The On-line Mud Logging Handbook by Alun Whittakery Alun Whittaker

1/29
Opportunities in offshore wind for
the Norwegian supply chain
8th Offshore Wind Supply Chain Conference
26 April 2017
Dr Alun Roberts, Associate Director, BVG Associates

2/29
BVG AssociatesA renewable energy consultancy focusing on wind, wave and tidal, and energy systems
Alun Roberts leads projects for BVG Associates in supply
chain and technology analysis and development. He brings
to this a deep knowledge of offshore wind technologies, the
structure of the supply chain, the requirements of the major
players in the sector, and the development of global
markets.
He has used this insight for several developers in recent
years in helping them to develop their supply chain plans
for the UK government , supporting smaller companies
about the opportunities in the sector and analysing the
market of different products and services.
A key area of work for him is helping clients understand the
economic impacts of their investments through
assessments of local content, gross value added (GVA)
and jobs.
Alun Roberts
BVG Associates is a renewable energy consultancy
focusing on wind, wave and tidal, and energy systems.
Company
© BVG Associates 2017

3/29
2. Introduction to marketsAvailable as part of report or printouts to take home
© BVG Associates 2017

4/29
Contents
© BVG Associates 2017
• European offshore wind
market
• Offshore wind value chain
• Procurement strategies
• Overview of opportunities
• Challenges to diversification
• Conclusions

5/29
0
10
20
30
40
50
0
1
2
3
4
5
'16 '17 '18 '19 '20 '21 '22 '23 '24 '25 Cum
ula
tive in
stalle
d c
ap
aci
ty
(GW
)
Insta
lled c
apaci
ty (G
W)
BE DE DK
FR NL UK
Other Europe Cumulative
Source: BVG Associates CAGR: 11%
1. The marketEurope leads globally
© BVG Associates 2017
• Europe had almost 13GW installed capacity at the end of
2016
• In comparison, rest of world had just under 2GW
• By 2020, anticipated to reach about 25GW
• Main markets after 2020: UK, Germany, Netherlands and
France

6/29
1. The marketUK focus – the largest European market
© BVG Associates 2017
• P50 scenario sees around 1.5GW of new capacity
annually from 2023 to 2025
• 2017 to 2019 has high installation from build out of FIDER
and ROC projects
• Drop in installed capacity in 2020 due to transition
between support mechanisms
• First project under CfD support anticipated to have first
turbine installed in 2019
• Next CfD round in 2017 for projects to be delivered
2021/2022
0
5
10
15
20
0.0
0.5
1.0
1.5
2.0
'16 '17 '18 '19 '20 '21 '22 '23 '24 '25
Cum
ula
tive in
stalle
d c
ap
aci
ty
(GW
)
Insta
lled c
apaci
ty (G
W)
Year of turbine installationUK annual Cumulative
Source: BVG Associates

7/29
1. The marketDE focus – the second largest European market
© BVG Associates 2017
• P50 scenario sees around 600MW of new capacity
annually from 2023 to 2025
• Market regulation seeing significant overhawl with
introduction of Offshore Wind Act “WindSeeG”
• Moving from a FiT to CfD support mechanism
• First competitive auction in 2017 (1.55GW to be installed
from 2020)
0
5
10
15
20
0.0
0.5
1.0
1.5
2.0
'16 '17 '18 '19 '20 '21 '22 '23 '24 '25
Cum
ula
tive in
stalle
d c
ap
aci
ty
(GW
)
Insta
lled c
apaci
ty (G
W)
Year of turbine installationGermany annual Cumulative
Source: BVG AssociatesSource: BVG Associates

8/29
1. The marketRest of Europe
Denmark France
Belgium Netherlands
© BVG Associates 2017
0
1
2
3
0.0
0.3
0.6
0.9
'16 '17 '18 '19 '20 '21 '22 '23 '24 '25 Cum
ula
tive in
stalle
d c
ap
aci
ty
(GW
)
Insta
lled c
apaci
ty (G
W)
Annual Cumulative
Source: BVG Associates
0
1
2
3
4
0.00
0.20
0.40
0.60
0.80
'16 '17 '18 '19 '20 '21 '22 '23 '24 '25 Cum
ula
tive in
stalle
d c
ap
aci
ty
(GW
)
Insta
lled c
apaci
ty (G
W)
Annual Cumulative
Source: BVG Associates
0
2
4
6
8
0.00
0.20
0.40
0.60
0.80
'16 '17 '18 '19 '20 '21 '22 '23 '24 '25 Cum
ula
tive in
stalle
d c
ap
aci
ty
(GW
)
Insta
lled c
apaci
ty (G
W)
Annual Cumulative
Source: BVG Associates
0
1
2
3
4
0.00
0.20
0.40
0.60
0.80
'16 '17 '18 '19 '20 '21 '22 '23 '24 '25 Cum
ula
tive in
stalle
d c
ap
aci
ty
(GW
)
Insta
lled c
apaci
ty (G
W)
Annual Cumulative
Source: BVG Associates

9/29
1. Opportunities in offshore wind for the Norwegian supply
chainThe findings
© BVG Associates 2017
• BVG Associates has undertaken a study into the opportunities for the Norwegian offshore supply chain in the emerging
offshore wind sector.
• The report covers:
• Introduction to markets
• Procurement strategies
• Overview of opportunities
• Norwegian supply chain assessment, and
• Strategies for market entry.

10/29
2. Offshore wind supply chainThe real opportunities
© BVG Associates 2017

11/29© BVG Associates 2017
3%
28%
19%
12%
35%
4%
Environmental surveys
0.1%
Consenting and development services
0.5%
Site investigations
0.5%
Project management
2.1%
Turbine assembly1.2%
Blades5.1%
Drive train5.2%
Power conversion8.3%
Large fabrications1.3%
Towers3.5%
Small components3.0%
Subsea cables4.8%
Transmission3.2%
Substation structures
2.1%
Turbinefoundations
7.6%
Secondary steelwork1.4%
Installation ports and logistics
0.6%
Turbine and
foundationinstallation
4.9%Cable installation
2.4%Substation installation
0.4%
Installation equipment and
support services3.0%
Onshore works0.6%
Maintenance and inspection services
14.8%
Vessels and equipment16.4%
O&M ports3.8%
Ports and logistics0.2%
Marineoperations
3.3%
Salvage and recycling0.0%
Project management0.1%
Wind turbine supply
Balance of plant
Installation and commissioning
Operation, maintenance
and service
Decommissioning
Source: BVG Associates
Development and project
management
2. Offshore wind supply chain

12/29
3. Procurement strategiesMulti contracting vs EPCI
Multi contracting
© BVG Associates 2017
• Developer typically awards main contracts.
• Some packages can be split or combined depending on a developer’s needs,
preferences or capabilities.
• Multi-contracting is often preferred by large utilities, particularly if the project is funded
from their balance sheet.

13/29
3. Procurement strategiesMulti contracting vs EPCI
EPCI
© BVG Associates 2017
• EPCI contracting usually involves three main
packages. The turbine package is typically kept
separate. The other two packages vary in scope
according to the strengths of the bidders.
• Contract values can exceed £1 billion, which is a
major risk for all but the largest and most experienced
contractors.
• The interfaces between the non-turbine packages are
not difficult for the developer to manage.
• Independent developers and less experienced
utilities prefer this approach.
14/29© BVG Associates 2017
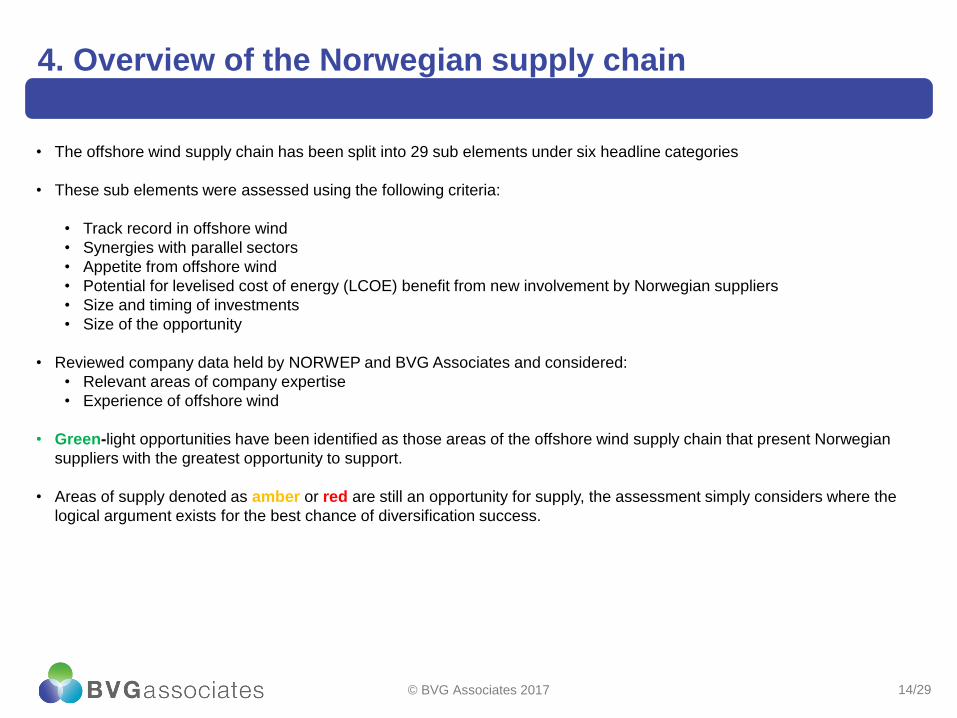
4. Overview of the Norwegian supply chain
• The offshore wind supply chain has been split into 29 sub elements under six headline categories
• These sub elements were assessed using the following criteria:
• Track record in offshore wind
• Synergies with parallel sectors
• Appetite from offshore wind
• Potential for levelised cost of energy (LCOE) benefit from new involvement by Norwegian suppliers
• Size and timing of investments
• Size of the opportunity
• Reviewed company data held by NORWEP and BVG Associates and considered:
• Relevant areas of company expertise
• Experience of offshore wind
• Green-light opportunities have been identified as those areas of the offshore wind supply chain that present Norwegian
suppliers with the greatest opportunity to support.
• Areas of supply denoted as amber or red are still an opportunity for supply, the assessment simply considers where the
logical argument exists for the best chance of diversification success.

15/29
4.1 Development and project managementOverview
• Makes up 3% of lifetime expenditure
• Contractors carry out geotechnical and geophysical
studies, wildlife studies, human impact studies and
cable route assessments during site selection
• A number of specialists needed across all stages of
development
• Developers may subcontract project management and
coordination of tasks
© BVG Associates 2017
Sub element Lifetime spend* Norwegian
suppliers
Environmental
surveys
0.1% 55 kr
million
Consenting and
development
services
0.5% 264 kr
million
Site investigations 0.5% 264 kr
million
Project management 2.1% 1,156 kr
million
* For a 1GW offshore wind farm
Environmental surveys
3%
Consenting and development
services15%
Site investigations
15%
Project management
67%
Development and project
management3%
16/29
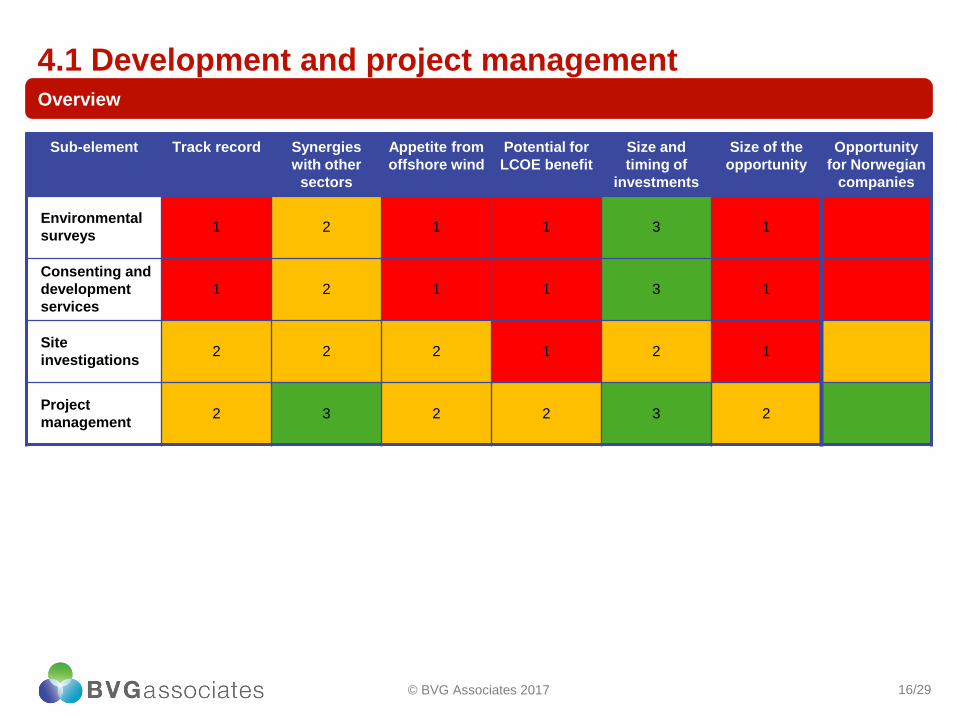
4.1 Development and project managementOverview
© BVG Associates 2017
Sub-element Track record Synergies
with other
sectors
Appetite from
offshore wind
Potential for
LCOE benefit
Size and
timing of
investments
Size of the
opportunity
Opportunity
for Norwegian
companies
Environmental
surveys1 2 1 1 3 1
Consenting and
development
services
1 2 1 1 3 1
Site
investigations2 2 2 1 2 1
Project
management2 3 2 2 3 2

17/29
4.2 TurbineOverview
• Turbine supply involves design, manufacture and
assembly of all electrical and mechanical components
• WTM assembles the final product using components
that are mostly externally sourced
• No part of the turbine supply is graded as a strong
opportunity for Norwegian suppliers
• Norwegian suppliers are competing with a supply chain
that has 20 years of wind track-record
© BVG Associates 2017
Sub element Lifetime spend* Norwegian
suppliers
Turbine assembly 1.2% 661 kr
million
Blades 5.1% 2,808 kr
million
Drive train 5.2% 2,863 kr
million
Power conversion 8.3% 4,625 kr
million
Large fabrications 1.3% 715 kr
million
Towers 3.5% 1,927 kr
million
Small components 3.0% 1,652 kr
million
* For a 1GW offshore wind farm
Turbine assembly
4%
Blades18%
Drive train19%
Power conversion
30%
Large fabrications
5%
Towers13%
Small components
11%
Turbine28%

18/29
4.2 TurbineOverview
© BVG Associates 2017
Sub-element Track record Synergies
with other
sectors
Appetite from
offshore wind
Potential for
LCOE benefit
Size and
timing of
investments
Size of the
opportunity
Opportunity
for Norwegian
companies
Turbine assembly 1 2 2 1 2 2
Blades 1 1 1 1 1 3
Drive train 1 1 1 1 1 3
Power
conversion1 1 1 1 2 3
Large
fabrications1 2 1 1 2 2
Towers 1 2 1 1 2 3
Small
components1 2 1 1 2 2
19/29
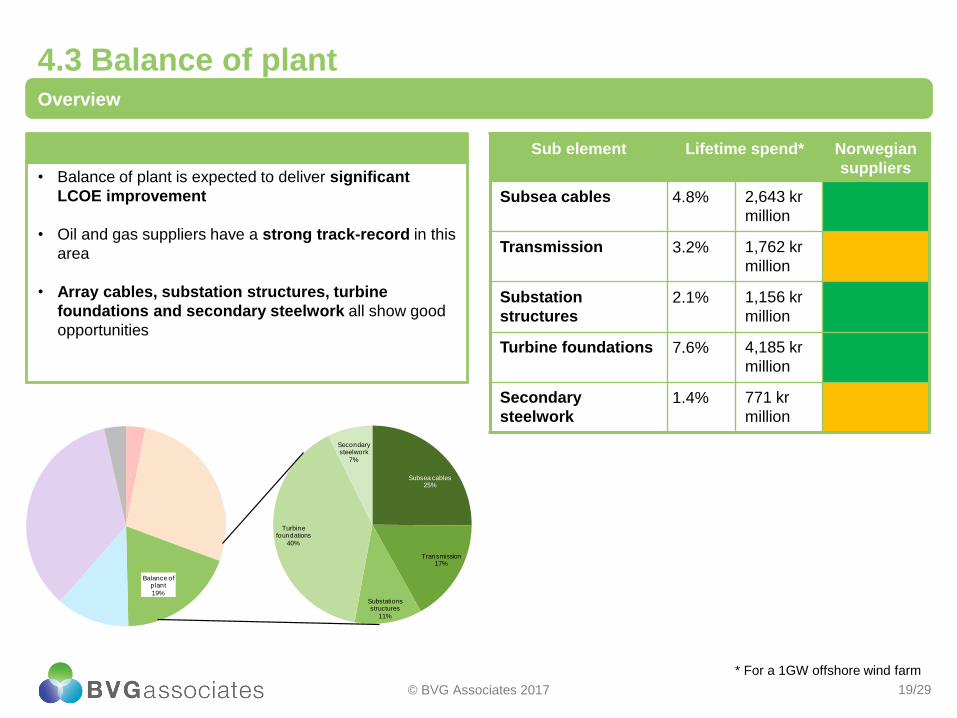
4.3 Balance of plantOverview
• Balance of plant is expected to deliver significant
LCOE improvement
• Oil and gas suppliers have a strong track-record in this
area
• Array cables, substation structures, turbine
foundations and secondary steelwork all show good
opportunities
© BVG Associates 2017
Sub element Lifetime spend* Norwegian
suppliers
Subsea cables 4.8% 2,643 kr
million
Transmission 3.2% 1,762 kr
million
Substation
structures
2.1% 1,156 kr
million
Turbine foundations 7.6% 4,185 kr
million
Secondary
steelwork
1.4% 771 kr
million
* For a 1GW offshore wind farm
Subsea cables25%
Transmission17%
Substations structures
11%
Turbine foundations
40%
Secondary steelwork
7%
Balance of plant
19%

20/29
4.3 Balance of plantOverview
© BVG Associates 2017
Sub-element Track record Synergies
with other
sectors
Appetite from
offshore wind
Potential for
LCOE benefit
Size and
timing of
investments
Size of the
opportunity
Opportunity
for Norwegian
companies
Subsea cables 3 3 3 2 2 2
Transmission 1 2 2 2 2 3
Substation
structures2 3 2 2 2 3
Turbine
foundations2 3 3 3 2 3
Secondary
steelwork2 2 2 2 3 2

21/29
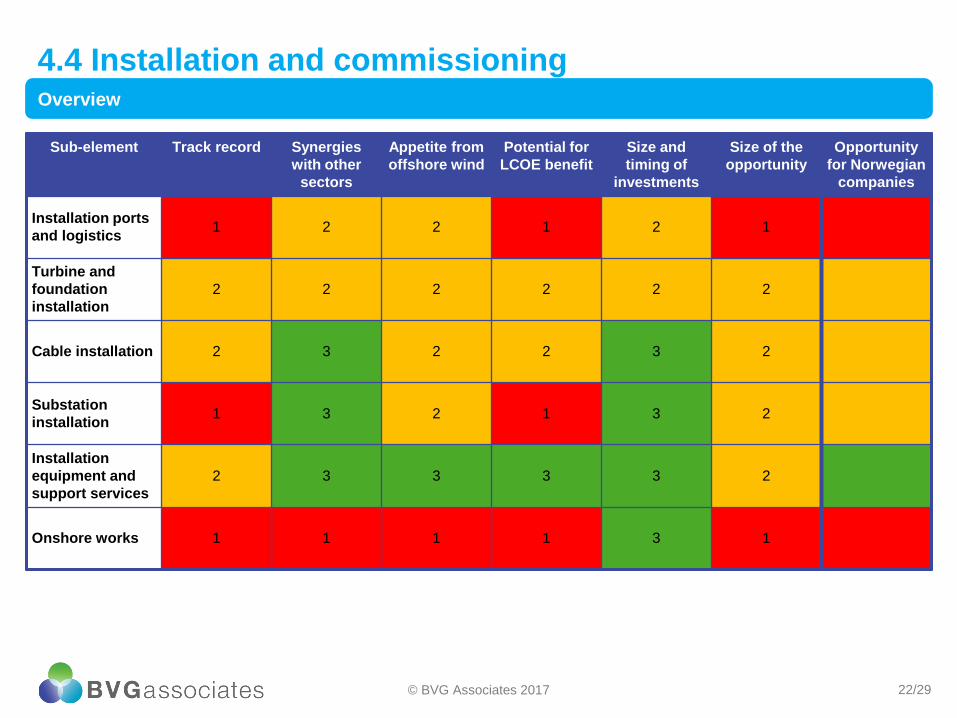
4.4 Installation and commissioningOverview
• Few oil and gas companies have a track-record in
turbine and foundation installation although contractors
draw on experience in oil and gas.
• Vessels used are now bespoke and often high-
specification jack-up vessels built in the Gulf states or
east Asia
• Main opportunities lie in installation equipment and
support services, to engineer efficient offshore
solutions for a range of installation activities
© BVG Associates 2017
Sub element Lifetime spend* Norwegian
suppliers
Installation ports
and logistics
0.6% 330 kr
million
Turbine and
foundation
installation
4.9% 2,698 kr
million
Cable installation 2.4% 1,322 kr
million
Substation
installation
0.4% 220 kr
million
Installation
equipment and
support services
3.0% 1,652 kr
million
Onshore works 0.6% 330 kr
million
* For a 1GW offshore wind farm
Installation ports and logistics
5%
Turbine and foundation
installation41%
Cable installation
20%
Substation installation
4%
Installation equipment and
support services25%
Onshore works
5%
Installation and commissioning
12%
22/29
4.4 Installation and commissioningOverview
© BVG Associates 2017
Sub-element Track record Synergies
with other
sectors
Appetite from
offshore wind
Potential for
LCOE benefit
Size and
timing of
investments
Size of the
opportunity
Opportunity
for Norwegian
companies
Installation ports
and logistics1 2 2 1 2 1
Turbine and
foundation
installation
2 2 2 2 2 2
Cable installation 2 3 2 2 3 2
Substation
installation1 3 2 1 3 2
Installation
equipment and
support services
2 3 3 3 3 2
Onshore works 1 1 1 1 3 1

23/29
4.5 Operation, maintenance and serviceOverview
• Maintenance and inspection services present a good
opportunity for Norwegian suppliers seeking to
diversify
• Opportunities for the supply of vessels and equipment
from Norway will increase as the market moves towards
SOVs which include walk to work solutions.
• There is little benefit of combining offshore wind port
requirements within existing oil and gas service hubs.
© BVG Associates 2017
Sub element Lifetime spend* Norwegian
suppliers
Maintenance and
inspection services
14.8% 8,192 kr
million
Vessels and
equipment
16.4% 9,091 kr
million
O&M ports 3.8% 2,109 kr
million
* For a 1GW offshore wind farm
Maintenance and inspection
services42%
Vessels and equipment
47%
O&M ports11%
Operation, mantenance
and service35%

24/29
4.5 Operation, maintenance and serviceOverview
© BVG Associates 2017
Sub-element Track record Synergies
with other
sectors
Appetite from
offshore wind
Potential for
LCOE benefit
Size and
timing of
investments
Size of the
opportunity
Opportunity
for Norwegian
companies
Maintenance and
inspection
services
2 3 3 3 3 3
Vessels and
equipment2 3 3 3 3 2
O&M ports 1 3 2 1 2 1

25/29
4.6 DecommissioningOverview
• Only one small offshore wind farm has been
decommissioned.
• One of the key challenges is in the large number of
assets spread over a wide area
• Given the current deployment profile and lifetime of the
installations there will not be significant activity before
2030.
• Norway is likely to be in a strong position to support the
marine operations sub-element.
© BVG Associates 2017
Sub element Lifetime spend* Norwegian
suppliers
Ports and logistics 0.2% 88 kr
million
Marine operations 3.3% 1,817 kr
million
Salvage and recycling 0.0% 22 kr
million
Project management 0.1% 33 kr
million
* For a 1GW offshore wind farm
Ports and logistics
4%
Marine operations
93%
Salvage and recycling
1%
Project management
2%Decommissioning 4%

26/29
4.6 DecommissioningOverview
© BVG Associates 2017
* For a 1GW offshore wind farm
Sub-element Track record Synergies
with other
sectors
Appetite from
offshore wind
Potential for
LCOE benefit
Size and
timing of
investments
Size of the
opportunity
Opportunity
for Norwegian
companies
Ports and
logistics1 3 2 1 3 1
Marine
operations1 3 2 1 3 1
Salvage and
recycling1 3 3 1 3 1
Project
management1 3 2 1 3 1

27/29
5. Challenges to diversificationUnderstand core competence, address supply gaps in offshore wind seeking highest LCOE savings
© BVG Associates 2017
Lack of
track
record
Risk-
adverse
investors
Cost
competitive
ness
Contracts
(lump sum
vs fixed
price)
Warranties
and asset
uptime
linked
reward
Target
multiple
projects
Long-term
OPEX
focus high
local
contentFloating wind
high O&G
structure
synergy
Disruptive
innovation /
cost
competitive
Understand
differences
with clear
strategy

28/29
6. Conclusions
• Diversification can be a great business strategy - a
targeted move into a new sector can spread risk, generate
new revenue and reduce unit costs.
• Key to successful diversification - ensure there is
capability overlap between “legacy” and “new “ industry.
• The oil & gas overlap - offshore wind open to suppliers
from all sectors but capability correlation between offshore
wind and oil and gas is naturally very high.
• Two-way learning - processes and innovative thinking
developed over decades in other sectors can be
transferred to offshore wind. Rapid cost reduction,
standardisation and faster deployment techniques in
offshore wind can benefit oil and gas as well as other
sectors
© BVG Associates 2017

29/29
Thank you….
Please get in touch
BVG Associates Ltd
The Blackthorn Centre
Purton Road
Cricklade, Swindon
SN6 6HY UK
tel +44 (0) 1793 752 308
@bvgassociates
www.bvgassociates.com
This presentation and its content is copyright of BVG Associates Limited
© BVG Associates 2017
Tel: +44 1793 799 022
Mob: +44 7595 400262
Coming soon….
BVG Associates report on
offshore wind opportunities
for Norwegian supply chain..