Opportunities for thin film photovoltaics in Building …...Abstract Building Integrated...
94
Opportunities for thin film photovoltaics in Building Integrated Photovoltaics (BIPV) with a focus on Australia This dissertation is presented for the Master of Science in Renewable Energy School of Energy and Engineering Murdoch University PEC 624 Submitted: Nov 2009 by Miwa Tominaga B.Eng. 30419198
Transcript of Opportunities for thin film photovoltaics in Building …...Abstract Building Integrated...

Opportunities for thin film photovoltaics inBuilding Integrated Photovoltaics (BIPV)
with a focus on Australia
This dissertation is presented for theMaster of Science in Renewable Energy
School of Energy and EngineeringMurdoch University
PEC 624
Submitted: Nov 2009
by Miwa TominagaB.Eng.
30419198

Declaration
I declare that this dissertation is my own account of the research undertaken. I have made specific referenceto information from materials used in the compilation of this dissertation. No part of this work has beenpreviously been submitted at any tertiary education institute.
Miwa Tominaga November 2009
2

Abstract
Building Integrated Photovoltaic (BIPV) products can not only generate electricity but also provide structuralstability, thermal insulation, shading, natural lighting, protection from water and other elements. Thin filmphotovoltaic cells are favoured over crystalline cells in BIPV applications, due to their physical flexibility,wide ranging options for installation, comparably low cost and aesthetics. Of the total worldwide PV market,thin film technologies contribute only about 10%. However, this is set to change.
Third generation thin film PV has the advantages of their flexible substrate and the ability to perform in dimor variable lighting. Their low temperature roll-to-roll manufacturing methods make them economical forlarge surface areas such as BIPV roofing and facades. First and second generation PV have proventhemselves in BIPV installations in products such as tiles, laminates, slates and glazing. Much excitementsurrounds Canberra based thin film solar cell company Dyesol and their partnership with strip steel sheetingmanufacturers Corus. Together they plan to provide the world with a possible 35GW of BIPV generatedenergy per annum.
There is great potential for BIPV in Australia, with the average Australian residential household being able togenerate almost three times their average daily energy use. The $/m2 costs for BIPV products in Australia arefast approaching cost competitiveness with conventional building materials. Some types of thin film PV havealready broken through the $1/W manufacturing cost barrier and are speeding towards grid parity withconventional fossil fuel generated electricity. However, there are still many barriers to increasing the use ofBIPV which must also be addressed.
Government support is critical for BIPV to achieve the potential that it can and to create a level playing fieldagainst Australia's well established coal and fossil fuel industries. Some of the measures that the Australiangovernment could introduce in support of BIPV are:
➢ One Australia-wide gross feed-in tariff with extra incentives for BIPV generated electricity, paying 5times the standard rate for electricity. This would also remove the administrative burden on state andterritory governments, each with different schemes.
➢ Mandate for all new buildings to be zero emissions by 2016.➢ Encourage the use of on-site renewables.➢ Fund large-scale public projects to showcase the BIPV technology.➢ Support and coordinate with independent regulators so the approval process for the importation of
BIPV products is transparent and straight forward.➢ Provide educational programs that train architects and builders to design BIPV installations.➢ Fund R&D into thin-film PV technologies and their commercialisation in BIPV applications. ➢ Support cooperation between BIPV manufacturers and others in the value chain. ➢ Support the PV manufacturing industry to attract new facilities to Australia. This provides more
green jobs, a highly skilled workforce and supports the PV industry for future generations.
3

Acknowledgements
Firstly, I would like to thank my supervisor, Professor Philip Jennings for his expertise, support and guidancethroughout the year.
Thank you to Dr Trevor Pryor, Unit Co-ordinator, for the detailed feedback (and checking through my 7pages of references!). Thank you to Gonzalo Muslera, Sales Manager for Schott Solar Australia, for providing specifications,quotes and friendly advice used in the BIPV cost comparison section of this report. The immaculatecustomer service you provided can only strengthen the solar industry in Australia.
Also, thank you to Eamonn Darcy of Solar Unlimited for the Suntech BIPV prices used in this report and thefriendly customer service.
Thanks to Dr Mark Snow, Solarch group, University of New South Wales (UNSW), for replying to myemails about BIPV costs in Australia. And to Steven Herron from Kalzip Australia and Narayan Kafle fromGoing Solar; even though you couldn't provide me with the information I was after, I still appreciate the timetaken in replying to my emails. I understand that customer service is not an easy job.
Thanks to Mark Lister, Policy and Strategy Advisor at Szencorp, for providing a tour of the Szencorpbuilding's BIPV installation in South Melbourne. It really is inspiring to see it working first hand.
And thanks to the team at Beyond Zero Emissions for always pushing the boundaries to what's possible withrenewable energy technologies and encouraging me to think outside the square!
4

Table of Contents
Declaration...........................................................................................................................................2Abstract.................................................................................................................................................3Acknowledgements..............................................................................................................................4List of figures.......................................................................................................................................7
1.0 Introduction....................................................................................................................................9
What are the opportunities for thin film photovoltaics in Australia's Building IntegratedPV (BIPV) industry? ........................................................................................................9
2.0 Types of thin film solar cells........................................................................................................10
2.1 Amorphous Silicon (a-Si)....................................................................................................122.2 Micromorphous Silicon cell................................................................................................142.3 Cadmium Telluride (CdTe).................................................................................................152.4 Copper indium gallium diselenide (CIGS).........................................................................162.5 Copper indium diselenide (CIS).........................................................................................162.6 Dye sensitised solar cells....................................................................................................17
2.6.1 History....................................................................................................................172.6.2 How it works..........................................................................................................17
2.7 Organic solar cells...............................................................................................................182.8 Crystalline Silicon on Glass (CSG) thin film solar cells....................................................19
2.8.1 History....................................................................................................................192.8.2 How it works..........................................................................................................202.8.3 Advantages of CSG................................................................................................21
2.9 World Market for thin film solar cells.................................................................................21
3.0 BIPV applications.........................................................................................................................25
3.1 BIPV windows....................................................................................................................253.2 PV roofing shingles.............................................................................................................283.3 PV roof tiles........................................................................................................................283.4 PV roofing laminates...........................................................................................................303.5 PV laminates fully integrated with roofing material and electrical equipment..................313.6 PV roofing integrated systems............................................................................................333.7 PV facades...........................................................................................................................333.8 Corus and Dyesol................................................................................................................343.9 PV railings...........................................................................................................................34
4.0 BIPV potential in Australia...........................................................................................................36
4.1 Architectural and solar suitability ....................................................................................364.2 Limitations of these results .............................................................................................394.3 Achievable levels of BIPV energy production .................................................................414.4 BIPV costs in $/m2.............................................................................................................414.5 BIPV $/m2 costs in Australia .............................................................................................43
5
5.0 Discussion.....................................................................................................................................45
5.1 History of BIPV.......................................................................................................................455.2 Climate change and the role of solar energy............................................................................455.3 Economics and cost reductions ...............................................................................................465.4 $1/W breakthrough..................................................................................................................475.5 Grid parity................................................................................................................................475.6 Efficiency increase...................................................................................................................495.7 Matching daily load profiles ...................................................................................................515.8 Advantages of thin film PV.....................................................................................................535.9 Silicon shortage........................................................................................................................535.10 Temperature effects ..............................................................................................................545.11 Technical benefits of a-Si in BIPV products..........................................................................555.12 Staebler-Wronski effect .......................................................................................................555.13 Thin-film BIPV vs conventional roof-top PV.......................................................................565.14 Third generation thin film PV................................................................................................565.15 Environmental impact............................................................................................................575.16 Life Cycle Analysis................................................................................................................585.17 Cadmium (Cd) Toxicity ........................................................................................................605.18 Recycling...............................................................................................................................61
6.0 Future for BIPV............................................................................................................................62
6.1 Barriers.....................................................................................................................................636.2 BIPV and building code requirements.....................................................................................636.3 BIPV manufacturers and the building industry.......................................................................646.4 Financing mechanisms and industry support measures...........................................................656.5 BIPV specific feed-in tariff......................................................................................................666.6 Education, training and demonstration projects .....................................................................676.7 Zero emissions buildings.........................................................................................................676.8 PV GIS supporting BIPV design.............................................................................................68
7.0 Conclusion....................................................................................................................................697.1 Summary..................................................................................................................................697.2 Recommendations....................................................................................................................69
References .........................................................................................................................................71
Appendices.........................................................................................................................................78Appendix A....................................................................................................................................78Appendix B....................................................................................................................................79Appendix C....................................................................................................................................80Appendix D....................................................................................................................................82Appendix E....................................................................................................................................86Appendix F....................................................................................................................................90
6

List of figuresFigure 1: World PV market share in 2008....................................................................................................10Figure 2: PV market share details in 2009...................................................................................................10Table 1: PV technology specification in 2007 ............................................................................................11Figure 3: Comparing manufacturing costs for thin film and non-thin film.................................................11Figure 4: Types of PV technologies.............................................................................................................12Figure 5: Structure of an amorphous Silicon (a-Si) cell .............................................................................12Figure 6: Continuous roll-to-roll manufacturing process .........................................................................13Figure 7: Performance Ratio (PR) of various Si PV cells versus ambient temperature ........................14Figure 8: Structure of a micromorphous silicon cell...................................................................................14Figure 9: Micromorphous cell – How it works ..........................................................................................15Figure 10: Structure of a CdTe cell ............................................................................................................15Figure 11: Structure of a CIGS cell (left) and photo of a flexible CIGS cell on polyimide foils ..............16Figure 12: Structure of a CIS cell ..............................................................................................................16Figure 13: Principles of Operation of the Dye Solar Cell (DSC) ...............................................................18Figure 14: Schematic of a typical Dye Solar Cell with dye and TiO2 nanoparticles .................................18Figure 15: Schematic of an organic thin film heterojunction PV cell .........................................................19Figure 16: Schematic of the CSG structure ................................................................................................20Figure 17: Top view of CSG structure .......................................................................................................20Figure 18: Thin film PV market share in the United States.........................................................................21Table 2: Thin film PV capacity projected to 2010 ...................................................................................22Figure 19: PV planned production capacities ......................................................................................23Figure 20: Planned thin film production capacity – regional and technology distribution .......................23Figure 21: Ertex Solar transparency and output for various types of BIPV glazing ..................................25Figure 22: Electricity used by 100m2 of SeeThru compared to heat reflective glass.................................26Figure 23: Suntech SeeThru canopy (5% transparency) at Kanazawa Bus Terminal, Japan ...................26Figure 24: Schott Solar ASI Thru and ASI Glass cross sections ..............................................................27Figure 25: SHGC comparison for different glazing and shading systems ...............................................27Figure 26: Typical applications for ASI Glass products..............................................................................27Figure 27: Uni-Solar PV shingles on roof (left) and on roll before installation .........................................28Figure 28: Installation process of SunPower SunTiles on a residential house ..........................................29Figure 29: SunTile installation in a new housing development in Rocklin, California USA (nearSacremento) ................................................................................................................................................29Figure 30: Uni-Solar PV laminates on a raised seam metal roof ................................................................30Figure 31: Uni-Solar laminates models PVL-68 and PVL-124 .................................................................30Figure 32: Triple junction solar cell schematic ..................................................................................31Figure 33: Triple junction cell absorbing 3 colour wavelengths of the light spectrum ..........................32Figure 34: Examples of SolarClad retrofitting on to existing Kalzip roofs and facades .........................32Figure 35: Schott Solar InDaX roofing integrated 175W solar modules with close view of 225W modulesshowing overlapping ...............................................................................................................................33Figure 36: Electrically operated BIPV facades to assist natural ventilation................................................33Figure 37: Solarail used in a New York city apartment balcony.................................................................34Figure 38: Energy payback time for EPV Solar's a-Si module compared to a standard c-Si module.........35Table 3: Solar architectural rules of thumb for calculating BIPV potential ................................................37Table 4: Average floor area of new houses by state and territory ...............................................................38Figure 39: Australian average daily solar exposure over a year ................................................................38Table 5: Comparing BIPV and roof-top PV systems daily kWh generated for average size houses by state......................................................................................................................................................................40 ...................................................................................................................................................................40Figure 40: Achievable levels of solar power production from PV roofs and facades.................................41Figure 41: Cost difference between BIPV ASI Glass product and conventional facade .........................42Figure 42: BIPV costs (Euros/m2) compared to conventional building materials ....................................42Figure 43: Australian $/m2 BIPV costs compared to conventional building materials in residential
7

applications..................................................................................................................................................44Figure 44: Amount of energy in solar radiation reaching Earth's surface compared to worldwide energyconsumption and fossil fuel resources ........................................................................................................45Figure 45: Levelised Cost of Alternative versus Conventional Energy ......................................................46Figure 46: Projected PV power installed per year (TW/annum) ................................................................47Figure 47: Australia's installed capacity compared to major world PV markets .......................................48Figure 48: Australian retail electricity prices compared to international average and best PV trends .......49Figure 49: Predicted efficiency increases for different PV technologies in the laboratory ........................49Figure 50: Efficiency and cost trade-offs for the three generations of PV technology; crystalline, thinfilms and advanced thin films like dye solar cells (in year 2003 dollars)....................................................50Figure 51: Multi-junction cells increasing the utilisation of the solar spectrum ....................................50Figure 52: Spectral sensitivity of different types of solar cells ...................................................................51Figure 53: Daily commercial load profile compared with reduced load from distributed PV resource......52Figure 54: Thin film PV manufacturing work flow compared to crystalline ............................................52Figure 55: Commercial production process for CIGS thin-film cells..........................................................53Figure 56: Global supply/demand of solar polysilicon and price trend ....................................................54Figure 57: Comparison of materials and primary energy used in production for thin-film (left) andpolycrystalline cells ...............................................................................................................................54Figure 58: Annual power production with thin film PV cell (Mitsubishi micromorphous tandem)compared to crystalline PV ........................................................................................................................55Figure 59: (L-R) Examples of conventionally mounted PV panels broken, structural supports blown over,wind uplift; compared to unbreakable and flexible Uni-Solar laminates (bottom) ...................................56Table 6: Comparing Dye-sensitised and Organic PV cells .........................................................................57Figure 60: PV life cycle analysis ............................................................................................................58Figure 61: Life cycle emissions of PV electricity compared to fossil fuel electricity ................................58Figure 62: Emissions generated by PV technologies today and projected to 2050 ...................................59Figure 63: Emissions for different types of building integration in comparison with tilted roof retrofit (inkg/kWhel) ...................................................................................................................................................60Figure 64: Predicted world cumulative PV installed capacities according to three scenarios ..................62Figure 65: Predicted BIPV system capital cost to 2050 under three scenarios: 1) pessimistic 2) optimistic/realistic 3) optimistic/ technology breakthrough.........................................................................................63Figure 66: PV dissemination/ promotional programs effectiveness by country ..................................66Figure 67: Energy demand (kWh/m2 per annum) of existing buildings compared to energy efficientbuildings.......................................................................................................................................................68Figure 68: Photovoltaic Geographical Information System interactive software screen shot.....................68
8
1.0 Introduction
Building Integrated Photovoltaic (BIPV) refers to photovoltaic or solar cells which can be integrated into thebuilding envelope as part of its structure. This means they can not only generate electricity but also providestructural stability, thermal insulation, shading, natural lighting, protection from water and other elements.
Buildings or shelter are as essential to our daily lives as food and water. Buildings contribute about 20% ofAustralia's greenhouse gas emissions, split evenly between residential homes and commercial buildings(2009, http://www.environment.gov.au/sustainability/energyefficiency/buildings/). Only the electricitygeneration and transport sectors contribute more to the country's emissions.
Most building emissions come from the use of electricity in heating, cooling, ventilating, lighting andpowering appliances. Although improving building efficiencies are important to reducing electricity use, wecan go a step further by generating our own renewable electricity on site within the building envelope. As thesunniest country on Earth, should Australia be turning towards BIPV products to reduce emissions andmitigate the effects of climate change?
Countries around the world such as Germany and Japan have seen an explosion of residential roof-top PVinstallations in past decades but BIPV systems are yet to become mainstream. Is thin film solar celltechnology what the BIPV industry has been waiting for?
The main research question for this report is:
What are the opportunities for thin film photovoltaics in the Building Integrated PV(BIPV) industry, with a focus on Australia?
The objectives are:
➢ To determine the state of the present BIPV industry; which includes an industry analysis, focus onthe major products and players, and worldwide prevalence
➢ To research the contributions of thin film PV technology to BIPV
➢ To outline the advantages of using thin film over other types of PV in BIPV applications
➢ To discover the future potential of thin films in the BIPV industry
➢ To evaluate the BIPV potential in Australia by calculating the energy generated and cost of a typicalBIPV installation for a residential house
➢ To calculate A$/m2 costs for BIPV products that will be useful in designing installations
➢ To look at the barriers hindering BIPV uptake in Australia and to make recommendations to improvethis situation for the future.
9

2.0 Types of thin film solar cells
Thin film solar cells (TFSC) are favoured over crystalline cells in BIPV applications, due to their physicalflexibility, wide ranging options for installation, comparably low cost and aesthetics. Of the total worldwidePV market, TFSC technologies contribute just over 10%, with the traditional mono-crystalline and poly-crystalline silicon cells contributing about 87%, as shown in figure 1. However, TFSC has had significantgrowth in recent years. This is generally due to the implementation of efficient and cost effectivemanufacturing processes. A continuous roll-to-roll (R2R) process is used, compared to the batch step andrepeat process for crystalline PV cells (Henemann 2008, 16).
Figure 1: World PV market share in 2008(Source: Photon International 2009)
Figure 2: PV market share details in 2009
(Source: Raugei and Frankl 2009, 393)
Crystalline cells are known as first generation solar cells and are made up of the traditional (phosphorous orboron) doped silicon semiconductor (http://org.ntnu.no/solarcells/pages/generations.php 2009). One of thedrawbacks of crystalline cells is the high cost of the 250-300μm thick high grade silicon (Si) wafer used, aswell as their limiting upper efficiency (Chopra, Paulson and Dutta 2004, 70).
10
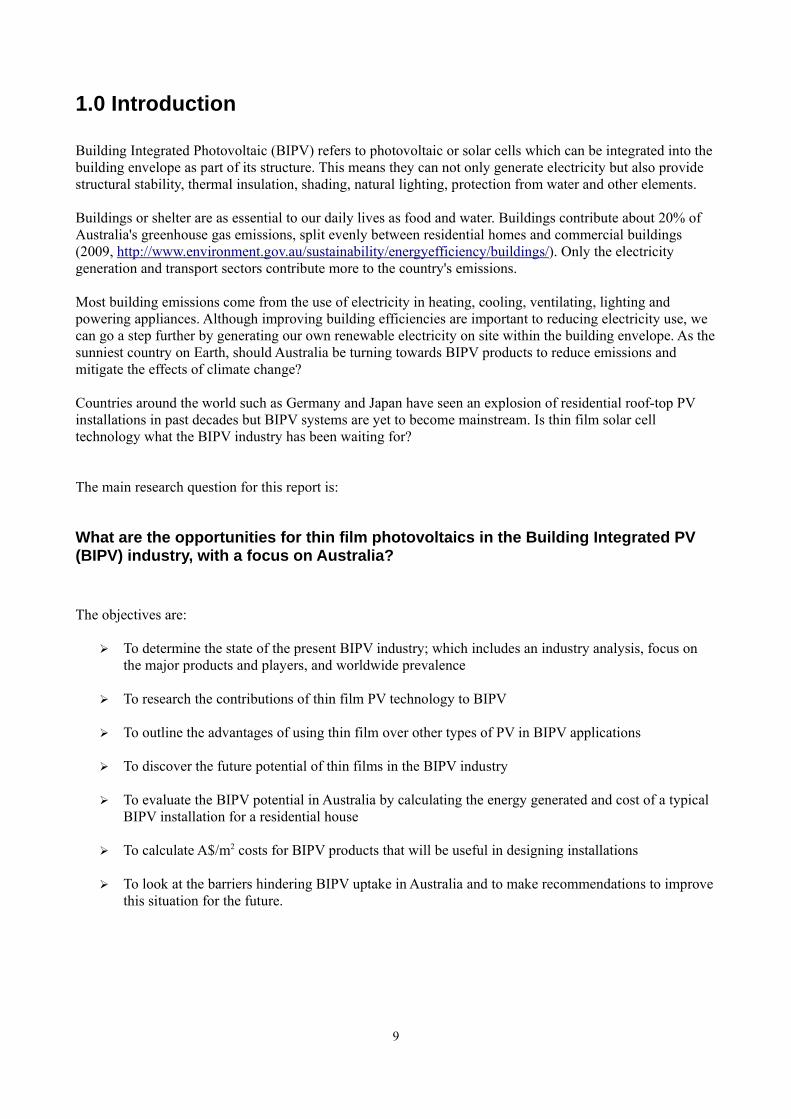
Thin film amorphous (non-crystalline) silicon cells are typically deposited at a 1um thickness on to asubstrate material and are therefore cheaper to manufacture. This also means there is more silicon surfacearea exposed to sunlight for a given amount of silicon (Marsh 2008, 64). However, efficiencies are about halfthat of crystalline cells, so generally double the surface area of TFSC is required to achieve the equivalentoutput of crystalline cells. Figure 2 displays the contribution to the market of the main types of PVtechnologies, while the following table (1) compares the efficiencies and market shares of crystalline versusthin film PV technologies. In general, the more silicon required, the more costly the technology.
Table 1: PV technology specification in 2007 (Source: Raugei and Frankl 2009, 394)
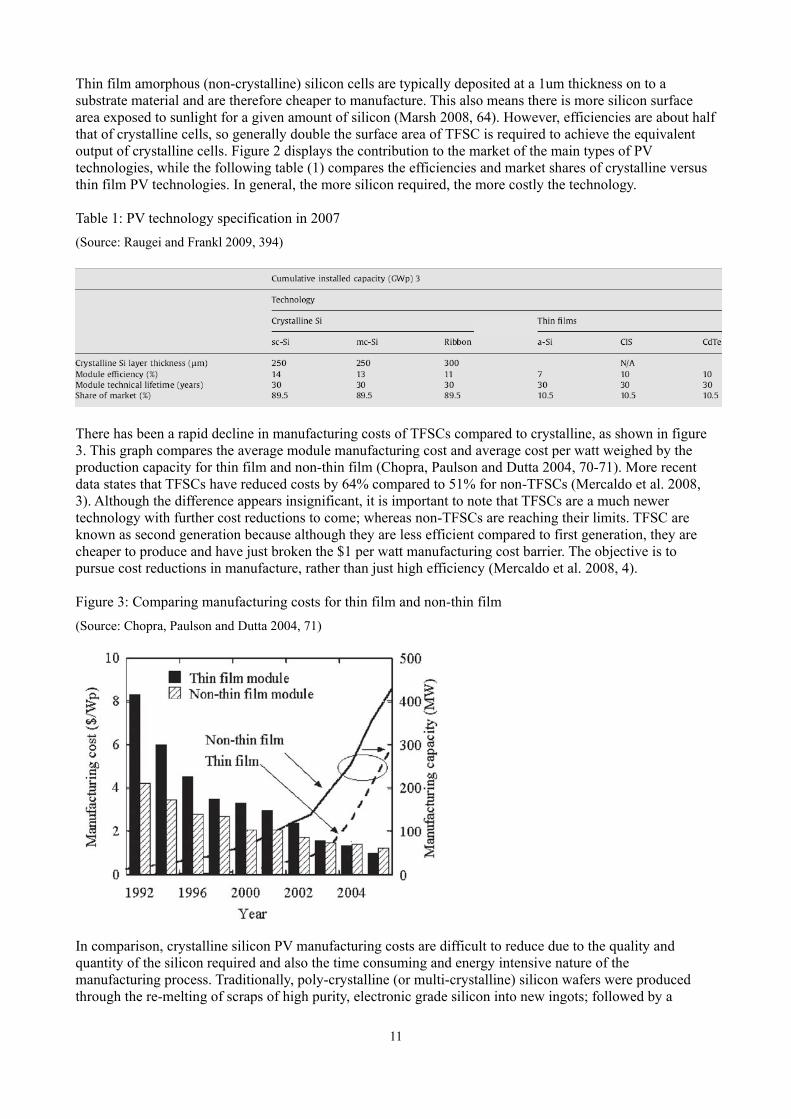
There has been a rapid decline in manufacturing costs of TFSCs compared to crystalline, as shown in figure3. This graph compares the average module manufacturing cost and average cost per watt weighed by theproduction capacity for thin film and non-thin film (Chopra, Paulson and Dutta 2004, 70-71). More recentdata states that TFSCs have reduced costs by 64% compared to 51% for non-TFSCs (Mercaldo et al. 2008,3). Although the difference appears insignificant, it is important to note that TFSCs are a much newertechnology with further cost reductions to come; whereas non-TFSCs are reaching their limits. TFSC areknown as second generation because although they are less efficient compared to first generation, they arecheaper to produce and have just broken the $1 per watt manufacturing cost barrier. The objective is topursue cost reductions in manufacture, rather than just high efficiency (Mercaldo et al. 2008, 4).
Figure 3: Comparing manufacturing costs for thin film and non-thin film(Source: Chopra, Paulson and Dutta 2004, 71)
In comparison, crystalline silicon PV manufacturing costs are difficult to reduce due to the quality andquantity of the silicon required and also the time consuming and energy intensive nature of themanufacturing process. Traditionally, poly-crystalline (or multi-crystalline) silicon wafers were producedthrough the re-melting of scraps of high purity, electronic grade silicon into new ingots; followed by a
11

careful, mechanical slicing process. An additional energy intensive re-crystallisation step is required toproduce a single or mono-crystalline wafer. (See appendix C). To lower costs and the energy used inmanufacture, a new method for the production of poly-crystalline cells has been implemented over the pastdecade. This method uses a lower purity silicon – called solar grade silicon – which can be produced directlyfrom primary metallurgical grade silicon (Raugei and Frankl 2009, 392). Not only does TFSC technologyprovide the cost advantage over crystalline, but also ensures lower greenhouse gas emissions and life cycleenergy consumption. There are more details on this in the discussion section.
TFSCs come in a few different types, as illustrated in Figure 4 below. All have been used in BIPVapplications around the world.
1. Amorphous Silicon (a-Si)2. Micromorphous Silicon (μ-Si)3. Cadmium Telluride (CdTe)4. Copper Indium Gallium DiSelenide (CIGS)5. Copper Indium DiSelenide (CIS)6. Dye sensitised solar cell (DSC)7. Organic8. Crystalline Silicon on Glass (CSG)
The characteristics of these different types will now be considered.
Figure 4: Types of PV technologies
(Source: Raugei and Frankl 2009)
2.1 Amorphous Silicon (a-Si)
Figure 5: Structure of an amorphous Silicon (a-Si) cell
(Source: German Solar Energy Society DGS 2007)
12
Amorphous silicon PV cells utilise a very thin layer of silicon (typically < 1um) deposited on to a substrateof glass or plastic. This technology does not use individual crystals and is the most popular type of TFSC fora number of reasons, such as:
• abundance of silicon, • non-toxic,• low material requirements (1-2 μm), • low cost,• low process temperature (~200°C) required, • can be produced on flexible and low cost substrates such as float glass and plastics,• can be produced for large area deposition,• moderate energy consumption in manufacturing process,• continuous production process,• short energy payback time,• shading tolerance which also negate the need for bypass diodes, • monolithic series connections of cells allows a wide range of module output voltages,• diversity of use,• attractive modules can be built for architectural applications eg. Semi-transparent, flexible modules,• a disadvantage of a-Si is the Staebler-Wronski effect which is described in section 5.12
(Chopra, Paulson and Dutta 2004, 81; and Mercaldo et al. 2008, 5; and Maurus et al. 2004, 22).
Due to the irregular structure and resulting open bonds of the silicon atoms, hydrogen is used in the activematerial to form an alloy called hydrogenated amorphous silicon (a-Si:H). The manufacturing process beginswith the Chemical Vapour Deposition (CVD) of gaseous silane (SiH4) at process temperatures of between200°C and 250°C. The resulting a-Si:H has an energy bandgap of 1.7 eV and an optical absorptioncoefficient of 105 /cm. This is the intrinsic (undoped) i-layer which sits between the p-doped and n-dopedlayers to create a p–i–n cell structure (Miles, Hynes and Forbes 2005, 7-8). Common materials for thetransparent conductor oxide layer (TCO) front contact includes tin oxide (SnO2), indium tin oxide (ITO) orzinc oxide (ZnO). The metal back contact and lower TCO layer function as a reflector. Commercial a-Simodule efficiencies range from 5 – 7% (German Solar Energy Society DGS 2007, 42-43).
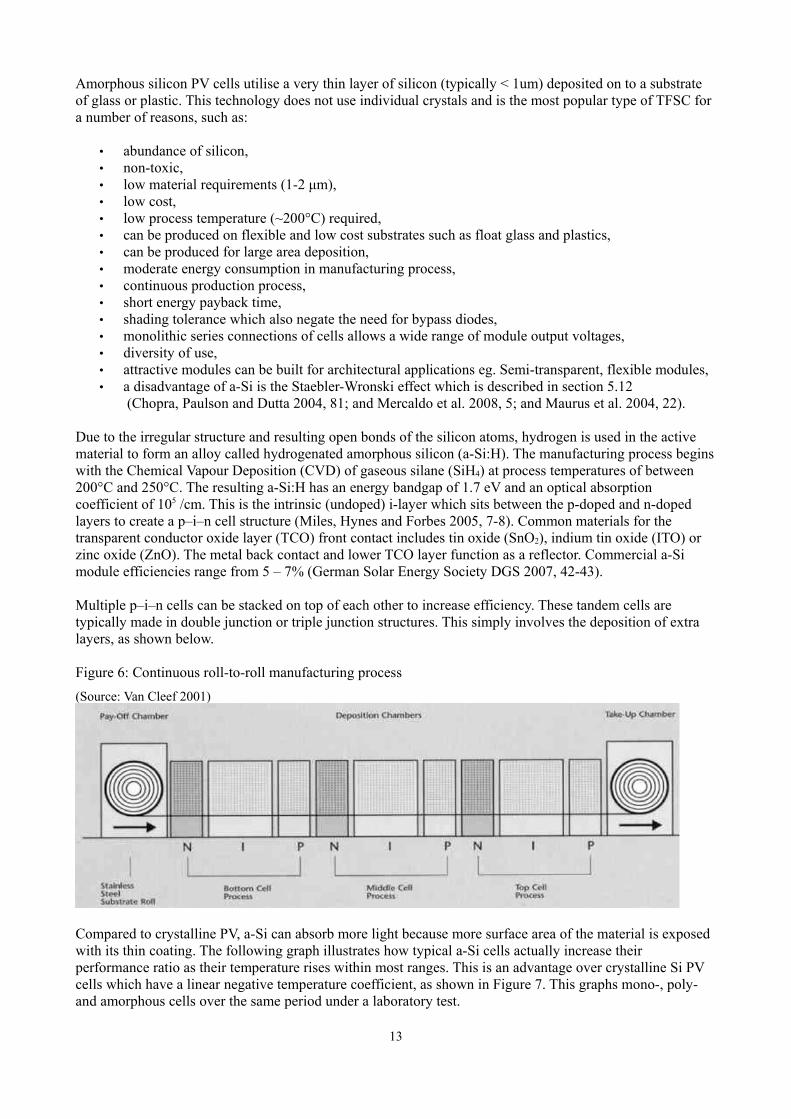
Multiple p–i–n cells can be stacked on top of each other to increase efficiency. These tandem cells aretypically made in double junction or triple junction structures. This simply involves the deposition of extralayers, as shown below.
Figure 6: Continuous roll-to-roll manufacturing process (Source: Van Cleef 2001)
Compared to crystalline PV, a-Si can absorb more light because more surface area of the material is exposedwith its thin coating. The following graph illustrates how typical a-Si cells actually increase theirperformance ratio as their temperature rises within most ranges. This is an advantage over crystalline Si PVcells which have a linear negative temperature coefficient, as shown in Figure 7. This graphs mono-, poly-and amorphous cells over the same period under a laboratory test.
13

Figure 7: Performance Ratio (PR) of various Si PV cells versus ambient temperature (Source: Van Cleef 2001)
2.2 Micromorphous Silicon cell
Figure 8: Structure of a micromorphous silicon cell
(Source: Miles, Hynes and Forbes 2005)
As the name suggest, micromorphous cells are a tandem cell composed of two active layers – amicrocrystalline layer and an amorphous layer as shown in Figure 8 above. Micromorphous cells take thebest out of both crystalline and thin film technologies, achieving efficiencies up to 8.5% by depositing finegrained microcrystalline structures to create a silicon film with a thickness in the order of 10μm. The glassand TCO layers are often textured to increase the light trapping ability of the cell. The efficiency is alsoimproved by stacking the microcrystalline with an amorphous layer, so more of the solar spectrum can beutilised. The diagram below illustrates this concept where the amorphous layer utilises short wavelengths ofthe light spectrum, while the microcrystalline layer utilises the longer wavelengths. Efficiencies ofcommercial modules have reached 9% (German Solar Energy Society DGS 2007, 48).
14

Figure 9: Micromorphous cell – How it works
(Source: Mitsubishi Heavy Industries Ltd 2009)
2.3 Cadmium Telluride (CdTe)
Figure 10: Structure of a CdTe cell (Source: German Solar Energy Society DGS 2007)
A CdTe cell has the desirable optical and chemical properties of an absorption coefficient of approximately105 per cm in the visible region and an energy band gap of 1.5 eV. This means that a layer of a fewmicrometers thick is able to absorb about 90% of the incident photons. Manufacturing begins with a glasssubstrate and front contact of a TCO, usually indium tin oxide (ITO). Next is a n-type cadmium sulfide(CdS) window layer, followed by a p-type CdTe absorber layer. Finally, the metallic back contact isdeposited using a sputter process. (See figure 10).
The CdTe/CdS hetero-junction cells have achieved efficiencies of 16.5% with the theoretical maximumbeing 29%. Conversion efficiencies of over 10% are achievable using a range of deposition techniques.Close spaced sublimation (CSS), physical vapour deposition (PVD), electro-deposition and screen printingtechniques have been scaled to produce large area modules. Commercial CdTe module efficiencies rangefrom 7 – 9% (Chopra et al. 2004, 80-81 and German Solar Energy Society DGS 2007, 45).
15

2.4 Copper indium gallium diselenide (CIGS)
Figure 11: Structure of a CIGS cell (left) and photo of a flexible CIGS cell on polyimide foils
(Source: Chopra, Paulson and Dutta 2004 and Kaelin et al. 2005)
Copper Indium Gallium diSelenide (CuInGaS2) solar cells have high efficiencies and long term stableperformance. Flexible CIGS cells have been produced on polyimide and steel metal foils for roof and facadeintegration, as well as for lightweight portable applications (Kaelin 2005, 1-3). It is one of the mostabsorbing semiconductor materials with an absorption coefficient of 3-6 x 10⁵/cm which means about 99% ofthe light is absorbed before reaching 1 µm into the material (2009http://org.ntnu.no/solarcells/pages/generations.php). It makes an excellent junction cell and can tolerate awide range of doping combinations. It has achieved an efficiency of 15.4% (Chopra, Paulson and Dutta2004, 80).
2.5 Copper indium diselenide (CIS)
Figure 12: Structure of a CIS cell
(Source: German Solar Energy Society (DGS) 2007)
Manufacture of a CIS cell starts with the transparent front contact of n-type Aluminium-doped zinc oxide(ZnO:Al) which is then coated with an intrinsic layer of zinc oxide (i-ZnO). Then a n-type cadmium sulphide(CdS) buffer layer is applied, followed by the p-type CIS active absorber layer. These layers are completedwith the back contact layer and glass substrate. CIS cells do not suffer from the Staebler-Wronski effect likea-Si cells. (See section 5.12 Staebler-Wronski effect) Module efficiencies range from 9 – 11% (German SolarEnergy Society DGS 2007, 43-45).
16

2.6 Dye sensitised solar cells
Dye sensitised solar cells are an emerging third generation technology which has been touted to be thebiggest breakthrough in solar technology since the silicon cell itself. (Third generation refers to thosetechnologies which have the potential to be more efficient than first and second generations but most ofwhich have not reached commercial scale yet.) These solar cells mimic photosynthesis in plants to generateelectricity by using colour dyes, just as plants use chlorophyll. Australian company, Dyesol Industries, isbased in Canberra and is at the forefront in commercialisation of what are called Dye Solar Cells (DSC)(Dyesol 2009, http://www.dyesol.com/index.php?page=Technology).
2.6.1 HistoryThe original concept of using artificial photosynthesis in solar cells was developed by Swiss scientistMichael Graetzel in 1988, at EPFL (Ecole Polytechnique Fédérale de Lausanne) in Switzerland. DSCs arealso known as Graetzel cells. Previous attempts made in the 1970's achieved only about 0.01% efficiency.Graetzel's use of nanotechnology made all the difference. He used titanium dioxide (titania) semiconductorparticles which were 20 nanometres in diameter and coated in a thin layer of dye. This increased the surfacearea that was exposed to light and thus increased the efficiency (Dyesol 2009). The company DyesolIndustries was born of a Swiss-Australian joint venture with the objective to commercialise this technology.Graetzel continues his work as the Chairman of Dyesol's Technology Advisory Board (Tulloch 2009,http://podcast.beyondzeroemissions.org/audio/podcast-2009-03-05-63071.mp3).
2.6.2 How it worksPhotosynthesis in plants is represented by the following chemical equation.
CO2 + 2 H2O + photons → (CH2O)n + H2O + O2
carbon dioxide + water + light energy → carbohydrate + oxygen + water (Wikipedia 2009, http://en.wikipedia.org/wiki/Photosynthesis)
Carbon dioxide, sunlight and water are absorbed by the chlorophyll in the plant to make carbohydrates andoxygen. In the Dye Solar Cell, the dye is analogous to the chlorophyll. Chlorophyll is green because itabsorbs all the red part of light spectrum and reflects the blue and the yellow. The basic principle is that thedye is absorbing the energy from the parts of the light spectrum that you are not seeing. So when light hitsthe dye, the energy excites electrons. In the DSC application, the dye is sandwiched between a nano-particleslayer – usually titania (TiO2) – and an electrolyte with catalyst. So the light excited electrons jump from thedye, through to the nano-particles and generate an electric current, as shown in the following figures (13, 14).Titania is a plentiful, benign substance which is commonly used as the white component in toothpaste. (Tulloch 2009, http://podcast.beyondzeroemissions.org/audio/podcast-2009-03-05-63071.mp3)
Dyesol managing director Sylvia Tulloch, stated that DSCs have demonstrated a peak efficiency of 11.4% inthe lab and projects that this will reach 15% by 2015. Dyesol are planning to roll out DSCs with anefficiency of 7% to match that of second generation amorphous silicon cells. With further development,DSCs can theoretically approach maximum efficiencies of 100%. There are strict limits in first and secondgeneration solar cells because it takes a certain amount of energy (photons of light) to knock off an electronin the doped silicon semiconductor. This is called the band gap energy. If the photons have less than therequired energy, it won't work and if they have more, the energy is wasted. Only about 30% of the energy(photons) from the sun can be usefully consumed by a first and second generation solar cell. However withthird generation DSCs, a mixture of dyes or a stacking of different dyes, can capture the whole lightspectrum. Research is being undertaken on dyes that can even absorb infra-red light. This is how very highefficiencies can be reached. (Tulloch 2009, http://podcast.beyondzeroemissions.org/audio/podcast-2009-03-05-63071.mp3)
17

Figure 13: Principles of Operation of the Dye Solar Cell (DSC)
(Source: Dyesol 2009)
Figure 14: Schematic of a typical Dye Solar Cell with dye and TiO2 nanoparticles
(Source: The University of Melbourne 2009, http://www.vicosc.unimelb.edu.au/organicsolarcells.htm )
Unlike crystalline silicon PV, DSCs can operate in low light levels, angles that are not directly facing the sunand also under indoor lighting and shading. As they mimic photosynthesis, their voltage is virtuallyindependent of light levels. Additionally, they use cheaper raw materials and manufacturing equipment,lower embodied energy and can be directly integrated into buildings by replacing conventional glass panelsor metal sheets. The cost is expected to be one tenth of the price of a silicon solar panel, making them moreattractive and accessible to householders and the end user (2007http://www.sciencedaily.com/releases/2007/04/070405171830.htm).
2.7 Organic solar cells
Another emerging third generation technology is the organic PV cell which was first demonstrated in 1986by C.W. Tang, and progress was slow, as interest shifted to Organic Light Emitting Diodes (OLEDs) for adecade (Meredith 2009, 14). There has been a recent resurgence in the field of organic PV, with researchbeing led by The University of Melbourne and some industry partners. They are looking at ways to use
18

organic PV to produce flexible plastic cells and coatings which can be used as roof paints and in fabrics(Watt, Passey and Watt 2008, 3-4). The main type of organic PV are thin film heterojunctions, as shown inthe following figure.
Figure 15: Schematic of an organic thin film heterojunction PV cell
(Source: The University of Melbourne 2009, http://www.vicosc.unimelb.edu.au/organicsolarcells.htm)
The heterojunction consists of photo-active layers of organic material sandwiched between an anodeelectrode and a cathode metallic electrode. The anode is a transparent and conducting oxide, such as IndiumTin Oxide (ITO) and the cathode is usually a low work function metal, such as Aluminium. The activeorganic layer can be polymer, dendrimer or other small molecule, typically in the order of 100nm thick (TheUniversity of Melbourne 2009).
It operates on the same principle as the silicon p-n junction (with holes and electrons), where aheterojunction is formed between two materials of different electron affinities – the donor and the acceptor –as part of the active layer. Light photons cause the donor to transfer electrons to the acceptor, thus creatingelectric current flow. The most studied acceptor and donor materials are PCBM ([6,6]-phenyl-C61 butyricacid) and P3HT [poly(3-n-hexyl-2,5-thiophene)] (Meredith 2009, 14). Only about 5% of the electron-holepairs effectively contribute to the photo-electric current. This is due to inherent limitations of the organicmaterial such as exciton lifetime and low charge mobility. To overcome this, research is being carried outinto increasing junction surface area, enlarging donor acceptor network and enhancing exciton dissociation(Boulanger 2004, 128).
2.8 Crystalline Silicon on Glass (CSG) thin film solar cells
2.8.1 HistoryThese solar cells were developed in Australia with research beginning in 1995 by a company called PacificSolar, which later changed its name to CSG Solar (Egan et al. 2006, 1). CSG cells are a special type whichuse a thin enough layer of crystalline silicon (1.6μm) to be classified as a TFSC. They combine the knowndurability and good electronic properties of silicon wafer-based technology with the advantages of TFSC;namely low material use, large monolithic construction and low manufacturing costs (Green et al. 2004, 1).CSG Solar moved its base to Germany with only a small testing facility remaining in Australia (Egan et al.
19
2006, 1). In late 2006, the upgrade of their main factory in Germany meant that the company had doubledtheir rated capacity to 20 MW per year for CSG module production (Basore 2006, 4).
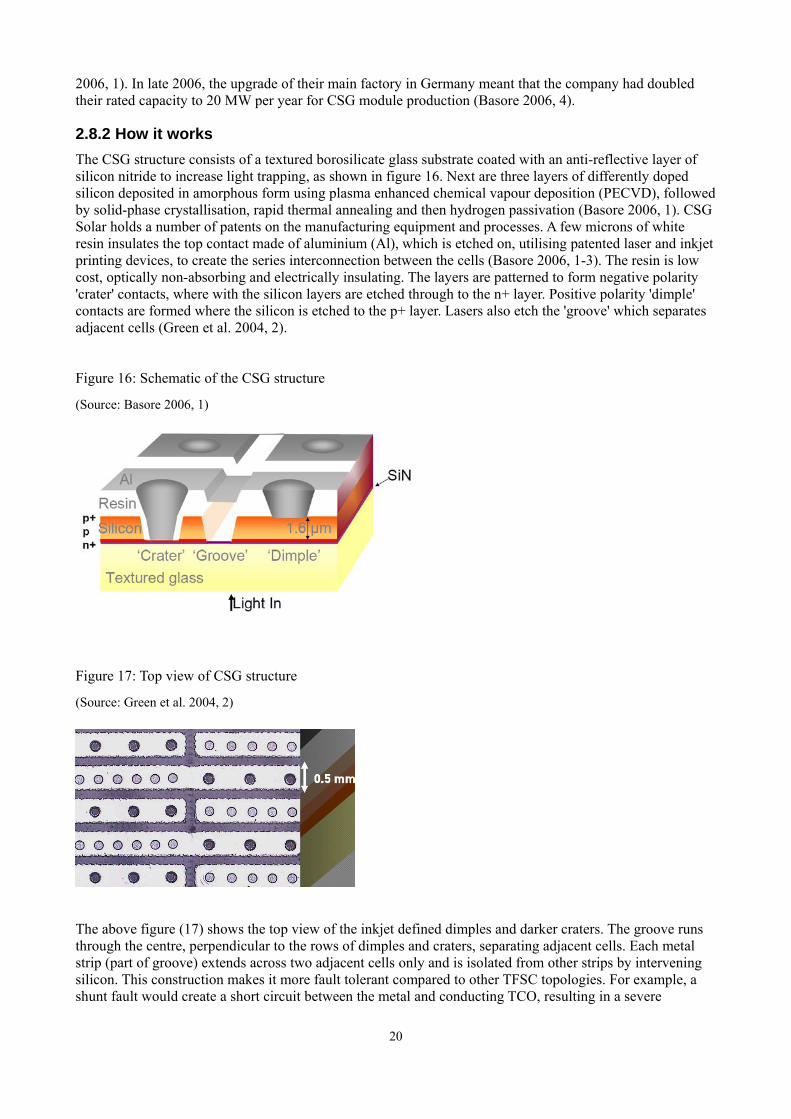
2.8.2 How it worksThe CSG structure consists of a textured borosilicate glass substrate coated with an anti-reflective layer ofsilicon nitride to increase light trapping, as shown in figure 16. Next are three layers of differently dopedsilicon deposited in amorphous form using plasma enhanced chemical vapour deposition (PECVD), followedby solid-phase crystallisation, rapid thermal annealing and then hydrogen passivation (Basore 2006, 1). CSGSolar holds a number of patents on the manufacturing equipment and processes. A few microns of whiteresin insulates the top contact made of aluminium (Al), which is etched on, utilising patented laser and inkjetprinting devices, to create the series interconnection between the cells (Basore 2006, 1-3). The resin is lowcost, optically non-absorbing and electrically insulating. The layers are patterned to form negative polarity'crater' contacts, where with the silicon layers are etched through to the n+ layer. Positive polarity 'dimple'contacts are formed where the silicon is etched to the p+ layer. Lasers also etch the 'groove' which separatesadjacent cells (Green et al. 2004, 2).
Figure 16: Schematic of the CSG structure
(Source: Basore 2006, 1)
Figure 17: Top view of CSG structure
(Source: Green et al. 2004, 2)
The above figure (17) shows the top view of the inkjet defined dimples and darker craters. The groove runsthrough the centre, perpendicular to the rows of dimples and craters, separating adjacent cells. Each metalstrip (part of groove) extends across two adjacent cells only and is isolated from other strips by interveningsilicon. This construction makes it more fault tolerant compared to other TFSC topologies. For example, ashunt fault would create a short circuit between the metal and conducting TCO, resulting in a severe
20
degradation in module output – or no output at all. The same shunt fault in a CSG module would be isolatedto the surrounding area only by the resistance of the intervening silicon, resulting in no loss of module output(Green et al. 2004, 3).
2.8.3 Advantages of CSGCSG cells use a relatively small number of layers compared to other TFSCs and more simple depositiontechniques. As it uses crystalline silicon, the quality of the silicon layer is enough to allow lateral currentconduction. Therefore a transparent conducting oxide layer (TCO), and its associated cost and durabilityproblems, is not required. The good light trapping properties of the textured glass and the reflective backingmean that a very thin layer (~1.6μm) of silicon is required. This silicon layer is thinner than the active layer(including TCO) of traditional TFSC technologies such as CIS, CdTe and tandem a-Si. CSG cells are alsomore fault tolerant as mentioned previously (Green et al. 2004, 2-3). In comparison, they use 1% of thesilicon used by crystalline silicon PV. Another major advantage is low manufacturing costs.(Egan 2009, http://podcast.beyondzeroemissions.org/audio/podcast-2009-10-30-67411.mp3)
2.9 World Market for thin film solar cells
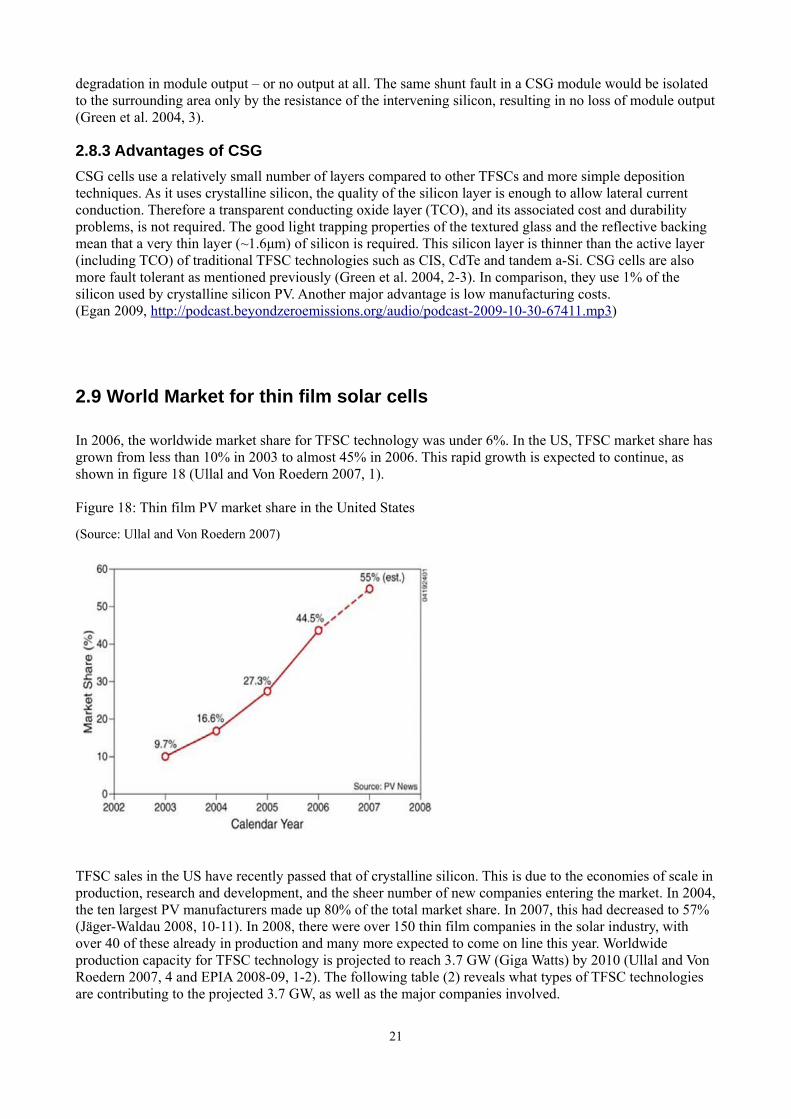
In 2006, the worldwide market share for TFSC technology was under 6%. In the US, TFSC market share hasgrown from less than 10% in 2003 to almost 45% in 2006. This rapid growth is expected to continue, asshown in figure 18 (Ullal and Von Roedern 2007, 1).
Figure 18: Thin film PV market share in the United States
(Source: Ullal and Von Roedern 2007)
TFSC sales in the US have recently passed that of crystalline silicon. This is due to the economies of scale inproduction, research and development, and the sheer number of new companies entering the market. In 2004,the ten largest PV manufacturers made up 80% of the total market share. In 2007, this had decreased to 57%(Jäger-Waldau 2008, 10-11). In 2008, there were over 150 thin film companies in the solar industry, withover 40 of these already in production and many more expected to come on line this year. Worldwideproduction capacity for TFSC technology is projected to reach 3.7 GW (Giga Watts) by 2010 (Ullal and VonRoedern 2007, 4 and EPIA 2008-09, 1-2). The following table (2) reveals what types of TFSC technologiesare contributing to the projected 3.7 GW, as well as the major companies involved.
21

Table 2: Thin film PV capacity projected to 2010
(Source: Ullal and Von Roedern 2007)
Since Table 2 was published, Sharp announced in February 2008, that they would increase their thin filmcapacity from the original 1GW to 6GW by 2012 (Jäger-Waldau 2008, 10).
The March 2009 issue of Photon International magazine rated the world's top 10 PV manufacturers.
1) Q-Cells2) First Solar (TFSCs)3) Suntech4) Sharp (TFSCs)5) Kyocera6) Yingli7) JA8) Motech9) SunPower10) Sanyo
As expected, the traditional PV world leaders of Germany (Q-Cells) and Japan (Sharp, Kyocera, Sanyo)feature in the top 10 list. Sharp uses a range of technologies including a-Si thin films. Number 2 on the list,First Solar, produces TFSCs only (see section 5.4 for details on First Solar). In recent times, the emerging PVmanufacturers in China (Suntech, Yingli) and Taiwan (Motech) have accelerated production capacities, withSouth Korea, India and Malaysia, following their lead. Over 98% of China and Taiwan's PV production isexported, so the countries themselves are yet to see much installed capacity at home (Jäger-Waldau 2008,11).
The 2008 PV Status Report (from the EU's Joint Research Centre Renewable Energy Unit) produced thefollowing figure (19), which graphs 2006-07 world production capacities and then predicts increasingcapacities up to 2012 based on manufacturer announcements. By 2012, world PV production is set to reach42.8 GW, with about 35% (15 GW) of this being thin films.
22

Figure 19: PV planned production capacities (Source: Jäger-Waldau 2008)
About 27% of the planned 42.8 GW is expected to come from China, 23% from Europe, 17% from Japanand 14% from Taiwan. The next few years will bring not only a shift in the countries and regions which arethe main PV producers of the world, but also a shift in the favoured technology, to different types of thinfilms, as shown in figure 20 below.
Figure 20: Planned thin film production capacity – regional and technology distribution
(Source: Jäger-Waldau 2008)
23

The 116 thin film companies represented in the 2008 PV Status Report's graph (figure 20) had the followinggeographical distribution:
Europe 40
USA 19
Japan 8
China 27
Taiwan 12
Rest Of World 10
TOTAL 116
About 70% of these companies use silicon based technology, using mainly a-Si and/or micromorphous. The4 GW of TFSC production by 2010 seems certain, with an additional 1 GW possible, depending on the delaybetween announcement to production, especially for new technologies and operational processes. CIS celltechnology will be produced by 19 of the companies in the graph, CdTe has 7 companies and 5 companieswill produce PV cells using dye and other materials (Jäger-Waldau 2008, 12-14).
24

3.0 BIPV applications
3.1 BIPV windows
Examples of BIPV facade systems are laminated and patterned glass used for windows, which can be used inplace of conventional building materials. Typically, a layer of PV cells is sandwiched between 2 glass sheets.There is also an encapsulant material such as ethylene-vinyl acetate (EVA) and a translucent or colouredtedlar-coated backsheet. A range of different colours are available, as well as different levels of transparencyfor the windows. Both crystalline and thin film PV are used for BIPV glazing products. The spacing betweeneach PV cell dictates the transparency level of the glass, as well as the power output (Eiffert and Kiss 2000,63-64). This means it can also be used for shading and daylighting features. The following graph comparesthe power output and transparency of several different types of BIPV glazing, made by Ertex Solar. Figure 21: Ertex Solar transparency and output for various types of BIPV glazing
(Source: Ertex Solar 2009)
A similar PV glazing product is manufactured by Suntech. Called SeeThru, this product uses laser etched a-Si PV, sandwiched between 2 sheets of glass. It comes in a thickness of 10.5mm or 13.5mm and has a tintedglass finish look with transparency levels of 1%, 5% and 10%. All electrical connections are made on theedges of the standard sized 980mm x 960mm unit, thus ensuring all wiring is concealed in the frames. Aswell as generating PV electricity, the a-Si in SeeThru absorbs more solar thermal radiation or heat than low-e
25
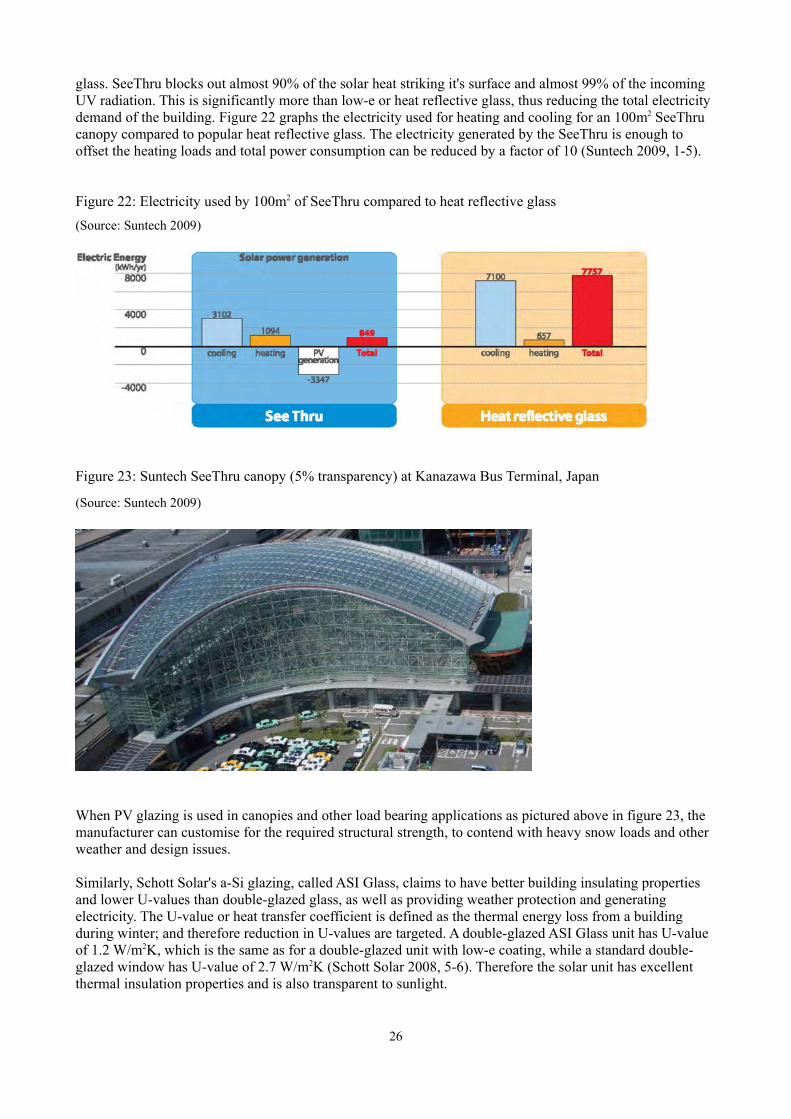
glass. SeeThru blocks out almost 90% of the solar heat striking it's surface and almost 99% of the incomingUV radiation. This is significantly more than low-e or heat reflective glass, thus reducing the total electricitydemand of the building. Figure 22 graphs the electricity used for heating and cooling for an 100m2 SeeThrucanopy compared to popular heat reflective glass. The electricity generated by the SeeThru is enough tooffset the heating loads and total power consumption can be reduced by a factor of 10 (Suntech 2009, 1-5).
Figure 22: Electricity used by 100m2 of SeeThru compared to heat reflective glass(Source: Suntech 2009)
Figure 23: Suntech SeeThru canopy (5% transparency) at Kanazawa Bus Terminal, Japan
(Source: Suntech 2009)
When PV glazing is used in canopies and other load bearing applications as pictured above in figure 23, themanufacturer can customise for the required structural strength, to contend with heavy snow loads and otherweather and design issues.
Similarly, Schott Solar's a-Si glazing, called ASI Glass, claims to have better building insulating propertiesand lower U-values than double-glazed glass, as well as providing weather protection and generatingelectricity. The U-value or heat transfer coefficient is defined as the thermal energy loss from a buildingduring winter; and therefore reduction in U-values are targeted. A double-glazed ASI Glass unit has U-valueof 1.2 W/m2K, which is the same as for a double-glazed unit with low-e coating, while a standard double-glazed window has U-value of 2.7 W/m2K (Schott Solar 2008, 5-6). Therefore the solar unit has excellentthermal insulation properties and is also transparent to sunlight.
26

Figure 24: Schott Solar ASI Thru and ASI Glass cross sections
(Source: Schott Solar 2008)
Not only does it reduce thermal loss from within the building envelope in winter, but it also reduces heat gainin summer. The Solar Heat Gain Coefficient (SHGC) is the thermal energy transmitted into a building.Lower values of SHGC will result in less overheating of the building interior during summer. This is criticalto reducing air-conditioning loads. The SHGC of double glazed ASI Glass is 10%, meaning 90% ofincoming heat is absorbed and 10% entering the building. In comparison, a single glass pane can have aSHGC of about 80%, while a double-glazed pane with solar control coating has a SHGC of about 30-70%.Figure 25 demonstrates the SHGC values for various types of glazing, as well as shading used in conjunctionwith double-glazed windows.
Figure 25: SHGC comparison for different glazing and shading systems (Source: Schott Solar 2008)
Applications for BIPV windows or glazing include, insulated elements for light roofs and facades, sunshading lamellas and laminates for light roofs, ventilated glass facades. These are illustrated in figure 26.
Figure 26: Typical applications for ASI Glass products(Source: Waldmann 2009, 22)
27

3.2 PV roofing shingles
The advantage of PV roofing shingles over conventional roof mount PV modules, are that they interlock withother shingles (both PV and non-PV) to give an aesthetic, seamless look. PV shingles such as the Uni-Solarshingles shown in the pictures below (figure 27), can be nailed directly onto the roof substructure, just likethe conventional asphalt shingles they can replace. These 4mm thick shingles comprise of Uni-Solar'sproprietary triple junction solar cell deposited using the roll-to-roll process, on a continuous roll of stainlesssteel. The shingles are encapsulated in UV polymers and are UL (world safety standards) listed as a“prepared roofing cover” to be mounted over a fire resistant underlay. They comply with UL and IEC 61646requirements, having been tested for UV, hail impact, mechanical load, wet insulation, damp heat, humidity,freezing, thermal cycling, 128 km/h wind speeds and robustness of terminations. A pair of wires comes outof the back of each shingle which is then fed in through the roof deck for electrical connection in the roofspace or attic. Adjacent shingles are connected together using moisture resistant butt splices (Uni-SolarOvonic 2009, 1).
Figure 27: Uni-Solar PV shingles on roof (left) and on roll before installation
(Source: Uni-Solar Ovonic 2009)
3.3 PV roof tiles
PV roof tiles, like shingles, can be seamlessly integrated into the roof, following the roof's contours, just likeconventional cement tiles. Most common types of PV tiles use mono and poly-crystalline cells. Figure 28illustrates the installation of SunPower SunTiles which use mono-crystalline cells. Different manufacturersspecify different preparation and installation requirements. SunTiles are installed on an underlay which helpsprovide fire ratings for the roof covering. Preparation includes pre-wiring the house for PV with cabling,junction boxes, ready for connection to an inverter. Since the SunTiles are lighter than the cement tiles theyreplaced, additional structural support is not required.
Clockwise from left in the next figure (28), the installation continues with brackets affixed to the underlay, inorder to hold the first row of tiles. Then the tiles are installed row by row, with convenient electricalconnectors plugged between each, and testing the power output along the way. The positive, negative andground wires are guided through the roof by a tube that combines flashing with a seal. More seals areprovided with caulking, as the final tile is installed. Electrical connection to the inverter is made and theSunTiles begin generating electricity (US DoE 2007, 10-14).
28

Figure 28: Installation process of SunPower SunTiles on a residential house (Source: US DoE 2007)
The following photo (figure 29) shows the finished product. The PV tiles are difficult to notice, in someangles of light, as they match the surrounding conventional roof tiles so well. The dark, almost black, areasare actually the PV tiles. They are installed on different roof faces of the houses, depending on theorientation of the house to the sun. Another reason for this is that some builders install PV on the back rooffor aesthetic reasons, as they prefer not to have a dark patch of PV roof visible from the front – or streetview. On the other hand, some builders choose to have the PV tiles on the front of the house so they can beseen for educational purposes, and this can encourage others to follow their example.
Figure 29: SunTile installation in a new housing development in Rocklin, California USA (near Sacremento) (Source: SunPower Corporation 2008)
29

3.4 PV roofing laminates
Figure 30: Uni-Solar PV laminates on a raised seam metal roof (Source: Sundial Energy 2009,http://www.sundialenergy.com/se_css_images/smartpower_roof/lam_silver_city_2_09.jpg)
PV laminates are rolls of thin film PV on soft plastic which can be bonded to roofing materials andstructures. Although they do not replace the roof, they are easily installed with electrical connections madeunder the roof and no additional structural support is required (US Department of Energy 2007, Chapter 4,12). These are available in a number of standard lengths. A popular option is Uni-Solar Laminates PVLseries, which come in approximately 3m lengths rated at 68W and about 5m lengths for 124W, as shown infigure 31 below.
Figure 31: Uni-Solar laminates models PVL-68 and PVL-124 (Source: Uni-Solar Ovonic 2009)
30
The laminates have a peel and stick adhesive with a bonding time of 15 – 20 minutes (per laminate) and canbe bonded to:
• Metal roofing and facades, such as galvalume steel, stainless steel, double galvanised steel• Membrane roofing, such as PVC, PVC-EVA, EPDM, TPO/FPO, TPE, ETFE• Composite building materials (Van Cleef 2001, 14-53)
Some other features of the Uni-Solar laminates include:
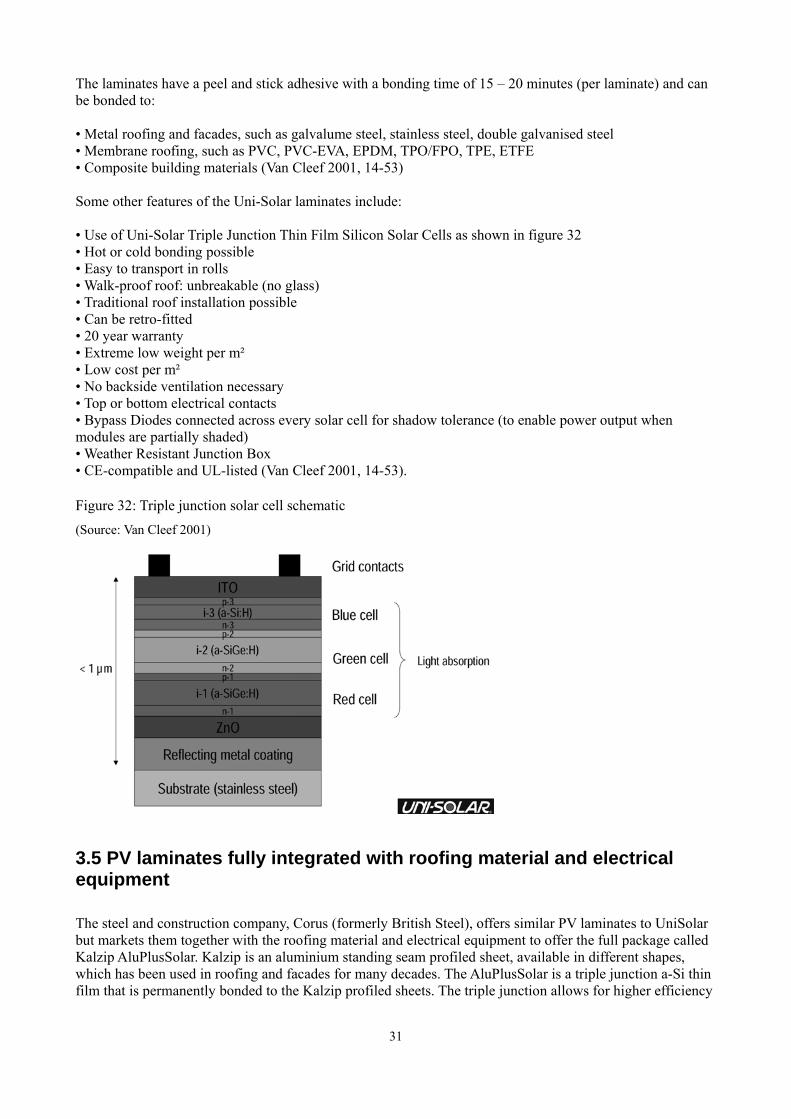
• Use of Uni-Solar Triple Junction Thin Film Silicon Solar Cells as shown in figure 32• Hot or cold bonding possible• Easy to transport in rolls• Walk-proof roof: unbreakable (no glass)• Traditional roof installation possible• Can be retro-fitted• 20 year warranty• Extreme low weight per m²• Low cost per m²• No backside ventilation necessary• Top or bottom electrical contacts• Bypass Diodes connected across every solar cell for shadow tolerance (to enable power output whenmodules are partially shaded)• Weather Resistant Junction Box• CE-compatible and UL-listed (Van Cleef 2001, 14-53).
Figure 32: Triple junction solar cell schematic (Source: Van Cleef 2001)
3.5 PV laminates fully integrated with roofing material and electricalequipment
The steel and construction company, Corus (formerly British Steel), offers similar PV laminates to UniSolarbut markets them together with the roofing material and electrical equipment to offer the full package calledKalzip AluPlusSolar. Kalzip is an aluminium standing seam profiled sheet, available in different shapes,which has been used in roofing and facades for many decades. The AluPlusSolar is a triple junction a-Si thinfilm that is permanently bonded to the Kalzip profiled sheets. The triple junction allows for higher efficiency
31
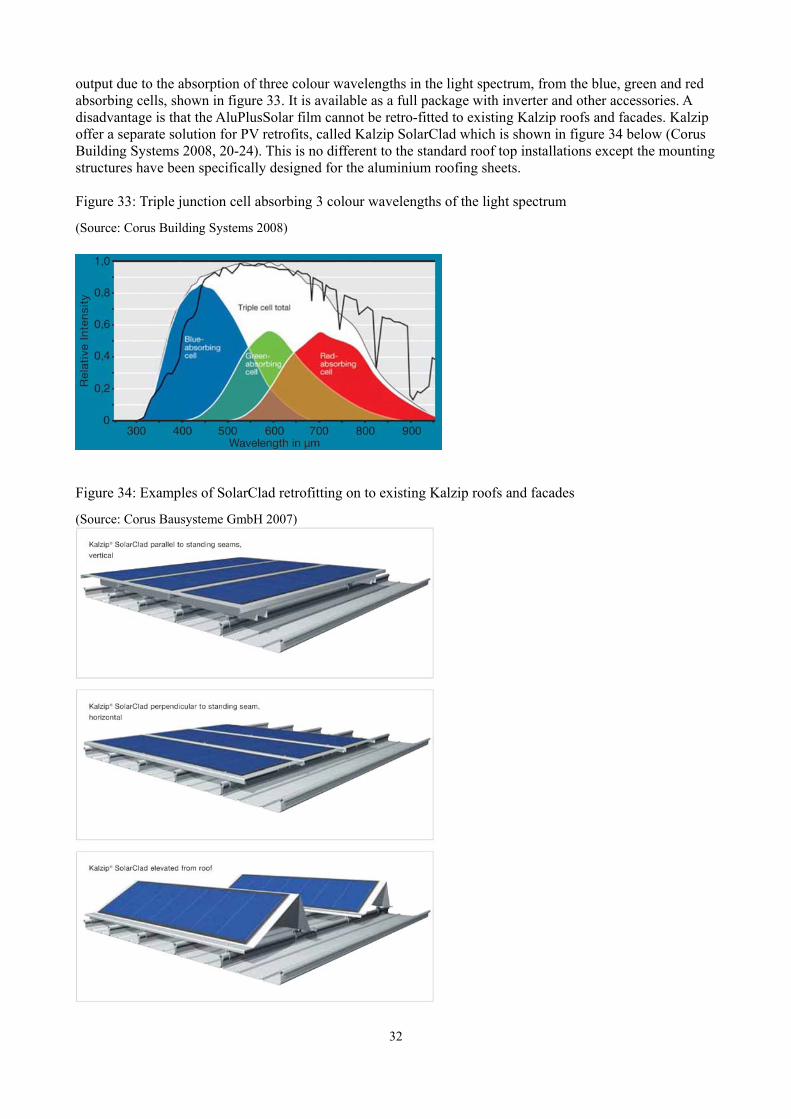
output due to the absorption of three colour wavelengths in the light spectrum, from the blue, green and redabsorbing cells, shown in figure 33. It is available as a full package with inverter and other accessories. Adisadvantage is that the AluPlusSolar film cannot be retro-fitted to existing Kalzip roofs and facades. Kalzipoffer a separate solution for PV retrofits, called Kalzip SolarClad which is shown in figure 34 below (CorusBuilding Systems 2008, 20-24). This is no different to the standard roof top installations except the mountingstructures have been specifically designed for the aluminium roofing sheets.
Figure 33: Triple junction cell absorbing 3 colour wavelengths of the light spectrum
(Source: Corus Building Systems 2008)
Figure 34: Examples of SolarClad retrofitting on to existing Kalzip roofs and facades
(Source: Corus Bausysteme GmbH 2007)
32

3.6 PV roofing integrated systems
Roofing integrated systems provide the dual function of generating solar electricity and a weather resistantroof covering, totally replacing conventional roofing material. They are durable in all weather conditions,with a shingle like design providing water drainage, as pictured below (figure 35). They are designed to bemounted in pitched roofs and have good rear ventilation so that efficiency is not compromised due to hightemperatures. Most examples of roofing integrated systems, such as Schott Solar's InDaX modules, usemono-crystalline or poly-crystalline PV cells for their higher efficiences. Both new installations and retro-fitting can be catered for with these systems.
Figure 35: Schott Solar InDaX roofing integrated 175W solar modules with close view of 225W modulesshowing overlapping
(Source: Schott Solar 2008)
3.7 PV facades
BIPV facades or curtain walls are often similar to BIPV glazing products, where different levels oftransparency and insulation are available. They are compatible with windows, doors and other facadecomponents (Hebly 2001, 1-8). They come in a number of colours. New versions of these products haveelectrically operated fittings technology so they can be slid or swung to aid the natural ventilation of thebuilding, and assist heating and cooling as pictured in figure 36 (Batoul 2008, 7-22).
Figure 36: Electrically operated BIPV facades to assist natural ventilation(Source: Batoul 2008)
33

3.8 Corus and Dyesol
Corus is the fifth largest steel producer in the world and has been involved in BIPV for many years with itspreviously mentioned products, AluPlusSolar and SolarClad. In late 2008, it opened a multi-million dollarfacility in partnership with Dyesol, to develop and produce DSCs fully integrated onto strip steel buildingproducts, in a coil coating line. The facility is located in Wales and has received £5M from the WelshAssembly Government. Dyesol does not manufacture the solar modules themselves but develops,manufactures and supplies the input materials, such as dyes, nanoparticulate pastes, electrolytes andcatalysts. They partner with other companies to commercialise BIPV products (Dyesol 2008-09, 1-2).
The Corus-Dyesol partnership aims to have the product available to market in 2010, with acceptance testingand on-site testing earlier that year. They announced that it will be the first PV technology to achieve gridparity under the normal light conditions experienced in most cities around the world, compared to the fulllight conditions required by others. It will operate in cloudy and hazy conditions, is less impacted by heatand has a 25 year corrosion resistance specification. As the existing coated steel market contributes over onebillion square metres per annum, Dyesol is forecasting over 200 million square metres per annum ofphotovoltaic product, which is equivalent to 35GW of PV energy! (Dyesol 2008-09, 1-2).
In September 2009, Dyesol Limited (ASX: DYE) won the ACT Chief Minister’s 2009 Export Award for theSmall to Medium Manufacturer’s Category and are now contenders for the Australian Export Award. Dyesolhas been recognised with many accolades and environmental awards, such as being included in the Top 100Low Carbon Pioneers of CNBC Europe in 2008, as well as the Australian CleanTech Index (Dyesol 2009).
3.9 PV railings
Figure 37: Solarail used in a New York city apartment balcony(Source: EPV Solar 2009)
Figure 37 shows a Solarail installation, where the solar modules are vertically mounted on to the balconystructure. A stainless steel or aluminium railing caps the other side for a decorative finish. These Solarail
34

modules utilise EPV Solar's dual junction a-Si cells and can be applied as balcony railings, terrace walls orguardrails. EPV Solar boasts that its a-Si modules have a 30% faster energy payback compared to standardcrystalline silicon modules (EPV Solar 2009, 1-3). So as figure 38 below shows, the time taken for themodule to generate enough energy to payback that consumed to produce the module, is about 2.5 years for a-Si. Another advantage of these – as well as BIPV products in general – are that they are frameless and do nothave the structural and mounting costs associated with standard PV modules.
Figure 38: Energy payback time for EPV Solar's a-Si module compared to a standard c-Si module(Source: EPV Solar 2009)
35

4.0 BIPV potential in Australia
In 1993, the International Energy Agency (IEA) established its Photovoltaic Power Systems Programme(PVPS) to look at the applications of PV energy conversion within its member countries, of which Australiais one. Task 7 of the PVPS ran from 1997 to 2001 – final reporting published in 2002 – with the objective:
“To enhance the architectural quality, technical quality and economic viability of photovoltaic power systemsin the built environment and to assess and remove non-technical barriers for their introduction as an energysignificant option.” (IEA - PVPS 2008, 121)
One of the outcomes of Task 7 was the report IEA - PVPS T7-4 (2002) Potential for Building IntegratedPhotovoltaics. This assessed the member countries' current building stock and its 'architectural suitability' forthe technology to come up with actual figures for the BIPV potential, which is defined as the available areacorrected for PV suitability. The report's other objectives were to compare different buildings and solarinsolation levels to develop a comprehensive methodology and rules of thumb for calculating BIPVpotential. These rules of thumb have been utilised for the following state-by-state analysis of Australia. Inaddition, the total amount of energy generated by this BIPV potential has been calculated, to evaluate howmuch of Australia's energy needs can be generated with BIPV. Perhaps more fitting, would be the amount ofthe building sector's energy needs that can be generated with BIPV. Following the IEA - PVPS T7-4 model,firstly, the total roof and facade areas were obtained from Australian Bureau of Statistics (ABS) data. Thenthis was corrected for architectural suitability and solar insolation levels from Bureau of Meteorology(BOM) data.
4.1 Architectural and solar suitability
IEA - PVPS T7-4 defines 'architectural suitability' to be suitability with respect to the building skin for PVdeployment. This includes corrections for limitations due to construction (for example terraces andelevators), historical considerations, shading effects and use of the available surfaces for other purposes.From the 14 OECD (Organisation for Economic Co-operation and Development) countries involved in thisstudy, the researchers were able to provide average architectural suitability values of 60% for roof areas and20% for facade areas.
The T7-4 report defines 'solar suitability' as the relative amount of irradiation for the surfaces depending ontheir orientation, inclination and location as well as the potential performance of the PV system integratedinto the building. Of the architecturally suitable areas for roof (60%) and facade (20%) above, the crosscountry rule of thumb is that 55% and 50% respectively will be solar suitable, as shown in table 3.
'Solar-architectural suitability' is the combination of both the above definitions. The report determined thatfor 1 m2 of ground floor area in a building, 0.4 m2 of the roof area and 0.15 m2 of the facade area would havethe solar-architectural suitability for BIPV. T7-4 pointed out that “the relative share of solar-architecturallysuitable area is fairly coherent within and between the countries considered.”
T7-4 also outlined the methodology for obtaining the data to calculate the BIPV potential. Most countries,including Australia, do not have direct statistical information available for roof and facade areas. So groundfloor area figures are used to calculate roof and facade area figures.
Consulting the Australian Bureau of Statistics (ABS) website, freely available statistics include number ofnew residential dwellings constructed and approved over each financial year and the cost of constructingthem. It is difficult to get accurate statistics on the total floor area of all existing building stock in Australia,so a sample of the most recent and accurate data was chosen for this analysis, in the hope that it can beextrapolated out to cover all existing building stock.
36
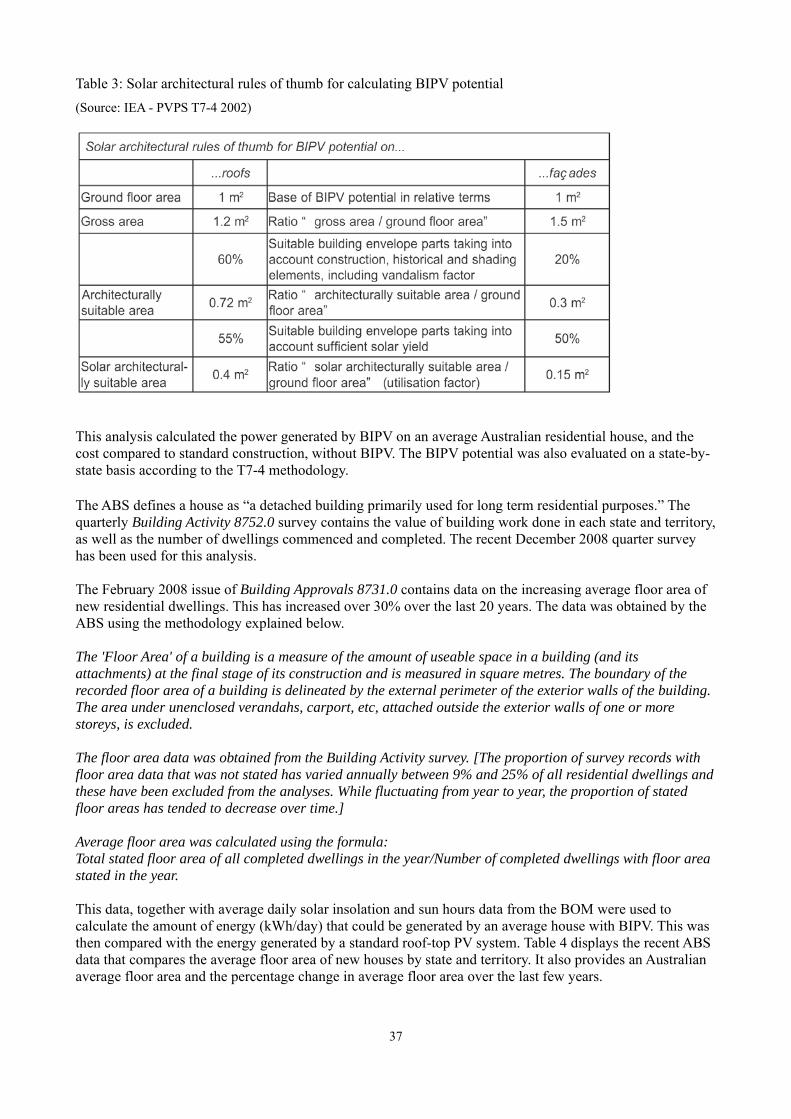
Table 3: Solar architectural rules of thumb for calculating BIPV potential (Source: IEA - PVPS T7-4 2002)
This analysis calculated the power generated by BIPV on an average Australian residential house, and thecost compared to standard construction, without BIPV. The BIPV potential was also evaluated on a state-by-state basis according to the T7-4 methodology.
The ABS defines a house as “a detached building primarily used for long term residential purposes.” Thequarterly Building Activity 8752.0 survey contains the value of building work done in each state and territory,as well as the number of dwellings commenced and completed. The recent December 2008 quarter surveyhas been used for this analysis.
The February 2008 issue of Building Approvals 8731.0 contains data on the increasing average floor area ofnew residential dwellings. This has increased over 30% over the last 20 years. The data was obtained by theABS using the methodology explained below.
The 'Floor Area' of a building is a measure of the amount of useable space in a building (and itsattachments) at the final stage of its construction and is measured in square metres. The boundary of therecorded floor area of a building is delineated by the external perimeter of the exterior walls of the building.The area under unenclosed verandahs, carport, etc, attached outside the exterior walls of one or morestoreys, is excluded.
The floor area data was obtained from the Building Activity survey. [The proportion of survey records withfloor area data that was not stated has varied annually between 9% and 25% of all residential dwellings andthese have been excluded from the analyses. While fluctuating from year to year, the proportion of statedfloor areas has tended to decrease over time.]
Average floor area was calculated using the formula:Total stated floor area of all completed dwellings in the year/Number of completed dwellings with floor areastated in the year.
This data, together with average daily solar insolation and sun hours data from the BOM were used tocalculate the amount of energy (kWh/day) that could be generated by an average house with BIPV. This wasthen compared with the energy generated by a standard roof-top PV system. Table 4 displays the recent ABSdata that compares the average floor area of new houses by state and territory. It also provides an Australianaverage floor area and the percentage change in average floor area over the last few years.
37

Table 4: Average floor area of new houses by state and territory (Source: Australian Bureau of Statistics 2008)
Figure 39 was used to calculate the daily energy in kWh/m2 by dividing the MJ/m2 value by 3.6 for theconversion. This gives the horizontal solar radiation. This conservative number gave a more realistic valuefor peak sun hours, as it is the peak sun hours – or 1000W/m2 of solar radiation – at which the solar poweroutput is specified for. In other words, a 1kW PV system will only provide 1kW when the panels areilluminated at 1000W/m2, which is usually between 12 noon and 2 pm on a clear, sunny afternoon. Sohalving the number of average sun hours should give an approximate estimate for the number of kWh'sgenerated in a typical day. Figure 39: Australian average daily solar exposure over a year (Source: Bureau of Meteorology 2009, http://www.bom.gov.au/cgi-bin/climate/cgi_bin_scripts/solar-radiation.cgi)
38

Costs for a standard grid-connect roof-top PV were obtained from a popular renewable energy installationcompany called Energy Matters. Their website (http://www.energymatters.com.au/climate-data/grid-calculate-solar.php) contains a clever system builder calculator, which takes user inputs such as location andaverage electricity usage to recommend a custom sized and costed PV system. This online calculator wasused to estimate the typical costs of a grid connected 1kW, 2kW and 3kW roof-top PV system.
Table 5 summarises the calculations and compares the daily kWh generated by a BIPV installation and atypical roof-top PV system. The typical construction costs for new houses was also obtained from the ABS.The results show that, even using a conservative 5% efficiency value for BIPV, the energy generated byBIPV on the roof and facades is 2 – 3 times more than the energy generated by a 3kW roof-top PV system onan average house, depending on solar insolation levels in each state. The reason why BIPV wins is due to thefact that there is more PV area available. The calculations are considering all the solar architecturally suitableareas. In addition, BIPV can provide all the energy needs of an average Australian household, which uses 15kWh per day, while a roof-top system cannot.
Roof-top PV is an additional cost to the building whereas BIPV can often be utilised at little or no extra costto a new building structure itself (Suntech 2009). More and more BIPV manufacturers are making claimsthat their products are a small additional cost to the building but the fact remains that BIPV is not a standardconstruction material anywhere in the world. In some cases, cost competitiveness is achieved through bulkbuy schemes where whole housing estates are built using BIPV. Independent tests and monitoring need to becarried out to validate these claims. Nonetheless, on existing building stock, the cost of BIPV can be offsetwith the cost of building materials during renovations.
In Table 5 (on page 40), the typical construction costs for a residential house in each state and territory ofAustralia was taken from ABS data. There is similar residential sector data published by the AustralianInstitute of Architects in their quarterly Archicentre cost guide (see Appendix E). Since the cost of BIPV isone of its major barriers to increased uptake, the aim of establishing these costs was to explore how muchextra BIPV costs compared to the building itself. This was a difficult process as BIPV is still new inAustralia and costs vary substantially. From BIPV suppliers in Australia, an approximate cost of $1000/m2
was used. This cost value is similar to that of BIPV in Europe at the moment (see sections 4.4 – 4.5). Ingeneral, BIPV is about half the construction cost of a typical house. So this means adding BIPV couldincrease the construction cost of a new house by 1.5 times! However, this does not account for the buildingmaterial and costs saved by using BIPV as a replacement to conventional building materials. Further studywould include a detailed cost breakdown of all building materials and labour, comparing a home utilisingBIPV and one without. The payback time in years could also then be calculated.
4.2 Limitations of these results
Although the results show that there is a great opportunity for the average house to become an energyproducer, instead of an energy consumer, there would be still be some buildings for which BIPV would notbe possible. Facade systems are considered to have low energy output in some locations around Australia dueto vertical elevation and high sun angles (http://www.yourhome.gov.au/technical/fs67.html#bipv 2008).Some buildings in densely populated cities would be affected by shading to such an extent that BIPV wouldnot be viable. However, thin film technologies that operate in shady conditions will be a feasible alternativehere.
In addition, the Table 5 calculations are based on BOM horizontal solar radiation data. Depending on factorssuch as the angle of the roof, whether it's north facing, orientation and general cleanliness, the actual solarradiation could be less or more than the horizontal solar levels. In facade systems, the actual levels would befar less than the horizontal levels. To compensate for this, other factors such as BIPV efficiency of 5% andpeak sun hours have been estimated very conservatively. With more time, higher accuracy in thecalculations can be achieved.
39

More calculations are also required into what the ABS classifies as “other residential dwellings” such as,multi-storey flats, units, apartments and townhouses. Average ground floor areas for these types of dwellingsalso exist, so this would be another useful comparison.
A limitation is that these results consider a typical new house only, when the vast majority of the buildingstock is existing. For BIPV to make a larger impact, defining costs for retrofitting will be essential. If theABS kept data on the total floor area of existing building stock, the true worth of retrofitting these with BIPVcould be calculated. The energy generating potential and the costing data would make a supporting case forBIPV retrofits. Since most buildings require retrofitting or upgrading more than once during their lifetime,options for BIPV should always be considered. Case studies and retrofitting examples could be created tohelp in this regard.
Further analysis is required into commercial buildings, as making them self sufficient will have a hugeimpact on reducing Australia's greenhouse gas emissions. Commercial building data though is difficult tofind, as the ABS does not record this type of data directly. There are also too many different types and it isdifficult to define your average commercial building.
An interesting point regardless of these limitations and approximations, is that of the total possible solarradiation energy striking an average building, if just 1% of this could be converted into electricity, this stillgenerates 7kWh per day. This is more than the electricity generated by a typical 1kW roof-top system in oneday (see Table 5).
Table 5: Comparing BIPV and roof-top PV systems daily kWh generated for average size houses by state
40
State NSW VIC QLD SA WA TAS NT ACT AUST274.6 237.8 239.3 191.5 237.5 195 231.2 243.6 239.2
109.84 95.12 95.72 76.6 95 78 92.48 97.44 95.68
41.19 35.67 35.9 28.73 35.63 29.25 34.68 36.54 35.88151.03 130.79 131.62 105.33 130.63 107.25 127.16 133.98 131.56
18 18 21 21 21 15 21 15 18.75Annual average daily sun hours: best case (hours) 9 7 8 9 10 6 9 8 8.25
5 5 5.83 5.83 5.83 4.17 5.83 4.17 5.21Roof: total possible solar radiation (kWh) 549.2 475.6 478.6 383 475 390 462.4 487.2 478.4Facade: total possible solar radiation (kWh) 205.95 178.35 179.48 143.63 178.13 146.25 173.4 182.7 179.4Total possible solar = roof + facade (kWh) 755.15 653.95 658.08 526.63 653.13 536.25 635.8 669.9 657.8BIPV efficiency = 5% (%) 5 5 5 5 5 5 5 5 5
7.55 6.54 6.58 5.27 6.53 5.36 6.36 6.7 6.58BIPV daily kWh generated (kWh/day) 33.98 22.89 26.32 23.7 32.66 16.09 28.61 26.8 27.13
151030 130790 131615 105325 130625 107250 127160 133980 131560typical construction cost for house ($) 272000 226000 240000 182000 241000 206000 313000 284000 236000standard 1kW roof-top PV system generates (kWh/day) 4.5 3.5 4 4.5 5 3 4.5 4 4.13standard 2kW roof-top PV system generates (kWh/day) 9 7 8 9 10 6 9 8 8.25standard 3kW roof-top PV system generates (kWh/day) 13.5 10.5 12 13.5 15 9 13.5 12 12.38typical cost for 1kW roof-top PV ($) * 12776 12776 12776 12776 12776 12776 N/A 12776 12776typical cost for 1.5kW roof-top PV ($) * 18397 18397 18397 18397 18397 18397 18397 18397typical cost for 2kW roof-top PV ($) * 23507 23507 23507 23507 23507 23507 23507 23507typical cost for 3kW roof-top PV ($) * 32194 32194 32194 32194 32194 32194 32194 32194*Approximate price for installation within 100km of all Australian Capital cities (not including NT) as at May 2009. Does not include govt. rebates.
Average floor area new house (m2)Roof equivalent solar architecturally suitable area (m2) = average Floor area x0.4 Facade equiv. solar architecturally suitable area (m2) = average Floor area x0.15 Total solar architecturally suitable area (m2)Annual average daily horizontal solar radiation (MJ/m2)
Daily solar radiation (kWh/m2)
BIPV power =0.05kW/m2 xBIPV area (kW)
BIPV system estimated cost assuming $1000/m2 ($)
# 10200# 12500# 19700
*http://www.energymatters.com.au/climate-data/grid-calculate-solar.php# bulk buy PV program within 100km of Darwin before Solar Credits + RECs rebate

4.3 Achievable levels of BIPV energy production These Australian results (in table 5) are consistent with those of the PVPS study, which found that about 75%of the BIPV potential is attributable to roof areas and about 25% to facade areas. PVPS goes further bylinking the average areas of solar and architectural suitability to other factors such as population size, annualsolar radiation and building types – residential, commercial, industrial, agricultural. This results in a valuefor the potential production of solar electricity on the building envelope in TWh per year. When this value isdivided by the actual electricity consumption, in TWh per year, using the following formula; the outcome is aratio for each country that is graphed in figure 40.
Ratio = solar electricity production potential / electricity consumption
Figure 40: Achievable levels of solar power production from PV roofs and facades(Source: Schoen et al. 2002)
Thus, Australia has the potential to generate 46% of its total electricity use from BIPV. The US is evenhigher, at 58%. This is still a conservative ratio because the global conversion efficiency (solar electricityoutput from total solar energy irradiated) was assumed to be only 10%. So if this was increased the BIPVpotential could be even higher. This amazing result is mainly attributed to the greater areas available forresidential buildings and larger per capita building areas in these countries. There is an average 36m2 of roofarea available per capita for PV in the US and Australia, while in Europe, it drops to 18m2. Denselypopulated countries like Japan have a much more modest BIPV potential, as the per capita building areas aresmall (PVPS T7-4 2002).
It is interesting to note that these findings were made 8 years ago and these IEA countries are still waiting tosee BIPV become mainstream in the building industry. It raises the question, if there are so many advantages,then should BIPV be mandated, like plumbing is for buildings?
4.4 BIPV costs in $/m2
The perception that BIPV is too costly is a major hurdle for the industry. One of the outcomes of PVPS Task7, as well as other research around Europe, was the need for BIPV costs to be quoted in $/m2, rather than$/Wp. This would allow a direct comparison with the traditional building materials and give architects a baseto work from when designing a building. The next figure (41) is a graphic representation, by a BIPVmanufacturer, of the costs involved in using an ASI Glass facade in place of a conventional wall. Theadditional costs of the BIPV system are offset by the energy generated over the system's life. Payback timecan be the same as for roof-top solar – about 1-3 years – but this is location dependent, among other factors.Most BIPV products have a 20-25 year guarantee. Unlike building materials, BIPV products generate
41

electricity and so will allow the building owner to recover the initial cost of the investment (Europe Sunrise2009, 17-19). Figure 41: Cost difference between BIPV ASI Glass product and conventional facade (Source: Schott Solar 2008)
In Europe, there are a number of different published graphs comparing the costs of BIPV to conventionalmaterials. As the number of BIPV installations has increased, there has been a dramatic drop in costs overrecent years, to the point where it is becoming cost competitive with conventional building materials. Figure42 shows that BIPV glass products are cheaper than some conventional materials like marble, andapproximately double the cost of heat insulated glass without the BIPV feature.
There is no compatible Australian dollar per square metre (A$/m2) graph for Australia (Snow 2009). Sincemuch of the BIPV products used here are imported direct from Germany, the Euros/m2 graph is an accurateestimate of their Australian costs with freight and import tax costs additional .
Figure 42: BIPV costs (Euros/m2) compared to conventional building materials
(Source: Architekturburo-Hagemann 2007)
42

4.5 BIPV $/m2 costs in Australia To create an A$/m2 BIPV cost comparison graph, quotes and information were sought through BIPVsuppliers in Australia. As these products are still relatively new here, all quotes are done on a price onapplication (p.o.a) basis. Thus, a hypothetical 1kW BIPV system on a residential house was created.Suppliers were asked to quote on a 1kW system or for a general $/Wp cost. Contacted suppliers includedKalzip, Suntech and Going Solar – an award winning renewable energy company based in Melbourne. Manysuppliers were reluctant to provide quotes. The reason for this may be that this was for student research andwould not lead directly to a sale! Another reason may be the difficulty in getting the costs themselves, as thisis not an off-the-shelf product like roof-top solar packages have become. Kalzip and Going Solar did notethat they had to refer each quote to their head offices in Germany. Dealing with exchange rates, freight,import duties, taxes and the like, do not make the job of providing this type of information easy.
Two stand-out companies though, are Schott Solar who quoted on their ASI glass product and SolarUnlimited who are distributors of Suntech's Just Roof BIPV modules. Schott quoted $25,179 for 1kW of ASIglass modules and about $26,500 for the double glazed version. Solar Unlimited provided a verbal quote of$7000 for 1kW of Suntech Just Roof modules, or about $7/W, imported from China. Solar Unlimitedstressed that Just Roof was still awaiting BCA approval in Australia, even though the product has beeninstalled elsewhere around the world in countries with reputable building standards, such as Japan and theUS. These costs are for the BIPV modules only, so installation, freight and BOS costs are additional. Refer toAppendix D for quotes and data sheets.
The cost divided by the area of the modules resulted in the A$/m2 values shown in figure 43. An extra 15%was added for freight, as suggested by Schott, to provide the maximum A$/m2 cost in the range. Purchasinglarger system quantities through a renewable energy supplier or retailer may reduce the costs.
The conventional building material costing was either directly taken or adapted from the March 2009Archicentre cost guide, which is a regular publication by the Australian Institute of Architects (see AppendixE). This is a freely available cost guide designed to help prospective residential home builders and renovatorsestimate the cost of their projects. Pricing would vary substantially under commercial and industrial projects,and there would also be some variation according to the construction market at the time of the project (whichis also outlined in Appendix E).
Taking into account the limitations mentioned already, figure 43 provides a realistic cost comparison forBIPV products in residential applications in Australia. These follow the European cost comparisons (figure42), showing that BIPV glass is about double the cost of standard glass windows. BIPV is also more costlycompared to standard roof-top PV. However, BIPV products are competitive or cheaper than the high-endbuilding materials like brick veneer and solid brick.
To improve this, more comprehensive data on Australian building material costs could be obtained fromReed Construction Data. They have publications and software – called Cordell e-costing – that is used byestimators and other building professionals to evaluate both residential and commercial buildings. TheCordell Housing Building Cost Guide and the Cordell m2 Commercial Building Cost Guide are two of therelevant tools. However, these could not be obtained due to the costs being many times larger than the budgetfor this project. They also contained no PV data.
43
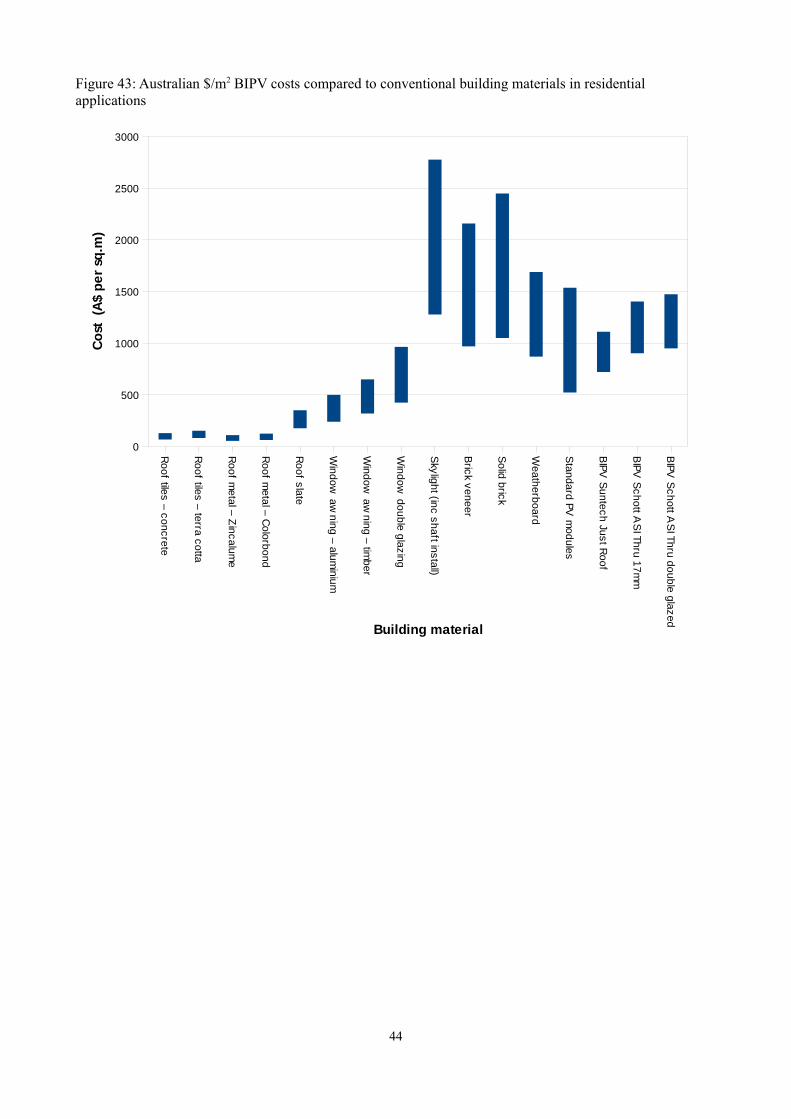
Figure 43: Australian $/m2 BIPV costs compared to conventional building materials in residentialapplications
44
Roof tiles – co ncrete
Roof tiles – ter ra cotta
Roof metal – Z incalum
e
Roof metal – C olorbond
Roof slate
Wi nd ow
awnin g – alum
i nium
Wind ow
awnin g – tim
be r
Wind ow
doubl e glazing
Skyli ght (inc sh aft instal l)
Brick veneer
Solid brick
Wea therboard
Stan dard PV m
odules
BIPV Suntech Just Roof
BIPV Schott A
SI Thru 17 mm
BIPV Schott A
SI Thru do uble glaz ed
0
500
1000
1500
2000
2500
3000
Building material
Cost
(A$
per
sq.
m)

5.0 Discussion
5.1 History of BIPVIn the 1960s, PV cells first entered niche markets, such as applications in space exploration (Hoffmann 2006,31). In the 1970s, PV started appearing around the world in off-grid applications where it was too costly orlogistically impossible to provide access to the electricity grid. In the 1980s, roof-mounted PV on buildingsand residential homes entered the market and in the 1990s, the first BIPV products became commerciallyavailable (Eiffert and Kiss 2000, 59). These were specifically designed to be integrated into the buildingenvelope. BIPV is the only option available to install renewable energy systems in many densely populated areas, suchas Japan, Europe and major cities in the U.S. Distributed generation within the urban environment is utilisedas there is no land available for large ground covering solar fields and arrays (Schoen et al. 1997, 2). Someother advantages of BIPV include:
➢ combining energy generation with other building functions, such as weather, heat and noiseprotection, shading, electromagnetic screening effect, thermal energy conversion and beingaesthetically pleasing (ISET 2007)
➢ cost savings from multiple building functions➢ no expensive or protected land required➢ no separate support structure required➢ electricity generated at the point of use so no transmission and distribution losses➢ reduces utility company's capital and maintenance costs➢ can match daily peak power demand, as it coincides with the sunniest time of the day
5.2 Climate change and the role of solar energyAnthropogenic induced climate change, peak oil, energy security, finite fossil fuel reserves and theincreasing number of world governments agreeing to reduce greenhouse gas emissions, are creating afavourable market for all renewable energy technologies. The amount of energy provided by the solarradiation striking the Earth's surface in one year is about 1 x 10¹⁸ kWh per annum. This is about 10,000 timesmore than the world's total energy consumption in one year (German Solar Energy Society DGS 2007, 8-9).The following figure depicts this along with the total nuclear and fossil fuel energy resources in the world.The equivalent energy contained in Uranium, coal, oil and gas reserves are tiny compared to the energy thatcould be harnessed from solar radiation.
Figure 44: Amount of energy in solar radiation reaching Earth's surface compared to worldwide energyconsumption and fossil fuel resources
(Source: German Solar Energy Society 2007)
45
Uranium Gas Oil Coal Annual worldwide energy consumption

5.3 Economics and cost reductions
For the PV market, costs have been reducing steadily for many years. In June 2008, Lazard estimatesreleased its levelised cost ($/MWh) comparisons between alternative (or renewable) energy and conventionalfossil fuel energy. The figure below shows that some alternative energy technologies are already costcompetitive, even before costing the environmental externalities and other financial mechanisms such as aprice on carbon. The lowest cost end of wind, geothermal and biomass technologies are under $50/MWh,while fossil fuels and nuclear start at $73/MWh and increase to a huge $334/MWh for gas used to powerpeaking loads. This is over double the cost of the most expensive types of crystalline PV energy sources. Alltypes of thin film PV are cheaper than first generation crystalline PV. Energy efficiency measures are by farthe least cost method to save MWhs.
Figure 45: Levelised Cost of Alternative versus Conventional Energy
(Source: Lazard estimates 2008)
Notes for figure 45 (Lazard estimates 2008): Reflects production tax credit, investment tax credit, and accelerated assetdepreciation as applicable. Assumes 2008 dollars, 60% debt at 7% interest rate, 40% equity at 12% cost, 20-yeareconomic life, 40% tax rate, and 5-20 year tax life. Assumes coal price of $2.50 per MMBtu and natural gas price of$8.00 per MMBtu.(a) Low end represents single-axis tracking crystalline. High end represents fixed installation.(b) Represents a leading solar crystalline company’s targeted implied levelized cost of energy in 2010, assuming a totalsystem cost of $5.00 per watt. Company guidance for 2012 total system cost of $4.00 per watt would imply a levelizedcost of energy of $90 per MWh.(c) Represents the leading thin-film company’s targeted implied levelized cost of energy in 2010, assuming a totalsystem cost of $2.75 per watt. Company guidance for 2012 total system cost of $2.00 per watt would imply a levelizedcost of energy of $62 per MWh.(d) Low end represents solar tower. High end represents solar trough.(e) Represents retrofit cost of coal plant.(f) Estimates per National Action Plan for Energy Efficiency; actual cost for various initiatives varies widely.(g) High end incorporates 90% carbon capture and compression.(h) Does not reflect potential economic impact of federal loan guarantees or other subsidies.(i) Based on advanced supercritical pulverized coal. High end incorporates 90% carbon capture and compression.
The President of the European Photovoltaic Industry Association (EPIA), Dr Winfried Hoffmann, predictedin 2006 that PV could provide 25% of the world's electricity needs by 2040. EPIA is the world's largest PVindustry association and has over 200 members, representing every sector in the PV value-chain, from siliconmanufacture to solar system installation. Hoffmann stated that up until 2003, the price of PV decreased by20%, every time the cumulative installed capacity doubled. With these economies of scale, this represents aprice decrease of about 5% every year. He predicted that the current growth in grid-connect systems in
46

Europe, Japan and the US would continue, as well as seeing a trend for PV in remote rural areas ofdeveloping countries. These off-grid systems would account for the large number of installations after 2030and provide electricity to the 2 billion people in the world who live without it today, as shown in figure 46(Hoffmann 2006, 31-34). Figure 46: Projected PV power installed per year (TW/annum) (Source: Hoffmann 2006, 32)
5.4 $1/W breakthrough
In February 2009, First Solar broke the $1per watt price barrier by reducing manufacturing costs to 98 centsper watt, making them the world's lowest cost PV manufacturer. First Solar uses the CdTe thin filmtechnology and first began commercial production in 2004 at a manufacturing cost of $3 per watt. Since thenmanufacturing capacity has increased from 25MW to 1GW in 2009. Economies of scale and cost reductionsgo hand-in-hand. In a media release, First Solar CEO Mike Ahearn, said “Without forward-lookinggovernment programs [mainly in Germany] supporting solar electricity, we would not have been able toinvest in the capacity expansion which gives us the scale to bring costs down. First Solar’s ongoing focus oncost reduction enables continued growth even as subsidies decline. In the meantime, those initial investmentsare paying off in a cleaner environment and in the creation of thousands of jobs with a clear future.” (FirstSolar 2009). The $1/W breakthrough is so important as it is the point where solar can achieve grid paritywith fossil fuel generated electricity.
5.5 Grid parity
In late 2008, EPIA announced their new target for PV to supply 12% of European electricity demand by2020. They also declared that grid parity for PV will be reached in a number of EU countries, starting withthe countries with the highest solar radiation; namely Italy and Spain, who will reach grid parity as early as2010 and 2012 respectively. Germany is expected to reach grid parity in 2015, with the rest of Europe getting
47

there by 2020. With the EU's 20% renewables target by 2020, PV is expected to play a major role not only inachieving the target, but exceeding it. EPIA also predicts that thin film PV will reach grid parity beforeconventional crystalline types of PV. 4GW of thin film is expected to be installed by 2010, representingabout 20% of total PV production (EPIA 2008-09, 1-2). In contrast, the Australian PV industry has always been slow in uptake and has a dismal representation incumulative installed PV capacity compared to countries such as Germany, Japan and the USA. Despite beingthe sunniest continent in the world, reasons for Australia's lagging behind in the PV market, include theabundance of cheap coal and existing infrastructure for fossil fuel generated electricity, as well as the lack ofgovernment support mechanisms. Australia's cumulative installed capacity compared to other countries isdisplayed in the following graph. It is interesting to note the recent sharp increases in the PV capacities ofSpain, Italy, USA and Korea; that are mainly spurred on by new government incentives.
In 2007, Australia's PV industry was worth an estimated $210m plus $81.6m in exports, while the value ofimports was about $100m. Direct employment is about 1660 people in sectors such as policy, R&D,manufacturing, distribution and installation (Watt, 2008).
Figure 47: Australia's installed capacity compared to major world PV markets (Source: IEA-PVPS 2008)
Australia's PV industry is dominated by off-grid systems in remote locations. These are both domestic andnon-domestic. There has a been a recent surge in domestic grid connect systems, mainly attributable to thefederal government rebate under the Solar Homes and Communities Program, which was abruptly ended inJune 2009 (See Appendix A). In similar research to EPIA, the Australian PV Association (APVA) led by DrMuriel Watt, has estimated that grid parity for PV in Australia can be reached by as early as 2012 for the best
48

case (low cost and high efficiency) PV and by 2018 under more conservative scenarios. PV is already morecost effective compared to most diesel powered grids, as illustrated in figure 48.
Figure 48: Australian retail electricity prices compared to international average and best PV trends (Source: Watt 2009)
5.6 Efficiency increase
It is well known that, for every doubling of PV module efficiency, the price has steadily decreased by 20%(Watt 2009, 24). This makes efficiency improvements paramount to cutting costs and striving to better the$1/W breakthrough mark for all thin film technologies. Figure 49 shows that crystalline silicon PV isexpected to exceed its commercial target efficiency of 25% in the near future. Second generation thin filmsare closing the efficiency gap quickly. Figure 49: Predicted efficiency increases for different PV technologies in the laboratory (Source: Raugei and Frankl 2009, 395)
49

Both silicon wafer and single junction thin film technologies are nearing their upper efficiency limit of 31%.This is shown in figure 50, where first generation wafer/crystalline PV has moderate efficiency and highproduction costs per square metre, with little hope for improvements. Second generation on the other handoffers production costs as low as US$30/m2 but low efficiencies. Theoretically, sunlight can be convertedinto electricity at an efficiency close to the Carnot limit of 95%. So as mentioned previously, third generationtechnology offers high efficiencies, in the order of 2-3 times better than existing PV efficiencies, in a lowcost thin film product. Even if there was an increase in per m2 production costs compared to secondgeneration, this would be offset by the huge gain in efficiency. From an economic point of view, this wouldmake third generation PV one of the cheapest forms of future energy production (Green 2006, 1-5).
Figure 50: Efficiency and cost trade-offs for the three generations of PV technology; crystalline, thin filmsand advanced thin films like dye solar cells (in year 2003 dollars)(Source: Green 2006)
Stacking layers of PV cells using the R2R process can be a cost effective way to increase efficiency. Thisallows the absorption of a greater part of the light spectrum, as shown below.
Figure 51: Multi-junction cells increasing the utilisation of the solar spectrum
(Source: Schindler 2006)
50

The various types of TFSCs have their own spectral sensitivity, meaning they have a particular wavelengthrange for which they operate most efficiently and this also affects how they operate under different solarirradiance conditions. Figure 52 shows that crystalline silicon is most sensitive to longer wavelengths of thesolar spectrum. In comparison, thin films are more sensitive to shorter wavelengths in the visible light rangeof 400 – 800nm. Of these, a-Si is most sensitive to short wavelengths, while CdTe and CIS prefer themedium wavelengths of solar radiation (German Solar Energy Society DGS 2007, 60-61).
Figure 52: Spectral sensitivity of different types of solar cells (Source: German Solar Energy Society DGS 2007, 61)
5.7 Matching daily load profiles
Another argument for increased BIPV uptake is the close matching of PV output to the daily electricity loadprofile. The highest loads occur just after midday when air conditioning use peaks and this also coincideswith the time of day when solar insolation and therefore PV output is at its maximum. Summer peak loads inparticular, put a huge strain on the electricity generators and push up electricity spot prices for those south-eastern states in the National Electricity Market (NEM), as there becomes a need to bring expensive peakingpower plants online. High prices and power outages are becoming all too common and using PV power tolimit these peaks is arguably a safe, reliable and economical option.
Research by Watt et al. (2005) and various studies since, have shown that PV output correlates directly withthe load profile of commercial buildings, as shown in figure 53 and supported by the graphs in appendix B.The correlation with residential loads is not as good because of the second peak early in the evening whenresidents return home from work and cook meals. This evening peak is not easily met by PV, without someform of energy storage. However, the whole electricity market could benefit from increased PV uptake in thecommercial sector, especially since Australia's buildings are responsible for 23% of Australia's totalgreenhouse gas emissions. The breakdown for this is about 10% for commercial and 13% for residentialbuildings (2009 http://www.asbec.asn.au/research).
51

Figure 53: Daily commercial load profile compared with reduced load from distributed PV resource(Source: Watt et al. 2005)
5.8 Advantages of thin film PV
So far the discussion has concentrated on the advantages of PV compared to fossil fuel generated electricityand the predictions for reaching grid parity. Now the focus changes to thin film PV – second and thirdgeneration – compared to first generation crystalline silicon PV. This block diagram shows that themanufacturing work flow for a TFSC is much simpler than for a crystalline one. Both mono- and poly-crystalline cells require higher temperatures, more steps like drawing out and slicing the silicon, more timeand thus more money. Full production process flow diagrams for crystalline silicon, as well as CdTe cells,can be found in Appendix C.
Figure 54: Thin film PV manufacturing work flow compared to crystalline (Source: Mitsubishi Heavy Industries Ltd 2009)
The roll-to-roll process used in the manufacture of CIS and CIGS cells requires far less materials and energycompared to crystalline silicon cells. It also means that the final product has no cell interconnection failures,like crystalline modules can have. The following figure (55) illustrates the production process for CIGS cellsby a small start-up company in Germany called PVflex, which began in 2006. For detailed CIGS and CISproduction line diagrams, see Appendix C. PVflex uses a typical process whereby the deposition of the backcontact layer (Mo) on the 35mm stainless steel substrate and the deposition of the window layer (TCO) are
52
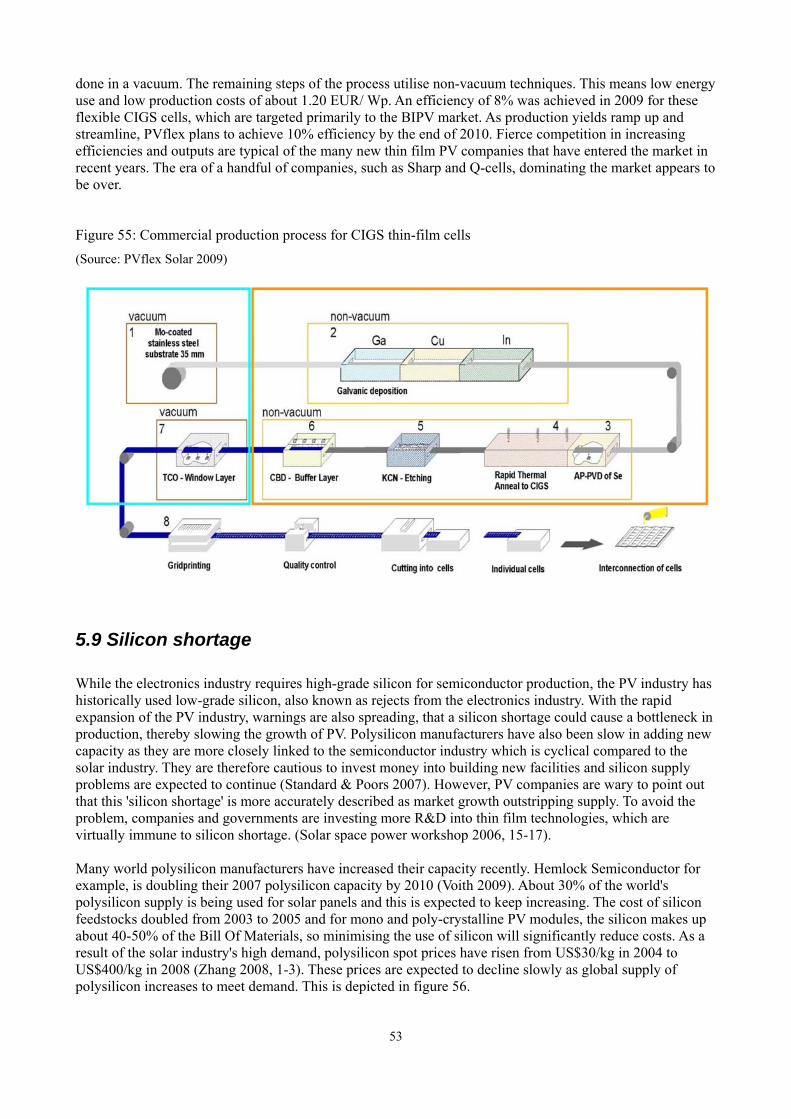
done in a vacuum. The remaining steps of the process utilise non-vacuum techniques. This means low energyuse and low production costs of about 1.20 EUR/ Wp. An efficiency of 8% was achieved in 2009 for theseflexible CIGS cells, which are targeted primarily to the BIPV market. As production yields ramp up andstreamline, PVflex plans to achieve 10% efficiency by the end of 2010. Fierce competition in increasingefficiencies and outputs are typical of the many new thin film PV companies that have entered the market inrecent years. The era of a handful of companies, such as Sharp and Q-cells, dominating the market appears tobe over.
Figure 55: Commercial production process for CIGS thin-film cells(Source: PVflex Solar 2009)
5.9 Silicon shortage
While the electronics industry requires high-grade silicon for semiconductor production, the PV industry hashistorically used low-grade silicon, also known as rejects from the electronics industry. With the rapidexpansion of the PV industry, warnings are also spreading, that a silicon shortage could cause a bottleneck inproduction, thereby slowing the growth of PV. Polysilicon manufacturers have also been slow in adding newcapacity as they are more closely linked to the semiconductor industry which is cyclical compared to thesolar industry. They are therefore cautious to invest money into building new facilities and silicon supplyproblems are expected to continue (Standard & Poors 2007). However, PV companies are wary to point outthat this 'silicon shortage' is more accurately described as market growth outstripping supply. To avoid theproblem, companies and governments are investing more R&D into thin film technologies, which arevirtually immune to silicon shortage. (Solar space power workshop 2006, 15-17).
Many world polysilicon manufacturers have increased their capacity recently. Hemlock Semiconductor forexample, is doubling their 2007 polysilicon capacity by 2010 (Voith 2009). About 30% of the world'spolysilicon supply is being used for solar panels and this is expected to keep increasing. The cost of siliconfeedstocks doubled from 2003 to 2005 and for mono and poly-crystalline PV modules, the silicon makes upabout 40-50% of the Bill Of Materials, so minimising the use of silicon will significantly reduce costs. As aresult of the solar industry's high demand, polysilicon spot prices have risen from US$30/kg in 2004 toUS$400/kg in 2008 (Zhang 2008, 1-3). These prices are expected to decline slowly as global supply ofpolysilicon increases to meet demand. This is depicted in figure 56.
53

Figure 56: Global supply/demand of solar polysilicon and price trend (Source: Solarbuzz 2008)
Figure 57 is a pictorial representation of the amount of silicon and energy used to produce a TFSC comparedto a polycrystalline silicon cell. Thin film PV uses about one-fiftieth of the silicon and half the energy,compared to polycrystalline, per kWp. So it is clear that TFSCs make good economic and environmentalsense (German Solar Energy Society DGS 2007, 39-40). Figure 57: Comparison of materials and primary energy used in production for thin-film (left) andpolycrystalline cells (Source: German Solar Energy Society DGS 2007)
5.10 Temperature effects
Most TFSC technologies are particularly suitable for a hot country like Australia, where PV paneltemperatures can easily reach 70ºC. TFSC efficiencies are not affected by heat, like their crystallinecounterparts. In hot and arid parts of Australia, TFSC will have an increased power output compared tocrystalline.
Research has proven that this is even true in Germany, where the climate is cooler and solar insolation levelsare about one third of those of Australia's. ISET in Kassel Germany, tested micromorphous tandem thin film
54

PV (Model MT130) by Mitsubishi against standard crystalline PV, as shown in figure 58. As the test facilityis in the northern hemisphere, the highest power outputs in summer occur between April and August. Themicromorphous thin film consistently outperforms the crystalline in generating more kWh per kWp everymonth, and therefore has a higher annual power output.
Figure 58: Annual power production with thin film PV cell (Mitsubishi micromorphous tandem) compared tocrystalline PV (Source: Mitsubishi Heavy Industries Ltd 2009)
Immunity to temperature effects does not hold true for all TFSCs. The main disadvantage of dye solar cells isthat they exhibit some degradation under heat and UV light and consequently lifetimes of these modules areonly about 15 years, compared to minimum 20 years for other PV technologies.
5.11 Technical benefits of a-Si in BIPV products
As mentioned earlier, the main benefits of a-Si – such as the low cost manufacturing, good efficiencies andabundance of silicon – make it stand out with the most installed capacity out of all TFSCs in the market(Maurus et al. 2004, 22).
Research shows that there is also potential for further cost reductions. Larger module sizes increasing from1m2 to several m2 will make for more cost effective installations and generate options for more flexible BIPVapplications. Schott Solar also believes that larger modules will complement developments in the flat-panelindustry and also give silicon based TFSCs an advantage over other types of thin films (Maurus et al. 2004,27). The only disadvantage of a-Si is the lower efficiency and the Staebler-Wronski effect, compared tocrystalline silicon PV.
5.12 Staebler-Wronski effect
During the first 6-12 months of operation, a-Si cells are affected by light-induced degradation. Consequently,their power output drops to their nominal power rating and stabilises to this level for the rest of its life. Thisis known as the Staebler-Wronski effect (German Solar Energy Society DGS 2007). In early designs, the
55

extent of photo-degradation was as high as 30% but with more recent designs, the loss of efficiency is lessthan 10% of the original value.
5.13 Thin-film BIPV vs conventional roof-top PV
There are a many reasons why BIPV roofing and laminates are favoured over the conventional roof-top PVmodules. BIPV products are:
➢ Unbreakable (this applies to the flexible products, not the glass type BIPV)➢ Light weight < 5 kg/m2 (compared to roof-top PV > 15 kg/m2) ➢ No Roof Penetrations (for most BIPV products)➢ No Wind Uplift➢ No mounting structures required➢ Energy production less dependent on tilt (as they perform better in cloudy conditions and high
temperatures compared to crystalline PV) (Van Cleef 2009, 7-12)
These are illustrated in the following pictures.
Figure 59: (L-R) Examples of conventionally mounted PV panels broken, structural supports blown over,wind uplift; compared to unbreakable and flexible Uni-Solar laminates (bottom)
(Source: Van Cleef 2009)
5.14 Third generation thin film PV
The most advanced types of third generation technology – dye-sensitised cells (DSC) and organic PV (OPV)– still have low efficiencies compared to first and second generation silicon PV. Where they do have acompetitive advantage is their flexible substrate and the ability to perform in dim or variable (or even indoor)lighting. With further research and refinement into their low temperature roll-to-roll (R2R) manufacturingmethods, which already incorporate conventional printing techniques, production costs will reduce to makethem economical for large surface areas. The DSC market is therefore in large area BIPV, while OPV targets
56

lower power consumer electronics applications, due to its much lower efficiencies and cell lifetime, assummarised in the following table. (Drachman 2009).
Table 6: Comparing Dye-sensitised and Organic PV cells (Source: http://www.greentechmedia.com/images/wysiwyg/reports/tf-table.jpg)
Dyesol, EPFL, G24i, Mitsubishi and Peccell are the world's largest developers of DSC, while Konarka andPlextronics represent the largest OPV developers. Recent research shows that the future of these technologieswill depend on the following factors:
➢ costs in $/Wp, as well as $/m2 of product and power availability (kWh/Wp/annum); ➢ the technical and environmental profile of each newly introduced technology; ➢ added value for the consumer and architects; ➢ ease of production and the scale at which a production plant becomes economically feasible.
Although both technologies have found some niche markets, further R&D on cell efficiency, stability andlifetime is required in order to ensure their long term future in conventional electricity generation systems,such as roof-top solar (Drachman 2009).
5.15 Environmental impact
Many studies have investigated the environmental and health issues associated with expanding theproduction of TFSCs. The resources and energy required, the use of toxic materials, the emissions generatedand waste management are just some of the factors investigated. Overall findings concluded that there are noserious environmental bottlenecks for upscaling for higher TFSC production. However in the long term, Inand Cd resource availability may become an issue (Miles et al. 2005 33).
57
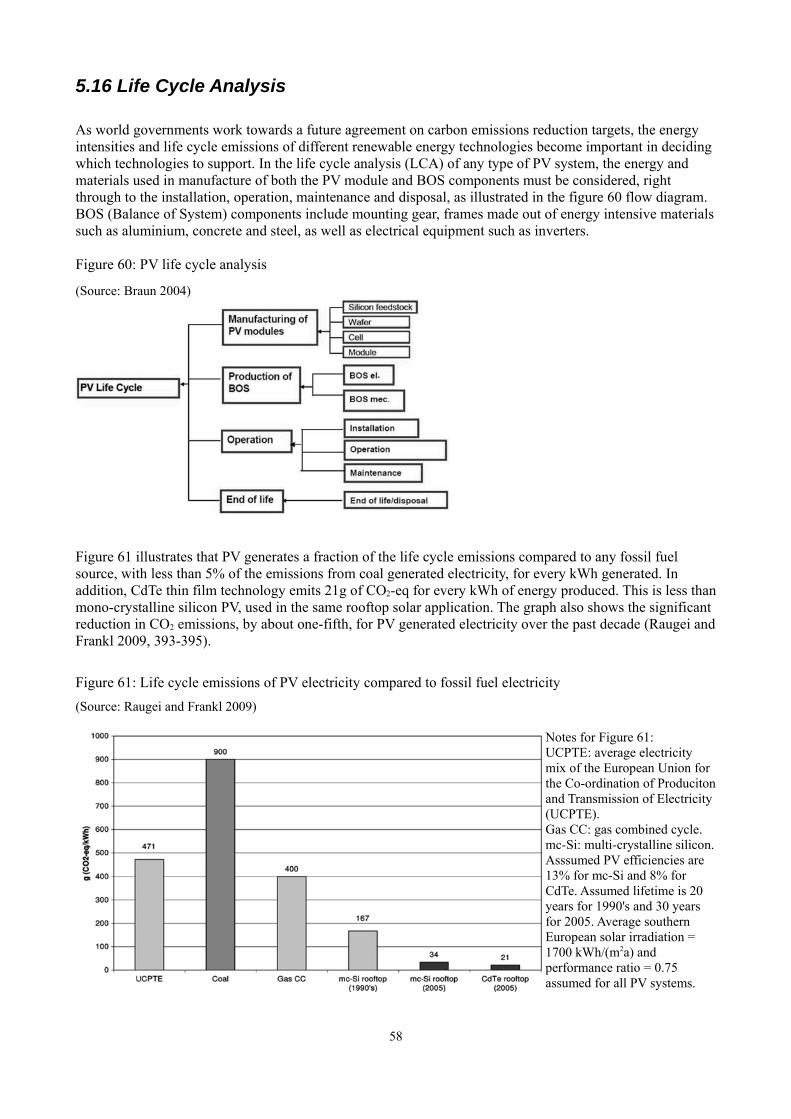
5.16 Life Cycle Analysis
As world governments work towards a future agreement on carbon emissions reduction targets, the energyintensities and life cycle emissions of different renewable energy technologies become important in decidingwhich technologies to support. In the life cycle analysis (LCA) of any type of PV system, the energy andmaterials used in manufacture of both the PV module and BOS components must be considered, rightthrough to the installation, operation, maintenance and disposal, as illustrated in the figure 60 flow diagram.BOS (Balance of System) components include mounting gear, frames made out of energy intensive materialssuch as aluminium, concrete and steel, as well as electrical equipment such as inverters.
Figure 60: PV life cycle analysis
(Source: Braun 2004)
Figure 61 illustrates that PV generates a fraction of the life cycle emissions compared to any fossil fuelsource, with less than 5% of the emissions from coal generated electricity, for every kWh generated. Inaddition, CdTe thin film technology emits 21g of CO2-eq for every kWh of energy produced. This is less thanmono-crystalline silicon PV, used in the same rooftop solar application. The graph also shows the significantreduction in CO2 emissions, by about one-fifth, for PV generated electricity over the past decade (Raugei andFrankl 2009, 393-395).
Figure 61: Life cycle emissions of PV electricity compared to fossil fuel electricity (Source: Raugei and Frankl 2009)
Notes for Figure 61:UCPTE: average electricitymix of the European Union forthe Co-ordination of Producitonand Transmission of Electricity(UCPTE).Gas CC: gas combined cycle.mc-Si: multi-crystalline silicon.Asssumed PV efficiencies are13% for mc-Si and 8% forCdTe. Assumed lifetime is 20years for 1990's and 30 yearsfor 2005. Average southernEuropean solar irradiation =1700 kWh/(m2a) andperformance ratio = 0.75assumed for all PV systems.
58

These LCA emissions are set to halve for some thin film types by 2025 as shown in figure 62. This graphsthe emissions generated by mono-crystalline silicon PV (sc-Si), which still has the highest module efficiencytoday compared to other technologies, of 14% and a lifetime of 30 years. This has been compared to ribbon-Si which, for the purposes of the graph, has an efficiency of 20% and lifetime of 35 years in 2025; and anefficiency of 22% and lifetime of 40 years in 2050. The most successful TFSC of CdTe has 13% efficiencyand 35 year lifetime in 2025 and 16% efficiency and 40 year lifetime in 2050. New generation DSCs have17% efficiency and 15 year lifetime by 2050. Other assumptions of the graph's LCA emissions for all PVsystems are solar radiation of 1700 kWh/(m2 p.a.) and a 0.75 performance ratio.
Figure 62: Emissions generated by PV technologies today and projected to 2050 (Source: Raugei and Frankl 2009)
The results of another LCA study (Braun 2004, 1-87) are displayed in figure 63. Although this study analysesmono-crystalline PV only, it shows the effect of different forms of building integration on the total PV lifecycle emissions. The emissions generated by a tilted roof retrofit building integration were used as thereference case (100%). Tilted roof retrofit installations can suffer from sub-optimal solar radiation angles,module over heating and lower efficiences, that in turn lead to increased emissions in order to generate akWh of electricity. Solar tiles and roof integrated PV installed during the first construction of a building canreplace conventional construction materials and benefit from initial planning to increase efficiency, solarradiation and cooling. These types of BIPV emit less CO2, SO2, NOx, particulates and NMVOC (nonmethane volatile organic compounds) compared to the reference case. Solar tiles are more efficient than roofintegrated systems, as tiles have no need for a frame.
The skylight integrated type of BIPV has low life cycle emissions due to it being able to displace the use ofglass without the need for mounting structures. Efficiencies of BIPV in vertical facades can be significantlyaffected by site, shading, orientation and latitude. Similarly to roofing installations, facades can displaceconventional building materials with their use in original designs being favoured over retrofitting later.Facade installations can greatly increase the amount of BIPV available for a building but the graph revealsthat it is more emissions intensive compared to popular roof integration.
An installation on a flat roof with an aluminium reflector focuses more diffuse radiation onto the solar panelto increase its efficiency. Another interesting case is that of ground mounted PV, where emissions are muchhigher than the reference case because of the requirement for larger frames, mounting platforms andfoundations for the solar panels.
59

Figure 63: Emissions for different types of building integration in comparison with tilted roof retrofit (inkg/kWhel) (Source: Braun 2004)
Overall, retrofits have a lower efficiency compared to new installations and therefore release moreemissions. With building lifetimes as long as they are, retrofitting is still an important consideration inpromoting the widespread use of BIPV.
Since most PV life cycle emissions are generated by the fossil fuelled electricity consumed in the PVproduction process, using solar energy to make solar panels could make it a truely zero emissionstechnology. Studies have shown that at least 89% of emissions could be prevented if PV displaced all otherelectricity from the grid (Fthenakis et al. 2008, 1).
5.17 Cadmium (Cd) Toxicity
In the 1970s, the US Department of Energy began funding research into the health and environmentalimpacts of the production, use and disposal of thin film PV cells. Focus has been on Cd compounds due toinhalation risks. Health and safety assessments have been carried out on the thin film deposition process –particularly the CdS bath – and its effect on workers in the production line. CdTe however, is considered tobe a much more stable and insoluble form of Cd, compared to the elemental Cd used in Ni-Cd batteries.Safety hazards have also been found with the use of pyrophoric SiH4 in a-Si cells. Precautions are thereforetaken in a-Si, CdTe and CIS thin film manufacturing facilities, to limit the exposure of workers to hazardouschemicals (Miles et al. 2005 32-33).
60
Research has also been undertaken in the operation phase of TFSCs. Testing the effects of fire, weather anddamage due to mishandling was done on CdTe and CIS modules, by measuring the concentrations ofcadmium, selenium and tellurium in the air during and after the event. The results proved that there is “noacute danger” and that the burning of a PV module actually produced less cadmium and selenium emissionsthan a coal fired power station in normal operation. Both coal and oil burning power stations produce Cdemissions, while PV cells produce no emissions during normal operation (Miles et al. 2005 31-33). The lifecycle emissions from CdTe cells are 90 – 300 times lower than coal-fired power stations with optimallyfunctioning particulate control devices (Fthenakis et al. 2008, 6).
In terms of life cycle emissions, CdTe emits the least compared to all other PV technologies because it usesthe least energy in manufacture. The processing steps are simpler and there are fewer of them. This isillustrated in the block diagram comparing CdTe to the silicon PV production process, in appendix C. Thedifferences in emissions between PV technologies are tiny though, when compared to those from fossil fuels(Fthenakis et al. 2008, 1-7).
5.18 Recycling
Satisfactory treatment methods for the recycling of manufacturing waste and end of life PV modules haveexisted for decades. However to boost their green credentials, most PV companies are now actively pursuingrecycling. Companies such as Deutsche Solar (Germany) and Soltech (Belgium) reclaim old crystallinesilicon modules and recycle them into high efficiency recycled modules, which have an energy paybackperiod of about 20% that of a brand new module (Miles et al. 2005 34).
There are also companies that have developed recycling processes for TFSCs. The most prominent of theseis First Solar, who set aside funds for collection and recycling with the sale of every CdTe module. This isthe first pre-funded collection and recycling program in the PV industry. Just as there are companies thatrecover 100% of Cd from Ni-Cd batteries (Fthenakis 2004, 323), First Solar recycles over 90% of their CdTePV modules into new products, including new modules (First Solar 2009). After collection and removal offrames, junction boxes and wires, the recycling process begins with a shredder and hammermill, where theglass modules are broken down. The semiconductor films are physically removed in a slowly rotating leachdrum containing sulphuric acid and hydrogen peroxide and then the solids are separated from the liquids.The glass is rinsed to remove any residual semiconductor film. The final precipitation stage involvesseparating each of the metals (e.g. Cd, Te, Se, Sn, Ni, Al, Cu) into a thickening tank, where the filter cakeproduct can be packaged for disposal by a third party. The metals are made into new products or new PVmodules. First Solar emphasises that their recycling process is monitored and audited to comply with localregulations in health, safety and waste management (First Solar 2009). The total cost of recycling thin filmPV is estimated to be 5c/W, excluding transportation (Fthenakis 2004, 323).
Although recycling of PV modules is a new idea, recycling of building materials has been done for a longtime. Materials such as glass, concrete, steel, aluminium from a building can all be recycled and used in newproducts for a fraction of the energy used to produce it from raw materials.
61

6.0 Future for BIPV
In 2007, Europe's BIPV market was worth an estimated 143 million Euros with an installed capacity of25.7MW, mostly in the commercial and industrial sectors (Sivanandan 2009). This constitutes less than 5%of the total European PV market. Many construction projects and studies have found that BIPV can beinstalled for the same cost or even for less cost than if conventional construction materials were used, withthe added value of generating electricity. Raugei and Frankl (2009) have studied the outlook and cost forBIPV systems to 2050, according to three different scenarios. These cumulative installed capacities of PVthat these three scenarios envisage are displayed in the following graph (figure 64).
Figure 64: Predicted world cumulative PV installed capacities according to three scenarios (Source: Raugei and Frankl 2009)
Firstly, the pessimistic scenario follows the IEA and OECD's 2006 Energy Technology Perspectives report inwhich PV is not expected to become cost competitive with conventional grid power and will account for only2% of global electricity supply by 2050, to 500 GWp total installed capacity. TFSC market growth ispredicted to be slow, contributing only 15% by 2025 and 45% by 2050. As revealed in figure 65, BIPVsystem costs to 2050 plateau much earlier under this scenario, because BIPV systems are still seen as after-market add-ons and thus consumers still have to pay the full mechanical BOS (Balance Of System) costsassociated with them.
Scenario 2 is the intermediate scenario called optimistic/realistic. This is based on the latest SolarGeneration Report by EPIA and Greenpeace which expects an annual installed capacity peaking at 55 GWpin 2025, followed by a slower linear annual growth rate to reach 2400 GWp by 2050. TFSC marketcontributes 45% by 2025 under this scenario, underpinned by CIS, CdTe and to a lesser extent, a-Si. Thegraph shows BIPV system costs falling significantly due to it becoming a standard part of the building andthe associated mechanical structure being absorbed by the buildings themselves.
Scenario 3 is the very optimistic/ technology breakthrough scenario where large scale energy storageinfrastructure, such as hydrogen, compressed air energy storage (CAES) or flywheels, will be common placeby 2035. This will allow PV to become a stable, dispatchable energy source, contributing nearly 9000 GWpby 2050 or 35% of global electricity production. This scenario is entirely feasible and based on a number ofstudies. One of these ground-breaking studies (Fthenakis et al. 2009) predicts that almost 70% of electricitydemand in the USA could be met by PV with CAES. In scenario 3, third generation PV will expand tocontribute 50% of the PV market by 2050 and BIPV costs will drop as a consequence, especially after 2025 –
62

when they are forecast to become mainstream.Figure 65: Predicted BIPV system capital cost to 2050 under three scenarios: 1) pessimistic 2) optimistic/realistic 3) optimistic/ technology breakthrough(Source: Raugei and Frankl 2009)
6.1 Barriers
A 2008 report by the IEA-PVPS Task 10 found that non-BIPV use far outnumbers BIPV use in roof-topapplications. A separate report, by the European Sunrise project titled Barriers for the introduction ofPhotovoltaics in the building sector (Fraile et al. 2009), was published in mid-2009. It aimed to strengthenties between PV manufacturers, architects and construction companies, and thus, lead to a larger deploymentof BIPV products. Both reports outline various barriers to increasing BIPV uptake, including:
➢ Higher availability of conventional framed, non-BIPV modules➢ BIPV systems may not meet code requirements➢ BIPV systems may have higher costs due to lower volume production and other factors➢ Application of BIPV systems may require specific building dimensional characteristics➢ Weather sealing requirements of BIPV systems may not be proven➢ BIPV is not allowed on heritage buildings (of historical and cultural significance)➢ missing links between architects and engineers, manufacturer and end-user.
The IEA-PVPS Task 10 report emphasises that these barriers can be addressed adequately by BIPVmanufacturers and accelerated by additional support policies which make it more favourable over non-BIPVoptions. This will expand the BIPV industry and allow economies of scale to remove cost barriers, so BIPVwill eventually become cost effective in its own right. It is interesting to note that these barriers are nothingto do with the technical efficiency of the PV cell itself, but rather to do with the packaging of the PV and thedesign of the module to make it more marketable.
6.2 BIPV and building code requirements
To address the barriers to increasing BIPV uptake, manufacturers and designers must produce systems thatmeet minimum building standards and consider building industry practices. The easier and quicker the BIPV
63
1)
2)
3)

products can be installed by builders, the more popular they will become over competing products.Durability, lifetime and aesthetics are additional features that must be included.
BIPV can be much more effective in new buildings where they are involved in the design and planning stagebefore the building itself is built. Again, this requires engagement of the building industry. Factors such asbuilding orientation, roof pitch, shading, building placement, road access and roof dimensions compared tothe BIPV system, all contribute to the efficiency of the BIPV system. Many of these factors cannot bechanged after the initial planning stage of the building and therefore need to be communicated throughincreased involvement from BIPV companies (PVPS Task 10 2008, 24). Complex approval and certificationprocedures also hinder the retrofitting of BIPV in existing buildings. It is just as difficult as receivingapproval for BIPV components on a planning application for a new building (Montoro et al. 2009, 1-2).
Furthermore, the building code standards for BIPV are still lacking. Even in Europe, each member countryhas its own regulations and standards, making it difficult for BIPV products to enter the market (Montoro etal. 2009, 16). Similar experiences have been had in Australia, where there are a number of BIPV productsawaiting Building Code of Australia (BCA) approval, even though they have been proven elsewhere in theworld. To improve the situation in the EU, IP Performance (a consortium of some EPIA members anduniversities) is developing European standards for BIPV modules which includes tests for fire safety,mechanical and electrical loads for construction requirements, water tightness and temperature (www.pv-performance.org 2009).
This will assist architects and builders, as well as the manufacturers of the BIPV modules themselves. Atpresent, each PV module manufacturer produces its own unique module, with different size, dimensions,efficiency and power ratings. The sheer number of different types inhibits their use by architects. TheEuropean Sunrise project (2009) has recommended that the dimensions for PV modules become standardisedto overcome this. Similarly, inverter (and other BOS) manufacturers should standardise voltage and power tosimplify connection of PV modules. For conventional roof-top PV, structural manufacturers should alsostandardise so there is no need for installers to design the connection between the PV and structural support.With BIPV products, the structure should be integrated with the PV module, so it is supplied ready to installand marketed in a plug-and-play style.
Moreover, enhanced structural integration in new buildings as well as retro-fitting existing ones will reduceBOS component costs for these decentralised systems. This means large scale BIPV installations aretechnically and economically feasible. Even on historical and heritage sites where aesthetic, social andcultural issues are paramount, innovative engineering solutions have already been developed in the EU, toimprove visual integration of PV (Raugei and Frankl 2009, 394-395).
6.3 BIPV manufacturers and the building industry
Widespread adoption of BIPV requires partnerships between manufacturers and the building industry thatminimise risks associated with new, innovative products and also decrease costs. For building products, thevalue chain includes the manufacturer, distributor, retailer, installer and then the final customer, which resultsin a high final price and low margins for those along the value chain. In the emerging market of BIPV,having too many small companies in the value chain can hinder profits and prevent market expansion. It alsoseparates the manufacturer from the final user of the product, the builder, and raises barriers in terms ofcustomer support which can again be a major hurdle for a new product. Cases where the BIPV manufacturerhas directly approached end users have allowed them to enter new construction markets with enough successto far outweigh the added costs of doing so (PVPS Task 10 2008, 23-24).
An example of a successful partnership between a BIPV manufacturer and a building group is the Rocklin,California residential housing development in the USA (shown previously in figure 29). Developer GrupeHomes have constructed 144 homes on which every roof has a 2.4kWp BIPV tile system. SunPower –
64

Powerlight manufactures the SunTile product for these systems and markets them directly to buildingcompanies. They even provide sales representatives and marketing material to prospective homebuyers, aswell as educating the developer's sales staff. Web-based monitoring of the solar system is also available oncethe homeowners move in. SunTile is not available to individual suppliers and homeowners. The aim is toreduce costs in the value chain, increase profits and to provide direct product support to the building industry.With the market maturing, economies of scale will reduce manufacturing costs, increase margins and thenallow building suppliers to enter the value chain (SunPower 2008).
SunTile homes boasted that they were selling at twice the rate, compared to standard homes, when they firstwent on sale in mid-2007 (SunPower 2007). The company attributes this to their customer service,educational support, marketing and the ability to project a green, environmentally friendly image. For costsof this project in 2007, SunPower stated that adding the 2.4kWp SunTile system to a 3 to 5 bedroom homeadded about US$20,000 – 25,000 to the builder's total costs. The state of California provided a rebate ofabout US$5,000 and the homeowner received a US$2,000 federal tax credit to make the final priceUS$13,000 – 18,000. Payback times ranged from 10 – 30 years under scenarios of saving US$500 – 1,400per year in electricity bills, equivalent to about a 60% reduction in energy use (Kanellos 2007). In addition,the SunTiles can increase the re-sale value of the house.
6.4 Financing mechanisms and industry support measures
In Australia, the government has always favoured an investment focused rebate programs approach, overgeneration focused market mechanisms like the feed-in tariff (FiT), which have been so successful inGermany and Spain. To evaluate the various PV dissemination methods, figure 66 displays:Global effectiveness = total installed capacityLocal effectiveness = installed capacity per inhabitant.
The abbreviations for the major programs of each country evaluated are:
AU PVRP – Australia's PV Rebate Program (2000 – 2009)CA ERP – California's Emerging Renewables Program (1998 – 2006)DE HTDP – Germany's 100,000 Roof Program (1999 – 2003) DE EEG – Germany's Renewable Energy Act and Feed-in tariff (since 2000)IT TPV – Italy's “Tetti PV” roof program (2001 – 2005) IT CE – Italy's “Conto Energia” Feed-in tariff (since 2005)JP RPVDP – Japan's Residential PV Dissemination Program (1994 – 2005) DK SOL – Denmark's SOL 300 + SOL 1000 PV rebates (2000 – 2006) ES RD – Spain's Royal Decree 436/2004 Feed-in tariff (since 1999) CH EWZ – Switzerland's Swiss solar stock exchange program which is voluntary generation focusedincentive (since 1996). Note that the state of California in the US is considered to be one of the world's largest economies andtherefore is evaluated in comparison with whole countries. The total installed PV capacities in Germany and Japan eclipse that of any other country. However, theirgovernments have used different approaches to achieve this. Although Germany had a rebate program(100,000 roof program), most of its success is due to the generous FiT. The graph data also shows thepositive impact a FiT had in Italy, when it switched over from a rebate program in 2005. Despite only threemonths of data available for the graph, Italy's FiT has achieved many times more installed PV capacity thanthe four year rebate program did previously. Japan on the other hand, has achieved most of its installedcapacity with a government rebate similar to Australia's. Japan's success was accelerated by supportingincentives like low interest consumer loans, comprehensive education about PV and categories for largehousing developments and public buildings, which Australia does not have. The Japanese government hasalso always provided financial support to R&D, demonstration projects and industrial facilities for the PVindustry (Lopez-Polo, Haas, Suna 2007, 14-32).
65

Figure 66: PV dissemination/ promotional programs effectiveness by country (Source: Lopez-Polo, Haas, Suna 2007)
Figure 66 notes:1) The data corresponding to Spain comes from program ICO-IDAE and represent accepted power rather than installedcapacity. It includes also a small percentage of off grid plants.2) For the Swiss program of EWZ the inhabitants of Zurich have been considered.3) For the Italian FIT capacity accepted capacity and not installed capacity has been considered in order to give a betteridea of the market.
The highest levels of BIPV investment have not been in areas that have a good solar resource or that arearchitecturally suitable but where there is a high level of legislative support (Sivanandan 2009). In Europe,this support is implemented through the feed-in tariff.
6.5 BIPV specific feed-in tariff Feed-in tariffs (FiT) have been implemented in over 40 countries around the world and have been creditedfor the huge success of the renewable energy industries in Germany and Spain (Hughes 2009). Thosetargeted specifically towards BIPV are also beginning to have a positive impact in Europe. France is goodexample. France depends on nuclear energy for about 80% of its energy needs and has very limited naturalresources, so their energy security and independence strategy has made them look towards PV (Rhodes2007). In 2006, the country introduced a BIPV specific FiT, which pays 60 Euro-cents for every kWh fedinto the grid. This is 5 times the standard electricity rate and almost double the amount paid for roof-top andground-based PV systems (http://www.pv-tech.org/tariff_watch/_a/france_mainland/ 2009). By 2007, theFrench BIPV market had grown to be one of the largest in Europe, being second only to Germany(Sivanandan 2009). Large-scale BIPV systems are popular. Typical of these is a 205kW roof-integratedsystem at a chicken farm in Bretagne, France which was commissioned in early 2009. The BIPV systembecomes a second income to farmers because of the FiT (Osborne 2009). France has attracted a number ofEuropean manufacturers to establish offices in the country as it works hard to develop a high level ofexpertise in design and installation in its own right (Sivanandan 2009).
Most states and territories in Australia have mandated a net FiT which only pays the premium price for thesurplus electricity exported to the grid. However, the ACT uses the gross FiT model, similar to Germany's,and the NSW state government recently announced that a generous gross FiT paying 60c/kWh wouldcommence in January 2010 (Energy Matters 2009). There are no BIPV specific FiTs in Australia. Research
66

has shown that a nation-wide gross FiT, like Germany's, would cost the average Australian household anextra 12c a year on their electricity bill (Watt, 2009). This one incentive would bring all the states andterritories into line and also be easier to administer than a number of different rebates.
6.6 Education, training and demonstration projects
Demonstration projects have a major role to play in influencing the building industry and ultimately, the end-consumer or home owner. Recommendations by PVPS and university researchers found that BIPVmanufacturers should cover education and training of architects, suppliers, builders, installers and othertrades in the promotion of their products. This would allow communication between all participants andincrease expertise and confidence in the BIPV industry. Feedback from builders and end-users of theproducts would also create new product ideas and improvements. Involvement of all building industrystakeholders is essential to improve product confidence (PVPS Task 10 2008, 23).
Government funding of showcase projects has provided a number of successful BIPV installations inAustralia (Prasad and Snow 2004, 1). Some examples include:
➢ 2000: Sydney Olympic Solar Village contains about 700kWp of BIPV roofing laminates➢ 2002: University of Melbourne commissioned a 40kWp polycrystalline cell system as Australia's
first BIPV facade on a commercial building.➢ 2006: Ballarat University installed 8.4kWp of a-Si double glazed facade.➢ 2006: Szencorp building in South Melbourne commissioned a pergola made of 1kW a-Si semi-
transparent BIPV modules➢ 2007: Australia's first BIPV Noise Barrier was installed at the Tullamarine-Calder Interchange near
Melbourne Airport, using a-Si double glazed modules. See Appendix F for further details. Government funded projects will always have important educational value and support in gaining localexpertise. It will also provide for advancements in technology. Energy storage for example, has always beenan issue with solar, as the sun is not a 24 hour resource. However, since over 95% of Europe's BIPVinstallations are on-grid, there is effectively no market for BIPV storage technologies (Sivanandan 2009).
6.7 Zero emissions buildings
In March 2009, the European Parliament (EP) agreed to a directive that, all new buildings should be at leastnet zero energy buildings by December 2018, at the latest (EPIA 2009, 1). In 2007, the UK announced newregulations for all new buildings to be zero emissions by 2016, for heating, hot water, cooling, ventilation,and lighting. This corresponds to Level 5 of the Code for Sustainable Homes. Level 6 is a completely zerocarbon home, where there is zero net emissions from all energy use in the home (Department forCommunities and Local Government 2006, 6-10). Since the UK's announcement, many other countries haveformed associations advocating similar standards.
As PV is the most flexible renewable energy technology to allow direct integration into buildings, BIPV hasa critical role, along with energy efficiency measures, in achieving these goals. EPIA also encourages the useof renewables, in buildings undergoing major renovations, as existing building stock represents the majority.Although no legislation has been passed to this effect, EPIA remains hopeful that it is at least on the agendaof the governments of Europe (EPIA 2009).
The goal of zero emissions building design is that buildings should never need more energy over theirlifetime than they can produce. BIPV technology, along with other on-site renewable energy generation, willbecome essential to achieving this. An example from Germany is displayed in figure 67, where energyefficiency and passive solar design can create a new passive solar house (or passivhaus in German) whichuses about 20% of the energy that an existing building uses. Using PV, buildings can generate over
67

50kWh/m2 every year. When this is used in conjunction with other active solar systems, such as solar thermalhot water, the result is an 'energy surplus house' (European Sunrise Project 2009, 2-7).
Figure 67: Energy demand (kWh/m2 per annum) of existing buildings compared to energy efficient buildings
(Source: Architekturburo-Hagemann 2007)
6.8 PV GIS supporting BIPV design
PV GIS (Geographical Information System) is an interactive software design tool that can be used to helparchitects calculate how much energy can be generated from a BIPV system using different PV technologies,like CIS and a-Si. It has an interactive map (figure 68) which allows the user to click on the site location.Since the PV GIS project has been funded in Europe, the only locations that the software considers areEurope and Africa. This would be a great tool to have in Australia.
Figure 68: Photovoltaic Geographical Information System interactive software screen shot(Source: http://re.jrc.ec.europa.eu/pvgis/apps3/pvest.php# 2009)
68

7.0 Conclusion
7.1 Summary It is clear that BIPV installations have already been successful in a number of showcase projects in Australia.But there are also many opportunities yet to be exploited. BIPV products are the only building material thatwill make a return on their investment by generating their own electricity. There are numerous opportunitiesfor different thin-film technologies in many applications for BIPV products and installations. The technologyis proven. There just needs to be some sort of financial incentive to offset the high capital costs. Then aseconomies of scale build up, the prices will become competitive and BIPV will come into its own.
In reference to the research question and objectives:
Thin film PV has seen massive cost reductions compared to crystalline PV technology and promises to gofurther over the coming decade. Its low cost manufacturing process as well as economic use of materialsused are inherent to the properties of this second generation PV technology. By 2012, world PV production isset to reach almost 43GW, with about 35% of this being thin films. In 2009, First Solar, who only producethin film PV, became the second largest PV manufacturer in the world. First Solar's CdTe PV broke the $1/Wprice barrier in early 2009 by reducing manufacturing costs to $0.98/W. Efficiencies are also predicted toincrease for thin films, contributing to further reductions in costs.
Properties if thin films make them well suited to use in BIPV products. For example, they are flexible,lightweight, weather proof, aesthetically pleasing, easy to integrate, do not require mounting structures,perform better in cloudy conditions in densely populated areas and better in high temperatures compared tocrystalline PV.
The potential for BIPV in Australia is huge. An average Australian residential home can generate 2-3 timesits average daily energy use by utilising the building's total solar architecturally suitable area with BIPV.BIPV products are also becoming cost competitive with conventional building materials. BIPV glass forexample, is about twice the cost of standard glazing. The $/m2 costs for Australia follow closely withEuropean costs, as most of the BIPV products are imported from Europe.
7.2 RecommendationsRenewable energy technologies face much tougher economic conditions in a fossil fuel rich country likeAustralia, compared to Europe. Government support is critical for BIPV to achieve the potential that it canand to create a level playing field against Australia's well established coal and fossil fuel industries. Some ofthe measures that the Australian government could introduce in support of BIPV are:
➢ One Australia-wide gross feed-in tariff with extra incentives for BIPV generated electricity, paying 5times the standard rate for electricity. This would also remove the administrative burden on state andterritory governments, each with different schemes.
➢ Mandate for all new buildings to be zero emissions by 2016.➢ Encourage the use of on-site renewables.➢ Fund large-scale public projects to showcase the BIPV technology.➢ Support and coordinate with independent regulators so the approval process for the importation of
BIPV products is transparent and straight forward.➢ Provide educational programs that train architects and builders to design BIPV installations.➢ Support cooperation between BIPV manufacturers and others in the value chain.➢ Fund R&D into thin-film PV technologies and their commercialisation in BIPV applications. ➢ Support the PV manufacturing industry to attract new facilities to Australia. This provides more
green jobs, a highly skilled workforce and supports the PV industry for future generations.
69

All of these support measures are in line with world's best practice. They are nothing new and have beenproven to give results.
Further work that could be done includes evaluating all the BIPV products on the market and calculating anaccurate A$/m2 cost that will be useful to architects in the early design stages. Increasing the range of BIPVproducts will also increase the awareness of these products. A$/m2 costs can be lesser when installed in largecommercial applications, so further research is required for cost comparisons in commercial buildings.Commercial and industrial applications earn the largest revenue in the European BIPV markets, so this datawould be more valuable than residential data.
Perhaps a future project for a software programmer or student, would be to design PVGIS software forAustralia, in line with the European and African example. This will help architects see the advantages ofBIPV and calculate the energy generated by these systems.
More opportunities exist for BIPV in Australia because thin film PV technologies can only help to lower thecosts for BIPV products. In particular, Australian-Swiss company, Dyesol's third generation dye-sensitisedsolar cells are set to revolutionise the BIPV industry. Due for release on the commercial market in 2010,these thin film cells operate in shade and low light levels and are integrated with the well known Corus stripsteel sheeting, making them familiar to designers and easy to install. Finally, an Australian based company isset to take on the world BIPV industry. Hopefully the publicity and prestige this brings to Australia willencourage the federal government to invest more in renewable energy technologies and less in subsidisingthe fossil fuel industry.
70

References
Architekturburo-Hagemann. 2007. Building Integrated Photovoltaics. http://www.pvsunrise.eu/pv-diffusion-in-the-building-sector-bipv/project-work-program.html (accessed 19 October 2009).
Australian Bureau of Statistics. 2009. Australian Industry: 2007-08, 28 May.http://www.abs.gov.au/AUSSTATS/[email protected]/DetailsPage/8155.02007-08?OpenDocument (accessed 11 July, 2009).
Australian Bureau of Statistics. 2009. Building Activity: December quarter 2008, 17 April.http://www.abs.gov.au/AUSSTATS/[email protected]/ProductsbyTopic/ADA6562044E1FBF2CA2568A900139362?OpenDocument (accessed 11 July, 2009).
Australian Bureau of Statistics. 2009. Building Approvals: February 2008, 7 April.http://www.abs.gov.au/AUSSTATS/[email protected]/DoSSbyTopic/6647286D5517E834CA2570F10015ED94?OpenDocument(accessed 11 July, 2009).
Australian Bureau of Statistics. 2009. Building Approvals: May 2009, 1 July.http://www.abs.gov.au/AUSSTATS/[email protected]/ProductsbyTopic/0545FFC6A101264DCA25719F007F6F1F?OpenDocument (accessed 11 July, 2009).
Australian Sustainable Built Environment Council (ASBEC) website. http://www.asbec.asn.au/research (accessed 22August 2009).
Australian Government, Department of the Environment, Water, Heritage and the Arts, Energy Efficient Buildingswebsite http://www.environment.gov.au/sustainability/energyefficiency/buildings/ (accessed 19 October 2009). Basore, Paul A. 2005. Crystalline Silicon on Glass Device Optimisation. 31st IEEE Photovoltaic Specialists Conference,Lake Buena Vista, Florida, 3 – 7 January. http://www.csgsolar.com/pages/technology.php?lang=en (accessed 28 June2009).
Basore, Paul A. 2006. CSG-2: Expanding the production of a new polycrystalline silicon PV technology.http://www.csgsolar.com/pages/technology.php?lang=en (accessed 28 June 2009).
Bautoul, Hamid. 2009. BIPV: New Products Development. Schuco France. http://www.pvsunrise.eu/pv-diffusion-in-the-building-sector-bipv/project-work-program.html (accessed 11 October 2009).
Bischoff, Ariane. 2008. Chances in the BIPV Market in France. Scheuten Solar France. http://www.pvsunrise.eu/pv-diffusion-in-the-building-sector-bipv/events/31st-january-2008-change-of-mind-sets-bipv-a-market-segment-with-huge-potential.html (accessed 26 July 2009).
Boulanger, Pascal. 2005. Building integrated photovoltaic systems. CLEFS CEA No.50/51 Winter 2004-2005.http://www.cea.fr/var/cea/storage/static/gb/library/Clefs50/pdf/124a126boulanger-gb.pdf (accessed 22 March, 2009).
Braun, Martin. 2004. Environmental External Costs from Power Generation by Renewable Energies. http://elib.uni-stuttgart.de/opus/volltexte/2004/1948/pdf/Martin_Braun_Diplomarbeit_Environmenta_External_Costs_from_Power_Generation_by_Renewable_Energies.pdf (accessed 22 March, 2009).
Brown, Gregory F. and Junqiao Wu. 2009. Third generation photovoltaics. Laser & Photon. Rev. 3, No. 4, 394–405.http://www.mse.berkeley.edu/~jwu/publications/Brown-LPR-09.pdf (accessed 19 October 2009).
Brown, James and Chris Hendry. 2009. Public demonstration projects and field trials:Accelerating commercialisation ofsustainable technology in solar photovoltaics. Energy Policy 37 (2009): 2560–2573.
Chopra, K.L., P.D. Paulson and V. Dutta. 2004. Thin-Film Solar Cells: An Overview. Progress in Photovoltaics:Research and Applications 12: 69–92.
Corus. 2004. Construction Details: Kalzip roof systems. http://www.kalzip.com/kalzip/au/literature/literature_brochure-download.html (accessed 8 June, 2009).
71

Corus. 2007. Kalzip Systems: Product information and specification.http://www.kalzip.com/kalzip/au/literature/literature_brochure-download.html (accessed 8 June, 2009). Corus. 2007. Kalzip Solar Power Systems: Flexible solutions for creative solar architecture.http://www.kalzip.com/kalzip/au/literature/literature_brochure-download.html (accessed 8 June, 2009).
CSG Solar. 2006. CSG Solar Frequently Asked Questions, Version 0.5, 21 June.http://www.csgsolar.com/pages/technology.php?lang=en (accessed 28 June 2009).
Department for Communities and Local Government, UK. 2006. Code for Sustainable Homes: A step-change insustainable home building practice. http://www.planningportal.gov.uk/uploads/code_for_sust_homes.pdf (accessed 19October 2009).
Drachman, Philip. 2009. Third-Gen Thin-Film Solar Technologies: Forecasting the Future of Dye-Sensitized andOrganic PV. Greentech Media, 8 October. http://www.gtmresearch.com/report/third-generation-thin-film-solar-technologies (accessed 19 October 2009).
Dyesol. 2008. Dyesol and Corus Accelerate Building Integrated Solar Cell Commercialisation. Media release 16December. http://www.dyesol.com/index.php?element=DYE081216+-+Dyesol+and+Corus+Accelerate+Building+Integrated+Solar+Cell+Commercialisation (accessed 22 March, 2009).
Dyesol. 2009. Dyesol and Corus Power Through Third Milestone. Media release12 February.http://www.dyesol.com/index.php?page=NewsArticles&archiveitemid=5&archiveitemdatetime=2009-02-12%2015:16:32&archiveitemstart=1&archiveitemtotal=27 (accessed 22 March, 2009).
Dyesol. 2009. History, How it works, How to order, Manufacturing, Technology pages from Dyesol website.http://www.dyesol.com/ (accessed 22 March 2009).
Egan, Renate J. et al. 2006. Silicon Deposition Optimisation for Peak Efficiency of CSG Modules.http://www.csgsolar.com/pages/technology.php?lang=en (accessed 28 June 2009).
Egan, Renate. 2009. Renate Egan interview with Beyond Zero radio. Podcast available fromhttp://podcast.beyondzeroemissions.org/audio/podcast-2009-10-30-67411.mp3 (accessed 7 November 2009).
Egan, R., P. Basore and R. Evans. 2007. Silicon Deposition Optimisation for Manufacturability of CSG Modules.http://www.csgsolar.com/pages/technology.php?lang=en (accessed 28 June 2009).
Eiffert, Patrina and Gregory J. Kiss. 2000. Building-Integrated Photovoltaic Designs for Commercial and InstitutionalStructures: A Sourcebook for Architects. http://www.nrel.gov/docs/fy00osti/25272.pdf (accessed 22 March, 2009).
Energy Matters. 2009. System Builder calculator and solar panel retail pricing, Australia.http://www.energymatters.com.au/climate-data/ (accessed 26 July 2009).
Engstrom, Dan. 2005. PV-NORD – Paving the way for BIPV in Northern Europe.http://www.pvnord.org/power_point/Final_Report_PV-NORD.pdf (accessed 26 July 2009).
EPV Solar. 2009. EPV Solar information brochure. http://www.epvsolar.com/ (accessed 19 October 2009).
Ertex Solar. 2009. Cell types, EFL Glass backsheet modules, Transparency, VSG Laminated safety glass modulesproduct information brochures. http://www.ertex-solar.at/cms/startseiteeng (accessed 22 March 2009).
European Commission. 2009. PV Performance: A science base on PV performance for increased market transparencyand customer confidence. http://www.pv-performance.org/performance (accessed 19 October 2009).
European Commission, Joint Research Centre. 2009. Photovoltaic Geographical Information System (PVGIS).http://re.jrc.ec.europa.eu/pvgis/ (accessed 19 October 2009).
European Sunrise Project. 2008. Barriers for the introduction of Photovoltaics in the building sector.http://www.pvsunrise.eu/pv-diffusion-in-the-building-sector-bipv/events/31st-january-2008-change-of-mind-sets-bipv-a-market-segment-with-huge-potential.html (accessed 26 July 2009).
72

European Sunrise Project. 2009. Building Integrated Photovoltaics: A new design opportunity for architects.http://www.pvsunrise.eu/pv-diffusion-in-the-building-sector-bipv/project-work-program.html (accessed 19 October2009.
European Photovoltaic Industry Association (EPIA). 2008. Photovoltaic industry substantially revises its target tosupply 12% of European electricity demand by 2020. Press release 4 September. http://www.epia.org/index.php?id=31(accessed 4 August 2009).
Fath, Peter. 2009. Potential for High Volume PV Manufacture in Australia. Centrotherm photovoltaics AG Germany.http://www.apva.org.au/drupal-6.3/sites/default/files2/Documents/PV%20Manufacture/Fath%202009%20PV%20Manufacture%20Australia.pdf (accessed 19 October 2009).
First Solar. 2009. Company overview, Corporate, Media, News, Recycling, Technology pages from website.http://www.firstsolar.com/recycling.php (accessed 19 October 2009).
Foskett, Ben and Monica Oliphant. 2008. Australia: ready for renewable investment. Renewable Energy FocusMay/June 2008: 75-77. Fraile Montoro, Daniel. 2009. PV Diffusion in the Building Sector.http://www.pvsunrise.eu/documents/PV_diffusion_in_the_Building_Sector.pdf (accessed 26 July 2009).
Fthenakis, Vasilis M. 2003. Life cycle impact analysis of cadmium in CdTe PV production. Renewable and SustainableEnergy Reviews 8 (2004) 303–334.
Fthenakis, Vasilis M. et al. 2004. Experimental Investigation of Emissions and Redistribution of elements in CdTe PVmodules during fires. 19th European PV Solar Energy Conference, Paris, France, 7 June.
Fthenakis, Vasilis M., Hyung Chul Kim and Erik Alsema. 2008. Emissions from Photovoltaic LifeCycles. Environmental Science and Technology Vol. 42 No. 6: 2168–2174.
German Solar Energy Society (DGS). 2007. Photovoltaic Basics. Earthscan, Chapter 1: 1-64.http://www.earthscan.co.uk/Portals/0/Files/Sample%20Chapters/9781844074426.pdf (accessed 22 March, 2009).
Green, Martin A. 2006. Third Generation Photovoltaics: Advanced solar energy conversion. Berlin: Springer.
Green, Martin A. et al. 2004. Crystalline silicon on glass (CSG) thin-film solar cell modules. Solar Energy 77 (2004)857–863.
Haas, Reinhard. 2004. Progress in Markets for Grid-connected PV Systems in the Built Environment. Progress inPhotovoltaics: Research and Applications 12: 427–440.http://www3.interscience.wiley.com/journal/109605023/abstract?CRETRY=1&SRETRY=0 (accessed 22 March 2009.)
Haris, Ahmad Hadri. 2008. Grid-Connected BIPV Market in Malaysia: Current Status & Future Plan. National PVConference. http://www.mbipv.net.my/dload/NPVC%20Hadri.pdf (accessed 4 August 2009).
Hegedus, S. 2004. Thin Film Solar Modules: The Low Cost, High Throughput and Versatile Alternative to Si Wafers.Progress in Photovoltaics: Research and Applications 14: 393–411.
Henemann, Andreas. 2008. BIPV: Built-in solar energy. Renewable energy focus, Green Building supplementNovember/December: 14-19.
Hoffmann, Winfried. 2006. Photovoltaic on the Way from a Few Lead Markets to a World Market. EuropeanRenewable Energy Review. Solar power: 31-34.
Hug, Rolf. 2007. Building integrated Photovoltaics (BIPV): Solar electric power systems conquer large roofs andfaçades. The solar server – forum for solar energy. http://www.solarserver.de/solarmagazin/solar-report_0607_e.html (accessed 22 March, 2009).
Hughes, Emma. 2009. aleo solar takes advantage of French BIPV tariff; opens business in France. PV-tech.org, 16
73
October. http://www.pv-tech.org/news/_a/aleo_solar_takes_advantage_of_french_bipv_tariff_opens_business_in_france/ (accessed 19 October2009). IEA-PVPS (International Energy Agency - Photovoltaic Power Systems Programme). 2009. IEA - PVPS Annual Report2008. http://www.iea-pvps.org/ (accessed 22 March, 2009).
IEA-PVPS. 2008. Analysis of PV System's Values Beyond Energy – by country and stakeholder. Report IEA - PVPST07-02:2008. http://www.iea-pvps.org/ (accessed 22 March, 2009).
IEA-PVPS T7-4 (International Energy Agency - Photovoltaic Power Systems Programme Task 7-4). 2002. Potential forBuilding Integrated Photovoltaics, Report IEA - PVPS T7-4 Summary. http://www.iea-pvps.org/tasks/task7.htm(accessed 22 March, 2009).
IEA-PVPS. 1999. Literature survey and analysis of non-technical problems for the introduction of building integratedphotovoltaic systems, Report IEA - PVPS Task 7 T7-01:1999. http://www.iea-pvps.org/tasks/task7.htm (accessed 22March, 2009).
IEA-PVPS. 2001. PV in Non Building Structures - a design guide, Report IEA - PVPS Task 7 T7-02:2000.http://www.iea-pvps.org/tasks/task7.htm (accessed 22 March, 2009).
IEA-PVPS. 2008. Urban BIPV in the New Residential Construction Industry, Report IEA - PVPS T10-03:2008.http://www.iea-pvps.org/tasks/task7.htm (accessed 22 March, 2009).
Iencinella, Daniele, Emanuele Centurioni and Maria Grazia Busana. 2008. Thin-film solar cells on commercial ceramictiles. Solar Energy Materials & Solar Cells 93 (2009): 206–210.
ISET. 2007. Electricity from renewable energy. http://www.iset.uni-kassel.de/pls/w3isetdad/www_iset_new.main_page?p_name=7210002&p_lang=eng (accessed 22 August 2009).
Jäger-Waldau, Arnaulf. 2008. PV Status Report 2008. European Commission, Joint Research Centre, Renewable EnergyUnit, Italy. James, P.A.B., M.F. Jentsch and A.S. Bahaj.2008. Quantifying the added value of BiPV as a shading solution in atria.Solar Energy 83 (2009) 220–231.
Kaelin, M. et al. 2005. Flexible CIGS solar cells and mini-modules (FLEXCIM). Active Solar Energy PhotovoltaicProgramme, Annual Report, Swiss Federal Office of Energy: 83-88.http://apache.solarch.ch/pdf/JB2004Band1Internet.pdf (accessed 22 March 2009).
Kanellos, Michael. 2006. Home builders switch on the 'invisible' solar panels. 11 May.http://news.com.com/Home+builders+switch+on+the+invisible+solar+panels/2100-11392_3-6070992.html (accessed22 August 2009).
Krawietz, Silke A. Future Perspectives of Building Integration of (Thin-Film) of Photovoltaics (BIPV) and EducationNetwork for BIPV Development. BIPV Perspectives and Education Network. http://www.pvsunrise.eu/pv-diffusion-in-the-building-sector-bipv/events/20-september-2009-workshop-on-building-integrated-photovoltaics.html (accessed 19October 2009).
Krawietz, Silke A. 2007. Building the future: New possibilities for thin films in building integrated PV. RenewableEnergy World. http://www.renewableenergyworld.com/rea/news/article/2007/09/building-the-future-new-possibilities-for-thin-films-in-building-integrated-pv-51465 (accessed 22 March 2009).
Lazard. 2008. Levelized Cost of Energy Analysis. Version 2.0 June.http://www.narucmeetings.org/Presentations/2008%20EMP%20Levelized%20Cost%20of%20Energy%20-%20Master%20June%202008%20(2).pdf (accessed 26 July).
Limet, Florence. 2009. Influence of the EU legislation on the development of PV in the building sector. EPIA-Sunrise,Hamburg. http://www.pvsunrise.eu/pv-diffusion-in-the-building-sector-bipv/events/20-september-2009-workshop-on-building-integrated-photovoltaics.html (accessed 19 October 2009).
74

Lopez-Polo, Assumpcio, Reinhard Haas and Demet Suna. 2007. Promotional drivers for PV. WP5- Deliverable 5.1:Report on “Economical Drivers and Market Impacts of Urban PV”. Energy Economics Group, Vienna University ofTechnology: Austria. http://www.pvupscale.org/IMG/pdf/D5.1_Final_Report_economical_drivers_070629.pdf(accessed 22 March 2009).
Marsh, George. 2008. BIPV: innovation puts spotlight on solar. Renewable energy focus, May/June:62-67.
Maurus, H. et al. 2004. PV for Buildings: Benefits and experiences with amorphous silicon in BIPV applications.reFOCUS November/December: 22-27.
Mercaldo, L.V. et al. 2008. Thin film silicon photovoltaics: Architectural perspectives and technological issues. AppliedEnergy, Science Direct.
Meredith, Paul. 2009. New materials for next-generation organic solar cells. Chemistry in Australia, June: 14-17.http://www.physics.uq.edu.au/cope/pubs.htm (accessed 20 June 2009).
Miles, R.W., K.M. Hynes and I. Forbes. 2005. Photovoltaic solar cells: An overview of state-of-the-art cell developmentand environmental issues. Progress in Crystal Growth and Characterization of Materials 51 (2005) 1-42 .
Mitsubishi Heavy Industries Ltd. 2009. Micromorph Tandem Photovoltaic Module. http://www.jase-w.eccj.or.jp/technologies/pdf/electricity/E-7.pdf (accessed 4 August 2009).
Mitsubishi Heavy Industries Ltd. 2009. Thin-film Photovoltaic Module. http://www.albasolar.it/schede-tecniche/Moduli/Mitsubishi/MT130T2_EN.pdf (accessed 4 August 2009).
National Renewable Energy Laboratory (NREL). 2008. A Homebuilder's Guide to Going Solar. U.S. Department ofEnergy, December.
Osborne, Mark. 2009. Large-scale BIPV system commissioned in France. PV-tech.org, 6 July. http://www.pv-tech.org/news/_a/large-scale_bipv_system_commissioned_in_france/ (accessed 19 October 2009).
Photon International. 2009. Photon International, the solar power magazine. http://www.photon-magazine.com/index.htm (accessed 22 March 2009).
Plaza, Alvaro P. 2007. Change of mind sets: BIPV a market segment with huge potential. European Union SustainableEnergy Week Brussels. Isofoton. http://www.pvsunrise.eu/pv-diffusion-in-the-building-sector-bipv/events/31st-january-2008-change-of-mind-sets-bipv-a-market-segment-with-huge-potential.html (accessed 26 July 2009).
Poponi, Daniele, John Byrne and Steven Hegedus. 2006. Break-even Price Estimates for Residential PV Applications inOECD Countries with an Analysis of Cost Prospective Reductions. Energy Studies Review Vol. 14 No. 1: 101-117.
Powalla, Michael and Dieter Bonnet. 2007. Thin-Film Solar Cells Based on the Polycrystalline CompoundSemiconductors CIS and CdTe. Advances in OptoElectronics Volume 2007, Article ID 97545.
Prasad, Deo and Mark Snow. 2003. Designing with Solar Power: A source book for building integrated photovoltaics.Images publishing. http://books.google.com.au/books?id=_sC32NrngP8C&pg=PA217&lpg=PA217&dq=bipv+solar+cost+savings+construction+study&source=bl&ots=0t5dtp5BkJ&sig=SHAeyXkDXK22dglkgAyeUcle7c8&hl=en&ei=w7RrSoP8HIXgsQPV4I2aBw&sa=X&oi=book_result&ct=result&resnum=3 (accessed 22 March, 2009).
Prasad, Deo K. and Mark Snow. 2004. Examples of Successful Architectural Integration of PV: Australia. Progress inPhotovoltaics: Research and Applications 12: 477–483.
Raugei, Marco and Paolo Frankl. 2009. Life cycle impacts and costs of photovoltaic systems: Current state of the artand future outlooks. Energy 34: 392–399.
Rhodes, Chris. 2007. Building-Integrated Photovoltaics (BIPV). http://scitizen.com/stories/Future-Energies/2007/10/-Building-Integrated-Photovoltaics--BIPV--/ (accessed 19 October 2009).
Schoen, T. et al. 2002. Status Report of Task 7 of the IEA PV Power Systesms Program. http://www.iea-pvps.org/
75

(accessed 22 March, 2009).
Schoen, T. et al. 2001. Task 7 of the IEA PV Power Systesms Program – Achievements and outlook. 17th EuropeanPhotovoltaic Solar Conference, 24 October. http://www.iea-pvps.org/ (accessed 22 March, 2009).
Schott Solar. 2008. ASI Glass: Integrated architecture powered by the sun.http://www.schottsolar.com/fileadmin/media/sales-services/downloads/brochures/SCHOTT_Solar_ASI_Glass.pdf(accessed 22 March 2009).
Schott Solar. 2008. InDaX V 175, V225, ASI Glass modular sizes, ASI Thru, ASI Opak product information brochures.http://www.schottsolar.com/global/sales-services/downloads/product-information.html (accessed 22 March 2009).
Smiley, Eric W., John D. Jones and Ljubisav Stamenic. 2001. Low Irradiance Performance Modelling for BuildingIntegrated Photovoltaics. 17th European PV solar energy conference Munich.
Solar Space Power Workshop. 2006. Photovoltaics (Solar Cells). 7 April.http://www.sspi.gatech.edu/photovoltaics2006.pdf (accessed 22 March 2009).
Solar Unlimited. 2009. Solar power and Suntech product technical information, Australia.http://www.solarunlimited.com.au/solarunlimited/Home-Tech_Specs.htm (accessed 26 July 2009).
Solarbuzz. 2009. World Solar Energy News Headlines. http://www.solarbuzz.com/Marketbuzz2009-intro.htm (accessed19 October 2009).
Standard & Poors. 2007. Silicon Wafer Maker MEMC Shines Bright. S&P Focus Stock of the Week, 22 Octoberhttp://outlook.standardandpoors.com/NASApp/NetAdvantage/displayCompanyEditorialStory.do?&context=Company&prefix=null&docId=12489047 (accessed 19 October 2009).
Suna, Demet., Assun Lopez Polo and Richard Haas. 2006. Demand Side Value of PV. Report of the IEE project, PVUpscale- Urban Scale Photovoltaic Systems. Vienna.http://www.pvupscale.org/IMG/pdf/D5.2_Report_Demand_Side_Value_of_PV_01.07.pdf (accessed 22 March 2009).
SunPower. 2005. SunPower Announces $330 Million Global Solar Supply Agreement With PowerLight. 15 December.http://files.shareholder.com/downloads/SPWR/0x0x25012/81e703d1-f7f0-4024-b996-640a26a452f1/182021.pdf(accessed 22 August 2009).
SunPower. 2007. New Solar Homes Outpace the Market Solar Homes with SunPower SunTile: Selling at Twice thePace of Standard Homes. 30 May. http://files.shareholder.com/downloads/SPWR/0x0x102669/67c6ac75-498f-475d-80a5-c7f128281627/246299.pdf (accessed 22 August 2009).
SunPower. 2009. SunPower website news, product information and case studies. http://www.sunpowercorp.com(accessed 22 August 2009).
Suntech. 2009. Suntech See Thru building integrated glazing system, Just Roof building integrated roofing system, a-Sithin film solar panel product brochures http://www.suntech-power.com/index.php (accessed 22 March 2009). Sivanandan, Akhil. 2009. BIPV hotspots in the EU. Renewable energy focus, 6 May.http://www.renewableenergyfocus.com/view/1708/bipv-hotspots-in-the-eu-/ (accessed 19 October 2009).
The University of Melbourne. 2009. New Generation Solar Cells. VICOSC: Victorian Organic Solar Cell Consortium.http://www.vicosc.unimelb.edu.au/organicsolarcells.htm (accessed 22 March 2009).
Tulloch, Sylvia. 2009. Sylvia Tulloch interview with Beyond Zero Radio. Podcast available fromhttp://podcast.beyondzeroemissions.org/audio/podcast-2009-03-05-63071.mp3 (accessed 22 March 2009).
Ullal, Harin S.and Bolko von Roedern. 2007. Thin-Film CIGS and CdTe Photovoltaic Technologies:Commercialization, Critical Issues, and Applications. NREL, 22nd European Photovoltaic Solar Energy Conference(PVSEC) and Exhibition 3 September.
Uni-Solar. 2009. Uni-Solar Solar Laminate PVL-Series Model: PVL-68 and PVL-124, Solar shingles SHR-17.
76

http://www.uni-solar.com/uploadedFiles/PVL-68-EN.pdf and http://www.uni-solar.com/interior.asp?id=36 (accessed 22March 2009).
U.S. Department of Energy. 2007. High-Performance Home Technologies: Solar Thermal & Photovoltaic Systems.Building America Best Practices Series, Research toward Zero energy homes with Pacific Northwest NationalLaboratory & Oak Ridge National Laboratory, 4 June.
Van Cleef, Maarten. 2008. Flexible Photovoltaics: A New Opportunity for Architects and the Construction Industry.Workshop on BIPV, United Solar Ovonic Europe GmbH. http://www.pvsunrise.eu/pv-diffusion-in-the-building-sector-bipv/events/20-september-2009-workshop-on-building-integrated-photovoltaics.html (accessed 19 October 2009).
Waldmann, Lars. 2009. Integration opportunities with c-Si and a-Si Modules. Workshop on BIPV, Schott Solar AG.http://www.pvsunrise.eu/pv-diffusion-in-the-building-sector-bipv/events/20-september-2009-workshop-on-building-integrated-photovoltaics.html (accessed 19 October 2009).
Watt, Muriel. 2009. Australia: Photovoltaic technology status and prospects. IEA-PVPS Annual Report 2008: 36-38.
Watt, Muriel et al. 2005. The Value of PV in Summer Peaks. http://www.ergo.ee.unsw.edu.au/value%20of%20PV%20in%20summer%20peaks.pdf (accessed 22 March, 2009).
Watt, Muriel., Robert Passey and Greg Watt. 2008. Designing a Coherent PV Strategy for Australia.http://www.apva.org.au/drupal-6.3/sites/default/files2/Documents/Australian%20PV%20Strategy.pdf (accessed 22March, 2009).
Wenham, Stuart R., Martin A. Green, Muriel E. Watt and Richard Corkish. 2007. Applied Photovoltaics. London:Earthscan.
Your Home Technical Manual. 2008. Australia's guide to environmentally sustainable homes, Edition 4.http://www.yourhome.gov.au/technical/fs67.html#bipv (accessed 22 March 2009).
Zhang, Norman. 2008. Solargiga: Sunshine in winter. SBI E2 Capital, 8 December.http://www.sbie2capital.com/research/pdf/0757NZ041208MH.pdf (accessed 19 October 2009).
77

Appendices
Appendix A
Figure A: Australia's installed PV capacity comparing off-grid, diesel and grid-connect systems (Source: Watt 2009)
78

Appendix B
Figure B: Daily PV output compared to residential and commercial loads (Source: Watt et al. 2009)
79

Appendix C
Figure C1: Production process for mono and polycrystalline solar cells
(Source: German Solar Energy Society 2007)
80
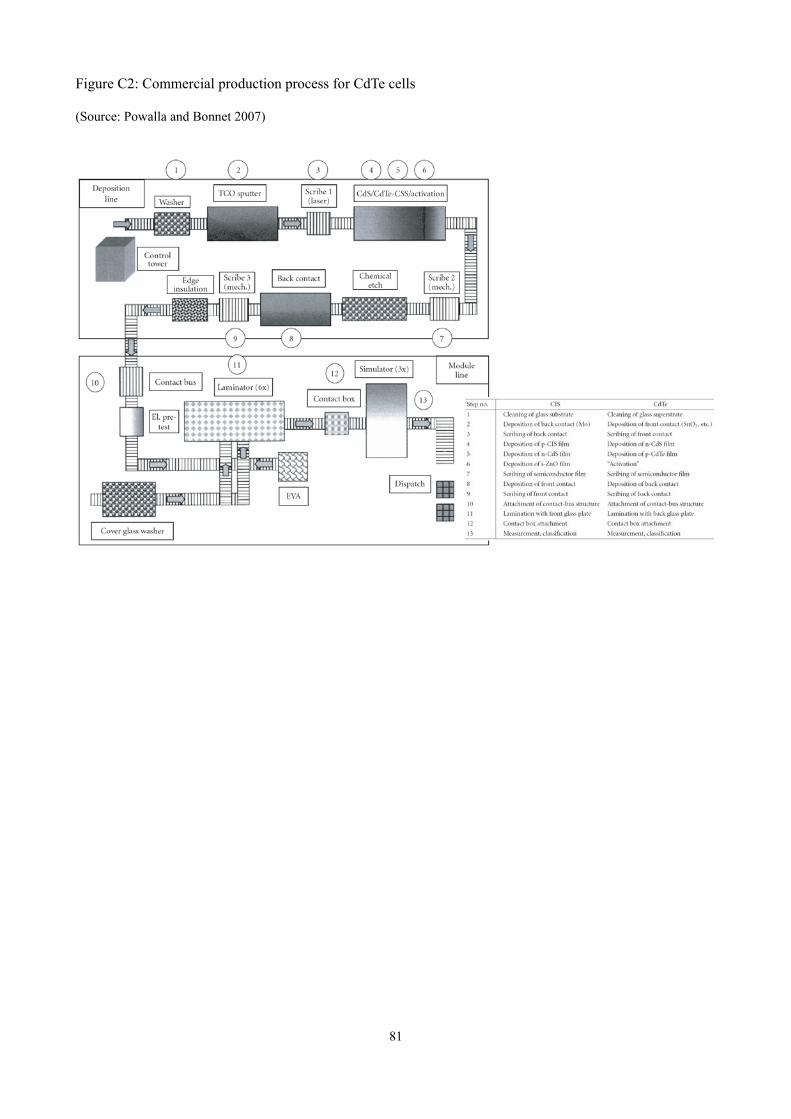
Figure C2: Commercial production process for CdTe cells
(Source: Powalla and Bonnet 2007)
81

Appendix D
Schott Solar quotes and data sheets
82

83

84

85
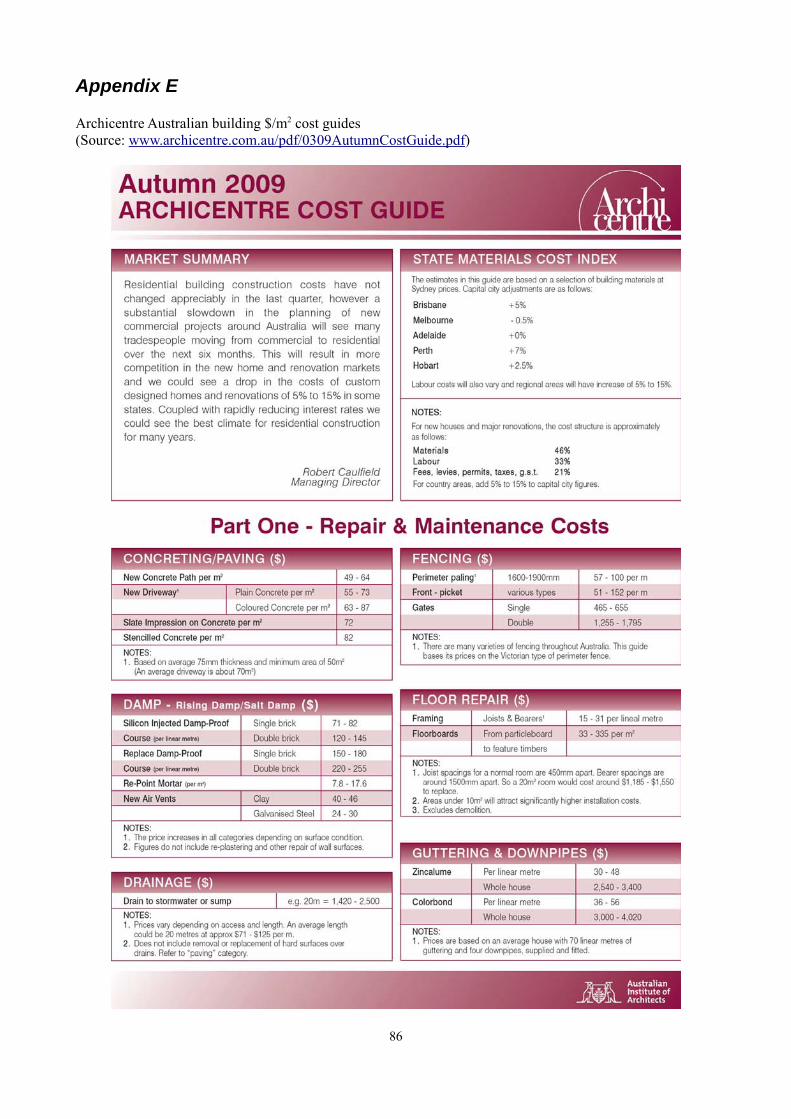
Appendix E
Archicentre Australian building $/m2 cost guides(Source: www.archicentre.com.au/pdf/0309AutumnCostGuide.pdf)
86

87

88
89

Appendix FBIPV installation case studies in Victoria, Australia.
90

91

92

93

94