Oportunidades en agronegocios 2012
87
CHILE opportunities in agribusiness www.foreigninvestment.cl www.foreigninvestment.cl OPORTUNIDADES EN AGRONEGOCIOS
-
Upload
agencia-exportadora -
Category
Services
-
view
94 -
download
1
Transcript of Oportunidades en agronegocios 2012

CHILE opportunities
in agribusiness
w w w. f o r e i g n i n v e s t m e n t . c lw w w. f o r e i g n i n v e s t m e n t . c l
OPOR
TUNI
DADE
S EN
AGRO
NEGO
CIOS

CHILE oportunidadesen energía
6
FOREIGN INVESTMENT COMMITTEE
The Foreign Investment Committee is the agency that represents the State of Chile in its dealings with those investors who choose to use the Foreign Investment Statute (D.L. 600) as the legal mechanism for bringing foreign direct investment (FDI) into Chile. The Foreign Investment Committee is formed by the Ministers of Economy (who acts as president of the Committee), Finance, Foreign Relations and Planning as well as the president of the Central Bank. Other ministers responsible for specific economic sectors are also invited to participate in meetings whenever deemed necessary. Mission
To help position Chile as a highly attractive destination for foreign investment and international business through its role in matters related to the administration and communication of the corresponding legal norms, the development of promotional activities of different types and the preparation of information concerning foreign investment for investors and potential investors. Strategic objectives
To ensure the correct application of the Foreign Investment Statute in order to safeguard the rights of both the State and foreign investors by communicating the law’s terms and administering related legal procedures: the analysis of investment applications, the signing of investment contracts and the authorization of remittances.
To develop all types of initiatives to communicate, promote, coordinate and implement measures to foster the entry of foreign investment.
To maintain an up-to-date and accurate statistical register of foreign investment under the Foreign Investment Statute by compiling information about contracts and flows under these contracts in order both to safeguard investors’ interests and to prepare statistical reports for public use.
The Executive Vice-Presidency
The Foreign Investment Committee is headed and managed by an Executive Vice-President who is appointed by the President of the Republic.
The Executive Vice-Presidency provides general information and guidance to any investor about Chile, its economic and social environment, legal framework and policies on FDI. When requested, it provides information on how to begin the process of setting up a businesses in Chile as well as the procedures and regulations to which any investor must adhere, whether signing a D.L. 600 contract or not, at the national, regional and sector-specific levels. In order to promote Chile as an attractive place to invest, the Executive Vice-Presidency coordinates business missions abroad, organizes seminars and conferences and publishes regular reports about Chile’s business climate and about investment opportunities, both in print and electronic form. In developing these promotional activities, it works with other ministries and State agencies as well as with the local and foreign private sector.

w w w. f o r e i g n i n v e s t m e n t . c l
CHILEopportunities
OPOR
TUNI
DADE
S EN
AGR
ONEG
OCIO
S
in agribusiness

CHILE, OPPORTUNITIES IN AGRIBUSINESS
Foreign Investment CommitteeAll rights reservedTo request permission for reproduction, please contact [email protected].
Second edition, January 2012 Designed by www.vox.cl.Printed in Maval.
CHILE, OPORTUNIDADES EN AGRONEGOCIOS
Comité de Inversiones Extranjeras, todos los derechos protegidos.Para solicitar permiso para la reproducción dirigirse a [email protected].
Segunda edición, Enero 2012 Diseño www.vox.cl

Chile, a food and forestry power / Chile potencia alimentaria y forestal 7
Structure of agribusiness in Chile / La estructura de los agronegocios en Chile 13
Wine industry /Industria vitivinícola 21
Fruit farming / Fruticultura 31
Processed foods /Alimentos procesados 41
Fishing and fish farming / Pesca y productos acuícolas 49
Dairy industry / Lácteos 55
Olive oil industry / Olivícola 59
Meat production /Carnes 63
Foreign Direct Investment in agribusiness / Inversión Extranjera Directa en agronegocios 71
CONTENTS / ÍNDICE

CHILE opportunitiesin Agribusiness
4
Regions / Regiones
P
AC
IF
IC
O
CE
AN
/O
CÉA
NO
PA
CÍF
ICO
ARICA Y PARINACOTA
TARAPACÁ
ANTOFAGASTA
ATACAMA
COQUIMBO
VALPARAÍSO
SantiagoMETROPOLITANA
LIBERTADOR GENERAL BERNARDO O’HIGGINS
MAULE
BÍO-BÍO
ARAUCANÍA
LOS RÍOS
LOS LAGOS
CoihaiqueAYSÉN DEL GENERALCARLOS IBAÑEZ DEL CAMPO
MAGALLANES Y LA ANTÁRTICA CHILENA
Arica
Pta. Arenas
Pto. Montt
Valdivia
Temuco
Concepción
TalcaRancagua
La Serena
Iquique
Copiapó
Antofagasta
Valparaíso
Océano Austral
Chile in South America / Chile en Sudamérica
Brazil
Guyana
Suriname
French
Guiana
VenezuelaColombia
Ecuador
Peru
Bolivia
Paraguay
Chile UruguayArgentina

5
ChileGeography / Geografía
Chile is located in the extreme southwestern part of South America and stretches through the Antarctic to the South Pole. Its most western territory is Easter Island in Oceania. Chile’s varied topography ranges from the Atacama Desert in the north, with its great mineral wealth - principally copper and nitrates - to the agricultural and wine-growing Central Valley, where the capital Santiago is located, and to the woods, mountains, lakes, glaciers and fjords of the south.
Chile está situado en el extremo sudoccidental de América del Sur y se prolonga en el continente antártico hasta el Polo Sur. Su provincia más occidental es Isla de Pascua, en Oceanía. Posee una diversidad topográfica que comprende el Desierto de Atacama por el norte que contiene gran riqueza mineral, principalmente cobre y nitratos. El valle central, incluyendo la capital, Santiago, alberga la agricultura y vitivinicultura y hacia el sur, el país tiene bosques, montañas, lagos, glaciares, fiordos y canales.
Area / Superficie Mainland & islands / Continental e insular : 756,096 km2 Antarctic / Antártica : 1,250,000 km2 Total : 2,006,096 km2
Mainland length / Longitud continental : 4,200 km
Administrative divisions / División político administrativa : 15 regions /regiones, 53 provinces/ provincias and 346 municipal districts / comunas
Government / Gobierno : The President of the Republic serves as head of state and head of government. Since March 2010, this post has been held by Sebastián Piñera. Está encabezado por un Presidente de la República, quien es el jefe de Estado y de gobierno. Desde marzo de 2010, este cargo es ejercido por Sebastián Piñera.
Social
Population / Población : 16.9 million / millonesPopulation density / Densidad : 20.4 inhabitants/km2 / habitantes por km2 Official language / Idioma oficial : Spanish / EspañolCurrency / Moneda : Peso Literacy / Tasa de alfabetización : 98.6%Life expectancy / Esperanza de vida : 78 years / años
Economy / Economía
GDP / PIB 2011 : US$248,411 million / millonesGDP per capita / PIB per cápita (nominal, 2011) : US$14,413GDP per capita / PIB per cápita (PPP, 2011) : US$16,171 Unemployment rate / Tasa de desempleo 2012 : 6.6% (Ene-Mar)GDP growth / Crecimiento del PIB (2011) : 6.0%Exports / Exportaciones (2011) : US$80.6 million / millonesImports / Importaciones (2011) : US$74.2 million / millones

CHILE opportunitiesin Agribusiness
6
Chile, a food and forestry power
Chile potencia alimentaria y forestal

7
Chile, a food and forestry power Chile potencia alimentaria y forestal
Hacer de Chile una potencia alimentaria y forestal es el paradigma en el que hoy se sostiene la estrategia de desarrollo y conquista de nuevos mercados del sector de los agronegocios. Dicha transformación ha venido desarrollándose gracias a la creciente red de acuerdos comerciales y el impulso de la cadena productiva.
La estrategia de crecimiento del sector apuesta por lograr que Chile esté entre los primeros diez exportadores de alimentos hacia el año 2019. Actualmente, el país se ubica en el puesto 16 a nivel mundial.
Los diferentes productores del país, reunidos bajo la marca sectorial Foodlinks creada por ProChile, actualmente se encuentran aunando los esfuerzos necesarios para refocalizar la producción chilena de alimentos desde los commodities hacia productos más elaborados y con valor agregado.
Chile ha centrado su producción en la calidad. Los agregados de valor con que el país destaca en sus envíos de alimentos al exterior son la biotecnología, las condiciones fitosanitarias propias de su geografía y su diversidad de microclimas.
En sintonía con las metas sectoriales, el año 2010 la Organización para la Cooperación y el Desarrollo Económico (OCDE) reconoció a la agricultura chilena como una de las más abiertas del mundo, destacando su sólida institucionalidad así como las relevantes medidas de apoyo que se han aplicado para que acceda a los mercados externos. El Ministerio de Agricultura ha subrayado la importancia de las coordinaciones interministeriales y las políticas en educación rural y regadíos en este logro. Y existe espacio para que el sector siga mejorando.
Chile necesita inyectar innovación y competitividad en los procesos y el sector primario, así como agregar valor a sus marcas. Asimismo, requiere conquistar los mercados del Asia-Pacífico. Para ello,
The transformation of Chile into a world food and forestry power is the paradigm at the root of the current development strategy of the country’s agribusiness sector and its bid to conquer new markets. In its efforts to achieve this transformation, the sector has benefitted from Chile’s growing network of trade agreements and the resulting boost to the production chain.
The goal of the sector’s growth strategy is to position Chile as one of the world’s ten largest food exporters by 2019, up from 16th at present.
The country’s different producers, grouped together under the Foodlinks brand created by ProChile, the government’s export promotion agency, are currently working to shift the focus of Chile’s food production away from commodities towards more finished products with a larger value-added component.
Chile has made quality its hallmark, harnessing biotechnology, the phytosanitary conditions inherent to the country’s geography and the diversity of its micro-climates to add value to its food exports.
In 2010, in line with these goals, the Organisation for Economic Co-operation and Development (OECD) recognized Chile’s agricultural sector as one of the most open in the world, highlighting its solid institutional framework as well as the significant support provided in order to allow it to access external markets. The Ministry of Agriculture has underlined the importance of coordination between ministries and rural education and irrigation policies in this achievement. And the sector still has room to continue improving.
Chile needs to incorporate innovation into processes and the primary sector and to increase their competitiveness while also adding value to its brands. In addition, it needs to expand into

CHILE opportunitiesin Agribusiness
8
ya se ha abierto una red de agregados agrícolas en la región, específicamente en Japón, Corea del Sur, India y China.
Los factores que sustentan la consolidación del sector de agroindustria son cuatro:
Cada día hay más personas que alimentar: la población mundial al 2015 llegará a 7.800 millones. Actualmente, es de 6.700 millones.
Aumentan las expectativas de vida: hacia el 2050, cerca del 20% de la población mundial será mayor de 60 años, segmento que consume más alimentos sanos y con mayor valor agregado.
Se incrementa el poder adquisitivo mundial: se duplicará la cantidad de personas que optan por la dieta mediterránea. En este proceso China juega un rol preponderante, a medida que la clase media crece. Cerca de 40 millones de chinos superan la pobreza al año y su primera gran inversión es mejorar sus estándares alimenticios.
Cambia la forma en que las personas se alimentan: aumentan las mujeres que trabajan y con ello el consumo de alimentos preparados.
markets in the Asia-Pacific region and, to this end, has appointed agricultural attachés in Japan, South Korea, India and China.
Four main factors underpin the consolidation of Chile’s agribusiness sector: There are ever more people needing to be fed, with the world population projected to reach 7.8 billion in 2015, up from 6.7 billion at present.
Life expectancy is also increasing and, by 2050, around 20% of the world population will be over 60, the age group that tends to consume more healthy foods with a higher value-added content.
World purchasing power is rising and the number of people opting for a Mediterranean diet will double, with China playing a key role in this process as its middle class expands. Around 40 million Chinese people rise above the poverty line each year and their first great investment is in improving their diet.
Eating habits are changing as an increasing number of women undertake paid work, prompting increased demand for pre-prepared foods.

9
Chile’s agribusiness advantages:Geography, climate and counter-season
Chile has unparalleled natural advantages for producing the components of a typical Mediterranean diet:
It is one of only five places in the world, along with California (United States), Valencia (Spain), Cape Town (South Africa) and Perth (Australia), with a Mediterranean climate. All these places are located around 40ºN or 40ºS and, as a result, share a climate characterized by a clear differentiation between summer and a rainy winter, with a temperature variation of no more than 15ºC. This type of climate facilitates production of foods such as olive oil, wine, fruit and vegetables that are in line with an international trend towards healthy eating.
The influence of the Andes Mountains and the Pacific Ocean creates different agroclimatic zones and a wide variety of landscapes.
Chile is considered a phytosanitary and zoosanitary island that is naturally protected against the entry of pests and plagues. In the north, protection is provided by the Atacama Desert, one of the driest in the world; in the east by the Andes Mountains, one of the earth’s highest ranges, which hamper the entry of potential phytosaniary threats; in the west by the Pacific Ocean whose cold Humboldt current has a moderating effect on the climate and temperatures; and, in the south, by Antarctica where almost no vegetable life can survive.
Chile’s geographic location in South America permits counter-season production of foods as compared to the main consumption centers in the northern hemisphere. In
Ventajas de los agronegocios en Chile:Geografía, clima y contraestación
Chile tiene ventajas naturales inigualables para producir los productos que integran la dieta mediterránea promedio:
Chile es uno de los cinco lugares del mundo, al igual que California (EE.UU), Valencia (España), Ciudad del Cabo (Sudáfrica) y Perth (Australia), que cuenta con clima mediterráneo. Todos estos lugares se ubican entre los paralelos 40 de latitud norte y 40 de latitud sur, por lo que comparten un tipo de clima que se caracteriza por tener veranos e inviernos marcados y lluviosos, junto con una oscilación térmica que no supera los 15 grados. En términos prácticos, este clima facilita la producción de alimentos como el aceite de oliva, el vino, las frutas y verduras, que se enmarcan dentro de la tendencia mundial por una alimentación saludable.
La influencia de la Cordillera de los Andes y del Océano Pacífico permite la existencia de variadas zonas agroclimáticas y una vasta heterogeneidad de paisajes.
Chile es considerado una isla sanitaria protegida naturalmente del ingreso de pestes y plagas exóticas, ya que cuenta por el norte con el desierto de Atacama, uno de los más áridos del mundo; por el este, con la cordillera de Los Andes, una de las cadenas montañosas más altas de la tierra que impide el acceso de potenciales amenazas sanitarias; por el oeste, el Océano Pacífico tiene la corriente fría de Humboldt que modera el clima y las temperaturas y hacia el sur existe el territorio antártico, donde casi no existe vida vegetal.

CHILE opportunitiesin Agribusiness
10
addition, its north-south length and the resulting climate diversity mean staggered production, providing a relatively long export season.
Phytosanitary and zoosanitary assets
It is, however, not enough to have natural advantages. Today’s consumers want healthy and safe foods and, in this context, Chile has established an international reputation as a producer of high-quality foods. This is thanks to the policy of phytosanitary and zoosanitary protection implemented by the Agriculture Ministry’s Agricultural Inspection Service (SAG). At border crossings, ports and airports, the SAG controls the entry of living organisms in order to preserve Chile’s freedom from pests. As a result, Chile is known for its low level of phytosanitary and zoosanitary risk, favoring its trade in food products.
Openness to trade
Chile’s open economy, combined with an active policy of signing bilateral, regional and multilateral trade agreements, has underpinned a steady increase in its foreign trade in goods and services and the country’s competitiveness.
It has 22 trade agreements in place with 59 countries, giving its exporters privileged access to 60% of the world’s population.
Free Trade Agreements: Panama, China, United States, Canada, Mexico, South Korea, Central America, Colombia, EFTA (Norway, Switzerland, Iceland and Liechtenstein), Australia, Colombia, Peru, Turkey and Malasia.
Association Agreements: European Union (EU), Japan and P4 (New Zealand, Singapore and Brunei Darussalam as well as Chile);
La ubicación geográfica de Chile en América del Sur permite que la producción de alimentos sea en contraestación respecto a los principales centros de consumo del hemisferio norte. Además, la longitud del país permite obtener producciones escalonadas con un periodo de exportación relativamente amplio, gracias a su diversidad de climas.
Patrimonio sanitario
No basta con tener ventajas naturales, hoy los consumidores buscan y prefieren alimentos sanos y seguros. En este contexto, Chile destaca en el mercado mundial por la calidad de sus productos gracias a la política de protección fito y zoosanitaria que ha aplicado el Servicio Agrícola Ganadero (SAG), entidad dependiente del Ministerio de Agricultura. En los pasos fronterizos, puertos y aeropuertos, el SAG controla el ingreso de organismos vivos a fin de mantener al país libre de plagas. Esto ha traído como consecuencia que Chile sea reconocido como un país que tiene un bajo nivel de riesgo desde el punto de vista sanitario, favoreciendo el intercambio comercial.
Apertura comercial
La economía abierta de Chile, combinada con una activa política de acuerdos comerciales bilaterales, regionales y multilaterales, ha significado un aumento sostenido del comercio exterior de bienes y servicios y de la competitividad del país. Chile tiene 22 Tratados de Libre Comercio firmados con 59 países, lo que le otorga a los exportadores un acceso privilegiado al 62% de la población mundial
Tratados de Libre Comercio (TLC): Panamá, China, Estados Unidos, Canadá, México, Corea del Sur, Centroamérica, Colombia, el EFTA (Noruega, Suiza, Islandia y Liechtenstein), Australia, Colombia, Perú, Turquía y Malasia.
Acuerdos de Asociación Económica (AAE): Unión Europea (UE), Japón y P4 (Nueva Zelanda,

11
Economic Complementation Agreements: Bolivia, Ecuador, MERCOSUR and Venezuela;
Partial Scope Agreements: Cuba and India;
Agreements under negotiation, signed and not ratified (as of December 2011): Turkey, Thailand and Vietnam.
Chile, open to foreign investment
At present, over 4,000 overseas companies from at least 60 countries have investments in different sectors of the Chilean economy, creating jobs and new economic opportunities. Incoming foreign direct investment (FDI) has remained strong in recent years, with record amounts in 2010 and 2011, helping not only to position Chile in the global market and insert it into important international production, distribution and financial circuits but also to increase its competitiveness by contributing resources, technological development and specialized know-how.
Singapur y Brunei Darussalam, además de Chile).
Acuerdos de Complementación Económica (ACE): Bolivia, Ecuador, MERCOSUR y Venezuela.
Acuerdos de Alcance Parcial (AAP): Cuba e India.
Acuerdos en negociación, suscritos y no ratificados (a enero de 2012): Turquía, Tailandia Vietnam.
Chile, abierto a la inversión extranjera
Actualmente, más de 4.000 empresas extranjeras provenientes de a lo menos 60 países invierten en diversos sectores de la economía nacional, generando empleo y nuevas oportunidades económicas. Estos flujos de capitales han sido constantes durante los últimos años, con montos record en 2010 y 2011, contribuyendo no sólo a situar al país en el mercado global y a vincularlo a importantes circuitos productivos, comerciales y financieros internacionales, sino también a hacer más competitiva la economía chilena, aportando recursos, mayor desarrollo tecnológico y conocimientos especializados.

CHILE opportunitiesin Agribusiness
12
Structure of agribusiness in Chile
La estructura de los agronegociosen Chile

13
In Chile, the agribusiness sector comprises three broad activities - agriculture, fishing and processing - and it is, therefore, highly diversified, including crop growing, silviculture, wine production, animal husbandry, food processing, fish farming and fishing or, in other words, the activities that, together with the forestry industry, account for most of the country’s renewable natural resources.
Agribusiness is one of the country’s most important sectors after copper mining, accounting for 12% of Chile’s GDP and 24% of exports in 2010.
Growth and diversification
The growth rates of the different activities that make up the agribusiness sector vary significantly. If wood and paper production is included, the processing segment grew by 11% between 2004 and 2010 while, in the case of agriculture, the expansion reached 21%.
La industria nacional de los agronegocios, como actividad económica, se compone de tres grandes sectores: la extracción silvoagropecuaria, la pesca y la agroindustria, por lo que es un sector altamente diversificado. En éste participan las ramas agrícola, silvícola, vitivinícola, pecuaria, alimenticia, acuícola y pesquera, las que aportan, junto al sector forestal, la mayor parte de los recursos naturales renovables del país.
Asimismo, está entre los negocios más importantes del país después de la minería del cobre. Al año 2010, los agronegocios, en todo su conjunto, representan el 12% del PIB nacional y un 24% de las exportaciones del país.
Crecimiento y diversificación
Segmentada por sector, la industria ha exhibido distintos ritmos de expansión. El PIB de la agroindustria, que incluye las ramas maderera y papelera, ha crecido un 11% entre 2004 y 2010, en tanto que el PIB silvoagropecuario ha aumentado un 21% en el mismo periodo.
La estructura de los agronegocios en Chile
Source: Energy Ministry (www.minenergia.cl).
SECTOR 2004 2005 2006 2007 2008 2009 2010
AgricultureSilvoagropecuario 8.3 9.3 6.6 0.7 2.9 -1.1 1.0
FishingPesca 19.1 0.9 -3.5 1.8 7.6 -7.3 -13.7
ProcessingAgroindustria 8.0 4.2 3.7 4.7 2.7 -3.4 -0.9
GDP by Sector, 2004-2010(Annual variation, %)
Producto Interno Bruto (PIB) por sector económico, 2004-2010(Variación anual)
Source: ODEPA (www.odepa.cl) based on 2003-2010 national accounts calculated by Central Bank of Chile (www.bcentral.cl).
Structure of agribusiness in Chile

CHILE opportunitiesin Agribusiness
14
The agricultural sector corresponds to the primary extraction of natural resources and is divided into four subsectors - crop growing, fruit farming, animal husbandry and silviculture - of which fruit farming is the largest, accounting for 40% of the sector’s accumulated output over the past five years.
The processing of the resources produced by the agricultural and fishing sectors is, in turn, divided into three subsectors - the food industry, the wood industry and the paper and printing industry - of which the first is the largest, accounting for 66% of these industries’ total output in 2010, while the wood, paper and printing industries, including wood pulp production, account for the remaining third. These figures, which have shown little change over the past 20 years, mean that the food industry alone represents 4.6% of Chile’s GDP.
El sector silvoagropecuario corresponde a la extracción primaria de recursos naturales y se encuentra segmentado en cuatro ramas: Agricultura, Fruticultura, Ganadería y Silvicultura. La explotación frutícola es la más extensiva de este sector, representando el 40% de la producción acumulada en cinco años.
El sector de la agroindustria corresponde al procesamiento industrial de los recursos silvoagropecuarios y pesqueros y se segmenta en tres ramas: Industria de Alimentos, Industria de la Madera y Papel e Imprentas, siendo el primero de estos subsectores el más vigoroso al representar el 66% de la producción total del año 2010. El subsector forestal, incluyendo la industria de la celulosa, representa el tercio restante. Estas participaciones porcentuales se han mantenido estables a lo largo de las últimas dos décadas. De este modo, solamente la industria alimenticia alcanza el 4,6% del PIB chileno.
Source: ODEPA (www.odepa.cl) based on 2003-2010 national accounts calculated by Central Bank of Chile (www.bcentral.cl).
Agricultural GDP by Subsector, 2005-2009(% of sector’s accumulated output)
PIB silvoagropecuario por rama productiva, 2005-2009(% del producto sectorial acumulado)
Silviculture18%
Crop growing18%
Animal husbandry24%
Fruit farming40%

15
Exports
Chile’s agribusiness exports have increased steadily as the industry has diversified and penetrated new markets. Thanks to Chile’s extensive network of trade agreements, its exports enjoy tariff advantages in markets that represent over 85.7% of global GDP and comprise 4.3 billion consumers or, in other words, 65% of the world’s population.
Chile’s exports of foods and beverages alone grew by 155% between 1996 and 2010. In 2003, they reached US$4,030 million and, by 2010, had risen to over US$7,826 million, an amount equivalent to 50% of the country’s total exports in 1998.
This growth trend was temporarily interrupted in 2009 as a result of the international crisis which affected principally the food industry.
Exportaciones
Las exportaciones de Chile en el rubro de los agronegocios han ido en ascenso a medida que el país ha diversificado su industria y se ha abierto a más países. Gracias a su amplia red de acuerdos comerciales, desde Chile se accede con ventajas arancelarias a más del 85,7% del PIB del mundo y a un total de 4.302,36 millones de consumidores, el 65% de la población mundial.
De 1996 al año 2010, sólo la tasa de crecimiento de las exportaciones de alimentos y bebestibles ha sido del 155%. En 2003 se exportaban US$4.030 millones, mientras que en 2010 los retornos superaron los US$7.826 millones, cifra equivalente al 50% del total de todo lo exportado por el país en 1998.
Esta tendencia expansiva se vio interrumpida durante el ejercicio 2009, consecuencia
Agribusiness Processing GDP by Subsector, 2010(% of sector’s annual output)
PIB agroindustrial por rama productiva, 2010(% del producto sectorial anual)
Paper & printing 24%
Food industry 66%
Wood production 10%
Source: ODEPA (www.odepa.cl) based on 2003-2010 national accounts calculated by Central Bank of Chile (www.bcentral.cl).

CHILE opportunitiesin Agribusiness
16
In 2010, however, signs of rapid recovery became apparent and, today, agribusiness products account 24.1% of Chile’s total exports.
de la crisis internacional que golpeó principalmente al sector alimentario. No obstante, los resultados del año 2010 ya han comenzado a evidenciar señales de rápida recuperación y hoy las exportaciones de los agronegocios representan un 24,1% del total de los envíos del país.
Source: Central Bank of Chile (www.bcentral.cl).*Free on Board: excludes shipping costs. **Includes fish meal, salmon, trout, mollusks, crustaceans, canned fish, raisins and other dehydrated fruits, tomato paste and juice, frozen unsweetened fruit, fruit juices, canned fruit, powdered juices and pork. ***Includes principally chemical products, perfumes and cosmetics, metal products, machinery, equipment and non-monetary gold.
2005 2006 2007 2008 2009 2010 Mining Copper 18,965 32,710 37,778 32,842 27,702 40,257 Others 4,226 33,753 5,567 5,146 2,993 4,022 Agriculture & fishing 2,524 2,765 3,226 4,009 3,646 4,352 Fruit farming 2,177 2,401 2,808 3,451 3,026 3,708 Silviculture 26 16 11 19 14 21 Fishing 37 34 42 55 62 72 Others 284 314 365 484 544 551 Manufacturing 13,829 16,641 18,809 21,085 16,899 19,283
Foods** 4,785 5,556 6,051 6,982 6,273 6,167 Beverages & tobacco 937 1,027 1,343 1,496 1,471 1,658 Forestry & wood pulp 3,460 3,911 4,975 5,359 4,186 4,961
Other 7,761 6,147 6,440 7,248 4,969 6,497 Others** 1,723 2,250 2,592 3,177 2,764 3,115 Total exports 41,267 58,680 67,972 66,259 54,004 71,029
23,191 37,024 43,345 37,988 30,695 44,279
Exports by Sector, 2005-2010 (US$ million, FOB*)
Exportación de mercancías generales por sector, 2005-2010(Millones de US$ FOB*)
Chile’s main food exports are salmon and trout, which accounted for 26% of exports of food, beverages and tobacco in 2010. They were followed by wine (20%) while other important exports are fruit and other processed fish products.
Despite the impact of the international financial crisis, exports of fresh fruit increased by 9% in 2010 while wine exports rose by 12%. This recovery reflected both stronger international demand and an increase in the price of basic products.
Las principales ofertas exportables, dentro del sector alimentario, son los salmones y truchas y el vino, que representaron un 26% y un 20%, respectivamente, del total de los envíos de la industria de alimentos, bebidas y tabaco del año 2010. Otras exportaciones importantes son los frutos y otros procesados de la industria pesquera.
A pesar de los efectos que tuvo la crisis financiera mundial en el sector, de 2009 a 2010 las exportaciones de fruta fresca se incrementaron un 9% y las de vino un 12%;

17
In 2010, fruit exports initially showed a drop but recovered as from the second quarter while wine exports maintained their upward trend of recent years, reaching an annual record of US$1,548 million. Japan was Chile’s largest market for food exports while wine and other beverages went principally to Europe.
dicha mejora en los montos exportados estuvo marcada por la mayor demanda mundial y el incremento del precio de los productos básicos.
Los embarques de fruta partieron el año 2010 a la baja, pero repuntaron a partir del segundo trimestre, en tanto los envíos de vino continuaron la tendencia alcista de los últimos años y marcaron un récord en 2010 con US$1.548 millones. Los mayores embarques alimenticios se destinaron a Japón, mientras que los vinos y otras bebidas tuvieron su principal ruta de comercialización en Europa.
Source: Central Bank of Chile (www.bcentral.cl).* Includes smaller items such as canned products, juices, tobacco and other processed products.
Powdered juices 3%
Salmon and trout 26%
Pork 4%
Others * 29%
Mollusks and crustaceans
5%
Fruit (dehydrated and frozen)
7%
Wine 20%
Fish meal 6%
Exports of foods, beverages and tobacco, 2010 (Total = US$7,826 million FOB)
Exportación de alimentos, bebidas y tabaco por producto, 2010(Total: US$7.826 millones FOB)
Wood pulp and wood products are Chile’s largest forestry exports. In 2010, bleached wood pulp accounted for 45% of forestry exports while subproducts made using radiata pine were also important.
The sector as a whole expanded by 21% in 2010, standing out for its positive results, albeit from a low base of comparison after
En el sector forestal y sus derivados, las exportaciones más importantes son la celulosa y las maderas trabajadas. El año 2010, la celulosa blanqueada representó el 45% de los embarques de la rama, en tanto que fue importante también la comercialización de subproductos facturados con pino insigne.
Este sector, en su conjunto, creció un 21% entre

CHILE opportunitiesin Agribusiness
18
showing one of the slowest rates of recovery from the international crisis. The United States and Japan were the industry’s principal markets for wood products while wood pulp and paper went mainly to Europe and China.
el año 2009 y 2010 y destaca, pese a la baja base de comparación, por sus buenos resultados luego de haber sido uno de los sectores de menor tasa de recuperación tras la crisis internacional. Los mayores envíos de madera se dirigieron a Estados Unidos y Japón, en tanto que los de celulosa y papel se concentraron en Europa y China.
Forestry and wood pulp exports, 2010(Total = US$4,961 million FOB)
Exportación de derivados forestales y celulosa por producto, 2010(Total: US$4,961 millones FOB)
Carpentry products 1%
Planed wood 4%Non-bleached
wood pulp 4%Cardboard
6%
Fiberboard & particleboard
6%
Wood chips and pallets
7%
Bleached wood pulp 44%
Radiata pine bases and sawn wood
11%
Others 14%
Source: Central Bank of Chile (www.bcentral.cl).

19

CHILE opportunitiesin Agribusiness
20
Wine industry Industria vitivinícola

21
Chile’s wine industry is currently one of the pillars of its food exports, ranking just after seafood products.
Although Chile has been making wine for over 450 years, it is only in recent decades that the wine industry has shown a sustained expansion. According to the International Organisation of Vine and Wine (OIV), it has been the world’s fifth largest wine exporter since 2003, ranking very close to industry leaders such as France and Spain, and, in 2010, was also the world’s eighth largest producer.
Chile has also become a synonym for high-quality wines and, in recent years, its labels have received prestigious international awards as, for example, in the Decanter World Wine Awards and from specialized publications such as Wine Spectator.
Chile offers privileged agricultural and climatic conditions for grape growing and this is reflected in the quality of its wines. Its principal advantages include the edaphoclimatic conditions of central Chile’s Mediterranean climate and a diversity of soils suitable for the cultivation of different grape varieties. In addition, Chile’s freedom from phylloxera is another key competitive advantage.
La industria vitivinícola nacional es actualmente uno de los grandes pilares de la canasta exportadora de alimentos de Chile, justo después de los productos del mar.
Si bien el vino chileno se elabora desde hace más de 450 años, recién en las últimas décadas ha comenzado un proceso sostenido de expansión. Según datos de la Organización Mundial de la Viña y el Vino (OIV), desde el año 2003 Chile está posicionado como el quinto país con mayores exportaciones de vino en el mundo, muy cerca de los líderes mundiales de la industria, como Francia y España, y en el año 2010 se ubicó además como el octavo productor a nivel global.
Chile se ha convertido asimismo en sinónimo de vinos de alta calidad. En los últimos años, las marcas chilenas han recibido galardones en prestigiosos certámenes internacionales como el Decanter World Wine Awards y revistas especializadas como Wine Spectator.
Chile posee condiciones agroclimáticas excepcionales para el cultivo de la vid, lo que se traduce en una producción de vinos de primera calidad. Entre sus principales fortalezas destacan las condiciones edafoclimáticas producto del clima mediterráneo de la zona central del país, así como la diversidad de suelos, lo que permite la producción de variadas cepas. Además, la condición fitosanitaria (libre de la philoxera) representa una ventaja competitiva para los productores vinícolas.
Industria vitivinícolaWine industry

CHILE opportunitiesin Agribusiness
22
Output
In Chile, there are 111,525 hectares under wine grapes and this is expected to continue to increase. According to the latest industry survey, Catastro Vitícola Nacional, released by the government’s Agricultural Inspection Service (SAG) in 2009, the area devoted to wine grapes expanded by 52% between 1995 and 2009 and is located principally between the Atacama and Los Lagos Regions, including the Santiago Region.
Red varieties account for 72.9% of the area under wine grapes while white varieties account for 27.4%. The single most important variety in terms of the area planted is cabernet sauvignon which accounts for 40,728 hectares.
Producción
En Chile existen 111.525 hectáreas de superficie para vinificación, cifra que debiese ser mayor en el futuro, de acuerdo al más reciente Catastro Vitícola Nacional publicado por el SAG (2009). Entre 1995 y 2009, la superficie se ha expandido en un 52%. Esta área de vinificación se localiza entre las regiones de Atacama y Los Lagos, incluyendo la Región Metropolitana.
Un 72,9% de los viñedos chilenos corresponden a cepajes tintos y otro 27,4% a cepajes blancos, siendo las cepas de Cabernet Sauvignon las que se extienden en mayor proporción, en un total de 40.728 hectáreas del país.
Others 18%
Chardonnay 12%
Sauvignon blanc 11%
Merlot 9%
Carmenère 8%
Syrah 5%
Cabernet sauvignon 37%
Wine Grape Varieties by Area Planted, 2009(% of total hectares)
Variedades de cepas plantadas por superficie de vides, 2009(En % del total de hectáreas)
Source: Vineyard and Wine Subdepartment, SAG (www.sag.cl).

23
In 2010, Chile produced 884,413 million liters of wine of which 82.9% corresponded to wines with denomination of origin, 12.2% to wines without denomination or not corresponding to a particular variety and the remaining 4.9% to wines made from table grapes. According to the SAG’s Executive Wine Production Report, the vast majority of wine is produced in the Maule, O’Higgins and Santiago Regions which together account for 90.5% of the country’s annual output.
As a result of the losses suffered by the country’s main vineyards in the February 2010 earthquake, the industry’s growth was temporarily interrupted. However, in 2011, wine output increased by 14.3% to 1,046 million liters of which 79.2% corresponded to wines with denomination of origin, 11.3% to wines without denomination or not of a specific variety and 9.5% to wines from table grapes. The Maule, O’Higgins and Santiago Regions accounted for 90.1% of output.
Chile produjo en total 884.413 millones de litros de vino en el año 2010, de los cuales un 82,9% correspondió a vinos con denominación de origen, otro 12,2% a vinos sin denominación y vinos viníferos y el 4,9% restante a vinos provenientes de uvas de mesa. De acuerdo al Informe Ejecutivo de Producción de Vinos publicado por el Servicio Agrícola y Ganadero (SAG) del Ministerio de Agricultura, la mayor parte de la producción se localizó en las regiones del Maule, Libertador Bernardo O’Higgins y Metropolitana, que juntas concentraron el 90,5% de la producción anual.
Debido a las mermas ocasionadas por el terremoto en las principales viñas del país, los resultados del año 2010 significaron una importante caída en la tendencia expansiva de la industria. Sin embargo, al cierre del año 2011 la producción vinícola se incrementó en un 14,3% respecto al ejercicio anterior, cifrándose en 1.046 millones de litros de vino, de los que un 79,2% correspondió a denominación de origen, un 11,3% a viníferos y otro 9,5% a vinos de mesa. Las tres regiones líderes de la zona central concentraron el 90,1% de lo producido.
De este modo, pese a los efectos del terremoto de febrero de 2010, durante los últimos 4 años la producción de vino ha crecido un 20,5%, diversificándose además durante el ejercicio 2011 a nivel territorial tras los excelentes resultados de Atacama y Valparaíso y a nivel de producción tras el aumento en un 129,2% de la producción de vinos de mesa.
Source: Vineyard and Wine Subdepartment, SAG (www.sag.cl).
Region 2008 2009 2010 2011Atacama 28,300 26,680 38,860 375,841Coquimbo 27,896,700 22,225,532 38,424,221 55,870,815Valparaíso 10,721,300 19,767,856 14,854,669 18,518,566O’Higgins 285,576,300 323,484,449 261,611,981 318,447,472Maule 421,909,100 478,047,173 432,311,543 479,824,045Bío-Bío 30,403,500 25,565,971 30,523,026 28,364,917Santiago 91,761,800 117,816,927 106,649,071 144,979,247Total 868,297,000 986,934,588 884,413,371 1,046,380,903
Despite the impact of the earthquake, Chile’s wine output has increased by 20.5% over the past four years while, in 2011, the industry also diversified to new geographic areas, after experiencing excellent results in the Atacama and Valparaíso Regions, while its production of wines from table grapes increased by 129.2%.
Wine Output by Region, 2008-2011(Liters)
Evolución de la producción anual de vino por regiones, 2008-2011(En litros)

CHILE opportunitiesin Agribusiness
24
The areas planted with cabernet sauvignon, sauvignon blanc and merlot grapes are reflected in output of these varieties which together accounted for 59% of Chile’s wine production in 2011. By comparison, output of chardonnay, although the second largest variety in terms of the area planted, is more specialized and, therefore, relatively smaller in output.
Los niveles de superficie de viñedos Cabernet Sauvignon, Sauvignon Blanc y Merlot han tenido su efecto en la cantidad de litros obtenidos tras las cosechas. De este modo, estas tres cepas representaron en total un 59% de lo producido en el año 2011. Por el contrario, las vastas extensiones de vides para Chardonnay, que ocupan el segundo lugar en el total de hectáreas plantadas, dan como resultado una producción más especializada.
Wine Output by Category, 2008-2011 (% annual variation)
Variación de los orígenes de producción vinícola, 2008-2011 (En % anual)
Denomination of origin Table grapesWithout denomination
2008-2009
2009-2010
2010-2011
24% -22.5% -41.7%
-15.4% -6.7% 5.8%
11.3% -7.2% 129.2%
Source: Vineyard and Wine Subdepartment, SAG (www.sag.cl).
Cabernet sauvignon 34%
Sauvignon blanc 13%Merlot
12%
Chardonnay 10%
Carmenère 8%
Syrah 7%
Others 16%
Wine Output by Variety, 2011(% of total output)
Producción de vino según tipo de cepaje, 2011(En % del total anual)
Source: Vineyard and Wine Supdepartment, SAG (www.sag.cl).
of origin

25
Exports
Chile’s wine industry has focused on export markets, basing its strategy of internationalization on the optimization of its price-quality ratio or, in other words, on supplying good quality wines at reasonable prices, taking advantage of production costs that, by international standards, are comparatively low.
In 2010, it exported wines for US$1,548 million, accounting for 2.2% of the country’s total exports and 20% of its food exports. Since the international crisis, demand for bottled wine in the industry’s main markets has recovered, with exports in 2010 representing a 12.1% increase in value and 11.2% in volume.
Over the next ten years, the industry aims to double its exports of bottled wine to US$3,000 million in 2020. This implies achieving an annual growth rate of 9% and increasing domestic sales to US$500 million per year, up from their present level of US$200 million.
Chile’s openness to trade and its network of Free Trade Agreements (FTAs) have been of particular benefit for exports of bottled and bulk wine. In 2015, Chilean wines will have tariff-free access to the Chinese market and, in 2016 and 2020, to the United States and Japan, respectively.
At present, the European Union (EU) is the principal market for Chilean wines and accounted for 42.9% of exports in 2010, led by the UK (22%). The fastest growth is, however, in exports of bulk wine to China which rose by over 50% in 2010.
Exportaciones
Chile ha orientado su producción vitivinícola al exterior, optimizando la relación precio-calidad al ofrecer vinos de buena calidad a precios razonables y en consonancia con los bajos costos comparativos de producción a nivel internacional.
Los envíos de vino chileno al extranjero sumaron US$1.548 millones en 2010, constituyendo el 2,2% de las exportaciones totales y el 20% de las alimentarias. Con posterioridad a la crisis mundial, los principales destinos del vino embotellado fueron recuperando su nivel de demanda, lo que permitió que el valor de las exportaciones se expandiera a una tasa anual de 12,1% y los volúmenes en un 11,2% al cerrar el año 2010.
El objetivo de la industria es duplicar las exportaciones de vino envasado en los próximos diez años, hasta alcanzar una tasa anual de US$3.000 millones en el año 2020. Para ello, el sector deberá mantener una tasa de crecimiento del 9% por año, así como incrementar el mercado interno de los US$200 millones a los US$500 millones durante dicho periodo.
El comercio de vinos embotellados y a granel se ha visto especialmente favorecido por la apertura de Chile en el contexto internacional a través de los Acuerdos de Libre Comercio suscritos. En 2015 los vinos chilenos tendrán arancel cero con China, en 2016 con Estados Unidos y en 2020 con Japón.
A la fecha, la Unión Europea (UE) constituye el principal destinatario de los vinos chilenos, representando un 42,9% del total exportado al año 2010. Dentro de la UE, Inglaterra destaca como el principal destino de las exportaciones chilenas de vino (22% del total). Por otro lado, el crecimiento más acelerado de los envíos se está dando en China con el vino a granel; el monto de las transacciones con la potencia asiática se incrementó sobre un 50% entre 2009 y 2010.

CHILE opportunitiesin Agribusiness
26
Wine Exports by Market, 2009-2010 (US$ million)
Exportaciones de vino por mercados de destino, 2009-2010 (Millones de US$)
2009 Variation (%)Market 2010
European Union
Canada
Mexico
India
United States
China
Andean Community
Others
MERCOSUR
Japan
South Korea
Total
618.7
77.2
26.5
0.4
664.3
89.5
33.7
0.6
7.4%
15.9%
27.2%
30.2%
241.6
54.0
25.7
169.4
243.0
83.5
30.2
190.8
0.6%
54.6%
17.6%
12.6%
80.0
65.4
22.5
1.381
107.7
81.2
23.0
1.548
34.6%
24.3%
2.4%
12.0%
Source: Research Department, DIRECON (www.direcon.cl) based on export declarations with Value Variation Report (IVV) and figures from Central Bank of Chile (www.bcentral.cl).
Chile has positioned itself abroad as a supplier of bottled wines from a region where it has few competitors since most other countries focus on the bulk market. According to René Araneda, president of Wines of Chile, the industry association, the growth of Chile’s bulk exports has gradually weakened in response to the higher returns that can be obtained from high-quality grape varieties.
In 2010, Chile’s exports of bottled wine were up by 11.5% in volume terms while the volume of bulk wine exported increased by 12.5%, accounting for just over a third of total exports. For 2012, the industry anticipates a drop in the growth of bulk wine sales.
Chile se ha posicionado en el exterior como proveedor de vinos embotellados donde tiene muy pocos competidores, ya que en la región la mayor parte de los productores se ha abocado a los graneles. Según el presidente de Vinos de Chile, René Araneda, la exportación de graneles cada vez ha ido perdiendo más fuerza, a medida que ha sido más rentable la producción de cepajes de alta calidad.
Entre 2009 y 2010, el volumen de comercialización de embotellados en el extranjero creció un 11,5%, en tanto que los graneles subieron un 12,5%, representando un poco más del tercio de lo exportado. La industria espera que la expansión de los envíos de vino a granel se contraiga para el periodo 2011-12.

27
Source: Wines of Chile (www.vinasdechile.cl).
Investment
Chile’s wine industry is extremely heterogeneous, offering a portfolio of differentiated value-added products. Given its track record, there are ample opportunities for ongoing innovation throughout the production chain and, particularly, for harnessing the latest technological developments. Chile has highly-qualified professionals in both the production area and in research and development and, therefore, enormous comparative advantages for producing high-quality wines at competitive prices.
Foreign investment has played an important role in the industry’s development, with the presence of companies from different countries that include Chateau Lafitte, Rothschild, Pernod Ricard, Kendall-Jackson, Franciscan, Miguel Torres and Bisquertt. They have all been attracted by the ideal geographic and climatic conditions available in Chile and by strong demand for its wines around the world.
Inversión
La industria vitivinícola chilena se caracteriza por ser altamente heterogénea, ofreciendo un portafolio de productos diferenciados con valor agregado. Dada su trayectoria, existe un amplio espacio para seguir innovando en toda la cadena productiva, especialmente de la mano con los últimos avances tecnológicos. Chile cuenta con profesionales altamente calificados, tanto en el ámbito productivo como en investigación y desarrollo, por lo que existen ventajas comparativas enormes para producir vinos de alta calidad a precios competitivos.
Las inversiones extranjeras han influido notoriamente en el desarrollo de la industria vitivinícola chilena, destacando el ingreso de empresas de diversos países incluyendo marcas como Chateau Lafitte, Rothschild, Pernod Ricard, Kendall-Jackson, Franciscan, Miguel Torres y Bisquertt, entre otros. Todos ellos han sido atraídos por las ideales condiciones geoclimáticas y la importante demanda por vinos chilenos a través del mundo.
Bottled 58,1%
Canned 3,7%
Bulk 37,5%
Champagne 0,5%
Sparkling & others 0,3%
Wine Exports by Type of product, 2010(Liters)
Producción de vino según tipo de producto, 2010(En litros)

CHILE opportunitiesin Agribusiness
28
Opportunities
Chile has privileged locations and climatic conditions for producing different varieties of wine.
Internationally, wine is highly valued in relation to regional/local culture and cuisine.
Wine is ever more identified with and valued for its functional properties as regards health (for example, as an antioxidant).
In Chile, the tourist industry is beginning to develop related products such as wine spas and wine routes, boosting the prospects for the industry’s development.
Important challenges for producers include increasing domestic consumption (currently 15 liters per capita per year) and exports of bottled wine.
Greater innovation is required in associated industries and technologies such as production facilities and irrigation.
More investment is needed in high-quality vines.
Oportunidades sectoriales
Chile tiene tierras y condiciones climáticas privilegiadas para la producción de diversas cepas de vino.
Existe una alta valoración internacional del vino chileno en relación la cultura y gastronomía regional/local.
Cada día es mayor la identificación y valoración de las propiedades funcionales del vino para la buena salud, como los antioxidantes.
Existe un sector de turismo emergente asociado a wine spa y rutas del vino que abre amplias posibilidades de potenciar el sector vitivinícola.
Aumentar el consumo per cápita interno (15 litros por persona al año) y la exportación de vino embotellados, son los grandes desafíos para los productores.
Se requiere mayor innovación en las industrias y tecnologías asociadas a este sector tales como bodegas y sistemas de riego.
Se necesita inversión en viñedos de alta calidad.

29

CHILE opportunitiesin Agribusiness
30
Fruit farmingFruticultura

31
FruticulturaFruit farming
The positive development of Chile’s fruit industry reflects its specialization in products for which international demand is most dynamic and its counter-season advantage as a supplier to northern hemisphere markets.
In recent decades, the industry has emerged as one of the principal poles of Chile’s economic and export development and currently accounts for 2% of the country’s GDP and 5% of its total exports. Indeed, over 80% of the fruit produced in Chile is exported.
Chile has established itself internationally as a reliable supplier of fruit that meets high phytosanitary standards, thanks to climate conditions that allow it to project ongoing export growth. In addition, the country’s north-south length and its diversity of climates permit staggered production, giving it a relatively long export season.
Output
Between 2003 and 2009, Chile’s fruit output increased by 48%, equivalent to an average annual growth rate of 7%.
Within the primary subsector of the agribusiness industry - including crop growing, animal husbandry and fruit farming but excluding silviculture and fishing - fruit farming accounts for 46% of output and 87% of exports. Output of all different types of fruit increased between 2006 and 2010, despite the drops seen in 2009 as a result of the international financial crisis.
These growth rates as regards both output and exports have implied an important increase in the area under fruit which, over the past decade, has expanded by 26%.
La industria frutícola chilena está bien encaminada en su desarrollo y énfasis productivo, desde que el país se especializara en frutas que están experimentando un crecimiento más dinámico en los mercados consumidores internacionales, con la ventaja de hacer envíos en la contraestación de los mercados del hemisferio norte.
En las últimas décadas, la industria frutícola se ha posicionado como uno de los principales polos productivos y exportadores de la economía nacional, representando actualmente un 2% del PIB nacional y un 5% de las exportaciones totales. En efecto, más del 80% de la producción de esta actividad económica se dirige al exterior.
Chile ha logrado posicionarse en el mundo como proveedor de fruta fresca confiable y de elevado estatus fitosanitario, sus condiciones climáticas permiten proyectar un crecimiento constante de la oferta exportable. Asimismo, la longitud del país permite acceder a terrenos con producciones escalonadas, con un período de exportación relativamente amplio gracias a su diversidad de climas.
Producción
La producción frutícola se ha expandido un 48% entre 2003 y 2009, creciendo en promedio a una tasa del 7% anual en los últimos 7 años.
Dentro del subsector primario de los agronegocios, que incluye la agricultura, la ganadería y la fruticultura –excluyendo silvicultura y pesca extractiva– esta actividad representa el 46% de la producción y el 87% de las exportaciones. Todos los tipos de productos presentan un crecimiento en el período 2006-2010, a pesar de las bajas del año 2009 debido a la crisis financiera mundial.
Estos niveles de crecimiento, tanto de la producción como las exportaciones, han implicado

CHILE opportunitiesin Agribusiness
32
From 2001 to 2010, the largest increases in the area planted corresponded to avocados (143%), cherries (118%) and European plums (110%). Important increases were also seen in walnuts and peaches for canning.
un fuerte incremento de la superficie plantada con especies frutales en Chile, aumentando un 26% en los últimos 10 años.
Las especies frutales que han incrementado más sus hectáreas de manejo en el periodo 2001-2010 han sido los paltos (143%), los cerezos (118%) y los ciruelos europeos (110%). También han tenido un incremento importante los nogales y duraznos conserveros.
Source: ODEPA (www.odepa.cl) based on regional fruit surveys by CIREN (www.ciren.cl).
Area under Fruit, 2005-2010(Hectares)
Superficie plantada con frutales, 2005-2010(En hectáreas)
2008200550,960 50,952 50,846 52,187 53,339 52,65534,820 35,247 35,972 34,963 35,075 35,02926,731 26,744 26,759 33,837 33,531 34,05714,443 14,462 14,889 14,636 18,536 18,651
9,616 9,734 10,067 11,135 12,549 15,4516,945 6,879 6,639 6,429 6,633 6,2258,225 8,225 8,210 8,868 7,473 7,4357,125 7,621 9,922 10,054 12,468 13,1437,240 7,234 7,173 7,935 7,649 7,2356,818 6,818 6,819 6,603 6,038 5,3766,606 6,707 8,734 8,740 10,769 10,9225,820 5,822 5,827 6,192 6,924 7,6175,742 5,795 8,001 8,597 11,985 12,874
30,001 33,598 38,801 39,378 41,851 40,820221,092 225,837 237,660 249,553 264,819 267,491
Table grapes
Avocados
Walnuts
Oranges
Lemons
KiwisAlmondsOlivesOthersTotal
Apples
Plums
Pears
Cherries
Nectarines
2006 2007 2009 2010

33
Tables grapes currently account for 20% of the area under fruit in Chile and are followed by apples and avocados (both with 13%) and plums (7%). As a result, these four species account for over half the total area under fruit.
Cultivation of table grapes takes place in principally in northern and central Chile and, specifically, in the Atacama and Coquimbo Regions where they account for over 70% of the total area under fruit. Similarly, cultivation of red apples is concentrated in central and southern Chile where, in some cases, they represent almost 100% of the area under fruit.
The Maule Region, for example, alone accounts for 59.8% of the total area under apples in Chile. Reflecting the large areas devoted to apple production, Chile’s annual output now reaches 1,624,000 tonnes.
Las especies más plantadas en Chile actualmente son las vides de mesa, que representan un 20% del total de hectáreas; le siguen los manzanos y paltos, ambos con un 13%, y los ciruelos con un 7%. La agrupación de estas cuatro especies supera la mitad de la superficie plantada de frutales en el país.
Las principales regiones de plantación de vides de mesa son las del norte y centro del país, puntualmente Atacama y Coquimbo, donde esta especie supera el 70% del total de frutales; lo mismo ocurre con los manzanos rojos en la zona centro y sur del país que llega a tener un 100% de presencia en la superficie plantada con frutales.
En efecto, en la región del Maule se concentra el 59,8% de la superficie nacional plantada de manzanos. Como resultado de tales extensiones de manzanos, hoy la producción nacional de manzanas alcanza 1.624.000 toneladas.
.
Source: ODEPA (www.odepa.cl) based on regional fruit surveys by CIREN (www.ciren.cl).* Selected regions and species with largest area. The year of measurement varies by region and ranges from 2005 to 2010.
Area under Fruit by Region(Regions and selected species, %)*
Proporción de superficie de frutales por región(Regiones y especies seleccionadas, %)*
PearsWalnuts
Red ApplesKiwis
Peaches for canningEuropean plums
AvocadosTable grapes
Santiago
O’HigginsMaule
Bío Bío
La Araucanía
Los Ríos
Los Lagos
Valparaíso
Coquimbo
Atacama0%
10%
20%
30%
40%
50%
60%
80%
70%
90%
100%

CHILE opportunitiesin Agribusiness
34
Exports
World imports of fresh Mediterranean fruit - a category that comprises 13 species including apples, grapes, citrus fruit and plums - increased by 7.3% in volume between 2005 and 2009, rising from 27.9 million tonnes to 30.0 million tonnes, according to the International Trade Centre (ITC). This is precisely the category of fruit that Chile mainly exports.
Chile’s fresh fruit exports account on average for 7.7% of the volume imported internationally. Thanks to the industry’s dynamic development, Chile is the world’s leading exporter of a number of species as well as the southern hemisphere’s largest fruit exporter, a position that reflects the diversification of its output and its counter-season advantage with respect to markets in the northern hemisphere.
Fresh fruit accounts for 27.3% of the total export earnings of the agricultural sector.
In 2010, the volume of Chile’s fruit exports rose by 2.4% to over 2.4 million tonnes while their value increased by 12.8% to US$3,105 million. These results demonstrate the industry’s rapid recovery from the international crisis.
Chile’s five largest fruit exports by volume and value are grapes, apples, kiwis, avocados and plums. However, with the exception of apples, all these species performed negatively in 2010, while less traditional fruit exports such as lemons, mandarins and, particularly, blueberries, showed better results.
Exportaciones
El mercado mundial de importación de fruta fresca de clima mediterráneo - una categoría que incluye un total de trece especies entre las que se cuentan manzanas, uvas, cítricos y ciruelas -, ha tenido un incremento de 7,3% en volumen entre los años 2005 y 2009, pasando desde 27,9 a 30 millones de toneladas, según cifras del Centro de Comercio Internacional (CCI). Esta categoría de frutas es la que Chile principalmente exporta.
Las exportaciones chilenas de fruta fresca participan en promedio de un 7,7% del volumen de las importaciones mundiales. El dinámico desarrollo de esta industria ha logrado ubicar a Chile en el liderazgo exportador mundial en varias especies, además de ser el líder exportador del hemisferio sur. Esto gracias a la diversificación de la oferta y a la posibilidad de producir durante contraestación con respecto al hemisferio norte.
El valor de la exportación de fruta fresca representa el 27,3% de las exportaciones totales del sector silvoagropecuario.
El volumen exportado de fruta fresca experimentó un crecimiento de 2,4% durante el año 2010 en comparación con el registro 2009, superando las 2,4 millones de toneladas; el valor, en tanto, aumentó en 12,8%, cifrándose en US$3.105 millones. Estos resultados reflejan la rápida recuperación del sector después de la crisis.
Las cinco frutas que más se exportan son, por toneladas y valor, las uvas, las manzanas, los kiwis, las paltas y las ciruelas. No obstante, salvo las manzanas, sus resultados fueron negativos entre el 2009 y el 2010, dando paso a mejores resultados para envíos menos tradicionales como los limones, mandarinas y especialmente los arándanos.

35
The largest increases in volume of exports in 2010 were in citrus fruits, blueberries, cherries and apples while the largest increases in the value of exports were in blueberries, apples and peaches. Both the increases and decreases seen in species that included kiwis, avocados, pears and raspberries were explained by weather and production conditions during their pre- and post-harvest periods which had a differing impact on each of these species.
Cítricos, arándanos, cerezas y manzanas fueron las especies con mayores aumentos en volumen de exportación durante el año 2010, en tanto que arándanos, manzanas y duraznos incrementaron más su valor de envío al extranjero. Tanto los aumentos como las caídas, registradas en kiwis, paltas, peras y frambuesas, entre otras frutas, se explican por las condiciones meteorológicas y productivas experimentadas durante los periodos de pre y post cosecha, que impactaron distintamente a cada categoría.
Fresh Fruit Exports by Species, 2010(Tonnes, % of total)
Exportación de fruta fresca por especie, 2010(En toneladas, %)
Apples 33%
Grapes 31%
Kiwis 7%
Citrus fruits* 5%
Pears 5%
Avocados 4%
Plums 3%
Nectarines 2%
Blueberries 2%
Others 8%
Source: ODEPA (www.odepa.cl). * Includes lemons, oranges, mandarins and clementines.

CHILE opportunitiesin Agribusiness
36
The United States has historically been Chile’s principal fresh fruit market but its share of total exports, at 42%, showed a drop in 2010, due to smaller volumes of avocados, grapes and apples. The importance of Asian markets and, particularly, South Korea and China has, on the other hand, shown a sustained increase and, in 2010, China, including Taiwan and Hong Kong, accounted for 9% of Chile’s exports of fresh fruit.
Estados Unidos ha sido históricamente el principal destino de los envíos chilenos de fruta fresca. En 2010 captó el 42% de las exportaciones totales, disminuyendo su participación al registrar bajas en el volumen de paltas, uvas y manzanas. Por su parte, los países asiáticos han ido aumentando continuamente su participación en el total, especialmente Corea del Sur y China; este último, sumando sus provincias de Taiwán y Hong Kong, representa el 9% de los envíos de fruta fresca de Chile.
Source: ODEPA (www.odepa.cl).* Ordered by volume of exports (in tonnes).
Fresh Fruit Exports by Species*, 2009-2010(US$ thousand FOB and % variation)
Exportación de fruta fresca por especie*, 2009-2010(En US$ miles FOB y % variación anual)
% variation 2010/2009
1,144,556 1,240,614 8.4479,662 594,834 24.0147,288 144,525 -1.9244,495 143,367 -41.4101,321 105,183 3.8107,860 100,585 -6.7177,936 299,796 68.5
63,960 75,314 17.839,106
241,784
47,403
350,931
21.2
45.14,409
2,752,377
3,138
3,105,691
-28.8
12.8
Grapes
Kiwis
Plums
Blueberries
Peaches
Others
Apples
Avocados
Pears
Nectarines
Raspberries
Total
2009 2010Fruit

37
Investment
Chile’s experience as a net agricultural exporter has permitted the development of a fruit industry that is highly competitive internationally and, particularly, within the southern hemisphere where it is the leading exporter. At the same time, the Free Trade Agreements that Chile has signed have opened new markets and meant important tariff reductions as a result of which the sector has many opportunities. Given the growing importance of Asian countries and the so-called BRIC countries (Brazil, Russia, India and China) as markets for Chilean fresh fruit, an increase in production capacity is required in order to satisfy the demand of these rapidly developing economies as well as greater investment in innovation and research and development (R&D).
Inversión
La experiencia de ser un país netamente exportador en el área agrícola ha permitido desarrollar un sector frutícola altamente competitivo a nivel internacional, en especial en el Hemisferio Sur, donde el país ocupa el primer lugar. A su vez, los Tratados de Libre Comercio suscritos brindan apertura de mercados y reducciones arancelarias importantes, por lo que son muchas las oportunidades que tiene este sector.
Dada la creciente participación de los países asiáticos y el bloque denominado BRIC dentro del espectro de destinos de los envíos chilenos de fruta fresca, existe la necesidad de aumentar la capacidad productiva del país para satisfacer la demanda de mercados que se están desarrollando a tasas muy aceleradas, así como mayores inversiones en innovación e Investigación y Desarrollo.
Netherlands 8%
United Kingdom 5%
Hong Kong 4%
Russia 3%
Brazil 3%
Taiwan 3%
China 2%
Mexico 2%
South Korea 2%
United States 42%
Others 26%
Exports of Fresh Fruit by Market, 2010(US$ thousand FOB, %)
Exportación de fruta fresca por país de destino, 2010(En miles de US$ FOB, %)
Source: ODEPA (www.odepa.cl) based on information from National Customs Service (www.aduana.cl).

CHILE opportunitiesin Agribusiness
38
Opportunities
In order to be more competitive, Chile must increase the area devoted to fruit and vegetables to 500,000 hectares; according to estimates by experts, this would imply exports of US$4,000 million.
There are opportunities to increase the price of Chile’s portfolio of fruit exports by producing higher-value species such as walnuts, berries, cherries and avocados and organic products.
Consumers are changing their fruit-eating habits, providing an opportunity to increase output of functional products such as juices, fortified foods and baby foods; this would require higher investment in areas that include biotechnology, agricultural engineering and nurseries.
Markets for fresh fruit in Asia and the BRIC countries are expanding rapidly due to a sustained increase in consumption.
Opportunities exist to increase the quality of the final product by incorporating greater value-added in the production chain through irrigation technology, traceability, biosecurity, biofertilizers and processing plants.
Ready-to-serve foods in portions can be incorporated into the industry’s export portfolio.
An important market for the management of vegetable waste is developing related to the production of biogas and clean energies.
Oportunidades
A fin de ser más competitivos, Chile debe aumentar a 500.000 las hectáreas plantadas de frutales y hortalizas. Esto implicaría exportar US$4.000 millones, según estimaciones de expertos.
Posibilidad de mejorar e incrementar el precio del portafolio frutícola con la producción de especies finas como nueces, berries, cerezas, paltas y orgánicos.
El consumidor está haciendo un recambio de las frutas que consume por lo que existe la posibilidad de aumentar la producción de alimentos funcionales como jugos, alimentos fortificados y baby food, lo que requerirá de mayores inversiones en biotecnología, ingeniería agronómica y viveros, entre otros.
Hay una gran expansión de los mercados mundiales de fruta fresca en Asia y los países BRIC, donde el consumo crece en forma sostenida.
Aumentar la calidad en el producto final con la incorporación de mayor valor agregado en la cadena, como tecnología de riego, trazabilidad, bioseguridad, biofertilizantes y plantas procesadoras.
Incorporar alimentos porcionados listos para servir.
Se abre un amplio mercado con el manejo de desechos vegetales para la producción de biogás o energías limpias.

39

CHILE opportunitiesin Agribusiness
40
Processed foods
Alimentos procesados

41
Processed foodsAlimentos procesados
The food processing industry accounts for over half the output of Chile’s agribusiness sector and 11% of the country’s total exports. Since 2003, the industry has experienced average annual 3% growth and currently has a GDP of over US$6,242 million.
Over 200 industrial plants located around the country process over half the fruit and vegetables produced in Chile and more than 430 companies export processed foods, providing some 24,000 direct jobs.
Exports
Chile’s exports of foods, beverages and forestry products reached US$12,786 million in 2010. This was an increase of 7.1% on the previous year, representing an important recovery after their drop of 13.8% in 2009 as a result of the international crisis.
According to the Ministry of Agriculture, the industry’s expansion is explained by increasing international demand for processed foods as well as by its comparative and competitive advantages.
La industria de los alimentos procesados abarca más de la mitad de lo producido por el sector agroindustrial chileno y representa un 11% de las exportaciones totales del país. El subsector ha exhibido en promedio una tasa anual de crecimiento del 3% a partir del año 2003 y actualmente su PIB supera los US$6.242 millones.
Existen más de 200 plantas industriales distribuidas a lo largo del país, que procesan más de la mitad de las frutas y hortalizas que se producen en Chile; asimismo existen más de 430 empresas exportadoras, dando empleo directo a 24.000 personas.
Exportaciones
Las exportaciones del sector agroindustrial durante el año 2010, sumando alimentos, bebidas y derivados forestales, se valorizaron en US$12.786 millones, monto que representó un crecimiento anual del 7,1%, marcando un fuerte repunte luego de una caída del 13,8% en 2009 como consecuencia de la crisis mundial.
Las razones de esta expansión, según el Ministerio de Agricultura, están en la creciente demanda mundial por alimentos elaborados, así como en las ventajas comparativas y competitivas de la industria.
.

CHILE opportunitiesin Agribusiness
42
Source: Energy Ministry (www.minenergia.cl).
Type/sector 2008 2009 2010 % variation Participation 2010 2010/2009 Primary products 4,280,802 3,745,201 4,254,657 13.6% 35.1%
Processed products 8,477,552 6,986,963 7,870,908 12.7% 64.9%
Crop production 3,014,188 2,741,756 2,952,661 7.7% 37.5%
Animal husbandry 995,328 864,707 919,406 6.3% 11.7% Forestry 4,468,036 3,380,500 3,998,841 18.3% 50.8%
Total 12,758,356 10,732,163 12,125,565 13.0% -
Agricultural Exports by Type and Sector, 2008-2010(US$ thousand)
Exportación de productos silvoagropecuarios por clase y sector, 2008-2010(En miles de US$)
Source: ODEPA (www.odepa.cl) based on information from National Customs Service (www.aduana.cl).
The agribusiness sector’s exports correspond almost exclusively to agricultural products (excluding fishing) which accounted for 95% of its total exports in 2010. The growth of this subsector, in fact, almost doubled that of the sector as a whole. The forestry industry, which currently accounts for half of the subsector’s exports, showed the best result, with an expansion of 18.3% over 2009.
La canasta exportadora de la agroindustria chilena está constituida netamente por productos silvoagropecuarios, excluyendo la pesca, que ocupan un 95% del total de envíos en el año 2010. En efecto, el ritmo de crecimiento de este subsector casi duplicó el del sector en su conjunto, siendo la rama forestal la que exhibió un mejor resultado tras variar un 18,3% entre 2009 y 2010, representando actualmente la mitad de lo exportado.
Source: ODEPA (www.odepa.cl).
Exports of Processed Agricultural Products, 2009-2010(US$ thousand FOB and % variation)
Exportación de productos silvoagropecuarios industrializados por especie, 2009-2010(En US$ miles FOB y % variación anual)
Product 2009 2010 % variation 2010/2009 Bleached and semi-bleached conifer wood pulp 1,003,414 1,143,111 13.9
Bleached and semi-bleached non-conifer wood pulp 835,664 1,064,074 27.3
Sawn conifer wood 45,396 542,620 27.6
Raisins 118,943 141,106 18.6
Frozen raspberries 124,741 131,355 5.3
Prunes 100,059 125,504 25.4
Canned peaches 67,971 70,742 4.1
Condensed milk 40,150 51,536 28.4
Apple juice 40,318 39,847 -1.2
Peach compote 39,142 35,413 -9.5
Frozen strawberries 28,832 30,134 4.5
Full-fat powdered milk 44,491 27,169 -38.9

43
In 2008, exports of processed fruit and vegetables reached US$1,366 million, trebling their level of US$429 million in 2002. As a result of the international crisis, however, they dropped in 2009 and, in 2010, showed a small recovery to US$1,166 million. They have, in other words, doubled over the past decade, positioning Chile as one of the world’s 16 largest exporters of processed fruit and vegetables, with a particularly important position as a supplier of dehydrated products.
Las frutas y hortalizas procesadas, por su parte, venían triplicando sus envíos al exterior hasta el año 2008, cuando crecieron US$1.366 millones con respecto a los retornos de US$429 millones de 2002. Como consecuencia de la crisis, las ventas bajaron y tras un leve repunte en el año 2010, se valorizaron en US$1.166 millones. De esta manera, se han duplicado las ventas en la última década y hoy Chile está entre los 16 principales exportadores de frutas y hortalizas procesadas, destacándose en los envíos de deshidratados principalmente.
Source: ODEPA (www.odepa.cl) based on TradeMap data (www.trademap.org).
JuicesOilsFrozenCanned
Dehydrated
India
Chile
Mexico
Canada
Brazil
France
Thailand
Turkey
Germany
Belgium
Italy
Spain
Holland
United States
China
Indonesia0 2 4 6 8 10 12 14 16
Main Exporters of Processed Fruit and Vegetables by Type of Product, 2010(US$ billion FOB)
Principales países exportadores de frutas y hortalizas procesadas por tipo de producto, 2010(En miles de millones de US$ FOB)

CHILE opportunitiesin Agribusiness
44
In 2010, 80% of exports corresponded to fruit, 16% to vegetables and tubers, 2% to a mixture of both and 2% to mushrooms. The main processed fruit exports were grapes, raspberries, plums and peaches while the main processes used were canning and dehydration. Latin American markets accounted for 26% of Chile’s exports of processed fruit and vegetables and were followed by European markets (23%) and the United States (22%).
En el año 2010, el 80% de los productos exportados son procesados de frutas; el 16%, de hortalizas y tubérculos; un 2% son mezclas de ambos y un 2% son hongos. Dentro del procesamiento de frutas, las principales especies son las uvas, las frambuesas, las ciruelas y los duraznos, mientras que los principales productos son las conservas y los deshidratados. Un 26% de los envíos chilenos de frutas y hortalizas procesadas se dirige a Latinoamérica, un 23% se concentra en Europa y otro 22% en Estados Unidos.
Source: ODEPA (www.odepa.cl) based on information from National Customs Service (www.aduana.cl).
Raisins 12%
Frozen raspberries 11%
Prunes 11%
Grape juice 6%
Tomato paste 8%
Canned peaches 6%
Jams & jellies 3%
Others 39%
Apple juice 4%
Exports of Processed Fruit and Vegetables by Species, 2010(US$ thousand FOB, %)
Exportación de frutas y hortalizas procesadas por especie, 2010(En miles de US$ FOB, %)

45
The growth and development of Chile’s fruit and vegetable processing industry is illustrated by a number of important milestones:
It is the world’s largest exporter of temperate fruit pulp and the southern hemisphere’s largest exporter of tomato paste and canned peaches.
It is the world’s second largest exporter of prunes, the fourth of raisins and the main exporter of dried peppers; it is also the most important supplier of dehydrated apples to the United States.
It is the southern hemisphere’s largest exporter of frozen fruit and vegetables and the second in the world; it is also the second largest supplier of frozen strawberries to the United States and the southern hemisphere’s main producer of frozen berries.
It is the world’s fifth largest producer of apple juice and the fourth exporter.
El crecimiento y desarrollo alcanzado por la industria elaboradora de frutas y hortalizas ha logrado una gran notoriedad, como lo demuestran los siguientes hechos:
En conservas, Chile es el principal exportador de pulpas de fruta de clima templado del mundo y el primer exportador de pasta de tomate y duraznos en conserva del Hemisferio Sur.
En deshidratados, Chile es el segundo exportador de ciruelas del mundo, el cuarto exportador de pasas, el principal exportador de pimentón y el principal abastecedor de manzana deshidratada de Estados Unidos.
En congelados, Chile es el segundo exportador mundial y el primero del Hemisferio Sur. También es el segundo proveedor de frutillas de Estados Unidos y el principal productor de berries del Hemisferio Sur.
En jugos, Chile es el quinto productor y cuarto exportador mundial de jugo de manzana.
Exports of Processed Fruit and Vegetables by Type of Product, 1990-2010(US$ million)
Evolución de las exportaciones chilenas de frutas y hortalizas procesadas 1990-2010(US$ millones)
500
450
400
350
300
250
200
150
100
50
Source: ODEPA (www.odepa.cl) based on information from National Customs Service (www.aduana.cl). Figures subject to review in line with Value Variation Reports (IVV).
Canned Deshydrated Frozen Juices Oils
1990 1992 1994 1996 1998 2000 2002 2004 2006 2008 2010
Mill
ion
US$

CHILE opportunitiesin Agribusiness
46
Investment
Chile offers a wide variety of processed agricultural products but this, nonetheless, needs to be complemented by new products in order to respond to demand in fast-growing countries. From exporting commodities where it faces great competition from countries with a much greater production capacity, it must take a next qualitative step for which innovation is crucial. New and vigorous investment is, in other words, called for in order to diversify Chile’s output of processed agricultural products.
Today’s consumers have incorporated the concepts of health, pleasure and convenience into their eating habits, with a positive impact on demand for processed products and the resulting creation of niche, value-added markets. There is, moreover, a worldwide trend towards the so-called Mediterranean diet which typically includes the food products that Chile supplies.
Opportunities
The international market for foods will increasingly be driven by a trend towards foods that are healthier and have special characteristics such as diet, organic and pre-prepared products. In addition, eating habits are changing around the world, with an ever increasing shift away from carbohydrates and saturated fats in favor of products that include more fiber, vitamins and antioxidants.
The incorporation of latest-generation technology in, for example, dehydration and juice-making means that products are of optimum quality. Chile is one of the few countries to produce blueberry juice which is in high demand for its health properties.
Inversión
La oferta de productos de la agroindustria nacional es amplia y variada, no obstante requiere ser complementada para responder a la creciente demanda de los países con altas tasas de crecimiento. Chile necesita superar la fase de commodities y avanzar en la calidad, ya que existe una alta competencia entre países on mucha mayor capacidad productiva. En este salto, la innovación es clave. Se requieren nuevas y vigorosas inversiones que permitan diversificar la oferta agroindustrial.
Desde el punto de vista de la demanda, los consumidores de hoy han incorporado a sus patrones alimentarios conceptos como la salud, el placer y la conveniencia, lo que incrementa el consumo de productos elaborados, que entregan un bien segmentado por nichos y valor agregado. Más aún, existe una tendencia por consumir productos típicos de la llamada dieta mediterránea, que coincide plenamente con la oferta de alimentos que se generan en Chile.
Oportunidades
El mercado mundial de alimentos se verá crecientemente estimulado por la tendencia a consumir alimentos más sanos y especiales, tales como dietéticos, orgánicos y preparados. La población mundial está cambiando sus hábitos alimenticios, prefiriendo cada vez productos con menor contenido de carbohidratos y grasas saturadas, a la vez que buscan incluir mayor cantidad de fibra, vitaminas y antioxidantes en su dieta.
La incorporación de tecnología de última generación ha permitido obtener productos de óptima calidad como los deshidratados y jugos. Chile es uno de los pocos países que tiene una planta de producción de jugo de arándanos, altamente demandado por sus beneficios a la salud.
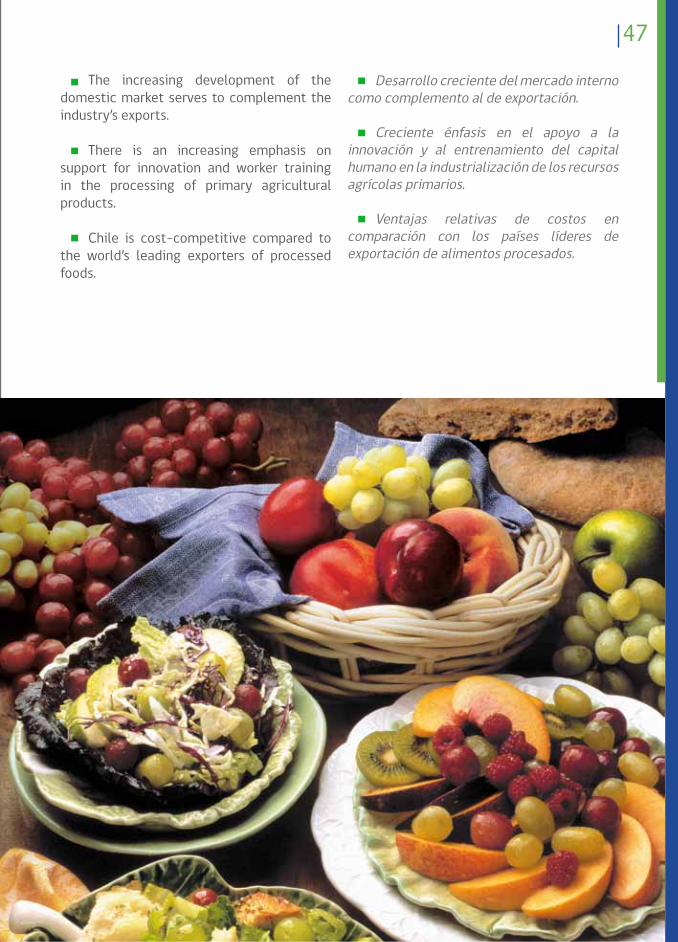
47
The increasing development of the domestic market serves to complement the industry’s exports.
There is an increasing emphasis on support for innovation and worker training in the processing of primary agricultural products.
Chile is cost-competitive compared to the world’s leading exporters of processed foods.
Desarrollo creciente del mercado interno como complemento al de exportación.
Creciente énfasis en el apoyo a la innovación y al entrenamiento del capital humano en la industrialización de los recursos agrícolas primarios.
Ventajas relativas de costos en comparación con los países líderes de exportación de alimentos procesados.

CHILE opportunitiesin Agribusiness
48
Fishing and fish farming Pesca y productos acuícolas

49
Chile is, by nature, a fishing and fish-farming country. As well as its biodiversity and the Humboldt current, it has the advantage of over 25,000 kilometers of coastline and island shores and, in total, has 1,804,000 km2 of territorial waters.
Fishing and fish farming take place mainly in the Bío-Bío and Los Lagos Regions and, to a lesser extent, in the Tarapacá, Antofagasta and Aysén Regions.
Although Chile accounts for only 0.6% of the world fishing fleet, it has emerged as a fishing power, with one of the world’s five largest catches. Since 2004, it has also ranked among the seven largest fish exporters with a market share of 3.6%. In 2010, its fishing exports reached US$3,577 million while, over the past five years (2006-2010), fishing and fish farming have accounted for an average 5.0% of Chile’s total exports.
In 2010, Chile exported fishing and fish-farming products to 112 countries. However, ten markets accounted for 74% of the total, led by China, Spain, Japan and the United States which together accounted for 56%.
In the light of scientific discoveries about the nutritional properties and health benefits of seafood, the industry is of ever increasing importance. The so-called oily fish such as mackerel, tuna, salmon and anchovies are a key source of Omega 3 fatty acids, with their proven health benefits.
The principal processed products sold domestically are fish meal and fish oil, which are used by the salmon farming industry, followed by canned shell fish and mackerel.
Chile tiene 25.000 kilómetros de borde costero y perímetros insulares, lo que sumado a su biodiversidad y la presencia de la corriente de Humboldt, hacen de él un país oceánico y por ende pesquero y acuícola. En total posee 1.804.000 kilómetros cuadrados de aguas jurisdiccionales.
La actividad pesquera y acuícola se concentra principalmente en las regiones del Bío Bío y de Los Lagos y, secundariamente, en las regiones de Tarapacá, Antofagasta y Aysén.
Si bien Chile posee el 0,6% de la flota mundial se ha transformado en una potencia pesquera, ubicándose entre las cinco naciones de mayores capturas. A su vez, desde 2004 se ubica entre los siete países con mayores exportaciones pesqueras con una participación de 3,6% del total. En 2010 las exportaciones llegaron a US$3.577 millones. Asimismo, durante los últimos cinco años (2006-2010), el sector de pesca y acuicultura ha alcanzado una participación promedio anual de 5,0% sobre las exportaciones totales del país.
En 2010, Chile exportó sus productos pesqueros y acuícolas a 112 países. Los diez principales mercados abarcaron el 74% de las exportaciones, destacándose China, España, Japón y Estados Unidos como los destinos más importantes, que en conjunto representaron un 56% del monto total exportado.
El rol de esta industria es cada vez más relevante a la luz de los avances científicos relacionados con las propiedades nutricionales de los alimentos del mar y sus positivos efectos sobre la salud.
Fishing and fish farming Pesca y productos acuícolas

CHILE opportunitiesin Agribusiness
50
In 2010, fishing exports reached US$1,516 million of which frozen products, at US$545 million, accounted for 35.9%. Algae and by-products, at US$183 million, accounted for a further 12.1%, followed by canned products (US$135 million or 8.9%) and chilled products (US$63 million or 4.2%).
Fish farming
In recent years, Chile has emerged as a fish-farming power, with salmon accounting for 93% of the industry’s output. Prior to the crisis that affected the salmon industry as a result of an outbreak of the ISA virus, Chile was the world’s second largest producer after Norway.
In 2010, salmon exports reached US$2,059 million, down by 2% on 2009. A drop had been anticipated, due to lower output of Atlantic salmon, but this was mitigated by an increase in exports of Coho salmon, which rose by 1% to US$433 million, and by a 52% increase in trout exports.
Chile is, in addition, establishing an important international position as a producer of farmed scallops and mussels.
Los principales productos procesados para el mercado interno son harina y aceite de pescados los que se utilizan como base de la alimentación de la salmonicultura, seguidos por las conservas de mariscos y de jurel.
En 2010, las exportaciones de pesca extractiva alcanzaron US$1.516 millones, donde la línea de congelados representó un 35,9% equivalente a US$545 millones. Algas y subproductos registró un 12,1% con US$183 millones, Conservas un 8,9% con US$135 millones y Frescos refrigerados un 4,2% con US$63 millones.
Acuicultura
En los últimos años, Chile se transformó en una potencia acuícola, siendo el salmón el principal producto (93% del total de la producción acuícola nacional). Hasta antes de la crisis que afectó a la industria del salmón por la presencia del virus ISA, nuestro país era el segundo productor mundial después de Noruega.
En 2010 las exportaciones de salmón llegaron a US$2.059 millones lo que presentó una caída de 2% respecto de 2009. Si bien se esperaba una baja para 2010 -por la disminución del salmón atlántico-, ésta fue aminorada por el alza del salmón coho (anotó US$ 433 millones, un alza de 1%) y el fuerte incremento de las exportaciones de trucha (52%).
En otros subsectores acuícolas, Chile está tomando protagonismo internacional como productor de ostiones y choritos.

51
Fishing Exports, 2005-2010 (US$ thousand)
Exportaciones Sector Pesquero, 2005-2010(US$ miles de millones)
Source: Fishing Development Institute, IFOP (www.ifop.cl).
2005 2006 20092007 2008 2010
4,500,000
4,000,000
3,500,000
3,000,000
2,500,000
2,000,000
1,500,000
1,000,000
500,000
0
Opportunities
Chile’s natural conditions, characterized by clear, clean and cold waters, and the availability of resources and raw materials for feed, along with technological development and business entrepreneurship, have been decisive in the expansion of Chile’s fishing industry.
The main investment opportunities are in fish farming, which has advantages that include the quality of the country’s waters and the quantity of sites available along its long coastline. New species such as turbot and abalone could acquire greater importance.
Global demand for farmed fish is forecast to increase, reflecting particularly the rise in world population, volume limits on extractive fishing, the health benefits of consuming fish,
Oportunidades
Las condiciones geográficas naturales caracterizadas por aguas cristalinas no contaminadas y frías, además de la disponibilidad de recursos y de materias primas para la alimentación de las especies, así como el desarrollo de la tecnología e iniciativa empresarial, han sido determinantes para la expansión de la actividad pesquera en Chile.
Las principales oportunidades de inversión están en el sector acuícola, el que goza de ventajas, como la calidad de las aguas y cantidad de lugares disponibles a lo largo de la costa. Nuevas especies podrían tomar mayor importancia como el cultivo del turbot y abalón.
Las proyecciones para el mercado global de la acuicultura son crecientes y están especialmente basadas en el aumento de la

CHILE opportunitiesin Agribusiness
52
economic development and the trend towards healthy eating.
The long-term sustainability of extractive fishing, anchored in its sound legal framework, means that future investment is expected to be geared towards technological advances, the development of new products for human consumption and the environment.
población mundial, la limitación de volumen de la pesca extractiva, la correlación positiva entre consumo de pescado y salud, el desarrollo económico y las tendencias de alimentación sana.
Como la industria pesquera extractiva presenta un sólido marco legal que ha permitido la sustentabilidad a largo plazo, las inversiones futuras están pensadas hacia mejoras tecnológicas, en el desarrollo de nuevos productos de consumo humano y medioambiente.

53

CHILE opportunitiesin Agribusiness
54
Dairy industry Lácteos

55
Dairy industry Lácteos
Dairy industry Lácteos
The extensive pasture lands and rainy climate of the Bío-Bío, Araucanía, Los Ríos and Los Lagos Regions provide privileged conditions for the development of the dairy industry.
With over 3.7 million head of cattle and efficient milk producers, Chile has sufficient supply of milk to cover domestic consumption and, since 2001, the industry has increasingly been targeting export markets that today include Mexico, Venezuela, Peru, the United States, Syria, Cuba, Costa Rica, Guatemala, South Korea and Ecuador.
Chile has some 10,000 milk producers, with an output in 2010 of 2,500 million liters. Fluid milk is the country’s main dairy product (366 million liters in 2010), followed by yoghurt (198 million liters), powdered milk (82 million liters), cheese (64 million kilos), cream, butter and manjar. Per capita milk consumption reached 132 liters in 2010, up by 4.7% on the previous year.
Chile posee un entorno privilegiado en las regiones del Bío Bío, La Araucanía, Los Ríos y Los Lagos para el desarrollo de la industria láctea, debido a las grandes extensiones de praderas verdes y clima lluvioso.
El volumen de la masa ganadera, que supera los 3,7 millones de cabezas y la eficiencia de los productores de leche, ha permitido que Chile se autoabastezca de este producto. Incluso, en 2001 comenzó un sostenido proceso exportador que hoy abarca países como México, Venezuela, Perú, Estados Unidos, Siria, Cuba, Costa Rica, Guatemala, Corea del Sur y Ecuador.
La industria lechera chilena cuenta con alrededor de 10.000 productores, que en 2010 produjeron cerca de 2.500 millones de litros. La elaboración de productos lácteos está orientada principalmente a leche fluida (366 millones de litros producidos en 2010), yogurt (198 millones de litros), leche en polvo (82 millones de kilos), quesos (64 millones de kilos), cremas, mantequillas y manjar. El consumo anual de leche, en tanto, fue de 132 litros por habitante en 2010, un 4,7% superior al del año anterior.
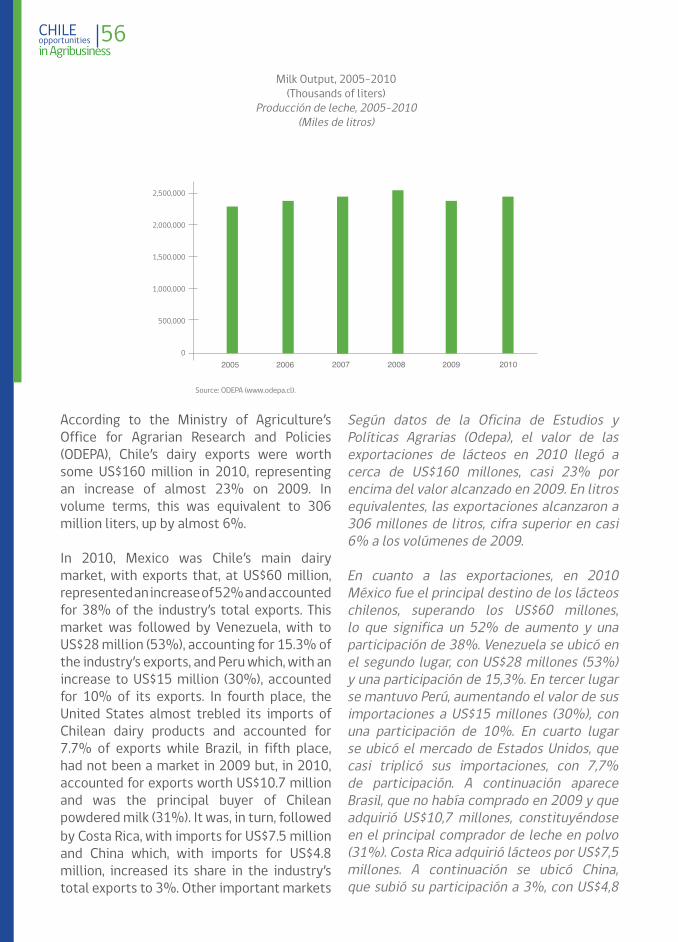
CHILE opportunitiesin Agribusiness
56
Milk Output, 2005-2010 (Thousands of liters)
Producción de leche, 2005-2010(Miles de litros)
Source: ODEPA (www.odepa.cl).
2005 2006 20092007 2008 2010
2,500,000
2,000,000
1,500,000
1,000,000
500,000
0
According to the Ministry of Agriculture’s Office for Agrarian Research and Policies (ODEPA), Chile’s dairy exports were worth some US$160 million in 2010, representing an increase of almost 23% on 2009. In volume terms, this was equivalent to 306 million liters, up by almost 6%.
In 2010, Mexico was Chile’s main dairy market, with exports that, at US$60 million, represented an increase of 52% and accounted for 38% of the industry’s total exports. This market was followed by Venezuela, with to US$28 million (53%), accounting for 15.3% of the industry’s exports, and Peru which, with an increase to US$15 million (30%), accounted for 10% of its exports. In fourth place, the United States almost trebled its imports of Chilean dairy products and accounted for 7.7% of exports while Brazil, in fifth place, had not been a market in 2009 but, in 2010, accounted for exports worth US$10.7 million and was the principal buyer of Chilean powdered milk (31%). It was, in turn, followed by Costa Rica, with imports for US$7.5 million and China which, with imports for US$4.8 million, increased its share in the industry’s total exports to 3%. Other important markets
Según datos de la Oficina de Estudios y Políticas Agrarias (Odepa), el valor de las exportaciones de lácteos en 2010 llegó a cerca de US$160 millones, casi 23% por encima del valor alcanzado en 2009. En litros equivalentes, las exportaciones alcanzaron a 306 millones de litros, cifra superior en casi 6% a los volúmenes de 2009.
En cuanto a las exportaciones, en 2010 México fue el principal destino de los lácteos chilenos, superando los US$60 millones, lo que significa un 52% de aumento y una participación de 38%. Venezuela se ubicó en el segundo lugar, con US$28 millones (53%) y una participación de 15,3%. En tercer lugar se mantuvo Perú, aumentando el valor de sus importaciones a US$15 millones (30%), con una participación de 10%. En cuarto lugar se ubicó el mercado de Estados Unidos, que casi triplicó sus importaciones, con 7,7% de participación. A continuación aparece Brasil, que no había comprado en 2009 y que adquirió US$10,7 millones, constituyéndose en el principal comprador de leche en polvo (31%). Costa Rica adquirió lácteos por US$7,5 millones. A continuación se ubicó China, que subió su participación a 3%, con US$4,8

57
for Chilean dairy products which, according to ODEPA, were exported to some 30 countries in 2010, included Cuba, Ecuador and Algeria.
Opportunities
Since Chile’s potential milk output well exceeds the needs of the domestic market, the dairy industry as a whole has identified exports as the main vehicle for its long-term growth and development.
Although consumption of dairy products has held relatively steady, lower-income sectors of the population are incorporating new products into their diet, leading to a significant increase in demand for these foods.
As well as supplying domestic demand, Chile needs to penetrate new markets such as Japan, Russia and Algeria with a broad range of high-quality products - particularly different types of cheese, full-fat and skimmed powdered milk and condensed milk - that are in line with current requirements for a healthier diet.
There is room for efficiency gains to bring transformation costs into line with international parameters; this is an area in which research and innovation are crucial.
millones. Otros importadores relevantes fueron Cuba, Ecuador y Argelia. En términos generales, en 2010 se enviaron lácteos chilenos a treinta países, según Odepa.
Oportunidades
Dado que el potencial de producción de leche supera con creces las posibilidades de consumo interno, el sector lácteo en su conjunto ha definido que la principal vía de desarrollo y crecimiento para el largo plazo apunta a fortalecer su participación en los mercados externos.
Pese a que se observa cierta estabilidad en el consumo de productos lácteos, segmentos de menores ingresos están incorporando a su dieta alimenticia nuevos productos, aumentando en forma significativa la demanda.
Además de satisfacer la demanda interna, Chile tiene que abrirse a otros mercados como Japón, Rusia y Argelia, con una gran variedad de productos de calidad -entre los que destacan los quesos en sus diversas variedades, leches en polvo, enteras y descremadas, y condensadas- que respondan a los actuales requerimientos de una alimentación más saludable.
Existen espacios de mejora en la eficiencia en los costos de transformación, de manera de hacerlos homólogos a la realidad internacional. Para esto la investigación e innovación constituyen pilares fundamentales.

CHILE opportunitiesin Agribusiness
58
Olive oil industry
Olivícola

59
Olive oil industry Olivícola
Chile already has an established international reputation as a producer of extra-virgin olive oil. A total of some 29 countries produce olive oil, with an output of over 3 million tonnes in 2010 while, according to ChileOliva, the industry association, Chile produced 12,000 tonnes in 2010, up by 41% from an output of 8,500 tonnes in 2009. Olive plantations, located mainly between Copiapó in the Atacama Region and Talca in the Maule Region, now cover 24,000 hectares, up four-fold on 2006, and are projected to reach 33,000 hectares by 2020.
Chile has competitive advantages for the production of extra-virgin olive oil that include natural characteristics such as climate and soils and its exceptional phytosanitary conditions. Domestic consumption has also increased in recent years in response to information campaigns about olive oil’s nutritive and taste properties and, in 2010, is estimated to have reached around 568 grams per capita, up by some 30% on the previous year.
Chile ya tiene un prestigio ganado entre los productores mundiales de aceite de oliva extra virgen. Existen alrededor de 29 países productores de aceite de oliva que en 2010 superaron las 3 millones de toneladas. Según cifras de ChileOliva, el país produjo 12.000 toneladas durante 2010, cerca de un 41% más que las 8.500 toneladas del año 2009. Geográficamente, las plantaciones de olivo en Chile, ubicadas entre Copiapó y Talca en su mayoría, suman 24.000 hectáreas plantadas, cuatro veces las existentes en 2006, y con proyecciones de llegar a las 33.000 en 2020.
Chile presenta ventajas para la producción de aceite de oliva extra virgen, dentro de las que destacan sus características naturales como clima y suelo, y condiciones fitosanitarias de excepción. En términos de consumo local, éste ha experimentado un aumento en los últimos años, debido a la promoción de sus características nutritivas y sensoriales. El consumo per cápita estimado para el año 2010 fue de alrededor 568 gramos por persona, lo que representa un aumento del 30% con respecto al consumo estimado del año anterior.
Source: ChileOliva (www.chileoliva.cl).
Hect
ares
2006
5,000
10,000
15,000
20,000
25,000
30,000
35,000
40,000
20122007 20132010 2016 20192008 20142009 2015 20182011 2017 2020
Estimates and Projections of Area under Olives for Oil Production in Chile, 2006-2020(Thousands of liters)
Estimaciones y Proyecciónes de la Superficie Plantada de Olivos en Chile para la producción de Aceite de Oliva, 2006-2020(Miles de litros)

CHILE opportunitiesin Agribusiness
60
Chile’s exports of olive oil have shown an important increase in recent years. In 2010, exports for US$12,390,680 corresponded to a volume of 3,057 tonnes, up by 58% on the previous year. Out of this total, 36% corresponded to extra-virgin bottled oil while 64% corresponded to bulk extra-virgin oil.
Opportunities
A Mediterranean climate with a dry spring and summer and a temperate autumn and winter favors the production of foods with a high content of polyphenols.
Areas exist that are suitable for the cultivation of almost all known olive varieties.
Unlike other food industries, the olive oil industry has been able to draw on technology and know-how from the fruit industry. Moreover, the olive harvest begins when the fruit harvest is ending, enabling olive oil producers to take advantage of the fruit industry’s specialized labor and its infrastructure and machinery (such as storage facilities, trucks and deposits).
Olive oil consumption has shown a marked increase along with opportunities for the export of gourmet products, with an important value-added component, that can command higher prices.
Las exportaciones de aceite de oliva, en tanto, han presentado un incremento considerable en los últimos años. Durante el año 2010 se exportaron US$ 12.390.680, correspondientes a 3.057 toneladas de aceite de oliva, lo que constituye un aumento en volumen del 58% con respecto al año anterior. Del volumen exportado el 36% corresponde a aceite de oliva extra virgen embotellado y el 64% a aceite de oliva extra virgen a granel.
Oportunidades
Clima mediterráneo con primavera y veranos secos, otoño e inviernos templados, favorecen la producción de alimentos con alto contenido de polifenoles.
Existen diferentes zonas para la adaptación de casi todas las variedades de olivos existentes.
A diferencia de otras industrias de alimentos, la producción de aceite de oliva en Chile se beneficia de la tecnología y know how de la fruticultura, ya que cuando termina la temporada de frutas comienza la del olivo. Por ende, se aprovecha la mano de obra especializada y el uso de infraestructura y maquinarias (bodegas, camiones, cubas, etc).
El consumo de aceite de oliva ha experimentado una notoria alza, así como las posibilidades de exportación de productos gourmet, con valor agregado, que permiten obtener mejores precios.

61

CHILE opportunitiesin Agribusiness
62
Meat Production
Carnes

63
Chile: Domestic Meat Consumption (Tonnes, carcass weight)
Consumo interno (Ton. Vara)
553,687364,543379,909223,235319,263345,01010,17419,928
952,716 1,263,033
Poultry*Pork
OthersBeef
Total
20101998
Meat ProductionCarnes
Chile’s meat output of 1,332,482 tonnes in 2010 represented an increase of 9.5% on 2005. Poultry accounted for 45% of total output, followed by pork (38%) and beef (16%) while the remaining 1% corresponded to other meats.
Most of the meat produced in Chile is for domestic consumption which reached a record 81.9 kilos per capita in 2010.
Durante 2010, la producción de carnes a nivel nacional alcanzó a 1.332.482 toneladas, un 9,5% superior a la producción total que el país registraba en 2005. Del total anual, un 45% correspondió a carnes de ave, un 38% a carne de cerdo, un 16% a carne de bovinos y el 1% restante corresponde a otras carnes.
La mayor parte de esta producción se destina al consumo interno, el que durante 2010 llegó a 81,9 kilos per cápita, la mayor cifra histórica.
Sources: Chilean Association of Poultry Producers, APA (www.apa.cl) and Chilean Association of Pork Producers, ASPROCER (www.asprocer.cl).
Sources: Chilean Association of Poultry Producers, APA (www.apa.cl) and Chilean Association of Pork Producers, ASPROCER (www.asprocer.cl).
Chile: Meat Output, 2010Producción de carnes chilenas, 2010
498,77289,884
498,300210,294
35,2321,332,482
Chicken
Pork
Others
Turkey
Beef
Total
Tonnes (carcass weight)
* Includes chicken, turkey and other poultry.
Animal
Type

CHILE opportunitiesin Agribusiness
64
However, over the past decade, Chile has consolidated a position as a poultry and pork exporter and, more recently, has also begun to export beef, lamb and mutton.
Chile’s natural resources and excellent zoosanitary standards as well as technological progress and tariff advantages under the country’s trade agreements have served as a catalyst for the development of the country’s meat exports and underpin the industry’s promising prospects.
Poultry
In 2010, Chile produced 588,656 tonnes of poultry meat (84.7% corresponding to broiler chicken and 15.3% to turkey). This represented a drop of 1.3% on the previous year, although output has increased by over 50% in the past ten years. According to the Chilean Association of Poultry Producers (APA), this increase primarily reflects the industry’s investments in technology, production processes and training, with a particular emphasis on issues related to animal health and food safety, traceability, animal welfare and environmental sustainability. Over the past five years, the industry has, in fact, invested over US$300 million, achieving a
Sin embargo, en la última década se ha consolidado el desarrollo exportador de aves y cerdos y más recientemente se está iniciando el proceso de internacionalización de las carnes bovinas y ovinas.
La calidad de los recursos naturales, las excelentes condiciones zoosanitarias del país, así como los avances alcanzados en materia de desarrollo tecnológico y los beneficios arancelarios producto de los acuerdos comerciales suscritos por Chile, se han traducido en un factor dinamizador de las exportaciones de carne, entregando a esta industria una auspiciosa proyección de desarrollo en los próximos años.
Aves
En 2010, Chile produjo 588.656 toneladas de carne de ave (84,7% pollo broiler y 15,3% pavo), lo que representó una disminución de 1,3% respecto al año anterior. En la última década la producción ha tenido un crecimiento de más de 50%. Según la Asociación de Productores Avícolas, este crecimiento se debe fundamentalmente a que la industria avícola nacional invierte en tecnología, procesos productivos y capacitación, con especial preocupación por los temas relacionados con la sanidad animal
* Includes chicken and turkey.
Chile: Meat Exports, 2010Exportación de carnes chilenas, 2010
108,555
131,765
6,337
Poultry*
Beef
Pork
TonnesMeat
Sources: Chilean Association of Poultry Producers, APA (www.apa.cl) and Chilean Association of Pork Producers, ASPROCER (www.asprocer.cl).

65
e inocuidad, trazabilidad, bienestar animal y sustentabilidad ambiental. De hecho, en los últimos cinco años se han invertido montos superiores a los US$300 millones, logrando así un alto nivel tecnológico y de eficiencia productiva.
Actualmente el 81,8% de la producción de aves está destinada al consumo interno, que en 2010 alcanzó a 33,3 kg, un 4,4% más que en 2009.
high level of technology and efficiency in production.
At present, 81.8% of Chile’s poultry output goes to the domestic market where per capita consumption reached 33.3 kilos in 2010, up by 4.4% on the previous year.
Chile: Poultry Industry, 2010(Tonnes, carcass weight)
Caracterización industria avícola nacional, 2010
89,884498,77225,65682,89966,241482,630
OutputExportsDomestic consumption
TurkeyMarket Chicken
In 2010, Chile’s net exports of chicken and turkey reached 108,555 tonnes, with a value of US$263 million.
According to APA, the industry seeks to supply demanding international markets by offering products with greater value-added, emphasizing quality rather than quantity.
Las exportaciones de pollo y pavo en 2010 alcanzaron las 108.555 toneladas netas, por un valor de US$263 millones. De acuerdo a la Asociación de Productores Avícolas, este proyecto exportador está orientado a satisfacer mercados internacionales con altos niveles de exigencia, elaborando productos con mayor valor agregado, para privilegiar la calidad por sobre el volumen.
Sources: Chilean Association of Poultry Producers, APA (www.apa.cl) and Chilean Association of Pork Producers, ASPROCER (www.asprocer.cl).
(Ton. Vara)

CHILE opportunitiesin Agribusiness
66
The industry’s principal poultry export markets were Mexico, Hong Kong and Germany.
Pork
In 2010, Chile produced 498,324 carcass-weight tonnes of pork, representing a drop of 3% on the previous year. In the past decade, however, pork production has doubled. At present, the domestic market accounts for 76.2% of output and, in 2010, per capita consumption reached 24.4 kilos, up by 1.7% on the previous year.
Los principales destinos de las exportaciones de ave fueron México, Hong Kong y Alemania.
Porcino
En 2010 se produjeron en Chile 498.324 toneladas de cerdo en vara, lo que representó un descenso de 3% respecto a 2009. Este volumen duplica la producción observada hace diez años. Actualmente el 76,2% de la producción de carne de cerdo se destina al consumo nacional, el que alcanzó en 2010 los 24,4 kg por habitante, un 1,7% más que en 2009.
Chile: Pork Industry, 2010(Tonnes, carcass weight)
Caracterización industria porcina nacional, 2010(Ton. Vara)
498,324
131,765
379,909
Output
Domestic consumption
Exports
Poultry Exports, 2000-2010 (tonnes, carcass weight)
Evolución de las exportaciones de ave, 2000-2010 (Ton. Vara)
2000 2001 20042002 2003 2005 2006 2007 2008 2009 2010
160,000
140,000
120,000
100,000
80,000
60,000
40,000
20,000
0
Sources: Chilean Association of Poultry Producers, APA (www.apa.cl) and Chilean Association of Pork Producers, ASPROCER (www.asprocer.cl).
Sources: Chilean Association of Poultry Producers, APA (www.apa.cl) and Chilean Association of Pork Producers, ASPROCER (www.asprocer.cl).

67
Chile’s pork exports were worth US$357 million in 2010 and went principally to Japan (42.4%) and South Korea (29.6%) while other important markets were Germany, Peru, the United Kingdom, Italy and the United States.
Beef, mutton and lamb
Chile has long had a beef deficit and has, therefore, been a net importer. This situation persists, despite an increase in both production and exports.
Chile has some 3.3 million head of beef cattle, mostly in the Los Lagos Region (27.9%), the Araucanía Region (17.9%) and the Los Ríos Region (16.6%).
The breeds of cattle traditionally used in Chile for meat production are Clavel Alemán and Ovejero Negro. Other high-quality breeds that have adapted to conditions in the south of Chile are Red and Black Angus, Hereford, Limousin, Charolais and, mostly recently, Wagyu, a breed whose meat is particularly popular in Japan.
Las exportaciones de cerdo, en tanto, alcanzaron en 2010 un valor de US$ 357 millones. Los principales compradores son Japón (42,4%) y Corea del Sur (29,6%). Otros destinos relevantes son Alemania, Perú, Reino Unido, Italia y EE.UU.
Bovinos y ovinos
Chile ha sido por mucho tiempo un país deficitario en carnes de bovino y por lo tanto, un importador neto de dicho alimento, situación que continua en la actualidad, pese al aumento que se ha registrado tanto en la producción como en la exportación.
La ganadería bovina chilena cuenta con alrededor de 3,3 millones de cabezas, que se concentran principalmente en las regiones de Los Lagos (27,9%), La Araucanía (17,9%) y Los Ríos (16,6%).
Tradicionalmente las razas bovinas que se han utilizado en la producción de carne en Chile son el Clavel Alemán y el Ovejero Negro. Otras razas de grandes cualidades que también se han adaptado a las condiciones agroecológicas del sur del país son el Angus Rojo y el Negro, el Hereford, el Limousine, el Charolais y últimamente el Wagyu, una raza muy apetecida en Japón.
2005 2006 2007 2008 2009 2010
160,000
140,000
120,000
100,000
80,000
60,000
40,000
20,000
0
Pork Exports, 2005-2010 (Tonnes, carcass weight)
Exportación de Carne de Cerdo, 2005-2010 (Ton. Vara)
Sources: Chilean Association of Poultry Producers, APA (www.apa.cl) and Chilean Association of Pork Producers, ASPROCER (www.asprocer.cl).

CHILE opportunitiesin Agribusiness
68
Chile: Beef Industry, 2010(Tonnes, carcass weight)
Caracterización industria bovina nacional, 2010(Ton. Vara)
210,294
6,337
319,264
Output
Domestic consumption
Exports
In 2010, Chile’s beef output reached 210,294 carcass-weight tonnes while exports, at 6,227 carcass-weight tonnes, were worth US$39 million, accounting for 3.0% of output. Domestic per capita consumption increased by 5.4% on the previous year to 23.6 kilos.
In 2010, Chile’s main beef markets, ranked according to the value of exports, were Germany (32.4%), the United States (17.1%), Venezuela (17.1%), the United Kingdom (9.0%), Spain (5.3%), Israel (5.0%) and Holland (3.0%) but also included some 20 other markets.
Chile has some 3.9 million head of sheep, located principally in the Magallanes Region (56.7%). In 2010, its mutton and lamb output reached 10,519 tonnes of which 6,827 tonnes were exported. This is not only a significant amount but also represents a growth opportunity for the sector in a context in which annual per capita consumption in Chile reaches only 0.2 kilos. The main markets by value of exports were Spain (37.8%), Holland (9.3%), Denmark (8.9%), the United Kingdom (8.8%), Israel (7.6%), France (6.1%) and Sweden (5.7%) as well as a dozen other smaller markets.
La producción de carne de bovino en 2010 fue de 210.294 toneladas vara, en tanto que las exportaciones alcanzaron las 6.227 toneladas vara, por un valor de US$39 millones, representando un 3,0% de la producción nacional del período. El consumo per cápita aparente de carne bovina en el 2010 fue de 23,6 kilogramos. Esta cifra es 5,4% mayor que en 2009.
En 2010 los principales compradores de carne bovina nacional, de acuerdo al valor exportado, fueron Alemania (32,4%), EE.UU. (17,1%), Venezuela (17,1%), Reino Unido (9,0%), España (5,3%), Israel (5,0%), y Holanda (3,0%), existiendo una veintena de países más.
La ganadería ovina, en tanto, cuenta en el país con alrededor de 3,9 millones de cabezas, concentradas principalmente en la región de Magallanes (56,7%). La producción de carne ovina del país sumó 10.519 toneladas en 2010, de las cuales 6.827 toneladas fueron al exterior, lo que es relevante y representa una oportunidad de crecimiento para el sector, tomando en cuenta que el consumo por habitante en Chile alcanza sólo a los 0,2 kg. Los principales países de destino en cuanto a valor exportado fueron España (37,8%), Holanda (9,3%), Dinamarca (8,9%), Reino Unido (8,8%), Israel (7,6%), Francia (6,1%) y Suecia (5,7%), listado al que se suma una docena de naciones más.
Sources: Chilean Association of Poultry Producers, APA (www.apa.cl) and Chilean Association of Pork Producers, ASPROCER (www.asprocer.cl).

69
Opportunities
An important market has developed for pork by-products for human consumption as well as for industrial use (for example, gelatin or suede) and medical use (for example, valves for cardiovascular surgery). Poultry by-products are used mainly for human consumption in the production of fresh and processed foods, although they also have pharmacological applications that include the manufacture of vaccines and antibodies.
Chile is still a small player in the international pork market, but has focused on high-quality products.
In order to be able to export red meats, quality control systems have been installed throughout the export process to provide the assurances required by the most demanding countries.
Chile has introduced Wagyu cattle whose meat is in ever greater demand.
Demand for mutton and lamb is showing a sustained increase and France and Germany, which are among the world’s main consumers, are unable to satisfy domestic demand. Demand in other countries, such as China, South Korea and Japan, has also risen steadily.
Chile has the capacity to double its exports of mutton and lamb so as to take advantage of short supply from Australia and New Zealand, which are giving priority to the use of land for wine and milk production.
Oportunidades
Un importante mercado se ha abierto para los derivados del cerdo, ya sea para consumo humano, aplicaciones industriales (por ejemplo gelatina o gamuza) o medicinales (por ejemplo válvulas para cirugías cardiovasculares). Los derivados de aves son principalmente utilizados para consumo humano en la producción de alimentos frescos y procesados, aunque también se dispone de ellos para usos farmacológicos, en la producción de vacunas y anticuerpos, entre otros.
Chile es aún un actor pequeño a nivel global en la producción de cerdo, pero se ha enfocado en productos de alta calidad.
El proceso exportador de carnes rojas ha exigido a Chile contar con un sistema de aseguramiento de la calidad a lo largo de la cadena exportadora, capaz de dar garantías a los países más exigentes.
En Chile se introdujo la raza japonesa Wagyu dentro de la producción cárnica, que ha alcanzado gran demanda. La demanda por carne ovina está en constante aumento. Francia y Alemania, grandes consumidores, no logran autoabastecerse. A su vez, otros países como China, Corea y Japón han registrado un alza sostenida en la demanda..
Chile puede duplicar los volúmenes de exportación de carne ovina a fin de aprovechar la escasez de oferta por parte de Australia y Nueva Zelanda, países que están privilegiando sus campos para la producción de vinos y de leche.

CHILE opportunitiesin Agribusiness
70
Foreign Direct Investment in Agribusiness
Inversión Extranjera Directa en Agronegocios

71
Foreign Direct Investment in Agribusiness
Inversión Extranjera Directa en Agronegocios
Foreign Direct Investment in AgribusinessInversión Extranjera Directa en Agronegocios
Between 1974 and 2010, foreign direct investment (FDI) worth US$3,067 million was materialized in Chile’s agribusiness sector through the D.L. 600 Foreign Investment Statute, representing 4% of total gross inflows during this period. In net terms, investment in agribusiness reached US$2,104 million, accounting for 4.3% of total net FDI through D.L. 600.
The food, beverages and tobacco industries accounted for 71.0% of materialized foreign investment in the sector, followed by the fishing, fish farming and fish processing industries (20.1%) and agriculture and hunting (8.9%).
Entre 1974 y 2010, la inversión extranjera materializada a través del D.L. 600 en agronegocios alcanzó los US$3.067 millones, lo que representa un 4% del total de los ingresos brutos. Por su parte, la inversión neta en agronegocios alcanzó los US$2.104 millones, representando un 4,3% del total de inversión neta a través del D.L 600.
El 71% de la inversión extranjera materializada en esta área se destinó a la industria de Alimentos, bebidas y tabaco; el 20,1% a la Pesca, acuicultura e industria pesquera y el 8,9% a Agricultura y caza.
Source: Foreign Investment Committee (www.foreigninvestment.cl).
Fishing, fish farming & fish processing
20.1%
Agriculture & hunting8.9%
Foods, beverages & tobacco71.0%
Materialized FDI in Agribusiness, 1974-2010Total : US$3,067 million
IED materializada en agroindustria, 1974-2010Total: US$3.067 millones

CHILE opportunitiesin Agribusiness
72
Source: Foreign Investment Committee (www.foreigninvestment.cl).
Milling, bakery & confectionery 17.5%
Others 12.0%
Processed foods11.3%
Dairy products5.8%
Tobacco2.1%
Soft drinks, wines and liquors51.3%
Materialized FDI in the Food Industry, 1974-2010Total : US$2,178 million
IED materializada en la industria de alimentos, 1974-2010Total : US$2.178 millones
FDI in the food industry
Materialized FDI in the food industry reached US$2,178 million between 1974 and 2010. The soft drinks, wine and liquor industries accounted for 51.3% of this total, with investors that included Coca-Cola and Quilmes as well as wine producers such as Baron Philippe de Rothschild, Miguel Torres, Sogrape and Marnier.
These were followed by the milling, bakery and confectionery industries (17.5%), with investors that included South Africa’s Tiger Brands in Carozzi and Argentina’s Accor, while the processed food industry accounted for 11.3%, including investors such as Nestlé, BENEO-Orafti, Mexico’s CLC Group and Tricamp Lácteos with Danone. In addition, Brazil’s Camil Alimentos made an important investment, acquiring control of Empresas Tucapel, a producer of rice, pulses and olive oil.
IED en la industria de alimentos
La inversión extranjera materializada en la industria de alimentos alcanzó los US$2.178 millones entre 1974 y 2010. Se concentró básicamente en la industria de bebidas, vinos y licores (51,3% del total de IED en el sector) y la presencia de inversionistas como Coca Cola y Quilmes, además de viñas como Baron Philippe de Rothschild, Miguel Torres, Sogrape y Marnier.
En segundo lugar se ubicó el subsector de molinería, panadería y confitería (17,5%), con la presencia de inversionistas como la sudafricana Tiger Brandsen Carozzi y la argentina Arcor, entre otros. El 11,3% correspondió a alimentos procesados, con la presencia de empresas como Nestlé, BeneoOrafti, Grupo CLC de México y Tricamp Lácteos con Danone. Asimismo, destacó la inversión de la compañía brasileña Camil Alimentos, que tomó control de Empresas Tucapel, dedicada al negocio arrocero, de legumbres y aceite de oliva.

73
Source: Foreign Investment Committee (www.foreigninvestment.cl).
United States40.6%
Belgium11.4%
Netherlands11.3%
Argentina8.8%
Spain5.1%
France 4.4%
Italy3.5%
South Africa3.2%
Materialized FDI in the Food Industry, 1974-2010Breakdown by country of origin
IED Materializada en la industria de alimentos, 1974-2010Distribución según país de origen
La inversión extranjera en esta industria proviene principalmente de Estados Unidos (40,6%), Bélgica (11,4%), Países Bajos (11,3%) y Argentina (8,8%).
Respecto a la distribución geográfica, el 58,7% de la inversión se materializó en la Región Metropolitana; el 15% se destinó a proyectos multi-regionales; el 13% a la Región del Bío-Bío y el 9,4% a la de O’Higgins.
FDI in the food industry came mainly from the United States (40.6%), Belgium (11.4%), Netherlands (11.3%) and Argentina (8.8%).
The Santiago Region accounted for 58.7% of materialized investment in the food industry while multi-region projects represented 15.0%, followed by the Bío-Bío Region (13.0%) and the O’Higgins Region (9.4%).
Others 11.7%

CHILE opportunitiesin Agribusiness
74
Source: Foreign Investment Committee (www.foreigninvestment.cl).
Multi-region15.0%
Bío-Bío13.0%
Santiago58.7%
O’Higgins9.4%
Los Lagos1.2%
Maule1.2%
Valparaíso 1.2%Others0.3%
Materialized FDI in the Food Industry, 1974-2010Breakdown by region
IED Materializada en la industria de alimentos, 1974-2010Distribución según región de destino
IED en pesca, acuicultura e industria pesquera
Entre 1974 y 2010, la inversión extranjera materializada en pesca, acuicultura e industria pesquera alcanzó los US$616 millones, concentrándose principalmente en la industria pesquera (48,2%) y en piscicultura (42,0%).
FDI in fishing, fish farming and fish processing
Between 1974 and 2010, FDI worth US$616 million was materialized in the fishing, fish farming and fish processing industries. The latter accounted for 48.2% of the total while fish farming accounted for 42.0%.

75
Materialized FDI in Fishing, Fish Farming & Fish Processing, 1974-2010Breakdown by country of origin
IED Materializada en Pesca, acuicultura e industria pesquera, 1974-2010Distribución según país de origen
Source: Foreign Investment Committee (www.foreigninvestment.cl).
Norway39.1%
Japan17.4%
Spain5.3%
Canada4.8%
United States3.1% Others
7.8%
South Africa7.2%
New Zealand2.0%
Finland13.3%
Source: Foreign Investment Committee (www.foreigninvestment.cl).
Fish processing48.2%
Fishing farming42.0%
Other aquaculture2.5%
Fishing7.3%
Materialized FDI in Fishing, Fish Farming and Fish Processing, 1974-2010Total : US$616 million
IED materializada en Pesca, Acuicultura e Industria Pesquera, 1974 – 2010Total: US$616 millones
El 39,1% de la inversión extranjera en este sector proviene de Noruega, en tanto que el 17,4% lo hace de Japón y el 13,3% de Finlandia.
Investment in these industries was led by Norway (39.1%), followed by Japan (17.4%) and Finland (13.3%).

CHILE opportunitiesin Agribusiness
76
En tanto, el 44,7% de la inversión extranjera en Pesca, acuicultura e industria pesquera se concentró en la Región de Los Lagos y el 27% se destinó a proyectos multi-regionales.
Además de la presencia de importantes empresas de salmonicultura a nivel internacionalcomo Marine Harvest y Nutreco, en este sector destacan la japonesa Nippon Suisan, la noruega Vedde y la española Pescanova, que se dedica al cultivo de más de 30 especies marinas y su exportación en 200 presentaciones distintas a 38 países de todo el mundo. En otro plano, resalta la colombiana Inversiones Manuelita en la sociedad Mejillones América, que se dedica al cultivo de choritos en la región de Los Lagos, la empresa Cultivos Marinos Internacionales dedicada al cultivo en el mar de Abalón japonés y Ostión del norte, entre otras especies.
The Los Lagos Region accounted for 44.7% of FDI in fishing, fish farming and fish processing while multi-region projects represented a further 27.0%.
As well as important international salmon producers such as Marine Harvest and Nutreco, investors in this sector include Japan’s Nippon Suisan, Norway’s Vedde and Spain’s Pescanova, which farms over 30 species and exports them in 200 different forms to 38 countries, while Colombia’s Inversiones Manuelita through Mejillones América has developed a mussel-farming project in the Los Lagos Region and Cultivos Marinos Internacionales farms species that include Japanese abalone and the northern scallop.
Source: Foreign Investment Committee (www.foreigninvestment.cl).
Magallanes5.2%
Tarapacá4.9%
Atacama2.7%
Aysén4.9%
Materialized FDI in Fishing, Fish Farming & Fish Processing, 1974-2010Breakdown by region
IED Materializada en pesca, acuicultura e industria pesquera, 1974-2010Distribución según región de destino
Los Lagos44.7%
Multi-region27.0%
Bío-Bío6.5%
Others 4.5%

77
IED en agricultura
La inversión extranjera en el sector de agricultura alcanzó los US$272 millones, entre 1974 y 2010. Estos se concentraron principalmente en fruticultura, viñas y parronales (45,1%) y en otros cultivos agrícolas (44,9%).
Estados Unidos es el principal inversionista extranjero en agricultura, concentrando un 32,6% del total de inversión extranjera en este sector y con la presencia de inversionistas como Cran Chile, que se dedica al cultivo de arándanos, Cargill, y Sakata Seed, en la producción y comercialización de granos y semillas, entre otras. En segundo lugar se sitúa Luxemburgo (12,3%), en tercero Alemania (10%) y en cuarto Nueva Zelandia (8,2%).
FDI in agriculture
FDI in the agricultural sector reached US$272 million between 1974 and 2010 and was mostly in fruit farming, vineyards and grape growing (45.1%) and other crops (44.9%).
The United States was the principal source of FDI in agriculture, accounting for 32.6% of the total, with investors such as the Cran Chile cranberry grower and Cargill and Sakata Seed in grain and seed production and marketing. The United States was followed by Luxembourg (12.3%), Germany (10.0%) and New Zealand (8.2%).
Source: Foreign Investment Committee (www.foreigninvestment.cl).
Other crops44.9%
Agricultural services
1.3%Animal
husbandry2.5%
Fruit farming, vineyards & grape growing
45.1%
Seed production6.2%
Materialized FDI in Agriculture, 1974-2010Total : US$272 million
IED materializada en Agricultura, 1974 – 2010Total: US$272 millones

CHILE opportunitiesin Agribusiness
78
Materialized FDI in Agriculture, 1974-2010Breakdown by country of origin
IED Materializada en Agricultura, 1974-2010Distribución según país de origen
Source: Foreign Investment Committee (www.foreigninvestment.cl).
Japan2.9%
United States32.6%
Others 16.9%
Switzerland3.1%
Luxembourg12.3%
Germany10.0%
New Zealand8.2%
United Kingdom6.1%%
Panama4.6%
Canada3.3%
Respecto a la distribución geográfica, el 25,7% de la inversión extranjera en agricultura se destinó a proyectos multi-regionales, en tanto que el 19,3% se concentró en la Región de Los Lagos y el 18,0% en la Región Metropolitana.
Multi-region projects accounted for 25.7% of FDI in agriculture while the Los Lagos Region accounted for 19.3% and the Santiago Region for 18.0%.

79
Source: Foreign Investment Committee (www.foreigninvestment.cl)
Materialized FDI in Agriculture, 1974-2010Breakdown by region
IED Materializada en Agricultura, 1974-2010Distribución según región de destino
Others 10.1%
Multi-region25.7%
Valparaíso5.4%
Los Lagos19.3%
Santiago18.0%
O’Higgins8.6%
Maule7.3%
Los Ríos5.6%

Ministry of Agriculturewww.minagri.gob.clTeatinos 40, Santiago(56-2) 393 5000
Office for Agrarian Research and Policies (ODEPA)www.odepa.gob.clTeatinos 40, 8th floor, Santiago (56-2) 397 3000
Central Bank of Chilewww.bcentral.clAgustinas 1180, Santiago(56-2) 670 2000
Agricultural Inspection Service (SAG)www.sag.gob.clAv. Presidente Bulnes 140, Santiago(56-2) 345 1111
Chilean Association of Food Companies (Chilealimentos)www.chilealimentos.comAv. Andrés Bello 2777, 1st floorLas Condes, Santiago (56-2) 203 3770
National Agricultural Society (SNA)www.sna.clTenderini 187, Santiago(56-2) 585 3300
Dairy Exporters Association www.exporlacchile.clAv. El Bosque Sur 73 B Las Condes, Santiago(56-2) 251 5775
National Federation of Milk Producers (FEDELECHE) www.fedeleche.clTenderini 187, Santiago(56-2) 632 9473
Osorno Milk Producers’ Association (APROLECHE)www.aproleche.clCésar Ercilla S/N, Recinto Sago, Osorno(56-64) 200 350
Chilean Salmon Industry Association (SalmonChile)www.salmonchile.clFélix de Amesti 124, 6th floorLas Condes, Santiago (56-2) 228 0880
National Fisheries Association (SONAPESCA) www.sonapesca.clBarros Errázuriz 1954, Office 206 Providencia, Santiago (56-2) 269 2533
Bío-Bío Industrial Fisheries Association (ASIPES)www.asipes.clO’Higgins 940, Office 804Concepción, Bío-Bío Region(56-41) 224 3487
Chilean Association of Poultry Producers (APA) www.apa.clIsidora Goyenechea 2939, Office 701 Las Condes, Santiago (56-2) 231 3939
Chilean Association of Pork Producers (ASPROCER)www.asprocer.clIsidora Goyenechea 2939, Office 701 Santiago(56-2) 231 3939
Chilean Meat Associationwww.achic.clAv. Bulnes 216, Office 301, Santiago(56-2) 698 1529
Contacts in Chile and Sources of Information Contactos y fuentes de información

Chilean Association of Wagyu Producerswww.wagyu.clAv. Luis Pasteur 5280, Office 304 Vitacura, Santiago (56-2) 218 4277
Sheep Farming Consortiumwww.consorcioovino.cl
Chilean Association of Meat Processing and Refrigeration Plants www.faenacar.clAv. Libertador Bernardo O’Higgins 1315, Office 52, Santiago(56-2) 6886840
Association of Olive Oil Producers (ChileOliva) www.chileoliva.comLos Militares 4328, Office 31, Las Condes, Santiago(56-2) 2635910
Wines of Chilewww.vinosdechile.cl Av. Luis Pasteur 5280, Office 402, Vitacura, Santiago(56-2) 2180600
Chilean Wine Corporation www.ccv.clAv. Tabancura 1344, Vitacura, Santiago(56-2) 2170812
Exporters’ Association (ASOEX)www.asoex.clCruz del Sur 133, 2nd floor, Las Condes, Santiago (56-2) 47247 00
Chilean Federation of Fruit Producers (FEDEFRUTA) www.fedefruta.clSan Antonio 220, Office 301, Santiago(56-2) 58545 00
Chilean Hass Avocado Committeewww.paltahass.clSánchez Fontecilla 310, Office 701 B2, Las Condes, Santiago(56-2) 3345189
Egg Producers’ Association (ASOHUEVO)www.asohuevo.clLuis Thayer Ojeda 0115, Office 305, Providencia, Santiago(56-2) 2331327
Association of Gourmet Producers and Exporterswww.asogourmet.clBarcelona 2018, Suite 504, Providencia, Santiago(56-2) 334 5691
Fundación Chilewww.fundacionchile.clAv. Parque Antonio Rabat Sur N°6165, Vitacura(56-2) 2400 300

El contenido de este material fotográfico es de propiedad de la Fundación Imagen de Chile. Se prohíbe la copia, reproducción, distribución o edición total o parcial del mismo sin la autorización expresa de su titular. Cualquier copia, reproducción, distribución o edición no autorizada, será sancionada de conformidad a lo dispuesto en la ley Nº 17.736
y sus modificaciones.
El contenido de este material fotográfico es de propiedad de Codelco, Conaf, Corfo, los fotógrafos Max Donoso, Guy Wenborne, Juan Francisco Somalo, Francisco Aguayo, Chilephoto, Expo Shanghai y Revista Placeres, el que ha sido cedido a la Fundación Imagen de Chile para su difusión. Se prohíbe la copia, reproducción, distribución o edición
total o parcial del mismo sin la autorización expresa de su titular de la Fundación Imagen de Chile. Cualquier copia, reproducción, distribución o edición no autorizada, será sancionada de conformidad a lo dispuesto en la ley N°17.736
y sus modificaciones.
La información contenida en este documento está destinada exclusivamente a fines informativos y las condiciones particulares de cada caso específico pueden variar respecto de las aquí descritas. El contenido de este documento no debe interpretarse de ninguna manera como una obligación jurídica vinculante para la República de Chile o para
cualquier otra agencia estatal que participe de alguna manera en los procesos de licitación establecidos. Los acuerdos resultantes serán regidos e interpretados exclusivamente según las leyes de la República de Chile.
The content of this photographic material is the property of Fundación Imagen de Chile. It cannot be copied, reproduced, distributed or edited, either totally or partially, without the express authorization of its owner. Any breach
of these terms will be subject to the sanctions established in Law Nº 17.736 and its modifications.
The content of this photographic material is the property of Codelco, CONAF, CORFO, the photographers Max Donoso, Guy Wenborne, Juan Francisco Somalo and Francisco Aguayo, Chilephoto, Expo Shanghai and Revista Placeres and has been ceded to Fundación Imagen de Chile for its publication. It cannot be copied, reproduced, distributed or edited,
either totally or partially, without the express authorization of Fundación Imagen de Chile. Any breach of these terms will be subject to the sanctions established in Law Nº 17.736 and its modifications.
The information contained in this document is for the purposes of information only and the particular conditions of each specific potential project may vary from those set out here. The contents of this document should in no way
be interpreted as a legally binding obligation of the Republic of Chile or any other state agency that participates in any way in the processes of administrative approval or of any other nature corresponding under Chilean law. This information in no way constitutes an authorization to start or exercise the economic activity potentially intended
to be developed. The resulting agreements will be governed and interpreted exclusively according to the laws of the Republic of Chile, their related regulation and the national policies applicable to each particular case.
Gobierno de Chile
Comité de InversionesExtranjerasMinisterio de
Economía, Fomento y Turismo


COMITÉ DE INVERSIONES EXTRANJERAS
El Comité de Inversiones Extranjeras es el organismo que representa al Estado de Chile en sus tratos con aquellos inversionistas que eligen usar el Decreto Ley 600 (D.L. 600), o Estatuto de la Inversión Extranjera, como mecanismo para ingresar Inversión Extranjera Directa (IED) al país.
Está conformado por los Ministros de Economía (que actúa como Presidente del Comité), Hacienda, Relaciones Exteriores, Planificación, además del Presidente del Banco Central.
Adicionalmente, los ministros que representan sectores económicos específicos son invitados a participar en las sesiones del Comité de Inversiones Extranjeras (en caso que corresponda).
Misión Institucional
Apoyar el posicionamiento de Chile como plaza de alto atractivo para la inversión extranjera y los negocios internacionales actuando en materias relacionadas con la administración y difusión de la normativa legal pertinente, el desarrollo de actividades de promoción de diversa índole y la elaboración de información relevante en materia de inversión extranjera, para inversionistas extranjeros y potenciales inversionistas.
Objetivos Estratégicos Velar por la correcta aplicación del Estatuto de la Inversión Extranjera con el objeto de resguardar los derechos del Estado, como de los inversionistas extranjeros, mediante la difusión de su contenido y la administración de los procedimientos jurídicos vinculados a éste: análisis de solicitudes, celebración de contratos, autorización de remesas. Desarrollar todo tipo de iniciativas cuyo objeto sea informar, promocionar, coordinar y ejecutar toda acción tendiente a incentivar el ingreso de inversión extranjera. Mantener un registro estadístico actualizado y fidedigno de la inversión extranjera acogida al Estatuto de la Inversión Extranjera, mediante la sistematización de la información referida a los contratos como a los flujos de capital que se efectúan con cargo a éstos, con el propósito de resguardar los intereses de los inversionistas como asimismo elaborar informes estadísticos de uso público.
La Vicepresidencia Ejecutiva (VECIE) El Comité de Inversiones Extranjeras es dirigido y administrado a nivel operativo por el Vice-Presidente Ejecutivo, quien es designado por el Presidente de la República.
La Vicepresidencia Ejecutiva proporciona información y orientaciones generales a cualquier inversionista respecto al país, su ambiente económico y social, marco jurídico y las políticas hacia la IED. Cuando se requiere, entrega información sobre cómo comenzar el proceso de establecer un negocio en Chile así como la orientación en torno los procedimientos y las regulaciones que deben ser cumplidos por cualquier inversionista, tanto si firman un D.L. 600 o no, a los niveles nacionales, regionales y sectoriales.
Con el objetivo de posicionar a Chile como un lugar atractivo para invertir, la Vicepresidencia Ejecutiva coordina misiones de negocios al exterior, organiza seminarios y conferencias, y publica informes regulares sobre el clima de negocios de Chile y oportunidades de inversión, tanto en forma impresa como electrónica. En estas actividades promocionales, trabaja junto con otros ministerios y organismos del Estado, así como con el sector privado local y extranjero.

Ahumada 11, 12th Floor,Santiago - Chile
Tel: (56 - 2) 698 4254Fax: (56 - 2) 698 9476
www.foreigninvestment.cl
Ahumada 11, 12th Floor,Santiago - Chile
Tel: (56 - 2) 698 4254Fax: (56 - 2) 698 9476
www.foreigninvestment.cl