
Operations and Technical Update -...
219
OPERATIONS AND TECHNICAL UPDATE Wednesday, February 22, 2017
Transcript of Operations and Technical Update -...
OPERATIONS AND TECHNICAL UPDATEWednesday, February 22, 2017
Certain information contained or incorporated by reference in this presentation, including any information as to our strategy, projects, plans, or future financial or operating performance, constitutes "forward-looking statements". All statements, other than statements of historical fact, are forward-looking statements. The words "believe", "expect", "anticipate", "contemplate", "target", "plan", "objective" "aspiration", "aim", "intend", "project", "goal", "continue", "budget", "estimate", "potential", "may", "will", "can", "should", "could", "would", and similar expressions identify forward-looking statements. In particular, this presentation contains forward-looking statements including, without limitation, with respect to: (i) Barrick's forward-looking production guidance; (ii) estimates of future cost of sales per ounce for gold and per pound for copper, all-in-sustaining costs per ounce/pound, cash costs per ounce, and C1 cash costs per pound; (iii) cash flow forecasts; (iv) projected capital, operating, and exploration expenditures; (v) targeted debt and cost reductions; (vi) mine life and production rates; (vii) potential mineralization and metal or mineral recoveries; (viii) Barrick's Best-in-Class program (including potential improvements to financial and operating performance that may result from certain Best-in-Class initiatives); (ix) potential improvements to financial and operating performance and mine life at Barrick’s Cortez, Goldstrike, Pueblo Viejo, Veladero, Lagunas Norte, Turquoise Ridge and Hemlo mines; (x) potential developments at Barrick’s Goldrush, Alturas and Pascua Lama projects, including the Lama starter project and the potential for phased-in development of the Pascua-Lama project; (xi) the potential to identify new reserves and resources; (xii) our pipeline of high confidence projects at or near existing operations; (xiii) the benefits of integrating the Cortez and Goldstrike operations; (xiv) the potential impact and benefits of Barrick's digital transformation; (xv) asset sales, joint ventures, and partnerships; (xvi) expectations regarding future price assumptions, financial performance, and other outlook or guidance; and (xvii) the estimated timing and conclusions of technical reports and other studies.
Forward-looking statements are necessarily based upon a number of estimates and assumptions that, while considered reasonable by the Company as at the date of this press release in light of management's experience and perception of current conditions and expected developments, are inherently subject to significant business, economic and competitive uncertainties and contingencies. Known and unknown factors could cause actual results to differ materially from those projected in the forward-looking statements, and undue reliance should not be placed on such statements and information. Such factors include, but are not limited to: fluctuations in the spot and forward price of gold, copper, or certain other commodities (such as silver, diesel fuel, natural gas, and electricity); the speculative nature of mineral exploration and development; changes in mineral production performance, exploitation, and exploration successes; risks associated with the fact that certain Best-in-Class and other initiatives are still in the early stages of evaluation, and additional engineering and other analysis is required to fully assess their impact; risks associated with the implementation of Barrick's digital transformation initiative, and the ability of the projects under this initiative to meet the Company's capital allocation objectives; diminishing quantities or grades of reserves; increased costs, delays, suspensions, and technical challenges associated with the construction of capital projects; operating or technical difficulties in connection with mining or development activities, including geotechnical challenges, and disruptions in the maintenance or provision of required infrastructure and information technology systems; failure to comply with environmental and health and safety laws and regulations; timing of receipt of, or failure to comply with, necessary permits and approvals; uncertainty whether some or all of the Best-in-Class initiatives and targeted investments and projects will meet the Company's capital allocation objectives; the impact of global liquidity and credit availability on the timing of cash flows and the values of assets and liabilities based on projected future cash flows; adverse changes in our credit ratings; the impact of inflation; fluctuations in the currency markets; changes in U.S. dollar interest rates; risks arising from holding derivative instruments; changes in national and local government legislation, taxation, controls or regulations, and/or changes in the administration of laws, policies, and practices, expropriation or nationalization of property and political or economic developments in Canada, the United States , and other jurisdictions in which the Company does or may carry on business in the future; damage to the Company’s reputation due to the actual or perceived occurrence of any number of events, including negative publicity with respect to the Company’s handling of environmental matters or dealings with community groups, whether true or not; the possibility that future exploration results will not be consistent with the Company’s expectations; risks that exploration data may be incomplete and considerable additional work may be required to complete further evaluation, including but not limited to drilling, engineering and socio-economic studies and investment; risk of loss due to acts of war, terrorism, sabotage and civil disturbances; litigation; contests over title to properties, particularly title to undeveloped properties, or over access to water, power and other required infrastructure; business opportunities that may be presented to, or pursued by, the Company; risks associated with working with partners in jointly controlled assets; our ability to successfully integrate acquisitions or complete divestitures; employee relations; increased costs and risks related to the potential impact of climate change; and availability and increased costs associated with mining inputs and labor. In addition, there are risks and hazards associated with the business of mineral exploration, development and mining, including environmental hazards, industrial accidents, unusual or unexpected formations, pressures, cave-ins, flooding and gold bullion, copper cathode or gold or copper concentrate losses (and the risk of inadequate insurance, or inability to obtain insurance, to cover these risks).
Many of these uncertainties and contingencies can affect our actual results and could cause actual results to differ materially from those expressed or implied in any forward-looking statements made by, or on behalf of, us. Readers are cautioned that forward-looking statements are not guarantees of future performance. All of the forward-looking statements made in this presentation are qualified by these cautionary statements. Specific reference is made to the most recent Form 40-F/Annual Information Form on file with the SEC and Canadian provincial securities regulatory authorities for a more detailed discussion of some of the factors underlying forward- looking statements and the risks that may affect Barrick's ability to achieve the expectations set forth in the forward-looking statements contained in this presentation.
The Company disclaims any intention or obligation to update or revise any forward-looking statements whether as a result of new information, future events or otherwise, except as required by applicable law.
CAUTIONARY STATEMENT ON FORWARD-LOOKING INFORMATION

GLOSSARY OF KEY ACRONYMS
AC Autoclave LOM Life of Mine
AISC All-in Sustaining Costs M&I Measured and Indicated
ANFO Ammonium Nitrate, Fuel Oil MTBF Mean Time Between Failure
ARS Argentine Peso MTO Mine Traffic Optimization
Au Gold NEPA The National Environmental Policy Act
BCRA Banco Central de Republica Argentina NPV Net Present Value
BiC Best-in-Class NZ North Zone
CAGR Compound Annual Growth Rate OEE Overall Equipment Efficiency
CCTV Closed-circuit Television OP Open Pit
CDP Carbon Disclosure Project OPEX Operational Expenditure
CiC Carbon-in-Column PFS Pre-feasibility Study
CIL Carbon In Leach PMR Proyecto Mineral Refractario
CIP Carbon In Pulp POX Pressure Oxidation
CSR Corporate Social Responsibility PV Pueblo Viejo
DJSI Dow Jones Sustainability Indices QQ1 Quisqueya 1
DR The Dominican Republic ROD Record of Decision
Cu Copper ROIC Return on Invested Capital
DSO Direct Shipping Ore SAG Semi-Autogenous Grinding
EBITDA Earnings Before Interest, Tax, Depreciation and Amortization SIC Short Interval Control
EIA Environmental Impact Assessment SME Society for Mining, Metallurgy, and Exploration
EIS Environmental Impact Statement SZ South Zone
FCF Free Cash Flow TCM Total Carbonaceous Matter
FDI Foreign Direct Investment TPA Tonne Per Annum
FS Feasibility Study TPD Tonne Per Day
FT Feet TPOH Tonne Per Operating Hour
FWP Footwall Pond TR Turquoise Ridge
FX Forex TRIFR Total Recordable Injury Frequency Rate
GHG Greenhouse Gas TRJV Turquoise Ridge Joint Venture
GM General Manager TSR Total Shareholder Return
G/T Grams Per Tonne UAV Unmanned Aerial Vehicle
HCCUEP Horse Canyon/Cortez Unified Exploration Plan UG Underground
HFO Heavy Fuel Oil VRS Value Realization Support
KCGM Kalgoorlie Consolidated Gold Mines WTPOH Wet Ton Per Operating Hour
KPI Key Performance Indicator YE Year-End
LHD Load, Haul, Dump Machine YOY Year Over Year
LNG Liquefied Natural Gas
Operations and Technical Update | 1
OperationsandTechnicalUpdate
RichardWilliamsChiefOperatingOfficer
Operations and Technical Update | 2
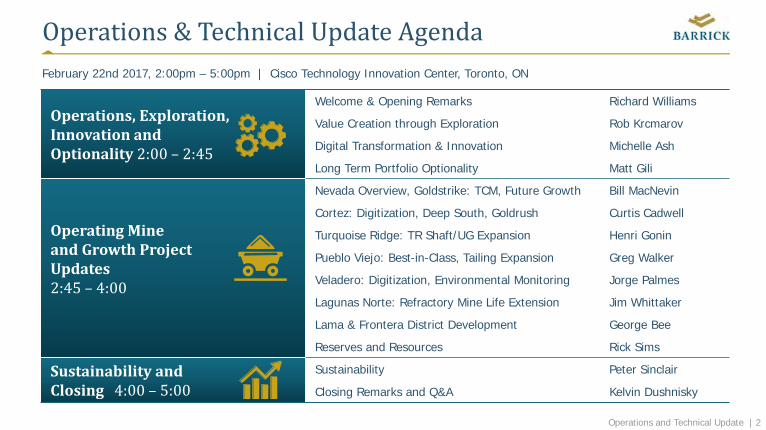
Operations&TechnicalUpdateAgenda
Operations,Exploration,InnovationandOptionality2:00– 2:45
Welcome & Opening Remarks Richard Williams
Value Creation through Exploration Rob Krcmarov
Digital Transformation & Innovation Michelle Ash
Long Term Portfolio Optionality Matt Gili
OperatingMineandGrowthProjectUpdates2:45– 4:00
Nevada Overview, Goldstrike: TCM, Future Growth Bill MacNevin
Cortez: Digitization, Deep South, Goldrush Curtis Cadwell
Turquoise Ridge: TR Shaft/UG Expansion Henri Gonin
Pueblo Viejo: Best-in-Class, Tailing Expansion Greg Walker
Veladero: Digitization, Environmental Monitoring Jorge Palmes
Lagunas Norte: Refractory Mine Life Extension Jim Whittaker
Lama & Frontera District Development George Bee
Reserves and Resources Rick Sims
SustainabilityandClosing4:00– 5:00
Sustainability Peter Sinclair
Closing Remarks and Q&A Kelvin Dushnisky
February 22nd 2017, 2:00pm – 5:00pm | Cisco Technology Innovation Center, Toronto, ON
Operations and Technical Update | 3
OurVision
OurVisionisthegenerationofwealththroughresponsiblemining–wealthforourowners,ourpeople,andthecountriesandcommunitieswithwhichwepartner.Weaimtobetheleadingminingcompanyfocusedongold,growingourcashflowpersharebydevelopingandoperatinghighqualityassetsthroughdisciplinedallocationofhumanandfinancialcapitalandoperationalexcellence.
Operations and Technical Update | 4
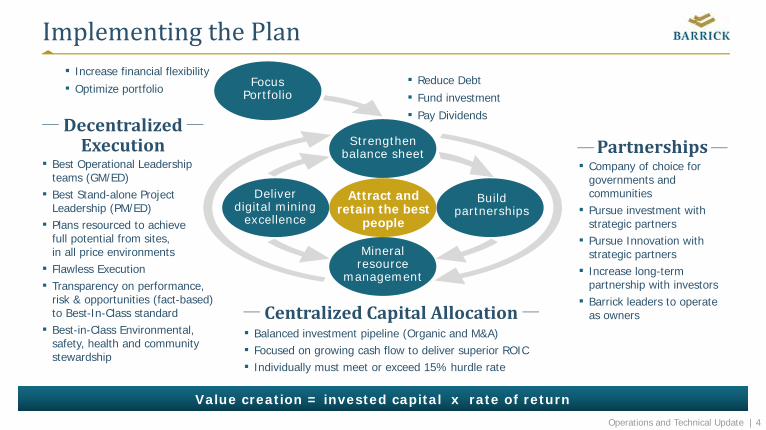
ImplementingthePlan
▪ Company of choice for governments and communities
▪ Pursue investment with strategic partners
▪ Pursue Innovation with strategic partners
▪ Increase long-term partnership with investors
▪ Barrick leaders to operate as owners
▪ Best Operational Leadership teams (GM/ED)
▪ Best Stand-alone Project Leadership (PM/ED)
▪ Plans resourced to achieve full potential from sites, in all price environments
▪ Flawless Execution▪ Transparency on performance,
risk & opportunities (fact-based) to Best-In-Class standard
▪ Best-in-Class Environmental, safety, health and community stewardship
▪ Increase financial flexibility▪ Optimize portfolio
▪ Reduce Debt ▪ Fund investment▪ Pay Dividends
Value creation = invested capital x rate of return
▪ Balanced investment pipeline (Organic and M&A)▪ Focused on growing cash flow to deliver superior ROIC ▪ Individually must meet or exceed 15% hurdle rate
CentralizedCapitalAllocation
PartnershipsDecentralizedExecution
Deliverdigital mining
excellence
Attract andretain the best
people
Buildpartnerships
Mineralresource
management
Strengthenbalance sheet
FocusPortfolio
Operations and Technical Update | 5
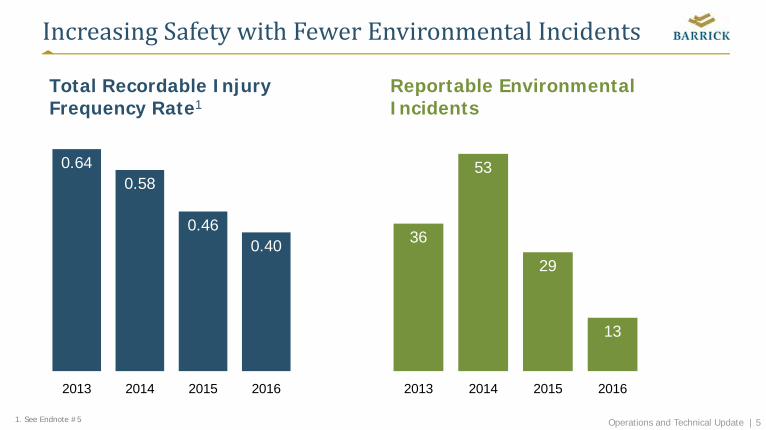
IncreasingSafetywithFewerEnvironmentalIncidents
36
53
29
13
2013 2014 2015 2016
Reportable Environmental Incidents
0.640.58
0.460.40
2013 2014 2015 2016
Total Recordable Injury Frequency Rate1
1. See Endnote #5
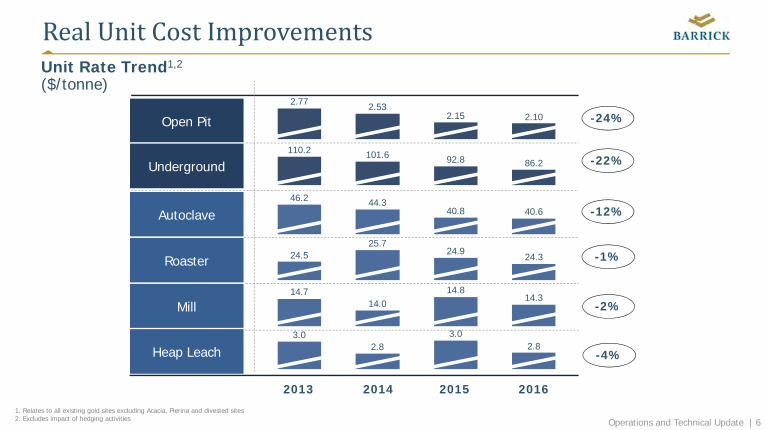
Operations and Technical Update | 61. Relates to all existing gold sites excluding Acacia, Pierina and divested sites2. Excludes impact of hedging activities
Unit Rate Trend1,2
($/tonne)
RealUnitCostImprovements
-24%
-22%
-12%
-1%
-2%
-4%
2.772.15 2.10
2.53
86.2101.6110.2
92.8
40.640.844.346.2
25.724.924.5 24.3
14.314.814.7
14.0
3.02.8
3.02.8
Open Pit
Underground
Autoclave
Roaster
Mill
Heap Leach
2014 2015 20162013
Operations and Technical Update | 7
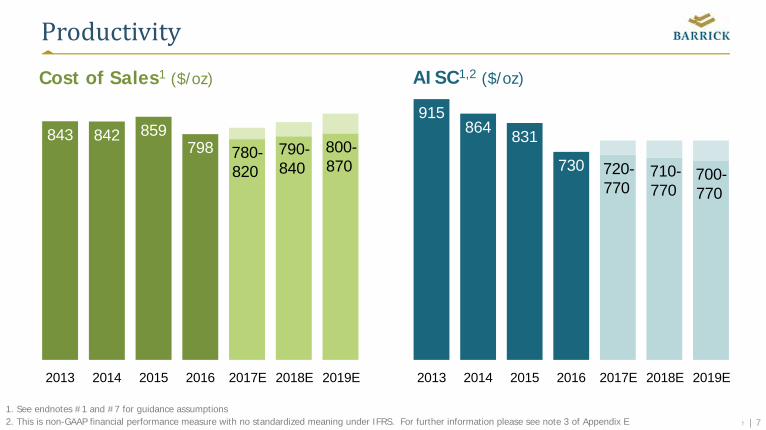
Productivity
843 842 859798
2013 2014 2015 2016 2017E 2018E 2019E
Cost of Sales1 ($/oz)
915864 831
730
2013 2014 2015 2016 2017E 2018E 2019E
AISC1,2 ($/oz)
720-770
710-770
700-770
780-820
790-840
800-870
1. See endnotes #1 and #7 for guidance assumptions2. This is non-GAAP financial performance measure with no standardized meaning under IFRS. For further information please see note 3 of Appendix E
Operations and Technical Update | 8
ValueCreationThroughExploration
RobKrcmarovExecutiveVicePresidentExplorationandGrowth
Operations and Technical Update | 9
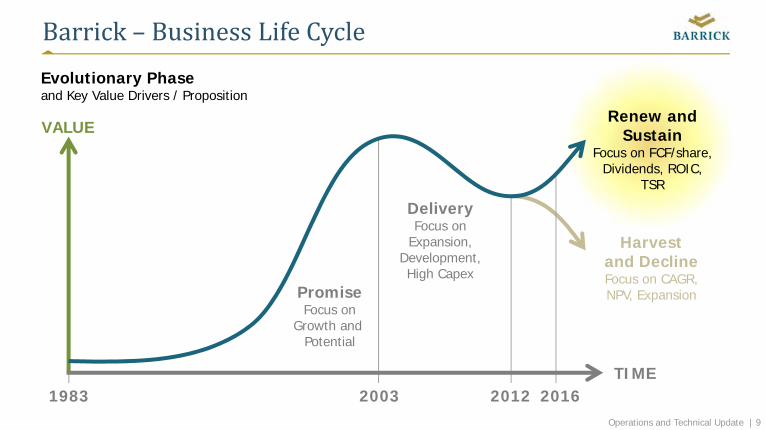
Barrick– BusinessLifeCycle
Renew and Sustain
Focus on FCF/share, Dividends, ROIC,
TSR
Harvest and DeclineFocus on CAGR, NPV, Expansion
DeliveryFocus on
Expansion, Development, High Capex
PromiseFocus on
Growth and Potential
VALUE
TIME1983 20162003 2012
Evolutionary Phase and Key Value Drivers / Proposition
Operations and Technical Update | 10
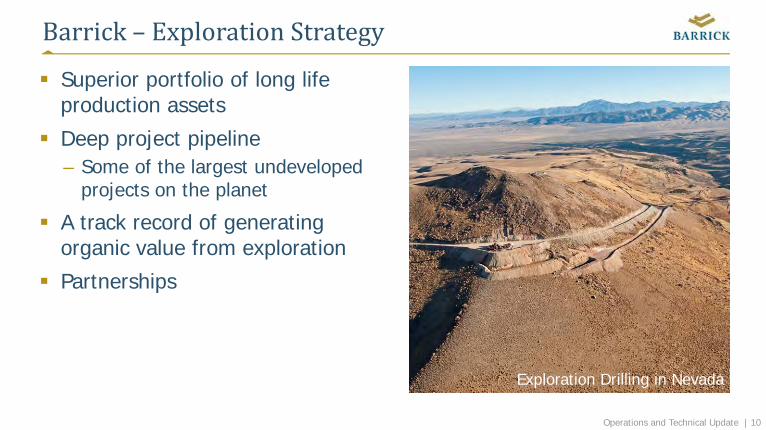
Barrick– ExplorationStrategy
Superior portfolio of long life production assets
Deep project pipeline– Some of the largest undeveloped
projects on the planet
A track record of generating organic value from exploration
Partnerships
Exploration Drilling in Nevada
Operations and Technical Update | 11
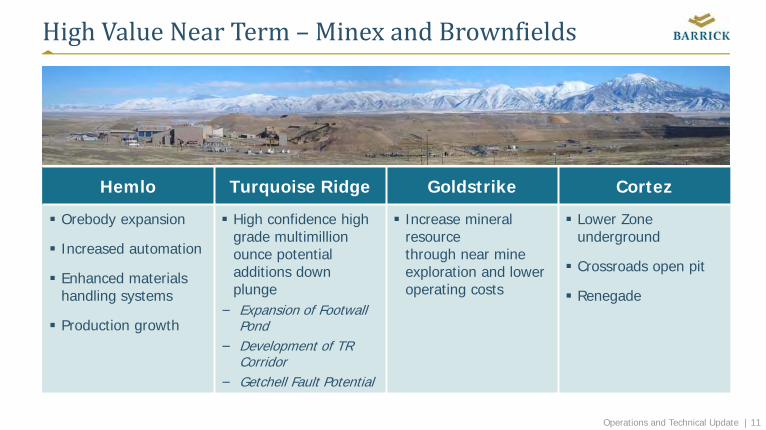
HighValueNearTerm– MinexandBrownfields
Hemlo Turquoise Ridge Goldstrike Cortez
Orebody expansion
Increased automation
Enhanced materials handling systems
Production growth
High confidence high grade multimillion ounce potential additions down plunge
− Expansion of Footwall Pond
− Development of TR Corridor
− Getchell Fault Potential
Increase mineral resource through near mine exploration and lower operating costs
Lower Zone underground
Crossroads open pit
Renegade
Operations and Technical Update | 12
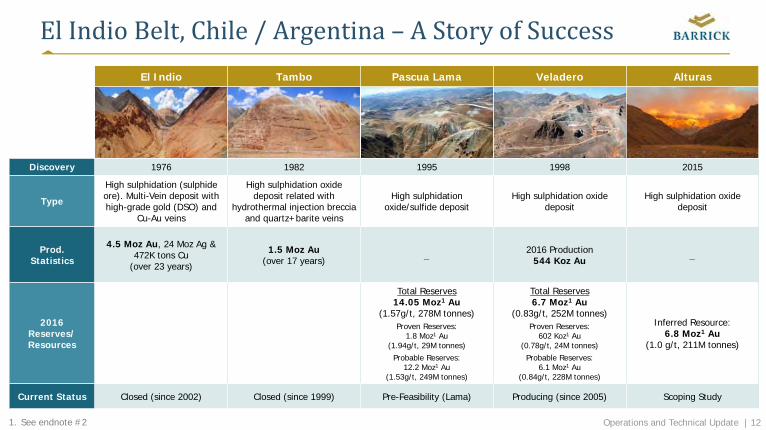
ElIndioBelt,Chile/Argentina– AStoryofSuccessEl Indio Tambo Pascua Lama Veladero Alturas
Discovery 1976 1982 1995 1998 2015
Type
High sulphidation (sulphide ore). Multi-Vein deposit with high-grade gold (DSO) and
Cu-Au veins
High sulphidation oxidedeposit related with
hydrothermal injection breccia and quartz+barite veins
High sulphidationoxide/sulfide deposit
High sulphidation oxide deposit
High sulphidation oxide deposit
Prod.Statistics
4.5 Moz Au, 24 Moz Ag & 472K tons Cu
(over 23 years)
1.5 Moz Au(over 17 years) _ 2016 Production
544 Koz Au _
2016 Reserves/Resources
Total Reserves14.05 Moz1 Au
(1.57g/t, 278M tonnes)Proven Reserves:
1.8 Moz1 Au (1.94g/t, 29M tonnes)
Probable Reserves:12.2 Moz1 Au
(1.53g/t, 249M tonnes)
Total Reserves6.7 Moz1 Au
(0.83g/t, 252M tonnes)Proven Reserves:
602 Koz1 Au (0.78g/t, 24M tonnes)
Probable Reserves:6.1 Moz1 Au
(0.84g/t, 228M tonnes)
Inferred Resource:6.8 Moz1 Au
(1.0 g/t, 211M tonnes)
Current Status Closed (since 2002) Closed (since 1999) Pre-Feasibility (Lama) Producing (since 2005) Scoping Study
1. See endnote #2
Operations and Technical Update | 13
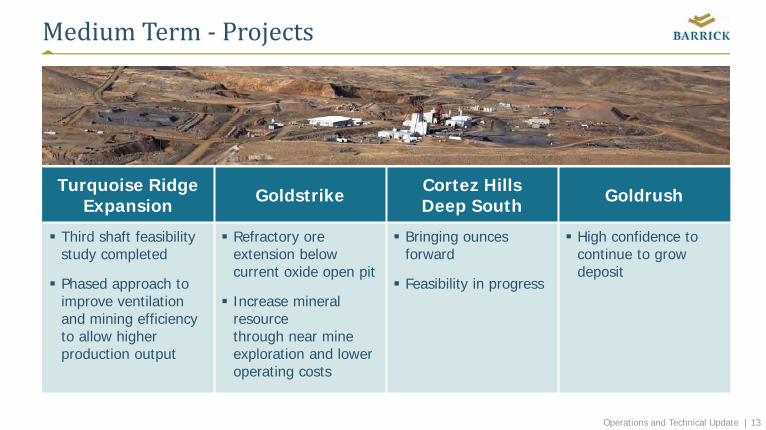
MediumTerm‐ Projects
Turquoise Ridge Expansion Goldstrike Cortez Hills
Deep South Goldrush
Third shaft feasibility study completed
Phased approach to improve ventilation and mining efficiency to allow higher production output
Refractory ore extension below current oxide open pit
Increase mineral resource through near mine exploration and lower operating costs
Bringing ounces forward
Feasibility in progress
High confidence to continue to grow deposit
Operations and Technical Update | 14
Alturas
Goldrush
Pueblo Viejo
Veladero
Donlin Gold
Cortez
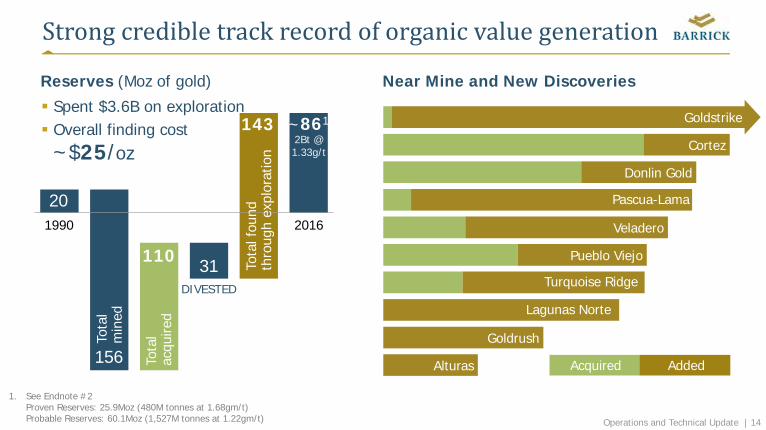
Strongcredibletrackrecordoforganicvaluegeneration
Spent $3.6B on exploration Overall finding cost ~$25/oz
1990
DIVESTED
Tota
lac
quire
d
Tota
lm
ined
1. See Endnote #2Proven Reserves: 25.9Moz (480M tonnes at 1.68gm/t)Probable Reserves: 60.1Moz (1,527M tonnes at 1.22gm/t)
Reserves (Moz of gold) Near Mine and New Discoveries
110
156
20
31
143
Tota
l fou
ndth
roug
h ex
plor
atio
n
~861
2Bt @1.33g/t
Turquoise Ridge
Acquired Added
Lagunas Norte
Goldstrike
2016
Pascua-Lama
Operations and Technical Update | 15
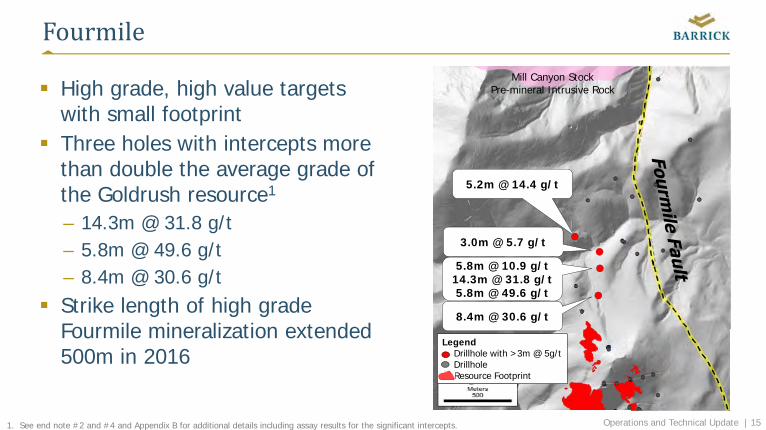
Fourmile
High grade, high value targets with small footprint
Three holes with intercepts more than double the average grade of the Goldrush resource1
– 14.3m @ 31.8 g/t– 5.8m @ 49.6 g/t– 8.4m @ 30.6 g/t
Strike length of high grade Fourmile mineralization extended 500m in 2016
1. See end note #2 and #4 and Appendix B for additional details including assay results for the significant intercepts.
Mill Canyon StockPre-mineral Intrusive Rock
5.2m @ 14.4 g/t
3.0m @ 5.7 g/t
5.8m @ 10.9 g/t 14.3m @ 31.8 g/t 5.8m @ 49.6 g/t
8.4m @ 30.6 g/t
LegendDrillhole with >3m @ 5g/tDrillholeResource Footprint
Operations and Technical Update | 16
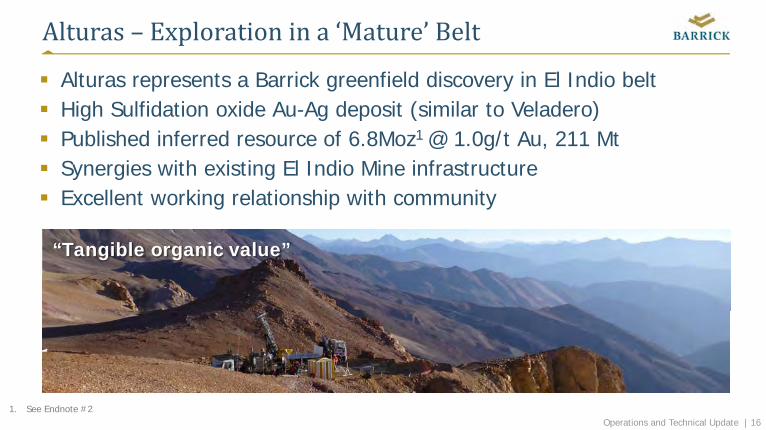
Alturas– Explorationina‘Mature’Belt
Alturas represents a Barrick greenfield discovery in El Indio belt High Sulfidation oxide Au-Ag deposit (similar to Veladero) Published inferred resource of 6.8Moz1 @ 1.0g/t Au, 211 Mt Synergies with existing El Indio Mine infrastructure Excellent working relationship with community
“Tangible organic value”
1. See Endnote #2
Operations and Technical Update | 17
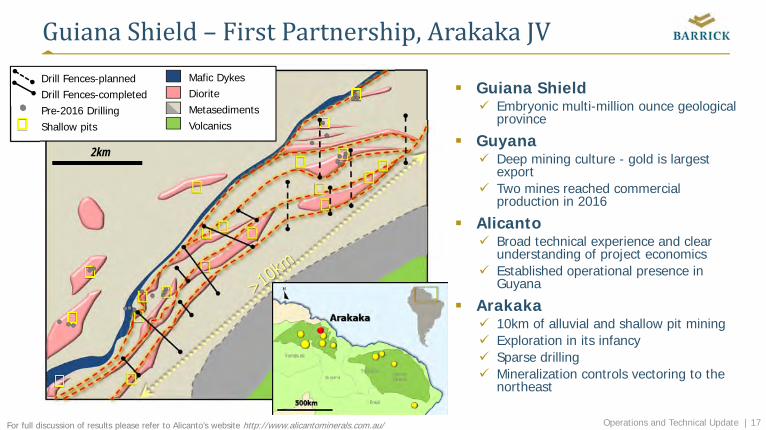
2km
�Drill Fences-plannedDrill Fences-completedPre-2016 DrillingShallow pits
Mafic DykesDioriteMetasedimentsVolcanics
GuianaShield– FirstPartnership,Arakaka JV
Guiana Shield Embryonic multi-million ounce geological
province
Guyana Deep mining culture - gold is largest
export Two mines reached commercial
production in 2016
Alicanto Broad technical experience and clear
understanding of project economics Established operational presence in
Guyana
Arakaka 10km of alluvial and shallow pit mining Exploration in its infancy Sparse drilling Mineralization controls vectoring to the
northeast
For full discussion of results please refer to Alicanto’s website http://www.alicantominerals.com.au/
Operations and Technical Update | 18
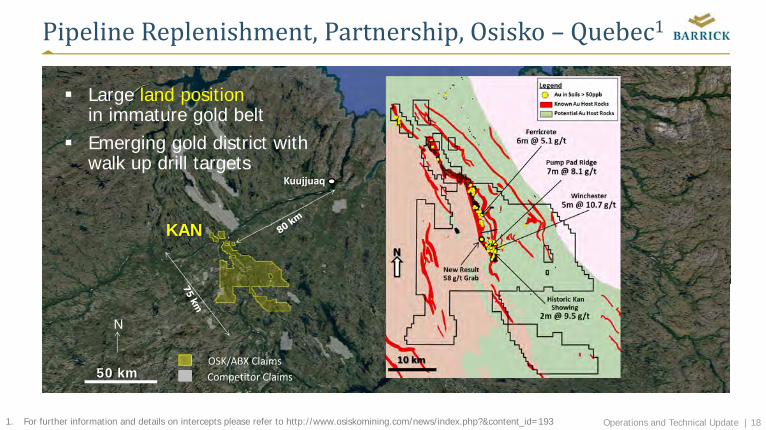
PipelineReplenishment,Partnership,Osisko – Quebec1
KAN
N
Kuujjuaq
50 km Competitor ClaimsOSK/ABX Claims
1. For further information and details on intercepts please refer to http://www.osiskomining.com/news/index.php?&content_id=193
Large land positionin immature gold belt
Emerging gold district with walk up drill targets
Operations and Technical Update | 19
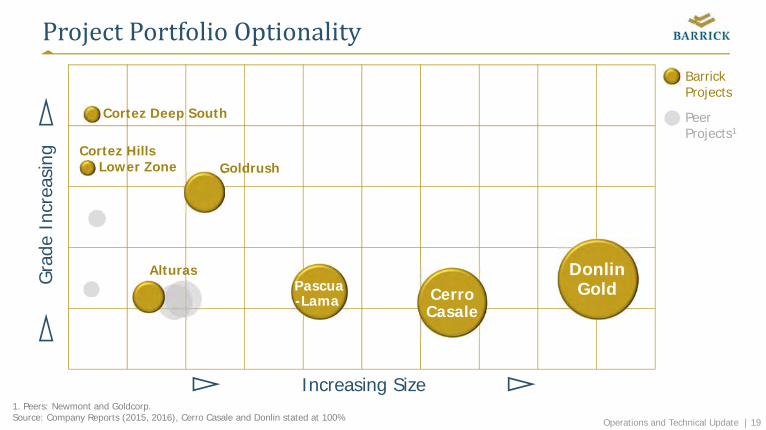
ProjectPortfolioOptionality
1. Peers: Newmont and Goldcorp.Source: Company Reports (2015, 2016), Cerro Casale and Donlin stated at 100%
Gra
de I
ncre
asin
g
Increasing Size
Barrick Projects
PeerProjects1
Goldrush
Cortez Deep South
Pascua-Lama Cerro
Casale
DonlinGold
Alturas
Cortez HillsLower Zone
Operations and Technical Update | 20
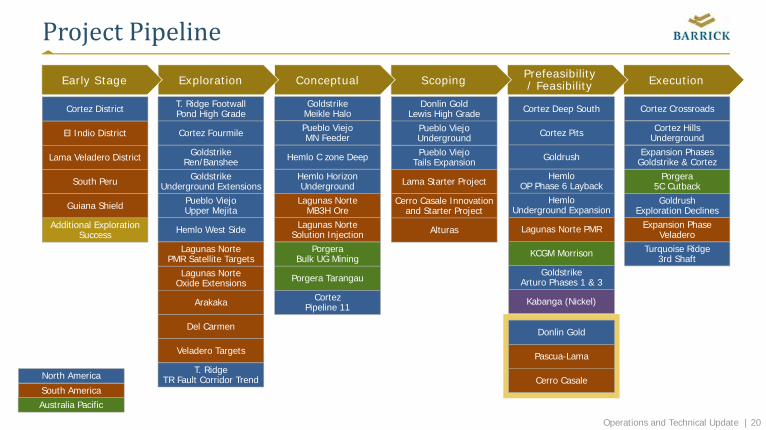
ProjectPipeline
Pascua-Lama
Donlin Gold
Cerro Casale
Kabanga (Nickel)
ExecutionPrefeasibility/ FeasibilityScopingConceptualExplorationEarly Stage
North America
South AmericaAustralia Pacific
Porgera5C Cutback
Cortez Crossroads
Cortez HillsUnderground
Turquoise Ridge3rd Shaft
Goldrush Exploration Declines
Expansion PhasesGoldstrike & Cortez
Expansion PhaseVeladero
Cortez District
El Indio District
Lama Veladero District
South Peru
Guiana Shield
Additional Exploration Success
Donlin GoldLewis High Grade
Pueblo Viejo UndergroundPueblo Viejo
Tails Expansion
Lama Starter Project
Alturas
Cerro Casale Innovationand Starter Project
Pueblo ViejoUpper Mejita
Lagunas NorteOxide Extensions
Hemlo West Side
T. Ridge Footwall Pond High Grade
Lagunas NortePMR Satellite Targets
Cortez Fourmile
Arakaka
Del Carmen
GoldstrikeUnderground Extensions
GoldstrikeRen/Banshee
Veladero Targets
T. Ridge TR Fault Corridor Trend
GoldstrikeMeikle Halo
Lagunas NorteMB3H Ore
Pueblo ViejoMN Feeder
Hemlo C zone Deep
PorgeraBulk UG Mining
Porgera Tarangau
CortezPipeline 11
Hemlo Horizon Underground
Lagunas NorteSolution Injection
GoldstrikeArturo Phases 1 & 3
Cortez Deep South
Cortez Pits
Goldrush
HemloOP Phase 6 Layback
KCGM Morrison
Lagunas Norte PMR
HemloUnderground Expansion
Operations and Technical Update | 21
DigitalTransformation&Innovation
MichelleAshChiefInnovationOfficer
Operations and Technical Update | 22
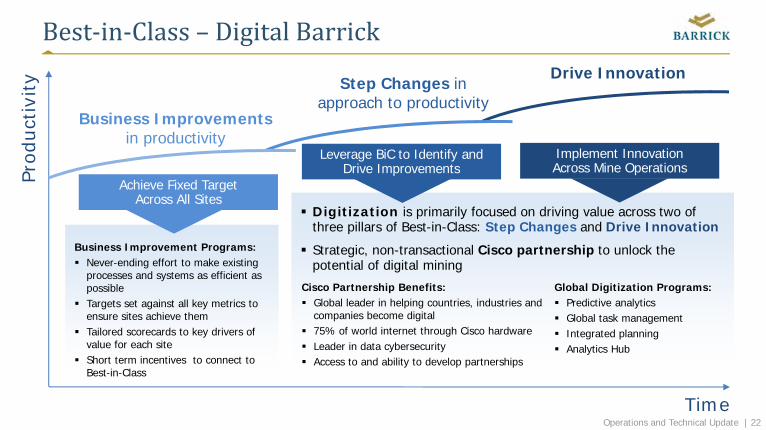
Best‐in‐Class– DigitalBarrickPr
oduc
tivity
Time
Leverage BiC to Identify and Drive Improvements
Achieve Fixed Target Across All Sites
Implement Innovation Across Mine Operations
Drive InnovationStep Changes in
approach to productivityBusiness Improvements
in productivity
Digitization is primarily focused on driving value across two of three pillars of Best-in-Class: Step Changes and Drive Innovation
Strategic, non-transactional Cisco partnership to unlock the potential of digital mining
Global Digitization Programs: Predictive analytics Global task management Integrated planning Analytics Hub
Cisco Partnership Benefits: Global leader in helping countries, industries and
companies become digital 75% of world internet through Cisco hardware Leader in data cybersecurity Access to and ability to develop partnerships
Business Improvement Programs: Never-ending effort to make existing
processes and systems as efficient as possible
Targets set against all key metrics to ensure sites achieve them
Tailored scorecards to key drivers of value for each site
Short term incentives to connect to Best-in-Class
Operations and Technical Update | 23
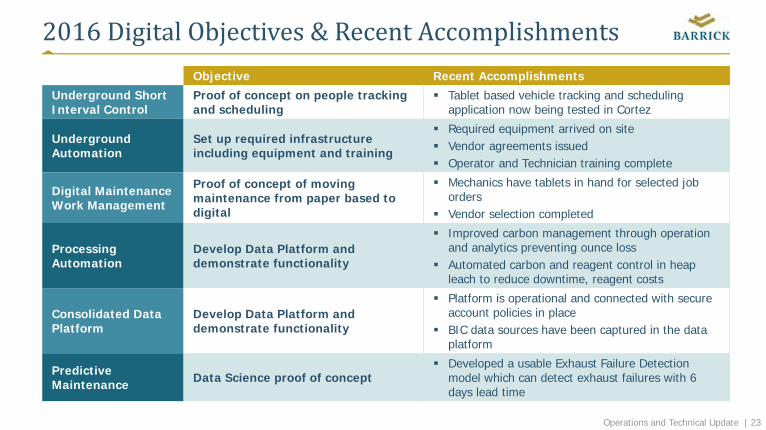
2016DigitalObjectives&RecentAccomplishmentsObjective Recent Accomplishments
Underground Short Interval Control
Proof of concept on people tracking and scheduling
Tablet based vehicle tracking and scheduling application now being tested in Cortez
Underground Automation
Set up required infrastructure including equipment and training
Required equipment arrived on site Vendor agreements issued Operator and Technician training complete
Digital Maintenance Work Management
Proof of concept of moving maintenance from paper based to digital
Mechanics have tablets in hand for selected job orders
Vendor selection completed
Processing Automation
Develop Data Platform and demonstrate functionality
Improved carbon management through operation and analytics preventing ounce loss
Automated carbon and reagent control in heap leach to reduce downtime, reagent costs
Consolidated Data Platform
Develop Data Platform and demonstrate functionality
Platform is operational and connected with secure account policies in place
BIC data sources have been captured in the data platform
Predictive Maintenance Data Science proof of concept
Developed a usable Exhaust Failure Detection model which can detect exhaust failures with 6 days lead time
Operations and Technical Update | 24
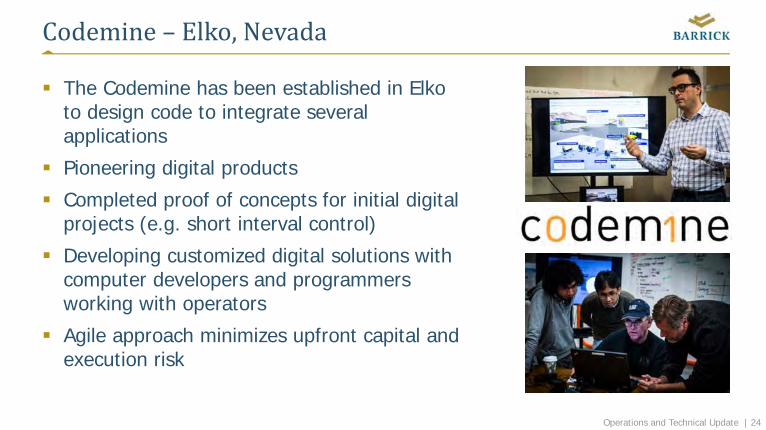
Codemine – Elko,Nevada
The Codemine has been established in Elko to design code to integrate several applications
Pioneering digital products
Completed proof of concepts for initial digital projects (e.g. short interval control)
Developing customized digital solutions with computer developers and programmers working with operators
Agile approach minimizes upfront capital and execution risk
Operations and Technical Update | 25
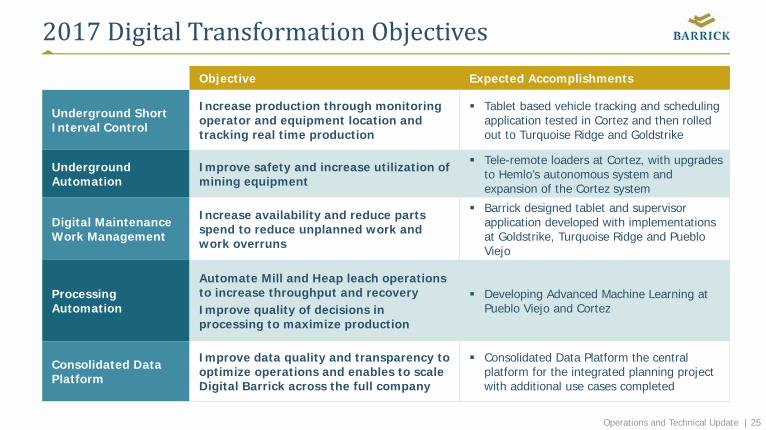
2017DigitalTransformationObjectivesObjective Expected Accomplishments
Underground Short Interval Control
Increase production through monitoring operator and equipment location and tracking real time production
Tablet based vehicle tracking and scheduling application tested in Cortez and then rolled out to Turquoise Ridge and Goldstrike
Underground Automation
Improve safety and increase utilization of mining equipment
Tele-remote loaders at Cortez, with upgrades to Hemlo’s autonomous system and expansion of the Cortez system
Digital Maintenance Work Management
Increase availability and reduce parts spend to reduce unplanned work and work overruns
Barrick designed tablet and supervisor application developed with implementations at Goldstrike, Turquoise Ridge and Pueblo Viejo
Processing Automation
Automate Mill and Heap leach operations to increase throughput and recovery Improve quality of decisions in processing to maximize production
Developing Advanced Machine Learning at Pueblo Viejo and Cortez
Consolidated Data Platform
Improve data quality and transparency to optimize operations and enables to scale Digital Barrick across the full company
Consolidated Data Platform the central platform for the integrated planning project with additional use cases completed
Operations and Technical Update | 26
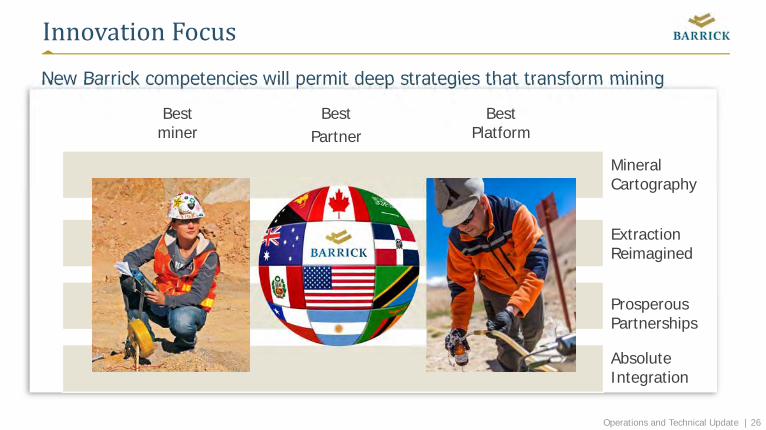
InnovationFocusNew Barrick competencies will permit deep strategies that transform mining
Best miner
Best Partner
Best Platform
Extraction Reimagined
Prosperous Partnerships
Absolute Integration
Mineral Cartography
Operations and Technical Update | 27
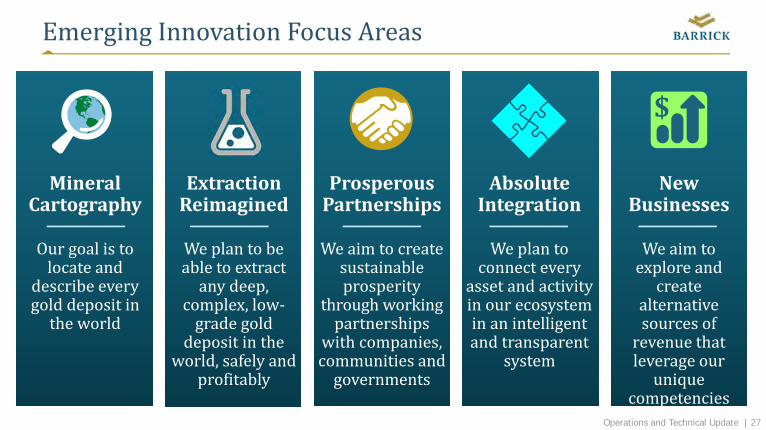
EmergingInnovationFocusAreas
MineralCartography
Ourgoalistolocateand
describeeverygolddepositintheworld
AbsoluteIntegration
Weplantoconnectevery
assetandactivityinourecosysteminanintelligentandtransparent
system
ProsperousPartnerships
Weaimtocreatesustainableprosperity
throughworkingpartnerships
withcompanies,communitiesandgovernments
ExtractionReimagined
Weplantobeabletoextractanydeep,
complex,low‐gradegold
depositintheworld,safelyand
profitably
NewBusinesses
Weaimtoexploreandcreate
alternativesourcesofrevenuethatleverageourunique
competencies
$
Operations and Technical Update | 28
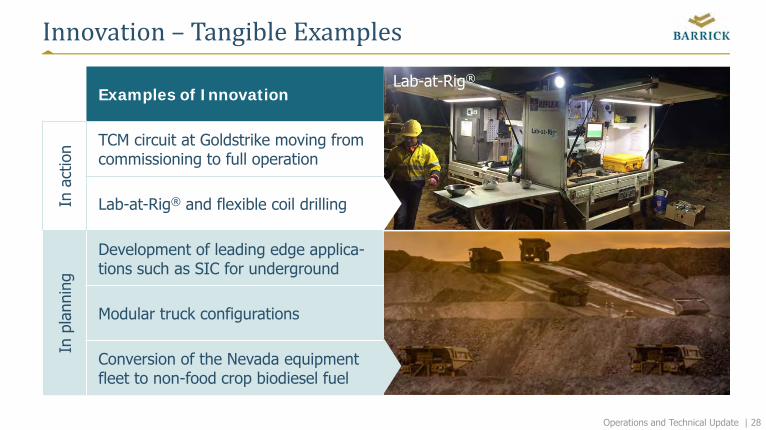
Innovation– TangibleExamples
Examples of Innovation
In a
ctio
n TCM circuit at Goldstrike moving from commissioning to full operation
Lab-at-Rig® and flexible coil drilling
In p
lann
ing
Development of leading edge applica-tions such as SIC for underground
Modular truck configurations
Conversion of the Nevada equipment fleet to non-food crop biodiesel fuel
Lab-at-Rig®
Operations and Technical Update | 29
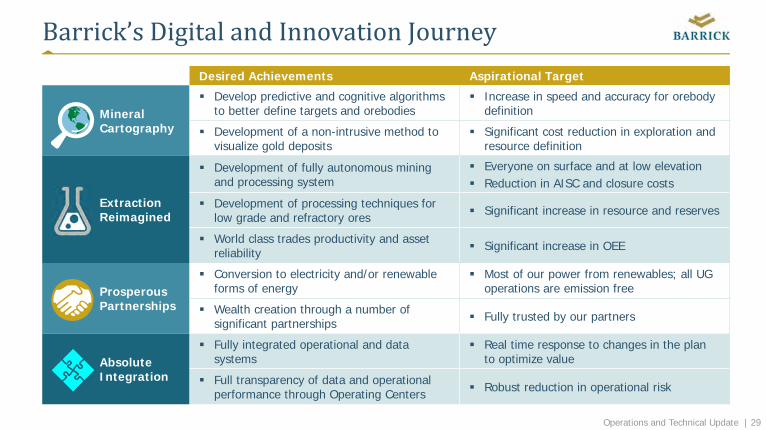
Barrick’s DigitalandInnovationJourneyDesired Achievements Aspirational Target
MineralCartography
Develop predictive and cognitive algorithms to better define targets and orebodies
Increase in speed and accuracy for orebody definition
Development of a non-intrusive method to visualize gold deposits
Significant cost reduction in exploration and resource definition
ExtractionReimagined
Development of fully autonomous mining and processing system
Everyone on surface and at low elevation Reduction in AISC and closure costs
Development of processing techniques for low grade and refractory ores Significant increase in resource and reserves
World class trades productivity and asset reliability Significant increase in OEE
ProsperousPartnerships
Conversion to electricity and/or renewable forms of energy
Most of our power from renewables; all UG operations are emission free
Wealth creation through a number of significant partnerships Fully trusted by our partners
AbsoluteIntegration
Fully integrated operational and data systems
Real time response to changes in the plan to optimize value
Full transparency of data and operational performance through Operating Centers Robust reduction in operational risk

Operations and Technical Update | 30
Long‐termPortfolioOptionality
MattGiliChiefTechnicalOfficer
Operations and Technical Update | 31
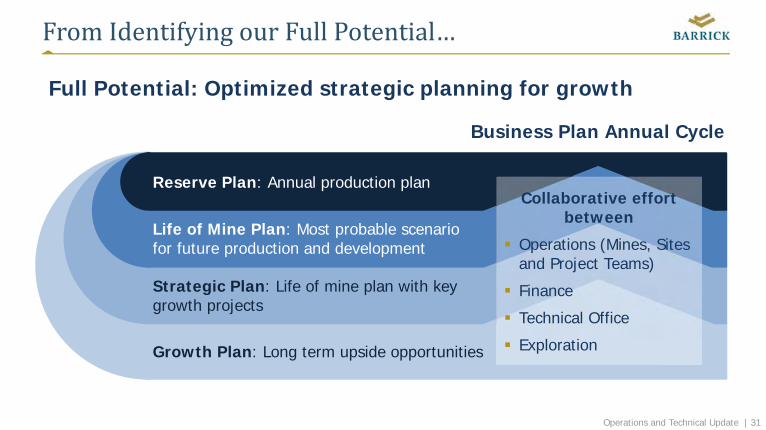
Growth Plan: Long term upside opportunities
Strategic Plan: Life of mine plan with key growth projects
FromIdentifyingourFullPotential…
Full Potential: Optimized strategic planning for growth
Life of Mine Plan: Most probable scenario for future production and development
Business Plan Annual Cycle
Reserve Plan: Annual production planCollaborative effort
between
Operations (Mines, Sites and Project Teams)
Finance
Technical Office
Exploration
Operations and Technical Update | 32
Technical Limits
LOM Plan
VRS
Cas
h Fl
ow
NPV
Short term(1-2 years)
Best-in-Class
Long term(3-5 years)Growth
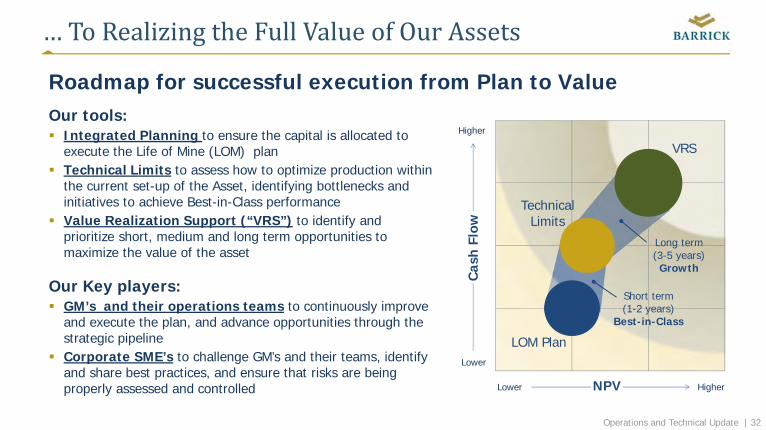
…ToRealizingtheFullValueofOurAssets
Roadmap for successful execution from Plan to Value Our tools: Integrated Planning to ensure the capital is allocated to
execute the Life of Mine (LOM) plan Technical Limits to assess how to optimize production within
the current set-up of the Asset, identifying bottlenecks and initiatives to achieve Best-in-Class performance
Value Realization Support (“VRS”) to identify and prioritize short, medium and long term opportunities to maximize the value of the asset
Our Key players: GM’s and their operations teams to continuously improve
and execute the plan, and advance opportunities through the strategic pipeline
Corporate SME’s to challenge GM’s and their teams, identify and share best practices, and ensure that risks are being properly assessed and controlled Higher
Higher
Lower
Lower
Operations and Technical Update | 33
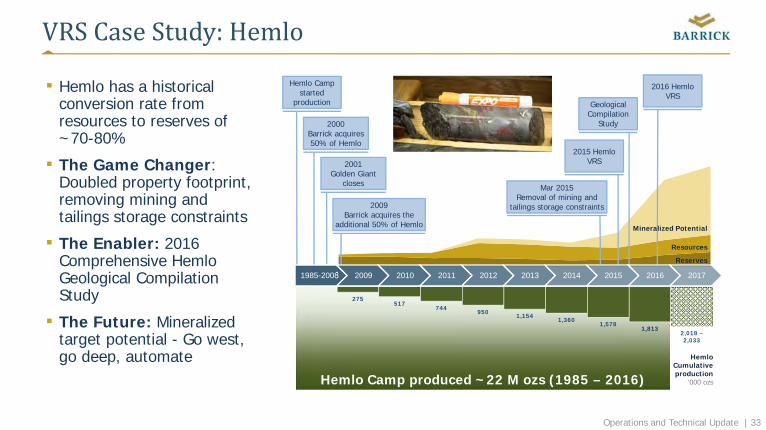
Hemlo Camp produced ~22 M ozs (1985 – 2016)
VRSCaseStudy:Hemlo
▪ Hemlo has a historical conversion rate from resources to reserves of ~70-80%
▪ The Game Changer: Doubled property footprint, removing mining and tailings storage constraints
▪ The Enabler: 2016 Comprehensive HemloGeological Compilation Study
▪ The Future: Mineralized target potential - Go west, go deep, automate
275517
744950
1,1541,360
1,5781,813
2,025
Mar 2015Removal of mining and
tailings storage constraints
2015 HemloVRS
2016 HemloVRS
Hemlo Camp started
production Geological Compilation
Study
2009Barrick acquires the
additional 50% of Hemlo
2000Barrick acquires 50% of Hemlo
1985-2008 2009 2010 2011 2012 2013 2014 2015 2016 2017
HemloCumulative production
‘000 ozs
Mineralized Potential
Resources
Reserves
2001Golden Giant
closes
2,018 –2,033
Operations and Technical Update | 34
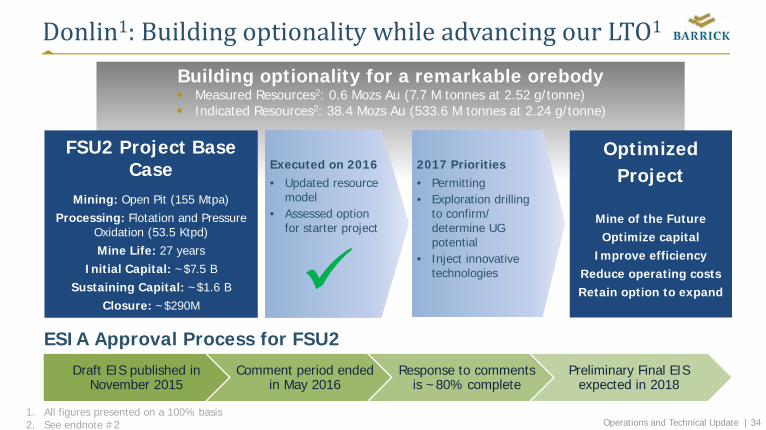
Donlin1:BuildingoptionalitywhileadvancingourLTO1
Building optionality for a remarkable orebody Measured Resources2: 0.6 Mozs Au (7.7 M tonnes at 2.52 g/tonne) Indicated Resources2: 38.4 Mozs Au (533.6 M tonnes at 2.24 g/tonne)
ESIA Approval Process for FSU2
FSU2 Project Base Case
Mining: Open Pit (155 Mtpa)Processing: Flotation and Pressure
Oxidation (53.5 Ktpd) Mine Life: 27 years
Initial Capital: ~$7.5 BSustaining Capital: ~$1.6 B
Closure: ~$290M
Draft EIS published in November 2015
Comment period ended in May 2016
Response to comments is ~80% complete
Preliminary Final EIS expected in 2018
Optimized Project
Mine of the FutureOptimize capital
Improve efficiencyReduce operating costsRetain option to expand
Executed on 2016• Updated resource
model• Assessed option
for starter project
2017 Priorities• Permitting• Exploration drilling
to confirm/determine UG potential
• Inject innovative technologies
1. All figures presented on a 100% basis2. See endnote #2
Operations and Technical Update | 35
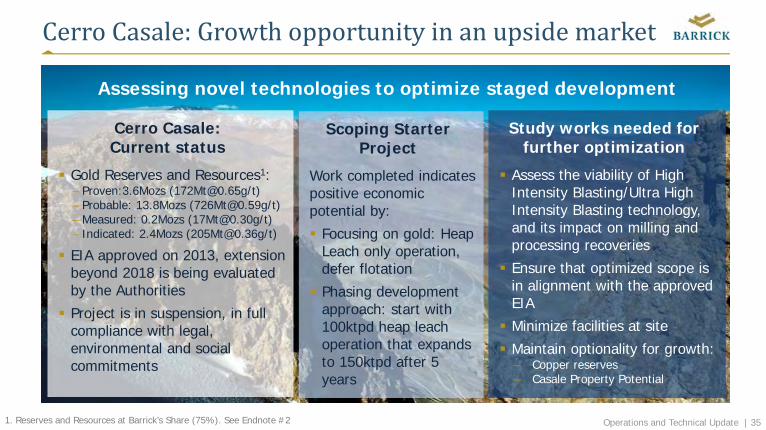
CerroCasale:Growthopportunityinanupsidemarket
Cerro Casale: Current status
Gold Reserves and Resources1:– Proven:3.6Mozs ([email protected]/t)– Probable: 13.8Mozs ([email protected]/t)– Measured: 0.2Mozs ([email protected]/t)– Indicated: 2.4Mozs ([email protected]/t)
EIA approved on 2013, extension beyond 2018 is being evaluated by the Authorities
Project is in suspension, in full compliance with legal, environmental and social commitments
Scoping Starter Project
Work completed indicates positive economic potential by:
Focusing on gold: Heap Leach only operation, defer flotation
Phasing development approach: start with 100ktpd heap leach operation that expands to 150ktpd after 5 years
Study works needed for further optimization
Assess the viability of High Intensity Blasting/Ultra High Intensity Blasting technology, and its impact on milling and processing recoveries
Ensure that optimized scope is in alignment with the approved EIA
Minimize facilities at site
Maintain optionality for growth:– Copper reserves– Casale Property Potential
Assessing novel technologies to optimize staged development
1. Reserves and Resources at Barrick’s Share (75%). See Endnote #2
Operations and Technical Update | 36
BarrickNevada– SecuringtheFuture
BillMacNevinBarrickNevadaCEO

Operations and Technical Update | 37
UnifyingNevadaAssets
Enabler of Change
First Step – What? Vision – How? Drive – Why?WeareunitingourCortezandGoldstrike operationsinNevada,combiningassets,infrastructureandexpertise…
…buildingonourcombinedstrengthsbyunitingtheseoperationsunderonesitebasedleadershipstructure…
…inordertocreatenewopportunitiesandgrowthebusinessforourpeople,communitiesandownersbydrivingimprovementsinefficiencyandproductivity
Operations and Technical Update | 38
BarrickNevadaValueCapture Targeting lower AISC/oz through combined efficiency and productivity improvements
– Focus talent and resources from whole business on opportunities of greatest value
Integrated collaboration and joint metal planning to optimize ore processing– Improve consistency of ore feed improving throughput in the Roaster
Integrated Leadership Team to share and adopt best practices– Prioritizing equipment and people to improve free cash flow
Deliver improved free cash flow through integrated processing operations– Deploy an integrated planning operating system to identify risk and opportunity in our plans
Expedite Digital Transformation through integrated digital operations management center– Barrick Nevada Operations Support Center to include dispatch for open pit and underground
mines, process control rooms, remote operations work stations to increase the capabilities of our people
Operations and Technical Update | 39
Goldstrike– FocusedonOperationalExcellence
Operations and Technical Update | 40
Goldstrike– Today
Vision – A core operation and processing option of choice focused on improvement, operational excellence and growth to ensure a sustainable, profitable production profile Conventional open pit and underground mining consisting of the Betze-Post open pit
and the Meikle and Rodeo underground mines Meikle and Rodeo are mined by transverse longhole stoping and underhand drift and
fill mining methods Double refractory ore is processed both at the Roaster and the Autoclave/TCM 30 Years of Operations, both open pit and underground, moving 3.5 billion tonnes and
producing 42M ounces – still going strong
Highlights of 2016:– Commenced commercial production at Arturo– Autoclave/TCM technology performing in line with expectations– Lowered water table to access high margin ounces in the underground– Delivered additional free cash flow through focus on operational excellence
Operations and Technical Update | 41
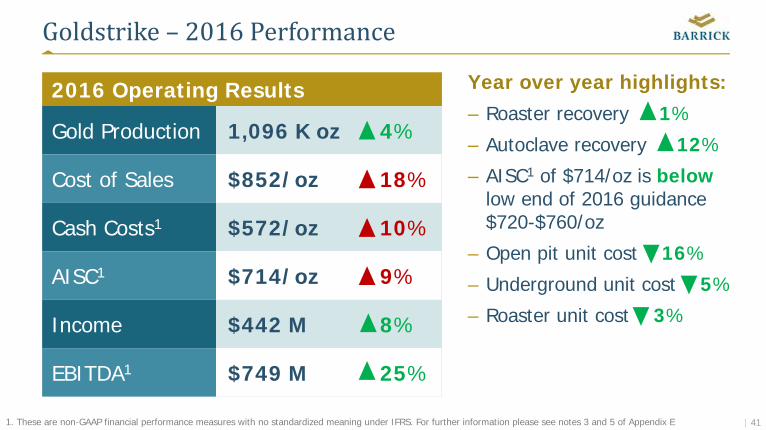
Goldstrike – 2016Performance
Year over year highlights:– Roaster recovery 1%
– Autoclave recovery 12%
– AISC1 of $714/oz is belowlow end of 2016 guidance $720-$760/oz
– Open pit unit cost 16%
– Underground unit cost 5%
– Roaster unit cost 3%
2016 Operating Results
Gold Production 1,096 K oz 4%
Cost of Sales $852/oz 18%
Cash Costs1 $572/oz 10%
AISC1 $714/oz 9%
Income $442 M 8%
EBITDA1 $749 M 25%
1. These are non-GAAP financial performance measures with no standardized meaning under IFRS. For further information please see notes 3 and 5 of Appendix E
Operations and Technical Update | 42
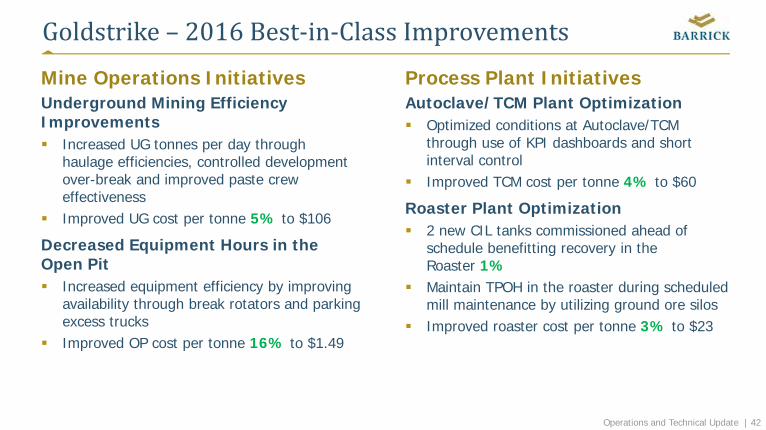
Goldstrike– 2016Best‐in‐ClassImprovementsMine Operations InitiativesUnderground Mining Efficiency Improvements Increased UG tonnes per day through
haulage efficiencies, controlled development over-break and improved paste crew effectiveness
Improved UG cost per tonne 5% to $106
Decreased Equipment Hours in the Open Pit Increased equipment efficiency by improving
availability through break rotators and parking excess trucks
Improved OP cost per tonne 16% to $1.49
Process Plant InitiativesAutoclave/TCM Plant Optimization Optimized conditions at Autoclave/TCM
through use of KPI dashboards and short interval control
Improved TCM cost per tonne 4% to $60
Roaster Plant Optimization 2 new CIL tanks commissioned ahead of
schedule benefitting recovery in the Roaster 1%
Maintain TPOH in the roaster during scheduled mill maintenance by utilizing ground ore silos
Improved roaster cost per tonne 3% to $23
Operations and Technical Update | 43
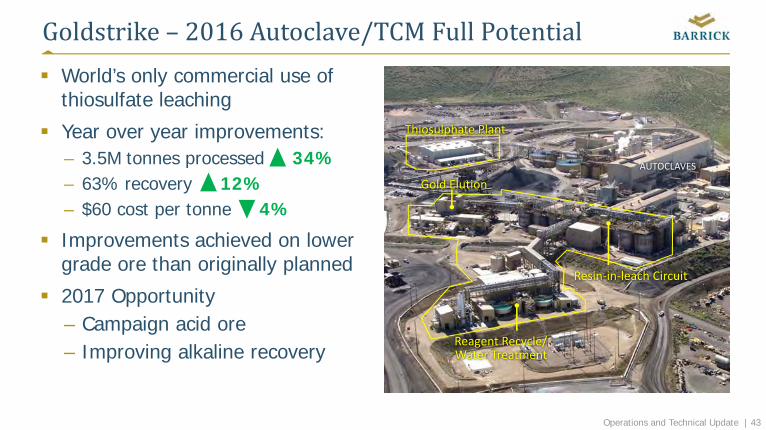
Goldstrike– 2016Autoclave/TCMFullPotential World’s only commercial use of
thiosulfate leaching
Year over year improvements:– 3.5M tonnes processed 34%– 63% recovery 12%– $60 cost per tonne 4%
Improvements achieved on lower grade ore than originally planned
2017 Opportunity– Campaign acid ore– Improving alkaline recovery
Resin‐in‐leach Circuit
Reagent Recycle/Water Treatment
Thiosulphate Plant
AUTOCLAVES
Gold Elution
Operations and Technical Update | 44
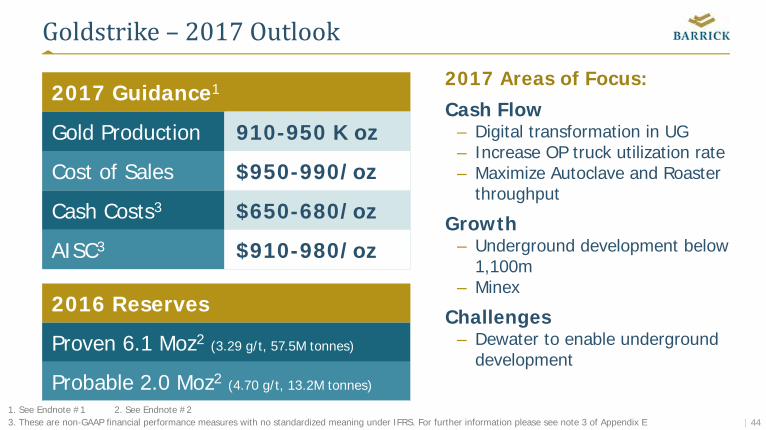
Goldstrike – 2017Outlook
2017 Guidance1
Gold Production 910-950 K oz
Cost of Sales $950-990/oz
Cash Costs3 $650-680/oz
AISC3 $910-980/oz
2017 Areas of Focus:
Cash Flow– Digital transformation in UG – Increase OP truck utilization rate– Maximize Autoclave and Roaster
throughput
Growth– Underground development below
1,100m– Minex
Challenges– Dewater to enable underground
development
2016 Reserves
Proven 6.1 Moz2 (3.29 g/t, 57.5M tonnes)
Probable 2.0 Moz2 (4.70 g/t, 13.2M tonnes)
1. See Endnote #1 2. See Endnote #23. These are non-GAAP financial performance measures with no standardized meaning under IFRS. For further information please see note 3 of Appendix E
Operations and Technical Update | 45
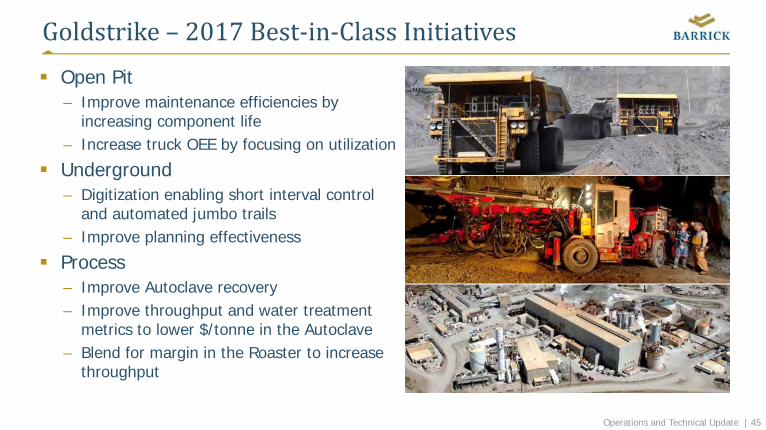
Goldstrike – 2017Best‐in‐ClassInitiatives Open Pit
– Improve maintenance efficiencies by increasing component life
– Increase truck OEE by focusing on utilization
Underground– Digitization enabling short interval control
and automated jumbo trails– Improve planning effectiveness
Process – Improve Autoclave recovery – Improve throughput and water treatment
metrics to lower $/tonne in the Autoclave– Blend for margin in the Roaster to increase
throughput
Operations and Technical Update | 46
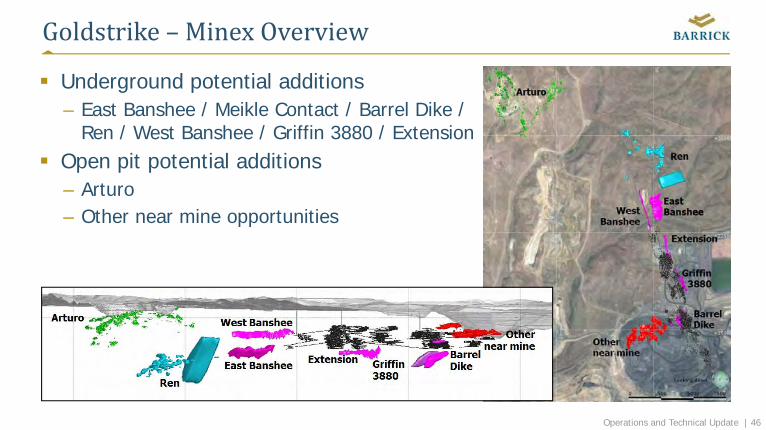
Goldstrike– MinexOverview
Underground potential additions– East Banshee / Meikle Contact / Barrel Dike /
Ren / West Banshee / Griffin 3880 / Extension Open pit potential additions
– Arturo– Other near mine opportunities
Operations and Technical Update | 47
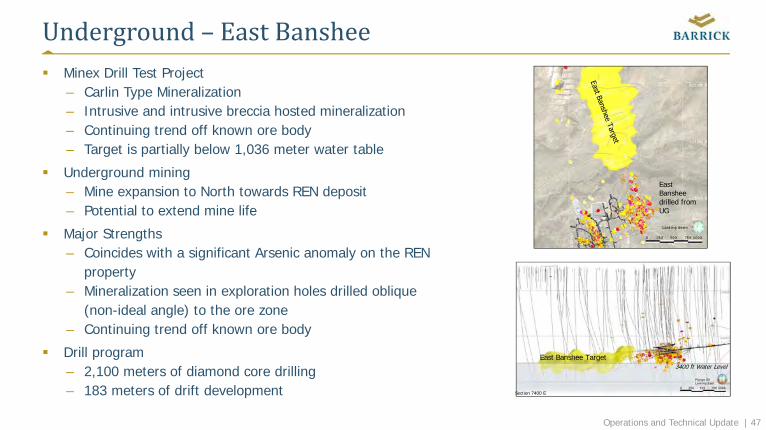
Underground– EastBanshee Minex Drill Test Project
– Carlin Type Mineralization– Intrusive and intrusive breccia hosted mineralization– Continuing trend off known ore body– Target is partially below 1,036 meter water table
Underground mining– Mine expansion to North towards REN deposit – Potential to extend mine life
Major Strengths– Coincides with a significant Arsenic anomaly on the REN
property– Mineralization seen in exploration holes drilled oblique
(non-ideal angle) to the ore zone– Continuing trend off known ore body
Drill program– 2,100 meters of diamond core drilling – 183 meters of drift development
East Banshee drilled from UG
3400 ft Water Level
Section 7400 E
East Banshee Target

Operations and Technical Update | 48
OpenPit‐ Arturo:Phases1,2,&3withGoldGradeShells
Additional Phases of Arturo utilizing existing mine equipment
Mining and process facilities are permitted
Under evaluation– Leach pad feasibility– Economics– Recoveries– Mining costs– In-pit backfill (backfilling not
permitted)
Mining will expose new geology and potential deep UG exploration targets
Phase 1Exploration Target
Phase 2: Mining completed Feb 2017
Phase 3Exploration Target
Operations and Technical Update | 49
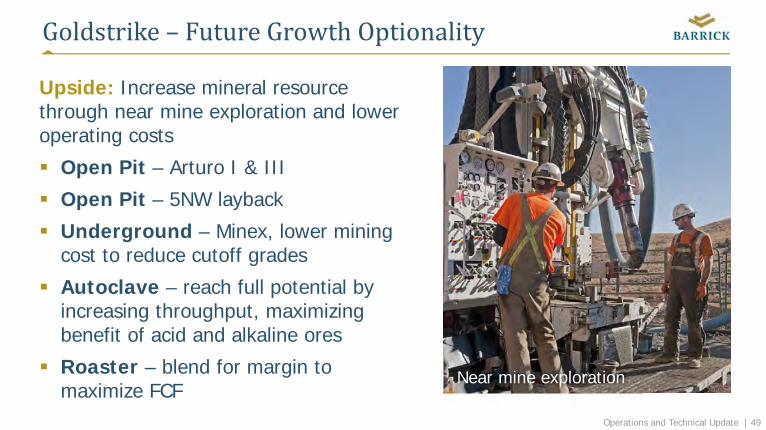
Goldstrike– FutureGrowthOptionality
Upside: Increase mineral resource through near mine exploration and lower operating costs
Open Pit – Arturo I & III
Open Pit – 5NW layback
Underground – Minex, lower mining cost to reduce cutoff grades
Autoclave – reach full potential byincreasing throughput, maximizingbenefit of acid and alkaline ores
Roaster – blend for margin to maximize FCF
Near mine exploration
Operations Technical Update Day | 50
Cortez– OrganicandTechnicalGrowth
CurtisCadwellGeneralManagerOperationsBarrick Nevada

Operations Technical Update Day | 51
Cortez– Today
Vision is to be a multi-mine operation, focused on increasing cash flow through relentless pursuit of operational excellence while generating sustainable growth Open pit and underground mining consisting of Pipeline open pit and Cortez
Hills open pit and underground Oxide ore is processed using heap leach and Oxide SAG+CIL, refractory ore
trucked to Goldstrike Roaster or TCM circuit Achievements in 2016:
– 43% reduction in reportable safety incidents from 2015 to lowest reporting rate on record for Cortez
– Commenced Digitization projects with focus on automation, process control, and maintenance data
– Commenced development of the Range Front Declines to increase Cortez Hills UG production
Operations Technical Update Day | 52
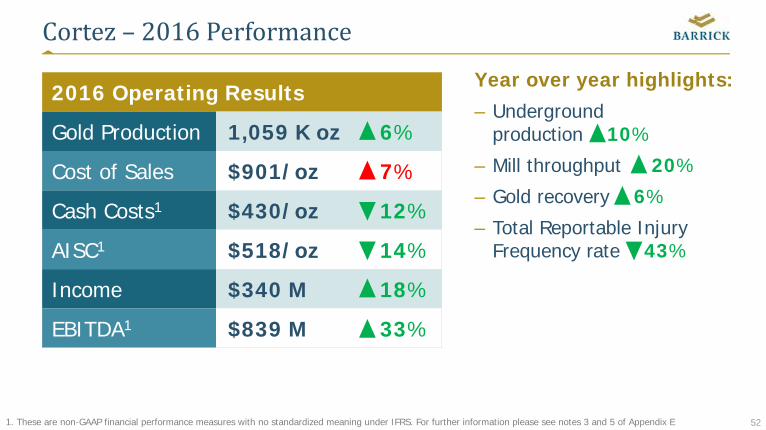
Cortez– 2016Performance
Year over year highlights:– Underground
production 10%
– Mill throughput 20%
– Gold recovery 6%
– Total Reportable Injury Frequency rate 43%
2016 Operating Results
Gold Production 1,059 K oz 6%
Cost of Sales $901/oz 7%
Cash Costs1 $430/oz 12%
AISC1 $518/oz 14%
Income $340 M 18%
EBITDA1 $839 M 33%
1. These are non-GAAP financial performance measures with no standardized meaning under IFRS. For further information please see notes 3 and 5 of Appendix E

Operations Technical Update Day | 53
Cortez– 2016Best‐in‐ClassInitiatives Open pit productivity initiatives
– Introduced operator scorecards– Adopted short interval control process
and focused on right loading of trucks– Digital work management and predictive
maintenance improving truck availability
Step change in underground production– Move to bulk mining increased efficiencies
and lowered mining cost per tonne– Completed 10 benches– Completed first long hole stope
UG operating performance
Operations Technical Update Day | 54
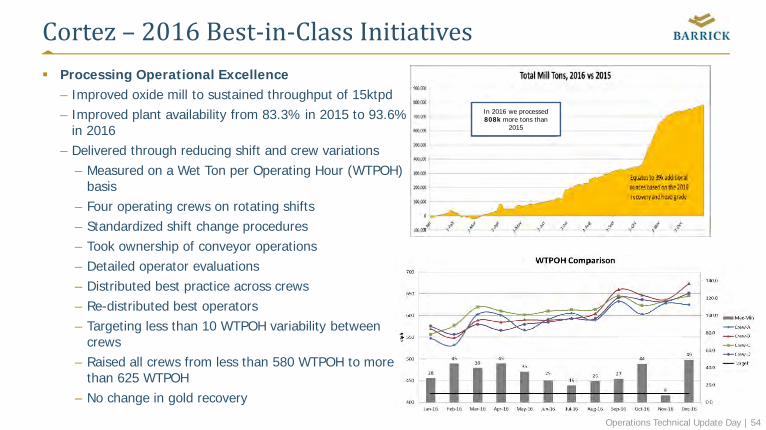
Cortez– 2016Best‐in‐ClassInitiatives Processing Operational Excellence
– Improved oxide mill to sustained throughput of 15ktpd– Improved plant availability from 83.3% in 2015 to 93.6%
in 2016– Delivered through reducing shift and crew variations
– Measured on a Wet Ton per Operating Hour (WTPOH) basis
– Four operating crews on rotating shifts– Standardized shift change procedures– Took ownership of conveyor operations– Detailed operator evaluations– Distributed best practice across crews– Re-distributed best operators– Targeting less than 10 WTPOH variability between
crews– Raised all crews from less than 580 WTPOH to more
than 625 WTPOH– No change in gold recovery
In 2016 we processed 808k more tons than
2015

Operations Technical Update Day | 55
Cortez– 2017Outlook2017 Areas of Focus:
Cash Flow– Digital transformation– Mining Cost reductions in Open Pit
and Underground– Mill throughput improvement
Growth– Lower Zone UG (in construction)– Crossroads OP (in construction)– Deep South UG (permitting)
Challenges– Execute Water Management Plan in
compliance with new Federal and State requirements
2017 Guidance1
Gold Production 1,250-1,290 Koz
Cost of Sales $730-760/oz
Cash Costs3 $360-380/oz
AISC3 $430-470/oz
2016 Reserves
Proven 0.8 Moz2 (1.52 g/t, 16M tonnes)
Probable 9.4 Moz2 (2.18 g/t, 135M tonnes)
1. See Endnote #1 2. See Endnote #23. These are non-GAAP financial performance measures with no standardized meaning under IFRS. For further information please see note 3 of Appendix E
Operations Technical Update Day | 56
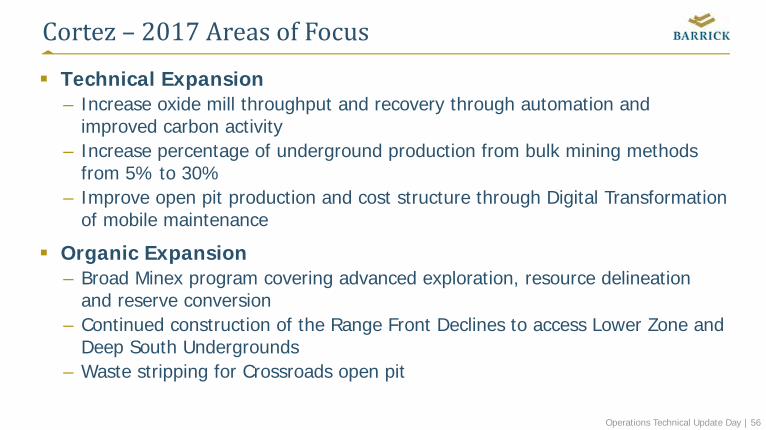
Cortez– 2017AreasofFocus
Technical Expansion– Increase oxide mill throughput and recovery through automation and
improved carbon activity– Increase percentage of underground production from bulk mining methods
from 5% to 30%– Improve open pit production and cost structure through Digital Transformation
of mobile maintenance
Organic Expansion– Broad Minex program covering advanced exploration, resource delineation
and reserve conversion– Continued construction of the Range Front Declines to access Lower Zone and
Deep South Undergrounds– Waste stripping for Crossroads open pit
Operations Technical Update Day | 57
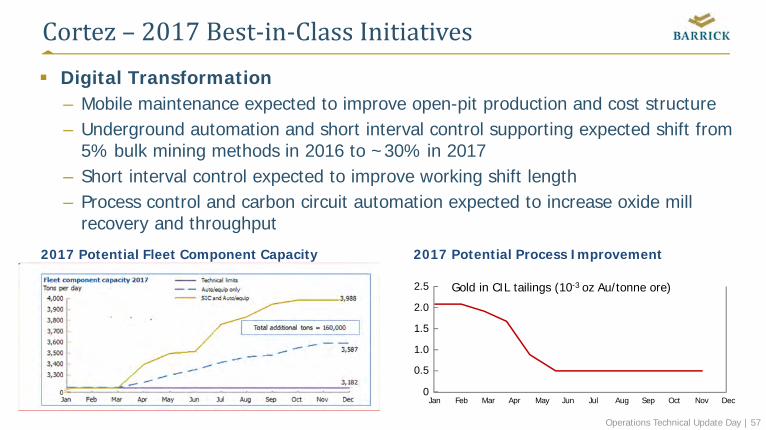
Cortez– 2017Best‐in‐ClassInitiatives Digital Transformation
– Mobile maintenance expected to improve open-pit production and cost structure– Underground automation and short interval control supporting expected shift from
5% bulk mining methods in 2016 to ~30% in 2017– Short interval control expected to improve working shift length– Process control and carbon circuit automation expected to increase oxide mill
recovery and throughput
2017 Potential Fleet Component Capacity 2017 Potential Process Improvement
2.5
2.0
1.5
1.0
0.5
0Jan Feb Mar Apr May Jun Jul Aug Sep Oct Nov Dec
Gold in CIL tailings (10-3 oz Au/tonne ore)
Operations Technical Update Day | 58
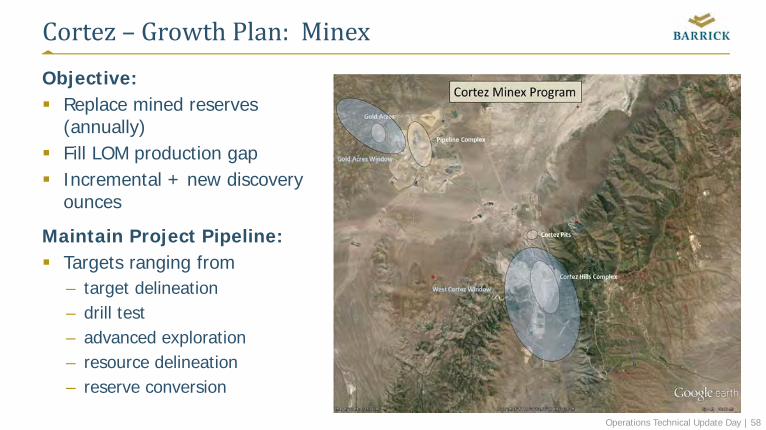
Cortez– GrowthPlan:MinexObjective: Replace mined reserves
(annually) Fill LOM production gap Incremental + new discovery
ounces
Maintain Project Pipeline: Targets ranging from
– target delineation– drill test– advanced exploration– resource delineation– reserve conversion
Operations Technical Update Day | 59
Project Current Status Capex
2017
2018
2019
2020
2021
2022
2023
2024
2025
2026
2027
2028
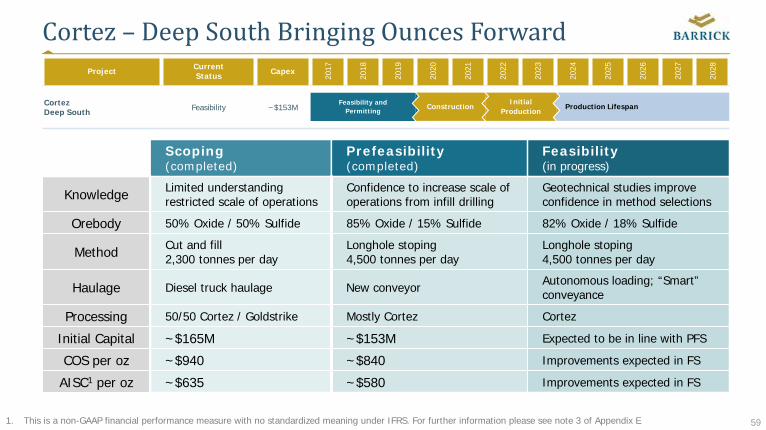
Cortez Deep South Feasibility ~$153M
Scoping (completed)
Prefeasibility (completed)
Feasibility (in progress)
Knowledge Limited understandingrestricted scale of operations
Confidence to increase scale of operations from infill drilling
Geotechnical studies improve confidence in method selections
Orebody 50% Oxide / 50% Sulfide 85% Oxide / 15% Sulfide 82% Oxide / 18% Sulfide
Method Cut and fill2,300 tonnes per day
Longhole stoping4,500 tonnes per day
Longhole stoping4,500 tonnes per day
Haulage Diesel truck haulage New conveyor Autonomous loading; “Smart” conveyance
Processing 50/50 Cortez / Goldstrike Mostly Cortez Cortez
Initial Capital ~$165M ~$153M Expected to be in line with PFS
COS per oz ~$940 ~$840 Improvements expected in FS
AISC1 per oz ~$635 ~$580 Improvements expected in FS
Cortez– DeepSouthBringingOuncesForward
Production LifespanConstructionFeasibility andPermitting
InitialProduction
1. This is a non-GAAP financial performance measure with no standardized meaning under IFRS. For further information please see note 3 of Appendix E
Operations Technical Update Day | 60
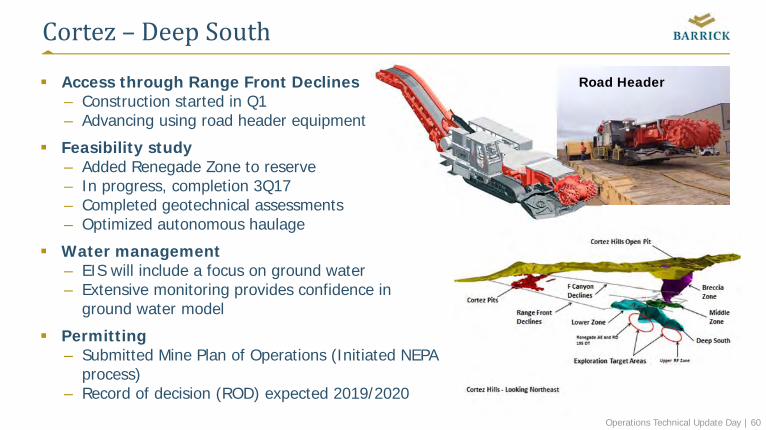
Cortez– DeepSouth
Access through Range Front Declines– Construction started in Q1– Advancing using road header equipment
Feasibility study – Added Renegade Zone to reserve– In progress, completion 3Q17– Completed geotechnical assessments– Optimized autonomous haulage
Water management– EIS will include a focus on ground water – Extensive monitoring provides confidence in
ground water model
Permitting– Submitted Mine Plan of Operations (Initiated NEPA
process)– Record of decision (ROD) expected 2019/2020
Road Header
Operations Technical Update Day | 61
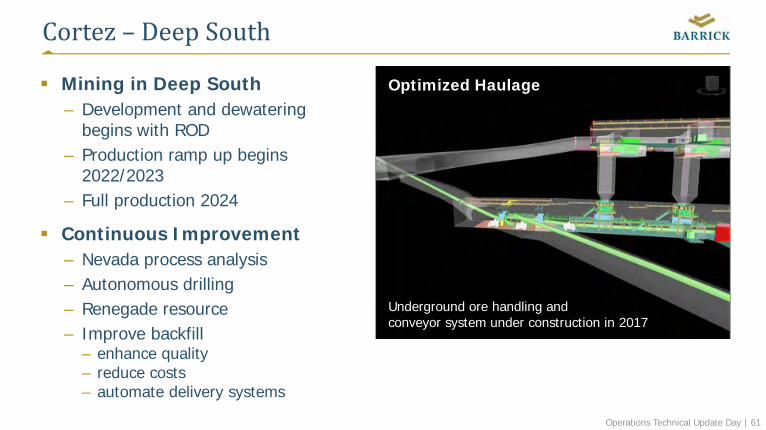
Cortez– DeepSouth
Mining in Deep South – Development and dewatering
begins with ROD– Production ramp up begins
2022/2023 – Full production 2024
Continuous Improvement– Nevada process analysis– Autonomous drilling– Renegade resource– Improve backfill
– enhance quality– reduce costs– automate delivery systems
Optimized Haulage
Underground ore handling and conveyor system under construction in 2017

Operations Technical Update Day | 62
Cortez– TechnicalandOrganicGrowthOptionality
Technical Growth Lower mining costs to reduce cutoff grades Increased mill throughput and recoveries to
increase produced gold
Organic Growth Open Pit
– Expansion of the Gold Acres pit– Expansion of the Pediment area– Additional Crossroads phase
Underground– Ponderosa North Area– Lower Zone expansion– Renegade and Upper RF Zones
Operations Technical Update Day | 63
Goldrush– EnhancingValue
Operations Technical Update Day | 64
Project Current Status Capex
2017
2018
2019
2020
2021
2022
2023
2024
2025
2026
2027
2028
2029
2030
2031
2032
2033
2034
2035
2036
2037
2038
2039
2040
2041
2042
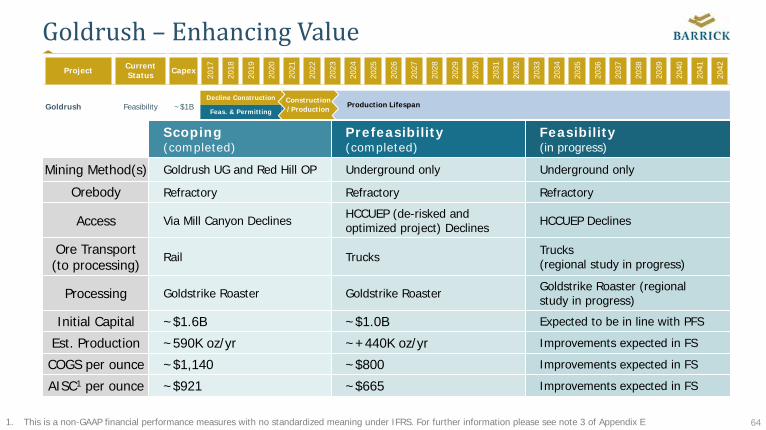
Goldrush Feasibility ~$1B
Goldrush– EnhancingValue
Scoping (completed)
Prefeasibility(completed)
Feasibility (in progress)
Mining Method(s) Goldrush UG and Red Hill OP Underground only Underground only
Orebody Refractory Refractory Refractory
Access Via Mill Canyon Declines HCCUEP (de-risked and optimized project) Declines HCCUEP Declines
Ore Transport (to processing)
Rail Trucks Trucks (regional study in progress)
Processing Goldstrike Roaster Goldstrike Roaster Goldstrike Roaster (regional study in progress)
Initial Capital ~$1.6B ~$1.0B Expected to be in line with PFS
Est. Production ~590K oz/yr ~+440K oz/yr Improvements expected in FS
COGS per ounce ~$1,140 ~$800 Improvements expected in FS
AISC1 per ounce ~$921 ~$665 Improvements expected in FS
Production LifespanDecline Construction
Feas. & Permitting
Construction/Production
1. This is a non-GAAP financial performance measures with no standardized meaning under IFRS. For further information please see note 3 of Appendix E
Operations Technical Update Day | 65
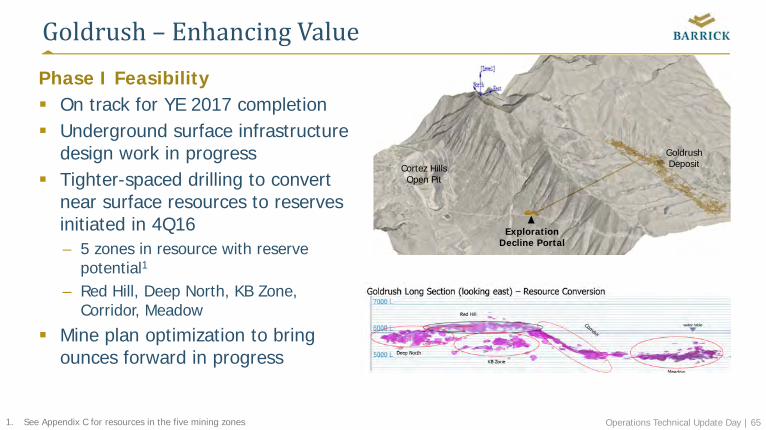
Goldrush– EnhancingValuePhase I Feasibility On track for YE 2017 completion Underground surface infrastructure
design work in progress Tighter-spaced drilling to convert
near surface resources to reserves initiated in 4Q16– 5 zones in resource with reserve
potential1
– Red Hill, Deep North, KB Zone, Corridor, Meadow
Mine plan optimization to bring ounces forward in progress
ExplorationDecline Portal
Cortez HillsOpen Pit
GoldrushDeposit
1. See Appendix C for resources in the five mining zones

Operations Technical Update Day | 66
TurquoiseRidge– BuildingonSuccess
HenriGoninGeneralManagerTurquoiseRidge, Nevada
Operations Technical Update Day | 67
TurquoiseRidge– Today
Our vision is to responsibly grow our mine into a core asset for our stakeholders and our people, delivering maximized value through the agile application of innovative technologies, methodologies and systems
75% owned joint venture, underground mine using drift and fill mining method. Ore is processed through Newmont’s neighboring Twin Creeks facility.
Achievements in 2016:– 2016 marks the doubling of production in five years at Turquoise Ridge– Winner of Nevada Mining Assoc. Safety Award for large underground mine– Record low mining cost– Record low AISC
Operations Technical Update Day | 68
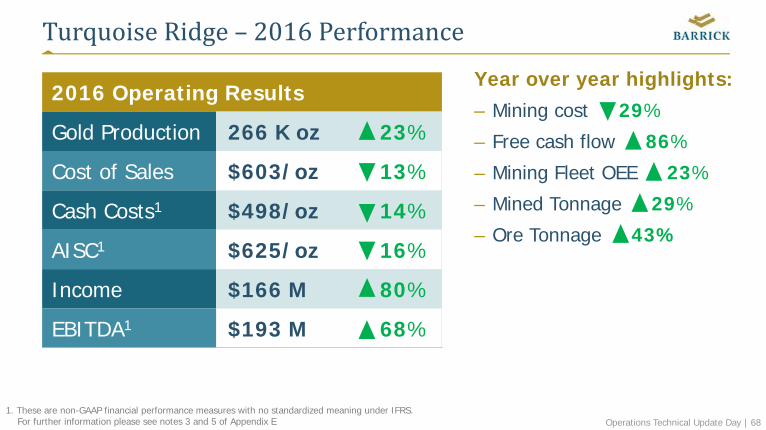
TurquoiseRidge– 2016Performance
Year over year highlights:– Mining cost 29%
– Free cash flow 86%
– Mining Fleet OEE 23%
– Mined Tonnage 29%
– Ore Tonnage 43%
2016 Operating Results
Gold Production 266 K oz 23%
Cost of Sales $603/oz 13%
Cash Costs1 $498/oz 14%
AISC1 $625/oz 16%
Income $166 M 80%
EBITDA1 $193 M 68%
1. These are non-GAAP financial performance measures with no standardized meaning under IFRS. For further information please see notes 3 and 5 of Appendix E
Operations Technical Update Day | 69
Old FWD-2721Level Design
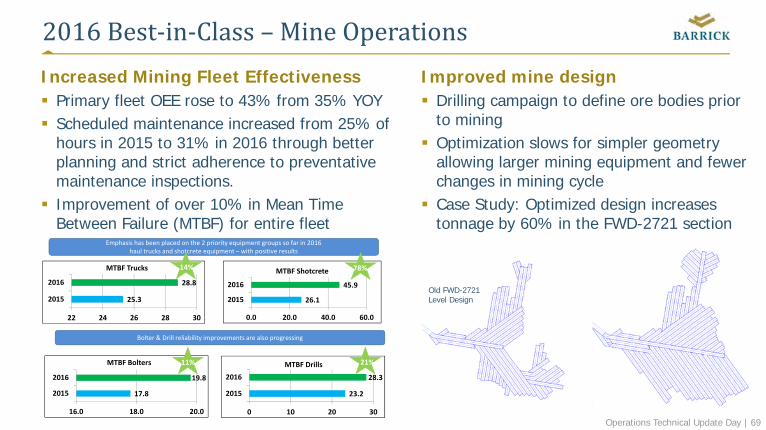
2016Best‐in‐Class– MineOperationsIncreased Mining Fleet Effectiveness Primary fleet OEE rose to 43% from 35% YOY Scheduled maintenance increased from 25% of
hours in 2015 to 31% in 2016 through better planning and strict adherence to preventative maintenance inspections.
Improvement of over 10% in Mean Time Between Failure (MTBF) for entire fleet
Improved mine design Drilling campaign to define ore bodies prior
to mining Optimization slows for simpler geometry
allowing larger mining equipment and fewer changes in mining cycle
Case Study: Optimized design increases tonnage by 60% in the FWD-2721 section
17.8
19.8
16.0 18.0 20.0
2015
2016
MTBF Bolters
23.2
28.3
0 10 20 30
2015
2016MTBF Drills
26.1
45.9
0.0 20.0 40.0 60.0
2015
2016
MTBF Shotcrete
25.3
28.8
22 24 26 28 30
2015
2016
MTBF Trucks
Bolter & Drill reliability improvements are also progressing
Emphasis has been placed on the 2 priority equipment groups so far in 2016haul trucks and shotcrete equipment – with positive results
78%
21%
14%
11%
Operations Technical Update Day | 70
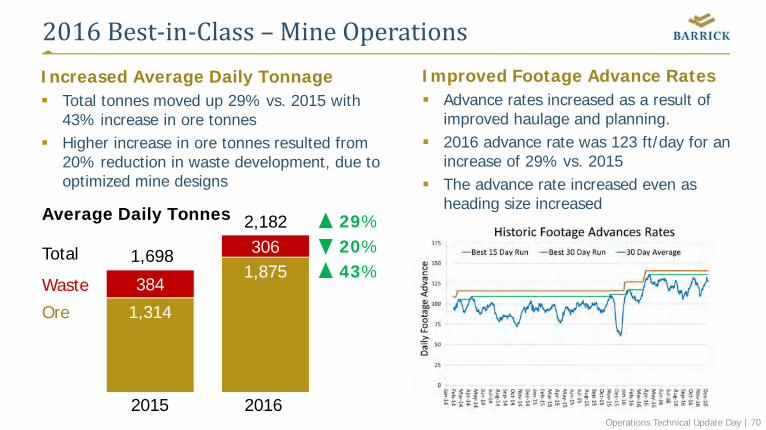
2016Best‐in‐Class– MineOperationsIncreased Average Daily Tonnage Total tonnes moved up 29% vs. 2015 with
43% increase in ore tonnes Higher increase in ore tonnes resulted from
20% reduction in waste development, due to optimized mine designs
Improved Footage Advance Rates Advance rates increased as a result of
improved haulage and planning. 2016 advance rate was 123 ft/day for an
increase of 29% vs. 2015 The advance rate increased even as
heading size increased
1,314
1,875384
3061,698
2,182
2015 2016
29%20%43%
Total
Waste
Ore
Average Daily Tonnes
Operations Technical Update Day | 71
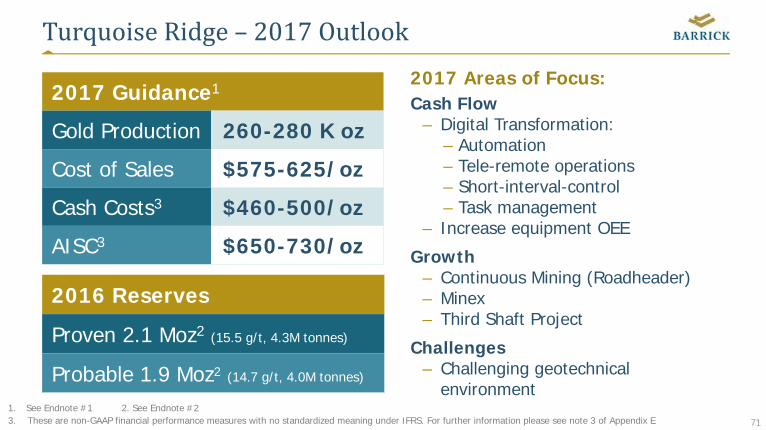
TurquoiseRidge– 2017Outlook2017 Areas of Focus:Cash Flow
– Digital Transformation: – Automation– Tele-remote operations– Short-interval-control– Task management
– Increase equipment OEE
Growth– Continuous Mining (Roadheader)– Minex– Third Shaft Project
Challenges– Challenging geotechnical
environment
2017 Guidance1
Gold Production 260-280 K oz
Cost of Sales $575-625/oz
Cash Costs3 $460-500/oz
AISC3 $650-730/oz
2016 Reserves
Proven 2.1 Moz2 (15.5 g/t, 4.3M tonnes)
Probable 1.9 Moz2 (14.7 g/t, 4.0M tonnes)
1. See Endnote #1 2. See Endnote #2 3. These are non-GAAP financial performance measures with no standardized meaning under IFRS. For further information please see note 3 of Appendix E
Operations Technical Update Day | 72
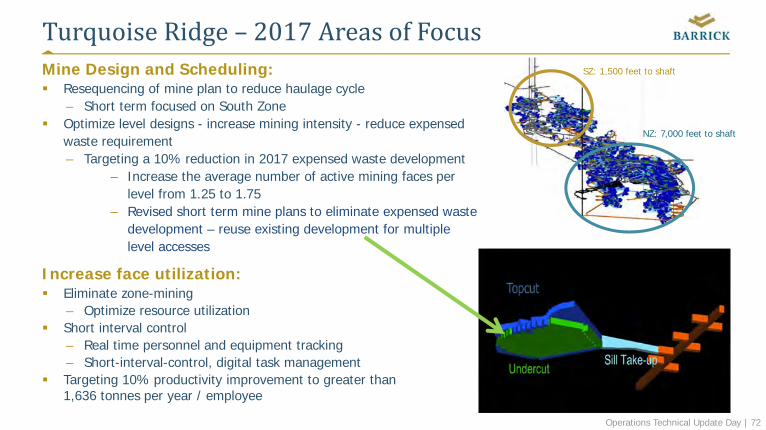
TurquoiseRidge– 2017AreasofFocusMine Design and Scheduling: Resequencing of mine plan to reduce haulage cycle
– Short term focused on South Zone Optimize level designs - increase mining intensity - reduce expensed
waste requirement– Targeting a 10% reduction in 2017 expensed waste development
– Increase the average number of active mining faces per level from 1.25 to 1.75
– Revised short term mine plans to eliminate expensed waste development – reuse existing development for multiple level accesses
Increase face utilization: Eliminate zone-mining
– Optimize resource utilization Short interval control
– Real time personnel and equipment tracking– Short-interval-control, digital task management
Targeting 10% productivity improvement to greater than 1,636 tonnes per year / employee
SZ: 1,500 feet to shaft
NZ: 7,000 feet to shaft
Operations Technical Update Day | 73
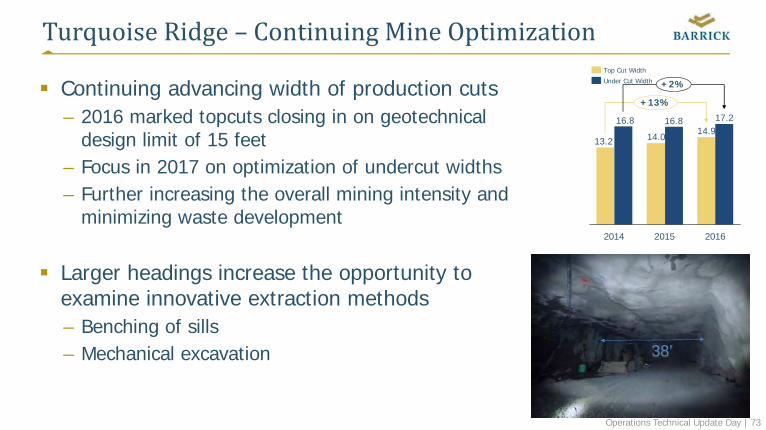
TurquoiseRidge– ContinuingMineOptimization
Continuing advancing width of production cuts– 2016 marked topcuts closing in on geotechnical
design limit of 15 feet– Focus in 2017 on optimization of undercut widths– Further increasing the overall mining intensity and
minimizing waste development
Larger headings increase the opportunity to examine innovative extraction methods– Benching of sills– Mechanical excavation
14.914.013.2
17.216.816.8
2014
+13%
2016
+2%
2015
Under Cut Width
Top Cut Width
38’
Operations Technical Update Day | 74
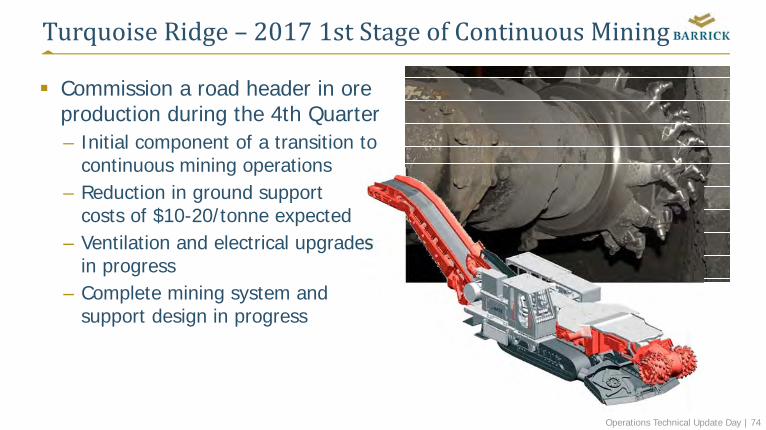
TurquoiseRidge– 20171stStageofContinuousMining
Commission a road header in ore production during the 4th Quarter– Initial component of a transition to
continuous mining operations– Reduction in ground support
costs of $10-20/tonne expected– Ventilation and electrical upgrades
in progress – Complete mining system and
support design in progress
Operations Technical Update Day | 75
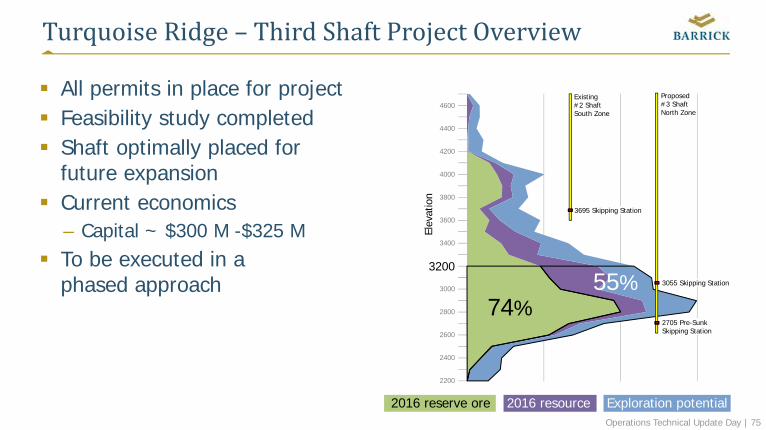
TurquoiseRidge– ThirdShaftProjectOverview
All permits in place for project Feasibility study completed Shaft optimally placed for
future expansion Current economics
– Capital ~ $300 M -$325 M To be executed in a
phased approach
2016 reserve ore 2016 resource Exploration potential
4600
4400
4200
4000
3800
3600
3400
3200
3000
2800
2600
2400
2200
74%55% 3055 Skipping Station
2705 Pre-Sunk Skipping Station
3695 Skipping Station
Existing#2 ShaftSouth Zone
Proposed #3 ShaftNorth Zone
Elev
atio
n
Operations Technical Update Day | 76
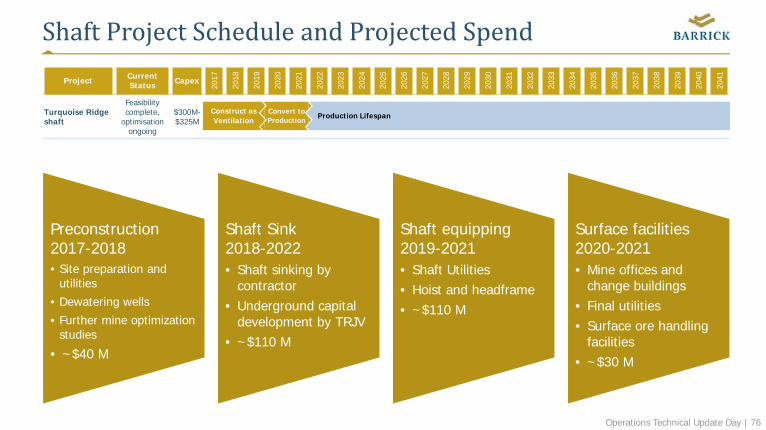
ShaftProjectScheduleandProjectedSpend
Preconstruction2017-2018• Site preparation and
utilities• Dewatering wells• Further mine optimization
studies
• ~$40 M
Shaft Sink2018-2022• Shaft sinking by
contractor• Underground capital
development by TRJV• ~$110 M
Shaft equipping2019-2021• Shaft Utilities• Hoist and headframe• ~$110 M
Surface facilities2020-2021• Mine offices and
change buildings• Final utilities• Surface ore handling
facilities• ~$30 M
Project Current Status Capex
2017
2018
2019
2020
2021
2022
2023
2024
2025
2026
2027
2028
2029
2030
2031
2032
2033
2034
2035
2036
2037
2038
2039
2040
2041
Turquoise Ridge shaft
Feasibility complete,
optimisationongoing
$300M-$325M
Convert to Production Production Lifespan
Construct as Ventilation
Operations Technical Update Day | 77
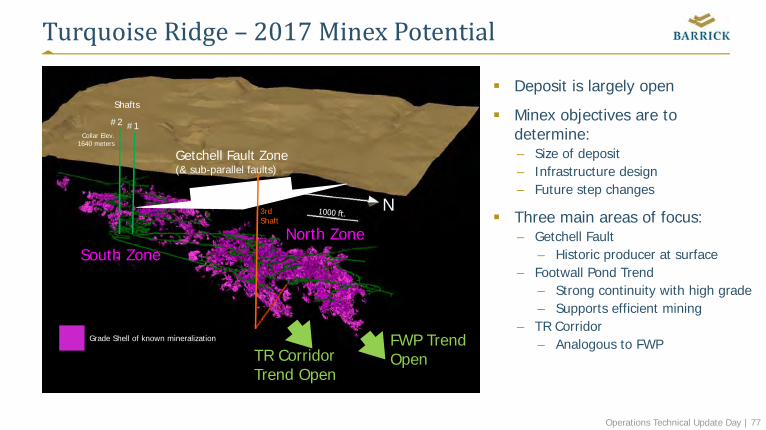
TurquoiseRidge– 2017Minex Potential
FWP TrendOpenTR Corridor
Trend Open
3rdShaft
N
Grade Shell of known mineralization
Shafts
#1#2
North ZoneSouth Zone
Collar Elev.1640 meters
Getchell Fault Zone(& sub-parallel faults)
Deposit is largely open
Minex objectives are to determine:– Size of deposit– Infrastructure design– Future step changes
Three main areas of focus: – Getchell Fault
– Historic producer at surface– Footwall Pond Trend
– Strong continuity with high grade – Supports efficient mining
– TR Corridor – Analogous to FWP
Operations Technical Update Day | 78
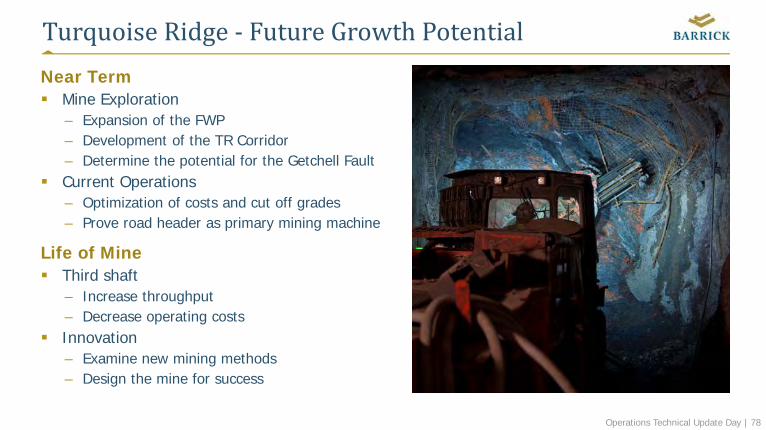
TurquoiseRidge‐ FutureGrowthPotentialNear Term Mine Exploration
– Expansion of the FWP– Development of the TR Corridor– Determine the potential for the Getchell Fault
Current Operations– Optimization of costs and cut off grades– Prove road header as primary mining machine
Life of Mine Third shaft
– Increase throughput– Decrease operating costs
Innovation– Examine new mining methods– Design the mine for success

Operations Technical Update Day | 79
PuebloViejo– ImprovedPerformanceandGrowth
GregWalkerExecutiveGeneralManagerPuebloViejo,DominicanRepublic
Operations Technical Update Day | 80
PuebloViejo– Today
Vision is to grow and mature our business, focusing on developing our people and systems while growing our returns to stakeholders in a responsible way Open pit mining at two large pits, Moore and Montenegro and a satellite
pit, Monte Oculto Norte Conventional truck and shovel operation, the processing is via autoclave,
carbon in leach (CIL) and Copper Precipitation Achievements in 2016:
– Winner of Barrick’s “Most Improved Safety Performance”– Gained contract to close the Dominion Republic government’s old Mejita
tailings dam– Implemented business improvement program and employee development
center

Operations Technical Update Day | 81
PuebloViejo– 2016Performance
Year over year highlights:– Gold recovery 4%
– Silver recovery 30%
– Autoclave OEE 7%
– Truck OEE 4%
– Shovel OEE 2%
– Total Reportable Injury Frequency rate2 25%
2016 Operating Results (60%)
Gold Production 700 K oz 22%
Cost of Sales $564/oz 36%
Cash Costs1 $395/oz 15%
AISC1 $490/oz 18%
Silver Production 3,385 K oz 36%
Income $528 M 130%
EBITDA1 $621 M 59%
1. These are non-GAAP financial performance measures with no standardized meaning under IFRS. For further information please see notes 3 and 5 of Appendix E 2. See endnote #5
Operations Technical Update Day | 82
PuebloViejo– 2016Best‐in‐ClassImprovements
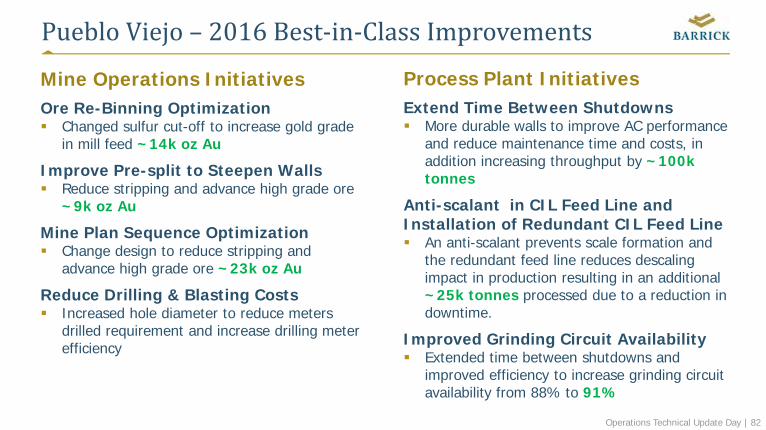
Mine Operations InitiativesOre Re-Binning Optimization Changed sulfur cut-off to increase gold grade
in mill feed ~14k oz Au
Improve Pre-split to Steepen Walls Reduce stripping and advance high grade ore
~9k oz Au
Mine Plan Sequence Optimization Change design to reduce stripping and
advance high grade ore ~23k oz Au
Reduce Drilling & Blasting Costs Increased hole diameter to reduce meters
drilled requirement and increase drilling meter efficiency
Process Plant InitiativesExtend Time Between Shutdowns More durable walls to improve AC performance
and reduce maintenance time and costs, in addition increasing throughput by ~100k tonnes
Anti-scalant in CIL Feed Line and Installation of Redundant CIL Feed Line An anti-scalant prevents scale formation and
the redundant feed line reduces descaling impact in production resulting in an additional ~25k tonnes processed due to a reduction in downtime.
Improved Grinding Circuit Availability Extended time between shutdowns and
improved efficiency to increase grinding circuit availability from 88% to 91%
Operations Technical Update Day | 83
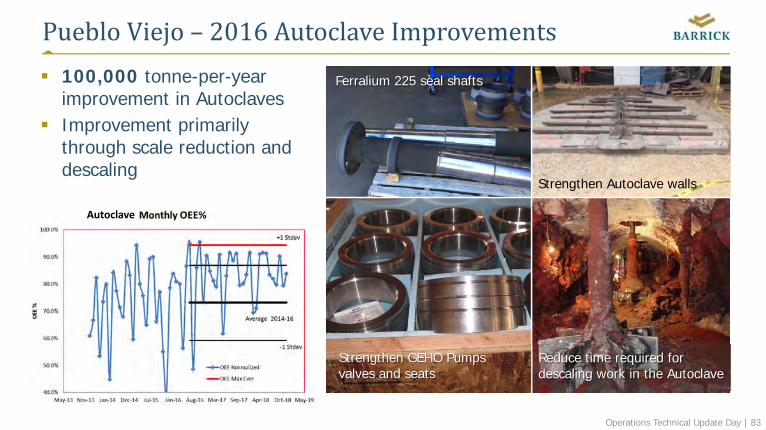
PuebloViejo– 2016AutoclaveImprovements 100,000 tonne-per-year
improvement in Autoclaves Improvement primarily
through scale reduction and descaling
Strengthen Autoclave walls
Ferralium 225 seal shafts
Strengthen GEHO Pumps valves and seats
Reduce time required for descaling work in the Autoclave
KPI improvement metrics to come
Autoclave
Operations Technical Update Day | 84
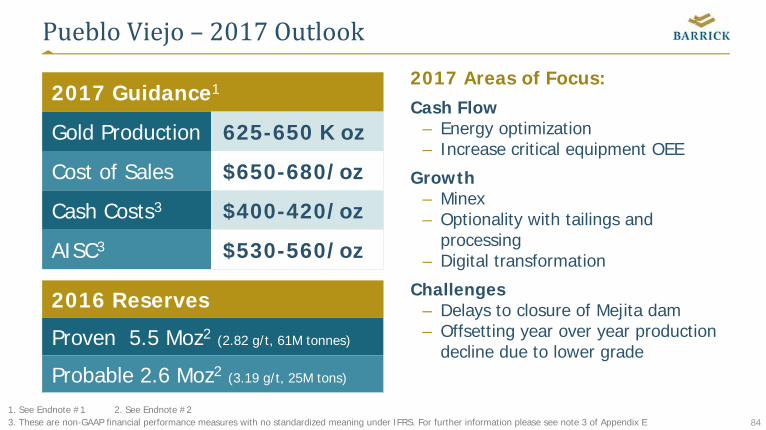
PuebloViejo– 2017Outlook2017 Areas of Focus:Cash Flow
– Energy optimization– Increase critical equipment OEE
Growth– Minex– Optionality with tailings and
processing– Digital transformation
Challenges– Delays to closure of Mejita dam– Offsetting year over year production
decline due to lower grade
2017 Guidance1
Gold Production 625-650 K oz
Cost of Sales $650-680/oz
Cash Costs3 $400-420/oz
AISC3 $530-560/oz
2016 Reserves
Proven 5.5 Moz2 (2.82 g/t, 61M tonnes)
Probable 2.6 Moz2 (3.19 g/t, 25M tons)
1. See Endnote #1 2. See Endnote #23. These are non-GAAP financial performance measures with no standardized meaning under IFRS. For further information please see note 3 of Appendix E
Operations Technical Update Day | 85
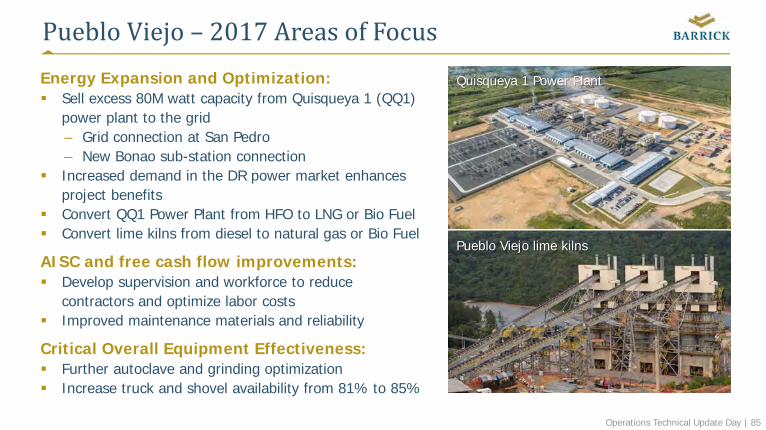
PuebloViejo– 2017AreasofFocusEnergy Expansion and Optimization: Sell excess 80M watt capacity from Quisqueya 1 (QQ1)
power plant to the grid– Grid connection at San Pedro– New Bonao sub-station connection
Increased demand in the DR power market enhances project benefits
Convert QQ1 Power Plant from HFO to LNG or Bio Fuel Convert lime kilns from diesel to natural gas or Bio Fuel
AISC and free cash flow improvements: Develop supervision and workforce to reduce
contractors and optimize labor costs Improved maintenance materials and reliability
Critical Overall Equipment Effectiveness: Further autoclave and grinding optimization Increase truck and shovel availability from 81% to 85%
Quisqueya 1 Power Plant
Pueblo Viejo lime kilns
Operations Technical Update Day | 86
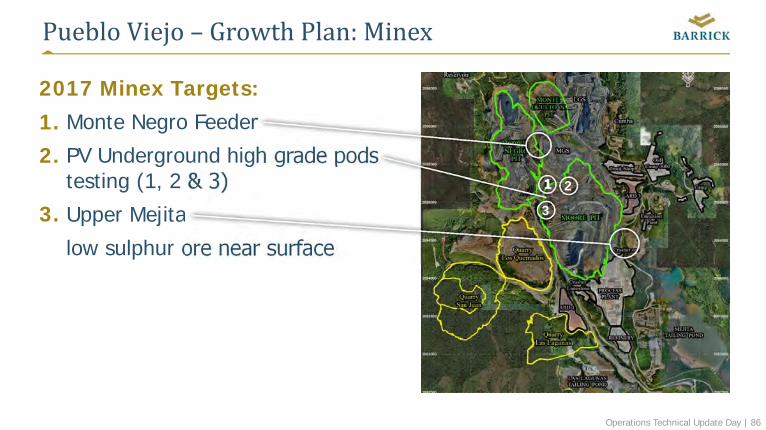
PuebloViejo– GrowthPlan:Minex
2017 Minex Targets:1. Monte Negro Feeder
2. PV Underground high grade pods testing (1, 2 & 3)
3. Upper Mejita
4. low sulphur ore near surface
1 2
3
1.2.
3.
Operations Technical Update Day | 87
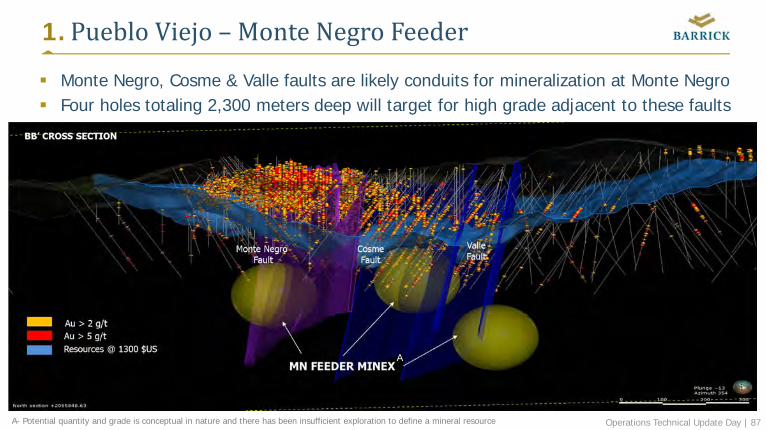
1.PuebloViejo– MonteNegroFeeder
Monte Negro, Cosme & Valle faults are likely conduits for mineralization at Monte Negro Four holes totaling 2,300 meters deep will target for high grade adjacent to these faults
A- Potential quantity and grade is conceptual in nature and there has been insufficient exploration to define a mineral resource
A
Operations Technical Update Day | 88
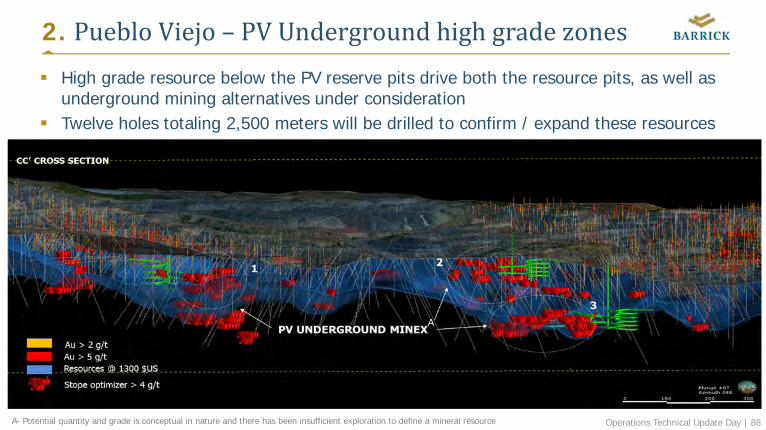
2. PuebloViejo– PVUndergroundhighgradezones High grade resource below the PV reserve pits drive both the resource pits, as well as
underground mining alternatives under consideration Twelve holes totaling 2,500 meters will be drilled to confirm / expand these resources
A
A- Potential quantity and grade is conceptual in nature and there has been insufficient exploration to define a mineral resource
Operations Technical Update Day | 89
Upper Mejita Minex
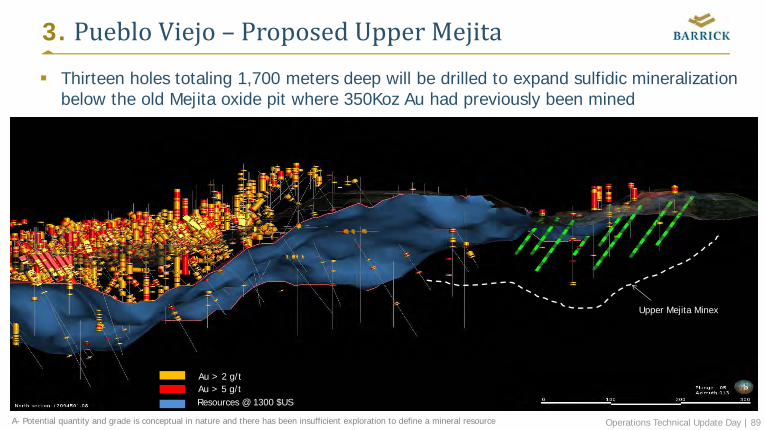
3. PuebloViejo– ProposedUpperMejita Thirteen holes totaling 1,700 meters deep will be drilled to expand sulfidic mineralization
below the old Mejita oxide pit where 350Koz Au had previously been mined
Au > 2 g/tAu > 5 g/tResources @ 1300 $US
A- Potential quantity and grade is conceptual in nature and there has been insufficient exploration to define a mineral resource
Operations Technical Update Day | 90
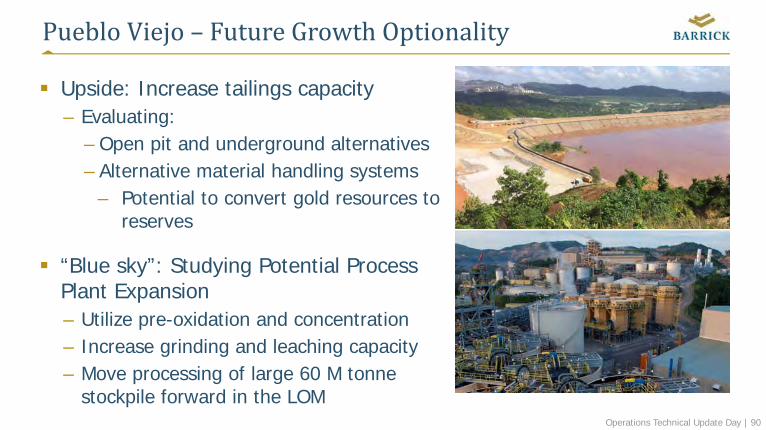
PuebloViejo– FutureGrowthOptionality
Upside: Increase tailings capacity– Evaluating:
– Open pit and underground alternatives– Alternative material handling systems
– Potential to convert gold resources to reserves
“Blue sky”: Studying Potential Process Plant Expansion– Utilize pre-oxidation and concentration– Increase grinding and leaching capacity– Move processing of large 60 M tonne
stockpile forward in the LOM
Operations Technical Update Day | 91
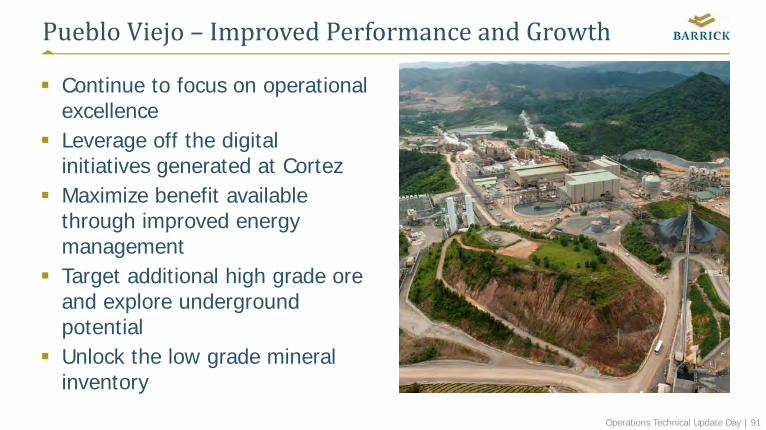
PuebloViejo– ImprovedPerformanceandGrowth
Continue to focus on operational excellence
Leverage off the digital initiatives generated at Cortez
Maximize benefit available through improved energy management
Target additional high grade ore and explore underground potential
Unlock the low grade mineral inventory
Operations and Technical Update | 92
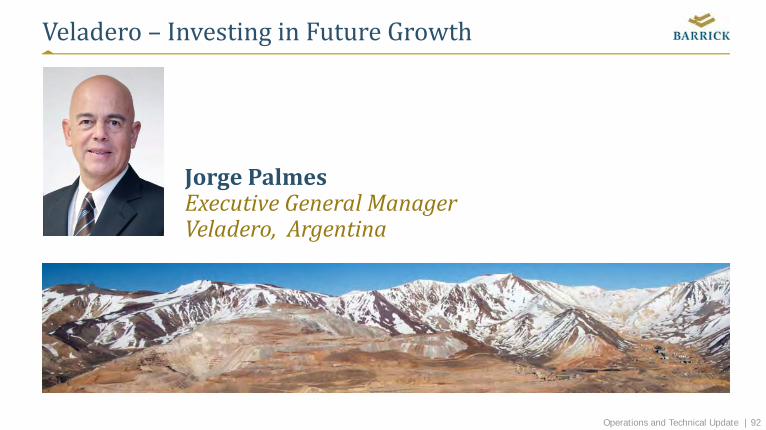
Veladero– InvestinginFutureGrowth
JorgePalmesExecutiveGeneralManagerVeladero,Argentina

Operations and Technical Update | 93
Veladero – Today
Vision – Responsible leaders, trusted partners, safety champions
Conventional open pit valley heap leach using the Merrill Crowe process for gold and silver recovery
Achievements in 2016:– Appointed new executive team with significant
in-country experience to unlock value– Strong safety record (TRIFR1 0.28)– Rapid recovery in operating performance
following weather challenges and mine suspension
1. See endnote #5
Operations and Technical Update | 94
Veladero– 2016Performance
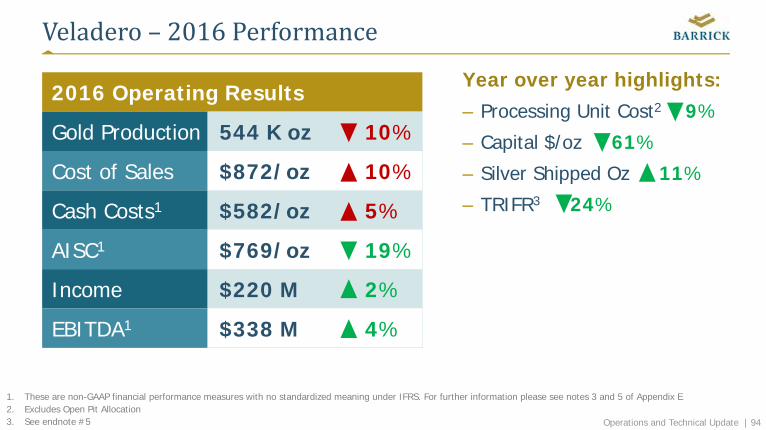
2016 Operating Results
Gold Production 544 K oz 10%
Cost of Sales $872/oz 10%
Cash Costs1 $582/oz 5%
AISC1 $769/oz 19%
Income $220 M 2%
EBITDA1 $338 M 4%
Year over year highlights:– Processing Unit Cost2 9%
– Capital $/oz 61%
– Silver Shipped Oz 11%
– TRIFR3 24%
1. These are non-GAAP financial performance measures with no standardized meaning under IFRS. For further information please see notes 3 and 5 of Appendix E 2. Excludes Open Pit Allocation3. See endnote #5
Operations and Technical Update | 95
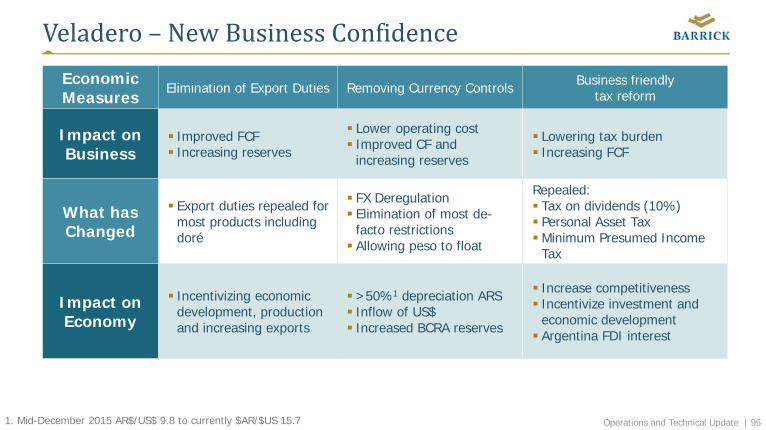
Veladero– NewBusinessConfidence
1. Mid-December 2015 AR$/US$ 9.8 to currently $AR/$US 15.7
EconomicMeasures
Elimination of Export Duties Removing Currency Controls Business friendlytax reform
Impact on Business
Improved FCF Increasing reserves
Lower operating cost Improved CF and
increasing reserves
Lowering tax burden Increasing FCF
What has Changed
Export duties repealed for most products including doré
FX Deregulation Elimination of most de-
facto restrictions Allowing peso to float
Repealed: Tax on dividends (10%) Personal Asset Tax Minimum Presumed Income
Tax
Impact on Economy
Incentivizing economic development, production and increasing exports
>50%1 depreciation ARS Inflow of US$ Increased BCRA reserves
Increase competitiveness Incentivize investment and
economic development Argentina FDI interest
Operations and Technical Update | 96
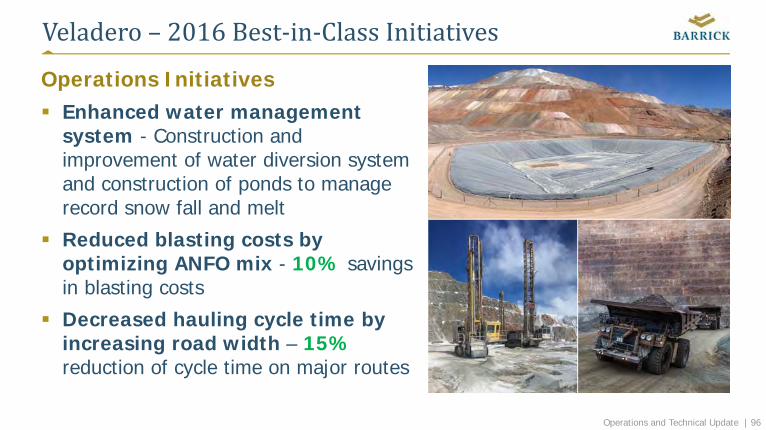
Veladero– 2016Best‐in‐ClassInitiatives
Operations Initiatives Enhanced water management
system - Construction and improvement of water diversion system and construction of ponds to manage record snow fall and melt
Reduced blasting costs by optimizing ANFO mix - 10% savings in blasting costs
Decreased hauling cycle time by increasing road width – 15%reduction of cycle time on major routes
Operations and Technical Update | 97
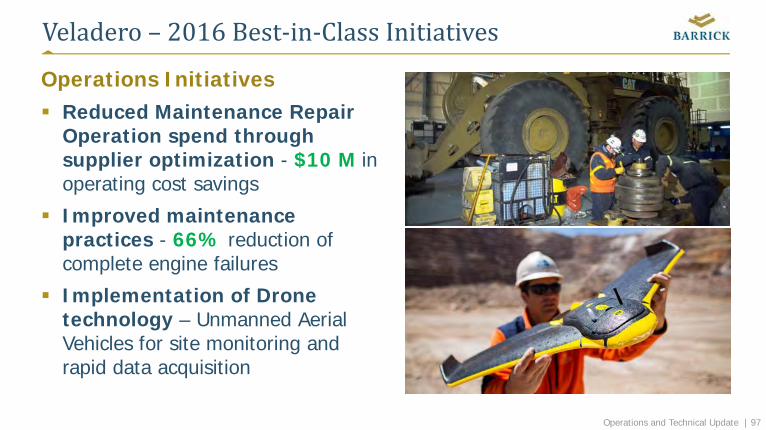
Veladero– 2016Best‐in‐ClassInitiatives
Operations Initiatives Reduced Maintenance Repair
Operation spend through supplier optimization - $10 M in operating cost savings
Improved maintenance practices - 66% reduction of complete engine failures
Implementation of Drone technology – Unmanned Aerial Vehicles for site monitoring and rapid data acquisition
Operations and Technical Update | 98
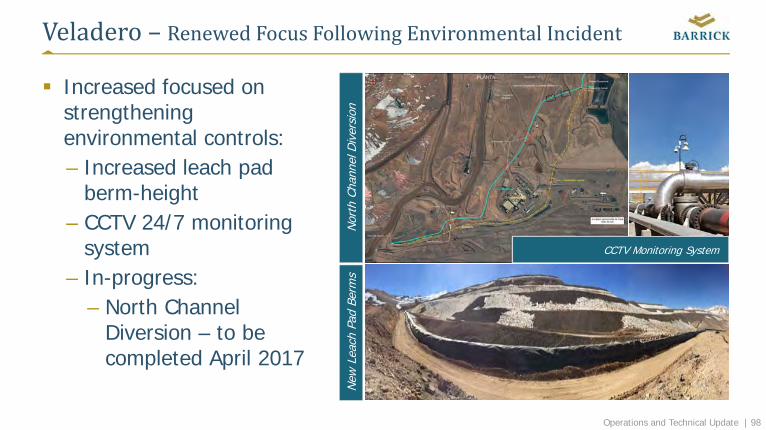
Veladero – RenewedFocusFollowingEnvironmentalIncident
Increased focused on strengthening environmental controls:– Increased leach pad
berm-height – CCTV 24/7 monitoring
system– In-progress:
– North Channel Diversion – to be completed April 2017
New
Lea
ch P
ad B
erm
sN
orth
Cha
nnel
Div
ersi
on
CCTV Monitoring System
Operations and Technical Update | 99
Veladero– 2017Outlook
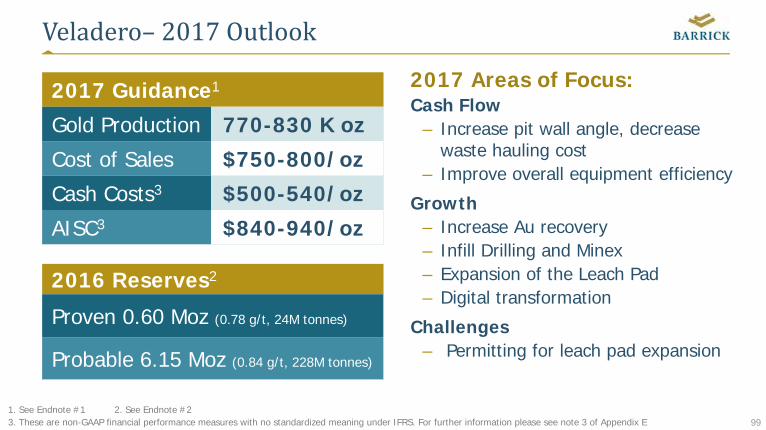
2017 Areas of Focus:Cash Flow
– Increase pit wall angle, decrease waste hauling cost
– Improve overall equipment efficiency
Growth– Increase Au recovery– Infill Drilling and Minex– Expansion of the Leach Pad– Digital transformation
Challenges– Permitting for leach pad expansion
2017 Guidance1
Gold Production 770-830 K oz
Cost of Sales $750-800/oz
Cash Costs3 $500-540/oz
AISC3 $840-940/oz
2016 Reserves2
Proven 0.60 Moz (0.78 g/t, 24M tonnes)
Probable 6.15 Moz (0.84 g/t, 228M tonnes)
1. See Endnote #1 2. See Endnote #23. These are non-GAAP financial performance measures with no standardized meaning under IFRS. For further information please see note 3 of Appendix E
Operations and Technical Update | 100
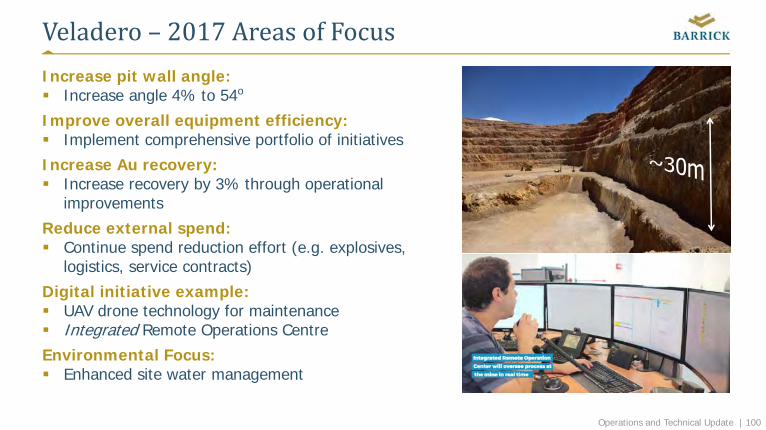
Veladero– 2017AreasofFocusIncrease pit wall angle: Increase angle 4% to 54o
Improve overall equipment efficiency: Implement comprehensive portfolio of initiatives
Increase Au recovery: Increase recovery by 3% through operational
improvements
Reduce external spend: Continue spend reduction effort (e.g. explosives,
logistics, service contracts)
Digital initiative example: UAV drone technology for maintenance Integrated Remote Operations Centre
Environmental Focus: Enhanced site water management
Operations and Technical Update | 101
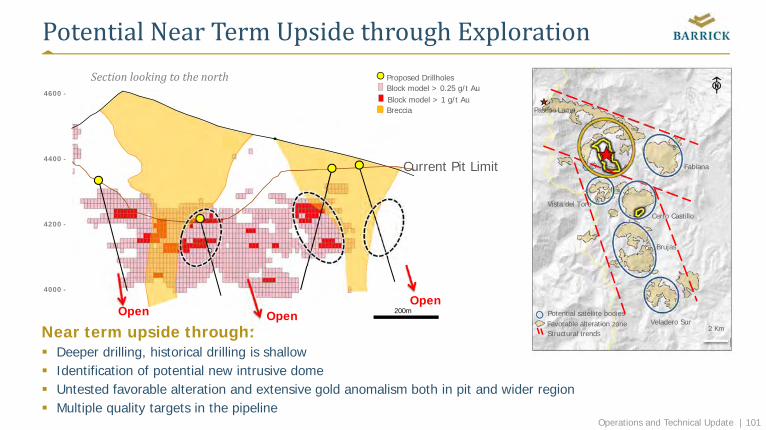
PotentialNearTermUpsidethroughExploration
Near term upside through: Deeper drilling, historical drilling is shallow Identification of potential new intrusive dome Untested favorable alteration and extensive gold anomalism both in pit and wider region Multiple quality targets in the pipeline
2 KmFavorable alteration zonePotential satellite bodies
Structural trends
Pascua Lama
Vista del Toro
Brujas
Cerro Castillo
Veladero Sur
Fabiana
4000 -
200m
4200 -
SectionlookingtothenorthBlock model > 0.25 g/t AuProposed Drillholes
Breccia
4600 -
4400 -Current Pit Limit
Block model > 1 g/t Au
OpenOpen Open
Operations and Technical Update | 102
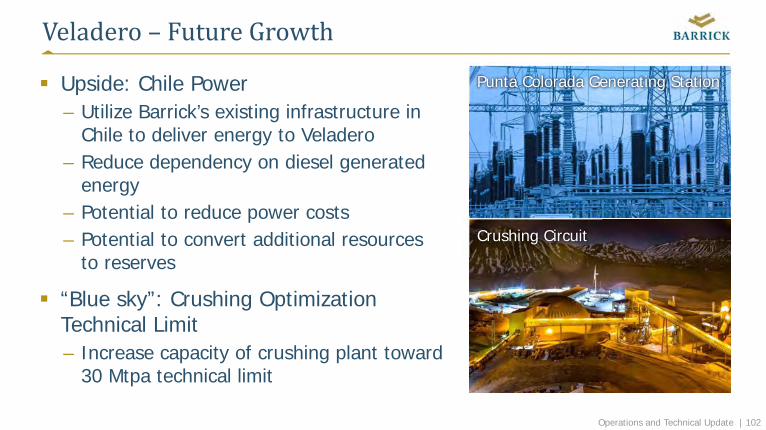
Veladero– FutureGrowth
Upside: Chile Power– Utilize Barrick’s existing infrastructure in
Chile to deliver energy to Veladero– Reduce dependency on diesel generated
energy– Potential to reduce power costs – Potential to convert additional resources
to reserves
“Blue sky”: Crushing Optimization Technical Limit– Increase capacity of crushing plant toward
30 Mtpa technical limit
Punta Colorada Generating Station
Crushing Circuit
Operations and Technical Update | 103
LagunasNorte– PreparingfortheFuture
JimWhittakerGeneralManagerLagunasNorte,Peru
Operations and Technical Update | 104
LagunasNorte– Today
Vision: We are a company dedicated to the sociably responsible extraction and production of gold, being a key influence for development in the region, reaching for the highest standards of safety and environmental protection, maintaining the efficiency and continuous improvement of our processes, with a commitment to the development of our employees Conventional open‐pit, crush, valley‐fill heap leach operation, two‐stage
conventional crushing circuit, heap leach, Merrill Crowe or Carbon-in-column (CIC) precipitation plants
Achievements in 2016:– Safety incident frequency has decreased for the first time in 5 years– On target production and under target AISC– Successful negotiation of unionized labor contracts– Prioritized resource portfolio to extend current mine life– Refractory ore PMR expansion project Feasibility Study phase 1 completed
Operations and Technical Update | 105
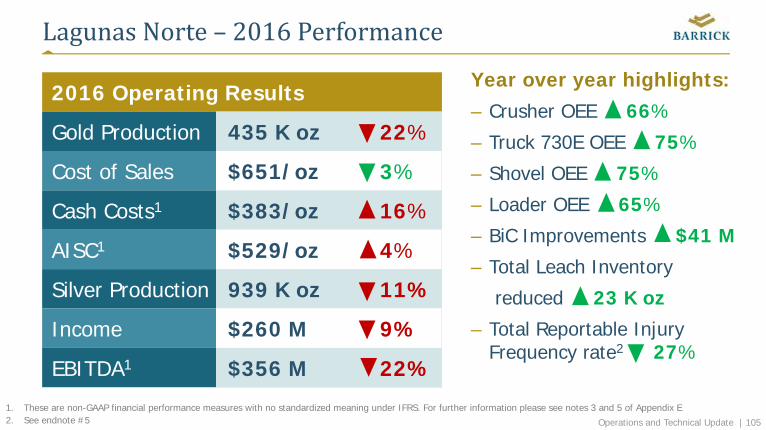
LagunasNorte– 2016Performance
Year over year highlights:– Crusher OEE 66%
– Truck 730E OEE 75%
– Shovel OEE 75%
– Loader OEE 65%
– BiC Improvements $41 M
– Total Leach Inventory
reduced 23 K oz
– Total Reportable Injury Frequency rate2 27%
2016 Operating Results
Gold Production 435 K oz 22%
Cost of Sales $651/oz 3%
Cash Costs1 $383/oz 16%
AISC1 $529/oz 4%
Silver Production 939 K oz 11%
Income $260 M 9%
EBITDA1 $356 M 22%
1. These are non-GAAP financial performance measures with no standardized meaning under IFRS. For further information please see notes 3 and 5 of Appendix E 2. See endnote #5
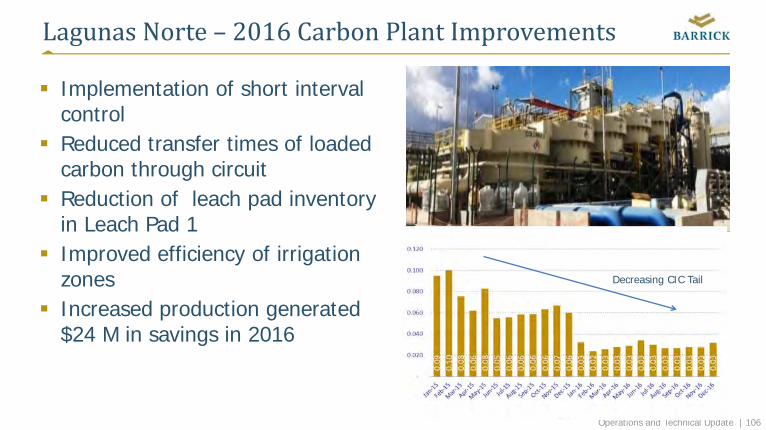
Operations and Technical Update | 106
LagunasNorte– 2016CarbonPlantImprovements
Implementation of short interval control
Reduced transfer times of loaded carbon through circuit
Reduction of leach pad inventory in Leach Pad 1
Improved efficiency of irrigation zones
Increased production generated $24 M in savings in 2016
Decreasing CIC Tail
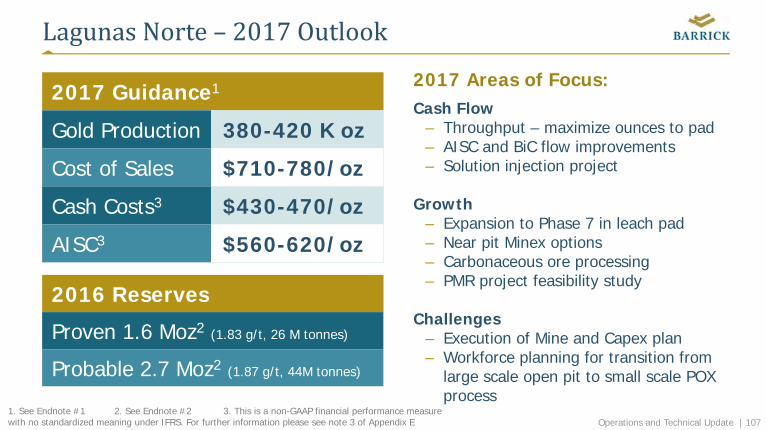
Operations and Technical Update | 107
LagunasNorte– 2017Outlook
2017 Areas of Focus:Cash Flow
– Throughput – maximize ounces to pad– AISC and BiC flow improvements– Solution injection project
Growth– Expansion to Phase 7 in leach pad– Near pit Minex options– Carbonaceous ore processing– PMR project feasibility study
Challenges– Execution of Mine and Capex plan– Workforce planning for transition from
large scale open pit to small scale POX process
2017 Guidance1
Gold Production 380-420 K oz
Cost of Sales $710-780/oz
Cash Costs3 $430-470/oz
AISC3 $560-620/oz
2016 Reserves
Proven 1.6 Moz2 (1.83 g/t, 26 M tonnes)
Probable 2.7 Moz2 (1.87 g/t, 44M tonnes)
1. See Endnote #1 2. See Endnote #2 3. This is a non-GAAP financial performance measurewith no standardized meaning under IFRS. For further information please see note 3 of Appendix E
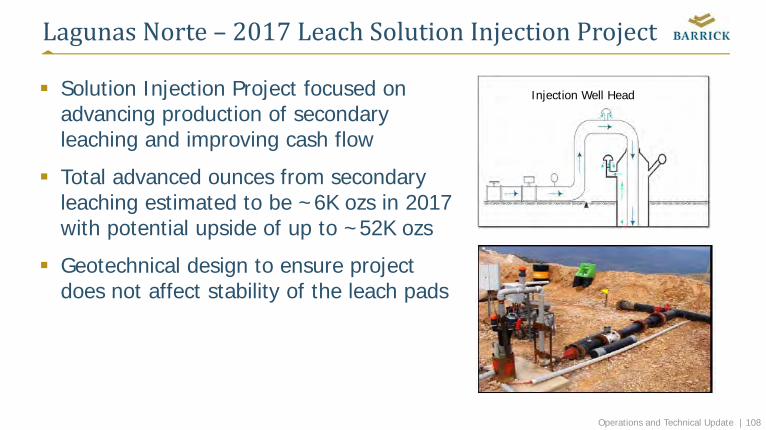
Operations and Technical Update | 108
LagunasNorte– 2017LeachSolutionInjectionProject
Solution Injection Project focused on advancing production of secondary leaching and improving cash flow
Total advanced ounces from secondary leaching estimated to be ~6K ozs in 2017 with potential upside of up to ~52K ozs
Geotechnical design to ensure project does not affect stability of the leach pads
Injection Well Head
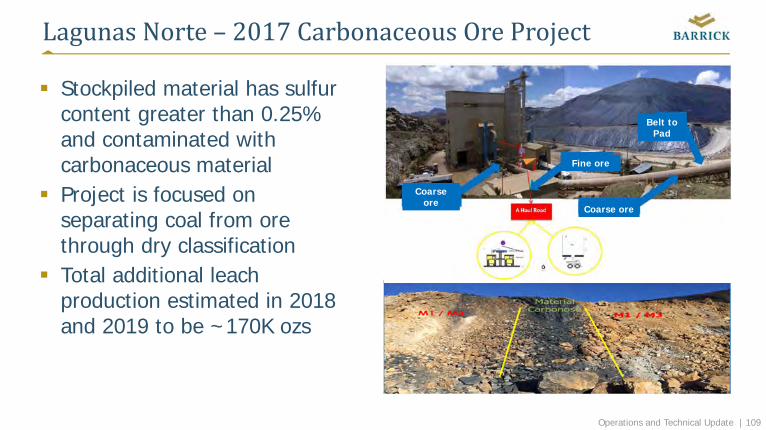
Operations and Technical Update | 109
LagunasNorte– 2017CarbonaceousOreProject
Stockpiled material has sulfur content greater than 0.25% and contaminated with carbonaceous material
Project is focused on separating coal from ore through dry classification
Total additional leach production estimated in 2018 and 2019 to be ~170K ozs
Coarseore
Coarse ore
Fine ore
Belt to Pad
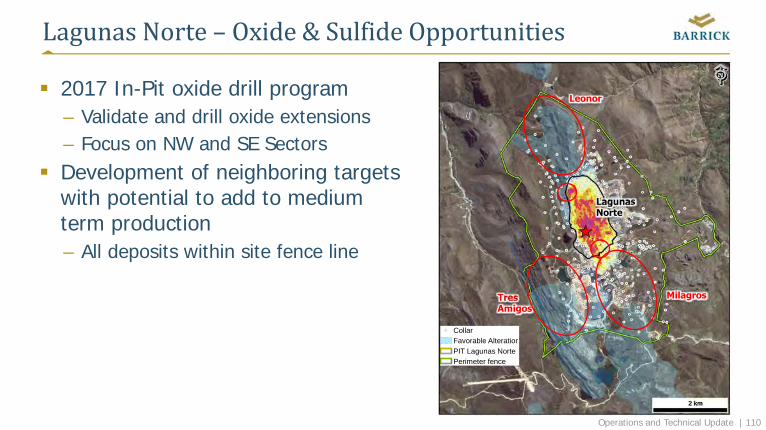
Operations and Technical Update | 110
LagunasNorte– Oxide&Sulfide Opportunities
2017 In-Pit oxide drill program– Validate and drill oxide extensions– Focus on NW and SE Sectors
Development of neighboring targets with potential to add to medium term production– All deposits within site fence line
!. CollarFavorable AlterationPIT Lagunas NortePerimeter fence

Operations and Technical Update | 111
Site 1 Grinding / Flotation
Site 2 Autoclave / Leaching
LagunasNorte– PMRSulphidesFeasibilityPhase1Extend mine life utilizing CIP and autoclave technology to recover an additional 2.2 M ozs(30 M tonnes at 2.27 g/t)
Phase Objectives Support permitting with engineering Conduct drilling to improve high grade delineation Advance project definition through engineering,
logistics planning and execution development Refine capital cost with more detailed vendor pricing
Key 2016 Results Sequenced mine LOM Extension via a new
carbonaceous oxide ore recovery project plus a relook and optimization of the PMR project to include Flotation-POX to treat sulfide ore later
Capital schedule extension is expected, peak capital spend reduced, economics expected to improve
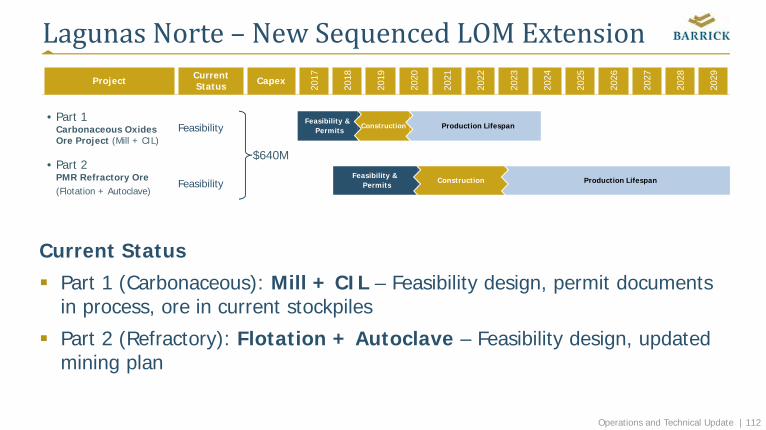
Operations and Technical Update | 112
Project Current Status Capex
2017
2018
2019
2020
2021
2022
2023
2024
2025
2026
2027
2028
2029
LagunasNorte– NewSequencedLOMExtension
Current Status Part 1 (Carbonaceous): Mill + CIL – Feasibility design, permit documents
in process, ore in current stockpiles
Part 2 (Refractory): Flotation + Autoclave – Feasibility design, updated mining plan
• Part 1Carbonaceous OxidesOre Project (Mill + CIL)
• Part 2PMR Refractory Ore (Flotation + Autoclave)
Feasibility
Feasibility
$640M
Feasibility & Permits
Construction Production Lifespan
Feasibility & Permits
Construction Production Lifespan
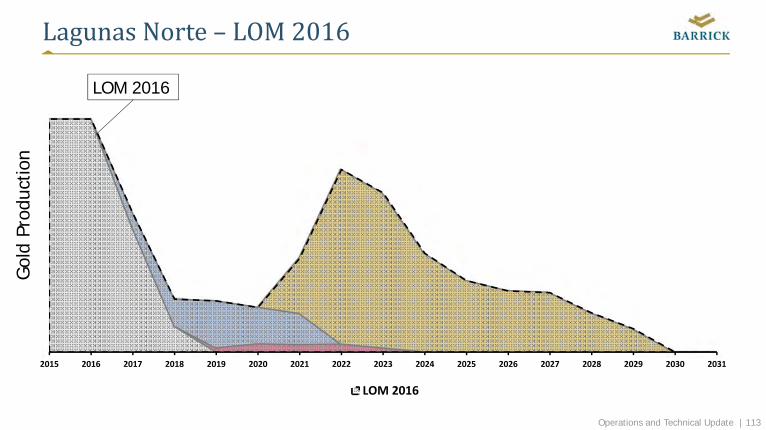
Operations and Technical Update | 113
LagunasNorte– LOM2016
2015 2016 2017 2018 2019 2020 2021 2022 2023 2024 2025 2026 2027 2028 2029 2030 2031
LOM 2016
LOM 2016
Gol
d Pr
oduc
tion

Operations and Technical Update | 114
LagunasNorte– ProductionOpportunity
2015 2016 2017 2018 2019 2020 2021 2022 2023 2024 2025 2026 2027 2028 2029 2030 2031
Oxide ‐ Heap Leach Oxide ‐ Second Leach PMR ‐ Heap Leach PMR ‐ Sulphides LOM 2016
PMR sulphides
ExplorationOpportunityDe-risking and
Opportunity
LOM 2016
LOM 2017POX
Gol
d Pr
oduc
tion
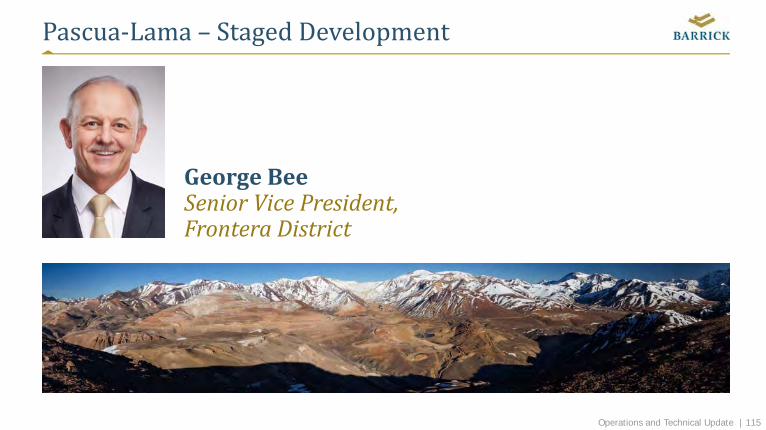
Operations and Technical Update | 115
Pascua‐Lama– StagedDevelopment
GeorgeBeeSeniorVicePresident,Frontera District
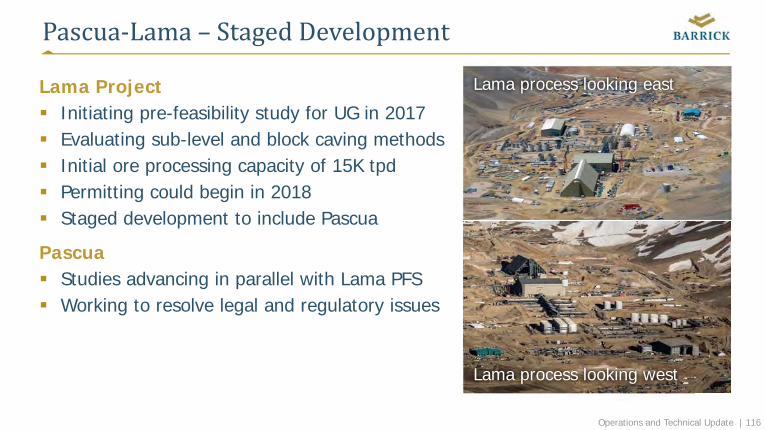
Operations and Technical Update | 116
Pascua‐Lama– StagedDevelopment
Lama Project Initiating pre-feasibility study for UG in 2017 Evaluating sub-level and block caving methods Initial ore processing capacity of 15K tpd Permitting could begin in 2018 Staged development to include Pascua
Pascua Studies advancing in parallel with Lama PFS Working to resolve legal and regulatory issues
Lama process looking east
Lama process looking west
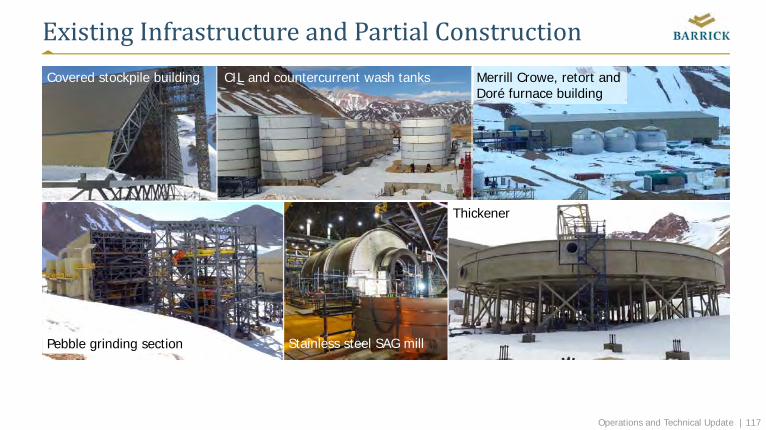
Operations and Technical Update | 117
ExistingInfrastructureandPartialConstructionCovered stockpile building CIL and countercurrent wash tanks
Stainless steel SAG mill
Thickener
Pebble grinding section
Merrill Crowe, retort andDoré furnace building
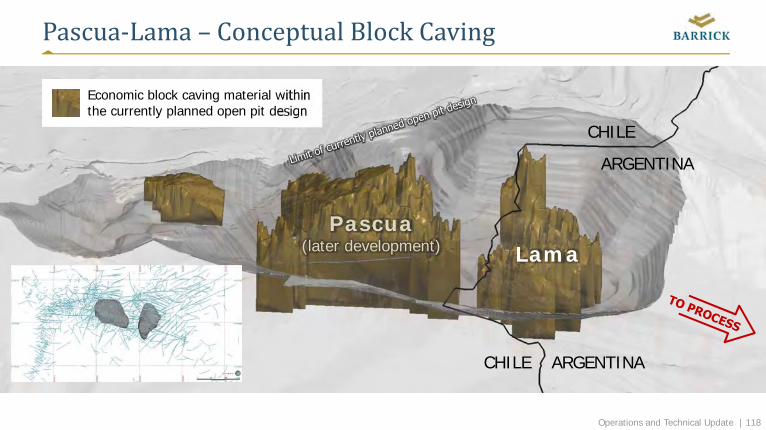
Operations and Technical Update | 118
Pascua‐Lama– ConceptualBlockCaving
Economic block caving material within the currently planned open pit design
LamaPascua
(later development)
CHILE ARGENTINA
CHILE
ARGENTINA
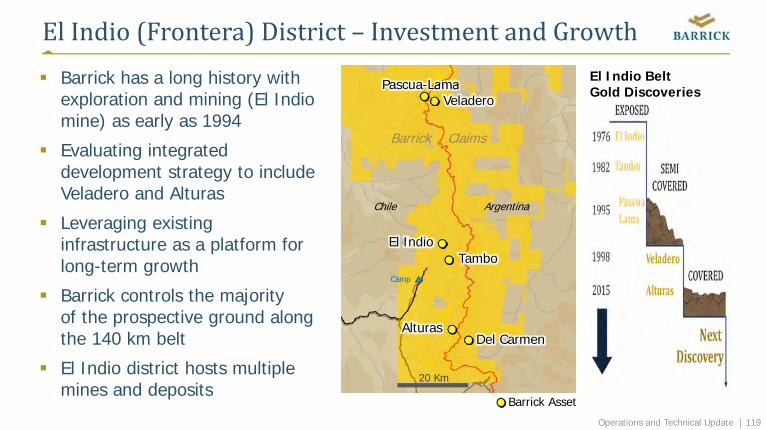
Operations and Technical Update | 119
ElIndio(Frontera)District– InvestmentandGrowth Barrick has a long history with
exploration and mining (El Indio mine) as early as 1994
Evaluating integrated development strategy to include Veladero and Alturas
Leveraging existing infrastructure as a platform for long-term growth
Barrick controls the majority of the prospective ground along the 140 km belt
El Indio district hosts multiple mines and deposits
Barrick Asset
Pascua-Lama
El Indio
Veladero
Tambo
Barrick Claims
20 Km
Del Carmen
Camp
Chile Argentina
Alturas
El Indio Belt Gold Discoveries
Operations and Technical Update | 120
ReservesandResources– PlanningOurFuture
RickSimsSeniorDirectorReservesandResources
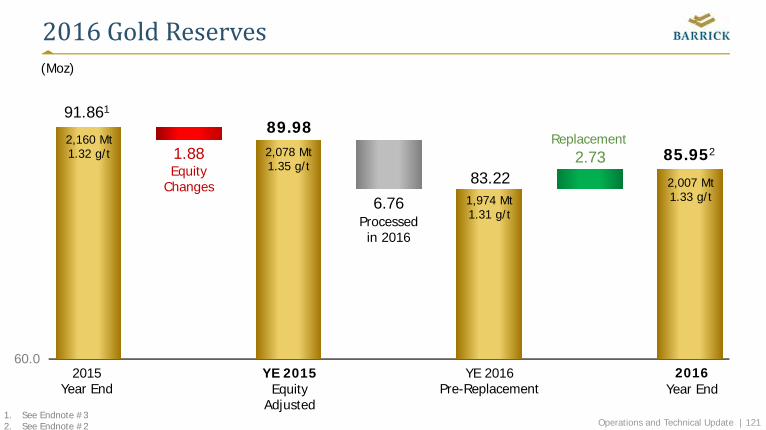
Operations and Technical Update | 121
(Moz)
2016GoldReserves
2015Year End
YE 2015Equity
Adjusted
2016Year End
EquityChanges
Replacement89.98
1.88
6.76
2.73
YE 2016Pre-Replacement
Processedin 2016
83.22
60.0
2,160 Mt1.32 g/t 2,078 Mt
1.35 g/t
1,974 Mt1.31 g/t
2,007 Mt1.33 g/t
1. See Endnote #32. See Endnote #2
91.861
85.952
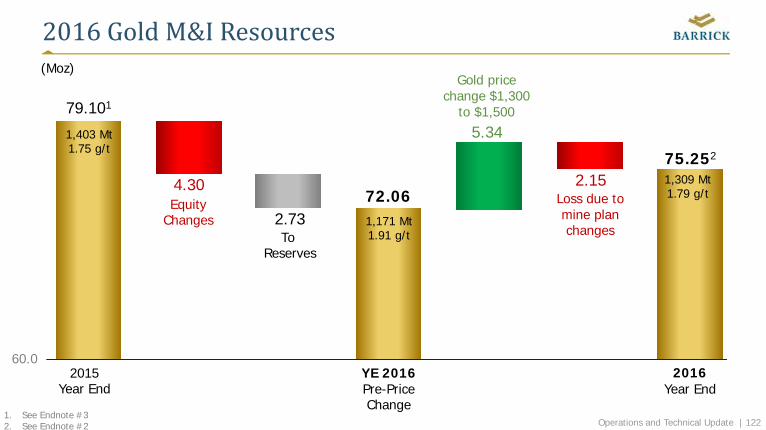
Operations and Technical Update | 122
2016GoldM&IResources
60.0
(Moz)
2015Year End
2016Year End
YE 2016Pre-PriceChange
79.101
75.252
4.30
2.73
2.15
5.34
EquityChanges
To Reserves
Gold pricechange $1,300
to $1,500
Loss due tomine planchanges
72.06
1,403 Mt1.75 g/t
1,171 Mt1.91 g/t
1,309 Mt1.79 g/t
1. See Endnote #32. See Endnote #2
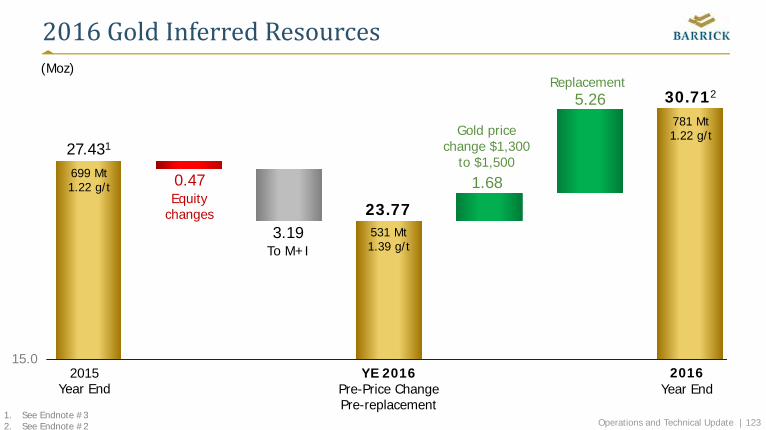
Operations and Technical Update | 123
2016GoldInferredResources
15.0
(Moz)
2015Year End
2016Year End
YE 2016Pre-Price ChangePre-replacement
27.431
30.712
3.19
1.68
To M+I
Gold pricechange $1,300
to $1,500
23.77
699 Mt1.22 g/t
531 Mt1.39 g/t
781 Mt1.22 g/t
0.47Equity
changes
Replacement5.26
1. See Endnote #32. See Endnote #2
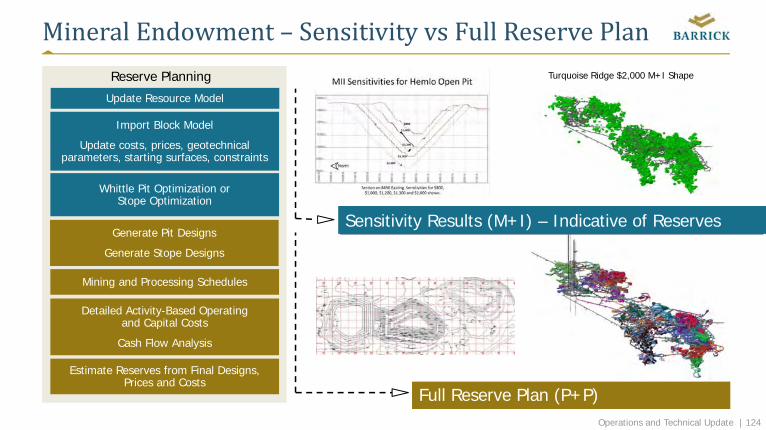
Operations and Technical Update | 124
MineralEndowment– SensitivityvsFullReservePlan
Update Resource Model
Import Block Model
Update costs, prices, geotechnical parameters, starting surfaces, constraints
Whittle Pit Optimization orStope Optimization
Generate Pit Designs
Generate Stope Designs
Mining and Processing Schedules
Detailed Activity-Based Operating and Capital Costs
Cash Flow Analysis
Estimate Reserves from Final Designs, Prices and Costs
Reserve Planning Turquoise Ridge $2,000 M+I Shape
Sensitivity Results (M+I) – Indicative of Reserves
Full Reserve Plan (P+P)
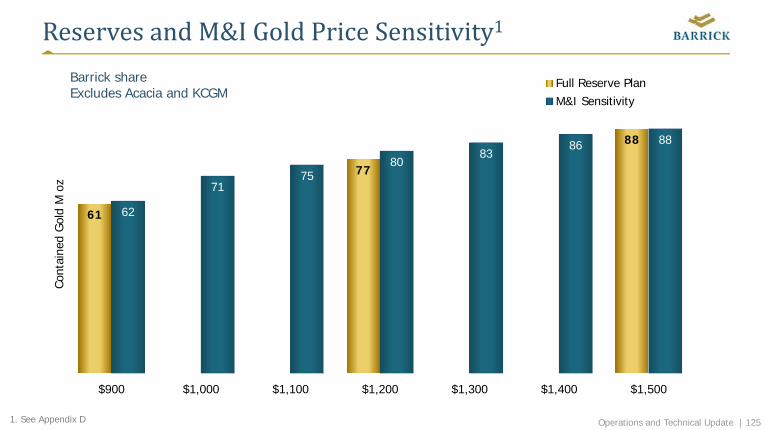
Operations and Technical Update | 125
ReservesandM&IGoldPriceSensitivity1
61
77
88
62
7175
8083
86 88
$900 $1,000 $1,100 $1,200 $1,300 $1,400 $1,500
Cont
aine
d G
old
M o
z
Full Reserve PlanM&I Sensitivity
Barrick shareExcludes Acacia and KCGM
1. See Appendix D
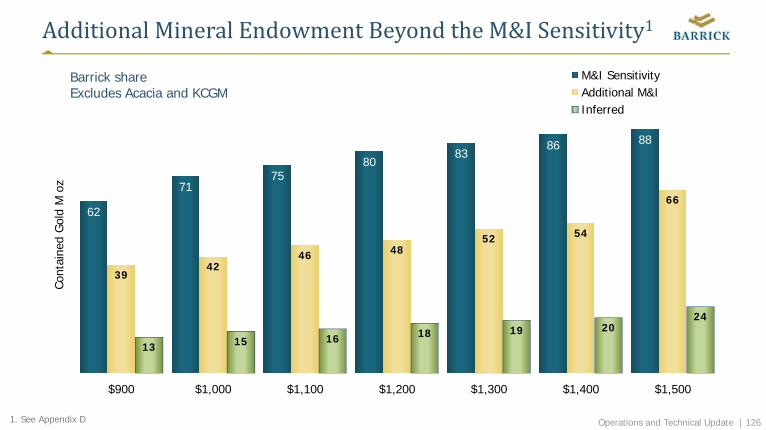
Operations and Technical Update | 126
AdditionalMineralEndowmentBeyondtheM&ISensitivity1
62
7175
8083
86 88
3942
46 4852 54
66
13 15 16 18 19 2024
$900 $1,000 $1,100 $1,200 $1,300 $1,400 $1,500
Cont
aine
d G
old
M o
zM&I SensitivityAdditional M&IInferred
Barrick shareExcludes Acacia and KCGM
1. See Appendix D
Operations and Technical Update | 127
Sustainability– Barrick’s LicensetoOperate
PeterSinclairChiefSustainabilityOfficer
Operations and Technical Update | 128
Barrick’sSustainabilityVision
Wepartnerwithhostgovernmentsandcommunitiestotransformtheir naturalresourcesintosustainablebenefitsand
mutualprosperity.
Weaimtobeawelcomeandtrustedpartnerofhostgovernmentsandcommunities,themostsought‐afteremployer,andthenatural
choiceforlong‐terminvestors.
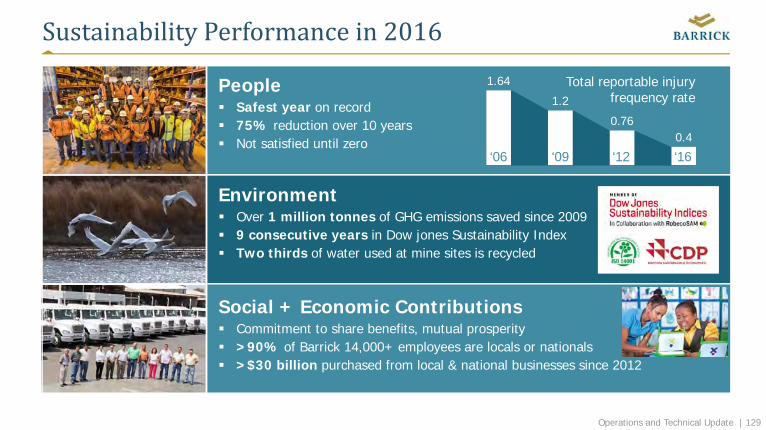
Operations and Technical Update | 129
SustainabilityPerformancein2016
People Safest year on record 75% reduction over 10 years Not satisfied until zero
Environment Over 1 million tonnes of GHG emissions saved since 2009 9 consecutive years in Dow jones Sustainability Index Two thirds of water used at mine sites is recycled
Social + Economic Contributions Commitment to share benefits, mutual prosperity >90% of Barrick 14,000+ employees are locals or nationals >$30 billion purchased from local & national businesses since 2012
1.64
1.2
0.760.4
Total reportable injury frequency rate
‘09‘06 ‘12 ‘16
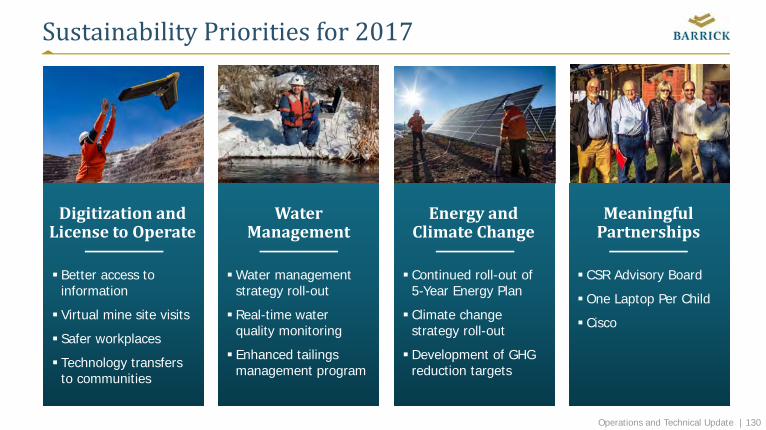
Operations and Technical Update | 130
SustainabilityPrioritiesfor2017
Better access to information
Virtual mine site visits
Safer workplaces
Technology transfers to communities
DigitizationandLicensetoOperate
EnergyandClimateChange
MeaningfulPartnerships
WaterManagement
Water management strategy roll-out
Real-time water quality monitoring
Enhanced tailings management program
Continued roll-out of 5-Year Energy Plan
Climate change strategy roll-out
Development of GHG reduction targets
CSR Advisory Board
One Laptop Per Child
Cisco
Operations and Technical Update | 131
ClosingRemarks
KelvinDushniskyPresident
Operations and Technical Update | 132
2017– Transformingintoa21stCenturyCompany
Generate free cash flow through price cycles Optimize portfolio, progress Frontera district, advance projects
and exploration Reduce total debt to $5 billion by end of 2018 Unify Nevada, embed and accelerate digital transformation and
innovation Upgrade talent and develop next generation of industry leaders
Operations and Technical Update | 133
Appendices
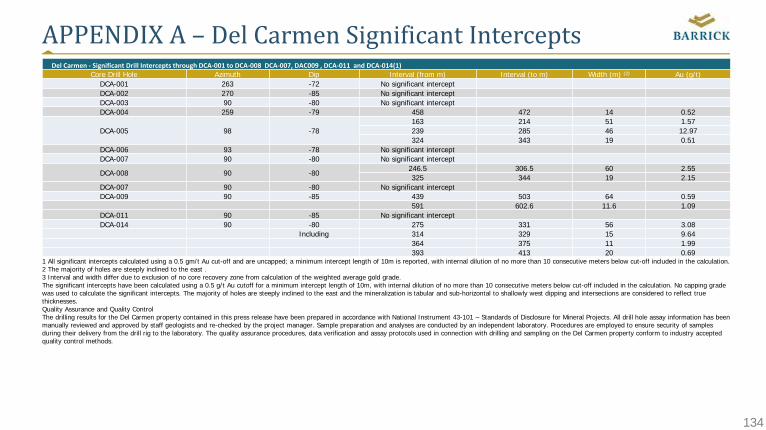
134
APPENDIXA– DelCarmenSignificantInterceptsDel Carmen ‐ Significant Drill Intercepts through DCA‐001 to DCA‐008 DCA‐007, DAC009 , DCA‐011 and DCA‐014(1)
Core Drill Hole Azimuth Dip Interval (from m) Interval (to m) Width (m) (2) Au (g/t)DCA-001 263 -72 No significant interceptDCA-002 270 -85 No significant interceptDCA-003 90 -80 No significant interceptDCA-004 259 -79 458 472 14 0.52
DCA-005 98 -78163 214 51 1.57239 285 46 12.97324 343 19 0.51
DCA-006 93 -78 No significant interceptDCA-007 90 -80 No significant intercept
DCA-008 90 -80246.5 306.5 60 2.55325 344 19 2.15
DCA-007 90 -80 No significant interceptDCA-009 90 -85 439 503 64 0.59
591 602.6 11.6 1.09DCA-011 90 -85 No significant interceptDCA-014 90 -80 275 331 56 3.08
Including 314 329 15 9.64364 375 11 1.99393 413 20 0.69
1 All significant intercepts calculated using a 0.5 gm/t Au cut-off and are uncapped; a minimum intercept length of 10m is reported, with internal dilution of no more than 10 consecutive meters below cut-off included in the calculation. 2 The majority of holes are steeply inclined to the east . 3 Interval and width differ due to exclusion of no core recovery zone from calculation of the weighted average gold grade.The significant intercepts have been calculated using a 0.5 g/t Au cutoff for a minimum intercept length of 10m, with internal dilution of no more than 10 consecutive meters below cut-off included in the calculation. No capping grade was used to calculate the significant intercepts. The majority of holes are steeply inclined to the east and the mineralization is tabular and sub-horizontal to shallowly west dipping and intersections are considered to reflect true thicknesses. Quality Assurance and Quality ControlThe drilling results for the Del Carmen property contained in this press release have been prepared in accordance with National Instrument 43-101 – Standards of Disclosure for Mineral Projects. All drill hole assay information has been manually reviewed and approved by staff geologists and re-checked by the project manager. Sample preparation and analyses are conducted by an independent laboratory. Procedures are employed to ensure security of samples during their delivery from the drill rig to the laboratory. The quality assurance procedures, data verification and assay protocols used in connection with drilling and sampling on the Del Carmen property conform to industry accepted quality control methods.
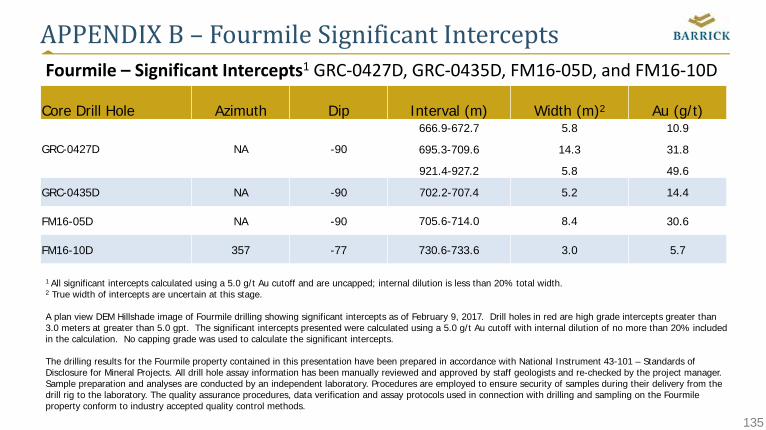
135
APPENDIXB– FourmileSignificantIntercepts
1 All significant intercepts calculated using a 5.0 g/t Au cutoff and are uncapped; internal dilution is less than 20% total width.2 True width of intercepts are uncertain at this stage.
A plan view DEM Hillshade image of Fourmile drilling showing significant intercepts as of February 9, 2017. Drill holes in red are high grade intercepts greater than 3.0 meters at greater than 5.0 gpt. The significant intercepts presented were calculated using a 5.0 g/t Au cutoff with internal dilution of no more than 20% included in the calculation. No capping grade was used to calculate the significant intercepts.
The drilling results for the Fourmile property contained in this presentation have been prepared in accordance with National Instrument 43-101 – Standards of Disclosure for Mineral Projects. All drill hole assay information has been manually reviewed and approved by staff geologists and re-checked by the project manager. Sample preparation and analyses are conducted by an independent laboratory. Procedures are employed to ensure security of samples during their delivery from the drill rig to the laboratory. The quality assurance procedures, data verification and assay protocols used in connection with drilling and sampling on the Fourmileproperty conform to industry accepted quality control methods.
Fourmile – Significant Intercepts1 GRC‐0427D, GRC‐0435D, FM16‐05D, and FM16‐10D
Core Drill Hole Azimuth Dip Interval (m) Width (m)2 Au (g/t)
GRC-0427D NA -90
666.9-672.7 5.8 10.9
695.3-709.6 14.3 31.8
921.4-927.2 5.8 49.6
GRC-0435D NA -90 702.2-707.4 5.2 14.4
FM16-05D NA -90 705.6-714.0 8.4 30.6
FM16-10D 357 -77 730.6-733.6 3.0 5.7
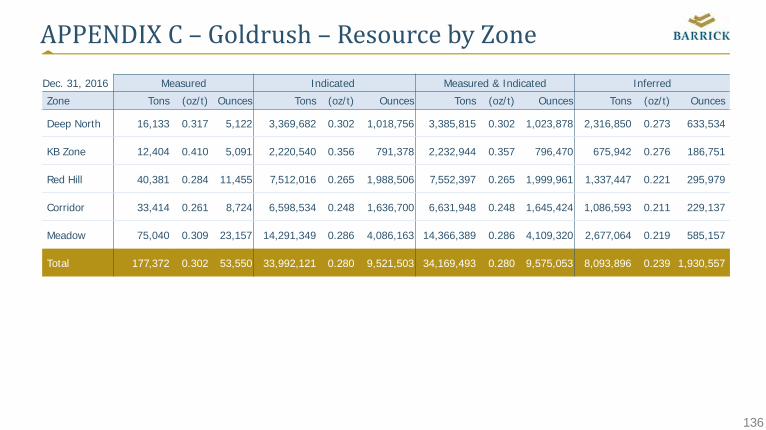
136
APPENDIXC – Goldrush– ResourcebyZoneDec. 31, 2016 Measured Indicated Measured & Indicated Inferred
Zone Tons (oz/t) Ounces Tons (oz/t) Ounces Tons (oz/t) Ounces Tons (oz/t) Ounces
Deep North 16,133 0.317 5,122 3,369,682 0.302 1,018,756 3,385,815 0.302 1,023,878 2,316,850 0.273 633,534
KB Zone 12,404 0.410 5,091 2,220,540 0.356 791,378 2,232,944 0.357 796,470 675,942 0.276 186,751
Red Hill 40,381 0.284 11,455 7,512,016 0.265 1,988,506 7,552,397 0.265 1,999,961 1,337,447 0.221 295,979
Corridor 33,414 0.261 8,724 6,598,534 0.248 1,636,700 6,631,948 0.248 1,645,424 1,086,593 0.211 229,137
Meadow 75,040 0.309 23,157 14,291,349 0.286 4,086,163 14,366,389 0.286 4,109,320 2,677,064 0.219 585,157
Total 177,372 0.302 53,550 33,992,121 0.280 9,521,503 34,169,493 0.280 9,575,053 8,093,896 0.239 1,930,557
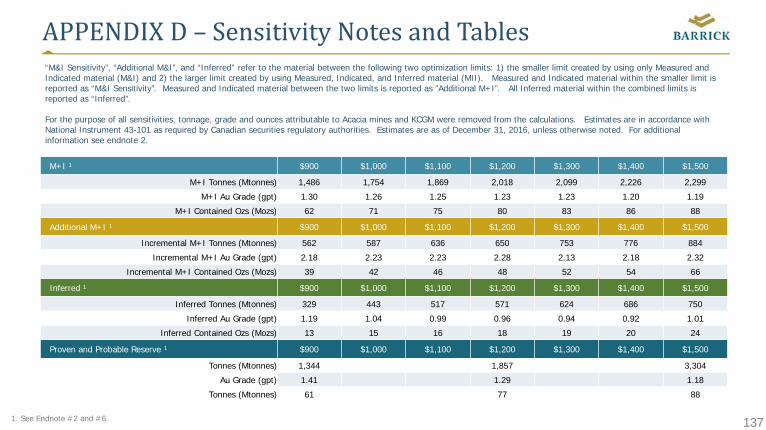
137
APPENDIXD– SensitivityNotesandTables
1. See Endnote #2 and #6
“M&I Sensitivity”, “Additional M&I”, and “Inferred” refer to the material between the following two optimization limits: 1) the smaller limit created by using only Measured and Indicated material (M&I) and 2) the larger limit created by using Measured, Indicated, and Inferred material (MII). Measured and Indicated material within the smaller limit is reported as “M&I Sensitivity”. Measured and Indicated material between the two limits is reported as ”Additional M+I”. All Inferred material within the combined limits is reported as “Inferred”.
For the purpose of all sensitivities, tonnage, grade and ounces attributable to Acacia mines and KCGM were removed from the calculations. Estimates are in accordance with National Instrument 43-101 as required by Canadian securities regulatory authorities. Estimates are as of December 31, 2016, unless otherwise noted. For additional information see endnote 2.
M+I 1 $900 $1,000 $1,100 $1,200 $1,300 $1,400 $1,500
M+I Tonnes (Mtonnes) 1,486 1,754 1,869 2,018 2,099 2,226 2,299
M+I Au Grade (gpt) 1.30 1.26 1.25 1.23 1.23 1.20 1.19
M+I Contained Ozs (Mozs) 62 71 75 80 83 86 88
Additional M+I 1 $900 $1,000 $1,100 $1,200 $1,300 $1,400 $1,500
Incremental M+I Tonnes (Mtonnes) 562 587 636 650 753 776 884
Incremental M+I Au Grade (gpt) 2.18 2.23 2.23 2.28 2.13 2.18 2.32
Incremental M+I Contained Ozs (Mozs) 39 42 46 48 52 54 66
Inferred 1 $900 $1,000 $1,100 $1,200 $1,300 $1,400 $1,500
Inferred Tonnes (Mtonnes) 329 443 517 571 624 686 750
Inferred Au Grade (gpt) 1.19 1.04 0.99 0.96 0.94 0.92 1.01
Inferred Contained Ozs (Mozs) 13 15 16 18 19 20 24
Proven and Probable Reserve 1 $900 $1,000 $1,100 $1,200 $1,300 $1,400 $1,500
Tonnes (Mtonnes) 1,344 1,857 3,304
Au Grade (gpt) 1.41 1.29 1.18
Tonnes (Mtonnes) 61 77 88
Operations and Technical Update | 138
AppendixE– Non‐GAAPFinancialPerformanceMeasures
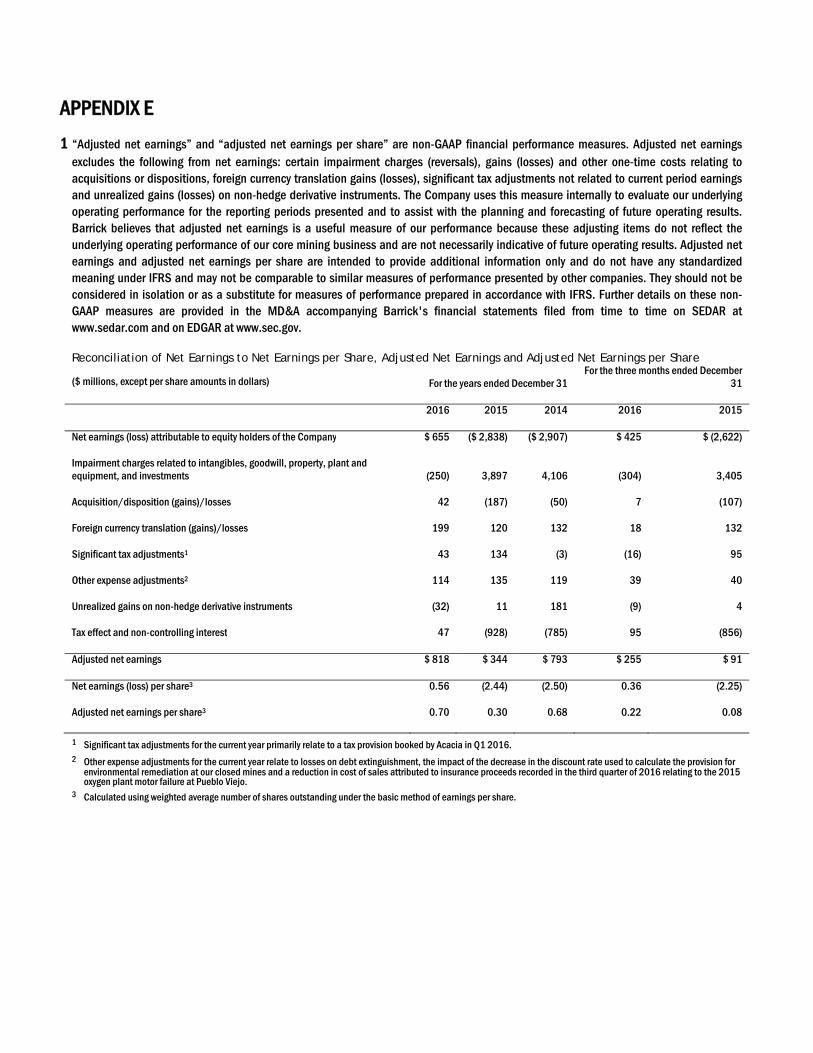
APPENDIX E
1 “Adjusted net earnings” and “adjusted net earnings per share” are non-GAAP financial performance measures. Adjusted net earnings excludes the following from net earnings: certain impairment charges (reversals), gains (losses) and other one-time costs relating to acquisitions or dispositions, foreign currency translation gains (losses), significant tax adjustments not related to current period earnings and unrealized gains (losses) on non-hedge derivative instruments. The Company uses this measure internally to evaluate our underlying operating performance for the reporting periods presented and to assist with the planning and forecasting of future operating results. Barrick believes that adjusted net earnings is a useful measure of our performance because these adjusting items do not reflect the underlying operating performance of our core mining business and are not necessarily indicative of future operating results. Adjusted net earnings and adjusted net earnings per share are intended to provide additional information only and do not have any standardized meaning under IFRS and may not be comparable to similar measures of performance presented by other companies. They should not be considered in isolation or as a substitute for measures of performance prepared in accordance with IFRS. Further details on these non-GAAP measures are provided in the MD&A accompanying Barrick's financial statements filed from time to time on SEDAR at www.sedar.com and on EDGAR at www.sec.gov.
Reconciliation of Net Earnings to Net Earnings per Share, Adjusted Net Earnings and Adjusted Net Earnings per Share
($ millions, except per share amounts in dollars) For the years ended December 31 For the three months ended December
31
2016 2015 2014 2016 2015
Net earnings (loss) attributable to equity holders of the Company $ 655 ($ 2,838) ($ 2,907) $ 425 $ (2,622)
Impairment charges related to intangibles, goodwill, property, plant and equipment, and investments (250) 3,897 4,106 (304) 3,405
Acquisition/disposition (gains)/losses 42 (187) (50) 7 (107)
Foreign currency translation (gains)/losses 199 120 132 18 132
Significant tax adjustments1 43 134 (3) (16) 95
Other expense adjustments2 114 135 119 39 40
Unrealized gains on non-hedge derivative instruments (32) 11 181 (9) 4
Tax effect and non-controlling interest 47 (928) (785) 95 (856)
Adjusted net earnings $ 818 $ 344 $ 793 $ 255 $ 91
Net earnings (loss) per share3 0.56 (2.44) (2.50) 0.36 (2.25)
Adjusted net earnings per share3 0.70 0.30 0.68 0.22 0.08
1 Significant tax adjustments for the current year primarily relate to a tax provision booked by Acacia in Q1 2016. 2 Other expense adjustments for the current year relate to losses on debt extinguishment, the impact of the decrease in the discount rate used to calculate the provision for
environmental remediation at our closed mines and a reduction in cost of sales attributed to insurance proceeds recorded in the third quarter of 2016 relating to the 2015 oxygen plant motor failure at Pueblo Viejo.
3 Calculated using weighted average number of shares outstanding under the basic method of earnings per share.
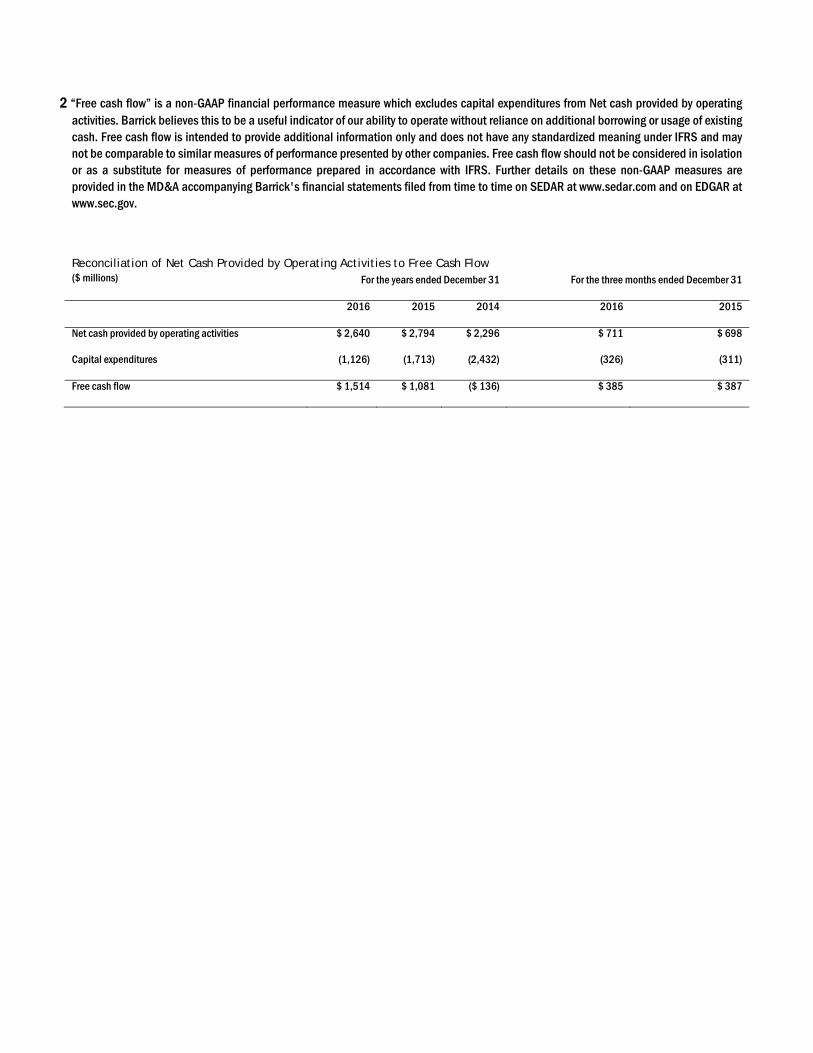
2 “Free cash flow” is a non-GAAP financial performance measure which excludes capital expenditures from Net cash provided by operating activities. Barrick believes this to be a useful indicator of our ability to operate without reliance on additional borrowing or usage of existing cash. Free cash flow is intended to provide additional information only and does not have any standardized meaning under IFRS and may not be comparable to similar measures of performance presented by other companies. Free cash flow should not be considered in isolation or as a substitute for measures of performance prepared in accordance with IFRS. Further details on these non-GAAP measures are provided in the MD&A accompanying Barrick's financial statements filed from time to time on SEDAR at www.sedar.com and on EDGAR at www.sec.gov.
Reconciliation of Net Cash Provided by Operating Activities to Free Cash Flow ($ millions) For the years ended December 31 For the three months ended December 31
2016 2015 2014 2016 2015
Net cash provided by operating activities $ 2,640 $ 2,794 $ 2,296 $ 711 $ 698
Capital expenditures (1,126) (1,713) (2,432) (326) (311)
Free cash flow $ 1,514 $ 1,081 ($ 136) $ 385 $ 387
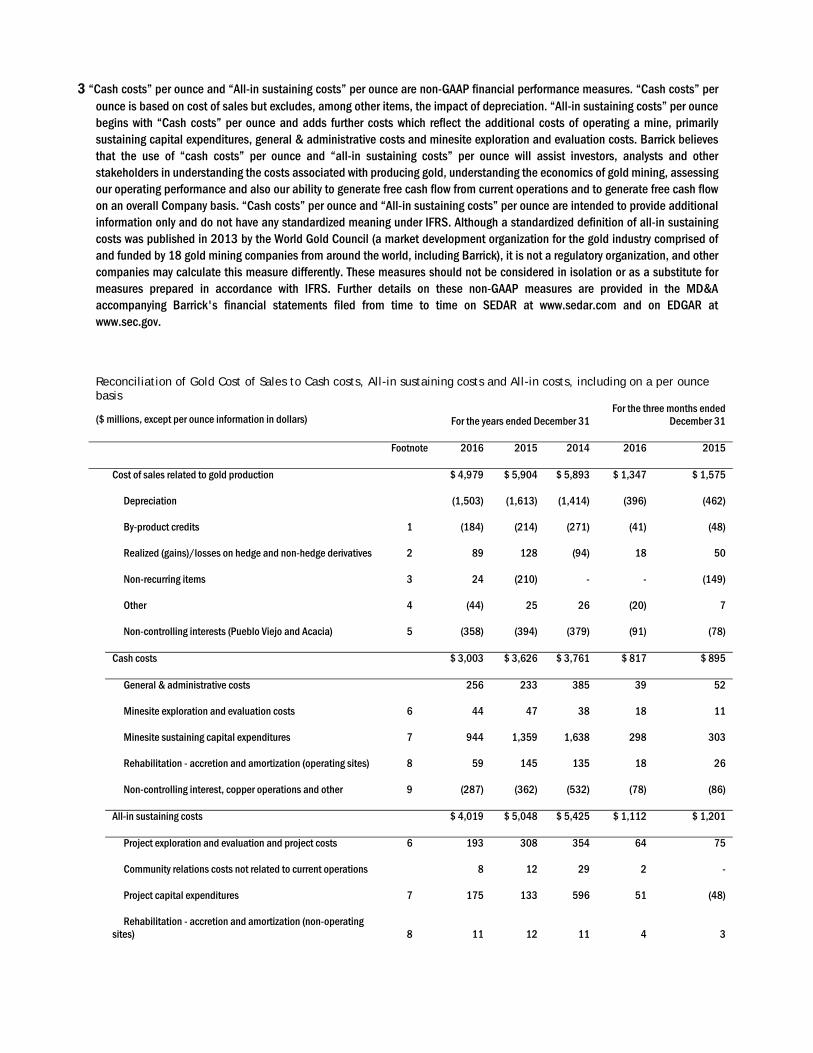
3 “Cash costs” per ounce and “All-in sustaining costs” per ounce are non-GAAP financial performance measures. “Cash costs” per ounce is based on cost of sales but excludes, among other items, the impact of depreciation. “All-in sustaining costs” per ounce begins with “Cash costs” per ounce and adds further costs which reflect the additional costs of operating a mine, primarily sustaining capital expenditures, general & administrative costs and minesite exploration and evaluation costs. Barrick believes that the use of “cash costs” per ounce and “all-in sustaining costs” per ounce will assist investors, analysts and other stakeholders in understanding the costs associated with producing gold, understanding the economics of gold mining, assessing our operating performance and also our ability to generate free cash flow from current operations and to generate free cash flow on an overall Company basis. “Cash costs” per ounce and “All-in sustaining costs” per ounce are intended to provide additional information only and do not have any standardized meaning under IFRS. Although a standardized definition of all-in sustaining costs was published in 2013 by the World Gold Council (a market development organization for the gold industry comprised of and funded by 18 gold mining companies from around the world, including Barrick), it is not a regulatory organization, and other companies may calculate this measure differently. These measures should not be considered in isolation or as a substitute for measures prepared in accordance with IFRS. Further details on these non-GAAP measures are provided in the MD&A accompanying Barrick's financial statements filed from time to time on SEDAR at www.sedar.com and on EDGAR at www.sec.gov.
Reconciliation of Gold Cost of Sales to Cash costs, All-in sustaining costs and All-in costs, including on a per ounce basis
($ millions, except per ounce information in dollars) For the years ended December 31 For the three months ended
December 31
Footnote 2016 2015 2014 2016 2015
Cost of sales related to gold production $ 4,979 $ 5,904 $ 5,893 $ 1,347 $ 1,575
Depreciation (1,503) (1,613) (1,414) (396) (462)
By-product credits 1 (184) (214) (271) (41) (48)
Realized (gains)/losses on hedge and non-hedge derivatives 2 89 128 (94) 18 50
Non-recurring items 3 24 (210) - - (149)
Other 4 (44) 25 26 (20) 7
Non-controlling interests (Pueblo Viejo and Acacia) 5 (358) (394) (379) (91) (78)
Cash costs $ 3,003 $ 3,626 $ 3,761 $ 817 $ 895
General & administrative costs 256 233 385 39 52
Minesite exploration and evaluation costs 6 44 47 38 18 11
Minesite sustaining capital expenditures 7 944 1,359 1,638 298 303
Rehabilitation - accretion and amortization (operating sites) 8 59 145 135 18 26
Non-controlling interest, copper operations and other 9 (287) (362) (532) (78) (86)
All-in sustaining costs $ 4,019 $ 5,048 $ 5,425 $ 1,112 $ 1,201
Project exploration and evaluation and project costs 6 193 308 354 64 75
Community relations costs not related to current operations 8 12 29 2 -
Project capital expenditures 7 175 133 596 51 (48)
Rehabilitation - accretion and amortization (non-operating
sites) 8 11 12 11 4 3
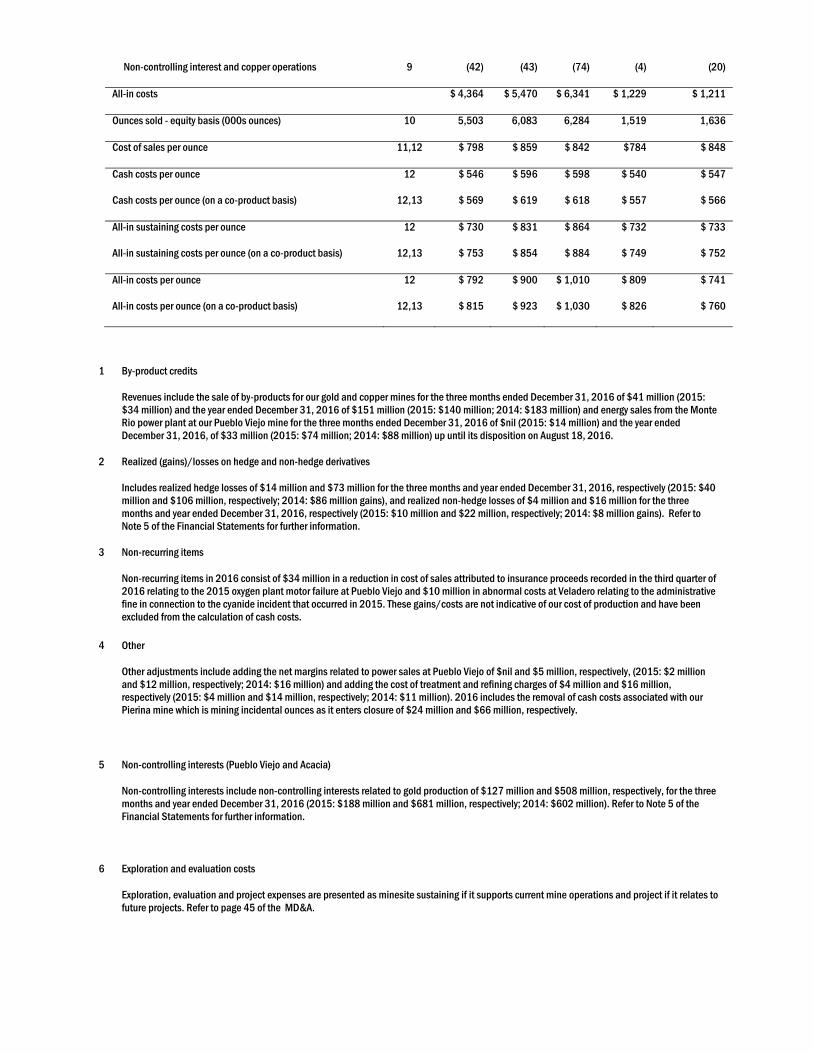
Non-controlling interest and copper operations 9 (42) (43) (74) (4) (20)
All-in costs $ 4,364 $ 5,470 $ 6,341 $ 1,229 $ 1,211
Ounces sold - equity basis (000s ounces) 10 5,503 6,083 6,284 1,519 1,636
Cost of sales per ounce 11,12 $ 798 $ 859 $ 842 $784 $ 848
Cash costs per ounce 12 $ 546 $ 596 $ 598 $ 540 $ 547
Cash costs per ounce (on a co-product basis) 12,13 $ 569 $ 619 $ 618 $ 557 $ 566
All-in sustaining costs per ounce 12 $ 730 $ 831 $ 864 $ 732 $ 733
All-in sustaining costs per ounce (on a co-product basis) 12,13 $ 753 $ 854 $ 884 $ 749 $ 752
All-in costs per ounce 12 $ 792 $ 900 $ 1,010 $ 809 $ 741
All-in costs per ounce (on a co-product basis) 12,13 $ 815 $ 923 $ 1,030 $ 826 $ 760
1 By-product credits
Revenues include the sale of by-products for our gold and copper mines for the three months ended December 31, 2016 of $41 million (2015: $34 million) and the year ended December 31, 2016 of $151 million (2015: $140 million; 2014: $183 million) and energy sales from the Monte Rio power plant at our Pueblo Viejo mine for the three months ended December 31, 2016 of $nil (2015: $14 million) and the year ended December 31, 2016, of $33 million (2015: $74 million; 2014: $88 million) up until its disposition on August 18, 2016.
2 Realized (gains)/losses on hedge and non-hedge derivatives
Includes realized hedge losses of $14 million and $73 million for the three months and year ended December 31, 2016, respectively (2015: $40 million and $106 million, respectively; 2014: $86 million gains), and realized non-hedge losses of $4 million and $16 million for the three months and year ended December 31, 2016, respectively (2015: $10 million and $22 million, respectively; 2014: $8 million gains). Refer to Note 5 of the Financial Statements for further information.
3 Non-recurring items
Non-recurring items in 2016 consist of $34 million in a reduction in cost of sales attributed to insurance proceeds recorded in the third quarter of 2016 relating to the 2015 oxygen plant motor failure at Pueblo Viejo and $10 million in abnormal costs at Veladero relating to the administrative fine in connection to the cyanide incident that occurred in 2015. These gains/costs are not indicative of our cost of production and have been excluded from the calculation of cash costs.
4 Other
Other adjustments include adding the net margins related to power sales at Pueblo Viejo of $nil and $5 million, respectively, (2015: $2 million and $12 million, respectively; 2014: $16 million) and adding the cost of treatment and refining charges of $4 million and $16 million, respectively (2015: $4 million and $14 million, respectively; 2014: $11 million). 2016 includes the removal of cash costs associated with our Pierina mine which is mining incidental ounces as it enters closure of $24 million and $66 million, respectively.
5 Non-controlling interests (Pueblo Viejo and Acacia)
Non-controlling interests include non-controlling interests related to gold production of $127 million and $508 million, respectively, for the three months and year ended December 31, 2016 (2015: $188 million and $681 million, respectively; 2014: $602 million). Refer to Note 5 of the Financial Statements for further information.
6 Exploration and evaluation costs
Exploration, evaluation and project expenses are presented as minesite sustaining if it supports current mine operations and project if it relates to future projects. Refer to page 45 of the MD&A.

7 Capital expenditures
Capital expenditures are related to our gold sites only and are presented on a 100% accrued basis. They are split between minesite sustaining and project capital expenditures. Project capital expenditures are distinct projects designed to increase the net present value of the mine and are not related to current production. Significant projects in the current year are Arturo, Cortez Lower Zone and Lagunas Norte Refractory Ore Project. Refer to page 44 of the MD&A.
8 Rehabilitation - accretion and amortization
Includes depreciation on the assets related to rehabilitation provisions of our gold operations and accretion on the rehabilitation provision of our gold operations, split between operating and non-operating sites.
9 Non-controlling interest and copper operations
Removes general & administrative costs related to non-controlling interests and copper based on a percentage allocation of revenue. Also removes exploration, evaluation and project costs, rehabilitation costs and capital expenditures incurred by our copper sites and the non-controlling interest of our Acacia and Pueblo Viejo operating segment and Arturo. In 2016, figures remove the impact of Pierina. The impact is summarized as the following:
($ millions)
For the years ended December 31 For the three months ended December 31
Non-controlling interest, copper operations and other 2016 2015 2014 2016 2015
General & administrative costs ($ 36) ($ 53) ($ 86) ($ 5) ($ 5)
Minesite exploration and evaluation costs (9) (8) (18) (3) (3)
Rehabilitation - accretion and amortization (operating sites) (9) (13) (12) (4) (4)
Minesite sustaining capital expenditures (233) (288) (416) (66) (74)
All-in sustaining costs total ($ 287) ($ 362) ($ 532) ($ 78) ($ 86)
Project exploration and evaluation and project costs (12) (11) (43) (4) (9)
Project capital expenditures (30) (32) (31) - (11)
All-in costs total ($ 42) ($ 43) ($ 74) ($ 4) ($ 20)
10 Ounces sold - equity basis
In 2016, figures remove the impact of Pierina as the mine is currently going through closure.
11 Cost of sales per ounce
In 2016, figures remove the cost of sales impact of Pierina of $30 million and $82 million, respectively for the three months and year ended December 31, 2016, as the mine is currently going through closure. Cost of sales per ounce excludes non-controlling interest related to gold productions. Cost of sales related to gold per ounce is calculated using cost of sales on an attributable basis (removing the non-controlling interest of 40% Pueblo Viejo and 36.1% Acacia from cost of sales), divided by attributable gold ounces.
12 Per ounce figures
Cost of sales per ounce, cash costs per ounce, all-in sustaining costs per ounce and all-in costs per ounce may not calculate based on amounts presented in the table due to rounding.
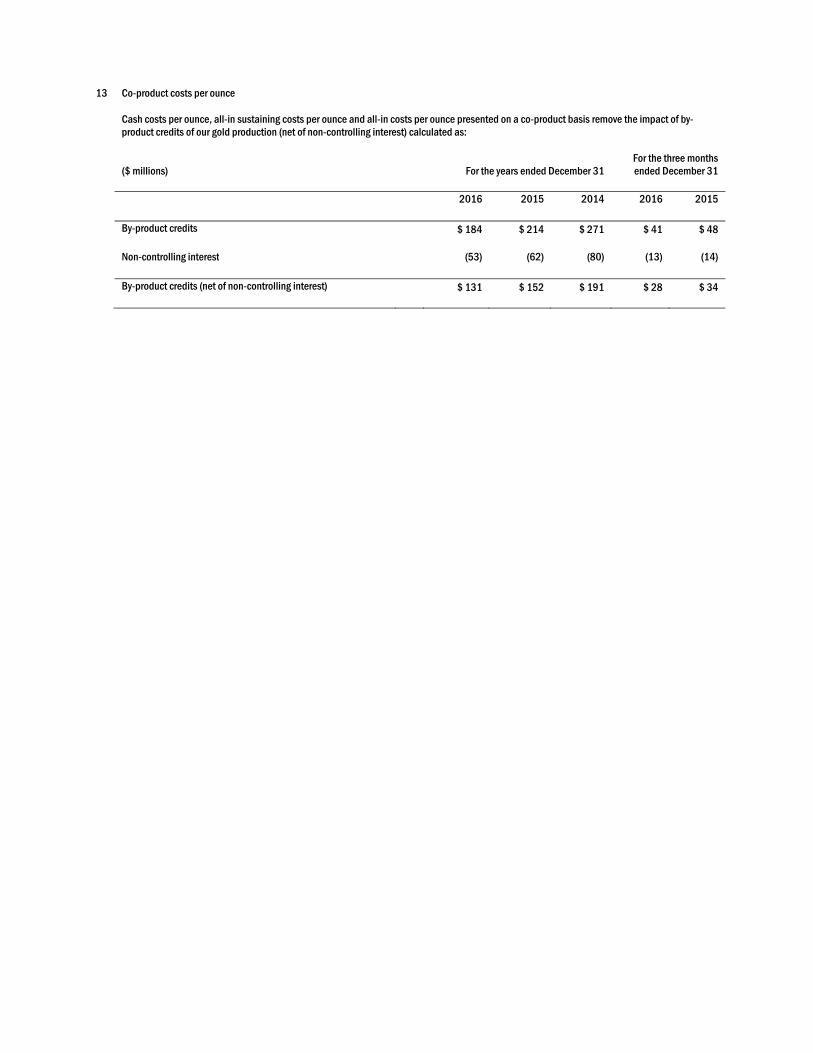
13 Co-product costs per ounce
Cash costs per ounce, all-in sustaining costs per ounce and all-in costs per ounce presented on a co-product basis remove the impact of by-product credits of our gold production (net of non-controlling interest) calculated as:
($ millions)
For the years ended December 31 For the three months ended December 31
2016 2015 2014 2016 2015
By-product credits $ 184 $ 214 $ 271 $ 41 $ 48
Non-controlling interest (53) (62) (80) (13) (14)
By-product credits (net of non-controlling interest) $ 131 $ 152 $ 191 $ 28 $ 34
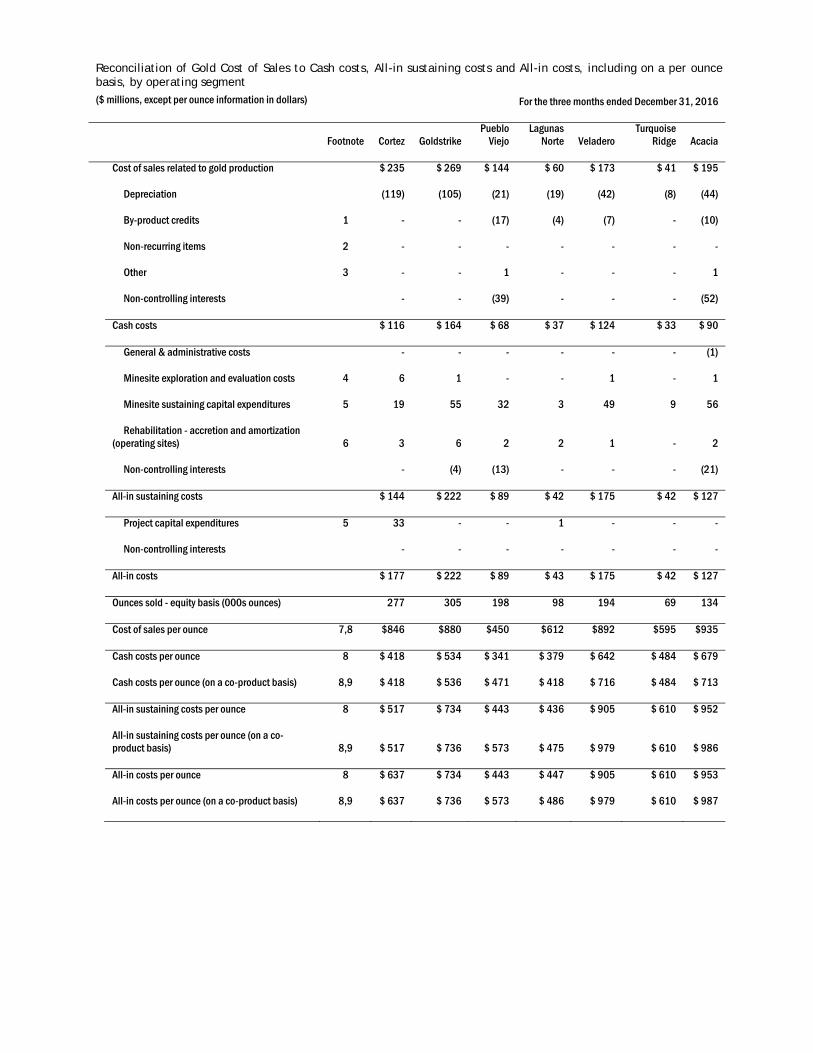
Reconciliation of Gold Cost of Sales to Cash costs, All-in sustaining costs and All-in costs, including on a per ounce basis, by operating segment ($ millions, except per ounce information in dollars) For the three months ended December 31, 2016
Footnote Cortez Goldstrike Pueblo
Viejo Lagunas
Norte Veladero Turquoise
Ridge Acacia
Cost of sales related to gold production $ 235 $ 269 $ 144 $ 60 $ 173 $ 41 $ 195
Depreciation (119) (105) (21) (19) (42) (8) (44)
By-product credits 1 - - (17) (4) (7) - (10)
Non-recurring items 2 - - - - - - -
Other 3 - - 1 - - - 1
Non-controlling interests - - (39) - - - (52)
Cash costs $ 116 $ 164 $ 68 $ 37 $ 124 $ 33 $ 90
General & administrative costs - - - - - - (1)
Minesite exploration and evaluation costs 4 6 1 - - 1 - 1
Minesite sustaining capital expenditures 5 19 55 32 3 49 9 56
Rehabilitation - accretion and amortization
(operating sites) 6 3 6 2 2 1 - 2
Non-controlling interests - (4) (13) - - - (21)
All-in sustaining costs $ 144 $ 222 $ 89 $ 42 $ 175 $ 42 $ 127
Project capital expenditures 5 33 - - 1 - - -
Non-controlling interests - - - - - - -
All-in costs $ 177 $ 222 $ 89 $ 43 $ 175 $ 42 $ 127
Ounces sold - equity basis (000s ounces) 277 305 198 98 194 69 134
Cost of sales per ounce 7,8 $846 $880 $450 $612 $892 $595 $935
Cash costs per ounce 8 $ 418 $ 534 $ 341 $ 379 $ 642 $ 484 $ 679
Cash costs per ounce (on a co-product basis) 8,9 $ 418 $ 536 $ 471 $ 418 $ 716 $ 484 $ 713
All-in sustaining costs per ounce 8 $ 517 $ 734 $ 443 $ 436 $ 905 $ 610 $ 952
All-in sustaining costs per ounce (on a co-product basis) 8,9 $ 517 $ 736 $ 573 $ 475 $ 979 $ 610 $ 986
All-in costs per ounce 8 $ 637 $ 734 $ 443 $ 447 $ 905 $ 610 $ 953
All-in costs per ounce (on a co-product basis) 8,9 $ 637 $ 736 $ 573 $ 486 $ 979 $ 610 $ 987
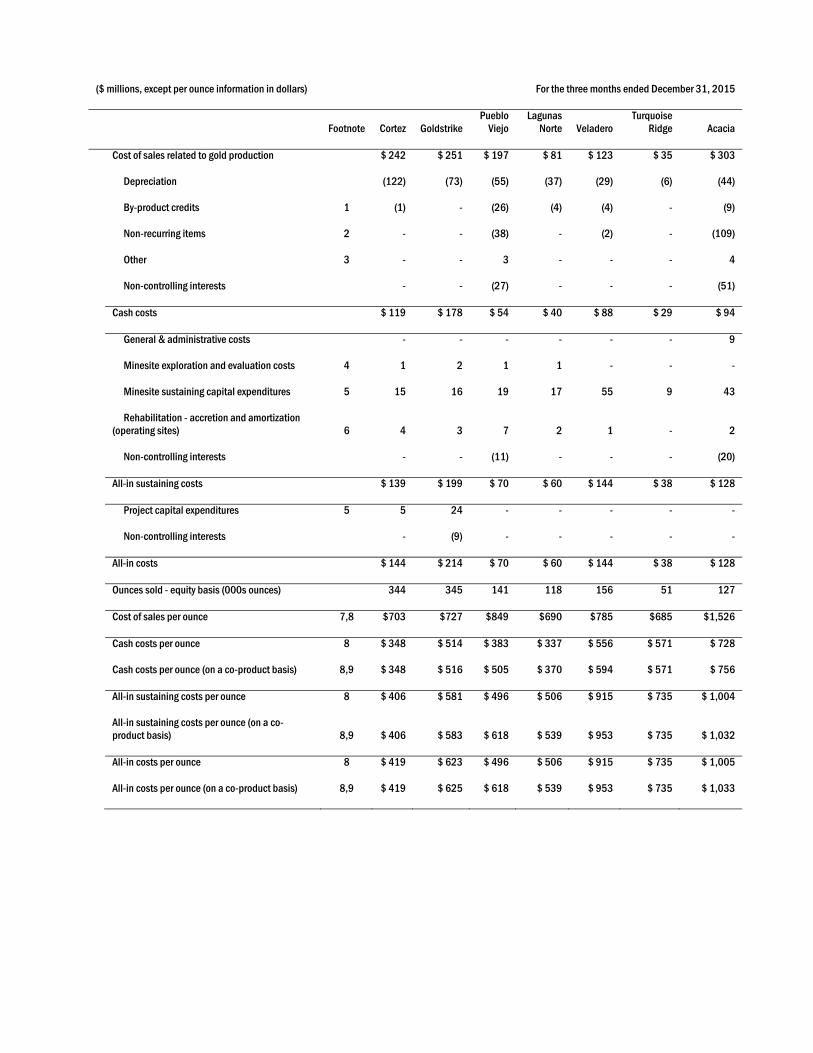
($ millions, except per ounce information in dollars) For the three months ended December 31, 2015
Footnote Cortez Goldstrike Pueblo
Viejo Lagunas
Norte Veladero Turquoise
Ridge Acacia
Cost of sales related to gold production $ 242 $ 251 $ 197 $ 81 $ 123 $ 35 $ 303
Depreciation (122) (73) (55) (37) (29) (6) (44)
By-product credits 1 (1) - (26) (4) (4) - (9)
Non-recurring items 2 - - (38) - (2) - (109)
Other 3 - - 3 - - - 4
Non-controlling interests - - (27) - - - (51)
Cash costs $ 119 $ 178 $ 54 $ 40 $ 88 $ 29 $ 94
General & administrative costs - - - - - - 9
Minesite exploration and evaluation costs 4 1 2 1 1 - - -
Minesite sustaining capital expenditures 5 15 16 19 17 55 9 43
Rehabilitation - accretion and amortization
(operating sites) 6 4 3 7 2 1 - 2
Non-controlling interests - - (11) - - - (20)
All-in sustaining costs $ 139 $ 199 $ 70 $ 60 $ 144 $ 38 $ 128
Project capital expenditures 5 5 24 - - - - -
Non-controlling interests - (9) - - - - -
All-in costs $ 144 $ 214 $ 70 $ 60 $ 144 $ 38 $ 128
Ounces sold - equity basis (000s ounces) 344 345 141 118 156 51 127
Cost of sales per ounce 7,8 $703 $727 $849 $690 $785 $685 $1,526
Cash costs per ounce 8 $ 348 $ 514 $ 383 $ 337 $ 556 $ 571 $ 728
Cash costs per ounce (on a co-product basis) 8,9 $ 348 $ 516 $ 505 $ 370 $ 594 $ 571 $ 756
All-in sustaining costs per ounce 8 $ 406 $ 581 $ 496 $ 506 $ 915 $ 735 $ 1,004
All-in sustaining costs per ounce (on a co-product basis) 8,9 $ 406 $ 583 $ 618 $ 539 $ 953 $ 735 $ 1,032
All-in costs per ounce 8 $ 419 $ 623 $ 496 $ 506 $ 915 $ 735 $ 1,005
All-in costs per ounce (on a co-product basis) 8,9 $ 419 $ 625 $ 618 $ 539 $ 953 $ 735 $ 1,033
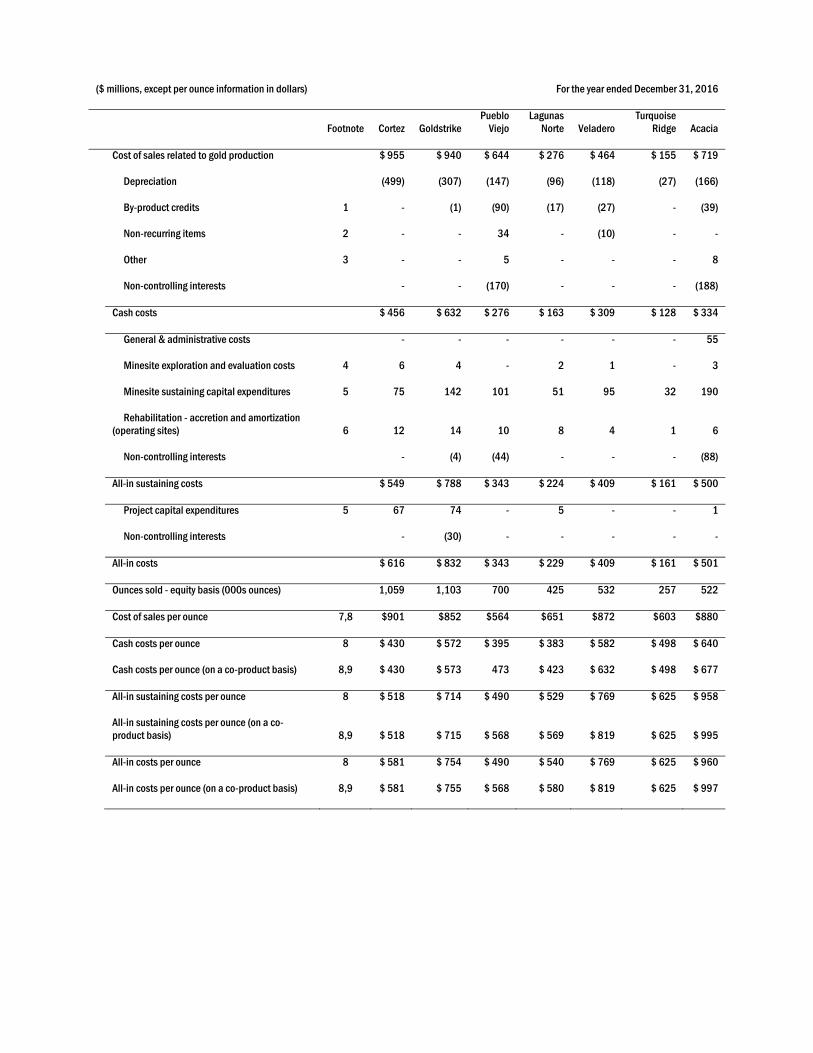
($ millions, except per ounce information in dollars) For the year ended December 31, 2016
Footnote Cortez Goldstrike Pueblo
Viejo Lagunas
Norte Veladero Turquoise
Ridge Acacia
Cost of sales related to gold production $ 955 $ 940 $ 644 $ 276 $ 464 $ 155 $ 719
Depreciation (499) (307) (147) (96) (118) (27) (166)
By-product credits 1 - (1) (90) (17) (27) - (39)
Non-recurring items 2 - - 34 - (10) - -
Other 3 - - 5 - - - 8
Non-controlling interests - - (170) - - - (188)
Cash costs $ 456 $ 632 $ 276 $ 163 $ 309 $ 128 $ 334
General & administrative costs - - - - - - 55
Minesite exploration and evaluation costs 4 6 4 - 2 1 - 3
Minesite sustaining capital expenditures 5 75 142 101 51 95 32 190
Rehabilitation - accretion and amortization
(operating sites) 6 12 14 10 8 4 1 6
Non-controlling interests - (4) (44) - - - (88)
All-in sustaining costs $ 549 $ 788 $ 343 $ 224 $ 409 $ 161 $ 500
Project capital expenditures 5 67 74 - 5 - - 1
Non-controlling interests - (30) - - - - -
All-in costs $ 616 $ 832 $ 343 $ 229 $ 409 $ 161 $ 501
Ounces sold - equity basis (000s ounces) 1,059 1,103 700 425 532 257 522
Cost of sales per ounce 7,8 $901 $852 $564 $651 $872 $603 $880
Cash costs per ounce 8 $ 430 $ 572 $ 395 $ 383 $ 582 $ 498 $ 640
Cash costs per ounce (on a co-product basis) 8,9 $ 430 $ 573 473 $ 423 $ 632 $ 498 $ 677
All-in sustaining costs per ounce 8 $ 518 $ 714 $ 490 $ 529 $ 769 $ 625 $ 958
All-in sustaining costs per ounce (on a co-product basis) 8,9 $ 518 $ 715 $ 568 $ 569 $ 819 $ 625 $ 995
All-in costs per ounce 8 $ 581 $ 754 $ 490 $ 540 $ 769 $ 625 $ 960
All-in costs per ounce (on a co-product basis) 8,9 $ 581 $ 755 $ 568 $ 580 $ 819 $ 625 $ 997
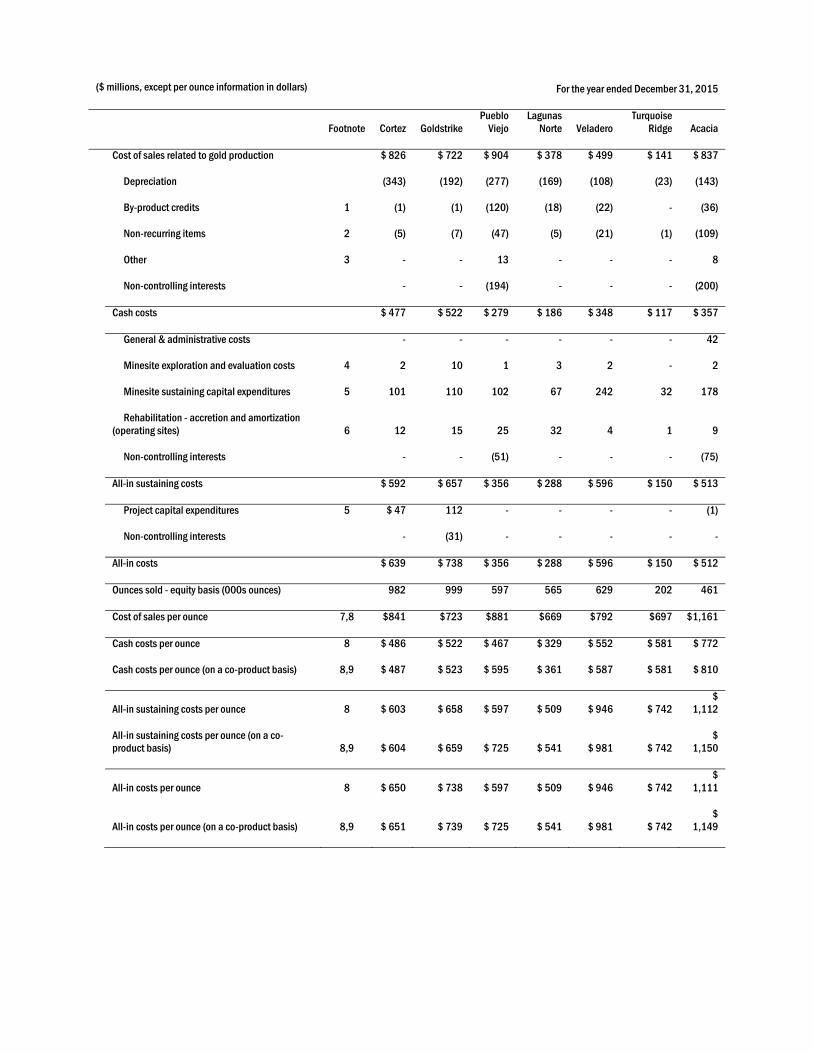
($ millions, except per ounce information in dollars) For the year ended December 31, 2015
Footnote Cortez Goldstrike Pueblo
Viejo Lagunas
Norte Veladero Turquoise
Ridge Acacia
Cost of sales related to gold production $ 826 $ 722 $ 904 $ 378 $ 499 $ 141 $ 837
Depreciation (343) (192) (277) (169) (108) (23) (143)
By-product credits 1 (1) (1) (120) (18) (22) - (36)
Non-recurring items 2 (5) (7) (47) (5) (21) (1) (109)
Other 3 - - 13 - - - 8
Non-controlling interests - - (194) - - - (200)
Cash costs $ 477 $ 522 $ 279 $ 186 $ 348 $ 117 $ 357
General & administrative costs - - - - - - 42
Minesite exploration and evaluation costs 4 2 10 1 3 2 - 2
Minesite sustaining capital expenditures 5 101 110 102 67 242 32 178
Rehabilitation - accretion and amortization
(operating sites) 6 12 15 25 32 4 1 9
Non-controlling interests - - (51) - - - (75)
All-in sustaining costs $ 592 $ 657 $ 356 $ 288 $ 596 $ 150 $ 513
Project capital expenditures 5 $ 47 112 - - - - (1)
Non-controlling interests - (31) - - - - -
All-in costs $ 639 $ 738 $ 356 $ 288 $ 596 $ 150 $ 512
Ounces sold - equity basis (000s ounces) 982 999 597 565 629 202 461
Cost of sales per ounce 7,8 $841 $723 $881 $669 $792 $697 $1,161
Cash costs per ounce 8 $ 486 $ 522 $ 467 $ 329 $ 552 $ 581 $ 772
Cash costs per ounce (on a co-product basis) 8,9 $ 487 $ 523 $ 595 $ 361 $ 587 $ 581 $ 810
All-in sustaining costs per ounce 8 $ 603 $ 658 $ 597 $ 509 $ 946 $ 742 $
1,112
All-in sustaining costs per ounce (on a co-product basis) 8,9 $ 604 $ 659 $ 725 $ 541 $ 981 $ 742
$ 1,150
All-in costs per ounce 8 $ 650 $ 738 $ 597 $ 509 $ 946 $ 742 $
1,111
All-in costs per ounce (on a co-product basis) 8,9 $ 651 $ 739 $ 725 $ 541 $ 981 $ 742 $
1,149
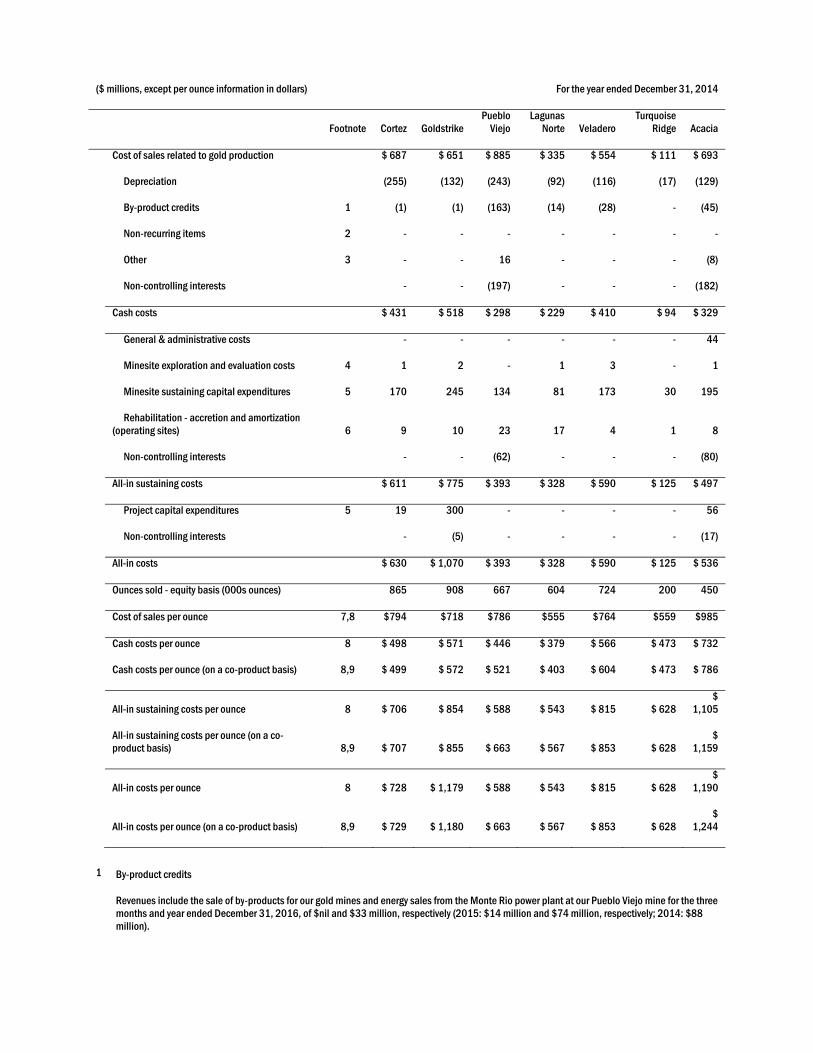
($ millions, except per ounce information in dollars) For the year ended December 31, 2014
Footnote Cortez Goldstrike Pueblo
Viejo Lagunas
Norte Veladero Turquoise
Ridge Acacia
Cost of sales related to gold production $ 687 $ 651 $ 885 $ 335 $ 554 $ 111 $ 693
Depreciation (255) (132) (243) (92) (116) (17) (129)
By-product credits 1 (1) (1) (163) (14) (28) - (45)
Non-recurring items 2 - - - - - - -
Other 3 - - 16 - - - (8)
Non-controlling interests - - (197) - - - (182)
Cash costs $ 431 $ 518 $ 298 $ 229 $ 410 $ 94 $ 329
General & administrative costs - - - - - - 44
Minesite exploration and evaluation costs 4 1 2 - 1 3 - 1
Minesite sustaining capital expenditures 5 170 245 134 81 173 30 195
Rehabilitation - accretion and amortization
(operating sites) 6 9 10 23 17 4 1 8
Non-controlling interests - - (62) - - - (80)
All-in sustaining costs $ 611 $ 775 $ 393 $ 328 $ 590 $ 125 $ 497
Project capital expenditures 5 19 300 - - - - 56
Non-controlling interests - (5) - - - - (17)
All-in costs $ 630 $ 1,070 $ 393 $ 328 $ 590 $ 125 $ 536
Ounces sold - equity basis (000s ounces) 865 908 667 604 724 200 450
Cost of sales per ounce 7,8 $794 $718 $786 $555 $764 $559 $985
Cash costs per ounce 8 $ 498 $ 571 $ 446 $ 379 $ 566 $ 473 $ 732
Cash costs per ounce (on a co-product basis) 8,9 $ 499 $ 572 $ 521 $ 403 $ 604 $ 473 $ 786
All-in sustaining costs per ounce 8 $ 706 $ 854 $ 588 $ 543 $ 815 $ 628 $
1,105
All-in sustaining costs per ounce (on a co-product basis) 8,9 $ 707 $ 855 $ 663 $ 567 $ 853 $ 628
$ 1,159
All-in costs per ounce 8 $ 728 $ 1,179 $ 588 $ 543 $ 815 $ 628 $
1,190
All-in costs per ounce (on a co-product basis) 8,9 $ 729 $ 1,180 $ 663 $ 567 $ 853 $ 628 $
1,244
1 By-product credits
Revenues include the sale of by-products for our gold mines and energy sales from the Monte Rio power plant at our Pueblo Viejo mine for the three months and year ended December 31, 2016, of $nil and $33 million, respectively (2015: $14 million and $74 million, respectively; 2014: $88 million).
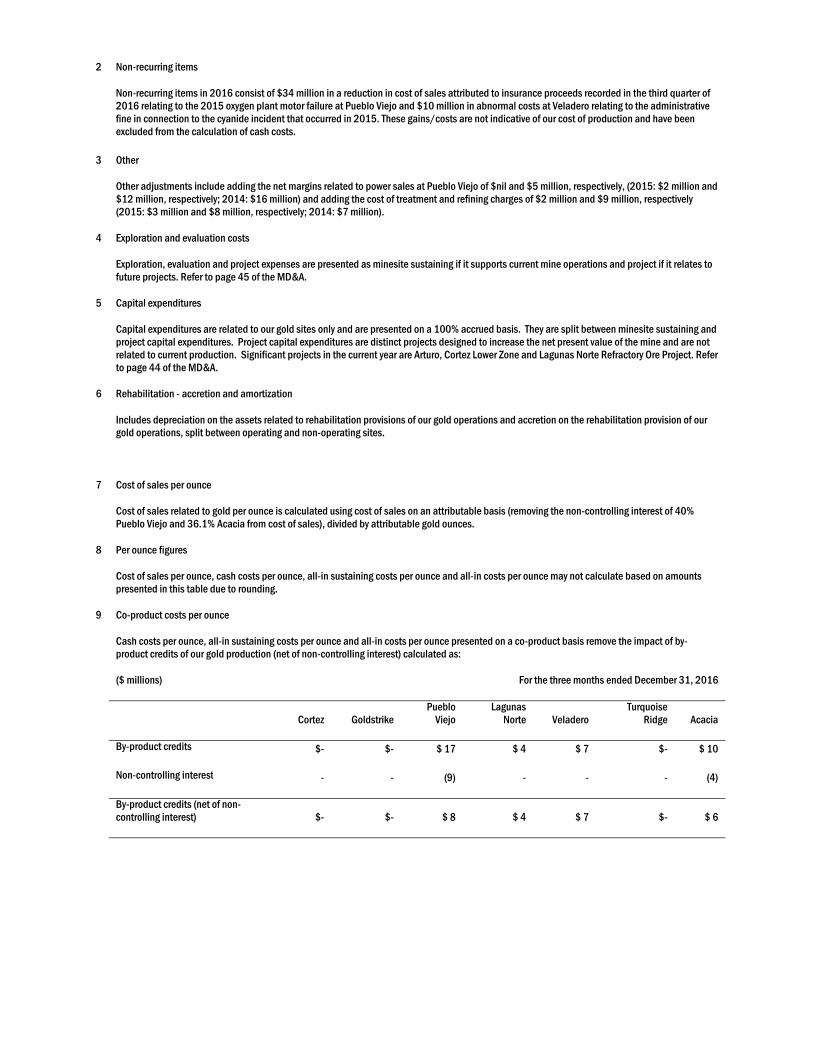
2 Non-recurring items
Non-recurring items in 2016 consist of $34 million in a reduction in cost of sales attributed to insurance proceeds recorded in the third quarter of 2016 relating to the 2015 oxygen plant motor failure at Pueblo Viejo and $10 million in abnormal costs at Veladero relating to the administrative fine in connection to the cyanide incident that occurred in 2015. These gains/costs are not indicative of our cost of production and have been excluded from the calculation of cash costs.
3 Other
Other adjustments include adding the net margins related to power sales at Pueblo Viejo of $nil and $5 million, respectively, (2015: $2 million and $12 million, respectively; 2014: $16 million) and adding the cost of treatment and refining charges of $2 million and $9 million, respectively (2015: $3 million and $8 million, respectively; 2014: $7 million).
4 Exploration and evaluation costs
Exploration, evaluation and project expenses are presented as minesite sustaining if it supports current mine operations and project if it relates to future projects. Refer to page 45 of the MD&A.
5 Capital expenditures
Capital expenditures are related to our gold sites only and are presented on a 100% accrued basis. They are split between minesite sustaining and project capital expenditures. Project capital expenditures are distinct projects designed to increase the net present value of the mine and are not related to current production. Significant projects in the current year are Arturo, Cortez Lower Zone and Lagunas Norte Refractory Ore Project. Refer to page 44 of the MD&A.
6 Rehabilitation - accretion and amortization
Includes depreciation on the assets related to rehabilitation provisions of our gold operations and accretion on the rehabilitation provision of our gold operations, split between operating and non-operating sites.
7 Cost of sales per ounce
Cost of sales related to gold per ounce is calculated using cost of sales on an attributable basis (removing the non-controlling interest of 40% Pueblo Viejo and 36.1% Acacia from cost of sales), divided by attributable gold ounces.
8 Per ounce figures
Cost of sales per ounce, cash costs per ounce, all-in sustaining costs per ounce and all-in costs per ounce may not calculate based on amounts presented in this table due to rounding.
9 Co-product costs per ounce
Cash costs per ounce, all-in sustaining costs per ounce and all-in costs per ounce presented on a co-product basis remove the impact of by-product credits of our gold production (net of non-controlling interest) calculated as:
($ millions) For the three months ended December 31, 2016
Cortez Goldstrike Pueblo
Viejo Lagunas
Norte Veladero Turquoise
Ridge Acacia
By-product credits $- $- $ 17 $ 4 $ 7 $- $ 10
Non-controlling interest - - (9) - - - (4)
By-product credits (net of non-controlling interest) $- $- $ 8 $ 4 $ 7 $- $ 6
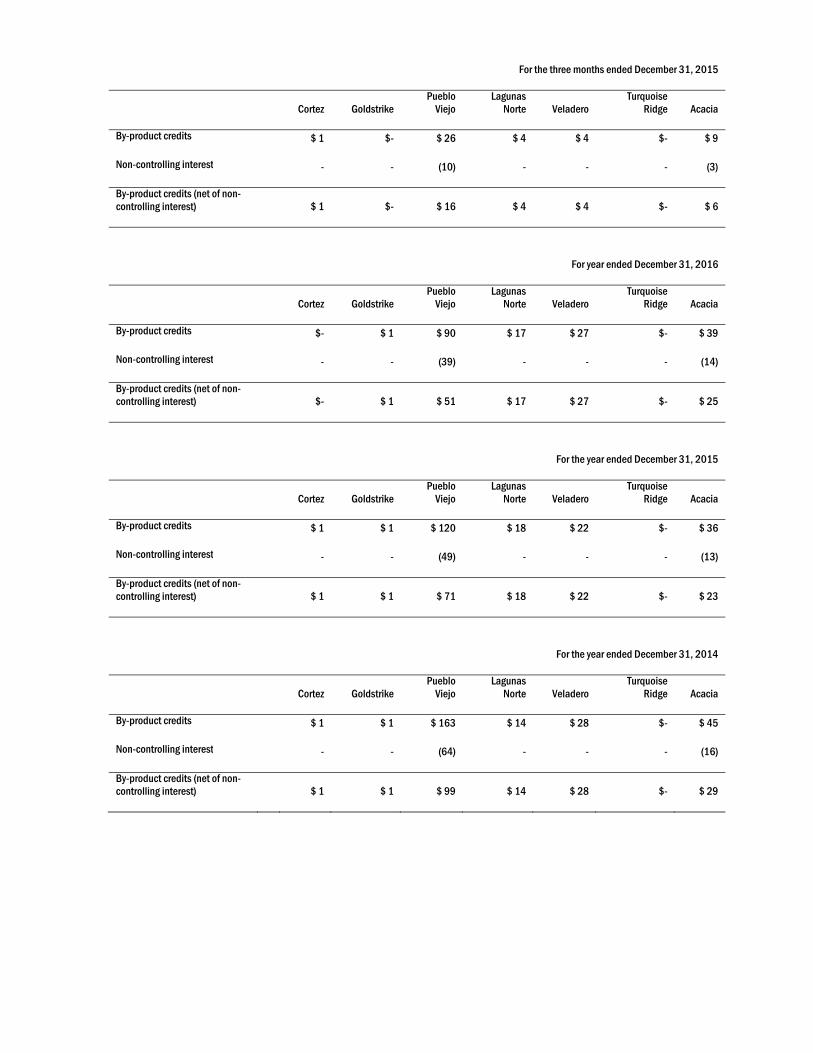
For the three months ended December 31, 2015
Cortez Goldstrike Pueblo
Viejo Lagunas
Norte Veladero Turquoise
Ridge Acacia
By-product credits $ 1 $- $ 26 $ 4 $ 4 $- $ 9
Non-controlling interest - - (10) - - - (3)
By-product credits (net of non-controlling interest) $ 1 $- $ 16 $ 4 $ 4 $- $ 6
For year ended December 31, 2016
Cortez Goldstrike Pueblo
Viejo Lagunas
Norte Veladero Turquoise
Ridge Acacia
By-product credits $- $ 1 $ 90 $ 17 $ 27 $- $ 39
Non-controlling interest - - (39) - - - (14)
By-product credits (net of non-controlling interest) $- $ 1 $ 51 $ 17 $ 27 $- $ 25
For the year ended December 31, 2015
Cortez Goldstrike Pueblo
Viejo Lagunas
Norte Veladero Turquoise
Ridge Acacia
By-product credits $ 1 $ 1 $ 120 $ 18 $ 22 $- $ 36
Non-controlling interest - - (49) - - - (13)
By-product credits (net of non-controlling interest) $ 1 $ 1 $ 71 $ 18 $ 22 $- $ 23
For the year ended December 31, 2014
Cortez Goldstrike Pueblo
Viejo Lagunas
Norte Veladero Turquoise
Ridge Acacia
By-product credits $ 1 $ 1 $ 163 $ 14 $ 28 $- $ 45
Non-controlling interest - - (64) - - - (16)
By-product credits (net of non-controlling interest) $ 1 $ 1 $ 99 $ 14 $ 28 $- $ 29
4 “C1 cash costs” per pound and “All-in sustaining costs” per pound are non-GAAP financial performance measures. “C1 cash
costs” per pound is based on cost of sales but excludes the impact of depreciation and royalties and includes treatment and refinement charges. “All-in sustaining costs” per pound begins with “C1 cash costs” per pound and adds further costs which reflect the additional costs of operating a mine, primarily sustaining capital expenditures, general & administrative costs and royalties. Barrick believes that the use of “C1 cash costs” per pound and “all-in sustaining costs” per pound will assist investors, analysts, and other stakeholders in understanding the costs associated with producing copper, understanding the economics of copper mining, assessing our operating performance, and also our ability to generate free cash flow from current operations and to generate free cash flow on an overall Company basis. “C1 cash costs” per pound and “All-in sustaining costs” per pound are intended to provide additional information only, do not have any standardized meaning under IFRS, and may not be comparable to similar measures of performance presented by other companies. These measures should not be considered in isolation or as a substitute for measures of performance prepared in accordance with IFRS. Further details on these non-GAAP measures are provided in the MD&A accompanying Barrick's financial statements filed from time to time on SEDAR at www.sedar.com and on EDGAR at www.sec.gov.
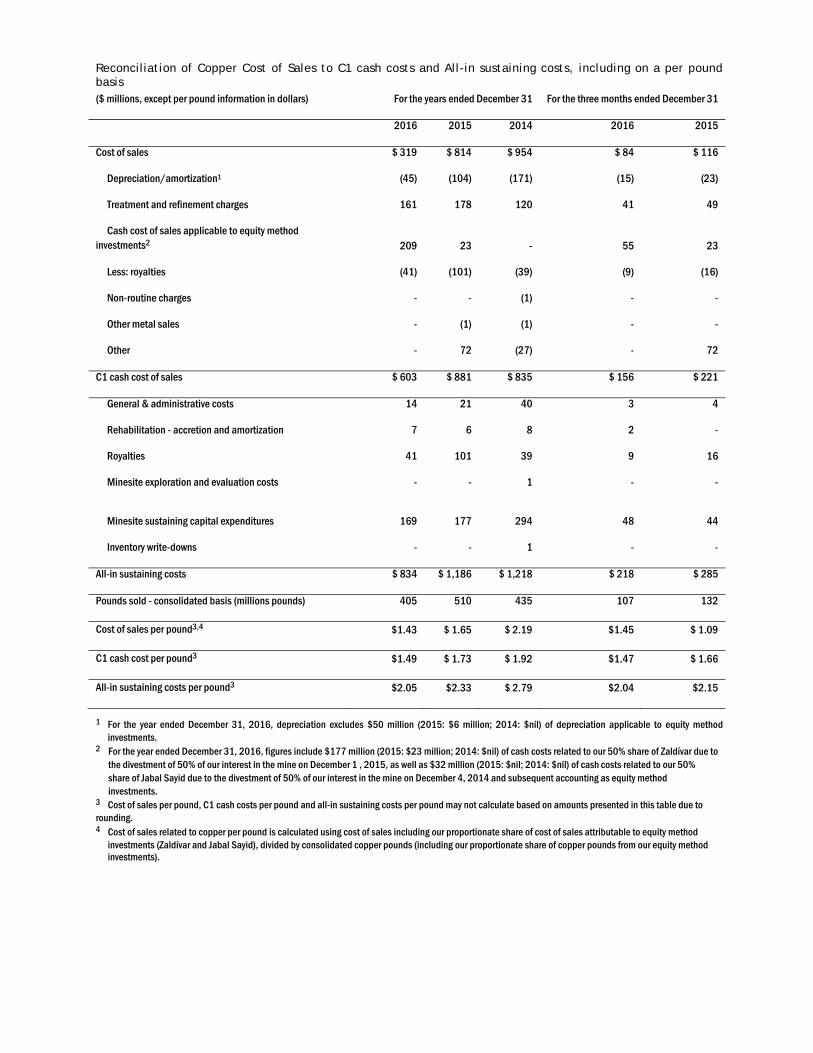
Reconciliation of Copper Cost of Sales to C1 cash costs and All-in sustaining costs, including on a per pound basis ($ millions, except per pound information in dollars) For the years ended December 31 For the three months ended December 31
2016 2015 2014 2016 2015
Cost of sales $ 319 $ 814 $ 954 $ 84 $ 116
Depreciation/amortization1 (45) (104) (171) (15) (23)
Treatment and refinement charges 161 178 120 41 49
Cash cost of sales applicable to equity method investments2 209 23 - 55 23
Less: royalties (41) (101) (39) (9) (16)
Non-routine charges - - (1) - -
Other metal sales - (1) (1) - -
Other - 72 (27) - 72
C1 cash cost of sales $ 603 $ 881 $ 835 $ 156 $ 221
General & administrative costs 14 21 40 3 4
Rehabilitation - accretion and amortization 7 6 8 2 -
Royalties 41 101 39 9 16
Minesite exploration and evaluation costs - - 1 - -
Minesite sustaining capital expenditures 169
177 294 48 44
Inventory write-downs - - 1 - -
All-in sustaining costs $ 834 $ 1,186 $ 1,218 $ 218 $ 285
Pounds sold - consolidated basis (millions pounds) 405 510 435 107 132
Cost of sales per pound3,4 $1.43 $ 1.65 $ 2.19 $1.45 $ 1.09
C1 cash cost per pound3 $1.49 $ 1.73 $ 1.92 $1.47 $ 1.66
All-in sustaining costs per pound3 $2.05 $2.33 $ 2.79 $2.04 $2.15
1 For the year ended December 31, 2016, depreciation excludes $50 million (2015: $6 million; 2014: $nil) of depreciation applicable to equity method investments.
2 For the year ended December 31, 2016, figures include $177 million (2015: $23 million; 2014: $nil) of cash costs related to our 50% share of Zaldívar due to the divestment of 50% of our interest in the mine on December 1 , 2015, as well as $32 million (2015: $nil; 2014: $nil) of cash costs related to our 50% share of Jabal Sayid due to the divestment of 50% of our interest in the mine on December 4, 2014 and subsequent accounting as equity method investments.
3 Cost of sales per pound, C1 cash costs per pound and all-in sustaining costs per pound may not calculate based on amounts presented in this table due to rounding. 4 Cost of sales related to copper per pound is calculated using cost of sales including our proportionate share of cost of sales attributable to equity method
investments (Zaldívar and Jabal Sayid), divided by consolidated copper pounds (including our proportionate share of copper pounds from our equity method investments).
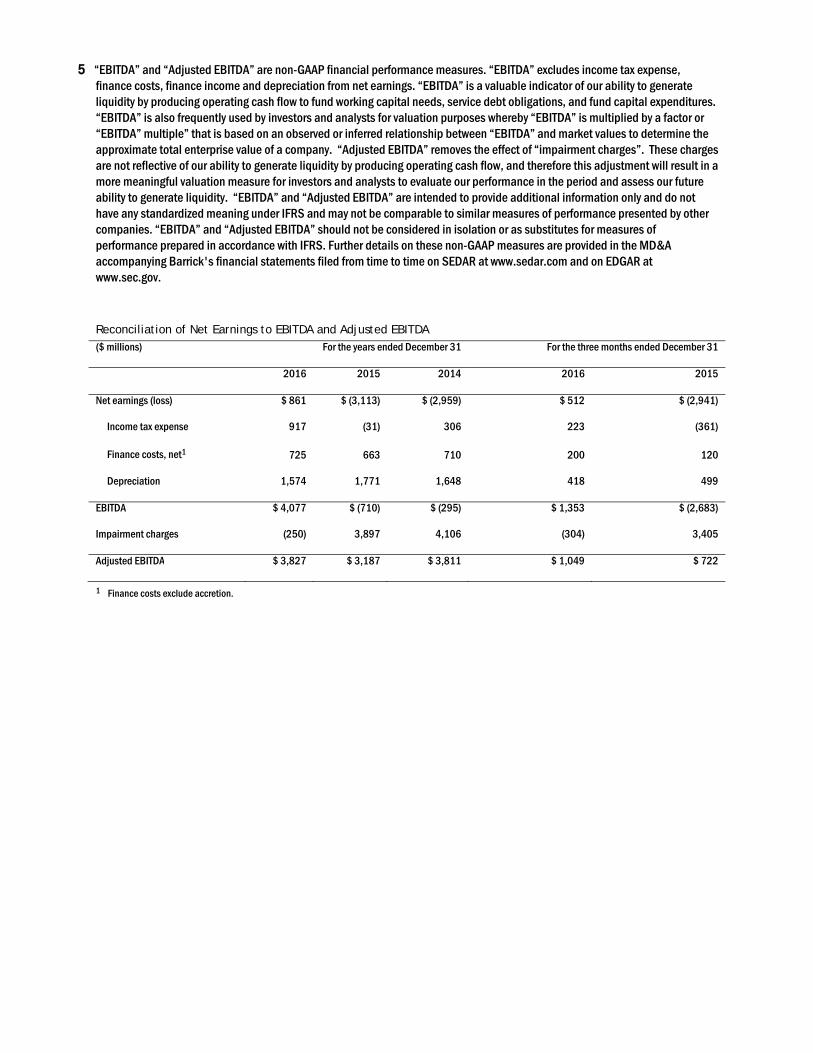
5 “EBITDA” and “Adjusted EBITDA” are non-GAAP financial performance measures. “EBITDA” excludes income tax expense,
finance costs, finance income and depreciation from net earnings. “EBITDA” is a valuable indicator of our ability to generate liquidity by producing operating cash flow to fund working capital needs, service debt obligations, and fund capital expenditures. “EBITDA” is also frequently used by investors and analysts for valuation purposes whereby “EBITDA” is multiplied by a factor or “EBITDA” multiple” that is based on an observed or inferred relationship between “EBITDA” and market values to determine the approximate total enterprise value of a company. “Adjusted EBITDA” removes the effect of “impairment charges”. These charges are not reflective of our ability to generate liquidity by producing operating cash flow, and therefore this adjustment will result in a more meaningful valuation measure for investors and analysts to evaluate our performance in the period and assess our future ability to generate liquidity. “EBITDA” and “Adjusted EBITDA” are intended to provide additional information only and do not have any standardized meaning under IFRS and may not be comparable to similar measures of performance presented by other companies. “EBITDA” and “Adjusted EBITDA” should not be considered in isolation or as substitutes for measures of performance prepared in accordance with IFRS. Further details on these non-GAAP measures are provided in the MD&A accompanying Barrick's financial statements filed from time to time on SEDAR at www.sedar.com and on EDGAR at www.sec.gov.
Reconciliation of Net Earnings to EBITDA and Adjusted EBITDA ($ millions) For the years ended December 31 For the three months ended December 31
2016 2015 2014 2016 2015
Net earnings (loss) $ 861 $ (3,113) $ (2,959) $ 512 $ (2,941)
Income tax expense 917 (31) 306 223 (361)
Finance costs, net1 725 663 710 200 120
Depreciation 1,574 1,771 1,648 418 499
EBITDA $ 4,077 $ (710) $ (295) $ 1,353 $ (2,683)
Impairment charges (250) 3,897 4,106 (304) 3,405
Adjusted EBITDA $ 3,827 $ 3,187 $ 3,811 $ 1,049 $ 722
1 Finance costs exclude accretion.
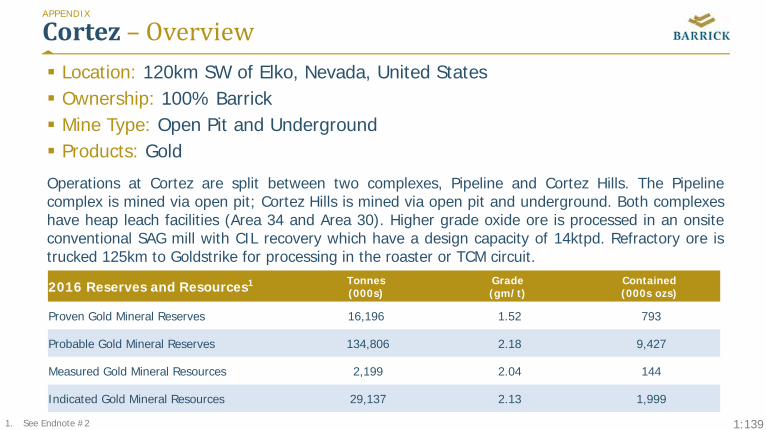
1:139
Cortez– Overview Location: 120km SW of Elko, Nevada, United States Ownership: 100% Barrick Mine Type: Open Pit and Underground Products: Gold
Operations at Cortez are split between two complexes, Pipeline and Cortez Hills. The Pipelinecomplex is mined via open pit; Cortez Hills is mined via open pit and underground. Both complexeshave heap leach facilities (Area 34 and Area 30). Higher grade oxide ore is processed in an onsiteconventional SAG mill with CIL recovery which have a design capacity of 14ktpd. Refractory ore istrucked 125km to Goldstrike for processing in the roaster or TCM circuit.
APPENDIX
2016 Reserves and Resources1 Tonnes(000s)
Grade(gm/t)
Contained(000s ozs)
Proven Gold Mineral Reserves 16,196 1.52 793
Probable Gold Mineral Reserves 134,806 2.18 9,427
Measured Gold Mineral Resources 2,199 2.04 144
Indicated Gold Mineral Resources 29,137 2.13 1,999
1. See Endnote #2
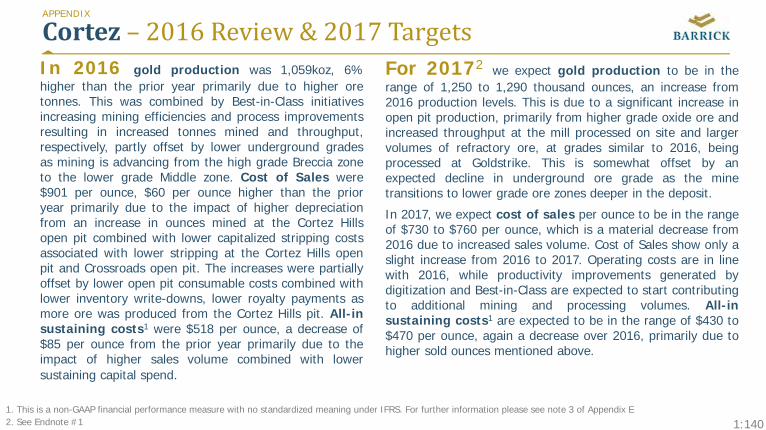
1:140
Cortez– 2016Review&2017TargetsIn 2016 gold production was 1,059koz, 6%higher than the prior year primarily due to higher oretonnes. This was combined by Best-in-Class initiativesincreasing mining efficiencies and process improvementsresulting in increased tonnes mined and throughput,respectively, partly offset by lower underground gradesas mining is advancing from the high grade Breccia zoneto the lower grade Middle zone. Cost of Sales were$901 per ounce, $60 per ounce higher than the prioryear primarily due to the impact of higher depreciationfrom an increase in ounces mined at the Cortez Hillsopen pit combined with lower capitalized stripping costsassociated with lower stripping at the Cortez Hills openpit and Crossroads open pit. The increases were partiallyoffset by lower open pit consumable costs combined withlower inventory write-downs, lower royalty payments asmore ore was produced from the Cortez Hills pit. All-insustaining costs1 were $518 per ounce, a decrease of$85 per ounce from the prior year primarily due to theimpact of higher sales volume combined with lowersustaining capital spend.
For 20172 we expect gold production to be in therange of 1,250 to 1,290 thousand ounces, an increase from2016 production levels. This is due to a significant increase inopen pit production, primarily from higher grade oxide ore andincreased throughput at the mill processed on site and largervolumes of refractory ore, at grades similar to 2016, beingprocessed at Goldstrike. This is somewhat offset by anexpected decline in underground ore grade as the minetransitions to lower grade ore zones deeper in the deposit.
In 2017, we expect cost of sales per ounce to be in the rangeof $730 to $760 per ounce, which is a material decrease from2016 due to increased sales volume. Cost of Sales show only aslight increase from 2016 to 2017. Operating costs are in linewith 2016, while productivity improvements generated bydigitization and Best-in-Class are expected to start contributingto additional mining and processing volumes. All-insustaining costs1 are expected to be in the range of $430 to$470 per ounce, again a decrease over 2016, primarily due tohigher sold ounces mentioned above.
APPENDIX
1. This is a non-GAAP financial performance measure with no standardized meaning under IFRS. For further information please see note 3 of Appendix E 2. See Endnote #1
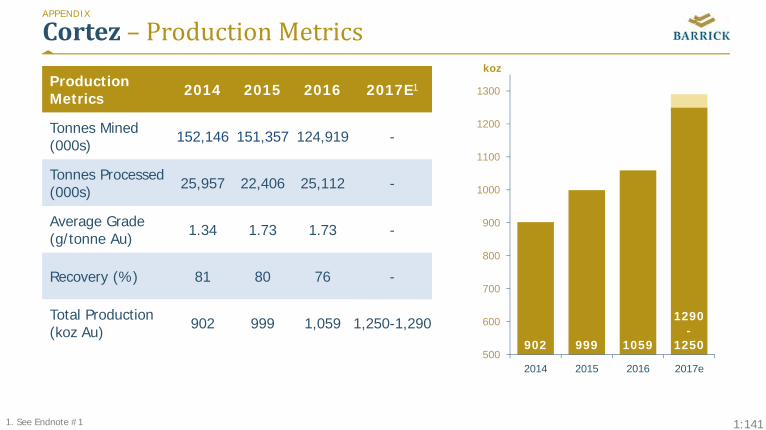
1:141
Cortez– ProductionMetrics
ProductionMetrics 2014 2015 2016 2017E1
Tonnes Mined (000s) 152,146 151,357 124,919 -
Tonnes Processed(000s) 25,957 22,406 25,112 -
Average Grade(g/tonne Au) 1.34 1.73 1.73 -
Recovery (%) 81 80 76 -
Total Production (koz Au) 902 999 1,059 1,250-1,290
APPENDIX
1. See Endnote #1
902 999 1059
1290-
1250500
600
700
800
900
1000
1100
1200
1300
2014 2015 2016 2017e
koz
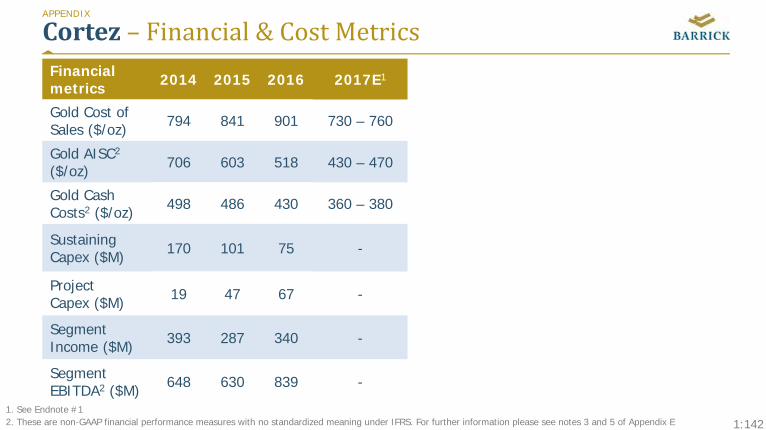
1:142
Financial metrics 2014 2015 2016 2017E1
Gold Cost of Sales ($/oz) 794 841 901 730 – 760
Gold AISC2
($/oz) 706 603 518 430 – 470
Gold CashCosts2 ($/oz) 498 486 430 360 – 380
Sustaining Capex ($M) 170 101 75 -
ProjectCapex ($M) 19 47 67 -
SegmentIncome ($M) 393 287 340 -
SegmentEBITDA2 ($M) 648 630 839 -
Cortez– Financial&CostMetricsAPPENDIX
1. See Endnote #1 2. These are non-GAAP financial performance measures with no standardized meaning under IFRS. For further information please see notes 3 and 5 of Appendix E
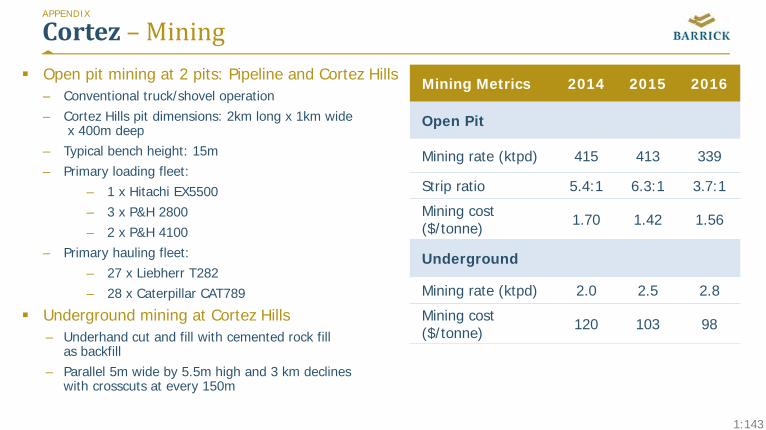
1:143
Cortez– Mining Open pit mining at 2 pits: Pipeline and Cortez Hills
– Conventional truck/shovel operation– Cortez Hills pit dimensions: 2km long x 1km wide
x 400m deep – Typical bench height: 15m– Primary loading fleet:
– 1 x Hitachi EX5500– 3 x P&H 2800– 2 x P&H 4100
– Primary hauling fleet:– 27 x Liebherr T282– 28 x Caterpillar CAT789
Underground mining at Cortez Hills– Underhand cut and fill with cemented rock fill
as backfill– Parallel 5m wide by 5.5m high and 3 km declines
with crosscuts at every 150m
Mining Metrics 2014 2015 2016
Open Pit
Mining rate (ktpd) 415 413 339
Strip ratio 5.4:1 6.3:1 3.7:1
Mining cost ($/tonne) 1.70 1.42 1.56
Underground
Mining rate (ktpd) 2.0 2.5 2.8
Mining cost ($/tonne) 120 103 98
APPENDIX

1:144
Cortez– ProcessingAPPENDIX
Processing metrics 2014 2015 2016
Mill Leaching
Cost ($/tonne) 12.4 13.1 12.3
Throughput (tonne/day) 10,200 9,500 11,500
Recovery (%) 84.2% 87.0% 87.7%
Total Production (koz Au) 468 530 568
Heap Leaching
Cost ($/tonne) 1.4 1.2 1.0
Throughput (tonne/day) 58,400 49,400 54,600
Recovery (%) 71.9% 52.9% 50.2%
Total Production (koz Au) 225 141 229

1:145
Cortez– Processing,cont’dAPPENDIX
Processing metrics 2014 2015 2016
Autoclave (Goldstrike)
Cost ($/tonne) 67.8 45.9 49.3
Throughput (tonne/day) See Goldstrike See Goldstrike See Goldstrike
Recovery (%) 84.3% 75.6% 64.4%
Total Production (koz Au) 98 33 8
Roaster (Goldstrike)
Cost ($/tonne) 28.7 28.7 28.7
Throughput (tonne/day) See Goldstrike See Goldstrike See Goldstrike
Recovery (%) 82.9% 90.7% 90.6%
Total Production (koz Au) 111 295 254
Total
Cost ($/tonne) 4.2 4.2 4.0
Throughput (tonne/day) 71,100 61,400 68,700
Recovery (%) 80.6% 80.3% 75.9%
Total Production (koz Au) 902 999 1,059
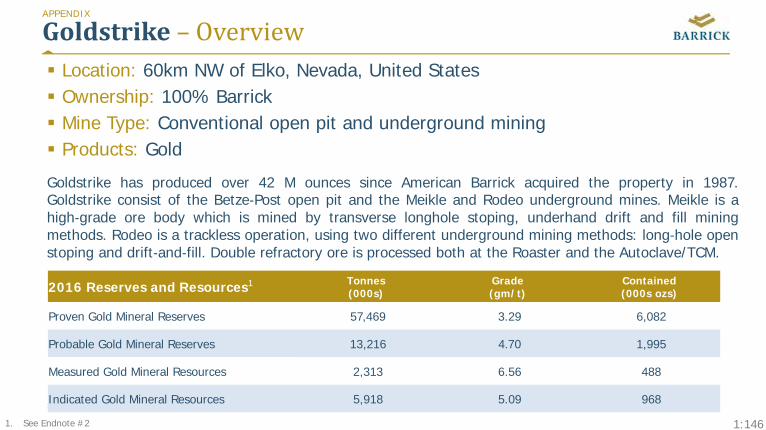
1:146
Goldstrike– Overview Location: 60km NW of Elko, Nevada, United States Ownership: 100% Barrick Mine Type: Conventional open pit and underground mining Products: Gold
Goldstrike has produced over 42 M ounces since American Barrick acquired the property in 1987.Goldstrike consist of the Betze‐Post open pit and the Meikle and Rodeo underground mines. Meikle is ahigh‐grade ore body which is mined by transverse longhole stoping, underhand drift and fill miningmethods. Rodeo is a trackless operation, using two different underground mining methods: long‐hole openstoping and drift‐and‐fill. Double refractory ore is processed both at the Roaster and the Autoclave/TCM.
APPENDIX
1. Does not include South Arturo
2016 Reserves and Resources1 Tonnes(000s)
Grade(gm/t)
Contained(000s ozs)
Proven Gold Mineral Reserves 57,469 3.29 6,082
Probable Gold Mineral Reserves 13,216 4.70 1,995
Measured Gold Mineral Resources 2,313 6.56 488
Indicated Gold Mineral Resources 5,918 5.09 968
1. See Endnote #2
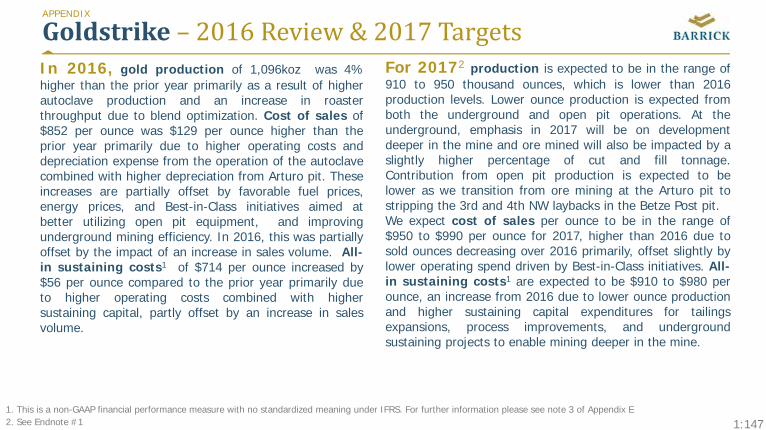
1:147
Goldstrike– 2016Review&2017TargetsIn 2016, gold production of 1,096koz was 4%higher than the prior year primarily as a result of higherautoclave production and an increase in roasterthroughput due to blend optimization. Cost of sales of$852 per ounce was $129 per ounce higher than theprior year primarily due to higher operating costs anddepreciation expense from the operation of the autoclavecombined with higher depreciation from Arturo pit. Theseincreases are partially offset by favorable fuel prices,energy prices, and Best-in-Class initiatives aimed atbetter utilizing open pit equipment, and improvingunderground mining efficiency. In 2016, this was partiallyoffset by the impact of an increase in sales volume. All-in sustaining costs1 of $714 per ounce increased by$56 per ounce compared to the prior year primarily dueto higher operating costs combined with highersustaining capital, partly offset by an increase in salesvolume.
For 20172 production is expected to be in the range of910 to 950 thousand ounces, which is lower than 2016production levels. Lower ounce production is expected fromboth the underground and open pit operations. At theunderground, emphasis in 2017 will be on developmentdeeper in the mine and ore mined will also be impacted by aslightly higher percentage of cut and fill tonnage.Contribution from open pit production is expected to belower as we transition from ore mining at the Arturo pit tostripping the 3rd and 4th NW laybacks in the Betze Post pit.We expect cost of sales per ounce to be in the range of$950 to $990 per ounce for 2017, higher than 2016 due tosold ounces decreasing over 2016 primarily, offset slightly bylower operating spend driven by Best-in-Class initiatives. All-in sustaining costs1 are expected to be $910 to $980 perounce, an increase from 2016 due to lower ounce productionand higher sustaining capital expenditures for tailingsexpansions, process improvements, and undergroundsustaining projects to enable mining deeper in the mine.
APPENDIX
1. This is a non-GAAP financial performance measure with no standardized meaning under IFRS. For further information please see note 3 of Appendix E 2. See Endnote #1
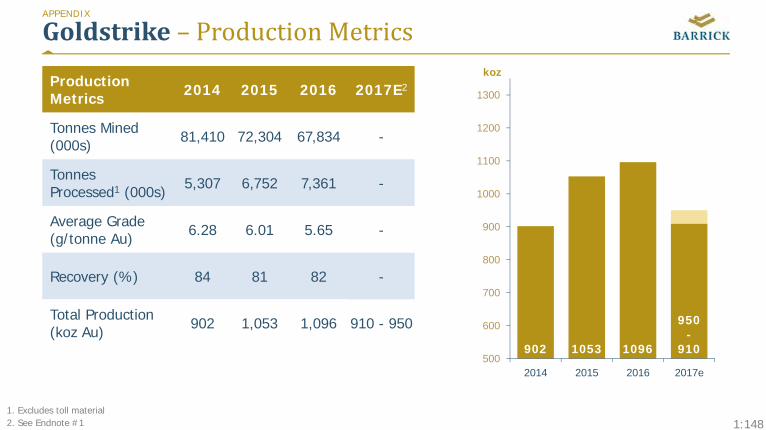
1:148
Goldstrike– ProductionMetrics
ProductionMetrics 2014 2015 2016 2017E2
Tonnes Mined (000s) 81,410 72,304 67,834 -
TonnesProcessed1 (000s) 5,307 6,752 7,361 -
Average Grade (g/tonne Au) 6.28 6.01 5.65 -
Recovery (%) 84 81 82 -
Total Production (koz Au) 902 1,053 1,096 910 - 950
APPENDIX
902 1053 1096
950-
910500
600
700
800
900
1000
1100
1200
1300
2014 2015 2016 2017e
koz
1. Excludes toll material2. See Endnote #1
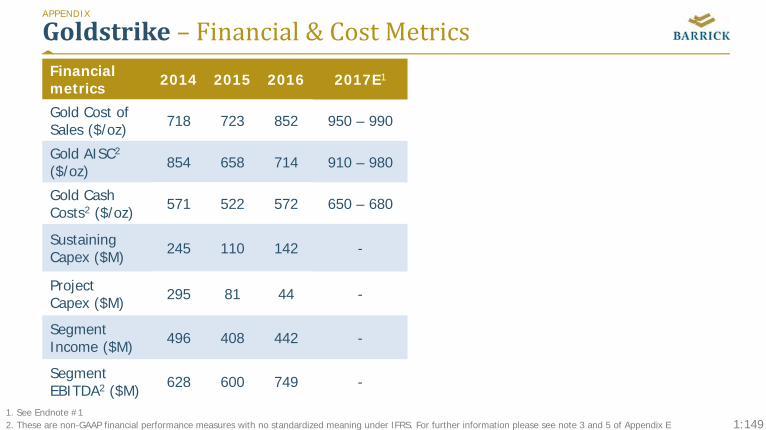
1:149
Goldstrike– Financial&CostMetricsAPPENDIX
Financial metrics 2014 2015 2016 2017E1
Gold Cost of Sales ($/oz) 718 723 852 950 – 990
Gold AISC2
($/oz) 854 658 714 910 – 980
Gold CashCosts2 ($/oz) 571 522 572 650 – 680
Sustaining Capex ($M) 245 110 142 -
ProjectCapex ($M) 295 81 44 -
SegmentIncome ($M) 496 408 442 -
SegmentEBITDA2 ($M) 628 600 749 -
1. See Endnote #1 2. These are non-GAAP financial performance measures with no standardized meaning under IFRS. For further information please see note 3 and 5 of Appendix E

1:150
Goldstrike– Mining(100%)2
Open pit mining at Betze Post– Conventional truck/shovel operation
– Pit dimensions: 3.3km long x 2km wide x 600m deep (w/out backfill)
– Typical bench height: 6-13m
– Primary loading fleet:
– 2 x P&H 4100
– 2 x P&H 2800
– 1 x Hitachi EX5500
– Primary hauling fleet:
– 23 x Komatsu 930E
Underground mining at Meikle and Rodeo– Underhand cut and fill, longhole stoping
– Cemented rock fill and paste as backfill
Mining Metrics 2014 2015 2016
Open Pit
Mining rate (ktpd) 219 237 244
Strip ratio 12.4:1 10.9:1 22.7:1
Mining cost1($/tonne) 2.25 1.90 1.60
Underground
Mining rate (ktpd) 5.4 4.9 4.9
Mining cost ($/tonne) 122 112 106
APPENDIX
1. Includes dewatering cost2. Stats above reflect all ore processed at Goldstrike including Arturo, Cortez and Goldstrike
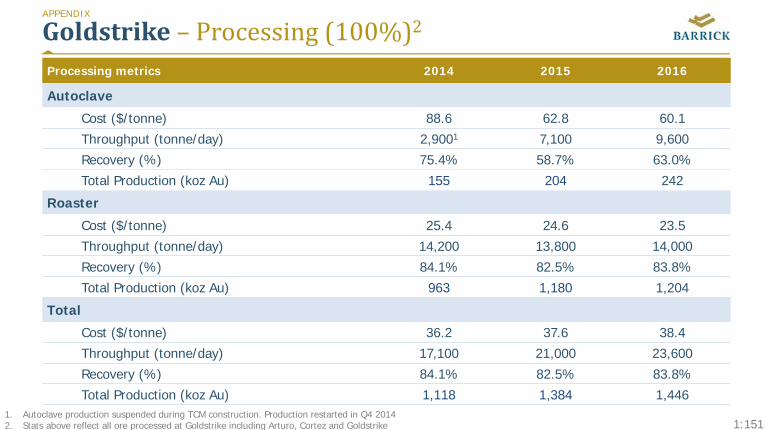
1:151
Goldstrike– Processing(100%)2APPENDIX
Processing metrics 2014 2015 2016
Autoclave
Cost ($/tonne) 88.6 62.8 60.1Throughput (tonne/day) 2,9001 7,100 9,600Recovery (%) 75.4% 58.7% 63.0%Total Production (koz Au) 155 204 242
Roaster
Cost ($/tonne) 25.4 24.6 23.5Throughput (tonne/day) 14,200 13,800 14,000Recovery (%) 84.1% 82.5% 83.8%Total Production (koz Au) 963 1,180 1,204
Total
Cost ($/tonne) 36.2 37.6 38.4Throughput (tonne/day) 17,100 21,000 23,600Recovery (%) 84.1% 82.5% 83.8%Total Production (koz Au) 1,118 1,384 1,446
1. Autoclave production suspended during TCM construction. Production restarted in Q4 2014 2. Stats above reflect all ore processed at Goldstrike including Arturo, Cortez and Goldstrike
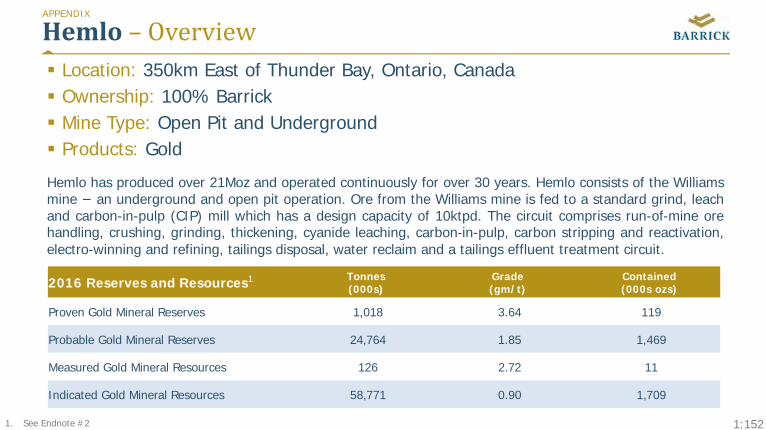
1:152
Hemlo– Overview Location: 350km East of Thunder Bay, Ontario, Canada Ownership: 100% Barrick Mine Type: Open Pit and Underground Products: Gold
Hemlo has produced over 21Moz and operated continuously for over 30 years. Hemlo consists of the Williamsmine − an underground and open pit operation. Ore from the Williams mine is fed to a standard grind, leachand carbon-in-pulp (CIP) mill which has a design capacity of 10ktpd. The circuit comprises run-of-mine orehandling, crushing, grinding, thickening, cyanide leaching, carbon‐in-pulp, carbon stripping and reactivation,electro-winning and refining, tailings disposal, water reclaim and a tailings effluent treatment circuit.
APPENDIX
2016 Reserves and Resources1 Tonnes(000s)
Grade(gm/t)
Contained(000s ozs)
Proven Gold Mineral Reserves 1,018 3.64 119
Probable Gold Mineral Reserves 24,764 1.85 1,469
Measured Gold Mineral Resources 126 2.72 11
Indicated Gold Mineral Resources 58,771 0.90 1,709
1. See Endnote #2

1:153
Hemlo– 2016Review&2017TargetsAPPENDIX
In 2016 gold production was 235koz,7.3% higher than the prior year. The increasewas primarily due to higher grades from theunderground. Cost of Sales of $795 per ouncewere $92/oz lower than the prior year. All-insustaining costs1 of $839 per ounce for 2016decreased by $56 per ounce compared to theprior year primarily due to the impact of highersales volume on unit production costscombined with a decrease in mine-sitesustaining capital expenditures.
For 20172 we expect gold production to bein the range of 205-220koz, which is slightlybelow 2016 production levels. This is primarilydue to a lower forecasted grade in theunderground then what was in 2016 and a onemonth shutdown to replace a SAG mill shell.Cost of Sales is anticipated to be in the rangeof $800-$860 per ounce which is slightly higherthan 2016 costs due to the less ounces minedfrom underground. All-in sustaining costs1
are forecast at $880-$890 per ounce, which ishigher than 2016 primarily due to sustainingcapital expenditures for tailings expansions,water management projects, SAG Mill shellreplacement, and timing of equipmentreplacements.
1. This is a non-GAAP financial performance measure with no standardized meaning under IFRS. For further information please see note 3 of Appendix E 2. See Endnote #1
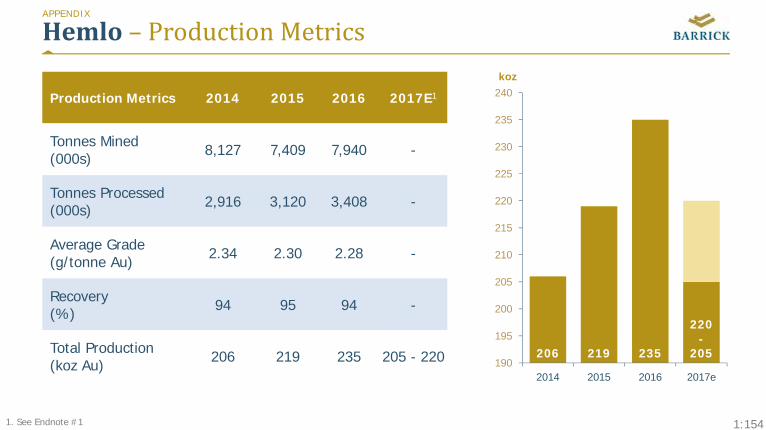
1:154
Hemlo– ProductionMetrics
Production Metrics 2014 2015 2016 2017E1
Tonnes Mined (000s) 8,127 7,409 7,940 -
Tonnes Processed (000s) 2,916 3,120 3,408 -
Average Grade (g/tonne Au) 2.34 2.30 2.28 -
Recovery (%) 94 95 94 -
Total Production (koz Au) 206 219 235 205 - 220
APPENDIX
206 219 235
220-
205190
195
200
205
210
215
220
225
230
235
240
2014 2015 2016 2017e
koz
1. See Endnote #1
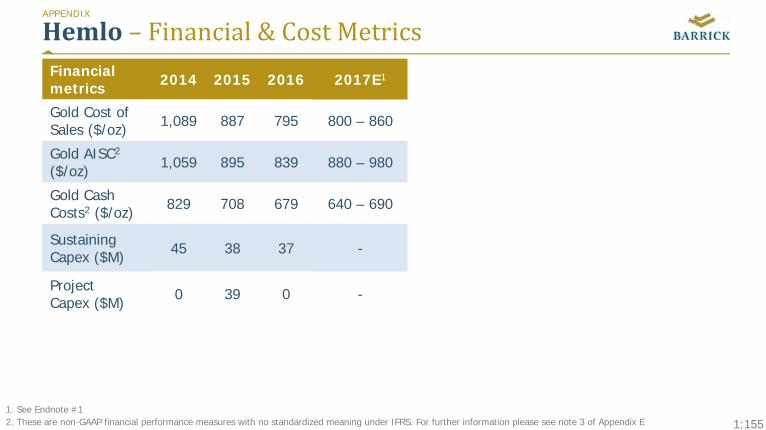
1:155
Hemlo– Financial&CostMetricsAPPENDIX
Financial metrics 2014 2015 2016 2017E1
Gold Cost of Sales ($/oz) 1,089 887 795 800 – 860
Gold AISC2
($/oz) 1,059 895 839 880 – 980
Gold CashCosts2 ($/oz) 829 708 679 640 – 690
Sustaining Capex ($M) 45 38 37 -
ProjectCapex ($M) 0 39 0 -
1. See Endnote #1 2. These are non-GAAP financial performance measures with no standardized meaning under IFRS. For further information please see note 3 of Appendix E
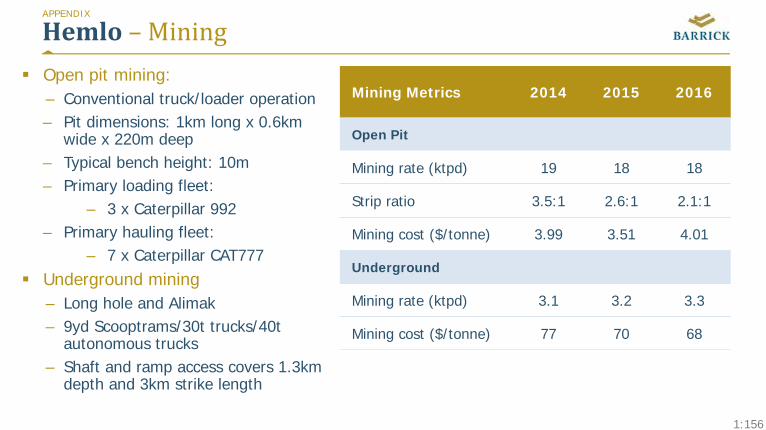
1:156
Hemlo– Mining Open pit mining:
– Conventional truck/loader operation– Pit dimensions: 1km long x 0.6km
wide x 220m deep – Typical bench height: 10m– Primary loading fleet:
– 3 x Caterpillar 992– Primary hauling fleet:
– 7 x Caterpillar CAT777 Underground mining
– Long hole and Alimak– 9yd Scooptrams/30t trucks/40t
autonomous trucks– Shaft and ramp access covers 1.3km
depth and 3km strike length
Mining Metrics 2014 2015 2016
Open Pit
Mining rate (ktpd) 19 18 18
Strip ratio 3.5:1 2.6:1 2.1:1
Mining cost ($/tonne) 3.99 3.51 4.01
Underground
Mining rate (ktpd) 3.1 3.2 3.3
Mining cost ($/tonne) 77 70 68
APPENDIX
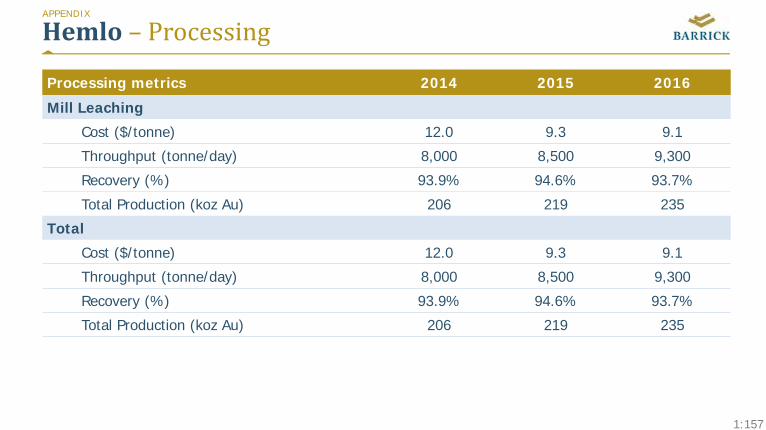
1:157
Hemlo– ProcessingAPPENDIX
Processing metrics 2014 2015 2016
Mill Leaching
Cost ($/tonne) 12.0 9.3 9.1
Throughput (tonne/day) 8,000 8,500 9,300
Recovery (%) 93.9% 94.6% 93.7%
Total Production (koz Au) 206 219 235
Total
Cost ($/tonne) 12.0 9.3 9.1
Throughput (tonne/day) 8,000 8,500 9,300
Recovery (%) 93.9% 94.6% 93.7%
Total Production (koz Au) 206 219 235
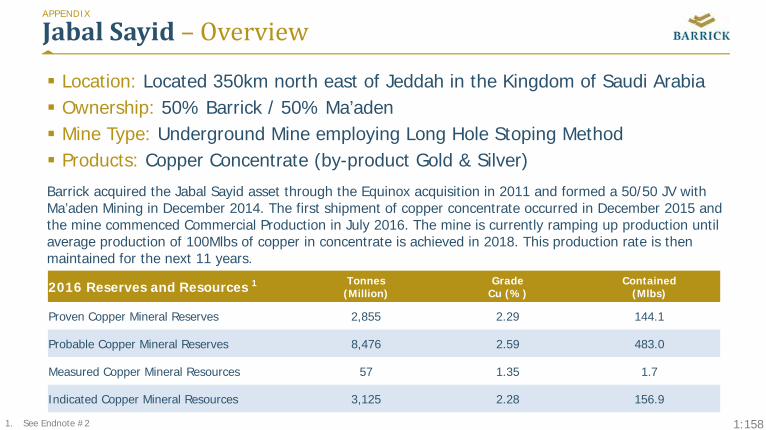
1:158
JabalSayid– Overview
Location: Located 350km north east of Jeddah in the Kingdom of Saudi Arabia Ownership: 50% Barrick / 50% Ma’aden Mine Type: Underground Mine employing Long Hole Stoping Method Products: Copper Concentrate (by-product Gold & Silver)
Barrick acquired the Jabal Sayid asset through the Equinox acquisition in 2011 and formed a 50/50 JV with Ma’aden Mining in December 2014. The first shipment of copper concentrate occurred in December 2015 and the mine commenced Commercial Production in July 2016. The mine is currently ramping up production until average production of 100Mlbs of copper in concentrate is achieved in 2018. This production rate is then maintained for the next 11 years.
APPENDIX
2016 Reserves and Resources 1 Tonnes(Million)
GradeCu (%)
Contained(Mlbs)
Proven Copper Mineral Reserves 2,855 2.29 144.1
Probable Copper Mineral Reserves 8,476 2.59 483.0
Measured Copper Mineral Resources 57 1.35 1.7
Indicated Copper Mineral Resources 3,125 2.28 156.9
1. See Endnote #2
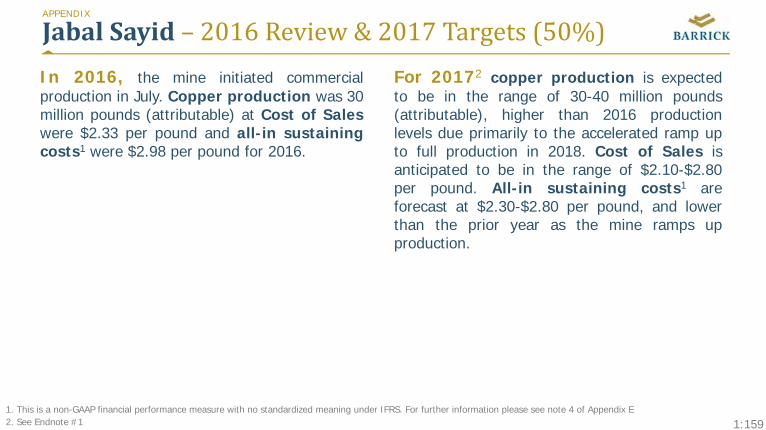
1:159
JabalSayid– 2016Review&2017Targets(50%)APPENDIX
In 2016, the mine initiated commercialproduction in July. Copper production was 30million pounds (attributable) at Cost of Saleswere $2.33 per pound and all-in sustainingcosts1 were $2.98 per pound for 2016.
For 20172 copper production is expectedto be in the range of 30-40 million pounds(attributable), higher than 2016 productionlevels due primarily to the accelerated ramp upto full production in 2018. Cost of Sales isanticipated to be in the range of $2.10-$2.80per pound. All-in sustaining costs1 areforecast at $2.30-$2.80 per pound, and lowerthan the prior year as the mine ramps upproduction.
1. This is a non-GAAP financial performance measure with no standardized meaning under IFRS. For further information please see note 4 of Appendix E 2. See Endnote #1
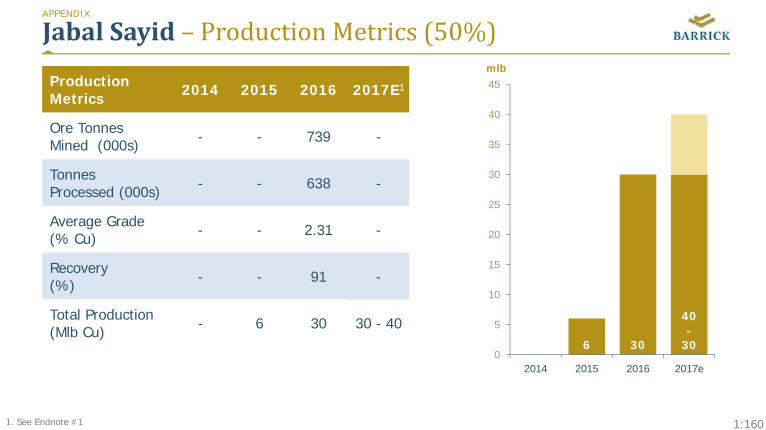
1:160
JabalSayid– ProductionMetrics(50%)
ProductionMetrics 2014 2015 2016 2017E1
Ore TonnesMined (000s) - - 739 -
TonnesProcessed (000s) - - 638 -
Average Grade (% Cu) - - 2.31 -
Recovery (%) - - 91 -
Total Production (Mlb Cu) - 6 30 30 - 40
APPENDIX
0 6 30
40-
300
5
10
15
20
25
30
35
40
45
2014 2015 2016 2017e
mlb
1. See Endnote #1
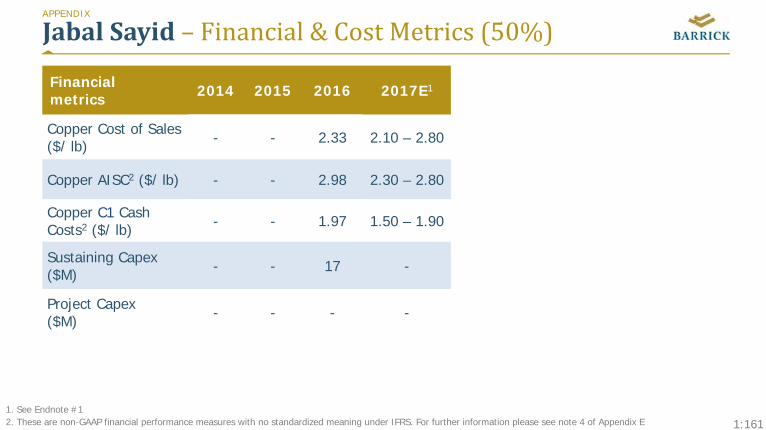
1:161
Financial metrics 2014 2015 2016 2017E1
Copper Cost of Sales ($/ lb) - - 2.33 2.10 – 2.80
Copper AISC2 ($/ lb) - - 2.98 2.30 – 2.80
Copper C1 Cash Costs2 ($/ lb) - - 1.97 1.50 – 1.90
Sustaining Capex ($M) - - 17 -
Project Capex($M) - - - -
JabalSayid– Financial&CostMetrics(50%)APPENDIX
1. See Endnote #1 2. These are non-GAAP financial performance measures with no standardized meaning under IFRS. For further information please see note 4 of Appendix E
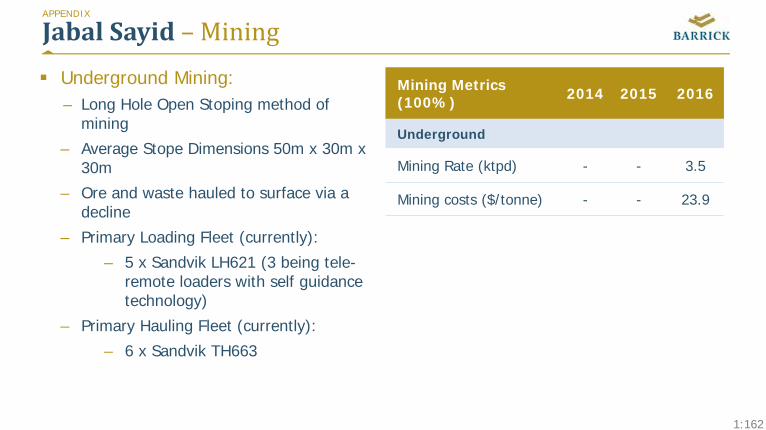
1:162
JabalSayid– Mining Underground Mining:
– Long Hole Open Stoping method of mining
– Average Stope Dimensions 50m x 30m x 30m
– Ore and waste hauled to surface via a decline
– Primary Loading Fleet (currently):
– 5 x Sandvik LH621 (3 being tele-remote loaders with self guidance technology)
– Primary Hauling Fleet (currently):
– 6 x Sandvik TH663
Mining Metrics (100%) 2014 2015 2016
Underground
Mining Rate (ktpd) - - 3.5
Mining costs ($/tonne) - - 23.9
APPENDIX
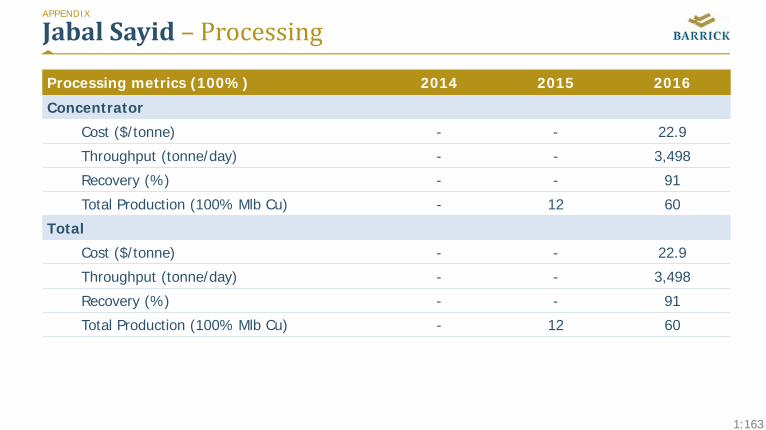
1:163
JabalSayid– ProcessingAPPENDIX
Processing metrics (100%) 2014 2015 2016
Concentrator
Cost ($/tonne) - - 22.9
Throughput (tonne/day) - - 3,498
Recovery (%) - - 91
Total Production (100% Mlb Cu) - 12 60
Total
Cost ($/tonne) - - 22.9
Throughput (tonne/day) - - 3,498
Recovery (%) - - 91
Total Production (100% Mlb Cu) - 12 60
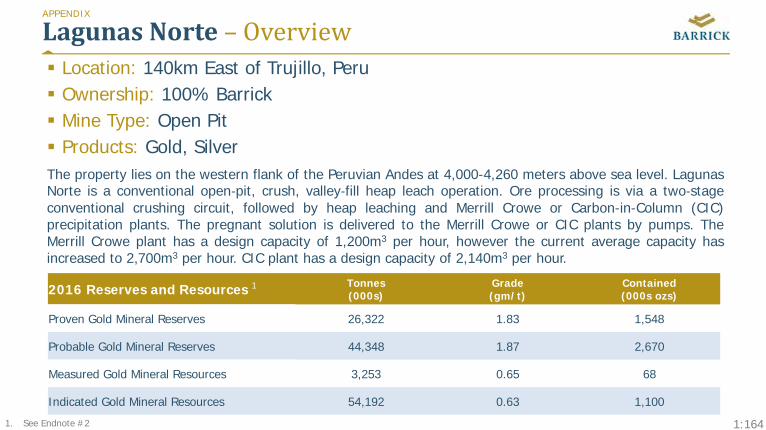
1:164
LagunasNorte– Overview Location: 140km East of Trujillo, Peru Ownership: 100% Barrick Mine Type: Open Pit Products: Gold, SilverThe property lies on the western flank of the Peruvian Andes at 4,000-4,260 meters above sea level. LagunasNorte is a conventional open‐pit, crush, valley‐fill heap leach operation. Ore processing is via a two‐stageconventional crushing circuit, followed by heap leaching and Merrill Crowe or Carbon-in-Column (CIC)precipitation plants. The pregnant solution is delivered to the Merrill Crowe or CIC plants by pumps. TheMerrill Crowe plant has a design capacity of 1,200m3 per hour, however the current average capacity hasincreased to 2,700m3 per hour. CIC plant has a design capacity of 2,140m3 per hour.
APPENDIX
2016 Reserves and Resources 1 Tonnes(000s)
Grade(gm/t)
Contained(000s ozs)
Proven Gold Mineral Reserves 26,322 1.83 1,548
Probable Gold Mineral Reserves 44,348 1.87 2,670
Measured Gold Mineral Resources 3,253 0.65 68
Indicated Gold Mineral Resources 54,192 0.63 1,100
1. See Endnote #2
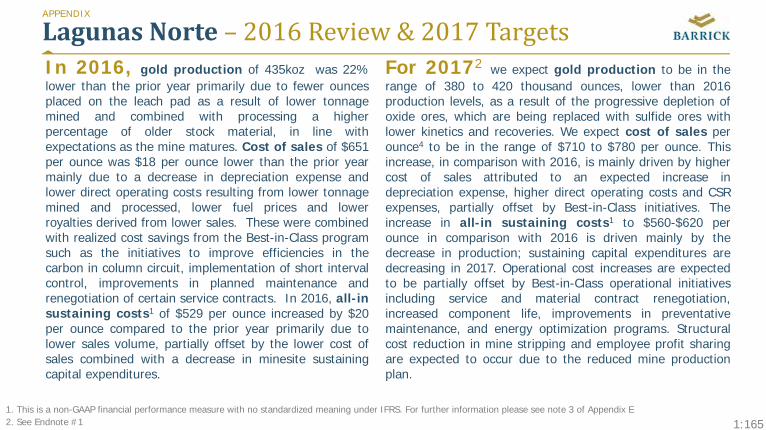
1:165
LagunasNorte– 2016Review&2017TargetsAPPENDIX
In 2016, gold production of 435koz was 22%lower than the prior year primarily due to fewer ouncesplaced on the leach pad as a result of lower tonnagemined and combined with processing a higherpercentage of older stock material, in line withexpectations as the mine matures. Cost of sales of $651per ounce was $18 per ounce lower than the prior yearmainly due to a decrease in depreciation expense andlower direct operating costs resulting from lower tonnagemined and processed, lower fuel prices and lowerroyalties derived from lower sales. These were combinedwith realized cost savings from the Best-in-Class programsuch as the initiatives to improve efficiencies in thecarbon in column circuit, implementation of short intervalcontrol, improvements in planned maintenance andrenegotiation of certain service contracts. In 2016, all-insustaining costs1 of $529 per ounce increased by $20per ounce compared to the prior year primarily due tolower sales volume, partially offset by the lower cost ofsales combined with a decrease in minesite sustainingcapital expenditures.
For 20172 we expect gold production to be in therange of 380 to 420 thousand ounces, lower than 2016production levels, as a result of the progressive depletion ofoxide ores, which are being replaced with sulfide ores withlower kinetics and recoveries. We expect cost of sales perounce4 to be in the range of $710 to $780 per ounce. Thisincrease, in comparison with 2016, is mainly driven by highercost of sales attributed to an expected increase indepreciation expense, higher direct operating costs and CSRexpenses, partially offset by Best-in-Class initiatives. Theincrease in all-in sustaining costs1 to $560-$620 perounce in comparison with 2016 is driven mainly by thedecrease in production; sustaining capital expenditures aredecreasing in 2017. Operational cost increases are expectedto be partially offset by Best-in-Class operational initiativesincluding service and material contract renegotiation,increased component life, improvements in preventativemaintenance, and energy optimization programs. Structuralcost reduction in mine stripping and employee profit sharingare expected to occur due to the reduced mine productionplan.
1. This is a non-GAAP financial performance measure with no standardized meaning under IFRS. For further information please see note 3 of Appendix E 2. See Endnote #1
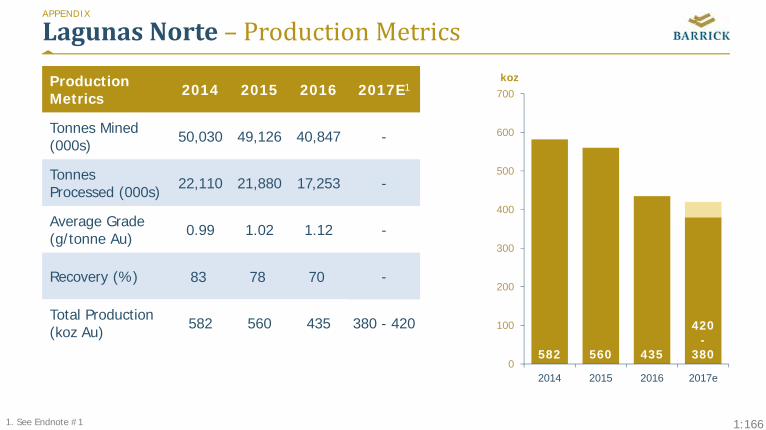
1:166
LagunasNorte– ProductionMetrics
ProductionMetrics 2014 2015 2016 2017E1
Tonnes Mined (000s) 50,030 49,126 40,847 -
TonnesProcessed (000s) 22,110 21,880 17,253 -
Average Grade (g/tonne Au) 0.99 1.02 1.12 -
Recovery (%) 83 78 70 -
Total Production (koz Au) 582 560 435 380 - 420
APPENDIX
582 560 435
420-
3800
100
200
300
400
500
600
700
2014 2015 2016 2017e
koz
1. See Endnote #1
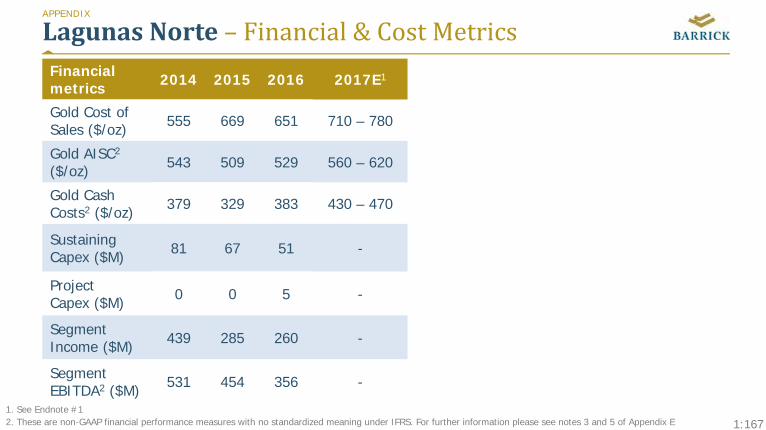
1:167
LagunasNorte– Financial&CostMetricsAPPENDIX
Financial metrics 2014 2015 2016 2017E1
Gold Cost of Sales ($/oz) 555 669 651 710 – 780
Gold AISC2
($/oz) 543 509 529 560 – 620
Gold CashCosts2 ($/oz) 379 329 383 430 – 470
Sustaining Capex ($M) 81 67 51 -
ProjectCapex ($M) 0 0 5 -
SegmentIncome ($M) 439 285 260 -
SegmentEBITDA2 ($M) 531 454 356 -
1. See Endnote #1 2. These are non-GAAP financial performance measures with no standardized meaning under IFRS. For further information please see notes 3 and 5 of Appendix E

1:168
LagunasNorte– Mining Open pit mining
– Conventional truck/shovel operation
– Pit Dimensions: 2.5 km long x 1.5 km wide x 170 m deep (no backfill)
– Typical Bench Height: 10m
– Primary Loading Fleet:
– 2 x Komatsu PC4000
– 3 x Komatsu WA1200
– Primary Hauling Fleet:
– 19 x Komatsu 730E
– 4 x Caterpillar 785C
Mining Metrics 2014 2015 2016
Open Pit
Mining rate (ktpd) 137 135 112
Strip Ratio 0.9:1 1.2:1 1.5:1
Mining costs ($/tonne) 2.35 2.22 1.84
APPENDIX
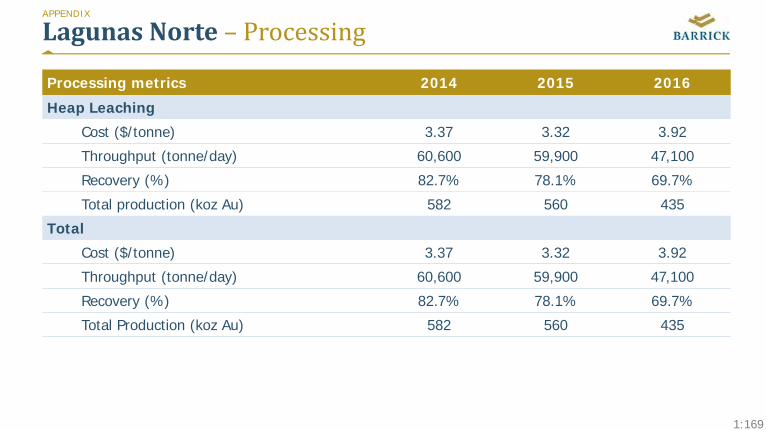
1:169
LagunasNorte– ProcessingAPPENDIX
Processing metrics 2014 2015 2016
Heap Leaching
Cost ($/tonne) 3.37 3.32 3.92
Throughput (tonne/day) 60,600 59,900 47,100
Recovery (%) 82.7% 78.1% 69.7%
Total production (koz Au) 582 560 435
Total
Cost ($/tonne) 3.37 3.32 3.92
Throughput (tonne/day) 60,600 59,900 47,100
Recovery (%) 82.7% 78.1% 69.7%
Total Production (koz Au) 582 560 435
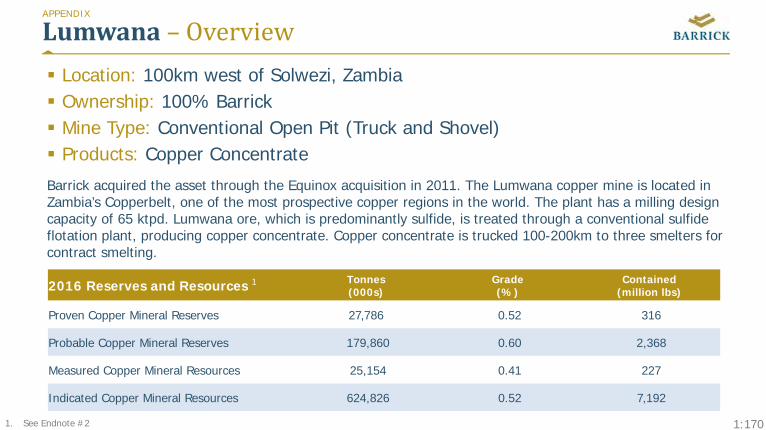
1:170
Lumwana– Overview Location: 100km west of Solwezi, Zambia Ownership: 100% Barrick Mine Type: Conventional Open Pit (Truck and Shovel) Products: Copper Concentrate
Barrick acquired the asset through the Equinox acquisition in 2011. The Lumwana copper mine is located in Zambia’s Copperbelt, one of the most prospective copper regions in the world. The plant has a milling design capacity of 65 ktpd. Lumwana ore, which is predominantly sulfide, is treated through a conventional sulfide flotation plant, producing copper concentrate. Copper concentrate is trucked 100-200km to three smelters for contract smelting.
APPENDIX
2016 Reserves and Resources 1 Tonnes(000s)
Grade(%)
Contained(million lbs)
Proven Copper Mineral Reserves 27,786 0.52 316
Probable Copper Mineral Reserves 179,860 0.60 2,368
Measured Copper Mineral Resources 25,154 0.41 227
Indicated Copper Mineral Resources 624,826 0.52 7,192
1. See Endnote #2
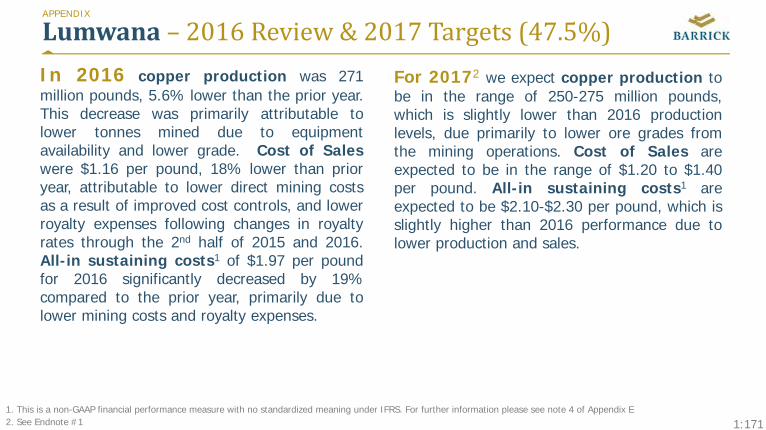
1:171
Lumwana– 2016Review&2017Targets(47.5%)APPENDIX
In 2016 copper production was 271million pounds, 5.6% lower than the prior year.This decrease was primarily attributable tolower tonnes mined due to equipmentavailability and lower grade. Cost of Saleswere $1.16 per pound, 18% lower than prioryear, attributable to lower direct mining costsas a result of improved cost controls, and lowerroyalty expenses following changes in royaltyrates through the 2nd half of 2015 and 2016.All-in sustaining costs1 of $1.97 per poundfor 2016 significantly decreased by 19%compared to the prior year, primarily due tolower mining costs and royalty expenses.
For 20172 we expect copper production tobe in the range of 250-275 million pounds,which is slightly lower than 2016 productionlevels, due primarily to lower ore grades fromthe mining operations. Cost of Sales areexpected to be in the range of $1.20 to $1.40per pound. All-in sustaining costs1 areexpected to be $2.10-$2.30 per pound, which isslightly higher than 2016 performance due tolower production and sales.
1. This is a non-GAAP financial performance measure with no standardized meaning under IFRS. For further information please see note 4 of Appendix E 2. See Endnote #1
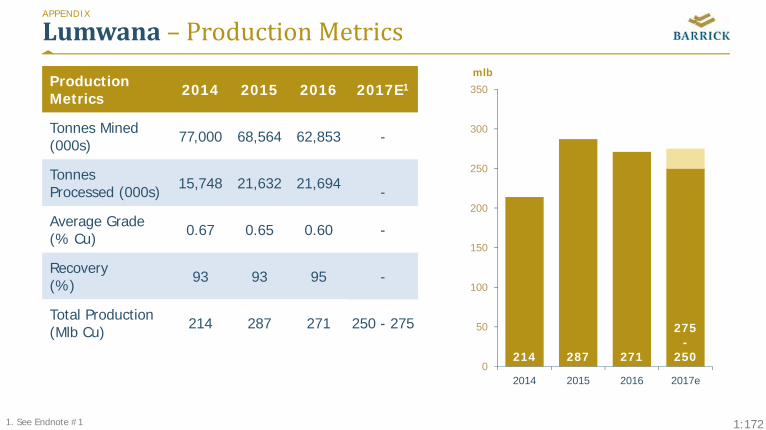
1:172
Lumwana– ProductionMetrics
ProductionMetrics 2014 2015 2016 2017E1
Tonnes Mined (000s) 77,000 68,564 62,853 -
TonnesProcessed (000s) 15,748 21,632 21,694 -
Average Grade (% Cu) 0.67 0.65 0.60 -
Recovery (%) 93 93 95 -
Total Production (Mlb Cu) 214 287 271 250 - 275
APPENDIX
214 287 271
275-
2500
50
100
150
200
250
300
350
2014 2015 2016 2017e
mlb
1. See Endnote #1
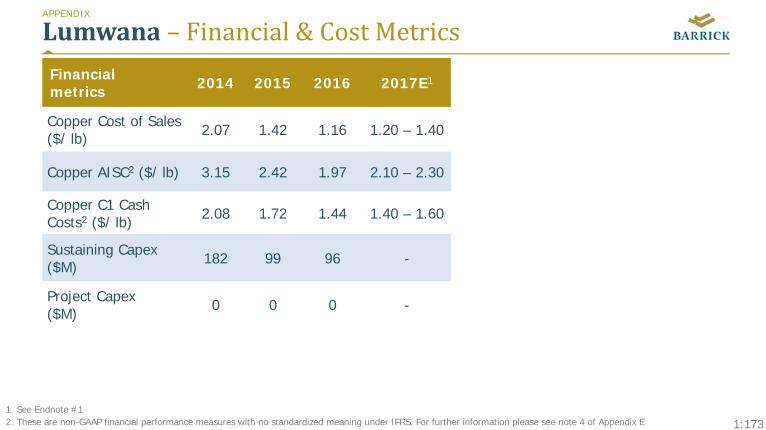
1:173
Lumwana– Financial&CostMetricsAPPENDIX
Financial metrics 2014 2015 2016 2017E1
Copper Cost of Sales ($/ lb) 2.07 1.42 1.16 1.20 – 1.40
Copper AISC2 ($/ lb) 3.15 2.42 1.97 2.10 – 2.30
Copper C1 Cash Costs2 ($/ lb) 2.08 1.72 1.44 1.40 – 1.60
Sustaining Capex ($M) 182 99 96 -
Project Capex($M) 0 0 0 -
1. See Endnote #1 2. These are non-GAAP financial performance measures with no standardized meaning under IFRS. For further information please see note 4 of Appendix E
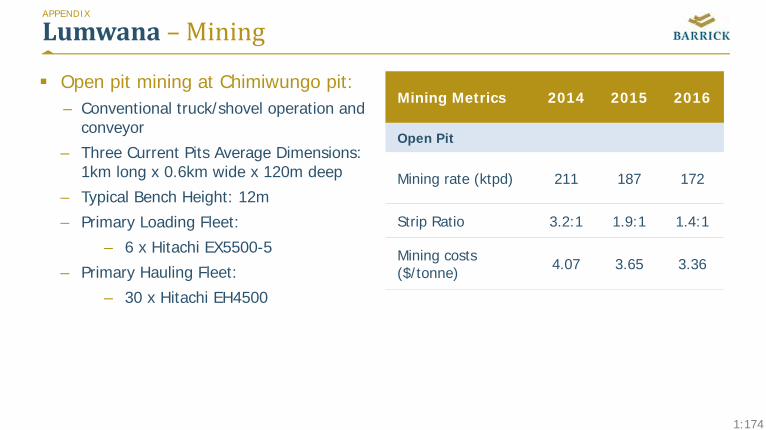
1:174
Lumwana– Mining
Open pit mining at Chimiwungo pit: – Conventional truck/shovel operation and
conveyor
– Three Current Pits Average Dimensions: 1km long x 0.6km wide x 120m deep
– Typical Bench Height: 12m
– Primary Loading Fleet:
– 6 x Hitachi EX5500-5
– Primary Hauling Fleet:
– 30 x Hitachi EH4500
Mining Metrics 2014 2015 2016
Open Pit
Mining rate (ktpd) 211 187 172
Strip Ratio 3.2:1 1.9:1 1.4:1
Mining costs ($/tonne) 4.07 3.65 3.36
APPENDIX

1:175
Lumwana– ProcessingAPPENDIX
Processing metrics 2014 2015 2016
Concentrator
Cost ($/tonne) 3.94 2.79 2.75
Throughput (tonne/day) 43,145 59,266 59,273
Recovery (%) 93.5% 93.3% 94.7%
Total Production (Mlb Cu) 214 287 271
Total
Cost ($/tonne) 3.94 2.79 2.75
Throughput (tonne/day) 43,145 59,266 59,273
Recovery (%) 93.5% 93.3% 94.7%
Total Production (Mlb Cu) 214 287 271
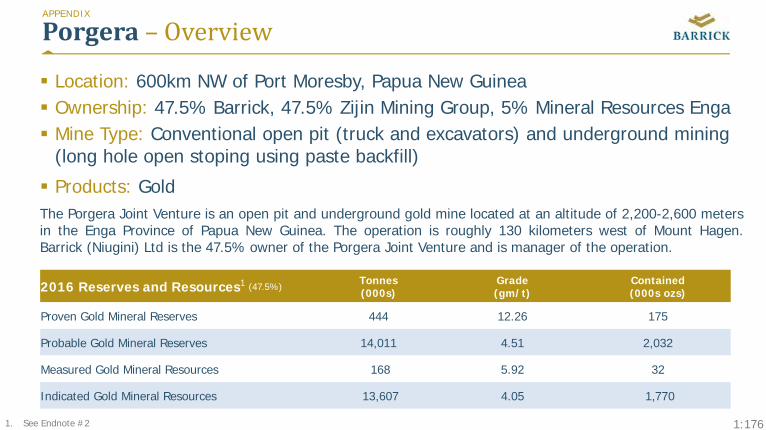
1:176
Porgera– Overview
Location: 600km NW of Port Moresby, Papua New Guinea Ownership: 47.5% Barrick, 47.5% Zijin Mining Group, 5% Mineral Resources Enga Mine Type: Conventional open pit (truck and excavators) and underground mining
(long hole open stoping using paste backfill)
Products: GoldThe Porgera Joint Venture is an open pit and underground gold mine located at an altitude of 2,200-2,600 metersin the Enga Province of Papua New Guinea. The operation is roughly 130 kilometers west of Mount Hagen.Barrick (Niugini) Ltd is the 47.5% owner of the Porgera Joint Venture and is manager of the operation.
APPENDIX
2016 Reserves and Resources1 (47.5%) Tonnes(000s)
Grade(gm/t)
Contained(000s ozs)
Proven Gold Mineral Reserves 444 12.26 175
Probable Gold Mineral Reserves 14,011 4.51 2,032
Measured Gold Mineral Resources 168 5.92 32
Indicated Gold Mineral Resources 13,607 4.05 1,770
1. See Endnote #2
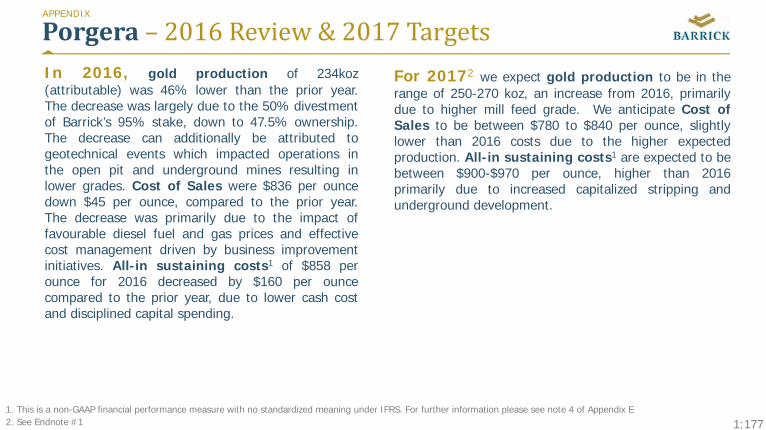
1:177
Porgera– 2016Review&2017TargetsIn 2016, gold production of 234koz(attributable) was 46% lower than the prior year.The decrease was largely due to the 50% divestmentof Barrick’s 95% stake, down to 47.5% ownership.The decrease can additionally be attributed togeotechnical events which impacted operations inthe open pit and underground mines resulting inlower grades. Cost of Sales were $836 per ouncedown $45 per ounce, compared to the prior year.The decrease was primarily due to the impact offavourable diesel fuel and gas prices and effectivecost management driven by business improvementinitiatives. All-in sustaining costs1 of $858 perounce for 2016 decreased by $160 per ouncecompared to the prior year, due to lower cash costand disciplined capital spending.
APPENDIX
For 20172 we expect gold production to be in therange of 250-270 koz, an increase from 2016, primarilydue to higher mill feed grade. We anticipate Cost ofSales to be between $780 to $840 per ounce, slightlylower than 2016 costs due to the higher expectedproduction. All-in sustaining costs1 are expected to bebetween $900-$970 per ounce, higher than 2016primarily due to increased capitalized stripping andunderground development.
1. This is a non-GAAP financial performance measure with no standardized meaning under IFRS. For further information please see note 4 of Appendix E 2. See Endnote #1
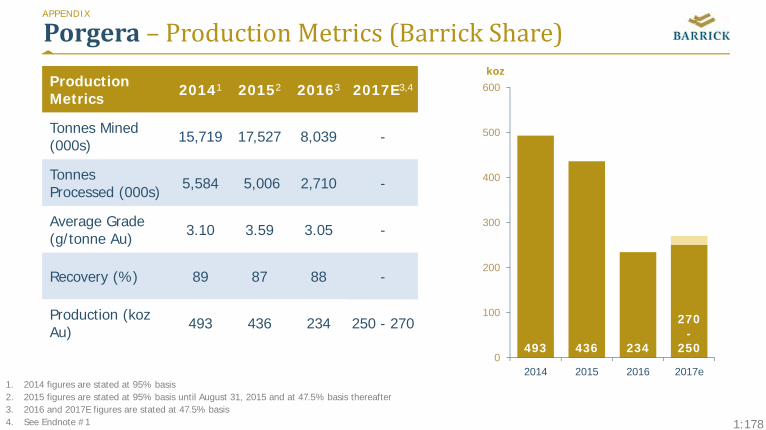
1:178
Porgera– ProductionMetrics(BarrickShare)
ProductionMetrics 20141 20152 20163 2017E3,4
Tonnes Mined (000s) 15,719 17,527 8,039 -
TonnesProcessed (000s) 5,584 5,006 2,710 -
Average Grade (g/tonne Au) 3.10 3.59 3.05 -
Recovery (%) 89 87 88 -
Production (kozAu) 493 436 234 250 - 270
APPENDIX
493 436 234
270-
2500
100
200
300
400
500
600
2014 2015 2016 2017e
koz
1. 2014 figures are stated at 95% basis 2. 2015 figures are stated at 95% basis until August 31, 2015 and at 47.5% basis thereafter3. 2016 and 2017E figures are stated at 47.5% basis4. See Endnote #1

1:179
Porgera– Financial&CostMetrics(BarrickShare)APPENDIX
Financial metrics 20141 20152 20163 2017E3,4
Gold Cost of Sales ($/oz) 1,000 881 836 780 – 840
Gold AISC5
($/oz) 996 1,018 858 900 – 970
Gold CashCosts5 ($/oz) 915 791 689 650 – 700
SustainingCapex ($M) 33 93 43 -
ProjectCapex ($M) 0 0 0 -
1. 2014 figures are stated at 95% basis 2. 2015 figures are stated at 95% basis until August 31, 2015 and at 47.5% basis thereafter3. 2016 and 2017E figures are stated at 47.5% basis4. See Endnote #15. These are non-GAAP financial performance measures with no standardized meaning under IFRS. For further information please see note 3 of Appendix E
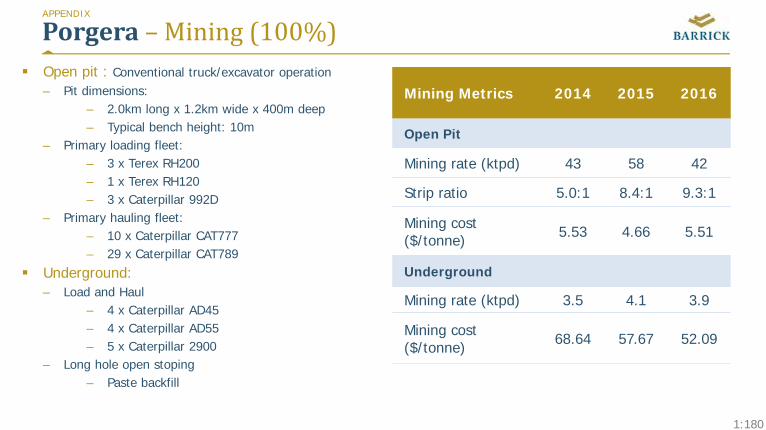
1:180
Porgera – Mining(100%) Open pit : Conventional truck/excavator operation
– Pit dimensions: – 2.0km long x 1.2km wide x 400m deep – Typical bench height: 10m
– Primary loading fleet:– 3 x Terex RH200– 1 x Terex RH120– 3 x Caterpillar 992D
– Primary hauling fleet:– 10 x Caterpillar CAT777– 29 x Caterpillar CAT789
Underground:– Load and Haul
– 4 x Caterpillar AD45– 4 x Caterpillar AD55– 5 x Caterpillar 2900
– Long hole open stoping– Paste backfill
Mining Metrics 2014 2015 2016
Open Pit
Mining rate (ktpd) 43 58 42
Strip ratio 5.0:1 8.4:1 9.3:1
Mining cost ($/tonne) 5.53 4.66 5.51
Underground
Mining rate (ktpd) 3.5 4.1 3.9
Mining cost ($/tonne) 68.64 57.67 52.09
APPENDIX

1:181
Porgera – Processing(100%)APPENDIX
Processing metrics 2014 2015 2016
Mill Processing
Cost ($/tonne) 27.6 22.1 19.3
Throughput (tonne/day) 16,100 15,200 15,600
Recovery (%) 88.5% 86.7% 88.2%
Total Production (koz Au) 519 554 494
Total
Cost ($/tonne) 27.6 22.1 19.3
Throughput (tonne/day) 16,100 15,200 15,600
Recovery (%) 88.5% 86.7% 88.2%
Total Production (koz Au) 519 554 494
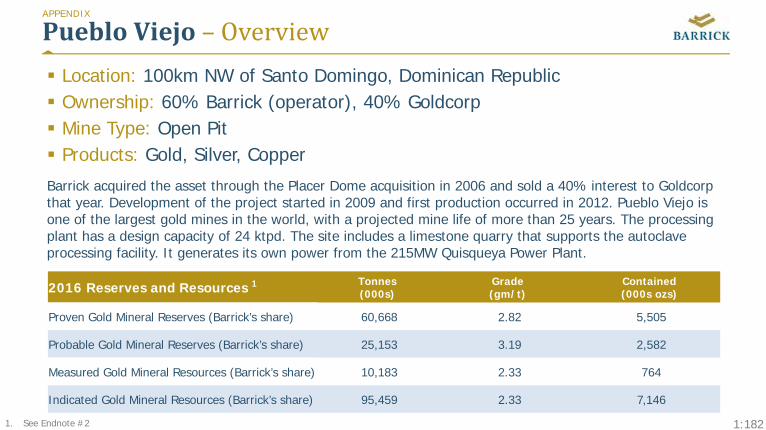
1:182
PuebloViejo– Overview Location: 100km NW of Santo Domingo, Dominican Republic Ownership: 60% Barrick (operator), 40% Goldcorp Mine Type: Open Pit Products: Gold, Silver, Copper
Barrick acquired the asset through the Placer Dome acquisition in 2006 and sold a 40% interest to Goldcorp that year. Development of the project started in 2009 and first production occurred in 2012. Pueblo Viejo is one of the largest gold mines in the world, with a projected mine life of more than 25 years. The processing plant has a design capacity of 24 ktpd. The site includes a limestone quarry that supports the autoclave processing facility. It generates its own power from the 215MW Quisqueya Power Plant.
APPENDIX
2016 Reserves and Resources 1 Tonnes(000s)
Grade(gm/t)
Contained(000s ozs)
Proven Gold Mineral Reserves (Barrick’s share) 60,668 2.82 5,505
Probable Gold Mineral Reserves (Barrick’s share) 25,153 3.19 2,582
Measured Gold Mineral Resources (Barrick’s share) 10,183 2.33 764
Indicated Gold Mineral Resources (Barrick’s share) 95,459 2.33 7,146
1. See Endnote #2
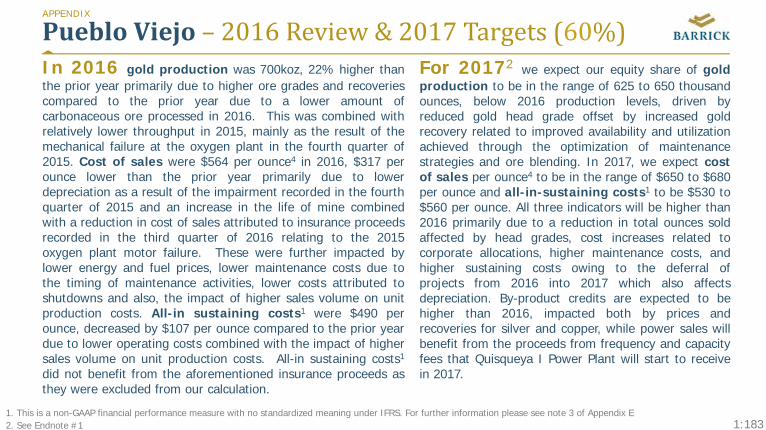
1:183
PuebloViejo– 2016Review&2017Targets(60%)APPENDIX
In 2016 gold production was 700koz, 22% higher thanthe prior year primarily due to higher ore grades and recoveriescompared to the prior year due to a lower amount ofcarbonaceous ore processed in 2016. This was combined withrelatively lower throughput in 2015, mainly as the result of themechanical failure at the oxygen plant in the fourth quarter of2015. Cost of sales were $564 per ounce4 in 2016, $317 perounce lower than the prior year primarily due to lowerdepreciation as a result of the impairment recorded in the fourthquarter of 2015 and an increase in the life of mine combinedwith a reduction in cost of sales attributed to insurance proceedsrecorded in the third quarter of 2016 relating to the 2015oxygen plant motor failure. These were further impacted bylower energy and fuel prices, lower maintenance costs due tothe timing of maintenance activities, lower costs attributed toshutdowns and also, the impact of higher sales volume on unitproduction costs. All-in sustaining costs1 were $490 perounce, decreased by $107 per ounce compared to the prior yeardue to lower operating costs combined with the impact of highersales volume on unit production costs. All-in sustaining costs1
did not benefit from the aforementioned insurance proceeds asthey were excluded from our calculation.
For 20172 we expect our equity share of goldproduction to be in the range of 625 to 650 thousandounces, below 2016 production levels, driven byreduced gold head grade offset by increased goldrecovery related to improved availability and utilizationachieved through the optimization of maintenancestrategies and ore blending. In 2017, we expect costof sales per ounce4 to be in the range of $650 to $680per ounce and all-in-sustaining costs1 to be $530 to$560 per ounce. All three indicators will be higher than2016 primarily due to a reduction in total ounces soldaffected by head grades, cost increases related tocorporate allocations, higher maintenance costs, andhigher sustaining costs owing to the deferral ofprojects from 2016 into 2017 which also affectsdepreciation. By-product credits are expected to behigher than 2016, impacted both by prices andrecoveries for silver and copper, while power sales willbenefit from the proceeds from frequency and capacityfees that Quisqueya I Power Plant will start to receivein 2017.
1. This is a non-GAAP financial performance measure with no standardized meaning under IFRS. For further information please see note 3 of Appendix E 2. See Endnote #1
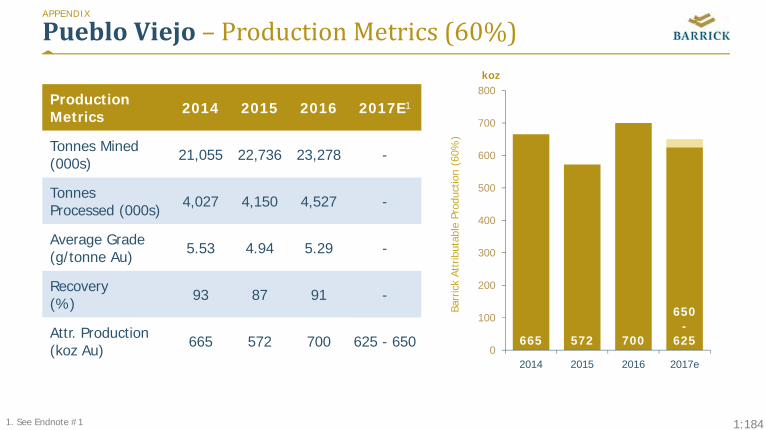
1:184
PuebloViejo– ProductionMetrics(60%)
ProductionMetrics 2014 2015 2016 2017E1
Tonnes Mined (000s) 21,055 22,736 23,278 -
TonnesProcessed (000s) 4,027 4,150 4,527 -
Average Grade (g/tonne Au) 5.53 4.94 5.29 -
Recovery (%) 93 87 91 -
Attr. Production (koz Au) 665 572 700 625 - 650
APPENDIX
Barr
ick
Attr
ibut
able
Pro
duct
ion
(60%
)
1. See Endnote #1
665 572 700
650-
6250
100
200
300
400
500
600
700
800
2014 2015 2016 2017e
koz
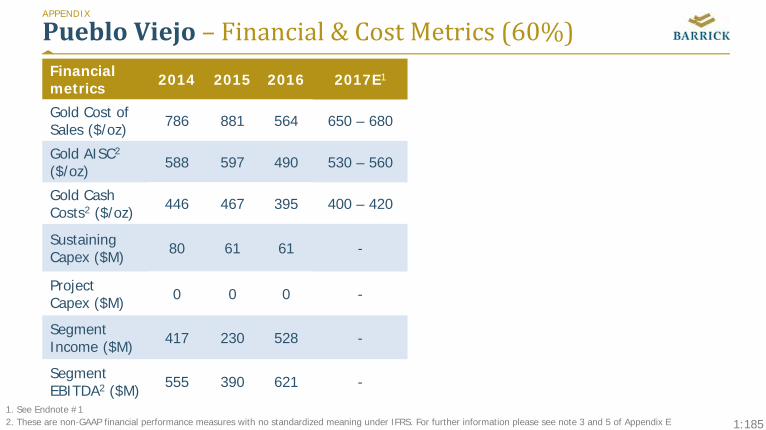
1:185
PuebloViejo– Financial&CostMetrics(60%)APPENDIX
Financial metrics 2014 2015 2016 2017E1
Gold Cost of Sales ($/oz) 786 881 564 650 – 680
Gold AISC2
($/oz) 588 597 490 530 – 560
Gold CashCosts2 ($/oz) 446 467 395 400 – 420
Sustaining Capex ($M) 80 61 61 -
ProjectCapex ($M) 0 0 0 -
SegmentIncome ($M) 417 230 528 -
SegmentEBITDA2 ($M) 555 390 621 -
1. See Endnote #1 2. These are non-GAAP financial performance measures with no standardized meaning under IFRS. For further information please see note 3 and 5 of Appendix E
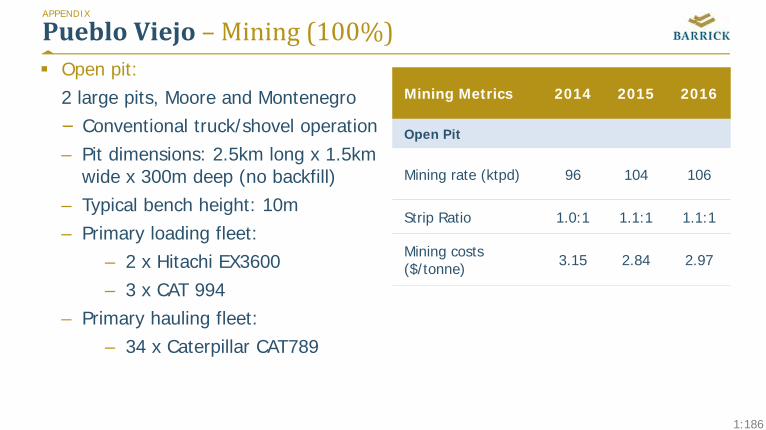
1:186
PuebloViejo– Mining(100%) Open pit:
2 large pits, Moore and Montenegro − Conventional truck/shovel operation– Pit dimensions: 2.5km long x 1.5km
wide x 300m deep (no backfill)– Typical bench height: 10m– Primary loading fleet:
– 2 x Hitachi EX3600– 3 x CAT 994
– Primary hauling fleet:– 34 x Caterpillar CAT789
Mining Metrics 2014 2015 2016
Open Pit
Mining rate (ktpd) 96 104 106
Strip Ratio 1.0:1 1.1:1 1.1:1
Mining costs ($/tonne) 3.15 2.84 2.97
APPENDIX

1:187
PuebloViejo– Processing(100%)APPENDIX
Processing metrics at 100% 2014 2015 2016
Autoclave
Cost ($/tonne) 58.0 50.4 42.3
Throughput (tonnes/day) 18,400 19,000 20,600
Recovery (%) 92.9% 86.8% 91.0%
Total production (koz Au) 1,109 954 1,167
Total
Cost ($/tonne) 58.0 50.4 42.3
Throughput (tonnes/day) 18,400 19,000 20,600
Recovery (%) 92.9% 86.8% 91.0%
Total production (koz Au) 1,109 954 1,167
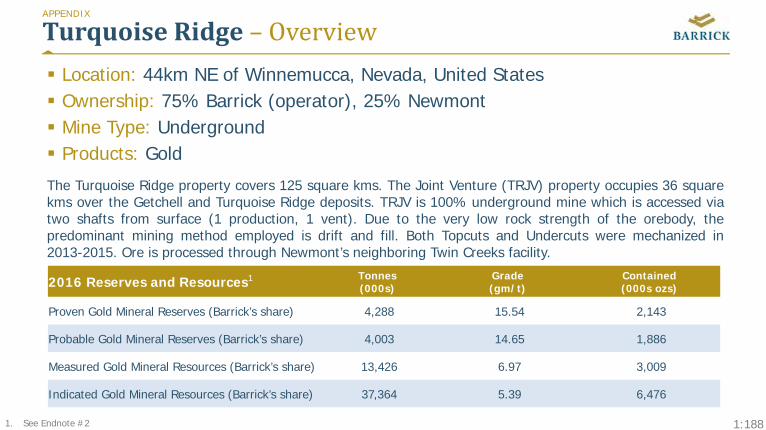
1:188
TurquoiseRidge– Overview Location: 44km NE of Winnemucca, Nevada, United States Ownership: 75% Barrick (operator), 25% Newmont Mine Type: Underground Products: Gold
The Turquoise Ridge property covers 125 square kms. The Joint Venture (TRJV) property occupies 36 squarekms over the Getchell and Turquoise Ridge deposits. TRJV is 100% underground mine which is accessed viatwo shafts from surface (1 production, 1 vent). Due to the very low rock strength of the orebody, thepredominant mining method employed is drift and fill. Both Topcuts and Undercuts were mechanized in2013-2015. Ore is processed through Newmont’s neighboring Twin Creeks facility.
APPENDIX
2016 Reserves and Resources1 Tonnes(000s)
Grade(gm/t)
Contained(000s ozs)
Proven Gold Mineral Reserves (Barrick’s share) 4,288 15.54 2,143
Probable Gold Mineral Reserves (Barrick’s share) 4,003 14.65 1,886
Measured Gold Mineral Resources (Barrick’s share) 13,426 6.97 3,009
Indicated Gold Mineral Resources (Barrick’s share) 37,364 5.39 6,476
1. See Endnote #2
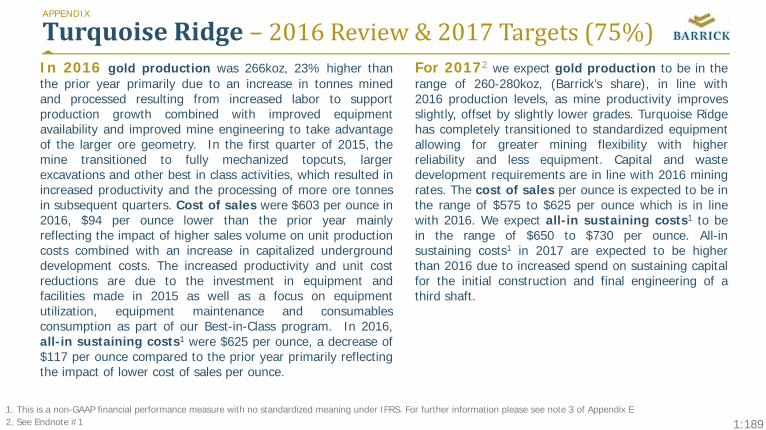
1:189
TurquoiseRidge– 2016Review&2017Targets(75%)APPENDIX
In 2016 gold production was 266koz, 23% higher thanthe prior year primarily due to an increase in tonnes minedand processed resulting from increased labor to supportproduction growth combined with improved equipmentavailability and improved mine engineering to take advantageof the larger ore geometry. In the first quarter of 2015, themine transitioned to fully mechanized topcuts, largerexcavations and other best in class activities, which resulted inincreased productivity and the processing of more ore tonnesin subsequent quarters. Cost of sales were $603 per ounce in2016, $94 per ounce lower than the prior year mainlyreflecting the impact of higher sales volume on unit productioncosts combined with an increase in capitalized undergrounddevelopment costs. The increased productivity and unit costreductions are due to the investment in equipment andfacilities made in 2015 as well as a focus on equipmentutilization, equipment maintenance and consumablesconsumption as part of our Best-in-Class program. In 2016,all-in sustaining costs1 were $625 per ounce, a decrease of$117 per ounce compared to the prior year primarily reflectingthe impact of lower cost of sales per ounce.
For 20172 we expect gold production to be in therange of 260-280koz, (Barrick’s share), in line with2016 production levels, as mine productivity improvesslightly, offset by slightly lower grades. Turquoise Ridgehas completely transitioned to standardized equipmentallowing for greater mining flexibility with higherreliability and less equipment. Capital and wastedevelopment requirements are in line with 2016 miningrates. The cost of sales per ounce is expected to be inthe range of $575 to $625 per ounce which is in linewith 2016. We expect all-in sustaining costs1 to bein the range of $650 to $730 per ounce. All-insustaining costs1 in 2017 are expected to be higherthan 2016 due to increased spend on sustaining capitalfor the initial construction and final engineering of athird shaft.
1. This is a non-GAAP financial performance measure with no standardized meaning under IFRS. For further information please see note 3 of Appendix E 2. See Endnote #1
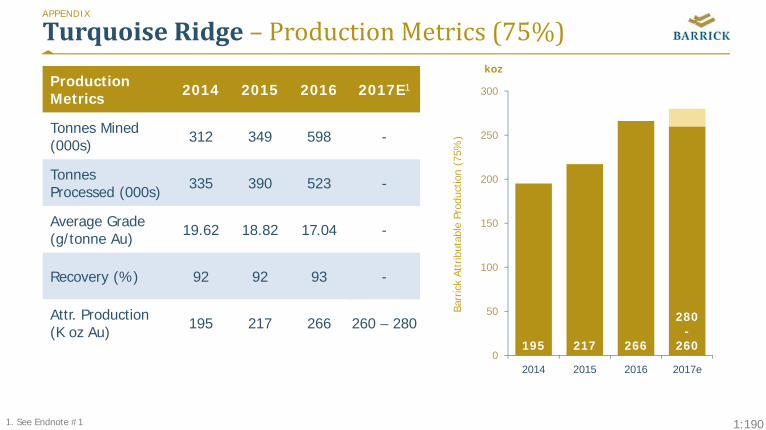
1:190
TurquoiseRidge– ProductionMetrics(75%)
ProductionMetrics 2014 2015 2016 2017E1
Tonnes Mined (000s) 312 349 598 -
TonnesProcessed (000s) 335 390 523 -
Average Grade (g/tonne Au) 19.62 18.82 17.04 -
Recovery (%) 92 92 93 -
Attr. Production (K oz Au) 195 217 266 260 – 280
APPENDIX
Barr
ick
Attr
ibut
able
Pro
duct
ion
(75%
)
195 217 266
280-
2600
50
100
150
200
250
300
2014 2015 2016 2017e
koz
1. See Endnote #1

1:191
TurquoiseRidge– Financial&CostMetrics(75%)APPENDIX
Financial metrics 2014 2015 2016 2017E1
Gold Cost of Sales ($/oz) 559 697 603 575 – 625
Gold AISC2
($/oz) 628 742 625 650 – 730
Gold CashCosts2 ($/oz) 473 581 498 460 – 500
Sustaining Capex ($M) 30 32 32 -
ProjectCapex ($M) 0 0 0 -
SegmentIncome ($M) 139 92 166 -
SegmentEBITDA2 ($M) 156 115 193 -
1. See Endnote #1 2. These are non-GAAP financial performance measures with no standardized meaning under IFRS. For further information please see note 3 and 5 of Appendix E
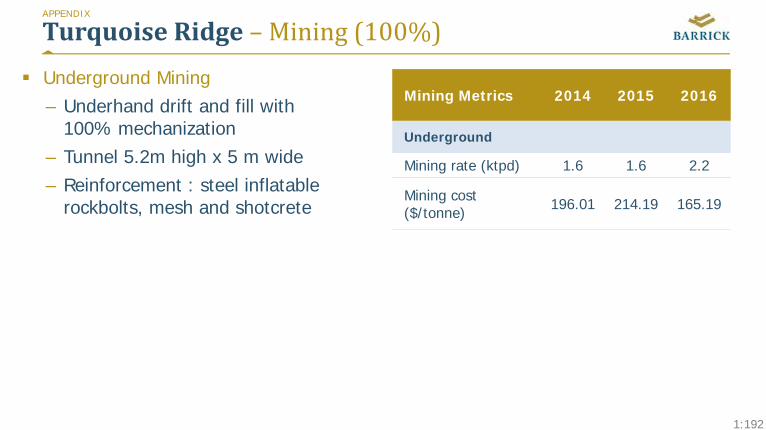
1:192
TurquoiseRidge– Mining(100%) Underground Mining
– Underhand drift and fill with 100% mechanization
– Tunnel 5.2m high x 5 m wide – Reinforcement : steel inflatable
rockbolts, mesh and shotcrete
Mining Metrics 2014 2015 2016
Underground
Mining rate (ktpd) 1.6 1.6 2.2
Mining cost ($/tonne) 196.01 214.19 165.19
APPENDIX
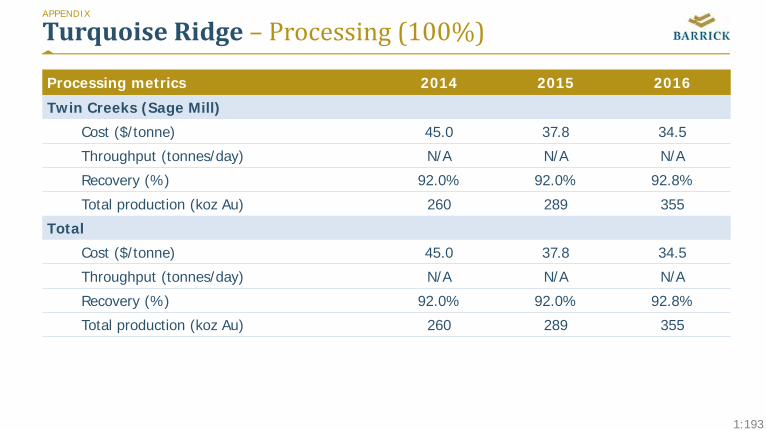
1:193
TurquoiseRidge– Processing(100%)APPENDIX
Processing metrics 2014 2015 2016
Twin Creeks (Sage Mill)
Cost ($/tonne) 45.0 37.8 34.5
Throughput (tonnes/day) N/A N/A N/A
Recovery (%) 92.0% 92.0% 92.8%
Total production (koz Au) 260 289 355
Total
Cost ($/tonne) 45.0 37.8 34.5
Throughput (tonnes/day) N/A N/A N/A
Recovery (%) 92.0% 92.0% 92.8%
Total production (koz Au) 260 289 355
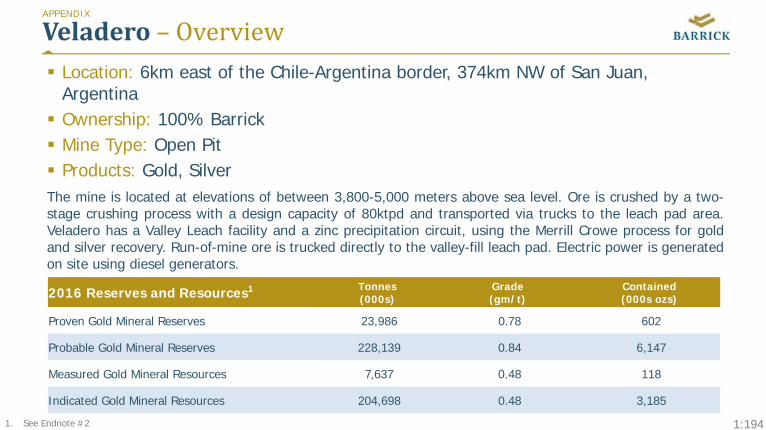
1:194
Veladero– Overview Location: 6km east of the Chile-Argentina border, 374km NW of San Juan,
Argentina Ownership: 100% Barrick Mine Type: Open Pit Products: Gold, SilverThe mine is located at elevations of between 3,800-5,000 meters above sea level. Ore is crushed by a two-stage crushing process with a design capacity of 80ktpd and transported via trucks to the leach pad area.Veladero has a Valley Leach facility and a zinc precipitation circuit, using the Merrill Crowe process for goldand silver recovery. Run-of-mine ore is trucked directly to the valley-fill leach pad. Electric power is generatedon site using diesel generators.
APPENDIX
2016 Reserves and Resources1 Tonnes(000s)
Grade(gm/t)
Contained(000s ozs)
Proven Gold Mineral Reserves 23,986 0.78 602
Probable Gold Mineral Reserves 228,139 0.84 6,147
Measured Gold Mineral Resources 7,637 0.48 118
Indicated Gold Mineral Resources 204,698 0.48 3,185
1. See Endnote #2
1:195
Veladero– 2016Review&2017TargetsAPPENDIX
In 2016 gold production was 544koz, 10% lowercompared to the prior year mainly reflecting lower gradetonnes placed on the leach pad in efforts to managewater balances in the leach pad. This was furtherimpacted by the temporary suspension of operations latein the third quarter of 2016 combined with unexpectedsevere winter weather conditions in the second quarterof 2016. Cost of sales were $872 per ounce in 2016,$80 per ounce higher than the prior year primarily dueto the impact of lower sales volume on unit productioncosts relating to the severe weather conditions andtemporary suspension of operations during 2016combined with lower capitalized stripping costs. In 2016,all-in sustaining costs1 were $769 per ounces,decreased of $177 per ounce compared to the prior yearprimarily due to a decrease in minesite sustaining capitalexpenditures combined with lower operating costs, partlyoffset by the impact of lower sales volume on unitproduction costs.
For 20172 we expect gold production to be in therange of 770-830koz, which is significantly higher than 2016production levels. The increase is mainly a result of a higherhead grade in ore processed due to mine sequence phasesat Federico pit. This is combined with higher ore tonnesmined and processed given the suspension, environmentaland bad weather incidents in 2016 all leading to improvedmining productivity, higher operating hours, and fewer dayslost. Cost of sales per ounce is expected to be decreasingfrom $872 to an expected range of $750 to $800, mainlydue to the impact of higher sales compared to 2016 andhigher mining costs capitalized as stripping. These positivevariances are expected to be partly offset by higher directoperating costs and the impact of higher charges from theproduction inventory movements stemming from theexpected drawdown of leach pad inventories. All-insustaining costs1 are expected to be between $840 and$940 per ounce, higher than 2016 levels mainly due to theincrease in capital expenditures requirements combined withhigher direct operating costs.
1. This is a non-GAAP financial performance measure with no standardized meaning under IFRS. For further information please see note 3 of Appendix E 2. See Endnote #1
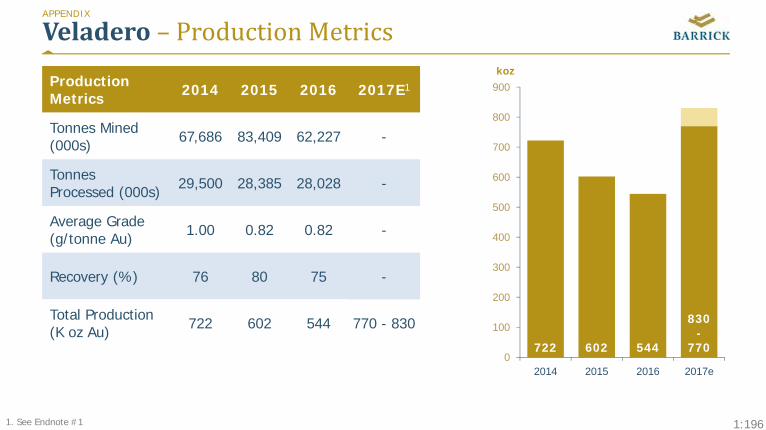
1:196
Veladero– ProductionMetrics
ProductionMetrics 2014 2015 2016 2017E1
Tonnes Mined (000s) 67,686 83,409 62,227 -
TonnesProcessed (000s) 29,500 28,385 28,028 -
Average Grade (g/tonne Au) 1.00 0.82 0.82 -
Recovery (%) 76 80 75 -
Total Production (K oz Au) 722 602 544 770 - 830
APPENDIX
722 602 544
830-
7700
100
200
300
400
500
600
700
800
900
2014 2015 2016 2017e
koz
1. See Endnote #1
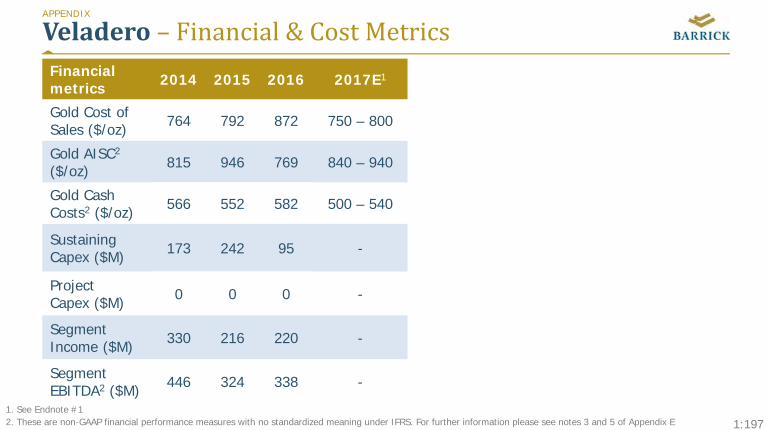
1:197
Veladero– Financial&CostMetricsAPPENDIX
Financial metrics 2014 2015 2016 2017E1
Gold Cost of Sales ($/oz) 764 792 872 750 – 800
Gold AISC2
($/oz) 815 946 769 840 – 940
Gold CashCosts2 ($/oz) 566 552 582 500 – 540
Sustaining Capex ($M) 173 242 95 -
ProjectCapex ($M) 0 0 0 -
SegmentIncome ($M) 330 216 220 -
SegmentEBITDA2 ($M) 446 324 338 -
1. See Endnote #1 2. These are non-GAAP financial performance measures with no standardized meaning under IFRS. For further information please see notes 3 and 5 of Appendix E
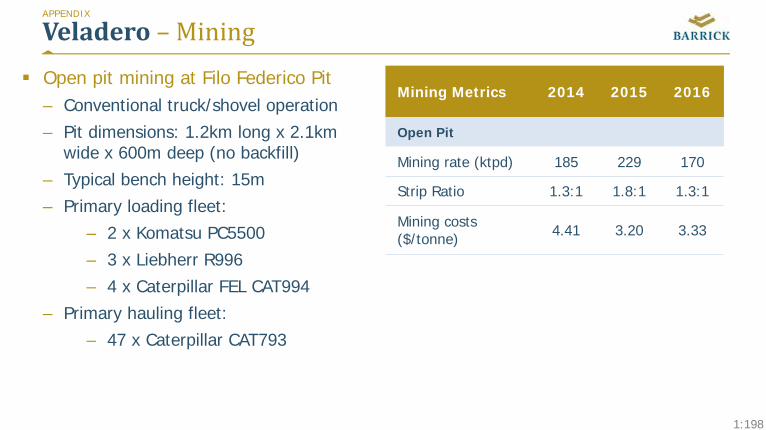
1:198
Veladero– Mining Open pit mining at Filo Federico Pit
– Conventional truck/shovel operation– Pit dimensions: 1.2km long x 2.1km
wide x 600m deep (no backfill)– Typical bench height: 15m– Primary loading fleet:
– 2 x Komatsu PC5500– 3 x Liebherr R996– 4 x Caterpillar FEL CAT994
– Primary hauling fleet:– 47 x Caterpillar CAT793
Mining Metrics 2014 2015 2016
Open Pit
Mining rate (ktpd) 185 229 170
Strip Ratio 1.3:1 1.8:1 1.3:1
Mining costs ($/tonne) 4.41 3.20 3.33
APPENDIX
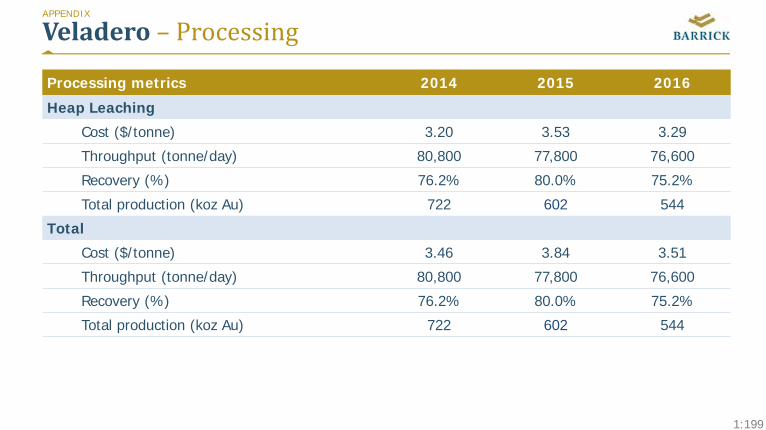
1:199
Veladero– ProcessingAPPENDIX
Processing metrics 2014 2015 2016
Heap Leaching
Cost ($/tonne) 3.20 3.53 3.29
Throughput (tonne/day) 80,800 77,800 76,600
Recovery (%) 76.2% 80.0% 75.2%
Total production (koz Au) 722 602 544
Total
Cost ($/tonne) 3.46 3.84 3.51
Throughput (tonne/day) 80,800 77,800 76,600
Recovery (%) 76.2% 80.0% 75.2%
Total production (koz Au) 722 602 544
200
1. 2017 guidance is based on gold, copper, and oil price assumptions of $1,050/oz, $2.25/lb, and $55/bbl, respectively, a USD:AUD exchange rate of 0.75:1, a CAD:USD exchange rate of 1.32:1, ARS:USDexchange rate of 16.5:1 and a CLP:USD exchange rate of 675:1. For economic sensitivity analysis of these assumptions, please refer to page 13 of Barrick’s Fourth Quarter and Year-End 2016 Report.
2. Estimated in accordance with National Instrument 43-101 as required by Canadian securities regulatory authorities. Estimates are as of December 31, 2016, unless otherwise noted. Total Proven reserves of480.3 million tonnes grading 1.68 g/t, representing 25.9 million ounces of gold, and 173.3 million tonnes grading 0.533%, representing 2.035 billion pounds of copper. Total Probable reserves of 1.5 billiontonnes grading 1.22 g/t, representing 60.1 million ounces of gold, and 276 million tonnes grading 0.638%, representing 3.886 billion pounds of copper. Total Measured resources of 82.9 million tonnesgrading 2.52 g/t, representing 6.7 million ounces of gold, and 83.2 million tonnes grading 0.410%, representing 753.4 million pounds of copper. Total Indicated resources of 1.2 million tonnes grading 1.74g/t, representing 68.5 million ounces of gold, and 650.3 million tonnes grading 0.526%, representing 7.545 billion pounds of copper. Total Inferred resources of 781 million tonnes grading 1.22 g/t,representing 30.7 million ounces of gold, and 114.1 million tonnes grading 0.501%, representing 1.259 billion pounds of copper. For United States reporting purposes, Industry Guide 7 under the Securitiesand Exchange Act of 1934 (as interpreted by Staff of the SEC), applies different standards in order to classify mineralization as a reserve. Accordingly, for U.S. reporting purposes, the approximately 1.9million ounces of proven and probable gold reserves associated with the Cortez Underground Expansion Project (approximately 5.6 million tonnes grading 10.5 g/t) are classified as mineralized material.Complete mineral reserve and mineral resource data for all mines and projects referenced in this presentation, including tonnes, grades, and ounces, can be found on pages 88-93 of Barrick’s Fourth Quarterand Year-End 2016 Report.
3. Estimated in accordance with National Instrument 43-101 as required by Canadian securities regulatory authorities. Estimates are as of December 31, 2015, unless otherwise noted. Complete mineral reserveand mineral resource data for all mines and projects referenced in this presentation, including tonnes, grades and ounces, can be found on pages 25-35 of Barrick’s 2015 Form 40-F/Annual Information Form.
4. Potential quantities and grades in these preliminary results are conceptual in nature and there has been insufficient exploration to define a mineral resource at this time and it is uncertain that furtherexploration will result in the target being delineated as a mineral resource.
5. Total reportable incident frequency rate (TRIFR) is a ratio calculated as follows: number of reportable injuries x 200,000 hours divided by the total number of hours worked. Reportable injuries includefatalities, lost time injuries, restricted duty injuries, and medically treated injuries.
6. For the purpose of all sensitivities, tonnage, grade and ounces attributable to Acacia mines and KCGM were removed from the calculations.
7. 2018 guidance is based on gold, copper, and oil price assumptions of $1,200/oz, $2.50/lb, and $50/bbl, respectively, and a USD:AUD exchange rate of 0.75:1, a CAD:USD exchange rate of 1.30:1, ARS:USDexchange rate of 17.5:1 and a CLP:USD exchange rate of 675:1. 2019 guidance is based on gold, copper, and oil price assumptions of $1,200/oz, $2.75/lb, and $60/bbl, respectively, and a USD:AUDexchange rate of 0.75:1, a CAD:USD exchange rate of 1.25:1, ARS:USD exchange rate of 18.5:1 and a CLP:USD exchange rate of 650:1. For economic sensitivity analysis of these assumptions, please referto page 13 of Barrick’s Fourth Quarter and Year-End 2016 Report.
TechnicalInformation
Endnotes
The following qualified persons, as that term is defined in National Instrument 43-101 – Standards of Disclosure for Mineral Projects, have reviewed and approved the relevant scientific and technical informationcontained in this presentation: Rob Krcmarov, Executive Vice President Exploration and Growth of Barrick, Rick Sims, Registered Member SME, Senior Director, Resources and Reserves of Barrick, PatrickGarretson, Registered Member SME, Senior Director, Life of Mine Planning of Barrick and Steven Haggarty, P. Eng., Senior Director, Metallurgy of Barrick.


