CRFS Technical Meeting LC Operations Update March 30, 2010.
10
CRFS Technical Meeting LC Operations Update March 30, 2010
-
Upload
alisha-hunter -
Category
Documents
-
view
216 -
download
1
Transcript of CRFS Technical Meeting LC Operations Update March 30, 2010.

CRFS Technical MeetingLC Operations Update
March 30, 2010

24-Month Study
ProjectedPowell
WY Unreg Inflow
ProjectedPowell Apr- Jul Unreg Inflow
ProjectedLake Powell
EOWY Elevation
w/ 8.23 maf Release
Projected Glen
Canyon WY
Release
Projected Amount of EQ
Release
ProjectedLake Mead EOWY
Elevation
Probability of EQ
Jan2010
77%9.3 maf
78%6.2 maf
3638.31 ft 8.23 maf 0.00 maf 1077.02 ft 21%
Feb 2010
73% 8.9 maf
73% 5.8 maf
3634.80 ft 8.23 maf 0.00 maf 1081.17 ft 25%
Mar 2010
69% 8.3 maf
68%5.4 maf
3631.88 ft 8.23 maf 0.00 maf 1081.36 ft 3%
Summary of Lake Powell and Lake Mead Operations24-Month Study 2010 Water Year Projections
In 2010, the Equalization Elevation is 3642 ft.

What happened January – March?Projected Lake Mead elevation end of WY
2010 increased 4.34 feet in 2 months
• Storm events in Southern California and Arizona• Salt River Project full• Alamo Dam releases• Painted Rock Dam releases

Water Released from COE DamsMarch 2010
Provisional data from USGS gages Mar 1, 2010 – Mar 29, 2010

Summary of Lake Mead Elevation and Lake Havasu Water Use in early 2010
January 24-Month Study Projections
Month Lake Mead Elev Parker Release Havasu Diversions
(in 2010) (feet) (kaf) (kaf)
January 1098.90 359 278
February 1099.21 442 260
March 1095.17 712 292
January and February Actuals/March Projections
Month Lake Mead Elev Parker Release Havasu Diversions
(in 2010) (feet) (kaf) (kaf)
January 1100.02 233 225
February 1103.21 331 157
March 1100.53 684 220
Differences
Month Lake Mead Elev Parker Release Havasu Diversions
(in 2010) (feet) (kaf) (kaf)
January 1.12 -126 -53
February 4.00 -111 -103
March 5.36 -28 -72

1,065
1,075
1,085
1,095
1,105
1,115
1,125O
ct-0
8
No
v-08
Dec
-08
Jan
-09
Feb
-09
Mar
-09
Ap
r-09
May
-09
Jun
-09
Jul-
09
Au
g-0
9
Sep
-09
Oct
-09
No
v-09
Dec
-09
Jan
-10
Feb
-10
Mar
-10
Ap
r-10
May
-10
Jun
-10
Jul-
10
Au
g-1
0
Sep
-10
Oct
-10
No
v-10
Dec
-10
Ele
vati
on
(ft
)Lake Mead End of Month Elevation
Projections from January-March 2010 24-Month Studies
January 2010 Official 24-Month StudyFebruary 2010 Official 24-Month StudyMarch 2010 Official 24-Month StudyHistorical Elevations


End of Calendar Year 2010
• LOTS of demand uncertainty– Unused agricultural water from January and
February– Capacity constraints of junior priority users– ICS plans for creation and delivery are still in
development
• Side Inflow uncertainty
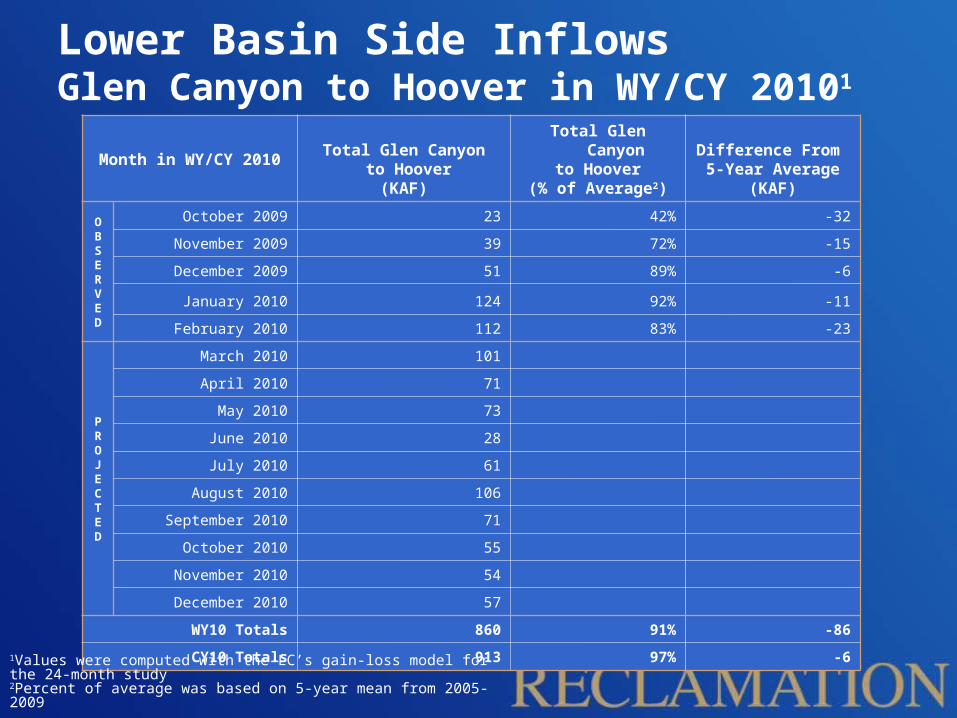
Lower Basin Side InflowsGlen Canyon to Hoover in WY/CY 20101
Month in WY/CY 2010Total Glen Canyon
to Hoover(KAF)
Total Glen Canyonto Hoover
(% of Average2)
Difference From 5-Year Average
(KAF)
OBSERVED
October 2009 23 42% -32
November 2009 39 72% -15
December 2009 51 89% -6
January 2010 124 92% -11
February 2010 112 83% -23
PROJECTED
March 2010 101
April 2010 71
May 2010 73
June 2010 28
July 2010 61
August 2010 106
September 2010 71
October 2010 55
November 2010 54
December 2010 57
WY10 Totals 860 91% -86
CY10 Totals 913 97% -6
1Values were computed with the LC’s gain-loss model for the 24-month study2Percent of average was based on 5-year mean from 2005-2009

Lower Colorado RiverOperations
For further information: http://www.usbr.gov/lc/region