Operational Research to Improve Health Services
104
Operational Research to Improve Health Services A guide for proposal development 2013 Desmond Tutu TB Centre, Department of Paediatrics and Child Health, Faculty of Medicine and Health Sciences, Stellenbosch University International Union Against Tuberculosis and Lung Disease ISBN 978-0-620-57795-3 Operational Research to Improve Health Services A guide for proposal development - 2013
Transcript of Operational Research to Improve Health Services
Operational Research toImprove Health Services
A guide for proposal development
2013
Desmond Tutu TB Centre, Department of Paediatrics and Child Health,
Faculty of Medicine and Health Sciences, Stellenbosch UniversityInternational Union Against Tuberculosis and Lung Disease
ISBN 978-0-620-57795-3Operational Research to Improve Health Services
A guide for proposal development - 2013
About The Union
Founded in 1920, the International Union Against Tuberculosis and Lung Disease (The Union) is dedicated to bringing innovation, expertise, solutions, and support to address health challenges in low- and middle-income populations. With nearly 10,000 members and subscribers from over 150 countries, The Union has its headquarters in Paris and offices serving the Africa, Asia Pacific, Europe, Latin America, Middle East, North America, and South-East Asia regions. Its scientific departments focus on tuberculosis, HIV, lung health, and non-communicable diseases, tobacco control and research. Each department engages in research, provides technical assistance and offers training and other capacity-building activities leading to health solutions for the poor.
For more information about The Union, please visit www.theunion.org
About the Desmond Tutu TB Centre
The Desmond Tutu TB Centre is an academic research centre of the Department of Paediatrics and Child Health, Faculty of Medicine and Health Sciences, Stellenbosch University. Its mission is to improve the health of vulnerable groups through research that influences policy and practice. It has three focal research areas: Childhood Tuberculosis; Health System Strengthening & Operational Research; and Community Randomized Trials.
The Centre works closely with the Department of Health and local communities. It provides training to academic and health services staff, builds capacity in the University and the Department of Health, provides services to communities and advocates for TB/HIV and other health issues. The Centre is involved in policy development at a regional, national and international level.
The Centre is named in honor of Archbishop Desmond Tutu, a tireless campaigner for health and human rights. Archbishop Tutu suffered from TB in his youth and champions tuberculosis research and care.
For more information, please visit www.sun.ac.za/tb
Operational Research toImprove Health Services
A guide for proposal development
2013
Desmond Tutu TB Centre, Department of Paediatrics and Child Health,
Faculty of Medicine and Health Sciences, Stellenbosch UniversityInternational Union Against Tuberculosis and Lung Disease

Pren NaidooBrenda Smuts
Mareli ClaassensI.D. Rusen
Donald A EnarsonNulda Beyers
This manual was produced from materials developed for the Operational Research Assistance Project, in partnership with the The Union through TREAT TB, with funding from the United States Agency for International
Development (USAID). The contents do not necessarily reflect the views of USAID
or the United States Government.
i
PrefaceThis Guide was developed for use in the Operational Research Assistance Project (ORAP) of the Desmond Tutu TB Centre (DTTC), Department of Paediatrics and Child Health of the Faculty of Medicine and Health Sciences, Stellenbosch University, South Africa. The ORAP was developed by the DTTC in collaboration with the International Union Against Tuberculosis and Lung Disease and funded through TREAT TB with a grant from the USAID. The methodology was developed using experience gained from similar workshops and material used in courses presented in Africa to promote Lung Health Research.
This Guide contains the course material used in the ORAP proposal development workshop. The workshop aims, over a period of five days, to train health care providers and academics to develop an operational research proposal that can be carried out over the subsequent year to improve services in public health facilities. Although the National Tuberculosis Control Programme is the focus for the workshop, the content is applicable to any health service.
The ORAP initiative is based on a firm belief that the health providers working in the services are those most likely to know the problems they face in delivering high quality services. Partnering personnel from the health services with local academic and research institutions and working together as a team to develop the research proposal helps to ensure that relevant research is undertaken and may assist in the uptake of research findings into practice and/or policy.
The initiative stresses the partnership of service providers and academics in developing, implementing and reporting the research. To help facilitate the research to be undertaken the DTTC organises access to experts such as statisticians, data managers and ethics reviewers. Each team is assigned a mentor to assist in proposal development, implementation, analysis and publication of results. The ultimate objective of the operational research is to change policy and / or practice in order to provide the highest quality of services possible for those affected by tuberculosis.
The Guide is a compilation of our experience in this initiative and is shared with others, not in a sense that it is definitive, but rather a practical and humble record of our experience. There are undoubtedly many other approaches that are equally valid in aiming to achieve the same objectives. We offer this record of our experience in the hope that it might be useful to those interested in undertaking operational research to improve health services.

ii
ISBN 978-0-620-57795-3Operational Research to Improve Health Services
A guide for proposal development - 2013

iii
Contents
1. Operational Research Overview ..................................................................... 11.1 What is Operational Research? ...................................................................11.2 How does OR differ from other types of research? ......................................11.3 How does OR differ from using routine data for quality ............................ improvement? ............................................................................................. 21.4 Why do we need OR? ................................................................................. 21.5 What are the challenges in undertaking OR? ............................................ 31.6 How do we measure the success of OR? ..................................................... 4
2. Proposal Overview ......................................................................................... 52.1 Outline and key questions ......................................................................... 52.2 Literature review ......................................................................................... 72.3 Referencing ............................................................................................... 11
3. Introduction to the Research Topic ............................................................. 133.1 Describing the context ............................................................................. 133.2 Problem identification ............................................................................. 133.3 Problem analysis ...................................................................................... 153.4 Justification .............................................................................................. 17
4. Defining the Research Question .................................................................. 214.1 The research question ............................................................................... 214.2 The research hypothesis............................................................................ 224.3 The two-by-two table ................................................................................ 234.4 Additional objectives ................................................................................ 26
5. Study Methods ............................................................................................. 275.1 Study setting ............................................................................................. 275.2 Study design .............................................................................................. 285.3 Target and Study Population .................................................................... 365.4 Sampling ................................................................................................... 405.5 Sample size and power .............................................................................. 41
iv
5.6 Variables, definitions and data sources .................................................... 465.7 Measurement, error and bias .................................................................... 525.8 Data collection .......................................................................................... 565.9 Data management .................................................................................... 605.10 Data analysis plan ................................................................................... 675.11 Quality assurance .................................................................................... 71
6. Ethics ............................................................................................................ 736.1 Key principles ............................................................................................ 736.2 Ethical considerations in operational research ....................................... 746.3 Applying for ethics approval .................................................................... 76
7. Application of research findings .................................................................. 797.1 Strengths and limitations ......................................................................... 797.2 Dissemination and stakeholder engagement .......................................... 807.3 Implications for policy and practice ......................................................... 81
8. Project management .................................................................................... 858.1 Roles and responsibilities of the principal investigator ........................... 858.2 Project timelines ....................................................................................... 878.3 Budget ........................................................................................................ 888.4 Budget narrative ........................................................................................ 918.5 Regulatory aspects .................................................................................... 93
1Operational Research Overview
1.1 What is Operational Research?
Operational research (OR) has many definitions depending on the setting, the researcher and the nature of the research. The International Union Against TB and Lung Disease (The Union) and many of its research partners define operational research as follows:
“research into strategies, interventions, tools or knowledge that can enhance the quality, coverage, effectiveness or performance of the health system or programme in which the research is being conducted” 1
Supporting this practical definition are three basic steps to guide operational research:1. Spell out well-defined goals and objectives of the health programme or
system in question2. Identify, prioritize and articulate constraints and obstacles that prevent
these objectives being achieved3. Develop research questions that address the constraints.
To successfully undertake relevant operational research, it is necessary to have a common understanding of what is meant by operational research as well as agreement on the key principles outlined in this guide.
1.2 How does OR differ from other types of research?
Operational research is different from clinical or epidemiological research in that it examines a system (in this case the health care system) rather than focusing on an individual or a group of individuals (as in clinical or epidemiological research where patients are examined). In addition, operational research has
1 Zachariah R, Harries D, Ishikawa N et al . Operational research in low income countries: what, why and how? Lancet Infect Dis 2009; 9: 711-717.
2 CHAPTER 1
at its core, the goal of improvement of a system (the health care system). To do this, it is necessary to identify challenges in the system and evaluate or recommend solutions.
1.3 How does OR differ from using routine data for quality improvement?
Those working in or responsible for health services can use routine data to drive quality improvement through data analysis, identification of gaps, development of quality improvement initiatives and monitoring whether or not these have resulted in improvements to the service. However it is impossible to differentiate between improvement due to the intervention (the quality improvement initiative) and other factors (management interest in the problem, improved monitoring of the problem or other changes that occur with time, for example).
Although OR also starts with identifying problems or challenges in the heath system, what differentiates OR from the use of routine data to drive quality improvement is that it is hypothesis driven. The hypothesis is evaluated using rigorous scientific methods that allow for analytical comparisons, so that inferences can be made about the target population and used to inform policy and practice.
1.4 Why do we need OR?
Operational research has been increasingly recognized as vital to the strengthening of health programmes. For example, the expanded Stop TB Strategy2 explicitly includes operational research as one of the key components for successful tuberculosis programmes. The Global Fund to Fight AIDS, Tuberculosis and Malaria (GFATM) recommends that health programmes spend between 5 and 10% of their budget on monitoring and evaluation which should include relevant operational research. The percentage of GFATM grants approved with an operational research component increased from 19% overall
2 The Stop TB Strategy, World Health Organization. 2006. http://whqlibdoc.who.int/hq/2006/WHO_HTM_STB_2006.368_eng.pdf. [Acessed 06 March 2013]
3OPERATIONAL RESEARCH OVERVIEW
in rounds 1-5, to 52% in round 63. On average, approximately US$ 400 000 was requested for operational research per proposal, accounting for 3%-4% of the total requested budget.
The true value of operational research to health programmes is not only the inclusion in global plans or the allocation of resources, but more importantly the improvement of health via the impact of research results on programmatic and policy decisions and on practice. In an example that highlights this direct relevance, researchers from a basic, low-cost operational research study in South Africa identified that patients treated in a large referral hospital were often lost to follow-up after transfer to their local primary health care facilities for ongoing treatment and made recommendations as to how the problem might be addressed4. The recommendations were implemented and the situation was re-evaluated and shown to have improved5.
The importance of operational research is its ability to address and solve local problems in delivering quality health services. A necessary starting point is to identify the obstacles to providing high quality services, analyse why these obstacles occur and to adopt policies and practices to overcome them.
1.5 What are the challenges in undertaking OR?
While the concept of operational research as an essential tool for health programmes is widely accepted, challenges to successful implementation of comprehensive OR activities at country level are numerous.
3 Framework for Operations and Implementation Research in Health and Disease Control Pro-grams, The Global Fund, W.H.O, UNAIDS, 2008. http://www.who.int/hiv/pub/operational/frame-work/en/index.html [Acessed 26 September 2012]4 Edginton ME, Wong ML, Phofa R, Mahlaba D, Hodkinson HJ. Tuberculosis at Chris Hani Barag-wanath Hospital: numbr of patients diagnosed and outcomes of referrals to district clinics. Int J Tuberc Lung Dis 2005; 9: 398-402.5 Edginton ME, Wong ML, Hodkinson HJ. Tuberculosis at Chris Hani Baragwanath Hospital: an intervention to improve patient referrals to district clinics. Int J Tuberc Lung Dis 2006; 10: 1018-1022.
4 CHAPTER 1
• Many countries still operate in the absence of a detailed, systematic research plan, with clear linkages to programme priorities, thus limiting the impact of research efforts.
• Implementing research studies in the absence of a carefully conducted situation analysis prevents many countries from achieving their desired goals.
• The appropriate external sources of support – financial, technical and research mentoring – must be in place at all stages of planning and implementation of the research. These resources must allow the local partners (rather than those providing the funds or external experts) to set the priorities. Such resources are insufficient or absent at some or all stages of OR implementation in many countries.
• Training in operational research methodology is required for both service providers and academics.
1.6 How do we measure the success of OR?
There is no doubt that operational research must lead to publications and the number of publications is one outcome measure of research. However, results and new knowledge must also lead to action, which will lead to changes in clinical or laboratory practice and management and if possible, also to changes in policy.
Apart from publications, research should also ensure that service providers in low and middle income countries are themselves empowered to do the research and to claim ‘ownership’ by being authors. This implies that they also know how to write and publish articles in peer-reviewed journals. Therefore mechanisms for ensuring the sustainability of operational research should be put in place.
All operational research and the new knowledge created by research should lead to and be measured by:• Publications• Capacity development of service providers and academic researchers• Changes in practice and/or policy
2Proposal Overview
2.1 Outline and key questions
Operational research studies develop in response to a problem that stakeholders wish to address. The development of a research proposal for the study is an iterative process that sets out to answer the following questions:
• What is the problem and why is it important to address this problem?• What is already known about this problem?• What does this study aim to achieve?• How will this be achieved – what data is required and how will it be collected
and analysed? • How will the work to be undertaken and what resources will be required?
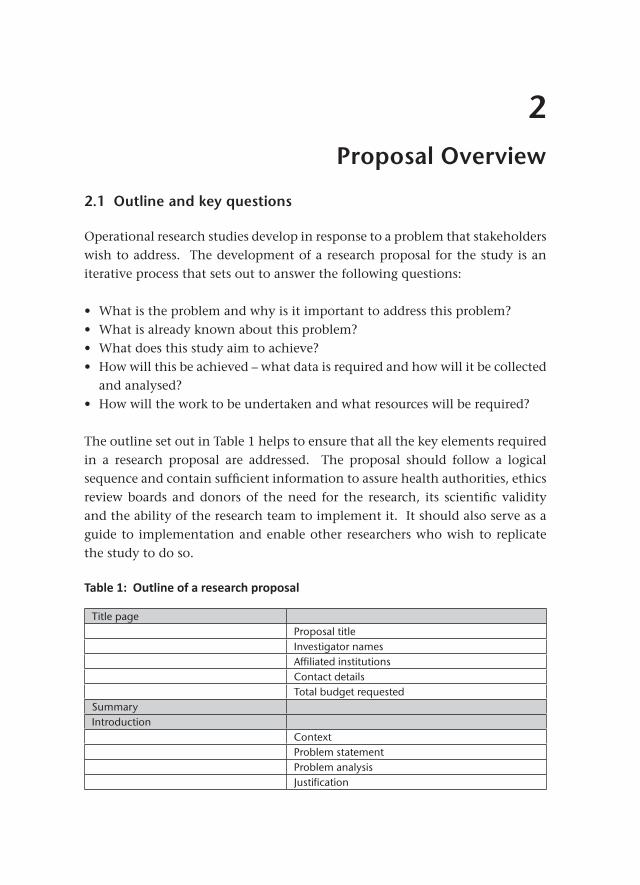
The outline set out in Table 1 helps to ensure that all the key elements required in a research proposal are addressed. The proposal should follow a logical sequence and contain sufficient information to assure health authorities, ethics review boards and donors of the need for the research, its scientific validity and the ability of the research team to implement it. It should also serve as a guide to implementation and enable other researchers who wish to replicate the study to do so.
Table 1: Outline of a research proposal
Title pageProposal titleInvestigator namesAffiliated institutionsContact detailsTotal budget requested
SummaryIntroduction
ContextProblem statementProblem analysisJustification
6 CHAPTER 2
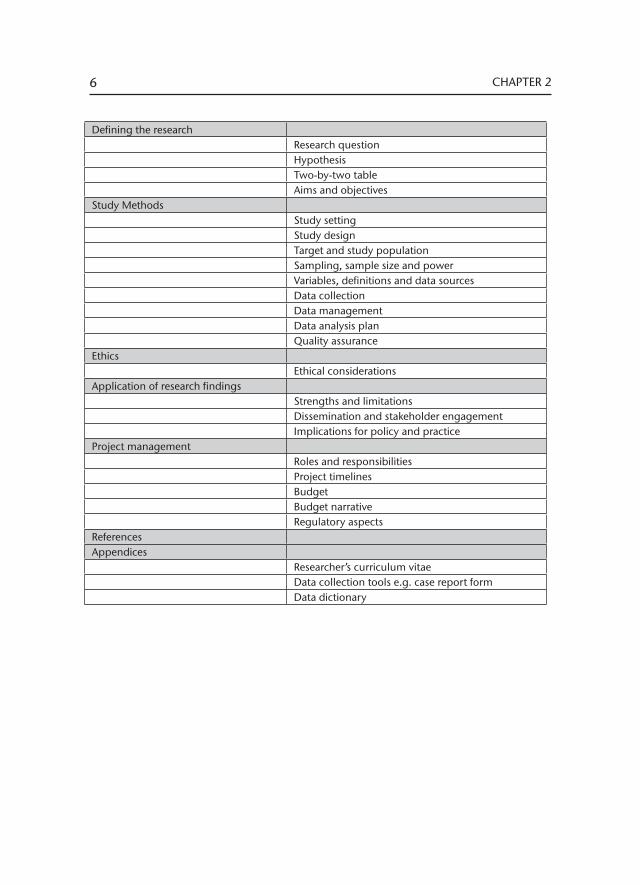
Defining the researchResearch questionHypothesisTwo-by-two tableAims and objectives
Study MethodsStudy settingStudy designTarget and study populationSampling, sample size and powerVariables, definitions and data sourcesData collectionData managementData analysis planQuality assurance
EthicsEthical considerations
Application of research findingsStrengths and limitationsDissemination and stakeholder engagementImplications for policy and practice
Project managementRoles and responsibilitiesProject timelinesBudgetBudget narrativeRegulatory aspects
ReferencesAppendices
Researcher’s curriculum vitaeData collection tools e.g. case report formData dictionary
7PROPOSAL OVERVIEW
2.2 Literature review
A literature review is a systematic and thorough search of the literature in order to identify as many relevant items as possible related to the subject being studied6.
A literature review is not only done at the start of a proposal development, but throughout the proposal writing process, during implementation of the study itself, and when analysing and writing up the study findings. Each time a literature review is undertaken, different pieces of information are sought.
During proposal development for example, the literature review can contribute to an understanding of the context in which the research will be undertaken, the extent of the problem and the factors influencing that problem. The literature review is essential in identifying what is already known about the problem and helps to justify the need for the proposed study. It can also assist with developing an appropriate study methodology, for example, by providing information that can be used to inform sample size calculation; by providing information on previously validated data collection tools and on analytic methods. Before starting a literature review, have a clear idea about what to search for and what the extent of the search will be. There is an extraordinarily large amount of information available; one therefore needs a specific search question to start the process. This question may be the same as the research question, but can sometimes differ, for example, when looking for background information.
Consider the different types of literature available and before starting a search, identify the type of literature which will be most applicable to the question. The different types of literature include published literature, grey literature and unpublished literature. Define the time period for literature inclusion according to the dates when publications became available. Another consideration is the language(s) of the articles: think carefully about the implications of omitting some languages from the search. Remember that although some articles are not
6 The Albert Sloman Library, University of Essex [internet]. Available from: http://libwww.essex.ac.uk/Information_Skills/literature_searching.htm [accessed 6 March 2013]
8 CHAPTER 2
written in English or a familiar language, the abstract may be available. If the abstract seems important for the literature review, the article can be translated.
Published literature can be found by searching databases, doing manual searches or contacting researchers involved in the field of interest. Literature databases are organised in different ways7 and depending on the search criteria, one may choose to use one of the types primarily.
• A database (e.g. Medline) may be organised using a structured thesaurus with MeSH (Medical Subject Headings) terms where a keyword, abstract or author is used to identify an article of interest according to the category (or MeSH) it is ordered to. This type of database may however not include the latest concepts in a field, especially in a rapidly developing science such as medicine. MeSH terms simplify the search as the indexer assigns the terms to articles dealing with similar topics. Each database differs and one has to study each to identify how to use it efficiently and effectively.
• A database such as Google Scholar does not have an in-built structure, and greater thought and preparation is needed to identify keywords which incorporate all possible references. All the possible alternative descriptions of the terms have to be searched for: a search for ‘preventive therapy’ for example will not identify articles with ‘prophylaxis’ as the key word.
• A database (e.g. Scisearch) may use citation searching where articles which have been cited by other articles in the field are identified.
Published data can also be searched manually by looking at indexing journals, abstracting journals, reference lists or library holdings at a medical library. Contacting researchers working in the field on the topic of interest could also be considered. Names of researchers working in the field are usually available on published articles or guidelines, where the first author is often the corresponding author and an email address is supplied in the article.
Databases are also available for unpublished data. In some instances, reports and conference proceedings give a good account of unpublished data. One
7 Eyers J. Searching bibliographic databases effectively. Health Policy Plan, 1998; 13(3):339-342
9PROPOSAL OVERVIEW
could also consult the websites of organisations, for instance the International Union against Tuberculosis and Lung Disease website, to access the annual conference abstracts.
Grey literature, defined as “that which is produced on all levels of government, academics, business and industry in print and electronic formats, but which is not controlled by commercial publishers”8 (such as technical / statistical reports, conference proceedings, theses etc) can be searched manually, but this is mostly done in a library and a subscription is usually needed. The New York Academy of Medicine Library lists several databases that allow for an electronic search of grey literature.
Experts could also be asked to contribute, for example with their conference abstracts. When experts are contacted directly, formulate a list of questions to go through with every expert to ensure a structured approach to their inputs. It is a good idea to send the questionnaire to the expert in advance to ensure that the information required is available when they are contacted.
The positive predictive value of the search could be increased by using more specific thesaurus terms, specifying major topics, using sub-headings, using additional thesaurus or free-text terms or using the limit options of the database itself. The sensitivity of the search could be increased by adding additional MeSH terms or free-text terms, by looking for key authors, searching for ‘related articles’, using additional data sources and searching manual sources. These strategies all contribute to a more thorough literature review.
Once a search is complete, it is crucial to record the search strategy in order to be able to replicate it in future. The following details should be recorded: date of search, data sources selected, search terms used (e.g. MeSH terms and how they are related), any limits applied, the results of the search, which abstracts were read and which articles were read, evaluated and included in the review. Remember that materials (for example, full text articles or abstracts) can be obtained on the Internet (Pubmed Central) or from other sources such as a
8 Grey Literature Report., The New York Academy of Medicine http://www.greylit.org/
10 CHAPTER 2
medical library (with interlibrary loans) and/or reprints. Colleagues may also assist with copies of articles needed for the literature review.
The literature review needs to be specific to the research question and study. The focus areas of the review should correspond to the various aspects of the study planned. In each section of the proposal therefore, refer to the relevant literature sources to strengthen the information presented rather than providing a ‘stand-alone’ literature review.
Example:
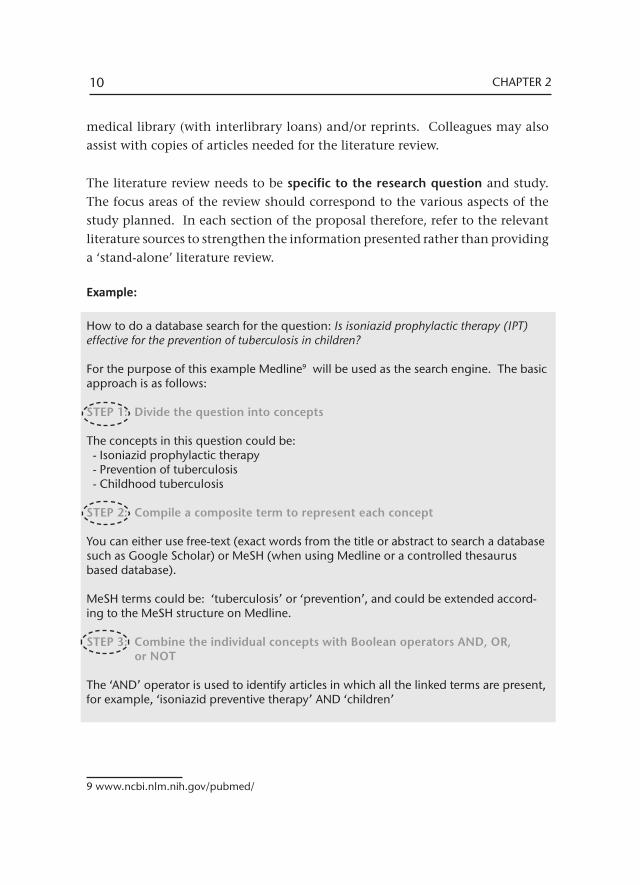
How to do a database search for the question: Is isoniazid prophylactic therapy (IPT) effective for the prevention of tuberculosis in children?
For the purpose of this example Medline9 will be used as the search engine. The basic approach is as follows:
STEP 1: Divide the question into concepts
The concepts in this question could be: - Isoniazid prophylactic therapy - Prevention of tuberculosis - Childhood tuberculosis
STEP 2: Compile a composite term to represent each concept
You can either use free-text (exact words from the title or abstract to search a database such as Google Scholar) or MeSH (when using Medline or a controlled thesaurus based database).
MeSH terms could be: ‘tuberculosis’ or ‘prevention’, and could be extended accord-ing to the MeSH structure on Medline.
STEP 3: Combine the individual concepts with Boolean operators AND, OR, or NOT
The ‘AND’ operator is used to identify articles in which all the linked terms are present, for example, ‘isoniazid preventive therapy’ AND ‘children’
9 www.ncbi.nlm.nih.gov/pubmed/
11PROPOSAL OVERVIEW
‘OR’ is used to identify articles that use synonymous terms that deal with the same topic, for example ‘prophylaxis’ OR ‘preventive therapy’. These terms may already have been linked in a structured database such as Medline, but will not have been linked in databases using keyword searches.
‘NOT’ is used to exclude references containing specific terms, for example, ‘TB prophy-laxis’ NOT ‘adults’
Remember the order of the Boolean operators used may make a difference to the search results. Keep careful notes of which concepts have been combined with which Boolean operators and the order in which they have been used.
2.3 Referencing
Referencing is a standardised way of acknowledging the source of information cited in the research proposal. Failure to acknowledge the source is considered to be plagiarism.
The use of standard formats allows others to readily find the source information. The standards for commonly used information sources such as journals, books, theses, internet sources, reports and personal communication differ. It is beyond the scope of this guide to deal with these in detail. Refer to “Make Sense of Referencing, The Harvard, APA and Vancouver methods and the footnote system”10 for a more detailed overview of referencing.
Journals contain the most current source of information in a field and are most frequently cited. Different academic institutions and journals use different citation formats, the commonest of which are the Harvard system and the Vancouver system. The latter is used in most medical journals.
In brief, the Vancouver system uses the following format for journal articles5: Author’s Surname Initials, Author’s Surname Initials. Title of article. Abbreviated Title of Journal, Year of publication; Volume number (issue number): page
10 Make Sense of Referencing, The Harvard, APA and Vancouver methods and the footnote sys-tem. Tobie van Dyk and Marisca Coetzee, Stellenbosch University Language Centre, 3rd edition, 2010. http://wiki.lib.sun.ac.za/images/a/a8/LanguageCentre_Reference_Techniques2010.pdf [Accessed 30 January 2013]
12 CHAPTER 2
numbers. If there are more than three authors, only the first three are listed followed by “et al”. For example:
1. Claassens MM, Sismanidis C, Lawrence KA et al, Tuberculosis among community-based health care researchers, Int J Tuberc Lung Dis, 2010,14(12):1576-1581
When citing the reference in the text, a number is used (either superscript or bracketed), ordered according to appearance in the text. For example: ‘Research in this community has shown that community based researchers have a more than 2-fold higher incidence of TB than the general community1’. The number 1 indicates that this is the 1st article cited in the text.
Once a decision has been taken on the journal to which an article will be submitted, refer to that journal’s ‘Instructions to Authors’ to ensure that the referencing requirements for that journal are adhered to.
Computer software is available to assist with referencing. Amongst those most commonly used, Endnote11 and RefWorks12 must be purchased. Zotero13 and Mendeley14 are open source and can be downloaded free of charge. Although the referencing software is extremely helpful, it is important to note that the electronic system used in compiling the list of references requires the correct inputs to ensure that references are in the correct format.
11 http://www.endnote.com/12 http://www.refworks-cos.com/refworks/13 http://www.zotero.org/14 http://www.mendeley.com/
3Introduction to the Research Topic
The introductory section of a research proposal should show that the researcher has a thorough grasp of the topic, is up to date with relevant literature and can make a compelling case for why this research is important. The approach is to start broadly with knowledge of the field of interest, narrowed to its relevance within a specific context and flowing into the problem identification, hypothesis and research question. The introductory section of a proposal is important in stimulating the reader’s interest and setting the tone for the proposal. 3.1 Describing the context Context refers to the set of conditions or circumstances around a particular situation through which that situation can be more fully understood. Context may include:
• The population and their demographics • Environmental factors (geographic, social, economic, cultural etc) that
influence both the health of people and the health system. • The burden of disease. This is best described by starting with a broad
perspective (international or national) and then honing in to a regional and local level.
One of the challenges is to succinctly present the information that is relevant to the problem. A rambling unfocused description of the context may detract rather than help to frame the research problem. This section should flow naturally into the problem identification section. 3.2 Problem identification
To get started in operational research, a challenge / problem in the health system needs to be identified as a potential research domain. A problem is defined as any deviation from a norm or expected standard. If the current and desired situations in the health services can be described, the problem is usually readily identified.
14 CHAPTER 3
The most appropriate people to identify which challenges are real and relevant, are those providing health care services. Health care providers face many challenges every day and most of these can become valid research questions and can be studied. It is advisable to think about the challenges and to consider whether, once the operational research has identified the reason for the challenge, it can be addressed through the new knowledge created by research. The research should focus on and address challenges that are relevant to that specific location.
The challenge or problem is most often identified from routinely collected data and used to formulate a scientific question. This leads to the collection of appropriate data for analysis and eventually the results and recommendations of the study are disseminated back to the health services so that the appropriate changes can be made to policy and / or practice.
From a TB perspective, problem identification starts with the analysis of local routinely collected data, usually from the TB treatment register or the electronic TB register (ETR.net) or from other sources such as the sputum register or laboratory records. It is important to have an adequate knowledge of the local data sources and their strengths and limitations. For example, poorly completed sputum registers may make it very difficult to identify initial TB treatment default (patients with a laboratory diagnosis of TB who do not commence TB treatment in a specified time).
In order to identify a problem in the health services the researcher needs an adequate technical knowledge of the health services, the data and the definitions used within the service. One of the most frequent errors made during data analysis is the incorrect interpretation of indicators. ‘DOTS coverage’, for example, is often incorrectly assumed to reflect the % of patients receiving daily observed therapy. It in fact refers to the population living in the districts implementing the DOTS strategy as a percentage of the total population. A low ‘bacteriological coverage’ is also often incorrectly attributed to a high number of children being diagnosed with PTB when, in fact, it refers to the number of PTB cases diagnosed by bacteriological tests (smear and / or culture) as a percentage of the total PTB cases reported, excluding children 0–7 years with no smear. To help avoid these errors, refer to the National TB Guidelines which
15INTRODUCTION TO THE RESEARCH TOPIC
provide the definitions of all indicators used in the TB Control Programme.
It is preferable to have at least annual data available for in-depth analysis and to have data available for the previous two to three years so that trends can also be identified. Before analysing the data, consider which cases are reflected in the data and which are excluded. For example, do the treatment outcomes reflect all TB cases or only smear positive cases? Do they reflect outcomes for new or retreatment TB cases?
Problem identification is an objective process. It requires a review of the routine data and ascertaining what contributes to the problem identified. For example, does ‘default’, ‘death’, ‘non-conversion’ or ‘results not available’ contribute most to a low ‘smear conversion’ rate. In selecting the problem to be addressed, consider what will have the greatest impact on improving the service and on issues that could be most easily remedied.
3.3 Problem analysis
Problem analysis is the process through which a more thorough understanding of the challenge / problem is developed. This requires the identification of associated factors and root causes to the problem. In order to fix a problem, one needs to have a thorough understanding of all the factors that influence the problem.
Problem analysis can be difficult to do on one’s own; it is very helpful to undertake a brain-storming exercise with colleagues who have some understanding of the topic. Factors that influence the problem may also be identified from the literature. A thorough consideration of the issues is an extremely important step in helping to ensure that the project scope is appropriate and that some of the limitations of the research are identified early on.
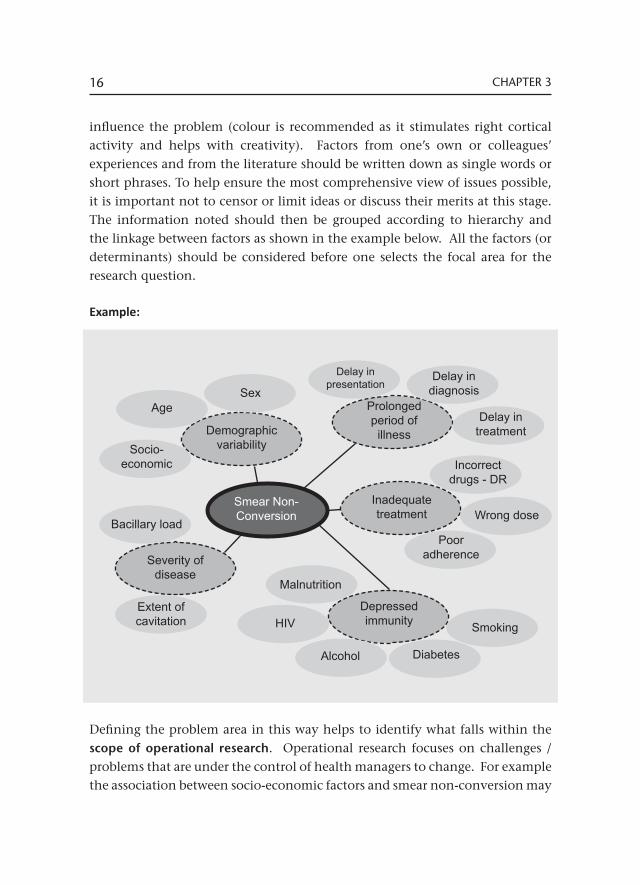
A creative approach to problem analysis is to use Tony Buzan’s mind mapping methodology15. Coloured pieces of paper are used to note down factors that
15 http://www.tonybuzan.com/about/mind-mapping
16 CHAPTER 3
influence the problem (colour is recommended as it stimulates right cortical activity and helps with creativity). Factors from one’s own or colleagues’ experiences and from the literature should be written down as single words or short phrases. To help ensure the most comprehensive view of issues possible, it is important not to censor or limit ideas or discuss their merits at this stage. The information noted should then be grouped according to hierarchy and the linkage between factors as shown in the example below. All the factors (or determinants) should be considered before one selects the focal area for the research question.
Example:
Defining the problem area in this way helps to identify what falls within the scope of operational research. Operational research focuses on challenges / problems that are under the control of health managers to change. For example the association between socio-economic factors and smear non-conversion may
Demographicvariability
Prolonged period of
illness
Inadequate treatment
Depressed immunity
Smear Non-Conversion
Severity of disease
SexAge
Socio-economic
Bacillary load
Extent of cavitation
Delay in presentation
Delay in diagnosis
Delay in treatment
Incorrect drugs - DR
Wrong dose
Poor adherence
Smoking
DiabetesAlcohol
HIV
Malnutrition
17INTRODUCTION TO THE RESEARCH TOPIC
be important to know, but poverty cannot be changed by the health services or by the health care managers.
It can also guide the formulation of the research question (for example, is there an association between smear non-conversion and poor adherence to treatment?) as well as help to determine the primary and secondary objectives.
Most importantly mind mapping and problem analysis help to identify some of the limitations of the research and can provide a basis for evaluating whether answering this research question will contribute significantly to addressing the problem. For example, research into the association between delays in TB treatment initiation after a result is available and smear non-conversion may not have a significant impact on smear conversion due to the many other factors that also contribute, such as delays in seeking health care and diagnostic delays, which cannot be readily measured from routine data.
3.4 Justification
There are many research questions which are interesting but part of putting the research into context is identifying the relevance of the problem – this can be a difficult task. Several questions can help to define the need for the operational research study:
• Does the knowledge already exist to solve the challenge/problem? If the knowledge already exists in the country, province or clinic, then this specific challenge is not a topic for research; rather prompt action based on the existing knowledge is needed to address the challenge. Research should not be an excuse for failure to act on existing knowledge.
• Does the research address a problem that represents a ‘blockage’ to the delivery of quality health services?
• Will it be possible to relieve this blockage and improve the health system using the new knowledge created by the research?
Part of putting research into context is in ensuring that the research is a priority for the health services. This is fairly easy if there are national or provincial
18 CHAPTER 3
priorities for operational research but often there is not a priority list. If there is no priority list, it can be challenging to determine priorities; a starting point could be a meeting of all the relevant stakeholders to set up a priority list for operational research.
Operational research priorities should always be set in collaboration with the health services. When identifying topics for inclusion consider the frequency of the problem, the risk to vulnerable groups, whether the problem can be solved and whether policy makers and the community are willing to act to solve the problem.
Every researcher should spend time before the research starts, to think through every possible outcome of the research and the impact of the results. One way of doing this is to reflect on the hypothesis and consider what the impact will be if the hypothesis is confirmed or if the hypothesis is refuted. In addition, think through the impact of the possible recommendations on the health services.
It is important to think about who will be affected by the research, who should act on the findings and then ensure that all these stakeholders are involved from the beginning. It does not help to have the results and only then to start thinking about to whom results should be disseminated. Consider the following questions:
• What change may this research bring to the delivery of health services? • Are the research findings likely to be equally effective for all people in the
community – men, women, adults, children, poor, non-poor?• What might patients find difficult about this research and the outcome of
this research? • What might this research change for patients? • What concerns might health care workers have about this research and its
outcome? • What might this research change for health care workers? • What changes to the health system might be required? (e.g. to staffing,
training, facilities, equipment, maintenance)• Will this research mean any changes to costs for the patient or health
system?

19INTRODUCTION TO THE RESEARCH TOPIC
• Is there likely to be any resistance from anyone or any institution to this research?
• If the research is successful, which practice, guidelines or policy would need to change?
• What impact, if any, is this research likely to have on international guidelines?
The literature review for this section should indicate what is already known in the field. Indicate how the proposed research study will add to this available body of knowledge.
Writing this section is an iterative process of identifying and thinking about a challenge in the health services, reading the literature, identifying a gap in knowledge, thinking about what this means for a specific setting, mind-mapping what is known and leading finally, to asking a question. Once the process has been completed, there should be a very clear focus for the research and this section of the proposal should be concise and reflect this focus.

20 CHAPTER 3
4Defining the Research Question
Operational research, like every other type of research must be disciplined, rigorous and precise. It is not just a narrative describing an event or process or reporting experiences with a particular topic. It should be ‘hypothesis driven’ (i.e. a specific statement is either rejected or accepted) so that new knowledge can be gained from it to improve the health services in which and with which we work. Sloppiness in thinking or carrying out the research is no more acceptable in operational research than it is in any other type of research.
4.1 The research question
The generation of new knowledge (the intermediate goal of research) starts with a question. A clear answer to the research question enables the action needed to improve health (the end goal of the research). The research question arises from problems in the routine provision of health services.
Example:
Is prolonged smear turnaround time (TAT) in facilities associated with a high rate of initial TB treatment default?
The example above takes a problem frequently encountered in the health facility (high rate of initial TB treatment default) and explores possible reasons for it. The final selection of the question focuses, among various possibilities, upon something that can be addressed within the health services themselves (prolonged smear turnaround time). Posing this question allows one to develop research that can provide an answer and create the new knowledge that is needed to take action to solve the problem being studied. This illustrates the role of operational research in addressing problems in the health system that compromise the quality or efficiency of the services, with an emphasis on those things that one can do something about.
Identifying the problem (outcome i.e. high rate of initial TB treatment default) and possible explanation (key determinant i.e. high smear turn around times)
22 CHAPTER 4
and constructing, from this, the research question are the most important steps in putting together the research proposal.
4.2 The research hypothesis
The research hypothesis is a positive statement of the content of the question. It is a statement of association i.e. ‘there is an association between the key determinant and the outcome’. To illustrate this using the previous example:
Example:
The research question is as follows: Is prolonged smear turnaround time (TAT) in facilities associated with a high rate of initial TB treatment default?
This is transformed to an hypothesis as follows: Prolonged smear TAT in facilities is associated with a high rate of initial TB treatment default.
The hypothesis is made up of two elements (variables): smear turnaround time and the initial TB treatment default. The hypothesis tests the association between two factors. This can be expressed in another way: ‘Are the facilities that are inefficient in handling the diagnostic process (have prolonged smear TAT) the same facilities that have poor patient management practices (patients are lost to follow-up before getting onto treatment and there is a high rate of initial TB treatment default)?’
The problem to be addressed is a high rate of initial TB treatment default (poor patient management practices). This is the ‘outcome’ of the study. This is a very important problem because patients who are sputum smear positive are the most potent sources of transmission of infection in the community. The more quickly they can be detected and given treatment, the better their treatment outcome, the less disability they will subsequently suffer and the less they will transmit TB in the community in which they live. The explanation proposed by the research question / hypothesis is that inefficient operation of the diagnostic system in a facility (indicated by long smear turnaround time) will increase the chance that a patient will not be started on tuberculosis treatment. Prolonged smear TAT is the ‘key determinant’ in the hypothesis and a high rate of initial TB treatment default is the ‘outcome’.
23DEFINING THE RESEARCH QUESTION
4.3 The two-by-two table
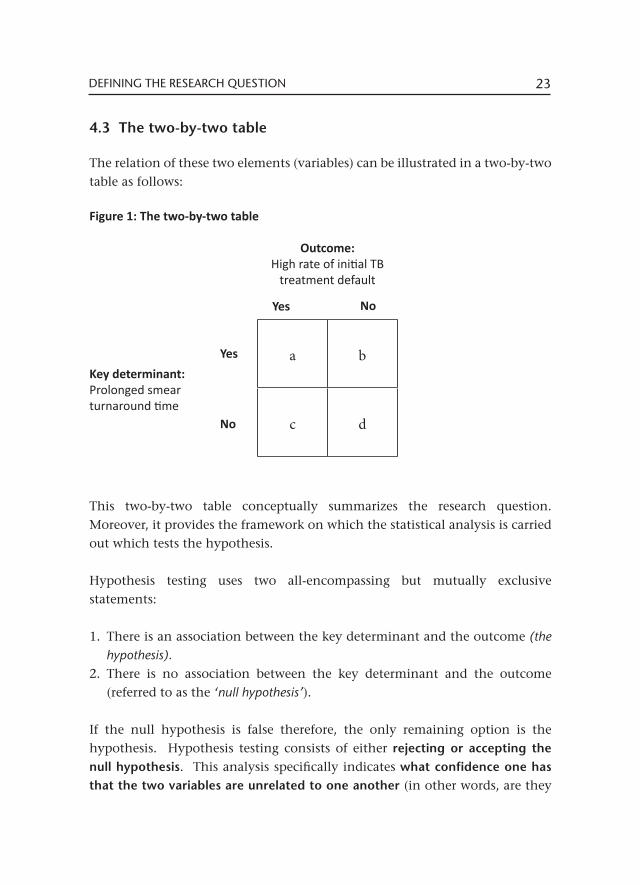
The relation of these two elements (variables) can be illustrated in a two-by-two table as follows:
Figure 1: The two-by-two table
This two-by-two table conceptually summarizes the research question. Moreover, it provides the framework on which the statistical analysis is carried out which tests the hypothesis.
Hypothesis testing uses two all-encompassing but mutually exclusive statements:
1. There is an association between the key determinant and the outcome (the hypothesis).
2. There is no association between the key determinant and the outcome (referred to as the ‘null hypothesis’).
If the null hypothesis is false therefore, the only remaining option is the hypothesis. Hypothesis testing consists of either rejecting or accepting the null hypothesis. This analysis specifically indicates what confidence one has that the two variables are unrelated to one another (in other words, are they
a b
c d
Outcome:High rate of initial TB
treatment default
Key determinant:Prolonged smear turnaround time
Yes
Yes
No
No
24 CHAPTER 4
equally distributed in the four boxes a-d?). By convention, if one cannot be at least 95% certain that the two variables are not associated, one cannot reject the null hypothesis, and therefore by default ‘accept’ the hypothesis.
Again, by convention, the outcome variable (the problem one wishes to study) is placed at the top of the table and the exposure variable (the key determinant) at the left side of the table. Finally, the table is constructed such that the worst event (prolonged smear TAT and high rates of initial TB treatment default – the result ‘yes / yes’ to the presence of the two variables) is in the upper left box and the best event (not prolonged smear turnaround time and low rates of initial TB treatment default – the answer ‘no / no’ to the presence of the two variables) in the lower right box. It is important to get into a habit of placing them this way to avoid confusion when seeing the results of the statistical analysis and to interpret the results of the study in the correct way.
Placing the key determinant and outcome derived from the research question into the two-by-two table as illustrated clarifies the research question immeasurably and makes the development, analysis and interpretation of the research much easier. Within the study, the ‘individuals’ being studied may consist of individual units (such as health facilities) within the health system, rather than individual patients or members of the community as is usually the case in epidemiological research. The focus of operational research is the ‘sick (poorly-functioning) facility’ rather than the ‘sick individual’. As noted above, in selecting the research question, the ‘sickness’ (outcome) in the facility is usually a malfunction (low case detection, inadequate sputum smear conversion rate, high rate of initial TB treatment default, high death rate) that is evident from the routine information reported from the facility. We frequently determine the relevant and important questions (identify the problem and from that the key determinant) by looking at the objectives and targets of the health service and whether or not we reach the targets. This information is often available from the routine reports coming from the health facility (for example, a higher than expected death rate or sputum smear conversion rate) but may also come from the daily experience of those working in a health facility (the problem of delays in providing HIV tests to newly diagnosed TB patients for example).
25DEFINING THE RESEARCH QUESTION
The ‘individuals’ (facilities) within the population to be studied can be classified into four groups (as in the two-by-two table):
• Facilities with the outcome of interest (malfunction) and with the determinant (a=yes to the presence of key determinant and outcome);
• Facilities without the outcome of interest (malfunction) and with the determinant (b=yes to presence of key determinant but no to outcome);
• Facilities with the outcome of interest (malfunction) and without the determinant (c=no to presence of key determinant but yes to outcome);
• Facilities without the outcome of interest (malfunction) and without the determinant (d=no to both presence of key determinant and outcome).
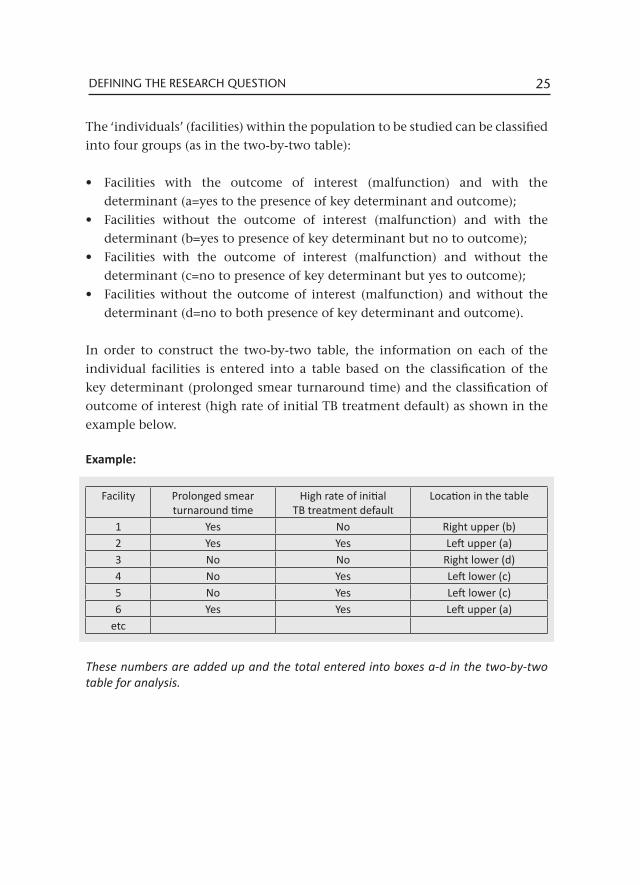
In order to construct the two-by-two table, the information on each of the individual facilities is entered into a table based on the classification of the key determinant (prolonged smear turnaround time) and the classification of outcome of interest (high rate of initial TB treatment default) as shown in the example below.
Example:
These numbers are added up and the total entered into boxes a-d in the two-by-two table for analysis.
Facility Prolonged smear turnaround time
High rate of initial TB treatment default
Location in the table
1 Yes No Right upper (b)2 Yes Yes Left upper (a)3 No No Right lower (d)4 No Yes Left lower (c)5 No Yes Left lower (c)6 Yes Yes Left upper (a)
etc
26 CHAPTER 4
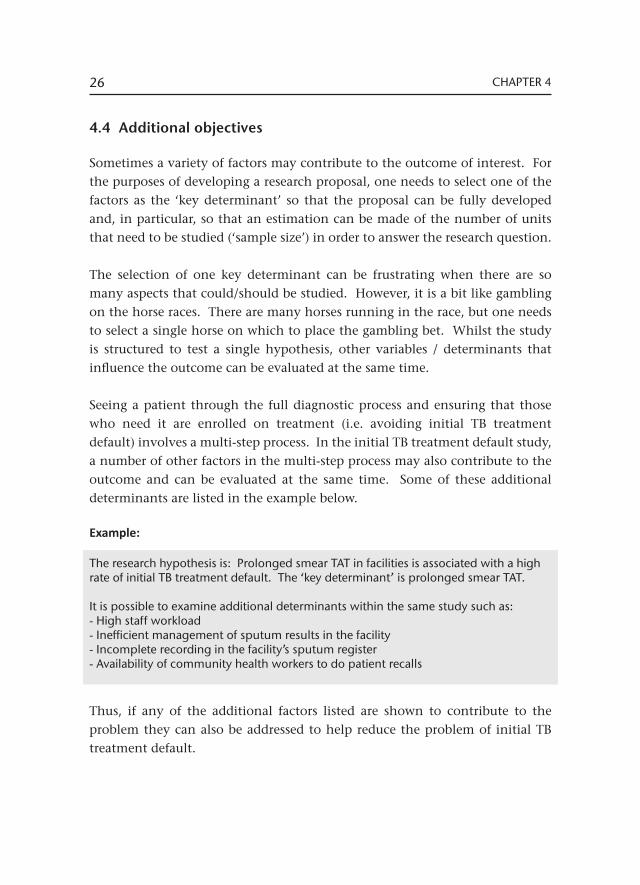
4.4 Additional objectives
Sometimes a variety of factors may contribute to the outcome of interest. For the purposes of developing a research proposal, one needs to select one of the factors as the ‘key determinant’ so that the proposal can be fully developed and, in particular, so that an estimation can be made of the number of units that need to be studied (‘sample size’) in order to answer the research question.
The selection of one key determinant can be frustrating when there are so many aspects that could/should be studied. However, it is a bit like gambling on the horse races. There are many horses running in the race, but one needs to select a single horse on which to place the gambling bet. Whilst the study is structured to test a single hypothesis, other variables / determinants that influence the outcome can be evaluated at the same time.
Seeing a patient through the full diagnostic process and ensuring that those who need it are enrolled on treatment (i.e. avoiding initial TB treatment default) involves a multi-step process. In the initial TB treatment default study, a number of other factors in the multi-step process may also contribute to the outcome and can be evaluated at the same time. Some of these additional determinants are listed in the example below.
Example:
The research hypothesis is: Prolonged smear TAT in facilities is associated with a high rate of initial TB treatment default. The ‘key determinant’ is prolonged smear TAT.
It is possible to examine additional determinants within the same study such as:- High staff workload- Inefficient management of sputum results in the facility- Incomplete recording in the facility’s sputum register- Availability of community health workers to do patient recalls
Thus, if any of the additional factors listed are shown to contribute to the problem they can also be addressed to help reduce the problem of initial TB treatment default.
5Study Methods
This section is the ‘cook book’ of the operational research and guides the researcher in carrying out the work. It also enables anyone reviewing the research and its results to repeat the study in another location or time. In this part of the research proposal, it is essential to be comprehensive and precise in indicating the source of the information used in the research, defining each term used, describing how the information is collected and managed and how it is compared to make conclusions regarding the results of the research.
5.1 Study setting
While research theoretically aims at ‘universal truth’ that gives the final and comprehensive answer to a research question, it is set in a local environment which may moderate the results and which needs to be carefully described in order for those reading the results to relate it to their own (and others’) setting.
The setting expands on information provided in the ‘context’ section of the study but with a focus on where the study will be undertaken and the relevant issues in that area. For example, is it primarily a rural or urban setting? Is the study being undertaken in a poor or a rich neighbourhood? Is the population young or old? Is the study being done in a residential care facility (such as a prison or hospital) or at primary health care level? What is the nature of the health system in the locality?
The setting should include a description of standards of care in place locally. While international standards of care have been established for many conditions (and particularly for tuberculosis), local adaptations of these standards have often been made that need to be described in order for those reading the findings to relate them to their own settings. This may include details for the following questions:
• How are TB cases detected?’• How are TB cases followed up and treated?
28 CHAPTER 5
• How is the outcome of TB treatment evaluated?• What is the ‘path to care’ normally taken by someone seeking care? (For example, when a person develops symptoms of TB, where does the person go to seek care in the first instance? How many ‘steps’ does the person go through before a diagnosis is made?) • What happens to the person once identified as a TB case? • How is the treatment given and monitored? • Who is responsible for each of these steps in the care of the patient?
By reading this section, someone outside the situation (in another country, in another service) should be able to understand the study setting and how it is similar or differs from their own setting.
To illustrate this point, consider the difference between a study conducted in a rich country with a low burden of HIV infection and one in a poor country with a lot of HIV. Would the two studies (even if they addressed the same question) give exactly the same answer when it comes to the characteristics and quality of health services?
Consider another example: Would the results of a study in a setting where most health care services are in the public sector and there are few private providers differ from one in which half of the patients obtain their care through the private sector? Would the results from the initial TB treatment default study differ in a setting where all facilities offered both TB diagnostic and treatment services to one in which different facilities offered diagnostic and treatment services? These examples illustrate why it is important to describe the study setting.
5.2 Study design
Scientific research on health-related matters usually follows one of a limited number of ‘study designs’. These have been developed for hypothesis testing primarily in epidemiological research but are equally relevant for operational research.
29STUDY METHODS
The study design provides a framework for carrying out the research in a systematic way to address the two essential elements of the hypothesis – the key determinant and the outcome. This emphasises once more the importance and usefulness of the two-by-two table at the core of the research question and hypothesis.
There are three standard types of study design: the cohort, the case control and the cross-sectional design. There can be a great deal of confusion and discussion around which design each study proposal may have, even among highly qualified experts. For the purposes of this exercise in proposal development, it is not really necessary to go into great detail and discussion about this matter but rather to describe exactly what the procedures will be in carrying out the study and then to choose one of the three designs to indicate how the study was carried out. This can be done relatively simply, even though the theory behind study design may be complex and controversial. These complexities and controversies are outside the scope of this text and will be left to experts to debate.
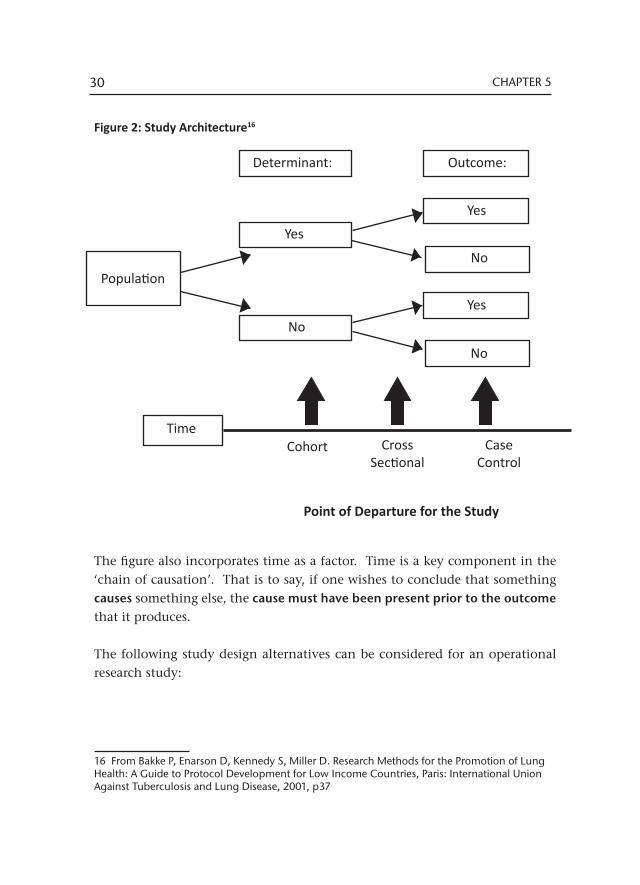
The first step in determining the study design can be made simply from the two-by-two table. The ‘architecture’ of the study (Figure 2) includes a ‘population’ that is being studied from which the individual units can be classified by the presence or absence of the key determinant and of the outcome of interest.
The figure illustrates the population, the key determinant and the outcome of interest. On the right side of the figure is the final classification of the population into the four categories found in the two-by-two table:
• Those with the determinant and the outcome of interest (a); • Those with the determinant and without the outcome (b); • Those without the determinant and with the outcome (c); • Those without the determinant and without the outcome (d).
30 CHAPTER 5
Figure 2: Study Architecture16
The figure also incorporates time as a factor. Time is a key component in the ‘chain of causation’. That is to say, if one wishes to conclude that something causes something else, the cause must have been present prior to the outcome that it produces.
The following study design alternatives can be considered for an operational research study:
16 From Bakke P, Enarson D, Kennedy S, Miller D. Research Methods for the Promotion of Lung Health: A Guide to Protocol Development for Low Income Countries, Paris: International Union Against Tuberculosis and Lung Disease, 2001, p37
Determinant: Outcome:
Population
Yes
Yes
No
No
Yes
No
TimeCohort Cross
SectionalCase
Control
Point of Departure for the Study
31STUDY METHODS
I Intervention studies
These purposely introduce measures to improve the services (for example, to improve the completeness of sputum smear examination recording in the sputum register). In this approach, specific facilities are selected from among all the facilities where measures to improve the services will be introduced and compared to facilities where measures will not be introduced. This is the strongest type of study in providing evidence not only of the cause of the problem but also how to solve it.
A step-wise change in policy and / or practice provides an opportunity for a stepped-wedge design intervention study that allows a comparison of the outcomes in facilities before and after the intervention and in those facilities with and without the intervention at a given point in time. In order to carry this out scientifically, it is necessary to assign the time for introducing the intervention in a random order and to include a sufficient number of facilities (a minimum of eleven) and period of time.
II Cohort study design
The population (e.g. facilities) are classified according to the presence of the key determinant in the study (for example, prolonged smear turnaround time or not) and then clinic records are searched to classify the facility according to whether or not they have the outcome (in this example, a high rate of initial TB treatment default).
III Case control study design
The population (e.g. facilities) are classified according to whether or not they have the outcome of the study (a high rate of initial TB treatment default) and then clinic records are searched in order to classify the facility according to whether or not it has the determinant (prolonged smear turnaround time).
IV Cross-sectional study design
The population (e.g. facilities) are classified simultaneously at a given point in time according to the determinant and the outcome. In this instance one
32 CHAPTER 5
cannot determine whether or not the determinant was present in the facility prior to the appearance of the outcome; one simply assesses at that point in time whether or not the determinant and the outcome are present for a facility.
Example:
In the example used, the research hypothesis states that ‘Prolonged smear turnaround time in facilities is associated with a high rate of initial TB treatment default’
In this statement, one could infer that the high rate of initial TB treatment default is present because the services are not efficiently managing diagnostic sputum smear examination. In other words, the cause of the high rate of initial TB treatment default is the inefficiency of the services in managing diagnostic sputum smear examination.
For this to be the true cause, the prolonged smear turnaround time must have happened before the high rate of initial TB treatment default: inefficiency leads to initial TB treatment default. This cannot be determined by a cross-sectional study because we simply know that the determinant and outcome are present or absent at one point in time and cannot know whether or not the determinant preceded the outcome.
The chosen study design from among the three types of design is determined by how the selection was made of the facilities to study. • Selecting facilities according to the key determinant first (low and high
smear turnaround time) and then following up to determine the presence of low or high rates of initial TB treatment default is a cohort study design
• Selecting facilities according to the outcome (groups with high and low rates of initial TB treatment default) and then finding out the information on whether the facilities have high or low rates of the determinant, prolonged turnaround time is a case control study design
• Measuring both the current smear turnaround time and the current initial TB treatment default and classifying facilities according to high or low turnaround time and initial TB treatment default is a cross-sectional study design.
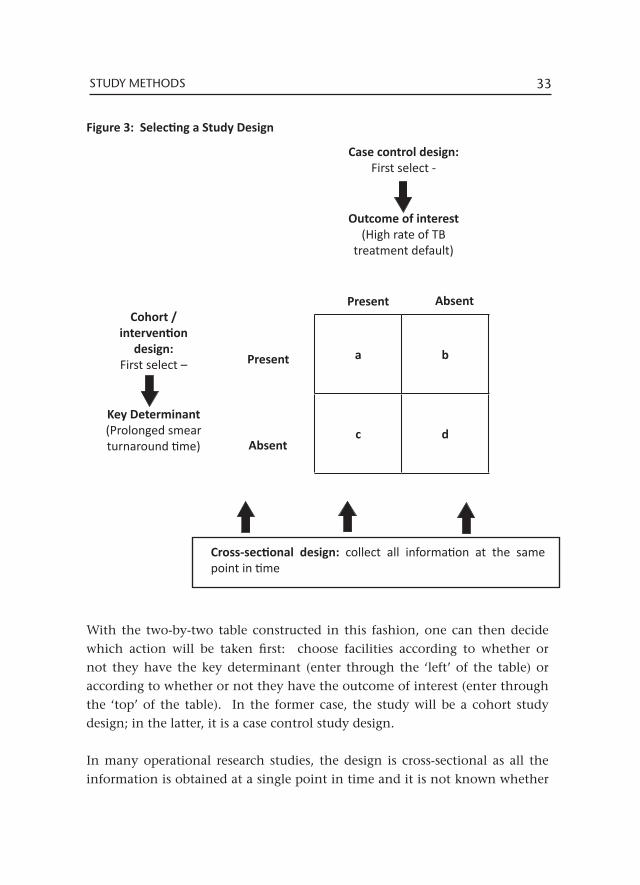
The process of deciding which study design is used in a study can be simplified by reference to the two-by-two table constructed, as shown in Figure 3 below.
33STUDY METHODS
Figure 3: Selecting a Study Design
With the two-by-two table constructed in this fashion, one can then decide which action will be taken first: choose facilities according to whether or not they have the key determinant (enter through the ‘left’ of the table) or according to whether or not they have the outcome of interest (enter through the ‘top’ of the table). In the former case, the study will be a cohort study design; in the latter, it is a case control study design.
In many operational research studies, the design is cross-sectional as all the information is obtained at a single point in time and it is not known whether
Case control design:First select -
Outcome of interest(High rate of TB
treatment default)
Cohort / intervention
design:First select –
Key Determinant(Prolonged smear turnaround time)
Cross-sectional design: collect all information at the same point in time
a b
c d
Present
Present
Absent
Absent
34 CHAPTER 5
the determinant predated the outcome.
The cross-sectional design has a number of advantages. It is often very efficient in that the information is gathered from a single visit to a facility which makes the study efficient. The design uses existing information within the service that may reflect more accurately the actual function of the service, without the effect on routine practice of knowing that a research study is being carried out. It has certain disadvantages. In this type of study, the sequence of events will not be possible to determine. In addition, it is possible to study only the information that is already present in the records from which you obtain the information.
Example:
In another example, the research hypothesis states: ‘A poor score on the infection control assessment at facilities is associated with a high rate of tuberculosis among facility staff.’
In this study, a facility is visited, an assessment of infection control undertaken and the facility classified as to whether or not it has a poor score in infection control. At the same time, HR records are reviewed to determine the proportion of the staff working in the clinic that have developed tuberculosis at some time in the past and classify the facility as to whether or not it has a high rate of tuberculosis among the staff.
Because both determinant and outcome were determined at a single point in time, one is not able to say whether or not the facility had the poor infection control before it had the high rate of tuberculosis amongst staff.
The intervention design provides the most powerful new knowledge. If the stepped-wedge approach is used, it can be undertaken in parallel with the scaling up of a new policy. A disadvantage of this design is that it is more expensive and requires sufficient expertise to ensure that it is done correctly. It is, however, the preferred design for evaluating any intervention. In the ‘initial TB treatment default’ study for example, strengthening capacity through training on the correct completion of the sputum register to reduce initial TB treatment default is a possible intervention study.
The cohort design has a number of advantages. In this design, the sequence of events can be accurately determined and incidence can then be calculated. A number of determinants can be studied simultaneously allowing an evaluation
35STUDY METHODS
of complex environments (such as health services) in which a number of factors may lead to a certain outcome. This design also has some disadvantages. Very often, a large population must be studied. This is particularly the case when the outcome is uncommon. Such studies often require a prolonged time scale to carry out and consequently are expensive. Because of the prolonged time scale, there may be losses of participants within the study (for example, if followed up prospectively, some facilities may be merged or closed). This design is very infrequently used in operational research.
The case control design has certain advantages. It is usually much cheaper and easier to undertake than the cohort design. It is often relatively easy to identify the presence or absence of the outcome of interest and to take a representative sample of those with and without the outcome. This is the only practical study design to use for studying rare events. This design also has disadvantages. It cannot study the sequences of events and therefore cannot conclude whether or not a determinant is a cause. For this reason, it cannot determine incidence. If the methods of assessing an outcome of interest are not standardized, this can present difficulties in carrying out the study. This design may call on participants to recall events or conditions in the past which may be associated with bias. Finally, great care must be taken to ensure that the cases and controls are drawn from the same source. If they are not, the conclusions drawn may lead to a bias.
Example:
In the example of a study of facilities with high rates of initial TB treatment default and smear turn around times (TAT), study design options are as follows:
I Cross-sectional study design
Information is gathered at a single point in time. Each of the facilities is classified by smear TAT (key determinant), either high or low and by the rate of initial TB treatment default (the outcome) either high or low. The four categories are compared.
II Cohort study design
Facilities are selected according to whether they have high or low smear TAT (the key determinant). Laboratory records are gathered for these facilities to identify all sputum smear positive results for TB suspects and compare them to the treatment registers to see if they have a high proportion of cases that are missing from the treatment register
36 CHAPTER 5
(initial TB treatment default – the outcome) and identify those with high and initial TB treatment default. Outcomes are compared in those with high and low smear TAT.
III Case control study design
Facilities are selected according to whether they have high or low initial TB treatment default (the outcome). Information is gathered on smear turnaround time and facilities classified according to whether or not they have high TAT. TAT is compared between those with and without high rates of initial TB treatment default.
5.3 Target and Study Population
A population, for epidemiological research, is defined as ‘all the inhabitants of a given area considered together’. In this definition, ‘inhabitants’ are the ‘units of observation’ in scientific terms.
Unlike epidemiological research where the units of observation are individual people who are either residents or patients, in operational research, the units of observation are often units of the health service (usually health facilities). It is the ‘sick’ (poorly-functioning) health facility that is being studied rather than the ‘sick’ individual. So, for operational research, the definition of population can be ‘all facilities of a given area considered together’.
The population, as previously noted, consists of facilities to be studied that are with and without the adverse outcome (high initial TB treatment default) and with and without the key determinant (prolonged smear turnaround time), thus fitting into the two-by-two table previously encountered.
The research question aims to discover ‘truth in the universe’; within the study, one is only able to uncover ‘truth in the study’. If the study is conducted carefully and with due attention to scientific principles, the ‘truth in the study’ should reliably reflect ‘truth in the universe’. This enables one to not only discover the new knowledge required to take action to improve the functioning of the local health services, but new knowledge that will be sufficiently reliable to provide a basis for decision-making by others in various locations in addressing similar problems in their health services. In this way, the study can lead to an improvement in practice in local facilities and together with other studies
37STUDY METHODS
in similar locations, can be brought together to improve policy (for the whole province, country or at the global level). To do this, however, one must follow through the study by publishing it in the scientific literature so that it will be available to others for their decision-making, especially to influence policy.
As one moves from ‘truth in the universe’ to ‘truth in the study’, one goes through three steps:
• Start by defining the target population, which in operational research is usually (all) health services / facilities providing a particular type of care. In tuberculosis, this will include all facilities providing care for tuberculosis patients or clients needing investigation of or prevention for tuberculosis, irrespective of the type or location of facility. The results of the study will have relevance to this population.
• In order to carry out the study, one must then define an accessible population. It is impossible to study all health facilities in the universe so those that are accessible (for example, in a country or province or district or, in the public health sector) are chosen for the study. They should be broadly representative of the target population and are defined by the geographical location where the study is to be undertaken and the time period selected for the study. In tuberculosis services, this might refer to ‘all public primary health care facilities in the Cape Town health district from 1 January to 31 December 2012’. Once the inclusion criteria have been defined, consider whether any of the facilities in the defined group will be excluded. For example, will facilities that are not TB reporting units be excluded? Carefully consider the rationale for the exclusion criteria and whether exclusion introduces bias into the study.
• Finally, identify the study population. This is the sample of the accessible population that is actually enrolled in the study. This sample must, as much as possible, be representative of the accessible population and, for this reason, a standard sampling strategy needs to be defined and used to ensure that this is the case. A sample is selected that is feasible to study, of sufficient size to answer the question but not so large as to be costly and more difficult than necessary to carry out the study. Practical constraints may result in
38 CHAPTER 5
additional exclusion criteria being applied. For example, facilities that have a small burden of TB or those with specific constraints (for example, too many other research studies being undertaken!) may be excluded and the impact of this needs to be considered.
In defining populations, great care must be taken to carefully identify the target population, taking into account the action contemplated and the location where the action needs to be undertaken to fix the problem being studied. If the aim is to improve health services for the poor and vulnerable (as is usually the case when studying tuberculosis), the ‘population’ usually consists of those services where the poor and vulnerable seek care. In many locations, these are the public health services (as opposed to the private health services). This naturally varies by location so the choice of target population must be made taking into account the local situation.
In moving from the target population to the accessible population to the study population, one needs to ensure, as far as possible, that the study population is representative of the target population. What does this mean?
Example:
In the ‘initial TB treatment default’ example, the target population could be all health facilities that provide case management for tuberculosis. Because tuberculosis is ‘multi-faceted’ and can affect any age group or any part of the body, tuberculosis patients may seek care at any level of the health service (public or private, primary or referral). What is of particular importance is whether the likelihood is the same or different that any given patient will seek care at one or the other type of service.
The accessible population in a particular study is usually all public health facilities because these are the services where most patients with TB seek care and also in which most of us work. With regard to tuberculosis, consider how moving from the target to the accessible population changes the population we are studying. For example, are patients who seek care at public and private services the same? Do they differ between primary health services and hospitals? In what way do they differ and is this difference important in terms of what the study finds? If facilities that provide both TB diagnostic and treatment services are selected, how will these differ from the total group of facilities some of which provide only TB diagnostic services?
The study population will be a sample of facilities identified in the accessible population. Assume that one selects only the facilities with the highest patient load in order to complete the study more efficiently. In what way will these facilities differ
39STUDY METHODS
from those with a lower workload in terms of the quality of the service they provide (related to the determinant) and in terms of the quality of the outcome they achieve?
How will this affect the study conclusions?
It is very important to understand how the situation changes as one moves from the target to the accessible and finally to the study population. Reflect on the issues described in the sections on ‘context’ and ‘study setting’ and consider how these change: Is the structure of the health system similar? Are the resources available in facilities similar? Is the distribution of services similar? Is the nature of services similar? Is the burden of disease similar? Is the type of clientele served by the systems similar? Are the care-seeking pathways similar?
This highlights the importance of describing all that is relevant and known about the health facilities and services in the description of the ‘study setting’. Where important information is not already available, (such as the care-seeking pathway), every effort should be made to collect this within the study itself. The ability to approach ‘truth in the universe’ from ‘truth in the study’ is highly dependent on ensuring that these population groups are truly comparable and on specifying in as much detail as possible how they might differ. The closer the characteristics of the accessible population are to those of the study population, the more likely it is that ‘truth in the study’ might reflect ‘truth in the universe’. Occasionally, it is possible to study the entire accessible population (for example, when there is a national database containing the information one wishes to use for the study). However, even when this is the case, it is usual that the information is available or standardized only for a limited period of time. Occasionally it is available for only a part of the population (for example, certain provinces), or is incomplete (for example some vulnerable groups such as prisoners or migrants are not included). In most cases it is best (for the sake of efficiency) and may be necessary (in order to ensure the quality of the information) to select a sample from the accessible population and this becomes the study population.
40 CHAPTER 5
5.4 Sampling
The study population is constructed by drawing a sample from a list of all possible study participants (the target population, in this case, facilities). The original list is referred to as the sampling frame. Ordinarily, this will be drawn from an official register of facilities in a government office, from a list of licensed facilities in a regulatory office or may have to be created from a ‘census’ that is created by the researchers (a process of counting all the facilities in a defined area). In the study proposal, it is essential to describe the sampling frame in detail and to describe which facilities were included and how the facilities are selected to participate in the study.
The selection of a sample should be done in such a way to maximize the possibility that it is truly representative of (is similar in every possible way to) the accessible population. To do this, it is necessary to ensure that every possible study subject (facility) on the list has an equal opportunity to be selected from the list as part of the study population. This is usually done by a random selection process, in which the subjects on the list are numbered and a set of random numbers obtained (drawn from a hat, taken from a list of random numbers). The facilities corresponding to the random numbers then become the study population. Other possibilities for maximizing representativeness include systematic sampling and cluster sampling.
In systematic sampling, the population units are listed and every kth unit on the list selected. The sampling interval (k) is determined by dividing the total population by the sample size. Bias can be avoided by randomly choosing the point at which to start sampling, working to the bottom of the list and then continuing again from the top of the list. Although much simpler to do, systematic sampling can obscure hidden traits in the study population.
Cluster sampling can be used when a list of the population is not available, for example, a list of all the health facilities in the country is not available. Districts may be randomly selected and lists of facilities generated from which a random sample is selected for those districts. It can also be used when naturally occurring homogenous groups exist in the population, for example different geographic areas or different districts. Each of the selected areas will be used
41INTRODUCTION TO THE RESEARCH TOPIC
as a sampling unit from which the study population will be randomly selected.
5.5 Sample size and power
As it is rarely possible to include the entire target population in a study, a representative sample of the population is included. Sample size refers to the number of research participants (facilities, individuals) that will be included. Determining the correct sample size is an important step in study design as the sample has to be large enough to ensure that statistically valid conclusions can be drawn.
Where the sample size is too small, the results may be inconclusive (the observed difference between the study groups is too small to conclude that it is statistically significant) or imprecise (the confidence limits are too wide). The time, effort and resources put into the study will have been wasted. Wastage may similarly occur if a larger than required sample size is used.
If a study group is homogenous (participants are similar to each other) and the difference in effect between the study groups is large, a smaller sample size is required. If there is substantial variation within a study group or the difference in effect between the groups is small, a larger sample size is required.
The following factors help to determine the sample size required to test a hypothesis:
1. The study design2. The level of significance required3. The power required 4. The anticipated outcomes in the groups5. The magnitude of the difference to be detected.
By convention, most studies set the level of significance (α) at 5%. This is the probability of incorrectly rejecting the ‘null’ hypothesis (statement of no association) i.e. there is a 5% probability of rejecting the statement ‘there is no difference between the study groups’ when there is in fact no difference.
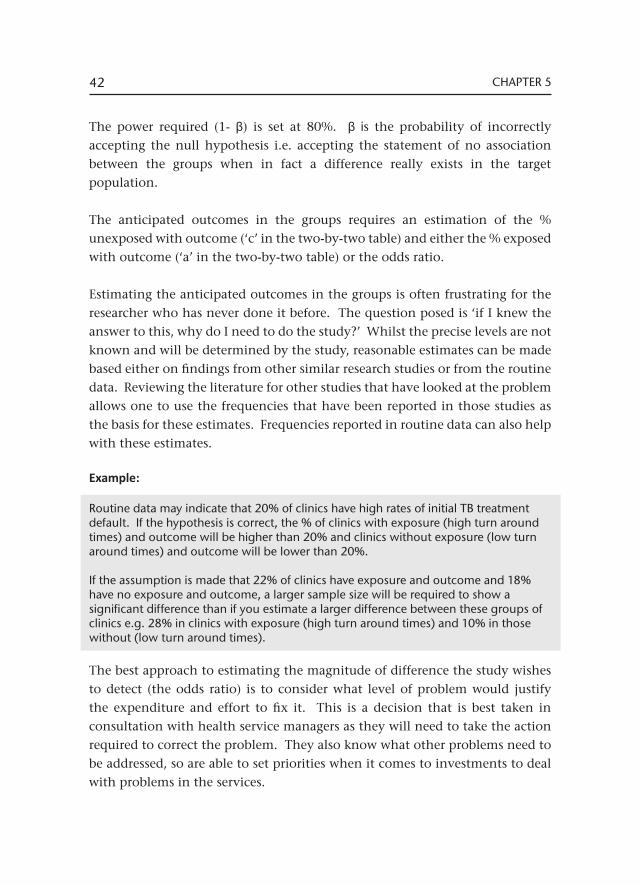
42 CHAPTER 5
The power required (1- β) is set at 80%. β is the probability of incorrectly accepting the null hypothesis i.e. accepting the statement of no association between the groups when in fact a difference really exists in the target population.
The anticipated outcomes in the groups requires an estimation of the % unexposed with outcome (‘c’ in the two-by-two table) and either the % exposed with outcome (‘a’ in the two-by-two table) or the odds ratio.
Estimating the anticipated outcomes in the groups is often frustrating for the researcher who has never done it before. The question posed is ‘if I knew the answer to this, why do I need to do the study?’ Whilst the precise levels are not known and will be determined by the study, reasonable estimates can be made based either on findings from other similar research studies or from the routine data. Reviewing the literature for other studies that have looked at the problem allows one to use the frequencies that have been reported in those studies as the basis for these estimates. Frequencies reported in routine data can also help with these estimates.
Example:
Routine data may indicate that 20% of clinics have high rates of initial TB treatment default. If the hypothesis is correct, the % of clinics with exposure (high turn around times) and outcome will be higher than 20% and clinics without exposure (low turn around times) and outcome will be lower than 20%.
If the assumption is made that 22% of clinics have exposure and outcome and 18% have no exposure and outcome, a larger sample size will be required to show a significant difference than if you estimate a larger difference between these groups of clinics e.g. 28% in clinics with exposure (high turn around times) and 10% in those without (low turn around times).
The best approach to estimating the magnitude of difference the study wishes to detect (the odds ratio) is to consider what level of problem would justify the expenditure and effort to fix it. This is a decision that is best taken in consultation with health service managers as they will need to take the action required to correct the problem. They also know what other problems need to be addressed, so are able to set priorities when it comes to investments to deal with problems in the services.
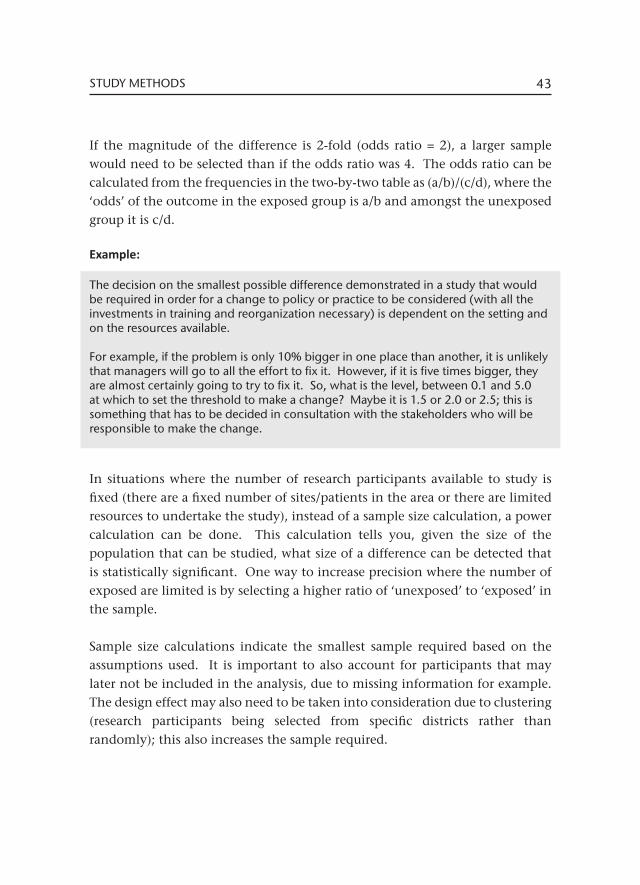
43STUDY METHODS
If the magnitude of the difference is 2-fold (odds ratio = 2), a larger sample would need to be selected than if the odds ratio was 4. The odds ratio can be calculated from the frequencies in the two-by-two table as (a/b)/(c/d), where the ‘odds’ of the outcome in the exposed group is a/b and amongst the unexposed group it is c/d.
Example:
The decision on the smallest possible difference demonstrated in a study that would be required in order for a change to policy or practice to be considered (with all the investments in training and reorganization necessary) is dependent on the setting and on the resources available.
For example, if the problem is only 10% bigger in one place than another, it is unlikely that managers will go to all the effort to fix it. However, if it is five times bigger, they are almost certainly going to try to fix it. So, what is the level, between 0.1 and 5.0 at which to set the threshold to make a change? Maybe it is 1.5 or 2.0 or 2.5; this is something that has to be decided in consultation with the stakeholders who will be responsible to make the change.
In situations where the number of research participants available to study is fixed (there are a fixed number of sites/patients in the area or there are limited resources to undertake the study), instead of a sample size calculation, a power calculation can be done. This calculation tells you, given the size of the population that can be studied, what size of a difference can be detected that is statistically significant. One way to increase precision where the number of exposed are limited is by selecting a higher ratio of ‘unexposed’ to ‘exposed’ in the sample.
Sample size calculations indicate the smallest sample required based on the assumptions used. It is important to also account for participants that may later not be included in the analysis, due to missing information for example. The design effect may also need to be taken into consideration due to clustering (research participants being selected from specific districts rather than randomly); this also increases the sample required.
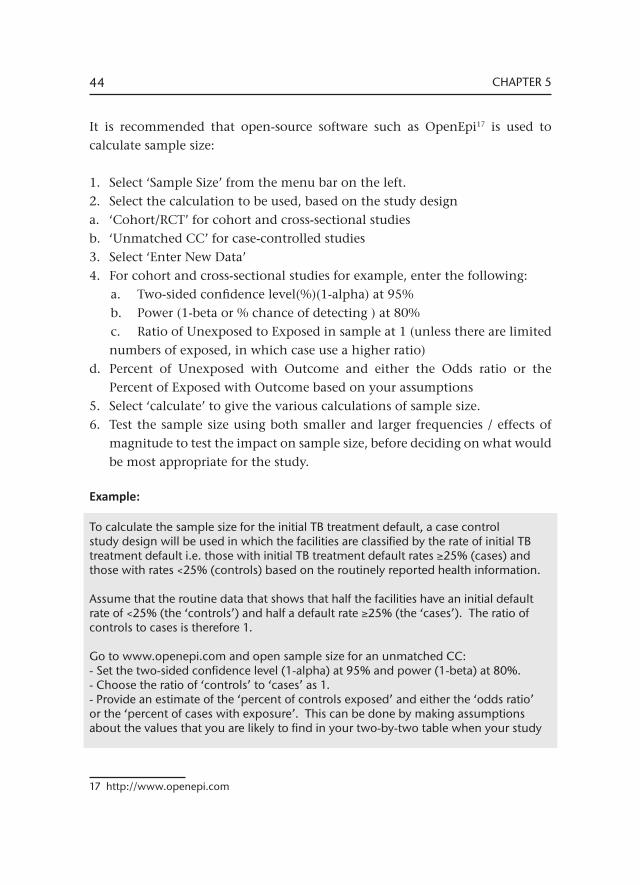
44 CHAPTER 5
It is recommended that open-source software such as OpenEpi17 is used to calculate sample size:
1. Select ‘Sample Size’ from the menu bar on the left. 2. Select the calculation to be used, based on the study design a. ‘Cohort/RCT’ for cohort and cross-sectional studiesb. ‘Unmatched CC’ for case-controlled studies3. Select ‘Enter New Data’4. For cohort and cross-sectional studies for example, enter the following:
a. Two-sided confidence level(%)(1-alpha) at 95% b. Power (1-beta or % chance of detecting ) at 80%c. Ratio of Unexposed to Exposed in sample at 1 (unless there are limited numbers of exposed, in which case use a higher ratio)
d. Percent of Unexposed with Outcome and either the Odds ratio or the Percent of Exposed with Outcome based on your assumptions
5. Select ‘calculate’ to give the various calculations of sample size.6. Test the sample size using both smaller and larger frequencies / effects of
magnitude to test the impact on sample size, before deciding on what would be most appropriate for the study.
Example:
To calculate the sample size for the initial TB treatment default, a case control study design will be used in which the facilities are classified by the rate of initial TB treatment default i.e. those with initial TB treatment default rates ≥25% (cases) and those with rates <25% (controls) based on the routinely reported health information.
Assume that the routine data that shows that half the facilities have an initial default rate of <25% (the ‘controls’) and half a default rate ≥25% (the ‘cases’). The ratio of controls to cases is therefore 1.
Go to www.openepi.com and open sample size for an unmatched CC:- Set the two-sided confidence level (1-alpha) at 95% and power (1-beta) at 80%.- Choose the ratio of ‘controls’ to ‘cases’ as 1.- Provide an estimate of the ‘percent of controls exposed’ and either the ‘odds ratio’ or the ‘percent of cases with exposure’. This can be done by making assumptions about the values that you are likely to find in your two-by-two table when your study
17 http://www.openepi.com
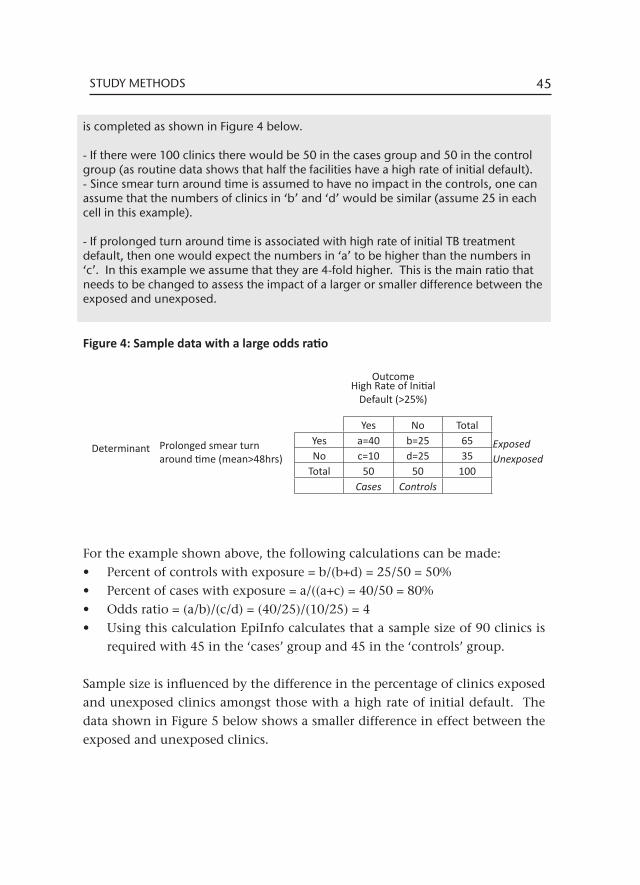
45STUDY METHODS
is completed as shown in Figure 4 below.
- If there were 100 clinics there would be 50 in the cases group and 50 in the control group (as routine data shows that half the facilities have a high rate of initial default). - Since smear turn around time is assumed to have no impact in the controls, one can assume that the numbers of clinics in ‘b’ and ‘d’ would be similar (assume 25 in each cell in this example).
- If prolonged turn around time is associated with high rate of initial TB treatment default, then one would expect the numbers in ‘a’ to be higher than the numbers in ‘c’. In this example we assume that they are 4-fold higher. This is the main ratio that needs to be changed to assess the impact of a larger or smaller difference between the exposed and unexposed.
Figure 4: Sample data with a large odds ratio
For the example shown above, the following calculations can be made:• Percent of controls with exposure = b/(b+d) = 25/50 = 50%• Percent of cases with exposure = a/((a+c) = 40/50 = 80%• Odds ratio = (a/b)/(c/d) = (40/25)/(10/25) = 4• Using this calculation EpiInfo calculates that a sample size of 90 clinics is
required with 45 in the ‘cases’ group and 45 in the ‘controls’ group.
Sample size is influenced by the difference in the percentage of clinics exposed and unexposed clinics amongst those with a high rate of initial default. The data shown in Figure 5 below shows a smaller difference in effect between the exposed and unexposed clinics.
OutcomeHigh Rate of Initial
Default (>25%)
Yes No Total
Determinant Prolonged smear turn around time (mean>48hrs)
Yes a=40 b=25 65 ExposedNo c=10 d=25 35 Unexposed
Total 50 50 100Cases Controls
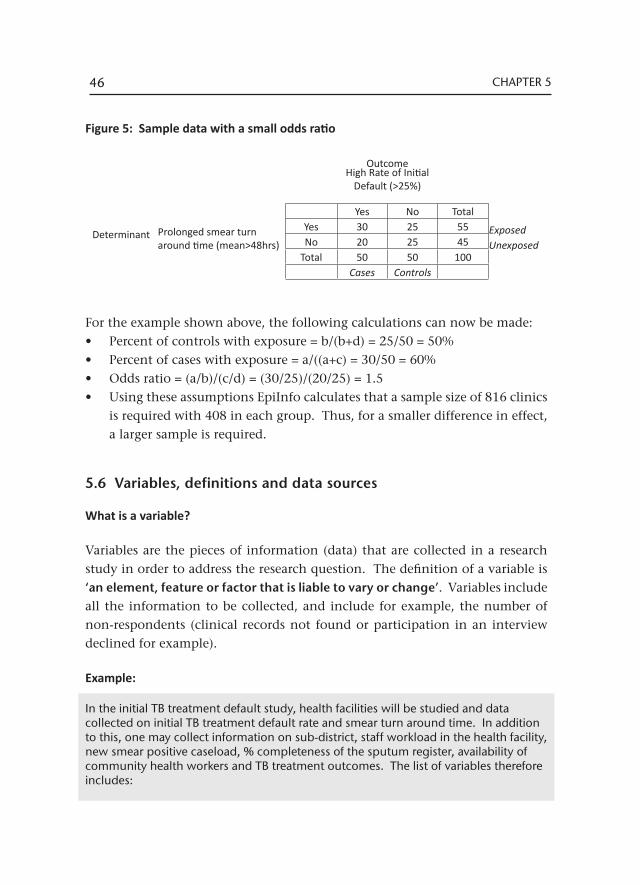
46 CHAPTER 5
Figure 5: Sample data with a small odds ratio
For the example shown above, the following calculations can now be made:• Percent of controls with exposure = b/(b+d) = 25/50 = 50%• Percent of cases with exposure = a/((a+c) = 30/50 = 60%• Odds ratio = (a/b)/(c/d) = (30/25)/(20/25) = 1.5• Using these assumptions EpiInfo calculates that a sample size of 816 clinics
is required with 408 in each group. Thus, for a smaller difference in effect, a larger sample is required.
5.6 Variables, definitions and data sources
What is a variable?
Variables are the pieces of information (data) that are collected in a research study in order to address the research question. The definition of a variable is ‘an element, feature or factor that is liable to vary or change’. Variables include all the information to be collected, and include for example, the number of non-respondents (clinical records not found or participation in an interview declined for example).
Example:
In the initial TB treatment default study, health facilities will be studied and data collected on initial TB treatment default rate and smear turn around time. In addition to this, one may collect information on sub-district, staff workload in the health facility, new smear positive caseload, % completeness of the sputum register, availability of community health workers and TB treatment outcomes. The list of variables therefore includes:
OutcomeHigh Rate of Initial
Default (>25%)
Yes No Total
Determinant Prolonged smear turn around time (mean>48hrs)
Yes 30 25 55 ExposedNo 20 25 45 Unexposed
Total 50 50 100Cases Controls
47STUDY METHODS
• Sub-district name• Health facility name• Initial TB default rate • Smear turn around time • Staff workload• New smear positive caseload• % completeness of the sputum register• Availability of community health workers• New smear positive treatment outcomes• Retreatment smear positive treatment outcomes
What types of variables are there?
Data variables can be classified as either categorical (qualitative) or numerical (quantitative). Categorical variables are descriptive in nature whereas numerical variables are measurements, where the numbers have some inherent meaning.
1) Categorical / Qualitative data variablea) Nominal: These are named categories where one category is no worse than
the next. For example sex is either male or female; facility type is either a clinic or a community health centre; TB cases are categorised as new or retreatment after relapse, failure, default or other.
b) Ordinal: These variables are ordered, with gradation over the category. For example, HIV disease staging as W.H.O. Stage 1, 2, 3 or 4; gradation of sputum smear severity as scanty, 1+, 2+ or 3+.
2) Numerical / Quantitative data variables a) Discrete variables: The data can only take on certain whole numbers.
The values of such variables do not overlap in any way. For example, the number of sputum samples submitted (1,2,3 etc); the number of visits to the health facility (1,2,3,4,5,6 etc). A patient cannot have had 1.5 sputum samples submitted or 3.3 visits to the clinic.
b) Continuous variables: The data may have a value anywhere along a continuum. For example, height may be measured in centimetres. The true height, if it could be measured, would be in centimetres with multiple decimal points and never finally arrive at the exact height. The point is illustrated similarly with age. The age could be said to be 52 years but is truly 52.546348….. And by the time this number is written, the age has
48 CHAPTER 5
already moved on several decimal points. For this reason, continuous variables are ‘rounded’ to a specified level.
It is important to indicate the type of variable because the statistical analysis differs based on the type of variable. This is discussed further in the section on data analysis.
It is recommended to always collect variables at the highest level of detail possible. For example rather use either the date of birth or age at a particular point (when test was done or when treatment was started for example) than using age brackets (eg 0-15 years, 16-20 years, 21-30 years… etc),. The data can be collapsed into categories for analysis at a later stage if required.
Defining variables
Although it might seem obvious that the name of the variable is, in fact, its definition, this is not the case. Take, for example, the simple term ‘tuberculosis case’. What is its precise meaning in the context of the study? It might refer to any of the following patients:
• Those treated with a course of TB medication for the disease • Those who have been bacteriologically confirmed with the disease • Those who are sputum smear positive • Those reported as having died of the disease.
Each of these definitions can be found in one or other scientific publication and each is technically acceptable. However, they have quite different connotations. For example, if the study includes only bacteriologically confirmed patients, it will, by and large, exclude small children. If the study includes only sputum smear positive patients, it will exclude all those with extra-pulmonary disease and those with sputum smear negative pulmonary tuberculosis. In the South African context, this may therefore exclude a large number of patients living with HIV. If it includes all patients given more than one medication for treatment of the disease, it will exclude all those diagnosed but never treated (‘initial TB treatment default’) and include a certain number of patients with other serious conditions affecting the lung but who are incorrectly treated for
49STUDY METHODS
tuberculosis (which is more frequent in patients living with HIV).
The precise definition of the terms used in scientific research is crucial to the quality of the research being undertaken. Each of the listed variables must be defined precisely to enable others to understand the terms used in the study and to replicate the study if they so desire.
The South African National TB Programme (SA NTP) uses well-established definitions, many of which are internationally accepted. Definitions exist for bacteriological coverage, patient category, disease classification, case holding and treatment outcomes amongst others. These definitions can be found in publications on the subject and in policy and programme documents. It is an advantage to use local definitions in the study where possible, for ease of understanding when disseminating your findings.
There will be instances where a well established variable will need to be defined specifically for the research study. For example, the SA NTP defines a child as being in the in the 0-7 year age group. The World Health Organisation TB report by comparison defines a child as being in the 0-14 year age group. For the purpose of a study evaluating HIV testing, a study may define a child as <12 years (the age of medical consent).
In instances where a study develops study specific variables, for example ‘favourable’ and ‘unfavourable’ TB treatment outcomes these need to be carefully defined. Whilst ‘treatment cure’ and ‘completion’ are readily understood as ‘favourable’ and ‘died’, ‘treatment, interrupted’ and ‘failed’ as ‘unfavourable’, where does ‘transfer out’ belong? Unless specified, it would be unclear how this group have been dealt with.
Example:
In the initial TB treatment default study, the key outcome and determinant variables may be defined in different ways. The ‘high initial TB default rate’ variable may be defined based on a value considered appropriate to the services. If the mean initial TB treatment default rate is known (for example it is 20%), a value for the high rate can be selected as something above this (for example 25 or 30%).
50 CHAPTER 5
The smear turn around time (TAT) variable may be defined as:• The mean smear TAT, with a mean >48 hour defined as a ‘prolonged TAT’ • The % smears with a TAT >48 hours and defined as ‘prolonged TAT if >20% of
samples had a TAT >48 hours’.
What data sources are used?
Most data used in operational research has already been captured in routine health records. Routine records for TB include, amongst others the following:• Case Identification and Follow Up Register• Tuberculosis Clinic Card (a structured clinical record)• Paper-based Tuberculosis Register (at facility level)• Electronic TB register (ETR.net) (at sub or district level)• Laboratory request forms• Laboratory results sheets• Electronic laboratory records.
For each variable, it is important to specify the data source that the variable was collected from. A missing sputum result in a clinical folder for example, has different connotations to a missing result in the laboratory database.
Operational research sometimes uses the same variable from two or more different sources for quality assurance purposes and to validate results, stressing the importance once more, of specifying the data source used. For example, the treatment outcome may be collected from the clinic card, paper TB register and the electronic TB register. When analysing the data, consideration should be given to the data source.
Defining variable codes and range
All categorical / qualitative variables have a range of ‘categories’ possible for each. The possible categories for TB treatment outcome for example include: cured, treatment completed, died, failed, treatment interrupted, transferred out or not evaluated. From a data collection perspective however, some data may not be recorded so ‘not recorded’ is also a possible category.
51STUDY METHODS
Information may be collected either as numbers or as text. It is standard practice to collect data from the source documents as text and to transform these into numbers for data capture.
Example:
For the ‘TB treatment outcome’ variable for example, the different categories would be coded as follows: 1 - cured2 - treatment completed3 - died4 - failed5 - treatment interrupted6 - transferred out7 - not evaluated-99 - not recorded (the same code can be used for all data not recorded in all variables for ease of data entry and analysis)
By convention the variable ‘sex’ is coded as:0 - male1 - female-99 - not recorded
Numerical / quantitative data is further described by defining the range of possible values, for example height as 1-220 cm.
The use of codes/numbers is preferable as it is less prone to data entry error than ‘typin’ (‘typing’) the text would be. The close proximity of the numeric keys on a personal computer also facilitates rapid data entry. This not only provides more efficient handling of data but also sets up the information in a way that can be easily managed for statistical analysis.
The following information is required to describe the attributes of each variable and will be used in compiling the data dictionary:• Variable name• Definition• Data source• Type of variable• Categories/Range
52 CHAPTER 5
• Coding
5.7 Measurement, error and bias
All measurement / data collection has a certain level of error. This error can be either random or systematic. The effect of random error is to obscure a real difference between the groups being compared. If the error is random and not large, the likelihood of finding a true difference between the groups increases with the size of the population studied.
Random error is intimately associated with, and the result of, actions taken during measurement. Random error can result from a number of factors:• Using inappropriate tools for measurement / data collection• Not standardizing the measurements / data collection• Inadequately training the research personnel undertaking the measurements
/ data collection• Not being systematic in taking the measurements / collecting data • Not carefully monitoring the measurements / data collection
Systematic error, on the other hand, can lead to bias. This will result in finding a difference between groups when one does not actually exist. Bias is far and away the more serious problem and careful attention must be taken to minimize its possibility in scientific studies. Systematic error, which can lead to bias, is of several types: selection bias, information bias and confounding.
Selection bias may occur if an inappropriate population is being studied, there is inadequate participation of the eligible population, the classification of the determinant changes over the study period or the study population consists only of the most accessible groups or volunteers.
Example:
In the initial TB treatment default study, bias can be introduced by selecting only clinics in an urban area as these may have lower smear turn around times (TAT) than semi-urban or rural clinics. If only clinics with on-site diagnostic services are included, the smear TAT may be very different in these clinics to those in clinics submitting smears to a central laboratory.
53STUDY METHODS
A substantial number of cases may be excluded from the calculation of TB initial default rates if only clinics offering both diagnostic and treatment services are included as initial default rates are likely to be higher when patients have to be referred from a clinic providing diagnostic services to another providing treatment.
The selection of an appropriate population is very important in undertaking a study. If we wish to study a determinant, we must select a population that has a possibility of having the determinant.
The effects of participation in creating bias occur when participation in the study is selective in relation to the determinant and / or the outcome. This is why it is essential to report on the total eligible population and to determine what proportion of them actually participated in the study. If the proportion is very high (for example, over 80%), the possibility that bias may have occurred due to selective participation is much diminished.
Example:
In the initial TB treatment default study, participation bias could be introduced by using only the ‘Case Identification and Follow Up Register’ register as the data source as this may contain the data of patients who are managed more efficiently and will thus have lower smear TAT. The patients that are managed inefficiently may not even be reflected in this register.
If a questionnaire is used to determine secondary outcomes related to the inefficiency in handling smear results, participation bias may be created by less efficient facilities being more unwilling to complete the questionnaire.
The participation of an easily accessible or volunteer group can also lead to systematic error. Volunteers or easily accessible populations may have more or less of the problem being studied and may also have a different level of the determinant, as compared with the total eligible population.
A change or variation in definition of the outcome can also lead to bias. Consequently, it is vital that the definition be the same in all groups under study.
54 CHAPTER 5
Example:
In the initial TB treatment default study, one region may define initial default rates as the % of patients with a confirmed smear result who fail to commence treatment within 1 week of the test being taken; another region may define it as the % of patients with a confirmed laboratory diagnosis who fail to commence treatment within 1 month of the test being taken and a 3rd may define it as the % of patients with a confirmed laboratory diagnosis who fail to commence treatment within 1 month of the result being available.
Initial TB treatment default rates are likely to be higher in the group who measure the outcome earlier as all the patients who commence from weeks 2-4 will be considered as initial defaulters in these clinics. Facilities using ‘result available’ allow for a longer period for treatment commencement than those using ‘test taken’.
Bias is a very serious problem in scientific investigation and every effort must be made to minimize it. Specific care must be taken in the study design to ensure that: • The population to be studied is appropriate to the question; • Every effort is made to ensure a high participation rate; • Comparisons are always presented of those who did and did not participate
(for example, age, sex, residence).
Efforts to address bias may also be taken in analysis: • Any part of the population excluded from the numerator should also be
excluded from the denominator in calculating rates; • Analysis using ‘person time at risk’ may be used; • Estimates can be made of ‘worst’ and ‘best’ case scenarios.
Systematic error may also occur due to information bias. Information bias may result from subject variation, observer variation, deficiencies of the measurement tool or technical errors in measurement.
Subject variation occurs when the same facility has a different outcome from one point of observation to another. For example, the facility may have a marked change in staffing during different times of the year, with associated variation in completeness of examination and / or recording of sputum results. The facility may vary in terms of its efficiency with seasons of the year, if it serves an agricultural community or is subject to extremes of climate. The
55STUDY METHODS
facility might vary in efficiency if it is aware that it is being evaluated.
Example:
In the initial TB treatment default study, initial default rates may vary substantially in a facility at one period in time compared to another, due to: population displacement as a result of a large fire; patients returning to their families in the Eastern Cape during the Christmas holidays; during the rainy winter season compared to in summer.
The smear turn around time may be influenced by staff going on strike during a particular period. Facilities evaluated during the strike may have longer smear turn around times to those evaluated at other times.
Observer variation may also contribute to information bias. This variation may occur between several observers (inter-observer error) or in the same observer at different points in time (intra-observer error).
Example:
In the initial TB treatment default study, one field researcher may complete the questionnaire “Is a community health worker available to do a recall for patients who have not commenced TB treatment” as applicable on that day; another may answer it as applicable at any time in that facility. This is inter-observer error.
A field researcher measuring the efficiency with which sputum results are processed may find different results in the morning when facilities are extremely busy to in the afternoon when facilities are quieter and more time is allocated to administrative tasks. This is intra-observer error.
Technical errors of measurement may also lead to information bias. This is more typical of biological measurements but may also occur in operational research. Unless measurements are carefully standardized, conscientiously undertaken and systematically recorded, errors may occur.
Example:
In the initial TB treatment default study, one facility may have a system to record when results are received in the facility and use this date in calculating smear turn around time. Another facility may not have a process in place and use the date when results are processed and filed in clinical folders. A third facility may calculate the date based on when the result was available in the laboratory, failing to take into account the time taken for the result to reach the clinic.
56 CHAPTER 5
In order to minimize information bias, it is critically important to specify criteria and procedures in advance, to analyze according to the pre-set criteria (and not based on a post hoc classification); to reduce the number of observers, to monitor the performance of the observers and to use standardized tools for measurement.
A special kind of bias is due to confounding. A ‘confounder’ is a factor that is associated with both the determinant and the outcome and consequently leads to a false association between determinant and outcome.
For a factor to act as a confounder, it must be independently associated with both the determinant and the outcome. In investigating the possibility of confounding, it is important first of all to test for an association with each of the determinant and the outcome. If the factor meets the criteria for confounding, an analysis of the association between determinant and outcome needs to be undertaken, stratifying for the presence or absence of the confounder. If the association between determinant and outcome persists after stratification for the potential confounder, the association can be accepted and the possibility of confounding rejected.
Example:
In the initial TB treatment default study, a possible confounder could be the geographic location of facility as either rural or urban. In a rural setting smear TAT may be lengthy due to poor communication systems between the laboratory and clinic and initial TB treatment default rates may be high due to poor patient access to health services.
5.8 Data collection
The core data used in operational research has already been collected in one or more of the sources listed in the previous section and exists in either a hard copy (paper) or electronic format. This data may be supplemented by additional primary information gathered in questionnaires. Data collection methods must be specified, even when an electronic source data is used.
57STUDY METHODS
Using case report forms
A case report form (CRF) is used to standardise data collection from existing paper records, helping to ensure that data is collected in a consistent way between different field researchers.
The CRF should be simple and contain the minimum amount of information required. This will help to ensure that the quality of data can be more readily maintained. The data collected should be guided by the variables required for the study rather than the data available in the source document.
The questions in the CRF should follow a logical sequence. For example, data that is available at the start of a clinical record (e.g. demographic information such as age and sex) should be collected early in the CRF whilst data on TB treatment outcomes (available at the end of the clinical record) should be collected towards the end of the CRF. Where data is collected from multiple data sources, the questions should be grouped according to the data source used, to avoid field researchers having to move repeatedly between different data sources.
The CRF should be piloted prior to its use in the study. This allows for the correction of simple errors such as essential information that is missing or a poor sequence of data collection. Piloting of the CRF can only be undertaken after ethical approval is received. The pilot should be undertaken on a similar population to that used in the study but data is generally not included in the analysis. Both the investigators and the field researchers should be involved in piloting the CRF to ensure a common understanding of the questions and responses. The pilot data can be used to calculate ‘dummy’ outcomes as this will also help to ensure that all the required data is being collected.
Once study data collection commences, the CRF must be routinely monitored to improve accuracy and ensure completeness. A data collection Standard Operating Procedure (SOP) should be developed that sets out all of the pertinent issues: from selection of records to be reviewed, to collection of data elements, to handling of missing records or data, to checking the CRF for completeness before leaving the facility and other quality assurance checks.
58 CHAPTER 5
Developing a CRF
The following guidelines are recommended when developing a CRF:• Do not collapse variables. For example, if evaluating TB and ART treatment
outcomes in two different models of care, have one question that asks about the model of care and another that captures the facility name rather than have to later allocate the facility to the model of care based on the name of the facility.
• Collect information exactly as it is recorded in the source document. Avoid the field researchers having to interpret information. For example, record the ‘Number TB treatment doses taken’ rather than expecting field researchers to answer the question ‘Did patient receive the correct number of doses of TB medication?’
• Collect the highest level of detail possible. For example collect the exact treatment start date and smear conversion date rather than weeks / months between treatment start and smear conversion. Collect date of birth or age at treatment initiation rather than noting whether patients are in particular age groups. During analysis, the data can be collapsed if required.
• Ensure that all possible responses are included in a question. For example, include the response categories ‘No record’, ‘Not done’ and ‘Not applicable’ where appropriate. The use of an option ‘Other’ should be kept to a minimum as this requires a substantial additional effort in post-coding once data collection has been completed. The range of response categories can often only be finalised once the CRF has been piloted.
• Avoid open ended questions if possible. For example: ‘Chest x-ray report summary’ or ‘What type of training do staff receive on TB?’ Post-coding of these responses is difficult and time consuming; consequently these variables are often not analysed.
• Set out the CRF in a way that optimises both data collection and data entry.
There are different ways to handle data in a CRF depending on the type of variable. With nominal, ordinal and discrete variables, check boxes may be used. These may allow for a single response only or for multiple responses.
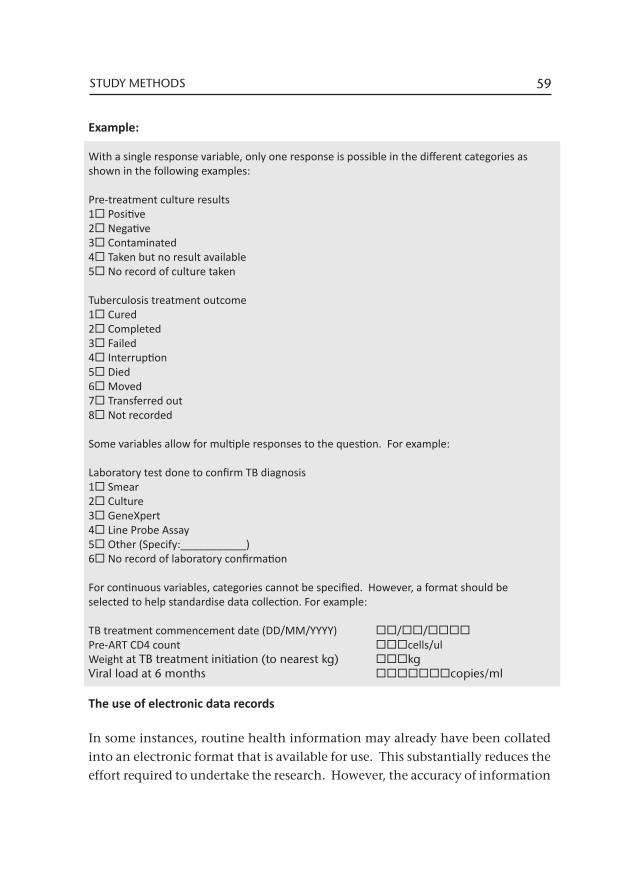
59STUDY METHODS
Example:
With a single response variable, only one response is possible in the different categories as shown in the following examples:
Pre-treatment culture results 1 Positive 2 Negative3 Contaminated4 Taken but no result available5 No record of culture taken
Tuberculosis treatment outcome 1 Cured2 Completed3 Failed4 Interruption5 Died6 Moved7 Transferred out8 Not recorded
Some variables allow for multiple responses to the question. For example:
Laboratory test done to confirm TB diagnosis 1 Smear2 Culture3 GeneXpert4 Line Probe Assay5 Other (Specify:___________)6 No record of laboratory confirmation
For continuous variables, categories cannot be specified. However, a format should be selected to help standardise data collection. For example:
TB treatment commencement date (DD/MM/YYYY) //Pre-ART CD4 count cells/ulWeight at TB treatment initiation (to nearest kg) kgViral load at 6 months copies/ml
The use of electronic data records
In some instances, routine health information may already have been collated into an electronic format that is available for use. This substantially reduces the effort required to undertake the research. However, the accuracy of information
60 CHAPTER 5
collated is unknown. This can be assessed by taking a sample - about 10% of records – and reviewing these against the original source documents (e.g. clinical records) to determine the rate of transcription errors. If the quality of data is poor for key determinant and outcome variables, it may not be possible to use the electronic records.
If possible, request that the data be provided in an excel format to facilitate import into the study database. For future clarity with analysis, specify the criteria that were used in extracting the data from the routine data source.
5.9 Data management
Data management ensures that appropriate data collection takes place; that data can be entered into a suitable database; and, that the process of data collection and data entry is tracked and monitored to ensure that the study has reliable, accurate data to analyse.
Data management includes the whole process of collecting, capturing, storing and preparing the data for analysis. All data should be handled and managed according to Good Clinical Practice (GCP) requirements and ethical standards. For good data management the following are needed:
• Carefully planned data forms (e.g. Case Report Forms (CRF) or questionnaires). Even if routine data are used (e.g. TB register data) a form should be set up to clearly indicate which variables from the routine data will be used.
• Data and sample flow algorithms and logistics • A data management plan• A data dictionary• Standard Operating Procedures (SOP) for collecting and storing data
Is the data collected appropriate?
When thinking about the study data, one needs to begin with the end in mind. In other words:• What is your hypothesis?
61STUDY METHODS
• What exactly do you want to analyse?• What format must the data be in for analysis?
Check that all the data variables required have been included in the case report form or other routine source of electronic records.
The data dictionary
A data dictionary is essential for data documentation in all research studies, irrespective of whether these collect primary data, use data from existing clinical records or from an existing electronic data source. The development of a data dictionary forces the researcher to think logically about the structure and the format of data to be collected. The data dictionary should contain at least the following information for each data variable to be collected:• Variable name• Variable description• Type of variable• Length• Value / format / range (permitted values)• Logic checks (e.g. root vs. nested question: cannot have number of
pregnancies completed if sex was recorded as male)• Missing values (e.g. -99=Unknown) – make sure that the symbol used for
the unknown value is not a value that can occur in the real data for that or any other variable.
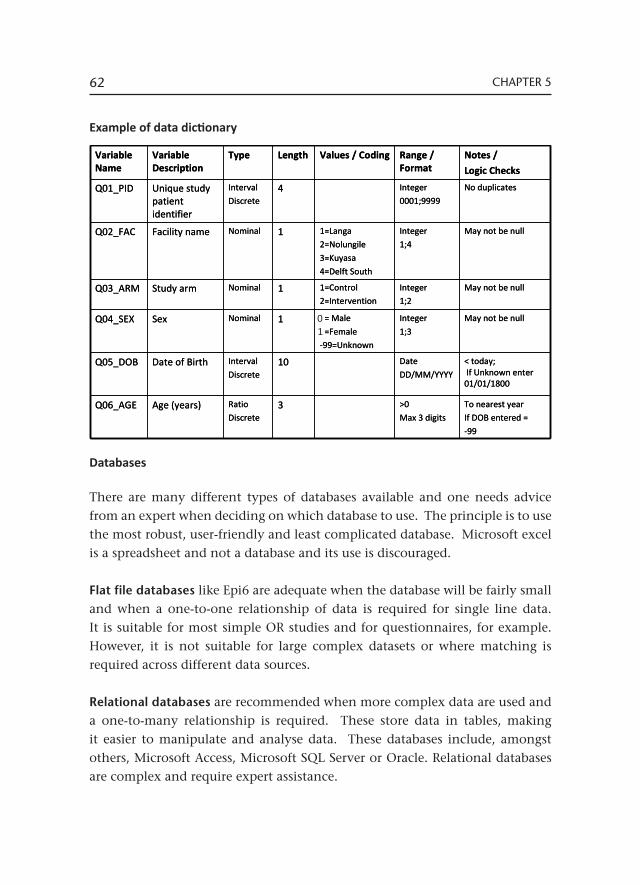
62 CHAPTER 5
Example of data dictionary
Databases
There are many different types of databases available and one needs advice from an expert when deciding on which database to use. The principle is to use the most robust, user-friendly and least complicated database. Microsoft excel is a spreadsheet and not a database and its use is discouraged.
Flat file databases like Epi6 are adequate when the database will be fairly small and when a one-to-one relationship of data is required for single line data. It is suitable for most simple OR studies and for questionnaires, for example. However, it is not suitable for large complex datasets or where matching is required across different data sources.
Relational databases are recommended when more complex data are used and a one-to-many relationship is required. These store data in tables, making it easier to manipulate and analyse data. These databases include, amongst others, Microsoft Access, Microsoft SQL Server or Oracle. Relational databases are complex and require expert assistance.
May not be nullInteger1;4
1=Langa2=Nolungile
3=Kuyasa
4=Delft South
1NominalFacility nameQ02_FAC
1= Male
2=Female-99=Unknown
1=Control2=Intervention
Values / Coding
May not be nullInteger
1;31NominalSexQ04_SEX
Variable Name
Variable Description
Type Length Range / Format
Notes /
Logic Checks
Q01_PID Unique study patient identifier
Interval
Discrete 4 Integer
0001;9999
No duplicates
Q03_ARM Study arm Nominal 1 Integer1;2
May not be null
Q05_DOB Date of Birth Interval
Discrete10 Date
DD/MM/YYYY
< today;If Unknown enter 01/01/1800
Q06_AGE Age (years) RatioDiscrete
3 >0Max 3 digits
To nearest year If DOB entered =
-99
01
63STUDY METHODS
If electronic data (for example an electronic TB register) is used, it is often not necessary to set up a separate database – the specific electronic data needed for the study can be exported directly into a statistics programme for analysis.
When developing a database the time invested in system development can pay dividends as a well designed database reduces errors during analysis. By setting up a series of routine reports that can be drawn from the database, data can be reviewed on an ongoing basis and errors identified and corrected whilst the study is ongoing.
Special attention should be paid to the safety and security of data entered into the database through limited access, password protection and regular backup and archiving of information.
Managing data flow from collection to analysis
Maintaining consistency is one of the most important aspects of managing data – data must always be collected and captured in exactly the same way.
The Standard Operating Procedures (SOPs) for managing the data must include step-by-step instructions on how data are to be collected in the field during the study. It should also include details of how to handle missing data or incorrect entries in routine data (for example, if a TB case is recorded as smear not done but a pre-treatment smear result is available in the clinical folder). The instructions in the SOP must be so clear that anyone following these instructions should be able to repeat the study – in other words the study and the data collection and management should be reproducible if other groups want to do the same study.
Maintaining confidentiality
In handling any information from records, strict procedures are required to ensure the confidentiality of the information collected and analysed. An essential and integral part of good clinical practice and ethical principles is to maintain confidentiality and not to use the names of individuals when collecting and analysing data.
64 CHAPTER 5
However, sometimes the only way to access data (e.g. when doing a folder search) is to use names. The principle then is to preferably use unique study numbers and not to have the name and study results in the same document, electronic spreadsheet or database.
The best practice recommendation for accessing data without having the name of a client on the same form as the results to be collected is to compile 2 lists: A list with subject name, surname and unique study code. A different list with the unique study code and results.
In some instances, personal identifiers (names, dates of birth, address, etc) may be required to perform record linkage. If this is necessary, the procedures to carry it out must be described along with processes to ensure that, after linkage is complete, personal identifiers are removed.
The exact manner in which data will be accessed and steps taken to ensure confidentiality will have to be explained to the ethics committee and only when approval has been granted, can the study go ahead.
Example:
A research study aims to determine the association between drug resistance and infection with HIV: • Information on drug resistance is reported in a standard register; • Information on HIV status is not recorded in the register and must be sought in
the clinic folders; • In order to locate the folders, it is necessary to have the names of the study
subjects.
Dual data entry
Once data collection has started, data entry should also commence. It is important to do dual data entry – in other words two people capture the same data separately on identical databases – each person has his/her own copy of the database. The reason for this is that it is only human to make errors (often at a rate of about 10%) during the data capture process. However, when 2 people capture the data and then the two data sets are compared and corrected by
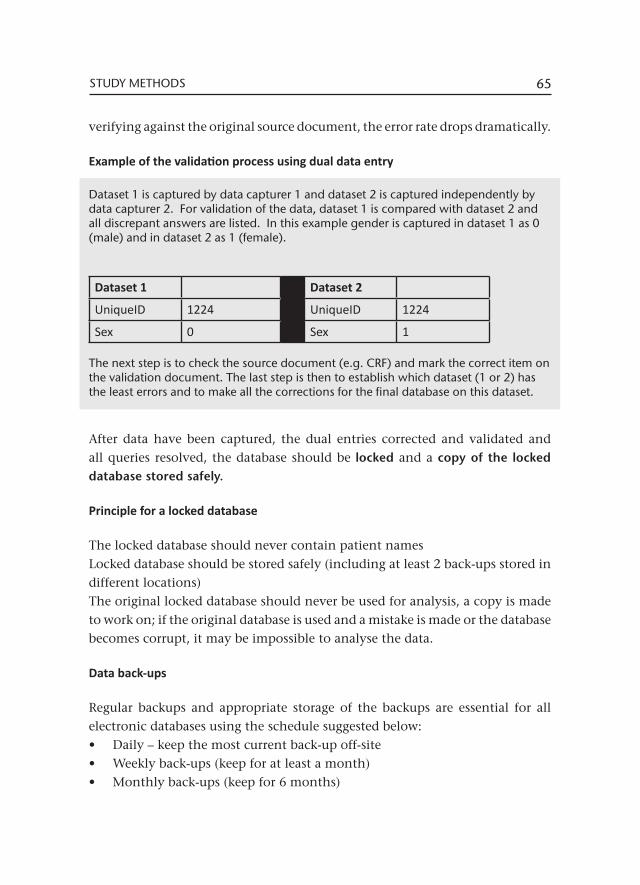
65STUDY METHODS
verifying against the original source document, the error rate drops dramatically.
Example of the validation process using dual data entry
Dataset 1 is captured by data capturer 1 and dataset 2 is captured independently by data capturer 2. For validation of the data, dataset 1 is compared with dataset 2 and all discrepant answers are listed. In this example gender is captured in dataset 1 as 0 (male) and in dataset 2 as 1 (female).
Dataset 1 Dataset 2
UniqueID 1224 UniqueID 1224
Sex 0 Sex 1
The next step is to check the source document (e.g. CRF) and mark the correct item on the validation document. The last step is then to establish which dataset (1 or 2) has the least errors and to make all the corrections for the final database on this dataset.
After data have been captured, the dual entries corrected and validated and all queries resolved, the database should be locked and a copy of the locked database stored safely.
Principle for a locked database
The locked database should never contain patient namesLocked database should be stored safely (including at least 2 back-ups stored in different locations)The original locked database should never be used for analysis, a copy is made to work on; if the original database is used and a mistake is made or the database becomes corrupt, it may be impossible to analyse the data.
Data back-ups
Regular backups and appropriate storage of the backups are essential for all electronic databases using the schedule suggested below:• Daily – keep the most current back-up off-site• Weekly back-ups (keep for at least a month)• Monthly back-ups (keep for 6 months)
66 CHAPTER 5
• Quarterly back-ups (keep for year)• 6-monthly backups (keep for 5 years)
Data storage
A plan for data storage is essential as all data must be stored for a minimum of 5 years (some studies require data to be stored for up to 15 years). Data can be stored either in electronic format, or in hard copies or preferably, in both.
All paper documents must be kept for a minimum of 5 years. Long term storage requires a lock up facility which is preferably safe from natural disasters like floods, fire and other destructive elements, for example rats and moths. As a further precautionary mechanism against water damage from burst water pipes or floods, never store data directly on the floor, always store it on shelves.
Data and documents should be stored in a logical format for later retrieval e.g. by community or by date or by unique identifier. The consent forms and the linking lists which contain names should always be stored in a separate locked filing cabinet.
Resources required for data management Data management starts right at the beginning - during proposal development. The proposal needs to address data requirements and data management. This needs to be carefully thought through as it has budget implications, including for the following:• Equipment (e.g. computer, printer)• Toner replacement; printer cartridges• Software or computer programs• Data collection tools (either paper based or electronic e.g. personal digital
assistants)• Stationery (e.g. paper, envelopes, labels, barcodes, black pens, clipboards,
files etc)• Staff (data manager, database developer, data capturers)• Data storage and backups (electronic and hard copy)
67STUDY METHODS
5.10 Data analysis plan
To answer a research question and to address an hypothesis, it is necessary that comparisons be made. This allows one to make inferences about the target population based on data from the study population and is what differentiates research from analysing routine reports.
A data analysis plan describes the intended analysis for a study based on the data collected, the defined variables of interest and the research question. The following elements should be included in an analysis plan:
• Identify the exposure and outcome variables that will be included in the analysis along with the type of each variable.
• Describe the statistical tests that will be used in the analysis of the research question. This is influenced by:- The type of variables being analysed (Are they categorical or numerical
and if the latter, are they discrete or continuous?)- For continuous variable, are they normally distributed in the study
population (or is this unknown)?- Are the variables independent of each other or not? (For example, in a
‘before and after’ evaluation or when cases and controls are matched, the groups are not independent of each other)
- The type of measurement being analysed (for example, comparing the mean between two groups)
• Indicate whether an analysis of sub-population will be undertaken, describe the variables to be analysed for the sub-populations and the statistical tests to be used for this.
• Indicate whether an assessment will be done to identify any potential confounders
• Include a summary of any descriptive analysis that will be reported to numerically describe the overall study population in terms of their demographic and clinical characteristics.
The input from a statistician is required during proposal development to ensure that the appropriate data analysis can be later undertaken. The statistician will help to identify the special circumstances that need to be taken into account
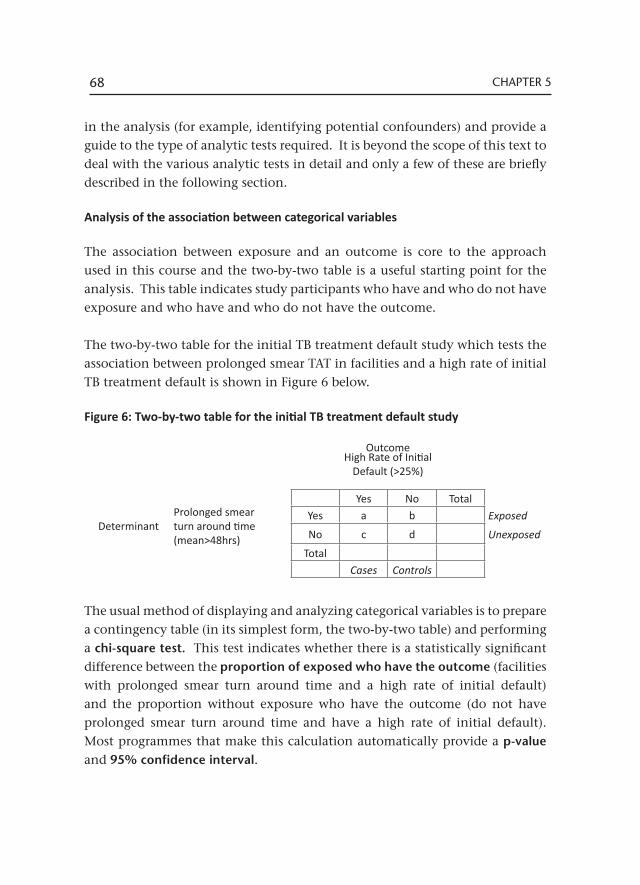
68 CHAPTER 5
in the analysis (for example, identifying potential confounders) and provide a guide to the type of analytic tests required. It is beyond the scope of this text to deal with the various analytic tests in detail and only a few of these are briefly described in the following section. Analysis of the association between categorical variables
The association between exposure and an outcome is core to the approach used in this course and the two-by-two table is a useful starting point for the analysis. This table indicates study participants who have and who do not have exposure and who have and who do not have the outcome.
The two-by-two table for the initial TB treatment default study which tests the association between prolonged smear TAT in facilities and a high rate of initial TB treatment default is shown in Figure 6 below.
Figure 6: Two-by-two table for the initial TB treatment default study
The usual method of displaying and analyzing categorical variables is to prepare a contingency table (in its simplest form, the two-by-two table) and performing a chi-square test. This test indicates whether there is a statistically significant difference between the proportion of exposed who have the outcome (facilities with prolonged smear turn around time and a high rate of initial default) and the proportion without exposure who have the outcome (do not have prolonged smear turn around time and have a high rate of initial default). Most programmes that make this calculation automatically provide a p-value and 95% confidence interval.
OutcomeHigh Rate of Initial
Default (>25%)
Yes No Total
DeterminantProlonged smear turn around time (mean>48hrs)
Yes a b Exposed
No c d Unexposed
TotalCases Controls
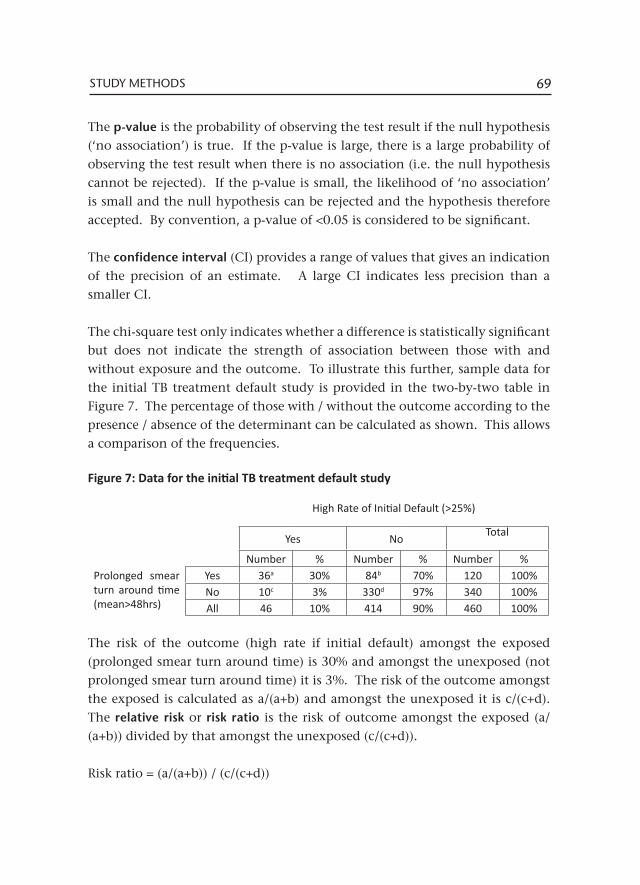
69STUDY METHODS
The p-value is the probability of observing the test result if the null hypothesis (‘no association’) is true. If the p-value is large, there is a large probability of observing the test result when there is no association (i.e. the null hypothesis cannot be rejected). If the p-value is small, the likelihood of ‘no association’ is small and the null hypothesis can be rejected and the hypothesis therefore accepted. By convention, a p-value of <0.05 is considered to be significant.
The confidence interval (CI) provides a range of values that gives an indication of the precision of an estimate. A large CI indicates less precision than a smaller CI.
The chi-square test only indicates whether a difference is statistically significant but does not indicate the strength of association between those with and without exposure and the outcome. To illustrate this further, sample data for the initial TB treatment default study is provided in the two-by-two table in Figure 7. The percentage of those with / without the outcome according to the presence / absence of the determinant can be calculated as shown. This allows a comparison of the frequencies.
Figure 7: Data for the initial TB treatment default study
The risk of the outcome (high rate if initial default) amongst the exposed (prolonged smear turn around time) is 30% and amongst the unexposed (not prolonged smear turn around time) it is 3%. The risk of the outcome amongst the exposed is calculated as a/(a+b) and amongst the unexposed it is c/(c+d). The relative risk or risk ratio is the risk of outcome amongst the exposed (a/(a+b)) divided by that amongst the unexposed (c/(c+d)).
Risk ratio = (a/(a+b)) / (c/(c+d))
High Rate of Initial Default (>25%)
Yes No Total
Number % Number % Number %Prolonged smear turn around time (mean>48hrs)
Yes 36a 30% 84b 70% 120 100%No 10c 3% 330d 97% 340 100%All 46 10% 414 90% 460 100%
70 CHAPTER 5
In the example given above, the risk ratio = 30/3 = 10. This means that there is a 10-fold higher risk of the outcome in the exposed to the unexposed groups.
When the study uses a case control design (used most frequently when the rates being examined are very low), the correct comparison is the ‘odds ratio’ rather than a risk ratio. This is because a predetermined number of cases and controls have been selected and these do not necessarily reflect the true proportions of those with and without the outcome in the study population. The odds of the outcome amongst the exposed is calculated as a/b and amongst the unexposed it is c/d. The odds ratio is calculated as follows:
Odds ratio = (a/b)/(c/d) = (ad)/(bc)
In our example, the odds ratio is (36/84)/(10/340) = 14.1. The two ratios are measurements of the size of effect. The advantage to both the risk ratio and the odds ratio is that, unlike the chi-square test, neither is influenced by sample size.
Analysis of the association between numerical variables
Correlation coefficients describe the relationship between two numerical variables. The variables can be positively associated (an increase in one causes an increase in the other) or negatively associated (an increase in one causes a decrease in the other) or there may be no correlation between the variables. The Pearson correlation co-efficient is an example that can be calculated for normally distributed data and the Spearman rank correlation co-efficient used for non-normally distributed data.
In a simple linear regression analysis, correlation is used to predict the value of the dependent variable based on the value of the independent variable. To analyse the relationship between more than two variables, various types of multiple regression analyses can be used.

71STUDY METHODS
5.11 Quality assurance
Quality assurance applies to all stages of proposal development, study implementation and data analysis. All the recommendations included thus far which ensure precision and standardisation, contribute to quality insurance. For example:• Precise definitions of the terms and variables used • Clear definitions of eligibility to participate and for recruitment• Standardised measurement procedures including the use of standardised
data collection tools such as case record forms• Avoiding systematic bias or random error in measurements• The use of standard operating procedures to guide participant selection,
data collection and checking
All staff involved in the research (including co-investigators, field researchers, data typists) should be trained on the SOPs to assure quality during implementation of the research study. Regular reviews should be undertaken to ensure that the SOPs are adhered to, for example to ensure that the correct sampling methods are used.
The study proposal serves as an important guide during the implementation of the research. However, it is quite likely that during the course of data collection some of the stipulations set out in the proposal may change, for example, exclusion criteria for participant selection or definitions. It is recommended that a project diary is maintained detailing issues during implementation. This should document all changes from those stipulated in the proposal. Whenever there is any change in definitions or recording procedures, these must be described in detail.
It is advisable to also document process issues that relate to the project determinants and outcomes in the study diary. For example, issues related to the quality of particular data elements, which may later reflect on the value placed on related findings. Include also environment factors that may influence study findings: strikes in facilities, social upheaval due to fire, floods or displacement, drug stock-outs, laboratory stock-outs of tests etc.
72 CHAPTER 5
Data Quality Assurance
Standard operating procedures help assure the quality of data and reduce missing and inaccurate data. The types of data checks to be implemented throughout the study include
• Field researchers checking the CRF for missing data / other errors before leaving the health facility
• Reviewing primary records for the initial CRFs that have been completed as a learning exercise to ensure a common understanding amongst project staff. This exercise can be repeated sporadically to check the quality of data collection
• An investigator / study manager checking completed CRFs before they are handed to the data typist for data entry
• Providing feedback on validation errors identified in the database• Undertaking dual data entry, correcting transcription errors and providing
feedback on errors to data typists
Once errors have been corrected, outliers in the dataset should be identified and decisions taken on how to handle these. When all data cleaning is completed, the final database should be locked and analysis undertaken on a copy of the final version.
6Ethics
Ethics can be defined as ‘rules or principles that govern right conduct’. This raises the question, “what is ‘right conduct’?” Does ‘right conduct’ mean the same thing for science, for the subjects of research and for society at large? It is important to carefully consider this question as ethics based on social benefit and scientific merit may be in conflict with ethics protecting the rights of research subjects.
All the different aspects of complex ethical issues in a research study should be considered and addressed in the research proposal. The solution to an ethical dilemma usually consists of a compromise between different ethical principles, taking into consideration the perspectives of the different stakeholders.
6.1 Key principles
Medical ethics as we know it has a relatively short history, commencing after the Second World War at the Nuremberg Trials when the Nuremberg Code, which included the first guidance on informed consent in research, was compiled. Subsequently the Declaration of Helsinki was developed and adopted by the World Medical Association in 1964, with the most recent revision in 2008. Further ethics guidelines were developed at the Council for International Organizations in Medical Sciences (CIOMS) in 2002. In these guidelines, the emphasis is mainly on the protection of the rights of individuals. These rights include, according to the United Nations Universal Declaration of Basic Human Rights:• Articles 1 and 3: the right of freedom to decide to participate in research• Articles 3 and 5: the right of freedom from harm during the course of
experimentation• Article 12: the right of personal privacy
74 CHAPTER 6
In terms of research, the implications of individual rights are analysed in terms of four basic principles18, namely:• Autonomy - the right or condition of self-government in a particular sphere• Non-maleficence - equivalent to ‘primum non nocere’, a Latin phrase that
means ‘First, do no harm’• Beneficence - the doing of active goodness, kindness, or charity, including
all actions intended to benefit others• Justice - the moral obligation to act on the basis of fair adjudication between
competing claims.
6.2 Ethical considerations in operational research
The principle of autonomy implies that every individual has the right to decide whether and how their personal information is used (this does not however apply to information which is publicly available). This means that informed consent should be received from each participant before enrolment in a study and requires disclosure of all relevant study information to the participant. Sometimes the contradiction between autonomy and scientific validity must be taken into account. Incomplete information may be given to participants as part of the informed consent process because of the study design. In a case-control study for example, knowing the specific risk factor that a hypothesis is based on may consciously or subconsciously influence participant’s responses and may bias the study results. Whilst a high response rate is essential for a study to be scientifically valid, there must also not be unreasonable pressure on the individual to participate in the research.
Strict adherence to the principle of autonomy may not be appropriate or practical in an OR study. The use of medical records obtained for clinical purposes without informed consent for research purposes can be justified for research when:
• There is minimal risk of harm to the individuals • Access to the records is essential to achieve the objectives of the research
18 Beauchamp TL, Childress JF. Principles of Biomedical Ethics. 4th Ed. New York: Oxford University Press; 1994.
75ETHICS
• There is a public benefit to undertaking the research• Informed consent is logically or economically impracticable• There is consent to use the data from the custodian of the records• The data are protected against those not involved in the research• The research is approved by an ethics committee
When medical records will be used in a research study, permission to use the records must be sought from the custodian of the records (or a nominee). The custodian of medical records is the Department of Health. Usually the custodian will be sensitive to contextual issues and know if the proposed research may cause harm.
If a waiver of informed consent is to be requested from the ethics committee, this must be explicitly stated in the proposal accompanied by a rationale on why informed consent is not needed / possible. The ethics committee reviewing the research proposal will decide on whether informed consent is necessary for a specific study. Informed consent is usually waived by the ethics committee for minimally invasive research and for retrospective record reviews. Assuring the confidentiality of data is an important ethical principle in OR. A participant’s anonymity should be ensured by removing personal information from the data. There are exceptions however as some important questions can only be answered through the use of personal data. For example, it may be necessary to use personal identifiers to link data from a laboratory database to that in the electronic TB register. Sometimes the researcher may need to have personal details to identify a possible participant before tracing is possible to request their participation. Records with personal information must be maintained securely and access to the information limited to the relevant personnel only.
If names or other personal identifiers have been used these must be removed from the research database when data collection is completed and before the analytical process starts. Records of personal data and research findings must then be kept separately (logically and physically under lock and key or password secured) and linked only by barcode. Records must only be kept as long as they are needed but usually for a minimum of five years, depending on the
76 CHAPTER 6
ethics committee and funder requirements. Data must be disposed of securely and publications may never include material which could identify subjects. For each study a written code of practice must include signed declarations from researchers to keep data confidential.
There is an obligation on the researcher to inform the participants of the outcome of a research study, especially when a risk factor or disease is discovered. This process should include an explanation of the significance of the finding, a recommendation of an appropriate action and ensuring that the recommendation is being followed if the participant has consented. The researcher has to provide information on study outcomes in general if the risk is real, but be sensitive not to cause anxiety by reporting the findings out-of-proportion and context. If any study findings include conditions or risk factors which may be hazardous to others, the results must be communicated taking into account the individual’s right to privacy.
It is also the researcher’s obligation to inform the wider scientific community about the outcomes of all research findings, even if these are negative. In doing so, not only will future expenses be avoided by studies not being repeated, but publication bias (due to only positive results being published) will be minimised and evidence based medicine will benefit.
6.3 Applying for ethics approval
Every study proposal must to be submitted to an ethics review board or committee for approval, prior to the research being undertaken. Most organisations, including universities and the International Union against Tuberculosis and Lung Disease, have their own ethics committees. Depending on the geographical locality of the research study, the employer of the researcher and the research partners, the proposal may have be submitted to one or more ethics committees. It is only possible to start the research when the ethics committees have approved the study. Ethics approval usually takes about a month and this time-frame must be taken into account when the project work-plan is developed.
77ETHICS
For Stellenbosch University, the ethics application procedure is stipulated online at http://sun025.sun.ac.za/portal/page/portal/Health_Sciences/English/Centres%20and%20Institutions/Research_Development_Support/Ethics/Application_package.
For the Union, the ethics application procedure for the Ethics Advisory Group is stipulated online at http://www.theunion.org/index.php/en/what-we-do/ethics. Other universities and organisations have similar resources which can be accessed online.
Some ethics review boards give approval for research studies for a one year period only. These boards may require a progress report and application for renewal of ethics approval on an annual basis. This must be submitted well before the ethics approval expiry date, so that the progress report can be reviewed and the project re-approved prior to the expiry date. Should the ethics approval lapse, the study must be halted until the ethics review board renews approval for the research. Most ethics review boards require a final report at the end of the study. In some cases, a copy of the published abstract may be submitted instead of a report.
Even though a research proposal has been approved by an ethics committee, it is important to emphasise that the responsibility for good ethical practice remains with the researcher.

78 CHAPTER 6
7Application of research findings
7.1 Strengths and limitations
All operational research studies have their strengths - the good qualities that make it easy to obtain scientific and relevant results - and limitations - conditions that constrain the research. These relate to issues such as the research topic, scope of research, research methods, the data used and the extent to which research is action-oriented and aimed at yielding practical results and / or at developing solutions. Throughout the proposal writing process and for each section of the proposal one should continuously think about and document the strengths and limitations. An honest appraisal of the practical or methodological issues that may influence the findings and the impact on subsequent action is important, if one aims to appropriately influence policy or practice.
Issues to consider in weighing up strengths and limitations include:• The extent to which there is participation from researchers, service providers
and policy makers and their influence • The cost of the research (think also about costs that will not necessarily be
borne by the project, for example, the cost of facility staff time, the use of facility space or other resources as this is a contribution from the health services)
• The geographic scope and limits of the research• The timeliness of results • The acceptability of likely changes in practice and policy based on research
findings• The ethical acceptability of the research• The extent to which results will be disseminated (locally and internationally
and the means through which this will be done, for example, feedback through different fora, presentation at conferences and papers published)
• The ability to influence policy, improve practice and ultimately lead to better health outcomes for the population served.
The use of routine data for operational research has several strengths: it is
80 CHAPTER 7
relatively simple as standardised information that is relevant to the problems experienced in addressing the TB epidemic is readily available. The information has local relevance and is comparable across difference sites. Using routine data is also cheaper than collecting new information.
There may however also be substantial limitations to using routine data. The quality and completeness of records may be poorer than the usual research standards. The reliability of the information may be questionable. For example, to what extent does the information in the electronic TB register (ETR.net) correlate with that in the paper register or in clinical records? This will need to be assessed if the ETR.net is used as the data source. There is also the possibility of introducing bias because of categories of clients whose folders are not available or not entered into the TB register. People who had sputum samples tested but who never started treatment (initial TB treatment default), for example, are often not recorded in the TB register.
Data may also not be comparable over time or between countries. The recent change in the international definition of a smear positive case (from at least two smears positive to at least one smear positive) is one such example. Another example is the previous exclusion of ‘transfers out’ from the denominator when calculating treatment outcomes in South Africa. It is important to document all the relevant issues and to review these during the data analysis process, especially when collecting and analysing data over a few years.
7.2 Dissemination and stakeholder engagement
In order to ensure that the research leads to action to address the challenge/problem it is important to involve all stakeholders from the very beginning. Stakeholders include all those who need the new knowledge that will be provided by the research. Those who undertake the research must work with those who will use the results of the research and with those for whom the services are provided.
Engaging all stakeholders from the beginning implies that they should not be approached only when results are ready to be disseminated. It is an essential principle of operational research to hold discussions with stakeholders during
81APPLICATION OF RESEARCH FINDINGS
the proposal development phase. If stakeholders are engaged from the beginning, then the dissemination becomes easier – but it is never without its own challenges.
Involvement of stakeholders is best achieved by creating an ‘advisory group’ which includes researchers, policy makers and individuals from the community. However, it is not always easy to know whether the consultation process should start at the community and then move up to the health services (local, regional and national) or whether consultation should start at national level and then move to regional, local and finally the community level. Whichever direction is selected, it is important to involve all levels at all stages.
The results of the research should be disseminated to all stakeholders. This may not be easy if there are no clear guidelines for dissemination or if the structures and platforms for interacting with them are not developed and in place. It is best to identify the stakeholders at the beginning of the study, write down exactly who they are, how they will be engaged and when and how results will be disseminated to them.
7.3 Implications for policy and practice
The overall goal of operational research is to improve the delivery of health services through identifying challenges or problems in the system, scientifically investigating which factors are related to the challenges and if possible, also identifying why those challenges exist and making recommendations to address them. The final piece is testing whether a specific intervention will address the challenge and requires commitment from health services (and sometimes funding).
It is an ethical responsibility to put all research into the public domain by publishing articles in peer-reviewed journals, allowing broad access to the results. The availability of good evidence however does not on its own guarantee action, even when this evidence is well synthesized (through systematic reviews for example) and effectively communicated to stakeholders. A frequently cited19 example of this is the poor uptake in use of a relatively inexpensive intervention (bed-nets) in malaria prevention, despite well documented efficacy.
82 CHAPTER 7
The Operational Research Assistance Project (ORAP) has made several deliberate efforts to address some of the barriers to translating research findings into policy and practice. Researchers have worked with health providers to identify priorities that shape the research agenda. Efforts have been made to bridge the gap between the research process and the decision making process by involving the ‘beneficiaries’ of research (programme managers for example) in the research process. This also provides an opportunity for researchers to become more involved in the process of translating research findings into practice.
Research results need to be communicated in an accessible way; journal articles for example, may not be appropriate for policy makers or practitioners and alternative ways of disseminating results are needed. Five steps have been identified to help effectively communicate research findings19:
1. Develop an actionable message based on potential benefits, balanced by possible negative consequences including the impact on resources (staff and costs for example). Verify the validity of this message with service providers prior to broader dissemination.
2. Identify the target audience: are these policy makers, implementers or users of the service. Identify and reach the opinion leaders within these groups.
3. Identify the most appropriate person to deliver the message. For example, clinicians may deliver the message more effectively to practitioners than researchers or managers would.
4. Identify how to convey the message. Face to face interaction is considered to be most effective but should be supported by written documents such as a ‘policy brief’ that sets out the issues and options/choices in an accessible way. It is important to provide access to the journal article for those wanting additional details.
5. Articulate the impact expected from the knowledge transfer: why are you conveying this message to this audience? Is a change in clinical or administrative practice recommended? For policy makers, is a change in guidelines recommended? For managers, is the recommendation that
19 World report on knowledge for better health: strengthening health systems. World Health Organization, 2004.
83APPLICATION OF RESEARCH FINDINGS
performance targets are set to monitor improvement in this area of the health services?
Another important aspect is to identify potential barriers to the uptake of recommendations from both a service provider and patient perspective. In resource constrained settings, staff shortages and cost are often an issue. Recognise that providers may be invested in maintaining the status quo for many reasons including inertia, a ‘belief’ in the efficacy of current practice, perceptions of increased workload and resistance to change. Patient literacy, patient’s belief systems, health seeking behaviour and community demand for a service may all present potential barriers to the uptake of recommendations. Barriers need to be identified and a plan made to address them should the recommendations be accepted.

84 CHAPTER 7
8Project management
Project management is defined as the planning, organising, directing and controlling of resources to meet defined objectives within a specific time period. This definition applies to the three phases that research studies go through:• The first phase is proposal development: the methods and plan of research
must be precisely developed and described and approval provided (from ethics committees and health departments) before research begins.
• The next phase is study implementation: this includes all the activities which will be undertaken to collect high quality data, as stipulated in the research proposal and standard operating procedures, on time and within budget, to allow one to meet the study objectives.
• The final phase is interpretation and reporting the results: study results and their implications need to be reported to the relevant stakeholders to enable the appropriate action to be taken.
It is important that the implementation phase is described in detail in the research proposal, with a clear indication of how the project will be executed once approval has been obtained. Roles and responsibilities, project timelines and budget requirements have to be stipulated.
Additional information on regulatory aspects of the Operational Research Assistance Project is provided in this section to assist researchers during study implementation.
8.1 Roles and responsibilities of the principal investigator
The principal investigator (PI) assumes overall responsibility for the implementation of the research and is responsible for implementing or supervising the implementation of the research. If the PI delegates functions, the PI should hold regular (weekly) progress meetings or obtain reports from those responsible for specific activities.
86 CHAPTER 8
• Ethics: The ethical considerations, principles and ethics review procedures are the responsibility of the PI. Should the ethics approval lapse, the PI must halt the study until the ethics review board renews approval for the research.
• Health Authority Approval and Feedback: The PI is required to seek permission from Health Authorities to undertake the research (for access to facilities, patients and data) and to provide regular feedback to health authorities, including on completion of the research.
• Personnel: The PI will identify the personnel required to carry out the research and define their responsibilities, skill level and training required. Responsibility for the advertisement, recruitment and employment of personnel are shared between the PI and employing institution, as is the case for ORAP.
• Training: All personnel working on the research need to be trained on general study objectives and good clinical practice guidelines. Specific training needs to be undertaken to ensure that the personnel are equipped to undertake the function expected of them and are able to follow the standard operation procedures that have been developed.
• Quality assurance: The PI must ensure that research procedures precisely follow those outlined in the protocol. The PI is responsible for the development and implementation of standard operating procedures and for pilot testing of data collection tools (case report forms or questionnaires).
• Management of data: The PI is responsible for adherence to the data management plan. Special attention must be paid to ensuring quality control and tracking the data obtained (which CRFs have been completed, quality checked, single and dual entered) and ensuring secure storage of the results. Periodic comparisons of data quality between researchers and field sites and over time (inter and intra-observer comparisons) should be made to improve standardisation.
• Contracts: The PI is responsible for completing and submitting the documentation setting out the contractual agreements between the various parties involved (contract, service level agreement or memorandum of understanding). It is the PI’s responsibility to ensure compliance with the contract (deliverables in work-plan, adherence to timelines and budget).
• Public relations: The PI should provide regular feedback to the relevant stakeholder regarding the progress of the research and should be available

87PROJECT MANAGEMENT
to address any concerns, especially from the community. Should there be any untoward events related to the research, the PI should make a public statement to allay fears and answer questions.
• Reporting of the results: The PI is responsible for reporting study results to the authorities and the scientific community. A special session should be organised to provide specific feedback to the community and authorities where the research was undertaken.
• Regulatory aspects: The PI must ensure that the research is conducted in an ethical manner and in accordance with local laws and regulations and institutional policies, and that the requirements of the funder are met. The PI is responsible for maintaining the regulatory documents (refer to Section 8.5).
8.2 Project timelines
A written work plan with timelines will help to ensure that the study is carried out within the time frame specified and help to ensure that the budget is not exceeded (by having to employ project staff for longer than required for example).
The work plan should begin by listing all the tasks to be undertaken in the study, when these will be undertaken and persons responsible. This is usually presented as a narrative; it is also useful to summarise activities and timelines in a Gantt chart, either as part of the proposal or as an annexure, to help track progress at a glance. The work plan should include the following important milestones:
• Finalization of research protocol• Submission of documents for ethics approval• Obtaining final approvals from the health department• Obtaining the funding required and signing of a contract/service level
agreement with the funder (if applicable)• Implementation of the research:
o Procurements of stationery, furniture and equipment etc.o Printing of forms and questionnaires o Advertisement and recruitment of project staff
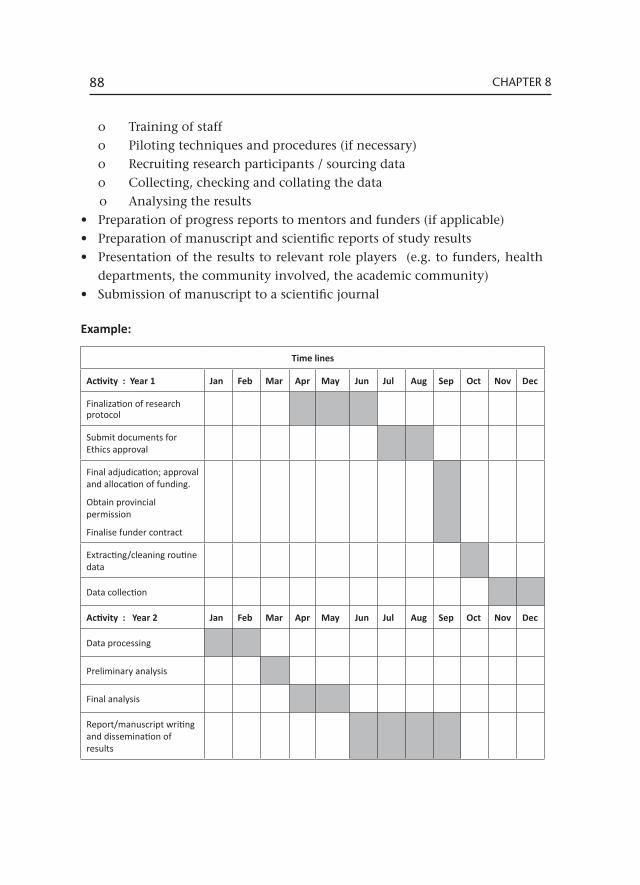
88 CHAPTER 8
o Training of staffo Piloting techniques and procedures (if necessary)o Recruiting research participants / sourcing datao Collecting, checking and collating the datao Analysing the results
• Preparation of progress reports to mentors and funders (if applicable) • Preparation of manuscript and scientific reports of study results • Presentation of the results to relevant role players (e.g. to funders, health
departments, the community involved, the academic community)• Submission of manuscript to a scientific journal
Example:
Time lines
Activity : Year 1 Jan Feb Mar Apr May Jun Jul Aug Sep Oct Nov Dec
Finalization of research protocol
Submit documents for Ethics approval
Final adjudication; approval and allocation of funding.
Obtain provincial permission
Finalise funder contract
Extracting/cleaning routine data
Data collection
Activity : Year 2 Jan Feb Mar Apr May Jun Jul Aug Sep Oct Nov Dec
Data processing
Preliminary analysis
Final analysis
Report/manuscript writing and dissemination of results

89PROJECT MANAGEMENT
8.3 Budget
The PI is responsible for the budget, but should also share relevant budget information with staff. Although this should not include staff salary information, it should include the duration of time each staff member is assigned to the project and other information of importance to project staff such as amounts allocated to transport and accommodation.
When drawing up a research budget, each item of expenditure required to conduct the study should be specified, even if the cost is covered by routine operations of the health service or by other sources outside the study itself. The funding required from external sources can then be specified. This helps to provide a realistic appraisal of the cost of undertaking the research.
A budget is usually presented as a spread sheet, in local currency and in the currency of the potential funder. A written budget justification should be included to explain expenditure in further detail.
Expenditure should, as far as possible, be given in units (hours, trips, kilometres etc.) For example, salaries can be calculated against full time equivalents or per hour according to qualifications.
Include the following standard items in the budget:• Personnel • Travel and accommodation• Equipment • Materials • Other costs: e.g. communications, rentals, honorariums, contracting
service providers
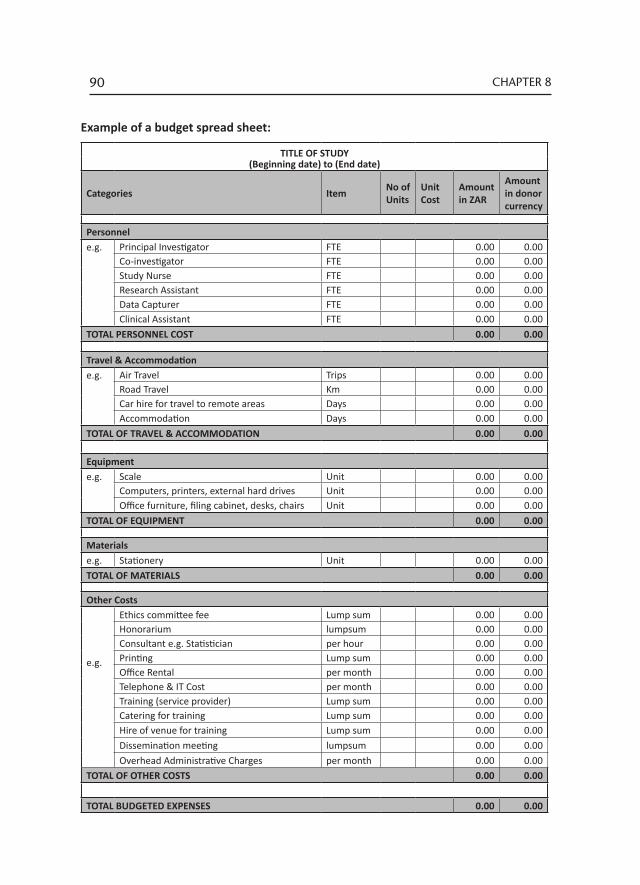
90 CHAPTER 8
TITLE OF STUDY(Beginning date) to (End date)
Categories Item No of Units
Unit Cost
Amount in ZAR
Amount in donor currency
Personnel e.g. Principal Investigator FTE 0.00 0.00
Co-investigator FTE 0.00 0.00Study Nurse FTE 0.00 0.00
Research Assistant FTE 0.00 0.00 Data Capturer FTE 0.00 0.00 Clinical Assistant FTE 0.00 0.00TOTAL PERSONNEL COST 0.00 0.00 Travel & Accommodation e.g. Air Travel Trips 0.00 0.00 Road Travel Km 0.00 0.00 Car hire for travel to remote areas Days 0.00 0.00 Accommodation Days 0.00 0.00TOTAL OF TRAVEL & ACCOMMODATION 0.00 0.00 Equipment e.g. Scale Unit 0.00 0.00 Computers, printers, external hard drives Unit 0.00 0.00 Office furniture, filing cabinet, desks, chairs Unit 0.00 0.00TOTAL OF EQUIPMENT 0.00 0.00 Materials e.g. Stationery Unit 0.00 0.00TOTAL OF MATERIALS 0.00 0.00 Other Costs
e.g.
Ethics committee fee Lump sum 0.00 0.00Honorarium lumpsum 0.00 0.00Consultant e.g. Statistician per hour 0.00 0.00Printing Lump sum 0.00 0.00Office Rental per month 0.00 0.00Telephone & IT Cost per month 0.00 0.00Training (service provider) Lump sum 0.00 0.00Catering for training Lump sum 0.00 0.00Hire of venue for training Lump sum 0.00 0.00Dissemination meeting lumpsum 0.00 0.00Overhead Administrative Charges per month 0.00 0.00
TOTAL OF OTHER COSTS 0.00 0.00 TOTAL BUDGETED EXPENSES 0.00 0.00
Example of a budget spread sheet:
91PROJECT MANAGEMENT
8.4 Budget narrative
Personnel
Some funders expect the costs for staff employed by the institutions undertaking the research to be paid by the institution as part of its contribution to the study whilst others will pay a percentage of their salaries. Check the budget guidelines for the funding agency very carefully before including institutional staff in personnel costs.
Depending on the funding guidelines, list all staff who will be involved in the study, either as full time equivalents or according to the time they will spend in the study. This is calculated as: annualized base salary/12 [/months] × number of months appointed to project × percentage effort (time allocation e.g. 0.2 if one day per week is spent on the research).
Additional personnel may need to be appointed e.g. research nurses, research assistants, data capturers etc. on a part-time or full time basis.
A human resources officer should be consulted regarding job descriptions, level of experience required and salary levels to ensure that standards are adhered to and that roles, responsibility and accountability are clearly defined. It is essential to have employment contracts in place that stipulate the conditions of employment.
Large research studies may include allocations for a financial officer to manage expenditure. If already employed by the research institution, a proportion of their salary (relative to the time spent on this project) may be included in the budget.
Travel and Accommodation
The geographic realities associated with activities to be undertaken within a project must be taken into account. If research staff have to travel consider the mode of transport used e.g. own vehicle, bus, taxi, train etc. Include costs for accommodation and per diem rates (daily allowances for work undertaken when away from home).
92 CHAPTER 8
Plan trips to be as cost-effective as possible. For example, if staff members have to travel to a remote location to collect data, is it more cost effective to pay for two trips or for overnight accommodation? If there are two remote sites in proximity to each other can these be visited together? The justification for overnight accommodation needs to be given. Projected costs for travel and accommodation must be presented within the budget. Include a narrative on the process for reimbursement for travel where appropriate.
Equipment
The budget should include all equipment required to undertake the project. These include costs related to the research office (laptop, computers, printers, desks, chairs, filing cabinets etc) as well as those related to research site work (scales or other medical equipment required). Some funders may limit the type of equipment purchased and/or require that distinctions are made between non-capital and capital assets, based usually on the value of the asset (e.g. assets <R5000 are non-capital and those ≥R5000 are capital).
Materials
The basic supplies required for implementation of project activities include items such as paper, printer ink cartridges, folders, pens, binders, flip charts, dry erase boards, training books, and funds for copying / printing of documents.
Other Costs
• Ethics review: Research proposals will require ethics review from a registered/recognised Health Ethics Committee. These committees usually have a fixed fee which should be included in the budget.
• Honoraria: Small honoraria may be required to recognize the contributions of key collaborators who play important roles in the successful implementation of project activities e.g. mentors and supervisors.
• Consultants: A consultant may be employed on a short term, hourly or daily contract. For example, a consultant may be contracted to build a database for a research project, for statistical analysis etc.
• Printing: It may be necessary to budget for the printing of documents for meetings or workshops and /or bulk copying of documents e.g.
93PROJECT MANAGEMENT
questionnaires and CRFs. The project may also require the development and printing of posters, pamphlets and educational materials in order to support key activities and messaging.
• Translation: If consent forms and questionnaires are to be used, these may need to be translated into local languages. Costs for translation should be calculated and included.
• Office rental: Consideration should be given to where appointed staff will be accommodated during work hours and office rentals included in the budget if necessary.
• Telecommunications: Funds should be requested to defray telecommunication expenses. This includes additional costs associated with internet charges, mailing, faxes, and telephone for project personnel.
• Training: If training of project personnel is required it can be arranged either through a registered training service provider or in-house. Include costs for a venue, materials or refreshments for the latter if required.
• Dissemination meeting: If a venue, materials or refreshments are required for the dissemination of study results, these should be budgeted for.
• Overhead Administrative Charges: Most institutions have a standard overhead charge that is a fixed percentage of the total costs of running the research.
• Audits: Larger projects may require an independent audit of project expenditure.
8.5 Regulatory aspects
The PI must ensure that the research is conducted in an ethical manner and in accordance with local laws and regulations and institutional policies, and that the requirements of the funder are met.
The regulatory file
All research studies must have a regulatory file (SA Good Clinical Practice Guidelines, 6.5 Preservation of Records). For sponsored research studies, the funder also maintains a copy of the research study’s regulatory file, except documents which contain patient identifying information.
94 CHAPTER 8
A regulatory file contains all study-specific information and regulatory documentation. It organizes essential documents, providing easy access to the study monitor, funder’s, auditor, ethics committee, or other regulatory authorities for review/audit purposes, and allows research team members to reference information.
Essential documents are those documents that demonstrate the compliance of the PI, study monitor and funder with the standards of good clinical practice (GCP) and with all applicable regulatory requirements.
Guidelines for keeping a regulatory file
The PI is ultimately responsible for the maintenance of regulatory files, although this task may be delegated to other study staff. The PI should ensure that this additional person is listed as an ‘Additional Person to Contact’ to ensure that all correspondence and documents are received and filed in a timely manner.• Organize and order the sections to facilitate easy use and reference, e.g. file
most used and referenced sections in the front of the file.• Add additional tabs and/or documents to each section as needed.• Keep the file current and up-to-date.• Store the file in a safe and secure location, but accessible to study staff at
all times.• Participant-specific documentation and information, e.g. signed consent
forms and completed case report forms, should not be kept in the regulatory file and should be filed separately.
The regulatory file template
The regulatory file should contain all the sections pertinent to the particular research study. Unused sections can be omitted and other sections added as needed. If the PI is unsure what sections to include/exclude, the study mentor or study monitor should be consulted. The suggested Table of Contents for the regulatory file is provided below.
95PROJECT MANAGEMENT
1. Index
2.
Title Page: Project/Study Title Name of PI/ co-investigators Name of Mentor Contract Number
3.
Protocol:The initial proposal and ALL subsequent drafts and amendments
• All drafts should contain a draft date and number• The application for ethics approval is attached to the final protocol
4. Consent Form & Information Sheets
5.Investigator CVs: CVs should be signed, dated, and updated regularly to verify that the information is accurate and current.
6.
Investigator Declarations: The Ethics Committee may request a statement on financial or other competing interests with respect to the study, which may present a potential conflict of interest for the investigators
7. Ethics: Approval letters and reference numbers. Include ethics renewals.
8. Other Approvals Department of Health application forms and approval letters
9. Contract/Service Level Agreement10. Incidents/Adverse Events11. Budget and Expenditure Reports
12. Progress Reports: Monthly, Quarterly, Annual
13.
Data Management A blank set of case report forms, data collection sheets, and/or study questionnaires with amendments made over time. Reports
14.
Study Staff • Adverts, CVs & job descriptions for study staff • Valid registration/certification for all professional study staff (e.g., medical or
nursing registration)15. Training Records – Study Staff16. Prescribed Medical Test Records – Study Staff17. Signature Log – Study Staff18. Standard Operating Procedures
19.Correspondence with Funder/Monitor/Mentor All correspondence to and from (e.g. letters, emails, meeting notes, and notes of telephone calls)
20. Manuscripts submitted/Publications/Presentations/Posters
21.Notes To File If documents are maintained electronically, write a note-to-file indicating the location and who maintains them
96 CHAPTER 8
The principal investigator’s regulatory responsibilities
All correspondence between the principal investigator and the funder must be preserved and available on the request of the funder, independent auditors or the ethics committee.
The PI is responsible for keeping track of expenditure and submitting financial reports regularly to the donor (even if the study employs a financial officer). The PI is also responsible for submitting all quarterly narrative reports.
The PI is responsible for the storage of all research data, case-record forms, questionnaires and consent forms and other essential documentation including, the study protocol and amendments, applications to the ethics committee, serious adverse event reports and all other correspondence relating to the study.
If the principal investigator is unable to maintain custody of the study documents, the funder should be informed in writing about the location of the records and the name of the person responsible for their retention. If necessary the funder may inventory and retain, in a sealed container, the investigator’s documents. The means by which prompt access to documentation can be assured should also be stated.
Requirements on completion of the research study
When the research has been completed or is being closed out prior to completion, a final report is submitted to the Ethics Committee, study monitor and funder.
Thereafter, all documentation must be stored for a minimum period of five years.