LEVERAGING TECHNOLOGY TO IMPROVE OPERATIONAL PERFORMANCE
49
LEVERAGING TECHNOLOGY TO IMPROVE OPERATIONAL PERFORMANCE CORPORATE PRESENTATION – FEB 2021 As part of PV3 Optimization, Pinto Valley utilized blast fragmentation technology to increase throughput and reduce energy consumption in the mill
Transcript of LEVERAGING TECHNOLOGY TO IMPROVE OPERATIONAL PERFORMANCE
LEVERAGING TECHNOLOGY TO IMPROVE OPERATIONAL
PERFORMANCE
CORPORATE PRESENTATION – FEB 2021As part of PV3 Optimization, Pinto Valley utilized blast fragmentation technology to increase throughput and reduce energy consumption in the mill

CAUTIONARY NOTE ON FORWARD LOOKING INFORMATIONThis document may contain “forward-looking information” within the meaning of Canadian securities legislation and “forward-looking statements” within the meaning of the United States Private Securities Litigation Reform Act of 1995 (collectively, “forward-looking statements”). These forward-looking statements are made as of the date of this document and the Company does not intend, and does not assume any obligation, to update these forward-looking statements, except as required under applicable securities legislation.
Forward-looking statements relate to future events or future performance and reflect our expectations or beliefs regarding future events and the impacts of the ongoing and evolving COVID-19 pandemic. Forward-looking statements include, but are not limited to, statements with respect to the estimation of Mineral Resources and Mineral Reserves, the expected success of the underground paste backfill system study and tailings filtration project at Cozamin, the PV HydroFloat project, the outcome and timing of the PV4 study, the potential for completion of a Santo Domingo stream agreement with Wheaton Precious Metals Corp., the successful completion of a rail and/ or port agreement with Puerto Ventanas, the success of our strategic process for the Santo Domingo project, the timing and success of the PV3 Optimization project, the realization of Mineral Reserve estimates, the timing and amount of estimated future production, costs of production and capital expenditures and reclamation, the success of our mining operations, the continuing success of mineral exploration, the estimations for potential quantities and grade of inferred resources and exploration targets, Capstone’s ability to fund future exploration activities, environmental risks, unanticipated reclamation expenses and title disputes. The potential effects of the COVID-19 pandemic on our business and operations are unknown at this time, including Capstone’s ability to manage challenges and restrictions arising from COVID-19 in the communities in which Capstone operates and our ability to continue to safely operate and to safely return our business to normal operations. The impact of COVID-19 to Capstone is dependent on a number of factors outside of our control and knowledge, including the effectiveness of the measures taken by public health and governmental authorities to combat the spread of the disease, global economic uncertainties and outlook due to the disease, and the evolving restrictions relating to mining activities and to travel in certain jurisdictions in which we operate.
In certain cases, forward-looking statements can be identified by the use of words such as “anticipates”, “approximately”, “believes”, “budget”, “estimates”, expects”, “forecasts”, “guidance”, intends”, “plans”, “scheduled”, “target”, or variations of such words and phrases, or statements that certain actions, events or results “be achieved”, “could”, “may”, “might”, “occur”, “should”, “will be taken” or “would” or the negative of these terms or comparable terminology. In this document certain forward-looking statements are identified by words including “anticipated”, “expected”, “guidance” and “plan”. By their very nature, forward-looking statements involve known and unknown risks, uncertainties and other factors that may cause our actual results, performance or achievements to be materially different from any future results, performance or achievements expressed or implied by the forward-looking statements. Such factors include, amongst others, risks related to inherent hazards associated with mining operations and closure of mining projects, future prices of copper and other metals, compliance with financial covenants, surety bonding, our ability to raise capital, Capstone’s ability to acquire properties for growth, counterparty risks associated with sales of our metals, use of financial derivative instruments and associated counterparty risks, foreign currency exchange rate fluctuations, market access restrictions or tariffs, changes in general economic conditions, availability of water, accuracy of Mineral Resource and Mineral Reserve estimates, operating in foreign jurisdictions with risk of changes to governmental regulation, compliance with governmental regulations, compliance with environmental laws and regulations, reliance on approvals, licenses and permits from governmental authorities and potential legal challenges to permit applications, contractual risks including but not limited to, our ability to meet the completion test requirements under the Cozamin Silver Stream Agreement with Wheaton Precious Metals, acting as Indemnitor for Minto Exploration Ltd.’s surety bond obligations post divestiture, impact of climate change and changes to climatic conditions at our Pinto Valley and Cozamin operations, changes in regulatory requirements and policy related to climate change and GHG emissions, land reclamation and mine closure obligations, risks relating to widespread epidemics or pandemic outbreak including the COVID-19 pandemic; the impact of COVID-19 on our workforce, suppliers and other essential resources and what effect those impacts, if they occur, would have on our business, including our ability to access goods and supplies, the ability to transport our products and impacts on employee productivity, the risks in connection with the operations, cash flow and results of Capstone relating to the unknown duration and impact of the COVID-19 pandemic, uncertainties and risks related to the potential development of the Santo Domingo Project, increased operating and capital costs, increased cost of reclamation, challenges to title to our mineral properties, increased taxes in jurisdictions the Company operates or is subject to tax, changes in tax regimes we are subject to and any changes in law or interpretation of law may be difficult to react to in an efficient manner, maintaining ongoing social license to operate, dependence on key management personnel, potential conflicts of interest involving our directors and officers, corruption and bribery, limitations inherent in our insurance coverage, labour relations, increasing energy prices, competition in the mining industry including but not limited to competition for skilled labour, risks associated with joint venture partners, our ability to integrate new acquisitions and new technology into our operations, cybersecurity threats, legal proceedings, and other risks of the mining industry as well as those factors detailed from time to time in the Company’s interim and annual financial statements and MD&A of those statements and Annual Information Form, all of which are filed and available for review under the Company’s profile on SEDARat www.sedar.com. Although the Company has attempted to identify important factors that could cause our actual results, performance or achievements to differ materially from those described in our forward-looking statements, there may be other factors that cause our results, performance or achievements not to be as anticipated, estimated or intended. There can be no assurance that our forward-looking statements will prove to be accurate, as our actual results, performance or achievements could differ materially from those anticipated in such statements. Accordingly, readers should not place undue reliance on our forward-looking statements.
CURRENCYAll amounts are in US$ unless otherwise specified.
ALTERNATIVE PERFORMANCE MEASURES“C1 cash cost”, “cash cost”, “adjusted EBITDA”, “operating cash flow before changes in working capital”, “adjusted net income”, “net debt”, “all-in sustaining costs”, “all-in costs” and “available liquidity” are Alternative Performance Measures. Alternative performance measures are furnished to provide additional information. These non-GAAP performance measures are included in this presentation because these statistics are key performance measures that management uses to monitor performance, to assess how the Company is performing, to plan and to assess the overall effectiveness and efficiency of mining operations. These performance measures do not have a standard meaning within IFRS and, therefore, amounts presented may not be comparable to similar data presented by other mining companies. These performance measures should not be considered in isolation as a substitute for measures of performance in accordance with IFRS. For full information, please refer to the Company’s latest Management Discussion and Analysis published on its Financial Reporting webpage or on SEDAR.
COMPLIANCE WITH NI 43-101Unless otherwise indicated, Capstone has prepared the technical information in this document (“Technical Information”) based on information contained in the technical reports, Annual Information Form and news releases (collectively the “Disclosure Documents”) available under Capstone Mining Corp.’s company profile on SEDAR at www.sedar.com. Each Disclosure Document was prepared by or under the supervision of a qualified person (a “Qualified Person”) as defined in National Instrument 43-101 – Standards of Disclosure for Mineral Projects of the Canadian Securities Administrators (“NI 43-101”). Readers are encouraged to review the full text of the Disclosure Documents which qualifies the Technical Information. Readers are advised that Mineral Resources that are not Mineral Reserves do not have demonstrated economic viability. The Disclosure Documents are each intended to be read as a whole, and sections should not be read or relied upon out of context. The Technical Information is subject to the assumptions and qualifications contained in the Disclosure Documents.
Disclosure Documents include the National Instrument 43-101 compliant technical reports titled "NI 43-101 Technical Report on the Cozamin Mine, Zacatecas, Mexico" effective October 23, 2020, “Pinto Valley Mine Life Extension – Phase 3 (PV3) Pre-Feasibility Study” effective January 1, 2016 and “Santo Domingo Project, Region III, Chile, NI 43-101 Technical Report” effective February 19, 2020.
The disclosure of scientific and Technical Information in this MD&A was reviewed and approved by Brad Mercer, P. Geol., Senior Vice President and Chief Operating Officer (technical information related to mineral exploration activities and to Mineral Resources at Cozamin), Clay Craig, P.Eng, Manager, Mining & Evaluations (technical information related to Mineral Reserves and Mineral Resources at Pinto Valley), Tucker Jensen, Superintendent Mine Operations, P.Eng (technical information related to Mineral Reserves at Cozamin) and Albert Garcia III, PE, Vice President, Projects (technical information related to project updates at Santo Domingo) all Qualified Persons under NI 43-101.
ADDITIONAL REFERENCE MATERIALSRefer to the Company’s news release of February 24, 2021 and MD&A and Financial Statements for the three and full year ended December 31, 2020, for full details to the information referenced throughout this presentation.
Cautionary Notes
CAPSTONE MINING (TSX:CS) • 2

3-Year Growth of Over 100% Positions Capstone to Premier Mid-tier Status
CAPSTONE MINING (TSX:CS) • 3
UNLOCKING TRANSFORMATIONAL GROWTH~200,000 tpa copper producer
• Long Reserve life and large Resource upside in prolific mining district with consolidation opportunity
• Optimization and innovation leading to higher production, lower costs and improved ESG performance (coarse particle flotation, Jetti technology, blast fragmentation)
• Expected to generate over $1 billion after-tax cash flow* in next three years• Lowest G&A per pound in peer group with near zero interest costs• Positioned to grow production to 375 to 440 million pounds in 2024 from 200
million pounds per year in 2022-2023• ~95% of revenues are from copper
• Low cost, first quartile mine generating free cash flow every year since 2006 start• Current 10-year operational outlook is strongest in its history, at higher grades and
lower costs• Exploration expansion potential – open in multiple directions
• At today’s copper and iron prices*, would generate $1 billion in cashflows in year 1 of operations, pay-back period of five quarters (1.25 years)
• Advanced negotiations for gold stream, port and rail and cobalt stream• Construction start in H2 2021
DEBT FREE IN 2021
BALANCE SHEET
HIGH PRODUCTION, LOWER COSTS
PINTO VALLEY
1st QUARTILE COSTS, EXPLORATION UPSIDE
COZAMIN
FULLY PERMITTED, CONSTRUCTION READY
SANTO DOMINGO
2024*At $4 per pound copper
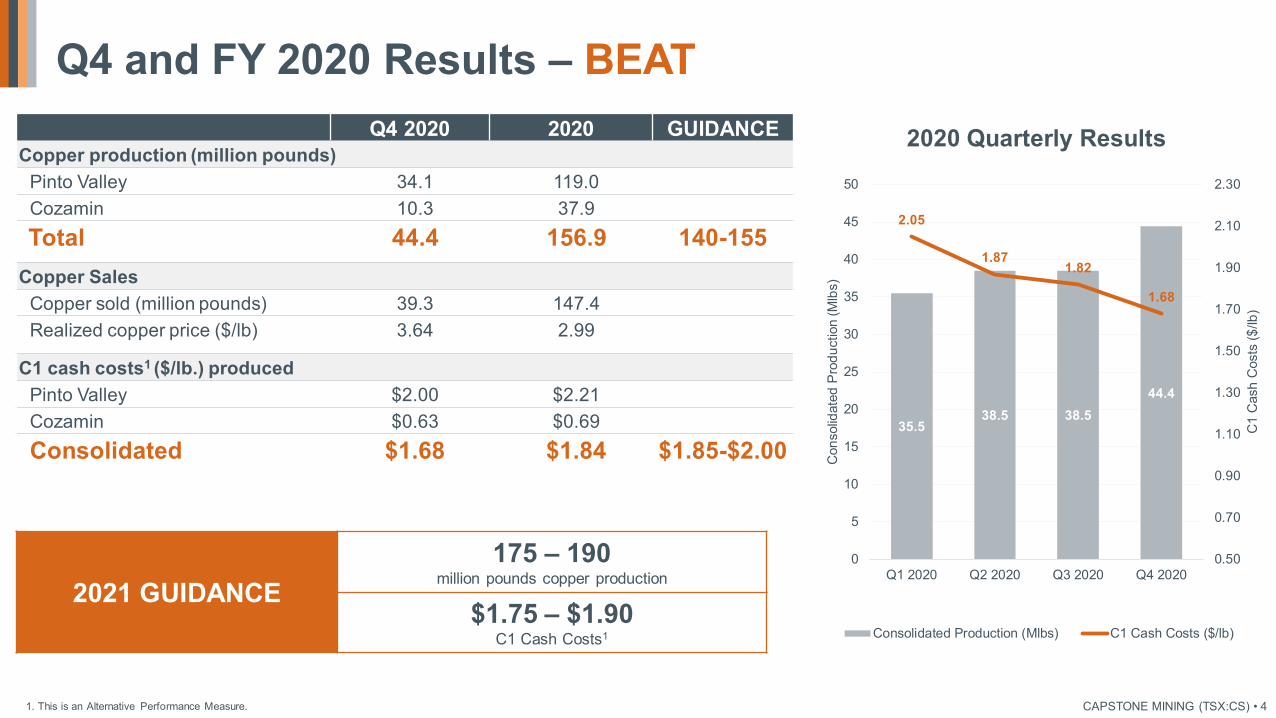
35.538.5 38.5
44.4
2.05
1.871.82
1.68
0.50
0.70
0.90
1.10
1.30
1.50
1.70
1.90
2.10
2.30
0
5
10
15
20
25
30
35
40
45
50
Q1 2020 Q2 2020 Q3 2020 Q4 2020
C1
Cas
h C
osts
($/lb
)
Con
solid
ated
Pro
duct
ion
(Mlb
s)
2020 Quarterly Results
Consolidated Production (Mlbs) C1 Cash Costs ($/lb)
Q4 2020 2020 GUIDANCECopper production (million pounds)
Pinto Valley 34.1 119.0Cozamin 10.3 37.9Total 44.4 156.9 140-155
Copper SalesCopper sold (million pounds) 39.3 147.4Realized copper price ($/lb) 3.64 2.99
C1 cash costs1 ($/lb.) producedPinto Valley $2.00 $2.21Cozamin $0.63 $0.69Consolidated $1.68 $1.84 $1.85-$2.00
1. This is an Alternative Performance Measure.
Q4 and FY 2020 Results – BEAT
2021 GUIDANCE175 – 190
million pounds copper production
$1.75 – $1.90 C1 Cash Costs1
CAPSTONE MINING (TSX:CS) • 4

• Published interim ESG-sustainability report and achieved new safety records
• $150 million for 50% Cozamin silver stream resulting in a net debt zero balance sheet
PINTO VALLEY• Phase 1 PV3 Optimization completed, leading to 10% higher throughput with 5% lower
costs
• Pioneered Jetti Resources catalytic leaching technology to significantly increase cathode production from waste tonnes
• Successful pilot plant testing of Eriez HydroFloat coarse particle flotation technology demonstrating 6% or higher copper recovery potential
COZAMIN• One-way ramp expansion completed with 10+ year mine life applying paste
backfill technology with tailings to increase copper ore extraction capability underground
SANTO DOMINGO• Released PEA for cobalt production with annual 10MIb+ per year battery-grade cobalt
production at -$4 per pound cost potential
• Entered into MOU with Puerto Ventanas for port and rail infrastructure sharing
2020 Highlights
Coarse particle flotation concentrate +300μm recovered from tailings stream at Pinto Valley pilot plant trial – Dec 2020
LEVERAGING NEW TECHNOLOGY TO INCREASE COPPER RECOVERY
CAPSTONE MINING (TSX:CS) • 5
Recovered copper will be sent to regrind mill and flotation circuit

• Capstone has pipeline of low capital, high return brownfield growth projects at Pinto Valley and Cozamin
• Unhedged copper cash flow to build equity
$-
~$200
~$400
~$600
~$800
~$1,000
~$1,200
~$1,400
$3.00 $3.50 $4.00 $4.50 $5.00(U
S$ m
illion
s)Per Pound Copper Price
Balance Sheet is Positioned to Power Our Transformation
CAPSTONE MINING (TSX:CS) • 6*Based on December 31, 2020 net debt balance of $124.9 million and $150 million stream proceeds. **OCF is operating cash flow, inclusive of tax and interest payments. OCF forecasts assume Ag pricing of $26/oz
2021E-2023E Cumulative After-Tax Operating Cash Flow**
Shares Outstanding (as at Dec 31/20)
409 million
Market Cap (as at Feb 22/21)
US$1,252 million
Net Cash* US$25 million
Enterprise Value(as at Feb 22/21)
US$1,227 million
Currently
NET CASH DEBT FREEin 2021

1.56x
2.61x 2.54x
1.62x
0.88x
0.000.501.001.502.002.503.00
Q4/19 Q1/20 Q2/20 Q3/20 Q4/20
USD
$/lb
Net Debt/EBITDADebt Free in 2021
-0.02-0.04
0.000.02
0.09
-0.06
-0.01
0.04
0.09
0.14
Q4/19 Q1/20 Q2/20 Q3/20 Q4/20
USD
Adjusted EPSYE2020 $0.07
20
-3
2445
65
-200
20406080
Q4/19 Q1/20 Q2/20 Q3/20 Q4/20
USD
mill
ions
OCF (After-Tax) Before Changes in WCYE2020 $131M
16 11 13
5264
0
20
40
60
80
Q4/19 Q1/20 Q2/20 Q3/20 Q4/20
USD
mill
ions
Adjusted EBITDAYE2020 $139M
Adjusted EPS, Adjusted EBITDA and Operating Cash Flow (After-Tax) Before Changes in Working Capital are Alternative Performance Measures. Please refer to the Q4 2020 MD&A for full information.
Financial Transformation Q4 and FY 2020 Financial Results
CAPSTONE MINING (TSX:CS) • 7

0.00
0.50
1.00
1.50
2.00
2.50
3.00
3.50
4.00
4.50
5.00
0.00
0.50
1.00
1.50
2.00
2.50
3.00
3.50
4.00
4.50
5.00
Jan-2007 Jan-2008 Jan-2009 Jan-2010 Jan-2011 Jan-2012 Jan-2013 Jan-2014 Jan-2015 Jan-2016 Jan-2017 Jan-2018 Jan-2019 Jan-2020 Jan-2021
Cop
per P
rice
(US$
/lb)
CS
Shar
e Pr
ice
(C$
per s
hare
)
CS Share Price (C$ per share) Copper Price (US$ /lb.)
Positioning to Recapture a ZERO Net Debt Valuation
(US$) 2007 2008 2009 2010 2011 2012 2013 2014 2015 2016 2017 2018 2019 2020 2021E-23E
Shares outstanding 81 165 197 201 376 381 380 382 382 392 392 400 400 409 409
Enterprise Value (EV) $M $205 $118 $421 $727 $542 $423 $1,280 $797 $371 $567 $572 $329 $398 $9272 $9624
Production (Mlbs) 14 73 89 78 83 83 112 227 203 253 199 155 153 157 ~200
C1 Cash Cost $/lb. $0.54 $1.25 $1.03 $1.40 $1.45 $1.50 $1.72 $1.93 $1.99 $1.44 $1.92 $1.831 $1.781 $1.84 ~$1.70
Net Debt ($M) -$25 -$5 -$108 -$181 -$486 -$500 $208 $128 $249 $199 $159 $150 $165 $1253 Target $0
EV is market capitalisation + net debt. C1 cash costs is an alternative performance measure.1) From continuing operations (excl. Minto). 2) As of Dec 31, 2020. 3) As of Dec 31, 2020; stream transaction closes January 2021. 4) EV as of Feb 17, 2021, less 2020 net debt.
2013 Acquired Pinto Valley
Feb 2021 Zero Net Debt
$3.00/lb Cu
2011 Acquired Santo Domingo
CAPSTONE MINING (TSX:CS) • 8
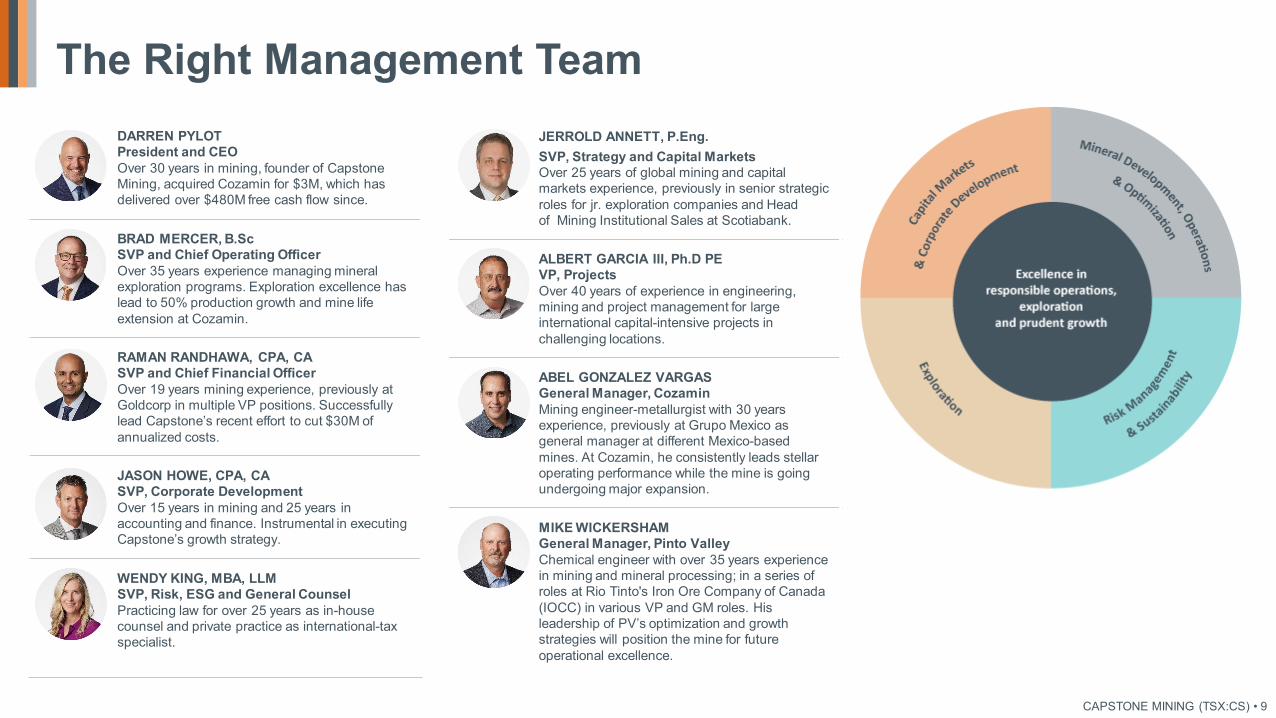
The Right Management Team
CAPSTONE MINING (TSX:CS) • 9
DARREN PYLOTPresident and CEO Over 30 years in mining, founder of Capstone Mining, acquired Cozamin for $3M, which has delivered over $480M free cash flow since.
BRAD MERCER, B.ScSVP and Chief Operating Officer Over 35 years experience managing mineral exploration programs. Exploration excellence has lead to 50% production growth and mine life extension at Cozamin.
RAMAN RANDHAWA, CPA, CASVP and Chief Financial Officer Over 19 years mining experience, previously at Goldcorp in multiple VP positions. Successfully lead Capstone’s recent effort to cut $30M of annualized costs.
JASON HOWE, CPA, CASVP, Corporate DevelopmentOver 15 years in mining and 25 years in accounting and finance. Instrumental in executing Capstone’s growth strategy.
WENDY KING, MBA, LLMSVP, Risk, ESG and General Counsel Practicing law for over 25 years as in-house counsel and private practice as international-tax specialist.
JERROLD ANNETT, P.Eng.SVP, Strategy and Capital MarketsOver 25 years of global mining and capital markets experience, previously in senior strategic roles for jr. exploration companies and Head of Mining Institutional Sales at Scotiabank.
ALBERT GARCIA III, Ph.D PEVP, ProjectsOver 40 years of experience in engineering, mining and project management for large international capital-intensive projects in challenging locations.
ABEL GONZALEZ VARGASGeneral Manager, CozaminMining engineer-metallurgist with 30 years experience, previously at Grupo Mexico as general manager at different Mexico-based mines. At Cozamin, he consistently leads stellar operating performance while the mine is going undergoing major expansion.
MIKE WICKERSHAMGeneral Manager, Pinto ValleyChemical engineer with over 35 years experience in mining and mineral processing; in a series of roles at Rio Tinto's Iron Ore Company of Canada (IOCC) in various VP and GM roles. His leadership of PV’s optimization and growth strategies will position the mine for future operational excellence.

Pinto Valley
Jetti Catalytic Leach Technology- Dump leach expected to deliver up to 350 million pounds of copper cathode over next 19 years- PV4 Study to include increased use of leaching technology to reduce waste tonnes in mine plan (2022)- Opportunity to use water from brownfield district mine sites to recover dissolved copper and decrease fresh water consumption
Pyrite Agglomeration- A PFS study to agglomerate a mill stream containing chalcopyrite and pyrite minerals with dump leach rock to further reduce copper losses to tailings by 2 to 3%- Pyrite will enhance free-acid generation, thereby reducing operating costs and should lead to improved leach kinetics
Coarse Particle Floatation- Eriez HydroFloat technology is expected to increase copper recovery by over 6%, leading to a decrease of copper losses to tailings by 40%- Other benefits may include a decrease in water and power consumption
Cozamin
Paste Backfill- Approximately half of the filtered tailings will be combined with cement to form a paste and pumped underground to build support pillars, allowing for increased copper ore extraction- This project has extended the mine life through to 2031 and will give the optionality to extract ore pillars from historic areas of the mine
Santo Domingo
Cobalt Project- A tailing stream containing pyrite, laden with ~0.5% cobalt, will be recovered through floatation. The concentrate will be sent to a conventional process of roasting and solvent extraction followed by crystallization to produce battery-grade cobalt sulphate heptahydrate- At 10.4 million pounds of cobalt production per year, this will be one of the largest and lowest cost cobalt producers in the world at -$4 per poundAdditional benefits: - By-product sulphuric acid production from pyrite roasting process can be used for heap leaching to produce low-cost copper cathodes at Santo Domingo and in the district
Recovering Green Metals from Waste Streams
CAPSTONE MINING (TSX:CS) • 10
2020 H1 2022 H2 2022 H1 2023 2025
Optimization, Innovation and Expansion at Pinto Valley
Jetti Resources catalytic technology pioneered by Capstone is expected to recover up to 350 million pounds of copper from mineralized waste mined at Pinto Valley over the next 19 years
1. Refer to Appendix slide “Pinto Valley Reserves and Resources” and the Company’s 2019 Annual Information Form for full details.
Pinto Valley: Only Operating Mine In This Historic District
CAPSTONE MINING (TSX:CS) • 12
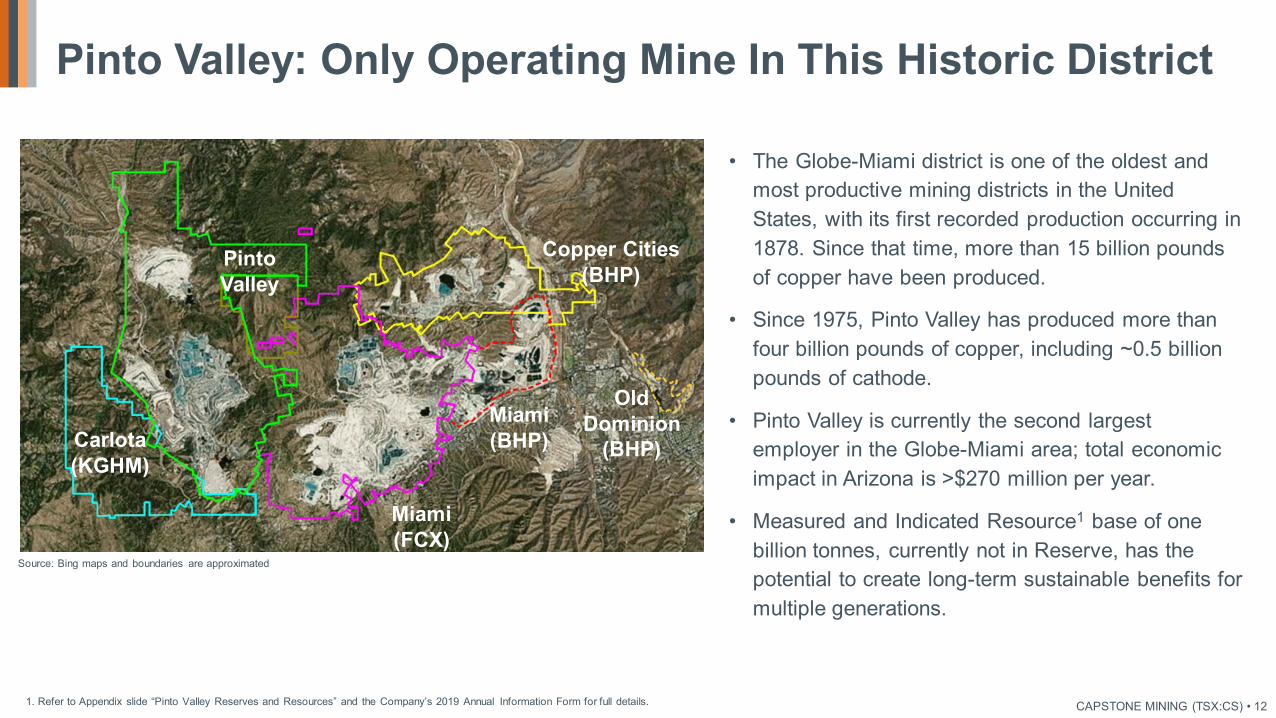
• The Globe-Miami district is one of the oldest and most productive mining districts in the United States, with its first recorded production occurring in 1878. Since that time, more than 15 billion pounds of copper have been produced.
• Since 1975, Pinto Valley has produced more than four billion pounds of copper, including ~0.5 billion pounds of cathode.
• Pinto Valley is currently the second largest employer in the Globe-Miami area; total economic impact in Arizona is >$270 million per year.
• Measured and Indicated Resource1 base of one billion tonnes, currently not in Reserve, has the potential to create long-term sustainable benefits for multiple generations.
Carlota(KGHM)
Pinto Valley
Miami (FCX)
Copper Cities (BHP)
Miami (BHP)
Old Dominion
(BHP)
Source: Bing maps and boundaries are approximated

2020 Guidance Mid-point of the 2020 cost and production guidance ranges reported in the Company’s news release of January 22, 2020.1. Refer to Appendix slide “Pinto Valley Reserves and Resources” and the Company’s 2019 Annual Information Form for full details.
Pinto Valley – Higher Throughput and Higher Recovery
CAPSTONE MINING (TSX:CS) • 13
An Exciting Catalyst-Rich Future2021PV3 Optimization and Innovation• Pilot plant testing of Eriez HydroFloat coarse particle flotation technology
in Dec 2020 surpassed our 6% improvement target to overall copper recovery, results expected in Feb 2021
• Cathode production from mineralized waste using Jetti Resources technology continues to ramp up
• First full-year usage of blast fragmentation technology
• All PV3 Optimization projects will be included in an updated NI 43-101 Technical Report expected in H2 2021
2022PV4 StudyPV4 is evaluating the long-term growth potential of over 1.36 billion tonnesof Measured and Indicated Resources1 (inclusive of Reserves) at 0.30% copper. Scenarios include increased mining rates, higher mill grades and increased leaching.
$0.50
$0.70
$0.90
$1.10
$1.30
$1.50
$1.70
$1.90
$2.10
$2.30
0
20
40
60
80
100
120
140
160
2020A 2021G 2022E-2023E
C1
cash
cos
ts $
/lb
Tota
l Est
. Cu
Prod
uctio
n (M
lbs)
Higher Production with Lower Costs
Cu in Cathode Cu in Concentrate C1 cash cost ($/lb.)
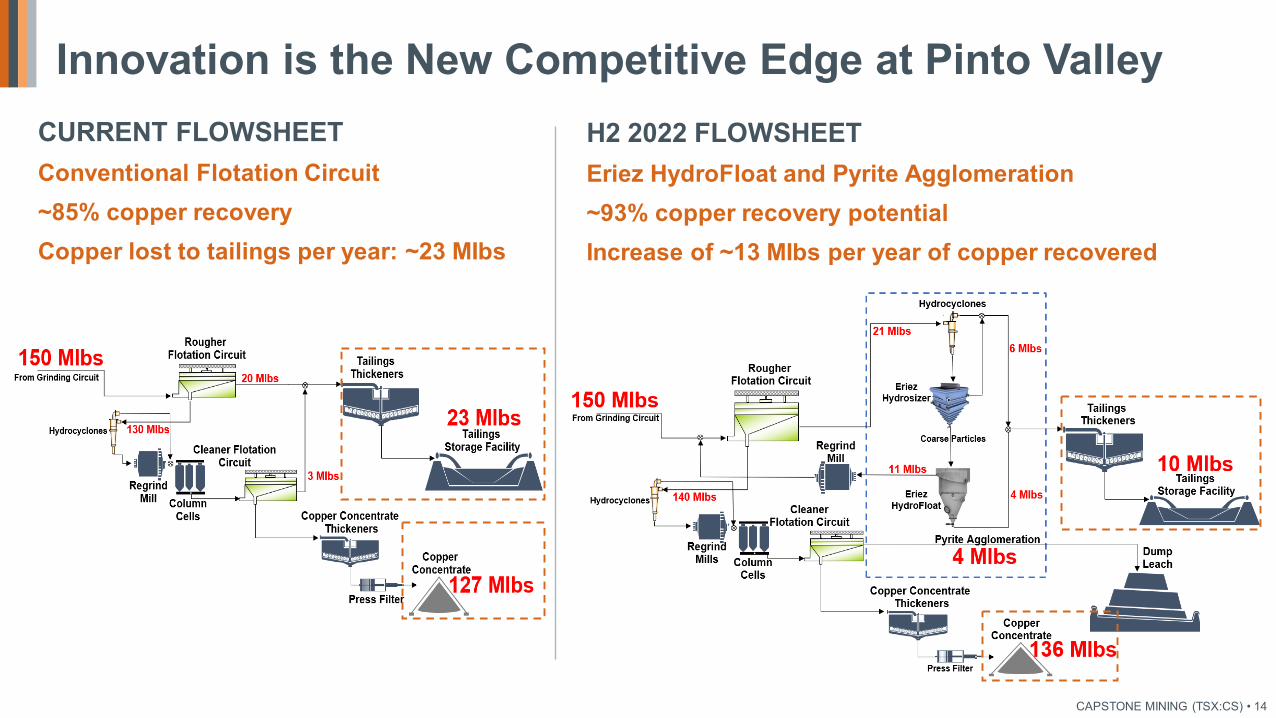
Innovation is the New Competitive Edge at Pinto ValleyCURRENT FLOWSHEETConventional Flotation Circuit~85% copper recoveryCopper lost to tailings per year: ~23 MIbs
H2 2022 FLOWSHEET Eriez HydroFloat and Pyrite Agglomeration~93% copper recovery potentialIncrease of ~13 MIbs per year of copper recovered
CAPSTONE MINING (TSX:CS) • 14
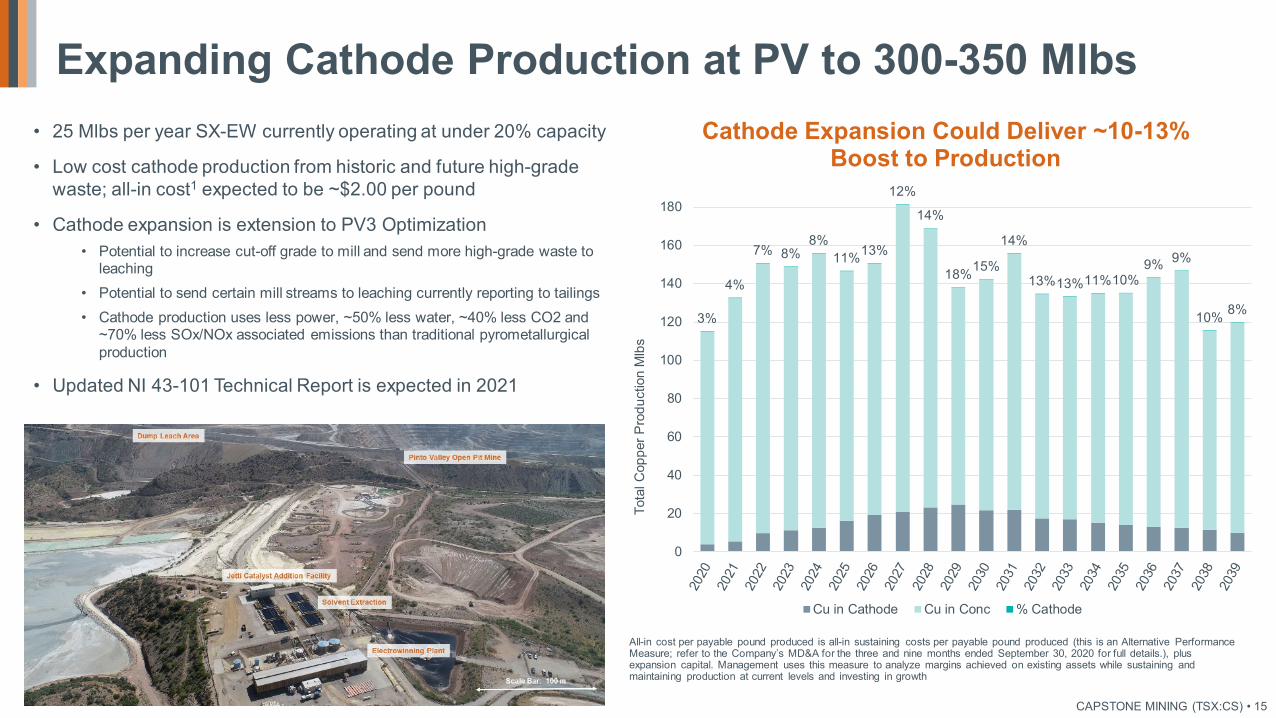
• 25 Mlbs per year SX-EW currently operating at under 20% capacity
• Low cost cathode production from historic and future high-grade waste; all-in cost1 expected to be ~$2.00 per pound
• Cathode expansion is extension to PV3 Optimization• Potential to increase cut-off grade to mill and send more high-grade waste to
leaching• Potential to send certain mill streams to leaching currently reporting to tailings• Cathode production uses less power, ~50% less water, ~40% less CO2 and
~70% less SOx/NOx associated emissions than traditional pyrometallurgical production
• Updated NI 43-101 Technical Report is expected in 2021
Expanding Cathode Production at PV to 300-350 Mlbs
CAPSTONE MINING (TSX:CS) • 15
3%
4%
7% 8%8%
11%13%
12%
14%
18%15%
14%
13%13%11%10%9% 9%
10% 8%
0
20
40
60
80
100
120
140
160
180
Tota
l Cop
per P
rodu
ctio
n M
lbs
Cathode Expansion Could Deliver ~10-13% Boost to Production
Cu in Cathode Cu in Conc % Cathode
All-in cost per payable pound produced is all-in sustaining costs per payable pound produced (this is an Alternative PerformanceMeasure; refer to the Company’s MD&A for the three and nine months ended September 30, 2020 for full details.), plus expansion capital. Management uses this measure to analyze margins achieved on existing assets while sustaining and maintaining production at current levels and investing in growth

Cozamin 10+ Year Mine Life"The Best Years Are Ahead"

Cozamin's Proven Track Record – Best is Yet to Come
2007 first full year of production
+500 Mlbscopper produced
+19 Mozssilver produced
~$500 Mcumulative free cash flow
to date
2007-2020
CAPSTONE MINING (TSX:CS) • 17
New Technical Report
+512 Mlbscopper production
16 Mozssilver production2
$570 M3
LOM free cash flow with 50% silver stream
2021E-2030E1
Impact23 Growth Projects
Exploration expansion potential in East and West Targets
Enhanced Pillar Recovery
Reduced Stope Dilution
Truckless Headings/Ore Passes
Alternative mining techniques and ore sorting technology
2031+
Production is contained. 1. 2021E-2023E based on 2021 LOMP released in the Company’s news release of January 27, 2021.2. 50% of payable silver production is subject to Wheaton’s stream transaction.3. FCF Cu price 2021-2024 $3.50/lb., 2025+ $3.25/lb and Ag price 2021-2024 $26/oz, 2025+ $22/oz.
0
10
20
30
40
50
60
70
80
2018 2019 2020 2021 2022 2023 2024 2025 2026 2027 2028 2029 2030 2031
Cop
per P
rodu
ctio
n (M
lbs) Mine Plan
Update LOMPExpected Copper
Production
Reserves Million
Tonnes1
% Cu Grade
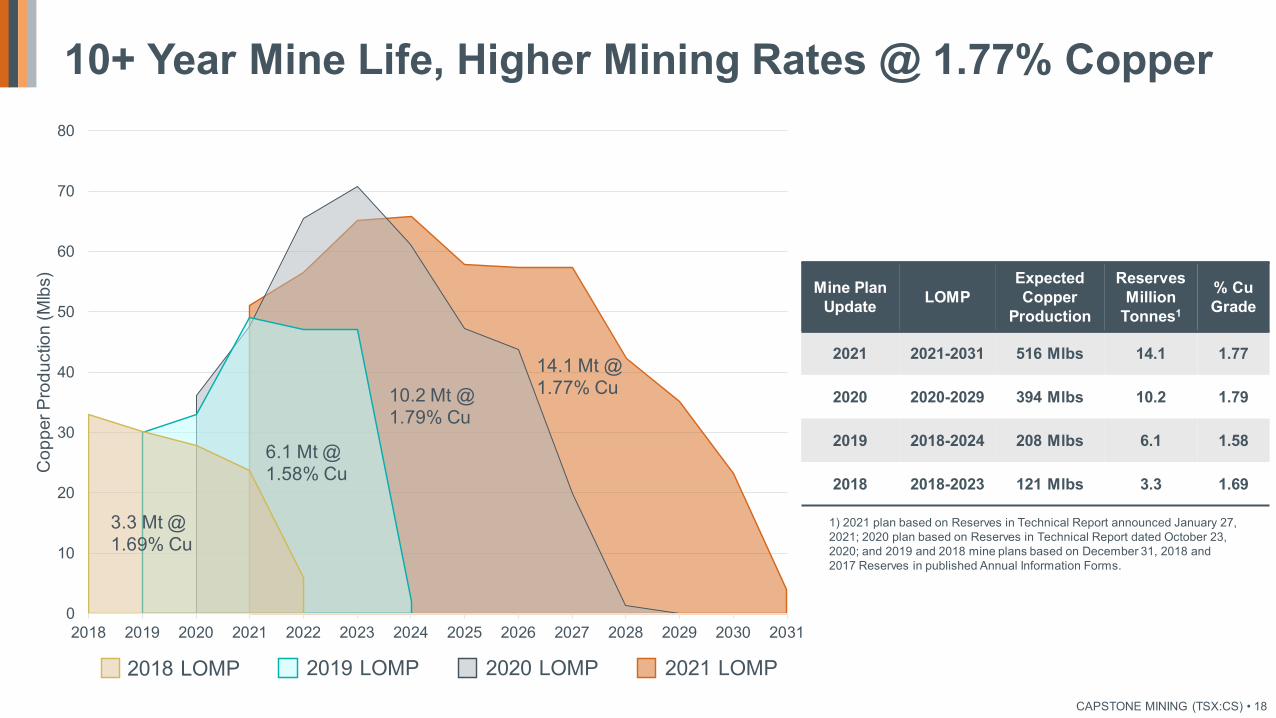
2021 2021-2031 516 Mlbs 14.1 1.77
2020 2020-2029 394 Mlbs 10.2 1.79
2019 2018-2024 208 Mlbs 6.1 1.58
2018 2018-2023 121 Mlbs 3.3 1.69
10+ Year Mine Life, Higher Mining Rates @ 1.77% Copper
1) 2021 plan based on Reserves in Technical Report announced January 27, 2021; 2020 plan based on Reserves in Technical Report dated October 23, 2020; and 2019 and 2018 mine plans based on December 31, 2018 and 2017 Reserves in published Annual Information Forms.
3.3 Mt @ 1.69% Cu
6.1 Mt @1.58% Cu
10.2 Mt @ 1.79% Cu
14.1 Mt @ 1.77% Cu
2021 LOMP2020 LOMP2019 LOMP2018 LOMPCAPSTONE MINING (TSX:CS) • 18
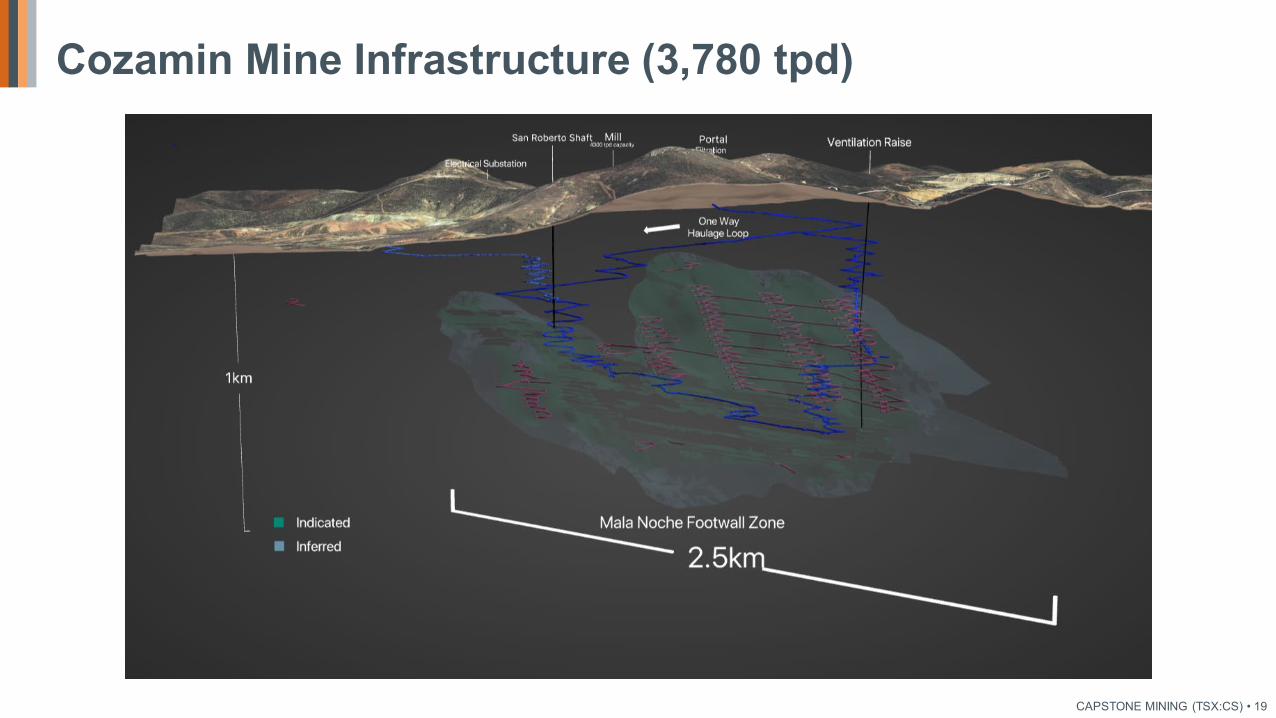
Cozamin Mine Infrastructure (3,780 tpd)
CAPSTONE MINING (TSX:CS) • 19

Cozamin Brownfield – MNFWZ West Expansion Target
MNFWZ West is an extension of Vein 20 recently identified by extensive review of historical drilling data
The West target is easily accessible from both the MNV and MNFWZ infrastructure
Surface drilling will begin in Q1 2021
Development of the West crosscuts will start in Q1 2021, shifting to underground drilling in 2022
CAPSTONE MINING (TSX:CS) • 20
$5M budgeted in 2021 for 40,000 meters primarily targeting the MNFWZ West target

GOAL: Extend mine life, increase environmental & safety performance and improve operational efficiencies utilizing mineral resources already discovered in addition to testing new targets
Exploration Expansion Potential in the East and West Targets
Drill testing the newly recognized West target area with 40km of surface drilling in 2021 and the East target area in 2022
Enhanced Pillar Recovery Reviewing short-term and long-term opportunities for additional recovery potential of pillars in the historic areas of the mine
Stope Dilution Minimizing dilution site-wide through improved engineering, planning, long-hole drill control and optimized explosives design
Truckless Headings Redesigning the upper areas of the Reserves to ore pass use, increasing safety and efficiency, while increasing air quality
Alternative Mining Techniques and Ore Sorting Technology
Lower costs and dilution to convert resources to reserves from MNFWZ Indicated Resources
Impact23 Growth Projects
MNFWZ Indicated (I)
Tonnes(kt)
Copper(%)
Silver(g/t)
Zinc(%)
Lead(%)
Copper Metal(kt)
Silver Metal(koz)
Zinc Metal(kt)
Lead Metal(kt)
Copper-Silver Zones 9,472 1.56 35 0.51 0.05 148 10,796 48 4Zinc-Lead-Silver Zones 4,138 0.38 28 2.22 0.98 16 3,786 92 41Please refer to Table 4 of the Company’s January 27, 2021 news release for full details of the Mineral Resource estimate.
CAPSTONE MINING (TSX:CS) • 21

Santo Domingo: Unlocking Transformational Growth
CAPSTONE MINING (TSX:CS) • 22

Santo Domingo in the Middle of a Growing Mining District
(TSX:CS) • 23
~1,000m above sea level20 kmREGION III, CHILE
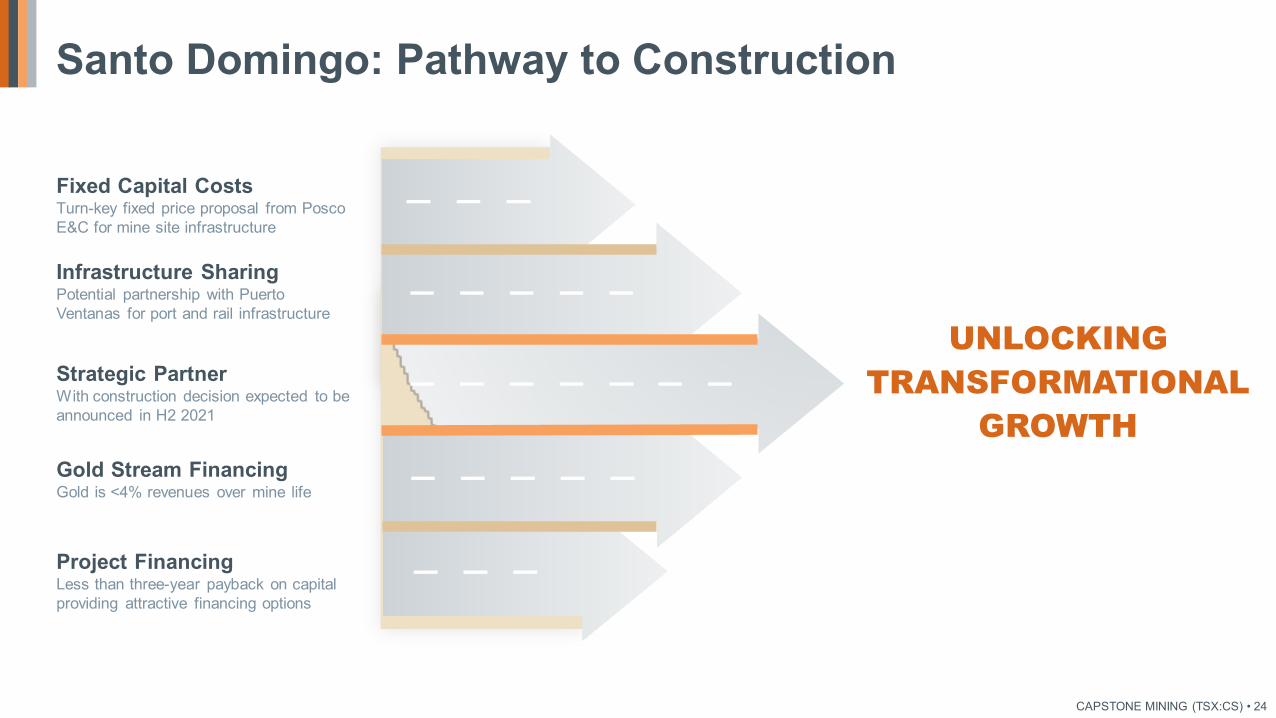
Infrastructure SharingPotential partnership with Puerto Ventanas for port and rail infrastructure
Fixed Capital CostsTurn-key fixed price proposal from PoscoE&C for mine site infrastructure
Santo Domingo: Pathway to Construction
UNLOCKING TRANSFORMATIONAL
GROWTH
Project FinancingLess than three-year payback on capital providing attractive financing options
Gold Stream FinancingGold is <4% revenues over mine life
CAPSTONE MINING (TSX:CS) • 24
Strategic PartnerWith construction decision expected to be announced in H2 2021

• Debt free in 2021• Sustainable 200 Mlbs copper producer by 2022Corporate
• Coarse particle flotation decision in H1 2021• Pyrite agglomeration decision in H1 2021• PV3 Optimization projects completed in H2 2021• Release of updated Technical Report in H2 2021
Pinto Valley
• Ramp up to 3,780 tpd on track for end of Q1 2021• MNFWZ and MNV West exploration expansion is ongoingCozamin
• Update on gold stream and port and rail MOU in H1 2021• Strategic partner and financing announcement and construction
commencing in H2 2021Santo Domingo
2021 Catalysts
CAPSTONE MINING (TSX:CS) • 25

E = company estimate, guidance is only provided for the current year.G = is mid-point of guidance for consolidated copper production and C1 costs.*With silver stream for 50% of silver production, commenced Dec 2020. **Assumes Santo Domingo gold stream sold to help fund initial capex.
Transformational Growth in 2024
CAPSTONE MINING (TSX:CS) • 26
157 Mlbs183 Mlbs
~200 Mlbs
~375 Mlbs
~440 Mlbs
$0.50
$0.70
$0.90
$1.10
$1.30
$1.50
$1.70
$1.90
$2.10
$2.30
0
50
100
150
200
250
300
350
400
450
500
2020A 2021G 2022E-2023E
2024E50% of SD
2024E70% of SD
C1
cash
cos
ts $
/lb
Tota
l Est
. Cu
Prod
uctio
n (M
lbs)
50% adds 165 Mlbs and 70% adds 230 Mlbs
50%
San
to D
omin
go
70%
San
to D
omin
go
Transformational copper production growth with Santo Domingo 2024**
$0.50
$0.70
$0.90
$1.10
$1.30
$1.50
$1.70
$1.90
$2.10
$2.30
0
10
20
30
40
50
60
70
2020A 2021G 2022E-2023E
C1
cash
cos
ts $
/lb
Tota
l Est
. Cu
Prod
uctio
n (M
lbs)
Cozamin C1 Cost <$1.00 Per Pound*
Cu Production C1 cash cost ($/lb.)
~200 Mlbs sustainable copper production2022-2023
Pinto Valley• PV4 study released;
evaluating scenarios for increased mining rates, higher mill grades and increased leaching (2022)
Cozamin• Impact23 Growth Project
report (2023)• Paste backfill plant and
pillar recovery to start (2023)
Santo Domingo• Cobalt feasibility announced
and permitting underway (2022)
$0.50
$0.70
$0.90
$1.10
$1.30
$1.50
$1.70
$1.90
$2.10
$2.30
0
20
40
60
80
100
120
140
160
2020A 2021G 2022E-2023E
C1
cash
cos
ts $
/lb
Tota
l Est
. Cu
Prod
uctio
n (M
lbs)
Pinto ValleyHigher Production with Lower Costs
Cu in CathodeCu in Concentrate

APPENDIX
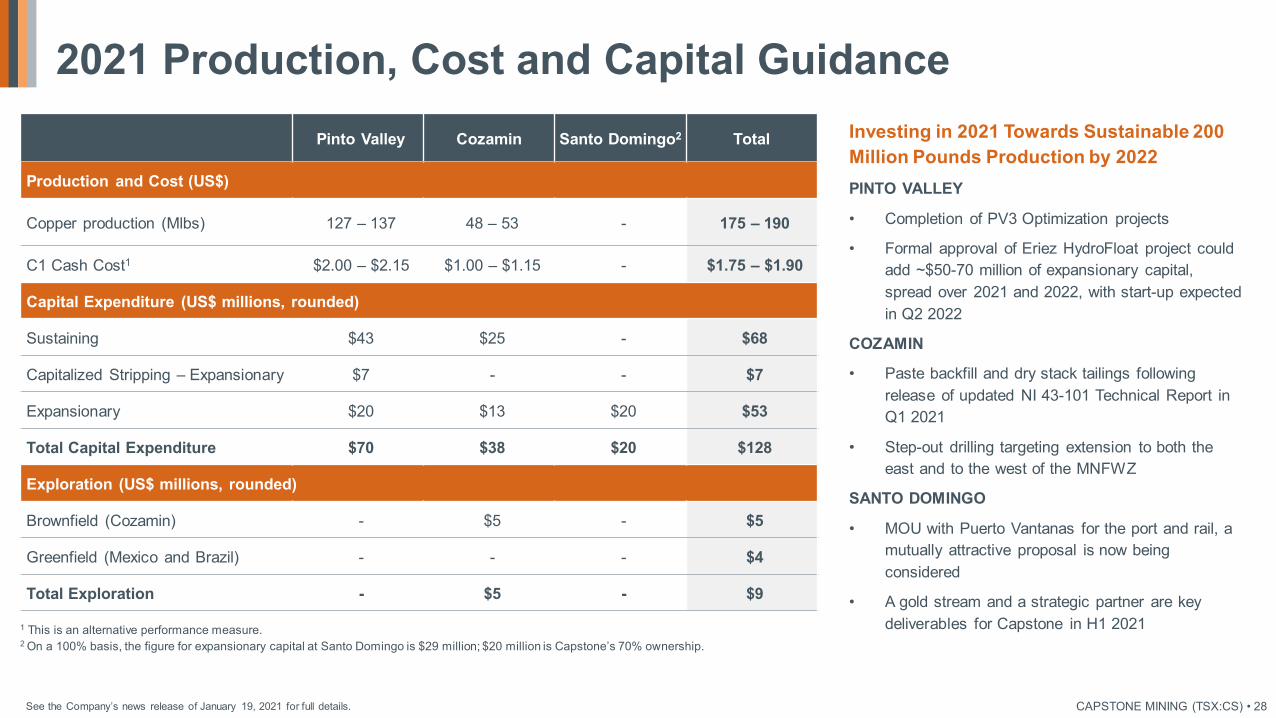
Investing in 2021 Towards Sustainable 200 Million Pounds Production by 2022PINTO VALLEY
• Completion of PV3 Optimization projects
• Formal approval of Eriez HydroFloat project could add ~$50-70 million of expansionary capital, spread over 2021 and 2022, with start-up expected in Q2 2022
COZAMIN
• Paste backfill and dry stack tailings following release of updated NI 43-101 Technical Report in Q1 2021
• Step-out drilling targeting extension to both the east and to the west of the MNFWZ
SANTO DOMINGO
• MOU with Puerto Vantanas for the port and rail, a mutually attractive proposal is now being considered
• A gold stream and a strategic partner are key deliverables for Capstone in H1 2021
Pinto Valley Cozamin Santo Domingo2 Total
Production and Cost (US$)
Copper production (Mlbs) 127 – 137 48 – 53 - 175 – 190
C1 Cash Cost1 $2.00 – $2.15 $1.00 – $1.15 - $1.75 – $1.90
Capital Expenditure (US$ millions, rounded)
Sustaining $43 $25 - $68
Capitalized Stripping – Expansionary $7 - - $7
Expansionary $20 $13 $20 $53
Total Capital Expenditure $70 $38 $20 $128
Exploration (US$ millions, rounded)
Brownfield (Cozamin) - $5 - $5
Greenfield (Mexico and Brazil) - - - $4
Total Exploration - $5 - $9
1 This is an alternative performance measure.2 On a 100% basis, the figure for expansionary capital at Santo Domingo is $29 million; $20 million is Capstone’s 70% ownership.
See the Company’s news release of January 19, 2021 for full details.
2021 Production, Cost and Capital Guidance
CAPSTONE MINING (TSX:CS) • 28
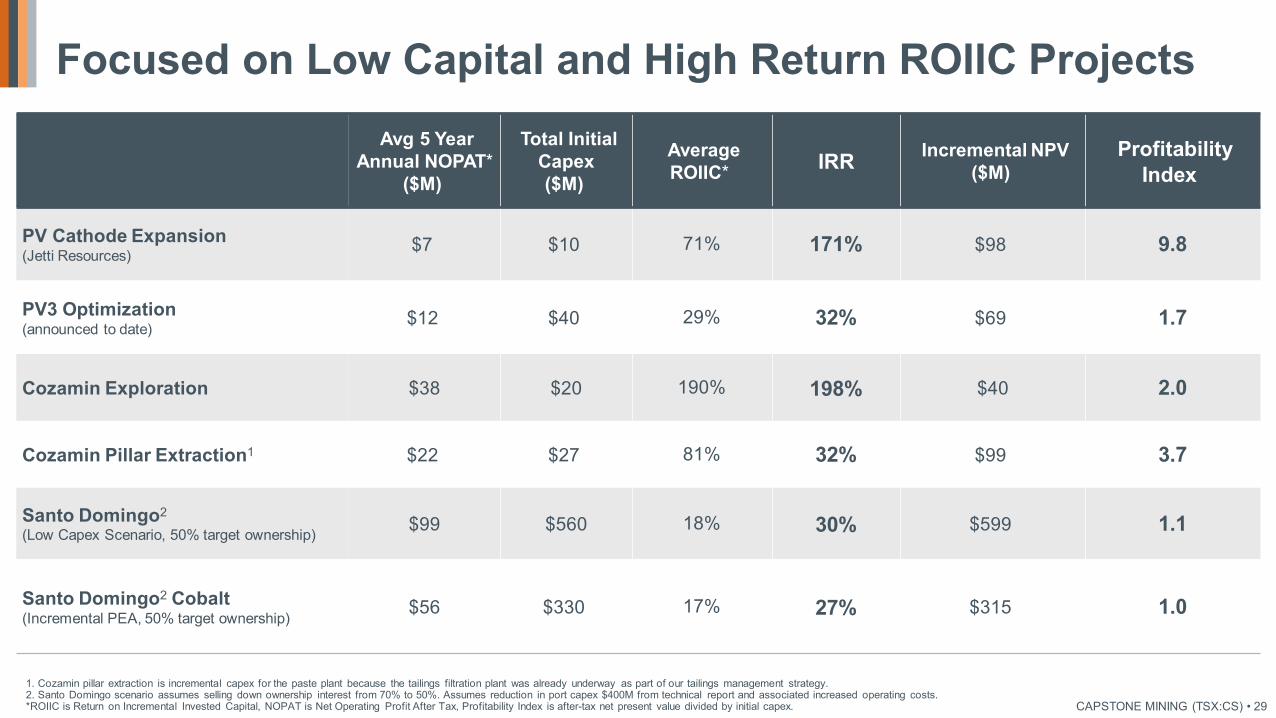
Avg 5 Year Annual NOPAT*
($M)
Total Initial Capex ($M)
Average ROIIC* IRR Incremental NPV
($M)Profitability
Index
PV Cathode Expansion (Jetti Resources) $7 $10 71% 171% $98 9.8
PV3 Optimization (announced to date) $12 $40 29% 32% $69 1.7
Cozamin Exploration $38 $20 190% 198% $40 2.0
Cozamin Pillar Extraction1 $22 $27 81% 32% $99 3.7
Santo Domingo2
(Low Capex Scenario, 50% target ownership) $99 $560 18% 30% $599 1.1
Santo Domingo2 Cobalt(Incremental PEA, 50% target ownership) $56 $330 17% 27% $315 1.0
1. Cozamin pillar extraction is incremental capex for the paste plant because the tailings filtration plant was already underway as part of our tailings management strategy.2. Santo Domingo scenario assumes selling down ownership interest from 70% to 50%. Assumes reduction in port capex $400M from technical report and associated increased operating costs. *ROIIC is Return on Incremental Invested Capital, NOPAT is Net Operating Profit After Tax, Profitability Index is after-tax net present value divided by initial capex.
Focused on Low Capital and High Return ROIIC Projects
CAPSTONE MINING (TSX:CS) • 29
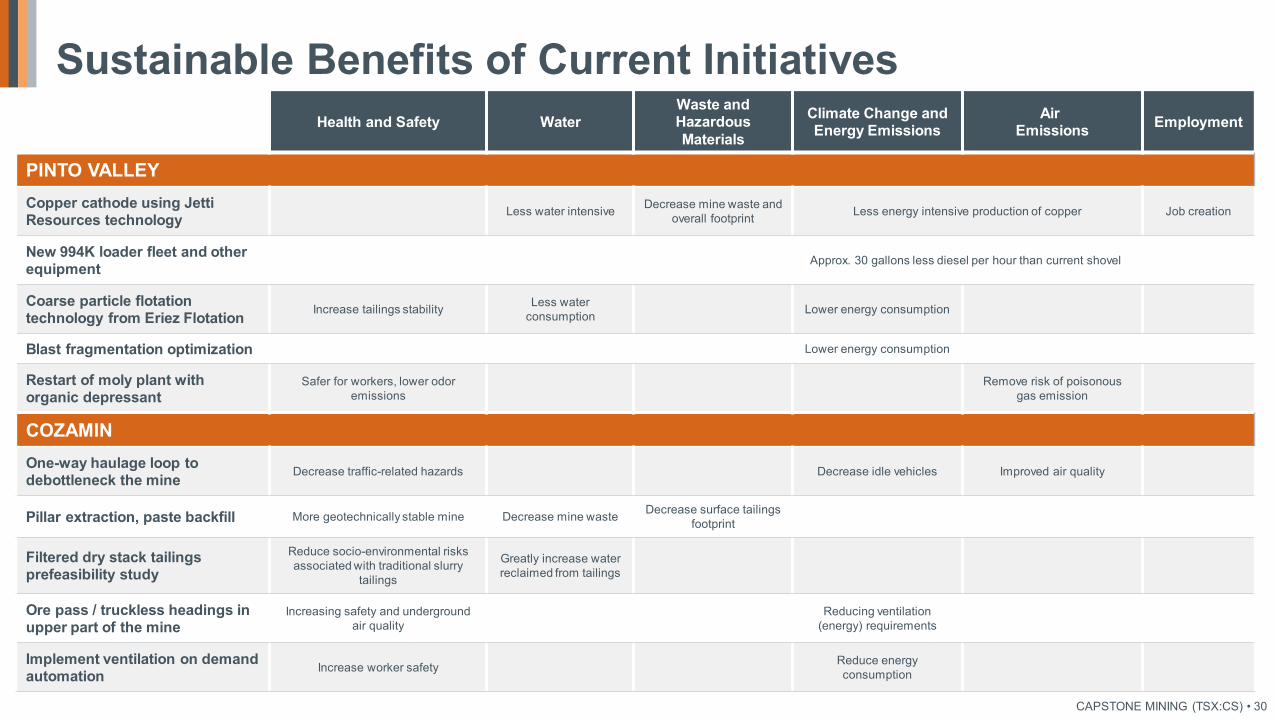
Health and Safety WaterWaste and Hazardous Materials
Climate Change and Energy Emissions
AirEmissions Employment
PINTO VALLEYCopper cathode using Jetti Resources technology Less water intensive Decrease mine waste and
overall footprint Less energy intensive production of copper Job creation
New 994K loader fleet and other equipment Approx. 30 gallons less diesel per hour than current shovel
Coarse particle flotation technology from Eriez Flotation Increase tailings stability Less water
consumption Lower energy consumption
Blast fragmentation optimization Lower energy consumption
Restart of moly plant with organic depressant
Safer for workers, lower odor emissions
Remove risk of poisonous gas emission
COZAMINOne-way haulage loop to debottleneck the mine Decrease traffic-related hazards Decrease idle vehicles Improved air quality
Pillar extraction, paste backfill More geotechnically stable mine Decrease mine waste Decrease surface tailings footprint
Filtered dry stack tailings prefeasibility study
Reduce socio-environmental risks associated with traditional slurry
tailings
Greatly increase water reclaimed from tailings
Ore pass / truckless headings in upper part of the mine
Increasing safety and underground air quality
Reducing ventilation (energy) requirements
Implement ventilation on demand automation Increase worker safety Reduce energy
consumption
Sustainable Benefits of Current Initiatives
CAPSTONE MINING (TSX:CS) • 30

Top Five Institutional Shareholders Own ~50%Institution Name % of S/OGRM Investments Ltd. 22%Korea Resources Corporation (KORES) 10%Ingalls & Snyder 9%Third Avenue Management 5%Columbia Threadneedle 2%As of January 8, 2021, from Bloomberg and IPREO, plus undisclosed shareholders as per Capstone’s best knowledge
Company Structure (TSX:CS)
CAPSTONE MINING (TSX:CS) • 31
Retail and Other ~40%
18-4 18-7 18-10 19-1 19-4 19-7 19-10 20-1 20-4 20-7 20-10 21-1$.00
$.50
$1.00
$1.50
$2.00
$2.50
$3.00
$3.50
$4.00
$4.50
Shar
ePr
ice
($C
)
0
1
2
3
4
5
6
7
Volu
me
(milli
ons)
Capstone Three Year Price & VolumeVolume Price
Shares Outstanding (as at Dec 31/20) 409 million
Market Cap (as at Feb 22/21) US$1,252 million
Q4 2020 ResultsCopper production (million pounds) Q4 2020 YTD 2020
Pinto Valley 34.1 119.0Cozamin 10.3 37.9Total 44.4 156.92020 consolidated guidance 140-155
C1 cash costs1 ($/lb.) produced Q4 2020 YTD 2020Pinto Valley $2.00 $2.21Cozamin $0.63 $0.69Consolidated $1.68 $1.842020 consolidated guidance $1.85-$2.00
Financial results ($ millions) Q4 2020 YTD 2020Revenue2 148.1 453.8Net income (loss) 27.6 12.4Adjusted net income (loss)1,3 35.6 26.4Adjusted EBITDA1,2,3,4 63.5 139.2Cash flow from operating activities2 67.4 147.2Operating cash flow before changes in working capital1,2 65.3 131.2
($ millions) Dec 31/20 Dec 31/19Long term debt (excluding financing fees) 184.9 209.9Cash and cash equivalents and short-term investments
60.0 44.5
Net debt1 124.9 165.51 This is an alternative performance measure.2 In accordance with IFRS 5, Minto’s results are excluded from revenue but included within cash flow amounts in the comparative period. The Minto mine was sold on June 3, 2019. 3Certain prior period amounts have been restated to conform with current period classification.4 EBITDA is earnings before interest, taxes, depletion and amortization.

DALE PENIUK, CPA, CA, B.CommFormer Assurance Partner, Mining, KMPG LLP and is currently Audit Committee Chair for Lundin Mining, Argonaut Gold and Miramont Resources.
DARREN PYLOTPresident & CEO of Capstone Mining Corp.Over 30 years in mining, founder of Capstone Mining and Silverstone Resources. Currently also a board member with Zena Mining.
SEUNGWAN SHON, M.Sc Geology Has been with KORES since 2001 and currently leads their Metals Team, managing overseas copper projects. Has held numerous positions, including Mine Manager of Boleo Mine, Sr. Manager of KORES Corporate Partnership Team and Sr. Manager of the Exploration Team for Nonmetal Mineral Deposits in South Korea.
RICHARD ZIMMER, MBA, P.Eng, B.ScOver 40 years of mining and resource experience. Former President & CEO of Far West Mining, prior to that was with Teck Corporation, Teck-Cominco and Teck-Pogo. Currently also a board member with Alexco Resources and Ascot Resources.
GEORGE BRACK, MBA, CFA, BA ScChairman of the BoardOver 30 years in mining focused on exploration, corporate development and investment banking. Former Managing Director & Industry Head, Mining at Scotia Capital; President of Macquarie NA Ltd.; VP Corp Dev at Placer Dome and VP Mining at CIBC Wood Gundy. Currently also a board member with Wheaton Precious Metals and Alio Gold.
ROBERT GALLAGHER, BA ScOver 40 years of experience in developing and operating large-scale mining projects. Former President & CEO of New Gold; CEO of Peak Gold; VP Operations at Newmont Asia Pacific; as well as previously with Placer Dome. Currently also a board member with Southern Arc Minerals and Japan Gold.
PETER MEREDITH, CPA, CAFormer Deputy Chairman and CFO of Turquoise Hill Resources and spent 31 years at Deloitte as a Partner. Currently also a board member with Ivanhoe Mines, Great Canadian Gaming Corporation and Cordoba Minerals.
Board of Directors
CAPSTONE MINING (TSX:CS) • 32

Total Global Copper Inventory is Near a 10 Year Low
CAPSTONE MINING (TSX:CS) • 33

ESG Performance
Pinto Valley’s new CAT 994K loader burns ~30 less gallons of fuel per hour than the current shovels, both saving on operational costs and reduce CO2 emissions. The improved efficiency will save approximately 116,000 gallons of fuel in 2020. A second loader is being added in 2021, and are expected to displace approximately 10,000 shovel hours a year, which should save approximately 410,000 gallons of fuel and millions in maintenance costs.
CAPSTONE MINING (TSX:CS) • 34

• Senior management development of ESG strategy with Board oversight, including identification of short, mid and long-term ESG-focused priorities
• Amended executive compensation to further enhance ESG metrics and weighting
• ESG Committee formed and tasked with enhancing governance practices and improving disclosure data
• Bottom-up opportunity and risk identification, enhanced ESG risk assessment and reporting to the Board
• Culture of ESG-based thinking in decision making
• Innovation and projects to improve ESG practices
• Published interim summary report for 2018-H1 2020, re-establishing GRI reporting for 2020
ESG at Capstone
CAPSTONE MINING (TSX:CS) • 35
Environmental work at Santo Domingo

KEY INITIATIVES
• Health Clinic established at Pinto Valley in June 2017 improving case management
• Ongoing training at all levels "Values in Action" and "Leadership in Action"
• Reward Points System encourages reporting unsafe acts and conditions
• Declining Lagging Indicator curves
• Adopted system of Leading Indicators in 2020
• Continuous improvement in 2020• Investment in remote equipment• Critical Task Inventory and SOP overhaul• Planned investment in fatigue monitoring
systems at PV and personal underground location tracking system at Cozamin
Industry TRIFR: National Mining Assn (USA) “Mine Safety & Health at a Glance 1931-2019” Industry LTIFR: MSHA (USA) “Mine Injury & Worktime Quarterly Statistics – Metal/Nonmetal Data
Safety Performance
CAPSTONE MINING (TSX:CS) • 36

• Coarse particle flotation technology lowers water consumption
• Technology to reduce evaporation in various water sources• Retrofits to thickeners are expected to help with reclaiming
process water, which will reduce overall water consumption due to less evaporation
• Developed a water balance model using leading industry software to model seasonal water balances• Implement climate change-related modelling to predict longer-
term availability due to precipitation and evaporation variances
• In close collaboration with brownfield neighbours that have untreated water that we can use, lowering our need for fresh water• Opportunity to think outside our property boundaries to improve
environmental performance on a district-scale
Using Technology to Conserve Water
CAPSTONE MINING (TSX:CS) • 37
Eriez HydroFloat pilot plant at Pinto Valley

GHG Emissions (tonnes of CO2eT) GHG Emissions (total CO2eT) per Tonne Copper Produced
*Sludge at Pinto Valley was 5t in 2017, 3t in 2018 and 4t in 2019.
Climate Change and Environmental PerformanceEnergy Consumption (000’s gigajoules)
1,364 1,460 1,326
1,419 1,411 1,445
-
500
1,000
1,500
2,000
2,500
3,000
3,500
2017 2018 2019
Fuel Electricity
95,883 99,033 89,943
186,566 185,470 189,727
0
50,000
100,000
150,000
200,000
250,000
300,000
2017 2018 2019
Direct Indirect
Mining Waste (Mt)*
3.81 4.04 4.02
-
0.50
1.00
1.50
2.00
2.50
3.00
3.50
4.00
4.50
2017 2018 2019
GHG Emissions (total CO2eT)per Tonne Ore Mined
0.0131 0.0140 0.0140
-
0.0020
0.0040
0.0060
0.0080
0.0100
0.0120
0.0140
0.0160
2017 2018 2019
26.2 27.7 30.1
20.3 20.0 19.6
-
10.0
20.0
30.0
40.0
50.0
60.0
2017 2018 2019
Waste Rock Tailings
Hydro, 5%
Coal, 33%
Other, 1%Nuclear,
9%Renewabl
es, 6%
Natural Gas, 47%
Purchased Electricity by Source
CAPSTONE MINING (TSX:CS) • 38

Employment Performance for 2019
CAPSTONE MINING (TSX:CS) • 39
Pinto Valley,
548
Corporate & Exploration, 37
Santo Domingo, 12
Cozamin, 452
Total Employees = 1,049
Male, 920, 88%
Female, 129, 12%
Employees by Gender
Hiring and Turnover Rate
15%
18%
New hire rate Turnover rate
141
165
17 24
- 20 40 60 80
100 120 140 160 180
New hires Turnover
Male Female
Hiring and Turnover by Gender
Line out meeting at Cozamin
Reduced turnover rate by half in 2020 at PV

ARIZONAPopulation of 7.2MConfirmed: 461,345Deaths: 7,972Death rate: 1.7%
ZACATECASPopulation of 1.5MConfirmed: 20,049Deaths: 1,795Death rate: 8.9%
CHILEPopulation of 18.7MConfirmed: 587,488Deaths: 16,197Death rate: 2.8%
BRITISH COLUMBIAPopulation: 6MConfirmed: 47,067Deaths: 765Death rate: 1.6%
Focused on Four Key Principles
Our COVID-19 Response
Stats from varying sources as of December 21, 2020. CAPSTONE MINING (TSX:CS) • 40

Our COVID-19 ResponseEnsure the Health and Safety of Our People and the Communities in Which We Operate
Protecting Our People Thermal screening Rapid COVID testing Physical distancing protocols Masks as standard PPE Engineered controls (plexi-glass, barriers) Outdoor lineout process Enhanced sanitization
Extended paid sick leave At risk employees off site Engaging remote work Travel business essential only Reduced visitors & guests Education of prevention measures Onsite medical staff
Additional Health & Safety Measures Community SupportCompanywide - Conducted employee pulse survey to understand how to further
support employees and their mental health
Pinto Valley - Mailed pamphlets to educate families on the risks and how to protect themselves at work and at home
- Provided access to virtual healthcare
- Donated N95 masks to medical and public sector workers and $100,000 to the United Fund of Globe-Miami
- Will launch an employee contribution and company matching program for the United Fund - Partnered with Gila County Health Department to offer vaccinations to 130 Pinto Valley
employees in one of the largest worksite efforts in the region
Cozamin - Completed training to safeguard employees and contractors and the site has achieved “Safe Company” status by local authorities
- Provided masks and monetary donations to Zacatecas government to support local hospitals and businesses
- Purchased hospital beds to expand capacity for COVID-19 patients in the state
Santo Domingo - Donated food boxes to local communities and families
Corporate - Replaced office door handles with copper coated handles for antimicrobial protection
- Provided access to virtual healthcare- Organized virtual employee engagement events
- Employees donated to the Greater Vancouver Foodbank and Capstone matched their donations
CAPSTONE MINING (TSX:CS) • 41

• In October, Cozamin received the “Health Security” badge from the Secretary of Health, through the Mexican Institute of Social Health (IMSS)
• In September, Cozamin was awarded the Ethics and Values Award in the “Multinational Companies” category by the CONCAMIN (Confederation of Industrial Chambers of Mexico), recognizing companies who have developed a culture governed by ethics and values
• Each year between 2012 to 2020, Cozamin was recognized as a Distinctive ESR® Socially Responsible Company by the Mexican Centre for Philanthropy (CEMEFI) for success in strategic CSR and efforts to assume voluntary and public commitment to implement socially responsible management and continuous improvement as part of its culture and business strategy.
• Each year between 2015 to 2020, Cozamin was awarded the Clean Industry Certification by Mexico's Federal Attorney for Environmental Protection (Procuraduría Federal de Protección al Ambiente or PROFEPA) for undertaking voluntary environmental audits that certifies full compliance with Mexican federal environmental laws.
• In the past five years, Capstone has received an ISS Governance Score of 1, indicating the highest level of governance quality and the lowest level of governance risk.
2020 Awards and Recognition
CAPSTONE MINING (TSX:CS) • 42

Capstone History
January: Acquired Cozamin Project, in Zacatecas Mexico
October: Development of Cozamin began
February:Minto development began
June: Silverstone distributed as a dividend to Capstone shareholders
September:Cozamin began commercial production
May:Sherwood merged with Western Keltic to acquire Kutcho Project
November:Merged with Sherwood Copper
May:Silverstone combined with Silver Wheaton
June:Formed a strategic partnership with KORES, and together acquired Far West Mining for the Santo Domingo Project
KORES also took an equity position in Capstone
October:Acquired Pinto Valley mine from BHP
December: Sold KutchoProject to Desert Star Resources
June:Sold Minto Mine to Pembridge Resources
June: Sherwood Copper acquired Minto Project in Yukon, Canada
October:Minto began commercial project
2004 2006 2008 2009 2011 2013 2017 20192005 2007 2021+2021+The best is yet to come
CAPSTONE MINING (TSX:CS) • 43

COPPERTotal Proven & Probable Cu Mineral Reserve 1.24 Mt contained metal (399 Mt @ 0.31% Cu)
Total Measured & Indicated Cu Mineral Resource 4.13 Mt contained metal (1,357 Mt @ 0.30% Cu)
Measured Cu Mineral Resource 1.89 Mt contained metal (567 Mt @ 0.33% Cu)
Indicated Cu Mineral Resource 2.24 Mt contained metal (791 Mt @ 0.28% Cu)
Inferred Cu Mineral Resource 0.43 Mt contained metal (176 Mt @ 0.25% Cu)
MOLYBDENUMTotal Proven & Probable Mo Mineral Reserve 0.025 Mt contained metal (399 Mt @ 0.006% Mo)
Total Measured & Indicated Mo Mineral Resource 0.074 Mt contained metal (1,357 Mt @ 0.005% Mo)
Inferred Mo Mineral Resource 0.043 Mt contained metal (176 Mt @ 0.005% Mo)
NOTESAll Mineral Reserves and Mineral Resources as at December 31, 2019. For full information, please refer to the Company’s Annual Information Form for December 31, 2019 available on www.capstonemining.com or SEDAR.
Reserves: Claydon Craig, P.Eng., Superintendent of Mine Technical Services at Pinto Valley is the Qualified Person responsible for the Pinto Valley Mineral Reserves estimate. Economic inputs to the block model were USD$2.75/lb Cu and USD$12.50/lb Mo. Mineral Reserves are reported above 0.175% Cu cut-off grade. Summation errors due to rounding. Contained metals are reported at 100%.
Resources: Klaus Triebel, CPG., Chief Geologist at Pinto Valley, is the Qualified Person responsible for the Pinto Valley Mineral Resources estimate. Mineral Resources are not Mineral Reserves and do not have demonstrated economic viability. Mineral Resources are presented inclusive of Mineral Reserves. Mineral Resources are reported as at December 31, 2019 above a 0.17% Cu cut-off grade. The economic assumptions for the reasonable prospects pit include: $3.30/lb Cu, $10.00/lb Mo, 88% Cu recovery, 50% Mo recovery, $1.50/ton mining costs, $1.50/ton G&A costs, $5.00/ton milling costs, and a pit slope of 45°. Totals may not tally due to rounding. Contained metals are reported at 100%.
Pinto Valley Reserves & Resources
CAPSTONE MINING (TSX:CS) • 44

Cozamin Reserves & ResourcesCOPPERTotal Proven & Probable Cu Mineral Reserve 250 kt contained metal (14,127 kt @ 1.77% Cu)Total Measured & Indicated Cu Mineral Resource 451 kt contained metal (29,672 kt @ 1.52% Cu)Inferred Cu Mineral Resource 75 kt contained metal (13,869 kt @ 0.54% Cu)
SILVERTotal Proven & Probable Ag Mineral Reserve 20,179 koz contained metal (14,127 kt @ 44 g/t Ag)Total Measured & Indicated Ag Mineral Resource 41,497 koz contained metal (29,672 kt @ 44 g/t Ag)Inferred Ag Mineral Resource 17,383 koz contained metal (13,869 kt @ 39 g/t Ag)
ZINCTotal Proven & Probable Zn Mineral Reserve 77 kt contained metal (14,127 kt @ 0.54% Zn)Total Measured & Indicated Zn Mineral Resource 327 kt contained metal (29,672 kt @ 1.10% Zn)Inferred Zn Mineral Resource 309 kt contained metal (13,869 kt @ 2.23% Zn)
LEADTotal Proven & Probable Pb Mineral Reserve 29 kt contained metal (14,127 kt @ 0.21% Pb)Total Measured & Indicated Pb Mineral Resource 95 kt contained metal (29,672 kt @ 0.32% Pb)Inferred Pb Mineral Resource 103 kt contained metal (13,869 kt @ 0.74% Pb)NOTES: Mineral Resources and Mineral Reserves as at October 31, 2020. For full information, please refer to the Company’s news release of January 27, 2021.RESERVES: Tucker Jensen, P.Eng., Superintendent Mine Operations at Capstone Mining Corp., is the Qualified Person for the Cozamin Mineral Reserve. Disclosure of the Cozamin Mine Mineral Reserve as of October 31, 2020 was completed using fully diluted mineable stope shapes generated by the Maptek Vulcan Mine Stope Optimizer software and estimated using the 2020 MNFW and MNV resource block models by Garth Kirkham, P.Geo., FGC, Kirkham Geosystems Ltd. Mineral Reserves are reported at or above a US$48.04/t net smelter return (“NSR”) cut-off in conventionally backfilled zones for 2020-2022, a US$51.12/t NSR cut-off in conventionally backfilled zones for 2023+, a US$56.51/t NSR cut-off in paste backfilled zones of Vein 10, and a US$56.12/t NSR cut-off in paste backfilled zones of Vein 20 using three formulae based on zone mineralization. Copper-silver dominant zones use the NSR formula: (Cu*50.476 + Ag*0.406)*(1-NSRRoyalty%). MNFWZ zinc-silver zones use the NSR formula: (Ag*0.259 + Zn*15.081 + Pb*15.418)*(1-NSRRoyalty%). MNV zinc-silver dominant zones use the NSR formula: (Ag*0.203 + Zn*13.163 + Pb*13.233)*(1-NSRRoyalty%). Metal price assumptions (in US$) of Cu = $2.75/lb, Ag = $17.00/oz, Pb = $0.90/lb, Zn = $1.00/lb and metal recoveries of 96% Cu, 84% Ag, 0% Pb and 0% Zn in copper-silver dominant zones, 0% Cu, 60% Ag, 92% Pb and 86% Zn in MNFWZ zinc-silver dominant zones, and 0% Cu, 53% Ag, 79% Pb and 75% Zn in MNV zinc-silver dominant zones. Mineral reserve calculations consider mining by long-hole stoping and mineral processing by flotation. Tonnage and grade estimates include dilution and mining losses. The NSR royalty rate applied varies between 1% and 3% depending on the mining concession, and royalties are treated as costs in mineral reserve estimation. An exchange rate of MX$20 per US$1 is assumed. All metals are reported as contained. Figures may not sum exactly due to rounding.RESOURCES: Garth Kirkham, P.Geo., FGC, Kirkham Geosystems Ltd. is the independent Qualified Person for the Cozamin Mineral Resource. Mineral Resources are classified according to CIM (2014) definitions, estimated following CIM (2019) guidelines and have an effective date of October 31, 2020. Mineral Resources are reported using four formulae for NSR based on mineralization. Copper-silver dominant zones use the NSR formula: (Cu*60.779 + Ag*0.485)*(1-NSRRoyalty%). Copper-zinc zones use the NSR formula: (Cu*58.430 + Ag*0.416 + Zn*15.368 + Pb*7.837)*(1-NSRRoyalty%). MNFWZ zinc-silver dominant zones use the NSR formula: (Ag*0.304 + Zn*18.323 + Pb*17.339)*(1-NSRRoyalty%). MNV zinc-silver dominant zones use the NSR formula: (Ag*0.256 + Zn*16.401 + Pb*14.977)*(1-NSRRoyalty%). Metal price assumptions (in US$) used to calculate the NSR for all deposits are: Cu = $3.25/lb, Ag = $20.00/oz, Zn = $1.20/lb and Pb = $1.00/lb. Recoveries used in the four NSR formulae are based on mineralization. Copper-silver dominant zones use the following recoveries: 96% Cu and 85% Ag. Copper-zinc zones use the following recoveries: 92% Cu, 79% Ag, 72% Zn and 42% Pb. MNFWZ zinc-silver dominant zones use the following recoveries: 60% Ag, 86% Zn and 92% Pb. MNV zinc-silver dominant zones use the following recoveries: 55% Ag, 77% Zn and 80% Pb. The NSR formulae include confidential current smelter contract terms, transportation costs and royalty agreements from 1 to 3%, as applicable. An exchange rate of MX$20 per US$1 is assumed. Totals may not sum exactly due to rounding. The NSR cut-off of US$50/tonne is based on historical mining and milling costs plus general and administrative costs. The Mineral Resources considers underground mining by long-hole stoping and mineral processing by flotation. No dilution is incorporated in the Mineral Resource. All metals are reported as contained. Mineral Resource estimates do not account for mineability, selectivity, mining loss and dilution. These Mineral Resource estimates include Inferred Mineral Resources considered too speculative geologically to apply economic considerations for categorization as Mineral Reserves. However, it is reasonably expected that the majority of Inferred Mineral Resources could be upgraded to Indicated Resources. CAPSTONE MINING (TSX:CS) • 45

COPPER EQUIVALENT Total Measured & Indicated CuEq Mineral Resource 537 Mt @ 0.52% CuEqInferred CuEq Mineral Resource 48 Mt @ 0.41% CuEq
COPPERTotal Proven & Probable Cu Mineral Reserve 1,167 kt contained metal (392.3 Mt @ 0.30% Cu)Total Measured & Indicated Cu Mineral Resource 537 Mt @ 0.30% CuInferred Cu Mineral Resource 48 Mt @ 0.19% Cu
GOLDTotal Proven & Probable Au Mineral Reserve 506.7 koz contained metal (392.3 Mt @ 0.04 g/t Au)Total Measured & Indicated Au Mineral Resource 537 Mt @ 0.039 g/t AuInferred Au Mineral Resource 48 Mt @ 0.025 g/t Au
IRONTotal Proven & Probable Fe Mineral Reserve 75.1 Mt magnetite concentrate (392.3 Mt @ 28.2% Fe)Total Measured & Indicated Fe Mineral Resource 537 Mt @ 25.7% FeInferred Fe Mineral Resource 48 Mt @ 23.6% Fe
NOTES: Mineral Reserves as at December 31, 2019 and Mineral Resources as at February 13, 2020. For full information, please refer to the Company’s Annual Information Form for December 31, 2019 available on www.capstonemining.com or SEDAR.
RESERVES: Mineral Reserves have an effective date of 14 November 2018 and were prepared by Mr. Carlos Guzman, CMC, an employee of NCL. Mineral Reserves are reported as constrained within Measured and Indicated pit designs and supported by a mine plan featuring variable throughput rates and cut-off optimization. The pit designs and mine plan were optimized using the following economic and technical parameters: metal prices of US$3.00/lb Cu, US$1,280/oz Au and US$100/dmt of Fe concentrate; average recovery to concentrate is 93.4% for Cu and 60.1% for Au, with magnetite concentrate recovery varying on a block-by-block basis; copper concentrate treatment charges of US$80/dmt, U$0.08/lb of copper refining charges, US$5.0/oz of gold refining charges, US$33/wmt and US$20/dmt for shipping copper and iron concentrates respectively; waste mining cost of $1.75/t, mining cost of US$1.75/t ore and process and G&A costs of US$7.53/t processed; average pit slope angles that range from 37.6º to 43.6º; a 2% royalty rate assumption and an assumption of 100% mining recovery. Rounding as required by reporting standards may result in apparent summation differences between tonnes, grade and contained metal content. Tonnage measurements are in metric units. Copper and iron grades are reported as percentages, gold as grams per tonne. Contained gold ounces are reported as troy ounces, contained copper as million pounds and contained iron as metric million tonnes.
Santo Domingo Reserves & Resources
RESOURCES: Mineral Resources are classified according to CIM (2014) standards. Mineral Resources are reported inclusive of Mineral Reserves. Mineral Resources that are not Mineral Reserves do not have demonstrated economic viability. The Qualified Person for the estimates is Mr. David Rennie, P. Eng., an associate of Roscoe Postle Associates Inc. Mineral Resources for the Santo Domingo Sur, Iris, Iris Norte and Estrellita deposits have an effective date of 13 February 2020. Mineral Resources for the Santo Domingo Sur, Iris, Iris Norte and Estrellitadeposits are reported using a cut-off grade of 0.125% copper equivalent (CuEq). CuEq grades are calculated using average long-term prices of US$3.50/lb) Cu, US$1,300/oz Au and US$99/(dmt) Fe conc. The CuEq equation is: % Cu Equivalent = (Cu Metal Value + Au Metal Value + Fe Metal Value) / (Cu Metal Value per percent Cu). The general equation for metal value is: Metal Value = Grade * Cm * R * (Price – TCRC – Freight) * (100 – Royalty) / 100, were Cm is a constant to convert the grade of metal to metal price units, R is metallurgical recovery, and TCRC is smelter treatment charges and penalties. Only copper, gold and iron were recognized in the CuEq calculation; cobalt and sulphur were excluded. Mineral Resources are constrained by preliminary pit shells derived using a Lerchs–Grossmann algorithm and the following assumptions: pit slopes averaging 45º; mining cost of US$1.90/t, processing cost of US$7.27/t (including G&A cost); processing recovery of 89% copper and 79% gold, iron recoveries are calculated based on magnetic susceptibility; and metal prices of US$3.50/lb Cu, US$1,300/oz Au and US$99/dmt Fe concentrate. Rounding as required by reporting standards may result in apparent summation differences. Tonnage measurements are in metric units. Copper, iron and sulphur are reported as percentages, gold as grams per tonne and cobalt as parts per million.

and 85% Ag. Copper-zinc zones use the following recoveries: 92% Cu, 79% Ag, 72% Zn and 42% Pb. MNFWZ zinc-silver dominant zones use the following recoveries: 60% Ag, 86% Zn and 92% Pb. MNV zinc-silver dominant zones use the following recoveries: 55% Ag, 77% Zn and 80% Pb. The NSR formulae include confidential current smelter contract terms, transportation costs and royalty agreements from 1 to 3%, as applicable. An exchange rate of MX$20 per US$1 is assumed. Totals may not sum exactly due to rounding. The NSR cut-off of US$50/tonne is based on historical mining and milling costs plus general and administrative costs. The Mineral Resource Estimate encompasses both the MNFWZ and the MNV. Drilling campaigns from 2018 have focused on the MNFWZ and no drilling has been performed on the MNV since 2017. The Mineral Resource considers underground mining by longhole stoping and mineral processing by flotation. No dilution is incorporated in the Mineral Resource. All metals are reported as contained. Mineral Resource estimates do not account for mining loss and dilution. These Mineral Resource estimates include Inferred Mineral Resources considered too speculative geologically to apply economic considerations for categorization as Mineral Reserves. However, it is reasonably expected that the majority of Inferred Mineral Resources could be upgraded to Indicated Resources.
3. Santo Domingo Project Mineral Resources shown on 100% basis (Capstone’s share is 70%). David Rennie, P.Eng., an associate of Rosco Postle Associates Inc. and an independent Qualified Person responsible for the preparation of the Mineral Resources estimates for the Santo Domingo Sur, Iris, Iris Norte and Estrellita deposits, which have an effective date of February 13, 2020. Mineral Resources for the Santo Domingo Project are reported using a COG of 0.125% copper equivalent (CuEq). CuEq grades are calculated using average long term prices of US$3.50/lb Cu, US$1,300/oz Au and US$99/dmt Fe; no value was assigned to Co. The CuEq equation is: Metal Value = Grade*Cm*R%/100*(Price-TCRC-Freight)*(100-Royalty)/100, where Cm is a constant to convert grade of metal to metal price units; R is metallurgical recovery and %Cu Equivalent = (Cu Value + Au Value + Fe Value)/(Cu Value per 1%Cu). An assessment of reasonable prospects for economic extraction was performed using a Lerchs–Grossman pit shell with the following assumptions: pit slopes averaging 45°; mining cost of US$1.90/t, processing cost of US$7.27/t; processing recovery of 89% Cu and 79% Au; metal prices of US$3.50/lb Cu, US$1,300/oz Au and US$99/dmt Fe. All contained metals are reported at 100%. Note that the Fe grade includes all sources of Fe rather than only magnetite.
NOTES: Mineral Resources take into account mining activities (where applicable) until January 1, 2020 for Pinto Valley Mine and until October 31, 2020 for Cozamin Mine. Mineral Resources that are not Mineral Reserves do not have demonstrated economic viability. Mineral Resources are reported inclusive of the Mineral Reserves. All Mineral Resources are exclusive to dilution and mining recovery factors. All contained metals are reported at 100%. Rounding as required by reporting guidelines may result in apparent summation differences between tonnes, grade and contained metal content. Contained ounces (oz) are troy ounces. COG is cut-off grade. NSR is net smelter return. M&I = Measured & Indicated. All amounts in US$ unless otherwise specified. Stockpiled material is treated as Measured Mineral Resources. See Technical Reports filed under Capstone’s profile on SEDAR for further information.
1. Klaus Triebel, CPG., Chief Geologist at Pinto Valley, is the Qualified Person responsible for the Pinto Valley mineral resources and reservesestimate. Mineral resources are presented above a 0.17% Cu cut-off. Measured Mineral Resources include 417 kt of stockpiled material. . The economic assumptions for the reasonable prospects pit include: $3.30/lb Cu, $10.00/lb Mo, 88% Cu recovery, 50% Mo recovery, $1.50/ton mining costs, $1.50/ton G&A costs, $5.00/ton milling costs, and a pit slope of 45°. Pinto Valley Mine is an open pit mine with mineral processing by flotation.
2. The independent Qualified Person for the estimates is Mr. Garth D. Kirkham, P. Geo., FGC., of Kirkham Geosystems Ltd. Mineral Resources are classified according to CIM (2014) definitions, estimated following CIM (2019) guidelines and have an effective date of October 31, 2020. Mineral Resources are reported inclusive of Mineral Reserves. Mineral Resources that are not Mineral Reserves do not have demonstrated economic viability. Mineral Resources are reported using four formulae for NSR based on mineralization. Copper-silver dominant zones use the NSR formula: (Cu*60.779 + Ag*0.485)*(1-NSRRoyalty%). Copper-zinc zones use the NSR formula: (Cu*58.430 + Ag*0.416 + Zn*15.368 + Pb*7.837)*(1-NSRRoyalty%). MNFWZ zinc-silver dominant zones use the NSR formula: (Ag*0.304 + Zn*18.323 + Pb*17.339)*(1-NSRRoyalty%). MNV zinc-silver dominant zones use the NSR formula: (Ag*0.256 + Zn*16.401 + Pb*14.977)*(1-NSRRoyalty%). Metal price assumptions (in US$) used to calculate the NSR for all deposits are: Cu = $3.25/lb, Ag = $20.00/oz, Zn = $1.20/lb and Pb = $1.00/lb. Recoveries used in the four NSR formulae are based on mineralization. Copper-silver dominant zones use the following recoveries: 96% Cu
Consolidated Estimated Mineral Resources
CAPSTONE MINING (TSX:CS) • 47
Cu Zn Pb Mo Ag Au Fe Co S Cu Zn Pb Mo Ag Au Fe3 Co3
% % % % g/t g/t % ppm % kt kt kt kt koz koz kt ktPinto Valley1 Measured 566,639 0.33 - - 0.006 - - - - - 1,885 - - 34 - - - -
31-Dec-2019 Indicated 790,566 0.28 - - 0.005 - - - - - 2,240 - - 40 - - - - M&I 1,357,205 0.30 - - 0.005 - - - - - 4,125 - - 74 - - - -
Inferred 175,653 0.25 - - 0.005 - - - - - 431 - - 8 - - - -
Cozamin2 Measured 407 1.24 1.23 0.40 - 53 - - - - 5 5 2 - 698 - - -
31-Oct-2020 Indicated 29,265 1.53 1.10 0.32 - 43 - - - - 446 322 94 - 40,799 - - - M&I 29,672 1.52 1.10 0.32 - 43 - - - - 451 327 95 - 41,497 - - -
Inferred 13,869 0.54 2.23 0.74 - 39 - - - - 75 309 103 - 17,383 - - -
Santo Domingo3 Measured 65,981 0.61 - - - - 0.08 30.9 254 2.0 402 - - - - 172 20,386 17
(100%) Indicated 470,567 0.26 - - - - 0.03 25.0 225 1.9 1,205 - - - - 499 117,444 106
13-Feb-2020 M&I 536,548 0.30 - - - - 0.04 25.7 229 2.0 1,604 - - - - 673 137,828 123Inferred 47,903 0.19 - - - - 0.02 23.6 197 2.2 91 - - - - 38 11,306 9
6,181 327 95 74 41,497 673 137,828 123596 309 103 8 17,383 38 11,306 9
MINERAL RESOURCES – Inclusive of Mineral Reserves CONTAINED METAL
Category kt
TOTAL MEASURED & INDICATED MINERAL RESOURCESTOTAL INFERRED MINERAL RESOURCES

(Ag*0.259 + Zn*15.081 + Pb*15.418)*(1-NSRRoyalty%). MNV zinc-silver dominant zones use the NSR formula: (Ag*0.203 + Zn*13.163 + Pb*13.233)*(1-NSRRoyalty%). Metal price assumptions (in US$) of Cu = $2.75/lb, Ag = $17.00/oz, Pb = $0.90/lb, Zn = $1.00/lb and metal recoveries of 96% Cu, 84% Ag, 0% Pb and 0% Zn in copper-silver dominant zones, 0% Cu, 60% Ag, 92% Pb and 86% Zn in MNFWZ zinc-silver dominant zones, and 0% Cu, 53% Ag, 79% Pb and 75% Zn in MNV zinc-silver dominant zones. Mineral reserve calculations consider mining by long-hole stoping and mineral processing by flotation. Tonnage and grade estimates include dilution and mining losses. The NSRroyalty rate applied varies between 1% and 3% depending on the mining concession, and royalties are treated as costs in mineral reserve estimation. An exchange rate of MX$20 per US$1 is assumed. All metals are reported as contained. Figures may not sum exactly due to rounding.
3. Santo Domingo Project Mineral Reserves shown on 100% basis (Capstone’s share is 70%). Carlos Guzman, FAusIMM, CMC, of NCL Ingeniería y Construcción Ltda, is the independent Qualified Person responsible for the preparation of the Mineral Reserves estimate with an effective date of November 14, 2018. Mineral Reserves are reported as constrained within Measured and Indicated pit designs, and supported by a mine plan featuring variable throughput rates and cut-off optimization. The pit designs and mine plan were optimized using the following economic and technical parameters: metal prices of $3.00/lb Cu, $1,280/oz Au and $100/dmt of Fe concentrate; recovery to concentrate assumptions of a maximum of 93.4% for Cu and 60.1% for Au, with magnetite concentrate recovery varying on a block-by-block basis; copper concentrate treatment charges of $80/dmt, $0.08/lb of Cu refining charges, $5/oz of Au refining charges, $33/wmt and $20/wmt for shipping Cu and Fe concentrates respectively; waste mining cost of $1.75/t, mining cost of $1.75/t ore, and process and G&A costs of $7.53/t processed; average pit slope angles that range from 37.6º to 43.6º; a 2% royalty rate assumption, and an assumption of 100% mining recovery. Fe metal in the table denotes magnetite. There were no mining activities at Santo Domingo since the release of the MRMR estimate in 2018.
NOTES: Mineral Resources take into account mining activities (where applicable) until January 1, 2020 for Pinto Valley Mine and until October 31, 2020 for Cozamin Mine. Rounding as required by reporting guidelines may result in apparent summation differences between tonnes, grade and contained metal content. All Mineral Reserve estimates are inclusive of dilution and mining recovery factors. Contained ounces (oz) are troy ounces. COG is cut-off grade. NSR is net smelter return. All amounts in US$ unless otherwise specified. Stockpiled material is treated as Proven Mineral Reserves. All mineral reserves are fully diluted and factor mining recovery. See Technical Reports filed under Capstone’s profile on SEDAR for further information.
1. Claydon Craig, P.Eng., Superintendent of Mine Technical Services at Pinto Valley, is the Qualified Person responsible for the Pinto Valley mineral reserves estimate. Economic inputs to the block model were USD$2.75/lb per pound copper, USD$7.30/lb molybdenum. For the purposes of reporting mineral reserves going forward from January 1, 2017, an average cut-off grade of 0.175% Cu has been used, as it closely approximates the variable 0.17-0.18% Cu cut-off presented in the PV3 Pre-Feasibility NI 43-101 Technical Report. Proven mineral reserves include 417 kt of stockpiled material.
2. Tucker Jensen, P.Eng., Superintendent Mine Operations at Capstone Mining Corp., is the Qualified Person for this Cozamin Mineral Reserve update. Disclosure of the Cozamin Mineral Reserves as of October 31, 2020 was completed using fully diluted mineable stope shapes generated by the Maptek Vulcan Mine Stope Optimizer software and estimated using the 2020 MNFWZ resource block model created by Garth Kirkham, P.Geo., FGC and the 2017 MNV resource block model created by J. Vincent, P.Geo., formerly of Capstone Mining Corp. Mineral Reserves are reported at or above a US$48.04/t net smelter return (“NSR”) cut-off in conventionally backfilled zones for 2020-2022, a US$51.12/t NSR cut-off in conventionally backfilled zones for 2023+, a US$56.51/t NSR cut-off in paste backfilled zones of Vein 10, and a US$56.12/t NSR cut-off in paste backfilled zones of Vein 20 using three formulae based on zone mineralization. Copper-silver dominant zones use the NSR formula: (Cu*50.476 + Ag*0.406)*(1-NSRRoyalty%). MNFWZ zinc-silver zones use the NSR formula:
Consolidated Estimated Mineral Reserves
CAPSTONE MINING (TSX:CS) • 48
Cu Zn Pb Mo Ag Au Fe Cu Zn Pb Mo Ag Au Fe Con3
% % % % g/t g/t % kt kt kt kt koz koz MtPinto Valley1 Proven 245,604 0.33 - - 0.006 - - - 805 - - 16 - - -
31-Dec-2019 Probable 153,308 0.29 - - 0.006 - - - 439 - - 9 - - - Total 398,912 0.31 - - 0.006 - - - 1,244 - - 25 - - -
Cozamin2 Proven - - - - - - - - - - - - - - -
31-Oct-2020 Probable 14,127 1.77 0.54 0.21 - 44 - - 250 77 29 - 20,179 - - Total 14,127 1.77 0.54 0.21 - 44 - - 250 77 29 - 20,179 - -
Santo Domingo3 Proven 65,390 0.61 - - - - 0.08 30.9 398 - - - - 170 8 (100%) Probable 326,936 0.24 - - - - 0.03 27.6 768 - - - - 337 67
14-Nov-2018 Total 392,326 0.30 - - - - 0.04 28.2 1,167 - - - - 507 75 2,661 77 29 25 20,179 507 75 TOTAL MINERAL RESERVES
MINERAL RESERVES CONTAINED METAL
Category kt

GENERAL INQUIRIES
Capstone Mining Corp. Suite 2100 – 510 West Georgia StreetVancouver, BC V6B 0M3
www.capstonemining.com [email protected] 1-604-684-8894 1-866-684-8894 (N.A. toll free)
MEDIA AND INVESTOR INQUIRIES
Jerrold AnnettSenior VP, Strategy & Capital Markets 1-416-572-2272, Toronto, ON
Virginia MorganDirector, Investor Relations & Communications 604-674-2268, Vancouver, BC
Contact Information