OPERATIONAL PROGRAMME REGIONAL COMPETITIVENESS...
135
Republic of Croatia Ministry of Regional Development and EU Funds OPERATIONAL PROGRAMME REGIONAL COMPETITIVENESS 2007-2013 SEPTEMBER 2013
Transcript of OPERATIONAL PROGRAMME REGIONAL COMPETITIVENESS...
Republic of Croatia
Ministry of Regional Development and EU Funds
OPERATIONAL PROGRAMME
REGIONAL COMPETITIVENESS
2007-2013
SEPTEMBER 2013
Page 2 / 135
Table of Contents
INTRODUCTION ................................................................................................ 6
SECTION 1: ANALYSIS ........................................................................................ 8 1.1. Baseline and SWOT analysis.................................................................... 8 1.2. Lessons learned from previously implemented EU interventions .................... 46
SECTION 2: STRATEGY ..................................................................................... 49 2.1. Overall objective of the Operational Programme ....................................... 49 2.2. Specific objectives ............................................................................ 50 2.3. Identification of Priority axes ............................................................... 52 2.4. Compliance with EU and national policies ................................................ 56 2.5. Ex ante evaluation ............................................................................. 65 2.6. Significant Environmental Impact Assessment (SEA) .................................... 67 2.7. Partnership process ........................................................................... 69 2.8. Horizontal themes ............................................................................. 70
SECTION 3: PRIORITY AXES ............................................................................... 73 3.1. Priority axis 1: Development and upgrading of the regional infrastructure and raising the attractiveness of regions....................................... ...................... 74 3.2. Priority axis 2: Enhancing Competitiveness of the Croatian Economy .............. 79 3.3. Priority axis 3: Technical Assistance ....................................................... 90 3.4. Complementarity and demarcation ........................................................ 95
SECTION 4: IMPLEMENTATION........................................................................ 100 4.1. Management ................................................................................... 100 4.2. Monitoring and Evaluation .................................................................. 103 4.3. Financial Flows ................................................................................ 106 4.4. Information and publicity ................................................................... 107 4.5. Management and Information System (MIS) .............................................. 108 4.6. Compliance with state aid and public procurement rules ............................ 109
SECTION 5: FINANCIAL TABLES ......................................................................... 111 5.1. Annual commitment .......................................................................... 111 5.2. Total financial allocation .................................................................... 112 5.3. Categorization of expenditure and Lisbon earmarking ................................ 113
ANNEXES ..................................................................................................... 114 Annex 1 - Composition of the OPRC 2007 - 2013 drafting group (final draft 2007-2013) ..........................................................................................................114 Annex 2 – Statistical tables ....................................................................... 116 Annex 3 - Reconciliation of Croatian Strategies and OPRC 2007 – 2013 operations .. 131 Annex 4 - Quantification of the current situation in Croatian Economy using structural indicators ............................................................................................. 133 Annex 5 - Sectoral guidelines .................................................................... 134 Annex 6 - Financial Flows ......................................................................... 135
Page 3 / 135
List of Acronyms
ARD Agency for Regional Development
BICRO Business-Innovation Agency
BRI Business Related Infrastructure
BSI Business Support Institutions
CARDS Community Assistance for Reconstruction, Development and Stability
CBS
CCE
Central Bureau of Statistics
Croatian Chamber of Economy
CODEF Central Office for Development Strategy and Coordination of EU Funds
CDA County Development Agency
CEDB Council of Europe Development Bank
CNB
CSG
Croatian National Bank
Community Strategic Guidelines
CPI Consumer Price Index
DIS Decentralised Implementation System
EBRD European Bank for Reconstruction and Development
EC European Commission
EIB European Investment Bank
EPO
ERA
European Patent Office
European Research Area
ERDF European Regional Development Fund
ERP Economic Recovery Programme
ESF European Social Fund
ESDP Education Sector Development Project
EU European Union
FDI Foreign Direct Investment
FINA Croatian Financial Agency
HAMAG INVEST Croatian Agency for Small and Medium Enterprises
HIT
HRDOP
HRST
Croatian Institute of Technology
Human Resources Development Operational Programme
Human Resources in Science and Technology
GDP Gross Domestic Product
GCI Global Competitiveness Index
GVA Gross Value Added
IB Intermediate Bodies
ICT Information and Communication Technologies
IFI International Funding Instruments
IRCRO R&D program targeting small and medium size business
ILO International Labour Organization
IPA
IPA OPRC
Instrument for Pre-Accession Assistance
IPA IIIc Regional Competitiveness Operational Programme 2007-30th June 2013
Page 4 / 135
IT
IUS
Information Technology
Innovation Union Scoreboard
KT
LLL
Knowledge transfer
Lifelong learning
MA Managing Authority
ME Ministry of Economy
MEC Ministry of Entrepreneurship and Crafts
MIS Management Information System
MHSW Ministry of Health and Social Welfare
MPA Major project application
MRDEUF Ministry of Regional Development and EU Funds
MT Ministry of Tourism
MSES Ministry of Science, Education and Sport
NGO Non-Government Organisation
NSRF National Strategic Reference Framework
NUTS Nomenclature of Territorial Units for Statistics
OP
PPS
Operational Programme
Purchasing Power Standards
R&D Research and Development
OPRC ERDF Regional Competitiveness Operational Programme
SIPO
SRDRC
TOP
TTO
State Intellectual Property Office
Strategy of Regional Development of Republic of Croatia
Transport Operational Programme
Technology Transfer Office
Page 5 / 135
List of Tables
Table 1: General Comparison between NUTS 2 Regions ................................................... 14
Table 2: Croatian counties (NUTS 3 level) according to Development Index ......................... 16
Table 3: Regional Competitiveness Index Model ............................................................ 19
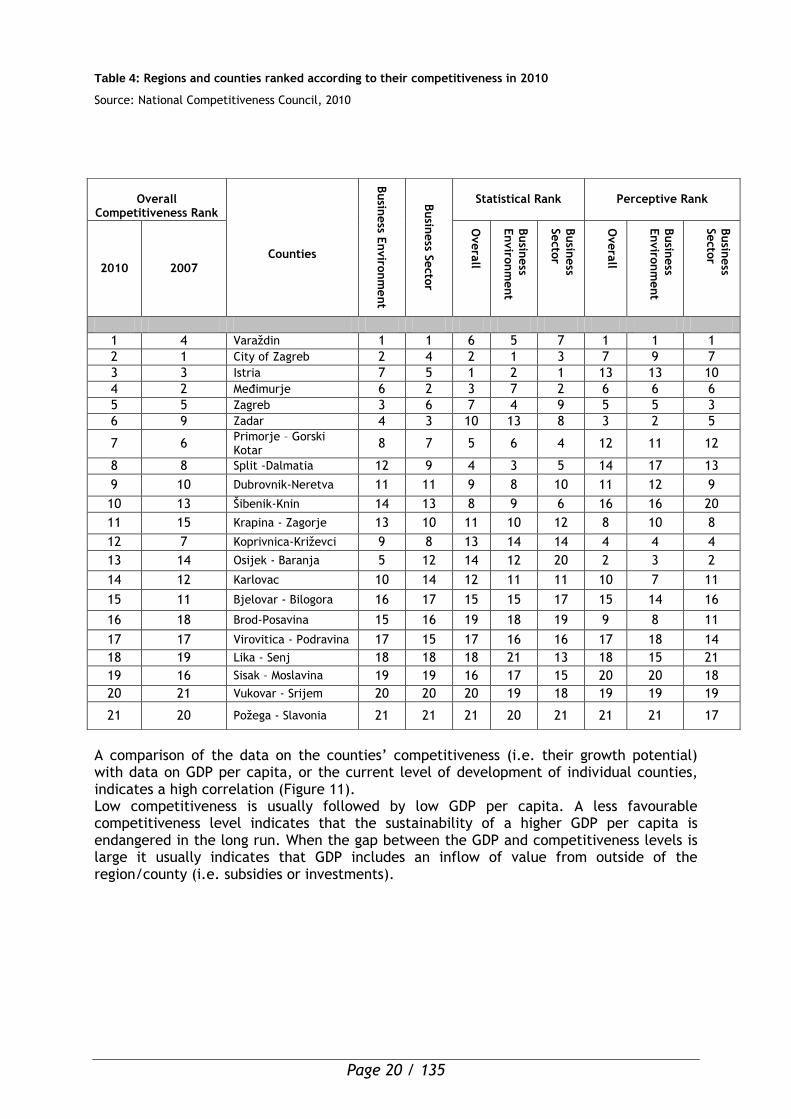
Table 4: Regions and counties ranked according to their competitiveness in 2010 ................ 20
Table 5: Enterprises, by Innovation Performance, Activity and Size, 2008–2010 ................... 26
Table 6: Growing companies in Croatia, according to the criterion of new product development
.......................................................................................................................... 26
Table 7: Gross domestic expenditure on R&D as percentage of GDP ................................... 33
Table 8: Accommodation capacities in 2010, number of bed places, ................................. 38
Table 9: Average number of tourist overnights per bed in 2011, ....................................... 38
Table 10: Visitors to national parks ............................................................................ 42
Table 11: OPRC specific objectives ............................................................................. 51
Table 12: Conformity of the OPRC with the Community Strategic Guidelines on Cohesion ....... 57
Table 13: Compliance of OPRC with the Strategic Development Framework (SDF) 2006- 2013 . 60
Table 14: Compliance of the OPRC with the Strategy of Regional Development of the Republic of
Croatia 2011-2013 .................................................................................................. 63
Table 15: COMPLEMENTARITY WITH OP HUMAN RESOURCES DEVELOPMENT 2007-2013 .......... 96
Table 16: COMPLEMENTARTIY AND DEMARCATION WITH IPA RURAL DEVELOPMENT (IPARD) 2007-
2013 ................................................................................................................... 97
Table 17: COMPLEMENTARTIY AND DEMARCATION WITH OP ENVIRONMENTAL 2007-2013 ........ 98
Table 18: Intermediate bodies designated for the OPRC 2007-2013 ................................. 102
Table 19: Financing plan of the OPRC detailing ERDF annual allocations, in EUR ................. 111
Table 20: Financial plan of the programming period with financial allocations from the ERDF,
national co-financing and co-financing rates for priorities under the OPRC, in EUR .............. 112
List of Figures
Figure 1: Real GDP growth rates in selected countries averages 2001- 2011 ......................... 8
Figure 2: GDP per capita in PPS, in selected countries, 2011, EU27=100 .............................. 9
Figure 3: Unemployment rate (ILO) in selected countries in 2011 ..................................... 11
Figure 4: FDI per capita in selected countries, 2000- 2011 .............................................. 11
Figure 5: Croatian NUTS 2 Regions as of 2012 ............................................................... 13
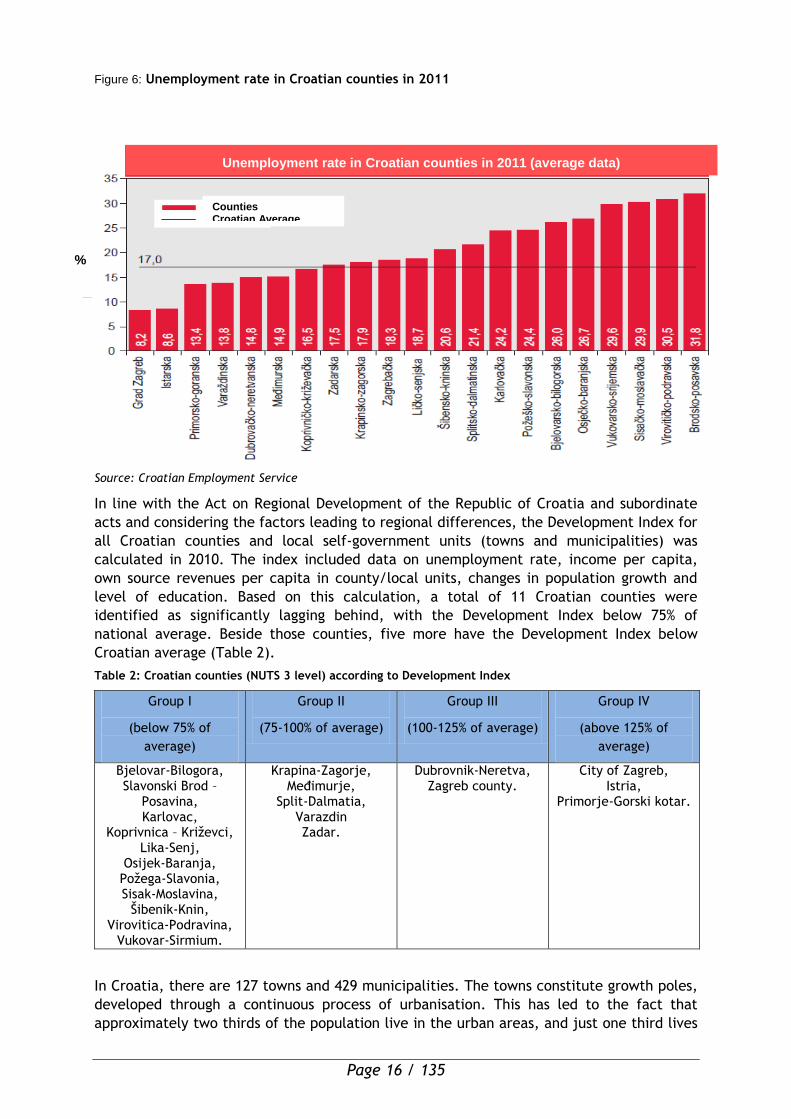
Figure 6: Unemployment rate in Croatian counties in 2011 .............................................. 16
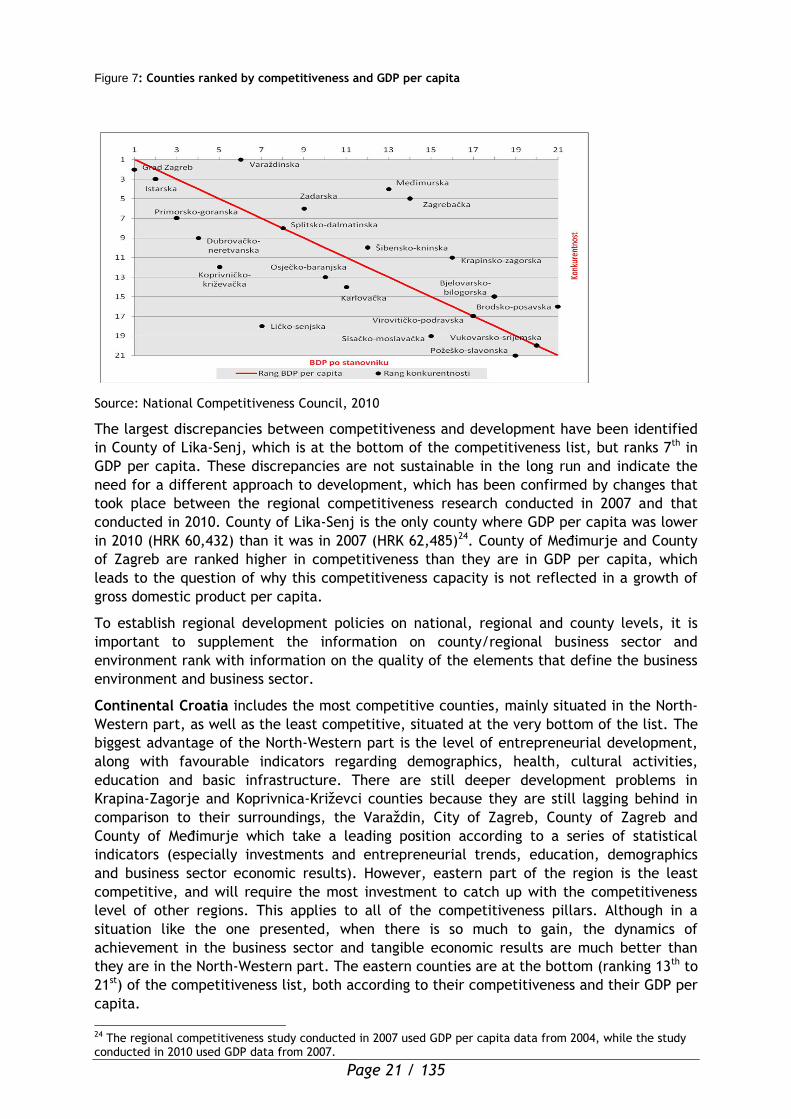
Figure 7: Counties ranked by competitiveness and GDP per capita .................................... 21
Figure 8: The share of revenue from innovative products/services in the company's revenue .. 27
Figure 9: Share of innovative enterprises in the total number of enterprises, 2008 (%) .......... 31
Figure 10: Gross domestic expenditure on R&D as percentage of GDP ................................ 33
Figure 11: Tourist traffic per months .......................................................................... 37
Page 6 / 135
Introduction
The Operational Programme Regional Competitiveness (OPRC) represents a programme
document prepared for the use of EU funds and specifically pertaining to the European
Fund for Regional Development (ERDF) envisaged for the implementation of EU Cohesion
policy allocated to Croatia for the financial perspective 2007-2013 under the Convergence
Objective. The OPRC builds on previous investments and capacity building initiatives
related to regional competitiveness and funded through earlier EU programmes, including
the Instrument for Pre-Accession Assistance (IPA) and aims to improve the activities
necessary for developing an economic environment that will facilitate the convergence of
Croatia and its regions towards the EU levels.
The OPRC is based on the EU Council Regulation No 1083/2006, which includes the general
provisions on the use of the ERDF resources. Furthermore, the activities planned within
this OP are in conformity with the EU Council Regulation No 1080/2006, which provides the
specific tasks, scope and eligibility rules for assistance provided under the ERDF1.
The OPRC was prepared within the framework of National Strategic Reference Framework,
a key strategic document for the use of EU Cohesion policy Funds, which ensures that the
assistance from the Funds is consistent with both EU and national objectives and
guidelines. The NSRF defines priority areas which will be financed from this OP and
describes how the implementation of the OP is expected to contribute to the achievements
of strategic objectives and thematic priorities of the NSRF. The key orientation of the
OPRC is to achieve the following overall objective, which is also an NSRF thematic priority:
„Higher Competitiveness of SMEs and Support to a Knowledge-based Economy”.
Taking into consideration the challenges of operating in the European single market and
the opportunities that have been identified for Croatian enterprises, the OPRC 2007-2013
is structured as follows:
Priority axis 1: Development and Upgrading of the Regional Infrastructure and
Enhancement of the Attractiveness of Regions
Priority axis 2: Enhancing the Competitiveness of the Croatian economy
Priority Axis 3: Technical Assistance
The strategy is to increase Croatia’s competitiveness through the creation of a favourable
business climate, involving support for SME, research and development, business and
tourism-related infrastructure, networking and clustering, while respecting the principle of
balanced regional development.
The OPRC was designed by the Ministry of Regional Development and EU Funds (MRDEUF)
by applying the key principles of EU cohesion policy and following the requirements of
Articles 10-11 of the General Regulation concerning the programming and partnership
process. Led by the principle of partnership, MRDEUF paid great attention to the
establishment of a spectrum of networks in order to form a close cooperation between the
partners – the State and the EC on the one hand and other authorities and bodies on the
other (competent regional, local and other public bodies, economic and social partners as
well as other appropriate authorities which represent civil society, environmental partners
and non–governmental organisations and bodies responsible for the promotion of gender
equality and other relevant issues).
1 Until July 1st 2013, IPA Council Regulation (EC) No 1085/2006 establishing an instrument for pre-accession assistance (IPA) and Commission Regulation (EC) No 718/2007 on implementation of IPA applied to this document and its management and implementation.
Page 7 / 135
The starting point for the preparation of the OPRC 2007-2013 is an analysis of the current
situation regarding Croatia’s competitiveness, with special emphasis on the sector of the
small and medium-sized enterprises (SME), resources for the area of research and
development (R&D), tourism and issues characterising regional development. The
document also includes a SWOT analysis and strategy for the relevant programming period;
it contains a description of the OPRC priority axes, measures and operations and proposed
interventions, as well as financial tables required by the EC regulations and information on
the implementation provisions.
Particular programming features of the NSRF and the OPRC 2007 - 2013 are expected to
support the implementation of the strategies set by the Croatian government and to
contribute to addressing the weaknesses in specific economic sectors for which EU funds
support will be provided. Furthermore, the OPRC 2007 - 2013 strategy strongly builds upon
lessons and benefits of the IPA IIIc Operational Programme Regional Competitiveness (IPA
OPRC), through which approximately EUR 96.8 million was allocated for the period 2007 –
30 June 2013.
The ERDF OPRC 2007-2013 was approved by the OPRC Monitoring Committee on 24 July,
2013, submitted to European Commission services on 1 August, 2013, and adopted by the
Commission Decision on 6 September 2013 (Commision Decision C(2013) 5650).
Page 8 / 135
Section 1: Analysis
1.1. Baseline and SWOT analysis
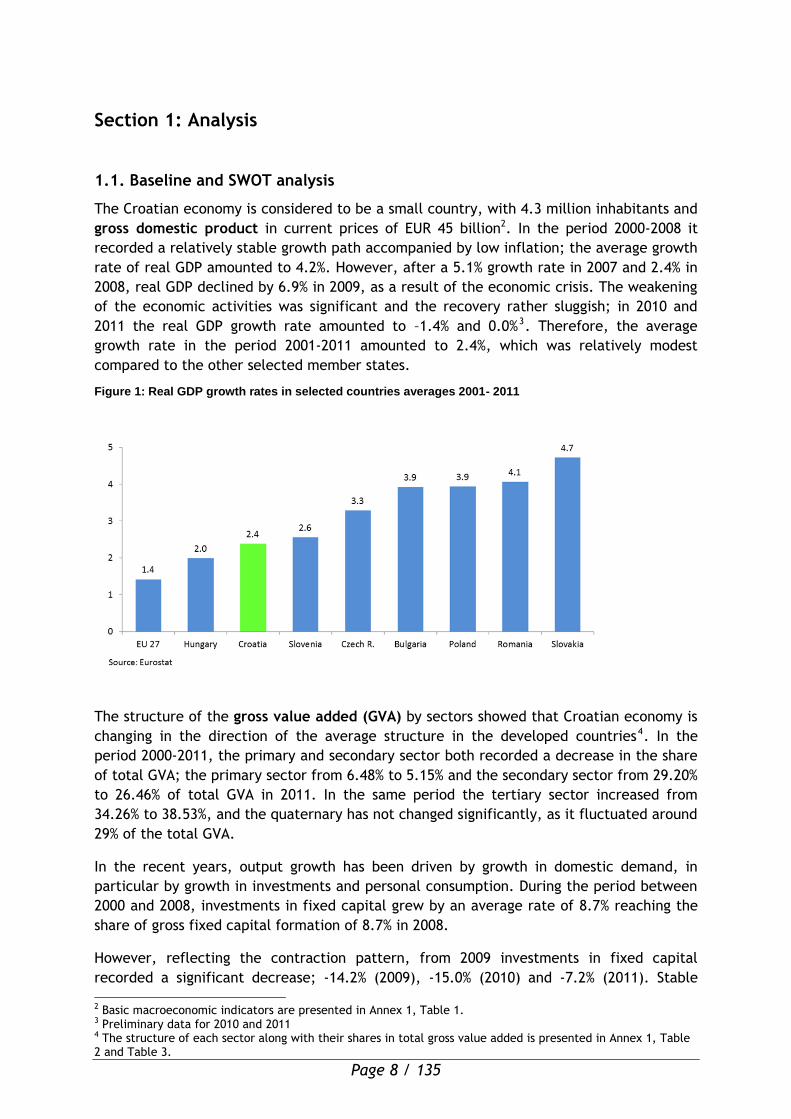
The Croatian economy is considered to be a small country, with 4.3 million inhabitants and
gross domestic product in current prices of EUR 45 billion2. In the period 2000-2008 it
recorded a relatively stable growth path accompanied by low inflation; the average growth
rate of real GDP amounted to 4.2%. However, after a 5.1% growth rate in 2007 and 2.4% in
2008, real GDP declined by 6.9% in 2009, as a result of the economic crisis. The weakening
of the economic activities was significant and the recovery rather sluggish; in 2010 and
2011 the real GDP growth rate amounted to –1.4% and 0.0%3. Therefore, the average
growth rate in the period 2001-2011 amounted to 2.4%, which was relatively modest
compared to the other selected member states.
Figure 1: Real GDP growth rates in selected countries averages 2001- 2011
The structure of the gross value added (GVA) by sectors showed that Croatian economy is
changing in the direction of the average structure in the developed countries4. In the
period 2000-2011, the primary and secondary sector both recorded a decrease in the share
of total GVA; the primary sector from 6.48% to 5.15% and the secondary sector from 29.20%
to 26.46% of total GVA in 2011. In the same period the tertiary sector increased from
34.26% to 38.53%, and the quaternary has not changed significantly, as it fluctuated around
29% of the total GVA.
In the recent years, output growth has been driven by growth in domestic demand, in
particular by growth in investments and personal consumption. During the period between
2000 and 2008, investments in fixed capital grew by an average rate of 8.7% reaching the
share of gross fixed capital formation of 8.7% in 2008.
However, reflecting the contraction pattern, from 2009 investments in fixed capital
recorded a significant decrease; -14.2% (2009), -15.0% (2010) and -7.2% (2011). Stable
2 Basic macroeconomic indicators are presented in Annex 1, Table 1. 3 Preliminary data for 2010 and 2011 4 The structure of each sector along with their shares in total gross value added is presented in Annex 1, Table 2 and Table 3.
Page 9 / 135
economic growth followed by the persistent crisis period led to the decreasing of the
income gap in relation to EU27.
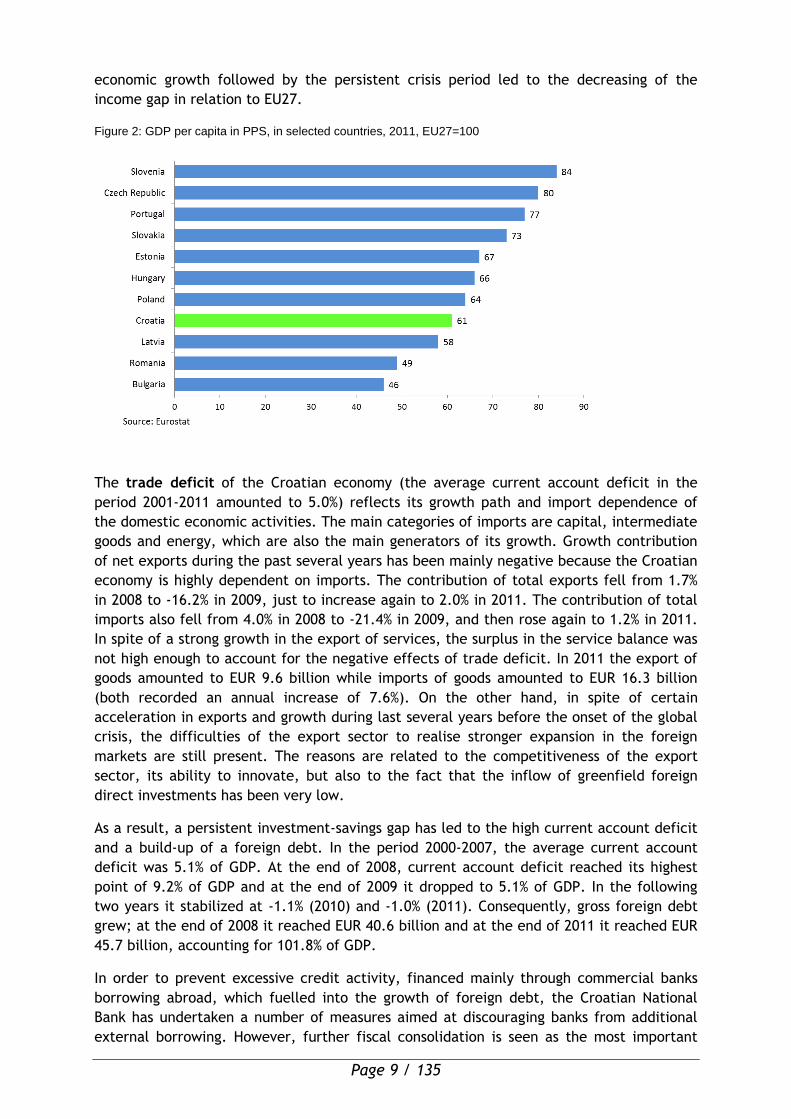
Figure 2: GDP per capita in PPS, in selected countries, 2011, EU27=100
The trade deficit of the Croatian economy (the average current account deficit in the
period 2001-2011 amounted to 5.0%) reflects its growth path and import dependence of
the domestic economic activities. The main categories of imports are capital, intermediate
goods and energy, which are also the main generators of its growth. Growth contribution
of net exports during the past several years has been mainly negative because the Croatian
economy is highly dependent on imports. The contribution of total exports fell from 1.7%
in 2008 to -16.2% in 2009, just to increase again to 2.0% in 2011. The contribution of total
imports also fell from 4.0% in 2008 to -21.4% in 2009, and then rose again to 1.2% in 2011.
In spite of a strong growth in the export of services, the surplus in the service balance was
not high enough to account for the negative effects of trade deficit. In 2011 the export of
goods amounted to EUR 9.6 billion while imports of goods amounted to EUR 16.3 billion
(both recorded an annual increase of 7.6%). On the other hand, in spite of certain
acceleration in exports and growth during last several years before the onset of the global
crisis, the difficulties of the export sector to realise stronger expansion in the foreign
markets are still present. The reasons are related to the competitiveness of the export
sector, its ability to innovate, but also to the fact that the inflow of greenfield foreign
direct investments has been very low.
As a result, a persistent investment-savings gap has led to the high current account deficit
and a build-up of a foreign debt. In the period 2000-2007, the average current account
deficit was 5.1% of GDP. At the end of 2008, current account deficit reached its highest
point of 9.2% of GDP and at the end of 2009 it dropped to 5.1% of GDP. In the following
two years it stabilized at -1.1% (2010) and -1.0% (2011). Consequently, gross foreign debt
grew; at the end of 2008 it reached EUR 40.6 billion and at the end of 2011 it reached EUR
45.7 billion, accounting for 101.8% of GDP.
In order to prevent excessive credit activity, financed mainly through commercial banks
borrowing abroad, which fuelled into the growth of foreign debt, the Croatian National
Bank has undertaken a number of measures aimed at discouraging banks from additional
external borrowing. However, further fiscal consolidation is seen as the most important

Page 10 / 135
tool to support the process of tackling external imbalances. Since 2004, fiscal policy is in
the on-going process of fiscal consolidation, which has allowed for the consolidated
general government balance to decrease from -4.1% of GDP in 2002 to -1.4% in 20085.
In 2009, caused by the negative effects of the crisis, it recorded a new decrease of -4.1%
of GDP, which has continued in the recent period, as it amounted to -5.1% of GDP in 2011.
Inflation in Croatia, measured by the consumer price index in the period 2000-2007, was
moderate, mainly due to the appreciation of the HRK/EUR exchange rate, slow nominal
wage increase, mild labour productivity growth and intense competition in the retail
trade. Continued increase in the prices of food products and energy on the world market
caused considerable growth of the consumer price index of 6.1% in 2008. However, in the
following period (2009-2011) the CPI decreased, as it amounted to 2.4%, 1.1% and 2.3%,
respectively.
Croatia is following a managed float regime. Croatian National Bank is maintaining a stable
exchange rate by direct foreign exchange interventions and by regulating bank system
liquidity. A relatively strong inflow of a foreign capital and productivity growth is
conditioned by a gradual real appreciation of the exchange rate. In the period 2001-2011
the average exchange rate HRK/EUR floated between 7.22 and 7.56.
Due to a relatively stable economic growth before the crisis period, the labour market
recorded positive trends and the number of employed persons increased, while the
unemployment rate has been constantly decreasing since 2000, when it had reached the
maximum of 16.1% (measured by ILO comparable rate). Favourable labour market
developments continued into 2008, when the unemployment rate amounted to 8.4% and
reached its lowest level in the last 15 years. However, in 2009 the long-term trend of
decreasing unemployment was interrupted by the crisis. The ILO comparable
unemployment rate first increased to 9.1% in 2009 and continued its rise to 13.5% in 2011.
The registered unemployment at the end of 2011 was 17.8% higher than at the end of the
previous year. The crisis most strongly hit the male-dominated manufacturing and
construction industries. Apart from currently high cyclical unemployment, the Croatian
labour market is also characterized by several long-term structural problems. The overall
employment rate of 50.9% in 2011 is still relatively low, reflecting insufficient activity
despite positive developments in the last several years. The unemployment rate of the
youth and women is relatively high, partly due to obstacles in their access to employment.
The long-term unemployment rate (persons unemployed for 12 months and more) in 2011 amounted to 8.6%, reflecting a lack of employability, generally decreased activity and limited access to employment.
5 According to the ESA 95 methodology.
Page 11 / 135
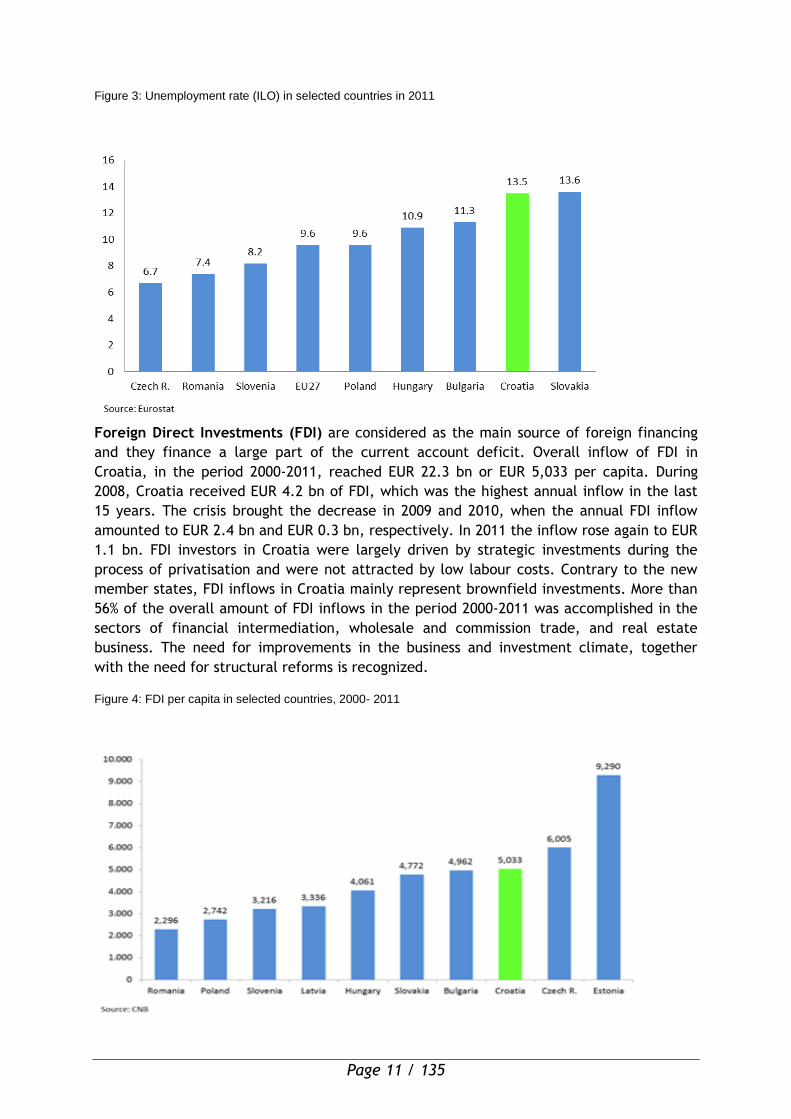
Figure 3: Unemployment rate (ILO) in selected countries in 2011
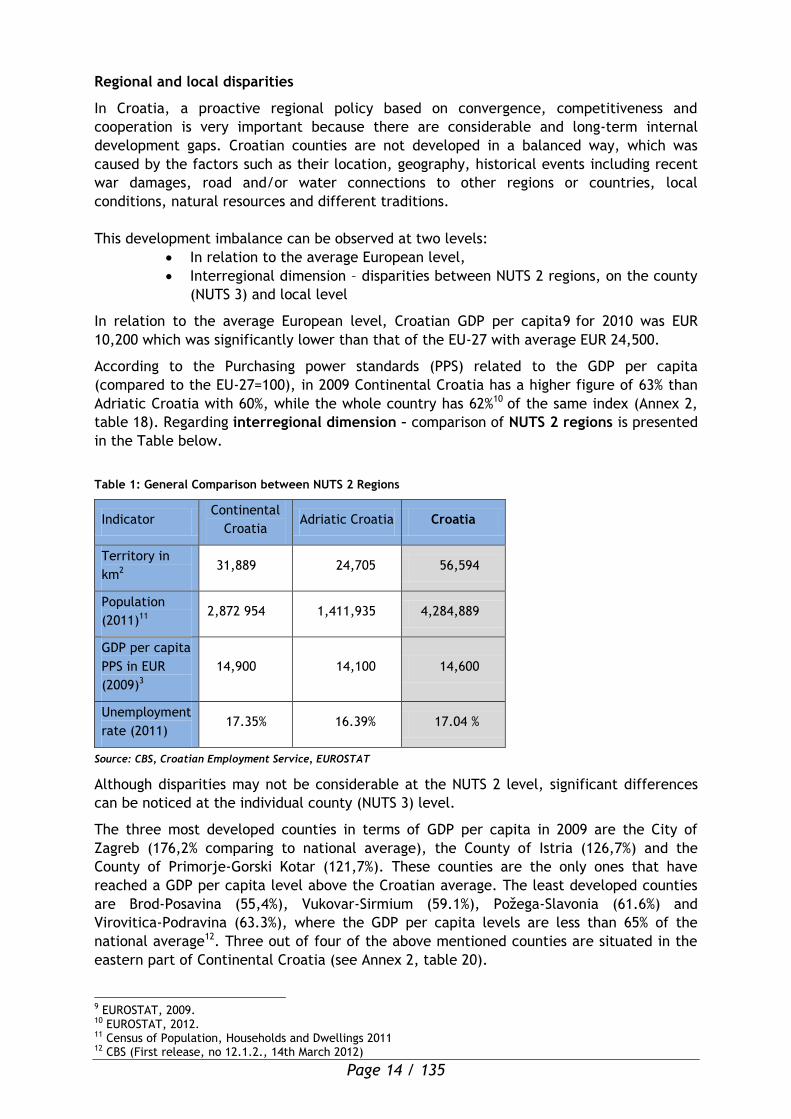
Foreign Direct Investments (FDI) are considered as the main source of foreign financing
and they finance a large part of the current account deficit. Overall inflow of FDI in
Croatia, in the period 2000-2011, reached EUR 22.3 bn or EUR 5,033 per capita. During
2008, Croatia received EUR 4.2 bn of FDI, which was the highest annual inflow in the last
15 years. The crisis brought the decrease in 2009 and 2010, when the annual FDI inflow
amounted to EUR 2.4 bn and EUR 0.3 bn, respectively. In 2011 the inflow rose again to EUR
1.1 bn. FDI investors in Croatia were largely driven by strategic investments during the
process of privatisation and were not attracted by low labour costs. Contrary to the new
member states, FDI inflows in Croatia mainly represent brownfield investments. More than
56% of the overall amount of FDI inflows in the period 2000-2011 was accomplished in the
sectors of financial intermediation, wholesale and commission trade, and real estate
business. The need for improvements in the business and investment climate, together
with the need for structural reforms is recognized.
Figure 4: FDI per capita in selected countries, 2000- 2011

Page 12 / 135
The Global Competitiveness Report (GCR) 2012 - 20136 analyses competitiveness of 144
countries/economies by ranking them according to their position in three different stages
of development, depending on a combination of macroeconomic and microeconomic
indicators and institutional factors 7. Croatia is located in a group of countries in the
transition stage from an “efficiency driven economy” to an “innovation driven economy”,
together with its potentially comparable competitors of the Central and Eastern Europe:
Estonia, Hungary, Latvia, Lithuania and Poland. With the Global Competitiveness Index
(GCI) of 4.0 in 2011, Croatia is ranked in the 81st place (out of 144) with a stable
competitiveness score (4.0 in 2009 and 4.1 in 2010). Looking at the 12 pillars of
competitiveness, negative trend of development continued.
The results in GCR Report show that Croatia declined in infrastructure and in technological
readiness, whilst the results in health and primary education continue to be a concern. The
rankings for the pillars of competitiveness such as financial market development, business
sophistication, and institutions were assessed as suboptimal, while higher education,
goods market efficiency and market size represents stagnating pillars.
The decline in the evaluation of innovation was halted, while there was an improvement in the evaluation of labour market efficiency, although it continues to be at a lower level. Although there are some competitive advantages which are located mostly under the infrastructure pillar, health and primary education pillar and technological readiness pillar, the Croatian economy will need to focus especially on increasing business sophistication and innovation in order for it to remain competitive. All these pillars cover the first and second stage of the development focus, and should be further improved.
1.1.2 Regional development and competitiveness of Croatian regions
Croatia is divided into two NUTS 2 regions: Adriatic Croatia and Continental Croatia8.
These regions constitute statistical units only, unlike the counties, the NUTS 3 levels,
which are administrative, self-governing units (there are 21 counties in Croatia, including
the City of Zagreb). Apart from the fact that these statistical regions are currently
important for the programming and allocation of available EU funds intended for cohesion
policy purposes, they still play a significant role regarding the work of regional actors in
planning that takes into consideration the regional specificities.
Although there are only a few structures that exist related to them at the moment, e.g.
Regional Partnership Councils; the coordination of County Development Agencies-CDA on
the level of statistical region, they will be developed further.
Regional development in Croatia is governed through a set of laws and other legislative
acts, with the most important among them being the Act on Regional Development of
Republic of Croatia and Strategy of Regional Development of Republic of Croatia (SRDRC).
Regional coordinators are appointed at the level of each county (in most cases function is
performed by regional development agency) and continuous communication is ensured
with the Ministry of Regional Development and EU Funds.
6 Released in September 2012 by the World Economic Forum 7 Competitiveness is measured by means of the Global Competitiveness Index (on a scale of 1-7), which measures different aspects grouped into 12 pillars of competitiveness: institutions, infrastructure, macroeconomic environment, health and primary education, higher education and training, goods market efficiency, labour market efficiency, financial market development, technological readiness, market size, business sophistication, and innovation. 8 National Classification of Territorial Units for Statistics (OG 96/2012).

Page 13 / 135
Continental Croatia consists out of 14 counties: City of Zagreb, County of Zagreb,
County of Krapina-Zagorje, County of Varaždin, County of Koprivnica-Križevci, County of
Međimurje, County of Bjelovar-Bilogora, County of Virovitica-Podravina, County of
Požega-Slavonia, County of Brod-Posavina, County of Osijek-Baranja, County of Vukovar-
Sirmium, County of Karlovac, County of Sisak-Moslavina.
Adriatic Croatia consists out of 7 counties: County of Primorje-Gorski kotar, County of
Lika-Senj, County of Zadar, County of Šibenik-Knin, County of Split-Dalmatia, County of
Istria, County of Dubrovnik-Neretva.
Figure 5: Croatian NUTS 2 Regions as of 2012
Source: CBS
Page 14 / 135
Regional and local disparities
In Croatia, a proactive regional policy based on convergence, competitiveness and
cooperation is very important because there are considerable and long-term internal
development gaps. Croatian counties are not developed in a balanced way, which was
caused by the factors such as their location, geography, historical events including recent
war damages, road and/or water connections to other regions or countries, local
conditions, natural resources and different traditions.
This development imbalance can be observed at two levels:
In relation to the average European level,
Interregional dimension – disparities between NUTS 2 regions, on the county
(NUTS 3) and local level
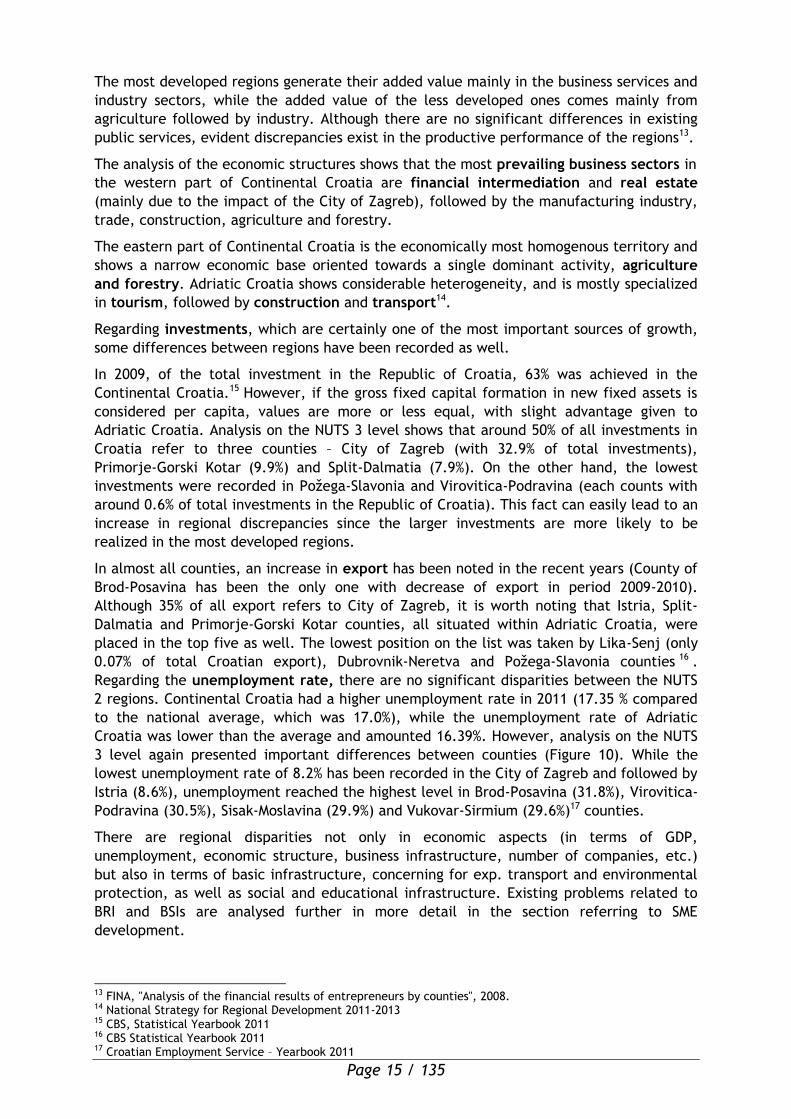
In relation to the average European level, Croatian GDP per capita9 for 2010 was EUR
10,200 which was significantly lower than that of the EU-27 with average EUR 24,500.
According to the Purchasing power standards (PPS) related to the GDP per capita
(compared to the EU-27=100), in 2009 Continental Croatia has a higher figure of 63% than
Adriatic Croatia with 60%, while the whole country has 62%10 of the same index (Annex 2,
table 18). Regarding interregional dimension – comparison of NUTS 2 regions is presented
in the Table below.
Table 1: General Comparison between NUTS 2 Regions
Indicator Continental
Croatia Adriatic Croatia Croatia
Territory in
km2 31,889 24,705 56,594
Population
(2011)11 2,872 954 1,411,935 4,284,889
GDP per capita
PPS in EUR
(2009)3
14,900 14,100 14,600
Unemployment
rate (2011) 17.35% 16.39% 17.04 %
Source: CBS, Croatian Employment Service, EUROSTAT
Although disparities may not be considerable at the NUTS 2 level, significant differences
can be noticed at the individual county (NUTS 3) level.
The three most developed counties in terms of GDP per capita in 2009 are the City of
Zagreb (176,2% comparing to national average), the County of Istria (126,7%) and the
County of Primorje-Gorski Kotar (121,7%). These counties are the only ones that have
reached a GDP per capita level above the Croatian average. The least developed counties
are Brod-Posavina (55,4%), Vukovar-Sirmium (59.1%), Požega-Slavonia (61.6%) and
Virovitica-Podravina (63.3%), where the GDP per capita levels are less than 65% of the
national average12. Three out of four of the above mentioned counties are situated in the
eastern part of Continental Croatia (see Annex 2, table 20).
9 EUROSTAT, 2009. 10 EUROSTAT, 2012. 11 Census of Population, Households and Dwellings 2011 12 CBS (First release, no 12.1.2., 14th March 2012)
Page 15 / 135
The most developed regions generate their added value mainly in the business services and
industry sectors, while the added value of the less developed ones comes mainly from
agriculture followed by industry. Although there are no significant differences in existing
public services, evident discrepancies exist in the productive performance of the regions13.
The analysis of the economic structures shows that the most prevailing business sectors in
the western part of Continental Croatia are financial intermediation and real estate
(mainly due to the impact of the City of Zagreb), followed by the manufacturing industry,
trade, construction, agriculture and forestry.
The eastern part of Continental Croatia is the economically most homogenous territory and
shows a narrow economic base oriented towards a single dominant activity, agriculture
and forestry. Adriatic Croatia shows considerable heterogeneity, and is mostly specialized
in tourism, followed by construction and transport14.
Regarding investments, which are certainly one of the most important sources of growth,
some differences between regions have been recorded as well.
In 2009, of the total investment in the Republic of Croatia, 63% was achieved in the
Continental Croatia.15 However, if the gross fixed capital formation in new fixed assets is
considered per capita, values are more or less equal, with slight advantage given to
Adriatic Croatia. Analysis on the NUTS 3 level shows that around 50% of all investments in
Croatia refer to three counties – City of Zagreb (with 32.9% of total investments),
Primorje-Gorski Kotar (9.9%) and Split-Dalmatia (7.9%). On the other hand, the lowest
investments were recorded in Požega-Slavonia and Virovitica-Podravina (each counts with
around 0.6% of total investments in the Republic of Croatia). This fact can easily lead to an
increase in regional discrepancies since the larger investments are more likely to be
realized in the most developed regions.
In almost all counties, an increase in export has been noted in the recent years (County of
Brod-Posavina has been the only one with decrease of export in period 2009-2010).
Although 35% of all export refers to City of Zagreb, it is worth noting that Istria, Split-
Dalmatia and Primorje-Gorski Kotar counties, all situated within Adriatic Croatia, were
placed in the top five as well. The lowest position on the list was taken by Lika-Senj (only
0.07% of total Croatian export), Dubrovnik-Neretva and Požega-Slavonia counties 16 .
Regarding the unemployment rate, there are no significant disparities between the NUTS
2 regions. Continental Croatia had a higher unemployment rate in 2011 (17.35 % compared
to the national average, which was 17.0%), while the unemployment rate of Adriatic
Croatia was lower than the average and amounted 16.39%. However, analysis on the NUTS
3 level again presented important differences between counties (Figure 10). While the
lowest unemployment rate of 8.2% has been recorded in the City of Zagreb and followed by
Istria (8.6%), unemployment reached the highest level in Brod-Posavina (31.8%), Virovitica-
Podravina (30.5%), Sisak-Moslavina (29.9%) and Vukovar-Sirmium (29.6%)17 counties.
There are regional disparities not only in economic aspects (in terms of GDP,
unemployment, economic structure, business infrastructure, number of companies, etc.)
but also in terms of basic infrastructure, concerning for exp. transport and environmental
protection, as well as social and educational infrastructure. Existing problems related to
BRI and BSIs are analysed further in more detail in the section referring to SME
development.
13 FINA, "Analysis of the financial results of entrepreneurs by counties", 2008. 14 National Strategy for Regional Development 2011-2013 15 CBS, Statistical Yearbook 2011 16 CBS Statistical Yearbook 2011 17 Croatian Employment Service – Yearbook 2011
Page 16 / 135
Figure 6: Unemployment rate in Croatian counties in 2011
Source: Croatian Employment Service
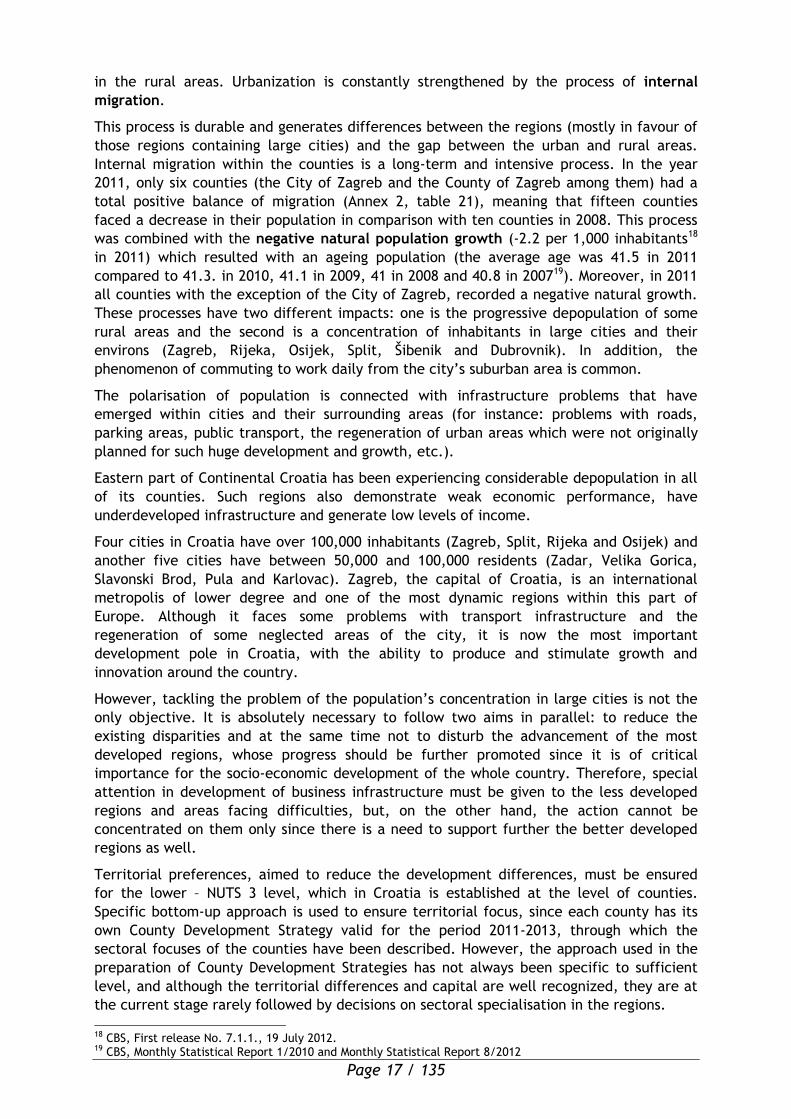
In line with the Act on Regional Development of the Republic of Croatia and subordinate
acts and considering the factors leading to regional differences, the Development Index for
all Croatian counties and local self-government units (towns and municipalities) was
calculated in 2010. The index included data on unemployment rate, income per capita,
own source revenues per capita in county/local units, changes in population growth and
level of education. Based on this calculation, a total of 11 Croatian counties were
identified as significantly lagging behind, with the Development Index below 75% of
national average. Beside those counties, five more have the Development Index below
Croatian average (Table 2).
Table 2: Croatian counties (NUTS 3 level) according to Development Index
Group I
(below 75% of
average)
Group II
(75-100% of average)
Group III
(100-125% of average)
Group IV
(above 125% of
average)
Bjelovar-Bilogora, Slavonski Brod –
Posavina, Karlovac,
Koprivnica – Križevci, Lika-Senj,
Osijek-Baranja, Požega-Slavonia, Sisak-Moslavina,
Šibenik-Knin, Virovitica-Podravina,
Vukovar-Sirmium.
Krapina-Zagorje, Međimurje,
Split-Dalmatia, Varazdin Zadar.
Dubrovnik-Neretva, Zagreb county.
City of Zagreb, Istria,
Primorje-Gorski kotar.
In Croatia, there are 127 towns and 429 municipalities. The towns constitute growth poles,
developed through a continuous process of urbanisation. This has led to the fact that
approximately two thirds of the population live in the urban areas, and just one third lives
Unemployment rate in Croatian counties in 2011 (average data)
Counties Croatian Average
%
Page 17 / 135
in the rural areas. Urbanization is constantly strengthened by the process of internal
migration.
This process is durable and generates differences between the regions (mostly in favour of
those regions containing large cities) and the gap between the urban and rural areas.
Internal migration within the counties is a long-term and intensive process. In the year
2011, only six counties (the City of Zagreb and the County of Zagreb among them) had a
total positive balance of migration (Annex 2, table 21), meaning that fifteen counties
faced a decrease in their population in comparison with ten counties in 2008. This process
was combined with the negative natural population growth (-2.2 per 1,000 inhabitants18
in 2011) which resulted with an ageing population (the average age was 41.5 in 2011
compared to 41.3. in 2010, 41.1 in 2009, 41 in 2008 and 40.8 in 200719). Moreover, in 2011
all counties with the exception of the City of Zagreb, recorded a negative natural growth.
These processes have two different impacts: one is the progressive depopulation of some
rural areas and the second is a concentration of inhabitants in large cities and their
environs (Zagreb, Rijeka, Osijek, Split, Šibenik and Dubrovnik). In addition, the
phenomenon of commuting to work daily from the city’s suburban area is common.
The polarisation of population is connected with infrastructure problems that have
emerged within cities and their surrounding areas (for instance: problems with roads,
parking areas, public transport, the regeneration of urban areas which were not originally
planned for such huge development and growth, etc.).
Eastern part of Continental Croatia has been experiencing considerable depopulation in all
of its counties. Such regions also demonstrate weak economic performance, have
underdeveloped infrastructure and generate low levels of income.
Four cities in Croatia have over 100,000 inhabitants (Zagreb, Split, Rijeka and Osijek) and
another five cities have between 50,000 and 100,000 residents (Zadar, Velika Gorica,
Slavonski Brod, Pula and Karlovac). Zagreb, the capital of Croatia, is an international
metropolis of lower degree and one of the most dynamic regions within this part of
Europe. Although it faces some problems with transport infrastructure and the
regeneration of some neglected areas of the city, it is now the most important
development pole in Croatia, with the ability to produce and stimulate growth and
innovation around the country.
However, tackling the problem of the population’s concentration in large cities is not the
only objective. It is absolutely necessary to follow two aims in parallel: to reduce the
existing disparities and at the same time not to disturb the advancement of the most
developed regions, whose progress should be further promoted since it is of critical
importance for the socio-economic development of the whole country. Therefore, special
attention in development of business infrastructure must be given to the less developed
regions and areas facing difficulties, but, on the other hand, the action cannot be
concentrated on them only since there is a need to support further the better developed
regions as well.
Territorial preferences, aimed to reduce the development differences, must be ensured
for the lower – NUTS 3 level, which in Croatia is established at the level of counties.
Specific bottom-up approach is used to ensure territorial focus, since each county has its
own County Development Strategy valid for the period 2011-2013, through which the
sectoral focuses of the counties have been described. However, the approach used in the
preparation of County Development Strategies has not always been specific to sufficient
level, and although the territorial differences and capital are well recognized, they are at
the current stage rarely followed by decisions on sectoral specialisation in the regions.
18 CBS, First release No. 7.1.1., 19 July 2012. 19 CBS, Monthly Statistical Report 1/2010 and Monthly Statistical Report 8/2012
Page 18 / 135
Generally, SRDRC and County Development Strategies, but also the project ideas proposed
through Central Electronic Database of Development Projects, point out the great interest
and need for development of business related infrastructure and tourism offer.
Further analysis related to these topics is included in the sections related to SME
development and Tourism. Also, project ideas from the regional level (bottom-up) are not
always developed to the sufficient level, with all necessary technical and project
documentation, so help in quality preparation of such projects is needed as well.
Competitiveness of Croatian regions
The scope and intensity of progress in individual regions or counties and their ability to
“catch up” with the more developed parts of Croatia, and the European Union, can best be
understood through a competitiveness analysis. A competitiveness research conducted in
2007 in Croatia was based on the World Economic Forum 2002 methodology, which
provided a good background for tracking changes and adjustments of national policies
focused on the removal of barriers to development and competitiveness enhancement.
National competitiveness is based on among other things, companies’ comparative
competitiveness, i.e. a good business environment and business sector in the whole
country. In order to achieve a high quality of life for everyone and improve national
competitiveness, regions should cooperate to share their knowledge of development,
innovation and use of natural resources, identify the engines of growth in each individual
region and eliminate obstacles to competitive growth.
The competitiveness research conducted in 2007 provided an analysis of the initial state of
regional competitiveness in Croatia, a first and crucial step toward establishing a more
effective regional development policy. Since the regional competitiveness monitoring
began in Croatia in 2002, its regional competitiveness ranking has consistently fallen. From
2002 to 2006 Croatia’s average ranking was in the range of 60th place, but in 2009 it
dropped to 72nd, in 2010 to 77th, and in 2011 to 81st 20.
Low business sector productivity 21 and constant presence of various obstacles in the
business environment22, which are primarily caused by the inefficient judiciary and public
institutions systems, corruption a lack of ability to absorb new knowledge, technology,
innovation and labour market inefficiency make it difficult to strengthen competitiveness.
The fact that some processes of institutional change have not been completed (e.g. the
“guillotine” of unnecessary regulations – project HITROREZ)23 considerably slows down the
development of a simpler and more transparent business environment regulatory
framework and also makes it difficult to create positive energy for changes in the society.
The competitiveness of the Croatian economy on a national level is a reflection of local
and regional level competitive capacities, which only enhances the importance and the
need for regional and local development in the country. Therefore, Croatian national and
regional development policies have to be complementary and aligned with the European
Union’s regional policy. The Regional Competitiveness Index 2010 (RCI 2010) monitors and
evaluates the competitiveness of the regions, as well as the competitiveness of all Croatian
counties and the City of Zagreb (NUTS 3 level), like in the research conducted in 2007. 20 National Competitiveness Council, Annual Reports on Croatian Competitiveness 21 Labor productivity in Croatia was 59.2% of the EU 25 average (2006). However, Croatia’s labor productivity lags even more when compared to the EU 15 average, which is 106% of the EU 25 average. (“Path to Faster Convergence: Challenges and Cooperation Overview“, World Bank, Zagreb, January 2008, p.18.) 22 The World Bank study on the ease of doing business ranked Croatia 103 of 183 countries. Doing Business, World Bank, 2010. 23 The project was implemented in 2006 and 2007; 1,455 regulations relating to the economy have been reviewed, and 799 recalls/simplifications were proposed. Only 368 proposals were implemented. The HITROREZ project implementation summary (July 28, 2009) is available at www.hitrorez.hr
Page 19 / 135
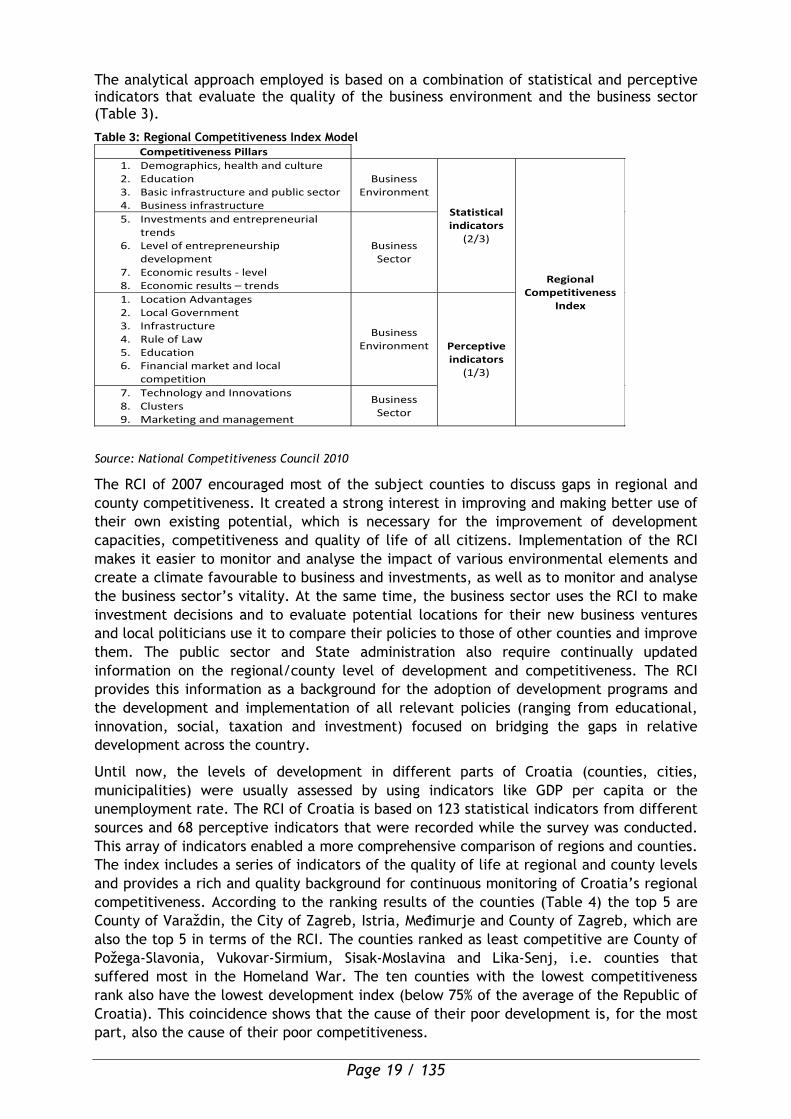
The analytical approach employed is based on a combination of statistical and perceptive indicators that evaluate the quality of the business environment and the business sector (Table 3).
Table 3: Regional Competitiveness Index Model
Competitiveness Pillars
1. Demographics, health and culture 2. Education 3. Basic infrastructure and public sector 4. Business infrastructure
Business Environment
Statistical indicators
(2/3)
Regional Competitiveness
Index
5. Investments and entrepreneurial trends
6. Level of entrepreneurship development
7. Economic results - level 8. Economic results – trends
Business Sector
1. Location Advantages 2. Local Government 3. Infrastructure 4. Rule of Law 5. Education 6. Financial market and local
competition
Business Environment Perceptive
indicators (1/3)
7. Technology and Innovations 8. Clusters 9. Marketing and management
Business Sector
Source: National Competitiveness Council 2010
The RCI of 2007 encouraged most of the subject counties to discuss gaps in regional and
county competitiveness. It created a strong interest in improving and making better use of
their own existing potential, which is necessary for the improvement of development
capacities, competitiveness and quality of life of all citizens. Implementation of the RCI
makes it easier to monitor and analyse the impact of various environmental elements and
create a climate favourable to business and investments, as well as to monitor and analyse
the business sector’s vitality. At the same time, the business sector uses the RCI to make
investment decisions and to evaluate potential locations for their new business ventures
and local politicians use it to compare their policies to those of other counties and improve
them. The public sector and State administration also require continually updated
information on the regional/county level of development and competitiveness. The RCI
provides this information as a background for the adoption of development programs and
the development and implementation of all relevant policies (ranging from educational,
innovation, social, taxation and investment) focused on bridging the gaps in relative
development across the country.
Until now, the levels of development in different parts of Croatia (counties, cities,
municipalities) were usually assessed by using indicators like GDP per capita or the
unemployment rate. The RCI of Croatia is based on 123 statistical indicators from different
sources and 68 perceptive indicators that were recorded while the survey was conducted.
This array of indicators enabled a more comprehensive comparison of regions and counties.
The index includes a series of indicators of the quality of life at regional and county levels
and provides a rich and quality background for continuous monitoring of Croatia’s regional
competitiveness. According to the ranking results of the counties (Table 4) the top 5 are
County of Varaždin, the City of Zagreb, Istria, Međimurje and County of Zagreb, which are
also the top 5 in terms of the RCI. The counties ranked as least competitive are County of
Požega-Slavonia, Vukovar-Sirmium, Sisak-Moslavina and Lika-Senj, i.e. counties that
suffered most in the Homeland War. The ten counties with the lowest competitiveness
rank also have the lowest development index (below 75% of the average of the Republic of
Croatia). This coincidence shows that the cause of their poor development is, for the most
part, also the cause of their poor competitiveness.
Page 20 / 135
Table 4: Regions and counties ranked according to their competitiveness in 2010
Source: National Competitiveness Council, 2010
A comparison of the data on the counties’ competitiveness (i.e. their growth potential) with data on GDP per capita, or the current level of development of individual counties, indicates a high correlation (Figure 11). Low competitiveness is usually followed by low GDP per capita. A less favourable competitiveness level indicates that the sustainability of a higher GDP per capita is endangered in the long run. When the gap between the GDP and competitiveness levels is large it usually indicates that GDP includes an inflow of value from outside of the region/county (i.e. subsidies or investments).
Overall
Competitiveness Rank
Counties
Busin
ess E
nviro
nm
ent
Busin
ess S
ecto
r
Statistical Rank Perceptive Rank
2010 2007
Overa
ll
Busin
ess
Enviro
nm
ent
Busin
ess
Secto
r
Overa
ll
Busin
ess
Enviro
nm
ent
Busin
ess
Secto
r
1 4 Varaždin 1 1 6 5 7 1 1 1
2 1 City of Zagreb 2 4 2 1 3 7 9 7
3 3 Istria 7 5 1 2 1 13 13 10
4 2 Međimurje 6 2 3 7 2 6 6 6
5 5 Zagreb 3 6 7 4 9 5 5 3
6 9 Zadar 4 3 10 13 8 3 2 5
7 6 Primorje – Gorski Kotar
8 7 5 6 4 12 11 12
8 8 Split -Dalmatia 12 9 4 3 5 14 17 13
9 10 Dubrovnik-Neretva 11 11 9 8 10 11 12 9
10 13 Šibenik-Knin 14 13 8 9 6 16 16 20
11 15 Krapina - Zagorje 13 10 11 10 12 8 10 8
12 7 Koprivnica-Križevci 9 8 13 14 14 4 4 4
13 14 Osijek - Baranja 5 12 14 12 20 2 3 2
14 12 Karlovac 10 14 12 11 11 10 7 11
15 11 Bjelovar - Bilogora 16 17 15 15 17 15 14 16
16 18 Brod-Posavina 15 16 19 18 19 9 8 11
17 17 Virovitica - Podravina 17 15 17 16 16 17 18 14
18 19 Lika - Senj 18 18 18 21 13 18 15 21
19 16 Sisak – Moslavina 19 19 16 17 15 20 20 18
20 21 Vukovar - Srijem 20 20 20 19 18 19 19 19
21 20 Požega - Slavonia 21 21 21 20 21 21 21 17
Page 21 / 135
Figure 7: Counties ranked by competitiveness and GDP per capita
Source: National Competitiveness Council, 2010
The largest discrepancies between competitiveness and development have been identified
in County of Lika-Senj, which is at the bottom of the competitiveness list, but ranks 7th in
GDP per capita. These discrepancies are not sustainable in the long run and indicate the
need for a different approach to development, which has been confirmed by changes that
took place between the regional competitiveness research conducted in 2007 and that
conducted in 2010. County of Lika-Senj is the only county where GDP per capita was lower
in 2010 (HRK 60,432) than it was in 2007 (HRK 62,485)24. County of Međimurje and County
of Zagreb are ranked higher in competitiveness than they are in GDP per capita, which
leads to the question of why this competitiveness capacity is not reflected in a growth of
gross domestic product per capita.
To establish regional development policies on national, regional and county levels, it is
important to supplement the information on county/regional business sector and
environment rank with information on the quality of the elements that define the business
environment and business sector.
Continental Croatia includes the most competitive counties, mainly situated in the North-
Western part, as well as the least competitive, situated at the very bottom of the list. The
biggest advantage of the North-Western part is the level of entrepreneurial development,
along with favourable indicators regarding demographics, health, cultural activities,
education and basic infrastructure. There are still deeper development problems in
Krapina-Zagorje and Koprivnica-Križevci counties because they are still lagging behind in
comparison to their surroundings, the Varaždin, City of Zagreb, County of Zagreb and
County of Međimurje which take a leading position according to a series of statistical
indicators (especially investments and entrepreneurial trends, education, demographics
and business sector economic results). However, eastern part of the region is the least
competitive, and will require the most investment to catch up with the competitiveness
level of other regions. This applies to all of the competitiveness pillars. Although in a
situation like the one presented, when there is so much to gain, the dynamics of
achievement in the business sector and tangible economic results are much better than
they are in the North-Western part. The eastern counties are at the bottom (ranking 13th to
21st) of the competitiveness list, both according to their competitiveness and their GDP per
capita.
24 The regional competitiveness study conducted in 2007 used GDP per capita data from 2004, while the study conducted in 2010 used GDP data from 2007.
Page 22 / 135
Adriatic Croatia, although similar if the indicators are considered at average levels, has a
considerably different competitiveness profile than Continental Croatia. The reason behind
this difference is a very good business environment (demographics and education) and the
presence of good business sector indicators (investments and entrepreneurial trends and
trends in business economic results). The region still faces problems with the quality of
basic and business infrastructure and entrepreneurship development which is particularly
emphasised in County of Lika-Senj.
Key challenges
The most crucial issues that regional development encounters are:
- development gap of both Croatian NUTS 2 region in comparison to EU level;
- significant socio-economic disparities between NUTS 3 regions;
- insufficient basic business and tourism-related public infrastructure – in terms of
the number, location, size, quality and appropriateness of facilities; and
- progressive depopulation of some regions and concentration of inhabitants in large
cities and their hinterlands.
1.1.3.1. SME development
In the last two decades Croatian economy has been characterized by the transition process and the conversion of the existing businesses from state to private ownership, and at the same time the establishment of new privately owned small businesses. The result of these developments is reflected in the increase of the share of SMEs and actual financial results.
According to the data of financial reports for 201125, business entities in Croatia amount to 98,530 subjects liable to corporation tax out of which 96,855 are micro and small, 1,316 medium, 359 large and 86,230 are craftsmen, employing a total of 851,386 workers. The data show continuous growth of the number of entrepreneurs in the past five years and illustrates vivacity and growth of the Croatian SMEs.
SMEs in Croatia represent 99.7% of all enterprises, similar to the EU 27 where they represent 99.8% of all enterprises26. Micro entities account on average 80% of total number of SMEs, liable to submission of financial reports. In the Ministry of Entrepreneurship and Crafts’ (MEC) official Registry of crafts, by the end of December 2011 the number of active crafts was 86,230, employing 195,281 craftsmen and workers.
An average number of people employed in small entities in the period 2003–2010 is about 4 to 5, while the average number of people employed in medium-sized entities in the same period increased by 87% (on average, from 61 employed in 2003 to an average of 114 employed in 2010). Pursuant to shares in total employment SMEs had a share of 67.2% of overall employment, and in EU 27 SMEs share in total employment is 67%27.
Depending on the observed business year, the share of small business entities in GDP ranges from 33 to 33.8%, medium-sized entities about 19% and totalling more than 50%. Shares in exports of SMEs are almost equated, the share of both entities in overall exports being about 21%, totalling to 41%.
25 FINA 26 SBA fact sheet Croatia 2010/2011 27 SBA fact sheet Croatia 2010/2011
Page 23 / 135
Density of SMEs is measured by the number of SMEs per 1,000 inhabitants. In the period 2001-2010, in Croatia, the density of SMEs increased from 12.71% in 2001 to 22.47% in 2010, as a result of an increase of the SMEs number in spite of the decrease of the number of inhabitants.
The SME sector contributes to around 57.1% of total value added in comparison to 58.5% in the EU27 according to the 2008 data28. In the year 2010, the year of general losses, when GDP fell by 1.2%, the SME sector still made a positive result. However, the basic characteristic of the period is a large number of loss making entrepreneurs (41.9%).
The leading productive sectors in Croatia are 29: the wholesale and retail trade sector (24.35% of enterprises); manufacturing (13.27%); construction (13.07%); accommodation and food service activities (10.67%); and, professional, scientific and technical activities (10.38%). These five sectors represent 72% of all SMEs30.
SMEs are concentrated in a number of manufacturing sectors and sub-sectors. The principal sectors are: food production and processing, textiles (especially wearing apparel), manufacture of timber and wood products (except furniture), articles of straw and painting materials, rubber and plastic products, and the manufacture of metal and machinery products. An analysis of manufacturing sector indicates that there is a substantial difference between sectors and sub-sectors in which most SMEs operate (food products, wearing apparel, basic wood products, fabrication of metal products), most profitable being: beverages, leather products, pharmaceutical products, computer and electronics, trailers and motor vehicles, and repair of machine and equipment.
In relation to SMEs’ geographic location in two NUTS II regions (the Adriatic and Continental), 38,58% SMEs are located in the Adriatic Region, while 61,42% are situated in the Continental Region. In terms of GDP per capita in PPS, compared to the EU27=100, both NUTS II Croatian Regions are characterized as equally developed, Continental Region with an index of 63% and Adriatic Region with 60%. Croatia, as a country, has an index of 62%31. However, it is important to emphasize that the differences are very pronounced in the view of the structure of SME development at the county level. For instance, in the north-west counties (NUTS III regions), which are part of the Continental NUTS II Region, there is the largest number of SMEs, with the greatest share of total employment in SMEs and the greatest value added generated by SMEs. On the other hand, the central and eastern counties of the same Region have the smallest number of enterprises, least employment in SMEs and the lowest generation of value added (only 7.9% of total value added generated in 2008) which makes them Croatia’s poorest performing counties in SME terms. Profitability is an acute problem in both Regions, whereby 41.9% of all enterprises were loss-making in the Adriatic Region compared to 61.6% in the Continental Region. The highest number of profitable enterprises was found in the Croatian north-west counties.
Data on the location of economic activity on the county level, measured in terms of registered businesses, shows the concentration of SMEs in a few major urban centres and their surrounding areas. The fact that economic activity is to a great extent linked to larger urban centres (Zagreb, Split, Rijeka, and Osijek) and their surrounding areas, demonstrates the lack of balanced business development among Croatian counties. The lead belongs to the City of Zagreb, whose share in the total number of entrepreneurs in the year 2011 amounted to 33.45%. On the other hand, this share was only 0.7%32 in the Požeško-Slavonska and Lika-Senj County for the same year.
Regarding SME policy, Croatia had been implementing the guidelines of the European Charter for Small Enterprises until these were replaced with the Small Business Act for Europe (SBA) in 2009, under which the good practice will continue to be implemented. However, the SME policy index will continue to be used as a benchmarking tool for SMEs.
28 SBA fact sheet Croatia 2010/2011 (see Annex 2) 29 The Croatian SME Observatory Report 2012 30 The Croatian SME Observatory Report 2012 31 EUROSTAT, 2012 32 CBS
Page 24 / 135
The policy index implementation capability in this field is relatively well structured, resourced and framed in a concise set of SME strategies and operational plans. There is a distribution of roles between the Ministry of Entrepreneurship and Crafts (MEC) and the SME agency (HAMAG INVEST). Croatia has aligned SME Encouragement Act33 with the EU SME definition, but full alignment still needs to be ensured in the Croatian Accounting Act34. According to the economic criteria and recommendations in Croatia Progress Report 2012 as regards enterprise and industrial policy, improving the business environment should remain a priority and efforts are necessary to improve it.
Despite relatively good IT literacy per capita, use of online payment operations and the online goods and services trade is rather low. Statistics shows that 61% of total SMEs in Croatia have web sites, 85% is the percentage of usage of financial and banking services and 63% of e-government usage. According to the amendments to the Order on the VAT in Croatia, starting from 1 August 2011, e-invoicing and e-bill are equivalent to a paper bill. In February 2012 there were 527 users of e-bill services in Croatia and that number is growing on a daily basis, 97% enterprises had Internet, 84% broadband Internet and 11% very fast internet access (above 30 Mbps), 39% of companies purchased goods and services via the Internet and 26% used the Internet for selling their products.
The Programme for SME business simplification as a part of the Government Economic Recovery Program developed by the former MELE was adopted in June 2010 encompassing 27 measures covering, among others, business simplification and costs reduction, facilitation of financial sources, e-business, entrepreneurial education, business consultancy and promotion.
According to the Government Programme of Incentives for Small and Medium-Size Enterprises 2008 – 2012, each year Ministry of Entrepreneurship and Crafts (MEC) gives incentives to SMEs which are related to strengthening competitiveness, uniform regional development, raising the quality of entrepreneurial infrastructure, decreasing administrative obstacles, strengthening the entrepreneurial climate in the society and e-business development, growth of target group entrepreneurs (women and young entrepreneurs, war veterans and disabled persons). In addition, the SME state aid Register has been developed at MEC.
However, the results of an international research project on Entrepreneurship Global Entrepreneurship Monitor (GEM), in which Croatia has been included since 2002, indicate a very low level of activity in launching new ventures measured by Total Entrepreneurial Activity Index - TEA35 . With the TEA index of 5.52 in 2010 and 7.32 in 2011 Croatia belongs to countries with low levels of activity in the launch business ventures, compared to the average value of the TEA index (11,39) of all the countries participating in the GEM study36.
SME Policy Index monitors the implementation of the SBA via over 108 indicators, and in its preliminary report, Croatia was considered to be among the leaders of policy changes related to the SMEs. However, the report identifies areas that require significant changes, such as further improving the regulatory framework for SMEs, improving the business environment, streamline the bankruptcy process, stronger support for the development of venture capital and other non-traditional sources of financing to SMEs and support the development of innovative and knowledge-based companies37.
Within the Government Programme of Incentives to Small and Medium-Size Enterprises 2008 – 2012, development of craftsmanship is settled as a specific objective.
33 SME Encouragement Act (OG No 29/02; 63/07; 53/12) 34 Accounting Act (OG No 109/07) 35 TEA index is a number of entrepreneurially active people (which combines a number of people who are trying to start an entrepreneurial venture and the number of people who are the owners or the owners / managers of companies under the age of 42 months) compared to the 100 respondents between 18 and 64 years of age. 36 CEPOR - Report on small and medium-sized enterprises in Croatia - 2012. 37 SBA Fact Sheet 2012, Croatia

Page 25 / 135
Through an Operational plan, incentives for development of vocational schools, craftsmen lifelong education, supporting students by scholarships, encouragement of craftsmen and companies as the providers of practical training, informatics training for tradesmen and craftsmen, acquiring of additional qualifications for craftsmanship and development of traditional and artistic crafts were allocated.
The results of the Government Operational Plan for SME Incentives for 2011 show that 5,400 SMEs applications were accepted for funding from the National budget in the amount of HRK 198.848 million (EUR 26,762 million) through 16 different projects.
The Program of Improving International Competitiveness and Internationalisation of Croatian economy that started in 2006 is composed of two different Projects. One aiming at strengthening the marketing activities on the foreign markets and internationalisation of new products and the other through which two different activities were financed – joint presentation on international fairs and economy missions organised on foreign market. In the period from 2009 to 2011 MELE allocated HRK 96.20 million (EUR 12.95 million) to the Program. In the same period, more than 400 grants in the total value of HRK 85 million (EUR 11.44 million) were given to export oriented companies which used the funds to better access foreign markets. Also, HRK 11.20 (EUR 1.5 million) million was granted to chambers and clusters of companies for their joint presentation of Croatian companies in foreign markets. MELE participated in organising 150 joint presentations at foreign fairs as well as 6 economic missions and 2 representative offices of Croatian clusters in target markets.
Clusters will be used as an export tool to improve the performance of SMEs and top up activities initiated till now according to the "bottom up" approach. The final expected result is increasing of the capacity and capability of SMEs for international competitiveness and improving the export business. A study “Clusters in the Republic of Croatia in 2011” showed that Croatian clusters are not many and do not gather a surprisingly large number of companies (up to 25). In most cases, clusters operate in the manufacturing industry, but are also strongly represented in tourism and agriculture and in most cases focused on the Croatian market. Since 2005 until 2011 MELE co-financed more than 46 initiatives of the listed clusters that join 504 companies and 25,063 employees.
SMEs participated in total exports in 2010 with 41% (SMEs export 39.91% of total value; however crafts’ exports amount to only 0.6%) and large enterprises with 58.9%. Within the SME sector size is significant with the medium sized enterprises responsible for 62% of all SME exports. However, both sectors have a significant trade balance deficit, with imports exceeding exports by 30%.
An important component of the competitiveness of the country is evaluation of its results in innovation. Croatia has a very poor execution in the areas of innovation and knowledge creation, as well as in areas of innovation, entrepreneurship, and implementation. In 2011, Croatia had the innovation index ranked on 76th place (from 142) with GCI 3.1.
The most important source of funding for the total domestic investments in R&D is the government sector which in 2009 provided 51.2% of Gross Domestic Expenditure on R&D (GERD), while the business enterprise sector contributed with 39.8%. The majority of Business Enterprise Research and Development (BERD) is financed by business companies themselves (72% in 2008) while the foreign investors contribute to the business sector with 14.7%.
The structure of the business expenditures on R&D (BERD) in 2010 (€ 128m) reveals those sectors in which most of R&D activities were performed. The highest proportion (32.6%) was in scientific R&D, followed by telecommunications (17.8%) and pharmaceuticals (17.8%). Relatively significant shares have also been observed in food (5.1%), financial and other services (5.5%), motor vehicles (4.4%) and energy supply (4.7%38).
38 Erawatch Croatia
Page 26 / 135
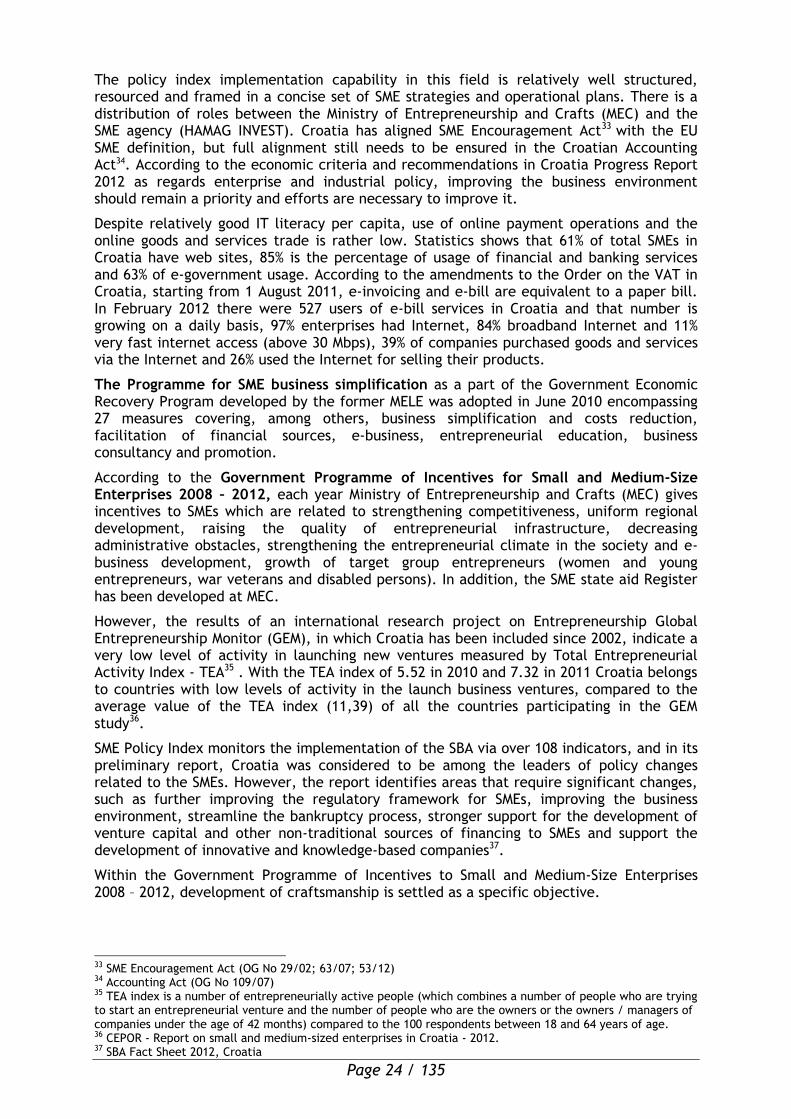
Table 5: Enterprises, by Innovation Performance, Activity and Size, 2008–2010
Total Innovators Non-innovators Share of innovators,%
Total 10 068 3 752 6 315 37,3
Industrial enterprises 3 641 1 626 2 015 44,7
Service enterprises 6 427 2 126 4 300 33,1
Small enterprises 8 208 2 745 5 463 33,4
Medium-sized enterprises 1 520 773 748 50,9
Large enterprises 339 234 105 79,0
Source: CBS 2012
According to the GEM research in 2011, there is very small number of growing businesses, only about 3% measured by criteria of innovation, participation in export revenue and the intensity of the new employment. Although there is a slight increase in innovation of SMEs (which is a prerequisite for increasing competitiveness and market penetration), such growth is still not sufficient to contribute significantly to solving the problem of long-term and high unemployment in Croatia.
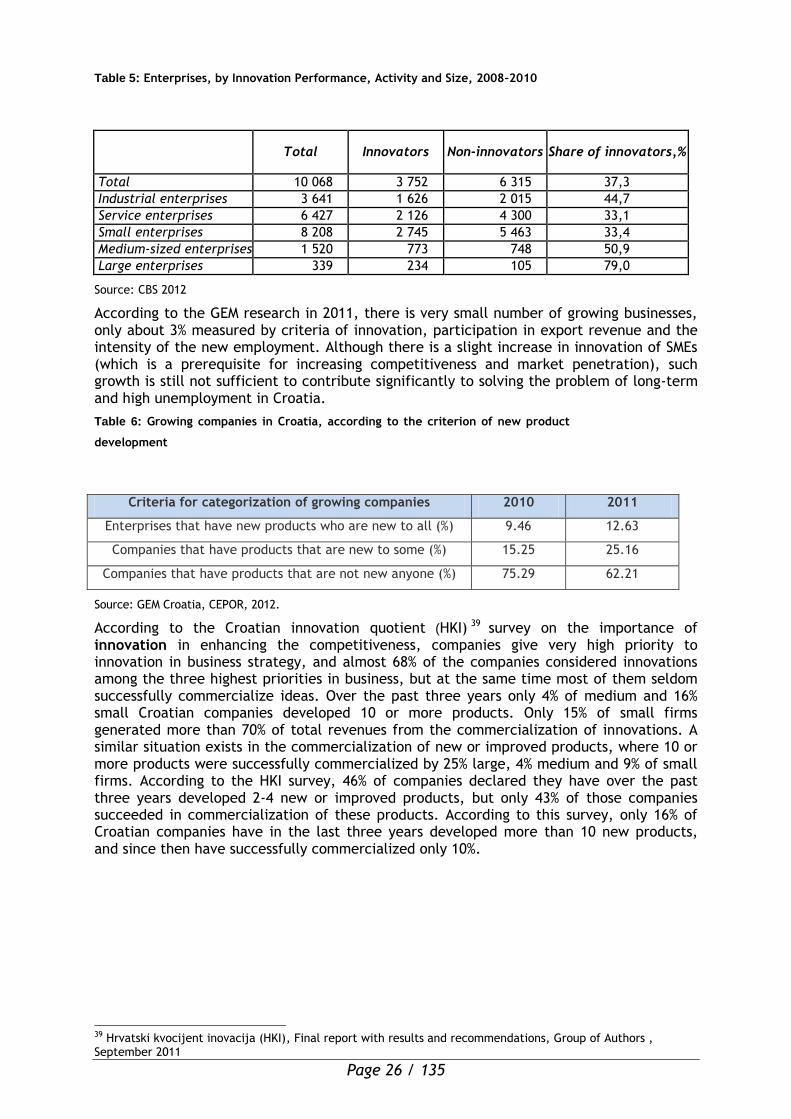
Table 6: Growing companies in Croatia, according to the criterion of new product
development
Criteria for categorization of growing companies 2010 2011
Enterprises that have new products who are new to all (%) 9.46 12.63
Companies that have products that are new to some (%) 15.25 25.16
Companies that have products that are not new anyone (%) 75.29 62.21
Source: GEM Croatia, CEPOR, 2012.
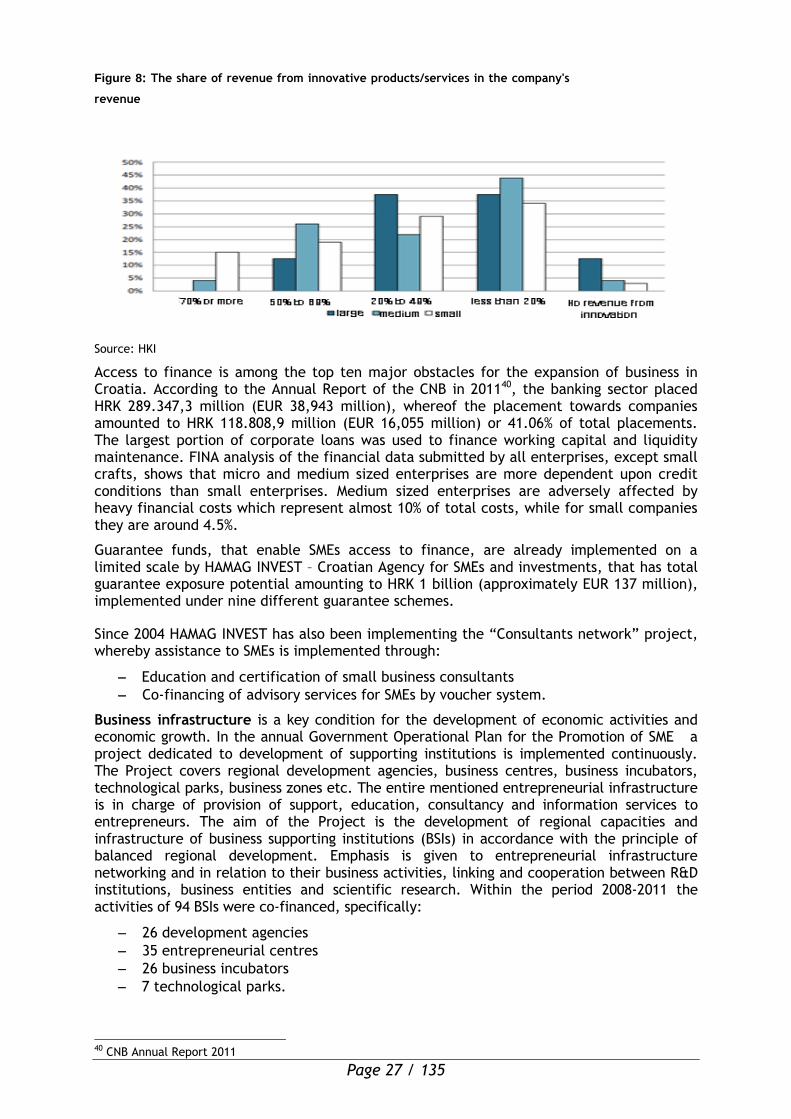
According to the Croatian innovation quotient (HKI) 39 survey on the importance of innovation in enhancing the competitiveness, companies give very high priority to innovation in business strategy, and almost 68% of the companies considered innovations among the three highest priorities in business, but at the same time most of them seldom successfully commercialize ideas. Over the past three years only 4% of medium and 16% small Croatian companies developed 10 or more products. Only 15% of small firms generated more than 70% of total revenues from the commercialization of innovations. A similar situation exists in the commercialization of new or improved products, where 10 or more products were successfully commercialized by 25% large, 4% medium and 9% of small firms. According to the HKI survey, 46% of companies declared they have over the past three years developed 2-4 new or improved products, but only 43% of those companies succeeded in commercialization of these products. According to this survey, only 16% of Croatian companies have in the last three years developed more than 10 new products, and since then have successfully commercialized only 10%.
39 Hrvatski kvocijent inovacija (HKI), Final report with results and recommendations, Group of Authors , September 2011
Page 27 / 135
Figure 8: The share of revenue from innovative products/services in the company's
revenue
Source: HKI
Access to finance is among the top ten major obstacles for the expansion of business in Croatia. According to the Annual Report of the CNB in 201140, the banking sector placed HRK 289.347,3 million (EUR 38,943 million), whereof the placement towards companies amounted to HRK 118.808,9 million (EUR 16,055 million) or 41.06% of total placements. The largest portion of corporate loans was used to finance working capital and liquidity maintenance. FINA analysis of the financial data submitted by all enterprises, except small crafts, shows that micro and medium sized enterprises are more dependent upon credit conditions than small enterprises. Medium sized enterprises are adversely affected by heavy financial costs which represent almost 10% of total costs, while for small companies they are around 4.5%.
Guarantee funds, that enable SMEs access to finance, are already implemented on a limited scale by HAMAG INVEST – Croatian Agency for SMEs and investments, that has total guarantee exposure potential amounting to HRK 1 billion (approximately EUR 137 million), implemented under nine different guarantee schemes.
Since 2004 HAMAG INVEST has also been implementing the “Consultants network” project, whereby assistance to SMEs is implemented through:
Education and certification of small business consultants
Co-financing of advisory services for SMEs by voucher system.
Business infrastructure is a key condition for the development of economic activities and economic growth. In the annual Government Operational Plan for the Promotion of SME a project dedicated to development of supporting institutions is implemented continuously. The Project covers regional development agencies, business centres, business incubators, technological parks, business zones etc. The entire mentioned entrepreneurial infrastructure is in charge of provision of support, education, consultancy and information services to entrepreneurs. The aim of the Project is the development of regional capacities and infrastructure of business supporting institutions (BSIs) in accordance with the principle of balanced regional development. Emphasis is given to entrepreneurial infrastructure networking and in relation to their business activities, linking and cooperation between R&D institutions, business entities and scientific research. Within the period 2008-2011 the activities of 94 BSIs were co-financed, specifically:
26 development agencies
35 entrepreneurial centres
26 business incubators
7 technological parks.
40 CNB Annual Report 2011
Page 28 / 135
In 2011, an assessment41 of BSIs was conducted which included 88 BSIs, of which: 21 Regional Development agencies, 10 Local Development agencies, 16 Business Incubators, 6 Technological Parks and 35 Entrepreneurial Centres. Main concentration of BSIs is in the largest counties which gravitate towards biggest centres of Republic of Croatia, like Zagreb (including County of Zagreb with 8 BSIs), Osijek (Osijek- Baranja County with 11 BSIs), Split (Split -Dalmatia County with 7 BSIs), and Rijeka ( Primorje - Gorski Kotar County with 7 BSIs). In the lagging behind Regions there are 33 BSIs which represent 37.5% of the total number of BSIs. Counties in lagging behind regions have 1-2 BSIs, with one of them being Regional Development Agency, except Sisak - Moslavina County with 5 BSIs. On the other hand, in more developed north-western Croatia like Varaždin County there are total of 6 BSIs, Koprivnica - Križavci County with 7 BSIs and in the Istria County there are 7 BSI's.
The main role of BSIs is to support the long-term sustainable development of SMEs in the region, municipality, or equivalent territory where they act. BSIs work directly with the existing entrepreneurs and potential investors, providing them with the assistance in registering their business, selecting sites for their facilities, providing financial support, advisory services and help when dealing with everyday problems.
As a regular activity they provide information to investors, business partners and service providers on opportunities for expanding their business activities and investments. In 2010 BSIs organized 540 training sessions for SMEs with objective to promote entrepreneurial culture and support the initiating and development of SMEs, developing specific entrepreneurial skills and ICT competences, and encouraging access to finance sources and EU funding.
The construction of entrepreneurial zones was financed by MEC (and former MELE), local and regional self-government units, public institutions, EU-funded projects and other ministries. In the period between 2004 and 2009, former MELE co-financed the construction and development of 293 business zones, which, according to the data submitted by the local self-governing units, occupied around 8,000 hectares and had approximately 1,800 active entrepreneurs employing 31,000 persons. In period between 2004 and 2009 over EUR 70 million were invested in business zones by former MELE, but considering the number and size of zones, the average incentive per hectare was around EUR 8,700, which amounts only about 10% of average building costs.
Despite these investments, the quality of available business infrastructure limits the economic activities and growth of enterprises. In particular, the large entrepreneurial zones (with surface over 70 hectares) are considered to be inadequate for the reception of foreign and domestic investments due to the low level of infrastructural equipment (only 13.53% of the free surface is fully equipped)42. In small and medium sized zones the situation is better, provided that the highest rate of infrastructure equipment is located in the small zones.
The occupancy rate of large business zones is considered low (34.75%) compared to the medium-sized zones (40.84%), despite a high interest of investors in large zones. The reason behind this is that the large business zones have inadequate infrastructural equipment for the reception of foreign and domestic investments that have requirement for an area of land greater than 50 ha, which is difficult to be realized within the small and medium-sized zones. According to the conducted “Supply and Demand Analysis of Business Zones in Croatia” that included potential investors Letters of Intent, within the entrepreneurial zones there is a total supply shortfall of 823.25 hectares (see Annex II, table …). The greatest deficit is in the large zones, where there is a supply shortfall of 892 hectares. The situation in the middle zones is somewhat more balanced, with a supply excess of 2.31 hectares, while in the case of small zones supply exceeds demand by 66.4 hectares.
According to the economic criteria in Croatia Progress Report 2009 it was estimated that "economic growth in Croatia has identified a problem of a small number of "Greenfield" investments”. The development of large business zones would create a tool to attract
41 Project Capacity Building of Service Professionals and Business Support Institutions: Report on the Current capacity assessment of Croatian Business institutions, 2011 42 “Supply and Demand Analysis of Business Zones in Croatia”, Trade & Investment Promotion Agency, 2010
Page 29 / 135
“Greenfield” investments that would encourage the growth of competitiveness enabling Croatia to prepare for the EU single market. In conclusion, it can be said that despite the progress made over recent years, there are still a number of challenges in terms of SME performance that need to be overcome if Croatia is to reap the full benefits from, and respond effectively to, EU and global markets.
Key challenges
The SMEs in Croatia are confronted with many problems. More specifically:
The sector continues to suffer from the cumbersome regulatory framework and inefficiencies in public administration;
The analysis above shows that the economy lacks access to finance, despite the fact that Croatia has a relatively solvent and stable banking system, while access to longer-term financing remains difficult, particularly for newly established businesses;
Despite relatively good IT literacy per capita, use of online payment operations and the online goods and services trade is rather low;
Sectors with substantial sources for growth, including technological and academic entrepreneurship, are insufficiently involved in business activities;
There is a lack of connection between entrepreneurship and R&D, not only in the relations of business with science institutions, but also with companies dealing with new technologies, research and development;
Productivity in the SME sector is low. The technological content of products and components is limited and there is a lack of orientation toward exporting;
A large number of enterprises are located in big cities or their vicinity and this fact is detrimental to the attempt to balance entrepreneurship among the regions
More favourable conditions for investments need to be further enhanced, especially outside urbanised areas where BSIs need to be strengthened in this respect;
SMEs are either not used to outsourcing professional advisory services, or cannot afford to do so or do not see the benefit of such services in terms of improving their performance;
Private and thus also a more competitive business advisory market in Croatia still needs to develop more in order to be able to provide stronger and quality support to all business entities in the market.
1.1.3.2 Innovation, Research and Development
Technical and technological development is an important factor that impacts the economic
development of regions and their long term sustainability, notably under the conditions of
strengthening globalisation. Promotion of research and development together with
innovation policy is therefore one of the priority areas for Croatia. At present it is
important to profit on and further develop the existing scientific and technical potential
and notably to reach a high level of innovation capacity. In line with this, further
promotion and strengthening of basic research is also important since it presents
foundations for more applied forms of research and technology transfer leading to creating
commercial value to the discoveries that result from all forms of research.
Within the last decade, especially with regards to accession negotiations with the EU,
Croatia underwent significant changes at organisational, institutional, legal and
administrative level, thus creating a more favourable environment for the enhancement of
entrepreneurship and innovations.
Page 30 / 135
However, research, development and innovation sector in Croatia is somewhat lagging
behind European and international competitors and there is still space for improvement.
Pursuant to the Act on Scientific Activity and Higher Education43, scientific activity is
conducted at institutions such as: universities, public research institutes, research
institutes, Croatian Academy of Sciences and Arts and other legal persons duly registered
in the Register of Scientific Organisations.
The R&D and higher education sector consists of44:
- 25 public research institutes, 11 private institutes, 7 technology centres, 16 research
centres in industry, and one military research centre;
- 7 public universities, 13 public polytechnics, 3 public schools of professional higher
education, 3 private universities, 2 private polytechnics, and 28 private schools of
professional higher education;
- 5 technology transfer offices at universities (4) and research institutes (1)
Outdated infrastructure and equipment represents one of the obstacles for Croatian
public research organisations and higher education institutions to enhance the quality and
availability of their services/research and thus become well integrated in the European
Research Area (ERA) as research and educational centres. Supply of the equipment and
infrastructure for research and technology transfer is mostly funded by public resources for
science and research projects, technology projects, and development projects (Ministry of
Science, BICRO etc.). While public research and educational infrastructure is outdated, in
private sector R&D infrastructure is almost devastated due to the negative effects of
deindustrialization process. Furthermore, public research institutions do not have
sufficient resources for the implementation of filed based research and laboratory
analyses, necessary instruments and software, as well as for the training of employees, this
is evident from the fact that the decrease of gross domestic expenditure on R&D (GERD) as
% of GDP from 0,89 in 2008 to 0,73 in 201145. It was the lack of space and / or equipment
and outdated infrastructure recognized as one of the main obstacles for Croatian public
research organizations and higher education institutions in achieving higher quality and
availability of their research services and stronger integration into the European Research
Area (ERA). Funds granted from the state budget is insufficient, and the funds that these
institutions attract from the business sector are almost insignificant.
Reform46 of higher education system in Croatia is necessary in order to harmonize Croatian
higher education system with the European system. Based on relevant national and
European strategies on higher education, Croatian universities developed their own
strategies47 which clearly demonstrate common goals of developing these institutions into
recognized science and education centres, well-integrated in European network of higher
education institutions. However, unclear and unstable financial conditions, inadequate
financial resources from the state budget, lack of working space and/or equipment at
some faculties of the universities are recognized as both weaknesses and threats in the
attempt to achieve these goals. Research facilities, and facilities which can be used as a
research/business cooperation interfaces are currently severely underdeveloped in Croatia
and require to be improved. On the other hand, situation in the innovation sector shows
the share of innovative companies in Croatia being 44,2% of the total number of companies
- which is comparable to EU-27 average (51.6%)
43 OG 123/03, 198/03, 105/04, 174/04, 02/07, 46/07, 45/09, 63/11 44 Source: Ministry of Science, Education and Sports 45 EUROSTAT 46 Science and Technology Policy of the Republic of Croatia 47 University of Rijeka Strategy 2007-2013, University of Dubrovnik Research strategy 2009-2015, University of Zagreb Research Strategy 2008-2013.
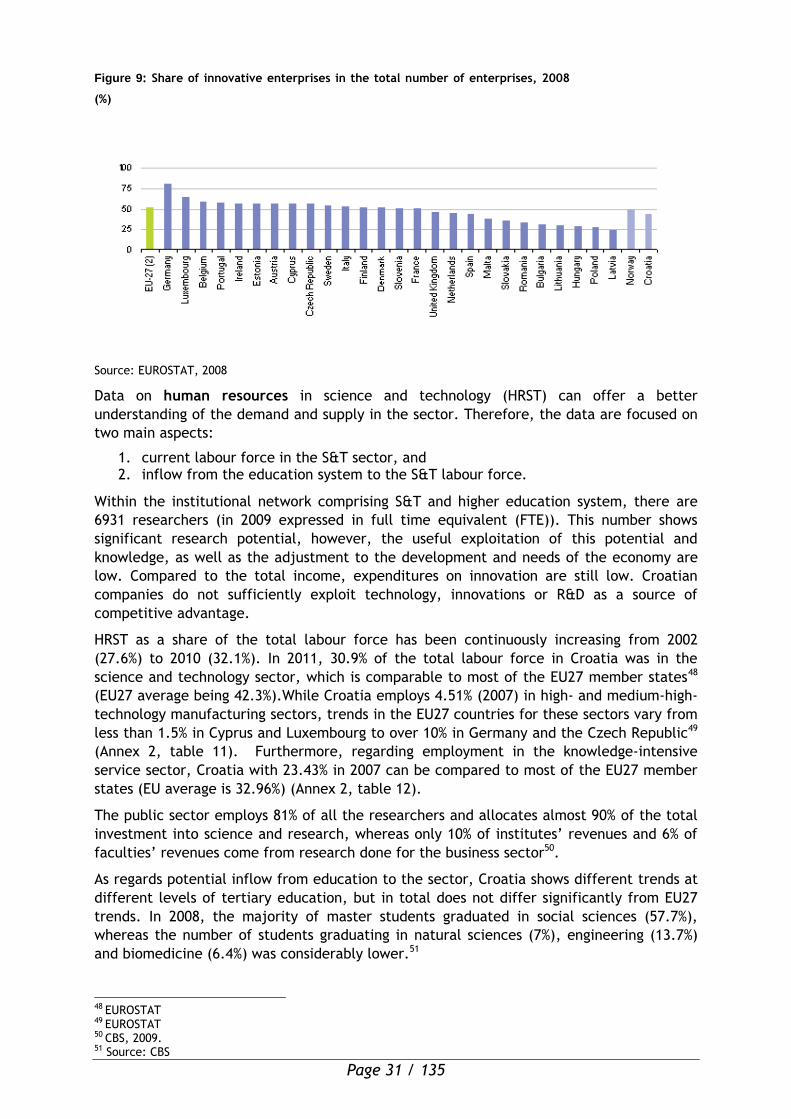
Page 31 / 135
Figure 9: Share of innovative enterprises in the total number of enterprises, 2008
(%)
Source: EUROSTAT, 2008
Data on human resources in science and technology (HRST) can offer a better
understanding of the demand and supply in the sector. Therefore, the data are focused on
two main aspects:
1. current labour force in the S&T sector, and 2. inflow from the education system to the S&T labour force.
Within the institutional network comprising S&T and higher education system, there are
6931 researchers (in 2009 expressed in full time equivalent (FTE)). This number shows
significant research potential, however, the useful exploitation of this potential and
knowledge, as well as the adjustment to the development and needs of the economy are
low. Compared to the total income, expenditures on innovation are still low. Croatian
companies do not sufficiently exploit technology, innovations or R&D as a source of
competitive advantage.
HRST as a share of the total labour force has been continuously increasing from 2002
(27.6%) to 2010 (32.1%). In 2011, 30.9% of the total labour force in Croatia was in the
science and technology sector, which is comparable to most of the EU27 member states48
(EU27 average being 42.3%).While Croatia employs 4.51% (2007) in high- and medium-high-
technology manufacturing sectors, trends in the EU27 countries for these sectors vary from
less than 1.5% in Cyprus and Luxembourg to over 10% in Germany and the Czech Republic49
(Annex 2, table 11). Furthermore, regarding employment in the knowledge-intensive
service sector, Croatia with 23.43% in 2007 can be compared to most of the EU27 member
states (EU average is 32.96%) (Annex 2, table 12).
The public sector employs 81% of all the researchers and allocates almost 90% of the total
investment into science and research, whereas only 10% of institutes’ revenues and 6% of
faculties’ revenues come from research done for the business sector50.
As regards potential inflow from education to the sector, Croatia shows different trends at
different levels of tertiary education, but in total does not differ significantly from EU27
trends. In 2008, the majority of master students graduated in social sciences (57.7%),
whereas the number of students graduating in natural sciences (7%), engineering (13.7%)
and biomedicine (6.4%) was considerably lower.51
48 EUROSTAT 49 EUROSTAT
50 CBS, 2009.
51 Source: CBS
Page 32 / 135
However, in terms of the number of students choosing natural and technical doctorate
studies, statistics for academic year 2007/08 show there are no larger discrepancies among
scientific fields.52 In 2008, 9.2% of all graduates (all levels of tertiary education) in Croatia
graduated in the field of Science, Mathematics and Computing (compared to 9.7% in EU27)
and 13.7% graduated in Engineering, Manufacturing and Construction (compared to 12.3%
in EU27).53
To conclude, Croatia generally follows European trends in terms of demand and supply of
personnel in S&T. However, brain drain has been the main bottleneck of the system for
almost four decades, which has also had a negative effect on the Croatian economy54.
Croatia is characterized by a strong emigration tradition which, of course, includes the
emigration of highly educated people and scientists. The volume of brain drain in Croatia is
large but undefined, due to the lack of official statistical data. Estimation was that 5,000
highly educated people left the country between 1991 and 2001.
This trend has been caused among other things by the fact that highly qualified work force
has a very limited job market on hand in Croatia and unattractive working conditions,
while options on offer abroad include a wider scope of both positions that are in line with
achieved qualifications, better possibilities of getting ahead and more attractive overall
remuneration as well as better LLL options. The share of research and development
personnel in the business sector (in 2010: 0.13% of the labour force in Croatia to 0.53% in
the EU-2755) is not sufficient for the accumulation of regional technological potential.
Total investments in R&D, as a percentage of the general national budget (government
budget appropriations for R&D, GBAORD), amounted to 0.68%56 GDP in 2011. The average
GERD for the period 2002-2011 is 0.8% of the country’s GDP. The most important source
of funding for the total domestic investments in R&D, in 2011 was the government sector
which provides 48.2% of Gross Domestic Expenditure on R&D (GERD), while the business
enterprise sector contributes with 38,2%. The majority of Business Enterprise Research and
Development (BERD) is financed by business companies themselves (68,7% in 2010) while
the foreign investors contribute to the business sector with 17,4%. Investments in R&D57 in
Croatia demonstrate a declining line since 2005.
In the period prior to 2005, the total investments in R&D (GERD), as share of GDP, were
constantly rising, from 0.77% in 1997 to 1.05% in 2004, which provided Croatia a status of
the regional leader in science and technology. After a sharp decline of GERD to 0.75% of
GDP in 2006, GERD slightly increased in 2007 and 2008 (0.8% and 0.89% of GDP,
respectively) but started decreasing again in 2009 (0.85 %) and especially in 2010 and 2011
(0,75%). Although investments by the business sector were increasing (from 0.36% to 0.40%
of GDP in the period 2005-2008), they have been decreasing in the last few years (0,34 in
2009 and 0,32 in 2011) so that the absolute value of these investments is still much behind
public investments (Annex 2, table 14).
The fact that the public sector is more active in R&D than the private is contradictory to
the EU trend, where private enterprises contribute more than a half of total expenditure
to R&D, and also reveals that the business sector in Croatia lags behind in R&D expenditure
compared to the EU average. The most active sectors are engineering and life sciences.
(Annex 2, table 15).
52 Number of doctorate candidates per field in 2007/08 is as follows: natural sciences – 14.05%, engineering – 26.3%, biomedicine – 15.5%, social sciences - 17.3%, humanities – 15.5%, other fields – less than 7%. Source: CBS 53 Source: Eurostat, Education statistics
54 Source: Unity through Knowledge Fund
55 EUROSTAT, 2011
56 EUROSTAT 2012 57 According to reviewed data by the Croatian Bureau of Statistics (a revision from 2009, for the period 1995-2008)
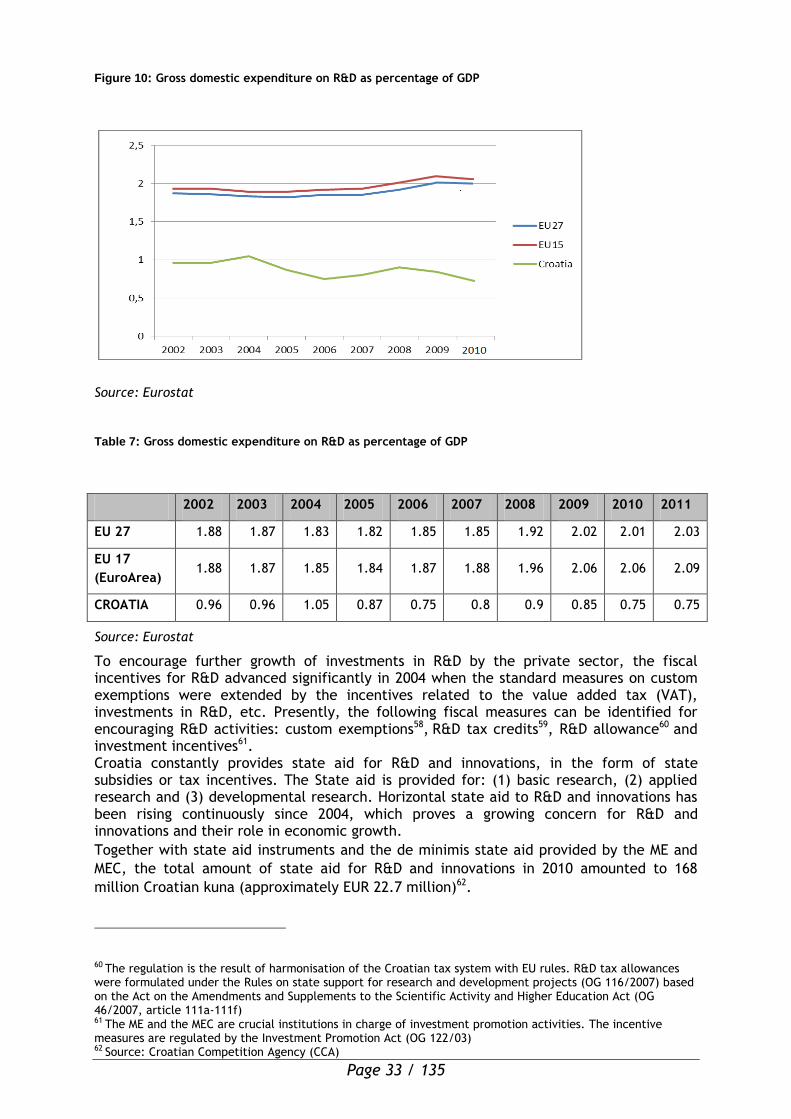
Page 33 / 135
Figure 10: Gross domestic expenditure on R&D as percentage of GDP
Source: Eurostat
Table 7: Gross domestic expenditure on R&D as percentage of GDP
2002 2003 2004 2005 2006 2007 2008 2009 2010 2011
EU 27 1.88 1.87 1.83 1.82 1.85 1.85 1.92 2.02 2.01 2.03
EU 17
(EuroArea) 1.88 1.87 1.85 1.84 1.87 1.88 1.96 2.06 2.06 2.09
CROATIA 0.96 0.96 1.05 0.87 0.75 0.8 0.9 0.85 0.75 0.75
Source: Eurostat
To encourage further growth of investments in R&D by the private sector, the fiscal incentives for R&D advanced significantly in 2004 when the standard measures on custom exemptions were extended by the incentives related to the value added tax (VAT), investments in R&D, etc. Presently, the following fiscal measures can be identified for encouraging R&D activities: custom exemptions58, R&D tax credits59, R&D allowance60 and investment incentives61. Croatia constantly provides state aid for R&D and innovations, in the form of state subsidies or tax incentives. The State aid is provided for: (1) basic research, (2) applied research and (3) developmental research. Horizontal state aid to R&D and innovations has been rising continuously since 2004, which proves a growing concern for R&D and innovations and their role in economic growth.
Together with state aid instruments and the de minimis state aid provided by the ME and
MEC, the total amount of state aid for R&D and innovations in 2010 amounted to 168
million Croatian kuna (approximately EUR 22.7 million)62.
60 The regulation is the result of harmonisation of the Croatian tax system with EU rules. R&D tax allowances were formulated under the Rules on state support for research and development projects (OG 116/2007) based on the Act on the Amendments and Supplements to the Scientific Activity and Higher Education Act (OG 46/2007, article 111a-111f) 61 The ME and the MEC are crucial institutions in charge of investment promotion activities. The incentive measures are regulated by the Investment Promotion Act (OG 122/03) 62 Source: Croatian Competition Agency (CCA)
Page 34 / 135
Moreover, the financing of science and technology projects in Croatia has been provided
from the national budget alone or as a co-financing component of the EU funding and the
World Bank funding. The national funding of individual scientific projects is provided
through the MSES and the National Foundation for Science, Higher Education and
Technological Development.
MSES provides research grants in 6 different scientific areas: (1) life sciences, (2) technical
sciences; (3) biomedicine and health; (4) biotechnical sciences; (5) social sciences and (6)
humanities; in line with the defined long-term and short-term strategic priorities through
the competition-based programme called “Research Projects”. In July 2007, the financing
of a total of 1,996 projects commenced, whereas in March 2008 additional 301 projects
were accepted for financing. Based on the Decision on financing research projects in year
2010, in July 2010, after the evaluation of project reports, a total of around 2,072 projects
remained in support. The same number of projects continues to be financed in 2011, in
total amount of around EUR 15,7 million.
For the projects funded by the national budget through NSF (since 2001) there are around
120 applications yearly, and approximately 50% of them have been accepted for funding.
So far, in the period 2005-2009, 188 scientific projects in the areas of natural sciences,
technical sciences, biomedicine and health and biotechnology have been funded through
NSF in total amount of about EUR 10 million. Projects in the area of natural sciences (54%)
and biomedicine (21%) have been financed with the largest share of financing.
In addition to the national funding of scientific projects described above, the formation of
the innovation system in Croatia took place in 2001 with the introduction of Croatian
programme for innovative technology development (HITRA), with two subcomponents of
the programme: TEST (Research and Technological Development projects, implemented by
Croatian Institute for Technology - HIT) and RAZUM (development of knowledge-based
companies, implemented by Croatian Business Innovation Agency -BICRO). The main goal of
the programme was to give support to R&D activities in development of new products for
the Croatian economy. EU funding of R&D&I projects is provided through the EU
programmes FP763, COST and EUREKA. In 2005 the HITRA project was extended to become
Science and Technology Project (S&T Project), in the next phase, the Second S&T Project
will focus on supporting Croatia to absorb EU Funds in the research and innovation sector
by capacitating selected public sector organizations and stirring the demand for those
funds from the business and scientific communities.
Technology transfer services in Croatia are mostly provided by Technology Transfer
Offices (TTOs) at universities and research organisations. They should help researchers
in all innovation commercialisation phases, particularly:
identification of potentially marketable ideas
proof of concept/prototype development
IPR protection and
start-ups / licensing.
Their task is also to support permanent communication and cooperation between industry
and research groups, identifying expertise and competences of the science groups and
needs of companies in order to match them. However, TT offices are a part of a
underdeveloped or partially developed professional service system which supports
technology and knowledge transfer, which could be improved by investing in development
of professionally facilitated services within HEI and PROs in order to help researchers
shorten the way from potentially marketable idea to the market and the industry sector to
better cooperate with research groups.

Page 35 / 135
Only structured and well organised TTOs at Croatian HEIs and PROs, with fully developed
professional technology and knowledge transfer services could make a significant impact
on availability of research results of public funded institutions (which have mayor research
potential) to industrial exploitation.
Another factor that exposes the insufficiency of innovation in Croatia is that patent
applications submitted to the European Patent Office (EPO) are noticeably lower than the
EU-27 average (see Annex 2, table 16). In 2010, Croatia submitted only 5.65 patent
applications per million inhabitants64, while the average for the EU-27 was 108.59. One of
the reasons is that Croatia is inefficient in transforming investments in R&D into results
that could be patented, which suggests that the NIS is inefficient in the commercialization
of R&D activities, and the public’s insufficient awareness of intellectual property rights
(IPR). Although the IPR system is well developed compared to other South-European
countries, Croatia’s overall global ranking for IPR protection (69th out of 142 countries) is
considered relatively weak 65 . In addition, Croatia’s export of high-tech products is
decreasing and amounted to 6.61% of total exports in 2007, a great deficit in comparison
to the 15.96% average of the member states (Annex 2, table 17).
However, measured by the Innovation Union Scoreboard (IUS66) in 2011, Croatia belongs to
moderate innovators which is a step forward compared to former European Innovation
Scoreboard (EIS, 2009) where Croatia was categorised as catching-up country with
innovation performance far below the EU-27 average. Relative strengths are in Human
resources, Innovators and Outputs. Relative weaknesses are in open, excellent and
attractive research systems and intellectual assets. High growth is observed for Non-R&D
innovation expenditure, Public-private publications and Community designs. A strong
decline is observed for PCT patent applications and License and patent revenues from
abroad. Growth performance in Firm investments, Linkages & Entrepreneurship and
Intellectual assets is above average.
Considerable effort has been put into developing a national innovation system (NIS) in
Croatia, especially by institutions such as MSES and ME, which were aided in this process by
the BICRO and HIT as specialized state agencies responsible for the implementation of NIS.
The greatest weakness seems to be technological exploitation of knowledge (i.e.
technology transfer) with a still underdeveloped professional system / innovation
infrastructure which supports technology and knowledge transfer from HEIs and PROs
towards industry and encourages their cooperation (technology transfer offices). The other
is out-dated infrastructure and equipment which represents one of the obstacles for public
research organisations and higher education institutions to enhance the quality and
availability of their services/research, caused by inadequate financial means that would
propel Croatia’s transition towards a knowledge-based economy to which it strives.
The cooperation of the business sector with research organizations and higher education
institutions is unsatisfactory, and as a result, technological capabilities of the industry,
particularly smaller companies and SMEs, are inadequate. Even though significant effort
has been undertaken in development of NIS there is still a lot do in order to improve
different segments of the system.
A key point that still has to be developed is to enhance organizational and physical
innovation infrastructure whose purpose is the connection of science and business sectors
(Technology parks, Innovation-parks, completion centres, technology platforms). There are
several reasons why these have not been developed yet, but the main one is related to the
64 EUROSTAT, 2007 65 World Economic Forum: “Global Competitiveness Report”, 2011-12 66 EUROSTAT, 2010

Page 36 / 135
lack of resources and post-transitional issues that negatively affect the private and public
R&D sector and hinder the development of tech oriented firms (SMEs).
Further national policy objectives in R&D sector will be directed towards the continuation
of major objectives of the S&T policy 2006-2010, in accordance with the achievements so
far and necessary further improvements, and in line with Europe 2020 strategy where
knowledge and innovation represent one of the three major areas for interventions, along
with a more sustainable economy and high employment and social inclusion. Therefore,
the process of knowledge transfer from the public to the business sector and the wider
community, for the benefit of economy and ultimately for the benefits to the society
remains in the focus of the national policy agenda for strategic development.
Key challenges
In the field of Innovation, Research and Development we can find several major issues such as:
Insufficient demand for innovation in the business sector;
Low GDP share spent on R&D;
Insufficient research infrastructure to enable innovation and technology transfer to
the SME sector;
Weak connection between entrepreneurship and R&D;
Drain of highly qualified research workers to foreign countries – brain drain
(particularly young researchers);
Inadequate (i.e. out-dated, lacking, low quality) R&D infrastructure.
1.1.3.3 Tourism
The Croatian economy is geared towards tourism which is of vital importance for the
livelihood of many areas, particularly those situated on the Adriatic coast. With its unique
natural wealth and cultural-historical heritage and attractive geographical position Croatia
is exceptionally attractive for tourism. Tourism sector in Croatia in 2011 contributed with
8.3 % to the national GDP67 and had 14.4%68 share of international receipts to the GDP and
the income of inbound tourism amounted to 6.6 billion EUR69.
The main driving force in the tourism industry of Croatia is by far seaside tourism closely
linked to the Adriatic Sea and geographical advantages of Croatia as a car-destination
country. The unique seawater and coastline (around 1800 km long), relatively sparsely
inhabited, with over 1,000 islands (only 66 are inhabited) together with a mild climate
have long been recognized and utilized as the main comparative advantages of Croatian
tourism. In a recent market analysis of demand preferences, other types of tourism were
established to be present on the market (described further in text below). Taking into
account the potential for the development of these types of tourism and special interest
tourism segments, Croatia has much unused potential.
Nonetheless, Croatia is a typical example of the “mature tourism destination” with a
predominant “sun and sea” product which results in high seasonality as evident in Figure
18 below (Tourist traffic – per months 2011). The vast majority of the tourists’ arrivals and
overnights take place during the summer season, from June to September.
67 Croatian National Bank, 2011 68 Croatian National Bank, 2011 69 Croatian National Bank, 2011
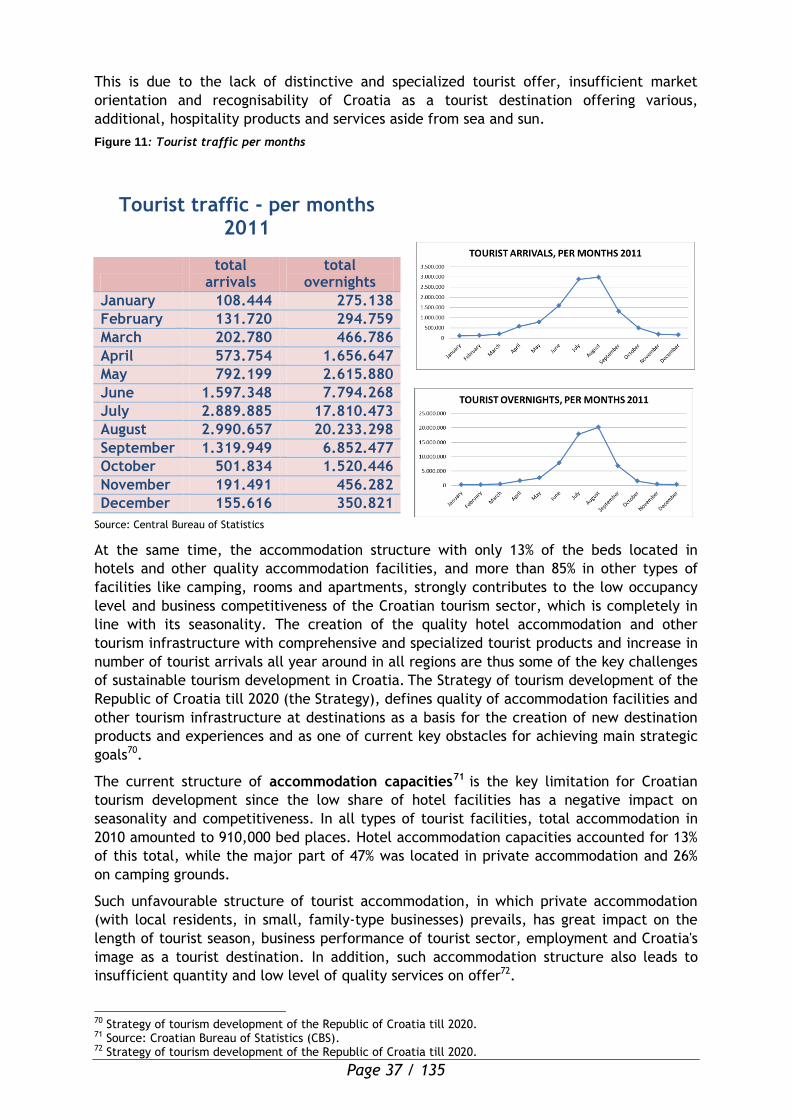
Page 37 / 135
This is due to the lack of distinctive and specialized tourist offer, insufficient market
orientation and recognisability of Croatia as a tourist destination offering various,
additional, hospitality products and services aside from sea and sun.
Figure 11: Tourist traffic per months
Tourist traffic - per months 2011
total
arrivals total
overnights
January 108.444 275.138
February 131.720 294.759
March 202.780 466.786
April 573.754 1.656.647
May 792.199 2.615.880
June 1.597.348 7.794.268
July 2.889.885 17.810.473
August 2.990.657 20.233.298
September 1.319.949 6.852.477
October 501.834 1.520.446
November 191.491 456.282
December 155.616 350.821
Source: Central Bureau of Statistics
At the same time, the accommodation structure with only 13% of the beds located in
hotels and other quality accommodation facilities, and more than 85% in other types of
facilities like camping, rooms and apartments, strongly contributes to the low occupancy
level and business competitiveness of the Croatian tourism sector, which is completely in
line with its seasonality. The creation of the quality hotel accommodation and other
tourism infrastructure with comprehensive and specialized tourist products and increase in
number of tourist arrivals all year around in all regions are thus some of the key challenges
of sustainable tourism development in Croatia. The Strategy of tourism development of the
Republic of Croatia till 2020 (the Strategy), defines quality of accommodation facilities and
other tourism infrastructure at destinations as a basis for the creation of new destination
products and experiences and as one of current key obstacles for achieving main strategic
goals70.
The current structure of accommodation capacities71 is the key limitation for Croatian
tourism development since the low share of hotel facilities has a negative impact on
seasonality and competitiveness. In all types of tourist facilities, total accommodation in
2010 amounted to 910,000 bed places. Hotel accommodation capacities accounted for 13%
of this total, while the major part of 47% was located in private accommodation and 26%
on camping grounds.
Such unfavourable structure of tourist accommodation, in which private accommodation
(with local residents, in small, family-type businesses) prevails, has great impact on the
length of tourist season, business performance of tourist sector, employment and Croatia's
image as a tourist destination. In addition, such accommodation structure also leads to
insufficient quantity and low level of quality services on offer72.
70 Strategy of tourism development of the Republic of Croatia till 2020. 71 Source: Croatian Bureau of Statistics (CBS). 72 Strategy of tourism development of the Republic of Croatia till 2020.
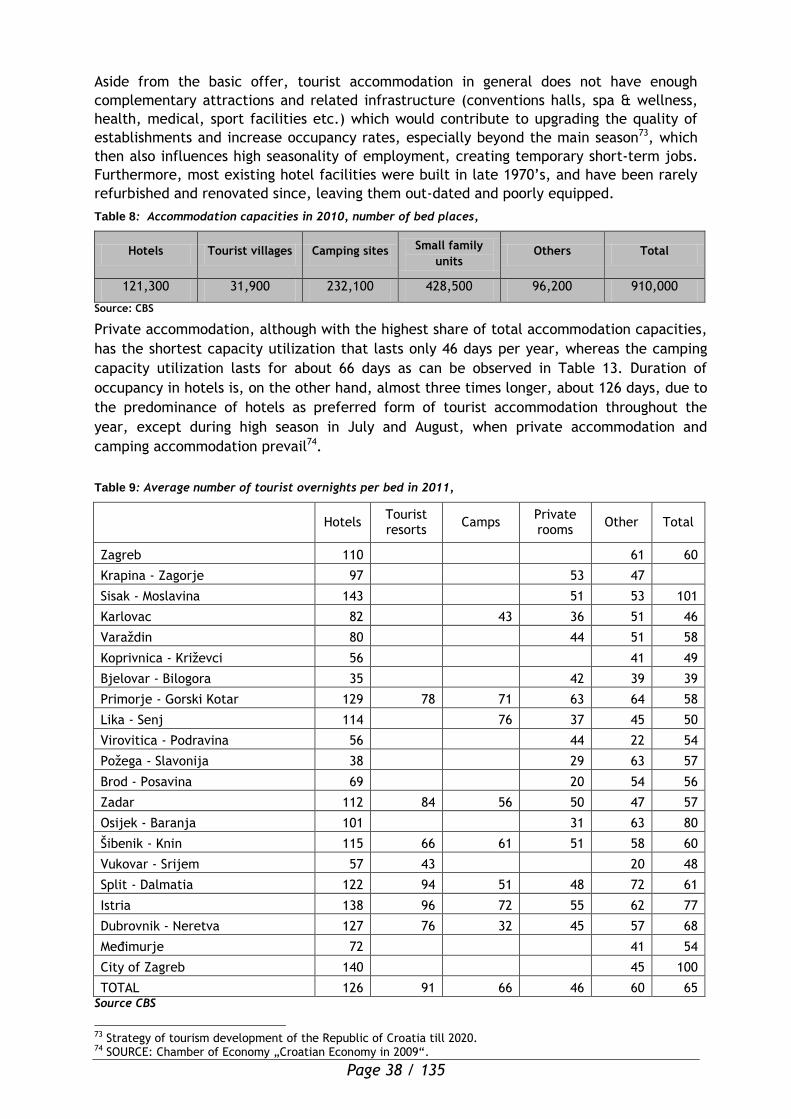
Page 38 / 135
Aside from the basic offer, tourist accommodation in general does not have enough
complementary attractions and related infrastructure (conventions halls, spa & wellness,
health, medical, sport facilities etc.) which would contribute to upgrading the quality of
establishments and increase occupancy rates, especially beyond the main season73, which
then also influences high seasonality of employment, creating temporary short-term jobs.
Furthermore, most existing hotel facilities were built in late 1970’s, and have been rarely
refurbished and renovated since, leaving them out-dated and poorly equipped.
Table 8: Accommodation capacities in 2010, number of bed places,
Hotels Tourist villages Camping sites Small family
units Others Total
121,300 31,900 232,100 428,500 96,200 910,000
Source: CBS
Private accommodation, although with the highest share of total accommodation capacities,
has the shortest capacity utilization that lasts only 46 days per year, whereas the camping
capacity utilization lasts for about 66 days as can be observed in Table 13. Duration of
occupancy in hotels is, on the other hand, almost three times longer, about 126 days, due to
the predominance of hotels as preferred form of tourist accommodation throughout the
year, except during high season in July and August, when private accommodation and
camping accommodation prevail74.
Table 9: Average number of tourist overnights per bed in 2011,
Hotels
Tourist resorts
Camps Private rooms
Other Total
Zagreb 110 61 60
Krapina - Zagorje 97 53 47
Sisak - Moslavina 143 51 53 101
Karlovac 82 43 36 51 46
Varaždin 80 44 51 58
Koprivnica - Križevci 56 41 49
Bjelovar - Bilogora 35 42 39 39
Primorje - Gorski Kotar 129 78 71 63 64 58
Lika - Senj 114 76 37 45 50
Virovitica - Podravina 56 44 22 54
Požega - Slavonija 38 29 63 57
Brod - Posavina 69 20 54 56
Zadar 112 84 56 50 47 57
Osijek - Baranja 101 31 63 80
Šibenik - Knin 115 66 61 51 58 60
Vukovar - Srijem 57 43 20 48
Split - Dalmatia 122 94 51 48 72 61
Istria 138 96 72 55 62 77
Dubrovnik - Neretva 127 76 32 45 57 68
Međimurje 72 41 54
City of Zagreb 140 45 100
TOTAL 126 91 66 46 60 65 Source CBS
73 Strategy of tourism development of the Republic of Croatia till 2020. 74 SOURCE: Chamber of Economy „Croatian Economy in 2009“.
Page 39 / 135
Thus, the Strategy defines that the way to improve quality and competitiveness of
accommodation and the overall product at the destinations, is to build new and modernize
existing hotels and similar accommodation capacities, so they could operate all year
around on the Adriatic coast as well as in other regions.
This requires development of quality hotels and similar accommodation with mentioned
complementary infrastructure which would contribute to higher occupancy rates and
business competitiveness, especially in the SME segment. This will extend the season in the
coastal area beyond traditional summer months and at the same time allow other regions
to create basic accommodation structure for development of their tourism potential as a
tool for overall economic development.
The basic goal of upgrading the accommodation structure has been already targeted in the
period 2002–2009 through the Governmental soft loan programme under the working title
Incentive for Success. The programme aimed at supporting SME development in tourism,
through special credit lines for SMEs. It was based on commercial banks’ credit assets and
the Ministry of Tourism assets, aimed at extending subsidies for interest rates on credits
granted. The eligible activities covered investments in the purchase or construction and
refurbishment of small accommodation facilities that fall into the category of hotels,
apart-hotels and camping grounds. Due to the limited budget, the number of
accommodation units in the facility eligible for this credit was limited to 40 rooms in
hotels, 20 apartments in apart-hotels and 100 camp units for the camping grounds. A
section of the Program, named Under the Centennial Roofs also covered traditional
houses’ renovation that had to be in compliance with genuine local architecture.
Refurbishment of these facilities was implemented in cooperation with curators and the
Ministry of Culture.
Due to the extended credit repayment period (up to 20 years), the grace period of up to
two years and a reduced interest rate, these credits were highly advantageous to the
beneficiaries. The interest rate level i.e. the subsidy level depended on the investment
scope, thus not being the same for each credit. Also, a lower interest rate was applicable
when the facility being invested in has been located in the under-developed inland area or
on a hardly accessible island. The subsidy was more substantial for investments in old and
protected structures, as well as in complementary facilities that diversify the offer of the
credit beneficiary. As a result, the season extended beyond summertime, while the quality
of beneficiary products, occupancy rates and business competitiveness increased.
In the six year period of the Incentive for Success Programme implementation, 476 credits,
worth 268 million EUR were granted in cooperation with 24 commercial banks. Investments
were made in 357 hotel accommodation facilities; 107 old houses/objects of cultural
heritage have been renovated; 30% of all credits were invested in inland areas and 15,000
new bed places were generated. These credits have diversified the tourist offer of the
small family run hotels and have made grounds for 3,700 new job openings. The
programme was eventually suspended, due to budgetary restrictions.
In addition to the Incentive for Success Programme, the Ministry of Tourism has, under a
range of other grant programmes, provided a further 7.9 MEUR of funds to SMEs, Agencies
and NGOs active in the field of tourism. These grant schemes generated over 5,000
applications and disbursed grants to nearly 1,400 organisations over the period 2008-09.
These funds were used to support the enhancement of the existing tourism portfolio in
Croatia as well as supporting its diversification. The strategic goal of these programmes is
to create new tourism infrastructure and products in destinations that will allow them to
be more competitive on the global level trough creation of new tourism experiences. This
would give relevant destinations an opportunity to be competitive beyond the main
Page 40 / 135
summer season and their sun and sea product, and at the same time provides a tool for
overall economic and social development of the underdeveloped tourism regions.
Some of these specific programmes were the following:
Programme for Subsidising Thematic Tourist Routes Development;
Programme for Encouragement, Protection, Reconstruction and Inclusion of Cultural
and Natural Heritage in Tourism;
Special Tourism Types in Continental Area Encouragement Programme;
Special Tourism Types in Coastal Area Encouragement Programme;
Programme for Subsidising Genuine Croatian Souvenirs.
Although efforts has been made in the past, tourist destinations are still deficient in attractions such as conventions and meeting halls, wellness and spa facilities, swimming pools, aqua parks, amusement parks, golf courses, tennis courts, equestrian facilities, funiculars to panoramic lookouts, ski facilities, etc. 75. As indicated by the TOMAS Summer 2010 market survey, conducted by the Institute for Tourism, only 30-50 % of tourists in Croatia are engaged in cultural or sports activities during their stay which are also the reasons of their lower satisfaction rate76. According to the same 201077 survey, the average tourist consumption in Croatia amounted to EUR 58 per tourist/per day. Out of that, EUR 29 were spent on accommodation, EUR 5.3 on food on the premises, EUR 6.4 on food off -premises, EUR 2.7 on beverages, EUR 8 on shopping and EUR 6.6 on sports and leisure - culture, entertainment, excursions etc.
The reason for this is the dispersed and unrelated tourism offer and lack of comprehensive tourist products and packages which would motivate tourists to spend more on different activities.
The Strategy defines that beside sun and sea tourism product which will, due to key
natural attractions related to Adriatic sea, remain most important, other strategic tourism
products will be developed; nautical tourism, health tourism, cultural tourism, MICE
(meeting, incentives, conventions and events) tourism, golf tourism, bike tourism, gourmet
and wine tourism, rural and mountain tourism, adventure and sports tourism, eco-tourism,
youth tourism and social tourism. In terms of these tourism products development,
Croatian cultural and natural heritage plays a very important role since their inclusion in
the tourist offer would provide competitive advantage to Croatia as a tourist destination in
relation to other global destinations.
Cultural tourism has a great potential to become a very significant part of the Croatian
tourism offer. Croatian cultural heritage comprises of many cultural goods, movable,
immovable and intangible and is defined in the Law on the Protection and Preservation of
Cultural Goods. 78 Overall, there are 4,058 protected cultural goods, of which 3,032
immovable, 173 historic complexes, 788 movable goods (collections and individual objects)
and 85 intangible cultural goods. The greater part of the cultural heritage (over 40%) is
located in the Adriatic coastal part of Croatia, which is generally the most significant and
most developed tourist region in the country.
Currently, due to the relatively low level of integration of natural potentials and cultural
heritage into the tourism offer, the share of culture in tourism is very modest.
75 Strategy of tourism development of the Republic of Croatia till 2020. 76 SOURCE: TOMAS 2010, Institute for Tourism 77 SOURCE: TOMAS 2010, Institute for Tourism 78 According to the Law on the Protection and Preservation of Cultural Goods (Official Gazette, nos. 151/03,157/03 corrigendum) cultural goods are defined as; moveable and immovable items of artistic, historical, paleontological, archaeological, anthropological and scientific importance; archaeological finds and archaeological zones, landscape and its components that bear witness to human presence in that area, and have an artistic, historical and anthropological value; intangible forms and phenomena of human spiritual creativity in the past, as well as documentation and bibliographic heritage, and buildings and other facilities that permanently preserve or display cultural goods and documentation concerning them
Page 41 / 135
According to the researches (TOMAS SUMMER 2010 Survey) around 7% of tourists come to
Croatia motivated by culture, while 54% of tourists who come are not motivated by culture
but still visit cultural sites. Events attract the largest share of the culture of motivated
visitors (46%), followed by cultural sites (34%) and museums/galleries (30%). Also, cultural
attractions and events in the continental regions attract significantly higher proportion of
the culture of motivated visitors (49%) compared to those in coastal regions (27%)79.
This rich and diverse cultural heritage offers a great potential for the creation of broader
and more diverse tourist offer throughout Croatia, but significant investments in the
infrastructure is still needed for the sustainable use of cultural heritage. Investments in
the development of selective type of tourism, i.e. cultural tourism80 as special interest
based tourism, would promote increased tourist participation in cultural experiences and
would enable Croatia to widely market its rich and diverse cultural heritage.
Regrettably, investments in culture entrepreneurship, particularly investments in
immovable cultural heritage, its preservation, protection, revaluation and economic use
have been very limited. There is an evident lack of all those activities and means with
which cultural heritage can be used for increasing the competitiveness of Croatian tourist
offer, for opening new market segments, increasing local and regional consumption,
prolonging the tourist season and increasing the effectiveness of business operations and
thus in the final instance enable additional income for better protection and preservation
of cultural heritage.
Natural heritage, together with nature protected areas and their tourism valorisation is
another aspect where interventions are necessary in order to integrate them into the
tourist offer. According to the State Institute for Nature Protection, in Croatia there are
433 areas of protected nature in several categories. These protected areas of nature are
divided as strict reserves (2), national parks (8), special reserves (80), nature parks (11),
regional parks (2), nature monument (85), significant landscape (84), park-forest (33) and
monuments of park architecture (127). These areas account for 8.48% of the total area of
the Republic of Croatia, or 12.07% of terrestrial territory and 1.94% of the territorial sea81.
From the aspect of biodiversity, the Republic of Croatia is considered as one of the
Europe’s richest countries due to its geographical position on the crossroads of several bio
geographical regions and with characteristic ecological, climate and geomorphological
conditions. Great diversity of coastal, maritime and underground habitats resulted in rich
flora and fauna which counts over 38,000 known species, while the approximation of total
number to be around 50,000 to 100,000 species82. The integration of the listed protected
areas into the tourism offer as well as the upgrading of infrastructure within, especially in
national parks, with emphasis on sustainable development, is one of the key challenges for
future tourism development.
79 TOMAS Cultural tourism in 2008, Institute for Tourism 2009 80 According to the Strategy, cultural tourism is defined as a visit of persons to places outside their permanent residence motivated completely or in part by their interest in history, art, heritage or local, regional, groups or institutional life style. 81 the State Institute for Nature Protection, 2012 82 Ministry of Culture, 2010
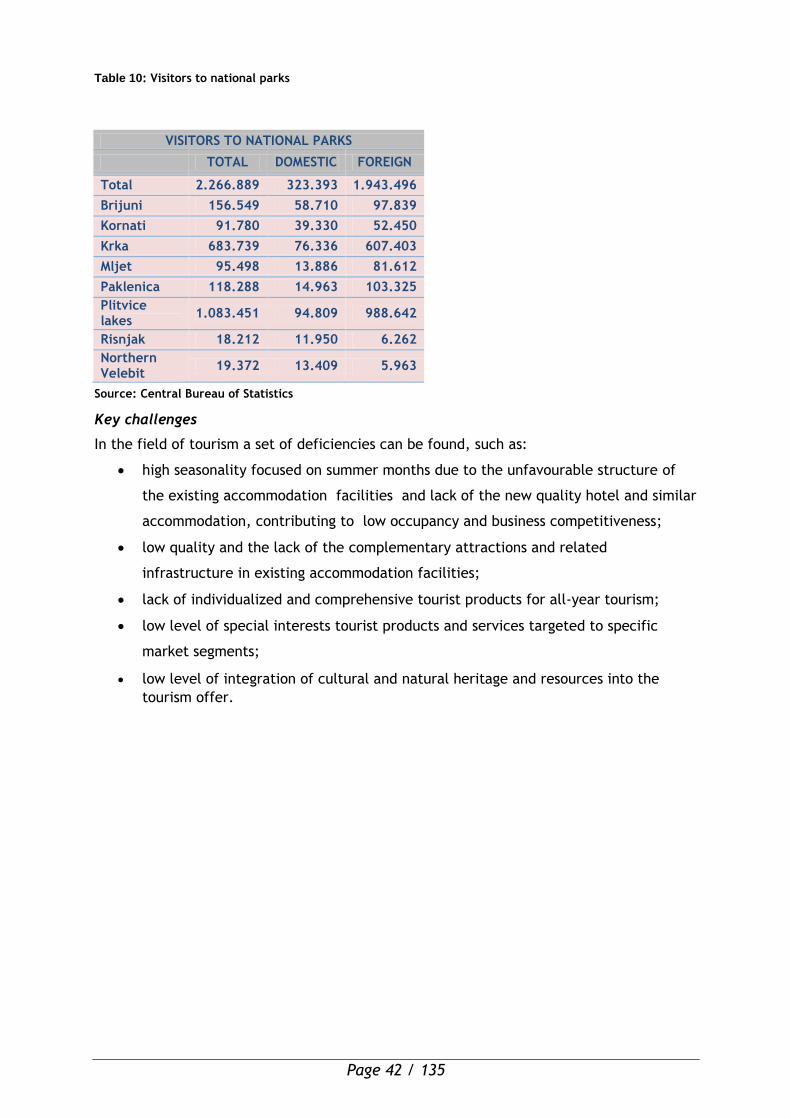
Page 42 / 135
Table 10: Visitors to national parks
VISITORS TO NATIONAL PARKS
TOTAL DOMESTIC FOREIGN
Total 2.266.889 323.393 1.943.496
Brijuni 156.549 58.710 97.839
Kornati 91.780 39.330 52.450
Krka 683.739 76.336 607.403
Mljet 95.498 13.886 81.612
Paklenica 118.288 14.963 103.325
Plitvice lakes
1.083.451 94.809 988.642
Risnjak 18.212 11.950 6.262
Northern Velebit
19.372 13.409 5.963
Source: Central Bureau of Statistics
Key challenges
In the field of tourism a set of deficiencies can be found, such as:
high seasonality focused on summer months due to the unfavourable structure of
the existing accommodation facilities and lack of the new quality hotel and similar
accommodation, contributing to low occupancy and business competitiveness;
low quality and the lack of the complementary attractions and related
infrastructure in existing accommodation facilities;
lack of individualized and comprehensive tourist products for all-year tourism;
low level of special interests tourist products and services targeted to specific
market segments;
low level of integration of cultural and natural heritage and resources into the
tourism offer.
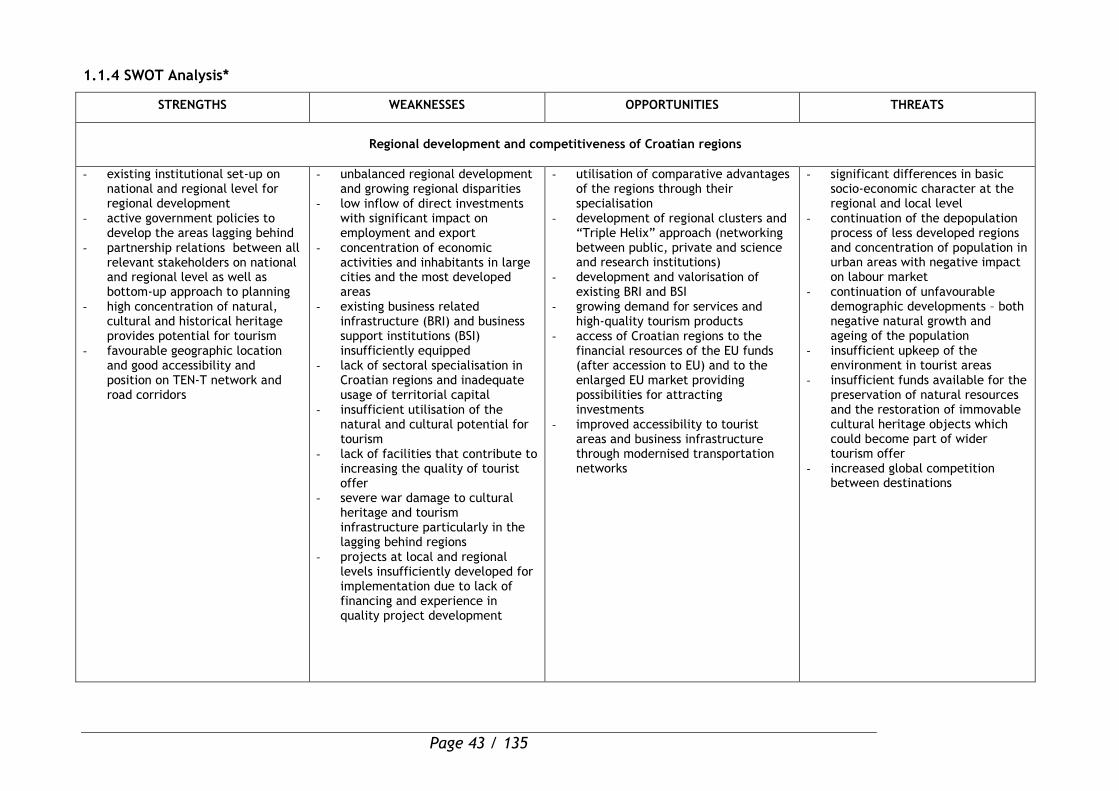
Page 43 / 135
1.1.4 SWOT Analysis*
STRENGTHS WEAKNESSES OPPORTUNITIES THREATS
Regional development and competitiveness of Croatian regions
- existing institutional set-up on national and regional level for regional development
- active government policies to develop the areas lagging behind
- partnership relations between all relevant stakeholders on national and regional level as well as bottom-up approach to planning
- high concentration of natural, cultural and historical heritage provides potential for tourism
- favourable geographic location and good accessibility and position on TEN-T network and road corridors
- unbalanced regional development and growing regional disparities
- low inflow of direct investments with significant impact on employment and export
- concentration of economic activities and inhabitants in large cities and the most developed areas
- existing business related infrastructure (BRI) and business support institutions (BSI) insufficiently equipped
- lack of sectoral specialisation in Croatian regions and inadequate usage of territorial capital
- insufficient utilisation of the natural and cultural potential for tourism
- lack of facilities that contribute to increasing the quality of tourist offer
- severe war damage to cultural heritage and tourism infrastructure particularly in the lagging behind regions
- projects at local and regional levels insufficiently developed for implementation due to lack of financing and experience in quality project development
- utilisation of comparative advantages of the regions through their specialisation
- development of regional clusters and “Triple Helix” approach (networking between public, private and science and research institutions)
- development and valorisation of existing BRI and BSI
- growing demand for services and high-quality tourism products
- access of Croatian regions to the financial resources of the EU funds (after accession to EU) and to the enlarged EU market providing possibilities for attracting investments
- improved accessibility to tourist areas and business infrastructure through modernised transportation networks
- significant differences in basic socio-economic character at the regional and local level
- continuation of the depopulation process of less developed regions and concentration of population in urban areas with negative impact on labour market
- continuation of unfavourable demographic developments – both negative natural growth and ageing of the population
- insufficient upkeep of the environment in tourist areas
- insufficient funds available for the preservation of natural resources and the restoration of immovable cultural heritage objects which could become part of wider tourism offer
- increased global competition between destinations

Page 44 / 135
STRENGTHS WEAKNESSES OPPORTUNITIES THREATS
SMEs and business climate
- systematic alignment of national SME policy with European good practice
- active government policy on promoting business climate
- favourable geographic location and good transport accessibility
- economically and politically stable and safe state
- increase of the share of small businesses in GDP
- established system of initiatives and incentives for development of entrepreneurship at the national and regional level
- standardised system for FDI attraction and pro-active approach to FDI in regions
- established system of providing counselling and support in BSI
- long tradition as tourist destination
- extraordinary biodiversity and landscape diversity
- high concentration of natural, cultural and historical heritage
- population highly interested in tourism development
- small number and slow growth of high-tech companies
- low SME investment into technology and R&D and consequently low work productivity
- SMEs are not sufficiently prepared for internationalisation of their activities and appearance on the Single Market
- existing BSIs and business related infrastructure insufficiently equipped
- Insufficient intensity and quality of public services to businesses and in particular for start-up entrepreneurs
- low level of networking in domestic economy
- short tourist season with a focus on seaside tourism
- unfavourable structure of tourist accommodation with a low share of hotel accommodation facilities, contributing to high seasonality
- insufficient quality of services - lack of complementary
infrastructure to accommodation facilities that contribute to the quality of services and increase occupancy rates, especially beyond the main season
- further SME development in sectors with higher value added through foreign assistance and application of relevant successful business models and methods through lessons learned in EU member states and globally
- EU and global trends and innovations in increased effectiveness and coordinated functioning of entrepreneurial support environment
- FDI targeted at increased use of industrial areas and revitalisation of so-called brown parks to facilitate the entry of further new investors in existing production facilities
- exploitation of foreign market opportunities (creation and focus on relevant market niches) and related technological and regional specialization
- growing demand for diversified services and high-quality tourism products as a result of globalisation
- global trends in tourism influencing development of modern tourist centres
- global financial crisis and instability on the largest export markets due to the crisis
- strong foreign competitive pressure on businesses (especially SMEs)
- negative impact of the global recession on the SME sector
- brain drain due to better economic situation and work conditions abroad
- export stagnation due to external obstacles like strong competition
- continuation of lack of FDI due to stronger attractiveness of foreign markets
- increased global competition between tourist destinations
- unfavourable global environmental changes influencing tourist resorts especially
- development of mass tourism through FDI
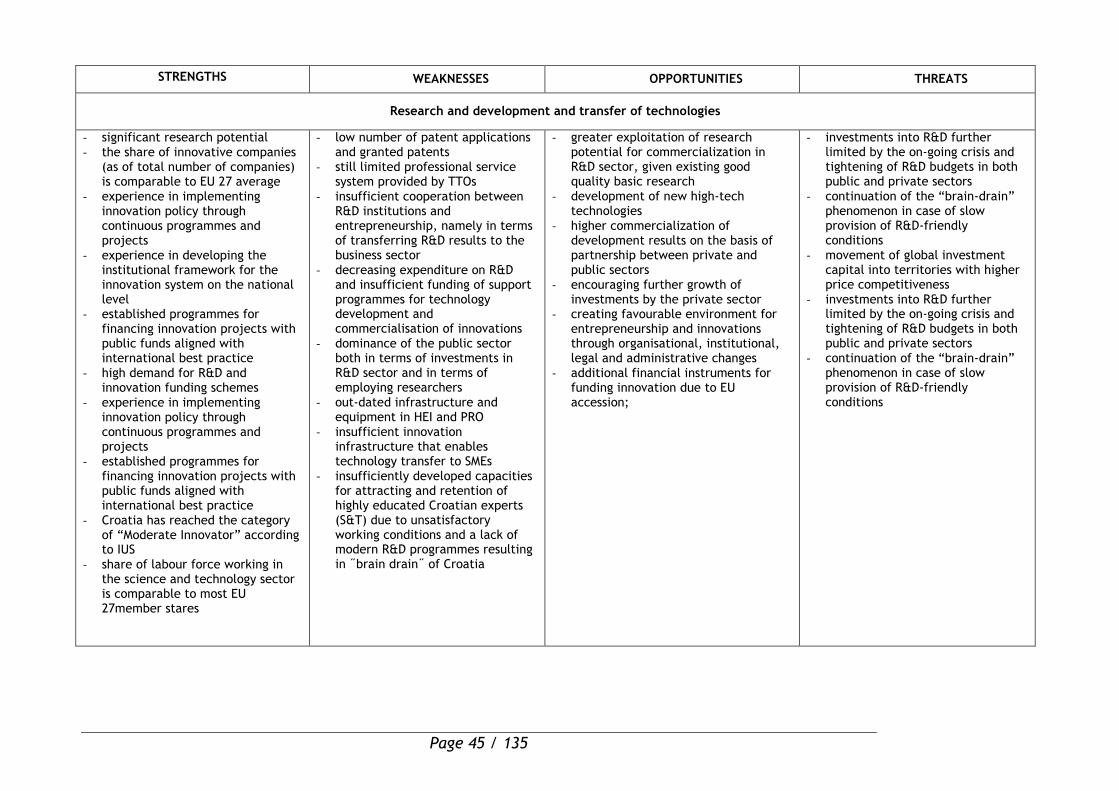
Page 45 / 135
STRENGTHS WEAKNESSES OPPORTUNITIES THREATS
Research and development and transfer of technologies
- significant research potential - the share of innovative companies
(as of total number of companies) is comparable to EU 27 average
- experience in implementing innovation policy through continuous programmes and projects
- experience in developing the institutional framework for the innovation system on the national level
- established programmes for financing innovation projects with public funds aligned with international best practice
- high demand for R&D and innovation funding schemes
- experience in implementing innovation policy through continuous programmes and projects
- established programmes for financing innovation projects with public funds aligned with international best practice
- Croatia has reached the category of “Moderate Innovator” according to IUS
- share of labour force working in the science and technology sector is comparable to most EU 27member stares
- low number of patent applications and granted patents
- still limited professional service system provided by TTOs
- insufficient cooperation between R&D institutions and entrepreneurship, namely in terms of transferring R&D results to the business sector
- decreasing expenditure on R&D and insufficient funding of support programmes for technology development and commercialisation of innovations
- dominance of the public sector both in terms of investments in R&D sector and in terms of employing researchers
- out-dated infrastructure and equipment in HEI and PRO
- insufficient innovation infrastructure that enables technology transfer to SMEs
- insufficiently developed capacities for attracting and retention of highly educated Croatian experts (S&T) due to unsatisfactory working conditions and a lack of modern R&D programmes resulting in ˝brain drain˝ of Croatia
- greater exploitation of research potential for commercialization in R&D sector, given existing good quality basic research
- development of new high-tech technologies
- higher commercialization of development results on the basis of partnership between private and public sectors
- encouraging further growth of investments by the private sector
- creating favourable environment for entrepreneurship and innovations through organisational, institutional, legal and administrative changes
- additional financial instruments for funding innovation due to EU accession;
- investments into R&D further limited by the on-going crisis and tightening of R&D budgets in both public and private sectors
- continuation of the “brain-drain” phenomenon in case of slow provision of R&D-friendly conditions
- movement of global investment capital into territories with higher price competitiveness
- investments into R&D further limited by the on-going crisis and tightening of R&D budgets in both public and private sectors
- continuation of the “brain-drain” phenomenon in case of slow provision of R&D-friendly conditions
Page 46 / 135
1.2. Lessons learned from previously implemented EU interventions
In the process of negotiation and preparation of Croatia for the EU accession, regional
policy has played a very important role whereby Croatia benefited from EU pre-accession
programs such as CARDS, Phare, ISPA, SAPARD and IPA, with an aim of assisting the
implementation of necessary reforms towards achieving overall progress in numerous
relevant fields.
Moreover, there have been several interventions related to increasing competitiveness.
The majority of these projects were focused on administrative capacity building and
assisting national administration in preparing for their future roles in managing and
implementing EU Structural Funds. They served as a solid basis for acquiring programming
and skills specific for EU funds. Additionally, regarding the science and technology sector,
CARDS and Phare projects assisted at building up networks and a “critical mass” of
technology transfer stakeholders within HEIs and PROs who became the target community
for further IPA interventions.
The first EU co-financed grant scheme for SMEs in Croatia – Support for Increasing the
Competitiveness and Export of Croatian SMEs was implemented through Phare 2006, which
was a pilot grant scheme for export-oriented SMEs that involved the provision of
consultancy support essential for enhancing their competitiveness and thereby increasing
their exports offered the following valuable lessons:
- the assistance proved to be well defined, targeted and needed, since according to an end
survey and analysis of final reports, it could be concluded that the overall competitiveness
of the SMEs assisted had in fact increased83, even annulling the negative recession trends;
- all grant beneficiaries gained experience in the implementation of EU funded projects
which they proved by participating in several conferences and workshops with the
objective of transferring the acquired knowledge and experiences to potential
beneficiaries of IPA and Structural Funds, which is important since entrepreneurs tend to
value and rely on such first-hand experiences, proving to them that the outcomes can be
beneficial to their businesses which can in turn motivate them to apply for EU funding;
- SMEs encountered difficulties in the preparation of their applications since they were
inexperienced in project preparation, partly due to the lack of support from BSIs, hence
there is a need to assist the final beneficiaries during both preparation and
implementation of their projects in order to ensure they are carried out in a proper and
quality way.
Further IPA interventions intended to strengthen competitiveness mobilized business
potential at the regional and local level with the implementation of more than 50 projects.
Although most of these were generally still related to institutional capacity building, the
private sector has also benefited both directly and indirectly from those projects and the
general public awareness has been raised regarding the benefits of EU assistance.
The process of implementing IPA has been in most aspects a learning-by-doing process that
had to overcome constraints of limited staff capacity, new methods of working, resistance
to change and somewhat slower acceptance of such practices by the overall national
administration system.
83 The beneficiary SMEs strengthened their export capacities by entering new markets (50% of SMEs), finding new customers (22% of SMEs) and establishing links with potential customers (28%) and many created innovative and more competitive products or improved the overall quality of their products. Employment rates and productivity levels of the beneficiary SMEs had also increased
Page 47 / 135
It introduced an Operating Structure composed of several national institutions which all
needed to be coordinated in their work and needed to accept the fact of one institution
(ME) bearing overall responsibility for the entire programme with its different sectors. In
practice, this meant that line ministries had to gradually grow used to the fact that they
will be reporting and answering to the BROP and BROP had to grow used to the practice of
coordinating a big multi-sector structure in a consistent way which has not always been an
easy task. This entailed issues such as lack of guidance by other national coordinating
bodies (also inexperienced in such matters), insufficient planning, but also low experience
in negotiating with EC, inadequate audit skills of the BROP, inconsistency in the use of
procedures, just to mention but a few.
Also, further overall lessons learnt refer to the importance of detailed, clear, precise and
strategic programme and project preparation as well as detailed plans for the
implementation of all projects and timely support to potential beneficiaries.
Simultaneously with the programming process for Structural Funds it has become evident
that TA is strongly needed in the process of project pipeline development. Well prepared
and mature projects, ready for implementation under Structural Funds are a priority which
demands full programming capacity of the Operating Structure staff but also specialist TA
expertise. As TA was available both to the grant schemes’ applicants as to the entire
Operating Structure, the usefulness of the TA inputs into specialist areas such as
assessment and evaluation of proposals; monitoring systems; financial procedures was
apparent.
It is important to notice that the majority of IPA OPRC operations were implemented
according to a procurement plan, which in itself is a test of the system’s efficiency. As the
OP contains operations that are implemented as grant schemes - the responsible
ministries, i.e., the MRDEUF, MSES and MEC have been continuously gaining valuable
experience in EU-funded grant scheme management, even though all institutions have
previous experience in managing national funding schemes. The mechanisms of grant
schemes were already known to these ministries but the IPA OPRC brought novelties
specific to the IPA programme. The initial findings of the so far completed evaluation of
the two OPRC grant schemes (BRI and SIIF) revealed that the grants were not only
absorbable but insufficient - in the sense that in each case, applications in the first call
exceeded the total allocation of funds for the schemes.
In short, the IPA RCOP served as a solid exercise platform for the ERDF grant schemes.
Authorities and employees included in the management and implementation of the IPA
OPRC have “grown together”, particularly regarding the coordination and harmonisation of
different ministries and different sectors. Such a close cooperation is expected to continue
within ERDF implementing system
However, there have also been constant issues of administrative capacity that all Croatian
institutions involved in the management of EU funds have experienced due to inadequate
remuneration and consequently large turnover of staff. Capacity building is, reasonably,
one of the key criteria for successful absorption of the funds and considerable effort
remains to be continuously invested in the development of a systematic retention policy
and in the promotion and education of employees.
Additional more specific lessons can be pointed out:
- preparation and implementation of various EU co-financed projects boosted cooperation
between relevant county institutions, which also proved to be crucial for the
local/regional success in attracting investments and developing the regions on the overall;

Page 48 / 135
- the private sector in the field of provision of business support services should be
supported by public policies, both at the national and local level, in order to create
motivation and free up competition between BSIs. The development of a public/private
partnership in establishing BSIs should be considered as a possible alternative;
- EU co-financed projects helped change the mind-set of local entrepreneurs regarding
consultancy services, since SMEs became keener on using business advisors in their
everyday work, and related projects proved sustainability through considerable number of
SMEs that followed up the cooperation with advisors provided by such operations, as well
as the importance and applicability of e-business tools as a means to achieving
competitiveness;
- PHARE 2005 and current IPA Business-Related Infrastructure (BRI) grant scheme published
Calls for Proposals gathered significant number of project proposals continuously
confirming the interest and existing demand in the regions. However, the quality of
applications still needs to be improved in order to be eligible for EU financing84;
- implementation capacities, particularly related to the financial management and
secondary procurement at regional and local level, although significantly improved over
the past years, need to be further strengthened, which could be ensured by providing
continuous support in the project preparation and implementation period;
- continuous efforts in terms of timely identification of potential bottle necks related to
the implementation of the operations, on a national and regional/local levels, could
contribute to more efficient action planning and successful achievement of results;
- all Calls published so far have proved the importance of timely and quality provision of
information to the final beneficiaries in terms of motivating them for applying for EU co-
financing of their projects and increasing the quality of project applications;
- having experienced long and cumbersome IPA project evaluation procedures that often
ensued due to a large number of submitted applications and concept note based evaluation
principle, efforts are going to be invested into simplifying the overall procedure for the
future, whereby projects are going to be evaluated according to the first-come, first-
served principle, or in the case of open calls, after the deadline for the submission of the
applications and concept notes will be avoided. Having in mind that the national draft
regulation on project selection envisages the limited timespan for the evaluation of the
projects, this approach should contribute considerably to the contracting dynamics and, in
turn, to absorption of funds. Moreover, the internal organization of IB1s has been adjusted
to carry out task of project evaluation more efficiently. In addition to each IB performing
specific measures to build the relevant capacities, additional external capacities for
project appraisal have also been foreseen to a greater extent than was the case, to be
resorted to when necessary;
- prioritising mature projects will considerably contribute to faster and transparent
contracting. To that end, project preparation assistance will also be available to potential
applicants through a specific operation; and
- day-to-day work with TA experts and close connection to potential beneficiaries has had
a very positive impact on the administrative staff managing the pre-accession assistance in
terms of establishing stronger connections with the beneficiaries and by discussing with
them all of the issues they face regarding their sectors and projects.
84 This can be confirmed by the high number of applicants for the Call for project ideas published in 2010 where 69 project concepts applied for technical assistance for project preparation.
Page 49 / 135
SECTION 2: STRATEGY
The present strategy of the OPRC has been developed on the basis of an analysis of the
challenges for regional competitiveness, while regarding the wider policies, strategies and
guidelines of both the EU and Croatia. During the process of strategy formulation, the
following issues were additionally taken into account:
- Experiences with the IPA programme – Previous experience with programming and
implementing IPA has been taken into consideration, not only as it relates to
strategy development, but also where it concerns the capacity to manage and
implement the present OPRC.
- The approach has been focused on efforts in those areas that are most significant
for regional competitiveness and at the same time most likely to achieve a positive
impact within a limited time period.
- The project pipeline – The institutions responsible for the programming are fully
aware that the success of the OPRC entirely depends on the existence of projects
that are ready to be implemented. The entire strategy is based on a thorough
analysis of the maturity of existing project pipeline, taking into account the
financial and available capacity for their preparation and implementation.
- The wider community – The draft strategy has been discussed with a wider
community of stakeholders and their input has been incorporated.
The result of this approach is a strategy that is strongly focused on objectives, on present
and future strategically important needs, and that includes sufficient safeguards to
guarantee the programme’s proper and timely implementation.
This section describes Croatia’s strategic aims and objectives with positive impact on
regional competitiveness, the correlations of this strategy with Community and national
policies and strategies, as well as the horizontal issues involved. Additionally, it describes
the process of partnership consultations with the relevant national and regional
stakeholders.
2.1. Overall objective of the Operational Programme
Contribution of the OP to the objectives of the NSRF
The overall objective of the NSRF is to support convergence of Croatia with other EU
countries by accelerating economic growth and fostering employment..
In support to the achievement of this overall objective, three strategic objectives have
been identified:
Competitive economy based on market integration, institutional reforms and
sustainable development,
Improving environment for job creation and employability,
Balanced regional development and improvement of living conditions.
The overall objective of the NSRF, together with its strategic objectives, defines the
strategic focus of the investments planned in a broader development context, while four
thematic priorities of the NSRF channel them in a more specific direction. Thematic
priorities of the NSRF are:
Development of modern transportation networks and increased accessibility of the
regions,
Improvement of environmental infrastructure and quality of related services,
Higher competitiveness of SMEs and support to knowledge-based economy,
Page 50 / 135
Improvement of labour market efficiency, development of human capital and
reinforcing social inclusion.
Third thematic priority of the NSRF, higher competitiveness of SMEs and support to
knowledge-based economy, is the overall objective of OP Regional Competitiveness and
will be addressed directly through the implementation of this OP. By supporting an
economy oriented towards knowledge, innovation and new technologies and based on more
competitive and productive SME sector, by reducing obstacles for doing business and
seeking to create a business friendly environment with attractive job opportunities, by
improving touristic and cultural valorisation of regions’ natural potential, the OP
implementation will contribute directly to the achievement of NSRF strategic objectives.
The needs listed below are given here in order to provide a wider environment from which
the OP has selected its relevant priority axes and interventions, based mainly on the
analysis of the socio-economic context, available sectoral strategic approach, but checked
and underpinned by projects in the pipeline:
increase in the attractiveness of the regions and promotion of balanced regional
socio-economic development through strengthening the infrastructure for business
and tourism, with a combination of bottom-up and top-down approach regarding
the project pipeline;
increase in the competitiveness of SME with greater focus on production with higher
added value, improvements in marketing and distribution, leveraging innovative
ecological solutions and optimizing energy and resource efficiency;
development of a comprehensive tourism offer and improvements in Croatia’s
competitiveness on relevant feeder markets; preservation of Croatia’s cultural,
historical and natural heritage and its integration into economic and social life; and
growth of productivity based on R&D results, innovation and technology transfer.
2.2. Specific objectives
The overall objective of the OPRC will be pursued through the following three specific
objectives:
1. Increasing regional potential for economic development;
2. Development of entrepreneurship; and
3. Fostering innovation and research excellence.
These specific objectives are pursuant to the principle of concentrating support on areas
of key importance and are complemented with a specific NSRF priority – “Increasing the
competitiveness of Croatian economy”.
Specific objectives are pursuant to the principle of concentrating support on areas of key
importance85.
The structure of the specific objectives is as follows:
1. Increasing regional potential for economic development
Support to the public authorities in creating and/or developing operational business
structures providing scope for sustainable development of business, to attract
investments, which will contribute to job creation; and
85 Thematic areas.
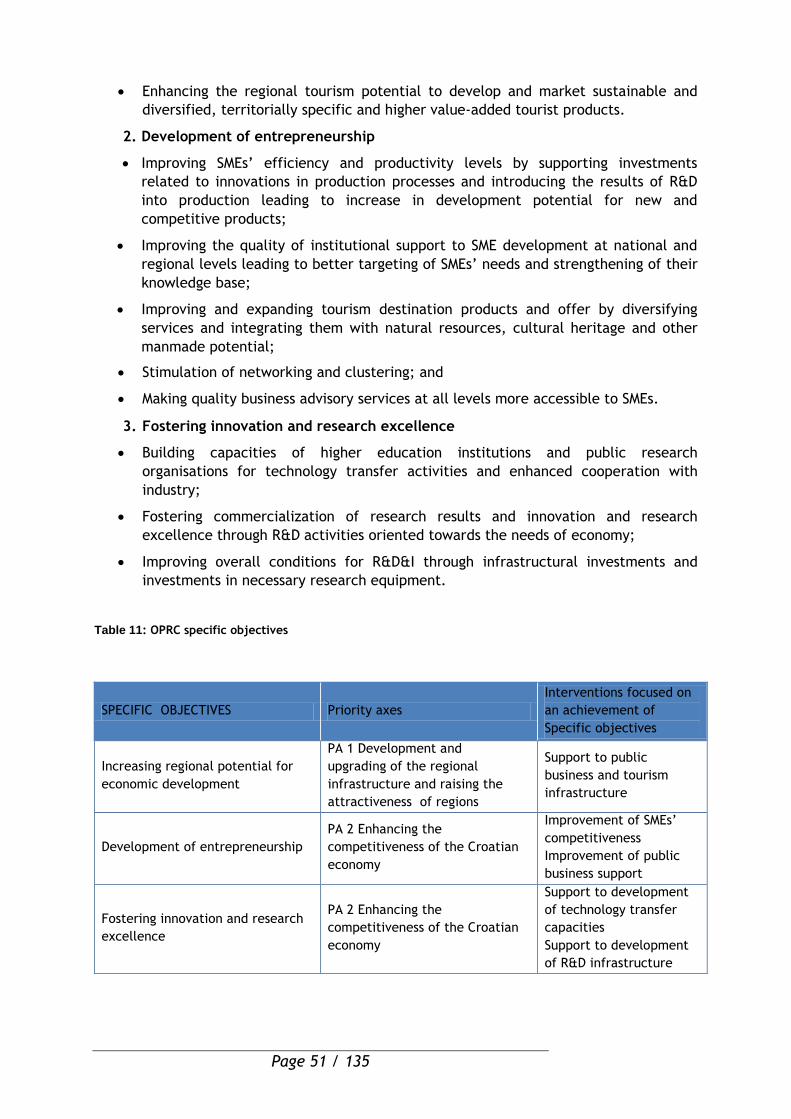
Page 51 / 135
Enhancing the regional tourism potential to develop and market sustainable and
diversified, territorially specific and higher value-added tourist products.
2. Development of entrepreneurship
Improving SMEs’ efficiency and productivity levels by supporting investments
related to innovations in production processes and introducing the results of R&D
into production leading to increase in development potential for new and
competitive products;
Improving the quality of institutional support to SME development at national and
regional levels leading to better targeting of SMEs’ needs and strengthening of their
knowledge base;
Improving and expanding tourism destination products and offer by diversifying
services and integrating them with natural resources, cultural heritage and other
manmade potential;
Stimulation of networking and clustering; and
Making quality business advisory services at all levels more accessible to SMEs.
3. Fostering innovation and research excellence
Building capacities of higher education institutions and public research
organisations for technology transfer activities and enhanced cooperation with
industry;
Fostering commercialization of research results and innovation and research
excellence through R&D activities oriented towards the needs of economy;
Improving overall conditions for R&D&I through infrastructural investments and
investments in necessary research equipment.
Table 11: OPRC specific objectives
SPECIFIC OBJECTIVES Priority axes
Interventions focused on
an achievement of
Specific objectives
Increasing regional potential for
economic development
PA 1 Development and
upgrading of the regional
infrastructure and raising the
attractiveness of regions
Support to public
business and tourism
infrastructure
Development of entrepreneurship
PA 2 Enhancing the
competitiveness of the Croatian
economy
Improvement of SMEs’
competitiveness
Improvement of public
business support
Fostering innovation and research
excellence
PA 2 Enhancing the
competitiveness of the Croatian
economy
Support to development
of technology transfer
capacities
Support to development
of R&D infrastructure
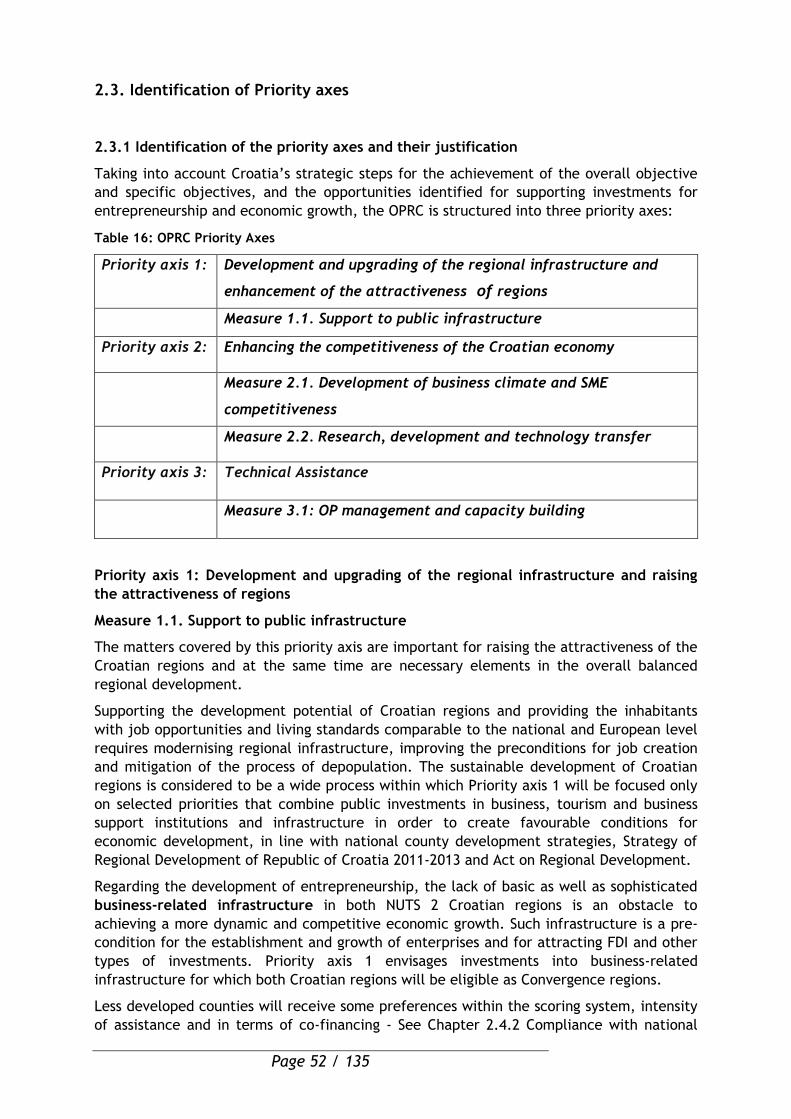
Page 52 / 135
2.3. Identification of Priority axes
2.3.1 Identification of the priority axes and their justification
Taking into account Croatia’s strategic steps for the achievement of the overall objective
and specific objectives, and the opportunities identified for supporting investments for
entrepreneurship and economic growth, the OPRC is structured into three priority axes:
Table 16: OPRC Priority Axes
Priority axis 1:
Development and upgrading of the regional infrastructure and
enhancement of the attractiveness of regions
Measure 1.1. Support to public infrastructure
Priority axis 2: Enhancing the competitiveness of the Croatian economy
Measure 2.1. Development of business climate and SME
competitiveness
Measure 2.2. Research, development and technology transfer
Priority axis 3: Technical Assistance
Measure 3.1: OP management and capacity building
Priority axis 1: Development and upgrading of the regional infrastructure and raising
the attractiveness of regions
Measure 1.1. Support to public infrastructure
The matters covered by this priority axis are important for raising the attractiveness of the
Croatian regions and at the same time are necessary elements in the overall balanced
regional development.
Supporting the development potential of Croatian regions and providing the inhabitants
with job opportunities and living standards comparable to the national and European level
requires modernising regional infrastructure, improving the preconditions for job creation
and mitigation of the process of depopulation. The sustainable development of Croatian
regions is considered to be a wide process within which Priority axis 1 will be focused only
on selected priorities that combine public investments in business, tourism and business
support institutions and infrastructure in order to create favourable conditions for
economic development, in line with national county development strategies, Strategy of
Regional Development of Republic of Croatia 2011-2013 and Act on Regional Development.
Regarding the development of entrepreneurship, the lack of basic as well as sophisticated
business-related infrastructure in both NUTS 2 Croatian regions is an obstacle to
achieving a more dynamic and competitive economic growth. Such infrastructure is a pre-
condition for the establishment and growth of enterprises and for attracting FDI and other
types of investments. Priority axis 1 envisages investments into business-related
infrastructure for which both Croatian regions will be eligible as Convergence regions.
Less developed counties will receive some preferences within the scoring system, intensity
of assistance and in terms of co-financing - See Chapter 2.4.2 Compliance with national
Page 53 / 135
policies). Whereas the second priority axis will support concrete development-research and
entrepreneurial projects, the first priority axis will ensure the support infrastructure that
will additionally promote the development of enterprises and transfer of technologies and
commercialisation of innovation at the same time providing the most advanced business,
research, educational, information and logistics services.
The key activity of priority axis 1 is the establishment of networks of business related
infrastructure (BRI) and business support institutions (BSI) in areas where sufficient critical
mass of knowledge can be ensured as well as sufficient concentration of economic
activities and development potentials together with adequate population concentration.
This infrastructure and relevant institutions will specialise in accordance with territorial
capital and comparative advantages of a wider area and their competitive advantages and
among other, they may include business-industrial-logistics areas (zones), technological
parks and centres, business incubators, higher education and research centres, and similar.
The OPRC will therefore support the local and regional public authorities in creating
and/or developing operational business structures, to attract enterprises, especially SME,
which will contribute to job creation and mobilization of the labour force available in the
relevant areas. The Croatian countryside offers many unexploited development
opportunities and has strong potential based on the distinctiveness and uniqueness of its
natural and historical heritage, which could be utilised for tourism and related services.
Therefore investments in tourism aim on prolonging the tourist season by developing
selective types of tourism, diversifying services and expanding tourist offer, creating
regional and local economic growth opportunities, and at contributing to job creation
through the valorisation and rehabilitation of specific geographic and natural assets, as
well as the valorisation of publicly owned cultural and historical monuments of Croatia’s
regions, including the continental regions which are now underdeveloped for tourism.
Such interventions in enhancement of tourist attractions and related tourism public
infrastructure and development of new tourist product and marketing of destinations will
complement the investments for SME in tourism within Priority axis 2. The renovation of
publicly owned cultural and historical assets will also be driven by the strategy and
objectives for tourism.
The OPRC will furthermore support the public authorities in specialisation, branding and
promotion of regions and development of regional clusters, pro-active promoting of
investment, developing larger regional infrastructure projects through co-financing
studies, analyses, designs and other relevant project documentation, in order to prepare
the regions for the next programming period.
Priority axis 2: Enhancing the competitiveness of the Croatian economy
Measure 2.1. Development of business climate and SME competitiveness
The performance of a region’s existing businesses is the largest single factor in determining
the future success of the regional economy in Croatia. Existing businesses need a climate
in which they are able to become more competitive and grow in a way that is sustainable.
Given the predominance of small and medium enterprises (SMEs) in the business sector,
the development of an effective business support network is a relevant area for public
sector involvement. This will provide companies with the advice, intelligence, and
networks they need to make informed decisions about the development of their
businesses. Focused assistance to high-tech industries may be appropriate to secure wider
economic benefit. Also, new enterprises are vital for ensuring continuing economic
prosperity. They develop in response to new or growing markets and help keep Croatian

Page 54 / 135
economy competitive. Creating conditions that promote entrepreneurship, by encouraging
ambitious and creative people to take risks and move into new markets, supports the
development of successful regions. This Priority axis contributes to the overall objective of
the OPRC by applying a comprehensive approach to the main strategic needs of SME
through enhancing policy making and implementation, enhancing the business and
investment climate.
Also this Priority axis operations aim at enhancing business support for SMEs delivering soft
services to SMEs including e-business, developing specialist support for high growth
businesses, improving their technological structure, R&D, innovation, networking and
clustering and reinforcing their sustainability and competitiveness and strengthening the
international presence of the Croatian economy.
Croatia’s strategic approach aims to enhance competitiveness through the sustainable
growth of productivity. This is to be achieved through productive investments into new
technologies, equipment and facilities. These investments will cut across all aspects of
competitiveness, i.e. productivity, quality, consumer appeal and marketing support, using
of renewable energy, networking of business sector in order to increase efficiency and
competitiveness by adding value (structural networking and encouraging the development
of clusters around research centres).
A problem facing Croatian SMEs on the eve of EU accession is that of preserving
competitiveness in general. As a first step towards designing a growth and development
strategy on the Single European Market, there is need for investing into skills and
knowledge of opportunities, threats and dynamics of the Common Market. Opportunities
for such capacity building are still not adequate (in terms of quality and quantity) or
sufficiently accessible as this type of knowledge and a more strategic mentality are still
lacking among the vast majority of SMEs in Croatia.
Skills are at the core of improving economic performance. There is therefore scope for
more sustained facilitation and investment into quality business advisory services and
education of SMEs on the part of the public sector at all levels (national, regional, local).
Support to the business climate complements integrated support to the national economy
through the development of enterprises, especially SME. Under OPRC direct support to SME
will be implemented with a focus on encouraging investment into export-oriented
activities, strengthening the business sector through the implementation of business start-
up initiatives, leveraging innovative ecological solutions and optimizing energy and
resource efficiency, increasing productivity levels, increasing investments to companies in
the production sector and introducing the results of R&D into production through linking
the business, scientific (educational) and public sector (“Triple Helix”) and associating into
interest associations.
The Croatian economy is geared mainly towards tourism and SMEs active in the tourism
sector need specially designed direct support. In accordance with the sectoral strategy,
the objective of the OP in the field of tourism will be diversifying services and expanding
the tourist offer, increasing the quality of the existing accommodation capacities and
building new ones, improving tourism destination product and offer aiming at the
prolongation of the tourist season, development of the less developed tourist areas,
especially inland and in hinterland by supporting specific forms of tourism and integrating
them with the natural resources, cultural heritage and other manmade potential to
increase the number of tourist visitors and improve their structure.
Page 55 / 135
Measure 2.2. Research, development and technology transfer
Modern economies rely increasingly on knowledge and innovation. Businesses need to
continually develop their products and services if they are to remain competitive. Keeping
up to date with rapidly changing markets, technologies and competitors is a critical
component both for business success and for more sustainable futures.
Encouraging a culture of increased innovation in all organisations, whether they are public,
private or voluntary, is crucial as it can help to drive up productivity as a whole. The
Croatian enterprise sector is currently demonstrating a low level of innovation, which is
reflected in the low number of innovative companies out of the total, the low level of
resources for the R&D sector coming from the enterprise sector, the inadequate saturation
of the enterprise sector with new technologies, and an insufficient number of research and
development personnel. A low level of funding (both public and private) has direct impact
on the identified weaknesses. Priority axis 2 in its aspect specifically related to Research
and development and technology transfer therefore focuses on several issues meant to
contribute to the increase of research capacity by investing in the development of R&D
projects, including investment in R&D infrastructure and world-class scientific research
and know-how centres, with the aim of supporting the development of a knowledge-based
economy in Croatia by encouraging and commercializing innovation as well as the
development and use of new technology.
In addition to research and development projects in companies and knowledge institutions
for the transfer of the research results, also the investments into modernisation of the
research and technological equipment in these organisations will be supported.
Furthermore, to ensure continuous funding of projects within the new financial perspective
of ERDF, building up the project pipeline and project preparation will be funded. The
above listed activities will contribute to the improved conditions for R&D&I activities
within the public R&D sector which will enable higher education institutions and public
research organisation to intensify their networking and collaboration activities within
other EU programs (such as for example the seventh framework program).
The successful establishment of Croatia as a knowledge-based economy depends on a
faster development and quality transformation of the science and technology sectors. The
main aspects of this policy require higher investments in the research and development
sector on the basis of the criteria of excellence, the transformation of those systems to
increase their efficiency, the encouragement of research partnerships, the promotion of
private sector research and development projects aimed at the development of new
products and processes, the strengthening of the support system for ensuring the quality of
young researchers with a view to achieving more efficient and productive knowledge
transfer and the establishment of a stimulating framework for their joint development
through creation of clusters of excellence.
In order to achieve the greater competitiveness of all eligible sectors of the Croatian
economy it is necessary to develop a culture of innovation, increase the contribution that
science and technology make to the economy, create technological platforms for
propulsive sectors, encourage collaboration between business and the existing knowledge
base and support technology transfer and commercialisation of innovation. Creating the
conditions for implementing technology transfer and developing support for a knowledge-
Page 56 / 135
based economy should result in a considerable improvement of the position of the Croatian
economy and its sectors in European and global markets.
Priority axis 3: Technical assistance
Measure 3.1: OP management and capacity building
The purpose of technical assistance is to ensure effective implementation of the
programme, development priorities, priority orientations, projects and activities. The
activities that will be implemented within the framework of technical assistance will
promote recognisability of the programme and its integral parts, the quality of
implementation of the project, its monitoring and control over its implementation.
Within the framework of technical assistance, different evaluation studies will be carried
out and the public will be kept informed of the OPRC achievements. At the same time,
support to the bodies within OPRC Management and Control system will be secured with
aim to improve management, monitoring and evaluation of the OP, as well as for the
retention of the expert staff through the coverage of related administrative costs and
remuneration of OS’ staff.
2.3.2 Indicative breakdown by categories of interventions – Earmarking
The priority axes covered by the OPRC will contribute to categories 01-09 of the categories
of Structural Funds’ investments identified in EU General Regulation 1083/2006 Article 9. A
table with an indicative breakdown of expenditure by category is presented in chapter 5.
2.4. Compliance with EU and national policies
2.4.1 Compliance with EU policies
The NSRF and the OPRC are based on strategic documents of the EU and Croatia. The OPRC
takes these strategic documents into consideration by selecting the objectives and
activities relevant for Croatia and by creating an implementation structure for those
interventions that most efficiently contribute to the objectives laid down in the NSRF.
Conformity of OPRC with the Community Strategic Guidelines on Cohesion
The OPRC is consistent with the Community Strategic Guidelines (CSG) on Cohesion, which
define the framework for the operation of SCF and identify areas where Cohesion policy
can contribute in the most effective manner to the realization of Community priorities
relating to the renewed Lisbon Strategy as defined under the Integrated Guidelines for
Growth and Jobs. The CSG on Cohesion for 2007-2013 are focused on three main guidelines
and their related priorities:
1. Make Europe and its regions more attractive places to invest and work
2. Improve knowledge and innovation for growth
3. More and better jobs
The OPRC conforms to the CSG to an extent defined by its specific nature - it is an OP
funded entirely by the ERDF and oriented towards the improvement of competitiveness in
Croatia, both at the national and the regional level.
The OP addresses the first guideline above mainly through environmentally friendly
interventions. The OP responds to the necessity of creating a more attractive atmosphere
for investments and work by promoting the compliance of enterprises with environmental
legislation, the rehabilitation of the physical environment (including natural and cultural
assets) and support for environmentally friendly technologies.
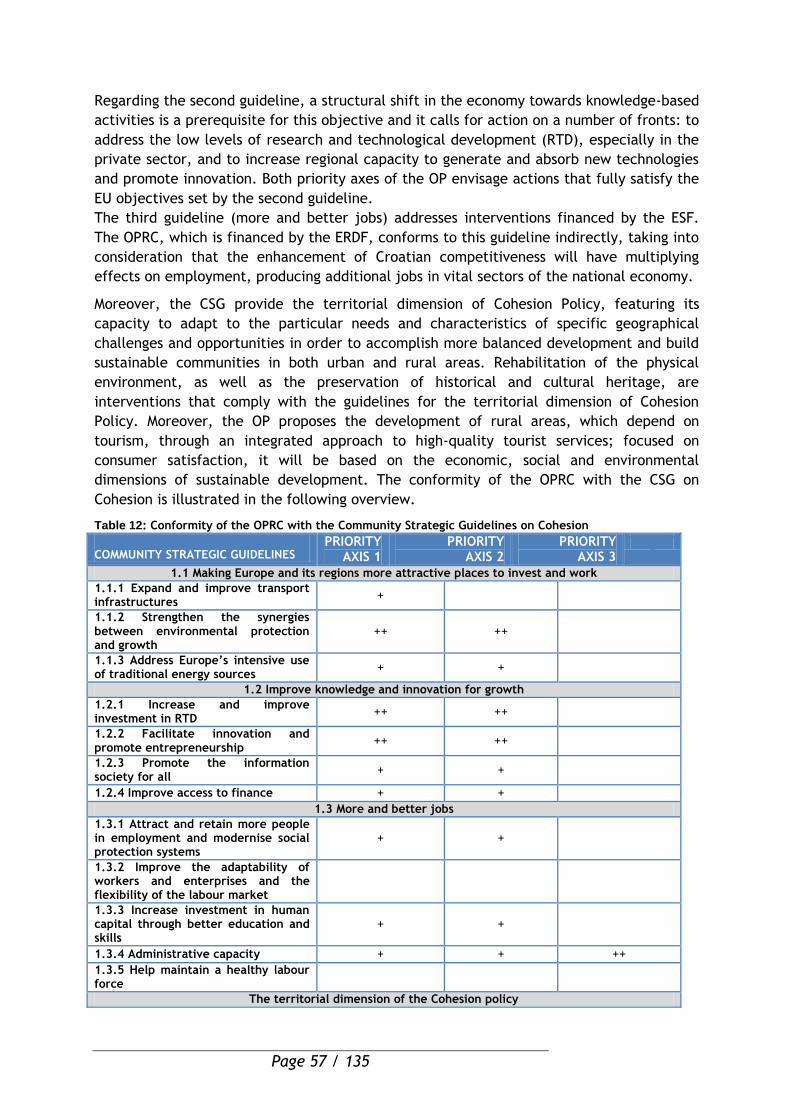
Page 57 / 135
Regarding the second guideline, a structural shift in the economy towards knowledge-based
activities is a prerequisite for this objective and it calls for action on a number of fronts: to
address the low levels of research and technological development (RTD), especially in the
private sector, and to increase regional capacity to generate and absorb new technologies
and promote innovation. Both priority axes of the OP envisage actions that fully satisfy the
EU objectives set by the second guideline.
The third guideline (more and better jobs) addresses interventions financed by the ESF.
The OPRC, which is financed by the ERDF, conforms to this guideline indirectly, taking into
consideration that the enhancement of Croatian competitiveness will have multiplying
effects on employment, producing additional jobs in vital sectors of the national economy.
Moreover, the CSG provide the territorial dimension of Cohesion Policy, featuring its
capacity to adapt to the particular needs and characteristics of specific geographical
challenges and opportunities in order to accomplish more balanced development and build
sustainable communities in both urban and rural areas. Rehabilitation of the physical
environment, as well as the preservation of historical and cultural heritage, are
interventions that comply with the guidelines for the territorial dimension of Cohesion
Policy. Moreover, the OP proposes the development of rural areas, which depend on
tourism, through an integrated approach to high-quality tourist services; focused on
consumer satisfaction, it will be based on the economic, social and environmental
dimensions of sustainable development. The conformity of the OPRC with the CSG on
Cohesion is illustrated in the following overview.
Table 12: Conformity of the OPRC with the Community Strategic Guidelines on Cohesion
COMMUNITY STRATEGIC GUIDELINES
PRIORITY AXIS 1
PRIORITY AXIS 2
PRIORITY AXIS 3
1.1 Making Europe and its regions more attractive places to invest and work 1.1.1 Expand and improve transport infrastructures
+
1.1.2 Strengthen the synergies between environmental protection and growth
++ ++
1.1.3 Address Europe’s intensive use of traditional energy sources
+ +
1.2 Improve knowledge and innovation for growth 1.2.1 Increase and improve investment in RTD
++ ++
1.2.2 Facilitate innovation and promote entrepreneurship
++ ++
1.2.3 Promote the information society for all
+ +
1.2.4 Improve access to finance + +
1.3 More and better jobs 1.3.1 Attract and retain more people in employment and modernise social protection systems
+ +
1.3.2 Improve the adaptability of workers and enterprises and the flexibility of the labour market
1.3.3 Increase investment in human capital through better education and skills
+ +
1.3.4 Administrative capacity + + ++
1.3.5 Help maintain a healthy labour force
The territorial dimension of the Cohesion policy
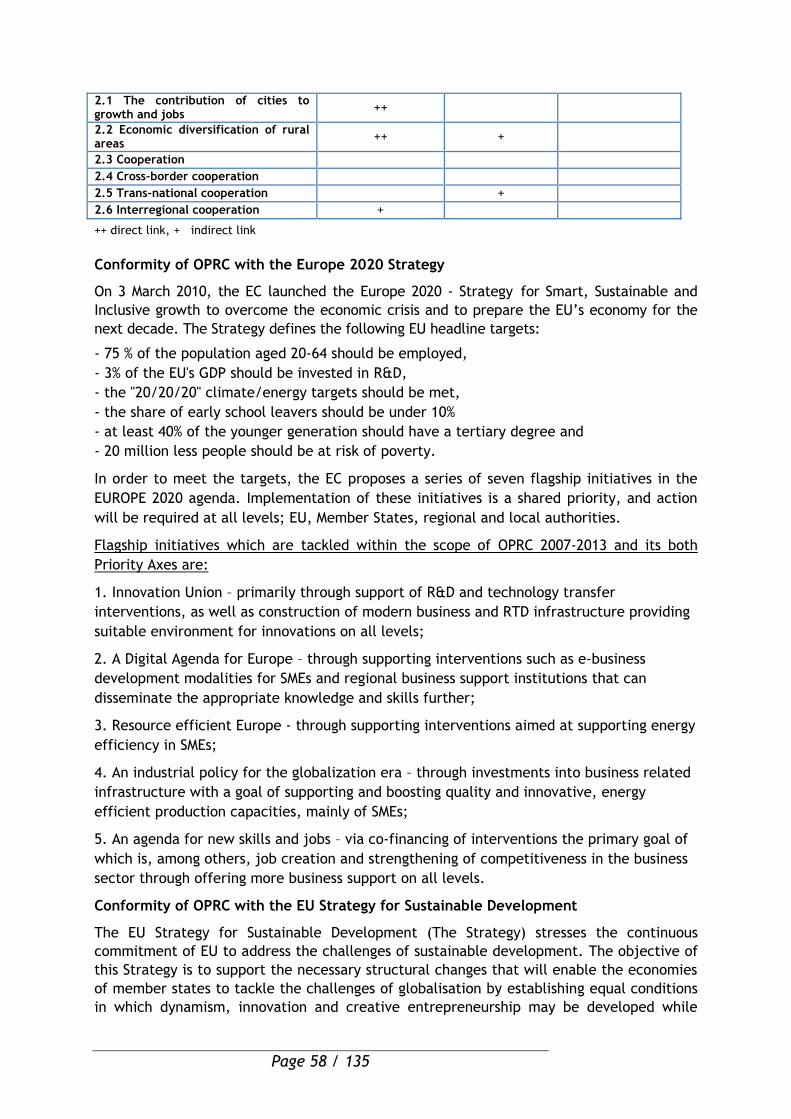
Page 58 / 135
2.1 The contribution of cities to growth and jobs
++
2.2 Economic diversification of rural areas
++ +
2.3 Cooperation
2.4 Cross-border cooperation
2.5 Trans-national cooperation +
2.6 Interregional cooperation +
++ direct link, + indirect link
Conformity of OPRC with the Europe 2020 Strategy
On 3 March 2010, the EC launched the Europe 2020 - Strategy for Smart, Sustainable and
Inclusive growth to overcome the economic crisis and to prepare the EU’s economy for the
next decade. The Strategy defines the following EU headline targets:
- 75 % of the population aged 20-64 should be employed,
- 3% of the EU's GDP should be invested in R&D,
- the "20/20/20" climate/energy targets should be met,
- the share of early school leavers should be under 10%
- at least 40% of the younger generation should have a tertiary degree and
- 20 million less people should be at risk of poverty.
In order to meet the targets, the EC proposes a series of seven flagship initiatives in the
EUROPE 2020 agenda. Implementation of these initiatives is a shared priority, and action
will be required at all levels; EU, Member States, regional and local authorities.
Flagship initiatives which are tackled within the scope of OPRC 2007-2013 and its both
Priority Axes are:
1. Innovation Union – primarily through support of R&D and technology transfer
interventions, as well as construction of modern business and RTD infrastructure providing
suitable environment for innovations on all levels;
2. A Digital Agenda for Europe – through supporting interventions such as e-business
development modalities for SMEs and regional business support institutions that can
disseminate the appropriate knowledge and skills further;
3. Resource efficient Europe - through supporting interventions aimed at supporting energy
efficiency in SMEs;
4. An industrial policy for the globalization era – through investments into business related
infrastructure with a goal of supporting and boosting quality and innovative, energy
efficient production capacities, mainly of SMEs;
5. An agenda for new skills and jobs – via co-financing of interventions the primary goal of
which is, among others, job creation and strengthening of competitiveness in the business
sector through offering more business support on all levels.
Conformity of OPRC with the EU Strategy for Sustainable Development
The EU Strategy for Sustainable Development (The Strategy) stresses the continuous
commitment of EU to address the challenges of sustainable development. The objective of
this Strategy is to support the necessary structural changes that will enable the economies
of member states to tackle the challenges of globalisation by establishing equal conditions
in which dynamism, innovation and creative entrepreneurship may be developed while
Page 59 / 135
ensuring social equality and a healthy environment. This intention is reflected in four key
objectives of the Strategy – protection of the environment, social justice and cohesion,
economic prosperity and fulfilment of international commitments.
The OPRC is mainly focused on achieving economic prosperity, through both of its Priority
Axes, as they are focused on boosting business related infrastructure, SME competitiveness
and energy efficiency, R&D and technology transfer, although some positive spill-over
effects (of milder intensity, considering the somewhat limited scope of this OP) are
expected on the other three objectives as well, through the mentioned interventions.
Other sectoral EU guidelines
Individual sectoral policies and guidelines designed at the EU level provide mandatory or
recommended conclusions to be addressed and reflected at national level. The OPRC and
its operations fully respect all the relevant policies and guidelines related to the increase
of regional competitiveness. The sectoral guidelines taken into consideration in the
formulation of the OPRC are listed in Annex 5.
2.4.2 Compliance with national policies
The overall strategic approach for the programming period focuses on the implementation
of polices aiming at convergence with the EU, improving the living standards of Croatian
citizens, and promoting sustainable and balanced development of Croatia’s regions and
cities through a range of productive and social capital investments.
The overall objective of the NSRF is to support convergence of Croatia with other EU
countries by accelerating economic growth and fostering employment..
On the basis of the socio-economic analysis, and the results of extended consultations for
setting the above strategic orientations, the following five thematic priorities of the NSRF
have been defined:
- Development of modern transportation networks and increased accessibility of the
regions
- Investment in environmental infrastructure for sustainable development and
improvement of nature and living environment
- Increasing competitiveness of the Croatian economy
- Employment and development of human capital
- Administrative capacity development.
The strategy of OPRC contributes mainly to fulfilment of the thematic priority Increasing
competitiveness of the Croatian economy.
Internal country cohesion and balanced regional development, as a horizontal priority
within the NSRF and consequently within all OPs, is stimulated by growth and the
development of regions based on their endogenous conditions (their location, terrain
morphology, climatic condition, natural resources and social capital including human
capital, traditional products and other traditions, experiences and the images built during
the years of their development).
In consideration of the current financial perspective, interventions that promote the
competitiveness of regions and balanced regional development will be implemented under
those programmes and sectors that are able to generate mature projects.
Page 60 / 135
Table 13: Compliance of OPRC with the Strategic Development Framework (SDF) 2006- 2013
OPRC Specific objectives Targets and principles of the SDF 2006-2013
Horizontal priority: Internal
country cohesion and
balanced regional
development
- Ensure polycentric regional development and a reduction of the differences in economic development and living standard within counties
- Foster sustainable development principles
- Support areas lagging behind in development
Strategic objective 1:
Increasing regional
potential for
economic development
- Ensure polycentric regional development and a reduction of the differences in economic development and living standard within counties
- Develop comprehensive Croatian tourism offer, emphasising the complementarities of Adriatic and continental tourism
- Increase quality and diversity of Croatian tourism offer on the overall
Strategic objective 2:
Development of
entrepreneurship
- Develop a favourable entrepreneurial climate as the essential condition for development and prosperity
- Further revive industrial production
- Create production based on superior technological processes
- Encourage export – to slow down the growth of the external debt and deficit of the balance of payment
- Promote the development of entrepreneurship as the main instrument of regional development
- Achieve openness of economy (importance of export, technology and knowledge transfer)
- Establish favourable investment climate - Affirm entrepreneurship as the key activity on which social
dynamics and integrity rely
- Create adequate conditions for FDI and ensuring permanent inflow of FDI into the export sector
- Increasing the country’s competitiveness by creating a more productive business environment
Strategic objective 3:
Fostering innovation and
research excellence
- Cope with inadequate use of innovations and scientific results in the development of the economy
- Invest in scientific infrastructure and institutions for knowledge transfer
- Raise absorption capacity of Croatian scientific organisations with respect to EU programme in R&D, especially through establishing connections with entrepreneurs
- Provide conditions for the transfer of knowledge and technologies in business ventures
- Increase investment in science and research, create conditions for increasing investments made by the private sector, including by attracting foreign capital
- Transfer knowledge as comprehensively as possible into the development of economy
- Create flexible scientific research centres with modern equipment where groups of researchers can work on specific projects
- Ensure polycentric development of science and research activities
- Encourage research partnership and strengthen the support system for promising young researchers
- Ensure adequate budgetary funds for the establishment of the infrastructure needed for technology transfer and for the start-up
and incubation spin-off enterprises from university and research institutions
- Achieve optimum usage of research equipment and infrastructure. Create partnerships of science and research institutions and the private sector in modernising the research infrastructure
Page 61 / 135
Until recently, Croatia’s policy for regional development has been implemented through
various measures and without a systematic approach covering the entire territory of the
country. Several acts focused on specific issues and mainly on the regions that are lagging
behind (those affected by war, or those which include islands, border and mountainous
regions, or other areas of special state concern).
Therefore, the Croatian government has identified the need for an integrated, coherent
regional policy based on its growing concern for the widening gaps in socio-economic
differences and development potential between different parts and social groups within
the country. In December 2009 the Act on Regional Development of the Republic of
Croatia86 was passed and the Strategy for Regional Development of the Republic of
Croatia 2011-2013 (SRDRC) was adopted in June 2010.
The SRDRC ensures that the national and EU regional policy are brought onto a consistent,
integrated and effective level, in order to enable the parallel usage of both national and
EU cohesion resources, as well as to make possible the reduction of Croatia’s internal
disparities and catching up of the country as a whole with the average EU socio-economic
development levels.
The SRDRC encompasses the development priorities and interventions aimed at building
the overall development capacity, reducing disparities and building the potential of
assisted areas to compete. It also sets out a coherent unified policy and legal framework
for regional development as well as a strategy for building the institutional framework on
both national and regional level.
At the county level, development is based on the regional development documents called
County Development Strategies (CDS), which are in line with the SRDRC. The CDSs are
prepared by the County Development Agencies in cooperation with the County Partnership
Council and in line with the priorities defined for the NUTS 2 regions that seek to match
the local and regional development needs with (a) the national and EU development
priorities, and (b) the availability of funds and the strategic documents covering the use of
EU and national funding resources.
The SRDRC is an essential strategic document for regional development; it establishes the
most important pre-conditions for successful implementation of Structural Funds relating
to regional development in Croatia. With the approved Act on Regional Development and
the government’s adoption of the SRDRC, the situation in regional development and the
preparation for Structural Funds is amended mainly in three fields:
- Legislation. The Act on Regional Development87 provides, in parallel with strategy, the
legal framework for regional development and the implementation of new measures,
including funding from SF;
86 Act on Regional Development of the Republic of Croatia (OG 153/2009) followed by 6 acts of secondary
legislation: 1) Government Decree on the Establishment of Partnership Councils of the NUTS 2 Regions (OG 38/10); 2) Regulation on Mandatory Content, Methodology, and Evaluation of County Development Strategies (OG 53/2010); 3) Regulation on the Registry of County Development Agencies (OG 53/2010); 4) Government Decree on the Development Index (OG 63/2010); 5) Regulation on the Central Electronic Database of Development Projects (OG 66/2010); 6) Government Decision on Categorization of Local and Regional Self-Government Units According to the Development Index Values (OG 89/2010), which lists assisted areas defined in the Law (whereby counties fall into Category I and municipalities into Categories I and II). 87 Adopted in December 2009 (OG 153/2009).
Page 62 / 135
- An institutional framework and management structure at the national and regional
level (NUTS 2 and NUTS 3 regions), which is very important for capacity building and
partnership. The act also defines the role of the Agency for Regional Development
(established in December 2008)88 and the roles of relevant ministries, self-government
units and County Development Agencies;
- Planning and programming at national and regional levels – SWOT analysis and
priorities at NUTS 2 level and design of instruments for the development of counties,
NUTS 2 regions and assisted areas and also for cross-border cooperation. This
methodology should enable multi-annual programming, which is vital for the successful
absorption of Structural Funds.
The SRDRC provides a coordinated approach to sustainable socio-economic development in
the country and connects the top-down and bottom-up development management by
linking various ministries and central state institutions with other stakeholders of the
country’s socio-economic development (at national, regional and local level) in order to
achieve a more balanced development of the country and to diminish socio-economic
differences.
This approach is reflected on the objective of the SRDRC which is to contribute to the
economic growth and development of the Republic of Croatia in line with sustainable
development principles, by creating conditions that would enable all parts of the country
to strengthen their competitiveness and realize their development potential. This will be
achieved by:
accomplishing a better linkage between local and regional development needs with
the development priorities at national level and eventually with the interventions
of the EU SCF,
ensuring support for all areas with socio-economic development difficulties in order
to increase and exploit their development potential by resolving the cause of their
development difficulties, and
reducing negative effects of national borders on the development of border areas
by stimulating cross-border cooperation.
88 OG 155/2008.
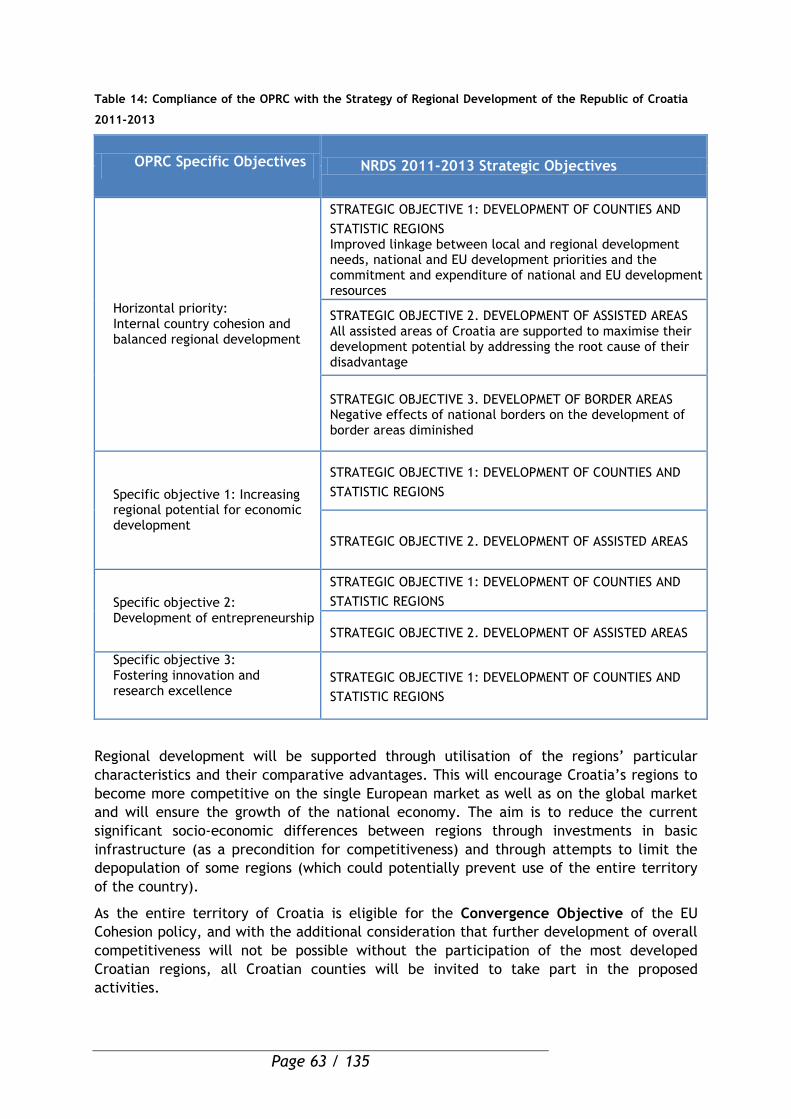
Page 63 / 135
Table 14: Compliance of the OPRC with the Strategy of Regional Development of the Republic of Croatia
2011-2013
OPRC Specific Objectives NRDS 2011-2013 Strategic Objectives
Horizontal priority: Internal country cohesion and balanced regional development
STRATEGIC OBJECTIVE 1: DEVELOPMENT OF COUNTIES AND
STATISTIC REGIONS Improved linkage between local and regional development needs, national and EU development priorities and the commitment and expenditure of national and EU development resources
STRATEGIC OBJECTIVE 2. DEVELOPMENT OF ASSISTED AREAS All assisted areas of Croatia are supported to maximise their development potential by addressing the root cause of their disadvantage
STRATEGIC OBJECTIVE 3. DEVELOPMET OF BORDER AREAS Negative effects of national borders on the development of border areas diminished
Specific objective 1: Increasing regional potential for economic development
STRATEGIC OBJECTIVE 1: DEVELOPMENT OF COUNTIES AND
STATISTIC REGIONS
STRATEGIC OBJECTIVE 2. DEVELOPMENT OF ASSISTED AREAS
Specific objective 2: Development of entrepreneurship
STRATEGIC OBJECTIVE 1: DEVELOPMENT OF COUNTIES AND
STATISTIC REGIONS
STRATEGIC OBJECTIVE 2. DEVELOPMENT OF ASSISTED AREAS
Specific objective 3: Fostering innovation and research excellence
STRATEGIC OBJECTIVE 1: DEVELOPMENT OF COUNTIES AND
STATISTIC REGIONS
Regional development will be supported through utilisation of the regions’ particular
characteristics and their comparative advantages. This will encourage Croatia’s regions to
become more competitive on the single European market as well as on the global market
and will ensure the growth of the national economy. The aim is to reduce the current
significant socio-economic differences between regions through investments in basic
infrastructure (as a precondition for competitiveness) and through attempts to limit the
depopulation of some regions (which could potentially prevent use of the entire territory
of the country).
As the entire territory of Croatia is eligible for the Convergence Objective of the EU
Cohesion policy, and with the additional consideration that further development of overall
competitiveness will not be possible without the participation of the most developed
Croatian regions, all Croatian counties will be invited to take part in the proposed
activities.
Page 64 / 135
The principle of balanced regional development as a horizontal priority will be applied
in such a way that it provides an opportunity for all regions to use their potential for
economic and social development to the maximum extent. In parallel, some preferences
for the assisted areas are provided in order to reduce regional disparities. The
identification of assisted areas is based on the “Development Index” in accordance with
the Act on Regional Development of the Republic of Croatia, articles 24 and 25, which
divides the self-governing units into categories (assisted areas being defined as counties
falling into Category I, and municipalities falling into Category I and II, namely all units
which development index is below 75% of the national average).
All self-governing units falling in the same category shall receive the same level of
preferences (Category I having higher volume of preferences than Category II). The
preferences can have three possible forms:
- extra points within the scoring process,
- a higher level intensity of assistance89, and
- a percentage of co-financing provided by the national level instead of the
applicant.
The strategy of increasing the development potential of the regions covers business-
related infrastructure (communal and support infrastructure inside business zones and
public tourism-related infrastructure), the infrastructure of e-communication, as well as
cultural and historical heritage related to the tourism development. Support of economic
activity (direct or indirect support to SME) has to be accompanied by the creation of
favourable conditions for workers and their families, facilitating their participation in the
labour market, and thus making regions an attractive place to live and work. All of the
above will also help tackle the issue of the excessive concentration of population in larger
cities and the depopulation of the countryside.
ERDF co-financed investments in the field of tourism will focus on better utilisation of
natural and cultural resources, as well as on other manmade potential for developing
tourism; more specifically, they will focus on prolonging the tourist season, attracting
tourists all year round (with the goal of developing tourism in the continental areas too,
through specific forms of tourism such as MICE90, spa tourism, mountain tourism, rural
tourism, active and hobby-based tourism, etc.), and on increasing and improving the
structure of foreign visitors. Efforts will also be made to improve the public infrastructure
for tourists, including cultural infrastructure and commercial facilities (accommodation,
leisure, sports, recreation, rehabilitation, amusement, conferences, etc.) operated mainly
by SME. The competitiveness of Croatian tourism will therefore be supported by both the
improvement of the products for tourism (through new facilities and services) and
intensive promotion and marketing activities on both domestic and foreign markets. The
proposed interventions are in full accordance with the Strategy for Croatian Tourism
Development and the long–term vision that is a part of this document.
Various national strategic documents have influenced the OPRC. The tables in Annex 3
show the links between the various national strategic documents and the foreseen types of
interventions for each type of operations of the OPRC.
89 Assistance intensity - % share of the grant in the total eligible cost of the project, e.g., for SME, a 50% grant of the total eligible cost in a less developed region, but only 40% or 35% in the most developed region. 90 Meetings, incentives, conferences and exhibitions.
Page 65 / 135
2.5. Ex ante evaluation
Ex-ante evaluation of the OPRC was undertaken between March and June 2012, in line with
the Council Regulation 1083/2006. Draft report was presented to the main stakeholders in
June and the final report was delivered in August 2012.
The evaluation was undertaken in the framework of the IPA 2008 project “Ex-ante
evaluation of programming documents and strengthening evaluation capacity for EU funds
post-accession”. The main reference document of the evaluation was the draft OPRC last
edited in March 2012.
The ex-ante evaluation report was built on the following methodology:
Desk-based review of background literature, Programme texts, operation manuals
and other documentation, including previous evaluations, progress reports, annual
implementation reports, and policy documents;
Data analysis of monitoring information and Programme performance indicators,
along with wider labour market and socioeconomic data;
Strategic consultations with each of the key stakeholders, including all Ministries
having management and thematic responsibilities in relation to the various
interventions of the OP;
Evaluation of the Priorities – and, in exceptional cases individual measures against
the set evaluation criteria.
The complete ex-ante evaluation report is presented in Annex 6 while an excerpt
containing the summary of the findings is offered below.
The main conclusions of the ex-ante evaluation are presented are as follows:
The objectives of the Programme in general respond to the needs and opportunities
described in its analytical chapter. Policy choices broadly fit to the related policy
environment set by the relevant national regional and sector policy frameworks,
and also take into account the specific circumstances of the programming.
The intervention logic of the Programme is valid and operational.
Territorial aspects have been considered by the strategy.
Increasing attention on the tourism sector raises the issue of stronger involvement
of specific stakeholders of this sector in programming and management in the
future.
Indicators presented are largely appropriate to measure the changes in relation to
the specific objectives of the Programme.
Planned measures are expected to sufficiently promote the principle of equal
opportunities and sustainable development, but areas of special concerns of neither
equal opportunity nor environmental issues have been identified.
In the R&D sector the greater involvement of the private sector would be beneficial
already in the programming phase.
The expected impact of the Programme is broadly in line with the objectives set.
Socio-economic impacts are limited by the relatively modest amount of financial
resources allocated to the programme.
The management structure of the Programme will almost certainly follow the one
established by the IPA OP. On one hand the system itself can be considered as being
set up and operational, on the other hand, to be reliably operational under the SCF
period, further steps of developing these institutions are to be made.
The management of the OP focused on developing targeted project pipelines to the
grant schemes implemented and less emphasis has been placed on creating and
Page 66 / 135
developing an institutional system that might become gradually self-sustaining and
deliver continuous advice and assistance for further beneficiaries.
On the basis of the above conclusions, the following recommendations were proposed:
1. To improve efficiency of handling territorial disparities, encourage, coordinate and
assist counties to update their county development strategies and extend already
planned preferences by targeted additional assistance to project holders in assisted
regions.
2. Strengthen the input from the tourism sector representatives to programming and
project selection, including by a more intense cooperation with industry
stakeholders and local and territorial self-governments.
3. For R&D schemes prepare the extension of the eligibility to the private sector and
consider launching a pilot scheme to collect experiences upfront.
4. Improve the quality of the main indicators for the purposes of evaluation.
5. Take necessary decision on the management structure and devise and make public a
comprehensive roadmap with regard to the evolution of the roles of the current
institutions involved in the management of the OP, including the IB’s designated
earlier.
6. Devise a comprehensive set of interventions in the delivery system of the OP,
including coordinated actions in the review and re-design the assessment and
contracting procedures and, for accelerating the pace of physical implementation
of the projects, the reinforcement of technical assistance services for beneficiaries
and physical monitoring activity.
7. Extend the scope of the presently available EU-funded instruments to support the
consolidation and further development of local and sub-national institutions in
charge of assisting potential beneficiaries in generating and developing projects.
8. Monitor the horizontal issues (equal participation of women and the promotion of
the participation of vulnerable groups as well as environmental sustainability of the
relevant operations).
9. Develop the analytical chapter of the OP to improve the clarity and the coverage of
the analysis, as well as the coherence between analysis and the objectives.
Based on the evaluators’ findings and recommendations, the Operating Structure
undertook a revision of the OPRC and introduced a number of improvements to both its
content and format. Those changes of a more substantial importance as well as additional
comments are summarized below.
1. A new “Strategy on Regional Development of the Republic of Croatia”, as well as
other County Development Strategies will be prepared for the period 2014-2020 and
the EU strategic documents such as EU2020 Strategy will be considered. However,
due to the shorter period of implementation of the ERDF OPRC, updating of
strategic documents which refer to the period 2011-2013 can be done only on an
individual basis. All actions within PA 1 have to be in line with existing territorial
development strategies (this rule has already been applied under IPA). Support to
sub-national institutional structure is envisaged by national actions (for exp.
MRDEUF “Programme for Preparation and Implementation of Projects”), through
support given to potential applicants, continuous communication and partnerships
with SRDP and through PA 3 actions.
2. Input from the tourism sector has been strengthened. Representatives of the
Ministry of Tourism (MT) have participated actively in preparation of the OPRC,
Page 67 / 135
especially in the socio-economic analysis for the tourism sector. The MT and
Ministry of Culture are included in the development of selection criteria together
with MRDEUF/SRDP and can propose strategic projects to be included in the project
pipeline.
3. The recommendation has been taken into account, and both the private business
sector and public sector will be included within the scope of the OPRC R&D grant
schemes.
4. Indicators have been further addressed and are in line with the table of indicators
included in the last IPA OP modification 2012-2013.
5. OP Section 4 Implementation contains more information regarding the mentioned
issues, while they are also being addressed through PA 3 of the OPRC (i.e. through
remuneration and trainings of staff) and appropriate modalities are being further
developed nationally along within the scope of the preparations for the compliance
assessment procedure.
6. Please see previous comment 5.
7. The activities to strengthen sub-national network of institution are envisaged within
some national actions, continuous communication with the regional coordinators
(including their participations in education for potential applicant and other
educational activities) and within PA 3.
8. Horizontal issues (gender equality and environmental protection especially) will be
considered as requirements for all actions and additional promotion of those issues
is envisaged through the selection criteria and related scoring system.
9. The analytical chapter of the OPRC has been further developed. Analysis of the
tourism sector for instance provides more details, including more information on
cultural tourism, natural heritage, accommodation facilities condition etc.
supporting the statements given in SWOT table, as was done for the other relevant
sectors as well.
2.6. Significant Environmental Impact Assessment (SEA)
SEA of the OPRC 2007 – 2013 has been drafted in accordance with the provisions of the
Environmental Protection Act (OG 110/07) and the Regulation on strategic environmental
assessment of plans and programmes (OG 64/08), assessing potentially significant
environmental impact that might be caused by implementation of plans and programmes.
Article 56 of the Environmental Protection Act (OG 110/07) prescribes mandatory strategic
evaluation in the following cases:
1. for plans and programmes, excluding their changes and/or amendments, adopted
on the national and regional level in the fields of: agriculture, forestry, fisheries,
energy, industry, mining, transport, telecommunications, tourism, waste
management and water management;
2. for county physical plans and for the City of Zagreb Physical Plan, excluding their
changes and/or amendments.
Strategic evaluation is conducted during the creation of draft proposal plan and
programme, prior to completion of the final proposal and starting of the adoption
procedure as prescribed by the Environmental Protection Act (OG 110/07) and the
Regulation on strategic environmental assessment of plans and programmes (OG 64/08).
SEA comprises definition, description and assessment of the expected significant
environmental impacts that might be caused by the implementation of the OPRC of 2007 –
Page 68 / 135
2013 as well as rational alternatives in terms of environmental protection, taking into
account objectives and scope of the relevant plan or programme. The objective and
purpose of drafting the SEA is to evaluate the impact of the OPRC of 2007 – 2013 on
strategic level, provide objectives and guidelines (measures) that will eliminate or reduce
the proven key impacts to the lowest possible level and suggest the manner of
incorporating objectives and guidelines (measures) into the OP.
Taking into account the strategic steps that Croatia is taking in order to achieve the above
mentioned overall objective and the identified opportunities and investments whose
purpose is to support the development of entrepreneurship and of the economy, which is
one of the strategic objectives of the NSRF, the RCOP is structured into three priority axes.
1. Priority Axis 1: Development and Upgrading of the Regional Infrastructure and
Enhancement of the Attractiveness of Regions.
2. Priority Axis 2: Enhancing the Competitiveness of the Croatian Economy:
3. Priority Axis 3: Technical Assistance.
For each of the priority axis, there are suggested key areas as well as the list of eligible
operations/activities within each key area throughout the entire Croatian territory. All
acceptable activities arising from this OPRC are not defined by location and size, rather by
purpose only.
All activities proposed have previously been valorised through a variety of acceptable
activities. After this, the acceptable activities are valorised once again through the
assumed possible environmental impacts and the appropriate prescribed environmental
protection measures, as well as an environmental monitoring program. In short, the
following may be concluded:
For much of the planned activities, it can be said that they will not have an impact on
the environment.
Activities implemented under PA 1, beside key area 1.1, intended for public business and
tourism infrastructure will certainly have small or negligible impacts on the environment.
The dominant activities that will affect the environmental characteristics of the areas in
which they are carried out refer to the key area of operations for PA 2 and direct support
for productive investments by SMEs.
The SEA public consultations process place in March 2013, providing opportunity to all
stakeholders, including regional and local government representatives, representatives of
public and scientific institutions and non-profit sector to comment and provide suggestions
for the improvement of planned OPRC activities.
The consultations process involved the following steps:
• an introductory session was publicly announced via the Croatian Chamber of
Economy (CCE) website and invitations and the SEA process and findings and the RCOP
presented in Croatian to the persons attending the session at the CCE. The representatives
of the MRDEUF and SEA drafting experts were present and provided additional information
and answered questions by the public;
Page 69 / 135
• during one month, the public could examine at MRDEUF premises and receive
answers to their questions and additional information related to the documents below,
also, as announced previously on MRDEUF webpages in Croatian and in CCE:
- the full draft SEA report in Croatian;
- the non-technical summary in Croatian;
- the RCOP summary (of key interventions and more detailed planned relevant
investment actions) in Croatian and
- the entire draft RCOP was the only document provided in English.
However, the RCOP summary in Croatian actually provided all of the most important
information, of the most interest to the public. Foremostly, a description of all the
planned areas of interventions and activities planned to be cofinanced, which are also
actually not that new to the Croatian public. Namely, since ERDF RCOP 2007-2013 is
actually a modified continuation of the IPA RCOP 2007-2013, in terms of areas of
interventions and investments, it offers little change, mostly due to the limited time frame
at the end of the financial perspective, which actually required focusing and targeting of
OP interventions.
Moreover, all of the planned ERDF interventions and the relevant sectors have already
been presented to the Croatian public in June 2010, at the public consultations held for
the NSRF and the RCOP, when these documents were drafted for the 2012-2013 period,
which was then narrowed down to the last six months of the financial perspective 2007-13.
The scope of activities has only been further limited since that point in time and no new
sectors, nor areas of interventions have been introduced within the scope of the OP.
• Furthermore, the SEA report itself, which has been drafted both in English and in
Croatian, respectively, was available to the public during the public consultations also
contains exhaustive descriptions of interventions planned under the RCOP and how they
relate to the SEA process and its findings.
2.7. Partnership process
The development of the OPRC was carried out through an extensive consultation
exercise, previously led by MELE in its role of BROP. In 2012, following the
Government Decree on the bodies in the management and control system for the use
of European Union structural instruments in the Republic of Croatia (OJ 97/2012),
the process of further revision of the OPRC was taken over by the designated future
MA – Ministry of Regional Development and EU funds. This consultation exercise puts
into the practice one of the key principles in OP preparation and strategic planning
in general, i.e. the principle of partnership, as defined in Council Regulation
No. 1083/2006.
The partnership principle was introduced through the establishment of the OPRC Drafting
Group (DG) comprising foremostly of the representatives of the relevant public
institutions, the composition of which is presented in Annex 1. Additional meetings of
specific and wider sub-groups were also held for the purposes of discussion on particular
priority axes’ structure as well as measures, operations and indicative fields of eligible
activities. Following each meeting, written contributions and comments to the discussed
chapters were submitted to MRDEUF. Beside the overall contents of the PAs, the OP DG
Page 70 / 135
also discussed in more detail the number, scope and focus of the OPRC grant schemes
(Calls for Proposals) and the relevant strategic orientation of the OP.
The OP DG and its members also contributed to the collection of data related to the
sectoral analysis and information on the sectoral strategies. It also discussed at length the
various areas of potential support from the OPRC for the sectors of culture, tourism and
employment, and relevant synergies and demarcations. The contribution of the OP DG
consultations proved particularly useful in relation to defining the number, contents and
scope of the grant schemes.
The OP DG is aware of the fact that the partnership approach safeguards the transparency
of the programming process and enhances the chances for ultimate success of the
interventions supported by the OP.
In respect of these principles, the OP DG organised the first partnership consultation
meeting on 15 July 2009, where the first draft OP was presented and discussed. Following
the discussion, the OP DG’s members were given additional time for written comments,
which were expected to be the result of their own discussions with their respective
counterparts.
Public consultations on the NSRF and the relevant four OPs organized by former CODEF
took place on 18 June 2010. The list of invited stakeholders included regional and local
government representatives as well as representatives of public and scientific institutions.
On this occasion the NSRF and OPs were presented, including OPRC with its strategic
objective, goals, priority axes, measures, operations and potential beneficiaries.
Participants could provide comments and ask questions during the actual event and were
also invited to consult other relevant stakeholders, as they deemed appropriate, and
submit additional comments and questions in a written form via a designated email
address, within a month following the public consultations’ meeting. All of the received
queries were replied to by CODEF in cooperation with relevant line ministries and duly
taken into account regarding the draft OPRC.
In 2012, a “Shadow Monitoring Committee” for the OPRC 2007–2013 was established in
parallel with IPA IIIc Sectoral Monitoring Committee. The “Shadow” MC was composed of
key stakeholders necessary for the process of efficient management, representing all
parties pursuant to Article 11 of Council Regulation (EC) No 1083/2006; representatives of
the public authorities, the economic and social partners, bodies representing civil society,
NGOs and bodies responsible for promoting gender equality and other horizontal issues.
The stakeholders had the opportunity to find out which measures are planned to be
financed from the SCF within the scope of OPRC 2007–2013 and the planned project
selection criteria as well as all other key matter pertaining to this OP.
2.8. Horizontal themes
All efforts will be made to ensure that interventions under OPRC comply with European
horizontal principles of equal opportunities (gender equality, eliminating discrimination of
all kinds), sustainable development and an information society. In relationship with
other horizontal policies, OPRC will not have direct impact in terms of social protection
Page 71 / 135
systems and government transparency as it is predominantly a programme for enhancing
economic growth.
The horizontal policies will be considered at all stages of the programming, from the
project design and application, through project selection to implementation and, finally,
to project monitoring and evaluation. Each priority axis of the OPRC 2007 – 2013 will
contribute to the selected horizontal policies to a different extent. In accordance with the
expectations of the European Union, fulfilment of horizontal priorities will be monitored
both on programme and project level, as appropriate. The obligations of the bodies within
the institutional system of the OPRC regarding horizontal issues during all stages of the
implementation will be described in the rules for OP management and control, as well as
in the internal manuals.
2.8.1 Equal opportunities
Croatia fully endorses EU policies in the field of equal opportunities, and considers gender
equality a precondition for fulfilling the overall EU objectives of growth, employment and
social cohesion. Increased participation of women in the labour market offers both a
guarantee of their economic independence and a substantial contribution to economic
development and the sustainability of social protection systems. Croatia acknowledges that
it is crucial to pursue and reinforce gender mainstreaming in the area of employment and
social policies and to continue efforts to remove barriers to the full participation of men
and women in the labour market. In September 2011, the Croatian parliament adopted the
National Policy for the Promotion of Gender Equality for the period 2011-2015 (NN 88/11).
The objectives of the policy include the reduction of female unemployment and the
elimination of discrimination, the promotion of female entrepreneurship and stronger
enforcement of relevant labour laws.
The obligation to respect equal opportunities, as one of the EU horizontal priorities, is laid
down in the specification of conditions for the provision of assistance within the scope of
each priority axis either directly or indirectly. To ensure that this principle is taken into
account at all levels of the OPRC implementation, the following procedures shall be
adopted:
Information and publicity: The awareness to ensure and demonstrate promotion
and respect of gender equality and equal opportunities principles in the
implementation of OPRC projects shall be promoted during the information and
publicity campaigns which will be the part of calls for proposals processes.
Selection: To encourage projects to take full account of equal opportunities, the
principle will be included in the projects application and selection procedures. All
projects will be required to demonstrate how they will contribute to equal
opportunities, showing how the issue has been taken into account.
Contracting: The requirement to observe equality of opportunities during project
implementation shall be built into agreements with beneficiaries, and shall be
checked as part of the monitoring and reporting procedures.
Monitoring: To assess results achieved by the OPRC related to the equal
opportunities, indicators will be built into the project monitoring system. The
results will be reviewed quarterly by the Programme Monitoring Committee and
report shall be prepared on operations linked to equal opportunities within the
annual implementation reports.

Page 72 / 135
Evaluation: The Evaluation plan for OPRC envisages conducting an on-going
evaluation which would include the question to what extent the selection criteria,
the monitoring systems and procedures support the implementation of horizontal
principles?
2.8.2 Sustainable development
The European Council (EC) has set the strategic goal for the EU of becoming the most competitive and dynamic knowledge-based economy in the world, capable of sustainable economic growth with more and better jobs and greater social cohesion. EU sustainable development strategy builds on this political commitment and completes it by including an environmental dimension, recognising that in the long term, economic growth, social cohesion and environmental protection must go hand in hand. The EC considers sustainable development to be a key principle governing all the policies and activities of the EU. In 2005, the EC adopted the "Declaration on the Guiding Principles for Sustainable Development". Based on these guiding principles, in June 2006 the EC then adopted an ambitious and comprehensive Sustainable Development Strategy that was further reviewed in July 2009, which underlines commitment of the EU to mainstream sustainable development into a broad range of its policies.
Croatia’s efforts to comply with sustainable development principles are imprinted in strategic documents elaborated during recent years, the most relevant being the Strategic Development Framework, 2006-2013 (2006), the National Environmental Strategy (2002), the Energy Development Strategy of the Republic of Croatia (2002), the National Waste Management Strategy (2005), the National Action Plan for the Protection and Improvement of Air Quality 2008–2011, and the National Strategy and Action Plan for the Protection of Biological and Landscape Diversity (2008).
In line with the above described, innovative technologies introduced in the Croatian economic sector for instance will need to have either a positive or at least a neutral impact on climate change. Direct support will primarily be granted to those activities and projects that promote the upgrading of existing technologies in order to mitigate their environmental impact as well as to the introduction of environmentally friendly technologies.
Principles of sustainable development are included in all OPRC Priority axes and planned operations. The foreseen operations will support not only the acquisition of new equipment and technologies that are in compliance with environment regulations but also activities implementing European environmental standards and management systems by enterprises.
Special attention will be devoted to the reduction of the economy’s consumption of energy and raw materials; the encouragement of cooperation among companies, non-governmental organisations and scientific institutes for the development of more environmentally friendly production processes and products; complex support to meet EU requirements in the area of environmental protection and emissions; the implementation and subsequent certification of environmental management systems in companies, etc. All these activities are aimed at improving the effectiveness and competitiveness of enterprises and the economy, as well as at reducing the adverse effects on nature of fast-track economic development.
Stimulating the transfer of modern technologies and innovation adapted to European environmental standards will lead not only to an improvement in the competitiveness of Croatian enterprises but also to a reduction in their environmentally negative impact.
Activities supported under this OP will be assessed to ensure they do not make a negative impact on the environment. In addition, the Strategic Environmental Assessment has made a number of recommendations regarding the OP.
Page 73 / 135
To ensure that sustainability and environmental protection are taken into account throughout the programme implementation, the following procedures will be carried out:
Information and publicity: The promotion of environmental protection and
sustainable development will be included in information and publicity campaigns,
and in the materials provided during calls for proposals and tendering processes.
Selection: Projects co-financed by the Operational Programme will have to fully
respect the provisions of the Environmental Impact Assessment Directive, the
Strategic Environmental Assessment findings and Natura 2000 Directive. Appropriate
appraisal process and selection criteria will be applied at the projects’ selection
stage to ensure that the projects are compliant with the above-mentioned directives.
Applicants will be expected to prove that their project will not have a harmful
environmental impact, to certify that it is environmentally neutral and/or to
present how the project will make a positive contribution to sustainable
development.
Contracting: Any consequences of the appraisal of environmental impact during the
selection stage will be reflected in the agreements with beneficiaries, and will be
checked as part of the internal controls and audit process.
Monitoring: An overview will be prepared on the matter of implementing
environmental protection and sustainable development principles in the annual
implementation reports of the Operational Programme.
Evaluation: The impact of OPRC regarding environmental protection and sustainable development has been considered as part of its ex ante evaluation and will be included in future evaluations, where relevant.
2.8.3 Information society
Information Society policies address core objectives of the Lisbon Growth and Job Strategy. They drive productivity growth, create an open and competitive digital economy, stimulate innovation to tackle changes of globalization and demographic change. Technological progress and use of ICT enhance productivity growth and create new markets. Investment in ICT drives innovation and improves business processes as well as reduces companies’ administrative burden thus contributing to the overall increase of country’s competitiveness on the international markets. At the same time, use of ICT increases efficiency in public administration. Horizontally, the development of information society in Croatia will be supported by OPRC through activities enhancing availability of communication, technology and application of IT in the business related infrastructure. The OPRC will also contribute by stimulating better utilisation of ICT by both public bodies at national and regional level as well as private enterprises, in terms of promoting e-business usage. Additionally, under the OPRC the focus will also be on optimising specific services provided by the central state authorities by integrating the technology and applications infrastructure.
2.8.4. Climate change and disaster resilience
The impacts of climate change are becoming increasingly evident across Europe. Building capacity to cope with the inevitable impacts of climate change is necessary across key EU policy fields, and has a special importance for expenditure programmes, such as those financed by the Cohesion Policy. The disaster risk resilience, prevention and management
Page 74 / 135
will be promoted in the preparation and implementation of the relevant programmes. Due consideration will also be given to the resilience of infrastructure to natural and man-made disasters in compliance with any requirement which may be set out in the relevant Union legislation.
In line with the Technical guidance on integrating climate change adaptation in programmes and investments of the Cohesion policy COM(2013)135, possible climate impacts have been tackled within the programing phase i.e. the preparation of this OP in the following manner:
- by tackling climate change within the various areas covered in the analysis chapter of this OP, including SWOT;
- by providing opportunities for direct funding of climate change adaptation activities, such as for example, investments into energy efficiency of SMEs, that will help reduce greenhouse emissions that will ultimately aim for the prevention and mitigation of the climate change risks.
On the side of project implementation level the goal is to create the conditions for project beneficiaries to prepare proposals where climate change adaptation is taken into consideration. In parallel, it is also necessary for the relevant Managing Authority to monitor project implementation. This will be done by providing technical support and advice to project beneficiaries and by on-going monitoring of projects during and after implementation, with support from environmental partners/adaptation experts, wherever possible.
SECTION 3: PRIORITY AXES
3.1. Priority axis 1: Development and upgrading of the regional infrastructure and raising the attractiveness of regions
Priority axis 1 contributes to the achievements of the Programme’s specific objective “Increasing regional potential for economic development” through the following types of operations:
3.1.1 Support to public infrastructure
3.1.1.1 Main goals
Priority axis 1 of the OPRC is focused on setting up and developing public infrastructure, namely business- and tourism-related infrastructure in order to increase the attractiveness of Croatian regions for entrepreneurs and workers, inhabitants and visitors as well as to stimulate economic growth and job creation. Investments will focus on: improving the efficiency, capacity, quality and attractiveness of existing business zones, new and existing business incubators, and other business support entities grouping and servicing SMEs; and enhancing the infrastructural capacity leading to increased tourism activity.
In line with the specific objective “Increasing regional potential for economic
development” this priority axis will also target the preparation of larger infrastructure
projects with regional dimension and of intraregional importance targeting specific
regional development needs.
The specific goals of Priority axis 1 Development and upgrading of the regional
infrastructure and raising the attractiveness of regions are:
Support to the public authorities in creating and/or developing operational
business, R&D&I and tourism infrastructures providing scope for sustainable
Page 75 / 135
development of business, to attract investments, which will contribute to job
creation and decrease in socio-economic disparities between regions;
Enhancing the regional tourism potential to develop and market sustainable and
diversified, territorially specific and higher value-added tourist products;
Development of project pipeline; providing support for preparation of larger
infrastructure projects with regional dimension for the next programming period to
ensure continuous development of regions.
3.1.1.2. Expected impacts
The successful implementation of interventions under Priority axis 1 is expected to
increase the overall competitiveness of Croatian regions and contribute to holding-back
growing regional disparities by enhancing regions’ attractiveness for entrepreneurs,
workers, visitors and inhabitants.
More specifically, this priority axis will support the development potential of the Croatian
regions by contributing to:
Higher attractiveness for investors;
Generating opportunities for employment;
Establishing new SMEs;
Higher attractiveness for local inhabitants to live in particular regions due to the
improved economic and social conditions (decrease of emigration at nuts 3 level);
Enrichment and diversification of the Croatian tourism offer;
Enhancing intraregional cooperation on the NUTS 2 level.
It is envisaged that business zones with enhanced infrastructure will be able to provide
additional services, generating added value to potential investors in the form of strategic
training centres, technology transfer centres with incubation centres, research and
development centres, business, logistics and distribution centres, centres of excellence,
etc. and additional value added services thus increasing the occupancy rates and generating
new employment.
Another expected impact is contribution to increasing the attractiveness of tourist
destinations, prolonging the tourist season by attracting tourists all year round, supporting
tourism also on the mainland, and increasing the number and improving the structure of
foreign visitors. Under this operation, cultural heritage objects of national interest will be
widely integrated in the social and economic life of the regions.
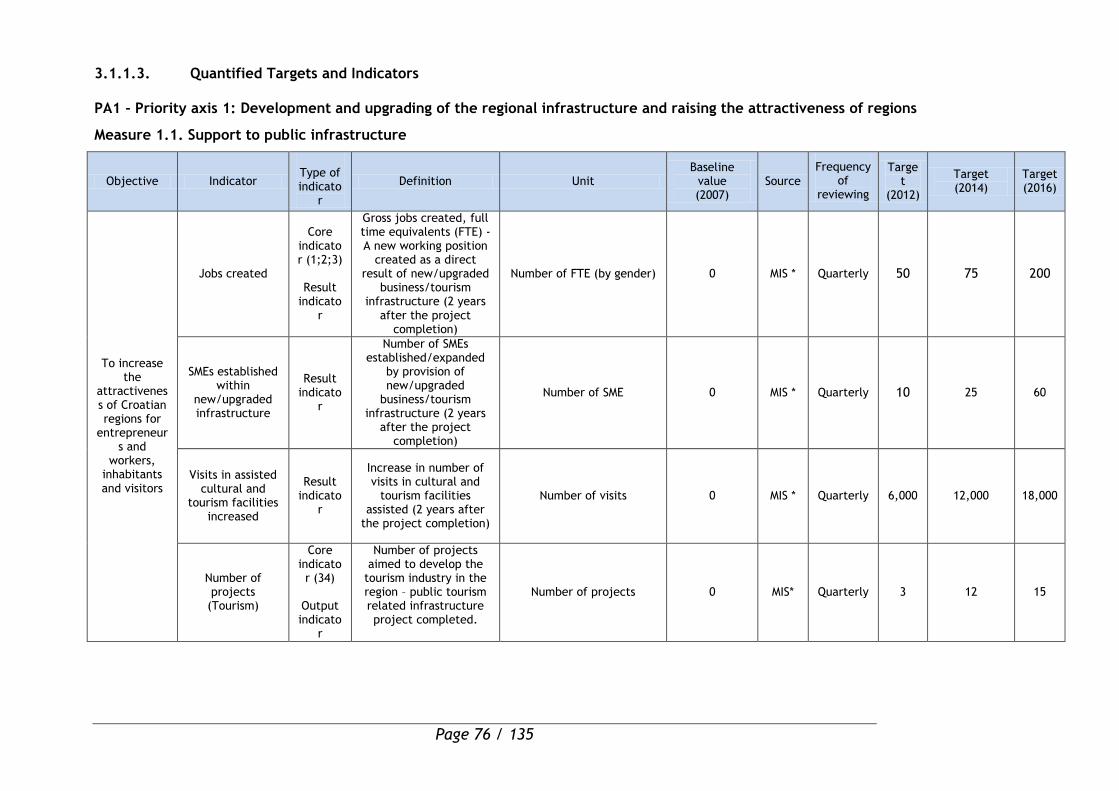
Page 76 / 135
3.1.1.3. Quantified Targets and Indicators
PA1 - Priority axis 1: Development and upgrading of the regional infrastructure and raising the attractiveness of regions
Measure 1.1. Support to public infrastructure
Objective Indicator
Type of indicato
r
Definition Unit Baseline
value (2007)
Source
Frequency of
reviewing
Target
(2012)
Target (2014)
Target (2016)
To increase the
attractiveness of Croatian regions for
entrepreneurs and
workers, inhabitants and visitors
Jobs created
Core indicator (1;2;3)
Result
indicator
Gross jobs created, full time equivalents (FTE) - A new working position
created as a direct result of new/upgraded
business/tourism infrastructure (2 years
after the project completion)
Number of FTE (by gender) 0 MIS * Quarterly 50 75 200
SMEs established within
new/upgraded infrastructure
Result indicato
r
Number of SMEs established/expanded
by provision of new/upgraded
business/tourism infrastructure (2 years
after the project completion)
Number of SME 0 MIS * Quarterly 10 25 60
Visits in assisted cultural and
tourism facilities increased
Result indicato
r
Increase in number of visits in cultural and
tourism facilities assisted (2 years after
the project completion)
Number of visits 0 MIS * Quarterly 6,000 12,000 18,000
Number of projects
(Tourism)
Core indicator (34)
Output indicato
r
Number of projects aimed to develop the
tourism industry in the region – public tourism related infrastructure project completed.
Number of projects 0 MIS* Quarterly 3 12 15
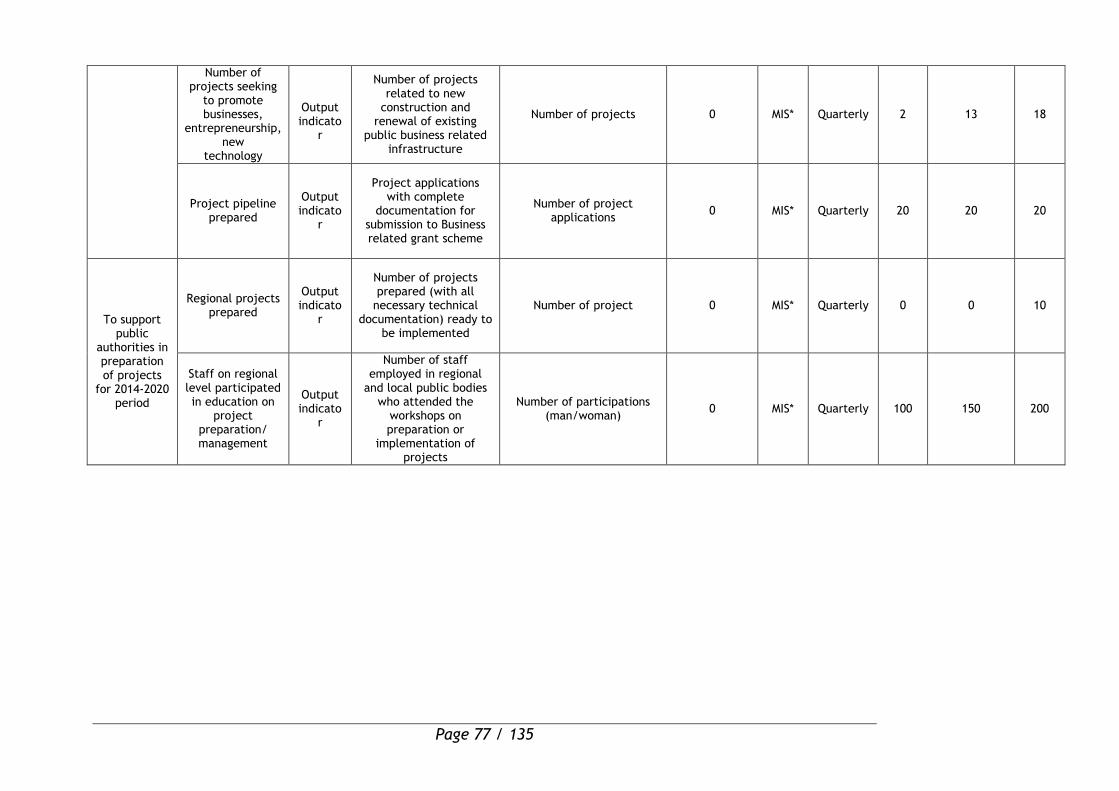
Page 77 / 135
Number of projects seeking
to promote businesses,
entrepreneurship, new
technology
Output indicato
r
Number of projects related to new
construction and renewal of existing
public business related infrastructure
Number of projects 0 MIS* Quarterly 2 13 18
Project pipeline prepared
Output indicato
r
Project applications with complete
documentation for submission to Business related grant scheme
Number of project applications
0 MIS* Quarterly 20 20 20
To support public
authorities in preparation of projects
for 2014-2020 period
Regional projects prepared
Output indicato
r
Number of projects prepared (with all
necessary technical documentation) ready to
be implemented
Number of project 0 MIS* Quarterly 0 0 10
Staff on regional level participated in education on
project preparation/ management
Output indicato
r
Number of staff employed in regional
and local public bodies who attended the
workshops on preparation or
implementation of projects
Number of participations (man/woman)
0 MIS* Quarterly 100 150 200
78
3.1.1.4 Indicative list of operations
This intervention is to be implemented through the following types of operations aiming at
support to public business and tourism infrastructure:
Investments into business infrastructure such as business incubators, equipping of
already existing business zones and other business support institutions with all
required infrastructure necessary to attract investments with employment and
growth potential;
Interventions in the field of public tourism infrastructure including cultural heritage
objects, with focus mostly on the construction of new and
reconstruction/modernisation of existing capacities, improvement of public spaces
within tourist destinations, upgrading and diversification of facilities and features
within the tourist locations;
Preparation of projects and assistance during their implementation, with a focus on
the preparation of larger infrastructure projects with regional dimension for the
next programming period.
3.1.1.5. Indicative list of beneficiaries/target groups
Potential beneficiaries of the interventions under PA 1 of the OPRC are:
Ministry in charge of regional development;
Self-governing units at the county and municipal level and their development
agencies;
National/regional/local public institutions or associations;
Other regional business support organisations and institutions representing the
business community, industries, professional associations, chamber of economy,
chamber of trade and crafts, association of cooperatives, etc.;
Public companies owned by regional/local self-government units;
National/regional/local tourism boards and associations;
Non-profit organisations from the private sector such as NGOs, foundations and
associations, including professional associations, and other;
Nationally established bodies with local jurisdiction91; and
SMEs – as a target group (but not direct beneficiary under this PA).
91 National and Nature Parks.
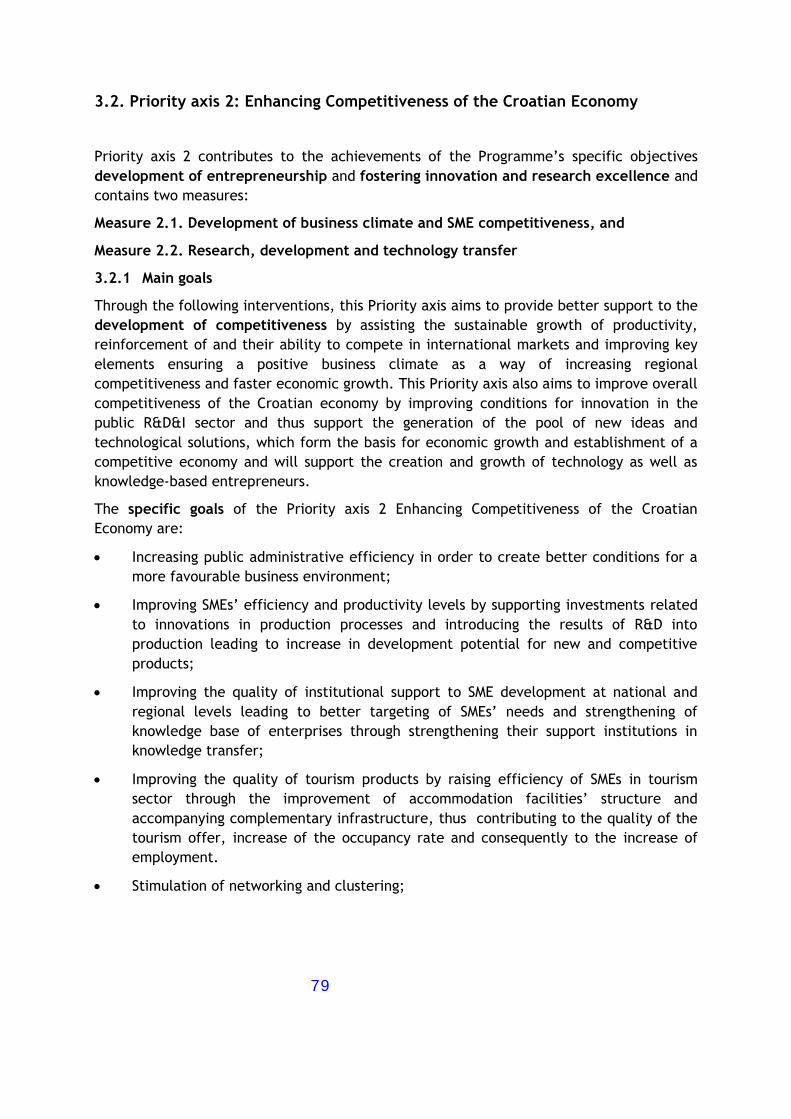
79
3.2. Priority axis 2: Enhancing Competitiveness of the Croatian Economy
Priority axis 2 contributes to the achievements of the Programme’s specific objectives
development of entrepreneurship and fostering innovation and research excellence and
contains two measures:
Measure 2.1. Development of business climate and SME competitiveness, and
Measure 2.2. Research, development and technology transfer
3.2.1 Main goals
Through the following interventions, this Priority axis aims to provide better support to the
development of competitiveness by assisting the sustainable growth of productivity,
reinforcement of and their ability to compete in international markets and improving key
elements ensuring a positive business climate as a way of increasing regional
competitiveness and faster economic growth. This Priority axis also aims to improve overall
competitiveness of the Croatian economy by improving conditions for innovation in the
public R&D&I sector and thus support the generation of the pool of new ideas and
technological solutions, which form the basis for economic growth and establishment of a
competitive economy and will support the creation and growth of technology as well as
knowledge-based entrepreneurs.
The specific goals of the Priority axis 2 Enhancing Competitiveness of the Croatian
Economy are:
Increasing public administrative efficiency in order to create better conditions for a
more favourable business environment;
Improving SMEs’ efficiency and productivity levels by supporting investments related
to innovations in production processes and introducing the results of R&D into
production leading to increase in development potential for new and competitive
products;
Improving the quality of institutional support to SME development at national and
regional levels leading to better targeting of SMEs’ needs and strengthening of
knowledge base of enterprises through strengthening their support institutions in
knowledge transfer;
Improving the quality of tourism products by raising efficiency of SMEs in tourism
sector through the improvement of accommodation facilities’ structure and
accompanying complementary infrastructure, thus contributing to the quality of the
tourism offer, increase of the occupancy rate and consequently to the increase of
employment.
Stimulation of networking and clustering;

80
Building capacities of higher education institutions and public research organisations
for technology transfer activities and enhanced cooperation with industry;
Bringing research, innovation and research excellence activities closer to the needs
of the Croatian economy;
Improving overall conditions for R&D&I through infrastructural investments and
investments in necessary research equipment;
Enhancing capacities for Structural Funds project preparation and building up the
project pipeline for the next financial perspective.
3.2.2 Expected impacts
Interventions under Priority axis 2 of the OPRC are expected to increase the
competitiveness of the Croatian regions through direct and indirect support to SMEs and
public higher education institutions and research organisations as a factor of sustainable
economic growth. They are expected to establish a clear path for Croatian development
based on research and innovation and produce a higher implementation of innovative and
advanced technologies in business resulting in increased productivity and efficiency, added
value, and motivation for development of new businesses as well as to improve the quality
of institutional support to SME development at national and regional levels leading to
better targeting of SMEs’ needs.
More specifically, the investments of the OPRC will improve the conditions for successful
development of entrepreneurship based on research and innovation and increased
competitiveness i.e. should result in:
Strengthened capacities and capabilities of SMEs service providers making quality
business advisory services at all levels more accessible to SMEs;
Strengthened competitive ability of SMEs at the national and regional level;
Improved, diversified and expanded tourism destination products and offer and
increased integration with the natural resources, cultural heritage and other
manmade potential for the development of tourism;
Strengthened capacities of the public R&D&I sector for technology transfer;
Improved conditions for the development of a knowledge-based economy through
technology transfers and support to research, technology development and
innovation
Established and improved research and innovation related infrastructure;
Strengthened administrative capacities and preparedness for the usage of structural
instruments for R&D and Innovations (project documentation and project pipeline
prepared).
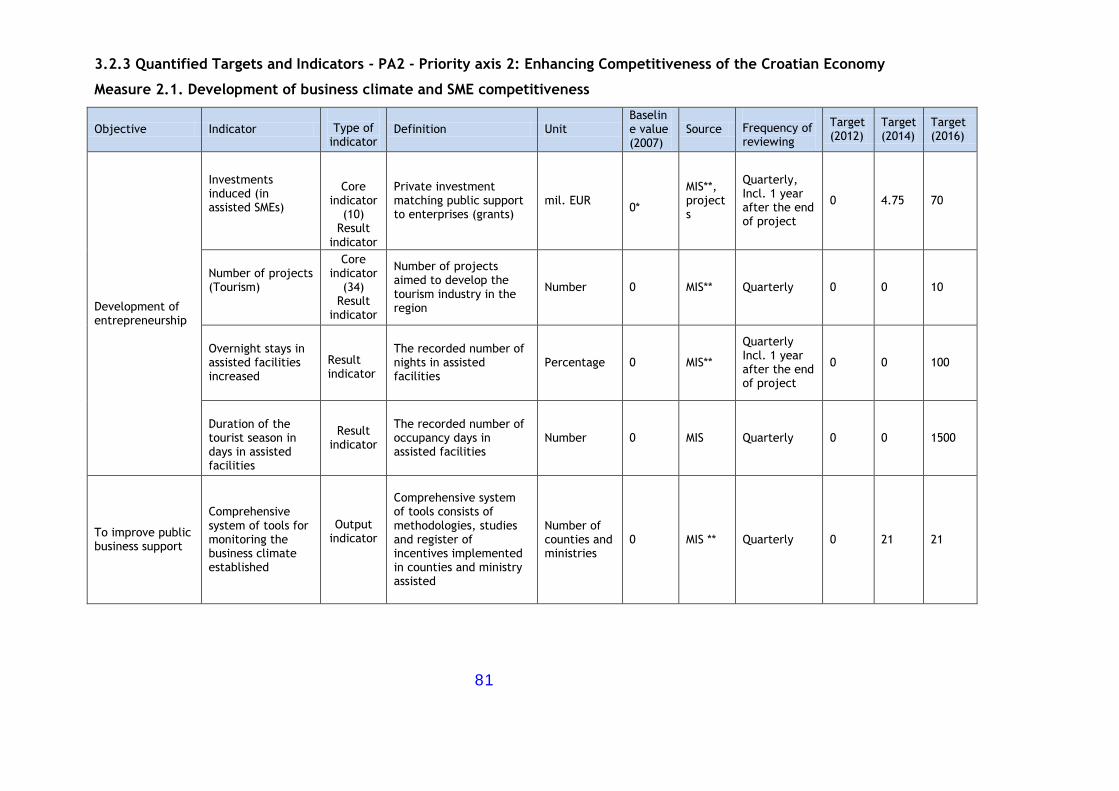
81
3.2.3 Quantified Targets and Indicators - PA2 - Priority axis 2: Enhancing Competitiveness of the Croatian Economy
Measure 2.1. Development of business climate and SME competitiveness
Objective Indicator
Type of
indicator Definition Unit
Baseline value (2007)
Source
Frequency of reviewing
Target (2012)
Target (2014)
Target (2016)
Development of entrepreneurship
Investments induced (in assisted SMEs)
Core indicator
(10) Result
indicator
Private investment matching public support to enterprises (grants)
mil. EUR 0*
MIS**, projects
Quarterly, Incl. 1 year after the end of project
0 4.75 70
Number of projects (Tourism)
Core indicator
(34) Result
indicator
Number of projects aimed to develop the tourism industry in the region
Number 0 MIS** Quarterly 0 0 10
Overnight stays in assisted facilities increased
Result indicator
The recorded number of nights in assisted facilities
Percentage 0 MIS**
Quarterly Incl. 1 year after the end of project
0 0 100
Duration of the tourist season in days in assisted facilities
Result indicator
The recorded number of occupancy days in assisted facilities
Number 0 MIS Quarterly 0 0 1500
To improve public business support
Comprehensive system of tools for monitoring the business climate established
Output indicator
Comprehensive system of tools consists of methodologies, studies and register of incentives implemented in counties and ministry assisted
Number of counties and ministries
0 MIS ** Quarterly 0 21 21
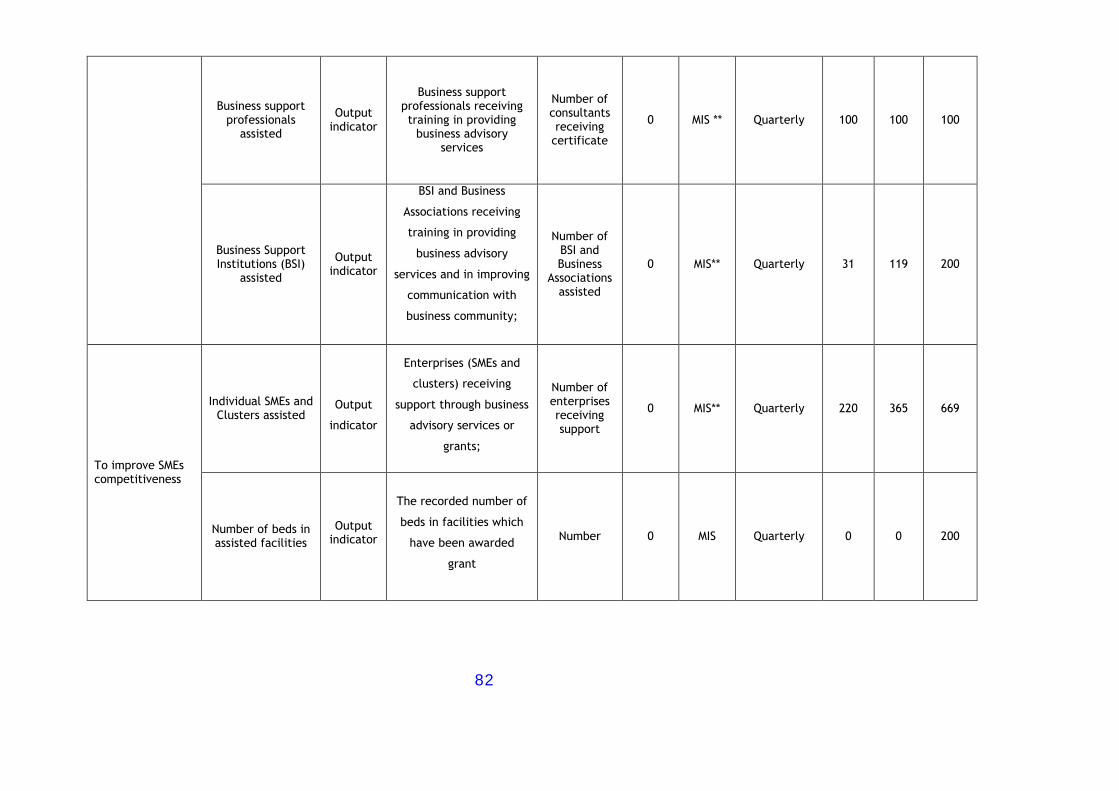
82
Business support professionals
assisted
Output indicator
Business support professionals receiving training in providing
business advisory services
Number of consultants receiving
certificate
0 MIS ** Quarterly 100 100 100
Business Support Institutions (BSI)
assisted
Output indicator
BSI and Business
Associations receiving
training in providing
business advisory
services and in improving
communication with
business community;
Number of BSI and Business
Associations assisted
0 MIS** Quarterly 31 119 200
To improve SMEs competitiveness
Individual SMEs and Clusters assisted
Output
indicator
Enterprises (SMEs and
clusters) receiving
support through business
advisory services or
grants;
Number of enterprises receiving support
0 MIS** Quarterly 220 365 669
Number of beds in assisted facilities
Output indicator
The recorded number of
beds in facilities which
have been awarded
grant
Number 0 MIS Quarterly 0 0 200
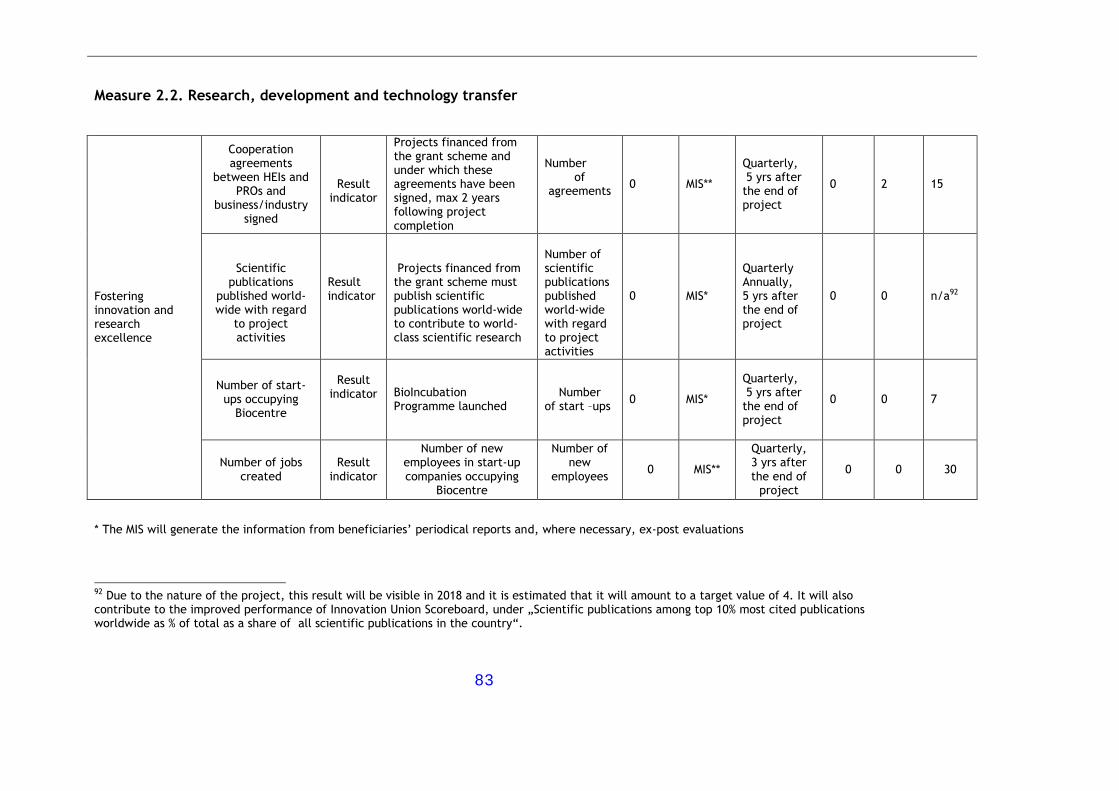
83
Measure 2.2. Research, development and technology transfer
Fostering innovation and research excellence
Cooperation agreements
between HEIs and PROs and
business/industry signed
Result indicator
Projects financed from the grant scheme and under which these agreements have been signed, max 2 years following project completion
Number of
agreements
0 MIS**
Quarterly, 5 yrs after the end of project
0 2
15
Scientific
publications published world-wide with regard
to project activities
Result indicator
Projects financed from the grant scheme must publish scientific publications world-wide to contribute to world-class scientific research
Number of scientific publications published world-wide with regard to project activities
0 MIS*
Quarterly Annually, 5 yrs after the end of project
0 0 n/a92
Number of start-ups occupying
Biocentre
Result
indicator BioIncubation Programme launched
Number of start –ups
0 MIS*
Quarterly, 5 yrs after the end of project
0 0 7
Number of jobs created
Result indicator
Number of new employees in start-up companies occupying
Biocentre
Number of new
employees
0 MIS**
Quarterly, 3 yrs after the end of
project
0 0 30
* The MIS will generate the information from beneficiaries’ periodical reports and, where necessary, ex-post evaluations
92 Due to the nature of the project, this result will be visible in 2018 and it is estimated that it will amount to a target value of 4. It will also contribute to the improved performance of Innovation Union Scoreboard, under „Scientific publications among top 10% most cited publications worldwide as % of total as a share of all scientific publications in the country“.
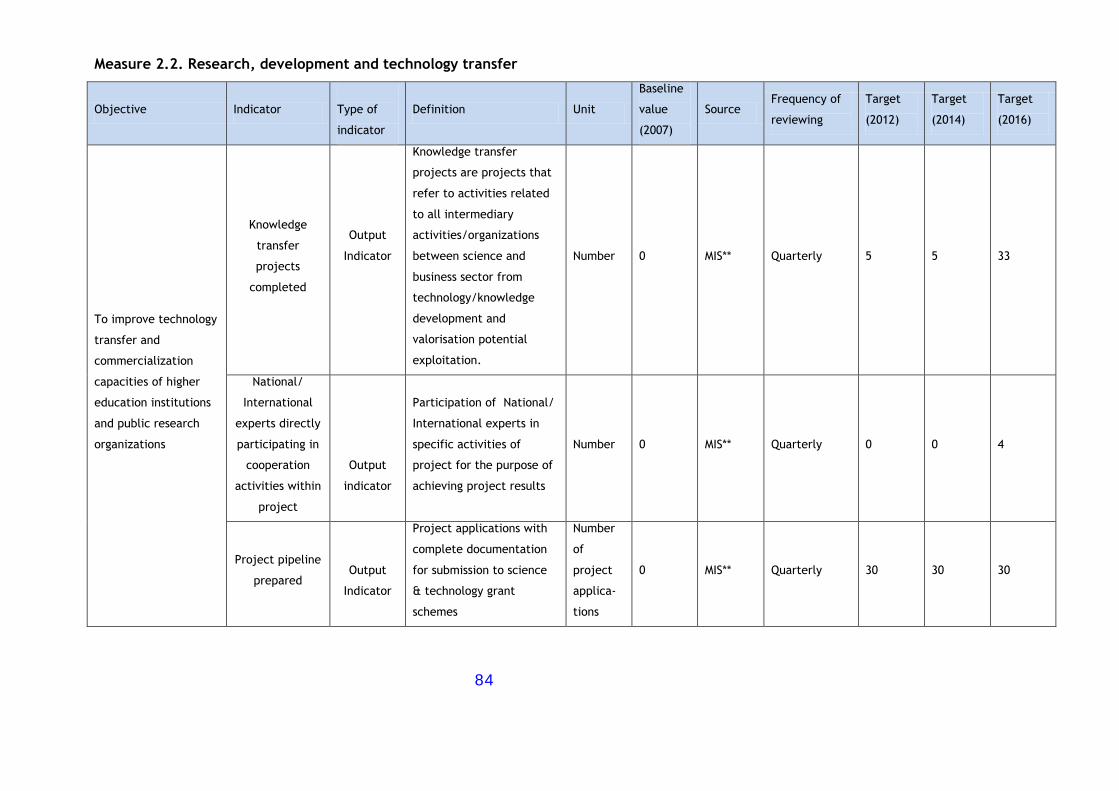
84
Measure 2.2. Research, development and technology transfer
Objective Indicator
Type of
indicator
Definition Unit
Baseline
value
(2007)
Source Frequency of
reviewing
Target
(2012)
Target
(2014)
Target
(2016)
To improve technology
transfer and
commercialization
capacities of higher
education institutions
and public research
organizations
Knowledge
transfer
projects
completed
Output
Indicator
Knowledge transfer
projects are projects that
refer to activities related
to all intermediary
activities/organizations
between science and
business sector from
technology/knowledge
development and
valorisation potential
exploitation.
Number 0 MIS** Quarterly 5 5 33
National/
International
experts directly
participating in
cooperation
activities within
project
Output
indicator
Participation of National/
International experts in
specific activities of
project for the purpose of
achieving project results
Number 0 MIS** Quarterly 0 0 4
Project pipeline
prepared
Output
Indicator
Project applications with
complete documentation
for submission to science
& technology grant
schemes
Number
of
project
applica-
tions
0 MIS** Quarterly 30 30 30
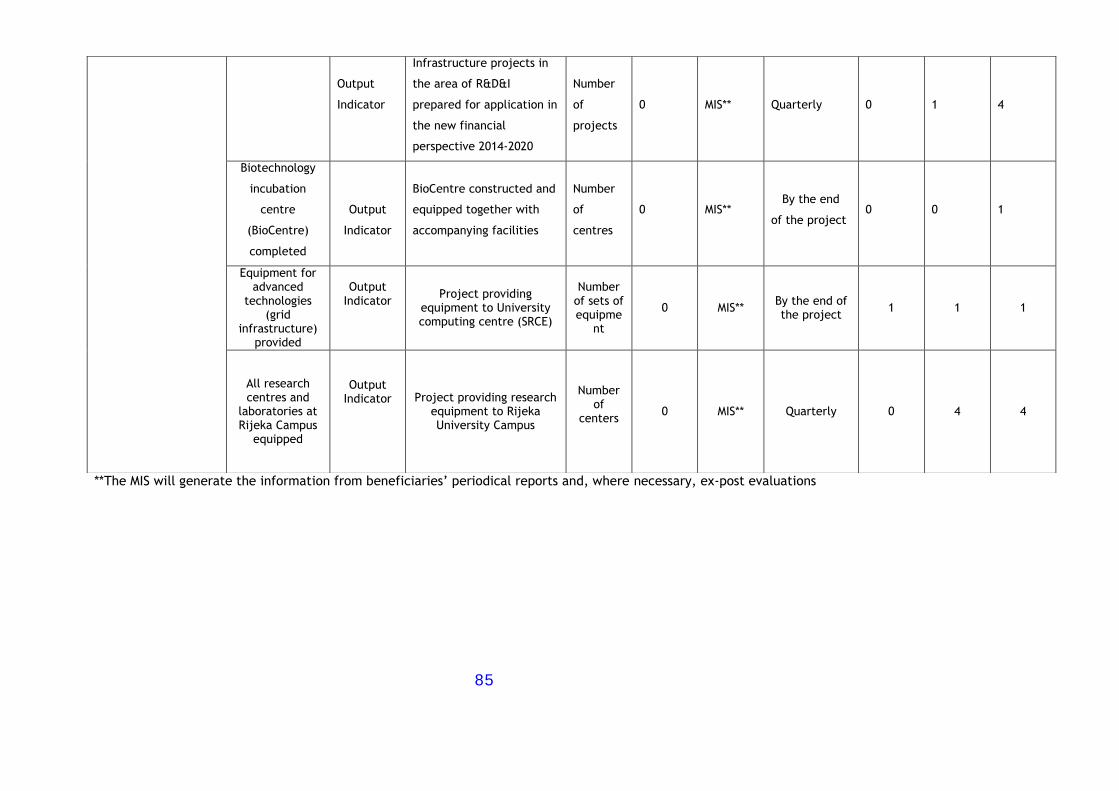
85
**The MIS will generate the information from beneficiaries’ periodical reports and, where necessary, ex-post evaluations
Output
Indicator
Infrastructure projects in
the area of R&D&I
prepared for application in
the new financial
perspective 2014-2020
Number
of
projects
0 MIS** Quarterly 0 1 4
Biotechnology
incubation
centre
(BioCentre)
completed
Output
Indicator
BioCentre constructed and
equipped together with
accompanying facilities
Number
of
centres
0 MIS** By the end
of the project 0 0 1
Equipment for advanced
technologies (grid
infrastructure) provided
Output
Indicator Project providing
equipment to University computing centre (SRCE)
Number of sets of equipme
nt
0 MIS** By the end of the project
1 1 1
All research centres and
laboratories at Rijeka Campus
equipped
Output Indicator Project providing research
equipment to Rijeka University Campus
Number of
centers
0 MIS** Quarterly 0 4 4
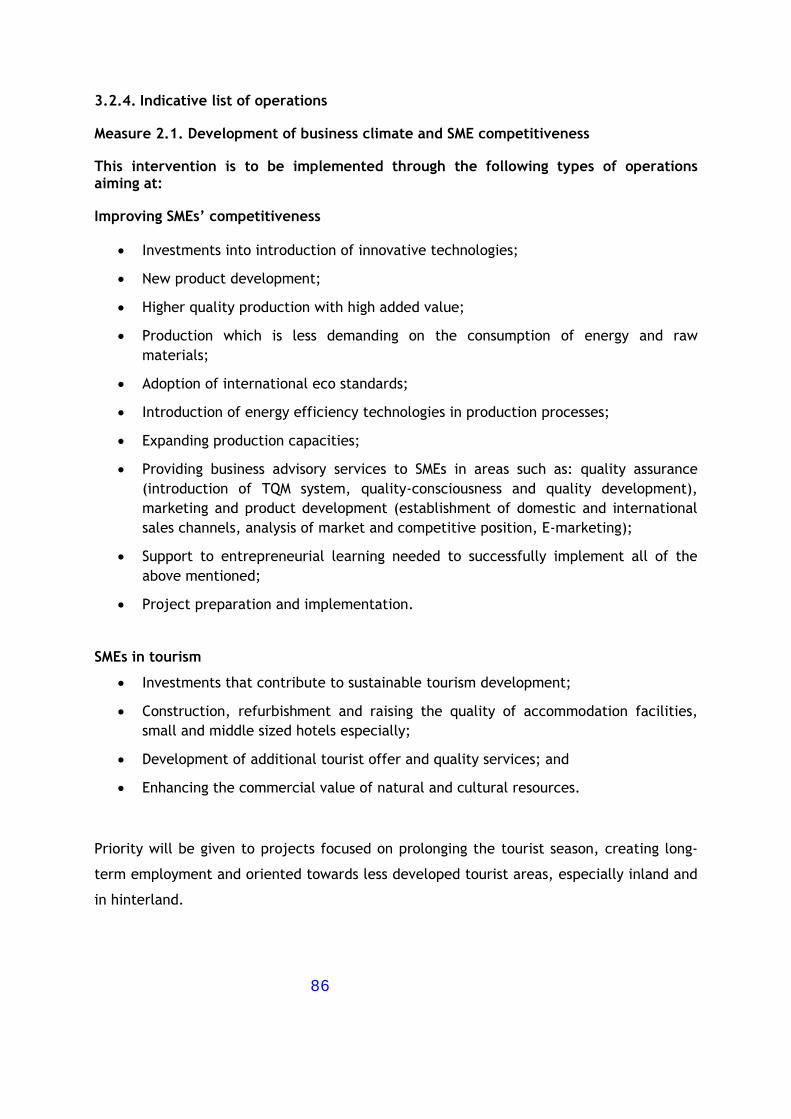
86
3.2.4. Indicative list of operations
Measure 2.1. Development of business climate and SME competitiveness
This intervention is to be implemented through the following types of operations aiming at:
Improving SMEs’ competitiveness
Investments into introduction of innovative technologies;
New product development;
Higher quality production with high added value;
Production which is less demanding on the consumption of energy and raw
materials;
Adoption of international eco standards;
Introduction of energy efficiency technologies in production processes;
Expanding production capacities;
Providing business advisory services to SMEs in areas such as: quality assurance
(introduction of TQM system, quality-consciousness and quality development),
marketing and product development (establishment of domestic and international
sales channels, analysis of market and competitive position, E-marketing);
Support to entrepreneurial learning needed to successfully implement all of the
above mentioned;
Project preparation and implementation.
SMEs in tourism
Investments that contribute to sustainable tourism development;
Construction, refurbishment and raising the quality of accommodation facilities,
small and middle sized hotels especially;
Development of additional tourist offer and quality services; and
Enhancing the commercial value of natural and cultural resources.
Priority will be given to projects focused on prolonging the tourist season, creating long-
term employment and oriented towards less developed tourist areas, especially inland and
in hinterland.

87
Improving public business support
Developing targeted SME policies and incentive programmes;
Promotion of entrepreneurial skills, mind set-up and active environment;
Promotion of e-business solutions;
Encouraging cooperation between businesses and cooperation of businesses and
public, education and research sectors through enhancement of clusters;
Developing effective business support capacities relative to investment promotion
at the regional level; and
Communication with businesses regarding the future impact of key regulatory areas
in Croatia and EU.
Measure 2.2. Research, development and technology transfer
Support to development of technology transfer capacities
Strengthening capacities of public higher education institutions and public research
organisations for technology transfer activities;
Enhanced science-industry collaboration;
Strengthening research and development in public R&D sector through supporting
the world class scientific research within public research organizations and to
increase the possibilities for exploitation of knowledge generated within the public
research sector;
To orient the research towards the needs of economy, by supporting research,
development and innovation projects and in cooperation with partners from private
business sector.
Support to development of R&D infrastructure
The establishment of new and/or modernization of existing research infrastructure,
including investments in necessary research equipment;
Provision of infrastructure and access to technology and business development
services, particularly for high value added sectors;
Bringing the HEI and PRO closer to the economic and market needs through
projects;
Support to development of project pipeline through development of all project
documentation needed for successful application and further implementation of
R&D&I infrastructure projects and grant schemes.
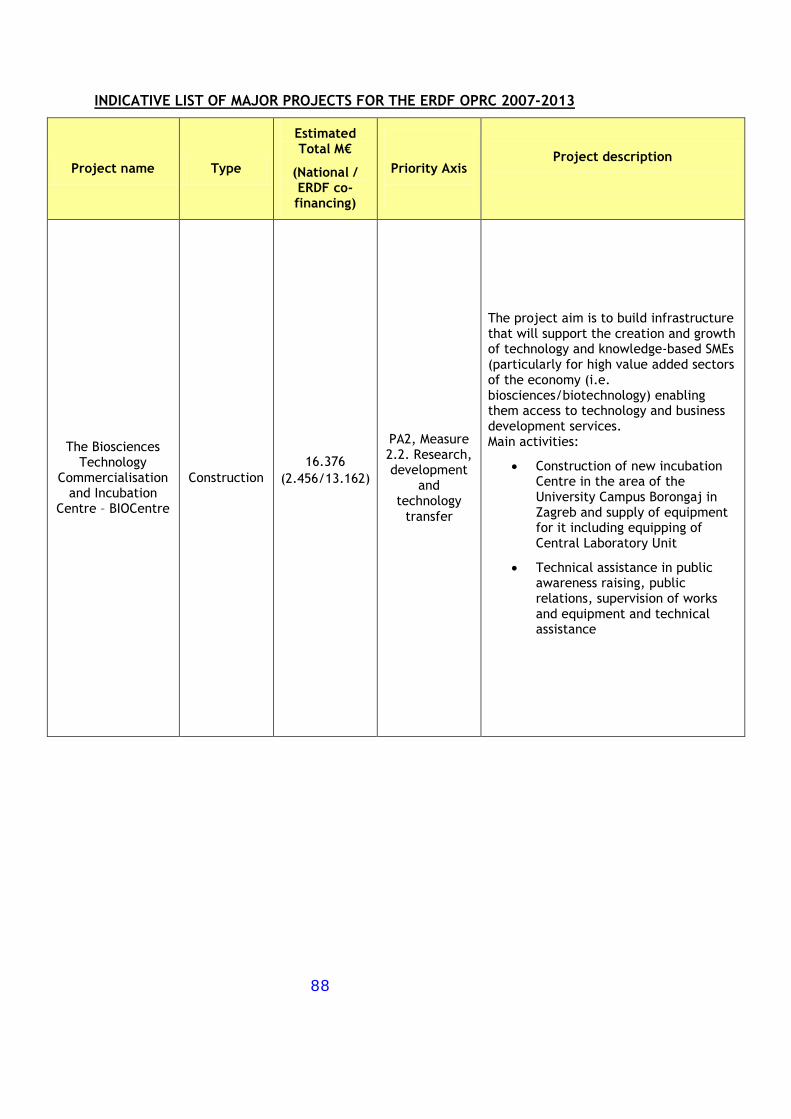
88
INDICATIVE LIST OF MAJOR PROJECTS FOR THE ERDF OPRC 2007-2013
Project name Type
Estimated Total M€
(National / ERDF co-financing)
Priority Axis
Project description
The Biosciences Technology
Commercialisation and Incubation
Centre – BIOCentre
Construction
16.376
(2.456/13.162)
PA2, Measure 2.2. Research, development
and technology
transfer
The project aim is to build infrastructure that will support the creation and growth of technology and knowledge-based SMEs (particularly for high value added sectors of the economy (i.e. biosciences/biotechnology) enabling them access to technology and business development services. Main activities:
Construction of new incubation Centre in the area of the University Campus Borongaj in Zagreb and supply of equipment for it including equipping of Central Laboratory Unit
Technical assistance in public awareness raising, public relations, supervision of works and equipment and technical assistance
89
3.2.5. Indicative list of beneficiaries/target groups
Potential beneficiaries of the interventions under Priority axis 2 of the OPRC are:
Private businesses entities, that conduct business in eligible business sectors and
are registered in Croatia;
Clusters;
Public authorities at the central level (ministries and agencies);
Regional/local public institutions or associations;
Other business support organisations and institutions representing the business
community, professional associations (e.g. Chamber of Economy, Chamber of
Trades and Crafts, Association of Cooperatives, etc);
Business support service professionals;
County administrations and their partners.
Higher education institutions (HEI);
Public research organizations (PRO);
Business Innovation Agency of Croatia – BICRO.
Cross-financing
In accordance to Article 34(2) Council Regulation (EC) No 1083/2006 of 11 July 2006 laying
down general provisions on the European Regional Development Fund (ERDF), the European
Social Fund (ESF) and the Cohesion Fund (CF) and repealing Regulation (EC) No 1260/1999,
projects may contain a limited proportion of activities falling within the scope of
assistance from the ESF, provided that they are necessary for the satisfactory
implementation of the projects and are directly linked to them. The proportion of costs for
ESF type of activities under Priority Axis 1 and 2 should not be more than 10% of total
project eligible costs for projects.
90
3.3. Priority axis 3: Technical Assistance
Priority axis 3 and Measure 3.1: OP management and capacity building are designed to
support the management of operations, ensure effective implementation of the OP and
facilitate the preparations for the next programming period.
3.3.1. Main goal
The main goal of the PA is to ensure a high level of absorption rates by providing support
to efficient and effective OP management.
More specifically, it shall focus on development of institutional capacity for managing and
absorbing EU funding in accordance with EU rules, regulations and procedures and
applicable national legislation, as well as on implementation of actions aimed at sustaining
the programming of future interventions in areas defined with the OP strategy and its
objectives.
The main goal of this priority will be achieved by delivering the following specific goals:
Ensuring necessary human resources through adequate retention policy that
will ensure stable and lasting employment of the staff responsible for the
managing and implementation of OPRC;
Enhancing capacities of bodies within OP’s management and control system
(MA, IBs) by providing assistance in introducing and implementing appropriate
control and management procedures and activities in accordance with the
provisions of EU Regulations;
Assistance in programming for the next financial perspective, identification of
project pipelines and project preparation;
Enhancing capacities of relevant institutions (MA, IBs) for result-oriented
monitoring and evaluation functions
Ensuring the consistency of implemented operations with Union regulations
and policies; and
Implementation of ICT instruments and systems to facilitate the efficient
management and implementation of operations.
3.3.2 Expected impacts
PA3 will contribute to increased capacities of the bodies within OPRC management and
control system for successful implementation, monitoring and evaluation of the OPRC
consequently contributing to the efficient absorption of the allocated funds and
achievement of targeted results.
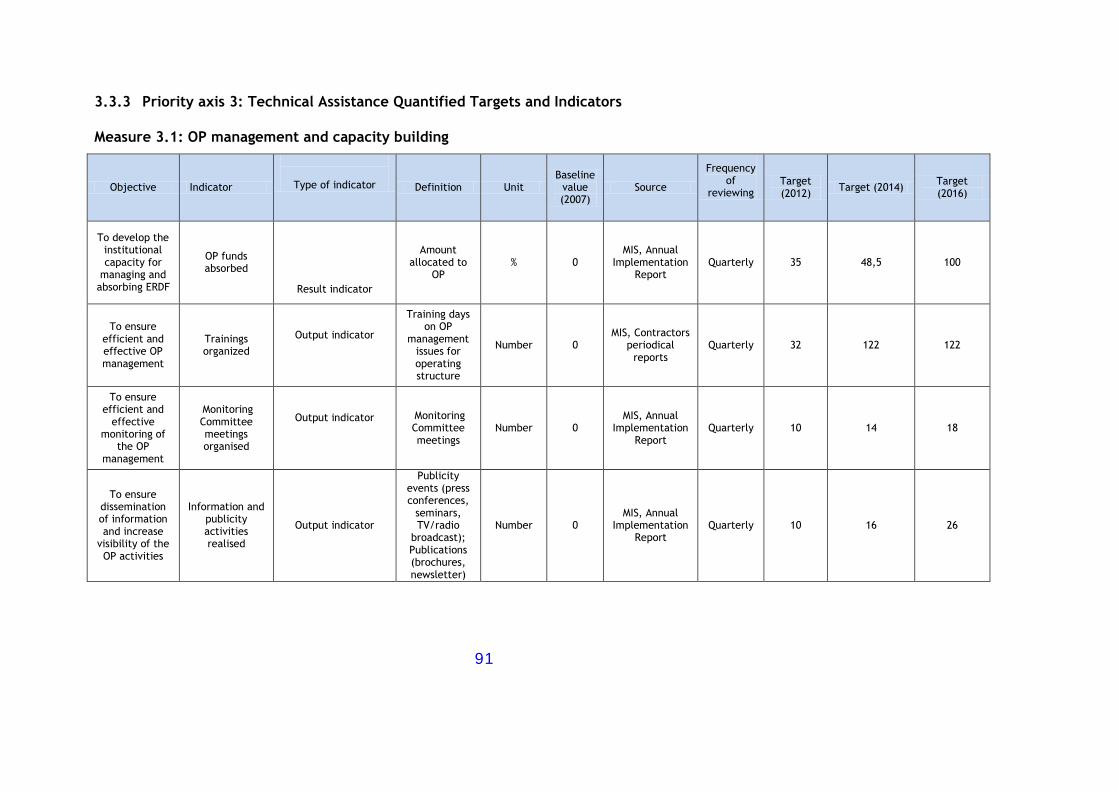
91
3.3.3 Priority axis 3: Technical Assistance Quantified Targets and Indicators
Measure 3.1: OP management and capacity building
Objective Indicator
Type of indicator Definition Unit Baseline
value (2007)
Source
Frequency of
reviewing Target (2012)
Target (2014) Target (2016)
To develop the institutional capacity for
managing and absorbing ERDF
OP funds absorbed
Result indicator
Amount allocated to
OP % 0
MIS, Annual Implementation
Report Quarterly 35 48,5 100
To ensure efficient and effective OP management
Trainings organized
Output indicator
Training days on OP
management issues for operating structure
Number 0 MIS, Contractors
periodical reports
Quarterly 32 122 122
To ensure efficient and
effective monitoring of
the OP management
Monitoring Committee meetings organised
Output indicator Monitoring Committee meetings
Number 0 MIS, Annual
Implementation Report
Quarterly 10 14 18
To ensure dissemination of information and increase
visibility of the OP activities
Information and publicity activities realised
Output indicator
Publicity events (press conferences,
seminars, TV/radio
broadcast); Publications (brochures, newsletter)
Number 0 MIS, Annual
Implementation Report
Quarterly 10 16 26
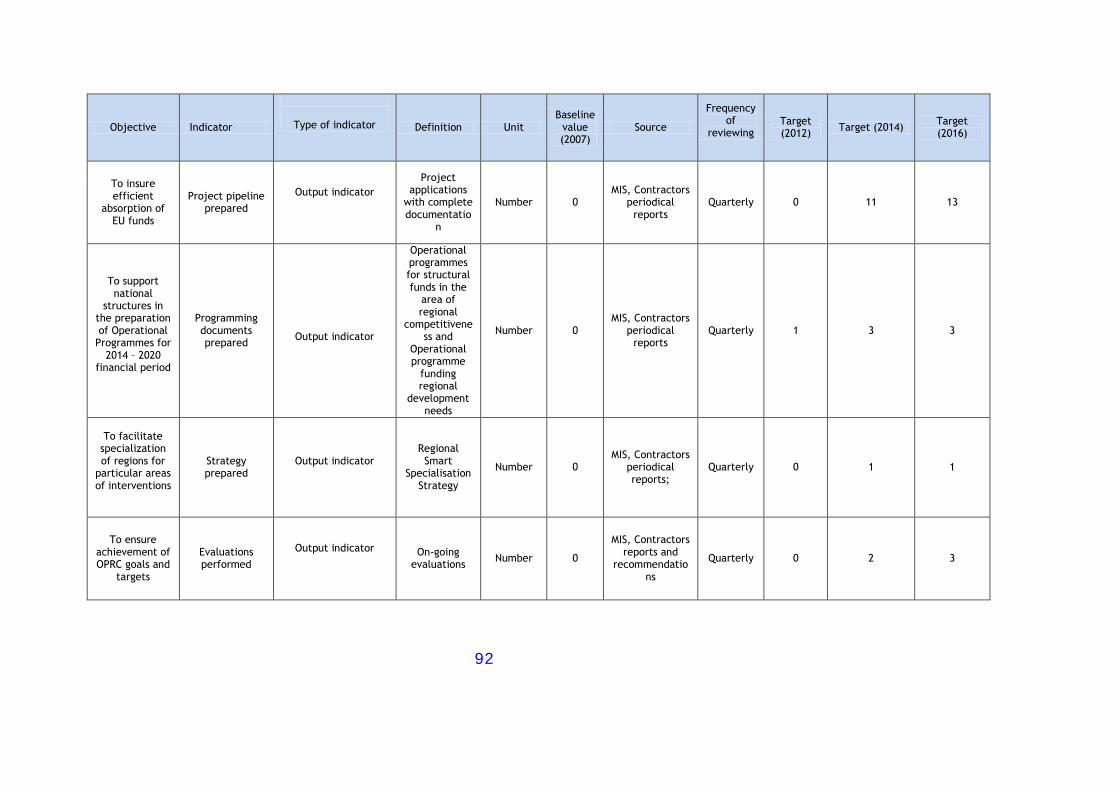
92
Objective Indicator
Type of indicator Definition Unit Baseline
value (2007)
Source
Frequency of
reviewing Target (2012)
Target (2014) Target (2016)
To insure efficient
absorption of EU funds
Project pipeline prepared
Output indicator
Project applications
with complete documentatio
n
Number 0 MIS, Contractors
periodical reports
Quarterly 0 11 13
To support national
structures in the preparation of Operational
Programmes for 2014 – 2020
financial period
Programming documents prepared
Output indicator
Operational programmes for structural funds in the
area of regional
competitiveness and
Operational programme
funding regional
development needs
Number 0 MIS, Contractors
periodical reports
Quarterly 1 3 3
To facilitate
specialization of regions for
particular areas of interventions
Strategy prepared
Output indicator Regional Smart
Specialisation Strategy
Number 0 MIS, Contractors
periodical reports;
Quarterly 0 1 1
To ensure achievement of OPRC goals and
targets
Evaluations performed
Output indicator On-going evaluations
Number 0
MIS, Contractors reports and
recommendations
Quarterly 0 2 3
93
3.3.4 Indicative list of operations
Measure 3.1: OP management and capacity building
The objectives of TA priority will be achieved through financing operations related to:
Administration (OS’ staff remuneration);
Building capacities for result-oriented monitoring and evaluation functions;
Conducting relevant on-going evaluations of the OP as per national Evaluation
Strategy and OP RC Evaluation Plan;
Appraisal and selection of operations;
Supporting the implementation of the operations;
Information and publicity at OP level and creation and maintenance of information
desks;
Dissemination of funding opportunities and projects’ good practices;
Monitoring Committee’s meetings;
Operation of working groups, committees and commissions;
Procurement of equipment;
Audits; and
Elaboration of background studies and support for the preparation of the next
programming period.
The Technical Assistance funds will help to obtain and maintain the necessary, sufficiently
knowledgeable human resources, to ensure their professional growth and conditions for
their mutual interoperation and, last but not least, to provide them with the necessary
technical background for high-quality decision making.
Therefore, through the mentioned interventions/operations, funds will also be allocated to
the development of administrative capacity in public bodies involved in the management
of the Programme. It is widely accepted that the general administrative procedures
connected with the use of EU funds are complex in nature and that they require high levels
of expertise in a wide range of areas.

94
Therefore, activities that shall be financed are related to:
Provision of trainings, seminars and working meetings for the employees responsible
for the preparation, management, monitoring, implementation, evaluation, audit
and control of selected operations and the OP as well as technical and operational
setups for such events;
Retention of trained staff (including the cost of salaries and social security
contributions).
Special attention is given to training activities for potential beneficiaries in all aspects of
EU project preparation and management in order to develop regional capacities which will
ensure the absorption of available funds successfully without extensive institutional
support.
The TA priority is also targeting the preparations of strategic documents and projects for
the current (2007-2013 perspective) as well as for the next programming period (2014-2020
perspective). More specifically, operations under this priority will support the elaboration
of sectoral analyses and studies, methodologies, reports and other programming
documents. Another important component of this intervention area is identification of the
relevant project pipeline and project preparation with the objective of achieving a high
level of absorption levels through the implementation of mature projects compliant with
OP strategy.
The management of the operations will be ensured by the Managing Authority of the OP.
3.3.5. Indicative list of potential beneficiaries
Beneficiaries of the operations related to administration (OS’ staff remuneration) and
management, monitoring and evaluation of the OP are:
Managing Authority
Intermediate Bodies.
All other envisaged operations will be targeted towards:
all bodies within the management and control system of the OPRC 2007 – 2013;
final beneficiaries.
95
3.4. Complementarity and demarcation
3.4.1. Coordination with Community Programmes
1. Competitiveness and Innovation Framework Programme (CIP)
Projects financed under the CIP Programme do not overlap with operations planned under
this OP, but rather offer synergy in promoting similar topics and goals and opportunities for
applying for assistance that is not envisaged under OPRC or only up to a limited extent, such
as:
- direct support to SMEs for innovation (including eco-innovation) projects;
- better access to finance for SMEs in form of financial instruments;
- better take-up and use of ICT, help to develop the information society and promote
the increased use of renewable energies and energy efficiency;
- Intelligent Energy – Europe Programme (IEE); etc.
Furthermore, Croatian SMEs thereby also need to compete with all other numerous SMEs at
EU level, whereby receiving assistance, although a challenge and an incentive to improve,
also presents an insurmountable obstacle and seems to be thus reserved for the limited
number of top EU applicants only.
While Croatian SMEs are continuously being encouraged to apply for this assistance, the
fact remains that the majority of them is still below EU average in terms of competitiveness
and needs different forms of assistance and development to be able to successfully
participate in such initiatives to a greater extent.
2. The Seventh Framework Programme for research, technological development and
demonstration activities (FP7)
Croatia is actively participating in the FP7 Programme. Activities under Priority axis 2 aim at
improving Croatia’s capacities for participation in this Framework and other related
programmes in the coming period. Projects financed under FP7 Programme do not overlap
with operations planned in this OP. FP7 projects primarily aim at increasing of research
capacities with the ERA (European research area) by supporting the collaborative projects
among EU countries/researchers. The operations within the OP are related to building
capacities for transfer technology, applied research development, development and
improvement of R&D&I infrastructure, development of the centres for research excellence
with the main aim of enhancing the national and regional economy in the context of closer
collaboration of science and business sectors.
3. Culture Programme (2007-2013)
Applicants from Croatia have been awarded several projects through this programme, but
since interventions financed through it are of a soft nature, there is no overlap with the
interventions planned under this OP, since the RCOP targets improvements of the cultural
infrastructure.
3.4.2. Complementarity with other OPs
The tables below provide areas of complementarity between the OPRC and other Operational Programmes, namely HRDOP, OPE and IPARD.
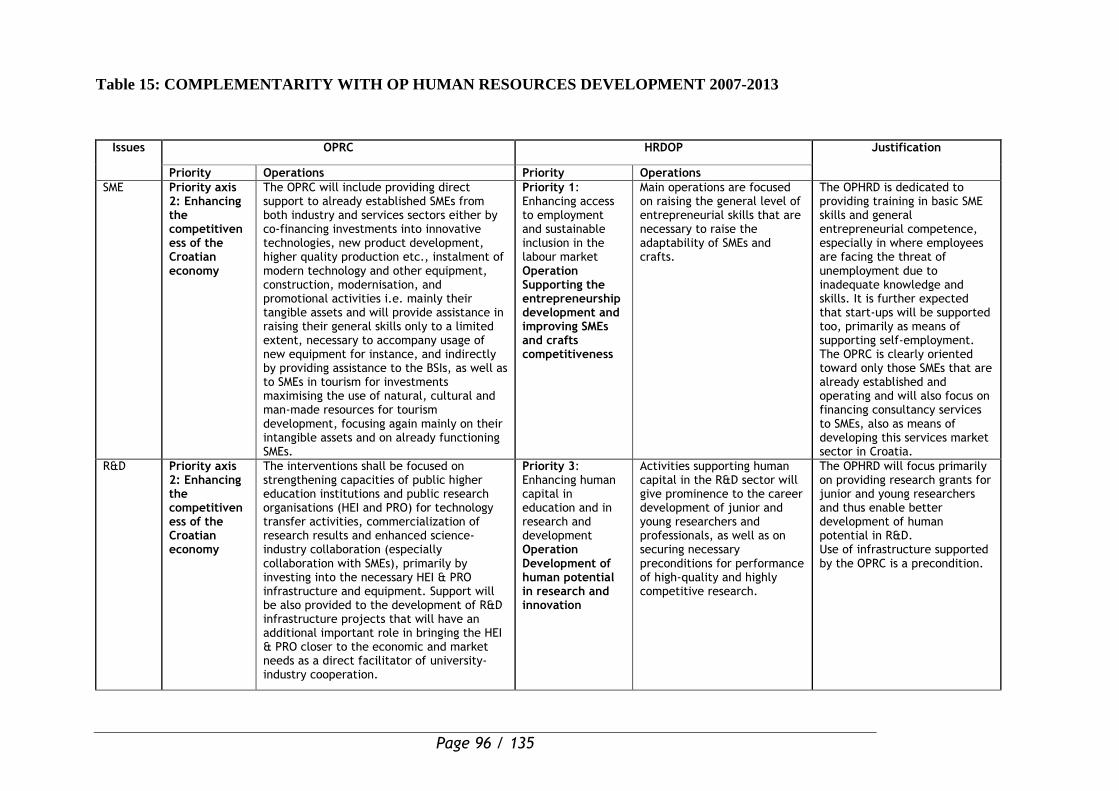
Page 96 / 135
Table 15: COMPLEMENTARITY WITH OP HUMAN RESOURCES DEVELOPMENT 2007-2013
Issues OPRC HRDOP Justification
Priority Operations Priority Operations
SME Priority axis 2: Enhancing the competitiveness of the Croatian economy
The OPRC will include providing direct support to already established SMEs from both industry and services sectors either by co-financing investments into innovative technologies, new product development, higher quality production etc., instalment of modern technology and other equipment, construction, modernisation, and promotional activities i.e. mainly their tangible assets and will provide assistance in raising their general skills only to a limited extent, necessary to accompany usage of new equipment for instance, and indirectly by providing assistance to the BSIs, as well as to SMEs in tourism for investments maximising the use of natural, cultural and man-made resources for tourism development, focusing again mainly on their intangible assets and on already functioning SMEs.
Priority 1: Enhancing access to employment and sustainable inclusion in the labour market Operation Supporting the entrepreneurship development and improving SMEs and crafts competitiveness
Main operations are focused on raising the general level of entrepreneurial skills that are necessary to raise the adaptability of SMEs and crafts.
The OPHRD is dedicated to providing training in basic SME skills and general entrepreneurial competence, especially in where employees are facing the threat of unemployment due to inadequate knowledge and skills. It is further expected that start-ups will be supported too, primarily as means of supporting self-employment. The OPRC is clearly oriented toward only those SMEs that are already established and operating and will also focus on financing consultancy services to SMEs, also as means of developing this services market sector in Croatia.
R&D Priority axis 2: Enhancing the competitiveness of the Croatian economy
The interventions shall be focused on strengthening capacities of public higher education institutions and public research organisations (HEI and PRO) for technology transfer activities, commercialization of research results and enhanced science-industry collaboration (especially collaboration with SMEs), primarily by investing into the necessary HEI & PRO infrastructure and equipment. Support will be also provided to the development of R&D infrastructure projects that will have an additional important role in bringing the HEI & PRO closer to the economic and market needs as a direct facilitator of university-industry cooperation.
Priority 3: Enhancing human capital in education and in research and development Operation Development of human potential in research and innovation
Activities supporting human capital in the R&D sector will give prominence to the career development of junior and young researchers and professionals, as well as on securing necessary preconditions for performance of high-quality and highly competitive research.
The OPHRD will focus primarily on providing research grants for junior and young researchers and thus enable better development of human potential in R&D. Use of infrastructure supported by the OPRC is a precondition.
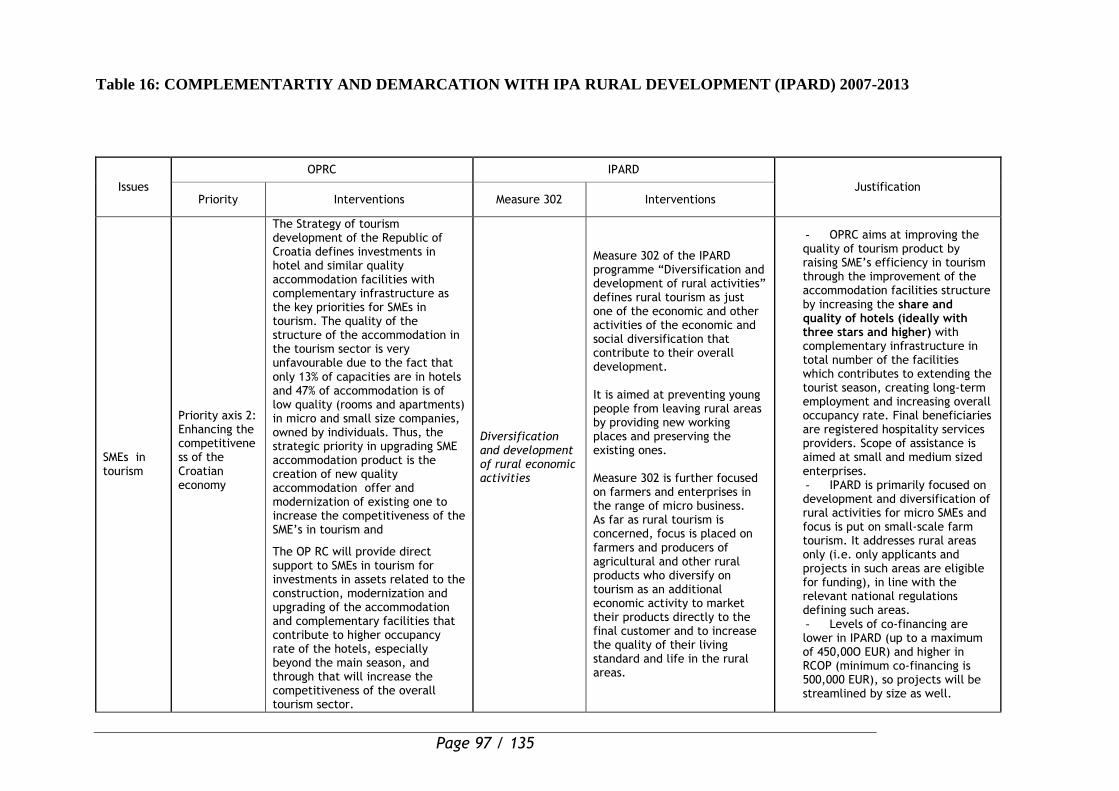
Page 97 / 135
Table 16: COMPLEMENTARTIY AND DEMARCATION WITH IPA RURAL DEVELOPMENT (IPARD) 2007-2013
Issues
OPRC IPARD
Justification Priority Interventions Measure 302 Interventions
SMEs in tourism
Priority axis 2: Enhancing the competitiveness of the Croatian economy
The Strategy of tourism development of the Republic of Croatia defines investments in hotel and similar quality accommodation facilities with complementary infrastructure as the key priorities for SMEs in tourism. The quality of the structure of the accommodation in the tourism sector is very unfavourable due to the fact that only 13% of capacities are in hotels and 47% of accommodation is of low quality (rooms and apartments) in micro and small size companies, owned by individuals. Thus, the strategic priority in upgrading SME accommodation product is the creation of new quality accommodation offer and modernization of existing one to increase the competitiveness of the SME’s in tourism and
The OP RC will provide direct support to SMEs in tourism for investments in assets related to the construction, modernization and upgrading of the accommodation and complementary facilities that contribute to higher occupancy rate of the hotels, especially beyond the main season, and through that will increase the competitiveness of the overall tourism sector.
Diversification and development of rural economic activities
Measure 302 of the IPARD programme “Diversification and development of rural activities” defines rural tourism as just one of the economic and other activities of the economic and social diversification that contribute to their overall development. It is aimed at preventing young people from leaving rural areas by providing new working places and preserving the existing ones. Measure 302 is further focused on farmers and enterprises in the range of micro business. As far as rural tourism is concerned, focus is placed on farmers and producers of agricultural and other rural products who diversify on tourism as an additional economic activity to market their products directly to the final customer and to increase the quality of their living standard and life in the rural areas.
- OPRC aims at improving the quality of tourism product by raising SME’s efficiency in tourism through the improvement of the accommodation facilities structure by increasing the share and quality of hotels (ideally with three stars and higher) with complementary infrastructure in total number of the facilities which contributes to extending the tourist season, creating long-term employment and increasing overall occupancy rate. Final beneficiaries are registered hospitality services providers. Scope of assistance is aimed at small and medium sized enterprises. - IPARD is primarily focused on development and diversification of rural activities for micro SMEs and focus is put on small-scale farm tourism. It addresses rural areas only (i.e. only applicants and projects in such areas are eligible for funding), in line with the relevant national regulations defining such areas. - Levels of co-financing are lower in IPARD (up to a maximum of 450,00O EUR) and higher in RCOP (minimum co-financing is 500,000 EUR), so projects will be streamlined by size as well.
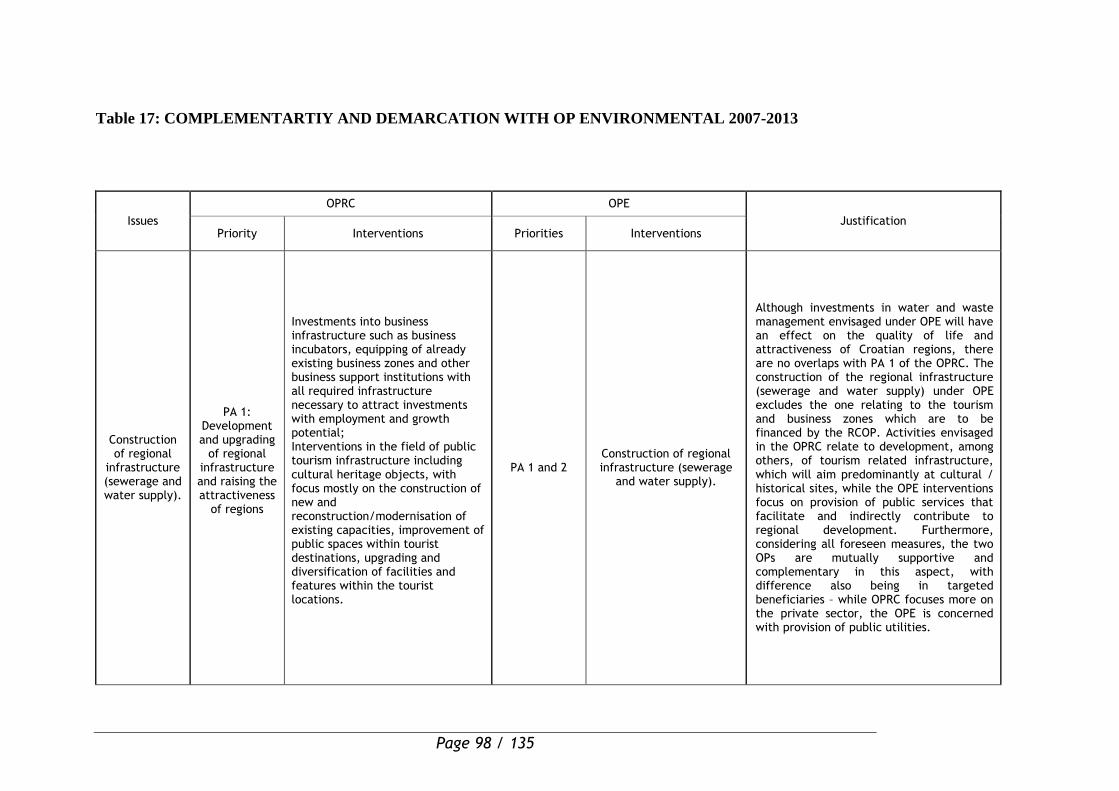
Page 98 / 135
Table 17: COMPLEMENTARTIY AND DEMARCATION WITH OP ENVIRONMENTAL 2007-2013
Issues
OPRC OPE
Justification Priority Interventions Priorities Interventions
Construction of regional
infrastructure (sewerage and water supply).
PA 1: Development and upgrading
of regional infrastructure and raising the attractiveness
of regions
Investments into business infrastructure such as business incubators, equipping of already existing business zones and other business support institutions with all required infrastructure necessary to attract investments with employment and growth potential; Interventions in the field of public tourism infrastructure including cultural heritage objects, with focus mostly on the construction of new and reconstruction/modernisation of existing capacities, improvement of public spaces within tourist destinations, upgrading and diversification of facilities and features within the tourist locations.
PA 1 and 2 Construction of regional infrastructure (sewerage
and water supply).
- Although investments in water and waste management envisaged under OPE will have an effect on the quality of life and attractiveness of Croatian regions, there are no overlaps with PA 1 of the OPRC. The construction of the regional infrastructure (sewerage and water supply) under OPE excludes the one relating to the tourism and business zones which are to be financed by the RCOP. Activities envisaged in the OPRC relate to development, among others, of tourism related infrastructure, which will aim predominantly at cultural / historical sites, while the OPE interventions focus on provision of public services that facilitate and indirectly contribute to regional development. Furthermore, considering all foreseen measures, the two OPs are mutually supportive and complementary in this aspect, with difference also being in targeted beneficiaries – while OPRC focuses more on the private sector, the OPE is concerned with provision of public utilities.
Page 99 / 135
3.4.3. Complementarities with the International Financing Institutions (IFI)
The World Bank (WB), the European Bank for Reconstruction and Development (EBRD), the
European Investment Bank (EIB) and the Council of Europe Development Bank (CEB) have
been extensively engaged in providing financial support, technical assistance, policy advice
and analytical services to Croatia since the independence of the country.
The OPRC will interact with the WB in its efforts to support Croatia regarding the MSES
through the Second Science and Technology Project (STP II) and Project Preparation
Advance (PPA) with the following objectives to: (i) improve the capacity of Croatia’s R&D
and innovation institutions to implement Europe 2020 Strategy for increased investments in
R&D through efficient absorption of EU funds, and (ii) develop a pipeline of public and
private R&D projects, including research groups, that could qualify for financing through
EU structural funds.
At present, the EBRD works closely with the Croatian authorities and the business
community to support the country’s preparation for EU accession. The focus of the EBRD’s
current strategy is on investment in the sectors listed below, with the highest priority
being given to regional support for Croatian corporations, commercial finance of national
and municipal infrastructure, SME finance and tourism. In the infrastructure and
environment sector, at the local level, the EBRD works with a number of large and
medium-sized municipalities to develop their infrastructure projects for prospective
IPA/ERDF co-financing.
In the financial sector, the EBRD will pursue SME finance with the support of the EU under
the EU/EBRD SME Finance Facility. EBRD will further develop financing for leasing
companies and other non-bank financial institutions, such as factoring companies. In 2009,
the EBRD Board approved a long-term loan of EUR 50 million EUR to Privredna Banka
Zagreb for an SME credit line and, through a regional project for UniCredit Group, an
additional EUR 50 million for Zagrebačka Bank for the same purpose. The EBRD plans to
provide a syndicated loan to the Croatian Bank for Reconstruction and Development for
SME financing. The OPRC will coordinate with the EBRD in terms of purpose and content of
financial support, especially on micro-credits and bank guarantees. Coordination is also
needed in terms of the purpose and content of financial support for SME in tourism.
With the aim of increasing the access of SME to long-term financing, the EIB cooperates
closely with well-established financial institutions with market expertise in Croatia,
providing services to small and medium-sized companies via a well-developed network of
branches. In the period 2001-2009, EIB granted loans in Croatia in a total amount of EUR
1.7 billion. The EIB also plans to further increase its support for SME. Therefore, the OPRC
needs to collaborate with the Bank in terms of the content and rules of state aid and
economic competition.
Coordination between the OPRC and the CEDB in terms of the content and rules of state
aid and economic competition will be ensured in the fields of SME support and in other
programmes of the Council in the labour market sector.
Page 100 / 135
SECTION 4: IMPLEMENTATION
This chapter describes the institutional framework for the implementation of OPRC 2007–
2013, in accordance with the provisions laid down in Council Regulation (EC) No. 1083/2006.
In December 2011, the Croatian Parliament adopted the Law on the State Administration
System (OG 150/11) and the Law on Organization and Scope of the Ministries and Other
Central State Administration Bodies (OG 150/11, 22/12), based on which the MRDEUF
performs the administrative and other tasks related to, inter alia, coordination of all
activities pertaining to the harmonization with the EU in the area of regional policy and
management of SCF.
The new Law on the Institutional Framework for the use of EU structural instruments in the
Republic of Croatia was adopted by the Parliament in July 201293 (hereinafter “the Law”),
repealing the Government Decision on the strategic documents and institutional framework
for the use of EU structural instruments in the Republic of Croatia from October 201094.
This Law defines the functions and responsibilities assigned to the bodies within the SCF
management and control system in Croatia. Based on the Law, a new Decree on the bodies
in the management and control system for use of European Union structural instruments in
the Republic of Croatia 95 was adopted by the Croatian Government in August 2012
(hereinafter “the Decree”). This Decree determines the jurisdiction of individual bodies for
the 2007-2013 programing period, horizontally at the level of the entire system, as well as
at the level of the OPs and their PAs, depending on the specificities of individual OPs.
4.1. Management
Overall responsibility
The overall responsibility for the quality and efficient implementation of the commitments
embodied in the documents concerning the EU SCF is ensured by the Government of the
Republic of Croatia.
Based on the Law and under the provisions of the Decree, the following bodies have been
designated:
Coordinating Body (CB) within the System is the Ministry of Regional Development and EU Funds (MRDEUF);
Certifying Authority (CA) within the System is the Ministry of Finance, which is also, responsible for payments and monitoring of irregularities within the System;
Audit Authority (AA) within the System is the Agency for the Audit of European Union Programmes Implementation System (ARPA);
Managing Authority (MA), is a national body responsible for managing an Operational Programme;
Intermediate Bodies level 1 (IB1) and Intermediate Bodies level 2 (IB2) are the national bodies which under the responsibilities of MA performs delegated functions.
93Law on the Institutional Framework for the use of EU structural instruments in the Republic of Croatia (OG 78/2012, 13 July 2012). 94Government Decision on the strategic documents and institutional framework for the use of EU structural instruments in the Republic of Croatia (OG 116/2010). 95Decree on the bodies in the management and control system for use of European Union structural instruments in the Republic of Croatia (OG 97/2012).
Page 101 / 135
The MRDEUF is designated to perform the role of central Coordinating Body for the
National Strategic Reference Framework (NSRF). It shall ensure strategic coherence across
the EU and national policies, and complementary use of national and EU financial
resources in pursuing national development goals. Furthermore, it shall coordinate and
support the programming, setting up of the Management and Control System, preparing
and adopting the rules, developing an integrated Management Information System (MIS),
monitoring implementation at the national level, coordinating preparation and revision of
project selection criteria with MA, prepare the communication plan and coordinate the
implementation of information and visibility measures to ensure proper implementation,
and assist with horizontal issues in EU funds management, thus ensuring absorption of EU
assistance in cooperation with all relevant state institutions.
4.1.1. Managing Authority
Although the MRDEUF performs the function of CB and MA, a clear separation of functions
has been insured within the Ministry. Obligations and rights of CB, and MA are clearly
stipulated in the Law. It is also clearly stated that functions of the CB as well as of the MA,
must be separated from the other functions of the MRDFEU which is ensured by internal
decrees. In respect of the requirements of Article 60 of Council Regulation (EC) No
1083/2006, the MA is responsible for managing and implementing the OP in accordance
with the principles of sound financial management and clear separation of functions.
MRDEUF in its role of the MA for OPRC 2007–2013 will perform all the functions stipulated
by the Law. Within the MA, the requirements for segregation of functions for selection and
approval of projects and management verifications will be fully respected. Internally, the
tasks of implementation and monitoring of projects will be separated from the control
tasks.
4.1.2. Intermediate Bodies:
In line with Articles 2.6 and 59.2 of Council Regulation (EC) No. 1083/2006, and according
to Article 5.2. of the Law, two levels of IBs are established, IB level 1 and IB level 2.
Intermediate Body level 1 is a national body which, in the line with its sectorial
responsibility, and under the responsibility of the MA, performs delegated functions
related to the selection of projects for funding under the priority of the OP within the
their competence, and other additional functions delegated by the MA.
Intermediate Body level 2 is a national or public body which, under the responsibility of
the MA, performs delegated functions related to the verification that the funded products
and services are delivered and that the expenditure declared by the beneficiary for the
project has been actually incurred and complies with national and European Union rules
for the whole of the project implementation and durability period.
For tasks delegated to IBs, the MA retains overall responsibility for ensuring that they are
properly conducted. Therefore, the MA shall regularly and systematically supervise IBs in
performing delegated functions.
In order to avoid risks arising where an IB is also the beneficiary of an operation,
segregation of functions will be ensured by assigning the relating tasks of the beneficiary
to a separate unit and verification checks will be carried out by the MA.
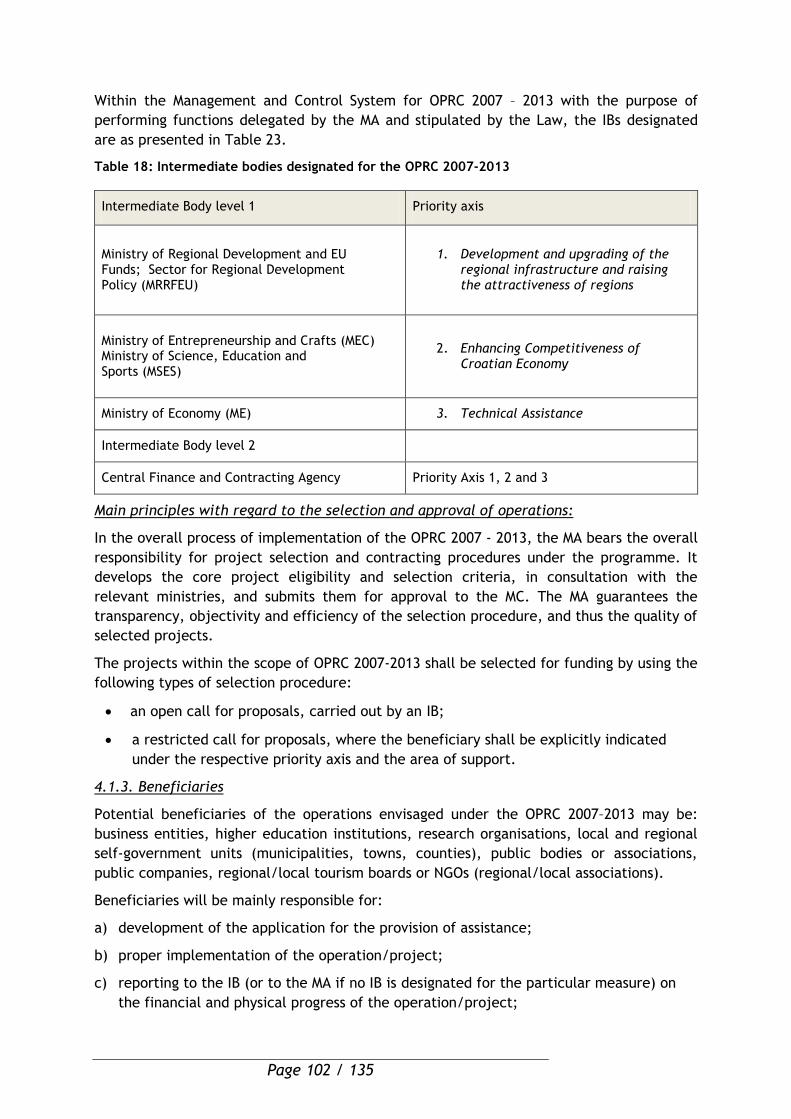
Page 102 / 135
Within the Management and Control System for OPRC 2007 – 2013 with the purpose of
performing functions delegated by the MA and stipulated by the Law, the IBs designated
are as presented in Table 23.
Table 18: Intermediate bodies designated for the OPRC 2007-2013
Intermediate Body level 1 Priority axis
Ministry of Regional Development and EU Funds; Sector for Regional Development Policy (MRRFEU)
1. Development and upgrading of the regional infrastructure and raising the attractiveness of regions
Ministry of Entrepreneurship and Crafts (MEC) Ministry of Science, Education and Sports (MSES)
2. Enhancing Competitiveness of Croatian Economy
Ministry of Economy (ME) 3. Technical Assistance
Intermediate Body level 2
Central Finance and Contracting Agency Priority Axis 1, 2 and 3
Main principles with regard to the selection and approval of operations:
In the overall process of implementation of the OPRC 2007 - 2013, the MA bears the overall
responsibility for project selection and contracting procedures under the programme. It
develops the core project eligibility and selection criteria, in consultation with the
relevant ministries, and submits them for approval to the MC. The MA guarantees the
transparency, objectivity and efficiency of the selection procedure, and thus the quality of
selected projects.
The projects within the scope of OPRC 2007-2013 shall be selected for funding by using the
following types of selection procedure:
an open call for proposals, carried out by an IB;
a restricted call for proposals, where the beneficiary shall be explicitly indicated
under the respective priority axis and the area of support.
4.1.3. Beneficiaries
Potential beneficiaries of the operations envisaged under the OPRC 2007–2013 may be:
business entities, higher education institutions, research organisations, local and regional
self-government units (municipalities, towns, counties), public bodies or associations,
public companies, regional/local tourism boards or NGOs (regional/local associations).
Beneficiaries will be mainly responsible for:
a) development of the application for the provision of assistance;
b) proper implementation of the operation/project;
c) reporting to the IB (or to the MA if no IB is designated for the particular measure) on
the financial and physical progress of the operation/project;
Page 103 / 135
d) compliance with publicity and information requirements in accordance with EU rules
and with the Communication Plan (at the operation/project level).
The beneficiaries shall be responsible for ensuring that the expenditure they declare for
co-financing is legal and regular and complies with all applicable EU and national rules. For
providing this assurance, the beneficiaries shall have in place their own internal control
procedures. In submitting the payment claims for expenditure eligible for co-financing,
beneficiaries shall substantiate the incurred expenditures and their compliance with the
requirements contained in the financing decision on the funds to be allocated within the
assistance. All payment claims must be supported by confirmed invoices and other
documents of equal probative value. The beneficiaries must keep project dossiers
providing adequate audit trails. Guidelines for beneficiaries will include detailed provisions
for audit trails. The beneficiaries must make the documents on projects available at any
time for inspections carried out by authorized persons or entities. The documents shall be
archived in compliance with applicable regulations.
4.1.4. Certifying Authority
The Certifying Authority (CA) for all OPs shall be responsible in the line with the provisions
of Article 61 of General Regulation No. 1083/2006. CA functions within the Ministry of
Finance will be performed by the National Fund (NF). As the national body, the NF is
responsible for certifying the statement of expenditure and applications for payment,
before submission to the EC, and also for payments, additionally verification, irregularity
monitoring and preparing part of the Rules governing activities of the bodies in the System
related to eligibility of expenditure, project verifications, payments, certification,
recoveries, irregularities, and audit trail. NF also monitors the application of the Rules as
well ensures exchange of practices and communication among the bodies in the System.
4.1.5. Audit
The Audit authority shall be responsible for functions specified in Article 62 of Council
Regulation No. 1083/2006. It is foreseen that the functions of the Audit Authority will be
performed by the Agency for the Audit of European Union Programmes' Implementation
System (ARPA) it is the national body functionally independent from the Managing
Authority and the Certifying Authority, responsible for external audit of the proper and
efficient functioning of the System.
4.2. Monitoring and Evaluation
4.2.1. Monitoring of implementation
Pursuant to Article 66 of the General Regulation, the Managing Authority (MA) and
Monitoring Committee (MC) shall ensure high quality of the implemented operational
programme (OP). Overall monitoring of the OP will be performed by MA, which will collect
information from the responsible institutions and from the Management Information
System (SCF MIS).
Monitoring is carried out under the partnership principle and OPRC MC will include
representatives of the MA, the Coordinating Body (CB), the Certifying Authority (CA), Audit
Authority (AA), all Intermediate Bodies (IB), social partners (employers’ associations, trade
union confederations), and relevant NGOs, including representatives of national and
regional organizations interested in active participation in OP implementation.
Page 104 / 135
Representatives of the European Commission (EC) shall participate in an advisory capacity
in the MC; when appropriate, delegates of the European Investment Bank (EIB) and
European Investment Fund (EIF) or other financing institutions will also be invited.
Pursuant to Article 6 of Council Regulation (EC) No 1083/2006 which states that the MC
shall be chaired by a representative of the Member State or the MA, the Chair of the OPRC
MC shall be a state official in the rank of the Deputy Minister at the Ministry of Regional
Development and EU funds (MA). The Chair will designate a Vice-chair, at least in the rank
of a senior civil servant. The MC will draw up and adopt its own rules of procedure within
the national institutional, legal and financial framework. The MA will provide the
Secretariat of the MC.
Prior to the date on which the Regulation (EC) No 1083/2006 enters into force in the
Republic of Croatia and prior to the date of notification of the decision approving OPRC
2007–2013, the MC will function in the capacity of a “Shadow” MC, serving as a panel of
stakeholders and interested parties with the aim of timely preparation of the OPRC
implementation. The composition of the MC, its duties and responsibilities, will be
confirmed within three months following the decision approving the OP, according to
Article 63 of Council Regulation No 1083/2006.
4.2.2. Monitoring indicators / targets
Based on the Common National Rules for “Forecasting and Monitoring”, the MA has
developed an internal manual of procedures detailing the method for monitoring above
described indicators and targets.
Quality and success of the OPRC will consist of monitoring and evaluation of:
- physical indicators of the OP, according to which the level of success of implementation
of the quantitative programme objectives will be established.
- financial indicators of the OP, which will form the basis for the evaluation of the speed
of absorption of funds, implementation of the rule N+3 and the need to revise or specify
the operational programme;
Based on the NSRF targets and the financial allocation for each OP priority, the OP physical
indicators are prepared in such a way that the aggregation of the OP indicator target
values aims to reach the NSRF target values. In order to monitor overall achievement of
the set indicators, CB will insert the prepared NSRF and OP physical indicators information
into the MIS.
According to the manual of procedures, the MA, in cooperation with IB1, responsible for
relevant PA of the OP, will prepare an indicator sheet, containing the description of each
indicator, for all the respective physical indicators and will submit those descriptions to
the Coordinating body.
The relevant OP indicators, related to OP objectives, as described in the indicator sheet,
will be the base for the project selection processes within each Priority Axis. Indicators,
which are necessary for project monitoring, but not relevant in the programme monitoring,
will be incorporated in the Call for Proposals. The applications to these calls will need to
contain a description of how to address all the indicators and achieve their target values.
IB1 will have to ensure that the proposals, contracts and project reports contain all the
Page 105 / 135
necessary information related to the achievement of the indicators. The values of the
output and result indicators will have to be part of project reports.
Based on the information supplied by each IB1 for each PA, the MA will prepare the Annual
Implementation Report as well as the Final Report, in line with Annex XVIII on annual and
final reporting and Annex II, part C of EC Regulation 1828/2006. The preparation of the
annual report and the final report will be based on the database of the MIS.
The CB shall provide quality assurance and checks whether the reports contain all the
necessary information. Upon quality check, MA shall send the draft reports to the members
of the monitoring committee before the OPRC MC meeting, which will be held well in
advance before the deadline of the submission of the reports to the EC.
4.2.3. Evaluation
The common goal of evaluation within the EU Cohesion Policy is to improve the quality,
efficiency and coherency of the EU SCF and the strategy of OPs and their implementation
so as to increase the value added of interventions financed by the EU SCF. Evaluation of EU
structural assistance is an important integral part of the decision-making process used for
the improvement of management of the EU financed programmes.
In accordance with Council Regulation (EC) No. 1083/2006, articles 47–49, laying down
general provisions on EU structural assistance, evaluation shall be carried out before the
programming period (ex-ante evaluation), during the programming period (on-going
evaluation) and upon its completion (ex-post evaluation).
On-going evaluation will be carried out during the entire period of the implementation of the
OP, by analysing and evaluating the progress made towards achieving the targets and result
indicators, by establishing the efficiency and effectiveness of the use of investments.
Evaluations shall be initiated upon the need, having identified the problems related to the
implementation of the OP or a part of the OP, or where collection of additional data during
the evaluation is required. In accordance with the provisions of the Regulation, evaluations
will be carried out when substantial deviations from the goals initially set will be identified.
The national institutional framework for evaluation comprises 2 levels:
an overall coordination level, ensured by the Coordinating Body (CB);
a functional level ensured by the MA.
During the 2007–2013 programming period, the CB will be responsible for coordination of
the evaluation of OPs. The CB has prepared the Evaluation strategy which contains EU
structural assistance evaluation goals, objectives as well as organisation and management
of the EU structural assistance evaluation. Based on the Strategy, annual evaluation plans
will be developed by the MA and IBs in accordance with the overall Evaluation Strategy.
The annual evaluation plan will be presented to the MC for the approval. On-going
evaluations will be financed from the TA budget. The CB will develop an Evaluation
Procedures Manual describing follow-up mechanism for tracking implementation of the
evaluation recommendations to be applied by the MA.
Information on the evaluation results will be provided to the MC, the EC, and other
responsible institutions. Also, evaluation reports will be available to all stakeholders and
general public. Evaluation results shall be made publicly available through an easily
identifiable and accessible means of communication.
Page 106 / 135
4.3. Financial Flows
The main procedures for mobilization and circulation of financial flows in order to ensure
their transparency while implementing this operational programme are presented below. It
is important to emphasize that the system described herein is common for all EU structural
assistance administered in Croatia according to the Convergence objective; therefore, it
will be equally applied to all operational programmes under the aforementioned objective.
The following two essential aspects of the financial flow system may be distinguished: a)
co-financing of actions by EU structural assistance and national funds; b) the cycle of
movement of EU funds to final beneficiaries.
The national co-financing of EU structural assistance will be ensured from the resources of
the state budget, other national public contribution, municipal budgets, and final
beneficiaries’ own funds. Taking into consideration the possibility envisaged in the
Regulation, private funds will comprise a part of national co-financing.
The potential of the national co-financing of EU structural assistance will be ensured by
the integrated planning of EU structural assistance in the State budget. The State budget
preparation and provision for EU structural assistance and national co-financing is ensured
in accordance with the applicable Instruction for preparation of State budget of Republic
of Croatia for certain period (issued by the State Treasury of the Ministry of Finance), and
forms part of overall procedure related to preparation of the State budget. As a rule, the
funds from EU structural assistance designated for allocation to a particular economic
sector will be included into the annual budget of a relevant budget user- Intermediate
body 1 (usually – a relevant ministry), responsible for co-ordination of the state policy in
this area, by integrating these funds into budget appropriations.
The EC will transfer EU structural assistance funds to a separate bank account opened
specially for each fund with the Croatian National Bank and administered by the State
Treasury of the Ministry of Finance. These funds will be transferred to the single treasury
account, which is located in the Croatian National Bank.
These funds will be transferred to final beneficiaries through the State Treasury Financial
Information System (STFIS). STFIS is designed to process all transactions relating to all
phases of the budgetary cycle. All budget users are connected into a single financial -
information system- STFIS through which State treasury may conduct transactions. Final
beneficiaries will submit payment applications to the Intermediate body 2 that will verify
the eligibility of expenditure declared by the final beneficiaries to be financed from EU
structural assistance funds, following the procedure established in the common rules
adopted by CB (MRDEUF) and following relevant instructions of the MA.
After setting the amounts specified in payment applications eligible for financing from EU
structural assistance funds, the budget user- Intermediary body, will prepare the requests
for payment (RfPs) to the State treasury for the amounts to be proceeded in STFIS. After
preparation of the RfP in STFIS, the process of verification and validation of the RfP will
take place following the general procedure for payment of the State budget funds.
After receipt of a proper RfP for a particular State budget appropriation item, under which expenditure of EU structural assistance is planned, the State Treasury of the Ministry of Finance will transfer the amount of EU structural assistance funds specified in the RfP from a single treasury account directly to the final beneficiary.
Page 107 / 135
Thus, transparency of the cycle of movement of EU funds down to final beneficiaries shall
be ensured by the mentioned several key measures:
After EU structural assistance is integrated into the State budget, during its
payment the general control measures for payment of the State budget
funds shall be applied;
EU funds, using STFIS, will be transferred directly to final beneficiaries,
thus enhancing the performance of the audit trail principle, also allowing to
implement the principle laid down in the Regulation, stating that EU funds
have to reach the final beneficiary as soon as possible, in a most effective
manner;
The system will ensure that in all cases EU funds for final beneficiaries will
be transferred only after verification and validation of amounts eligible for
financing from EU structural assistance funds by the procedure established
by the CB (MRDEUF) and instructions of the MA.
STFIS will also ensure that all interest accrued on EU structural assistance transferred to
Croatia in advance will be designated for the implementation of this operational
programme as public national co-financing.
The flowchart of financial flows is presented in Annex 7.
4.4. Information and publicity
Information and publicity actions of the OPRC will be included in the Communication
Action Plan (CAP) prepared in accordance with Commission Regulation (EC) No. 1828/2006
and they aim to:
- raise public awareness on EU Cohesion Policy and on the opportunities offered by
the SCF in Croatia;
- highlight the role played by the EU in co-financing OPRC activities, in supporting
Croatia’s economic competitiveness, in fostering economic development and
reducing regional disparities;
- raise public awareness of the OPRC and its objectives, priority axes and
mechanisms;
- inform potential beneficiaries on the conditions of eligibility for financing under
OPRC, the procedures for examining applications for funding and the timeframe
foreseen, the criteria for selecting the operations to be financed, and the contacts
at the national, regional or local level providing information on the OPRC;
- disseminate information on approved and financed projects as well as on the results
achieved and best practices;
- ensure access to information for all target groups;
- ensure maximum comprehensibility of the information provided to the public on the
Funds’ allocation and management.
The following target groups have been identified for the information and communication
actions of the OPRC:
- the general public;
- the (potential) beneficiaries;
- opinion leaders and the media, with particular reference to: leading economic and
financial newspapers, leading TV and radio stations; key local media;
Page 108 / 135
- the “partners for communication”, i.e., all those bodies that can help the MA and
IB to disseminate information widely.
Beneficiaries will be informed about their responsibilities, such as: informing the public
about the assistance obtained from the SCF, displaying billboards, permanent explanatory
plaques and the emblem of the EU referred to in Art. 8 of Commission Regulation (EC) No.
1828/2006, complying with the technical characteristics of information and publicity
measures referred to in Art. 9 of Commission Regulation (EC) No 1828/2006.
The beneficiaries shall also be informed that their projects are part of a priority axis in an
OP co-financed by the ERDF and that their names, the name of the operations and the
amount of public funding that is allocated to the operations will be published.
The tasks of the OPRC MC with relation to information and publicity issues include adopting
the Communication Plan and monitoring its implementation. Communication and publicity
measures will be subject to evaluations made by the MA OPRC and by the OPRC MC.
The Coordinating Body shall ensure the coordination of communication activities among
institutions engaged in information and publicity activities for all the OPs across the SCF
system.
The MA and IBs share tasks and support each other in:
- informing potential beneficiaries about eligibility criteria, selection procedures,
evaluation criteria, operations selected for financing, and budgets;
- advising beneficiaries on issues related to publicity measures;
- informing the general public about the projects implemented;
- offering all useful information for drafting the surveys and reports referred to in
Art. 4 of Commission Regulation (EC) No 1828/2006 to be presented by the MA to
the MC and to the EC.
Operations envisaged under the CAP are specified in the PA3 (TA) of the OP.
4.5. Management and Information System (MIS)
In view of accumulation, summarising and presenting the data of the ERDF, ESF and Cohesion funds, Croatia uses a single Management Information System (MIS). The scope of the Management Information System is twofold and its purpose is to manage operational programmes and projects, as well as to serve as financial control mechanism to enable the smooth processing of payments.
The MIS ensures that all the data, necessary for financial management, monitoring, supervision, audit and evaluation are collected and secured as required by the General and Implementation Regulations.
MIS provides a possibility to monitor the operational data and financial information on:
- implementation of separate projects, financed from SCF;
- progress of implementation of separate operational programmes;
- general progress of implementation of the assistance under the Convergence Objective;
- verifications of results, detected irregularities, and audit.
MIS facilitates implementation of the following functions:
1. Management: placement of the data on financial plans and indicators of operational programmes into computer system, forecasts and monitoring of financial plans and indicators, supervision of obligations and execution of payment plans, control of the N+2/N+3 rule.
Page 109 / 135
2. Administration: project registration, administration of agreements, forecasts on projects implementation and supervision of their execution, registration of verification results, control of eligibility of expenditure and payment. This function also includes the provision of accumulated data enabling for an easy identification of project implementation and payments problems.
3. Accountability: provision of information on progress of projects, elaboration of
summaries for reports, provision of information on the expenditure, collection of
information necessary for execution of control, audit, evaluations, submission of reports to
the Commission via electronic media (for audit purposes, pursuant to the requirements of
Regulation (EC) No 1083/2006) .
The system allows for a multi-user group environment with distinct roles and tasks. MIS is
managed centrally by the Coordinating Body (MRDEUF) and developed in co-operation with
other institutions; managing authorities, responsible ministries (Intermediate body 1),
agencies (Intermediate body 2), certifying and audit authority. The system issues numbers
of standard and customised reports to meet the needs of the various data groups, both on
an ad hoc and/or regular basis. It is envisaged that data placement commence in July
2013. The system ensures the data transmission between Managing Authority and the
European Commission (as foreseen in Article 60 (c) of Regulation (EC) No 1083/2006).
4.6. Compliance with state aid and public procurement rules
Croatia undertakes to ensure that the funding of the OPRC will be allocated in accordance
with the procedural and substantive rules applying to state aid and valid at the time when
funds are allocated. The compliance of individual measures within the OP with the rules on
state aid and their relation to a concrete scheme of state aid will be defined in
implementing documents. In the implementation of the OP rules regulating the internal
market and in particular the rules of public procurement also determined in the Directives
2004/18/EC and 2004/17/EC as well as relevant provisions of the EU Treaty will be taken
into consideration.
As of July 1st 2013, the Ministry of Finance (MF) and the Croatian Competition Agency (CCA)
will be fully in charge of state aid issues in Croatia and will share all relevant
responsibilities, whereas the CCA will be specifically responsible for state aid issues
regarding EU programmes and projects and communication with DG COMP. A new Act to be
adopted until the date of the accession shall govern the specific relevant roles and
procedures, in line with all of the appropriate legal EU and national requirements. In line
with that it is foreseen the CCA shall:
- give its expert opinion on proposed state aid schemes with regard to their accordance
with the relevant state aid rules, and prior to their communication to the European
Commission (EC) services for the purposes of notification or approval on behalf of the
EC;
- give its expert opinion on state aid schemes exempt from the notification obligation to
the EC and inform the EC thereof;
- offer expert assistance to bodies in charge of preparation of state aid schemes and in
cases of complex specific single state aid cases;
- collect, process and archive data on granted state aid and inform EC thereof.
Page 110 / 135
The Croatian Competition Agency (CCA) is a legal person with public authority which was
established by the Decision of the Croatian Parliament of 20 September 1995 and became
operative in early 1997.
CCA independently and autonomously performs the activities within its scope and powers
and is accountable for the delivery of its objectives to the Croatian Parliament.
The responsibilities and powers of the CCA are regulated by the Competition Act (OG
79/09) which covers its activities in the area of antitrust and merger control, and the State
Aid Act (OG 140/05) which, in wider terms, involves competition relating to authorisation,
monitoring the implementation and possible recovery of State aid in all areas but
agriculture and fisheries. The CCA participated actively in the Croatian accession to the EU
negotiation process. Contacts and more exhaustive information can be found at
www.aztn.hr.
With regard to revenue-generating projects, specific eligibility rules will apply for both
business and tourism related infrastructure projects for which it is determined that they
will generate revenues. The terms and conditions for application of a Guidance Note on
Article 55 of Council Regulation (EC) 1083/2006: Revenue Generating Projects (COCOF
07/0074/04-EN), as well as method of calculation of expenditure in revenue-generating
projects are set in the specific Guidelines on the matter provided by the OPRC MA and
shall be respected by all other relevant national authorities and project promoters in the
preparation, co-financing calculation and implementation of such projects.
With regard to public procurement (PP), the Public Procurement Act (PPA) (OG 90/2011)
with all of the secondary legislation has entered into force and is fully aligned with the EU
acquis. Common National Rules on the conditions for preparation and implementation of
projects, that cover the issue of public procurement, prescribe full applicability of the same
rules in the context of CSF projects implementation.
For entities which do not fall under the scope of the PPA, a separate procedure has been
prepared and integrated into the Common National Rules and ensures sound use of the funds.
The Ministry of Economy and all other relevant authorities are taking steps to ensure that all
the national procurement procedures are in place and that sufficient capacities are
developed within Croatian authorities at national and local level, to implement the
mentioned Act applicable for the preparation of future ESI co-funded projects.
The key central PP institutions in the Republic of Croatia are the Directorate for the Public
Procurement System within the Ministry of Economy, the Ministry of Finance for
concessions, the Public-Private Partnership Agency for PPPs and the State Commission for
the Supervision of Public Procurement Procedures for review procedures
(www.javnanabava.hr). The competencies of the body responsible for the public
procurement system (PPS) include:
- development, improvement and coordination of the entire PPS;
- issuing opinions, instructions and provision of legal assistance in connection with the
application of the PPA and other regulations in the field of PP;
- proposals, preparation and coordination of the development of draft proposals of laws
and other regulations on PP;
- development of expert and normative bases for the integration of the Republic of
Croatia to the EU in the field of PP;
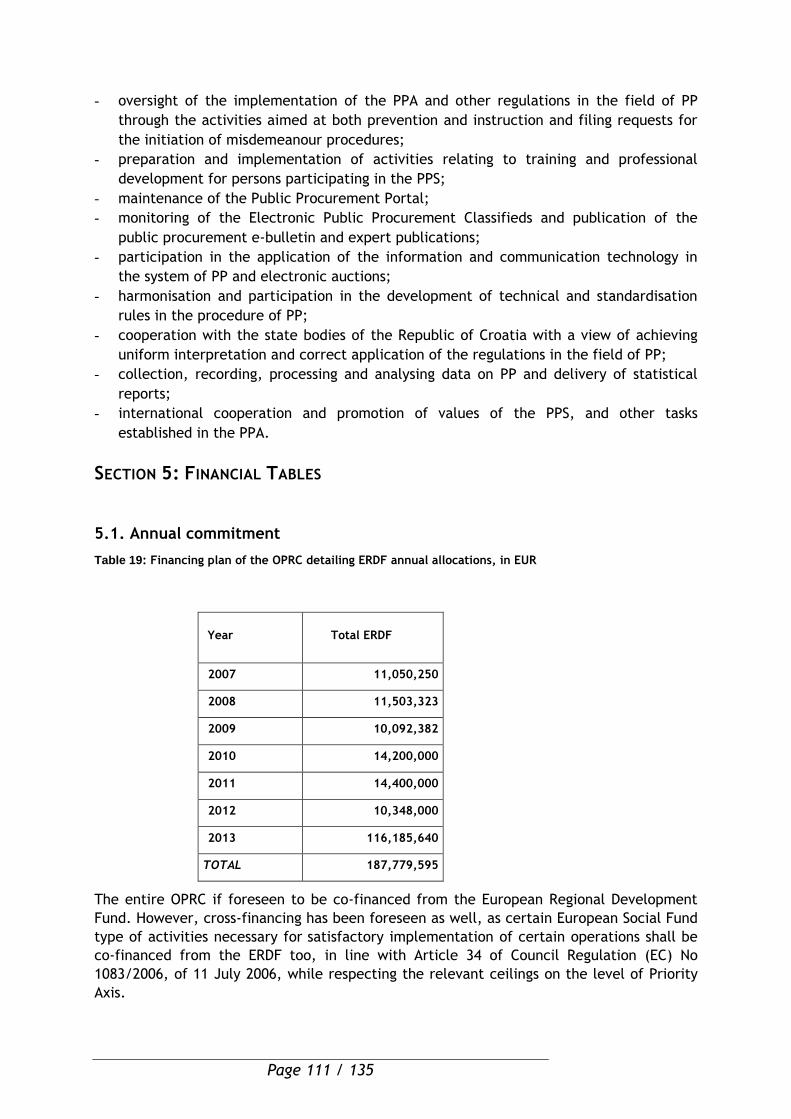
Page 111 / 135
- oversight of the implementation of the PPA and other regulations in the field of PP
through the activities aimed at both prevention and instruction and filing requests for
the initiation of misdemeanour procedures;
- preparation and implementation of activities relating to training and professional
development for persons participating in the PPS;
- maintenance of the Public Procurement Portal;
- monitoring of the Electronic Public Procurement Classifieds and publication of the
public procurement e-bulletin and expert publications;
- participation in the application of the information and communication technology in
the system of PP and electronic auctions;
- harmonisation and participation in the development of technical and standardisation
rules in the procedure of PP;
- cooperation with the state bodies of the Republic of Croatia with a view of achieving
uniform interpretation and correct application of the regulations in the field of PP;
- collection, recording, processing and analysing data on PP and delivery of statistical
reports;
- international cooperation and promotion of values of the PPS, and other tasks
established in the PPA.
SECTION 5: FINANCIAL TABLES
5.1. Annual commitment
Table 19: Financing plan of the OPRC detailing ERDF annual allocations, in EUR
Year Total ERDF
2007 11,050,250
2008 11,503,323
2009 10,092,382
2010 14,200,000
2011 14,400,000
2012 10,348,000
2013 116,185,640
TOTAL 187,779,595
The entire OPRC if foreseen to be co-financed from the European Regional Development
Fund. However, cross-financing has been foreseen as well, as certain European Social Fund
type of activities necessary for satisfactory implementation of certain operations shall be
co-financed from the ERDF too, in line with Article 34 of Council Regulation (EC) No
1083/2006, of 11 July 2006, while respecting the relevant ceilings on the level of Priority
Axis.
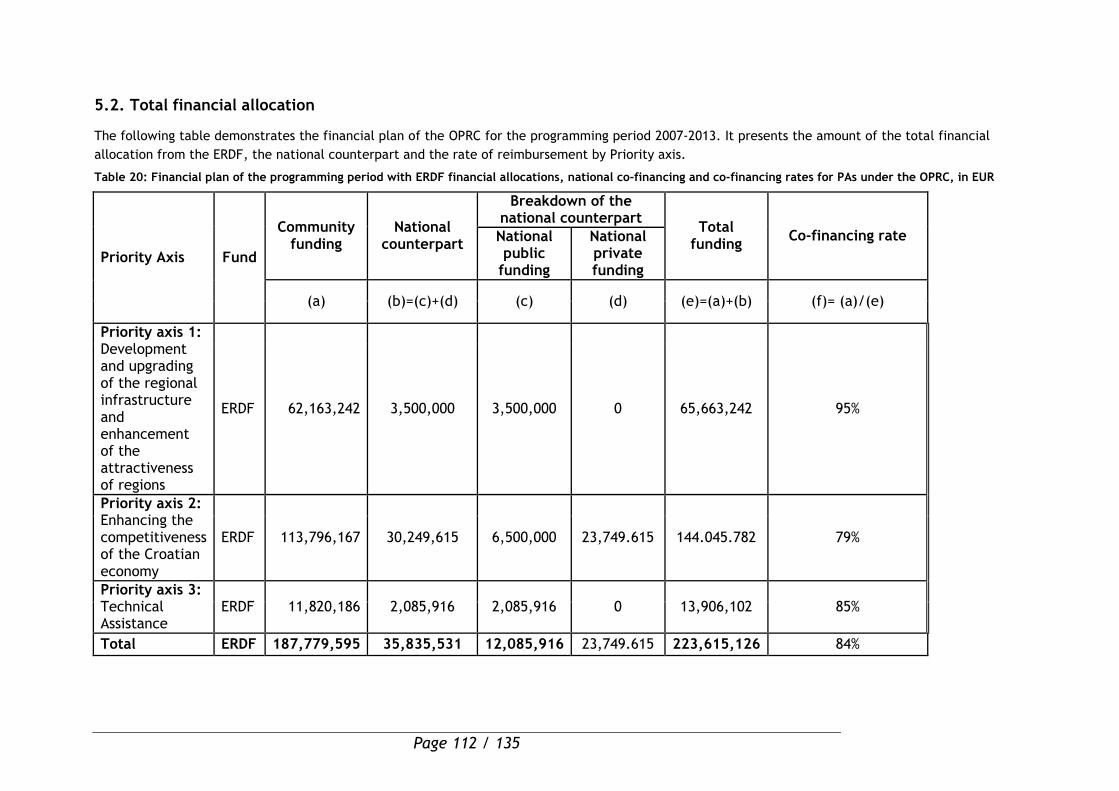
Page 112 / 135
5.2. Total financial allocation
The following table demonstrates the financial plan of the OPRC for the programming period 2007-2013. It presents the amount of the total financial
allocation from the ERDF, the national counterpart and the rate of reimbursement by Priority axis.
Table 20: Financial plan of the programming period with ERDF financial allocations, national co-financing and co-financing rates for PAs under the OPRC, in EUR
Priority Axis Fund
Community funding
National counterpart
Breakdown of the national counterpart
Total funding
Co-financing rate National public
funding
National private funding
(a) (b)=(c)+(d) (c) (d) (e)=(a)+(b) (f)= (a)/(e)
Priority axis 1: Development and upgrading of the regional infrastructure and enhancement of the attractiveness of regions
ERDF 62,163,242 3,500,000 3,500,000 0 65,663,242 95%
Priority axis 2: Enhancing the competitiveness of the Croatian economy
ERDF 113,796,167 30,249,615 6,500,000 23,749.615 144.045.782 79%
Priority axis 3: Technical Assistance
ERDF 11,820,186 2,085,916 2,085,916 0 13,906,102 85%
Total ERDF 187,779,595 35,835,531 12,085,916 23,749.615 223,615,126 84%
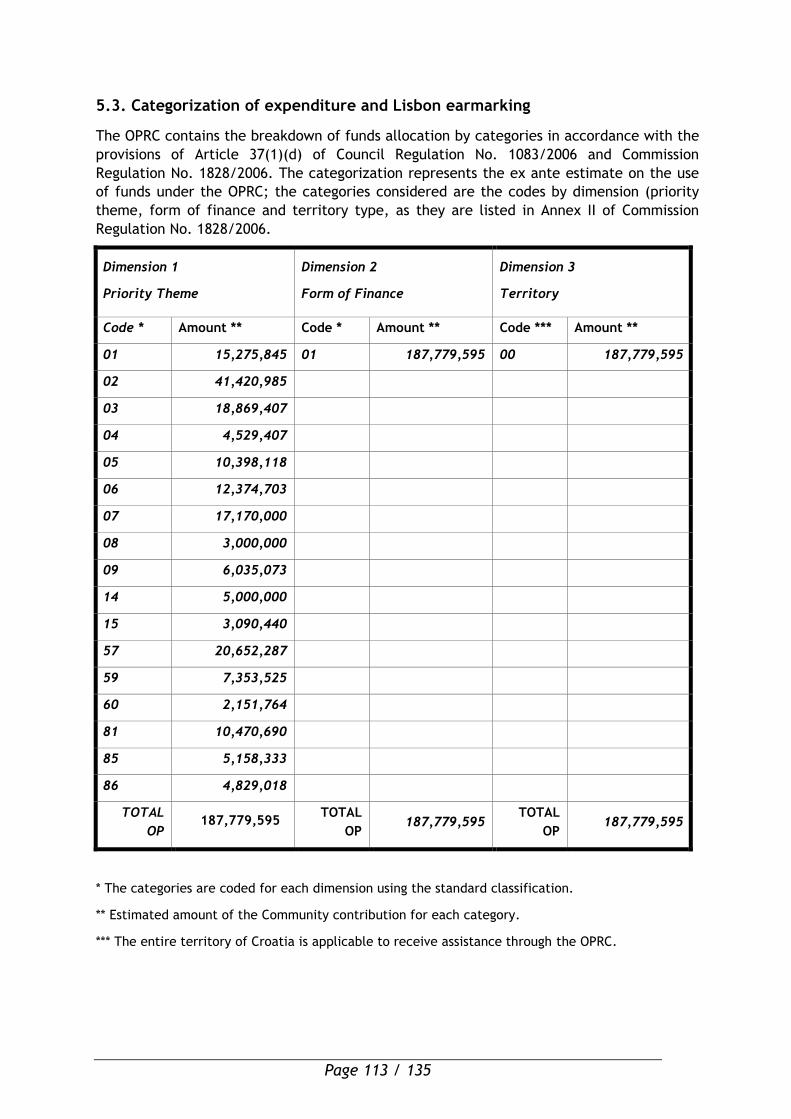
Page 113 / 135
5.3. Categorization of expenditure and Lisbon earmarking
The OPRC contains the breakdown of funds allocation by categories in accordance with the
provisions of Article 37(1)(d) of Council Regulation No. 1083/2006 and Commission
Regulation No. 1828/2006. The categorization represents the ex ante estimate on the use
of funds under the OPRC; the categories considered are the codes by dimension (priority
theme, form of finance and territory type, as they are listed in Annex II of Commission
Regulation No. 1828/2006.
Dimension 1
Priority Theme
Dimension 2
Form of Finance
Dimension 3
Territory
Code * Amount ** Code * Amount ** Code *** Amount **
01 15,275,845 01 187,779,595 00 187,779,595
02 41,420,985
03 18,869,407
04 4,529,407
05 10,398,118
06 12,374,703
07 17,170,000
08 3,000,000
09 6,035,073
14 5,000,000
15 3,090,440
57 20,652,287
59 7,353,525
60 2,151,764
81 10,470,690
85 5,158,333
86 4,829,018
TOTAL
OP 187,779,595
TOTAL
OP 187,779,595
TOTAL
OP 187,779,595
* The categories are coded for each dimension using the standard classification.
** Estimated amount of the Community contribution for each category.
*** The entire territory of Croatia is applicable to receive assistance through the OPRC.
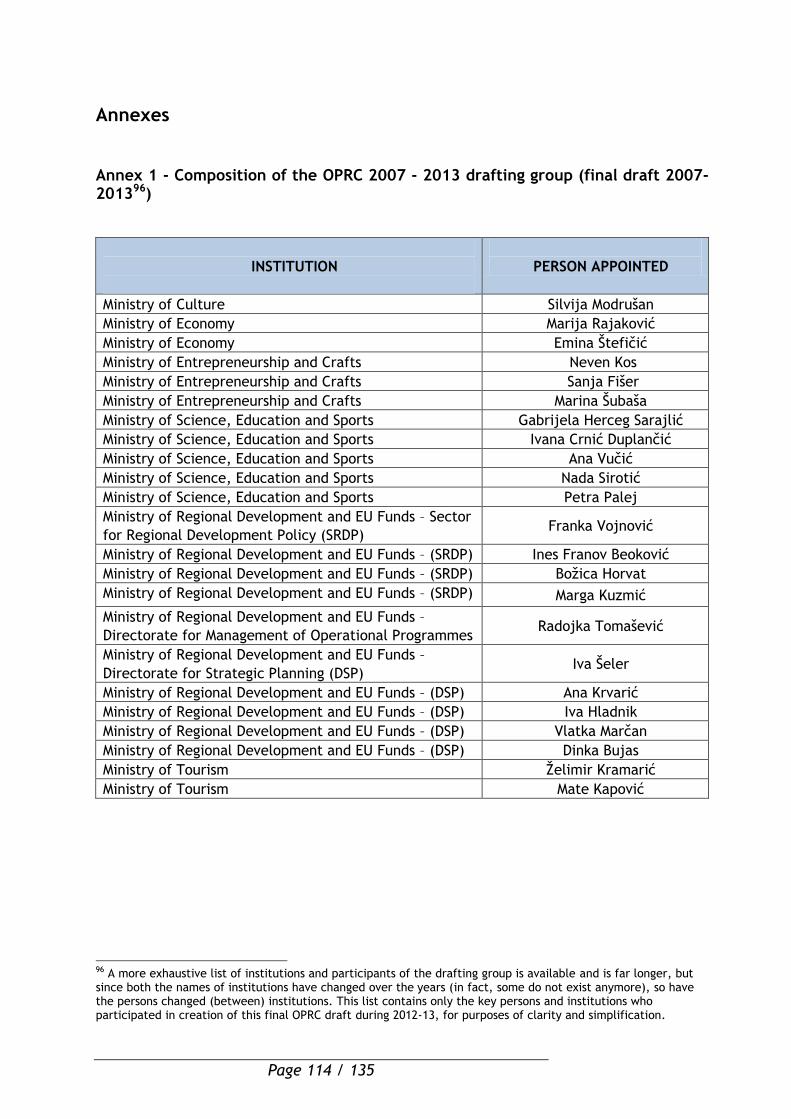
Page 114 / 135
Annexes
Annex 1 - Composition of the OPRC 2007 - 2013 drafting group (final draft 2007-201396)
INSTITUTION
PERSON APPOINTED
Ministry of Culture Silvija Modrušan
Ministry of Economy Marija Rajaković
Ministry of Economy Emina Štefičić
Ministry of Entrepreneurship and Crafts Neven Kos
Ministry of Entrepreneurship and Crafts Sanja Fišer
Ministry of Entrepreneurship and Crafts Marina Šubaša
Ministry of Science, Education and Sports Gabrijela Herceg Sarajlić
Ministry of Science, Education and Sports Ivana Crnić Duplančić
Ministry of Science, Education and Sports Ana Vučić
Ministry of Science, Education and Sports Nada Sirotić
Ministry of Science, Education and Sports Petra Palej
Ministry of Regional Development and EU Funds – Sector
for Regional Development Policy (SRDP) Franka Vojnović
Ministry of Regional Development and EU Funds – (SRDP) Ines Franov Beoković
Ministry of Regional Development and EU Funds – (SRDP) Božica Horvat
Ministry of Regional Development and EU Funds – (SRDP) Marga Kuzmić
Ministry of Regional Development and EU Funds –
Directorate for Management of Operational Programmes Radojka Tomašević
Ministry of Regional Development and EU Funds –
Directorate for Strategic Planning (DSP) Iva Šeler
Ministry of Regional Development and EU Funds – (DSP) Ana Krvarić
Ministry of Regional Development and EU Funds – (DSP) Iva Hladnik
Ministry of Regional Development and EU Funds – (DSP) Vlatka Marčan
Ministry of Regional Development and EU Funds – (DSP) Dinka Bujas
Ministry of Tourism Želimir Kramarić
Ministry of Tourism Mate Kapović
96 A more exhaustive list of institutions and participants of the drafting group is available and is far longer, but since both the names of institutions have changed over the years (in fact, some do not exist anymore), so have the persons changed (between) institutions. This list contains only the key persons and institutions who participated in creation of this final OPRC draft during 2012-13, for purposes of clarity and simplification.
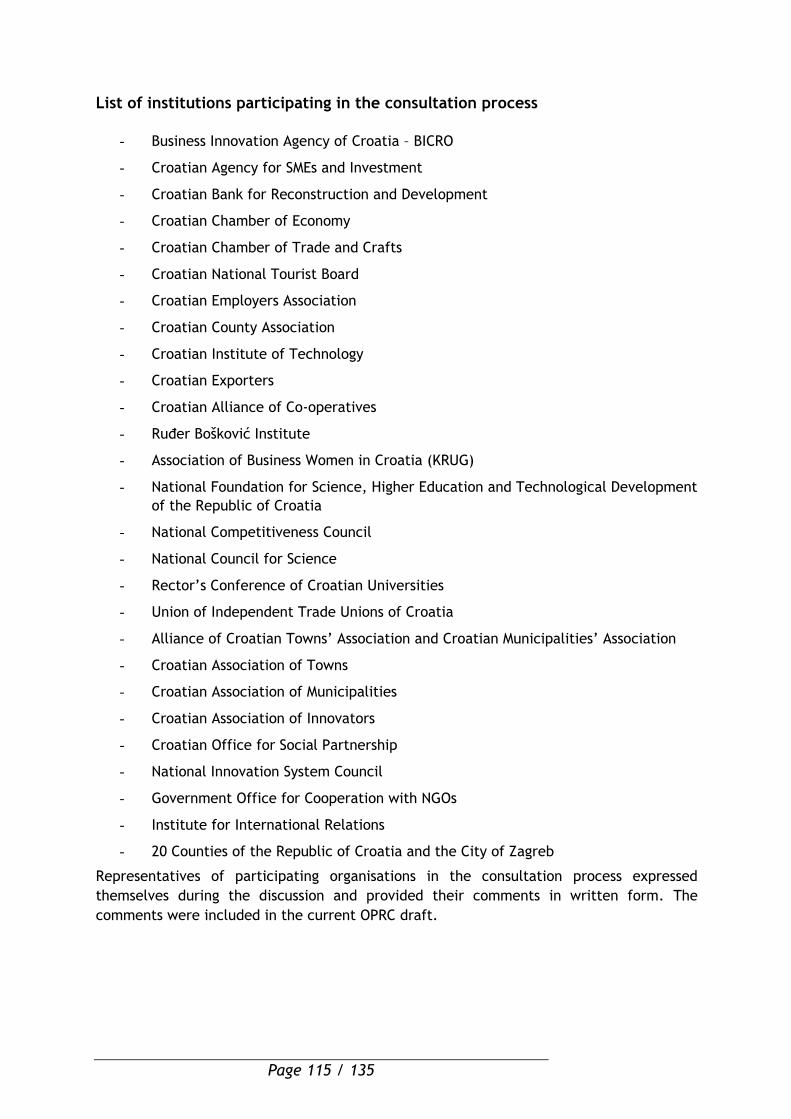
Page 115 / 135
List of institutions participating in the consultation process
- Business Innovation Agency of Croatia – BICRO
- Croatian Agency for SMEs and Investment
- Croatian Bank for Reconstruction and Development
- Croatian Chamber of Economy
- Croatian Chamber of Trade and Crafts
- Croatian National Tourist Board
- Croatian Employers Association
- Croatian County Association
- Croatian Institute of Technology
- Croatian Exporters
- Croatian Alliance of Co-operatives
- Ruđer Bošković Institute
- Association of Business Women in Croatia (KRUG)
- National Foundation for Science, Higher Education and Technological Development
of the Republic of Croatia
- National Competitiveness Council
- National Council for Science
- Rector’s Conference of Croatian Universities
- Union of Independent Trade Unions of Croatia
- Alliance of Croatian Towns’ Association and Croatian Municipalities’ Association
- Croatian Association of Towns
- Croatian Association of Municipalities
- Croatian Association of Innovators
- Croatian Office for Social Partnership
- National Innovation System Council
- Government Office for Cooperation with NGOs
- Institute for International Relations
- 20 Counties of the Republic of Croatia and the City of Zagreb
Representatives of participating organisations in the consultation process expressed
themselves during the discussion and provided their comments in written form. The
comments were included in the current OPRC draft.
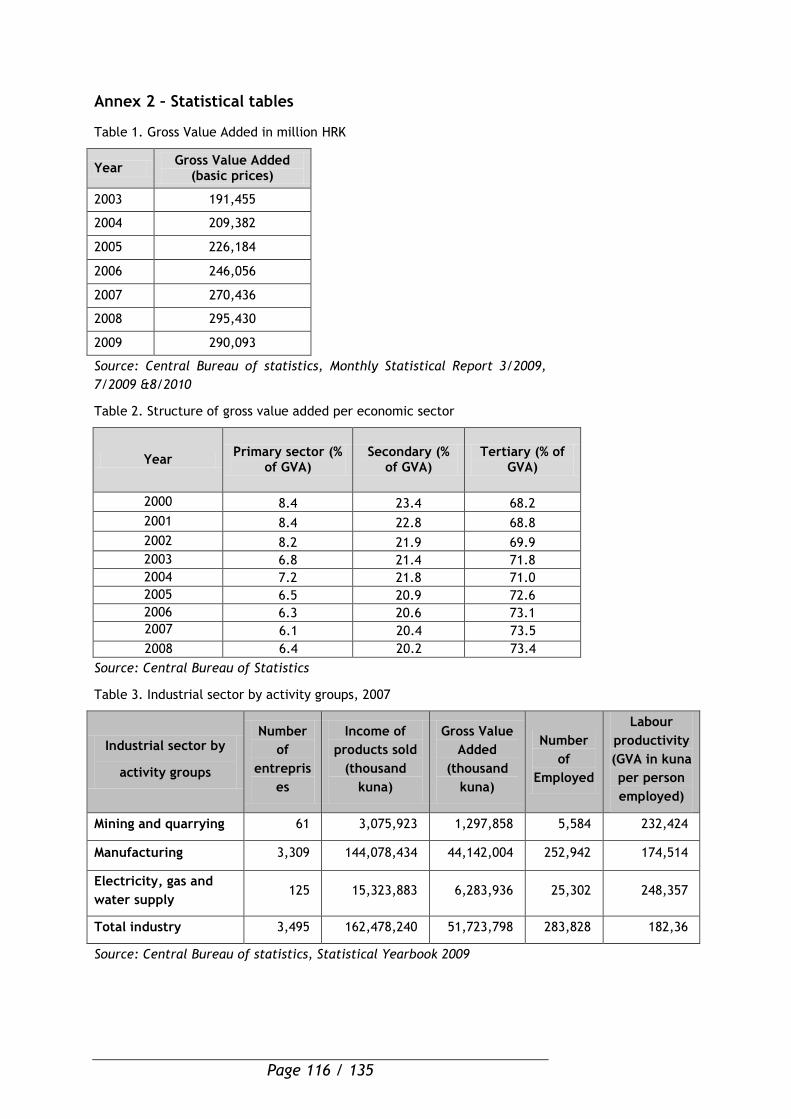
Page 116 / 135
Annex 2 – Statistical tables
Table 1. Gross Value Added in million HRK
Year Gross Value Added
(basic prices)
2003 191,455
2004 209,382
2005 226,184
2006 246,056
2007 270,436
2008 295,430
2009 290,093
Source: Central Bureau of statistics, Monthly Statistical Report 3/2009,
7/2009 &8/2010
Table 2. Structure of gross value added per economic sector
Year Primary sector (%
of GVA) Secondary (%
of GVA) Tertiary (% of
GVA)
2000 8.4 23.4 68.2
2001 8.4 22.8 68.8
2002 8.2 21.9 69.9
2003 6.8 21.4 71.8
2004 7.2 21.8 71.0
2005 6.5 20.9 72.6
2006 6.3 20.6 73.1
2007 6.1 20.4 73.5
2008 6.4 20.2 73.4
Source: Central Bureau of Statistics
Table 3. Industrial sector by activity groups, 2007
Industrial sector by
activity groups
Number
of
entrepris
es
Income of
products sold
(thousand
kuna)
Gross Value
Added
(thousand
kuna)
Number
of
Employed
Labour
productivity
(GVA in kuna
per person
employed)
Mining and quarrying 61 3,075,923 1,297,858 5,584 232,424
Manufacturing 3,309 144,078,434 44,142,004 252,942 174,514
Electricity, gas and
water supply 125 15,323,883 6,283,936 25,302 248,357
Total industry 3,495 162,478,240 51,723,798 283,828 182,36
Source: Central Bureau of statistics, Statistical Yearbook 2009
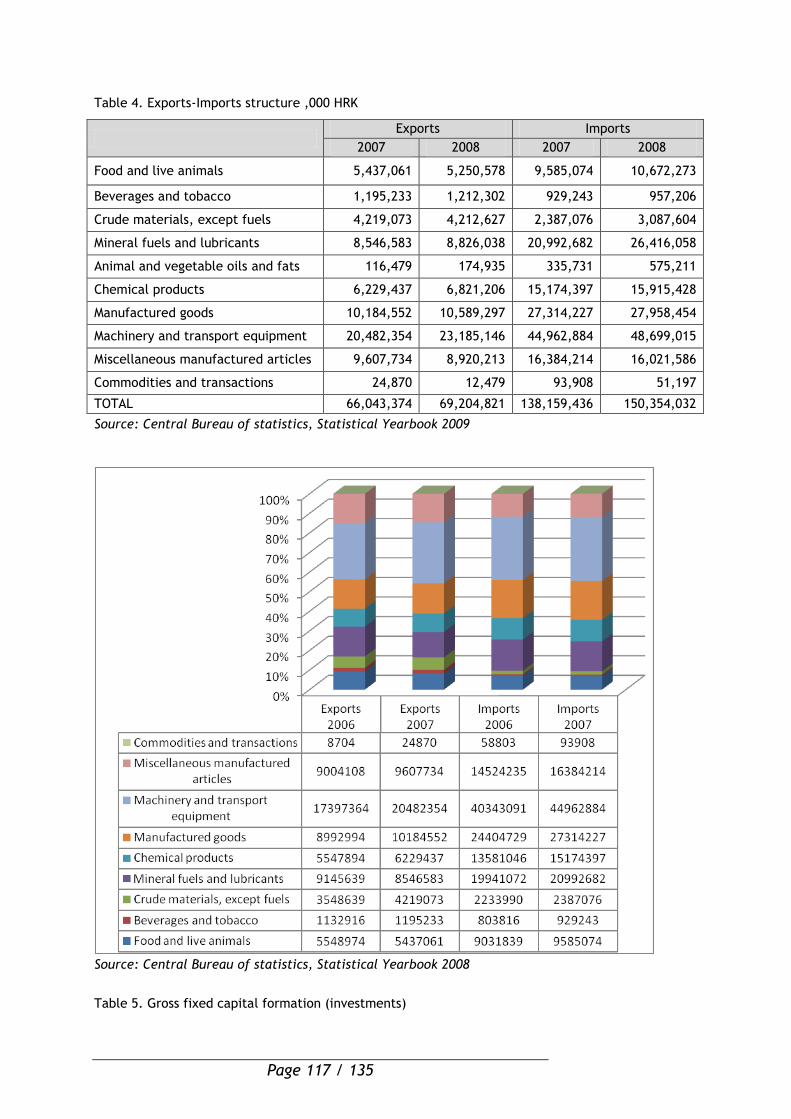
Page 117 / 135
Table 4. Exports-Imports structure ,000 HRK
Exports Imports
2007 2008 2007 2008
Food and live animals 5,437,061 5,250,578 9,585,074 10,672,273
Beverages and tobacco 1,195,233 1,212,302 929,243 957,206
Crude materials, except fuels 4,219,073 4,212,627 2,387,076 3,087,604
Mineral fuels and lubricants 8,546,583 8,826,038 20,992,682 26,416,058
Animal and vegetable oils and fats 116,479 174,935 335,731 575,211
Chemical products 6,229,437 6,821,206 15,174,397 15,915,428
Manufactured goods 10,184,552 10,589,297 27,314,227 27,958,454
Machinery and transport equipment 20,482,354 23,185,146 44,962,884 48,699,015
Miscellaneous manufactured articles 9,607,734 8,920,213 16,384,214 16,021,586
Commodities and transactions 24,870 12,479 93,908 51,197
TOTAL 66,043,374 69,204,821 138,159,436 150,354,032
Source: Central Bureau of statistics, Statistical Yearbook 2009
Source: Central Bureau of statistics, Statistical Yearbook 2008
Table 5. Gross fixed capital formation (investments)
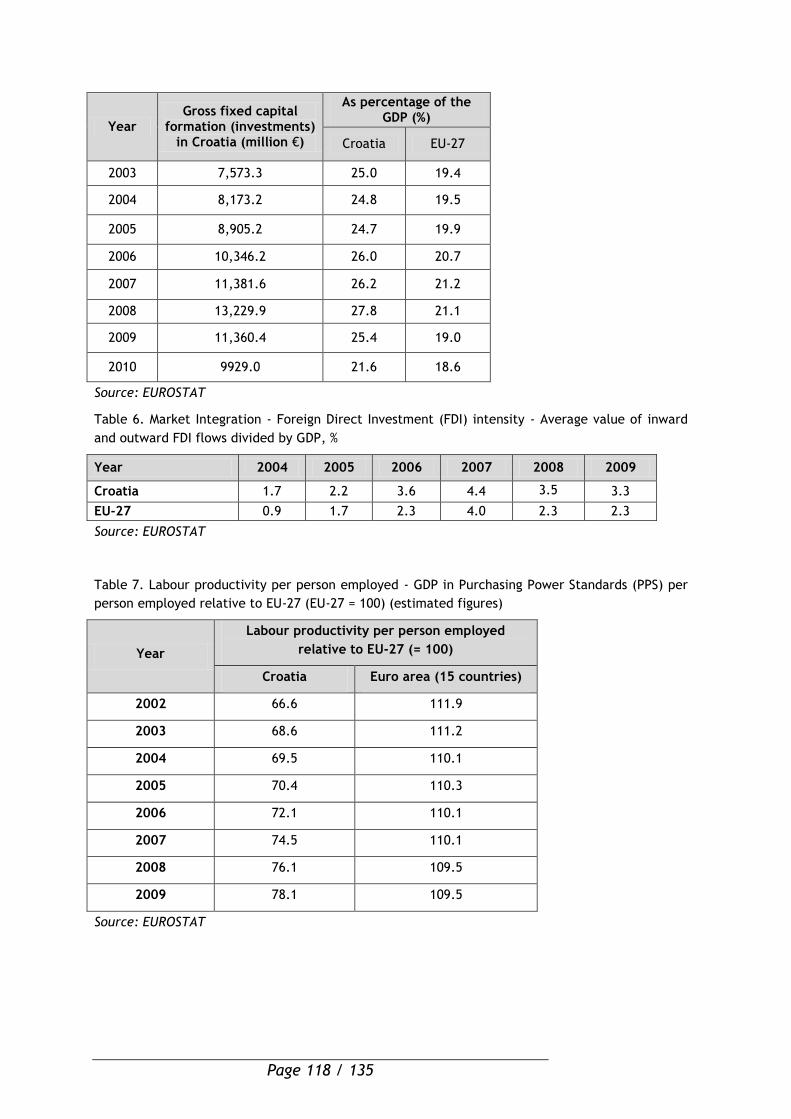
Page 118 / 135
Year Gross fixed capital
formation (investments) in Croatia (million €)
As percentage of the GDP (%)
Croatia EU-27
2003 7,573.3 25.0 19.4
2004 8,173.2 24.8 19.5
2005 8,905.2 24.7 19.9
2006 10,346.2 26.0 20.7
2007 11,381.6 26.2 21.2
2008 13,229.9 27.8 21.1
2009 11,360.4 25.4 19.0
2010 9929.0 21.6 18.6
Source: EUROSTAT
Table 6. Market Integration - Foreign Direct Investment (FDI) intensity - Average value of inward
and outward FDI flows divided by GDP, %
Year 2004 2005 2006 2007 2008 2009
Croatia 1.7 2.2 3.6 4.4 3.5 3.3
EU-27 0.9 1.7 2.3 4.0 2.3 2.3
Source: EUROSTAT
Table 7. Labour productivity per person employed - GDP in Purchasing Power Standards (PPS) per
person employed relative to EU-27 (EU-27 = 100) (estimated figures)
Year
Labour productivity per person employed
relative to EU-27 (= 100)
Croatia Euro area (15 countries)
2002 66.6 111.9
2003 68.6 111.2
2004 69.5 110.1
2005 70.4 110.3
2006 72.1 110.1
2007 74.5 110.1
2008 76.1 109.5
2009 78.1 109.5
Source: EUROSTAT
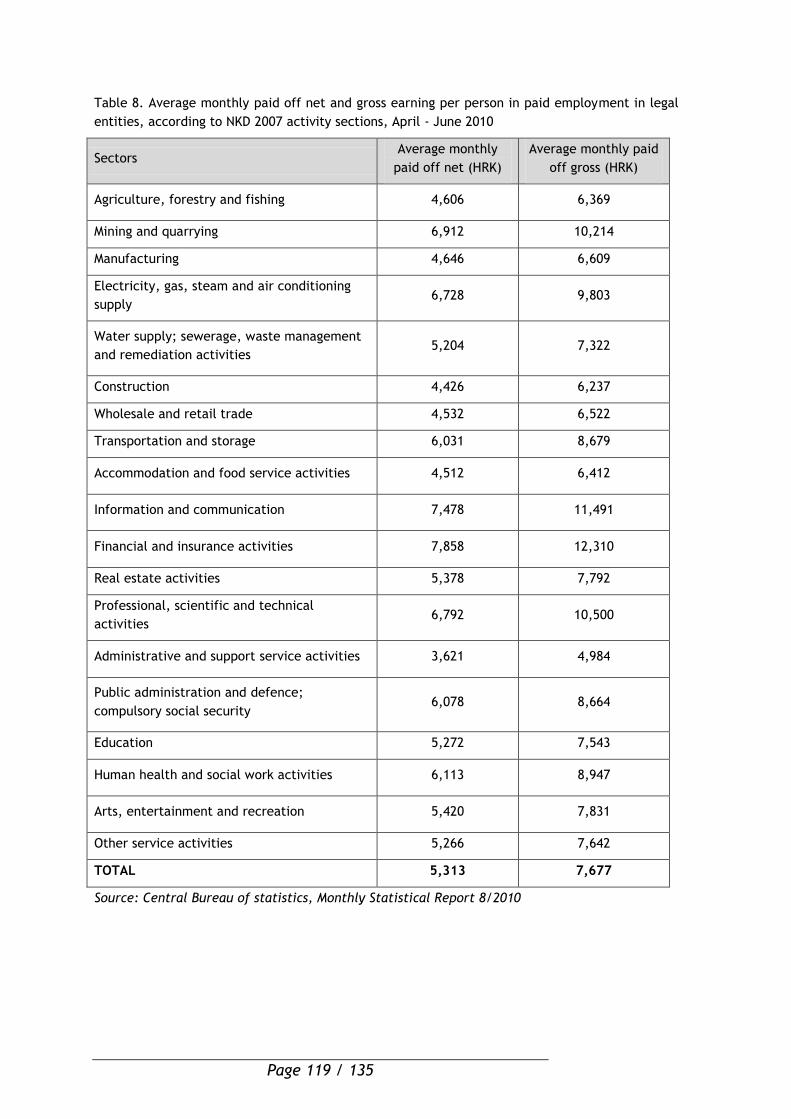
Page 119 / 135
Table 8. Average monthly paid off net and gross earning per person in paid employment in legal
entities, according to NKD 2007 activity sections, April - June 2010
Sectors Average monthly
paid off net (HRK)
Average monthly paid
off gross (HRK)
Agriculture, forestry and fishing 4,606 6,369
Mining and quarrying 6,912 10,214
Manufacturing 4,646 6,609
Electricity, gas, steam and air conditioning
supply 6,728 9,803
Water supply; sewerage, waste management
and remediation activities 5,204 7,322
Construction 4,426 6,237
Wholesale and retail trade 4,532 6,522
Transportation and storage 6,031 8,679
Accommodation and food service activities 4,512 6,412
Information and communication 7,478 11,491
Financial and insurance activities 7,858 12,310
Real estate activities 5,378 7,792
Professional, scientific and technical
activities 6,792 10,500
Administrative and support service activities 3,621 4,984
Public administration and defence;
compulsory social security 6,078 8,664
Education 5,272 7,543
Human health and social work activities 6,113 8,947
Arts, entertainment and recreation 5,420 7,831
Other service activities 5,266 7,642
TOTAL 5,313 7,677
Source: Central Bureau of statistics, Monthly Statistical Report 8/2010
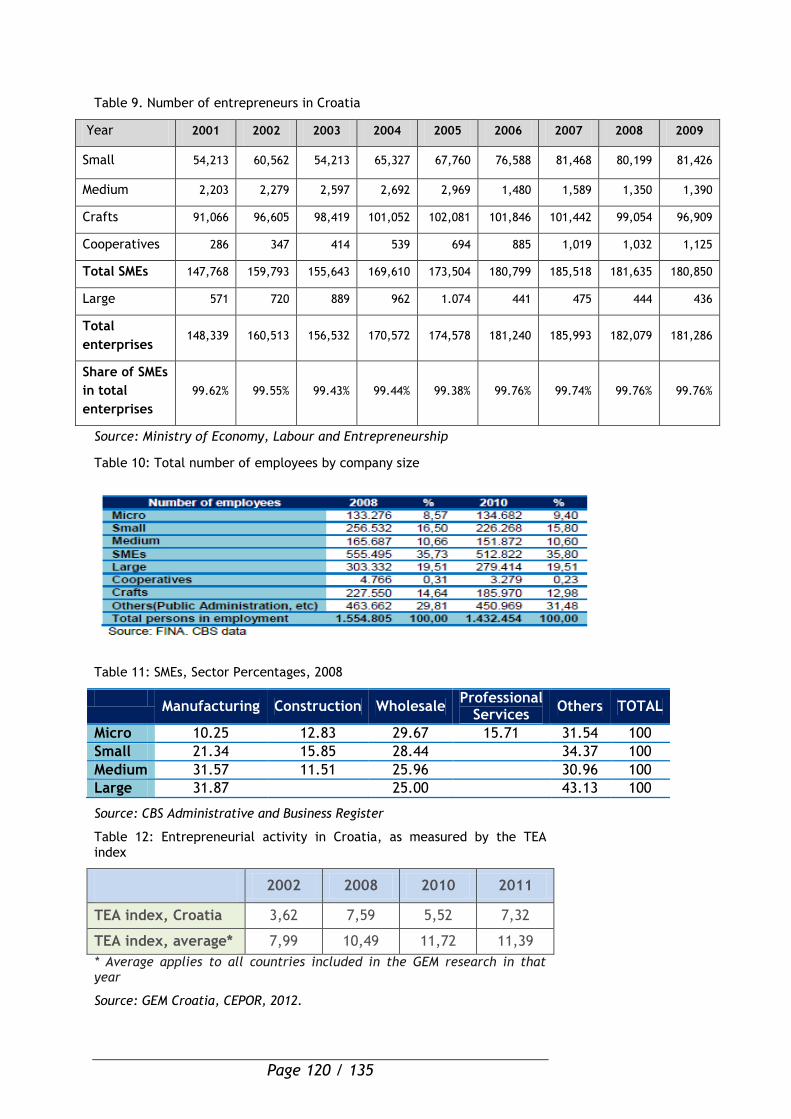
Page 120 / 135
Table 9. Number of entrepreneurs in Croatia
Year 2001 2002 2003 2004 2005 2006 2007 2008 2009
Small 54,213 60,562 54,213 65,327 67,760 76,588 81,468 80,199 81,426
Medium 2,203 2,279 2,597 2,692 2,969 1,480 1,589 1,350 1,390
Crafts 91,066 96,605 98,419 101,052 102,081 101,846 101,442 99,054 96,909
Cooperatives 286 347 414 539 694 885 1,019 1,032 1,125
Total SMEs 147,768 159,793 155,643 169,610 173,504 180,799 185,518 181,635 180,850
Large 571 720 889 962 1.074 441 475 444 436
Total
enterprises 148,339 160,513 156,532 170,572 174,578 181,240 185,993 182,079 181,286
Share of SMEs
in total
enterprises
99.62% 99.55% 99.43% 99.44% 99.38% 99.76% 99.74% 99.76% 99.76%
Source: Ministry of Economy, Labour and Entrepreneurship
Table 10: Total number of employees by company size
Table 11: SMEs, Sector Percentages, 2008
Manufacturing Construction Wholesale
Professional Services
Others TOTAL
Micro 10.25 12.83 29.67 15.71 31.54 100
Small 21.34 15.85 28.44 34.37 100
Medium 31.57 11.51 25.96 30.96 100
Large 31.87 25.00 43.13 100
Source: CBS Administrative and Business Register
Table 12: Entrepreneurial activity in Croatia, as measured by the TEA index
2002 2008 2010 2011
TEA index, Croatia 3,62 7,59 5,52 7,32
TEA index, average* 7,99 10,49 11,72 11,39
* Average applies to all countries included in the GEM research in that year
Source: GEM Croatia, CEPOR, 2012.
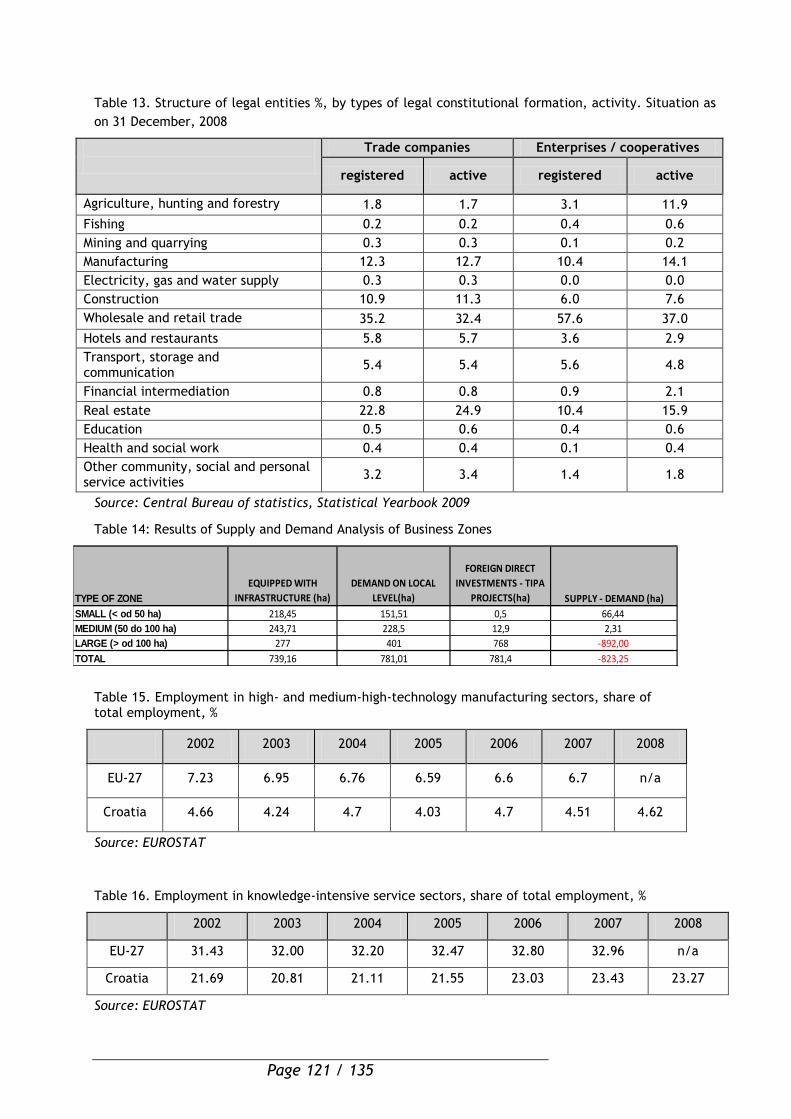
Page 121 / 135
Table 13. Structure of legal entities %, by types of legal constitutional formation, activity. Situation as
on 31 December, 2008
Trade companies Enterprises / cooperatives
registered active registered active
Agriculture, hunting and forestry 1.8 1.7 3.1 11.9
Fishing 0.2 0.2 0.4 0.6
Mining and quarrying 0.3 0.3 0.1 0.2
Manufacturing 12.3 12.7 10.4 14.1
Electricity, gas and water supply 0.3 0.3 0.0 0.0
Construction 10.9 11.3 6.0 7.6
Wholesale and retail trade 35.2 32.4 57.6 37.0
Hotels and restaurants 5.8 5.7 3.6 2.9
Transport, storage and communication
5.4 5.4 5.6 4.8
Financial intermediation 0.8 0.8 0.9 2.1
Real estate 22.8 24.9 10.4 15.9
Education 0.5 0.6 0.4 0.6
Health and social work 0.4 0.4 0.1 0.4
Other community, social and personal service activities
3.2 3.4 1.4 1.8
Source: Central Bureau of statistics, Statistical Yearbook 2009
Table 14: Results of Supply and Demand Analysis of Business Zones
Table 15. Employment in high- and medium-high-technology manufacturing sectors, share of total employment, %
2002 2003 2004 2005 2006 2007 2008
EU-27 7.23 6.95 6.76 6.59 6.6 6.7 n/a
Croatia 4.66 4.24 4.7 4.03 4.7 4.51 4.62
Source: EUROSTAT
Table 16. Employment in knowledge-intensive service sectors, share of total employment, %
2002 2003 2004 2005 2006 2007 2008
EU-27 31.43 32.00 32.20 32.47 32.80 32.96 n/a
Croatia 21.69 20.81 21.11 21.55 23.03 23.43 23.27
Source: EUROSTAT
TYPE OF ZONE
EQUIPPED WITH
INFRASTRUCTURE (ha)
DEMAND ON LOCAL
LEVEL(ha)
FOREIGN DIRECT
INVESTMENTS - TIPA
PROJECTS(ha) SUPPLY - DEMAND (ha)
SMALL (< od 50 ha) 218,45 151,51 0,5 66,44
MEDIUM (50 do 100 ha) 243,71 228,5 12,9 2,31
LARGE (> od 100 ha) 277 401 768 -892,00
TOTAL 739,16 781,01 781,4 -823,25
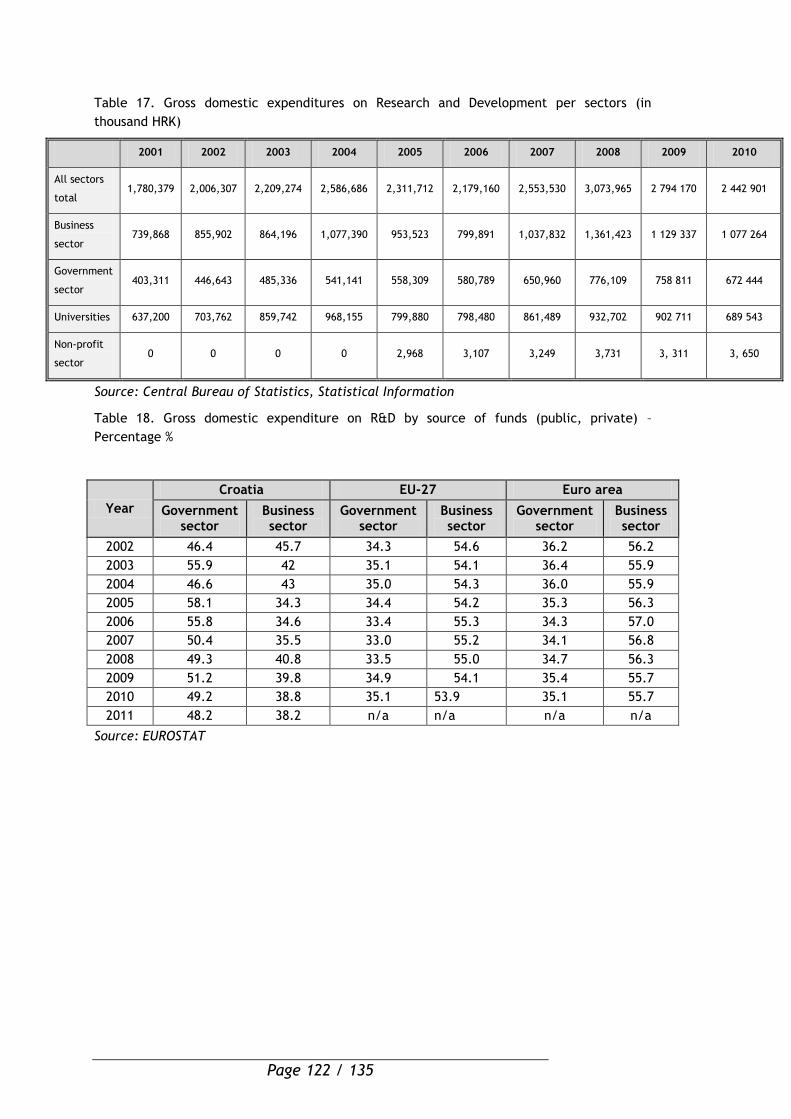
Page 122 / 135
Table 17. Gross domestic expenditures on Research and Development per sectors (in
thousand HRK)
2001 2002 2003 2004 2005 2006 2007 2008 2009 2010
All sectors
total 1,780,379 2,006,307 2,209,274 2,586,686 2,311,712 2,179,160 2,553,530 3,073,965 2 794 170 2 442 901
Business
sector 739,868 855,902 864,196 1,077,390 953,523 799,891 1,037,832 1,361,423 1 129 337 1 077 264
Government
sector 403,311 446,643 485,336 541,141 558,309 580,789 650,960 776,109 758 811 672 444
Universities 637,200 703,762 859,742 968,155 799,880 798,480 861,489 932,702 902 711 689 543
Non-profit
sector 0 0 0 0 2,968 3,107 3,249 3,731 3, 311 3, 650
Source: Central Bureau of Statistics, Statistical Information
Table 18. Gross domestic expenditure on R&D by source of funds (public, private) –
Percentage %
Year
Croatia EU-27 Euro area
Government sector
Business sector
Government sector
Business sector
Government sector
Business sector
2002 46.4 45.7 34.3 54.6 36.2 56.2
2003 55.9 42 35.1 54.1 36.4 55.9
2004 46.6 43 35.0 54.3 36.0 55.9
2005 58.1 34.3 34.4 54.2 35.3 56.3
2006 55.8 34.6 33.4 55.3 34.3 57.0
2007 50.4 35.5 33.0 55.2 34.1 56.8
2008 49.3 40.8 33.5 55.0 34.7 56.3
2009 51.2 39.8 34.9 54.1 35.4 55.7
2010 49.2 38.8 35.1 53.9 35.1 55.7
2011 48.2 38.2 n/a n/a n/a n/a
Source: EUROSTAT
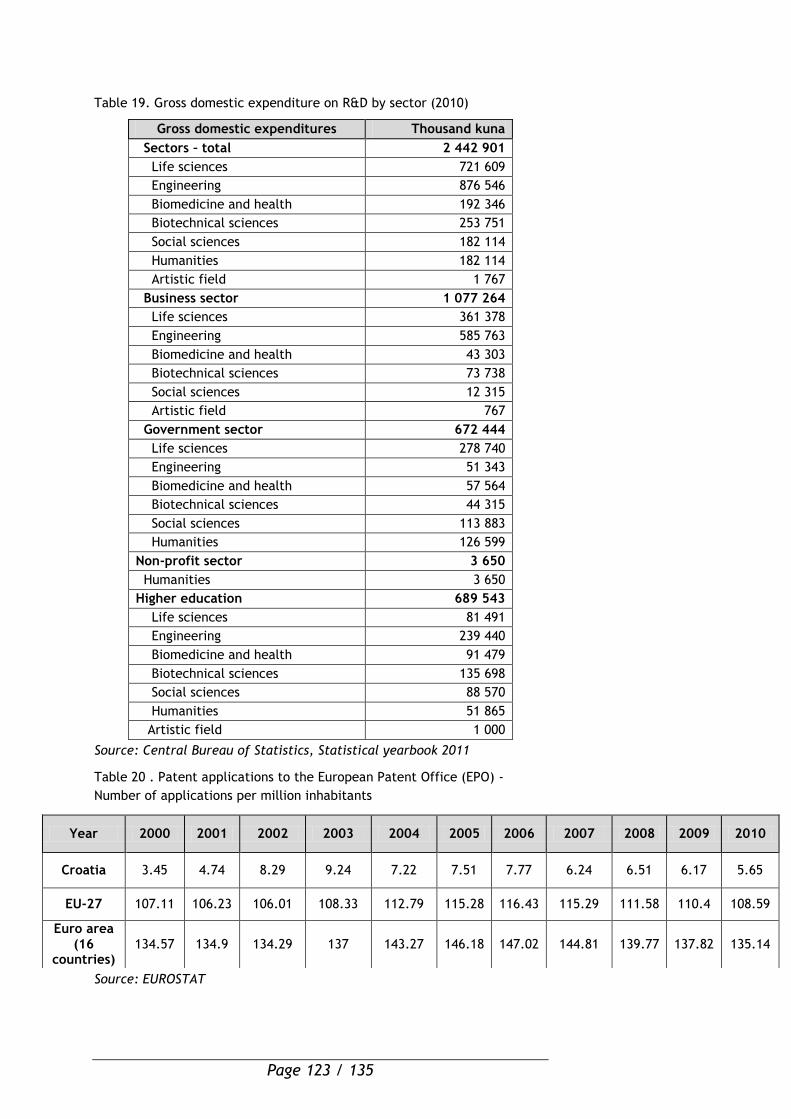
Page 123 / 135
Table 19. Gross domestic expenditure on R&D by sector (2010)
Gross domestic expenditures Thousand kuna
Sectors – total 2 442 901
Life sciences 721 609
Engineering 876 546
Biomedicine and health 192 346
Biotechnical sciences 253 751
Social sciences 182 114
Humanities 182 114
Artistic field 1 767
Business sector 1 077 264
Life sciences 361 378
Engineering 585 763
Biomedicine and health 43 303
Biotechnical sciences 73 738
Social sciences 12 315
Artistic field 767
Government sector 672 444
Life sciences 278 740
Engineering 51 343
Biomedicine and health 57 564
Biotechnical sciences 44 315
Social sciences 113 883
Humanities 126 599
Non-profit sector 3 650
Humanities 3 650
Higher education 689 543
Life sciences 81 491
Engineering 239 440
Biomedicine and health 91 479
Biotechnical sciences 135 698
Social sciences 88 570
Humanities 51 865
Artistic field 1 000
Source: Central Bureau of Statistics, Statistical yearbook 2011
Table 20 . Patent applications to the European Patent Office (EPO) -
Number of applications per million inhabitants
Source: EUROSTAT
Year 2000 2001 2002 2003 2004 2005 2006 2007 2008 2009 2010
Croatia 3.45 4.74 8.29 9.24 7.22 7.51 7.77 6.24 6.51 6.17 5.65
EU-27 107.11 106.23 106.01 108.33 112.79 115.28 116.43 115.29 111.58 110.4 108.59
Euro area (16
countries) 134.57 134.9 134.29 137 143.27 146.18 147.02 144.81 139.77 137.82 135.14
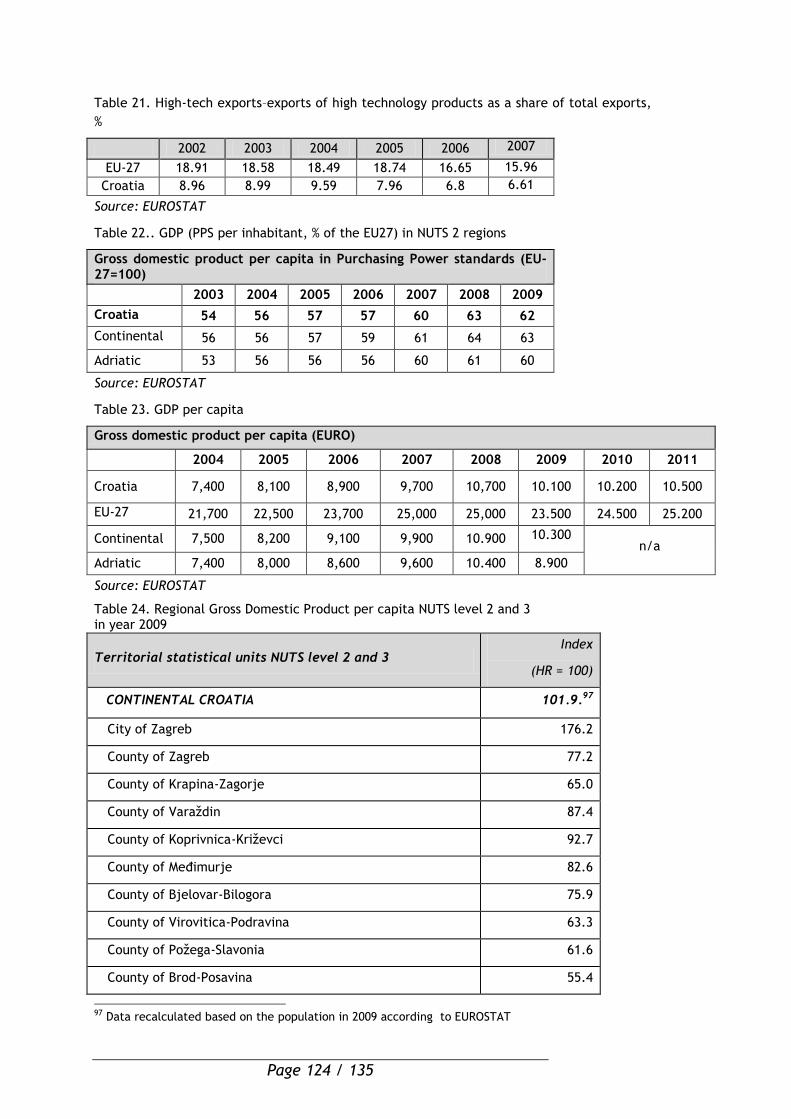
Page 124 / 135
Table 21. High-tech exports–exports of high technology products as a share of total exports,
%
2002 2003 2004 2005 2006 2007
EU-27 18.91 18.58 18.49 18.74 16.65 15.96
Croatia 8.96 8.99 9.59 7.96 6.8 6.61
Source: EUROSTAT
Table 22.. GDP (PPS per inhabitant, % of the EU27) in NUTS 2 regions
Gross domestic product per capita in Purchasing Power standards (EU-27=100)
2003 2004 2005 2006 2007 2008 2009
Croatia 54 56 57 57 60 63 62
Continental 56 56 57 59 61 64 63
Adriatic 53 56 56 56 60 61 60
Source: EUROSTAT
Table 23. GDP per capita
Gross domestic product per capita (EURO)
2004 2005 2006 2007 2008 2009 2010 2011
Croatia 7,400 8,100 8,900 9,700 10,700 10.100 10.200 10.500
EU-27 21,700 22,500 23,700 25,000 25,000 23.500 24.500 25.200
Continental 7,500 8,200 9,100 9,900 10.900 10.300 n/a
Adriatic 7,400 8,000 8,600 9,600 10.400 8.900
Source: EUROSTAT
Table 24. Regional Gross Domestic Product per capita NUTS level 2 and 3 in year 2009
Territorial statistical units NUTS level 2 and 3 Index
(HR = 100)
CONTINENTAL CROATIA 101.9.97
City of Zagreb 176.2
County of Zagreb 77.2
County of Krapina-Zagorje 65.0
County of Varaždin 87.4
County of Koprivnica-Križevci 92.7
County of Međimurje 82.6
County of Bjelovar-Bilogora 75.9
County of Virovitica-Podravina 63.3
County of Požega-Slavonia 61.6
County of Brod-Posavina 55.4
97 Data recalculated based on the population in 2009 according to EUROSTAT
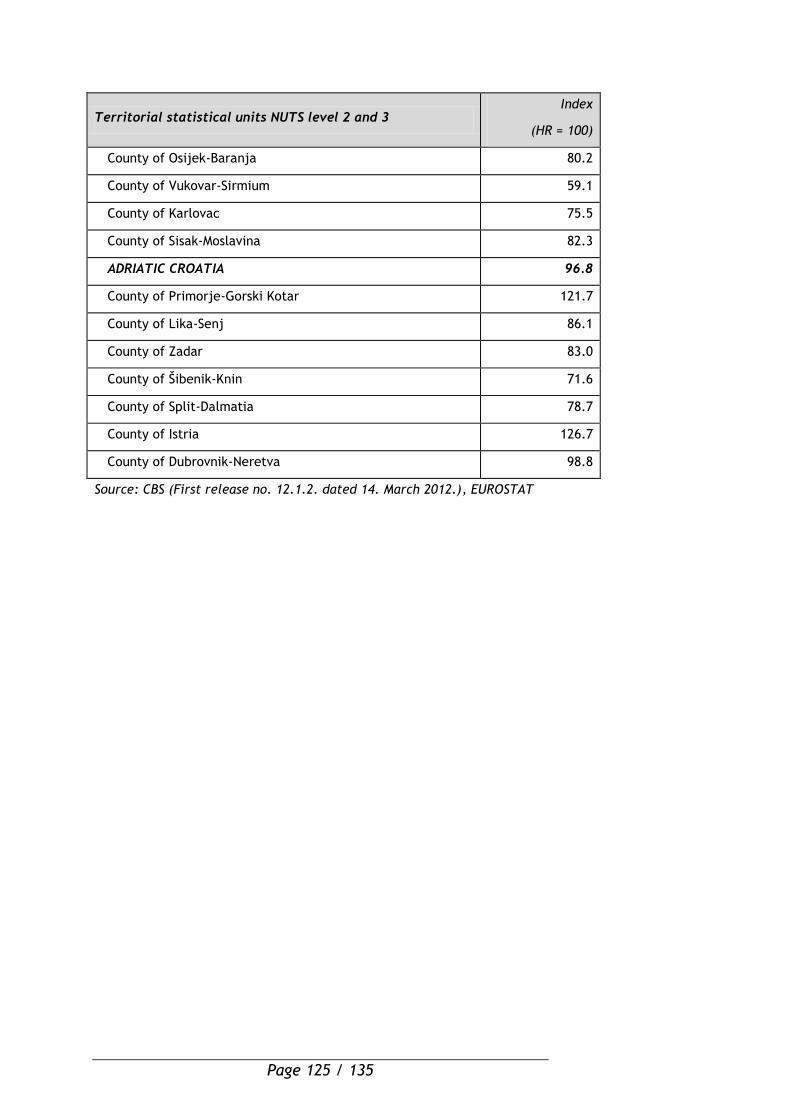
Page 125 / 135
Territorial statistical units NUTS level 2 and 3 Index
(HR = 100)
County of Osijek-Baranja 80.2
County of Vukovar-Sirmium 59.1
County of Karlovac 75.5
County of Sisak-Moslavina 82.3
ADRIATIC CROATIA 96.8
County of Primorje-Gorski Kotar 121.7
County of Lika-Senj 86.1
County of Zadar 83.0
County of Šibenik-Knin 71.6
County of Split-Dalmatia 78.7
County of Istria 126.7
County of Dubrovnik-Neretva 98.8
Source: CBS (First release no. 12.1.2. dated 14. March 2012.), EUROSTAT
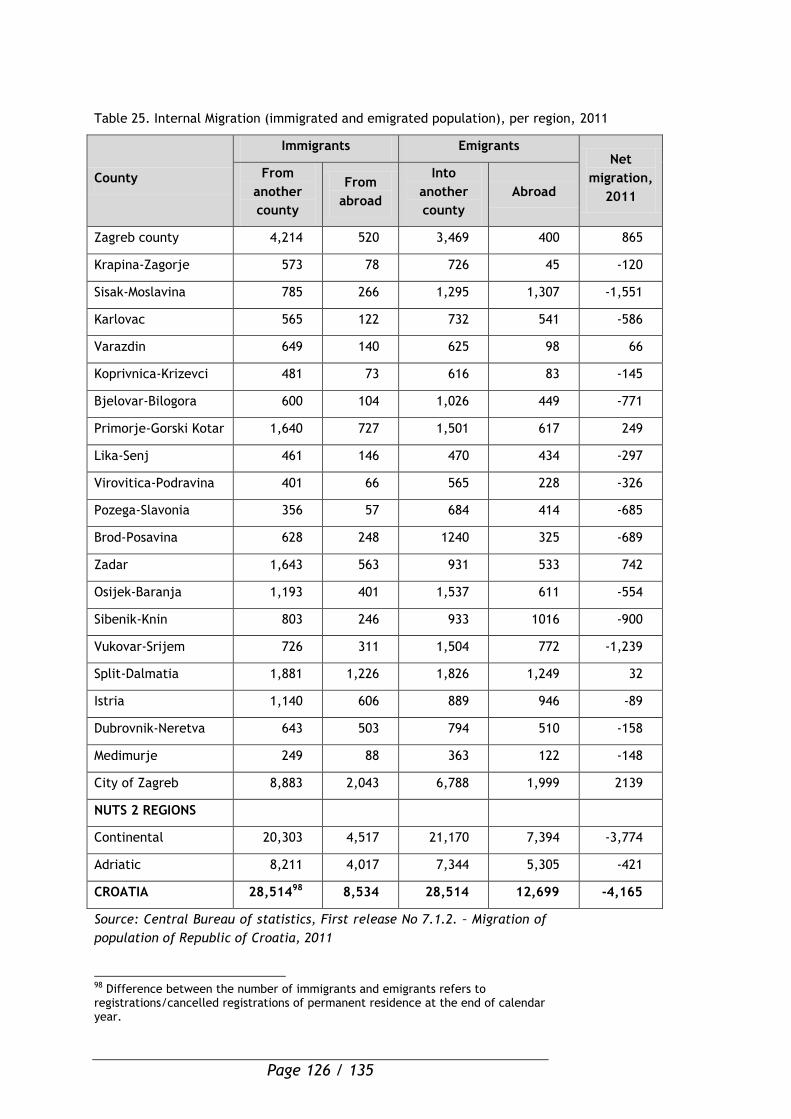
Page 126 / 135
Table 25. Internal Migration (immigrated and emigrated population), per region, 2011
County
Immigrants Emigrants Net
migration,
2011
From
another
county
From
abroad
Into
another
county
Abroad
Zagreb county 4,214 520 3,469 400 865
Krapina-Zagorje 573 78 726 45 -120
Sisak-Moslavina 785 266 1,295 1,307 -1,551
Karlovac 565 122 732 541 -586
Varazdin 649 140 625 98 66
Koprivnica-Krizevci 481 73 616 83 -145
Bjelovar-Bilogora 600 104 1,026 449 -771
Primorje-Gorski Kotar 1,640 727 1,501 617 249
Lika-Senj 461 146 470 434 -297
Virovitica-Podravina 401 66 565 228 -326
Pozega-Slavonia 356 57 684 414 -685
Brod-Posavina 628 248 1240 325 -689
Zadar 1,643 563 931 533 742
Osijek-Baranja 1,193 401 1,537 611 -554
Sibenik-Knin 803 246 933 1016 -900
Vukovar-Srijem 726 311 1,504 772 -1,239
Split-Dalmatia 1,881 1,226 1,826 1,249 32
Istria 1,140 606 889 946 -89
Dubrovnik-Neretva 643 503 794 510 -158
Medimurje 249 88 363 122 -148
City of Zagreb 8,883 2,043 6,788 1,999 2139
NUTS 2 REGIONS
Continental 20,303 4,517 21,170 7,394 -3,774
Adriatic 8,211 4,017 7,344 5,305 -421
CROATIA 28,51498 8,534 28,514 12,699 -4,165
Source: Central Bureau of statistics, First release No 7.1.2. – Migration of
population of Republic of Croatia, 2011
98 Difference between the number of immigrants and emigrants refers to registrations/cancelled registrations of permanent residence at the end of calendar year.
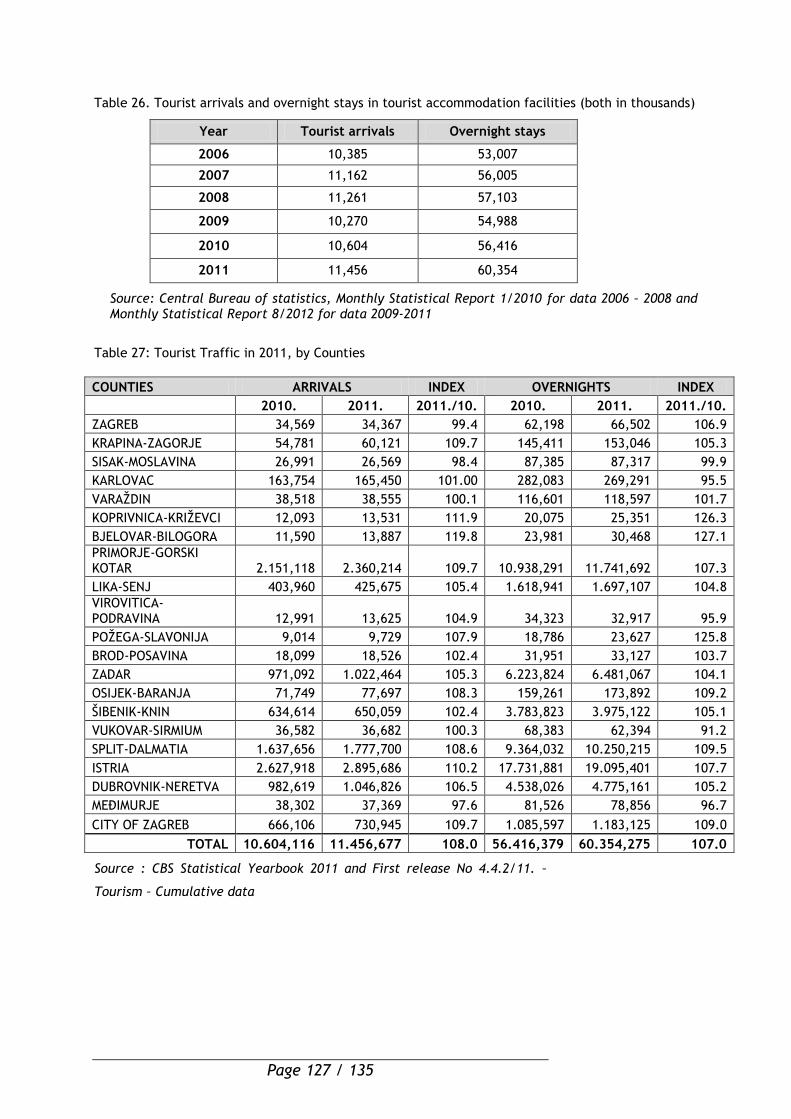
Page 127 / 135
Table 26. Tourist arrivals and overnight stays in tourist accommodation facilities (both in thousands)
Year Tourist arrivals Overnight stays
2006 10,385 53,007
2007 11,162 56,005
2008 11,261 57,103
2009 10,270 54,988
2010 10,604 56,416
2011 11,456 60,354
Source: Central Bureau of statistics, Monthly Statistical Report 1/2010 for data 2006 – 2008 and Monthly Statistical Report 8/2012 for data 2009-2011
Table 27: Tourist Traffic in 2011, by Counties
COUNTIES ARRIVALS INDEX OVERNIGHTS INDEX
2010. 2011. 2011./10. 2010. 2011. 2011./10.
ZAGREB 34,569 34,367 99.4 62,198 66,502 106.9
KRAPINA-ZAGORJE 54,781 60,121 109.7 145,411 153,046 105.3
SISAK-MOSLAVINA 26,991 26,569 98.4 87,385 87,317 99.9
KARLOVAC 163,754 165,450 101.00 282,083 269,291 95.5
VARAŽDIN 38,518 38,555 100.1 116,601 118,597 101.7
KOPRIVNICA-KRIŽEVCI 12,093 13,531 111.9 20,075 25,351 126.3
BJELOVAR-BILOGORA 11,590 13,887 119.8 23,981 30,468 127.1
PRIMORJE-GORSKI KOTAR 2.151,118 2.360,214 109.7 10.938,291 11.741,692 107.3
LIKA-SENJ 403,960 425,675 105.4 1.618,941 1.697,107 104.8
VIROVITICA-PODRAVINA 12,991 13,625 104.9 34,323 32,917 95.9
POŽEGA-SLAVONIJA 9,014 9,729 107.9 18,786 23,627 125.8
BROD-POSAVINA 18,099 18,526 102.4 31,951 33,127 103.7
ZADAR 971,092 1.022,464 105.3 6.223,824 6.481,067 104.1
OSIJEK-BARANJA 71,749 77,697 108.3 159,261 173,892 109.2
ŠIBENIK-KNIN 634,614 650,059 102.4 3.783,823 3.975,122 105.1
VUKOVAR-SIRMIUM 36,582 36,682 100.3 68,383 62,394 91.2
SPLIT-DALMATIA 1.637,656 1.777,700 108.6 9.364,032 10.250,215 109.5
ISTRIA 2.627,918 2.895,686 110.2 17.731,881 19.095,401 107.7
DUBROVNIK-NERETVA 982,619 1.046,826 106.5 4.538,026 4.775,161 105.2
MEĐIMURJE 38,302 37,369 97.6 81,526 78,856 96.7
CITY OF ZAGREB 666,106 730,945 109.7 1.085,597 1.183,125 109.0
TOTAL 10.604,116 11.456,677 108.0 56.416,379 60.354,275 107.0
Source : CBS Statistical Yearbook 2011 and First release No 4.4.2/11. –
Tourism – Cumulative data
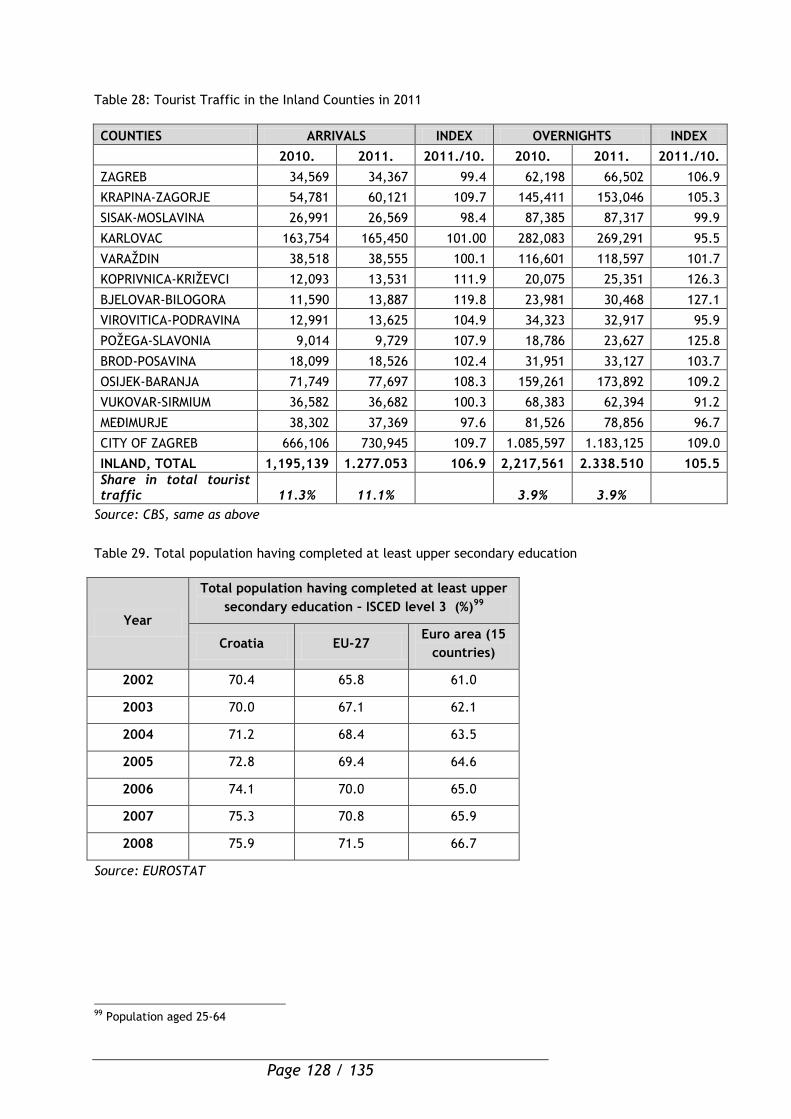
Page 128 / 135
Table 28: Tourist Traffic in the Inland Counties in 2011
COUNTIES ARRIVALS INDEX OVERNIGHTS INDEX
2010. 2011. 2011./10. 2010. 2011. 2011./10.
ZAGREB 34,569 34,367 99.4 62,198 66,502 106.9
KRAPINA-ZAGORJE 54,781 60,121 109.7 145,411 153,046 105.3
SISAK-MOSLAVINA 26,991 26,569 98.4 87,385 87,317 99.9
KARLOVAC 163,754 165,450 101.00 282,083 269,291 95.5
VARAŽDIN 38,518 38,555 100.1 116,601 118,597 101.7
KOPRIVNICA-KRIŽEVCI 12,093 13,531 111.9 20,075 25,351 126.3
BJELOVAR-BILOGORA 11,590 13,887 119.8 23,981 30,468 127.1
VIROVITICA-PODRAVINA 12,991 13,625 104.9 34,323 32,917 95.9
POŽEGA-SLAVONIA 9,014 9,729 107.9 18,786 23,627 125.8
BROD-POSAVINA 18,099 18,526 102.4 31,951 33,127 103.7
OSIJEK-BARANJA 71,749 77,697 108.3 159,261 173,892 109.2
VUKOVAR-SIRMIUM 36,582 36,682 100.3 68,383 62,394 91.2
MEĐIMURJE 38,302 37,369 97.6 81,526 78,856 96.7
CITY OF ZAGREB 666,106 730,945 109.7 1.085,597 1.183,125 109.0
INLAND, TOTAL 1,195,139 1.277.053 106.9 2,217,561 2.338.510 105.5
Share in total tourist traffic 11.3% 11.1% 3.9% 3.9%
Source: CBS, same as above
Table 29. Total population having completed at least upper secondary education
Year
Total population having completed at least upper
secondary education – ISCED level 3 (%)99
Croatia EU-27 Euro area (15
countries)
2002 70.4 65.8 61.0
2003 70.0 67.1 62.1
2004 71.2 68.4 63.5
2005 72.8 69.4 64.6
2006 74.1 70.0 65.0
2007 75.3 70.8 65.9
2008 75.9 71.5 66.7
Source: EUROSTAT
99 Population aged 25-64

Page 129 / 135
Table 30: Enterprises in Liquidation, Duration, Total Number of Employees and the Accumulated Amount of Debt (.000 kuna) at December 31, 2011
Period of liquidation
process
Number of insolvent business subjects
%
Number of employees in
insolvent businesses
% Total Value of
Creditor’s Claims
%
1 - 2 y 12.749 23,4 12.124 33,3 8.087.102 23,3
2 - 3 y 10.489 19,3 8.270 22,7 8.951.663 25,7
3 - 4 y 6.843 12,6 4.435 12,2 4.970.439 14,3
4 - 5 y 5.044 9,2 3.040 8,3 3.089.596 8,9
5 y and more 19.309 35,5 8.554 23,5 9.685.771 27,8
total 54.434 100,0 36.423 100,0 34.784.571 100,0
Source: FINA, Outstanding liabilities of business subjects
Table 31: Active Interest Rates: Short and Long-Term and Credit in Local and Foreign Currencies
Active Interest rates in HRK
2002 2003 2004 2005 2006 2007 2008 2009 2010 2011
Short term without currency exposure
7,44 8,02 8,33 7,71 6,75 7,39 8,98 9,29 6,98 7,48
Long term without currency exposure
6,48 6,14 6,9 6,48 5,86 6,66 8,1 8,27 6,45 6,76
Short term with currency exposure
8,72 7 7,09 6,34 6,29 6,86 8,18 8,41 7,91 7,56
Long term with currency exposure
6,37 5,76 5,55 5,18 6,21 6,51 6,92 7,31 7,19 6,37
Consumer Prices – Inflation rate
1,7 1,8 2,1 3,3 3,2 2,9 6,1 2,4 1,1 2,3
Source: CNB Annual Bulletin
Table 32: Passive Interest Rates - Short and Long-term
Passive Interest rates in HRK
2002 2003 2004 2005 2006 2007 2008 2009 2010 2011
Short term without currency exposure
2,86 4,69 4,13 3,23 2,69 5,48 5,64 2,04 1,41 1,89
Long term without currency exposure
3,23 2,82 3,30 3,49 3,11 6,45 6,85 2,07 3,03 2,78
Current account deposits with currency exposure in Euro
0,52 0,23 0,22 0,27 0,32 0,36 0,26 0,10 0,18 0,13
Short term saving deposits with currency exposure in Euro
2,89 2,29 2,46 2,63 4,24 5,10 4,13 2,64 1,63 2,37
Long term saving deposits with currency exposure in Euro
3,46 2,85 3,61 4,39 4,79 5,13 5,52 2,85 6,91 3,54
Consumer Prices – Inflation rate
1,7 1,8 2,1 3,3 3,2 2,9 6,1 2,4 1,1 2,3
Source: CNB Annual Bulletin
Table 33: The amount of FDI in Croatia in period of 1993 - 2011 (in millions of EUR)
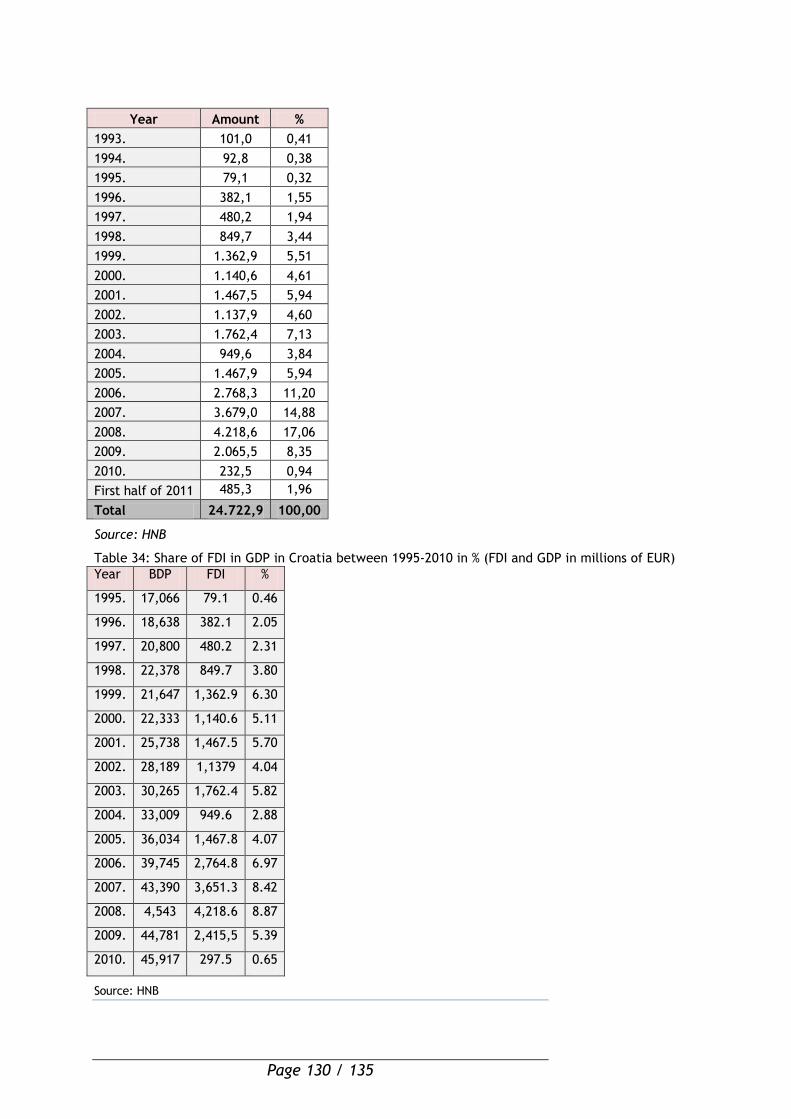
Page 130 / 135
Year Amount %
1993. 101,0 0,41
1994. 92,8 0,38
1995. 79,1 0,32
1996. 382,1 1,55
1997. 480,2 1,94
1998. 849,7 3,44
1999. 1.362,9 5,51
2000. 1.140,6 4,61
2001. 1.467,5 5,94
2002. 1.137,9 4,60
2003. 1.762,4 7,13
2004. 949,6 3,84
2005. 1.467,9 5,94
2006. 2.768,3 11,20
2007. 3.679,0 14,88
2008. 4.218,6 17,06
2009. 2.065,5 8,35
2010. 232,5 0,94
First half of 2011 485,3 1,96
Total 24.722,9 100,00
Source: HNB
Table 34: Share of FDI in GDP in Croatia between 1995-2010 in % (FDI and GDP in millions of EUR)
Year BDP FDI %
1995. 17,066 79.1 0.46
1996. 18,638 382.1 2.05
1997. 20,800 480.2 2.31
1998. 22,378 849.7 3.80
1999. 21,647 1,362.9 6.30
2000. 22,333 1,140.6 5.11
2001. 25,738 1,467.5 5.70
2002. 28,189 1,1379 4.04
2003. 30,265 1,762.4 5.82
2004. 33,009 949.6 2.88
2005. 36,034 1,467.8 4.07
2006. 39,745 2,764.8 6.97
2007. 43,390 3,651.3 8.42
2008. 4,543 4,218.6 8.87
2009. 44,781 2,415,5 5.39
2010. 45,917 297.5 0.65
Source: HNB
Page 131 / 135
Annex 3 - Reconciliation of Croatian Strategies and OPRC 2007 – 2013 operations
Priority Axis 1: Development and upgrading of the regional infrastructure and raising
the attractiveness of regions
BUSINESS RELATED AND TOURISM INFRASTRUCTURE
TYPES OF INTERVENTION STRATEGIC DOCUMENT
ADOPTED LINKAGE TO THE
TYPE OF INTERVENTION Priority Axis 1: all interventions Strategy for Regional
Development of the Republic of Croatia
2011-2013
June 2010 Investments in public business/tourism related infrastructure in order to create favourable conditions for economic development of Croatian regions, providing additional support to the lagging regions.
Business-related infrastructure (industrial parks, business incubators, business zones, public utilities for these structures) brownfield preparation for new business development
Government’s Programme for the Promotion of Small and Medium-Sized Enterprises, 2008-2012
April 2008
Construction of business zones Quality changes in business infrastructure and expert support to entrepreneurship
National Programme for the Development of the Islands
February 1997
Providing conditions for investments, equal with the mainland
Regional Index of Croatian Competition, 2010
Development of the entrepreneurial capacities of regions and counties
Tourism infrastructure (multifunctional city halls, Public facilities in spa resorts and other tourist destinations, marked tourist paths in mountains, public beaches, TIC, public parking & garages, cycle and thematic routes, and other infrastructure for services provided free of charge for tourists.
Nautical Tourism Development Strategy, 2009 -2019
December 2008
Increasing the capacities of yacht marinas and public ports, Construction of new marinas Increasing the level of communal infrastructure in the coastal zone and on the islands
Strategy Report Croatian Tourism Development by 2010
September 2003
Construction of transit infrastructures, development of an integral and integrated offer of Croatia as a tourist destination Development of particular types of tourism (wellness, hunting, excursion, rural, etc.)
Cultural infrastructure relevant for the development of tourism (revitalisation and valorisation of cultural and historical heritage: castles, palaces, manor houses, fortresses, houses with traditional architecture, monuments of industrial heritage, etc.)
3-year strategic plan of the MoC (in preparation)
Under preparation
Revitalisation of cultural heritage and its operation and presentation as a tourist attraction
Page 132 / 135
Priority axis 2: Enhancing Competitiveness of the Croatian Economy
SME
TYPES OF INTERVENTION STRATEGIC DOCUMENT
ADOPTED LINKAGE TO THE
TYPE OF INTERVENTION
Direct financial non-returnable support of productive investments of SME through a grant scheme. All eligible industries and services (new technologies, equipment, production lines and related construction or reconstruction) tourism and culture (construction or reconstruction of hotels, aqua parks, wellness centres, ski resorts, sports facilities, spa facilities, marinas and other commercial facilities). Support for innovative and new technologies, support for high value added competitive products, support for networking and cooperation - mainly by clusters, support for exports, innovation clusters, adoption of the environmental acquis, etc.
Government’s Programme for the Promotion of Small and Medium-Sized Enterprises 2008-2012
April 2008
Strengthening the competitive ability of SME through increasing overall investment in SME, increasing the share of high-tech SME, supporting export growth
Strategy Report: Croatian Tourism Development by 2010
September 2003
Increasing the quality of accommodation facilities (mainly hotels but also other types of establishments) Development of particular types of tourism (wellness, hunting, excursion, rural, etc.) and reinforcement of continental year-round tourism
Strategy of Government programmes 2013-2015
July 2012 Sustainable long-term development, increase of competitiveness and technology levels
Creating a favourable environment for FDI and local business investments, presentation of Croatian companies and products in international markets, supporting direct contacts between Croatian companies and their potential business partners from abroad. Analysis of sectoral policies for SME, promotion of specific groups of SME, start-ups, women, etc.
Industrial Policy of the Republic of Croatia (till 2013)
April 2008 Encourage the interaction between industry and the science community
Croatian Export Offensive 2007-2010
Reinforce the position of the Croatian economy in international markets
Government’s Programme for the Promotion of Small and Medium-Sized Enterprises 2008-2012
April 2008 Creation of development conditions for more productive entrepreneurship; increase of investments in small enterprises, increase of exports and development of export clusters Increase the quality level of clusters, market-sustainable clusters
Strategy of Government programmes 2013-2015
July 2012 Development of a comprehensive programme for the economic promotion of Croatia
Page 133 / 135
R&D AND TECHNOLOGY TRANSFER
TYPES OF INTERVENTION STRATEGIC DOCUMENT
ADOPTED LINKAGE TO THE
TYPE OF INTERVENTION Technology development programmes, establishment of centres of research excellence, improving research & technological development infrastructures, strengthening technology transfer in fields of research, strengthening the infrastructure capacity for competitive R&D. Protection of intellectual property rights. Developing better conditions for the introduction of innovative technologies related to Croatian industries and reflecting objectives defined by the Industrial Policy of the Republic of Croatia in Preparation for Accession to the EU.
Science and Technology Policy of the Republic of Croatia, 2006-2010
May 2006
Creation of technological infrastructure to support SME based on knowledge and newly established technology-based companies Strengthening competitiveness, including: increasing the number of high-tech SME and crafts Improvement of the quality of the entrepreneurial infrastructure, including stimulating centres of excellence and academic entrepreneurship to link with SME
Government’s Programme for the Promotion of Small and Medium-Sized Enterprises, 2008-2012
April 2008
Regional Index of Croatian Competition
2007
Industrial Policy of the Republic of Croatia (till 2013) Industrial Policy of the Republic of Croatia (till 2013)
October
2007
Development of regions of knowledge Encouragement of interaction between industry and the science community
Economic Recovery Programme
April 2010 Technological transition and strengthening competitiveness
Annex 4 - Quantification of the current situation in Croatian Economy using structural indicators
INDICATOR UNIT BASE VALUE EU-27 AVERAGE
VALUE SOURCE/YEAR TARGET 2015
GDP growth rate % -5.8 -4.2 EUROSTAT
2009
GDP per capita in PPS (compared to
the EU-27)
Number
(EU-
27=100)
63 100 EUROSTAT
2008
High-tech exports % 6.61 15.96 EUROSTAT
2007
Labour productivity per worker
(compared to the EU-27) Number 78.1 100
EUROSTAT
2009
Business investments (Gross fixed
capital formation in the private
sector, as % of GDP)
% 25.5 19.3 EUROSTAT
2009
Inflation rate % 2.4 1.0 EUROSTAT CBS
2009
Unemployment rate % 9.1 8.9 EUROSTAT
2009
Page 134 / 135
Annex 5 - Sectoral guidelines
Innovation
CIP – Competitiveness and Innovation Programme, Draft Work Programme 2009,
November 2008
EC – Innovation in the National Strategic Reference Frameworks, Working Document of
the DG Regio, October 2006
Research and Development
Commission Communication COM (2002) 499 “More Research for Europe - Objective 3%
of GDP”
Commission Communication COM (2005)141 “Integrated Guidelines for Growth and Jobs
2005-2008”
Proposal for a “Decision of the European Parliament and of the Council Establishing a
Competitiveness and Innovation Framework Programme (2007-2013)” {SEC(2005) 433}
Proposal for a “Competitiveness and Innovation Framework Programme (2007-2013)”
with a specific “Entrepreneurship and Innovation Programme”
Small and medium-sized enterprises
2003/361/CE Decision on the Definition of SME
Economic competition
Council Regulation (EC) 1/2003 on Implementation of the Rules of Economic
Competition
Industrial policy
Council Decision 96/413/EEC on Implementation of a Community Action Programme to
Strengthen the Competitiveness of European Industry
Commission Communication COM(2002) 714
"Industrial Policy in an Enlarged Europe"
Commission Communication COM(2003) 704
"Some Key Issues in Europe's Competitiveness - Towards an Integrated Approach"
Commission Communication COM(2004) 274
“Fostering Structural Change: an Industrial Policy for an Enlarged Europe”
Tourism
Commission Communication COM (2007) 621
“Agenda for a Sustainable and Competitive European Tourism”
Commission Communication COM (2006) 134
“A Renewed EU Tourism Policy – Towards a Stronger Partnership for European Tourism”
Commission Communication COM (2003) 716
“Basic Orientation for the Sustainability of European Tourism”
Public procurement
Treaty and EC Directives for the field of public procurement. This involves the
principles of transparency, equal treatment, non-discrimination, mutual recognition
and proportionality in maintaining the principles of economy in the allocation of
financial resources.
Protection and improvement of the environment
EU Directive 2001/42/EC on the assessment of the effects of certain plans and
programmes on the environment; this applies to the assessment of the strategic
documents.
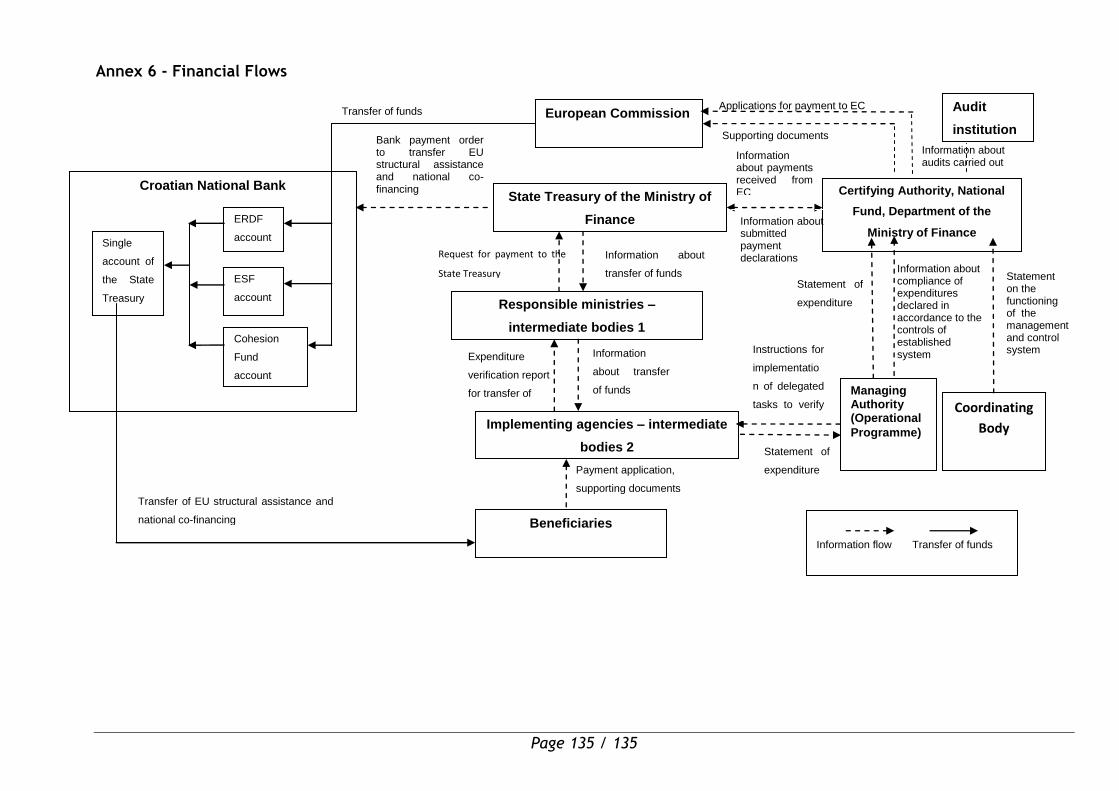
Page 135 / 135
Annex 6 - Financial Flows
Bank payment order to transfer EU structural assistance and national co-financing
Information about compliance of expenditures declared in accordance to the controls of established system
Beneficiaries
Croatian National Bank
European Commission
State Treasury of the Ministry of
Finance
Certifying Authority, National
Fund, Department of the
Ministry of Finance Single
account of
the State
Treasury
ERDF
account
ESF
account
Cohesion
Fund
account
Implementing agencies – intermediate
bodies 2
Payment application,
supporting documents
Responsible ministries –
intermediate bodies 1
Expenditure
verification report
for transfer of
funds
Request for payment to the
State Treasury
Transfer of funds
Information about
transfer of funds
Information
about transfer
of funds
Applications for payment to EC
Transfer of EU structural assistance and
national co-financing
Information flow Transfer of funds
Information about payments received from EC
Managing Authority (Operational
Programme)
Instructions for
implementatio
n of delegated
tasks to verify
expenditures
Supporting documents
Information about submitted payment declarations
Statement of
expenditure
Audit
institution
Information about audits carried out
Statement of
expenditure
Coordinating
Body
Statement on the functioning of the management and control system