OPERATIONAL ESTIMATES OF AREAL ......ABSTRACT Morton, F.I., 1982a. Operational estimates of areal...
246
OPERATIONAL ESTIMATES OF AREAL EVAPOTRANSPIRATION AND THEIR SIGNIFICANCE TO THE SCIENCE AND PRACTICE OF HYDROLOGY I THE PROBLEM F. I. Morton National Hydrology Research Institute Environment Canada Ottawa, Canada KIA 0E7
Transcript of OPERATIONAL ESTIMATES OF AREAL ......ABSTRACT Morton, F.I., 1982a. Operational estimates of areal...

OPERATIONAL ESTIMATES OF AREAL EVAPOTRANSPIRATION AND THEIR
SIGNIFICANCE TO THE SCIENCE AND PRACTICE OF HYDROLOGY
I THE PROBLEM
F. I. Morton
National Hydrology Research Institute
Environment Canada
Ottawa, Canada KIA 0E7

ABSTRACT
Morton, F. I., 1982a. Operational estimates of areal
evapotranspiration and their significance to the science and
practice of hydrology: I The problem
- Re1 iable estimates of areal evapotranspiration are essential to
significant improvements in the science and practice of hydrology.
Direct measurements; such as those provided by lysimeters, eddy flux
I instrumentation or Bowen-ratio instrumentation; give point values,
require constant attendance by skilled personnel and are based on
unverified assumptions. A critical review of the methods used for
estimating areal evapotranspiration is presented. It indicates that the
conventional conceptual techniques, such as those used in current
watershed models, are based on assumptions that are completely divorced
from reality. Furthermore, it provides evidence to the effect that
causal techniques based on processes and interactions in the soil-plant-
atmosphere continuum are not likely to prove useful for at least another
generation. However, the review demonstrates that models based on the
complementary relationship between areal and potential evapotranspiration
could do much to fill the gap until such time as the causal techniques
become practicable. The complementary relationship is introduced briefly
but its conceptual and empirical foundations, its use in providing the
basis for operational estimates of areal evapotranspiration and lake
evaporation, the testing of such estimates against comparable water
budget values and their potential use in providing the impetus for
transforming hydrology from a descriptive to a predictive science are
presented in a series of companion papers.

INTRODUCTION
Water planning and management require the ability to predict the
hydrologic regime of river basins over the lifetime of proposed projects
and the ability to forecast the hydrologic responses of river basins to
specific precipitation events. The prediction of hydrologic regimes is
based on the assumption that the streamf low records of the past are
representative of those of the future, and thus ignores the effects of
the land use or climatic changes that have taken place during the period
of record and that will take place during the lifetime of the project.
Forecasts of hydrologic response tend to be based on some crude modelling
device, such as the antecedent precipitation index, with the imp1 ici t
assumption that the water stored in the soil, swamps and lakes of a basin
has little effect on subsequent runoff events. Although water planning
and management have changed significantly during the last two decades,
primarily through the use of the computer, there has been little progress
in evaluating or improving the basic assumptions. Thus the current state
of the art is that of a car spinning its wheels while stuck in a swamp,
with frenetic computer applications making the problem worse by devaluing
human judgement and experience.
Evaluation and improvement of the water planning and management
assumptions have been impeded by the apparent determination of
hydrologists and engineers to ignore the significance of areal
evapotranspiration in the model ling of the hydrologic cycle. This
determination persists despite widespread recognition that
evapotranspiration is a much 1 arger proportion of the precipitation than
runoff in most populated parts of the world; that the accumulated effects
of evapotranspiration on the water stored in soil, swamps and lakes
control the basin response to precipitation events; and that
evapotranspiration is the component of the hydrologic cycle most directly
influenced by land use and climate changes. This attitude has resulted
in the diversion of research effort from the real problems of hydrology
to unreal mathematical elaborations of the more tractable peripheral
problems.
A somewhat similar problem exists with regard to meteorology.
Although air mass properties are the integrated results of hemispheric or
even global phenomena, the way they are modified in passing over the
continents is influenced to a large extent by the proportion of net
radiant energy that is used for areal evapotranspiration and transformed
into latent heat. The proportion can vary from zero to almost one. This
significant transformation of energy tends to be ignored because of the
difficulties associated with estimating areal evapotranspiration and with
coupling the microscale phenomena near the ground to the macroscale
phenomena in the free atmosphere.
The main reason for ignoring the hydrological and meteorological
effects of areal evapotranspiration is that it is extremely difficult to
measure or estimate. There is as yet no way to make routine direct

measurements. Those methods i n cu r ren t use, e.g. t h e covariance o r eddy
f l u x technique, t h e Bowen-ratio energy balance technique and t h e
l ys ime te r technique, g i ve o n l y p o i n t values and are n o t amenable t o
r o u t i n e observat ions because o f t h e h igh cos t o f ins t rumenta t ion and t h e
need . for constant attendance by s c i e n t i f i c o r t echn ica l personnel.
Furthermore they are a l l based on u n v e r i f i e d assumptions. Thus t h e
evapot ransp i ra t ion f rom a weighing l ys ime te r i s of s i g n i f i c a n c e o n l y i f
it i s assumed t h a t t h e s o i l , s o i l moisture and vegetat ion are i d e n t i c a l
t o those i n t h e immediate environment. The water balance technique i s an
except ion i n t h a t i t can be app l ied t o an area t h a t d ra ins i n t o a stream
where t h e f l o w i s measured. However t h i s requ i res assumptions concerning
changes i n t he amount o f water s tored i n t h e snow packs, lakes, swamps,
s o i l and rock o f t h e drainage basin. I n p r a c t i c e i t i s u s u a l l y necessary
t o ignore t h e changes i n storage so t h a t t h e r e s u l t a n t est imates of a rea l
evapot ransp i ra t ion are v a l i d o n l y when averaged over a per iod o f years
long enough f o r t h e changes t o become a n e g l i g i b l e p a r t of t h e t o t a l
water balance. Therefore t h e o n l y p r a c t i c a b l e method f o r measuring area l
evapot ransp i ra t ion has l i t t l e p r a c t i c a l use except i n c a l i b r a t i n g and
t e s t i n g models.
The development of models f o r es t ima t ing area l
evapot ransp i ra t ion i s hindered by t h e number o f processes and feedback
mechanisms invo lved as w e l l as b y t h e l ack of good data.
Evapotranspi rat ion depends on t h e a v a i l a b i l i t y o f energy, a f u n c t i o n of
t h e n e t r a d i a n t energy supply and t h e temperature and humid i ty o f t h e

overpassing air, and on the availability of water, a function of the
precipitation and a complex system of soil moisture and plant processes. a
Furthermore, the soil-plant-atmosphere continuum has a significant number
of interactions and feedback mechanisms. Those that are known tend to be
ignored and there is reason to suspect that others remain unidentified.
One interaction that is particularly relevant to the distinction between
point and areal evapotranspiration concerns changes in the avai 1 abi 1 ity
of water from place to place in a heterogeneous area and the effects of
such changes on the overpassing air. Thus the decrease in
evapotranspiration from a dry patch will make the overpassing air hotter
and drier, thereby increasing the availability of energy and producing
compensatory increases in evapotranspiration from any downwind wet
patches.
Model development is also impeded by lack of communication
between scientific disciplines. For example, the assumptions used for
the evapotranspiration components of current watershed models are
inconsistent with findings published in the meteorological, botanical ana
soil science literature. A critical review of the techniques for
estimating evapotranspiration is presented herein. It indicates that the
conventional conceptual techniques, such as those used in the current
watershed models, are based on assumptions that are completely divorced
from reality. Furthermore it provides some evidence to the effect that
causal techniques based on the processes and interactions in the
soi 1-pl ant-atmosphere continuum are not 1 ikely to prove useful for at

least another generat ion. However the review demonstrates that
techniques based on a complementary re1 ationship between areal and
potential evapotranspiration could do much to f i l l the gap until such
time as the causal techniques become practicable.
The concept of a complementary relationship between areal and
potential evapotranspiration is based on the previously mentioned
interaction between evaporating surfaces and overpassing air. By
incorporating this crucial feedback mechanism it avoids the complexities
of the soil-plant system so that areal evapotranspiration can be
estimated from its effects on the routinely observed temperatures and
humidities used in computing potential evapotranspiration with no need
for locally optimized coefficients. This means that the results are
falsifiable so that errors in the associated assumptions and empirical
relationships can be detected and corrected by progressive testing
against long-term water balance estimates of river basin
evapotranspiration from an ever-widening range of environments. During
the past decade the test range has been expanded from Canada and Ireland
to the United States of America, to Africa and to Australia and New
Zeal and.
The complementary relationship is introduced briefly herein but
its conceptual and empirical foundations, its use in providing the basis
for operational estimates of areal evapotranspiration and lake
evaporation, the testing of such estimates against comparable water

budget values and the potential use of such estimates to provide the
impetus for transforming hydrology from a descriptive to a predictive
science are presented in a series of companion papers (Morton, 1982b,
1982c, 19824, and 1982e).
A tabular summary of the 1 iterature on the complementary
relationship since it was introduced by Bouchet (1963) is presented in
the Appendix.
EVALUATION OF CONVENTIONAL CONCEPTUAL TECHNIQUES
The currently accepted conceptual techniques for estimating
evapotranspiration have many applications, a1 1 of them slightly
different. Examples are in Budyko (1974), in the new versatile soi 1
moisture budget presented by Baier and Robertson (1966) and in a
technique used by the United Kingdom Meteorological Office to map soil
moisture deficits and actual evapotranspiration (Grindley, 1970).
Despite superficial differences the basic assumptions are the same and
can be evaluated by examining one example, in this case the technique
used in one of the better known watershed models.
The SACRAMENTO WATERSHED MODELLING SYSTEM (Burnash, Ferre 1 and
McGuire, 1973) employs five conceptual storage reservoirs in the
soil-plant continuum, two of which store tension water and three of which
store free water. The tension storages are emptied by evapotranspiration

and filled by interception or percolation whereas the free-water storages
are emptied by interf low, basef low or subsurf ace outflow and are filled
by infiltration or percolation. There are also transfers of water from
free-water storage to tension storage. All of these processes depend on
the proportional loading (i .e. the ratio of current storage to storage
capacity) for one or more of the reservoirs. The storage capacities and
the parameters that control the transfers of water to and from the
reservoirs are calibrated to provide the best possible fit between model
output and recorded streamf lows. The evapotranspiration is assumed equal
to the evaporation demand (normally represented by pan evaporation or
potential evapotranspiration) mu1 tip1 ied by the difference between the
sum and product of the proportional loadings for the total tension
storage and the upper zone tension storage. Because it abstracts a large
proportion of the total precipitation directly from the tension storages
and indirectly from the free-water storages, the need to adjust the
evapotranspiration to make the water-balance balance over the calibration
period has a dominant influence on the selection of storage capacities
and transfer parameters. Therefore the reality of the calibrated
capacities and transfer parameters, i.e. their ability to simulate flows
before and after the calibration period and their applicability to the
development of relationships for transposition to other basins, depends
to a large extent on the validity of the assumptions used in estimating
evapotranspiration.

The technique used for estimating evapotranspiration in the
SACRAMENTO WATERSHED MODELLING SYSTEM is based on a number of implicit
assumptions about soi 1, plant and atmospheric processes. The discussion
that follows furnishes published experimental evidence that these are
either wrong or questionable.
Soil Assumptions: The tension storage capacities are supposed to reflect
the amount of moisture that can be held in the root zone between an upper
threshold value of moisture content (e.9. the field capacity) and a lower
threshold value of moisture content (e.9. the wilting point). The
specific assumptions that are made in modelling the tension storages are:
(1 ) That the tension storages are constant and do not depend on seasonal
o r annual changes in vegetation cover and root development. The
problems inherent in this assumption are self-evident and are
particularly important in cultivated areas.
(2) That there is no drainage from tension storage when the water
content is below the upper threshold value, the field capacity.
This assumption is contrary to the theoretical and experimental
findings of Rubin and Steinhardt (1963), Rubin, Steinhardt and
Reiniger (1964) and Rubin (1966) that soil water content during rain
infiltration rises only to the point where the hydraulic
conductivity becomes equal to the rainfall or snowmelt rate and then
water is transferred downward. Thus it is possible to have

s ignif icant groundwater recharge from long periods of rainf a1 1 or
snowmelt with the water content well below field capacity.
Moreover, evidence provided by Robins, Pruitt and Gardner (1954),
Ogata and Richards (1957), Neilsen, Kirkham and Van Wijk (1959),
Nixon and Lawless (1960) and Hewlett (1961) indicates that slow
vertical percolation can provide an important supply of groundwater
recharge during long dry periods after soil-moisture contents have
declined below field capacity.
(3) That moisture fluxes into or out of the tension storages are
independent of temperature, temperature gradients and vapour
pressure gradients. Carey (1966) has shown that soilmoisture
transport induced by thermal gradients and their associated vapour
pressure gradients can be significant when compared with transport
induced by hydraulic gradients, particularly when the temperatures
or soil-moisture contents are low. Peck (1974) has provided a brief
review of the theoretical and empirical evidence for the concept
that the 1 arge observed increases in soi l-moisture at below-f reezing
temperature or under a snow cover are caused by upward migration of
water. Abramova (1 968) has presented evidence of extensive upward
and downward transports of water as vapour in the relatively dry
soils of the Precaspian Lowland in the U.S.S.R. The experiments
demonstrating how Chinese elm could flourish with the soil in the
root zone at wilting point were particularly interesting because
they indicated that the required water was supplied by an upward

transport of water vapour and that this was induced by a relative
humidity gradient in the soil air rather than by a temperature
gradient.
Plant Assumptions: The conventional conceptual techniques for estimating
evapotranspiration, including that used in the SACRAMENTO WATERSHED
MODELLING SYSTEM, are based on the assumption that the vegetation acts as
a passive wick that transfers water from the tension storages to the
atmosphere. This requires that leaf stomatal resistances ,be responsive
only to internal leaf water controls and not to external environmental
controls such as those imposed by irradiance, carbon dioxide in the
ambient air, leaf temperature and humidity in the ambient air.
Documentation for the existence of such controls and hence for the lack
of reality in the assumption is presented in a detailed review by Cowan
(1977) and in a shorter review by Hall, Schulze and Lange (1976).
The notion that the ambient humidity or the difference between
the vapour pressure in the leaf and the vapour pressure in the air can
have a significant direct effect on stomatal resistance may seem novel
and strange to hydrologists and meteorologists, although the indirect
effects, whereby an increase in vapour pressure difference would increase
transpiration which in turn would reduce internal leaf water content
thereby causing the stomata to contract, have long been recognized. Thus
the indirect effects represent a feedback mechanism which reduces
transpiration after leaf water contents have been reduced and the direct
effects represent a feedforward mechanism which reduces transpi rat ion
before leaf water contents have been reduced. Schultze et al. (1972)
have shown that the direct effects of an increase in water vapour
concentration difference (or vapour pressure deficit) on apricots growing
in the Negev Desert is to reduce transpiration and increase leaf water
content. Kaufmann (1979) provided evidence that the direct effects of an
increase in the absolute humidity difference (or vapour pressure deficit)
on four year old potted Engelmann spruce seedlings was to increase the
.stomata1 resistance sufficiently to make the transpiration independent of
the difference. The significance of such findings is that an increase in
vapour pressure difference which produces an increase in potential
evapotranspiration may cause an increase in stomatal resistance large
enough to decrease the actual transpiration.
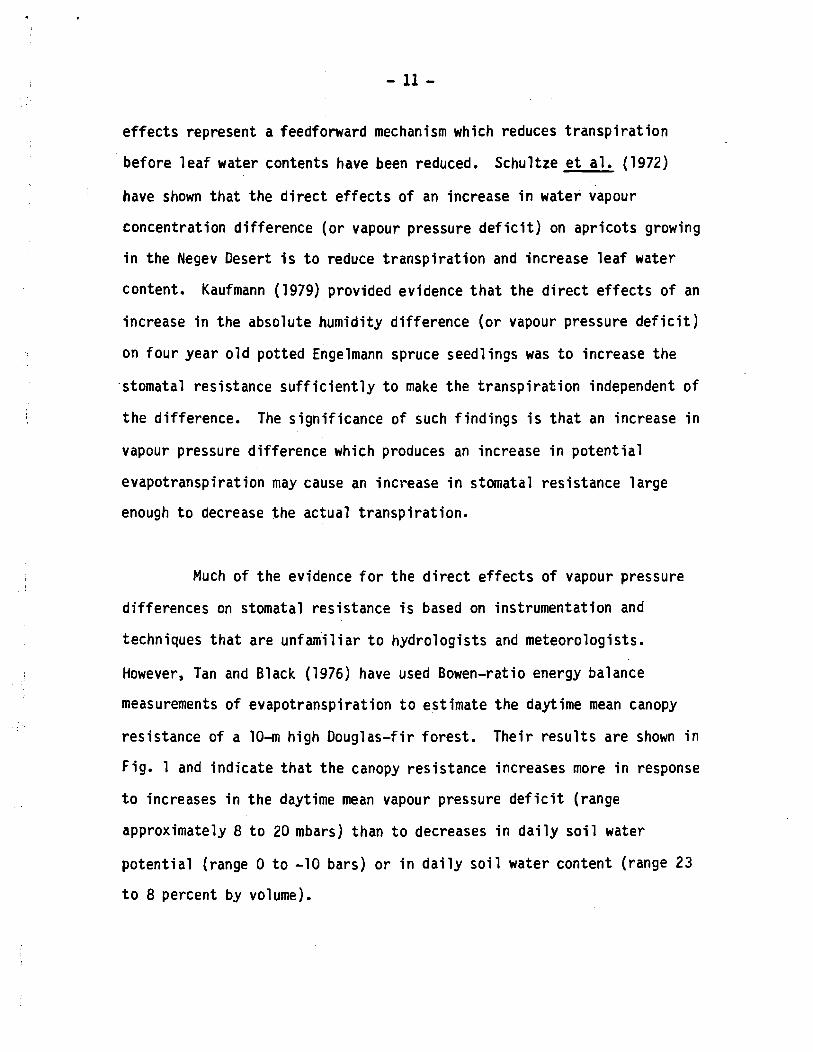
Much of the evidence for the direct effects of vapour pressure
differences on stomatal resistance is based on instrumentation and
techniques that are unfamiliar to hydrologists and meteorologists.
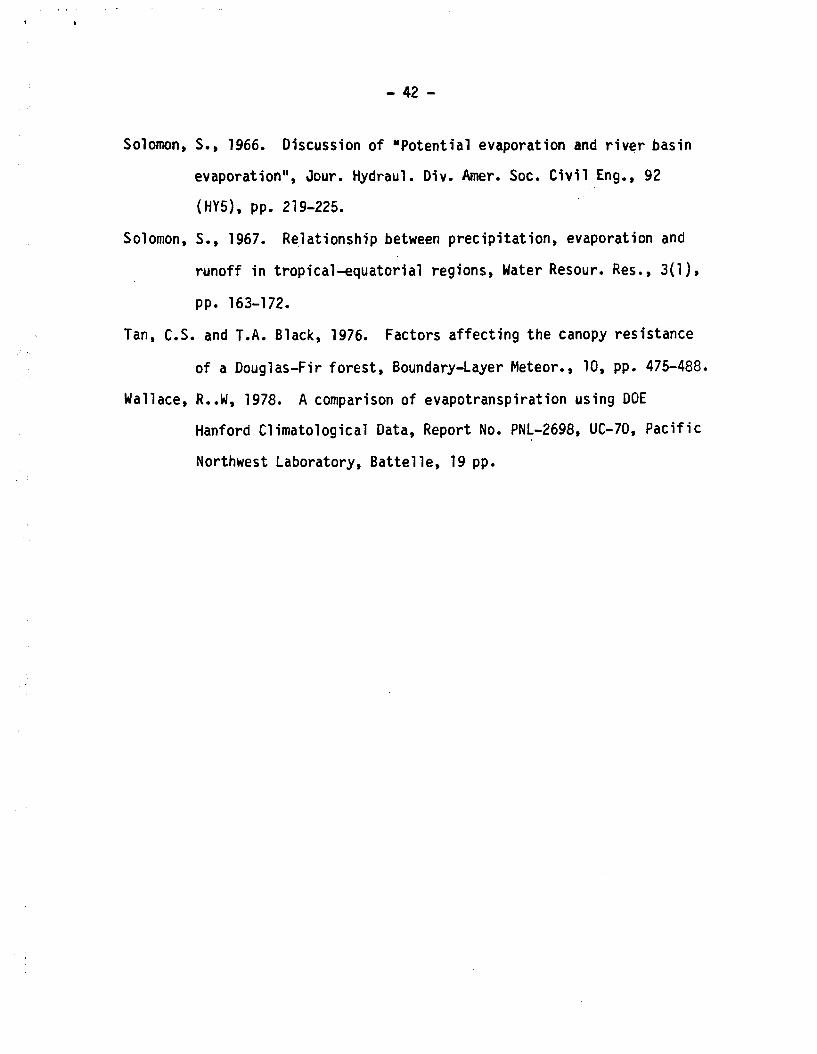
However, Tan and Black (1976) have used Bowen-ratio energy balance
measurements of evapotranspiration to estimate the daytime mean canopy
resistance of a 10-m high Douglas-fir forest. Their results are shown in
fig. 1 and indicate that the canopy resistance increases more in response
to increases in the daytime mean vapour pressure deficit (range
approximately 8 to 20 mbars) than to decreases in daily soil water
potential (range 0 to -10 bars) or in daily soil water content (range 23
to 8 percent by volume).
The e f f e c t s of ambient carbon d i o x i d e concentrat ions on stomata1
res is tance have s i g n i f i c a n c e f o r cu r ren t concerns about t h e hydro log ic
and c l i m a t i c consequences o f t h e combustion o f f o s s i l fue ls . Based on
t h e i r experiments w i t h po t ted ca rna t i on p lants, Enoch and Hurd (1979)
have est imated t h a t increases i n carbon d i o x i d e concentrat ions have
decreased t r a n s p i r a t i o n by 1.6 percent t h i s century and could decrease
t r a n s p i r a t i o n by about 10 percent du r ing t h e nex t 50 years. Such
decreases could cause s i g n i f i c a n t increases i n r u n o f f and a s i g n i f i c a n t
warming of t h e atmosphere which would augment t h e b e t t e r known greenhouse
e f fec t .
Atmospheric Assumpions: The c u r r e n t l y accepted conceptual techniques f o r
es t imat ing evapotranspi rat ion, i n c l u d i n g t h a t used i n t h e SACRAMENTO
WATERSHED MODELLING SYSTEM, a re based on t h e assumption t h a t pan
evaporat ion o r p o t e n t i a1 evapot ransp i ra t ion are independent of t h e a c t u a l
evapot ransp i ra t ion and may t h e r e f o r e be used t o r e f l e c t t h e evaporat ion
demand. This assumption ignores t h e w e l l known f a c t t h a t a decrease i n
a rea l evapot ransp i ra t ion caused by a reduc t i on i n t h e ava i l a b i 1 i ty o f
water w i l l increase t h e temperature and decrease t h e humid i ty of t h e
overpassing a i r and t h a t these i n t u r n w i l l increase pan evaporat ion o r
p o t e n t i a l evapotranspi rat ion.
P o t e n t i a l evapot ransp i ra t ion i s normal ly est imated from a
s o l u t i o n o f t h e energy balance equat ion and t h e vapour t r a n s f e r
equation. These equat ions can be solved w i t h a graph ica l technique, an

iterative technique or an approximate analytical technique. The
approximate solution as developed by Penman (1948) is
in which ETp = potential evapotranspiration, RTp = net radiation at
the temperature of the evaporating surface, v = saturation vapour
pressure at air temperature, vD = saturation vapour pressure at dew
point temperature, fT = vapour transfer coefficient, y = psychrometric
constant, p = atmospheric pressure and A = rate of change of saturation
vapour pressure with respect to temperature.
Kohler, Nordenson and Fox (1955) have shown that eq. (1) can
provide good estimates of evaporation from the Class A evaporation pan if
modified to take into account both the difference between vegetated and
water surfaces and the sensible heat flux through the wall and bottom of
the pan. Therefore there are grounds for belief that the evaporation
from any small water-filled container will provide a reasonable
reflection of potential evapotranspiration, although the reflection will
be somewhat distorted by differences in albedo, surface roughness and in
the ratio of the latent heat transfer area to sensible heat transfer area.
Eq. (1) shows that potential evapotranspiration increases when
the vapour pressure deficit (v-vD) increases. This results from an
increase in air temperature (as reflected in v) and/or a decrease in

hunidity (as reflected in vD). Following the cause-andsffect chain
beyond the customary first link, this is the kind of response that can be
expected from the increase in heat flux and the decrease in vapour flux
associated with a reduction in the availability of water for
evapotranspiration from the surrounding area. The resultant feedback
mechanism inval idates the currently accepted hydrometerological
assumption that in any relationship between areal evapotranspiration and
potential evapotranspiration the latter is the independent variable.
Thus the use of potential evapotranspiration as a causal factor or
forcing function is limited to two specific cases: (1) to existing moist
areas so large that the effects of the evapotranspiration on the
temperature and humidity of the overpassing air are fully developed and
the areal evapotranspiration equals the potential evapotranspiration ; and
(2) to existing or hypothetical moist areas so small that the effects of
the evapotranspiration on the temperature and humidity of the overpassing
air are negligible. Pans and other evaporimeters fit into the latter
category insofar as size is concerned.
In Bernouill i 's equation for open-channel flow, the potential
energy responds negatively to changes in the kinetic energy. Thus there
appear to be analogies between potenti a1 evapotranspiration and potent i a1
energy and between areal evapotranspiration and kinetic energy. To be
completely analogous the relationship would have to be complementary,
i.e. the responses would have to be both opposite in sign and equal, and
both observational data and theory show that this is a distinct

possibility. However it should be noted that the analogy can not be
extended into the critical flow regime because areal evapotranspiration
cannot exceed potential evapotranspiration.
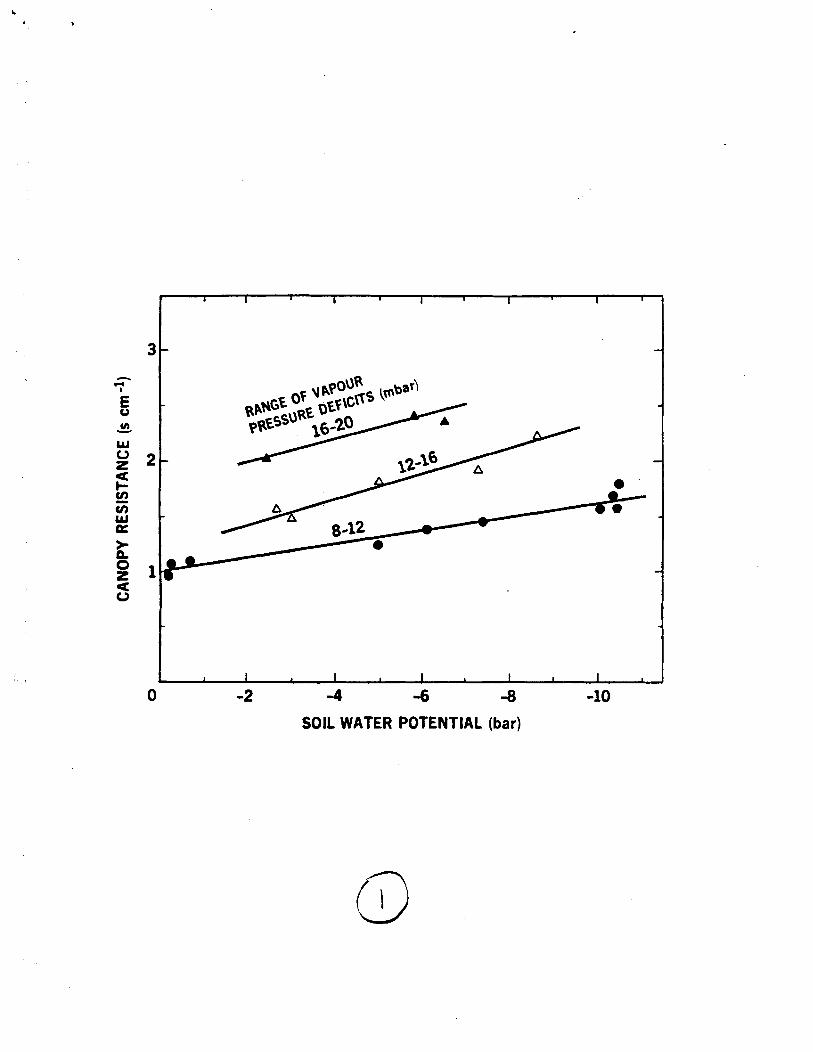
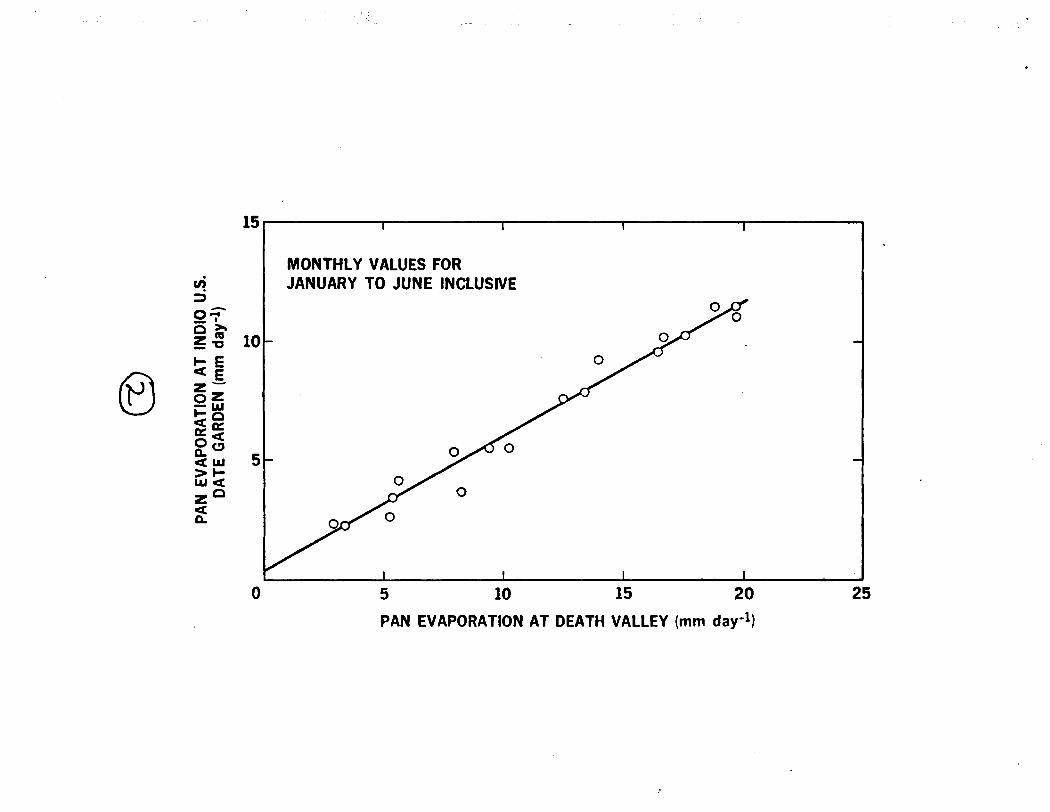
The oasis effect is the best known phenomenon associated with
the foregoing interactions. It can be demonstrated by comparing monthly
evaporation from two U.S. Weather Bureau Class A Pans in the southeast
desert basin of California during the years 1962, 1963 and 1964. Figures
2 and 3 show the pan evaporation in a large well-irrigated area at Indio
U.S. Date Garden plotted against the pan evaporation in the desert at
Death Valley for the first six months and the last six months of the
calendar year respectively. The plotted regression 1 ines have
coefficients of correlation of 99 percent. The small zero-intercepts can
be attributed to the effect of the 2.7 degree difference in latitude in
increasing the winter radiation inputs at Indio so that the slopes
represent the effects on pan evaporation of increasing the areal
evapotranspiration from a near-zero value in the desert to a near-maximum
value in an irrigated oasis. Thus Fig. 2 shows that the oasis pan
evaporation is only 57 percent of the desert pan evaporation during the
first six months of the calendar year and Fig. 3 shows that the oasis pan
evaporation is only 52 percent of the desert pan evaporation during the
last six months of the calendar year.
The oasis effect and the negative relationship between actual
and potential evapotranspiration have been demonstrated by Davenport and

Hudson (1967). They measured the variation in evaporation across a
series of irrigated cotton and unirrigated fallow fields in the Sudan
Gezira, using fiberglass dishes with black painted wells 113 nm in
diameter and 36 mm in depth. The dish evaporation observations provided
a somewhat distorted reflection of the potential evapotranspiration. The
passage of air from the upwind desert (and/or the upwind unirrigated
fallow fields) over the irrigated cotton caused the dish evaporation to
decrease rapidly and approach a low constant value within 300 m - the width of the fields. Furthermore, as the air passed from irrigated
cotton across unirrigated fallow the dish evaporation increased rapidly
and approached a high constant value within 300 m. Fig. 4 shows the
variation of dish evaporation across three irrigated fields on
December 27, 1963. The description of the soil condition is presumably
based on visual inspection and is related to the number of days since the
last irrigation. Thus it is reasonable to assume that the actual
evapotranspiration is greater in the "moist" field than in the I1dry"
field and that it is somewhere near its maximum possible value in the
"wet" field.
At the upwind edge of the irrigated fields, where the dish
evaporation decreases rapidly, the hot dry air from the desert (or the
unirrigated fa1 low) loses heat and gains vapour from contact with the
transpiring cotton leaves. Downwind from the transitional zone, where
the dish evaporation approaches a low constant value, the effects of the
evapotranspiration on the temperature and humidity of the overpassing air

are well developed and approaching equilibrium. (Decreases in
temperature and increases in humidity as the air moved across the
irrigated cotton were observed over one field. The vapour pressure
appeared to attain equilibrium values within 300 m but the temperatures
were still decreasing, possibly because the observations were made above
the level of the crop and dishes.) As it is only in an equilibrium zone
that the term areal evapotranspiration has any meaning, the minimum size
of an area for which the term is applicable is one in which the edge
effects in the upwind transitional zone become insignificant.
The ratio of daily dish evaporation at the downwind edges of the
individual irrigated cotton fields to that at the upwind edge of the
irrigated area was 0.69 for the field with ttdry" soil, 0.60 for the field
with "moistt' soil and 0.53 for the field with "wet" soil. This provides
good evidence that the dish evaporation, and presumably the potential
evapotranspiration, respond negatively to changes in areal
evapotranspiration induced by changes in the availability of water.
Army ana Ostle (1 957) have inadvertently provided more direct
evidence for the existence of a negative relationship between areal and
potential evapotranspiration. They calculated actual areal
evapotranspiration (ET) from 0.1 acre plots of spring wheat by adding
the total precipitation from seeding to harvest to the amount of soil
moisture lost from seeding to harvest for 29 years at Huntley, Montana
and for 26 years at Havre, Montana. The results were then related to the
corresponding values of evaporation from nearby sunken B. P. I. tank s
(EpN), which provide a somewhat distorted reflection of potential
evapotranspiration. The resultant regression equations for plots that
were cropped every year were:
ET (at Huntley) = 30.8 - 1.025 EpW
ET (at Havre) = 24.5 - 0.644 EpW
and the regression equations for two plots that were cropped and left in
fallow on alternate years were:
ET (at Huntley) = 34.6 - 1 .I42 EpW
ET (at Havre) = 28.5 - 0.725 EpW (5
The zero-intercepts for the four equations are in inches of
water and the coefficients of correlation vary from 0.790 to 0.826 with a
mean value of 0.814. In evaluating the results it should be noted that
the tank evaporation would be higher than the potential
evapotranspiration because of the low albedo of water and that this would
cause the negative slopes to be underestimated; that unreported
differences in vegetation and soil immediately adjacent to the various
plots and tanks could account for some of the differences between the
equations; and that unreported year-to-year variations of absorbed

incident radiation would add to the scatter of the points and the
uncertainty concerning the regression coefficients. With these
considerations in mind the equations show that the relationship between
actual evapotranspiration and potential evaporation is negative and that
there is reasonable probability that it is complementary, i.e., that the
slope is -1.
Summat ion: The foregoing evaluation shows that the assumptions used to
estimate areal evapotranspiration in the conventional conceptual models
are completely divorced from real ity. They continue to be used because
of their tractability and because of the ease with which unreal
coefficients can be optimized when the relevant variables are correlated,
sometimes spuriously, through their pronouced seasonal patterns. This is
evident in a discussion of Penman (1967) in which it is stated that "in
terms of hydrology, one could be very wrong in the estimates of potential
evaporation and still get the right answer if one had the right value of
DM in which D is a poorly defined tension storage capacity which is
usual ly obtained by optimization. The real ity of "garbage in - garbage out" tends to be ignored because the scientific and engineering
1 iteratures provide few if any examples of the consequences of practical
applications or of rigorous tests similar to those carried out by
Garrick, Cunnane and Nash (1978).
The most disturbing imp1 ication of the foregoing evaluation is
that it is unrealistic to keep a simple real-time water budget for the

- 20 -
unsaturated root zone. Part of the problem may be that the field
capacity has some basis in reality but is a function of temperature (as
suggested by Peck, 1974) and is applicable only to the problem of
drainage after infiltration has ceased. Thus the concept of a minimum
drainage water content that changes with the seasons and a maximum
infiltration water content that changes with the rainfall or snowmelt
rate may provide a realistic basis for a simple isothermal water budget.
The alternative appears to be a complex, physical ly-based and largely
untested mathematical model of the type developed by Freeze (1971).
However no matter what kind of model is selected it must be made more
realistic by taking into account the effects of temperature and/or vapour
pressure gradients on vertical moisture fluxes.
The other information used in the evaluation is more welcome
because it can be used constructively to formulate more realistic
models. Thus the information on plant processes that control
transpiration provides the basis for what are referred to herein as
causal models and the information on the negative or complementary
response of potential evapotranspiration to changes in the availability
of water for areal evapotranspiration provides the basis for a technique
that avoids the complexities of the soil-plant system. The causal
hydrobotanical models are evaluated in the next section and the
complementary relationship is introduced in the concluding discussion.

EVALUATION OF CAUSAL HYDROBOTAN ICAL TECHN IQUES
The hydrobotanica l models a re based on an equat ion formulated by
Monte i th (1965). I f t h e p o t e n t i a l evapot ransp i ra t ion (ETp) i s de r i ved
f rom eq. ( I ) , t h e ac tua l evapot ransp i ra t ion f rom a smal l area (ETS) i s
est imated f rom
i n which rc i s t h e canopy res is tance, i .e. an a rea l average of stomata1
res is tances, ra i s t h e aerodynamic res i s tance and a l l o ther symbols are
as def ined prev ious ly . The aerodynamic res i s tance i s r e l a t e d t o t he
vapour t r a n s f e r c o e f f i c i e n t , fT , i n eq. (1) by
i n which p and c a re t h e d e n s i t y and s p e c i f i c heat r e s p e c t i v e l y of t h e
a i r .
One of t h e s impler a p p l i c a t i o n s o f a causal model i s t h a t
descr ibed by Calder ( 1 977). The requ i red c o e f f i c i e n t s were obta ined by
an o p t i m i z a t i o n process us ing data from a l a r g e n a t u r a l l ys ime te r w i t h
twenty-six mature spruce t r e e s i n Plynlimon, Cent ra l Wales. The
aerodynamic res i s tance was obta ined f rom da ta observed du r i ng r a i n storms
(when t h e canopy res i s tance would be zero) together w i t h f o u r o the r

parameters in an interception model. The optimization process indicated
that it was a constant, i.e. that it was independent of wind speed. With
the aerodynamic resistance established, the four parameters needed to
relate canopy resistance to a cosine function of the Julian day number
(reflecting the seasonal pattern of irradiance) and the vapour pressure
deficit were derived from data observed when the canopy was dry. The
optimization process indicated that there was no relationship between
canopy resistance and soil moisture even though soil moisture deficits in
excess of 100 mn were recorded. Unfortunately there is no way to tell
whether this lack of relationship is real or whether it is due to a
causal relationship between soil moisture and vapour pressure deficit or
to a relationship between soil moisture and the time of the year.
A more sophisticated model has been developed by Federer
( 1979). The aerodynamic resistance is estimated from wind speed and from
estimated values of a roughness parameter and a zero-plane displacement;
the canopy resistance is assumed proportional to stomatal resistance; the
stomatal resistance is derived from a regression equation in which
porometer measurements of stomatal resistance have been related to solar
radiation, air temperature, vapour pressure deficit and the plant water
potential; the plant water potential is related to soil moisture by an
intricate and assumption-filled linkage through the plant system; and the
soil moisture is related to precipitation by dividing the soil into a
number of layers and applying some approximate equations. The model
includes an iterative procedure.

Federer (1979) chose t o simlr late t h e behaviour of mature y e l l o w
b i r c h and sugar maple i n t he Hubbard Brook Experimental Fores t i n New
Hampshire. Although some of t h e predetermined parameters-nere selected
ob jec t i ve l y , t he re was so much judgement used i n t h e se lec t i on o f o thers
t h a t they could o n l y be described as educated guesses. Three parameters;
i.e. the r a t i o o f canopy t o stomatal resistance, t h e res is tance t o f l ow
i n t o p l a n t storage and t h e i n t e r n a l p l a n t res is tance pe r u n i t o f length,
were determined by f i t t i n g t h e model t o two days o f data. Hal f -hour ly
atmospheric i n p u t da ta were der ived f rom d a i l y values us ing a number of
assumptions. The model simulated f i e l d da ta f rom a hardwood f o r e s t i n
terms of bo th p l a n t water p o t e n t i a l and stomatal behaviour, w i t h i n a day
and over a summer. The r e s u l t s were used t o develop simple r e l a t i o n s h i p s
between t h e r a t i o of ac tua l t o unstressed t r a n s p i r a t i o n and some f u n c t i o n
of t he s o i l moisture where t h e unstressed t r a n s p i r a t i o n i s def ined as t h e
value computed from t h e model when t h e stomatal opening i s n o t a f fec ted
by p l a n t water p o t e n t i a l (o r s o i l moisture).
Causal models of t h e t ype formulated b y Federer (1979) represent
t h e wave o f t he f u t u r e s ince i t i s obviously impossible t o p r e d i c t t h e
e f fec ts of n a t u r a l o r man-made changes w i thout a d e t a i l e d knowledge o f
a l l t he causal f a c t o r s and t h e i r i n te rac t i ons . Because of t h e complexi ty
of t h e processes and i n t e r a c t i o n s i t would be more c o r r e c t t o s t a t e t h a t
they represent t h e wave o f t he f a r - d i s t a n t fu tu re . Some of t h e problems
are:

(1) Pormeter estimates of stomatal resistance are based on the length
of time required to increase the relative humidity in a small
chamber from a selected artifically low value to a selected higher
value (Kanemasu, Thurtell and Tanner, 1969). This either ignores
the effects of humidity on stomatal resistance or assumes that the
effects are negligible over short measurement periods. Hal 1,
Schultze and Lange (1976) have pointed out that this assumption may
not always be valid, in which case the measurements would provide a
good example of the classical phenomenon whereby the act of
measurement disturbs the process being measured.
(2) Correlations between stomatal resistance and environmental factors
can lead to unreal istic results when the so-called independent
variables, i .e. solar radiation, temperature, vapour pressure
deficit and possibly plant water potential, have regular diurnal and
seasonal patterns.
(3) Much more knowledge is needed on the plant processes that limit the
amount of water reaching the leaves, particularly those at the
soil-root interface.
(4) Such models must be based on the assumption that it is possible to
compute a real-time soi 1 moisture budget. This problem has been
discussed at length in the preceding section. Although the method
used by Federer (1979) is much more realistic than those used in the

cur ren t conceptal models, t h e r e i s some i n d i c a t i o n t h a t i t
represents an unhappy medium i n t h a t i t i s t o o complex f o r easy
computation and t o o simple f o r real ism.
The a p p l i c a t i o n of eq. (6) t o an area i s based on t h e assumption
t h a t t h e p o t e n t i a l evapot ransp i ra t ion der ived f rom eq. (1) i s
independent o f t h e ac tua l a rea l evapot ransp i ra t ion and may the re fo re
be used t o r e f l e c t t h e evapot ransp i ra t ion demand. The in fo rmat ion
presented i n t h e preceding sec t i on shows t h a t t h i s assumption i s
i nva l i d . Federer (1979) has t r i e d t o take t h i s i n t o account i n
us ing t h e r e s u l t s o f h i s model b y us ing t h e unstressed t r a n s p i r a t i o n
as a causal f a c t o r o r f o r c i n g f u n c t i o n b u t does n o t take i t i n t o
account i n t h e model i t s e l f .
CONCLUDING DISCUSSION
The foregoing c r i t i c a l rev iew has i nd i ca ted t h a t t h e
convent ional conceptual techniques used i n es t imat ing a rea l
evapot ransp i ra t ion are based on assumptions t h a t a re completely d ivorced
f rom r e a l i t y and t h a t t h e causal techniques c u r r e n t l y under development
a re n o t l i k e l y t o prove use fu l f o r a t l e a s t another generation. However,
t h i s does no t mean t h a t t h e science o f hydrology must cont inue t o
stagnate f o r another generat ion awai t ing t h e opera t iona l est imates of
a rea l evapotranspi rat ion t h a t a re needed t o analyze r i v e r bas in water
balances and t h e hydro log ica l c y c l e because such est imates can be based

on the the negative or complementary responses of potential
evapotranspiration to changes in the water available for areal
evapotranspiration discussed in a preceding sect ion. If the relationship
is complementary it can be represented by:
ET + ETP = 2 ETW
or by:
ET = ZETw - ETP
in which ET is the areal evapotranspiration, the actual
evapotranspiration from an area so large that the effects of upwind
boundary transitions, such as those shown in Fig. 4 are negligible; ETp
is the potential evapotranspiration, as estimated from a solution of the
vapour transfer and energy balance equations, representing the
evapotranspiration that would occur from a hypothetical moist surf ace
with radiation absorption and vapour transfer characteristics similar to
those of the area and so small that the effects of the evapotranspiration
on the overpassing air would be negligible; and ETM is the wet
environment areal evapotranspiration, the evapotranspiration that would
occur if the soil-plant surfaces of the area were saturated and there
were no limitations on the availability of water.
Fig. 5 provides a schematic representation of eq. (8) under
conditions of constant radiant energy supply. The ordinate represents
evapotranspiration and the abscissa represents the water supply to the

soil-plant surfaces of the area, a quantity that is usually unknown.
When there is no water avail able for areal evapotranspiration (extreme
left of Fig. 5) it follows that ET = 0, that the air is very hot and
dry and that ETp is at its maximum rate of 2Ew (the dry environment
potential evapotranspiration). As the water supply to the soil-plant
surfaces of the area increases (moving to the right in Fig. 5) the
resultant equivalent increase in ET causes the overpassing air to
become cooler and more humid which in turn results in an equivalent
decrease in ETp. Finally, when the supply of water to the soil-plant
surfaces of the area has increased sufficiently, the values of ET and
E~~ converge to that of EiW.
The conventional definition for potential evapotranspiration is
the same as the definition for the wet environment areal
evapotranspiration. However the potential evapotranspiration that is
estimated from a solution of the vapour transfer and energy balance
equations by analytical (Penman, 1948), graphical (Ferguson, 1952) or
iterative (Morton, 1982b) techniques has reactions to changes in the
water supply to the soil-plant surfaces that are similar to those shown
for ETp in Fig. 5, so what is being estimated can exceed what is being
defined by as much as 100 percent. By taking into account such reactions
the complementary relationship is analogous to the Bernouilli equation
for open channel flow in which the potential energy responds in a
complementary way to changes in kinetic energy.

A tabular summary of the literature on the complementary
relationship since it was introduced by Bouchet (1963) is presented in
the Appendix. Although there is little doubt that the relationship is
negative there is no "proof" that it is complementary. It is explicable
only in terms of the meteorological theory of advection which is,
unfortunately, more qualitative than quantitative. Therefore attempts to
provide the complementary relationship with a mathematical basis, such as
those presented by Bouchet (1963), Morton (1971), and Seguin (1975),
depend on too many unverified and unverifiable assumptions to be
classified as anything other than rationalizations. Despite this
shortcoming the complementary relationship is superior to most
hydrological concepts (including the assumption of linearity that is
basic to the unit hydrograph) because it is compatible with all current
theoretical knowledge and re1 iable empirical evidence. This is discussed
in detail in a companion paper (Morton, 1982b). The supporting evidence
that follows is limited to data presented in preceding sections.
(1) In Fig. 3, the slope of the line that relates the evaporation from
the pan in the irrigated area at U.S. Indio Date Garden, California,
to the evaporation from the pan in the desert at Death Valley,
California, has a slope of 52 percent. In Fig. 4, the ratio of the
dish evaporation at the downwind edge of the cotton field with "wet"
soil to the dish evaporation in the desert at the upwind edge of the
irrigation project is 53 percent. These percentages agree closely
with the prediction of the complementary relationship (see Fig. 5)
that the potential evapotranspiration in a completely moist
environment should be 50 percent of the potential evapotranspiration
in a completely dry environment.
(2) Eq. (9) bears a striking resemblance to eqs. ( Z ) , ( 3 ) , (4) and (5),
the regression equations relating water budget estimates of growing
season evapotranspiration from spring wheat near Havre and Huntley,
Montana, to corresponding values of sunken tank evapotration (Army
and Ostle, 1957). The reasons for the variability in the regression
coefficients have been adduced in the discussion of the equations
which also indicated that the difference between the average slope
(-0.884) and that required by the complementary relationship
(-1.000) could be due to the low albedo of water which would make
the tank evaporation higher than the potential evapotranspiration.
The chief use of the complementary relationship is to provide
realistic independent estimates of areal evapotranspiration. Thus
eq. (9) provides the basis for a model in which the left hand side, a
product of complex processes and interactions in the
soil-plant-atmosphere continuum, can be estimated from the routine
observations of temperature, humidity and sunshine duration needed to
compute the right hand side. As in all modelling exercises the basic
concept must be associated with other assumptions and poorly defined
empiricisms. However, the complementary relationship avoids the
complexities of the soil-plant system and the need to represent such

poorly-understood phenomena as infiltration, soil moisture storage and
movement, groundwater recharge, uptake of water by roots and stomata1
controls by locally optimized fudge factors, Therefore the model is
falsifiable (i.e. can be tested rigorously) so that errors in the
associated assumptions and re1 at ionships can be detected and corrected by
progressive testing over an ever-widen ing range of envionments. Such a
methodology uses the entire world as a laboratory and requires that a
correction made to obtain agreement between model and river basin water
budget estimates in one environment must be applicable without
modification in a1 1 other environments.
The techniques that use the complementary relationship to
estimate areal evapotranspiration are referred to as the complementary
relationship areal evapotranspiration (CRAE) models. With a few minor
changes they can be used to provide realistic estimates of lake
evaporation from routine observations of temperaure, humidity and
sunshine duration in the land environment and they are then referred to
as the complementary re1 at ionship lake evaporation (CRLE) models.
The development of the complementary relationship to serve as a
basis for the latest versions of the CRAE and CRLE models and a detailed
documentation for these versions are presented in three companion papers
(horton, 1982b, 1982c and 1982e). Documentat ion of the combined program
in FORTRAN and in RPN notation for the Hewlett Packard HP-67 hand-held
calculator has been published by Morton, Goard and Piwowar (1980).

The procedure used to test the latest versions of the CRAE and
CRLE models is presented in detail in two companion papers (Morton, 1982d
and 1982e respectively). Fig. 6 shows the CRAE model estimates of areal
evapotranspiration plotted against the corresponding water budget
estimates for 143 river basins in North America, Africa, Ireland,
Australia and New Zealand. Fig. 7 shows the CRLE model estimates lake
evaporation plotted against the corresponding water budget estimates for
nine lakes in North America and one lake in Africa. The areal
evapotranspiration and lake evaporation were estimated for periods of a
month or shorter but were compared with water budget estimates for a year
or many years. In the case of evapotranspiration this minimizes the
effects of unmeasured changes of water stored in the basins and in the
case of lake evapotration this minimizes the effects of unmeasured
seasonal changes in subsurface heat storage.
Although it is generally recognized that evapotranspiration i s
an important aspect of hydrology, the recognition is theoretical. On a
practical basis, most hydrologists and engineers fail to understand how
research and education in hydrology have been confined to a few narrow
problems by the lack of reliable operational estimates of
evapotranspiration. Therefore it is extremely difficult for them to
visualize the opportunities that arise when such estimates become
available. For this reason a large part of a companion paper (Morton,
1982d) is devoted to examples which show the potential impact of
operational estimates of evapotranspiration on the science and practice
of hydro1 ogy .

- 32 -
APPENDIX
LITERATURE ON COMPLEMENTARY RELATI ONSHI P
Bouchet ( 1963)
Morton (.I 965)
Introduction and rationalization: Wet environment areal evapotranspiration assumed to be half the absorbed global radiation: Mean annual water budget data from equatorial regions used to demonstrate plausibility of concept.
Rational ization and model development: Potential evapotranspiration estimated from graphical technique of Ferguson (1 952) : Vapour transfer coefficient a function of wind speed derived from pan data: Model tested with monthly water budget estimates for 58 Canadian basins.
So 1 omon ( 1966) Discussion of Morton (1965)
Christiansen (1966) Discussion of Morton (1965)
Gillespie and Discussion of Morton (1965) King (1966)
Morton ( 1967) Reply to Solomon (1966), Christiansen (1966) and Gillespie and King (1966).
Solomon (1967) See discussion of Figs. 6 and 7 in companion paper (Morton, 1982b ) .
Morton ( 1968) Potential evapotranspiration estimated from Kohler and Parmele (1967) version of Penman (1948) equation: Concept tested with pan data from humid areas in Ireland and model tested with annual water budget data from six river basins in Ireland.
Morton ( 1969)
Morton ( 1970)
Test of concept extended to pan data from arid areas of the southwestern United States.
Model adapted for use during, snowy, high latitude winters. Tested with water budget data from 20 rivers in Ireland and Canada.
Model adapted for use without wind speed inputs, i.e. vapour transfer coefficient assumed to be constant.

- 33 -
APPENDIX (Cont 'd)
LITERATURE ON COMPLEMENTARY RELATIONSHIP
Bouchet, Fort in, ~ ~ ~ l i c a t i o n of basic concepts to the effects of and Seguin (1974) the size of an irrigated area on evapotranspiration.
Fortin and Seguin Rationalization and test with data from experimental ( 1975) plot for time scales of less than a month.
Seguin (1975) Application of basic concepts to take into account the effect of the relative size of the potential evapotranspiration area to the areal evapotranspiration area.
Morton (1975) Potential evapotranspiration estimated from Penman (1948) equation and wet environment areal evapotranspiration derived from Priestley and Taylor (1972) equation: Vapour transfer coefficient and the required advection energy calibrated with data from arid regions. Model tested with 5-year water budget data for 118 river basins in Canada, the southern United States and Ireland.
Morton (1 976)
Giusti (1978)
Morton (1978)
W a1 1 ace (1 978)
korton (1979)
Potential evapotranspiration estimated from Kohler and Parmele (1967) version of Penman equation and wet environment areal evapotranspiration made compatible with it: Test range extended to include 3 more river basins in Kenya and in the United States.
See discussion of Fig. 8 in companion paper (Morton, 1982b).
Wet environment areal evapotranspiration corrected for effects of changes in the availability of water on temperature: Vapour transfer coefficient made function of atmospheric stability and radiation estimates made more realistic. Test range extended to one more basin in Canada.
Application of model (Morton 1978) to data from arid area near Hanford, Washington.
Modification of model (Morton, 1968) to provide estimates of lake evaporation. Tested with annual water budget data for seven North American lakes.

LITERATURE ON COMPLEMENTARY RELATIONSHIP
Brutsaert and Wet envir~nment areal evapotranspiration est imated Stricker (1979) from Priestley and Taylor (1972) equation;
potential evapotranspiration estimated from Penman (1 948) equation; vapour transfer coefficient estimated from wind speed: Tested with 3-day energy budget data for a basin in the Netherlands during the dry summer of 1976.
LeDrew (1979)
Morton (1980)
LeDrew ( 1980)
A critical evaluation of the complementary relationship based primarily on simulated values of areal and potential evapotranspiration.
Discussion of LeDrew (1979) stressing the lack of reality in the criterion used to select which pairs out of the 540 simulated values of areal evapotranspiration and 100 simulated values of potential evapotranspiration were compatible with the requirement that prof i les of temperature and humidity be completely adjusted to surface fluxes of heat and water vapour.
Reply to Morton (1980) stating that the selection criterion is unimportant thereby implying incorrectly that there is no requirements for the profiles of temperature and humidity to be completely adjusted to the surface fluxes of heat and water vapour.
Morton, Goard and Documentation of Fortran programs and hand-held Piwowar (1980) programable calculator programs for the latest
versions of the areal evapotranspiration and lake evaporation models (Morton, 1982a,b,c,d,e).

- 35 -
REFERENCES
Abramova, M.M., 1968. Movement o f mo is tu re as a l i q u i d and vapour i n
s o i l s o f semi-deserts, In te rnat . Assoc. Sci. Hydrol., Proc.
Wageningen Symposium, Publ i c a t i o n 83, pp. 781-789.
Army, T.J. and B. Ostle, 1957. The assoc ia t ion between f reewater
evaporat ion and evapot ransp i ra t ion of sp r i ng wheat under t h e
p r e v a i l i n g c l i m a t i c cond i t i ons o f t h e p l a i n s area o f Montana,
Proc. S o i l Sci. Soc, Am., 21, pp. 469-472.
Baier, W. and Geo. W. Robertson, 1966. A new v e r s a t i l e s o i l mo is tu re
budget, Can. Jour. P lan t Sci., 46, pp. 299-315.
Bouchet, R.J., 1963. Evapotranspi rat ion r e e l e e t p o t e n t i e l l e ,
s i g n i f i c a t i o n c l imat ique, I n te rna t . Assoc. Sci. Hydrol ., Proc.
Berkeley Symposium, Publ i c a t i o n 62, pp. 134-142.
Bouchet, R.J., Fo r t i n , J.P. and B. Seguin, 1974. Mod i f i ca t i on des
fac teu rs c l imat iques e t de l ' evapo t ransp i ra t i on p o t e n t i e l l e
(ETP) pa r 1 ' i r r i g a t i o n , Journees de 1 'hydraul ique, 13, Par is ,
pp. 1-7.
Bru tsaer t , Wi l f r ied, and Han S t r i cke r , 1979. An advec t i on -a r i d i t y
approach t o est imate ac tua l reg iona l evapotranspi rat ion, Water
Resour. Res, 15 ( 2 ) , pp. 443-450.
Budyko, M.I., 1974. Climate and L i f e , Academic Press.
Burnash, R. J.C., F e r r e l , R. L., and R.A. McGuire, 1973. A general i zed
streamf low s imula t ion system: Conceptual model 1 i n g f o r d i g i t a l
computers, U.S. Department of Commerce, Nat iona l Weather Serv ice
and Cal. Dept. o f o f Water Resources, Sacremento, Ca l i fo rn ia .
Calder, I.R., 1977. A model of transpiration and interception loss from
a spruce forest in Plynlimon, Central Wales, Jour. of Hydrol.,
33, pp. 247-265.
Carey, J.W., 1966. Soil moisture transport due to thermal gradients:
practical aspects, Proc. Soil Sci. Soc. Am., 30, pp. 428-433.
Christiansen, Jerrold E., 1966. Discussion of "Potential evaporation and
river basin evaporation", Jour. Hydraul. Div. Amer. Soc. Civi 1
Engs., 92 (HY5), pp. 225-230.
Cowan, I .R., 1977. Stomata1 behaviour and environment, Advances in
Botanical Research, 4, pp. 11 7-228.
Davenport, D.C. and J.P. Hudson, 1967. Changes in evaporation rates
along a 17-km transect in the Sudan Gezira, Agric. Meteor., 4,
pp. 339-3520
Enoch, H.Z. and R.G. Hurd, 1979. The effect of elevated C02
concentrations on plant transpiration and water use efficiency:
A study with potted carnation plants. Int. Jour. Biorneteor.,
23, pp. 343-351
Federer, C.A., 1979. A soi 1-plant-atmosphere model for transpiration and
the availability of soil water, Water Resour. Res., 15(3),
pp. 555-5620
Ferguson, J., 1952. The rate of natural evaporation from shallow ponds,
Austr. Jour. Sci. Research, &, pp. 315-330.
Fortin, J.P. and B. Seguin, 1975. Estimation d e 1 'ETR regional a partir
de 1'ETP locale: Utilization de la relation de Bouchet a
differentes echelles de temps, Ann. Agron., 26(5), pp. 537-554.

Penman, H.L., 1948. Natural evaporation from open water, bare soil and
grass, Proc. Roy, Soc., Ser. A, 193, pp. 120-145.
Penman, H.L., 1967. Discussion on groundwater recharge study in
northeastern Jordan, Proc. Inst. Civil. Engr., 37, pp. 705-706.
Priestley, C.H.B. and R.J. Taylor, 1972. On the assessment of the
surface heat flux and evaporation using large-scale parameters,
Mon. Weather Rev., 100, pp. 81-92.
Robins, J.S., Pruitt, W.O., and W.H. Gardner, 1954. Unsaturated flow of
water in field soils and its effect on soil moisture
investigations, Proc. Soil Sci. Soc. Am., 18, pp. 344-347.
Rubin, J., 1966. Theory of rainfall uptake by soils initially drier than
their field capacity and its applications, Water Resour. Res,
2(4) , pp. 739-749.
Rubin, J., and R. Steinhardt, 1963. Soil water relations during rain
infiltration: I. Theory, Proc. Soil Sci. Soc. Am., 27,
pp. 246-251.
Rubin, J., Steinhardt, R., and P. Reiniger, 1964. Soil water relations
during rain infiltration: 11 Moisture content profiles during
rains of low intensities, Proc. Soil Sci. Soc. Am., 28, pp. 1-5.
Schultte, E.-D., Lange, O.L., Buschbom, U., Kappen, L., and M. Evenari,
1972. Stomata1 responses to changes in humidity in plants
growing in the desert, Planta, 108, pp. 259-270.
Seguin, B., 1975. Influence de 1 'evapotranspiration regionale sur 1 a
mesure locale d'evapotranspiration potentielle, Agric. Meteor.,
1 5, pp. 355-370.
Solomon, S., 1966. Discussion of *Potential evaporation and river basin
evaporationtt, Jour. Hydraul. Div. Amer. Soc. Civil Eng., 92
(HY5), pp. 219-225.
Solomon, S., 1967. Relationship between precipitation, evaporation and
runoff in tropical-equatorial regions, Water Resour. Res., 3(1),
pp. 163-172.
Tan, C.S. and T.A. Black, 1976. Factors affecting the canopy resistance
of a Doug1 as-Fir forest, Boundary-Layer Meteor., 10, pp. 475-488.
Wallace, R. .W, 1978. A comparison of evapotranspiration using DOE
Hanford Cl imatol ogical Data, Report No. PNL-2698, UC-70, Pacif i C
Northwest Laboratory, Battelle, 19 pp.

- 43 -
TITLES FOR FIGURES
Fig. 1 Relationship between mean daytime canopy resistance, soil water
potential and vapour pressure deficit for Douglass Fir (Tan and
Black, 1976).
Fig. 2. Relationship between Class A pan evaporation at Indio U.S. Date
Garden, California, and at Death Valley, California for the
months of January to June inclusive.
Fig. 3. Relationship between Class A pan evaporation at Indio U.S. Date
Garden, California, and at Death Valley, California, for the
months of July to December inclusive.
Fig. 4 Comparison of evaporation rates across irrigated cotton fields
on December 27, 1963 (Davenport and Hudson, 1967).
Fig. 5 Schematic representation of complementary relationship between
areal and potential evapotranspiration with constant radiant
energy supply.
Fig. 6 Comparison of model estimates with water budget estimates of
areal evapotranspiration for 143 river basins in North America,
Africa, Ireland, Australia and New Zealand.

Fig. 7 Comparison of model estimates with water budget estimates of
evaporation f r o m Lake Victoria [V], Salton Sea [ss], Silver
Lake [S], Lake Hefner [HI, Pyramid Lake [PI, Winnemucca Lake
[W], Lake Ontario [0], Last Mountain Lake [L] and Dauphin Lake
[Dl
0 -2 -4 -6 -8 -10
SOIL WATER POTENTIAL (bar)
MONTHLY VALUES FOR I JANUARY TO JUNE INCLUSIVE
5 10 15 20
PAN EVAPORATION AT DEATH VALLEY (mm day-l)
15 I I I I
MONTHLY VALUES FOR
5 10 15 20
PAN EVAPORATION AT DEATH VALLEY (mm day-')


2ETw = DRY ENVIRONMENT POTENTIAL EVAPOTRANSPIRATION
= POTENTIAL EVAPOTRANSPIRATION 2 . 0
. Q u3 E ~ w = WET ENVIRONMENT AREAL
EVAPOTRANSPIRATION I- 0 n
= AREAL EVAPOTRANSPIRATION
WATER SUPPLY TO SOIL-PLANT SURFACES OF AREA


WATER BUDGET ESTIMATE OF LAKE EVAPORATION IN MILLIMETRES PER YEAR

OPERATIONAL ESTIMATES OF AREAL EVAPOTRANSPIRATION
AND THEIR SIGNIFICANCE TO THE SCIENCE AND
PRACTICE OF HYDROLOGY
I1 THE COMPLEMENTARY RELATIONSHIP
F.I. Morton
National Hydrology Research Institute
Environment Canada
Ottawa, Canada KIA 0E7
ABSTRACT
Morton, F.I., 1982b. Operational estimates of areal
evapotranspiration and their significance to the science and
practice of hydrology: I1 The complementary relationship.
The complementary relationship predicts that the sum of the areal and
potential evapotranspiration is equal to twice the wet environment areal
evapotranspiration. It permits the areal evapotranspiration, a product
of complex processes and interactions in the soil-plant-atmosphere
continuum, to be estimated from its effects on the routine climatological
observations that are required to estimate the other two quantities. An
appraisal of the conceptual and empirical foundations for the
complementary relationship demonstrates that it is realistic in the
hydrometeorological context. A quickly converging iterative solution of
the vapour transfer and energy balance equations for estimating potential
evapotranspiration and the calibration of an equation for estimating wet
environment areal evapotranspiration, using climatological data from
desert regions where the monthly areal evapotranspiration approximates
the monthly precipitation, are outlined. These formulations permit the
complementary relationship to be used anywhere in the world with no
further calibration. The development of complementary relationship
models to provide operational estimates of areal evapotranspiration and
lake evaporation from routine climatological observations, the testing of
such estimates against comparable water budget values and their potential
use in revitalizing the science and practice of hydrology are presented
in subsequent companion papers.

INTRODUCTION
Advances in the science and practice of hydrology have been
impeded by a dearth of re1 iable areal evapotranspiration estimates.
Direct measurements, such as those provided by lysimeters, the eddy flux
technique or the Bowen-ratio technique, give point values, require
constant attendance by skilled personnel and are based on unverified
assumptions. The water budget method provides good estimates for several
years or more but requires excessive instrumentation ana manpower for
shorter term estimates. A companion paper (Norton, 1982a) presents a
critical review indicating that the current conceptual modelling
techniques, as exemplified in the SACREMENTO WATERSHED MODELLING SYSTEM,
are based on assumptions about the soil, the vegetation and the
atmosphere that are incompat ible with pub1 i shed evidence and that causa 1
modelling techniques that take into account the complex processes and
interactions in the soil-plant-atmosphere continuum are not expected to
have practical applications in the next generation. The review also
indicates that the models based on the complementary relationship between
potential and actual areal evapotranspiration can do much to fill the gap
until such time as the causal models become practicable.
The chief advantage of the complementary relationship is that it
permits the areal evapotranspiration, a product of complex processes and
interactions in the soil-plant-atmosphere continuum, to be estimated by
its effects on the routine climatological observations that are used to
compute potent i a1 evapotranspi rat ion. Because t h e model avoids t h e
complex i t ies of t h e so i l - p lan t system i t requ i res no l o c a l op t im iza t i on
o f c o e f f i c i e n t s and is , therefore, f a l s i f i a b l e . Th is means t h a t i t can
be tes ted r i g o r o u s l y so t h a t e r r o r s i n t h e associated assumptions and
re1 a t ionships can be detected and cor rec ted by progressive t e s t i n g over
an ever-widening range of environments. Such a methodology uses t h e
e n t i r e wor ld as a l abo ra to ry and requ i res t h a t a co r rec t i on made t o
ob ta in agreement between model and r i v e r bas in water budget est imates i n
one environment must be app l icab le w i thout mod i f i ca t i on i n a1 1 o t h e r
environments. The est imates r e s u l t i n g f rom t h e most recent a p p l i c a t i o n
o f t h i s methodology agree c l o s e l y w i t h comparable long-term water budget
est imates f o r 143 r i v e r basins i n Nor th America, Afr ica, I re land,
A u s t r a l i a and New Zealand.
The complementary r e l a t i o n s h i p a l so takes i n t o account t h e
mod i f i ca t i on o f t he a i r i n passing from land across a lake. Th i s
prov ides f u r t h e r advantages i n t h a t minor changes can transform t h e
complementary r e l a t i o n s h i p area l evapot ransp i ra t ion (CRAE) model t o a
complementary r e l a t i o n s h i p 1 ake evaporat ion (CRLE) model t h a t permi ts
lake evaporat ion t o be est imated from r o u t i n e c l i m a t o l o g i c a l observat ions
i n t h e land environment. Resul ts o f t h e l a t e s t CRLE model have been
tes ted against comparable water budget est imates f o r n i n e lakes i n North
America and two lakes i n A f r i ca .

The conceptual and emp i r i ca l foundat ions f o r t h e complementary
r e l a t i o n s h i p and t h e developments needed t o make i t useable are presented
here in. The fo rmu la t i on o f t h e l a t e s t CRAE and CRLE models, t h e way they
are used t o p rov ide opera t iona l est imates o f a rea l evapot ransp i ra t ion and
l a k e evaporat ion, t h e t e s t o f such est imates aga ins t comparable water
budget values and t h e p o t e n t i a l use o f such est imates t o p rov ide t h e
impetus f o r t ransforming hydrology f rom a d e s c r i p t i v e t o a p r e d i c t i v e
science are presented i n companion papers (Morton 1982c, 1982d, 1982e).
The conceptual bas i s f o r t h e complementary r e l a t i o n s h i p , which
inc ludes a schematic model o f t h e lower atmosphere and a mathematical
r a t i o n a l i z a t i o n , i s presented i n t h e Appendix.
COhPLEblENTARY RELATIONSHIP
P o t e n t i a l evapot ransp i ra t ion i s normal ly est imated f rom a
s o l u t i o n o f t h e energy balance equat ion and t h e vapour t r a n s f e r equat ion
f o r a mo is t surface. These equat ions can be solved by an approximate
a n a l y t i c a l technique (Penman, 1948) a g raph i ca l technique (Ferguson,
1952) o r an i t e r a t i v e technique l i k e t h e one presented herein. Kohler,
Nordenson and Fox (1955) have shown t h a t t h e Penman (1948) equat ion can
p rov ide good est imates o f Class A pan evaporat ion if modi f ied t o take
i n t o account t h e d i f fe rence between vegetated and water sur faces and t h e
e f fec ts of sens ib le heat f l u x through t h e w a l l and bottom o f t h e pan.
Therefore it seems l i k e l y t h a t t he evaporat ion f rom any smal l

water-f i l led container will provide a reasonable reflection of potential
evapotranspiration, although the reflection will be somewhat distorted by
differences in albedo, in surface roughness and in the ratio of latent
heat transfer area to sensible heat transfer area.
The complementary relationship is based on a feedback mechanism
whereby a decrease in areal evaporation caused by a reduction in the
availability of water will increase the temperature and decrease the
humidity of the overpassing air and this in turn will increase the
potential evapotranspiration. Interactions such as these invalidate the
conventional assumption that in any relationship between areal
evapotranspiration and potential evapotranspiration the latter is the
independent variable. Thus the use of potential evapotranspiration as a
causal factor or forcing function is limited to two specific cases:
( 1 ) to existing moist areas so large that the effects of the
evapotranspiration on the temperature and humidity of the overpassing air
are fully developed and the areal evapotranspiration equals the potential
evapotranspiration; and (2) to existing or hypothetical moist areas so
small that the effects of the evapotranspiration on the temperature and
humidity of the overpassing air are negligible. Pans and other
evaporimeters fit into the latter category insofar as size is concerned.
In Bernouilli's equation for open-channel flow, the potential
energy responds negatively to changes in the kinetic energy. Thus there
appear to be analogies between potenti a1 evapotranspiration and potenti a1

energy and between areal evapotranspiration and kinetic energy. To be
completely analogous the relationship would have to be complementary,
i.e. the responses would have to be opposite in sign and equal, and both
observational data and theory show that this is a distinct possibility.
However it should be noted that the analogy cannot be extended into the
critical flow regime because areal evapotranspiration cannot exceed
potential evapotranspiration.
The oasis effect is the best known phenomenon associated with
the foregoing interact ions. It can be demonstrated by comparing monthly
evaporation from two U.S. Weather Bureau Class A pans in the sout,heast
desert basin of California during the years 1962, 1963 and 1964. Figs 1
and 2 show the pan evaporation in a large well-irrigated area at Indio
U.S. Date Garden plotted against the pan evaporation in the desert at
Death Valley for the first six months and the last six months of the
calendar year respectively. The plotted regression lines have
coefficients of correlation of 99 percent. The small zero-intercepts can
be attributed to the effect of the 2.7 degree difference in latitude in
increasing the winter radiation inputs at Indio so that the slopes
represent the effects on pan evaporation of increasing the areal
evapotranspiration from a near-zero value in the desert to a near-maximum
value in an irrigated oasis. Thus Fig. 1 shows that the oasis pan
evaporation is only 57 percent of the desert pan evaporation during the
first six months of the calendar year and Fig. 2 shows that the oasis pan
evaporation is only 52 percent of the desert pan evaporation during the
last six months of the calendar year.

The oasis effect and the negative relationship between actual
and potential evapotranspiration have been demonstrated by Davenport and
Hudson (1967). They measured the variation in evaporation across a
series of irrigated cotton and unirrigated fallow fields in the Sudan
Gezira, using fiberglass dishes with black painted wells 113 mm in
diameter and 36 mm in depth. The dish evaporation observations provided
a somewhat distorted reflection of the potential evapotranspiration. The
passage of air from the upwind desert (and/or the upwind unirrigated
fallow fields) over the irrigated cotton caused the dish evaporation t o
decrease rapidly and approach a low constant value within 300 m - the width of the fields. Furthermore, 'as the air passed from irrigated
cotton across unirrigated fallow the dish evaporation increased rapidly
and approached a,high constant value within 300 m. Fig. 3 shows the
variation of dish evaporation across three irrigated fields on
December 27, 1963. The description of the soil condition is presumably
based on visual inspection and is related t o the number of days since the
last irrigation. Thus it is reasonable t o assume that the actual
evapotranspiration is greater in the Itmoist" field than in the "dry"
field and that it is somewhere near its maximum possible value in the
"wetn field.
At the upwind edge of the irrigated fields, where the dish
evaporation decreases rapidly, the hot dry air from the desert (or the
unirrigated fallow) loses heat and gains vapour from contact with the
transpiring cotton leaves. Downwind from the transitional zone, where
t he d i sh evaporat ion approaches a low constant value, t h e e f f e c t s o f t h e
evapot ransp i ra t ion on t h e temperature and humid i ty o f t h e overpassing a i r
are we1 1 developed and approaching equi 1 i brium. (Decreases i n
temperature and increases i n humid i ty as t h e a i r moved across t h e
i r r i g a t e d co t ton were observed over one f i e l d . The vapour pressure
appeared t o a t t a i n e q u i l i b r i u m values w i t h i n 300 m b u t t he temperatures
were s t i l l decreasing, poss ib l y because t h e observat ions were made above
t h e l e v e l of t h e crop and dishes.) As i t i s o n l y i n an e q u i l i b r i u m zone
t h a t the term area l evapot ransp i ra t ion has any meaning, t h e minimum s i z e
of an area f o r which t h e term i s app l i cab le i s one . in which t h e edge
e f fec ts i n t h e upwind t r a n s i t i o n a l zone become i n s i g n i f i c a n t .
The r a t i o of d a i l y d i s h evaporat ion a t t h e downwind edges of t h e
i n d i v i d u a l i r r i g a t e d co t ton f i e l d s t o t h a t a t t h e upwind edge of t h e
i r r i g a t e d area was 0.69 f o r t h e f i e l d w i t h "dry" s o i l , 0.60 f o r t h e f i e l d
w i t h "moist" s o i l and 0.53 f o r t h e f i e l d w i t h "wet" s o i l . This prov ides
good evidence t h a t t h e d i s h evaporat ion, and presumably the p o t e n t i a l
evapotranspi rat ion, respond nega t i ve l y t o changes i n a rea l
evapot ransp i ra t ion induced by changes i n t h e a v a i l a b i l i t y o f water.
I n Fig. 3 t h e d i s h evaporat ion f o r t h e "wet" f i e l d provides an
i n d i c a t i o n of what happens over a l ake i n an a r i d c l imate. Thus t h e
upwind d i s h evaporat ion r e f l e c t s t h e p o t e n t i a l evaporat ion i n t h e deser t
and t h e low, r e l a t i v e l y constant d i s h evaporat ion near t h e downwind edge
r e f l e c t s t h e p o t e n t i a l evaporat ion over most of t h e lake. Furthermore,

t h e d i sh evaporat ion f rom t h e 'moist" and "dry" f i e l d s prov ides an
analogy f o r what happens over lakes i n p rog ress i ve l y more humid c l imates
where the cont rac ts between lake and land environments are l ess extreme.
Because t h e t r a n s i t i o n zone i s so narrow, t h e lake evaporat ion would
approximate the low constant downwind value o f p o t e n t i a l evaporat ion.
If t h e negat ive reac t i ons o f p o t e n t i a l evapot ransp i ra t ion t o
changes i n t he avai l a b i 1 i t y o f water f o r a rea l evapot ransp i ra t ion are
complementary, as suggested by t h e analogy t o t h e B e r n o u i l l i theorem f o r
open channel flow, the r e l a t i o n s h i p i s expressed i n mathematical form by:
i n which ET i s t h e area l evapotranspi rat ion, t h e ac tua l
evapot ransp i ra t ion f rom an area so l a r g e t h a t t h e e f f e c t s of upwind
boundary t r a n s i t i o n s , such as those shown i n Fig. 3, are n e g l i g i b l e ;
ETP i s t h e p o t e n t i a l evapotranspi rat ion, as est imated f rom a s o l u t i o n
of t h e vapour t rans fe r and energy balance equations, represent ing t h e
evapot ransp i ra t ion t h a t would occur f rom a hypothet ica l mo is t surface
w i t h r a d i a t i o n absorpt ion and vapour t r a n s f e r c h a r a c t e r i s t i c s s i m i l a r t o
those o f t he area and so smal l t h a t t h e e f fec ts o f t h e evapot ransp i ra t ion
on t h e overpassing a i r would be n e g l i g i b l e ; and ETN i s t h e wet
environment areal evapotranspi rat ion, t h e evapotranspi rat ion t h a t would
occur if t h e s o i l - p l a n t surfaces of t h e area were sa tura ted and t h e r e
were no l i m i t a t i o n s on t h e a v a i l a b i l i t y o f water.

Fig. 4 provides a schematic representat ion o f eq. (1 ) under
cond i t i ons o f constant rad ian t energy supply. The o rd ina te represents
evapotranspirat ion and the abscissa represents the water supply t o t h e
s o i l - p l a n t surfaces of t he area, a q u a n t i t y t h a t i s u s u a l l y unknown.
hhen there i s no water ava i l ab le f o r areal evapotranspirat ion (extreme
l e f t of F ig. 4) i t f o l l o w s t h a t ET = 0, t h a t t he a i r i s very hot and
d r y and t h a t ETp i s a t i t s maximum r a t e o f 2ETk ( t h e d r y environment
p o t e n t i a l evapotranspirat ion) . As t h e water supply t o the s o i 1-plant
surfaces o f t he area increases (moving t o t h e r i g h t i n Fig. 4) t h e
r e s u l t a n t equ iva lent increase i n ET causes t h e overpassing a i r t o
become coo ler and more humid which i n t u r n produces an equ iva lent
decrease i n ETp. F i n a l l y , when t h e supply o f water t o the so i l -p lan t
surfaces o f t h e area has increased s u f f i c i e n t l y , t he values of ET and
E~ P converge t o t h a t of ETN.
The conventional d e f i n i t i o n f o r p o t e n t i a l evapotranspirat ion i s
the same as the d e f i n i t i o n f o r t he wet environment areal
evapotranspirat ion. However, t h e p o t e n t i a l evapotranspirat ion t h a t i s
estimated from a s o l u t i o n o f the vapour t r a n s f e r and energy balance
equations by a n a l y t i c a l (Penman, 1948), graphical (Ferguson, 1952) o r
i t e r a t i v e (see next sec t ion) techniques has reac t ions t o changes i n t h e
water supply t o t h e s o i l - p l a n t surfaces s i m i l a r t o those shown f o r ETp
i n Fig. 4 so t h a t what i s being estimated can exceed what i s being
def ined by as much as 100 percent. By t a k i n g i n t o account such reac t ions
the complementary r e l a t i o n s h i p i s analogous t o the B e r n o u i l l i equat ion
for open channel flow in which the potential energy responds in a
complementary way to changes in kinetic energy.
The evaporation from a shallow lake, E,,,, differs from the wet
environment areal evapotranspiration, ETN, only because the radiation
absorption and vapour transfer characteristics of water differ from those
of vegetated 1 and surfaces. The potential evaporation, Ep, differs
from the potential evapotranspiration, ETp, for the same reasons.
Although the lake evaporation is equal to the potential evaporation in
the lake environment it can differ significantly from the potential
evaporation in the land environment.
Fig. 5 provides a schematic representation of the relationship
between shallow lake evaporation and the potential evaporation in the
land environment under conditions of constant radiant energy supply. The
ordinate represents evaporation and the abscissa represents the water
supply to the soil-plant surfaces of the land environment. Since a lake
is defined to be so wide that the effects of the kind of upwind
transition shown in Fig. 3 are negligible, the lake evaporation is
independent of variations in the water supply to the soil-plant surfaces
of the 1 and environment. However, the complementary relationship
predicts that the potential evaporation in a completely dry land
environment would be twice the lake evaporation and that it would
decrease in response to increases in the water supply to the soil-plant
surfaces until it reached a minimum equal to the lake evaporation as
shown in Fig. 5.
A tabular summary of the literature on the complementary
relationship since it was introduced by Bouchet (1963) is appended to the
preceding companion paper (Morton, 1982a). Although there is 1 itt 1 e
doubt that the relationship is negative there is no "proof" that it is
complementary. However the most important assumption underlying the
relationship is compatible with the schematic model of the lower
atmosphere that is documented herein as an Appendix. The schematic model
includes an equilibrium sublayer, in which the gradients of temperature
and humidity adjust to the surface fluxes of heat and water vapour; and a
mixed sublayer, in which the heat and vapour fluxes are mixed by free
buoyant convection, with no significant potential temperature or specific
humidity gradients, under an overlying regional potential temperature
inversion. The heights of the equilibrium and mixed sublayers have
diurnal and seasonal patterns with typical summer afternoon values of
30 m and 800 m respectively. According to this model the large-scale
weather systems influence potential evapotranspiration indirectly through
their effects on the radiant energy and precipitated water received at
the surface. However the direct effects are negligible because they are
manifested by changes in the stability of the regional inversion and
because the changes cause increases or decreases in the equilibrium
sublayer temperature and in the equilibrium sublayer humidity that tend
to be compensatory. Therefore the effects of changes in the availability
of water for areal evapotranspiration on the potential evapotranspiration
can be assessed by their effects on the temperature and humidity
gradients in the equilibrium sublayer.

The complementary relationship is explicable only in terms of
the meteorological theory of advection which is, unfortunately, more
qua1 itative than quantitative. Therefore, attempts to provide it with a
mathematical formulation, such as those presented by Bouchet (1 963),
Morton (1971) and Seguin (1975), depend on too many unverified and
unverifiable assumptions to be classified as anything other than
rationalizations. However, the appended schematic model of the lower
atmosphere and the appended improved version of the previously published
rationalization (Morton, 1971) can be combined to show that the
complementary relationship has some basis in reality and to demonstrate
how it works.
The complementary relationship cannot be verified with currently
available theoretical knowledge and empirical evidence. However, in
addition to the rationalizations mentioned previously, there is direct
evidence for its plausibility. Figs. 6 and 7 were prepared in the same
format as Fig. 4 by Solomon (1967) to show annual data from four river
basins in Malawi. The availability of water is represented by the
precipitation, the evapotranspiration (areal ) is represented by the
difference between precipitation and runoff and the potential evaporation
is estimated from climatological data using the Penman (1948) equation.
The sum of the potential evaporation and evapotranspiration remains
relatively constant from basin to basin and from year to year. The lines
of best fit are curvilinear rather than linear as shown in Fig. 4,
because annual precipitation is greater than the water available for

evapotranspiration and the difference increases with increases in the
precipitation. Fig. 8 is a similar plot prepared by Giusti (1978) using
average annual data for a number of closed river basins in various parts
of Puerto Rico. In Fig. 8 the potential evapotranspiration is
represented by pan evapotranspiration. A1 1 three figures show that the
re1 ationship between annual values of potenti a1 and areal
evapotranspiration is negative in tropical countries like Malawi and
Puerto Rico and there is a good probability that it is complementary.
Army and Ostle (1957) have inadvertently provided more direct
evidence for the existence of a complementary relationship between areal
and potenti a1 evapotranspiration. They calculated actual areal
evapotranspiration (ET) from 0.1 acre plots of spring wheat by adding
the total precipitation from seeding to harvest to the amount of soil
moisture lost from seeding to harvest for 29 years at Huntley, Montana
and for 26 years at Havre, Montana. The results were then related to the
corresponding values of evaporation from nearby sunken B. P. I. tanks
(EpW), which provide a somewhat distorted reflection of potential
evapotranspiration. The resultant regression equations for plots that
were cropped every year were:
ET (at Huntley) = 30.8 - 1.025 EpW
ET (at Havre) = 24.5 - 0.644 EpW

and the regression equations for two plots that were cropped and left in
fallow on alternate years were:
ET (at Havre) = 28.5 - 0.725 EpW
The zero-intercepts for the four equations are in inches of
water and the coefficients of correlation vary from 0.790 to 0.826 with a
mean value of 0.814. In evaluating the results it should be noted that
unreported differences in vegetation and soil immediately adjacent to the
various plots and tanks could account for .sme of the differences between
the equations; that unreported year-to-year variations of absorbed
radiation would add to the scatter of the points and the uncertainty
concerning the regression coefficients; and that the tank evaporation
provides an overestimate of potential evapotranspiration (because of the
low albedo of water) and would thereby produce an underestimate of. the
negative slopes. In the light of these considerations the negative
slopes do not differ significantly from each other and the average value
(-0.884) does not differ significantly from that required by the
complementary relationship (-1.000).
In Fig. 2, the slope of the line that relates the evaporation
from the pan in the irrigated area at U.S. Indio Date Garden, California,
to the evaporation from the pan in the desert at Death Valley,

POTENTIAL EVAPOTRANSPIRATION
The potential evapotranspiration is estimated by solving for the
potenti a1 evapotranspiration equi 1 ibrium temperature (hereinafter
referred to as the equi librium temperature or T,,), the temperature at
which the energy balance equation and the vapour transfer equation for a
moist surface give the same result. The analytical solution of Penman
(1948) and the modification suggested by Kohler and Parmele (1967) are
accurate only under relatively humid conditions where the equilibrium
temperature is near the air temperature; the graphical solution of
Ferguson (1952) and the modification suggested by Morton (1965) are more
precise but are inappropriate to computer use; and trial-and-error or
iterative solutions can require excessive computer time to achieve the
required precision. The technique used herein produces numerical
accuracy within four iterat ibns by incorporating certain aspects of the
analytical solutions.
Eqs. (7) and (8) represent the energy balance and vapour
transfer equations respectively

i n which fZ i s a constant, r i s a dimensionless s t a b i l i t y f a c t o r and
p and pS are t h e atmospheric pressure and t h e sea l e v e l atmospheric
pressure respec t i ve l y .
The square r o o t term i n eq. (12) i s inc luded t o represent t h e
e f f e c t o f a l t i t u d e o r atmospheric pressure on evaporat ion and t h e vapour
t r a n s f e r coe f f i c i en t . It provides a b e t t e r f i t t o Rowher's (1931) data
f o r sdnken pans a t Pikes Peak, Vic tor , F o r t Co l l ins , ( a l l i n co lorado) ,
Lake Tahoe, Imper ia l , (bo th i n C a l i f o r n i a ) ; Logan ( i n Utah) and F o r t
Cal houn ( i n Nebraska) than Rowher's (1931 ) 1 inear representat ion.
The s t a b i l i t y f a c t o r i s inc luded t o take i n t o account t h e
decrease i n t he vapour t r a n s f e r c o e f f i c i e n t t h a t occurs when t h e
temperature of t h e evaporat ing sur face i s much below t h e a i r
temperature. Th is i s usual dur ing t h e w i n t e r i n ex t ra - t rop i ca l l a t i t u d e s
and du r ing o the r seasons i n very d r y environments. The r e l a t i o n s h i p used
here in i s :
i n which bo i s 1 .OO f o r a rea l evapotranspi rat ion, RTC i s RT w i t h
> 0, and a l l o the r symbols are as de f ined prev ious ly . R~~ -

Eq. (13) i s based on t h e reasonable assumption t h a t t h e r a t i o of
t h e r a d i a t i o n term t o t h e vapour t r a n s f e r term i n t h e Penman (1948)
equat ion f o r p o t e n t i a l evaporat ion prov ides a good index of t h e e f f e c t s
of atmospheric s t a b i 1 i t y on t h e vapour t r a n s f e r coe f f i c i en t . The
q u a n t i t y A R ~ ~ / [ ~ P (pS/p)0'5 bo fZ ( v - vD)] prov ides a
p r e l i m i n a r y est imate o f t h i s r a t i o . The o ther more a r b i t r a r y term was
selected t o reduce non - l i nea r i t y and s c a t t e r i n t h e 154 se ts o f da ta used
t o est imate t h e constants 2bl and 2b2.
The vapour t rans fe r c o e f f i c i e n t was assumed t o be independent of '
wind speed because: (1 ) i t increases w i t h increases i n both surface
roughness and wind speed and wind speeds tend t o be lower i n rough areas
than i n smooth areas; (2) i t increases w i t h increases i n t h e i n s t a b i l i t y
of t h e atmosphere and t h i s e f f e c t i s more pronounced a t low wind speeds
than a t h igh wind speeds; and (3) t h e use o f c l i m a t o l o g i c a l observat ions
of wind speed can lead t o s i g n i f i c a n t e r r o r because o f l o c a l v a r i a t i o n s
i n exposure and instrument height. These considerat ions i n d i c a t e t h a t
t h e use o f r o u t i n e l y observed wind speeds i n es t imat ing
evapot ransp i ra t ion does n o t s i g n i f i c a n t l y reduce e r r o r and may i n f a c t
increase it. Therefore the re i s ample j u s t i f i c a t i o n f o r assuming t h a t
the q u a n t i t y f Z i s a constant.
The constant fZ was der ived by t r i a l and e r r o r i n conjunct ion
w i t h t h e c a l i b r a t i o n o f constants 2b0 and 2bl t o meet t h e f o l l o w i n g
c r i t e r i o n :

in which the bar denotes an average for the 94 station-months that fell
within the northern hemisphere high radiation season of March to
September inclusive (i.e. 116.3 Wm-') and 1.32 is the constant in the
equation proposed by Priestley and Taylor (1972) that was revised upward
in the discussion of eq. (10) to make it compatible with their land
surface data and incsmpatihle with their water surface data.
The application of the criterion in eq. (14) produced values of
fZ, b and b2 of 28 wm-' mbar-l, 14 wm-' and 1.20 respectively.
Fig. 9 shows the 154 values of dry environment potential evapotranspiration
plotted against corresponding values of (1 + yplnp)-l RTP and the
regression line representing the solution of eq. (1 1) doubled.
It may be noted that the values of fZ are expressed in energy
units. As they are meant to represent a vapour transfer coefficient they
should be increased at below-f reezing temperatures by a factor of 1.15, the
ratio of the latent heat of sublimation to the latent heat of vaporization.
The same data and the same procedure were used in calibrating
eq. (11) to provide estimates of lake evaporation. The only differences
involved the use of water surface albedo and emissivity in estimating
potential and lake evaporation (Morton 1982e) and the selection criterion.

Thus the constant fZ was derived by trial-and-error in conjunction with the
calibration of the constants 2bl and 2b2 in order to minimize the absolute
average percentage error between the annual lake evaporation estimated from
the CRLE model (Morton, 1982e) and the corresponding water budget estimates
for Dauphin Lake in Manitoba, Lake Ontario in the North American Great Lakes
System, Pyramid and Winnemucca Lakes in Nevada, Lake Hefner in Oklahoma,
Silver Lake and Salton Sea in California and Lake Victoria in East Africa
[descriptions and data sources for these and other lakes are appended to a
companion paper (Morton, 1982ej J. The appl ication of this criterion produced -2 .
values of fZ, bl and b2 of 25 ~ m - ~ mbar-I, 13 Wm and 1.12
respectively. A plot comparable to that shown in Fig. 9, with dry environment
potential evaporation replacing dry environment potential evapotranspiration,
shows even less scatter to the points. It should be noted that the value of
the constant bo in eq. (13) is 1.12 for lake evaporation and that this is
the ratio of the vapour transfer coefficient for areal evapotranspiration to
the vapour transfer coefficient for lake evaporation.
CONCLUDING DISCUSSION
The only concepts used in hydrology that have any we1 1-founded
physical basis are the law of conservation of mass, the law of conservation of
energy and approximations to the law of conservation of momentum such as those
represented by the Darcy formula and modifications of the Chezy formula.
Practically all others are based on assumptions that contravene published and
verified field evidence. Even that cornerstone of modern river hydrology, the
unit hydrograph, is based on the assumption of linearity - an assumption that has been known as a questionable approximation, at best, for about two
decades. In comparison, the complementary relationship between areal and
potential evapotranspiration has a realistic physical basis. It is known that
a reduction in the water available for areal evapotranspiration makes the
overpassing air hotter and drier and it is known that hotter and drier air
increases the potential evapotranspiration so there is no doubt that the
relationship is negative. While there is no "proof" that the negative
reactions are complementary, the analysis of dish, pan and plot data presented
in a preceding section provides good evidence that the complementary
relationship is a reasonable working hypothesis. Furthermore the relationship
remains compatible with all current theoretical knowledge and reliable
empirical evidence, despite strong scepticism in the hydrometeorological
community since it was first pub1 ished by Bouchet (1963). ~ e ~ r e w (1979)
presented evidence that purported to cast doubt on the complementary
relationship but on closer examination (Morton, 1980) this turned out to be
simulated data based on inadequate assumptions and selected fragmentary field
data interpreted in a questionable way. Therefore, the complementary
relationship remains one of the better substantiated concepts in
hydrometeorology and its demonstrated ability to provide reliable independent
estimates of areal evapotranspiration from readily available data over an
extremely wide range of environments makes it possible at last to analyze
river basin water balances and thereby obtain much of the knowledge needed to
transform hydrology from a descriptive to a predictive science.

According to the complementary relationship the areal
evapotranspiration, a product of complex processes and interactions in the
soil-plant-atmosphere continuum, is equal to twice the wet environment areal
evapotranspiration less the potential evapotranspiration and both of these
quantities may be estimatea from routine climatological observations. As
described in the preceding sections, the potential evapotranspiration is
estimated from a quickly converging solution of the vapour transfer and energy
balance equations and the wet environment areal evapotranspiration is
estimated from an equation that was calibrated, in conjunction with the vapour
transfer coefficient used in estimating potential evapotranspiration, using
monthly climatological data from arid areas under conditions where the monthly
areal evapotranspiration could be assumed equal to monthly precipitation. To
be useful these basic concepts must be associated with a number of assumptions
and poorly defined empiricisms, most of which are required to provide
radiation estimates from routinely observed data. The latest version of the
resultant complementary re1 ationship areal evapotranspiration (CRAE) model is
presented in detai 1 in the next companion paper (Morton, 1982~). The minor
changes needed to change this to a complementary relationship 1 ake evaporation
(CRLE) model are described in a subsequent companion paper (Morton, 1982e).
Although most of the associated empiricisms were selected from the
1 iterature or were developed independently from pub1 ished data it was
necessary to use a certain amount of jugement in the selection process and in
making minor adjustments to obtain greater generality (e.g. in using
atmospheric pressure to estimate atmospheric radiation). As these empiricisms

were used in the once-only calibration of the vapour pressure coefficient and
the wet environment areal evapotranspiration, the effects of the selection
process and the minor adjustments are implicit in the models. Fortunately,
the models are falsifiable, with no need for locally optimized coefficients,
SO that many of the errors in the associated assumptions and empiricisms have
been detected and corrected during the years by progressive testing over an
ever-widening range of environments. This methodology has required that a
correction made to obtain agreement between model and river basin water budget
estimates in one environment must be applicable without modification in all
other environments. Later companion papers (Morton, 1982d, 1982e) test the
latest version of the CRAE models with comparable water budget estimates of
areal evapotranspiration for 143 river basins in North America, Africa,
Ireland, Australia and New Zealand and test the latest version of the CRLE
models with comparable water budget estimates of lake evaporation for 1 1 lakes
in horth America and Africa.
APPEND1 X
A CONCEPTUAL BASIS FOR THE COMPLEMENTARY RELATIONSHIP
Schematic Model of the Lower Atmosphere
The structure of the atmosphere surface layer is shown in Fig. 10
(Geiger, 1966). The figure is based on the work of K. Brock who summarized
all available observations made to 1938 in Central Europe and Egypt in the
lowest 100 m of the atmosphere. The logarithms of the hourly mean temperature

lapse r a t e s a t midday f o r t h e months o f June and December are p l o t t e d aga ins t
t h e logar i thms of t h e height . Fig. 10 shows t h a t t h e lower atmosphere can be
d i v ided i n t o a lower par t , where t h e temperature lapse r a t e decreases w i t h
he igh t due t o t h e changeover f rom fo rced f r i c t i o n a l convect ion near t h e ground
t o f r e e buoyant convect ion h igher up, and a h igher par t , where t h e
predominance o f f r e e buoyant convect ion keeps t h e lapse r a t e constant a t a
value somewhat lower than t h e d r y ad iaba t i c lapse r a t e (represented by t h e
broken l i n e ) . The former i s r e f e r r e d t o as t h e e q u i l i b r i u m sublayer, wh i l e
t h e l a t t e r i s r e f e r r e d t o as t h e mixed sublayer. The e q u i l i b r i u m sublayer
disappears a t n i g h t w i t h t h e fo rmat ion o f a temperature invers ion. According
t o Geiger (1966) i t appears again i n t h e morning when t h e sun's e l e v a t i o n
reaches about lo0. From then on i t increases i n thickness, and so do t h e
temperature grad ien ts observed i n it. During t h i s pe r iod a subs tan t i a l amount
of t h e heat t rans fer red from t h e ground i s used t o increase t h e th ickness of
t he e q u i l i b r i u m sublayer. When t h e sun reaches an e leva t i on of about 30°, t h e
temperature grad ien t cont inues t o increase, b u t t h e he igh t of t h e e q u i l i b r i u m
sublayer no longer increases, because by t h a t t ime the f ree convect ive motion
has become so <igorous t h a t f u r t h e r supp l ies of heat f rom t h e ground are
t rans fe r red main ly i n t o layers h igher up. The midday th ickness of t h e
e q u i l i b r i u m sublayer can vary f rom a value of about 4 m i n w i n t e r t o values
between 30 and 40 m by the t ime t h e sun changes d i r e c t i o n i n t h e summer.
The th ickness of t h e mixed sublayer can reach values of more than
2000 m al though the average midday value i n summer i s nearer t o 800 m. The
d i u r n a l and seasonal pa t te rns of changes i n th ickness are s i m i l a r t o those of
t he e q u i l i b r i u m sublayer.
Fig. 10 shows on l y two o f many s i m i l a r p lo t s . According t o Geiger
(1966), a frequency d i s t r i b u t i o n of t h e slopes f o r t h e e q u i l i b r i u m sublayer
shows a w e l l marked maximum f o r a value o f -1. This imp l i es t h a t t h e a i r
temperature decreases l oga r i t hm ica l l y w i t h t h e he igh t above t h e ground. The
l oga r i t hm ic r e l a t i o n s h i p does n o t permi t e x t r a p o l a t i o n t o t h e ground surface
b u t i t can be used t o show how changes i n temperature decrease w i t h he igh t as
the equi 1 i b r i um sublayer i s expanding upward against an e s s e n t i a l l y isothermal
mixed sublayer. Thus an increase i n temperature of 2 . 0 0 " ~ a t 0.014 m above
the ground would induce increases o f 0 . 9 9 " ~ a t 1.22 m ( t h e he igh t of a
meteoro log ica l screen) and 0 . 3 1 " ~ a t 25 m. S i m i l a r r e s u l t s could be expected
i f t h e f l u x o f heat from t h e ground heats t h e mixed sublayer w i t h no expansion
i n t h e he igh t of t h e e q u i l i b r i u m sublayer.
The d i s t r i b u t i o n o f humid i ty i n t h e lower atmosphere has n o t
been def ined so r i go rous l y . However t h e r e i s a g reat deal o f evidence i n
Geiger (1966) and elsewhere t h a t t h e daytime v e r t i c a l p r o f i l e s of vapour
pressure o r s p e c i f i c humid i ty a re s i m i l a r t o those of temperature. This
i s because t h e same processes o f f o rced and f r e e convect ion t h a t a re
respons ib le f o r upward t r a n s p o r t o f heat are a l s o responsib le f o r t h e
upward t r a n s p o r t o f water vapour.
I n t h e r a t i o n a l i z a t i o n o f t h e complementary r e l a t i o n s h i p the re
i s on ly one assumption t h a t i s o f s u f f i c i e n t import t o j u s t i f y an
i n t e n s i v e evaluat ion. It requ i res t h a t t h e p o t e n t i a l evapot ransp i ra t ion
be unaffected by advections (ho r i zon ta l t r anspor t s ) o f heat and water

vapour from elsewhere except insofar as they effect the radiant energy
and precipitation at the surface. According to the McIlroy (1971)
version of the Penman (1948) equation this can be achieved if the
advections do not change the wet bulb temperature depression at the
instrument level ; i .e. if the change in humidity changes the wet bulb
temperature by the same amount as the change in dry bulb temperature. In
the case of small-scale advection, such as that shown by Davenport and
Hudson (1967), the effects must be avoided by staying we1 1 down-wind of
sharp environmental discontinuities. In the case of advection associated
with large-scale weather systems, the effects can be assessed only in
terms of the growth and evolution of the mixed sublayer.
Fig. 1 1 is a compositive of three plots published by Milford,
Abdulla and Mansfield (1979) showing the results of temperature and
humidity observations made over southern England on September 12, 1973.
It shows the potential temperature (i.e. the temperature adjusted to the
1000 mbar level using the dry adiabatic lapse rate) plotted against
height for 5 daylight soundings and the humidity mixing ratio plotted
against height for 4 of the same 5 soundings. Fig. 12 is a composite of
two plots presented Deardorff (1974) showing similar profiles for 4
day1 ight soundings during Day 33 of the Australian Wangara Experiment
(Clarke et al. 1971). This is comparable to Fig. 1 1 because the specific
humidity is practically identical to the humidity mixing ratio. Coulman
(1978) has published similar profiles for other Australian data and those
for May 21, 1974 are shown in Fig. 13. The virtual potential

temperatures f o r 0937 hours exceeded the potential temperatures by 1.10'
a t a height of 100 m and 0.80' a t a height of 1400 m. The corresponding
figures f o r 1316 hours are 0.93' and 0.87" respectively.
During the night, when the a i r i n contact with the ground i s
cooled, a nocturnal inversion i s formed. This i s evident in the early
morning potential temperature profiles in Figs. 11, 12 and 13. When the
sun r i ses i n the morning the surface heats up , thereby inducing forced
convection near the ground and f ree convection further up i n the mixed
sublayer. The mixed sublayer, where both the potential temperature and
specific humidity are nearly constant, expands upward in response t o
increasing heat fluxes from the surface, i t s height a t any time being the
height a t which the overlying inversion has the same potential
temperature as the mixed sublayer. All three figures have a sharp height
discontinuity between the nocturnal inversion and the regional inversion,
and t h i s causes a sudden expansion in the height of the mixed sublayer - auring the morning. The regional inversion, which i s primarily the
resul t of large-scale weather systems, i s weaker and less stable than the
nocturnal inversion in Fig. 12 and stronger and more stable than the
nocturnal inversion in Figs. 11 and 13. The increase in potential
temperature that resul ts from a given afternoon surface heat flux i s
higher f o r a strong regional inversion than f o r a weak regional
inversion. Heat loss from the mixed sublayer i s primarily by radiation
and has a night-time maximum when the surface i s cooler than the a i r .
Fig. 12 shows the f i r s t step in the formation of the nocturnal inversion
as the surface cools off a t 1800 hours.
Figs. 11, 12 and 13 show t h a t s t rong mix ing tends t o keep t h e
s p e c i f i c humid i ty constant between t h e t o p o f t he e q u i l i b r i u m sublayer
and t h e p o t e n t i a l temperature invers ion. The s p e c i f i c humid i ty decreases
ab rup t l y across the p o t e n t i a l temperature i nve rs ion thereby c rea t i ng t h e
h i g h lapse r a t e needed f o r t h e i n e f f i c i e n t v e r t i c a l t r anspor t of water
vapour f rom the mixed sublayer t o t h e f r e e atmosphere. A1 1 th ree f i gu res
show a somewhat d i f f e r e n t humid i ty p a t t e r n i n t h e morning w i t h an abrupt
d i s c o n t i n u i t y between h igh values a t low l e v e l s and low values a t h i g h
l eve l s . Fig. 13 shows t h a t t h e increase a t low l e v e l s cont inues u n t i l
1140 hours. This i s thought t o be due t o t h e con t i nua t i on of upward
vapour f l u x du r ing per iods when the re i s no upward heat f l u x so t h a t
water vapour i s trapped under t h e noc turna l invers ion. F ig. 13 shows
t h a t t h i s concentrat ion o f water vapour a t lower l e v e l s disperses r a p i d l y
w i t h t h e sudden expansion i n t h e he igh t o f t h e mixed l a y e r f rom t h a t of
t h e noc turna l i nve rs ion t o t h a t of t h e reg iona l invers ion.
From t h e viewpoint o f t h e hydro log is t , t h e mixed sublayer
appears t o a c t as a l a rge r e s e r v o i r t h a t s to res the w ide ly vary ing heat
and vapour f l u x e s f rom the surface and releases them through delayed
r a d i a t i o n and/or i n e f f i c i e n t t ranspor t across a p o t e n t i a l temperature
invers ion. Thus t h e e f f e c t s o f t h e sur face heat and vapour f l u x e s on t h e
temperature and humid i ty a t t h e bottom o f t h e mixed sublayer, i.e. t h e
t o p o f t h e e q u i l i b r i u m sublayer, are very much less than they are near
t h e surface where r o u t i n e observat ions are made. Furthermore t h e mixed
sublayer b u f f e r s the p o t e n t i a l evapot ransp i ra t ion f rom t h e ef fects o f

large-scale weather systems that are manifested primarily through the
strength of the regional inversion. Thus an increase in the strength of
the regional inversion traps both the heat and vapour fluxes at lower
levels so that the effect of the increased temperature on the potential
evapotranspiration is offset to a large extent by the effect of the
increased humidity. Of course it takes some time for the mixed sublayer
to come back into equilibrium with the surface after the passage of a
weather system and during this time the potential evapotranspiration
would be in a perturbed state.
There are three complications to the foregoing schematic model
of the lower atmosphere:
( 1 ) During periods of negative net radiation, potential temperature and
specific humidity inversions persist down to the surface so that the
potential evapotranspiration may be influenced directly by the
advection of heat and water vapour associated with large-scale
weather systems. However vertical fluxes under inversion conditions
are notoriously inefficient so that the effects can be neglected
unless they persist for long periods of ,time, as in the fall and
winter. Even then they are quite small, so that they can be taken
into account empirical ly.
(2) When the regional inversion is weak or non-existent the mixed
sublayer may expand up to the condensation level with the resultant
formation of cumulus clouds. However, because the vapour used to
form a particular cloud converges from a much larger area, only the
top of the mixed layer is affected (Roll, 1965) so that the direct
effects of cumulus convection on the potential evapotranspiration
are probably negligible.
( 3 ) Convection in the mixed sublayer is sustained by ascending thermals
that penetrate into the nocturnal or regional inversions. The air
that is displaced downward makes the mixed sublayer hotter and
drier. The significance and extent of such effects are the subject
of much controversy, but the prevalence of temperature lapse rates
slightly less than adiabatic (Deardorff, 1972) and specific humidity
lapse rates somewhat greater than zero provide some evidence that
they are confined to the top part of the mixed sublayer. Therefore
even if they are significant in the overall meteorological context
they would have 1 ittle effect on the potential evapotranspiration.
The foregoing complications detract little from the validity of
the simple schematic model of the lower atmosphere that is basic to the
conceptual rationalization of the complementary relationship. In this
model the large-scale weather systems influence potential
evapotranspiration indirectly through their effects on the radiant energy
and the precipitated water received at the surface. However, the direct
effects are negligible because they are manifested by changes in the
stability of the regional inversion and because the changes cause
increases or decreases in the equilibrium sublayer temperature and in the
equilibrium sublayer humidity that tend to be compensatory. Therefore,
the effects of changes in the availability of water for areal
evapotranspiration on the potential evapotranspiration can be assessed by
their effects on the temperature and humidity gradients in the
equilibrium sublayer.
Mathemat ical Rationalization
With adequate moisture supplies to the soi.1 and vegetation
surfaces of an area, the areal evapotranspiration is equal to the
potential evapotranspiration. However when availability of moisture
limits areal evapotranspiration the resultant changes in the fluxes of
heat and water vapour alter the lower atmosphere. Some of the results
are so small that they are assumed to be negligible. These include
changes in atmospheric radiation and in the vapour transfer coefficient.
For the relationship between areal and potential evapotranspiration, the
governing factors are the changes in the temperature and humidity of the
equilibrium sublayer. If it is assumed that equality of eddy
diffusivities for heat and water vapour prevails throughout the
equilibrium sublayer, the changes are reflected in the following heat and
vapour transfer equations.

i n which ET i s t h e a rea l evapotranspi rat ion, TL and TU are abso lu te
a i r temperatures a t a lower and an upper re fe rence l e v e l respec t i ve l y ,
vDL and vDU are dew p o i n t s a t u r a t i o n vapour pressures a t t h e lower
and t h e upper reference l e v e l s respec t i ve l y , fTL and fTU are vapour
t r a n s f e r c o e f f i c i e n t s between t h e sur face and t h e lower reference l e v e l
and between t h e lower reference l e v e l and t h e upper reference l e v e l
respec t ive ly , y i s t he psychrometr ic constant, p i s t h e atmospheric
pressure, E i s t h e sur face e m i s s i v i t y , a i s t h e Stefan-Boltzman constant
and a i s t h e p a r t i a l d i f f e r e n t i a l w i t h respec t t o changes i n t h e supply
of mo is tu re t o t h e evaporat ing sur faces o f t h e area.
The negat ive s ign i n eq. (15) shows t h a t energy i s made
a v a i l a b l e when aET i s negat ive and t h a t energy i s used up when aET i s
p o s i t i v e . The r a t i o on t h e l e f t s i d e of eq. (15) represents t h e
p ropo r t i on of t h i s energy t h a t becomes sens ib le heat thereby changing t h e
hea t con ten t of t h e lower atmosphere. The remainder of t h e energy causes
changes i n t h e n e t long-wave rad ia t i on . Eq. (16) descr ibes changes i n
vapour t r a n s f e r and vapour con ten t o f t h e lower atmosphere desp i te t h e
use o f energy u n i t s .
The lower reference l e v e l i s def ined as t h e he igh t above t h e
sur face a t which t h e average e f f e c t o f sur face temperature changes would
be observed, i.e. t h e he igh t a t which t h e change i n a i r temperatures i s
ha l f t he change i n sur face temperatures. The d iscussion of t he
l o g a r i t h m i c temperature p r o f i l e s i n t h e e q u i l i b r i u m sublayer has

indicated that this occurs at a height that approximates the height of a
meteorological screen. Although the height of the lower reference leve 1
might be subject to minor changes these have little effect since there
would be compensatory changes in the vapour transfer coefficients f TL
and f TU.
The upper reference level should be near enough to the top of
the equilibrium sublayer for the ratios 6TU/6TL and 6vDU/6vDL to
be much lower than one. As they are both of the same sign they can be
assumed equal so that the solution of eqs. (15) and (16) is;
3 in which ATL = yp + ~ E U T IfTL L
The effects of 6vDL and sTL on the potential
evapotranspiration, ETp, are estimated from the heat and vapour
transfer equations for a hypothetical potential evapotranspirimeter at a
representative location in the area, i.e.
In which Tp = potential evapotranspiration equi 1 ibrium temperature,
i .e. the temperature at the surface of a hypothetical potential

evapotranspir imeter, vp = sa tu ra t i on vapour pressure a t Tp and a l l
o the r symbols are as def ined prev iously . Eq. (18) can be abbreviated t o
The s o l u t i o n of eqs. (17), (19) and (20) shows t h a t Tp does
n o t change i n response t o changes i n the a v a i l a b i l i t y of water t o t h e
evaporat ing surfaces of t h e area. With 6vp = 6Tp = 0
The change i n a i r temperature due t o a change i n t h e
a v a i l a b i l i t y of water a t t h e evaporat ing surfaces o f t h e area i s caused
by a change i n t h e temperature o f t h e evaporat ing surfaces. t h e
i n t e r a c t i o n s are obtained f rom t h e sens ib le heat t rans fe r equat ion f o r
the area l surfaces
3 [ Y P ~ ~ ~ / ( Y P ~ ~ ~ + ~ ~ ~ ~ ~ ) ] 6ET = -6[ypfTL(TT-TL)] = -rpfTL(6T T- 6T L ) (22)
i n which TT i s t h e temperature of t h e a rea l surfaces and a l l o t h e r
symbols are as p rev ious l y def ined.
The e q u i l i b r i u m heat content of t h e lower atmosphere i s changed
by the increment o f sens ib le heat t r a n s f e r from the area l surfaces. As
t h e a i r passes over t he p o t e n t i a l evapotransprimeter t h e change i n
atmospheric heat content and the unchanged surface temperature induce an
increment o f sens ib le heat t r a n s f e r t h a t i s opposite i n s ign and probably
equal i n magnitude t o t h e a rea l increment. That i s :
Eq. (23) requ i res t h a t 6TT = 26TL. This i s compatible w i t h
t h e d e f i n i t i o n o f t h e lower reference leve l . As noted p rev ious l y i t i s
a l s o cons i s ten t w i t h a l oga r i t hm ic temperature p r o f i l e and a lower
reference l e v e l near t he he igh t o f a meteorological screen.
The s o l u t i o n of eqs. (22) and (23) i s :
The complementary r e l a t i o n s h i p i s obtained by summing eqs. (21)
and (24) t o ob ta in
Eq. (25), i n i t s f i n a l form, does n o t take i n t o account any data
o r p rope r t i es p e r t a i n i n g t o t h e lower reference leve l . Therefore t h e
exac t he igh t o f t h e lower reference l e v e l o r i t s v a r i a t i o n s i n t ime are
n o t essent ia l t o t h e r a t i o n a l i z a t i o n . It i s poss ib le t h a t some of t h e
o t h e r equations, e.g. eqs. (21) and (24), may even tua l l y prove useful i n
remote sensing app l ica t ions , i n which case t h e data and p r o p e r t i e s
pertaining to the meteor01 ogical screen level should approximate those of
the 1 ower reference 1 eve1 .
The solution for eq. (25) is the complementary relationship as
presented in eq. (1).
REFERENCES
Army, T.J. and B. Ostle, 1957. The association between freewater
evaporation and evapotranspiration of spring wheat under the
prevailing climatic conditions of the plains area of Montana,
Proc. Soil Sci. Soc, Am., 21, pp. 469-472.
Bouchet, R. J., 1963. Evapotranspiration reele et potentiel le,
signification climatique, Internat. Assoc. Sci. Hydrol., Proc.
Berkeley Symposium, Pub1 ication 62, pp. 134-142.
Clarke, R.H., Dyer, A.J., Brook, R.R., Reid, D.G. and A.J. Troup, 1971
The Wangara experiment, Boundary layer data, Tech. Pap. No. 19,
Div. Meteor. Phys., CSIRO, Melbourne, Australia.
Coulman, C.E., 1976. Boundary-layer evolution and nocturnal inversion
dispersal - Part I, Boundary-Layer Meteor., 14(4), pp. 471-492.
Davenport, D.C. and J.P. Hudson, 1967. Changes in evaporation rates
along a 17-km transect in the Sudan Gezira, Agric. Meteor., 4,
pp. 339-352.
Deardorff, J.W., 1972. Theoretical expression for the countegradient
vertical heat f 1 ux, Jour. Geophys. Res., 77(30), pp. 5900-5904.

Deardorff, J.W., 1974. Three-dimensional numerical study of the height
and mean s t ructure of a heated planetary boundary layer,
Boundary-Layer Meteor., 7 (1) , pp. 81-106.
Ferguson, J., 1952. The r a t e of natural evaporation from shallow ponds,
Austr. Jour. Sci. Research, A5, pp. 315-330.
Geiger, R. , 1966. The Climate near the Ground, Harvard University Press.
Giusti , Ennio V., 1978. Hydrogeology of the kars t of Puerto Rico,
Geological Survey Prof. Paper 1012, Washington, 0. C.
Gr i f f i ths , J.F., 1972. Editor of Climates of Africa, World Survey of
Climatology, Vol. 10, Elsevier, New York, pp. 122, 190, 191, 192.
Kohler, M.A., Nordenson, T. J. and W.E. Fox, 1955. Evaporation from pans
and lakes, U.S. Dept. Commer. Weather Bureau Research Paper
No. 38, 21 pp.
Kohl e r , M.A. and L.H. Parmele, 1967. General ized estimates of f ree-water
evaporation, Water Resour. Res., 3 (4 ) , pp. 966-1005.
LeDrew, Ellsworth, F., 1979. A diagnostic examination of a complementary
relat ionship between actual and potential evapotranspiration,
Jour. of Appl. Meteor., 18(4), pp. 495-501.
McIl roy, I. C., 1971. An instrument f o r continuous recording of natural
evaporation, Agric. Meteor., 9, pp. 93-100.
Milford, J.R., Abdulla, S. and D.A. Mansfield, 1979. Eddy f l ux
measurements u s i n g a powered gl ider , Quart. Jour. Roy. Meteor.
SOC., 105, pp. 673-693.
Morton, Fred, I., 1965. Potential evaporation and r i ve r basin
evaporation, Jour. Hydraul. Div . Amer. Soc. Civil Eng., 91
(HY6), pp. 67-97.

Roll, H.U., 1965. Physics of the Marine Atmosphere, Academic Press.
Rowher, C., 1931. Evaporation from free water surfaces, U.S. Dept.
Agr. Tech. Bull. 271, pp. 1-96.
Seguin, B., 1975. Influence de l'evapotranspiration regionale sur la
mesure locale d 'evapotranspiration potentiel le, Agric. Meteor.,
15, pp. 355-370.
Solomon, S., 1967. Relationship between precipitation, evaporation and
runoff in tropical-equatorial regions, Water Resour. Res., 3(1),
pp. 163-172.


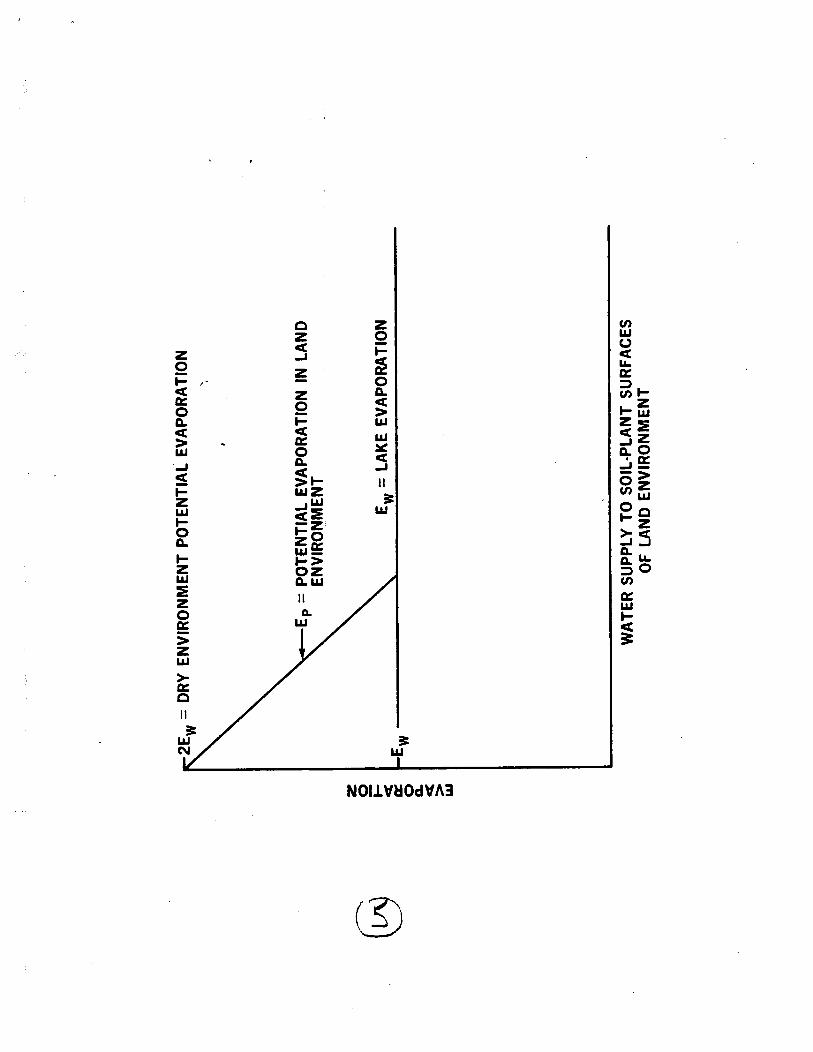

I I 1 I 1 1 1 I I . 0 - . . . -
0 n . - . - . -
-
-
-Q-- * > - d w
-
V) - LEGEND Z
- a ET Ep SUM
LAWEYA o 0 o - TUCHILA 0 B
10 20 -30 40 50 60 70 80 90
PRECIPITATION (hches)
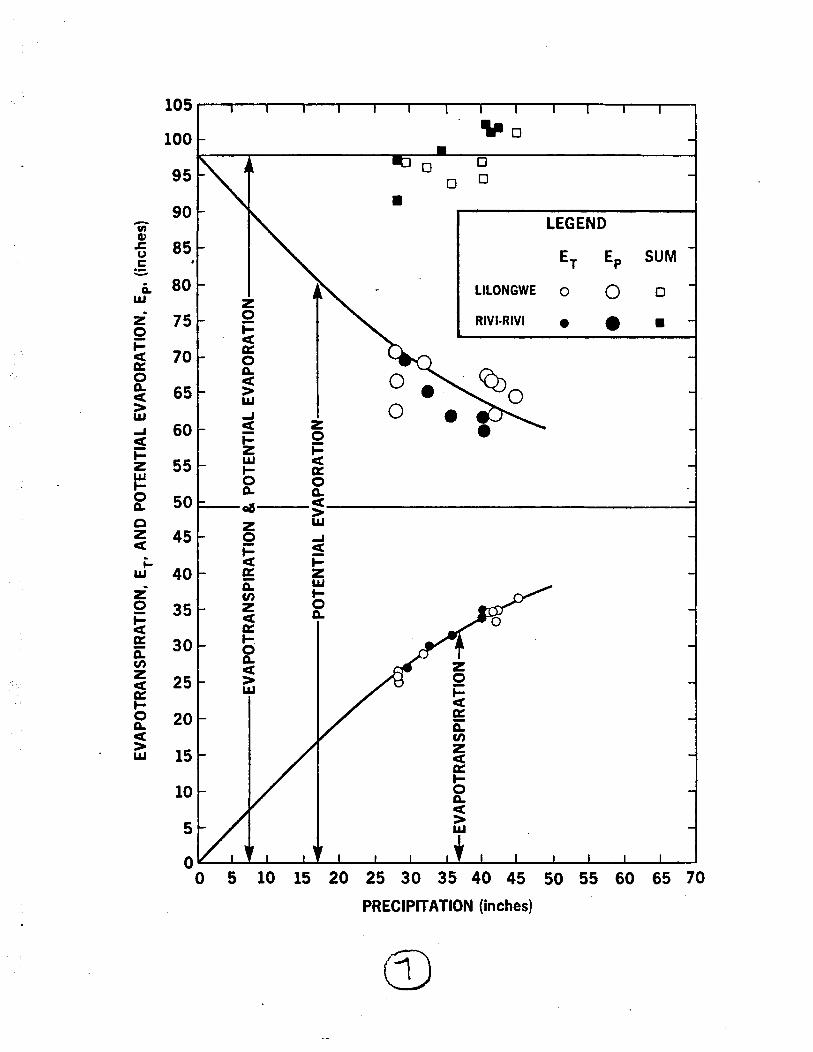
PRECIPITATION (inches)

(uu) NOIlVUOdVA3 NVd QNV NOIlVUldSNVUlOdVA3 7VflNNV
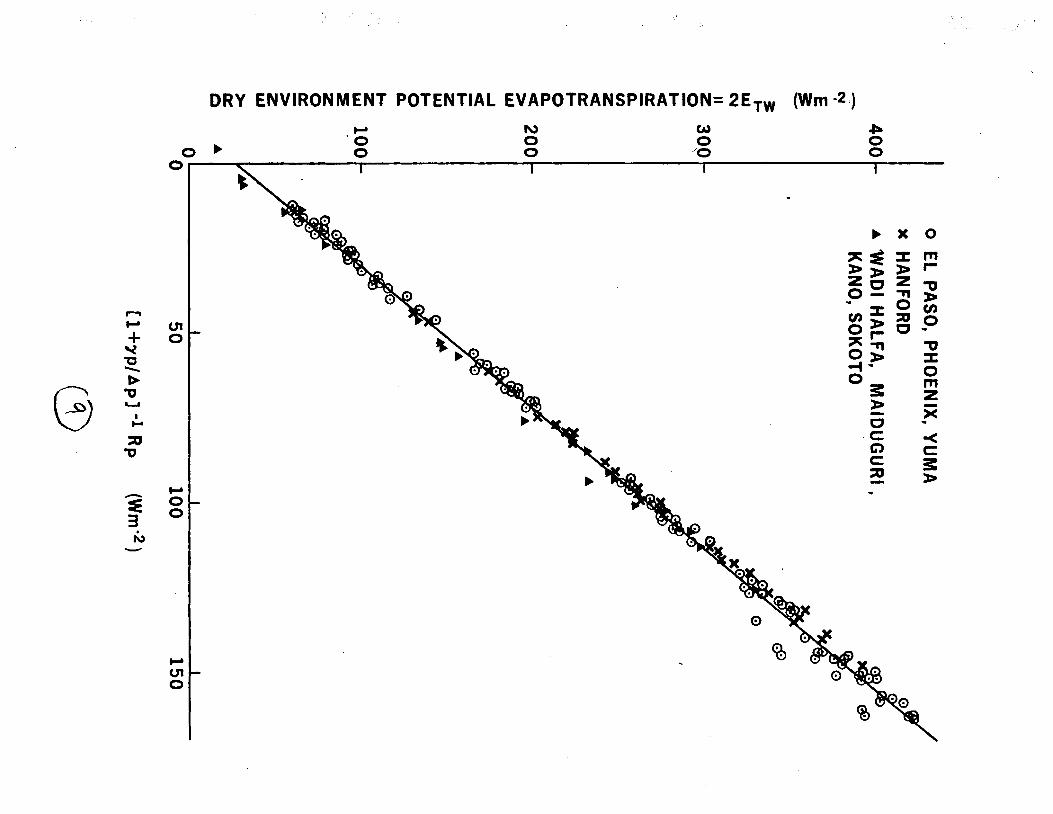
DRY ENVIRONMENT POTENTIAL EVAPOTRANSPIRATION= 2ETw (Wm - 2 )


o o o o o o o o o o o i u 0 0 0 0 0 0 0 0 0 0 g 2 2 2 2 2 a , w a c V

-0933 LST
I "-"""' 1035 LST
VIRTUAL POTENTIAL HUMIDITY MIXING TEMPERATURE (OK) RATIO (g kg-')
OPERATIONAL ESTIMATES OF AREAL EVAPOTRANSPIRATION
AND THEIR S IGNIF ICANCE TO THE SCIENCE AND
PRACTICE OF HYDROLOGY
I11 MODUS OPERAND1
F . I . M o r t o n
N a t i o n a l H y d r o l o g y R e s e a r c h I n s t i t u t e
E n v i r o n m e n t C a n a d a
O t t a w a , C a n a d a K I A OE7

ABSTRACT
Morton, F.I., 1982c. Opera t iona l es t imates of a r e a l
evapo t ransp i r a t i on and t h e i r s i g n i f i c a n c e t o t h e sc ience and
p r a c t i c e of hydro logy: I 1 1 Modus operandi .
The complementary r e l a t i o n s h i p pe rm i t s t h e a r e a l evapo t ransp i r a t i on , a
p roduc t of complex processes and i n t e r a c t i o n s i n t h e s o i l - p l a n t -
atmosphere contiuum, t o be es t imated f r om i t s e f f e c t s on t h e r o u t i n e
c 1 i m a t o l o g i c a l observa t ions needed t o compute t h e p o t e n t i a l
evapo t ransp i r a t i on . The l a t e s t ve r s i on o f t h e complementary r e l a t i o n s h i p
a r e a l e v a p o t r a n s p i r a t i o n (CRAE) models i s fo rmu la ted i n d e t a i l . The
r e q u i r e d s t a t i o n c h a r a c t e r i s t i c s a re t h e l a t i t u d e , t h e a l t i t u d e and a
rough es t ima te of t h e long-term average annual p r e c i p i t a t i o n . The
c l i m a t o l o g i c a l i n p u t s a re month ly va lues o f dew p o i n t temperature, a i r
temperature and sunshine du ra t i on . The m ino r changes needed f o r
humid i t y , temperature and i n s o l a t i o n i n p u t op t i ons and f o r s h o r t e r t i m e
p e r i o d o p t i o n s a r e o u t l i n e d . The r e s u l t a n t modus operandi appears q u i t e
compl icated b u t most o f t h e comp lex i t y i s r e q u i r e d t o es t ima te t h e
r a d i a t i o n components and t o p rov i de a g e n e r a l i t y t h a t pe rm i t s a p p l i c a t i o n
d u r i n g any season o f t h e yea r i n any p a r t o f t h e wor ld. The m ino r
changes r e q u i r e d t o conve r t t h e l a t e s t ve r s i on o f t h e CkAE models t o a
complementary r e l a t i o n s h i p l a k e evapora t ion (CRLE) model, t h e t e s t i n g o f
t h e CRAE and CRLE model es t imates a g a i n s t comparable water budget va lues
and t h e p o t e n t i a l use o f such es t imates t o expand t h e ho r i zons of
hydro logy and t h e range of problems t h a t can be addressed, s t u d i e d and
so lved a re presented i n subsequent companion papers.

R e l i a b l e es t ima tes o f a r e a l e v a p o t r a n s p i r a t i o n a r e e s s e n t i a l t o
s i g n i f i c a n t improvements i n t h e sc ience and p r a c t i c e of hydro logy .
D i r e c t measurements, such as those p r o v i d e d b y l ys imete rs , t h e eddy f l u x
techn ique o r t h e Bowen-ratio techn ique, g i v e p o i n t values, r e q u i r e
c o n s t a n t a t tendance b y s k i l l e d personne l and a r e based on u n v e r i f i e d
assumptions. The wa te r budget method p r o v i d e s good es t ima tes f o r s e v e r a l
y e a r s o r more b u t r e q u i r e excess ive i n s t r u m e n t a t i o n and manpower f o r
s h o r t e r te rm es t ima tes . A companion paper (Morton, 1982a) p r e s e n t s a
c r i t i c a l r e v i e w i n d i c a t i n g t h a t t h e c u r r e n t conceptua l model ing
techn iques, such as t h a t used i n t h e SACREMENTO WATERSHED MODELING
SYSTEM, a r e based on assumptions about t h e s o i 1, t h e v e g e t a t i o n and t h e
atmosphere t h a t a re i n c o m p a t i b l e w i t h p u b l i s h e d evidence; and t h a t causa l
m o d e l l i n g techn iques t h a t t a k e i n t o account t h e complex processes and
i n t e r a c t i o n s i n t h e s o i l - p l ant-atmosphere cont inuum a r e n o t expected t o
have p r a c t i c a l a p p l i c a t i o n s i n t h e n e x t t h r e e decades. The rev iew a l s o
i n d i c a t e s t h a t models based on t h e complementary r e l a t i o n s h i p between
p o t e n t i a l and a c t u a l a r e a l e v a p o t r a n s p i r a t i o n can do much t o f i l l t h e gap
u n t i l such t i m e as t h e causa l models become p r a c t i c a b l e .
The complementary r e l a t i o n s h i p i s rep resen ted by:
ET + E T P = 2 E T W
o r by:
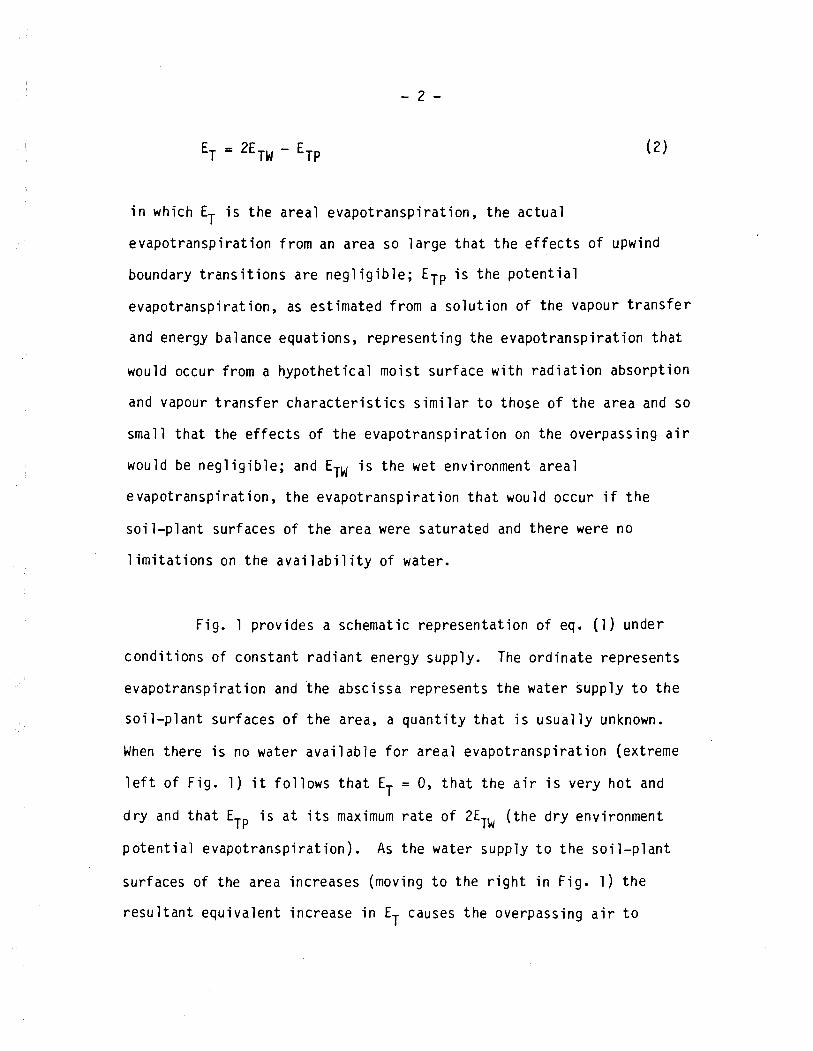
i n which ET i s t h e a r e a l evapo t ransp i r a t i on , t h e a c t u a l
e v a p o t r a n s p i r a t i o n f r o m an area so l a r g e t h a t t h e e f f e c t s of upwind
boundary t r a n s i t i o n s a r e n e g l i g i b l e ; ETp i s t h e p o t e n t i a l
evapo t ransp i ra t ion , as es t imated f r om a s o l u t i o n o f t h e vapour t r a n s f e r
and energy ba lance equat ions, r ep resen t i ng t h e e v a p o t r a n s p i r a t i o n t h a t
would occur f r om a h y p o t h e t i c a l m o i s t su r f ace w i t h r a d i a t i o n abso rp t i on
and vapour t r a n s f e r c h a r a c t e r i s t i c s s i m i l a r t o those of t h e a rea and so
smal l t h a t t h e e f f e c t s o f t h e evapo t ransp i r a t i on on t h e overpass ing a i r
would be n e g l i g i b l e ; and ETN i s t h e wet environment a r e a l
evapo t ransp i r a t i on , t h e e v a p o t r a n s p i r a t i o n t h a t would occur if t h e
s o i l - p l a n t su r faces o f t h e area were sa tu ra ted and t h e r e were no
l i m i t a t i o n s on t h e a v a i l a b i l i t y of water.
F ig . 1 p rov ides a schematic r e p r e s e n t a t i o n o f eq. ( 1 ) under
c o n d i t i o n s of cons tan t r a d i a n t energy supply. The o r d i n a t e r ep resen t s
evapo t ransp i r a t i on and t h e absc issa represen ts t h e wate r supp ly t o t h e
s o i l - p l a n t su r faces of t h e area, a q u a n t i t y t h a t i s u s u a l l y unknown.
When t he re i s no water ava i 1 ab le f o r a r e a l e v a p o t r a n s p i r a t i o n (extreme
l e f t of F i g . 1 ) i t f o l l o w s t h a t ET = 0, t h a t t h e a i r i s ve r y h o t and
d r y and t h a t ETp i s a t i t s maximum r a t e of ZEm ( t h e d r y environment
p o t e n t i a l e v a p o t r a n s p i r a t i o n ) . As t h e wate r supp ly t o t h e s o i 1-p lant
sur faces o f t he area inc reases (moving t o t h e r i g h t i n F i g . 1 ) t h e
r e s u l t a n t e q u i v a l e n t inc rease i n ET causes t h e overpass ing a i r t o

become c o o l e r and more humid which i n t u r n r e s u l t s i n an e q u i v a l e n t
decrease i n ETp. F i n a l l y , when t h e supp ly of wa te r t o t h e s o i l - p l a n t
su r faces of t h e a rea has increased s u f f i c i e n t l y , t h e va lues of ET and
E~~ converge t o t h a t of Em.
The conven t i ona l d e f i n i t i o n f o r p o t e n t i a l e v a p o t r a n s p i r a t i o n i s
t h e same as t h e d e f i n i t i o n f o r t h e wet environment a rea l
evapo t ransp i r a t i on . However t h e p o t e n t i a l e v a p o t r a n s p i r a t i o n t h a t i s
es t imated f rom a s o l u t i o n o f t h e vapour t r a n s f e r and energy ba lance
equat ions b y a n a l y t i c a l (Penman, 1948), g r a p h i c a l (Ferguson, 1952) o r
i t e r a t i v e (Morton, 1982b) techniques, has r e a c t i o n s t o changes i n t h e
water supply t o t h e s o i l - p l a n t su r f aces t h a t a r e s i m i l a r t o those shown
f o r ETp i n F ig . 1 so t h a t what i s be ing es t imated can exceed what i s
b e i n g def ined b y as much as 100 percent . By t a k i n g i n t o account such
r e a c t i o n s t h e complementary r e l a t i o n s h i p i s analogous t o t h e B e r n o u i l l i
equa t ion f o r open channel f l ow i n which t h e p o t e n t i a l energy responds i n
a complementary way t o changes i n k i n e t i c energy.
The p reced ing companion paper (Morton, 1982b) demonstrates t h a t
t h e complementary r e l a t i o n s h i p i s a work ing hypo thes is w i t h good
conceptua l and e m p i r i c a l founda t ions when compared w i t h those of o t h e r
h y d r o l o g i c a l concepts; p resen ts a q u i c k l y converg ing i t e r a t i v e s o l u t i o n
o f t h e vapour t r a n s f e r and energy ba lance equa t ions f o r e s t i m a t i n g
p o t e n t i a l evapo t ransp i r a t i on ; and descr ibes t h e c a l i b r a t i o n o f equa t ions
f o r e s t i m a t i n g t h e vapour t r a n s f e r c o e f f i c i e n t and t h e wet environment

a r e a l e v a p o t r a n s p i r a t i o n u s i n g month ly c l i m a t o l o g i c a l observa t ions f r om
s t a t i o n s i n a r i d environments. Wi th these developments, eq. ( 2 ) becomes
t h e b a s i s f o r a model i n which t h e t h e le f t -hand s ide, a p roduc t of
complex processes and i n t e r a c t i o n s i n t h e so i l -p lant -a tmosphere
continuum, i s es t ima ted f r om i t s e f f e c t on t h e r o u t i n e c l i m a t o l o g i c a l
observa t ions needed t o es t ima te t h e r igh t -hand s ide.
The modus operandi f o r t h e most r e c e n t ve r s i on of t h e
complementary r e l a t i o n s h i p a r e a l evapo t ransp i r a t i on (cRAE) models i s
presented i n d e t a i l i n t h e n e x t sec t i on . It appears q u i t e comp l i ca ted
b u t most o f t h e comp lex i t y i s r e q u i r e d t o es t imate r a d i a t i o n components
and t o p rov i de a g e n e r a l i t y t h a t pe rm i t s a p p l i c a t i o n d u r i n g any season of
t h e yea r i n any p a r t o f t h e wor ld. As i n a l l mode l l i ng exe rc i ses t h e
b a s i c concept i s assoc ia ted w i t h o t h e r assumptions and p o o r l y d e f i n e d
empi r ic isms. However t h e model i s f a l s i f i a b l e , w i t h no need f o r l o c a l l y
op t im ized c o e f f i c i e n t s , so t h a t e r r o r s i n t h e assoc ia ted assumptions and
empi r ic isms have been de tec ted and c o r r e c t e d by p rog ress i ve t e s t i n g o v e r
an ever-widening range of environments as demonstrated i n t h e Appendix t o
t h e f i r s t companion paper (Morton, 1982a). Th i s methodology r e q u i r e s
t h a t a c o r r e c t i o n made t o o b t a i n agreement between model and r i v e r b a s i n
water budget es t imates i n one environment must be a p p l i c a b l e w i t h o u t
m o d i f i c a t i o n i n a l l o t h e r environments. A l though most of t h e assoc ia ted
empi r ic isms were se lec ted f r om t h e l i t e r a t u r e o r were developed
independent ly f r om pub l i shed da ta i t was necessary t o use a c e r t a i n
amount o f judgement i n t h e s e l e c t i o n process and i n making minor

adjustments t o o b t a i n g r e a t e r g e n e r a l i t y (e.g. i n u s i n g atmospher ic
p ressure t o es t ima te atmospheric r a d i a t i o n ) . As these emp i r i c i sms were
used i n t h e once-only c a l i b r a t i o n o f t h e vapour t r a n s f e r c o e f f i c i e n t and
t h e wet environment a r e a l evapo t ransp i r a t i on , t h e e f f ec t s of t h e
s e l e c t i o n process and t h e minor adjustments a re i m p l i c i t i n t h e model.
The procedures s e t o u t i n t h e modus operandi a r e f o r t h e most
c o m o n l y used i n p u t s and outputs . The r e q u i r e d s t a t i o n c h a r a c t e r i s t i c s
a r e t h e l a t i t u d e i n degrees, t h e a l t i t u d e i n metres and a rough es t ima te
o f average p r e c i p i t a t i o n i n m i l 1 imet res pe r year . The r e q u i r e d
c 1 i m a t o l o g i c a l i n p u t s a r e month ly va lues of dewpoint temperature, a i r
temperature and t h e r a t i o o f observed t o maximum p o s s i b l e sunshine
d u r a t i o n w i t h t h e temperatures i n degrees Ce ls ius . The ou tpu t s a-re
month ly va lues o f t h e n e t r a d i a t i o n t h a t would occur i f t h e su r f ace were
a t a i r temperature, t h e p o t e n t i a l evapo t ransp i r a t i on and a r e a l
evapo t ransp i ra t ion , a l l i n m i l l i m e t r e s o f evapora t ion or, i n t h e case o f
n e t r a d i a t i o n , of evapora t ion equ i va l en t . The minor changes t h a t a re
needed f o r humid i t y , temperature and i s o l a t i o n i n p u t o p t i o n s and f o r
s h o r t e r t ime p e r i o d op t i ons a re d iscussed i n d e t a i l t h e r e a f t e r . The
procedure used t o t e s t t h e model and d e t a i l s of i t s p o t e n t i a l
a p p l i c a t i o n s a r e presented i n t h e subsequent companion paper (Morton,
1982d).
I t may be no ted t h a t t h e i n f o rma t i on presented h e r e i n i s of
i n t e r e s t o n l y t o those who w ish t o app l y t h e complementary r e l a t i o n s h i p

models so that those whose main interest is in the theoretical and
practical significance of the complementary relationship can skip to the
next companion paper (Morton, 1982d) with no loss of continuity.
The mathematical symbols are defined where first used and are
summarized in the Appendix.
MODUS OPERAND1
For each station:
(1) Assemble input: + = latitude in degrees (negative in
southern hemisphere); H = altitude above sea level in metres;
PA = average annual precipitation in millimetres.
(2) Compute the ratio of atmospheric pressure at the station to
that at sea level (pip,) with the pressure correction equation for the
standard atmosphere :
(3) Estimate the zenith value of the dry-season, snow-free,
clear-sky a1 bedo (azd) from

i n which t h e abso lu te va lue 1.+/421 i s needed f o r a p p l i c a t i o n i n t h e
southern hemisphere. . Eq. ( 4 ) a t tempts t o t a k e i n t o account t h e e f f e c t s
of changes i n vege ta t i ve cover w i t h a r i d i t y . The te rm i n b racke t s
r o u g h l y r e f l e c t s t h e r e c i p r o c a l o f l a t i t u d i n a l v a r i a t i o n s i n evapora t ing
power. Cons t ra i n t s (4a) and a l l o t h e r c o n s t r a i n t s used h e r e i n f u n c t i o n
as " I F " statements so t h a t if t h e va lue o f azd produced b y eq. ( 4 ) i s
g rea te r than 0.17 i t i s s e t equal t o 0.17 and i f t h e va lue of azd
produced by eq. ( 4 ) i s l e s s than 0.11 i t i s s e t equal t o 0.11. Over t h e
g r e a t e r p a r t of t h e e a r t h sur face azd w i l l be 0.11, whereas i n dese r t s
i t w i l l be 0.17. The na tu re o f t h e t r a n s i t i o n can be seen most c l e a r l y
i n western Texas where t h e es t imated va lues of pd a t E l Paso
(PA = 168 MTI year- '), Mid land (PA = 350 rrm San Angelo
(PA = 437 mn and Ab i lene (PA = 637 mn a re 0.170,
0.166, 0.143 and 0.110 respec t i ve l y . I n t h e t r a n s i t i o n s , t h e es t ima tes
of azd a re s u f f i c i e n t l y s e n s i t i v e t o changes i n average annual
p r e c i p i t a t i o n (PA) t o j u s t i f y an at tempt t o o b t a i n a r e g i o n a l va lue by
averaging t h e s t a t i o n va lue w i t h any o t h e r long-term records i n a 20 km
rad ius . Note t h a t t h e minimum c o n s t r a i n t o f 0.11 i s redundant a t t h i s
s tage of t h e computat ions because i t i s app l i ed l a t e r .

For each month:
(1 ) Assemble input : T = average o f maximum and minimum a i r
temperatures i n degrees Celsius; TD = average-dew p o i n t temperature i n
degrees Celsius; S = r a t i o o f observed t o maximum poss ib le sunshine
durat ion; i = month number beginning w i t h 1 i n January and ending w i t h 12
i n December; and n = number o f days i n t he month.
(2 ) Compute vD, t h e s a t u r a t i o n vapour pressure a t TD i n
mbar; v, t he sa tu ra t i on vapour pressure a t T i n mbar; and A, t he slope of
t he sa tu ra t i on vapour pressure curve a t T i n mbar 'c-l:
vD = 6.11 exp [17.27 TD/(TD + 237.3)]
v = 6.11 exp [aT/(T + B ) ]
i n which a and 0 a re 17.27 and 237.3°~, respect ive ly , when T - > O'C, o r
21.88 and 265.5°~, respect ive ly , when T < O'C.
( 3 ) Compute var ious angles and func t i ons lead ing up t o an
es t imate of t he extra-atmospheric g loba l r a d i a t i o n (GE) :

cosz = cos ($4)
cosz - > 0.001
cosw = l-cosz/(cos~ cose)
cosw > -1 -
cosz = cosZ + [(180/n) sin~/acos(cosw) - 11 cos+ cose
in which e is the declination of the sun in degrees, UI is the number of
degrees the earth rotates between sunrise and noon, Z and z are the noon
and average angular zenith distances of the sun, respectively, and n is
the radius vector of the sun. Constraint (9a) applies during the arctic
and antarctic winters when the sun does not rise, and constraint (10a)
applies during the arctic and antarctic sumers when the sun does not
set. Eqs. (8) and (12) provide monthly average values that must be
considered approximate because the solstices and equinoxes do not occur
at midmonth and because the month lengths are unequal. The largest
absolute error for eq. (8) is 0.48" in February and the average for all
months is 0.13". Alternatives to eqs. (8) and (12) for time periods of a
fraction of a month are presented in the next section.

( 4 ) Estimate the z e n i t h value of snow-free, clear-sky albedo
( a z ) t h e z e n i t h value o f clear-sky albedo (a,) and t h e clear-sky
albedo (ao):
a = a,, + ( 1 - c0)(0.34 2 - azz) 2
Const ra in t (14a) represents an attempt t o decrease the albedo dur ing t h e
wet season of a subar id reg ion where the est imate o f aZd may exceed the
minimum value o f 0.11. Eq. (16) represents an attempt t o increase t h e
albedo dur ing t h e season of snow cover when the vapour pressure d e f i c i t
i s u s u a l l y l ess than a m i l l i b a r . Eq. (17) was suggested by Arnfeld
(1975) and t h e numerical constants are equal t o those der ived from 110
observat ions i n a c o r n f i e l d when the re was l ess than 33 percent c loud
cover.
( 5 ) Est imate p r e c i p i t a b l e water vapour ( W ) i n mm and a
t u r b i d i t y c o e f f i c i e n t (j ) :

j = (0.5 + 2.5 cosLz) exp [cl(plps - I)]
The derivation of eq. (18) has been presented elsewhere
(Morton, 1978). Eq. (20) is based on the Angstrom formula for the
turbidity coefficient as reported by Robinson (1 966). However, the units
are different, the average angular zenith distance (2) has been added to
provide some sort of seasonal variation and the factor c l has been
added to decrease the effects of altitude when the average temperature
exceeds 16'~ and to eliminate them completely when the average
temperature exceeds 21 C.
(6) Compute the transmittancy of clear skies to direct beam
solar radiation (T) from an equation formulated by Brooks (1960) :
T = exp [-0.089(p/pS/cosz)0'75-0.083 (j/cosz)"*90-0.029(~/cosz) 0.603 (21)
(7) Estimate the part of T that is the result of absorption

T = exp [- 0.0415 ( j / cosz ) 0090 - ( o . o o z ~ ) ~ * ~ ( ~ l c o s z ) 0.31 a
T > exp [- 0.0415 ( j / cosz ) - 0.029 (W/cosz) 0.61 a -
Eq. (22) i s be l ieved t o be an improvement t o t h e suggest ion of Brooks
(1960) t h a t ra should be the exponent o f t he r ight-hand te rm i n t h e
argument of eq. (21). The est imate f o r absorpt ion by p r e c i p i t a b l e water
vapour t h a t would r e s u l t f rom eq. (22) i s almost i d e n t i c a l t o t h a t
r e s u l t i n g f rom an equat ion presented by Le t tau and Le t tau (1973). The
c o n s t r a i n t prevents t h e e f f e c t s o f absorpt ion by water vapour from
exceeding t h e e f fec ts o f absorpt ion and sca t te r i ng .
(8) Compute the c l e a r sky g loba l r a d i a t i o n (Go) us ing t h e
equat ion formulated by Brooks (1960); and then est imate t h e i n c i d e n t
g loba l r a d i a t i o n (G):
The r ight-hand term i n eq. (24), which represents t h e g loba l r a d i a t i o n '
t h a t i s t ransmi t ted through clouds, was der ived from zero- intercepts i n
t h e l i n e a r equat ion between the r a t i o o f observed t o extra-atmospheric
g loba l r a d i a t i o n and the r a t i o o f observed t o maximum poss ib le sunshine
du ra t i on t h a t were tabu la ted b y R i e t v e l d (1978). The 27 values f rom
Yugoslavia, Sweden, Portugal and the Nether1 ands were i d e n t i f i e d w i t h

either the sumner or the winter seasons whereas the remaining 25 were for
the entire year. Fig. 2 shows the 27 seasonally identified
zero-intercepts plotted against the appropriate average sunshine duration
ratios. The resultant regression 1 ine, which is shown on Fig. 2 and used
in eq. (24), differs slightly from the one proposed by Rietveld (1978)
because he used the values for the entire year as we1 1.
(9) Estimate the average albedo (a) from
The quantity ( 1 - 21330) in eq. (25) was derived by computing the clear
sky albedo from eq. (17) for the full range of noon angular zenith
distances; estimating the cloudy sky albedo for the same zenith distances
from a similar equation with constants that are somewhat more extreme
than those derived by Arnfeld ( 1 975) from 91 observations in a cornfield
when the cl'oud cover exceeded 67 percent; dividing the cloudy sky values
by the clear sky values and relating the ratios to the angular zenith
distance. The resultant relationship fits the computed data very
closely. Note that the clear sky and cloudy sky values are the same when
the noon sun is at the zenith i.e. at certain times of year within the
tropics.
(10) Estimate the proportional increase in atmospheric
radiation due to clouds ( p ) :
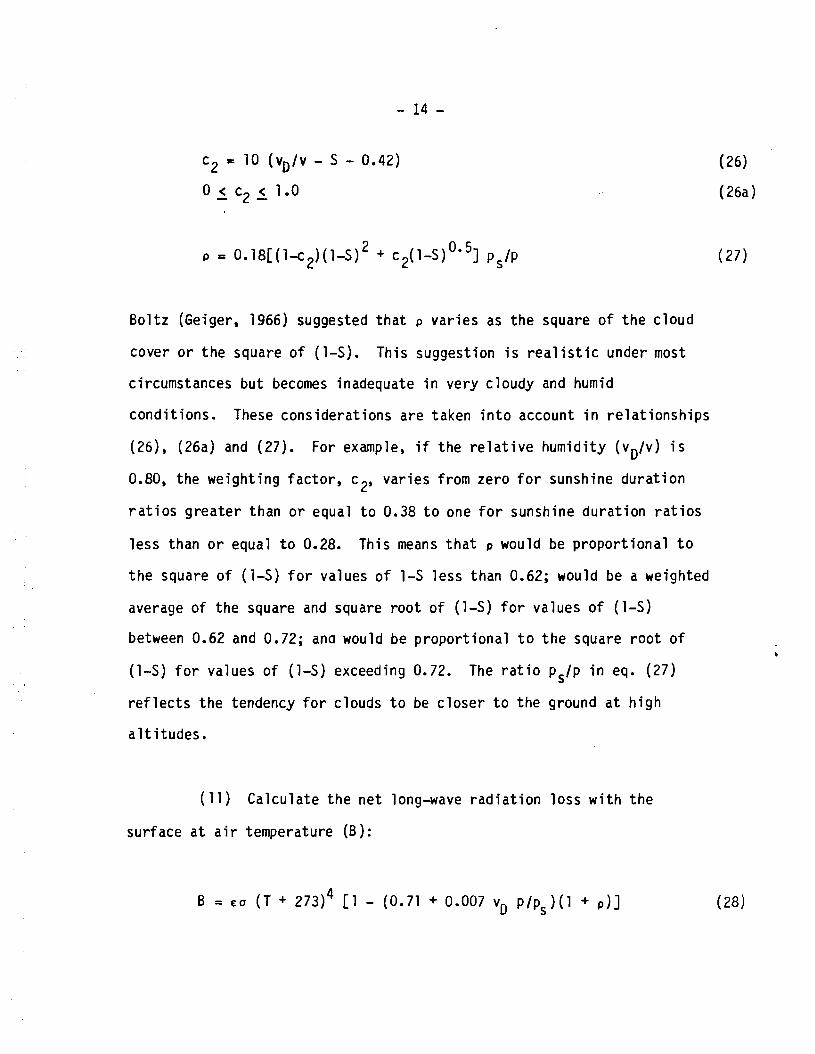
Bol t z (Geiger, 1966) suggested t h a t p va r ies as t h e square of t h e c loud
cover o r t h e square of (1-S). This suggestion i s r e a l i s t i c under most
circumstances b u t becomes inadequate i n very c loudy and humid
cond i t ions . These considerat ions are taken i n t o account i n r e l a t i o n s h i p s
(26), (26a) and (27). For example, i f the r e l a t i v e humid i ty (vD/v) i s
0.80, the weight ing fac to r , c2, va r i es f rom zero f o r sunshine d u r a t i o n
r a t i o s g r e a t e r than o r equal t o 0.38 t o one f o r sunshine du ra t i on r a t i o s
l ess than o r equal t o 0.28. This means t h a t p would be p r o p o r t i o n a l t o
t h e square o f (1-S) f o r values o f 1-S l ess than 0.62; would be a weighted
average o f t he square and square r o o t o f (1-S) f o r values o f (1-S)
between 0.62 and 0.72; ana would be p ropo r t i ona l t o t h e square r o o t of
(1-S) f o r values o f (1-S) exceeding 0.72. The r a t i o p,/p i n eq. (27)
r e f l e c t s t h e tendency f o r clouds t o be c l o s e r t o t he ground a t h i g h
a l t i t u d e s .
(11) Ca lcu la te t h e n e t long-wave r a d i a t i o n l o s s w i t h t h e
sur face a t a i r temperature (B):

i n which E i s t h e e m i s s i v i t y and i s t h e Stefan-Boltzmann constant.
With a land s u r f a c e ~ e m i s s i v i t y o f 0.92, € 0 i s 5.22 x Wm -20 K-4
The r a t i o of c lear-sky atmospheric r a d i a t i o n t o black-body rad ia t i on ,
i.e. (0.71 + 0.007 vD p/ps) has been der ived f rom 15 out of t h e
18 average values f o r Tucson, Ar izona tabu la ted by S e l l e r s (1965). A
p l o t o f t h e data and t h e regress ion equat ion (w i thou t t he atmospheric
pressure adjustment) has been presented elsewhere (Morton, 1978).
Cons t ra in t (28a) comes i n t o e f f e c t o n l y under very hot, humid and c loudy
c o n d i t i o n s such as those t h a t might p reva i 1 i n low a l t i t u d e equa to r i a l
reg ions du r i ng c e r t a i n seasons of the year. Note t h a t t h e e f f e c t s of
atmospheric pressure o r a l t i t u d e i n eqs. (27) and (28) w i l l tend t o
cancel each o the r ou t under c loudy cond i t ions .
(12) Est imate t h e n e t r a d i a t i o n i f the sur face were a t a i r
temperature (RT), the s t a b i l i t y f a c t o r ( c ) , t he vapour t r a n s f e r
c o e f f i c i e n t ( f T ) and t h e heat t r a n s f e r c o e f f i c i e n t ( A ) :

i n which bo = 1.00 f o r t h e CRAE model, p=(yps) (p lps) and f Z and
yP s a re 28.0 ~m- ' rnbar-I and 0.66 mbar 'c-I r e s p e c t i v e l y when
T - > O'C o r 28.0 x 1.15 ~rn- ' mbar-' and 0.6611.15 mbar 'c-I when T <
0°C. The development of eqs. (31) and (32) has been discussed i n t h e
preceding companion paper (Morton, 1982b).
(13) Choose i n i t i a l values of Tp, vp and hP equal t o T, v
and A and est imate the f i n a l values f rom t h e f o l l o w i n g q u i c k l y converging
i t e r a t i v e s o l u t i o n of t h e vapour t r a n s f e r and energy balance equat ions:
v~ = 6.11 exp LaTpl(Tp + a ) ] (36)
sdouglas
Text Box
PG 71 it is 0.28..... This could be an error here All of the previous calculations use 0.28
sdouglas
Text Box
This should be: γp = (γPs)(P/Ps) From Actual paper in journal of Hydrology

Eqs. (34). (35). (36) and (37) a re repeated s e t t i n g Ti, t I
v and dp equal t o t h e values o f Tp, vp and ap der ived P
from the preceding i t e r a t i o n u n t i l 6Tp < 0.01'~. The purpose i s t o -
est imate the p o t e n t i a l evapot ransp i ra t ion equi 1 i b r i um temperature (Tp)
from a s o l u t i o n o f t he vapour t r a n s f e r and energy balance equations f o r a
smal l mo is t surface, The development o f t h e i t e r a t i v e procedure i s
described i n the preceding companion paper (Morton, 1982b).
( 14) Est imate the p o t e n t i a l evapot ransp i ra t ion (ETp), t h e n e t
r a d i a t i o n i f the sur face were a t t he e q u i l i b r i u m temperature (RTp) and
the wet environment a rea l evapot ransp i ra t ion (ETW) :
i n which the constants bl and b 2 are 14 ~ m - ~ and 1.20 r e s p e c t i v e l y
f o r the CRAE model, They have been determined f rom t h e c a l i b r a t i o n
procedure described i n the preceeding companion paper (Morton, 1982b).
Const ra in ts (40a) prevent t he a rea l evapot ransp i ra t ion f rom being
negat ive i n a r i d environments and from exceeding the p o t e n t i a l
evapot ransp i ra t ion i n humid environments. Eqs. (38) and (39) a re j u s t
two d i f f e r e n t forms of the energy balance equation.
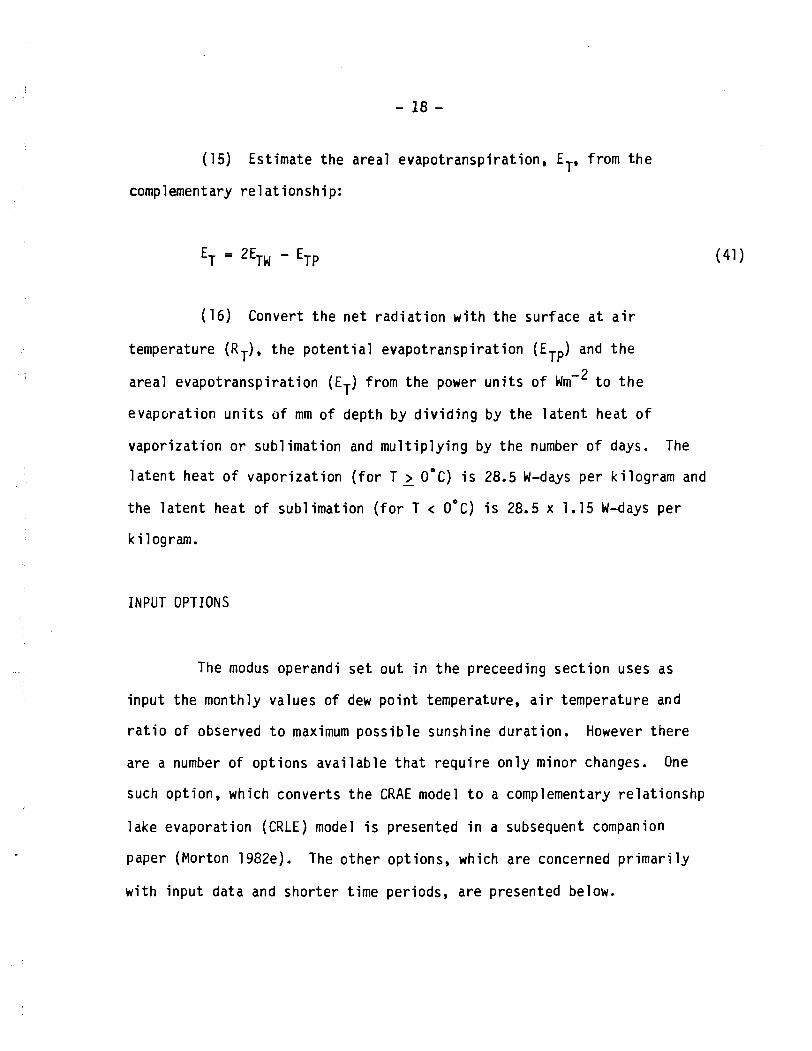
(15) Est imate t h e areal evapotranspi rat ion. ET, from t h e
complementary r e 1 a t ionship:
(16) Convert t h e n e t r a d i a t i o n w i t h t h e sur face a t a i r
temperature (RT), t h e p o t e n t i a l evapot ransp i ra t ion (ETp) and t h e
area l evapot ransp i ra t ion (ET) f rom t h e power u n i t s o f ~ m - ' t o t h e
evapora t ion u n i t s o f mm o f depth by d i v i d i n g by t h e l a t e n t heat o f
vapor iza t ion o r sub l imat ion and m u l t i p l y i n g by t h e number of days. The
l a t e n t heat of vapo r i za t i on ( f o r T - > O'C) i s 28.5 W-days per k i l og ram and
the l a t e n t heat o f sub1 imat ion ( f o r T < O'C) i s 28.5 x 1.15 W-days pe r
ki logram.
INPUT OPTIONS
The modus operandi s e t ou t i n t h e preceeding s e c t i o n uses as
i npu t t he monthly values o f dew p o i n t temperature, a i r temperature and
r a t i o of observed t o maximum poss ib le sunshine dura t ion . However there
are a number o f op t i ons a v a i l a b l e t h a t r e q u i r e o n l y minor changes. One
such opt ion, which conver ts t h e CRAE model t o a complementary re la t i onshp
lake evaporat ion (CRLE) model i s presented i n a subsequent companion
paper (Morton 1982e). The o t h e r opt ions, which are concerned p r i m a r i l y
w i t h i npu t data and sho r te r t ime periods, are presented below.

A1 t i tude Inpu t Opt ion
If t h e average atmospheric pressure (p ) i s known i t can be
d i v ided by the average sea l e v e l value (pS) o f 1013 mb thereby
render ing eq. (3 ) superfluous.
Humidity I n p u t Options
- rhe humid i t y i n p u t i s normal ly t h e average dew p o i n t temperature
and t h i s i s used t o est imate the average vapour pressure from eq. (5).
The r e l a t i o n s h i p i s non l inear so t h e r e s u l t i s somewhat l e s s than t h e
average o f t h e vapour pressures t h a t were used t o est imate t h e i n d i v i d u a l
values of dew po in t . The d i f f e r e n c e can be s i g n i f i c a n t when t h e averages
inc lude the e f f e c t s o f f requent weather changes. However t h e models have
been c a l i b r a t e d and tes ted w i t h dew p o i n t temperature i npu ts desp i te t h i s
inconsis tency because; (1 ) dew p o i n t s are pub1 ished more f requen t l y than
vapour pressures; and (2) t h e r e s u l t a n t vapour pressures a re compatible
w i t h the s a t u r a t i o n vapour pressures est imated from eq. (6 ) us ing average
a i r temperatures. Theref ore t h e use of average vapour pressure i npu ts
requi res a r e l a t i v e l y small co r rec t i on f a c t o r t h a t may be est imated from:
i n which (6vl) v2/vl - > 0.5 ( 6 ~ 2 ) and (6vl) v2 /v1 1.5 (6v2).

I n eq. (42) 6vD i s t h e c o r r e c t i o n t o be subt rac ted f rom the
average vapour pressure input, vo i s t h e s a t u r a t i o n vapour pressure a t
O'C (6.11 mbar), vl i s t h e s a t u r a t i o n vapour pressure a t t h e average
maximum a i r temperature, v i s t h e s a t u r a t i o n vapour pressure a t t h e 2 average minimum a i r temperature, 6Vl i s t h e d i f f e r e n c e between t h e
average o f t h e s a t u r a t i o n vapour pressures a t t h e maximum a i r
temperatures and v and 6v2 i s t h e d i f f e r e n c e between t h e average o f 1 ' t h e s a t u r a t i o n vapour pressures a t t h e minimum a i r temperatures and
v2' The equat ion i s d imensional ly consis tent .
The data used i n t h e fo rmu la t i on o f eq. (42) were de r i ved f rom
t h e Monthly Records o f Meteoro logica l Observations i n Canada f o r t h e
months of A p r i l , May, July, August, November and December a t 17 s t a t i o n s
spread over n i n e o f t he ten provinces. They inc luded month ly averages of
vapour pressure, dew p o i n t temperature, maximum a i r temperature and
minimum a i r temperature together w i t h d a i l y values o f t h e l a t t e r two
q u a n t i t i e s . F ig. 3 shows t h e month ly values o f avD t h a t were de r i ved
from eq. (42) p l o t t e d against t h e d i f ferences between t h e recorded
monthly vapour pressure and t h e vapour pressure computed f rom t h e
recorded monthly dew p o i n t temperature. The standard e r r o r of es t imate
f o r t h e 92 p l o t t e d p o i n t s i s 0.108 mbar.
The phys i ca l bas is f o r eq. (42) i s t he dependence o f the dew
p o i n t temperature on t h e minimum temperature and t h e dependence of t h e
minimum temperature on the dew p o i n t temperature i n humid and subhumid
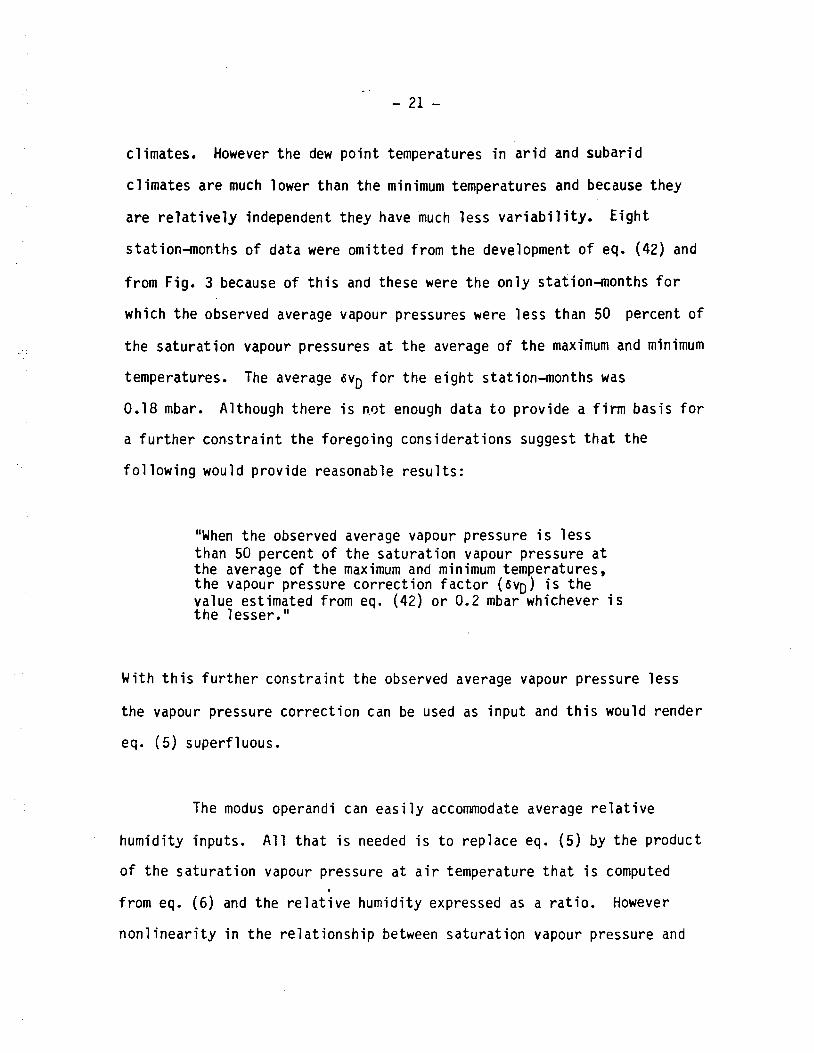
cl imates. However t h e dew p o i n t temperatures i n a r i d and subar id
c l imates a re much lower than the minimum temperatures and because they
are r e l a t i v e l y independent they have much less v a r i a b i l i t y . E i g h t
stat ion-months o f data were omit ted f rom t h e development of eq. (42) and
f rom Fig. 3 because o f t h i s and these were t h e o n l y stat ion-months f o r
which t h e observed average vapour pressures were l ess than 50 percent of
t he sa tu ra t i on vapour pressures a t t h e average o f t h e maximum and minimum
temperatures. The average 6vD f o r t h e e i g h t s tat ion-months was
0.18 mbar. Although the re i s n.ot enough data t o p rov ide a f i r m bas is f o r
a f u r t h e r c o n s t r a i n t t he fo rego ing considerat ions suggest t h a t t he
f o l l o w i n g would prov ide reasonable r e s u l t s :
"When t h e observed average vapour pressure i s l e s s than 50 percent of t h e sa tu ra t i on vapour pressure a t the average o f t h e maximum and minimum temperatures, t h e vapour pressure co r rec t i on f a c t o r ( 6 ~ ~ ) i s t he value est imated f rom eq. (42) o r 0.2 mbar whichever i s t h e lesser."
With t h i s f u r t h e r c o n s t r a i n t t he observed average vapour pressure l ess
the vapour pressure c o r r e c t i o n can be used as i npu t and t h i s would render
eq. ( 5 ) super f 1 uous.
The modus operandi can e a s i l y accommodate average r e l a t i v e
humid i ty inputs. A l l t h a t i s needed i s t o replace eq. ( 5 ) by t h e product
of t h e s a t u r a t i o n vapour pressure a t a i r temperature t h a t i s computed
f rom eq. ( 6 ) and the r e l a t i v e humid i ty expressed as a r a t i o . However
n o n l i n e a r i t y i n t h e r e l a t i o n s h i p between sa tu ra t i on vapour pressure and

temperature ensures t h a t t h e r e s u l t a n t va lue o f atmospheric vapour
pressure (vD) w i 11 be s ign i f i c a n t l y overestimated. The g rea te r p a r t of
t h e e r r o r i s due t o t h e inverse r e l a t i o n s h i p between h o u r l y values of
sa tu ra t i on vapour pressure and h o u r l y values of r e l a t i v e humid i ty t h a t i s
t h e r e s u l t of l a r g e hour-to-hour v a r i a t i o n s i n temperature and smal l
hour-to-hour v a r i a t i o n s i n atmospheric vapour pressures over t h e p e r i o d
o f a day and t h i s i s augmented b y t h e e f fec ts of t h e s i g n i f i c a n t
day-to-day v a r i a t i o n s i n atmospheric vapour pressures t h a t have been
discussed i n t h e preceding paragraphs. I f r e l a t i v e humid i t i es must be
used they should be app l ied t o t h e s a t u r a t i o n vapour pressures fo ' r t h e
temperatures t h a t occur a t t h e same t ime and t h e r e s u l t a n t atmospheric
vapour pressures should be converted t o dew p o i n t temperatures. Even if
t h i s were done o n l y once a day t h e average f o r t h e pe r i od of a week o r
more would p rov ide more s a t i s f a c t o r y r e s u l t s than t h e use of t h e average
values of r e l a t i v e humid i ty and temperature. However i t i s recommended
t h a t t h e observat ions and computations be more f requent - once every s i x
hours seems t o be a good compromise value.
Temperature Input Opt ions
Equat ions f o r conver t ing a i r and dew p o i n t temperatures from
Fahrenhei t ( o r o the r u n i t s ) t o Cels ius u n i t s can be inc luded i n t h e model
before implementing eq. (5).

Insolation Input Options
If global radiation observations are available they can be used
as input instead of the ratio of observed to maximum possible sunshine
duration. This is done by using the observed global radiation (in
~ m - ~ ) to replace the results of eq. (24) and to provide the estimates
of the sunshine duration ratio that are required in further
computations. The conversion to ~ m - ~ requires that cal cm-2 day-'
(langleys per day) be divided by 2.064 and that MJ m-' day-' be
divided by 0.0864. The estimates of the sunshine duration ratio are
estimated from
The formulation of eq. (43) is based on zero-intercepts and slopes for
the 27 linear equations between the ratio of incident to
extra-atmospheric insolation and the ratio of observed to maximum
possible sunshine duration that were tabulated by Reitveld (1978) and
identified with either the sumner or winter seasons. The same data were
used to formulate eq. (24) and prepare Fig. 2. Fig. 4 shows the zero
intercepts plotted against the average value of the ratio of incident to
extra-atmospheric global radiation as computed from the sum of the zero
intercept and the product of the slope and the average sunshine duration

- 24 -
r a t i o . The slope o f t h e l i n e shown i n Fig. 4 i s 0.47 and eq. (43) has
been der ived f rom a s o l u t i o n o f
If n e t r a d i a t i o n observat ions are a v a i l a b l e they can s i m p l i f y
the model s i g n i f i c a n t l y . However they may in t roduce e r r o r because t h e y
depend on sur face temperature whereas t h e n e t r a d i a t i o n used i n t h e model
(RT) i s t h e value t h a t would occur i f the sur face were a t a i r
temperature. The e r r o r cou ld be s i g n i f i c a n t i n a r i d o r subar id
cl imates. The d i f f e r e n c e can be taken i n t o account w i t h a rough es t imate
of t h e surface temperature by us ing t h e s lope o f t h e Stefan-Boltzmann
3 equation, 4au (T + 273) . The s lope has values of 6.0, 5.0 and
1 4.0 ~rn-' 'r a t temperatures o f 3 3 ' ~ , 1 5 ' ~ and - 5 ' ~ respect ive ly .
When the n e t r a d i a t i o n observat ions have been converted t o u n i t s of
~ m - ' and adjusted f o r t h e d i f f e r e n c e between surface and a i r
temperatures they can be used t o est imate R T and thereby e l i m i n a t e t h e
need f o r o ther i n s o l a t i o n estimates, t he s t a t i o n l a t i t u d e input , t h e
s t a t i o n 1 ong-term average annual p r e c i p i t a t i o n input ; and expressions
(4) , (4a) and (8) t o (29) inc lus ive .
Shor te r Time Per iod Options
The CRAE models cannot be used t o p rov ide d a i l y est imates
because o f subsurface heat storage changes and because o f t he l a g t imes

assoc ia ted w i t h t h e change i n s to rage o f hea t and wate r vapour i n t h e
atmospheric boundary l a y e r a f t e r changes i n su r f ace c o n d i t i o n s o r t h e
passage of f r o n t a l systems. There i s every p r o b a b i l i t y t h a t t h e t ime
pe r i ods cou ld be shortened t o f i v e days w i t h o u t problems b u t f o r
i n t e r v a l s of t h r e e days o r l e s s t h e r e s u l t s would always be suspect.
It i s convenient t o r e t a i n t h e month ly s t r u c t u r e when e s t i m a t i n g
a r e a l evapo t ransp i ra t i on f r om p a s t records and t h i s can be done q u i t e
s imply. L e t m equal t h e number o f t ime pe r i ods i n each month such t h a t
t h e f i r s t (m-1) pe r i ods have t h e same number o f days and t h e l a s t p e r i o d
has t h e number o f days r e q u i r e d t o complete t h e month. To avo id l a r g e
abso lu te and percentage v a r i a t i o n s i n t h e leng ths of t h e l a s t per iods , m
should be r e s t r i c t e d t o 2, 3, 5 and 6. If I i s t h e p e r i o d number, w i t h
I = 1 f o r t h e f i r s t p e r i o d i n January and I = 12 m f o r t h e l a s t p e r i o d i n
December, t he f r a c t i o n a l month number, i, t o be used i n eqs. ( 8 ) and (12)
i s
i = [I + 0.5 (m-l)]/m
and t h e cons tan t 23.2' i n eq. ( 8 ) i s changed t o 23.4'.
Fo r r ea l - t ime es t imates o f a r e a l evapo t ransp i ra t i on i t may be
convenient t o use weekly per iods o r some o t h e r t ime p e r i o d t h a t does n o t
f i t i n t o t h e month ly s t r u c t u r e . A1 1 t h a t i s needed i s t h e procedure s e t
ou t above w i t h I equal t o t h e number o f days f rom t h e beg inn ing of t h e

calendar year t o the middle day o f the pe r iod (us ing a February o f
28.5 days) and w i t h m equal t o 29.5 + 11270 o r 30.4, whichever i s
smal ler. As before, t h e constant 23.2' i n eq. (8) i s replaced by 23.4'-
D a i l y values of a rea l evapot ransp i ra t ion may be needed i n some
p o t e n t i a l app l ica t ions , e.g. i n r e a l t ime forecast ing. The e r r o r s
r e s u l t i n g f rom t h e use of The CRAE models w i t h d a i l y i npu ts should no t be
hydo log ica l l y s i g n i f i c a n t unless accumulated f o r many days. Therefore
t h e d a i l y model est imates can be used on a p r o v i s i o n a l bas i s f o r a week
but they should then be corrected p r o p o r t i o n a l l y t o make t h e t o t a l agree
w i t h t h e model est imates der ived from the average weekly inputs.
CONCLUDING DISCUSSION
Presented he re in i s a d e t a i l e d documentation on how t o use the
l a t e s t vers ion of t he CRAE models t o est imate area l evapot ransp i ra t ion
from monthly values of a i r temperature, dewpoint temperature and t h e
r a t i o o f observed t o maximum poss ib le sunshine du ra t i on and on how t o
make t h e adaptat ions needed f o r o the r temperature, humidity, i n s o l a t i o n
o r sho r te r t ime pe r iod opt ions. Documentation on how t o make the
conversion t o a CRLE model t h a t can be used t o es t imate lake evaporat ion
from the same c l i m a t o l o g i c a l i npu ts observed i n t he land environment i s
presented i n a companion paper (Morton, 1982e). The models have a l so
been documented i n FORTRAN and i n RPN f o r the Hewlett-Packard HP-67
hand-held c a l c u l a t o r (Morton, Goard and Piwowar, 1980). A l a t e r RPN

program for the Hewlett-Packard HP-41C hand-held calculator is documented
and can be made available on request. The greater storage capacity of
the HP-41C eliminates the need for using extra program cards during
individual computations and permits the full range of options.
The model presented herein has the following limitations:
It requires accurate humidity data qnd these have depended on
frequent observations by skilled personnel. This is one of the more
serious limitations to the use of the CRAE models at the present
time. However the Humicell, a simple device developed by the
Saskatchewan Research Council, now provides a convenient and
reliable alternative. According to Langham (1969) the instrument
provides integrated vapour pressures within + 2 percent for periods exceeding three days. Other more convenient instrumentation is
under development.
(2) It cannot be used for short time intervals because of subsurface
heat-storage changes and because of the lag times associated with
the change in storage of heat and water vapour in the atmospheric
boundary layer after changes in surface conditions or the passage of
frontal systems. There is every probability that the time periods
could be shortened to five days but for intervals of three days or
less the results would always be suspect. This limitation has
little significance in hydrological applications because it does not

matter much whether the daily evapotranspiration is 3 m or 6 mm as
long as the accumulated values for the week or for a longer period
are reliable. Short time period options are discussed more fully in
the preceding section.
(3) It cannot be used near sharp environmental discontinuities, such as
a high-latitude coast1 ine or the edge of an oasis, because of
advection of heat and water vapour in the lower layers of the
atmosphere. The discussion of the data of Davenport and Hudson
(1967) in some of the companion papers (Morton 1982a, 1982b and
1982d) indicates that the effects of such advections can decrease to
near zero within 300 m but this finding may not be generally
appl icable.
( 4 ) It requires input f rorn a cl imatological station whose surroundings
are representative of the area of interest. Some advantages that
are associated with this and the preceding limitation are presented
in a companion paper (Morton, 1982d).
( 5 ) It cannot be used to predict the effects of natural or man-made
changes since it neither uses nor requires knowledge of the
soil-vegetation system. This is the most serious long-term
limitation to the application of the CRAE models.

It i s emphasized t h a t t h e model presented h e r e i n i s comple te ly
c a l i b r a t e d . Thus i t i s a b l e t o p r o v i d e es t imates of a r e a l
evapo t ransp i ra t i on anywhere i n t h e wor ld w i t h no changes. The o n l y l o c a l
c h a r a c t e r i s t i c s t h a t a r e needed a r e t h e l a t i t u d e , t h e a l t i t u d e and a
rough es t imate o f long-term average annual p r e c i p i t a t i o n . These
c a p a b i l i t i e s a r e t e s t e d i n t h e n e x t companion paper (Morton, 1982d) us ing
water budget es t imates o f a r e a l evapo t ransp i ra t i on f o r 143 r i v e r bas ins
i n N o r t h America, A f r i c a , A u s t r a l i a , I r e l a n d and New Zealand. The
r e s u l t s a re shown i n F ig . 5.
As no ted p r e v i o u s l y t h e CRAE model can be conver ted t o a CRLE
model w i t h a few minor changes. I n e s t i m a t i n g l a k e evapora t ion from
r o u t i n e c l i m a t o l o g i c a l observa t ions i n t h e l and environment, i t has t h e
same c a p a b i l i t i e s , and these a re t e s t e d i n a companion paper us ing water
budget es t imates f o r e leven l akes i n N o r t h America and A f r i ca . The
r e s u l t s f o r t e n o f these l akes a re shown i n F ig . 6.
Probably t h e g r e a t e s t c o n s t r a i n t t o t h e use of t h e CRAE models
i s t he f a i l u r e o f h y d r o l o g i s t s and engineers t o understand how t h e
sc ience and p r a c t i c e o f hydro logy have been s tun ted by t h e l ack of
ope ra t i ona l es t imates of a rea l evapo t ransp i ra t i on and t o v i s u a l i z e how
t h e a v a i l a b i l i t y o f such es t imates can suddenly expand t h e hor i zons of
hydro logy and t he range o f problems t h a t can be addressed, s t u d i e d . and
solved. For t h i s reason a l a r g e p a r t o f t h e nex t companion paper
(Morton, 1972d) i s devoted t o examples which show t h e p o t e n t i a l impact o f
ope ra t i ona l es t imates o f a r e a l evapo t ransp i ra t i on on h y d r o l o g i c a l
research and on water p l ann ing and management.

APPEND1 X
DEFINITION OF SYMBOLS
a = albedo
a = c lear -sky albedo 0
a z = z e n i t h va lue o f c lear -sky albedo
a 22
= z e n i t h va lue o f c lear-sky, snow-free albedo
a z d = z e n i t h va lue o f dry-season, snow-free, c lear -sky albedo
bo, bl and b2 a r e cons tan ts
B = n e t long-wave r a d i a t i o n l o s s w i t h t h e sur face a t a i r
temperature ( ~ m - ~ )
co, c1 and c2 a re cons t ra ined v a r i a b l e s used i n l onge r equat ions
T = a rea l evapo t ransp i ra t i on
E~ P = p o t e n t i a l evapo t ransp i ra t i on ( ~ m - ~ )
E~~ = wet environment a rea l evapo t ransp i ra t i on (WM-')
T = vapour t r a n s f e r c o e f f i c i e n t (WITI-~ mbar- l )
f~
= cons tan t used i n e s t i m a t i n g fT - changes a t be low- f reez ing
temperatures ( ~ m - ~ mbar- l )
G = i n c i d e n t g l o b a l r a d i a t i o n ( ~ m - ~ )
E = extra-atmospheric g l oba l r a d i a t i o n ( ~ m - ~ )
Go = c lear-sky g l o b a l r a d i a t i o n (Wm-')
H = a l t i t u d e (rn)
i = month number
I = p e r i o d number

= t u r b i d i t y coe f f i c i en t
= number of per iods i n month
= number o f days i n pe r iod
= atmospheric pressure (mbar)
= atmospheric pressure a t sea l e v e l (mbar)
= long-term average annual p r e c i p i t a t i o n (nun year- ' )
= n e t r a d i a t i o n w i t h t h e s o i l - p l a n t surfaces a t a i r
temperature (~m-')
= RT w i t h RTC 0 ( ~ m - ~ )
= n e t r a d i a t i o n w i t h the sur face a t t he p o t e n t i a l
evapot ransp i ra t ion e q u i l i b r i u m temperature (~m-')
= r a t i o of observed t o maximum poss ib le sunshine du ra t i on
= average a i r temperature o r average o f maximum and minimum
values ( 'c)
= average dew p o i n t temperature ( 'c)
= p o t e n t i a l evapot ransp i ra t ion equi 1 i b r i um temperature ( 'c)
= t r i a l value o f Tp i n i t e r a t i o n process ( 'c)
= c o r r e c t i o n t o T; i n i t e r a t i o n process (OC)
= s a t u r a t i o n vapour pressure a t T (mbar)
= s a t u r a t i o n vapour pressure a t To (mbar)
= d i f f e r e n c e between average of t h e s a t u r a t i o n vapour
pressures a t t h e dew p o i n t temperatures and vD (mbar)
= sa tu ra t i on vapour pressure a t Tp (mbar)
= t r i a l va lue o f vp i n i t e r a t i o n process (mbar)
= s a t u r a t i o n vapour pressure a t 0°C = 6.11 mbar

= s a t u r a t i o n vapour pressure a t t h e average maximum a i r
temperature (mbar)
= d i f f e r e n c e between t h e average o f t h e s a t u r a t i o n vapour
pressures a t t h e maximum a i r temperatures and vl (mbar)
= s a t u r a t i o n vapour pressure a t t h e average minimum a i r
temperature (mbar)
= d i f f e r e n c e between t h e average o f t h e s a t u r a t i o n vapour
pressures a t t h e minimum a i r temperatures and v2 (mbar)
= p r e c i p i t a b l e water vapour (mm)
= average angular z e n i t h d i s t ance o f sun (degrees)
= noon angular z e n i t h d is tance o f sun (degrees)
= cons tan t used i n e s t i m a t i n g vapour pressures - changes a t
be low- f reez ing temperatures
= cons tan t used i n e s t i m a t i n g vapour pressures - changes a t
be low- f reez ing temperatures ('C)
= psychrometr ic cons tan t - changes a t be low- f reez ing
temperatures ('17' )
1 = s lope o f s a t u r a t i o n vapour pressure curve a t T (mbar O C - )
= s l ope o f s a t u r a t i o n vapour pressure curve a t Tp (mbar ' c - I )
1 = s l ope of s a t u r a t i o n vapour pressure curve a t T i (mbar ' C )
= su r f ace e m i s s i v i t y
= s t a b i l i t y f a c t o r
= r a d i u s v e c t o r o f sun
= d e c l i n a t i o n o f sun (degrees)
= yp + ~ E C J (T+273) 3/f (mbar 'c-')

= 3.141592654
= proport ional increase i n atmospheric r a d i a t i o n due t o clouds
= Stefan-Boltzmann constant
= transmittancy o f c l e a r skies t o d i r e c t beam solar r a d i a t i o n
= the p a r t o f r t h a t i s t h e r e s u l t o f absorption
= 1 a t i tude (degrees)
= angle t h e e a r t h r o t a t e s between sunrise and noon (degrees)

- 34 -
REFERENCES
Arnfeld, A.J., 1975. A n o t e on t h e d i u r n a l , l a t i t u d i n a l and seasonal
v a r i a t i o n o f t h e sur face r e f l e c t i o n c o e f f i c i e n t , Jour. Appl.
Meteor., 14, pp. 1603-1608.
Brooks, F.A., 1960. An I n t r o d u c t i o n t o Phys ica l M i c r o c l imatology,
U n i v e r s i t y of C a l i f o r n i a Press, Davis, C a l i f o r n i a .
Davenport, D.C. and J.P. Hudson, 1967. Changes i n evapora t ion r a t e s
a long a 17-km t r a n s e c t i n t h e Sudan Gezir-a, Agr ic . Meteor., 4,
pp. 339-352.
Ferguson, J., 1952. The r a t e o f n a t u r a l evapora t ion f rom sha l low ponds,
Austr . Jour. Sci . Research, - AS, 315-330.
Geiger, R., 1966. The Cl imate nea r t h e Ground, Harvard U n i v e r s i t y Press.
Langham, E.J., 1969. Discuss ion paper, Proc. Hydro l . Symp. No. 7,
Vol. 11, Environment Canada, Ottawa, p. 18.
Le t tau , H. and K. Let tau, 1973. Short-wave r a d i a t i o n , Cl imate i n Review,
Houghton M i f f l i n , Boston, Mass, pp. 9-21.
Morton, F.I., 1978. Es t ima t i ng evapo t ransp i ra t i on from p o t e n t i a l
evapora t ion : P r a c t i c a b i l i t y of an i c o n o c l a s t i c approach, Jour.
o f Hydrol., 38, pp. 1-32.
Morton, F.I., 1982a. Opera t iona l es t imates o f a rea l evapo t ransp i ra t i on
and t h e i r s i g n i f i c a n c e t o t h e sc ience and p r a c t i c e o f hydro logy:
I The problem, T h i s issue.
Morton, F.I., 1982b. Opera t iona l es t imates of evapora t ion and t h e i r
s i g n i f i c a n c e t o t h e c ience and p r a c t i c e of hydro logy:
I 1 The complementary r e l a t i o n s h i p , T h i s issue.
Morton, F. I., 1982d. Operational estimates of areal evapotranspiration
and their significance to the science and practice of
hydrology: IV Reliability, practicality and potential impact,
This issue.
Morton, F. I., 1982e. Operational estimates of 1 ake evaporation,
This issue.
Morton, F.I., Goard, R. and J. Piwowar, 1980. Programs REVAP and WEVAP
for estimating areal evapotranspiration and 1 ake evaporation
from climatological observations, NHRI Paper No. 12, Inland
Waters Directorate, Environment Canada, Ottawa.
Penman, H.L., 1948. Natural evaporation from open water, bare soil and
grass, Proc. Roy, Soc., Ser. A, 193, pp. 120-145.
Rietveld, R.M., 1978. A new method for estimating the regression
coefficients in the formula relating solar radiation to
sunshine, Agric. Meteor., 19, pp. 243-252.
Robinson, N., 1966. Solar Radiation, Elsevier, Amsterdam.
Sellers, W.D., 1965. Physical Climatology. University of Chicago
Press, Chicago, Ill., p. 57.

TITLES FOR FIGURES
F ig . 1 Schematic r ep resen ta t i on o f complementary r e l a t i o n s h i p between
a rea l and p o t e n t i a l evapo t ransp i ra t i on w i t h cons tan t r a d i a n t
energy supply.
F i g . 2 Re la t i onsh ip between t h e t r ansm i t t ancy o f c loudy s k i e s and t h e
r a t i o o f observed t o maximum p o s s i b l e sunshine d u r a t i o n
(R ie t ve ld , 1978).
F ig . 3 Comparisons o f est imated and observed vapour pressure
c o r r e c t ions.
F ig . 4 R e l a t i o n s h i p between t h e t r ansm i t t ancy o f c loudy s k i e s and t h e
r a t i o of i n c i d e n t t o e x t r a atmospheric g l oba l r a d i a t i o n
(R ie t ve ld , 1978).
F i g . 5 Comparison of model w i t h wate r budget es t imates o f a r e a l
evapo t ransp i ra t i on f o r 143 r i v e r bas ins i n Nor th America,
A f r i c a , I r e l and , A u s t r a l i a and New Zealand.
Fig. 6 Comparison o f model es t imates w i t h water budget es t imates of
evapora t ion from Lake V i c t o r i a [ V ] , Sa l ton Sea [ss], S i l v e r Lake
[S], Lake Hefner [HI, Pyramid Lake [ P I , Winnemucca Lake [W] ,
Lake O n t a r i o [0], L a s t Mountain Lake [L ] and Dauphin Lake [Dl .


RATIO OF OBSERVED TO MAXIMUM POSSIBLE SUNSHINE DURATION (SEASONAL)

DIFFERENCE BETWEEN AVERAGE VAPOUR PRESSURE. AND VAPOUR PRESSURE AT AVERAGE DEWPOINT (mbar)

TRANSMITTANCY OF CLOUDY SKIES TO EXTRA-ATMOSPHERIC GLOBAL RADIATION (SEASONAL)

0 RIVER BASINS I N CANADA /
A R N E R BASINS I N U.S.A.
- 0 RIVER BASINS I N AFRICA
* RIVER BASINS I N IRELAND
- * RIVER BASINS I N AUSTRALIA NEW ZEALAND
-
-
-
-
-
-
-
-
-
-
-
I I I I I I I I I I I 0 100 700 300 400 500 hOO 700 800 "(10 IflOff IIOf1 17110 1100
P R E C I P I T A T I O N L E S S R U N O F F F O R R I V E R B A S I N S rnnr y c a l '

WATER BUDGET ESTIMATE OF LAKE EVAPORATION I N MlLLlMETRES PER YEAR

OPERATIONAL ESTIMATES OF LAKE EVAPORATION
F. I. Morton
N a t i o n a l Hydro logy Research I n s t i t u t e
Environment Canada
Ottawa, Canada KIA 0E7

ABSTRACT
Morton, F.I., 1982e. Operational estimates of lake-evaporation.
The complementary relationship between areal and potential
evapotranspiration takes into account the changes in the temperature and
humidity of the air as it passes from a land environment to a lake
environment. Minor changes convert the latest version of the
complementary relationship areal evapotranspiration (CRAE) models to a
complementary relationship 1 ake evaporation (CRLE) model. The abi 1 ity of
the CRLE model to produce reliable estimates of annual lake evaporation
from monthly values of temperature, humidity and sunshine duration (or
global radiation) observed in the land environment with no locally
optimized coefficients is tested against comparable water budget
estimates for 1 1 lakes in North America and Africa. Maps of annual lake
evaporation and annual net reservoir evaporation (i.e. the difference
between 1 ake evaporation and areal evapotranspiration) for the part of
Canada to the east of the Pacific Divide and for the southern United
States are presented. An approximate routing technique, which takes into
account the effects of depth and salinity on the seasonal pattern of
monthly lake evaporation, is formulated and tested against comparable
water budget estimates for 10 lakes in North America and Africa. The
results indicate that the CRLE model, with its associated routing
technique, is much superior to the other techniques in current use that
rely on climatological or pan observations in the land environment.

INTRODUCTION
Opera t iona l es t imates of 1 ake evapo ra t i on must r e l y on r e a d i l y
a v a i l a b l e i n f o rma t i on and i n p r a c t i c e t h i s means c l i m a t o l o g i c a l da ta o r
pan evapora t ion d a t a t h a t have been observed i n t h e l and environment.
There a re severa l problems assoc ia ted w i t h t h e use o f such observat ions.
The f i r s t i s t h a t seasonal changes i n subsur face hea t s t o rage a r e n o t
r e f l e c t e d d i r e c t l y i n i n pan evapora t ion o r c l i m a t o l o g i c a l da ta and t h a t
such changes a r e s i g n i f i c a n t i n de te rm in i ng seasonal v a r i a t i o n s i n t h e
evapora t ion f r om deep lakes. Th i s problem i s n o t t o o impor tan t because
annual es t ima tes a r e adequate f o r most wa te r p l a n n i n g and management o r
env i ronmenta l impact s tud ies . Furthermore t h e e f f e c t s o f subsur face h e a t
s t o rage changes can be taken i n t o account i n an approximate way w i t h
r o u t i n g techniques. A much more s e r i o u s prob lem i s t h a t pan and
c l i m a t o l o g i c a l observa t ions a r e i n f l u e n c e d s i g n i f i c a n t l y b y changes i n
t h e a v a i l a b i l i t y of water f o r e v a p o t r a n s p i r a t i o n f r om t h e ad jacen t l a n d
and are, the re fo re , n o t r e p r e s e n t a t i v e of t h e environment ove r t h e lake.
R e l i a b l e i n f o r m a t i o n on t h e t r a n s i t i o n t h a t takes p l a c e when t h e
a i r passes f r o m t h e l and over a l a k e i s r a r e i f n o t n o n e x i s t e n t .
However, Davenport and Hudson (1967) have presented da ta on t h e
t r a n s i t i o n f r o m d e s e r t t o i r r i g a t e d c o t t o n t h a t can be used t o show what
happens a t t h e upwind edge o f a lake. They measured t h e v a r i a t i o n i n
evapo ra t i on across a s e r i e s o f i r r i g a t e d and f a l l o w f i e l d s i n t h e Sudan
Gez i ra us i ng f i b e r g l a s s d ishes w i t h b l ack p a i n t e d w e l l s 113 mm i n

diameter and 36 mm i n depth. The passage o f a i r f r om t h e dese r t ( o r from
t h e u n i r r i g a t e d f o l l o w f i e l d s ) over t h e i r r i g a t e d c o t t o n caused t h e d i s h
evaporat ion above t h e c o t t o n t o decrease r a p i d l y i n t h e downwind
d i r e c t i o n and t o approach a low cons tan t va lue w i t h i n 300 m, t h e w id th o f
t h e f i e l d s . Furthermore, as t h e a i r passed f rom i r r i g a t e d c o t t o n across
u n i r r i g a t e d f a l l ow , t h e d i s h evapora t ion above t h e f a l l o w increased
r a p i d l y i n t he downwind d i r e c t i o n and approached b u t d i d n o t reach t h e
va lue observed a t t h e upwind edge o f t h e i r r i g a t i o n area. F ig . 1 shows
t h e v a r i a t i o n o f d i s h evapora t ion across t h r e e i r r i g a t e d f i e l d s on
December 27, 1963. The r a t i o o f d a i l y d i s h evapora t ion a t t h e downwind
edges o f t h e i r r i g a t e d c o t t o n t o t h a t a t t h e upwind edge o f t h e i r r i g a t e d
area was 0.69 f o r t h e f i e l d w i t h "d r y " s o i l , 0.60 f o r t h e f i e l d w i t h
"mois t " s o i l and 0.53 f o r t h e f i e l d w i t h "wet" s o i l .
The decreases i n d i s h evapora t ion across t h e c o t t o n f i e l d s were
assoc ia ted w i t h decreases i n temperature and increases i n humid i ty . The
vapour pressures appeared t o a t t a i n e q u i l i b r i u m va lues w i t h i n t h e 3 0 0 4
w i d t h o f the f i e l d s , bu t t h e temperatures were s t i l l decreasing, p o s s i b l y
because t h e observa t ions were made above t h e l e v e l of t h e c r o p and t h e
dishes.
F i g . 1 shows how t h e d i s h evapora t ion and p o t e n t i a l evapora t ion
inc rease when t h e water a v a i l a b l e f o r evapo t ransp i ra t i on from t h e a rea
upwind decreases and how t h e y decrease when t h e wate r a v a i l a b l e f o r
evapo t ransp i ra t i on f rom t h e area upwind increases. Moreover, t h e d i s h
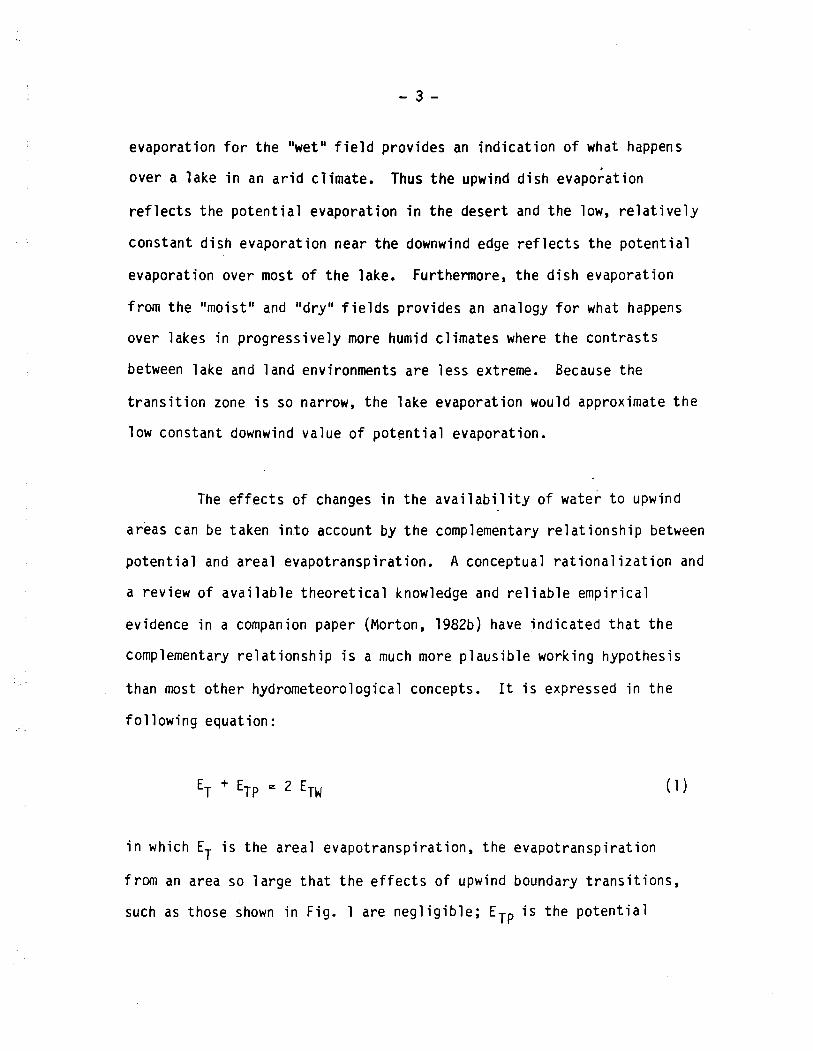
evaporation for the "wet" field provides an indication of what happens
over a lake in an arid climate. Thus the upwind dish evapo;ation
reflects the potential evaporation in the desert and the low, relatively
constant dish evaporation near the downwind edge reflects the potential
evaporation over most of the lake. Furthermore, the dish evaporation
from the "moist1' and "dry" fields provides an analogy for what happens
over lakes in progressively more humid climates where the contrasts
between lake and land environments are less extreme. Because the
transition zone is so narrow, the lake evaporation would approximate the
low constant downwind value of potential evaporation.
The effects of changes in the availabi 1 ity of water to upwind
areas can be taken into account by the complementary relationship between
potential and areal evapotranspiration. A conceptual rationalization and
a review of available theoretical knowledge and reliable empirical
evidence in a companion paper (Morton, 1982b) have indicated that the
complementary relationship is a much more plausible working hypothesis
than most other hydrometeorological concepts. It is expressed in the
following equation:
in which ET is the areal evapotranspiration, the evapotranspiration
from an area so 1 arge that the effects of upwind boundary transitions,
such as those shown in Fig. 1 are negligible; ETp is the potential

evapot ransp i ra t ion , as es t imated from a s o l u t i o n o f t h e vapour t r a n s f e r
and energy balance equat ions, r ep resen t i ng t h e evapo t ransp i ra t i on t h a t
would occur from a h y p o t h e t i c a l m o i s t s u r f ace w i t h r a d i a t i o n absorp t ion
and vapour t r a n s f e r c h a r a c t e r i s t i c s s i m i l a r t o those o f t h e area and so
sma l l t h a t t h e e f f ec t s of t h e evapo t ransp i ra t i on on t h e overpass ing a i r
would be n e g l i g i b l e ; and Em i s t h e wet environment a rea l
evapo t ransp i ra t ion , t h e evapo t ransp i ra t i on t h a t would occur if t h e
s o i l - p l a n t sur faces o f t h e area were sa tu ra ted and t h e r e were no
l i m i t a t i o n s on t h e a v a i l a b i l i t y o f water.
F ig . 2 p rov ides a schematic r ep resen ta t i on of eq. ( 1 ) under
c o n d i t i o n s of cons tan t r a d i a n t energy supply. The o r d i n a t e represen ts
evapo t ransp i ra t i on and t h e absc issa represen ts water supply t o t h e
s o i l - p l a n t surfaces of t h e area, a q u a n t i t y t h a t i s u s u a l l y unknown.
When t h e r e i s no water ava i 1 ab le f o r a r e a l evapo t ransp i ra t i on (extreme
l e f t of F ig . 2) i t f o l l o w s t h a t ET = 0, t h a t t h e a i r i s ve ry h o t and
d r y and t h a t ETp i s a t i t s maximum r a t e o f ZE,,,, ( t h e d r y environment
p o t e n t i a l evapo t ransp i ra t i on ) . As t h e wate r supply t o t h e s o i 1-plant
sur faces of t h e area increases (moving t o t h e r i g h t i n F ig . 2 ) t h e
r e s u l t a n t equ i va len t inc rease i n ET causes t h e overpassing a i r t o
become c o o l e r and more humid which i n t u r n produces an e q u i v a l e n t
decrease i n ETp. F i n a l l y , when t h e supp ly o f wa te r t o t h e s o i l - p l a n t
sur faces of t h e area has increased s u f f i c i e n t l y , t h e values o f ET and
ETP converge t o t h a t o f ETN.

The convent iona l d e f i n i t i o n f o r p o t e n t i a l evapo t ransp i ra t ion i s
t h e same as t h e d e f i n i t i o n f o r t h e wet environment a rea l
evapo t ransp i ra t ion . However t h e p o t e n t i a l evapo t ransp i ra t i on t h a t i s
est imated f rom a s o l u t i o n o f t h e vapour t r a n s f e r and energy balance
equat ions by a n a l y t i c a l (Penman, 1948), g raph i ca l (Ferguson, 1952) o r
i t e r a t i v e (Morton, 1982b) techniques has r e a c t i o n s t o changes i n t h e
water supp ly t o t h e s o i l - p l a n t su r faces s i m i l a r t o those shown f o r ETp
i n Fig. 2, so t h a t what i s be ing est imated can exceed what i s be ing
def ined by as much as 100 percent . By t a k i n g i n t o account such reac t i ons
t h e complementary r e l a t i o n s h i p i s analogous t o t h e B e r n o u i l l i equa t ion
f o r open channel f l o w i n which t h e p o t e n t i a l energy responds i n a
complementary way t o changes i n k i n e t i c energy.
The c h i e f advantage o f t h e complementary r e l a t i o n s h i p i s t h a t i t
permi ts t h e a rea l evapo t ransp i ra t ion , a product o f complex processes and
i n t e r a c t i o n s i n t h e so i l -p lant -a tmosphere continuum, t o be est imated by
i t s e f f e c t s on t h e r o u t i n e c l i m a t o l o g i c a l observat ions t h a t a re used t o
compute p o t e n t i a l evapo t ransp i ra t i on . Because t h e model avoids t h e
comp lex i t i es o f t h e s o i l - p l a n t system i t r e q u i r e s no l o c a l o p t i m i z a t i o n
of c o e f f i c i e n t s and i s , t he re fo re , f a l s i f i a b l e . Th is means t h a t i t can
be t es ted r i g o r o u s l y so t h a t e r r o r s i n t h e assoc ia ted assumptions and
r e l a t i o n s h i p s can be de tec ted and c o r r e c t e d by p rogress ive t e s t i n g over
an ever-widening range of environments. Such a methodology uses t h e
e n t i r e wo r l d as a l a b o r a t o r y and r e q u i r e s t h a t a c o r r e c t i o n made t o
o b t a i n agreement between model and r i v e r bas in water budget es t imates i n

one environment must be app l icab le wi thout mod i f i ca t i on i n a l l o the r
environments. The est imates r e s u l t i n g from the most recent appl i c a t i o n
o f t h i s methodology (Morton, 1982d) agree c l o s e l y w i t h comparable
long-term water budget est imates f o r 143 r i v e r basins i n North America,
A f r i ca , I re land, A u s t r a l i a and New Zealand.
The evaporat ion f rom a shal low lake, EN, d i f f e r s f rom t h e wet
environment a rea l evapotranspi rat ion, ETW, on l y because t h e r a d i a t i o n
absorpt ion and vapour t r a n s f e r c h a r a c t e r i s t i c s o f water d i f f e r f rom those
o f vegetated land surfaces. The p o t e n t i a l evaporation, Ep, d i f f e r s
from the p o t e n t i a l evapotranspi rat ion, ETp, f o r t he same reasons.
Although the lake evaporat ion i s equal t o the p o t e n t i a l evaporat ion i n
t h e lake environment i t can d i f f e r s i g n i f i c a n t l y from t h e p o t e n t i a l
evaporat ion i n t h e land environment.
F ig . 3 prov ides a schematic representat ion o f t he r e l a t i o n s h i p
between shal low lake evaporat ion and the p o t e n t i a l evaporat ion i n t h e
land environment under cond i t i ons o f constant r a d i a n t energy supply. The
ord ina te represents evaporat ion and the abscissa represents t h e water
supply t o the s o i l - p l a n t surfaces o f t he land environment. Since a lake
i s def ined t o be so wide t h a t t h e e f f e c t s o f t he k i n d o f upwind
t r a n s i t i o n shown i n F ig. 1 a re n e g l i g i b l e , t he lake evaporat ion i s
independent o f v a r i a t i o n s i n the water supply t o the s o i l - p l a n t sur faces
of t he land environment. However, t he complementary r e l a t i o n s h i p
p red i c t s t h a t the p o t e n t i a l evaporat ion i n a completely d r y land

environment would be tw ice t h e lake evaporat ion and t h a t i t would
decrease i n response t o increases i n t h e water supply t o t h e so i l -p lan t
surfaces u n t i l i t reached a minimum equal t o t h e lake evaporat ion as
shown i n Fig. 3.
The conventional techniques f o r es t imat ing lake evaporation are
based on t h e assumption t h a t t h e evaporation est imated f rom pan o r
c l ima to log ica l observat ions i n t h e land environment can be transposed t o
a earb by lake by apply ing a simple c o e f f i c i e n t . The apparent lack of
a l t e r n a t i v e s has l e d t o t h e p r a c t i c e o f i gno r ing the increasing body of
evidence t h a t these techniques are unreal i s t i c . Such evidence i s
i m p l i c i t i n a t a b u l a t i o n publ ished b y Hounam (1973) which shows t h a t t h e
annual Class A pan coe f f i c i en t i s 0.81 f o r Lake Okeechobee i n F lor ida ,
where t h e average annual p r e c i p i t a t i o n i s about 1400 mm; 0.70 f o r Lake
Hefner i n Oklahoma, where t h e average annual p r e c i p i t a t i o n i s about 800
mm; and 0.52 f o r t h e Sal ton Sea i n Ca l i f o rn ia , where t h e average annual
p r e c i p i t a t i o n i s about 60 mn. These k i n d o f va r ia t i ons undermine t h e
foundations o f t h e conventional techniques because they i n d i c a t e t h a t
lakes create t h e i r own environments which d i f f e r more and more from t h e
1 and environments as t h e land environments become more a r id . However
they are compatible w i t h the complementary r e l a t i o n s h i p and t h e k i n d of
i n t e r a c t i o n s shown i n Figs. 1 and 3, which p r e d i c t t h a t t h e l ake
evaporation would be equal t o t h e p o t e n t i a l evaporat ion i n a wet land
environment and would be equal t o h a l f t h e p o t e n t i a l evaporat ion i n a d r y
land environment.

The t ransposab i l i t y from one lake t o another of the coe f f i c i en t s
required i n t he app l i ca t ion o f t he conventional techniques w i l l always be
open t o doubt because o f the i n f i n i t e va r i e t y o f land environments and
t he lack of knowledge on now they in f luence t he pan evaporation and the
c l imatological observations. I n t h i s context the complementary
re la t ionsh ip seems an a t t r a c t i v e a l te rna t i ve . I t s use as the basis f o r
the l a t e s t version of what are now re fe r red t o as the CRAE (i.e.
complementary r e l a t i onsh ip areal evapotranspirat ion) models; the
appl i ca t i on o f t h i s l a t e s t version t o provide operat ional estimates o f
areal evapotranspirat ion from rou t i ne observations o f temperature,
humidity and sunshine durat ion ( o r g lobal rad ia t ion ) ; the t e s t o f t he
r e s u l t s against comparable water budget estimates f o r 143 r i v e r basins i n
North America, Af r ica , Ireland, Aus t ra l i a and New Zealand; and examples
of how r e l i a b l e operat ional estimates o f areal evapotranspirat ion can be
a major f a c t o r i n the transformation o f hydrology from a desc r ip t i ve t o a
p red i c t i ve science are described i n companion papers (Morton, 1982a,
1982b, 1982c, 1982d). The transformation o f the l a t e s t version of t he
CRAE models t o the l a t e s t version o f t he CRLE ( i .e. complementary
re1 at ionship lake evaporation) models may be regarded simply as spinof f
because the required changes are so minor. Presented herein are
descr ipt ions o f the required changes; o f the use of the resu l tan t CRLE
model t o provide operat ional estimates of shallow lake evaporation from
the rou t ine observations o f temperature, humidi ty and sunshine durat ion
( o r g lobal r ad i a t i on ) i n the land environment; o f the development of a
rou t ing procedure t o take i n t o account the e f f e c t s o f seasonal subsurface
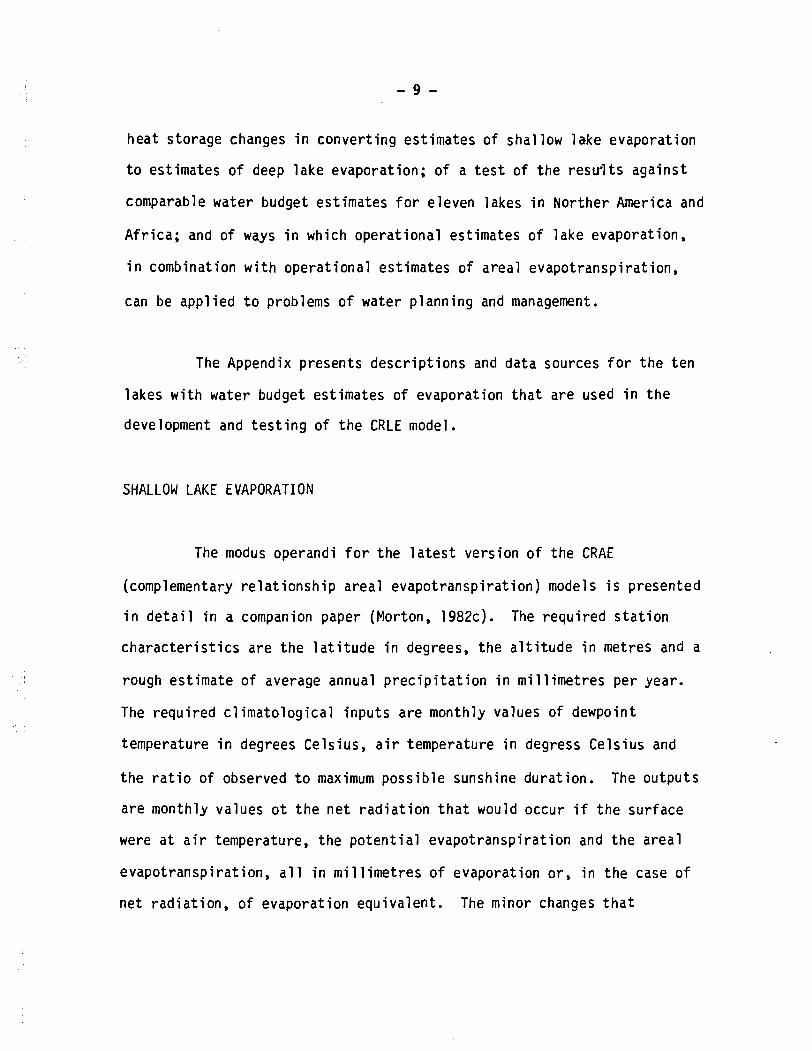
hea t s to rage changes i n conve r t i ng es t imates of sha l low l ake evapora t ion
t o es t imates o f deep l a k e evaporat ion; o f a t e s t o f t h e resu-lts aga ins t
comparable water budget es t imates f o r e leven lakes i n No r the r America and
A f r i c a ; and o f ways i n which ope ra t i ona l est imates o f l a k e evaporat ion,
i n combinat ion w i t h ope ra t i ona l es t imates of a r e a l evapo t ransp i ra t ion ,
can be app l i ed t o problems o f water p l ann ing and management.
The Appendix p resen ts d e s c r i p t i o n s and da ta sources f o r t h e t e n
lakes w i t h water budget es t imates o f evaporat ion t h a t a re used i n t h e
development and t e s t i n g of t h e CRLE model.
SHALLOW LAKE EVAPORATION
The modus operandi f o r t h e l a t e s t ve rs ion o f t h e CRAE
(complementary r e 1 a t i o n s h i p a r e a l evapo t ransp i ra t i on ) models i s presented
i n d e t a i l i n a companion paper (Morton, 1 9 8 2 ~ ) . The r e q u i r e d s t a t i o n
c h a r a c t e r i s t i c s a r e t h e l a t i t u d e i n degrees, t h e a l t i t u d e i n metres and a
rough es t ima te o f average annual p r e c i p i t a t i o n i n m i l l i m e t r e s p e r year.
The r e q u i r e d c l i m a t o l o g i c a l i n p u t s a r e month ly values of dewpoint
temperature i n degrees Cels ius, a i r temperature i n degress Ce l s i us and
t h e r a t i o o f observed t o maximum p o s s i b l e sunshine du ra t i on . The ou tpu t s
a r e month ly va lues o t t h e n e t r a d i a t i o n t h a t would occur i f t h e sur face
were a t a i r temperature, t h e p o t e n t i a l evapo t ransp i ra t i on and t h e a r e a l
evapo t ransp i ra t ion , a l l i n m i l l i m e t r e s o f evaporat ion o r , i n t h e case o f
n e t r a d i a t i o n , o f evapora t ion equ i va len t . The minor changes t h a t

are needed f o r humidity, temperature and i n s o l a t i o n i n p u t op t i ons and f o r
s h o r t e r t ime p e r i o d op t ions are presented i n d e t a i l t he rea f te r . The
mod i f i ca t i ons t o the equations and cons t ra in t s [ o f t h e reference (Morton,
1982c) 1 t h a t a re requ i red t o conver t t h e CRAE model t o a CRLE model are
sunmarized hereunder.
(1 ) The z e n i t h value o f snow-free, c lear-sky albedo (aZz) i n eq. (16)
i s assumed constant a t 0.05. This change permi ts t he d e l e t i o n of
eqs. (4 ) and (14) and t h e i r conbt ra in ts .
(2) The e m i s s i v i t y ( c ) i n eqs. (28) and (33) and i n c o n s t r a i n t (28a) i s
assumed t o be 0.97 so t h a t t h e value o f r o i s 5.5 x wm-'
(3) The value o f t h e constant f Z i n eqs. (31) and (32) i s 25.0 wm-'
mbar-' w i t h T 2 O'C and 25.0 x 1.15 wm-' .bar-' w i t h
T < O'C.
(4 ) The value o f bo i n eq. (31) i s 28/25 o r 1.12.
(5) The values o f bl and b 2 i n eq. (40) a re 13 Wm-' and 1.12
respect ive ly .
( 6 ) Eq. (41) i s deleted.
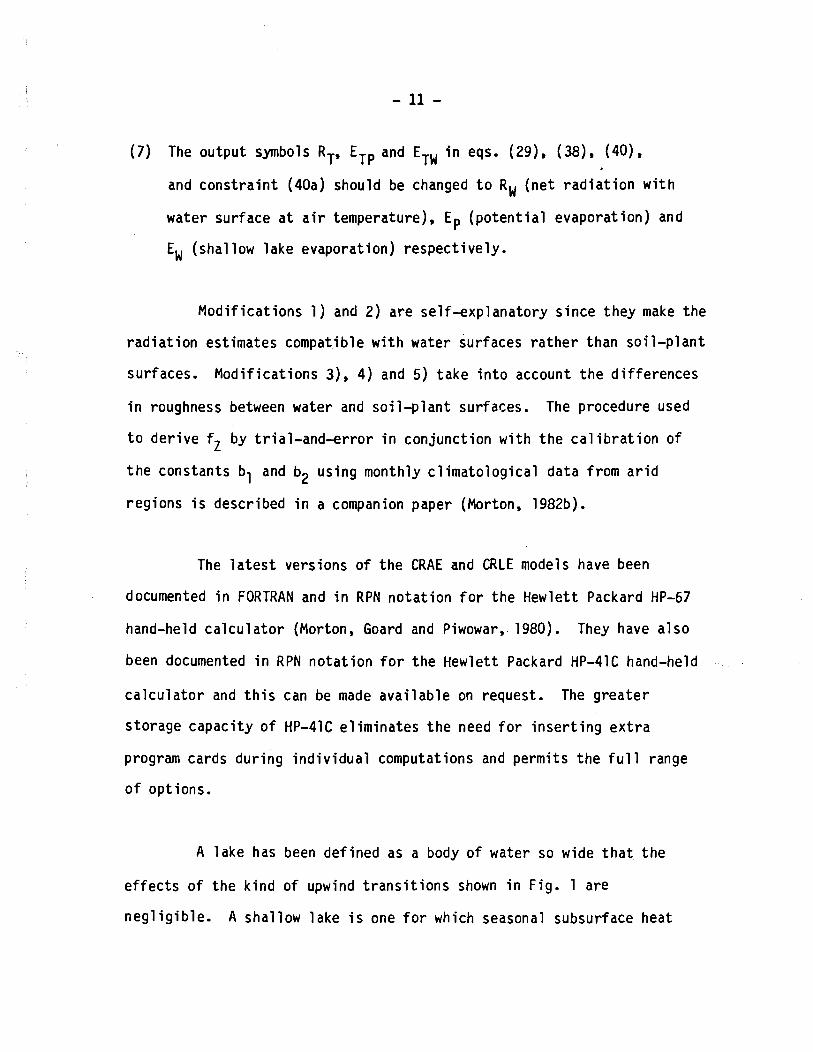
(7) The output symbols RT, ETp and ETW i n eqs. (29). (38). (40).
and c o n s t r a i n t (40a) should be changed t o RW (ne t r a d i a t i o n w i t h
water surface a t a i r temperature), Ep ( p o t e n t i a l evaporat ion) and
EW (shal low lake evaporat ion) respec t i ve l y .
Mod i f i ca t i ons 1 ) and 2) a re se l f - exp lana to ry s ince t h e y make t h e
r a d i a t i o n est imates compatible w i t h water s u r f aces r a t h e r than s o i 1-pl an t
surfaces. M o d i f i c a t i o n s 3), 4) and 5) t ake i n t o account t h e d i f f e r e n c e s
i n roughness between water and s o i l - p l a n t surfaces. The procedure used
t o d e r i v e fZ by t r i a l - a n d - e r r o r i n con junc t ion w i t h t h e c a l i b r a t i o n of
t h e constants bl and b2 us ing monthly c l i m a t o l o g i c a l da ta f rom a r i d
reg ions i s descr ibed i n a companion paper (Morton, 1982b).
The l a t e s t vers ions of t h e CRAE and CRLE models have been
documented i n FORTRAN and i n RPN n o t a t i o n f o r t h e Hewlet t Packard HP-67
hand-held c a l c u l a t o r (Morton, Goard and Piwowar, 1980). They have a l s o
been documented i n RPN n o t a t i o n f o r t h e Hewlet t Packard HP-41C hand-held
c a l c u l a t o r and t h i s can be made a v a i l a b l e on request. The g r e a t e r
s to rage capac i t y of HP-41C e l im ina tes t h e need f o r i n s e r t i n g e x t r a
program cards du r i ng i n d i v i d u a l computations and permi ts t h e f u l l range
of opt ions.
A lake has been de f ined as a body of water so wide t h a t t h e
e f f e c t s o f t h e k i n d o f upwind t r a n s i t i o n s shown i n F ig . 1 are
n e g l i g i b l e . A shal low lake i s one f o r which seasonal subsurface heat
s torage changes a re i n s i g n i f i c a n t . Est imates o f subsurface heat storage
changes can be incorporated i n t o t h e CRLE models by adding t'hem t o t h e
n e t r a d i a t i o n est imates i n eq. (29) o f t h e re levan t companion paper
(Morton, 1982~) . I n p r a c t i c a l terms t h i s i s n o t poss ib le because of t h e
huge amounts of time, money and e f f o r t t h a t a re requ i red f o r t h e
measurement o f temperature p r o f i l e s w i t h adequate s p a t i a l and temporal
reso lu t i on . Seasonal subsurf ace heat s torage changes can be taken i n t o
account i n an approximate way w i t h a r o u t i n g technique t h a t i s described
i n a subsequent sect ion. Furthermore they can be ignored i f t h e per iod
of i n t e r e s t i s one o r more i n t e g r a l years. I n o the r words any lake i s a
shal low lake i f one i s i n t e r e s t e d o n l y i n t h e annual o r mean annual
evaporation.
The l a t e s t vers ion o f t h e CRLE model should prov ide r e l i a b l e
est imates o f shal low lake evaporat ion anywhere i n t h e wor ld f rom records
of temperature, humid i ty and sunshine du ra t i on ( o r g loba l r a d i a t i o n )
observed i n t h e land environment w i t h no need f o r l o c a l l y opt imized
coef f i c ien ts . This c a p a b i l i t y has been tes ted w i t h water budget
est imates of evaporat ion f rom Lake V i c t o r i a i n East A f r i ca , Sal ton Sea
and S i l v e r Lake i n Ca l i f o rn ia , Lake Hefner i n Oklahoma, Pyramid and
Winnemucca Lakes i n Nevada, Utah Lake i n Utah, Lake Ontar io i n t h e Nor th
American Great Lakes System, Last Mountain Lake i n Saskatchewan and
Dauphin Lake i n Manitoba. Descr ip t ions and data sources f o r these lakes
a re presented i n t h e Appendix. The CRLE model was used t o p rov ide
monthly est imates o f shal low lake evaporat ion f o r these ten lakes. To
avoid the problems w i t h seasonal changes i n subsurface heat storage, t h e
monthly model est imates were accumulated t o p rov ide annual o r mean annual
values and p l o t t e d against t h e comparable water budget est imates i n
F ig. 4. The maximum and average absolute dev ia t i ons of the model
est imates from the l i n e o f e q u a l i t y are 100 and 49 mm year- 1
r e s p e c t i v e l y w h i l e t h e maximum and average absolute percentage dev ia t ions
are 5.6 and 3.9 percent respect ive ly .
Pouyaud (1979) has publ ished water budget est imates and the
requ i red c l i m a t o l o g i c a l i npu ts f o r Lac de Bam, a long narrow lake loca ted
a t 1 3 ~ 2 0 ' Nor th and 1°30' West on an i n t e r m i t t e n t t r i b u t a r y of t h e White
Vo l ta R iver i n t h e Republ ic o f Upper Volta. The water budget est imates
of evaporat ion are quest ionable and incomplete because o f d i f f i c u l t i e s i n
es t imat ing seepage out f lows and r a i n y season inf lows. I n f a c t t h e r e was
o n l y one year, t h e year ending on September 30, 1976, w i t h continuous
water budget est imates and t h e requ i red c l i m a t o l o g i c a l data. Based on
monthly temperature, vapour pressure and sunshine du ra t i on da ta observed
a few k i lomet res from the lake, t h e CRLE model est imates of shal low l a k e
evaporat ion f o r t h a t yea r t o t a l 2153 mm, approximately 8 percent l ess
than the comparable water budget est imate of 2346 mn. Furthermore,
g loba l r a d i a t i o n observat ions f o r e i g h t of t h e months and g loba l
r a d i a t i o n est imates f o r the remaining f o u r months (obta ined by a d j u s t i n g
observat ions from t h e same months of o t h e r years i n accordance w i t h
d i f f e rences i n sunshine du ra t i on ) have been used t o rep lace t h e sunshine
du ra t i on observat ions as input . The r e s u l t a n t CRLE model est imates of
sha l low lake evaporat ion t o t a l 2304 mm, approximately 2 percent l ess than
t h e comparable water budget estimate. The est imates f o r Lac de Bam are
n o t inc luded i n Fig. 4 because t h e d i f f e r e n c e between t h e est imates based
on sunshine du ra t i on i npu ts and those based on g loba l r a d i a t i o n inputs i s
t o o 1 arge t o be ignored.
The comparison between model and water budget est imates f o r t e n
lakes i n Fig. 4 and f o r Lac de Bam demonstrates t h a t t h e most recent
vers ion of t h e CRLE models can use r o u t i n e c l i m a t o l o g i c a l observat ions t o
p rov ide r e l i a b l e est imates o f annual lake evaporat ion over a wide range
of environments w i t h no l o c a l l y der ived c o e f f i c i e n t s . However t h e model
r e s u l t s do n o t agree nea r l y so w e l l w i t h pub1 ished energy budget
est imates f o r Lake Mead on t h e Colorado R i v e r and Lake Nasser on the N i l e
River. Thus t h e energy budget est imate f o r Lake Mead du r ing t h e yea r
ending September 30, 1953 (U.S. Geological Survey, 1958) was 2163 mm
whereas t h e comparable model estimate, based on monthly dew p o i n t and a i r
temperature observat ions a t Boulder City and monthly g loba l r a d i a t i o n
observat ions a t Boulder Is land, was o n l y 1680 mn. The two q u a n t i t i e s are
n o t s t r i c t l y comparable because t h e energy budget est imates i nc lude t h e
e f f e c t s o f n e t waterborne heat inputs, an energy term t h a t i s s i g n i f i c a n t
o n l y f o r deep r e s e r v o i r s on l a rge r i v e r s i n h o t cl imates, and releases of
subsurface heat storage, an energy term t h a t i s u s u a l l y i n s i g n i f i c a n t on
an annual basis . However, when these two terms are used i n the CRLE
model by adding them t o the n e t r a d i a t i o n est imates i n eq. (29) of t h e
r e l e v a n t companion paper (Morton, 1982c), t h e est imate i s increased t o

1855 mm which is still almost 15 percent less than energy
budget estimate. This type of discrepancy is even more evident in a
comparison for Lake Nasser where Omar and El-Bakry (1981) have used
monthly average estimates of different meteorological elements over the
lake to produce an energy budget estimate of 2689 mm year-1. This is
much higher than the value of 2087 m that is derived by using
monthly averages of dew point temperature, air temperature and global
radiation recorded near the south end of the lake at Wadi Halfa
(Griff iths, 1972), as input to the CRLE model. By incorporating the
monthly values of net waterborne heat inputs and releases of subsurface
heat storage that have been estimated by Omar and El-Bakry (1981) the
model estimate is increased to 2160 mn year-', which is still almost
20 percent less than the energy budget value.
In evaluating the foregoing results it should be noted that
although the energy budget technique is based on the law of conservation
of energy, it has a number of drawbacks. These are that it relies on the
questionable assumption that the Bowen-ratio provides an adequate
estimate of the ratio of sensible to latent heat fluxes under a1 1 the
peculiar conditions of atmospheric stability that can occur over a lake;
that the extrapolation of the inputs required for the energy budget
technique from a few measurement points to an entire lake can lead to
significant error; and that the energy budget had never been rigorously
tested by applying an identical technique to a number of lakes in
different environments and comparing the results with the applicable

water budget estimates. The nearest approach t o such a t e s t has been
performed i n A u s t r a l i a (Hoy and Stephens, 1979) b u t t h i s was n o t
s a t i s f a c t o r y because t h e lakes were unsu i tab le f o r water budget s tud ies
and i t was assumed t h a t t h e energy budget est imates were super ior . The
word " i d e n t i c a l * has been st ressed because i t i s easy t o ob ta in
s i g n i f i c a n t l y d i f f e r e n t r e s u l t s by seemingly a r b i t r a r y s e l e c t i o n of
techniques. For example, t h e Lake Nasser est imates produced by Omar and
El-Bakry (1981) depend on a technique f o r es t ima t ing n e t long-wave
r a d i a t i o n t h a t does n o t take i n t o account t h e e f f e c t s o f atmospheric
water vapour and they d i f f e r s i g n i f i c a n t l y f rom those t h a t would have
resu l ted from t h e use o f any o f t h e a l t e r n a t e techniques t h a t do take
i n t o account such e f f e c t s .
It i s easy t o recognize t h a t CRLE model est imates o f annual l a k e
evaporat ion would be orders o f magnitude easier, f a s t e r and cheaper than
energy budget estimates. What i s n o t so easy t o accept i s t h a t such
est imates may a l so be more r e a l i s t i c . However, t h e cons idera t ions
o u t l i n e d above i n d i c a t e t h a t such a conclus ion i s n o t o n l y poss ib le b u t
a l so probable.
The t e s t of t h e a rea l evapot ransp i ra t ion model [Morton, 1982d]
requ i red the prepara t ion o f evapot ransp i ra t ion maps f o r t h e p a r t of
Canada t o t h e eas t of t h e P a c i f i c D iv ide and f o r t h e southeastern
Uni ted States. This invo lved punching computer cards w i t h 5 years of

monthly a i r temperatures, dew p o i n t temperatures, and sunshine du ra t i on
r a t i o s f o r 37 c l i m a t o l o g i c a l s t a t i o n s i n t he Un i ted Sta tes and
153 c l i m a t o l o g i c a l s t a t i o n s i n Canada. The a v a i l a b i l i t y of t h e cards
provided the i n c e n t i v e t o prepare s i m i l a r maps f o r l ake evaporat ion and
f o r t h e d i f f e r e n c e between 1 ake evaporat ion and a rea l evapotranspi rat ion.
Fig. 5 i s a map o f t h e southeastern Uni ted Sta tes showing t h e
average annual l a k e evaporat ion f o r t h e 5 years ending September 30,
1965, and Fig. 6 i s a map o f t he p a r t o f Canada t o t h e east o f t h e
P a c i f i c D i v i d e showing t h e average annual l ake evaporat ion f o r t h e 5 y r
ending December 31, 1969. They are based on t h e accumulation o f month ly
CKLE model est imates f o r a l l c l i m a t o l o g i c a l s t a t i o n s i n t h e two areas
t h a t r e p o r t bo th a i r and dew p o i n t temperatures. The i sop le ths were
p l o t t e d by 1 i n e a r i n t e r p o l a t i o n between t h e s ta t i ons . It should be noted
t h a t t h e est imates shown i n t h e two maps do n o t apply t o bodies o f water
so smal l t h a t t h e t ype o f edge e f f e c t shown i n F ig. 1 would be
s i g n i f i c a n t o r t o lakes where the re are l a rge n e t waterborne heat inpu ts .
A comparison o f F ig. 5 w i t h t h e map on P l a t e 18 o f t h e Water
A t l a s o f t h e Un i ted States ( M i l l e r e t al., 1963) and a comparison of
F ig . 6 w i t h t h e map on P l a t e 17 of t h e Hydro log ica l A t l a s of Canada
(Canadian Nat iona l Committee f o r t h e IHD, 1978) i n d i c a t e t h a t t h e model
est imates are g e n e r a l l y h ighe r i n areas w i t h h i g h r e l a t i v e humid i t i es and
lower i n areas w i t h low r e l a t i v e humidi t ies. The reasons f o r these
discrepancies, which can be h i g h l y s i g n i f i c a n t , are t h a t a l l f o u r maps

are based on data f rom t h e land environment and t h a t t h e CRLE model takes
i n t o account t h e d i f fe rences between t h e land and t h e lake environments.
Fig. 7 i s a map o f t h e southeastern Uni ted Sta tes showing t h e
d i f ference between t h e average annual lake evaporat ion and t h e average
annual a rea l evapot ransp i ra t ion f o r t h e 5 years ending September 30,
1965, and Fig. 8 i s a map of t h e p a r t o f Canada t o t h e east o f t h e
P a c i f i c D iv ide showing the d i f f e r e n c e between t h e average annual l ake
evaporat ion and t h e average annual a rea l evapot ransp i ra t ion f o r t h e 5
years ending December 31, 1969. The lake evaporat ion est imates are those
used t o prepare Figs. 5 and 6, and t h e a rea l evapot ransp i ra t ion est imates
are those used i n t e s t i n g t h e a rea l evapot ransp i ra t ion model (Morton, ,
1982d). The i s o p l e t h s were p l o t t e d by i n t e r p o l a t i o n between t h e 190
c l i m a t o l o g i c a l s t a t i o n s i n t h e two areas t h a t r e p o r t bo th a i r and dew
p o i n t temperatures.
The purpose o f Figs. 7 and 8 i s t o p rov ide an es t imate of n e t
r e s e r v o i r evaporation, o r t h e e f f e c t on the long-term water balance of
cons t ruc t i ng a r e s e r v o i r when edge e f f e c t s and n e t waterborne heat i npu ts
are i n s i g n i f i c a n t . Such est imates are o f t e n needed f o r water resource o r
environmental impact i nves t i ga t i ons . The maps probably g i ve values t h a t
are somewhat t o o h igh because t h e vegetat ion f looded by t h e r e s e r v o i r
would tend t o t r a n s p i r e a t a h ighe r r a t e than t h e vegetat ion around t h e
a i rpo r t s , where c l i m a t o l o g i c a l s t a t i o n s are normal ly located.

DEEP LAKE EVAPORATION
The CRLE models do n o t t ake i n t o account t h e e f f e c t s of seasonal
changes i n subsurface heat storage so t h a t t h e monthly est imates o f t h e
evaporat ion a re r e a l i s t i c o n l y f o r shal low lakes o r when accumulated t o
p rov ide annual t o t a l s . It i s expected t h a t t h e da ta requ i red t o p rov ide
p h y s i c a l l y based s h o r t term est imates w i l l seldom be a v a i l a b l e on a
r o u t i n e bas is so i t i s f o r t u n a t e t h a t annual est imates are adequate f o r
most. engineer ing and hydro log ic appl i ca t ions . However i t i s poss ib le t o
take subsurface heat storage i n t o account i n an approximate way b y
app ly ing storage r o u t i n g techniques s i m i l a r t o those used i n r o u t i n g
water through n a t u r a l r e s e r v o i r s i n hydrology. The storage ( V ) i s
r e l a t e d t o t h e deep l ake evaporat ion (EL) i n :
i n which k i s t h e storage constant i n u n i t s o f months and t h e constant 12
i n t he argument o f t he exponent ia l term i s i n u n i t s of mm month-'. The
non l i n e a r i t y represented by t h e exponent ia l term i s of s i g n i f i c a n c e o n l y
dur ing h igh l a t i t u d e winters.
The r o u t i n g process a l so requ i res a t ime delay ( t ) which i s
taken i n t o account by us ing i n p u t da ta f o r t h e preceding months . i n t h e
f 01 lowing way:

i n which t h e E,,, are t h e CRLE model est imates o f shal low lake
evaporat ion, t h e superscr ip ts r e f e r t o t h e delay t i m e o r t h e number of
months backward i t i s necessary t o go t o ob ta in a value of EM f o r t h e
computations o f t h e cu r ren t month. The equat ion i s used t o est imate t h e
value o f 5, w i t h a de lay t ime t h a t has bo th i n t e g r a l and f r a c t i o n a l
components, i.e. [ t J and ( t - [ t ] ) respect ive ly , f rom t h e values of E,,,
f o r two o f t h e preceding i n t e g r a l months.
The s o l u t i o n of t h e storage and water balance equat ion must be
i t e r a t i v e because o f t h e exponent ia l term i n eq. (2). A r a p i d l y
converging s o l u t i o n may be obta ined us ing t h e f o l l o w i n g r e l a t i o n s h i p s
t 1 * * EW - (ELB+ELE) + kELB [1+7exp(-ELB/1Z)] - k ~ ~ ~ ~ ( 1 + 7 e x ~ ( - E , ~ / 1 2 ) ]
6ELE = + k + 7k ( 1 - EL;/l2) exp (- EL;/12) 2 ( 4 )
i n which ELB i s t h e deep l ake evaporat ion a t t h e end of t h e preceding
month, ELE i s t h e deep l ake evaporat ion a t t h e end of t h e c u r r e n t *
month, ELE i s a t r i a l va lue o f ELE and 6ELE i s t h e est imated
co r rec t i on . Eqs. (4 ) and (5) a re repeated u n t i l I aELEl - < 0.01 mm
month-' , a goal t h a t i s reached w i t h i n f o u r i t e r a t i o n s . The i n i t i a l *
va lue of ELE i s ELB and subsequent values are those est imated f rom

eq. (5) du r i ng t h e preceding i t e r a t i o n . I n eq. (4) t h e numerator i s t h e
e r r o r i n t h e water balance and t h e denominator i s t h e d e r i v a t i v e of t h e *
numerator w i t h respect t o ELE w i t h t h e s ign changed.
The monthly va lue o f deep l ake evaporat ion i s est imated from:
The r o u t i n g constant k and t h e de lay t ime t (bo th i n months) a re
est imated from:
i n which d i s t h e e f f e c t i v e depth o f t h e l ake i n m. It i s est imated f rom
t h e average depth (dA) i n m and t h e concent ra t ion o f t o t a l d isso lved
s o l i d s ( s ) i n ppm using:
The d e r i v a t i o n o f eqs. (7), (8 ) and (9) i s descr ibed subsequently.
The r e s u l t s o f any r o u t i n g procedure depend on a reasonable
es t ima te of t h e s t a r t i n g po in t . Al though e r r o r s r e s u l t i n g from an
a r b i t r a r y s t a r t i n g p o i n t wear o f f q u i t e q u i c k l y i t i s u s u a l l y wor thwh i le
t o repeat the computations f o r the f i r s t year once and use the
end-of-year r esu l t s f o r the f i r s t t r i a l as the s t a r t i n g po in t f o r the
second t r i a l . When using monthly values f o r a s ing le year o r average
monthly values f o r an average year i t i s worthwhile t o repeat the
computations u n t i l ELE f o r the l a s t month approaches qu i t e c lose ly the
value f o r the preceding t r i a l . This makes t he annual deep lake
evaporation equal t o the annual shallow lake evaporation. The nature of
the rou t ing equation produces f a s t convergence so t h a t t h i s c r i t e r i on ,
which has been used t o produce the r esu l t s presented herein, can be met
w i t h few repe t i t i ons .
Eqs. (7), (8) and (9) were der ived by using the monthly o r
average monthly water budget estimates o f evaporation and model estimates
of shallow lake evaporation f o r Lake Ontar io (dA = 86 m and
s = l o 0 ppm), Pyramid Lake (dA = 61 m and s = 3500 ppm), Lake Hefner
(dA = 8.2 m and s = 800 ppm), Salton Sea (dA = 8.0 m and s =
37000 ppm) and Last Mountain Lake (dA = 7.6 mm and s = 1700 ppm) i n
accordance w i t h the procedure set out hereunder.
(1) The i t e r a t i v e procedure o f eqs. (3), (4), (5) and (6) was used t o
estimate monthly o r average monthly values of deep lake evaporation
f o r Lake Ontar io and Pyramid Lake w i t h many d i f fe ren t combinations
o f storage constant (k ) and delay t ime ( t ) . For the two
combinations t h a t gave the best f i t t o the comparable water budget
estimates o f each o f these deep lakes, the delay t ime was very c lose
t o one h a l f t he storage constant as shown i n eq. (8).

(2) The i t e r a t i v e procedure was then used again t o est imate monthly o r
average monthly values o f deep l ake evaporat ion f o r Lake Ontario,
Pyramid Lake, Lake Hefner, Sa l ton Sea and Last Mountain Lake us ing
many d i f f e r e n t t r i a l est imates o f t h e storage constant and t h e de lay
t ime est imated f rom eq. (8). The f i v e t r i a l est imates of t h e
storage constant t h a t gave t h e bes t f i t t o t h e monthly water budget
est imates of each l ake were used i n t h e fo rmula t ion of eqs. (7) and
(9). Note t h a t eq. (9 ) depends almost e n t i r e l y on da ta f o r t h e
Sa l ton Sea where t h e concent ra t ion o f t o t a l d issolved s o l i d s i s more
than ten t imes h igher than t h a t f o r Pyramid Lake, t h e l ake w i t h t h e
n e x t h ighes t concentrat ion.
Fig. 9 has been prepared t o p rov ide comparisons between monthly
o r average monthly values o f shal low lake evaporat ion as est imated w i t h
t h e l a t e s t vers ion o f t h e CRLE models; o f deep lake evaporat ion as
est imated f rom Ew and t h e p rev ious l y descr ibed r o u t i n g procedure; and
of t h e 1 ake evaporat ion as est imated f rom t h e water budget. The
comparisons are f o r t h e t e n lakes described i n t h e Appendix and used i n
t h e prepara t ion o f Fig. 4. These i nc lude t h e f i v e lakes used t o de r i ve
eqs. (7), (8) and (9). I n eva lua t i ng t h e resu l t s , t h e u n c e r t a i n t i e s i n
t h e measurement o f end-of-month l ake l e v e l s and t h e i r c o n t r i b u t i o n t o
e r r o r i n t h e monthly water budget est imates should be kept i n mind. Thus
t h e Lake Hefner water budget est imates f o r t h e months o f February and
March prov ide grounds f o r suspic ion t h a t t h e est imated water l e v e l f o r
t h e end of February was f o u r t o f i v e cm t o o high. From t h i s p o i n t of

view Fig. 9 shows t h a t t h e a p p l i c a t i o n o f t h e prev ious ly described
r o u t i n g procedure t o t h e CRLE model est imates of shal low lake evaporat ion
can provide reasonably re1 i a b l e est imates o f monthly deep 1 ake
evaporation. I n t h i s regard i t may be o f i n t e r e s t t o note t h a t t h e
average absolute dev ia t i on f rom t h e water budget estimates i s 16.7
mmlmonth f o r t h e deep lake est imates as compared t o 32.3 mmlmonth f o r t h e
shallow lake estimates.
POND EVAPORATION
The CRLE model does n o t take i n t o account t h e e f f e c t s of
increased evaporat ion a t t h e upwind t r a n s i t i o n . These e f f e c t s can be
ignored f o r lakes b u t they cou ld be s i g n i f i c a n t f o r ponds o r o the r small
bodies o f water. The nature of t h e t r a n s i t i o n i s shown i n Fig. 1 where
t h e d i s h evaporat ion a t t h e upwind edge o f t h e co t ton f i e l d s i s analogous
t o the p o t e n t i a l evaporat ion i n t h e land environment and t h e d i s h
evaporat ion a t t h e downwind edge o f t h e co t ton f i e l d s i s approaching a
low constant value t h a t i s analogous t o t h e lake evaporation. The
t r a n s i t i o n can be approximated by
i n which EpX i s t h e p o t e n t i a l evaporat ion a t d is tance X downwind of t h e
upwind shorel ine, Ep i s t h e p o t e n t i a l evaporat ion i n t h e land
environment, EL i s t h e deep lake evaporat ion (i.e. t h e p o t e n t i a l
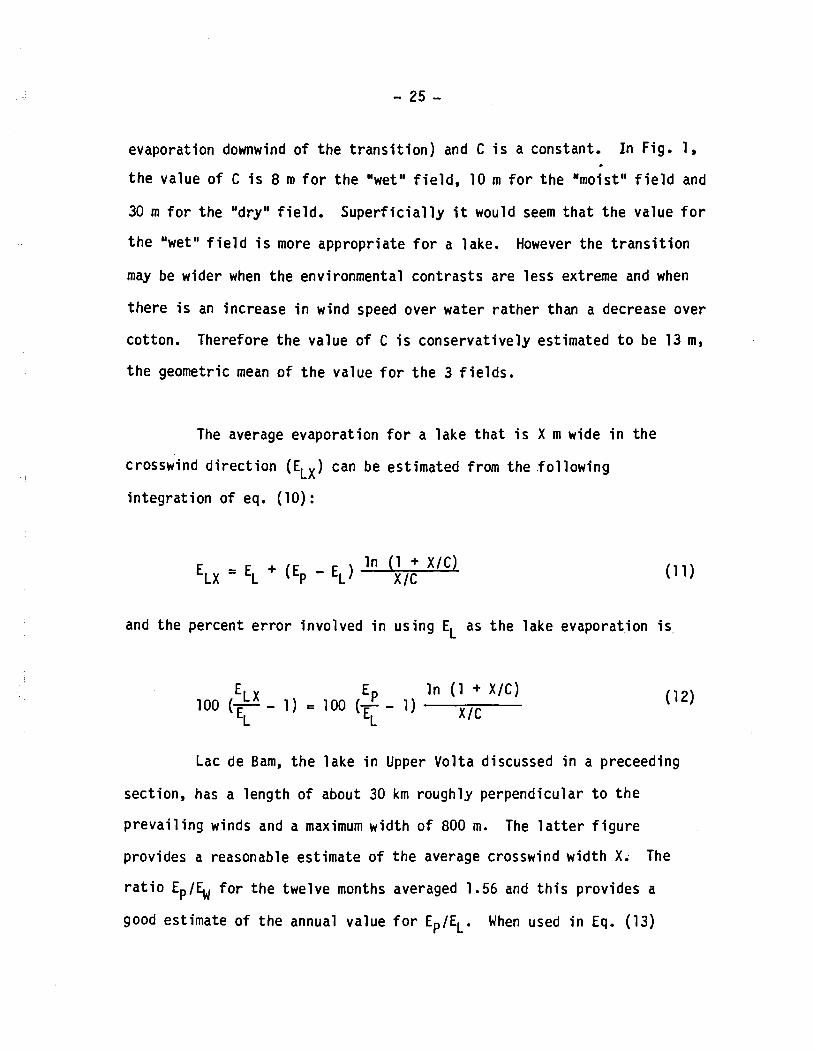
evaporation downwind o f t h e t r a n s i t i o n ) and C i s a constant. I n Fig. 1,
t h e value of C i s 8 m f o r t h e Uwetol f i e l d , 10 m f o r t h e Ymoistl' f i e l d and
30 m f o r t h e "dry" f i e l d . S u p e r f i c i a l l y i t would seem t h a t t h e value f o r
t h e "wet" f i e l d i s more appropr iate f o r a lake. However the t r a n s i t i o n
may be wider when t h e environmental cont ras ts are l ess extreme and when
the re i s an increase i n wind speed over water r a t h e r than a decrease over
cotton. Therefore t h e value o f C i s conservat ive ly est imated t o be 13 m,
t h e geometric mean of t h e value f o r t h e 3 f i e l d s .
The average evaporat ion f o r a lake t h a t i s X m wide i n t h e
crosswind d i r e c t i o n (ELX) can be est imated from the f o l l o w i n g
in teg ra t i on o f eq. (10):
and t h e percent e r r o r invo lved i n us ing EL as t h e lake evaporat ion i s
Lac de Bam, t h e l ake i n Upper Vo l ta discussed i n a preceeding
section, has a length of about 30 km roughly perpendicular t o t h e
p r e v a i l i n g winds and a maximum wid th o f 800 m. The l a t t e r f i g u r e
provides a reasonable est imate of t h e average crosswind w id th X. The
r a t i o Ep/EW f o r t h e twelve months averaged 1.56 and t h i s provides a
good est imate o f t h e annual value f o r Ep/EL. When used i n Eq. (13)

these f i g u r e s i n d i c a t e t h e annual CRLE evaporat ion est imates f o r
Lac de Bam are approximately 3.8 percent t o o low.
CONCLUDING DISCUSSION
The CRLE model est imates are most s e n s i t i v e t o e r r o r s i n the
required sunshine du ra t i on o r r a d i a t i o n inputs. They are r e l a t i v e l y
i n s e n s i t i v e t o e r r o r s i n t h e dew p o i n t temperature o r o the r op t i ona l
humidi ty inputs and i n the a i r temperature inputs. Furthermore i t
doesn't mat ter much where i n t h e v i c i n i t y o f t h e lake t h e temperature and
humidi ty inputs are observed because the complementary r e l a t i o n s h i p
automat i c a l l y takes i n t o account t h e e f f e c t s o f d i f f e r i n g surroundings.
Thus the d i f f e rence between est imates der ived f rom observat ions i n t h e
1 and environment and est imates der ived f rom observat ions over t h e 1 ake
would be due p r i m a r i l y t o t h e r e l a t i v e l y minor e f f e c t of t h e d i f f e r e n c e
i n humidi ty on t h e est imates o f n e t rad ia t i on .
One o f t he ob jec t ions t o t h e CRLE models i s t h a t they do no t
t a k e i n t o account t h e e f f e c t s of wind speed on lake evaporation. Such an
ob jec t i on ignores the f o l l o w i n g considerat ions:
(1 ) Vapour i s t ransported away f rom a lake i n a v e r t i c a l d i r e c t i o n by
wind-induced turbulence and heat-induced turbulence. Heat-induced
turbulence preponderates over wind-induced turbulence dur ing per iods
o f h igh evaporat ion and i t becomes more pronounced a t low wind
speeds so t h a t attempts t o p l o t evaporat ion pe r u n i t vapour pressure
d i f ference against wind speed always resemble buckshot on a barn
door.
(2) The ef fects on evaporat ion of an increase i n wind speed are
p a r t i a l l y of fset by t h e ef fects on evaporat ion of t h e r e s u l t a n t
decrease i n sur face temperature.
(3) Wind speed observat ions i n the 1 and environment are extremely
s e n s i t i v e t o instrument height , upwind sur face roughness and nearby
obstruct ions, so they do n o t necessar i l y p rov ide a good est imate of
wind speed over a lake. Therefore t h e use of r o u t i n e l y observed ..
wind speeds can lead t o s i g n i f i c a n t e r ror .
The foregoing observat ions i n d i c a t e t h a t t h e use of r o u t i n e l y observed
wind speeds i n es t imat ing lake evaporat ion does n o t s i g n i f i c a n t l y reduce
e r r o r and may q u i t e poss ib l y increase it.
The CRLE models do n o t imp1 i c i t l y take i n t o account seasonal
change i n subsurface heat storage. I n t h i s they are i n no way i n f e r i o r
t o the more conventional p o t e n t i a l evaporation, pan evaporat ion and b u l k
aerodynamic techniques t h a t a l s o depend on data observed i n t h e land
environment. I n f a c t , they are super io r because they can r e a d i l y
accommodate e x p l i c i t est imates of subsurface heat s torage changes t h a t
have been determined from temperature soundings and when, as i s usual,

the resu l t s o f such soundings are not ava i lab le they can be coupled w i t h
the rou t ing technique presented herein t o produce estimates o f deep lake
evaporation t ha t r e f l e c t the storage changes. Comparisons between
monthly routed values of deep lake evaporation and the corresponding
water budget values f o r ten lakes indicates t ha t the rou t ing technique
provides reasonably r e a l i s t i c estimates.
The CRLE models and the rout ing technique do no take i n t o
account the k ind o f upwind shorel ine t r a n s i t i o n shown i n Fig. 1.
Therefore they are appl icable only t o lakes. However the resu l t s can be
appl ied t o ponds o r other small bodies o f water when modif ied using
eq. (11).
The l i m i t a t i o n s and disadvantages of the CRLE models seem minor
i n comparison w i th the advantages t ha t are summarized below:
(1) They requ i re as input on ly land environment observations of
temperature, humidity and sunshine durat ion and the resu l t s are
r e l a t i v e l y insens i t i ve t o e r ro r s i n temperature and humidity.
(2) They requ i re no loca l opt imizat ion o r fudging o f coe f f i c ien ts . This
means t h a t the resu l t s are f a l s i f i a b l e and can be tested r igo rous ly
against comparable water budget estimates anywhere i n the world.
The resu l t s presented herein show good agreement w i th the
corresponding water budget estimates f o r n ine lakes i n North America
and two lakes ( inc lud ing Lac de Bam) i n Africa.

(3) They have a sound physical bas is and are therefore e a s i l y adaptable
t o unusual appl icat ions. Thus i t i s easy t o make t h e adaptat ions
needed t o est imate t h e e f f e c t s o f heat r e j e c t i o n f rom thermal power
p lan ts and t o est imate t h e e f fec ts o f n e t waterborne heat inputs t o
deep rese rvo i r s on la rge r i v e r s i n hot, a r i d cl imates.
(4) The same i n p u t data and an almost i d e n t i c a l model can be used t o
p rov ide an est imate of t h e evapotranspirat ion t h a t has taken p lace
i n t h e area where a r e s e r v o i r i s planned o r t h e evapotranspirat ion
t h a t would have taken p lace i f a r e s e r v o i r d i d no t e x i s t . The
d i f f e rence between t h e est imated lake evaporat ion and t h e est imated
evapotranspirat ion, t h e n e t r e s e r v o i r evaporation, i s an important
q u a n t i t y because i t represents the e f f e c t o f an e x i s t i n g o r planned
r e s e r v o i r on t h e water balance o f a basin.
The foregoing advantages make t h e CRLE models much super io r t o the
conventional p o t e n t i a l evaporation, pan evaporat ion o r bu l k aerodynamic
techniques t h a t a l so r e l y on data observed i n t h e land environment. With
regard t o t h e second advantage i t should be noted t h a t no o t h e r technique
( i nc lud ing t h e energy budget technique) has been tes ted so r i g o r o u s l y and
therefore no o the r technique can be used w i t h such confidence t o prov ide
estimates o f lake evaporat ion anywhere i n t h e wor ld w i thout t h e need f o r
l o c a l l y c a l i b r a t e d c o e f f i c i e n t s .

- 30 -
APPENDIX
DOCUMENTATION OF LAKES
The lakes used t o develop and t e s t t h e CRLE model i n t h i s and a
companion paper (Morton, 1982b) are documented here in i n order of
increasing l a t i t u d e .
, Lake V i c t o r i a i s located i n t h e headwaters o f t h e White N i l e
R iver i n East A f r i c a w i t h i t s centre near 1°S and 33O~. It has an
a t t i t u d e o f about 1130 metres above sea leve l , an average depth of 40
metres, an area o f 68000 square k i lomet res and a concentrat ion o f t o t a l
d isso lved s o l i d s t h a t i s be l ieved t o be near 400 ppm. The average annual
r a i n f a l l i s about 1670 mn. Monthly water budget est imates of evaporat ion
and t h e requ i red c l i m a t o l o g i c a l da ta f o r t h e f i v e years ending
December 31, 1974 have been suppl ied by t h e Chief Technical Advisor of
t h e WMO Hydrometeorological Survey o f Lakes V ic tor ia , Kyoga and Mobuto
Sese Seko. K i t e (1981) has tabulated t h e average monthly values of water
budget evaporation. The CRLE model est imates are based on t h e averages
o f t he monthly temperatures and dew p o i n t temperatures recorded a t
Entebbe and Mwanza and t h e monthly values o f sunshine dura t ion averaged
over the lake using shore l ine and i s l a n d s ta t ions . A second s e t o f CRLE
model est imates t h a t use t h e lake average values of g loba l r a d i a t i o n as
an inpu t op t ion provided r e s u l t s o n l y 2 percent l ess on an average annual
bas i s and are the re fo re n o t used separate ly i n t h e t e s t o f t h e model.

The Sa l ton Sea i s located a t 3 3 ' 1 5 ' ~ and 115 '50 '~ i n the s t a t e
o f Ca l i fo rn ia . During 1961 and 1962 i t was approximately 71 m below sea
2 l e v e l w i t h an average depth o f 8.0 metres and an area o f 920 km . The
load of t o t a l d issolved s o l i d s has been observed a t approximately
37000 ppm. The c l ima te i s a r i d w i t h an average annual p r e c i p i t a t i o n
between 20 and 60 mm. Monthly water budget est imates o f evaporation and
the requ i red c l imatological inputs f o r t h e years 1961 and 1962 have been
presented by Hughes (1967). Two d i f f e r e n t se ts o f CRLE model estimates
have k e n made, both based on dewpoint and a i r temperatures observed a t
Sandy Beach. They d i f f e r i n t h a t one uses t h e sunshine dura t ion observed
a t Yuma as i npu t whereas t h e o the r uses t h e g loba l and hemispheric
r a d i a t i o n observed a t Sandy Beach as input . Since t h e former se t of
model estimates exceeds the l a t t e r se t by l ess than 2 percent on an
average annual bas is i t has been selected f o r use i n t h e prepara t ion of
Figs. 4 and 9.
S i l v e r Lake i s located a t 3 5 ' 2 5 ' ~ and 1 1 6 ' 0 5 ' ~ i n t h e s t a t e o f
C a l i f o r n i a a t an a l t i t u d e o f approximately 280 m above sea leve l . I n 2 harch, 1938 t h e lake had an area exceeding 50 km and a maximum depth
of about 2 m b u t by September, 1939 most o f t h e water i n t h e lake had
evaporated. The average depth and t o t a l d issolved s o l i d s f o r t h i s pe r iod
a re assumed t o have been 0.5 m and 500 ppm respect ive ly . The c l ima te i s
a r i d w i t h an annual r a i n f a l l o f about 100 mn. Water budget est imates of
evaporat ion and observat ions o f temperature and r e l a t i v e humidi ty f o r t h e
twelve months ending A p r i l 30, 1939 have been presented by Blaney
(1957). There are no sunshine du ra t i on o r g loba l r a d i a t i o n records
a v a i l a b l e f o r use as input . However t h e l ake i s almost equ id i s tan t from
Las Vegas, where l a t e r g loba l r a d i a t i o n observat ions were h igh b u t w i t h i n
t h e expected range, and Inyokern (China Lake), where l a t e r g loba l
r a d i a t i o n observat ions were abnbrmally high. These l a t e r records
i nd i ca ted t h a t t he re i s l i t t l e year-to-year v a r i a t i o n i n g loba l r a d i a t i o n
i n the v i c i n i t y o f t h e lake. Therefore t h e CRLE model est imates of t h e
evaporat ion from S i l v e r Lake are based on t h e temperature and r e l a t i v e
humid i t ies observed a t t he lake and on t h e monthly values o f g loba l
r a d i a t i o n observed a t Las Vegas averaged over t h e 5 years ending December
31, 1964.
Lake Hefner i s located i n t h e s t a t e o f Oklahoma a t 3 5 ° 3 5 ' ~ and
97 '40 '~ . It i s approximately 365 m above sea leve l , has an average depth
2 o f 8.2 m, an average area of 10.5 km and t h e concentrat ion o f t o t a l
d isso lved s o l i d i s estimated t o be about 800 ppm. The c l ima te i s
subhumid w i t h an average annual p r e c i p i t a t i o n near 790 m. Water budget
est imates of evaporat ion from the lake f o r t h e 16 months ending August
31, 1951 were an important p a r t o f t h e well-known Lake Hefner s tud ies
(U.S. Geological Survey, 1954). The CRLE model est imates are based on
dewpoint temperature, a i r temperature and sunshine dura t ion records f o r
Oklahoma City. The values o f water budget and model est imates o f lake
evaporat ion f o r t h e months of May, June, Ju l y and August are averages f o r
two years w h i l e those f o r t h e remaining e i g h t months are f o r one year
only.

Pyramid Lake and Winnemucca Lake are located between 1 1 9 ' ~ and
1 2 0 " ~ a t a l a t i t u d e o f 4 0 " ~ and an a l t i t u d e o f about 1160 m above sea
l e v e l i n t h e s t a t e of Nevada. The c l ima te i s a r i d w i t h an average annual
p r e c i p i t a t i o n of approximately 165 mm. The depth and area of Winnemucca
2 Lake i n e a r l y 1935 were roughly 5 m and 60 km respec t i ve l y b u t by l a t e
1938 the lake was p r a c t i c a l l y dry. The average depth and the
concentrat ion o f t o t a l d issolved s o l i d s are unknown b u t can be assumed t o
be 1.2 m and 13000 ppm respec t i ve l y w i thou t c o n t r i b u t i n g t o s i g n i f i c a n t
e r ror . The average depth and average area o f Pyramid Lake dur ing 1935
ana 1936 were estimated t o be approximately 61 m and 460 km 2
respec t i ve l y t a k i n g i n t o account an apparent e r r o r o f 9 f e e t i n t h e gauge
reading p r i o r t o 1971 (Geological Survey Water Supply Paper, 2127,
1974). The concentrat ion o f t o t a l d isso lved s o l i d s f o r Pyramid Lake has
been measured and t h e reported value was approximately 3500 ppm. Harding
(1962) has presented water budget est imates o f evaporat ion f rom Pyramid
Lake f o r t he two complete years ending on December 31, 1936 and from
Winnemucca Lake f o r 37 o f t h e 41 months ending on September 30, 1938.
The comparable CRLE model est imates are based on dewpoint temperatures,
a i r temperatures, and sunshine du ra t i on recorded a t Reno, Nevada. The
monthly average values o f water budget and model est imates used i n Figs.
4 and 9 are f o r t h e calendar years 1935 and 1936 i n t h e case o f Pyramid
Lake and f o r from one t o f o u r years, depending on t h e a v a i l a b i l i t y of
water budget data, i n t h e case o f Winnemucca Lake.

Utah Lake i s loca ted a t 4 0 ' 1 0 ' ~ and 111'50'W a t an a l t i t u d e o f
2 approximately 1370 m i n t h e s t a t e o f Utah. It has an area of 380 km , an average depth of 2.7 m and concent ra t ion o f t o t a l d issolved s o l i d s o f
about 1000 ppm. The c l ima te i s semiar id w i t h an average annual
p r e c i p i t a t i o n o f approximately 340 mm. The water budget est imates of
monthly evaporation, averaged over t he th ree years ending June 30, 1973,
have been presented by M i l l e r and M e r r i t t (1980). The comparable CRLE
model est imates have been der ived from dewpoint temperature, a i r
temperature and sunshine d u r a t i o n da ta recorded a t S a l t Lake City.
Lake Ontario, t he f u r t h e s t downstream of the Nor th American
Great Lakes, i s centred a t 43O39 '~ and 7 7 ' 4 7 ' ~ w i t h an a l t i t u d e of about
2 75 m above sea leve l . It has an area o f 19100 km , an average depth o f
86 m and a concent ra t ion of t o t a l d isso lved s o l i d s o f rough ly 100 ppm.
Water budget est imates o f t h e evaporat ion f o r t h e year ending March 31,
1973 were prepared f o r t h e IFYGL, t h e I n t e r n a t i o n a l F i e l d Year on t h e
Great Lakes (Witherspoon, 1978). Dur ing t h i s year the p r e c i p i t a t i o n on
t h e lake, as est imated f rom sho re l i ne s t a t i o n s and radar was 1025 mm.
The comparable CRLE model est imates are based on dewpoint and a i r
temperatures t h a t a re averages f o r Toronto In te rna t i ona l , Trenton, and
Kingston a i r p o r t s and on sunshine du ra t i on r a t i o s t h a t a re averages f o r
Kingston, Morven, Smi th f ie ld , Toronto, Hamil ton and Vineland.
Last Mountain Lake i s a long, narrow north-south l ake centred a t
51°06'N and 1 0 5 " 1 2 ' ~ i n t h e prov ince of Saskatchewan. It i s loca ted a t

2 an a l t i t u d e o f 490 m above sea leve l , has an area of 185 km , an
average w id th of 2.5 km, an average depth o f 7.6 m and a concentrat ion of
t o t a l d issolved s o l i d s o f approximately 1700 ppm. D e t a i l s o f t h e water
budget est imates of evaporat ion f o r t h e two r e l a t i v e l y d r y years of 1973
and 1977 are presented i n Table I. The comparable CRLE model est imates
a re based on dewpoint temperatures, a i r temperatures and sunshine
dura t ion r a t i o s t h a t are averages f o r Wynyard.and t h e Regina, Moose Jaw
and Saskatoon a i rpo r t s .
Dauphin Lake i s located a t 5 1 ' 1 5 ' ~ and 9 9 ' 4 6 ' ~ i n t h e Province
o f Manitoba a t an a l t i t u d e o f 260 m above sea leve l . It has an area of
2 521 km , an average depth o f 2.0 m and t h e concentrat ion of t o t a l
d issolved s o l i d s has been observed a t approximately 300 ppm. The averag.e
annual p r e c i p i t a t i o n f o r t h e years 1967 and 1968 was between 390 and 400
mn. Deta i l s of t h e waer budget est imates o f evapotranspirat ion f o r 1967
and 1968 have been presented e l sewhere (Morton, 1979). The comparable
CRLE model est imates are based on t h e records o f dewpoint temperature,
a i r temperature and sunshine du ra t i on a t Dauphin A i rpo r t .

REFERENCES
Blaney, H.F., 1957. Evaporation study a t S i l v e r Lake i n t h e Mojave
Desert, Ca l i f o rn ia , EOS, Trans. AGU, 38(2), pp. 209-215.
Canadian Nat ional Committee f o r IHD, 1975. Hydrological a t l a s of
Canada, Supply and Services Canada, Ottawa, Canada, P l a t e 17.
Davenport, D.D. and J.P. Hudson, 1967. Changes i n e v a p o r a t i o ~ r a t e s
along a 17-km t ransec t i n t h e Sudan Gezira, Agr. Meteorol, 4(5),
pp. 339-352.
Ferguson, J., 1962. The r a t e o f n a t u r a l evaporat ion f rom shal low ponds,
Austr. Jour. Sci. Research, AS, pp. 315-330.
G r i f f i t h s , J.F., 1972. E d i t o r of Cl imates o f Afr ica, World Survey of
Climatology, Elsevier , New York, p. 122.
Harding, S.T., 1962. Evaporation f rom Pyramid and Winnemucca Lakes,
Nevada, J. I r r i g . and Dra in Div. Amer. Soc. C i v i l Eng., 88
( I R I ) , pp. 1-13.
Hounam, C. E., 1973. Comparison between pan and 1 ake evaporat ion,
Technical Note No. 126, World Meteoro log ica l Organizat ion,
Geneva, Switzer land, p. 15.

Hoy, R.D. and S.K. Stevens, 1979. F i e l d s tudy o f lake evaporat ion - ana lys is o f da ta f rom phase 2 storages and sumnary of phase 1
and phase 2, Aus t ra l i an Water Resources Council Technical Paper
No. 41, Canberra, Aus t ra l i a .
Hughes, G.H., 1967. Ana lys is o f techniques used t o measure evaporat ion
f rom Sa l ton Sea, Ca l i f o rn ia , U.S. Geological Survey Prof. Paper
272-H, Washington, D.C.
K i te , G.W., 1981. Recent changes i n l e v e l o f Lake V ic to r i a ,
Hydro log ica l Sciences Bul l e t i n , 26(3), pp. 233-243.
M i l l e r , A.W. and L.B. M e r r i t t , 1980. Utah Lake Evaporation Study,
Eyr ing Research I n s t i t u t e , Inc., Provo, Utah.
M i l l e r , D.W., J.J. Geraghty and R.S. Co l l i ns , 1963. Water a t l a s
of t h e Un i ted States, Water Inform. Center, Po r t Washington, New
York, P l a t e 18.
Morton, F.I., 1979. C l ima to log i ca l est imates of l ake evaporat ion,
Water Resources Res., 15(1), pp. 64-76.
Morton, F. I., 1982a. Operat ional est imates of a rea l evapot ransp i ra t ion
and t h e i r s i g n i f i c a n c e t o t h e science and p r a c t i c e of
hydrology: I The problem, Th is issue.
Morton, F. I., 1982b. Operational estimates of areal evapotranspiration
and their significance to the science and practice of
hydrology: I1 The complementary relationship, This issue.
Morton, F.I., 1982c. Operational estimates of areal evapotranspiration
and their significance to the science and practice of
hydrology: I11 Modus operandi, This issue.
Morton, F. I., 1982d. Operational estimates of areal evapotranspiration
and their significance to the science and practice of
hydrology: I V Reliability, practically and potential impact,
This issue.
Morton, F.I., Goard, R. and 3. Piwowar, 1980. Programs REVAP and WEVAP
for estimating areal evapotranspiration and lake evaporation
from climatological observations, NHRI Paper No. 12, Inland
Waters Directorate, Environment Canada, Ottawa.
Omar, M.H. and M.M. El-Bakry, 1981. Estimation of evaporation from
the lake of the Aswan High Dam (Lake Nasser) based on
measurements over the lake, Agr. Meteorol., 23, pp. 293-308.
Penman, H.L., 1948. Natural evaporation from open water, bare soi 1 and
grass, Proc. Roy, Soc. Ser. A., 193, pp. 120-145.

Pouyaud, B., 1979. Etude de 1 'evaporat ion d'un l a c en c l imat soudano-
sahelian: l e Lac de Bam (Haute-Volta), Cah. O.R.S.T.O.M., Ser.
Hydrol., XVI(2), pp. 89-143..
U.S. Geological Survey, 1954. Water loss i nves t i ga t i ons , Lake Hefner
s tudies, Prof. paper 269, Washington, D.C.
U.S. Geological Survey, 1958, Water loss i nves t i ga t i ons , Lake Mead
studies, Prof. Paper 298, Washington, D.C.
Witherspoon, D.F., 1978. Hydrology o f Lake Ontario, Verh. I n te rna t .
Verein. Limnol, 20, pp. 276-279.

- 40 -
TITLES FOR FIGURES
F ig . 1 Comparison of evaporat ion r a t e s across i r r i g a t e d c o t t o n f i e l d s
on December 27, 1963 (Davenport and Hudson, 1967).
F ig . 2 Schematic representa t i o n o f complementary r e l a t i o n s h i p between
a rea l and p o t e n t i a l evapot ransp i ra t ion w i t h constant r a d i a n t
energy supply.
F ig . 3 Schematic representa t ion o f r e l a t i o n s h i p between shal low 1 ake
evaporat ion and p o t e n t i a l evaporat ion i n t h e land environment
w i t h constant r a d i a n t energy supply.
Fig. 4 Comparison o f model est imates w i t h water budget est imates of
evaporat ion f rom Lake V i c t o r i a [V], Sa l ton Sea [ss], S i l v e r Lake '
[S], Lake Hefner [HI, Pyramid Lake [PI, Winnemucca Lake [W],
Lake On ta r i o [O], Las t Mountain Lake [L] and Dauphin Lake [Dl.
Fig. 5 Lake evaporat ion f o r t h e southern Un i ted States du r i ng t h e f i v e
years ending September 30, 1965.
Fig. 6 Lake evaporat ion f o r t h e p a r t o f Canada t o t h e eas t of t h e
P a c i f i c D i v i d e du r i ng t h e f i v e years ending December 31, 1969.
Fig. 7 Net r e s e r v o i r evaporat ion f o r t h e southern Un i ted Sta tes d u r i n g
t h e f i v e years ending September 30, 1965.
F i g . 8 Net r e s e v o i r evaporation f o r t h e p a r t o f Canada t o t h e east of
t h e P a c i f i c Divide during the f i v e years ending December 31,
1 969.
F i g . 9 Comparison of monthly model estimates o f shallow l a k e and deep
l a k e evaporation w i t h comparable monthly water budget estimate.

TABLE I
COMPONENTS OF THE LAST MOUNTAIN LAKE WATER BUDGE-T
P r e c i p- Gauged Ungauged Decrease Evapor- Year Month i t a t i o n 1 I n f l o w 2 I n f l o w ' O u t f l o w S i n L e v e l t i o n
1973 Jan. Feb. Mar. Apr. May June Jc l y Aug. Sept. Oct. Nov. Dec . T o t a l 449 6 3 5 3 - 3 123 69 1
1977 Jan. Feb. Mar. Apr. M ay June J u l y Aug. Sept. Oct. Nov. Dec.
T o t a l
' Average f o r D i lke, Duval , Las t Mountain W i l d l i fe. , Lumsden, Nokomi s and St rasbourg T o t a l f o r Lanigan, Arm, Lewis and S a l i n e Creeks (5793 km2) ' Gauged va lue m u l t i p l e d by (5207 km2/5793 km2) ' Based on Rowans Ravine averages f o r 10 days before and a f t e r end of month
E Est imated f r om d i f f e r e n c e s i n d ischarges a long Qu 'Appe l le R i v e r


-2Ew = DRY ENVIRONMENT POTENTIAL EVAPORATION
\ E, = POTENTIAL EVAPORATION IN LAND
ENVIRONMENT
Ew = LAKE EVAPORATION 'Ew
WATER SUPPLY TO SOIL-PLANT SURFACES OF LAND ENVIRONMENT

WATER BUDGET ESTIMATE OF LAKE EVAPORATION IN MILLIMETRES PER YEAR I


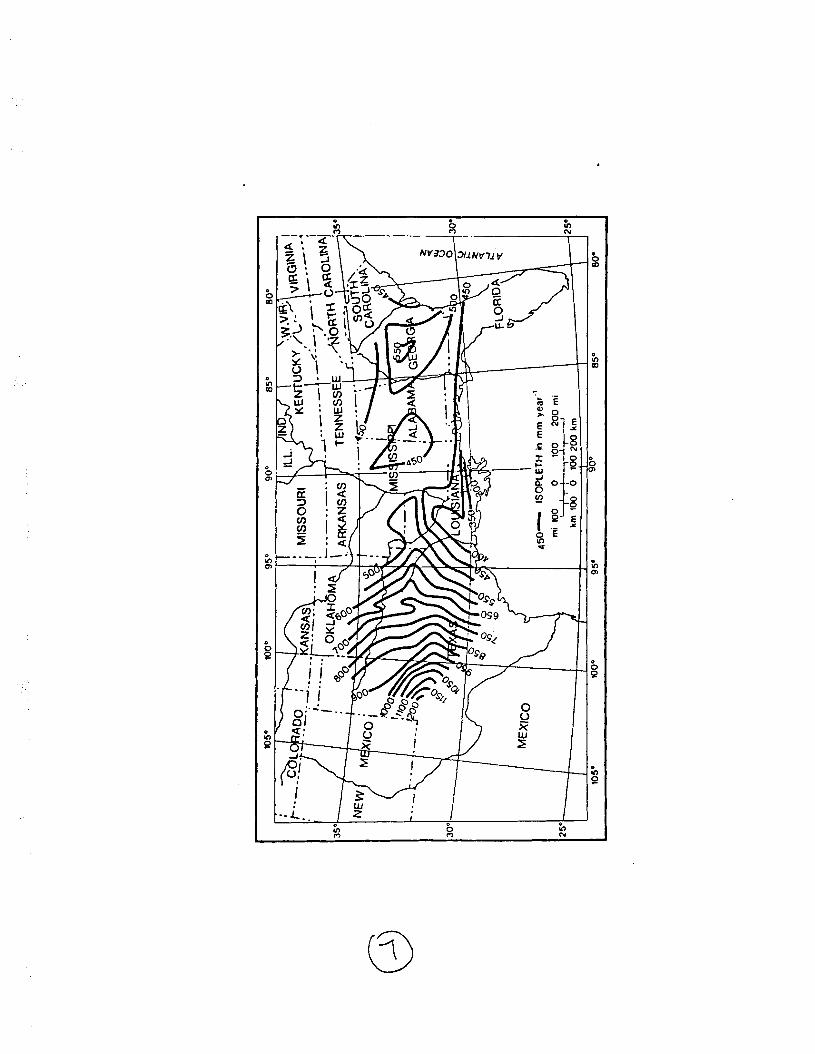
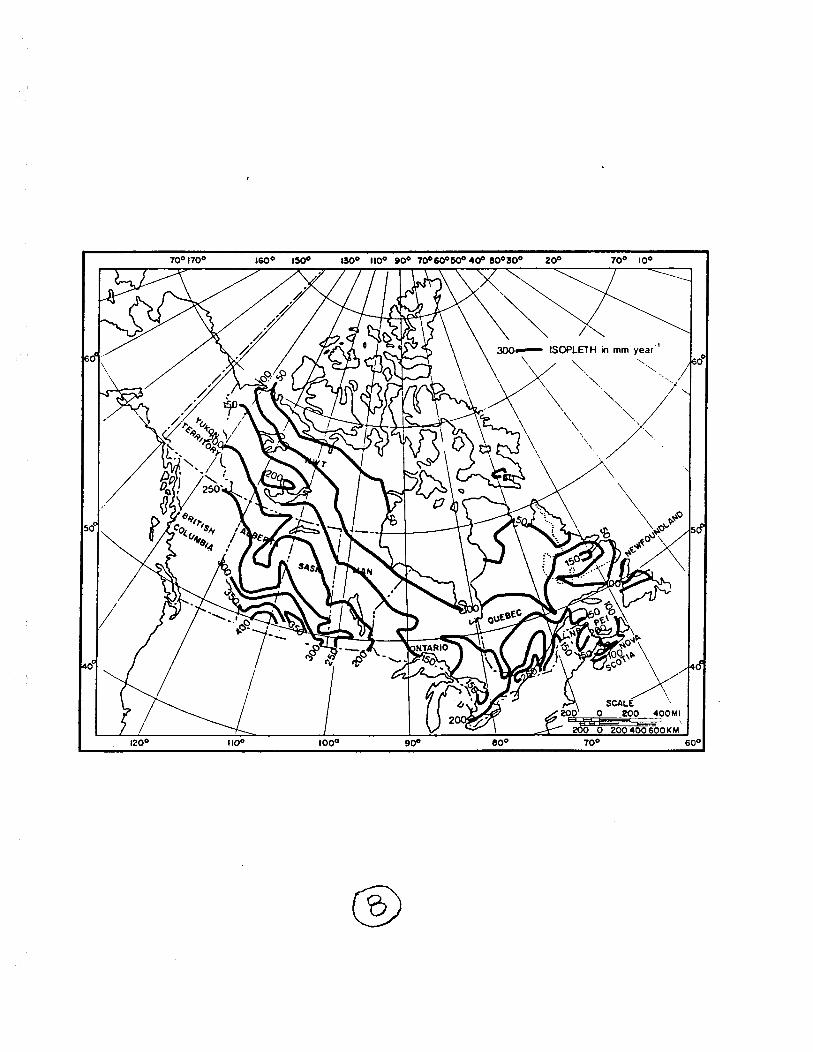

LEGEND
MODEL ESTIMATE --:? WATER BUDGET FOR SHALLOW LAKE I -- ESTIMATE
! MODEL ESTIMATE \ FOR DEEP LAKE
UTAH LAKE d, = 2.7 m
s = 1000 ppm
I F M A M J J A S O N O
LAKE HEFNER WINNEMUCCA L. PYRAMID LAKE dA = 8.2 m dA = 1.2 m dA = 61 m
s = 8 0 0 ppm ? s = 12000 ppm ? s = 3 5 0 0 ppm - 300
- 250
J F M A M J J A S O N D J F M A M J J A S O N D J F M A M J J A S O N O

OPERATIONAL ESTIMATES OF AREAL EVAPOTRANSPIRATION
AND THEIR SIGNIFICANCE TO THE SCIENCE AND
PRACTICE OF HYDROLOGY
IV RELIABILITY, PRACTICALITY AND POTENTIAL IMPACT
F.I. Morton
Nationa 1 Hydro logy Research Institute
Environment Canada
Ottawa, Canada KIA 0E7

ABSTRACT
Morton, F. I . , 1982d. (Operational estimates of areal
evapotranspiration and the i r significance to the science and
practice of hydrology: IV Re1 iabil i t y , practical i t y a n d
potential impact.
The re1 iabil i t y of the independent operational estimates of areal evapotrans-
piration produced by the l a t e s t version of the complementary relationship
models i s tested with comparable long-term water budget estimates for 143 river
basins in North America, Africa, Ireland, Australia and New Zealand. Their
practicality a n d potential impact are demonstrated by examples which show how
the avai labi l i ty of such estimates can revitalize the science and practice of
hydrology by providing a re1 iable basis for detailed water balance studies;
for further research on the development of causal model s ; for hydrological ,
agricultural a n d f i r e hazard forecasts; for detecting the development of errors
in hydrometeorological records; for detecting a n d monitoring the effects of
land use changes; for explaining hydrological anomalies; a n d for other bst ter known
appl ications. The use of the complementary re1 ationship t o provide re1 iabl e
estimates of lake evaporation from routine climatological observations in the
1 a n d environment is described in a subsequent companion paper.

INTRODUCTION
Evapo t ransp i ra t i on remains one o f t h e most neg lec ted and
i n t r a c t a b l e problems i n hydro logy desp i t e widespread r e c o g n i t i o n t h a t i t
i s a much l a r g e r p r o p o r t i o n o f p r e c i p i t a t i o n than r u n o f f i n most
populated p a r t s o f t he wor ld ; t h a t i t s accumulated e f f e c t s on water
s to rea i n t he s o i l , swamps and lakes c o n t r o l t h e bas in response t o
p r e c i - p i t a t i o n events; and t h a t i t i s t h e component o f t h e h y d r o l o g i c
c y c l e most d i r e c t l y i n f l uenced by l and use o r o t h e r bas in changes.
D i r e c t measurements, suc;i as those p rov ided by l ys imete rs , t h e eddy f l u x
technique o r t h e Bowen-ratio technique, g i v e p o i n t values, r e q u i r e
constant at tendance by s k i l l e d personnel and a r e based o n u n v e r i f i e d
assumptions. The water budget method p rov ides good es t imates f o r severa l
years o r m r e bu t r e q u i r e s excess ive i ns t rumen ta t i on and manpower f o r
s h o r t e r te rm e s t i m t e s . A companion paper (Morton, 1982a) p resen ts a
c r i t i c a l rev iew i n d i c a t i n g t h a t t he c u r r e n t conceptual m d e l i n g
techniques, a s exempl i f i e d i n t he SACREMENTO WATERSHED MODELING SYSTEk,
a r e based on assumptions about t h e s o i l , t he vege ta t i on and t he
a t m s p h e r e t h a t a r e incompat ib le w i t h pub1 ished evidence and t h a t causa 1
m d e l i n g techniques t h a t take i n t o account t h e complex processes and
i n t e r a c t i o n s i n t h e so i 1-p lan t -a tmsphere continuum a r e n o t expected t o
have p r a c t i c a l a p p l i c a t i o n s i n t h e n e x t t h r e e decades. The rev iew a l s o
i n d i c a t e s t h a t t h e models based o n t h e complementary r e l a t i o n s h i p between
p o t e n t i a l and a c t u a l a r e a l evapo t ransp i ra t i on can do m c h t o fill the gap
u n t i l such t ime a s t h e causal models become p r a c t i c a b l e .

The complementary r e l a t i o n s h i p i s :
i n which ET i s t h e a r e a l evapo t ransp i ra t ion , t h e a c t u a l
e v a p o t r a n s p i r a t i o n from a n area so l a r g e t h a t t h e e f f e c t s o f upwind
boundary t r a n s i t i o n s , such as those shown l a t e r i n F ig . 1, a r e
n e g l i g i b l e ; ETp i s t h e p o t e n t i a l evapo t ransp i ra t ion , a s e s t i m t e d f r om
a s o l u t i o n o f t h e vapour t r a n s f e r and energy balance equat ions,
r ep resen t i ng t h e evapotranspf r a t i o n t h a t would occu r f rom a hypo the t i ca 1
m i s t surface w i t h r a a i a t i o n a b s o r p t i o n and vapour t r a n s f e r
c h a r a c t e r i s t i c s s i m i l a r to those o f t h e area and so smal l t h a t t h e
e f f ec t s o f t h e evapo t ransp i ra t i on o n t h e overpass ing a i r would be
n e g l i g i b l e ; and ETW i s t he wet environment a r e a l evapo t ransp i ra t ion ,
t h e evapo t ransp i ra t i on t h a t would occu r i f t h e so i l - p l a n t sur faces o f t h e
area were sa tu ra ted and t h e r e were no l i m i t a t i o n s o n t h e a v a i l a b i l i t y o f
water .
The complementary r e l a t i o n s h i p i s produced by s m 11-sca l e
advec t ion o f hea t and wate r vapour i n t h e lower atmosphere as exempl i f i e d
i n t h e we1 1-known o a s i s e f f e c t . These phenomena have been demonstrated
g r a p h i c a l l y by Davenport and Hudson (1967). They measured t he v a r i a t i o n
i n evapora t ion ac ross a s e r i e s o f i r r i g a t e d c o t t o n and u n i r r i g a t e d f a l l o w
f i e l d s i n t he Sudan Gezira, u s i n g f i b e r g l a s s d ishes w i t h b lack p a i n t e d
w e l l s 113 mm i n d iameter and 36 mm i n depth. The d i sh evapora t ion

observa t ions p rov i de a r e f l e c t i o n o f t h e p o t e n t i a l e v a p o t r a n s p i r a t i o n
t h a t i s d i s t o r t e d somewhat b y t h e d i f f e r e n c e between t h e r a d i a t i o n
a b s o r p t i o n and roughness c h a r a c t e r i s t i c s o f wet vege ta t i on and wa te r
surfaces . The passage o f a i r f r o m t h e upwind dese r t (and/or t h e upwind
u n i r r i g a t e d f a l l o w f i e l d s ) o v e r t h e i r r i g a t e d c o t t o n caused t h e d i s h
evapo ra t i on t o decrease r a p i d l y and approach a low cons tan t va l ue w i t h i n
300 m - t h e w id th o f t h e f i e l d s . F u r t h e r m r e , a s t h e a i r passed f r o m
i r r i g a t e d c o t t o n ac ross u n i r r i g a t e d f a l l o w t h e d i s h evapo ra t i on increased
r a p i d l y and approached a h i g h cons tan t va lue w i t h i n 300 m. F i g . 1 shows
t h e v a r i a t i o n o f d i s h evapo ra t i on ac ross t h r e e i r r i g a t e d f i e l d s o n
December 27, 1963. The d e s c r i p t i o n o f t h e s o i l c o n d i t i o n i s presumably
based o n v i s u a l i n s p e c t i o n and i s r e l a t e d t o t h e number o f days s i nce t h e
l a s t i r r i g a t i o n . Thus i t i s reasonable t o assume t h a t t h e a c t u a l
e v a p o t r a n s p i r a t i o n i s g r e a t e r i n t h e l l m i s t l l f i e l d than i n t h e " d r y "
f i e l d and t h a t i t i s somewhere near i t s maximum p o s s i b l e va lue i n t h e
"wet" f i e l d .
A t t h e upwind edge o f t h e i r r i g a t e d f i e l d s , where t h e d i s h
evapora t ion decreases r a p i d l y , t h e h o t d r y a i r f r om t h e dese r t o r t h e
u n i r r i g a t e d f a l l o w loses h e a t and ga ins vapour f r om c o n t a c t w i t h
evapora t ing and t r a n s p i r i n g surfaces. Downwind f r om t h e t r a n s i t i o n a l
zone, where t h e d i s h evapo ra t i on approaches a low cons tan t value, t h e
e f f ec t s o f t h e e v a p o t r a n s p i r a t i o n on t h e temperature and h u m i a i t y o f t h e
overpass ing a i r a r e w e l l developed and approaching e q u i l i b r i u m . .
(Decreases i n temperature and inc reases i n h u m i d i t y a s t h e a i r m v e d
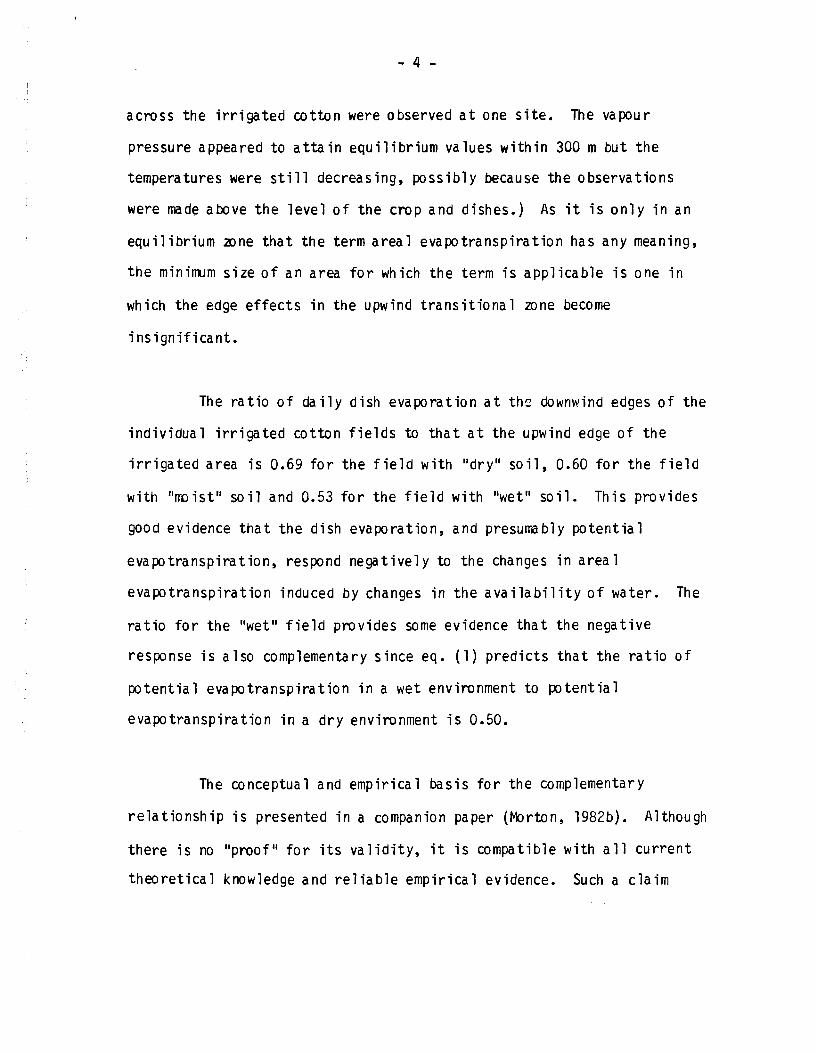
across the irrigated cotton were observed a t one s i t e . The vapour
pressure appeared to a t t a in equilibrium values within 300 m b u t the
temperatures were s t i l l decreasing, possibly because the observations
were made above the level of the crop and dishes.) As i t i s only i n an
equilibrium mne that the term areal evapotranspiration has any meaning,
the minirmm size of an area fo r which the term i s applicable i s one in
which the edge effects i n the u p w i n d transitional zone become
insignificant.
The rat io of daily dish evaporation a t the downwind edges of the
individual irrigated cotton f ie lds to that a t the upwind edge of the
irrigated area i s 0.69 for the f i e ld with "dry" so i l , 0.60 for the f i e ld
with " m i s t " soi l and 0.53 for the f i e ld with "wet" soi l . This provides
good evidence tha t the dish evaporation, and presumably potential
evapotranspiration, respond negatively to the changes in area 1
evapotranspiration induced b y changes in the avai labi l i ty of water. The
rat io for the "wet" f ie ld provides some evidence that the negative
response i s also complementary since eq. (1 ) predicts that the rat io o f
potential evapotranspiration i n a wet environment to potential
evapotranspiration in a dry environment i s 0.50.
The conceptual and empirical basis for the complementary
relationship i s presented i n a companion paper (rvbrton, 1982b). Although
there i s no "proofu for i t s validity, i t i s compatible with a l l current
theoretical knowledge and rel iable empirical evidence. Such a claim

cannot be matched by a n y concept used i n hydro l o g y w i t h t h e excep t ion o f
t he law o f conserva t ion o f mass, t h e law o f conserva t ion o f energy and
t h e approx imat ions t o t h e law o f conserva t ion o f momentum represented by
t h e Darcy formula and m o d i f i c a t i o n s t o t h e Chezy for rmla.
The ch ie f advantage o f t h e complementary r e l a t i o n s h i p i s t h a t i t
pe rm i t s t he a r e a l evapo t ransp i ra t ion , a p roduc t o f complex processes and
i n t e r a c t i o n s i n t h e so i l - p l a n t - a t m s p h e r e continuum, t o be es t imated by
i t s e f f e c t s on t he r o u t i n e c l i m a t o l o g i c a l observa t ions t h a t a r e used t o
compute p o t e n t i a l evapo t ransp i ra t i on . The d e t a i l e a f o r m u l a t i ~ n o f t h e
l a t e s t complementary r e l a t i o n s h i p area 1 evapo t ransp i ra t i on (CRAE) m d e l
i s presented i n a companion paper (Morton, 1 9 8 2 ~ ) . The r e q u i r e d
c l i m a t o l o g i c a l i n p u t s a r e screen l e v e l va lues o f t h e average dew p o i n t
temperature ( o r vapour pressure) , t h e average o f t h e maxirmm and minimum
temperatures, and t he average sunshine d u r a t i o n ( o r globa 1 r a d i a t i o n ) f o r
pe r i ods o f f r om f i v e days t o a month. The r e q u i r e d s t a t i o n
c h a r a c t e r i s t i c s a r e t h e l a t i t u d e , t h e a l t i t u d e and a rough es t imate o f
long- term average annua 1 p r e c i p i t a t i o n .
The CRAE models a r e b e p n d t h e c a p a c i t y o f s l i d e r u l e s o r
1 im i ted-memry c a l c u l a t o r s . However t h e l a t e s t ve rs i on has been
documented i n FORTRAN and i n RPN f o r t h e Hewlett-Packard HP-67 hand-held
c a l c u l a t o r (Morton, b a r d and Piwowar, 1980). A l a t e r RPN program f o r
t h e Hewlett-Packard HP-41C hand-held c a l c u l a t o r i s documented and can be
made a v a i l a b l e o n request . The g rea te r s to rage c a p a c i t y o f t h e HP 41-C

e l i m i n a t e s t he need f o r u s i n g e x t r a program cards d u r i n g i n d i v i d u a l
computat ions and pe rm i t s t h e f u l l range o f op t i ons .
Because t h e models a v o i d t he comp lex i t i es o f t h e s o i l - p l a n t
system they r e q u i r e no l o c a l o p t i m i z a t i o n o f c o e f f i c i e n t s and are,
there fo re , f a l s i f i a b l e . T h i s means t h a t t hey can be t e s t e d r i g o r o u s l y so
t h a t e r r o r s i n t h e assoc ia ted assumptions and r e l a t i o n s h i p s can be
de tec ted and co r rec ted by p rogress ive t e s t i n g ove r an ever-widening range
o f environments. Such a methodology uses t h e e n t i r e wo r l d a s a
l a b o r a t o r y and r e q u i r e s t h a t a c o r r e c t i o n made t o o b t a i n agreement
between model and r i v e r bas in water budget es t imates i n one envirorlment
must be a p p l i c a b l e w i t hou t m o d i f i c a t i o n i n a l l o t h e r environments. A
comparison o f t h e es t imates r e s u l t i n g f r o m t h e most r ecen t a p p l i c a t i o n o f
t h i s methodology w i t h comparable long-term water budget es t imates f o r 143
r i v e r bas ins i n Nor th America, A f r i c a , I r e l and , A u s t r a l i a and New Zealand
i s presented he re in .
A l though i t i s g e n e r a l l y recognizea t h a t evapo t ransp i ra t i on i s
an impor tant aspect o f hydrology, t he r e c o g n i t i o n i s t h e o r e t i c a l . On a
p r a c t i c a l bas is , most h y d r o l o g i s t s and engineers f a i l t o understand how
research and educa t ion i n hydro logy have been con f ined t o a few narrow
problems by t h e l ack o f r e l i a b l e o p e r a t i o n a l es t imates o f
evapo t ransp i ra t ion . Therefore i t i s ex t reme ly d i f f i c u l t f o r them t o
v i s u a l i z e t h e o p p o r t u n i t i e s t h a t a r i s e when such es t imates become
a v a i l a b l e . For t h i s reason, much o f t h i s paper i s devoted t o examples

which demonstrate t h e p o t e n t i a l impact o f ope ra t i bna l est imates o f
evapot ransp i ra t ion on t h e science and p r a c t i c e o f hydro logy.
TEST PROCEDURE AND RESULTS
The CRAE models a r e based o n the complementary r e l a t i o n s h i p
between po ten t i a 1 and a r e a l evapotranspi rat ion. A conceptual
r a t i o n a l i z a t i o n , a schematic model o f t h e lower atmosphere and a rev iew
o f a v a i l a b l e t h e o r e t i c a l knowleage and r e l i a b l e emp i r i ca l evidence
(Porton, 1982b) have i nd i ca ted t h a t t he concept r e f l e c t s rea 1 i t y .
Furthermore the re i s no documented evidence t h a t t h e complementary
r e l a t i o n s h i p contravenes cu r ren t knowledge o f t h e unde r l y i ng processes.
"owever t he re i s bound t o be doubt t h a t such a simple r e l a t i o n s h i p can
account f o r t he complex i n t e r a c t i o n s between t h e sur face and t h e
overpassing a i r . For t h i s reason i t i s e s s e n t i a l t h a t t h e model be
subjected t o a r i go rous t e s t i n g procedure.
I d e a l l y t h e model should be t e s t e d by comparing month1 Y
es t imates o f a r e a l evapot ransp i ra t ion w i t h monthly est imates o f
evapot ransp i ra t ion der ived f rom r i v e r basin water budgets. Th i s requ i r e s
knowledge o f changes i n the amount o f water s to red i n t he s o i l , rock,
lakes, and snow cover o f t h e basin. Unfor tunate ly , such changes can be
g rea te r than t h e evapot ransp i ra t ion and the re i s no s a t i s f a c t o r y way t o
measure them. The o n l y way t h a t t h e problem can be overcome i s t o
increase t h e comparison per iod t o a number o f years so t h a t t h e changes
i n storage become a very small part of the to ta l water budget. With the
reasonable assumption tha t groundwater gains o r losses a r e small, the
water budget evapotranspiration i s then approximately equal to
precipitation less runoff.
The use of long comparison periods does not permit direct
evaluation of the mon th ly estimates of area 1 evapotranspiration.
However, the model was calibrated with monthly data under particularly
stringent conditions, i.e., in a r id areas where ,the dry environment
potential evapotranspiration and the potentia 1 evapotranspiration are
very large and the areal evapotranspiration i s a small residual.
Furthermore, the model can be applied, without the need fo r local
optimization of coefficients, to r iver basins with different climates,
vegetation covers, s o i l s and landforms. Good agreement over a wide range
of environments between long-term areal evapotranspiration and the
corresponding values of precipitation less runoff should provide
reasonable assurance that the seasonal distributions a re r ea l i s t i c .
Fig. 2 i s a map of the southeastern U.S.A. showing average
annua 1 areal evapotranspiration fo r the f ive years ending September 30,
1965. The map i s based on the accumulation of monthly model estimates
for the 37 climatological stations in the area that report both a i r and
dew-point temperatures. For many of the s tat ions i t was necessary to
estimate sunshine duration from averages fo r the two nearest recording
stations. The isopleths were plotted by 1 inear interpo lation between the
stations.
The i s o p l e t h s i n western Texas do n o t t ake i n t o account t h e
es t ima te o f average annual a r e a l e v a p o t r a n s p i r a t i o n a t Lubbock which was
540 mm year'1 o r 100 mm year'1 h i g h e r t han t h e average annual
p r e c i p i t a t i o n . Since t h i s apparent e r r o r can be exp la i ned b y l a rge -sca le
i r r i g a t i o n f r om groundwater, i t demonstrates how a n apparent l i m i t a t i o n
to t h e widespread a p p l i c a b i l i t y o f t h e CRAE m d e l s can be u s e f u l i n
d e t e c t i n g and m o n i t o r i n g t h e hydrometeoro l og i ca 1 e f f ec t s o f human
a c t i v i t i e s .
F i g . 3 shows t h e average annual a r e a l e v a p o t r a n s p i r a t i o n o v e r
much o f Canaaa f o r t h e f i v e years end ing December 31, 1969. I t was
prepared i n t h e same way a s F i g . 2, b u t w i t h much more f r equen t use o f
t w o - o r t h r e e - s t a t i o n averages f o r t h e sunshine du ra t i on . The i s o p l e t h s
were i n t e r p o l a t e d between va lues f o r t h e 153 c l i m a t o l o g i c a l s t a t i o n s i n
t he area t h a t r e p o r t both a i r and dew-point temperatures. They were n o t
extended west o f t h e P a c i f i c D i v i d e because l a r g e a l t i t u d e d i f f e rences
would make t h e r e s u l t s un rep resen ta t i ve .
Some fea tu res became e v i d e n t i n t h e p repa ra t i on o f F i g . 3 t h a t
bear o n t h e l i m i t a t i o n s and p o t e n t i a l a p p l i c a t i o n s o f t h e CRAE models.
Examples a re :
( 1 ) The anomalously h i g h va lues o f a r e a l e v a p o t r a n s p i r a t i o n near t h e
eas t coast. These a r e p a r t i c u l a r l y n o t i c e a b l e t o t h e n o r t h o f t h e
Gulf o f St . Lawrence where t h e i s o p l e t h s a r e c o n t r o l l e d by t h e a r e a l

e v a p o t r a n s p i r a t i o n e s t i t m t e s a t Ba ie Comeau A i r p o r t (approx imate ly
1500 m f r o m t h e coas t ) and Sept I l e s A i r p o r t ( app rox i tm te l y 700 m
from t h e coas t ) . They p rov ide some i n d i c a t i o n t h a t advec t i on o f
hea t and water vapour i n t h e lower l a y e r s o f t h e a t m s p h e r e can
a f f e c t t h e a r e a l evapo t ransp i ra t i on es t imates a t a d i s t ance o f more
than 300 m from a h i g h - l a t i t u d e c o a s t l i n e .
( 2 ) The d i f fe rence between t h e area 1 evapo t ransp i ra t i on est imates a t
Edmnton I n t e r n a t i o n a l A i r p o r t (420 mm year-') and a t Edrmnton
I n d u s t r i a l A i r p o r t (358 mm Th i s c l e a r l y r e f l e c t s t h e
e f f ec t s o f u r b a n i z a t i o n s i nce t h e former i s surrounded by
a g r i c u l t u r a l l and and t h e l a t t e r i s surrounded by t h e c i t y .
The model was t e s t e d by comparing t h e a r e a l evapo t ransp i ra t i on
f o r 115 r i v e r basins, a s i n t e r p o l a t e d f r om Figs. 2 and 3, w i t h t h e
p r e c i p i t a t i o n l e s s r u n o f f va lues f o r t h e corresponding 5-year per iods .
The l o c a t i o n s o f t h e hydromet r i c s t a t i o n s a r e shown i n F igs. 2 and 3.
The p r e c i p i t a t i o n f o r t h e r i v e r bas ins was est imated f r om i s o h y e t a l maps
by p l an ime t r y o r by inspec t ion . The r u n o f f was es t imated by c o n v e r t i n g
t h e recorded f l o w s (ad jus ted f o r r epo r ted d i v e r s i o n s ) t o depth o v e r t h e
dra i na ge a rea .
S i m i l a r comparisons have been made f o r 28 r i v e r bas ins i n t h e
v i c i n i t y o f s p e c i f i c c l i m a t o l o g i c a l s t a t i o n s i n Canada, U.S.A., I r e l and ,
A f r i ca , A u s t r a l i a and New Zealand. D e t a i l s o f these comparisons a r e
summarized i n Table I.

Fig. 4 shows the CRAE m d e l est imates o f a r e a l
evapot ransp i ra t ion f o r 143 r i v e r basins p l o t t e d aga ins t the corresponding
p r e c i p i t a t i o n l ess r u n o f f values. The mean absolute dev ia t i on o f t h e
CRAE m d e l est imates f rom the l i n e o f e q u a l i t y i s 19.6 mm year-' o r
3.4 percent. The maximum dev ia t i ons a r e 52 mm year'1 and 9.9 percent.
As the dev ia t ions inc lude e r r o r i n t he p r e c i p i t a t i o n and- runoff est imates
i n a d d i t i o n to the e f fec ts o f basin storage changes and groundwater gains
o r losses, t hey a r e o f l i t t l e use i n eva lua t i ng e r r o r i n the model except
to conclude t h a t i t i s small.
The r i v e r basins used t o t e s t t he m d e l represent a extremely
wiae range o f c l imate, vegetat ion, s o i l and topography. The
environmental d i v e r s i t y , t h e c a l i b r a t i o n technique, and the gooa f i t o f
average annual data i n Fig. 4 combine t o prov ide assurance t h a t t h e
monthly est imates o f a r e a l evaporat ion a r e r e a l i s t i c .
LIMITATIONS
/
As demnst ra ted i n t he preceding sect ion, the CRAE model
presented i n a companion paper (bbrton, 1982c) can prov ide r e l i a b l e
ope ra t i ona l est imates o f a r e a l evapotranspi rat ion. However i t does have
the f o l l o w i n g 1 im i ta t i ons :
( 1 ) It requ i res accurate humid i t y data and these have depended on
frequent observat ions by s k i l l e d personnel. This i s one o f the m r e

ser ious l i m i t a t i o n s t o t he use o f t h e CRAE m d e l s a t the present
t ime. However t he Humicel l , a simple device developed by t h e
Saskatchewan Research Counci l , now prov ides a convenient and
r e l i a b l e a 1 t e rna t i ve . According t o Langham (1969) t h e inst rument
provides i n teg ra ted vapour pressures w i t h i n 2 2 percent f o r per iods
exceeding t h r e e days. Other more convenient ins t rumenta t ion i s
under development.
It cannot be used f o r s h o r t t ime i n t e r v a l s because of subsurface
heat-storage changes and because o f the l a g t imes associated w i t h
t h e change i n s torage o f h e a t and water vapour i n t he atmospheric
boundary l a y e r a f t e r changes i n sur face cond i t i ons o r t he passage o f
f r o n t a l systems. There i s every p r o b a b i l i t y t h a t t he t ime per iods
cou ld be shortened t o f i v e days b u t f o r i n t e r v a l s o f t h ree days o r
l e s s t h e r e s u l t s would always be suspect. Th is l i m i t a t i o n has
l i t t l e s i g n i f i c a n c e i n h y d r o l o g i c a l a p p l i c a t i o n s because i t does n o t
mat te r much whether t h e d a i l y evapot ransp i ra t ion i s 3 mm o r 6 mm as
long as the accumulated values f o r t he week o r f o r a longer pe r i od
a r e r e l i a b l e . The use o f s h o r t t ime per iods i s discussed i n the
preceding sect ion.
( 3 ) It cannot be used near sharp environmental d i s c o n t i n u i t i e s , such as
a h i g h - l a t i t u d e c o a s t l i n e o r the edge o f an oasis , because o f
advec t ion o f h e a t and water vapour i n t h e lower l aye rs o f the
atmosphere. The data o f Davenport and Hudson (1967) i n d i c a t e t h a t '

the effects of such advections can decrease to near zero w i t h i n 300
m b u t t h i s finding may not be generally applicable.
(4) I t requires input from a climatological station whose surroundings
a r e representative of the area of interest . Some advantages that
are associated with t h i s and the preceding limitation are presented
subsequently.
( 5 ) I t cannot be usea to predict the effects of natural o r man-made
changes since i t neither uses nor requires knowledge of the
soil-vegetation system. This i s the most serious long-term
limitation to the application of the CRAE models.
IhPACTON SCIENCE AND PRACTICE OF HYDROLOGY
I t i s generally recognized that evapotranspiration i s a much
larger proportion of the precipitation than runoff i n most populated
parts of the world; that the accumulated effects of evapotranspiration on
the water stored i n s o i l , swamps, lakes and snow pack control the
catchment response to precipitation events; and tha t evapotranspiration
i s the component of the hydrological cycle m s t direct ly influenced by
land use and climatic changes. What i s n o t recognized i s the implication
tha t without real i s t i c independent estimates of evapotranspiration there
i s no chance for significant improvements i n hydrological knowledge o r
fo r the transformation of hydrology from a descriptive to a predictive

science. This fa i lure to recognize the s ignif icanceof
evapotranspiration in the hydrological cycle i s , to a large extent,
responsible for the stagnation of the science d u r i n g the past three
decades and the concentration of research on marginal improvements to
existing techniques which i n themselves are open to doubt. I t explains
w h y so much time and e f fo r t have been expended on superficial
improvements to time distributions of runoff during the half-century
since the development of the u n i t hydrograph and why so l i t t l e time and
effort have been expended on those processes ana interactions tha t
control the volume of runoff. Furthermore i t provides a partial
explanation for the contrast between the amount of research that i s
directed toward statistically-based predictions of hydrologic regimes for
periods of several decades o r more and the amount of research tha t i s
directed toward detection of the effects of land use o r climatic changes
which, if significant, could destroy the s t a t i s t i ca l basis for the
predictions. The substitution of hydraulics and mathematics for
hyarology i s apparently based on the perception that rel iable operational
estimates of evapotranspiration a re impracticable. If so, the
demonstrated a b i l i t y of the current CRAE model to provide real i s t i c
estimates of areal evapotranspiration from routine climatological
observations anywhere i n the world should have a major impact on the
science and practice of hydrology. Some examples, for the most part
taken from the river basins l is ted in Table I , follow.

With r e l i a b l e independent es t imates o f evapo t ransp i ra t i on i t i s
poss ib l e to a b s t r a c t much h y d r o l o g i c a l i n f o r m a t i o n f rom t h e law o f
conserva t ion o f mass o r t h e wate r balance. The water balance equat ion
f o r a dra inage bas in s t a t e s t h a t t h e p r e c i p i t a t i o n equals t he sum o f t h e
runof f , evapo t ransp i ra t i on and change i n s to rage and i n t h e pas t i t has
been poss ib l e to r o u t i n e l y observe o r e s t i m t e o n l y two o f these f o u r
q u a n t i t i e s , i .e. t h e p r e c i p i t a t i o n and r u n o f f . The measurement o f
changes i n s torage o n a weekly, monthly, seasonal o r even an annual b a s i s
i s too expensive t o contemplate, except i n a research s i t u a t i o n , because
o f t h e he te rogene i t y o f topography, s o i l s , vege ta t ion and snow cover i n
most dra inage basins. Therefore t he wate r balance has been u s e f u l o n l y
to prov ide some idea o f what happens o v e r a p e r i o d o f m n y years when t h e
change i n s torage becomes r e l a t i v e l y i n s i g n i f i c a n t and t he
evapo t ransp i ra t i on can be assumed equal t o t he p r e c i p i t a t i o n l e s s
r u n o f f . However, w i t h t h e o p e r a t i o n a l es t imates o f evapo t ransp i ra t i on
p rov ided by t he c u r r e n t CRAE model, t h e wate r balance can be used t o
es t imate and s tudy t h e changes i n s torage.
F ig . 5 p rov ides some examples o f t h i s c a p a b i l i t y . It i s a
g r a p h i c a l r e p r e s e n t a t i o n o f t h e mean seasonal water balances f o r t h e
basins o f Cre igh ton T r i b u t a r y to Bad Lake near Rosetown, Saskatchewan;
Upper Rainy R i v e r o n t h e Ontar io-Minnesota Boundary; Perch Lake. I n l e t s 4
and 5 near Chalk River , Ontar io ; B i g F o s s i l Creek near F o r t Worth, Texas;

North River near Des Moines, Iowa; a n d W-5 Watershed o f Sleepers River
near Danville, Vermont; The seasonal water balances in Fig. 5 are based
o n monthly mean values o f observed precipitation, observed runoff and the
CRAE model estimates of evapotranspiration for five or more integral
years. The top solid line i s the accumulated precipitation since the
beginning of September; the middle long-dash 1 ine i s the accumulated
precipitation less evapotranspiration since the beginning of September;
and the bottom short-dash 1 ine i s the accumulated precipitation less
evapotranspiration less runoff since the beginning of September. Thus
the upper line represents a mass curve o f runoff; t h z vertical distances
i n the horizontally hatched area represent the ordinates o f a mass curve
o f evapotranspiration; the vertical distances in the stippled area
represent the ordinates o f a mass curve o f runoff; a n d the vertical
distances i n the vertically hatched area represent the ordinates o f a
mass curve of storage changes. The vertical distances o n the right h a n d
edge represent the annua 1 totals for a n average year. The very small
annual totals for the storage changes may represent an average o f the
storage change for five or more integral years o r may represent the
effects of errors i n estimating or measuring the other components o f the
water balance.
The most obvious use for the kind o f analysis presented in
Fig. 5 i s to provide general comparisons o f seasonal water balances for
river basins in differing environments. However i t can be used t o answer
more specific questions. For example, w h y i s the accumulated storage

change f o r Upper Rainy River, a l a r g e b a s i n i n the Precambrian S h i e l d
w i t h myriads o f lakes, o n l y 60 percen t o f t h a t f o r Perch Lake I n l e t s 4
and 5, a smal l bas in i n t h e Precambrian S h i e l d w i t h no lakes. F ig . 5
p rov ides t h e f o l l o w i n g p a r t i a l exp lana t ions :
( 1 ) The w i n t e r r u n o f f f o r t h e bas in o f Upper Rainy R i v e r i s much g r e a t e r
t h a n t h e w i n t e r r u n o f f f o r t h e bas in o f Perch Lake I n l e t s 4 and 5
and t h i s p rov ides a n i n d i c a t i o n t h a t t h e l ake s torage i s be ing
dep le ted a t t h e same t i m e a s t h e snowpack s torage i s be ing
augmented. I n f a c t it i s apparent t h a t t h e accumulat ion o f snow o n
t h e l a k e i c e would t end t o squeeze an equ i va len t amount o f water o u t
o f t h e lake.
( 2 ) The s p r i n g r u n o f f f o r t h e bas in o f t h e Upper Rainy R i v e r i s much
l e s s than t he s p r i n g r u n o f f f o r t h e bas in o f Perch Lake I n l e t s 4 and
5. Th is i n d i c a t e s t h a t t h e l a k e s to rage i s i nc reas ing a t t h e same
t ime as t h e snowpack s torage i s decreasing.
( 3 ) The mass curve o f p r e c i p i t a t i o n f o r t h e Upper Rainy bas in i s t y p i c a l
o f a c o n t i n e n t a l c l i m a t e where t h e p r e c i p i t a t i o n i s h i gh d u r i n g t h e
summer when evapo t ransp i ra t i on i s h i g h and low d u r i n g t h e w i n t e r
when evapo t ransp i ra t i on i s low and t h i s reauces t he need t o draw o n
s to red water. On t h e o t h e r hand t h e p r e c i p i t a t i o n mass curve f o r
t he bas in o f t he Perch Lake I n l e t s shows l i t t l e seasonal v a r i a b i l i t y .
The North R iver near Des Moines, Iowa provides the most extreme
example i n F ig. 5 o f a con t i nen ta l type o f p r e c i p i t a t i o n mass curve. It -
demonstrates how heavy summer r a i n f a l l can reduce t h e need f o r l a r g e
reduct ions i n s o i l moisture storage du r ing an average year. However the
storage dep le t ion dur ing the dryes t o f t he f i v e years was almost t h ree
t imes greater than t h a t f o r t h e average year.
Fig. 6 presents the average water balances f o r two basins i n the
Sahel reg ion o f nor thern Cameroon. I t has been prepared i n t h e same way
as Fig. 5 except t h a t t h e mass curves begin a t t he beginning o f Ju ly .
The data f o r t h e K a l l a i o basin were publ ished by Nouvelot (1973) wh i l e
the aata f o r the basin a t S t a t i o n 7 i n t h e Sangue're' were pub1 ished by
Casenave (1978). The p r e c i p i t a t i o n mass curves a r e f l a t dur ing the long
r a i n l e s s season.
F ig . 6 conta ins a hyd ro log i ca l anomaly. Although the two basins
a r e separated by less than one and a h a l f degrees o f l a t i t u d e and h a l f a
degree o f longi tude, t h e r u n o f f f r o m t he basin w i t h the lower
p r e c i p i t a t i o n exceeds the r u n o f f f r o m the basin w i t h the h ighe r
p r e c i p i t a t i o n by approximate ly 150 percent. U n t i l now t h i s k i n d o f
anomaly could be expla ined o n l y by assuming t h a t t he re i s groundwater
runoff t h a t f lows o u t o f t h e basin w i thou t being measured a t t he
streamflow gauging s i t e . Casenave (1978) s tud ied the water balance o f
t h e Sangue'r6 basins us ing t h i s assumption and concluded t h a t the
unmeasured groundwater ou t f low, which could be e x p l o i t e d w i thou t

d e p l e t i n g t h e reserves, was approx imate ly 15 percent o f t h e p r e c i p i t a t i o n
and approx imate ly 150 percen t h i g h e r t han t h e measured r u n o f f f r o m t he '
bas in a t S t a t i o n 7. However, w i t h r e l i a b l e independent es t imates o f
evapo t ransp i ra t ion , t h e r e i s no need t o make such an assumption. Thus
Fig. 6 shows t h a t t he e v a p o t r a n s p i r a t i o n f r o m t h e Sangue're' bas in i s much
h i g h e r t han t h e evapo t ransp i ra t i on f r o m t h e K a l l a i o bas in and t h i s
d i f f e r e n c e exp la i ns why t h e h i g h e r p r e c i p i t a t i o n produces a much lower
runoff . According t o t h i s exp lana t i on t h e l a r g e e x p l o i t a b l e groundwater
resource does n o t e x i s t .
The m d e l e s t i m t e s i n d i c a t e t h a t t h e evapo t ransp i ra t i on from
t h e Sangue're' bas in exceeds t h e evapo t ransp i ra t i on f r o m t h e K a l l a i o bas in
b y 348 mm/year. Th is excess may i n c l u d e an e r r o r o f 54 mm/year, t h e
d i f f e r e n c e between t h e annua 1 va lues o f accumulated changes i n bas in
storage, and does i n c l u d e t h e e f f ec t s o f t h e 206 m / y e a r d i f fe rence i n
p r e c i p i t a t i o n . The r e m i n d e r o f 88 mm/year i s a t t r i b u t a b l e t o t he way
t h a t Sangugre' bas in p rov ides c o n d i t i o n s f a v o u r i n g evapo t ransp i ra t i on a t
t h e expense o f r u n o f f i n comparison w i t h t h e K a l l a i o basin. I n o r d e r o f
i nc reas ing p l a u s i b i l i t y t h e poss ib l e reasons f o r t h i s d i f f e r e n c e a re :
(1 ) The sur face o f t he Sangugre' bas in m y be m r e perv ious than t h e
K a l l a i o bas in so t h a t m r e water i n f i l t r a t e s i n t o s o i l mo i s tu re
storage. Th i s cou ld account f o r t h e d i f f e r e n c e between t h e va lues
o f maximum s to rage accumulat ion b u t i s n o t c o n s i s t e n t w i t h t he low
r u n o f f f rom t h e K a l l a i o bas in d u r i n g t h e f i r s t t h r e e m n t h s o f t h e
wet season.

(2) The n e t r a d i a t i o n i s h igher f o r t he Sangue'r6 basin than f o r t he
K a l l a i o basin and the increased a v a i l a b i l i t y o f energy f o r
evapot ransp i ra t ion may have increased the a v a i l a b i l i t y o f water f o r
evapotranspi rat ion.
( 3 ) The water t a b l e i n t he Sangu6r6 basin may be c lose enough t o the
surface to supply water f o r s i g n i f i c a n t s o i l evaporat ion dur ing t h e
long r a i n l e s s season. However t h e r e i s some doubt t h a t the
saturated zone would cont inue to supply water f o r evapot ransp i ra t ion
i n excess o f r a i n f a l l dur ing the f i r s t t h ree months o f the wet
season as shown i n F ig. 6.
( 4 ) Some vegeta t ion i n the Sangue're' basin may be deeper rooted than any
vegetat ion i n the K a l l a i o basin and may the re fo re draw water from
greater depths. This i s compatible w i t h the tendency i n F ig. 6 f o r
the evapot ransp i ra t ion f r o m the Sangue'r6 basin to exceed r a in fa 11
du r ing the d r y season and the f i r s t t h ree months o f the wet season
wh i l e the evapot ransp i ra t ion from the K a l l a i o basin f o r the same
pe r iod remains equal t o the r a i n f a l l . Note t h a t the change i n
storage f rom the end o f October t o the end o f June f o r the Ka l la i 0
basin i s n e g l i g i b l e whereas f o r t he Sangu6r6 basin i t i s
a p p r o x i m t e l y equal to the d i f f e r e n c e i n annua 1 evapot ransp i ra t ion
between the two basins l ess the d i f f e r e n c e i n annual p r e c i p i t a t i o n
( i .e. 142 mm/year).

The o n l y r e a l i s t i c basis f o r hyd ro log i ca l fo recas ts i s an
accurate est imate o f t he antecedent moisture o r the amount o f water
s to red i n the s o i l , rock, snowpack, swamps and lakes o f the basin a t the
beginning o f the fo recas t period. The water s tored i n snowpacks can be
est imated from snow surveys and the water s to red i n the lakes can be
est imated from water l e v e l gauges bu t t he f i n a n c i a l and human resources
requ i red t o moni tor t h e water s to red i n t he s o i l , rock and swamps o f even
a smal l basin a r e too horrendous to contemplate. However the v a r i a t i o n s
i n t o t a l basin storage can be fo l lowed o n a r e a l t i w e basis by combining
the water balance w i t h independent est imates o f a rea l
evapotranspi rat ion. The bas in storage i s computed by se lec t i ng an
a r b i t r a r y i n i t i a l value and then accumulating the water balance est imates
o f storage change, i.e. p r e c i p i t a t i o n ( P ) less r u n o f f ( Q ) l ess a r e a l
evapot ransp i ra t ion (ET) .
Fig . 7 has been prepared to dermnstrate how the concept o f basin
storage can prov ide a bas is f o r rea l - t ime forecast ing. The data a r e f o r
t h e T u r t l e R iver near Mine Centre, a r i v e r t h a t f lows i n t o Rainy Lake on
the Ontario-Minnesota boundary. The area 1 evapot ransp i ra t ion was
est imated f r o m data a t Atikokan, Ontario, t h e same s t a t i o n used f o r the
Upper Rainy est imates i n Table I. The c i r c u l a r po in t s i n the upper h a l f -
o f F ig . 7 show the month-to-month v a r i a t i o n s i n basin storage f o r a 9
year period. The v e r t i c a l d is tances i n t he shaded area under the l i n e

j o i n i n g these p o i n t s represen ts t h e water s to red i n s o l i d fo rm i n t h e
snow cover a s es t imated f rom snow surveys, and t h e 1 i n e under t h e shaded
area represents t h e bas in s torage w i t h t h e snow cover water con ten t
remved. The l ack o f any s i g n i f i c a n t upward o r downward t r e n d o v e r t h e 9
year pe r i od i n d i c a t e s t h a t c o n s i s t e n t e r r o r s i n t h e p r e c i p i t a t i o n , runof f
o r a r e a l evapo t ransp i ra t i on a r e e i t h e r v e r y smal l o r compensatory.
Equat ions t h a t r e l a t e t h e r u n o f f f o r seasona 11 y de f i ned pe r i ods
o f f r om one t o f o u r months t o t h e t o t a l bas in s torage a t t he beginn ing o f
the p e r i o d (ad jus ted e m p i r i c a l l y f o r any ev iden t t ime t r end ) and t h e
p r e c i p i t a t i o n l e s s evapo t ransp i ra t i on d u r i n g t h e p e r i o d u s u a l l y have
regress ion c o e f f i c i e n t s t h a t a r e h i gh1 y s i g n i f i c a n t . However, when t h e
equat ions a r e used i n t h e fo reca .s t ing mode, u s i n g long- term average
values o f p r e c i p i t a t i o n l e s s evapo t ransp i ra t i on as inpu t , t h e r e s u l t s a r e
d isappo in t ing . P a r t o f t h e problem i s t h e reg ress ion approach w i t h i t s
requirements f o r f i x e d seasonal t ime pe r i ods and f o r many more years o f
data than t h e r e a r e years o f record. Holecek (1982) r e p o r t s good r e s u l t s
i n p r e d i c t i n g r u n o f f responses t o s p e c i f i c p r e c i p i t a t i o n and snowmelt
events f o r Sp r i ng Creek (see Table I), u s i n g a r e l a t i o n s h i p between
e f f e c t i v e drainage area and t o t a l bas in storage. The r e l a t i o n s h i p i s
h i g h l y non - l i nea r and t h i s r e l a t e s t o an tohe r major problem; i.e. t h a t
t he t o t a l bas in s torage inc ludes s o l i d s to rage i n t h e snow, t e n s i o n
s to rage i n t h e unsa tu ra ted s o i l and g r a v i t y s torage i n t h e lakes and i n
t h e sa tu ra ted groundwater zone, and t h a t each o f these d i f f e r e n t t ypes o f
s to rage have d i f f e r e n t e f f ec t s o n t h e runof f . A g raph i ca l technique f o r
a m l y z i n g these d i f f e r e n t e f f e c t s has been presented b y Klemes (1982) and
i s d iscussed b r i e f 1 y i n subsequent paragraphs.
The c i r c u l a r p o i n t s i n t h e lower h a l f o f F ig . 7 a r e t h e
accumulated va lues o f p r e c i p i t a t i o n ( P ) l e s s evapo t ransp i r a t i on (ET) -
l e s s t h e long- term average r u n o f f ( Q = t o t a l r u n o f f f o r 9 years d i v i d e d
b y 108 p e r i o d s ) s t a r t i n g f r o m a n a r b i t r a r y i n i t i a l va lue. The v e r t i c a l I
d is tances i n t h e shaded area under t h e l i n e j o i n i n g these p o i n t s
r ep resen t s t h e wate r s t o r e d i n t h e snow pack a s es t ima ted f r om snow
surveys. Thus t h e l i n e under t h e shaded area and through t h e c i r c u l a r
p o i n t s o f t h e snow-free season rep resen t s a r e s i d u a l mass curve o f t h e
n e t l i q u i d i n p u t s to bas in s to rage w i t h r espec t t o t h e l ong t e rm average
runof f . S i m i l a r i l y t h e 1 i n e through t h e t r i a n g u l a r p o i n t s represen ts t h e
mass curve o f o u t p u t s f r o m bas in s to rage ( Q = r u n o f f ) w i t h r espec t t o t h e -
long- term average r u n o f f (Q ) . The s lopes o f t h e mass curves rep resen t
t h e r a t e s o f n e t i n p u t o r o u t p u t w i t h r espec t to Q and t h e d i f f e r e n c e s
between t h e mass curves o f n e t i n p u t and o u t p u t a r e t h e bas in s torage
( w i t h o u t snowcover water con ten t ) to a datum s p e c i f i e d by t h e d i f f e r e n c e
i n i n i t i a l values. Note t h a t t h e pr ime reason f o r i n c l u d i n g 6 i s t o keep
t h e mass curves h o r i z o n t a l o v e r t h e 9 year per iod .
The d i f f e rence between t h e i n i t i a l va lues o f t h e n e t i n p u t and
t h e o u t p u t mass curves has been se lec ted by t r i a l - a n d - e r r o r t o a i d i n
d i s c r i m i n a t i n g between t ens ion and g r a v i t y storage. Thus d u r i n g m s t o f
t h e 9 years i t can be n o t i c e d t h a t :
(1 ) An increase i n ne t i n p u t when the n e t i n p u t mass curve i s above t h e
o u t p u t mass curve produces an increase i n ou tpu t because i t augments
g r a v i t y storage.
(2 ) A decrease i n ne t i n p u t when the n e t i npu t mass curve i s above the
ou tpu t mass curve has an i n s i g n i f i c a n t e f f e c t on t h e ou tpu t because
i t depletes tens ion storage.
( 3 ) A decrease i n n e t i n p u t when the n e t i n p u t mass curve i s below the
ou tpu t mass curve produces a decrease i n ou tpu t because i t depletes
g r a v i t y storage.
( 4 ) An increase i n ne t i npu t when the n e t i n p u t mass curve i s below the
ou tpu t mass curve has an i n s i g n i f i c a n t e f f e c t on t h e o u t p u t because
i t augments tens ion storage.
(5) As suggested by Klemes (1982) t h e d i f ference between t h e i n i t i a l
values o f t he two mass curves i s approximate ly equal t o t h e average
bas in storage (w i thout snow cover water content) , as de f ined by the
l i n e i n the upper h a l f o f F ig. 7, and the a r b i t r a r y i n i t i a l s t a r t i n g
po in t .
Tendencies ( 1 ) t o ( 4 ) i n c l u s i v e a r e masked t o some ex ten t by sur face
r u n o f f f r o m smal l saturated areas near t h e stream channels, by e r r o r i n
t h e snow cover water content and by e r r o r i n t h e p r e c i p i t a t i o n ,
evapot ransp i ra t ion and r u n o f f inputs.

Fig. 8 has been prepared i n t h e same way as F ig. 7. The bas in
s to rage and t h e mass curves a r e f o r t he Humber R ive r a t E lder M i l l s , a
basin t h a t i s loca ted a s h o r t d is tance west o f Toronto, Ontar io (see
Table I ) . The deduct ions made f r o m F ig. 7 app l y a l so t o F ig. 8 a l though
the r e s u l t s f o r the Humber basin a r e compl icated t o some ex ten t by
snowmelt dur ing t h e w i n t e r months and by the smal l bu t no t i ceab le
response o f r u n o f f t o t h e f a l l r a i n s when the ou tpu t mass curve i s h i g h e r
than t h e n e t i n p u t mass curve. Th is l a t t e r response, which i s be l ieved
due t o sur face r u n o f f f rom smal l sa tu ra ted areas near the stream
channels, i s most no t i ceab le dur ing t h e autumn o f 1972.
The k i n d o f a n a l y s i s presented i n Figs. 7 and 8 has obv ious
app l i ca t i ons . Thus the amount by which t h e ou tpu t mass curve exceeds the
n e t i n p u t mass curve represents t h e amount o f s torage t h a t must be
rep len ished before t h e ou tpu t ( r u n o f f ) w i l l respond i n a s i g n i f i c a n t way
to increases i n ne t i n p u t ( p r e c i p i t a t i o n l ess evapot ransp i ra t ion) and t h e
amount by which t h e i n p u t mass curve exceeds the o u t p u t mass curve
represents t he amount o f s torage t h a t must be depleted before t h e o u t p u t
w i l l respond i n a s i g n i f i c a n t way t o decreases i n n e t inpu t . Thus the
d is tance between the two mass curves prov ides an e x c e l l e n t es t imate o f
antecedent mo i s t u r e which, when combined w i t h average seasona 1 va lues o f
p r e c i p i t a t i o n l e s s evapotranspi rat ion, can prov ide the bas is f o r
rea l - t ime forecasts. App l i ca t i ons o f t h i s p o t e n t i a l i t y would be more
u s e f u l and i n fo rma t i ve i f based o n weekly t ime per iods r a t h e r than
monthly t ime per iods.
The graphical approach has two additional practical advantages.
These are: ( 1 ) t h a t forecasting can begin o n a tentative basis with o n l y
a few years of'data a n d , ( 2 ) t h a t i t i s easy t o detect a n d correct for
errors in the input da ta near the time when they occur. Klemes (1982)
has provided a n example of the la t ter capability a n d Fig. 8 provides
another. Thus there must have been a n error exceeding 50 mm during 1978
because, with the input mass curve higher t h a n the o u t p u t mass curve
during the a u t u m n of 1977 a n d the a u t u m n of 1978, the o u t p u t responded to
a n increased net input during the former period a n d did n o t respond t o a n
increased net input during the la t ter period. A possible explanation was
the loss of a key precipitation station during 1978 a n d i t s replacement
by another some distance away.
Fig. 9 demnstrates the m s t serious impediment to the use o f
basin storage for runoff forecasts, i.e. the accumulation o f small
consistent errors in the precipitation, evapotranspiration or runoff
inputs to produce a trend t h a t prevents realist ic year-to-year
comparisons o f basin storage. The trace for the Humber River a t Elder
Mills i s the same as t h a t shown in t o p half of Fig. 8 a n d the lack of a n y
significant upward or downward trend in basin storage over the 14 years
indicates t h a t consistent errors in the precipitation, runoff a n d area 1
evapotranspiration components are either very srnall o r compensatory.
Therefore the seasonal a n d annual variations in basin storage should
provide a real is t ic basis for runoff forecasts. The Conestogo River
a t /abve Drayton i s in the snowbelt of southwestern Ontario so t h a t the
seasonal v a r i a t i o n s i n bas in storage, which i nc l udes snowpack storage,
a r e much g r e a t e r than those f o r t he Humber R iver . There i s a d i s t i n c t
upward t r e n d f o r t h e Conestogo bas in s torage p r i o r to 1972 which cou ld
have been caused b y a n e r r o r o f l e s s t han 4 percen t i n p r e c i p i t a t i o n ,
6 percen t i n evapo t ransp i ra t i on o r 9 percen t i n runoff . That t h e e r r o r
was i n t h e r u n o f f component i s e v i d e n t i n t h e lack o f t r e n d i n t h e bas in
s torage du r i ng t h e f i v e years f o l l o w i n g December, 1972, when t he
streamflow gauging s t a t i o n was moved upstream o u t o f t h e backwater from
the Conestogo Reservo i r .
The s e n s i t i v i t y o f bas in s to rage t o minor e r r o r s i n any one o f
the water balance components i s t h e most se r i ous h indrance t o i t s use i n
runof f forecasts , a g r i c u l t u r a l f o r e c a s t s o r f i r e hazard f o recas t s .
l-bwever, i t s p o t e n t i a l i t i e s a r e so g r e a t t h a t t h e t ime and e f f o r t neeaed
t o so lve t h e problem would be w e l l wor thwhi le . The most obv ious and
expensive s o l u t i o n would be to make an annual c o r r e c t i o n t h a t i s based o n
a concentrated l a t e summer survey o f t h e wate r s to red i n t h e s o i l ,
aqu i f e r s , lakes and swamps o f t h e basin. F u r t h e r i n v e s t i g a t i o n s a r e
r e q u i r e d f o r more economic a l t e r n a t i v e s b u t a t t h e p resen t t ime t h e bes t
approach seems t o be t h e k i n d o f g r a p h i c a l d e t e c t i o n and c o r r e c t i o n
suggested i n t h e d i scuss ion o f F igs . 7 and 8.
The discussion of Fig. 9 dea l t w i t h the s e n s i t i v i t y of computed
basin storage to small consis tent e r r o r s i n measuring o r estimating the
p rec ip i t a t ion , runoff o r a r ea l evapotranspiration components of the water
balance. A1 though the negative aspects were s t ressed there a r e posi t ive
aspects a s we1 1. For example, changes in the trend o f basin storage t h a t
a r e s imi lar to those shown f o r the Conestogo basin i n F i g . 9 can be used
to a l e r t hydrometric o r meteorological organizations to the development
of possible e r ro r s o r inconsistencies i n t h e i r data. Further.mre, they
may be used a l so to detect the e f f e c t s o f changes i n land use i n the
basin.
F i g . 10 shows changes i n basin storage over a 14 year period f o r
three r i ve r s i n the western o u t s k i r t s of Toronto. The a rea l
evapotranspiration est imates used i n the computation of basin storage a r e
the same fo r a l l three basins, being based on temperature and h u m i d i t y
observations a t Toronto International Airport. The t race of basin
storage f o r the Humber River a t Elder k i l l s is the same a s t h a t shown i n
F i g . 9 although drawn to a d i f f e r en t scale . The basin above Elder Mills
i s s t i l l la rgely rura l and the t race of basin storage i s included i n
F i g . 10 merely to demonstrate t h a t there were no s ign i f i can t changes i n
the a rea l evapotranspiration est imates a t Toronto International Airport
o r i n the water balance o f the basin between 1965 and 1979. The Mimico
Creek and Etobicoke Creek basins were s t i l l la rgely rura l i n 1965 and
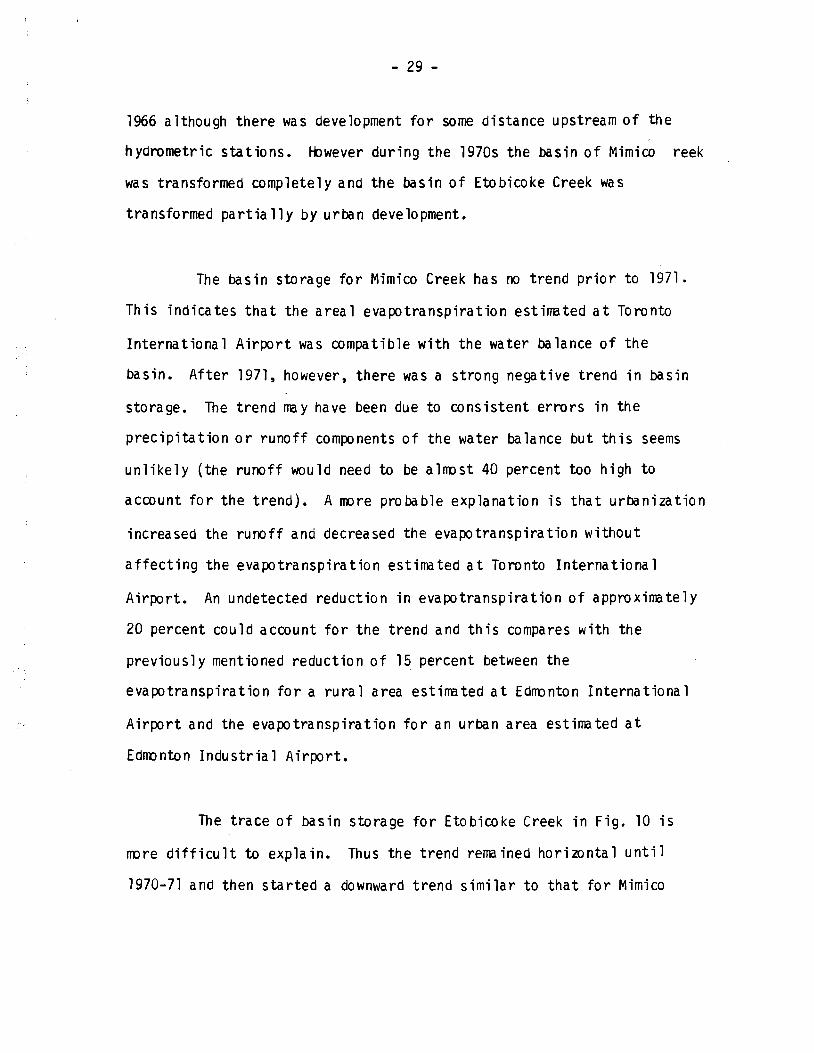
1966 although there was development for some distance upstream of the
hydrometric stations. However d u r i n g the 1970s the basin of Mimico reek
was transformed completely and the basin of Etobicoke Creek was
transformed par t ia l ly b y urban development.
The basin storage for Mimico Creek has no trend prior to 1971.
This indicates tha t the areal evapotranspiration estimated a t Toronto
International Airport was compatible w i t h the water balance of the
basin. After 1971, however, there was a strong negative trend i n basin
storage. The trend may have been due to consistent errors i n the
precipitation o r runoff components of the water balance b u t t h i s seems
unlikely (the runoff would need to be almost 40 percent too h i g h to
account fo r the trend). A more probable explanation i s that urbanization
increased the runoff and decreased the evapotranspiration without
affect ing the evapotranspiration estimated a t Toronto Internationa 1
Airport. An undetected reduction i n evapotranspiration of approximately
20 percent could account for the trend and t h i s compares w i t h the
previous1 y mentioned reduction of 15 percent between the
evapotranspiration for a rural area estimated a t Edmnton International
Airport and the evapotranspiration for a n urban area estimated a t
Edmnton Industrial Airport.
The trace of basin storage for Etobicoke Creek i n Fig. 10 i s
more d i f f icu l t t o explain. Thus the trend remained horizontal unt i l
1970-71 and then started a downward trend similar to that for Mimico

Creek. Unlike Mimico Creek, however, the trend became horizontal again
i n 1972-73. This means that there were two lengthy periods with balanced
water balances separated by a two-year transition period. If the
transition was real , i.e. i f i t was no t caused by an error in
precipitation o r runoff that was la ter corrected, i t may have been due to
some permanent reduction i n stored water associated w i t h urban pressures,
such a s the drainage of large swamps o r the lowering of the water table.
As the decrease i n basin storage was approximately 200 millimetres the
volume permanently abstracted from storage would have been a b u t 40
million cubic metres.
The trace of basin storage for the Castor River near Ottawa,
Ontario, i s no t shown. I t has a similar appearance to that for Mimico
Creek in that a strong negative trend developed a f t e r about f ive years
w i t h no trend. There i s a good chance that the negative trend a f t e r 1972
was due to a change in land use in the basin from pasture and h a y
production to corn cultivation with t i l e drainage. However, the
development of e r ror in the evapotranspiration estimates cannot be ruled
out a s the humidity inputs during the period of negative trend appear to
be to0 high.
A comparison of the resul t s shown in Table I fo r the Waikato
River i n New Zealand and the James River i n Missouri i s very interesting

f r o m a hyd ro log i ca l p o i n t o f view. The two basins a r e rough l y
e q u i d i s t a n t f r o m t h e equator and the re i s an approximate e q u a l i t y i n both
the model and the water budget est imates o f bas in evapot ransp i ra t ion .
Th is seems p e c u l i a r i n t h e l i g h t o f a d i f f e r e n c e o f more than 700 mm/year
between the p r e c i p i t a t i o n f o r t he Waikato R ive r and the p r e c i p i t a t i o n f o r
t he James River . Thus t h e evapotranspi rat ion, which i s rough ly t he same
f o r both basins, i s o n l y 44 percent o f the p r e c i p i t a t i o n f o r t he Waikato
bas in compared w i t h 77 percent f o r t he James basin. The more mountainous
nature o f the Waikato bas in prov ides a p a r t i a l exp lanat ion because i t
would favour r u n o f f a t t he expense o f evapotranspi rat ion. However t he
main reason f o r the anomaly i s t h a t the Waikato basin has a mar i t ime
c l ima te w i t h low r a d i a t i o n and a w i n t e r p r e c i p i t a t i o n maximum whereas t h e
James basin has a con t i nen ta l c l imate w i t h h igh r a d i a t i o n and a summer
p r e c i p i t a t i o n maximum. The d i f f e r e n c e i n r a d i a t i o n i s o f most i n t e r e s t
because the p r e c i p i t a t i o n on the James R ive r basin du r i ng the s i x months
c l o s e s t t o t h e summer s o l s t i c e i s o n l y about 80 percent o f t h a t f o r the
h'aikato R iver bas in desp i te the d i f f e r e n c e i n p r e c i p i t a t i o n pa t te rns .
F igure 11 i s a p l o t o f t he monthly mean CRAE model ou tpu ts f o r
t he h'aikato and James basins. The s o l i d l i n e i s t he a r e a l
evapot ransp i ra t ion , t h e dashed l i n e i s t he p o t e n t i a l evapot ransp i ra t ion
and the do t ted l i n e i s t he evaporat ion equ i va len t o f the ne t r a d i a t i o n
t h a t would have occur red w i t h t he sur face a t a i r temperature. The t ime
scale f o r t he Waikato bas in i s o f f s e t by s i x months t o make the seasonal
v a r i a t i o n s comparable w i t h those o f t he James basin i n the oppos i te

hemisphere. I n t h e wet mar i t ime c l i m a t e o f t h e Waikato bas in t h e area 7
evapo t ransp i ra t i on i s o n l y s l i g h t l y lower t han t he n e t r a d i a t i o n and
p o t e n t i a l evapo t ransp i ra t i on whereas i n t h e d r i e r c o n t i n e n t a l c l i m a t e o f
t h e James bas in i t i s w e l l below the n e t r a d i a t i o n and much below
p o t e n t i a l evapo t ransp i ra t ion . The approximate e q u a l i t y i n d is tance from
t h e equato r s i m p l i f i e s comparison and ana l ys i s . According t o t h e
complementary r e l a t i o n s h i p , one h a l f o f t h e sum o f t h e p o t e n t i a l and
a r e a l evapo t ransp i ra t i on i s t h e wet environment a r e a l evapo t ransp i ra t ion ,
o r t he energy a v a i l a b l e f o r evapo t ransp i ra t i on f r om a l a r g e area, ana t h e
a i f fe rence between t h e wet environment and t h e ac tua 1 a rea 1
evapo t ransp i ra t i on i s t he a r e a l water d e f i c i t , o r t h e r e d u c t i o n i n area 1
evapo t ransp i ra t i on caused by l ack o f water. On an annual bas i s t h e
energy a v a i l a b l e f o r evapo t ransp i ra t i on from t h e James bas in exceeds t h a t
f o r t h e Waikato bas in by 33 percent and t h i s presumably i s t h e most
impor tant f a c t o r coun te rac t i ng t h e e f f e c t s o f t he 41 percen t d i f fe rence
i n annual p r e c i p i t a t i o n . Furthermore, t h e a r e a l water d e f i c i t s f o r t he
James and Waikato bas ins were 350 and 90 mm/year r e s p e c t i v e l y so t h a t a
p r e c i p i t a t i o n d i f f e r e n c e o f 725 mm/year produced an evapo t ransp i ra t i on
d i f f e r e n c e o f 260 mm/year. The l a t t e r d i f f e r e n c e would be l a r g e r if both
bas ins had a c o n t i n e n t a l p r e c i p i t a t i o n pa t t e rn , which would increase
s l i g h t l y t he Waikato bas in evapo t ransp i ra t i on ; o r i f both bas ins had a
mar i t ime p r e c i p i t a t i o n pa t t e rn , which would decrease s i g n i f i c a n t l y t h e
James bas in evapot ransp i ra t ion .

Other- O p ~ r t u n i t i e s :
The fo rego ing d i scuss ion has demonstrated how o p e r a t i o n a l
es t imates o f a r e a l evapo t ransp i ra t i on p rov ided by t h e l a t e s t v e r s i o n o f
t h e CRAE models can be used t o r e v i t a l i z e t h e sc ience and p r a c t i c e o f
hydrology. T h i s w i l l be due ma in l y to t h e inc rease i n knowledge and
understanding t h a t can r e s u l t from r e 1 i a b l e independent es t imates o f what
has been, u n t i l now, t h e l a r g e s t and most i n t r a c t a b l e unknown i n t h e
wate r balance. However i t w i l l a l s o r e s u l t f r om t h e use o f such
es t imates to p rov ide a r e l i a b l e bas i s f o r hyd ro log i ca l , a g r i c u l t u r a 1 and
f i r e hazard f o recas t s ; f o r d e t e c t i n g t h e development o f e r r o r s i n
hydrometeoro log ica l records; and f o r d e t e c t i n g and mon i t o r i ng t h e e f f e c t s
o f l and use changes. There a r e o t h e r more obv ious a p p l i c a t i o n s t h a t have
n o t been discussed. Thus independent e s t imates o f evapo t ransp i ra t i on can
be used t o es t ima te groundwater recharge and t o es t imate t h e long-term
average r u n o f f f r o m c l i m a t o l o g i c a l r eco rds i n r eg ions where hyd rome t r i c
r eco rds a r e n o t a v a i l a b l e . Furthermore t h e y cou ld be i nco rpo ra ted i n t o
watershed mode l l i ng systems where t h e y would n o t o n l y be more r e l i a b l e
t han those produced by t h e convent iona l techniques b u t would a l s o pe rm i t
a more r i g o r o u s a p p r a i s a l o f t h e o t h e r moael components by s u b s t a n t i a l l y
r educ ing t h e number o f c o e f f i c i e n t s t h a t must now be aetermined by
fudging.
The use o f t h e complementary r e l a t i o n s h i p t o p rov ide o p e r a t i o n a l
es t imates o f l ake eyapora t ion and n e t r e s e r v o i r e v a p o t r a t i o n f r o m r o u t i n e

climatological observations in the land environment i s presented in a
companion paper (Morton, 1982e).
Probably the greatest human constraint to the use of the
complementary relationship and the CRAE models i s that the apparent
in t rac tabi l i ty of the evapotranspiration problem has caused education and
research in hydrology to be focused on a few narrow f i e lds of interest so
that most engineers and hydrologists, including the author, find i t
d i f f i cu l t to visualize the sudden expansion in topics that are now open
for study and research with a reasonable probability of success.
The major long-term conceptual limitation to the use of
complementary relationship models i s tha t the evapotranspiration i s
estimated from i t s e f fec ts rather than i t s causes. Therefore, although
they can be used to detect and monitor the hydrometeorological effects of
climatic o r land-use changes, they cannot be used to predict them. To
make such predictions would require knowledge of the complex processes
and interactions in the so i l-plant-atmosphere continuum and i t seems
unlikely that such knowledge will be available in useable form within the
next generation (Morton, 1982a). In t h i s context i t would appear that
the greatest long-term contribution of the complementary relationship
models will be to supply the frame of reference and the re l iab le
estimates of actua 1 evapotranspiration that are needed for research on
the processes and interactions and fo r the development of causal models.
CONCLUSIONS
The conceptual and f a c t u a l bases f o r t he complementary
r e l a t i o n s h i p between potent ia 1 and a r e a l evapot ransp i ra t ion and the
s u p e r i o r i t y o f t h e r e l a t i o n s h i p t o o t h e r hydrometeorological concepts
have been documented elsewhere (Morton, 1982a, 1982b). The fo rmu la t i on
o f a model t h a t uses t h e complementary r e l a t i o n s h i p t o prov ide
opera t iona l est imates o f a r e a l evapot ransp i ra t ion f r o m r o u t i n e
c l i m a t o l o g i c a l observat ions w i t h no l o c a l o p t i m i z a t i o n o f c o e f f i c i e n t s
hhs beer; documented i n another companion paper (Morton, 1982c) and the
r e s u l t s o f a t e s t procedure t h a t compares model est imates w i t h water
budget est imates f o r r i v e r basins i n a wide v a r i e t y of environments a r e
presented here in . The preceding sec t i on i nd i ca tes how t h e a b i l i t y t o
make r e l i a b l e ope ra t i ona l est imates o f evapot ransp i ra t ion can be a b i g
fac to r i n overcoming t h e c u r r e n t s t e r i l i t y o f hydro log ic research and
p rac t i ce and i n p rov id ing the frame o f reference and in format ion needed
t o transform hydro logy f rom a d e s c r i p t i v e t o a p r e d i c t i v e science.
I t has been noted t h a t the use o f the complementary r e l a t i o n s h i p
and the CRAE models i s constra ined by t h e f a i l u r e o f hyd ro log i s t s and
engineers to understand how the science and p r a c t i c e o f hydro logy have
been stunted by the lack o f r e l i a b l e ope ra t i ona l est imates o f
evapot ransp i ra t ion and to v i s u a l i z e how the a v a i l a b i l i t y o f such
est imates can suddenly expand the hor izons o f hydro logy and the range o f
problems t h a t can be addressed, s tud ied and solved. A r e l a t e d problem i s

Morton, F.I., 1.982e. Operat ional est imates o f lake evaporat ion,
Th i s issue.
Morton, F.I., b a r d , R. and J. Piwwar, 1980. Programs REVAP and WEVAP
f o r es t imat ing a r e a l evapot ransp i ra t ion and lake evaporat ion
f r o m c l i m a t o l o g i c a l observat ions, NHRI Paper No. 12, I n land
Waters D i rec tora te , Environment Canada, Ottawa.
Nouvelot, J.F., 1973. Hydrologie des mayos du Nord-Came.roun,
Cah. O.R.S.T.O.M., Ser. Hydrol., X(3) , pp. 211-301.
- 39 -
TITLES FOR FIGURES
F i g . 1 Comparison o f evapo ra t i on r a t e s ac ross i r r i g a t e d c o t t o n f i e l d s
o n December 27, 1963 (Davenport and Hudson, 1967).
F i g . 2 A rea l e v a p o t r a n s p i r a t i o n f o r t h e southern Un i t ed S ta tes d u r i n g
t h e f i v e years ending September 30, 1965
F ig . 3 A rea l e v a p o t r a n s p i r a t i o n f o r t h e p a r t o f Canada t o t h e e a s t o f
t h e P a c i f i c D i v i d e d u r i n g t h e f i v e years ending December 31, 1969
F ig . 4 Comparison o f model w i t h wa te r budget es t ima tes o f a r e a l
e v a p o t r a n s p i r a t i o n f o r 143 r i v e r bas ins i n Nor th America,
A f r i c a , I r e l and , Aust ra 1 i a and New Zea land.
F i g . 5 Seasonal wa te r balance f o r s i x bas ins i n Nor th America
F ig . 6 Seasonal wa te r balances f o r two bas ins i n A f r i c a
F i g . 7 Bas in s to rage and mass curves o f i n p u t and o u t p u t f o r T u r t l e
R i ve r .
F i g . 8 Bas in s t o rage and mass curves o f i n p u t and o u t p u t f o r Humber
R ive r .

- 40 -
Fig. 9 Basin storage for Humber River 'and Conestoga River
Fig. 10 Basin storage for Humber River, Etobicoke Creek and Mimico Creek
Fig. 1 1 Seasonal distributions o f mdel outputs for James River in
Missouri and Waikato River in New Zealand


70° 170° 160' 150° 130' 110° 90' 7O06Oo5O0 40° 80°300 20' 70' lo0
r HYDROMETRIC STATION
120° 1 lo0 100° 90° 80° 70' 60°


MASS CURVES OF
o 0 PRECIPITATION
ORDINATES FOR THE MASS CURVES OF
EVAPOTRANSPIRATION
PRECIPITATION LESS EVAPOTRANSPIRATION
............ ............ RUNOFF ............
o---- -0 PREClPlTATlON LESS EVAPOTRANSPIRATION LESS RUNOFF
STORED WATER
1000 CREIGHTON TRIBUTARY T O BAD LAKE UPPER RAINY RIVER - NEAR ROSETOWN, SASKATCHEWAN AT FORT FRANCES. ONTARIO NEAR CHALK RIVER, ONTARIO
E 800
E - 600
Lw 2 0 400 a ............... E ............... ............... ........................... ..................... 0 ........................... ..................... ........................... ..................... .......................... .................... 0 200 .................. ................. .................. ................. .................. ................. ............ ............ ............ W ............ ............ ............ ............
C ' c ' j 3 i o d = & a W U O W ~ W * P * 0 4 : g w o o w a w a o . C g > j i 6 = = : L z g P k g j 3 i ~ = = > ~ * z a g m w o z o k z < 1 2 2 a w o z o - b ~ a ~ ~ ~ a w U 0 W % w 4 0 a w o z o ~ I U E ~ = U a I I I I I I I I I I I : 1200- BIG FOSSIL CREEK -
NEAR FORT WORTH, TEXAS NORTH RIVER
NEAR DES MOINES, IOWA
................ ................ ................
W-3 AT SLEEPERS RIVER NEAR DANVILLE, VERMONT
............. ............. ............. ................. ................. ................ ................. ....................... ....................... ....................... ...................... ............................ ............................ ............................ ............................... ............................... ............................... ............................... .................................... .................................... .................................... ...................... ..................... ..................... ..................... ............... ............... ............... ............... ............ ............ . . . . . . . . .

ORDINATES FOR THE MASS CURVES OF MASS CURVES OF
o o PRECIPITATION 1 ' 1 EVAPOTRANSPIRATION
............ ............ RUNOFF *-- o PRECIPITATION LESS EVAPOTRANSPIRATION
o---- -0 PRECIPITATION LESS EVAPOTRANSPIRATION LESS RUNOFF STORED WATER
KALLAIO RIVER AT MAROUA CAMEROON
10.6"N 14.3OE CAMEROON
9.2ON 13.5"E


z-' O' 30C , = I- Z n- Y n
2 OC


JAMES RIVER MISSOURI
37.2"N 93.2"W
r - r l I - ' I
I I r-r I i"'i I I . *
: : I I i"" ' k...: I . ..... ,
-4 :I - 1 i 1" I : i~ I i i ! i...' : -7
t - I
k' i..: I - I-. : I
I i i I I i i I E"" : . 1 E 1 1 ... I f 7 ;I
r< :I - 1 i Tl : I !...i : I
i I ..A - . .....
J F M A M J J A S O N D
WAIKATO RIVER NEW ZEALAND 37.6"s 175.1°E
-
..... . . . . -
- r.Tg i l :L -. -
9 I -**:I I: : I
:I
F ~ : 1: ... : -.1
I: I : I
- *'":I
..... .....
J A S O N D J F M A M J
LEGEND AREAL EVAPOTRANSPIRATION
............... NET RADIATION ___-- POTENTIAL EVAPOTRANSPIRATION