Operating the Sidestream Elevated Pool Aeration Stations to Meet ...
21
Operating the Sidestream Elevated Pool Aeration Stations to Meet the Proposed Water Quality Standards on the Calumet-Sag Channel Judith Moran, Thomas Minarik, Michael Sopcak, Heng Zhang, Samuel Dennison, Catherine O’Connor, and Thomas Granato Metropolitan Water Reclamation District of Greater Chicago Environmental Monitoring and Research Division
-
Upload
nguyenthien -
Category
Documents
-
view
215 -
download
0
Transcript of Operating the Sidestream Elevated Pool Aeration Stations to Meet ...

Operating the Sidestream Elevated
Pool Aeration Stations to Meet the
Proposed Water Quality Standards
on the Calumet-Sag Channel
Judith Moran, Thomas Minarik, Michael Sopcak, Heng Zhang, Samuel Dennison, Catherine O’Connor, and Thomas Granato
Metropolitan Water Reclamation District of Greater Chicago
Environmental Monitoring and Research Division
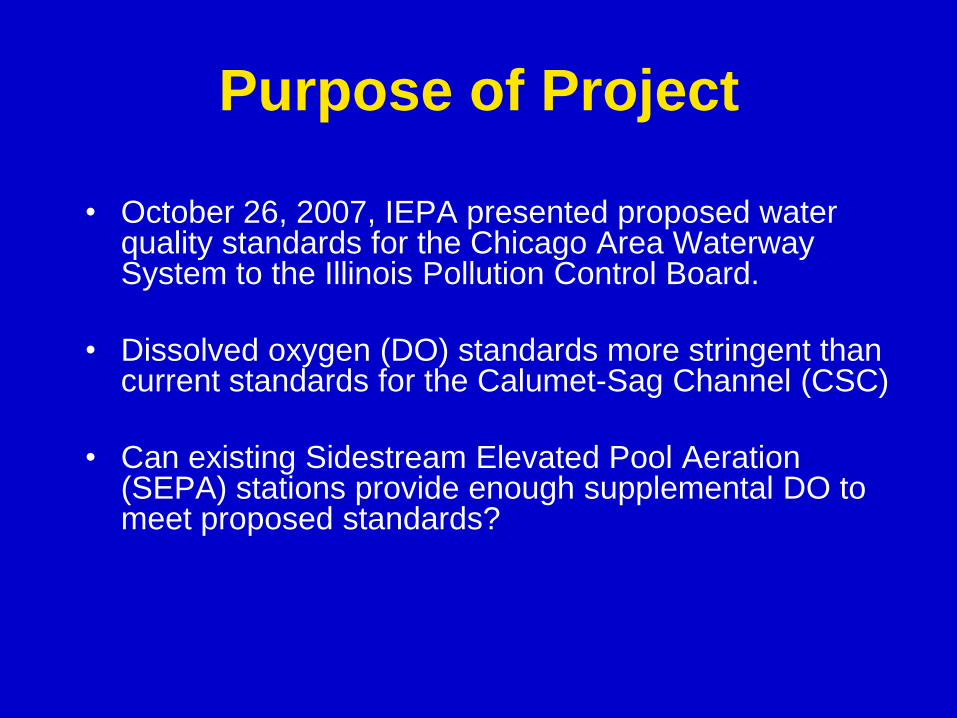
Purpose of Project
• October 26, 2007, IEPA presented proposed water quality standards for the Chicago Area Waterway System to the Illinois Pollution Control Board.
• Dissolved oxygen (DO) standards more stringent than current standards for the Calumet-Sag Channel (CSC)
• Can existing Sidestream Elevated Pool Aeration (SEPA) stations provide enough supplemental DO to meet proposed standards?

Presentation Overview
• Background– Description of Chicago Area Waterways (specifically CSC)
– Current and Proposed Standards for CSC
– SEPA Station Information
• Investigation Set-up
• Results– SEPA Station Performance
– Factors Affecting Performance
– Environmental Impacts of Meeting New Standards
• Summary

BackgroundChicago Area Waterways
0 1 2 3 4 5
Scale In Miles
LEGEND
Lock & Dam
Artificial Waterways CRIB
CRIB
DesPlainesRiver
LittleCalumetRiver
CalumetRiver
GrandCalumetRiver
LakeMichigan
NorthBranchChicagoRiver
CAL - SAG Channel
Sanitary &
Ship Canal
SouthBranch

BackgroundCSC, SEPA Stations
7 SEPA UWF 11.21.08

PUMPING
STATION
UPSTREAM
LOW
DISSOLVED
OXYGEN
LEVEL
DOWNSTREAM
INCREASED
DISSOLVED
OXYGEN
LEVEL
BAR
SCREEN
CASCADES
ELEVATEDPOOL
SOIL BANK
BackgroundSEPA Stations
SEPA Station 3: 4 pumps, practical max – 3 pumps/245.7 MGD
SEPA Station 4: 4 pumps, practical max – 3 pumps/232.8 MGD
SEPA Station 5: 5 pumps, practical max – 4 pumps/297.6 MGD

BackgroundSEPA Stations
1 2
3
4 5

BackgroundCurrent and Proposed Standards for CSC
Waterway Current
Year-Round
Proposed
March-July August-February
CSC 3.0 mg/L 5.0 mg/L
anytime
3.5 mg/L anytime,
4.0 mg/L as daily
minimum

Experimental Set-Up
• Four Events Event 1, Spring: 5/1/2008 to 5/21/2008
Event 2, Early Summer: 7/10/2008 to 7/31/2008
Event 3, Summer: 8/11/2008 to 8/22/2008
Event 4, Early Fall: 9/22/2008 to 10/3/2008
• Pump Operation Set Points Adjusted
• Monitoring Station Locations 6 stations along the CSC
3 stations along the Chicago Sanitary and Ship Canal (CSSC)
• Water Quality Monitoring DO, temperature, and conductivity
Continuous monitors – hourly measurement
YSI Model 6920 or Model 6600
Data downloaded weekly and reviewed for quality assurance according to the existing CDOM program (86% data recovery rate)

7 SEPA UWF 11.21.08
Experimental Set-UpMonitoring Stations
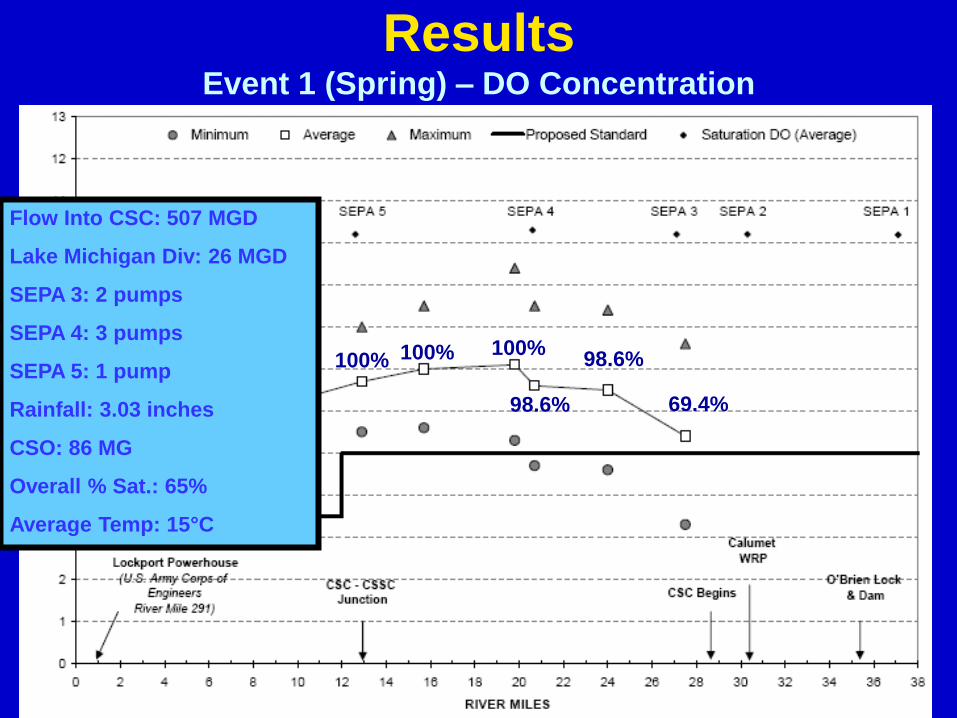
ResultsEvent 1 (Spring) – DO Concentration
69.4%
100%
98.6%
98.6%100%100%
Flow Into CSC: 507 MGD
Lake Michigan Div: 26 MGD
SEPA 3: 2 pumps
SEPA 4: 3 pumps
SEPA 5: 1 pump
Rainfall: 3.03 inches
CSO: 86 MG
Overall % Sat.: 65%
Average Temp: 15°C

ResultsEvent 2 (Early Summer) – DO Concentration
Flow Into CSC: 579 MGD
Lake Michigan Div: 280 MGD
SEPA 3: 3 pumps
SEPA 4: 3 pumps
SEPA 5: 3 pumps
Rainfall: 3.14 inches
CSO: 0 MG
Overall % Sat.: 78%
Average Temp: 25°C
80.5%
93.9%93.7%
95.3%
99.6%
79.1%

ResultsEvent 3 (Summer) – DO Concentration
Flow Into CSC: 640 MGD
Lake Michigan Div: 419 MGD
SEPA 3: 2 pumps
SEPA 4: 2 pumps
SEPA 5: 3 pumps
Rainfall: 0.09 inches
CSO: 0 MG
Overall % Sat.: 71%
Average Temp: 24°C
100%
100% 100% 100%100%

ResultsEvent 4 (Fall) – DO Concentration
Flow Into CSC: 876 MGD
Lake Michigan Div: 292 MGD
SEPA 3: 0 pumps
SEPA 4: 3 pumps
SEPA 5: 3 pumps
Rainfall: 0.06 inches
CSO: 0 MG
Overall % Sat.: 58%
Average Temp: 20°C
100%100%
100%
100% 100% 100%

ResultsDO Mass in CSC (Event 1)

ResultsElectricity Usage and Estimation of Emissions
Event
SEPA 3
Operating
(Additional)
SEPA 4
Operating
(Additional)
Total
Additional
Pumps
1 Spring 2 (1) 3 (2) 3
2 Early Summer 3 (2) 3 (2) 4
3 Summer 2 (1) 2 (1) 2
4 Early Fall 0 (0) 3 (1) 1
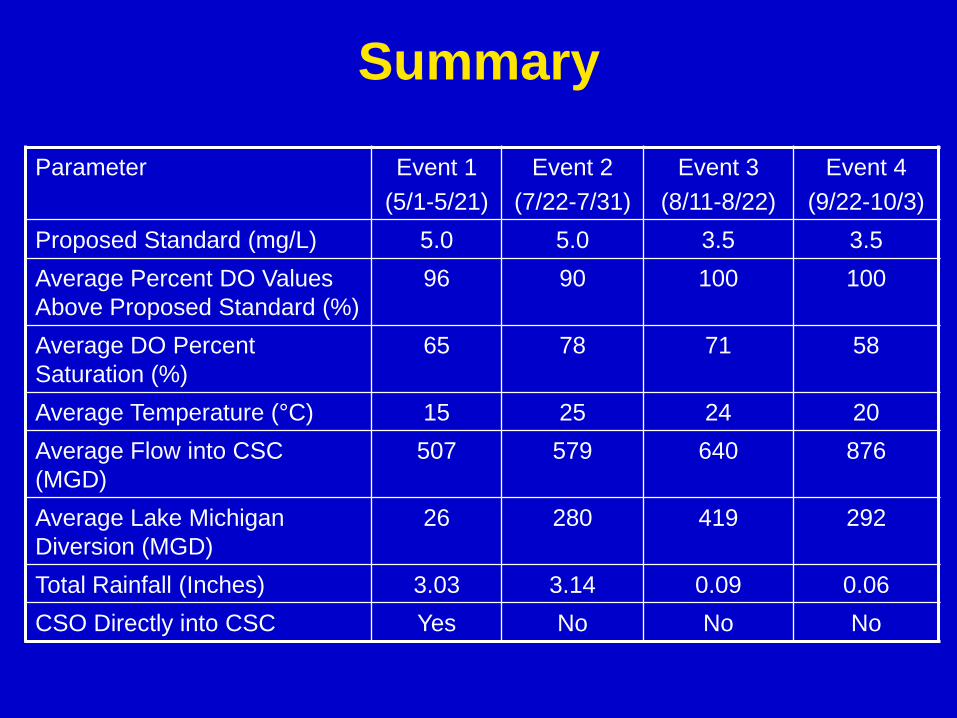
Summary
Parameter Event 1
(5/1-5/21)
Event 2
(7/22-7/31)
Event 3
(8/11-8/22)
Event 4
(9/22-10/3)
Proposed Standard (mg/L) 5.0 5.0 3.5 3.5
Average Percent DO Values
Above Proposed Standard (%)
96 90 100 100
Average DO Percent
Saturation (%)
65 78 71 58
Average Temperature (°C) 15 25 24 20
Average Flow into CSC
(MGD)
507 579 640 876
Average Lake Michigan
Diversion (MGD)
26 280 419 292
Total Rainfall (Inches) 3.03 3.14 0.09 0.06
CSO Directly into CSC Yes No No No

Summary
Parameter
Event 1
(5/1-5/21)
Event 2
(7/22-7/31)
Event 3
(8/11-8/22)
Event 4
(9/22-10/3)
Average O2 Added by
SEPAs 3 and 4
(metric ton/day)
5.8 3.5 2.8 3.2
Total Additional Pumps
Operated to Meet Proposed
Standards
3 4 2 1
Average O2 Transferred by
Additional Pumps
3.6 2.6 1.4 1.1
Electricity Used by
Additional Pumps
21.5 28.6 14.3 7.2
CO2 Produced by Additional
Pumps
11.9 15.8 7.9 4.0
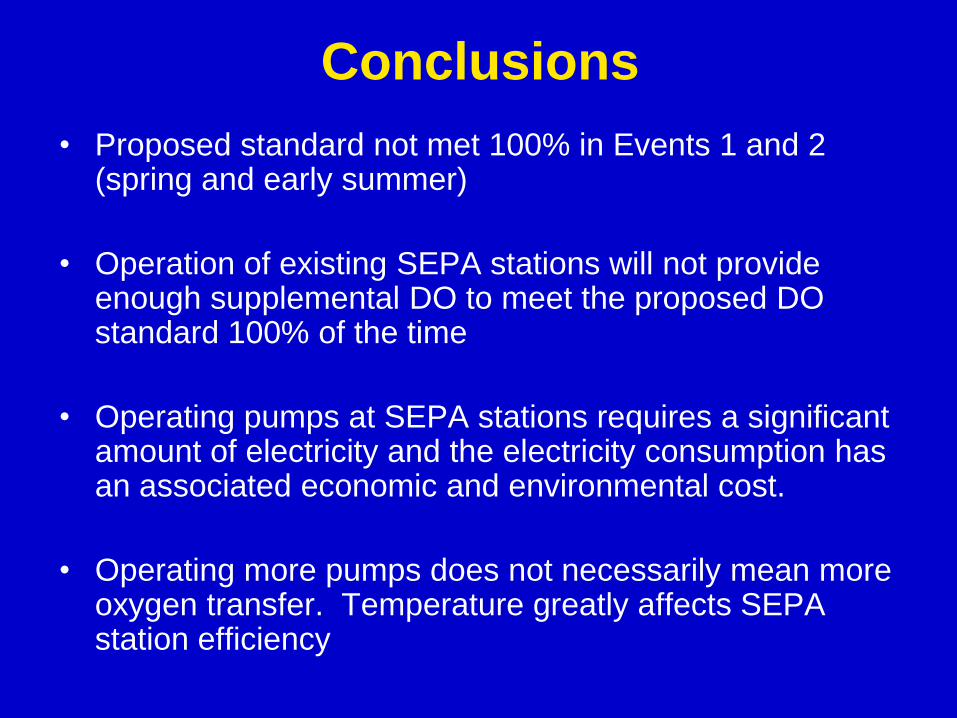
Conclusions
• Proposed standard not met 100% in Events 1 and 2 (spring and early summer)
• Operation of existing SEPA stations will not provide enough supplemental DO to meet the proposed DO standard 100% of the time
• Operating pumps at SEPA stations requires a significant amount of electricity and the electricity consumption has an associated economic and environmental cost.
• Operating more pumps does not necessarily mean more oxygen transfer. Temperature greatly affects SEPA station efficiency
Thanks to….
• Mr. David Tank and staff from the Maintenance and
Operation Department for operation of the SEPA stations
according to study plan
• Industrial Waste Division who deployed and retrieved the
water quality monitors
• Aquatic Ecology and Water Quality Section for data
downloading and maintenance of monitors

Questions?