OpenSees Development and Validation Efforts at...
27
OpenSees Development and Validation Efforts at UW Laura N. Lowes University of Washington
Transcript of OpenSees Development and Validation Efforts at...

OpenSees Development and Validation Efforts at UW
Laura N. LowesUniversity of Washington

OpenSees Developers Symposium, August 2005
OpenSees Research Activities
� Modeling RC Beam-Column Joints
� Element Development
� Material Model Development
� Pinching4 Material Model
� Bar-Slip Material Model
� Validation Study
� Modeling RC Bridge Columns for PBEE
� Concrete Material Model
� Variable Plastic-Hinge Length Model
� Plastic-Hinge Length Calibration Study

OpenSees Developers Symposium, August 2005
Acknowledgements
�Beam-Column Joint Modeling
� Nilanjan Mitra, Graduate Student
�Column Modeling
� Michael Berry, Graduate Student
� Dawn Lehman, Assistant Professor
� Nilanjan Mitra, Graduate Student

OpenSees Developers Symposium, August 2005
Modeling RC Beam-Column Joints
�Modeling Needs
�Element Development
�Material Model Development
�Material Model Calibration
�Validation
OpenSees Developers Symposium, August 2005
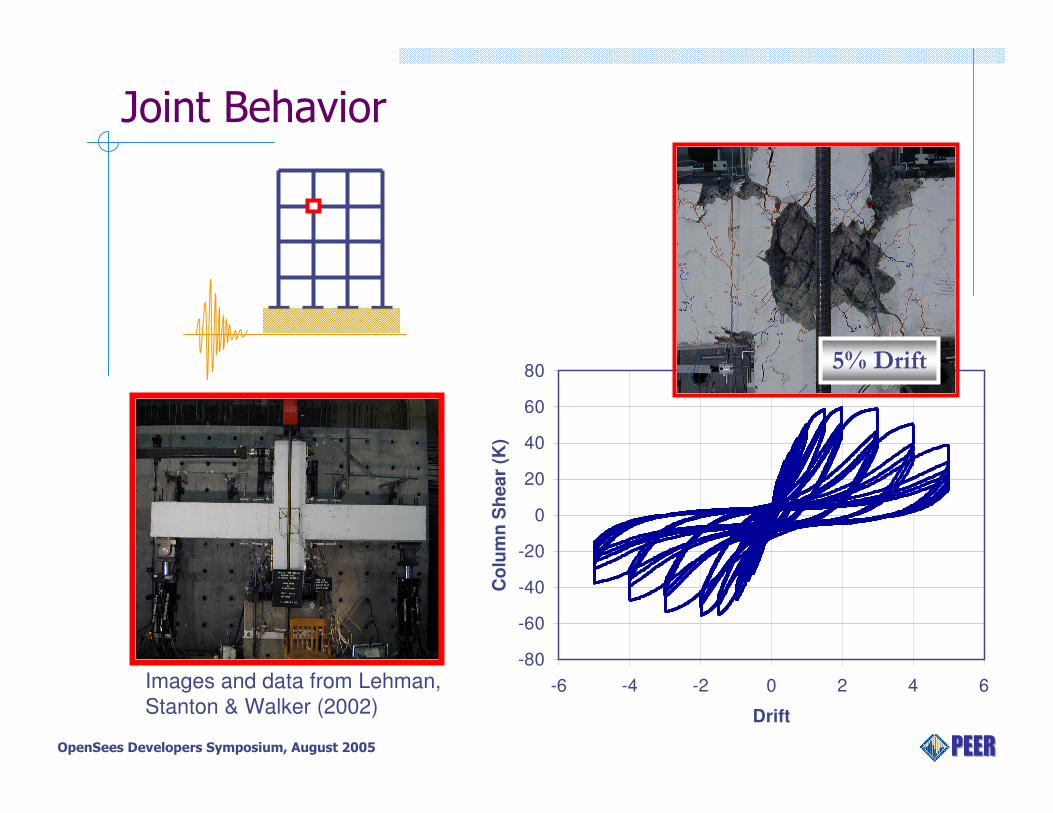
Joint Behavior
-80
-60
-40
-20
0
20
40
60
80
-6 -4 -2 0 2 4 6
Drift
Co
lum
n S
he
ar
(K)
5% Drift
Images and data from Lehman,
Stanton & Walker (2002)

OpenSees Developers Symposium, August 2005
Joint Element Development
� The objective was to develop a joint model that is
� Compatible with existing component models, i.e. beam-column line elements
� Computationally efficient
� Robust and accurate in predicting response
� Objective and transparent for user calibration
� This objective was achieved through development of a joint super-element
OpenSees Developers Symposium, August 2005
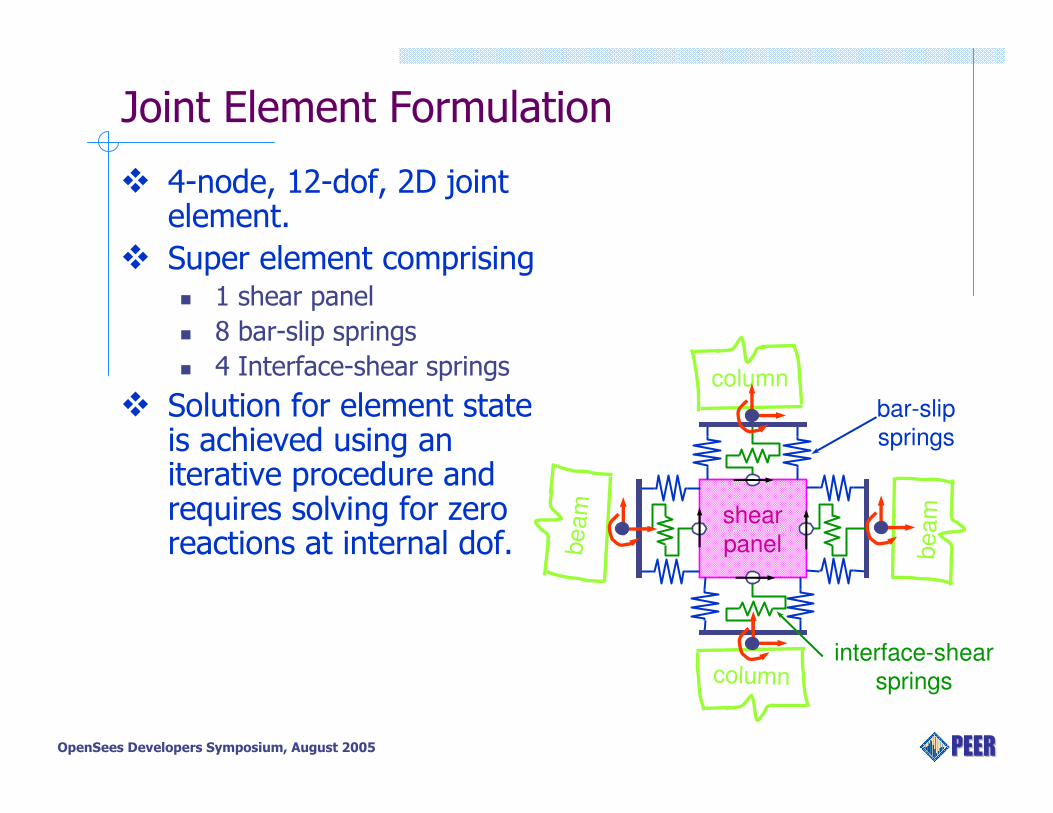
Joint Element Formulation
column
column
beam
beamshear
panel
bar-slip
springs
interface-shear
springs
� 4-node, 12-dof, 2D joint element.
� Super element comprising� 1 shear panel
� 8 bar-slip springs
� 4 Interface-shear springs
� Solution for element state is achieved using an iterative procedure and requires solving for zero reactions at internal dof.

OpenSees Developers Symposium, August 2005
Joint Element Formulation
4f
5f
6f 4F5F
6F
7f 8f9f
7F8F
9F
1f 2f3f
1F2F
3F
10f
11f
12f10F11F
12F
5f
4f
6f132
f
wΦ −
5 4
ˆ ˆ
2 2
h h h hf f
h h
− ++
1 2
ˆ ˆ
2 2
w w w wf f
w w
− + +
5 4
ˆ ˆ
2 2
h h h hf f
h h
+ −+
7 8
ˆ ˆ
2 2
w w w wf f
w w
− + +
13f
Component
Deformations
Component Forces

OpenSees Developers Symposium, August 2005
Material Model Development
�Pinching4 Uniaxial Material Model
� Multi-linear response envelope
� Tri-linear unload-reload path
� Strength, unloading stiffness, and reloading stiffness deterioration under cyclic loading
�Bar-Slip Uniaxial Material Model
� Pinching4 Material with strength degradation upon reloading
OpenSees Developers Symposium, August 2005
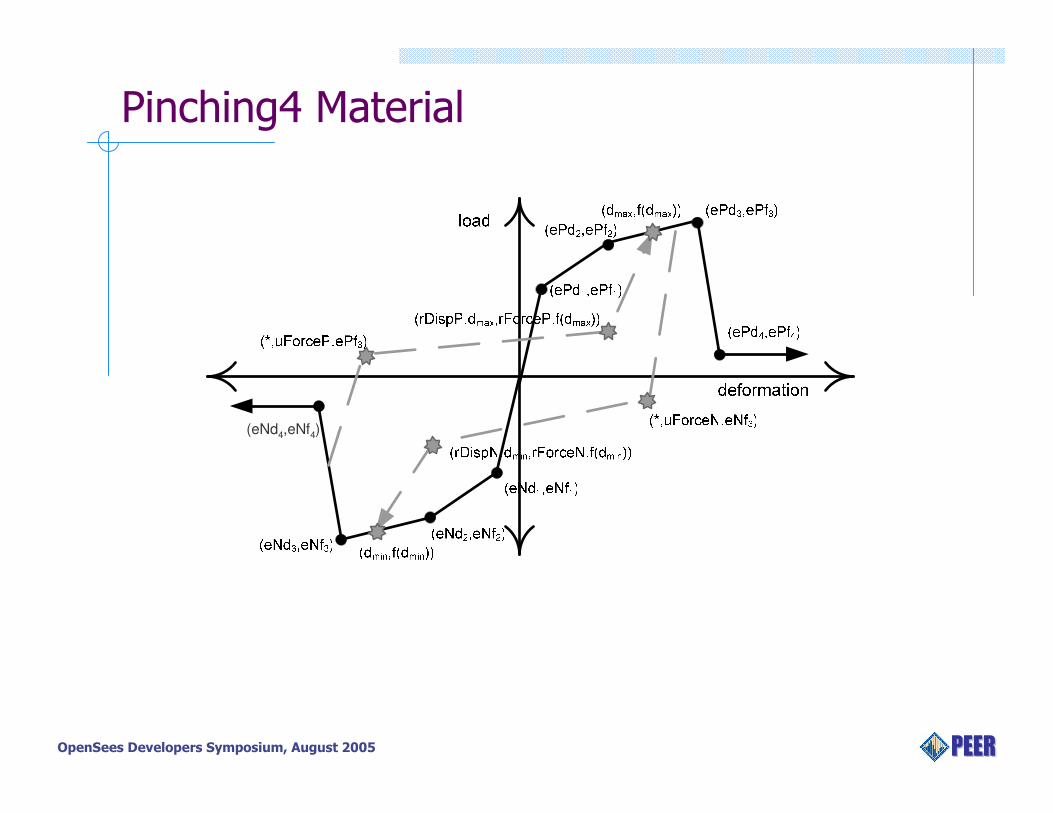
Pinching4 Material
(eNd4,eNf4)

OpenSees Developers Symposium, August 2005
Pinching4 Material – damage simulation
Strength Unloading Stiffness Reloading Stiffness
Strength and Stiffness Deterioration
( )ii
kkk δ−⋅= 10
( )ii
ddd δ+⋅= 10maxmax( ) ( ) ( )
iifff δ−⋅= 1
0maxmax
( ) ( )3 4
max max1 2
id
α α
δ α α χ= +%
( )
max
max
OR
i
m
E
E
number of load cycles
χβ
χ
=
=
( ) ( )max min
max
max min
max ,i id d
ddef def
=
%
i
history
E dE= ∫
m
monotonic history
E dE= ∫
OpenSees Developers Symposium, August 2005
Material Model Calibration – Shear Panel
� MCFT-based model (Lowes and Altoontash, 2003)� Assumes uniform shear stress is joint core.
� Envelope to panel stress-strain response is defined using MCFT (Vecchio and Collins 1986).
� Not appropriate for joints with low transverse steel ratios and/or high shear stress demands.
� Ratio of observed to predicted strength shows undesirable dependence on transverse steel ratio
� Compression-strut model (Mitra and Lowes, submitted)� Assumes shear stress transferred by a concrete strut.
� Envelope to panel stress-strain response is defined using confined concrete model (Mander et al. 1988).
� Appropriate for joints with variable transverse steel ratios andshear stress demands.
� Ratio of observed to predicted strength shows no dependence on transverse steel ratio.

OpenSees Developers Symposium, August 2005
Evaluation of Shear Panel Calibration
0.0
0.5
1.0
1.5
2.0
2.5
3.0
3.5
0.000 0.005 0.010 0.015 0.020 0.025 0.030 0.035 0.040
JF
BYJF
BY
`
0.0
0.5
1.0
1.5
2.0
2.5
3.0
3.5
0.0 0.5 1.0 1.5 2.0 2.5
JF
BYJF
BY
`
ϕ
τ MC
FT
_m
ono
/ τ m
ax
ρj
0.0
0.5
1.0
1.5
2.0
0.000 0.005 0.010 0.015 0.020 0.025 0.030 0.035 0.040
JF
BYJF
BY
`
τ str
ut/
τ max
transverse reinforcement ratio, ρj
0.0
0.5
1.0
1.5
2.0
0.0 0.5 1.0 1.5 2.0 2.5
JF
BYJF
BY
`
trans. reinforcement contribution to
max. shear demand, ϕ
str
ut-
based m
od
el
MC
FT
-based m
odel

OpenSees Developers Symposium, August 2005
� Experimental data used to calibrate unload-reload response and strength / stiffness deterioration.
� Cyclic response parameters calibrated using experimental data� rDisp = Displacement at reload / max. displacement = 0.09� rForce = Force at reload / max. force = 0.21� uForce = Force developed upon unloading = 0.0
� Strength / stiffness deterioration� Strength deterioration under cyclic loading included in bond strength values
� Stiffness deterioration:
� Comparison of simulated and observed response
( )0.22
max0.64k
idδ = % ( )
0.51
max0.20d
idδ = %
observed simulated
Specim
en S
E8
(Ste
vens e
t al. 1
987)
-0.012 -0.008 -0.004 0 0.004 0.008 0.012-10
-8
-6
-4
-2
0
2
4
6
8
10
Shear strain
Sh
ear
stre
ss (
MP
a)
Shear Panel - Cyclic Response

OpenSees Developers Symposium, August 2005
Bar-Slip Material Model
�Uses Pinching4 material model
�Strength loss is initiated once a specific force-deformation limit is exceeded

OpenSees Developers Symposium, August 2005
Material Model Calibration – Bar Slip Springs
Compression, - fs > fy
Compression, - fs < fy
Tension, fs > fy
Tension, fs< fy
Average bond strength, psi (fc in psi)Bar stress, fs (fy = tensile yield strength)
4.8 0.6YT c cf to fτ =
43YC cfτ =
MechanisticModel
Bond stress capacities from Lowes & Altoontash (2003)
26EC cfτ =
21ET cfτ =

OpenSees Developers Symposium, August 2005
0
5
10
15
20
0 10 20 30 40 50 60 70
BYJF
BY
Material Model Calibration – Bar Slip Springsmaximum slip (mm)
specimen number
0
1
2
3
4
5
0 10 20 30 40 50 60 70
specimen number
BYJF
BY
`
Max. slip / slip at activation
of full anchorage length

OpenSees Developers Symposium, August 2005
Material Model Calibration – Bar Slip Springs
� Envelope calibration is accomplished (within the model) using� Bond strength values� Reinforcing steel material properties� Anchorage length within the joint
� Cyclic response parameters calibrated using experimental data� rDisp = Displacement at reload / max. displacement = 0.25� rForce = Force at reload / max. force = 0.25� uForce = Force developed upon unloading = 0.0
� Stiffness deterioration is determined primarily by maximum deformation demand.
( )0.1
max0.3ki dδ = %( )
0.2
max0.6di dδ = %
� Strength deterioration� Is activated once slip exceeds the
slip level corresponding to ultimate stress in the reinforcing bars.
� Is observed upon reloading, with the result that bar-slip springs always exhibit positive tangent stiffness.
0 5 10 15-1000
-500
0
500
1000
slip (mm)
bar
-sp
rin
g f
orc
e (k
N)
OpenSees Developers Symposium, August 2005
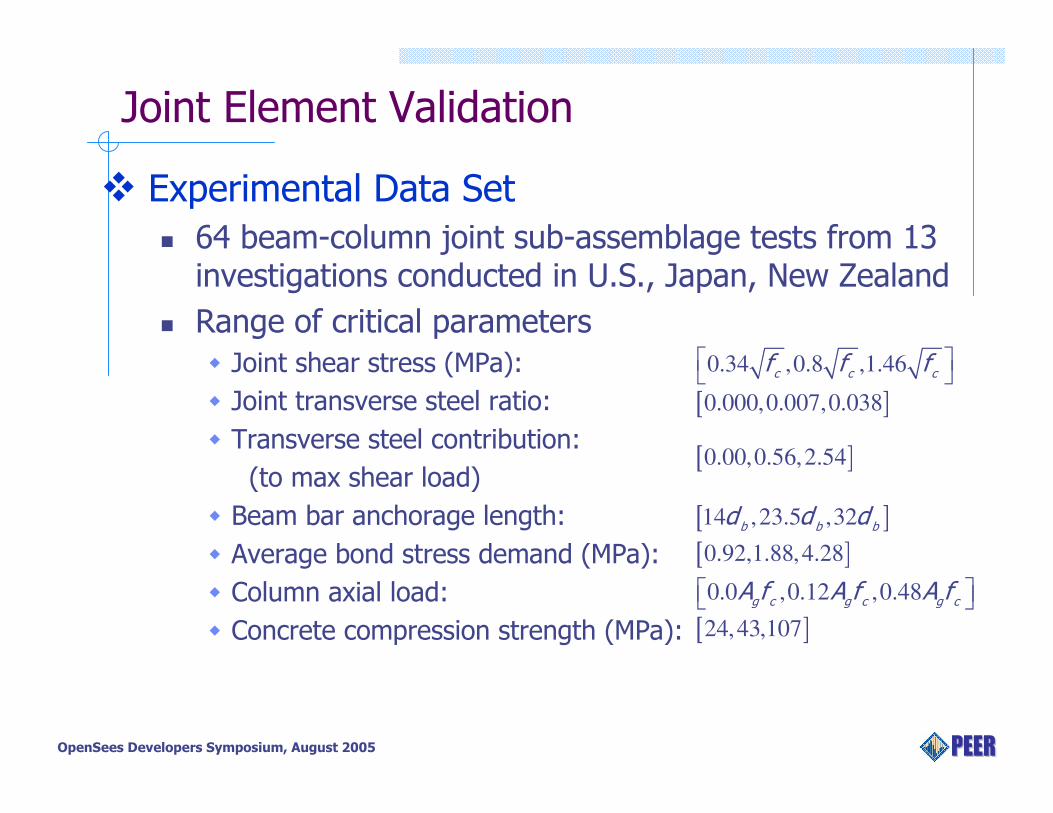
Joint Element Validation
� Experimental Data Set
� 64 beam-column joint sub-assemblage tests from 13 investigations conducted in U.S., Japan, New Zealand
� Range of critical parameters
� Joint shear stress (MPa):
� Joint transverse steel ratio:
� Transverse steel contribution:
(to max shear load)
� Beam bar anchorage length:
� Average bond stress demand (MPa):
� Column axial load:
� Concrete compression strength (MPa):
0.34 ,0.8 ,1.46 c c c
f f f
[ ]0.000,0.007,0.038
[ ]14 ,23.5 ,32b b b
d d d
[ ]0.92,1.88,4.28
0.0 ,0.12 ,0.48 g c g c g cA f A f A f
[ ]24,43,107
[ ]0.00,0.56,2.54

OpenSees Developers Symposium, August 2005
Joint Element Validation – OpenSees Model
Lab Test
OpenSees Model

OpenSees Developers Symposium, August 2005
Validation Study Results
observed responsesimulated response
-6 -4 -2 0 2 4 6-300
-200
-100
0
100
200
300
Drift (%)
Colu
mn s
hea
r (k
N)
-4 -2 0 2 4
-200
-100
0
100
200
300
Drift (%)
Colu
mn s
hea
r (k
N)
-6 6-300
-6 -5 -4 -3 -2 -1 0 1 2 3 4 5 6-60
-40
-20
0
20
40
60
Drift (%)
Colu
mn S
hea
r (k
ips)
-5 -4 -3 -2 -1 0 1 2 3 4 5-60
-40
-20
0
20
Drift (%)
Colu
mn S
hea
r (k
ips)
40
60
-6 6
Specimen OSJ10
(Okaand Shiohara 1992)
Specimen PEER0850
(Alire2002)

OpenSees Developers Symposium, August 2005
Validation Study Results
Obs. Sim. Obs.Sim. /
Obs.Obs. Sim.
Sim. /
Obs.Obs.
Sim. /
Obs.Obs.
Sim. /
Obs.Obs.
Sim. /
Obs.Obs.
Sim. /
Obs.Obs.
Sim. /
Obs.
DWX1 BYJF BYJF 5.02 0.77 0.00 0.00 1.00 191 0.84 2.54 1.18 6.54 1.14 0.76 1.18 0.23 1.19
DWX2 BY BYJF 5.44 0.77 0.17 0.20 1.20 200 0.85 3.62 1.00 6.56 1.45 0.81 1.16 0.22 1.18
DWX3 BY BY 4.71 0.75 0.00 0.50 > 10 160 0.87 3.67 1.60 5.25 0.87 0.86 1.22 0.28 1.20
OKAJ1 BY BYJF 5.31 1.09 0.45 0.63 1.40 115 1.13 5.00 1.00 7.63 1.13 0.82 1.05 0.19 1.55
OKAJ2 BY BYJF 5.98 0.97 0.31 0.50 1.61 119 1.19 5.00 1.43 8.47 0.83 0.83 1.19 0.19 1.48
OKAJ3 BY BY 5.88 0.98 0.31 0.62 2.00 132 1.13 5.00 1.50 6.58 1.03 0.84 1.31 0.17 1.72
OKAJ4 BYJF BYJF 6.14 0.95 0.30 0.35 1.17 112 1.16 2.50 1.93 13.98 0.77 0.61 1.57 0.30 1.01
Maximum
Column Load
(kN)
Strength at Final
Drift Level /
Max. Strength
Unloading
Stiffness at Max.
Load (kN/mm)
Pinching RatioDrift at Max.
Load (%)
Post Yield Stiffness
(kN/mm)Joint
Specimens
Failure
Mechanism
Initial Stiffness
(kN/mm)
LSD35Aa-2 JF BYJF NA NA NA NA NA 24 1.41 2.35 1.00 NA NA NA NA NA NA
LSD35Ab-1 JF JF NA NA NA NA NA 24 1.07 1.18 1.00 NA NA NA NA NA NA
LSD35Ab-2 JF BYJF NA NA NA NA NA 23 1.46 2.35 1.05 NA NA NA NA NA NA
B11 BY BY 7.81 0.99 0.29 0.33 1.14 200 0.97 3.81 1.00 4.18 0.97 1.00 1.00 0.25 1.44
B12 BY BY 7.81 1.08 0.27 0.28 1.04 205 0.99 3.81 1.00 4.29 0.91 1.00 1.00 0.24 2.21
O4 BYJF BY 7.50 1.50 0.00 0.10 > 10 177 1.21 1.24 4.00 8.85 1.62 0.68 1.56 0.17 3.48
O5 BYJF BY 5.25 1.90 0.00 0.08 > 10 150 1.40 2.76 2.00 7.50 1.40 0.58 1.78 0.27 1.83
ALL 1.08 (0.22) 1.20 (0.66) 1.01 (0.21) 1.32 (0.48) 1.05 (0.26) 1.17 (0.26) 1.44 (0.35)
JF 1.17 (0.22) 1.06 (0.25) 1.03 (0.27) 1.16 (0.26) 1.16 (0.19) 1.29 (0.37)
BYJF 1.13 (0.27) 0.87 (0.32) 0.97 (0.21) 1.63 (0.59) 1.06 (0.30) 1.31 (0.32) 1.54 (0.42)
BY 1.00 (0.15) 1.41 (0.66) 0.99 (0.12) 1.34 (0.32) 0.99 (0.22) 1.08 (0.19) 1.47 (0.27)
ALL 1.06 (0.19) 1.29 (0.75) 0.99 (0.18) 1.25 (0.34) 1.02 (0.25) 1.17 (0.16) 1.35 (0.33)
JF 1.13 (0.23) 0.99 (0.25) 0.89 (0.19) 1.15 (0.29) 1.15 (0.22) 1.25 (0.43)
BYJF 1.07 (0.20) 0.92 (0.27) 1.00 (0.13) 1.42 (0.35) 1.06 (0.18) 1.32 (0.16) 1.35 (0.32)
BY 1.00 (0.13) 1.43 (0.77) 0.99 (0.09) 1.48 (0.26) 0.92 (0.18) 1.15 (0.10) 1.53 (0.28)
Mea
n (
C.O
.V.) All specimens
Failure
mechanism
correctly
simulated
OpenSees Developers Symposium, August 2005
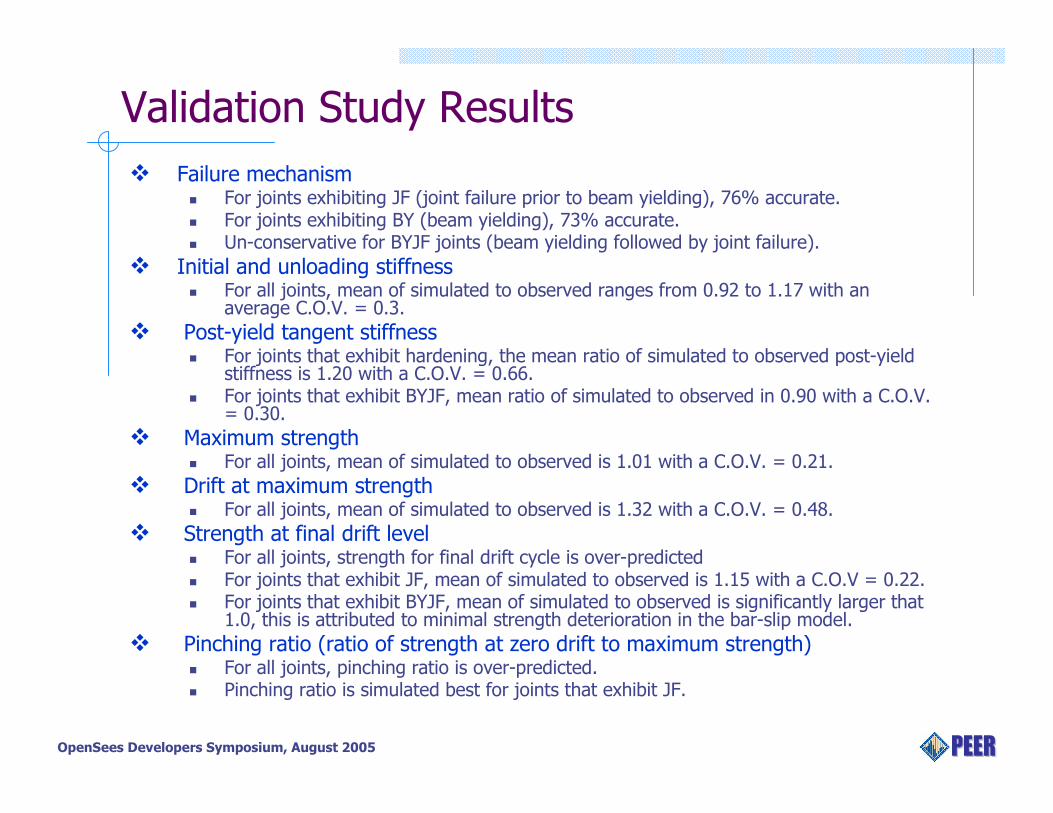
Validation Study Results
� Failure mechanism� For joints exhibiting JF (joint failure prior to beam yielding), 76% accurate. � For joints exhibiting BY (beam yielding), 73% accurate.� Un-conservative for BYJF joints (beam yielding followed by joint failure).
� Initial and unloading stiffness� For all joints, mean of simulated to observed ranges from 0.92 to 1.17 with an
average C.O.V. = 0.3.
� Post-yield tangent stiffness� For joints that exhibit hardening, the mean ratio of simulated to observed post-yield
stiffness is 1.20 with a C.O.V. = 0.66.� For joints that exhibit BYJF, mean ratio of simulated to observed in 0.90 with a C.O.V.
= 0.30.
� Maximum strength � For all joints, mean of simulated to observed is 1.01 with a C.O.V. = 0.21.
� Drift at maximum strength� For all joints, mean of simulated to observed is 1.32 with a C.O.V. = 0.48.
� Strength at final drift level � For all joints, strength for final drift cycle is over-predicted� For joints that exhibit JF, mean of simulated to observed is 1.15 with a C.O.V = 0.22.� For joints that exhibit BYJF, mean of simulated to observed is significantly larger that
1.0, this is attributed to minimal strength deterioration in the bar-slip model.
� Pinching ratio (ratio of strength at zero drift to maximum strength)� For all joints, pinching ratio is over-predicted. � Pinching ratio is simulated best for joints that exhibit JF.

OpenSees Developers Symposium, August 2005
Modeling RC Bridge Columns
�Concrete Material Model
�Variable Plastic-Hinge Length Model
�Plastic-Hinge Length Calibration Study

OpenSees Developers Symposium, August 2005
Concrete 04 Material Model
� Comparison of simulated and observed response indicated concretematerial model did not represent well the initial compressive stiffness, especially for high-strength or well-confined concrete
� New model is revision of Concrete03 with
� Popovics (1973) model used to simulate envelope of compression response.This allows user to identify initial stiffness (default in ACI 318 model).
� Concrete develops tensile stress only under tensile strain
� Concrete04 material response:
0.000 0.002 0.004 0.006 0.0080.0
2.0
4.0
Stress (ksi)
Compression Response
Strain
0.0 0.00005 0.0001 0.000150.0
0.2
0.4Tension Response
Strain
-0.005 0.000 .005 0.010-2.0
0.0
2.0
4.0
Strain
Comp.(+) & Tension(-) Response

OpenSees Developers Symposium, August 2005
Variable Plastic-Hinge Length Model
� The expressions defining plastic-hinge length are calibrated to provide accurate prediction of global (e.g. drift) or local (e.g. demand measures).
� For performance-based earthquake engineering, it may be appropriate to have different hinge lengths for different demand levels or performance states.
� The variable plastic-hinge length model allows for use of the Beam-With-Hinges element with a hinge-length that is defined by
� Model parameters are calibrated as part of the validation study.
( )α β
− −= ⋅ +
s y bnp
n c
f f dM M Ll
M f2

OpenSees Developers Symposium, August 2005
Bridge Column Model Development
� The objective is to develop recommendations for using the BeamWithHinges element to predict bridge column damage.
� Experimental data from the PEER column database are being used.� Recommendations will include effective stiffness and re-calibration
of plastic-hinge length expressions.� Effective stiffness is calibrated to ensure accurate prediction of
yield displacement.� Hinge-length models are calibrated to enable precise prediction
of the EDPs that determine initial of damage states� EDPs include drift, plastic rotation, and concrete and steel strains.� Damage states include cracking, spalling, crushing and bar buckling.
� Several hinge-length models are considered.