Opening up the Gas Market - SGN · LNG Liquefied Natural Gas ... OGM Opening up the Gas Market PPR...
81
Opening up the Gas Market Successful Delivery Reward Criteria 2 Carry out quantified risk assessment
Transcript of Opening up the Gas Market - SGN · LNG Liquefied Natural Gas ... OGM Opening up the Gas Market PPR...
Opening up the Gas Market Successful Delivery Reward Criteria 2 Carry out quantified risk assessment

“The information in this report has been provided by SGN. While the report has been prepared in good faith, no representation, warranty, assurance or undertaking (express or implied) is or will be made, and no responsibility or liability is or will be accepted by SGN or any of SGN’s subsidiaries in relation to the adequacy, accuracy, completeness or reasonableness of this report. All and any such responsibility and liability is expressly disclaimed.”
Project number SGNGN02
Report number OGM_SDRC_02
Title Carry out a quantified risk assessment
Author(s) Jamie McAinsh, Angus McIntosh
Revision History Description / Date:
1 Ofgem Issue / 26/6/2015
2 Redacted for webpage publication / 14/2/2017
Approval History: Reviewer/Approver:
Draft 1 Project Manager
Draft 2 Project Director
Final Draft Regulation
Final Project Director
Final Distribution:
Ofgem; [email protected] Angus McIntosh (Innovation and New Technology Manager); [email protected] Jamie McAinsh (Project Manager); [email protected] Jenny Rogers (Regulation Manager) [email protected]
Scotia Gas Networks Limited Registered Office: St Lawrence House, Station Approach, Horley, Surrey RH6 9HJ
Registered in England & Wales No. 04958135
Successful Delivery Reward Criteria 2
Page 4 of 10OGM_SDRC_02
1. Glossary of Terms 4 2. Executive Summary 5 3. Background 5 4. Project Manager’s Report 7 5. Schedule of Deliverables for SDRC-2 7 6. Conclusion 9 7. Appendices 10
1. Glossary of Terms
Abbreviation Term
BIS Department for Business Innovation and Skills
DECC Department of Energy and Climate Change
DNV GL Technical advisor to the energy industry
EASEE European Association for the Streamlining of Energy Exchange
GB Great Britain
GS(M)R Gas Safety (Management) Regulations
HHIC Heating and Hot Water Industry Council
HSE Health & Safety Executive
IGEM Institution of Gas Engineers and Managers
LDZ Local Distribution Zone
LNG Liquefied Natural Gas
NIC Network Innovation Competition
NBP National Balancing Point (GB)
OGM Opening up the Gas Market
PPR Project Progress Report
QRA Quantitative Risk Assessment
SDRC Successful Delivery Reward Criteria
SGN Scotia Gas Networks
SIU Scottish Independent Undertaking
WI Wobbe Index
ZEE Zeebrugge (Belgium)
Successful Delivery Reward Criteria 2
Page 5 of 10OGM_SDRC_02
2. Executive Summary
The Quantitative Risk Assessment (QRA) has been completed by project partner, DNV GL, on time and in line with the project plan. The QRA concludes that, with the mitigating factors that the project has incorporated, the risk posed by carbon monoxide emissions is reduced.
This document details the steps taken towards achieving the requirements of Successful Delivery Reward Criteria 2: carry out quantitative risk assessment.
The criteria required for achievement of this are:
Identify and understand the risks associated with high Wobbe LNG;
Create inventory of potential hazards, their likelihood, and consequences assessed bycomparison against defined criteria;
Show that risks are identified and controlled to an acceptable level;
Project team risk assessment meeting to be held to discuss and highlight the potentialissues and develop a robust view on the potential impact of higher Wobbe Indexgases.
A summary in relation to each criterion is detailed below:
This criterion has been met. The risks and factors associated with high Wobbe LNGhave been researched by SGN, and project partners DNVGL, Kiwa Gastec and DaveLander Consulting.
This criterion has been met. Hazards have been identified, and mitigated, to ensurethat their consequences can be minimised, and these have been incorporated into theQRA.
This criterion has been met. The QRA shows that risks have been identified andcontrolled, meaning the risk has reduced as a result of this project.
This criterion has been met. A number of meetings between DNV GL and the projectteam have taken place to ensure any issues were discussed and incorporated into theQRA.
The evidence required is:
Quantitative Risk Assessment published on SGN website;
Level of risk successfully defined in absolute terms.
It can be confirmed that the evidence specified above has been supplied and is detailed within this document.
SGN is satisfied that the criteria and evidence requirements for SDRC-2 have been met.
3. Background
The objective of this project is to demonstrate that gas which meets the European Association for the Streamlining of Energy Exchange-gas (EASEE Gas) specification, but sits outside of the characteristics of gas specified within GB Gas Safety (Management) Regulations (GS(M)R) 1996, can be distributed and utilised safely and efficiently in Great Britain. For this demonstration, we have a unique opportunity to utilise one of our discrete, isolated networks

Successful Delivery Reward Criteria 2
Page 6 of 10OGM_SDRC_02
which we operate in remote parts of Scotland, called the Scottish Independent Undertakings (SIUs), namely the Oban network.
This project is based on the principles of increasing competition for network entry, improving energy security and reducing the cost of gas for customers.
The specific objectives of the project are:
To demonstrate that gas which meets EASEE Gas specification but sits outside GS(M)Rcan be conveyed safely and efficiently in the GB gas network;
To demonstrate that all GAD (Gas Appliances Directive) compliant gas appliances arecapable of safely and efficiently burning gas which meets EASEE Gas specifications butsits outside GS(M)R;
To establish the proportion of older gas appliances that constrict gas qualityspecification in GB through assessment of a representative appliance sample fromOban Network;
To demonstrate through the sample population what is required to ensure GB'sappliance population is capable of operating safely and efficiently over a wider rangeof gas quality;
To identify and record all types/makes of gas appliances, identified through therepresentative appliance sample from Oban network that are not fit for operationusing gas which meets EASEE Gas specifications but sits outside GS(M)R;
To capture and record all project learning to assist in a full GB roll out in the future;
To compile a project completion report assessing the technical and commercialviability of accepting EASEE compliant gas in GB.
The established problem leading to the inception of this project was that increasingly, from around 2005 and beyond, dwindling gas reserves in GB have created security of supply concerns, leading to GB gas price increases. GB is now a net importer of gas, with prices and access to supply increasingly depending on markets elsewhere as a result. Hence GB gas prices exhibit volatility, given the short-term and/or spot market conditions.
Whilst the sources of new natural gas are numerous, gases have different compositions and GB’s specification for gas composition is very prescriptive, therefore limiting the market and exacerbating the problem. The current GB gas specification requirements, as set out in GS(M)R (1996) differ from those employed elsewhere in the European Community and internationally. This poses difficulties for the wider industry with regard to the increased importance of imported natural gas, LNG and unconventional gas such as shale gas and coal-bed methane. Furthermore it restricts the use of biomethane as a renewable green gas and hydrogen as a clean gas option for injection to the networks.
Current arrangements dictate that in order for gases with compositions that sit outside of GS(M)R to be conveyed and used within GB, expensive gas processing is required to bring it within these specifications. This limits the type and source of gases which can be used in GB and, in turn, ultimately leads to increased costs for the consumer.
With a backdrop of this type of market rigidity, it is necessary to redefine GB gas specification in order to help tackle the problems associated with security of supply and rising gas costs for the consumer. Changing GS(M)R to align with European gas specification (EASEE Gas) will open the market and accommodate the introduction and use of abundantly available alternative sources of gas without the need for expensive processing.
Successful Delivery Reward Criteria 2
Page 7 of 10OGM_SDRC_02
Outside of GB, mainland Europe seeks to conform to a wider gas specification called EASEE Gas, with the main difference relating to the Wobbe Index (WI). This enables a greater variety of gas sources to enter the networks harmonising gas inter-connection between countries. This project will demonstrate that gas which meets EASEE Gas specification but sites outside of GS(M)R can be conveyed and utilised in GB.
The current GB WI limits are 47.20 MJ/m3 - 51.41 MJ/m3, and this widens to 46.50MJ/m3 - 52.85MJ/m3 in a gas emergency. Typical daily average WI limits for Oban (July 2013) are 50.9 - 51.1MJ/m3. This is entirely in accord with expectations for a 100% LNG supplied network i.e. slightly below the top of the range. Typical EASEE-gas limits are 47.0 to 54.0 MJ/m3, but in practice LNG EASEE-gas limits are expected to be at the higher end of this range.
4. Project Manager’s Report
We have worked very closely with project partner, DNV GL, throughout the testing process to ensure that the QRA meets the necessary criteria. Through generating a password protected online database, we were able to allow DNV GL ‘live’ access to the test results, allowing the risk assessment to be a working document.
The QRA formed the basis of the GS(M)R exemption application submitted to the HSE and will be of vital importance when we are looking to apply our findings to GB. This QRA is a very complex piece of work but has been delivered to a very high standard as DNVGL are recognised experts in risk management.
We are encouraged to learn that the result of the QRA showed a decrease in risk based on the mitigation activities we have implemented in Oban.
5. Schedule of Deliverables for SDRC-2
As part of the Successful Delivery Reward Criteria 2, there is a schedule of deliverables to be met. These deliverables are explained as part of the appended QRA, however a summary is detailed below.
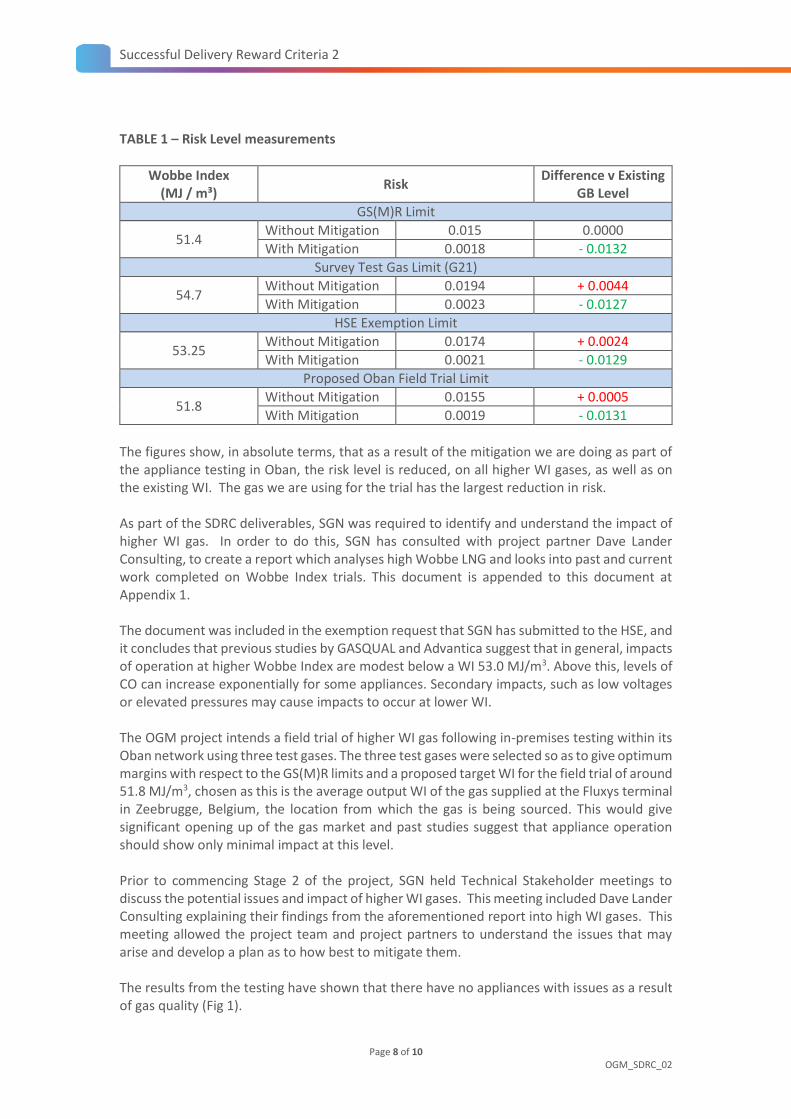
As part of the QRA, DNV GL included a summarising table, which detailed the variance in risk levels, dependent upon the WI value used. The table is shown overleaf:
Successful Delivery Reward Criteria 2
Page 8 of 10OGM_SDRC_02
TABLE 1 – Risk Level measurements
Wobbe Index (MJ / m³)
Risk Difference v Existing
GB Level
GS(M)R Limit
51.4 Without Mitigation 0.015 0.0000
With Mitigation 0.0018 - 0.0132
Survey Test Gas Limit (G21)
54.7 Without Mitigation 0.0194 + 0.0044
With Mitigation 0.0023 - 0.0127
HSE Exemption Limit
53.25 Without Mitigation 0.0174 + 0.0024
With Mitigation 0.0021 - 0.0129
Proposed Oban Field Trial Limit
51.8 Without Mitigation 0.0155 + 0.0005
With Mitigation 0.0019 - 0.0131
The figures show, in absolute terms, that as a result of the mitigation we are doing as part of the appliance testing in Oban, the risk level is reduced, on all higher WI gases, as well as on the existing WI. The gas we are using for the trial has the largest reduction in risk.
As part of the SDRC deliverables, SGN was required to identify and understand the impact of higher WI gas. In order to do this, SGN has consulted with project partner Dave Lander Consulting, to create a report which analyses high Wobbe LNG and looks into past and current work completed on Wobbe Index trials. This document is appended to this document at Appendix 1.
The document was included in the exemption request that SGN has submitted to the HSE, and it concludes that previous studies by GASQUAL and Advantica suggest that in general, impacts of operation at higher Wobbe Index are modest below a WI 53.0 MJ/m3. Above this, levels of CO can increase exponentially for some appliances. Secondary impacts, such as low voltages or elevated pressures may cause impacts to occur at lower WI.
The OGM project intends a field trial of higher WI gas following in-premises testing within its Oban network using three test gases. The three test gases were selected so as to give optimum margins with respect to the GS(M)R limits and a proposed target WI for the field trial of around 51.8 MJ/m3, chosen as this is the average output WI of the gas supplied at the Fluxys terminal in Zeebrugge, Belgium, the location from which the gas is being sourced. This would give significant opening up of the gas market and past studies suggest that appliance operation should show only minimal impact at this level.
Prior to commencing Stage 2 of the project, SGN held Technical Stakeholder meetings to discuss the potential issues and impact of higher WI gases. This meeting included Dave Lander Consulting explaining their findings from the aforementioned report into high WI gases. This meeting allowed the project team and project partners to understand the issues that may arise and develop a plan as to how best to mitigate them.
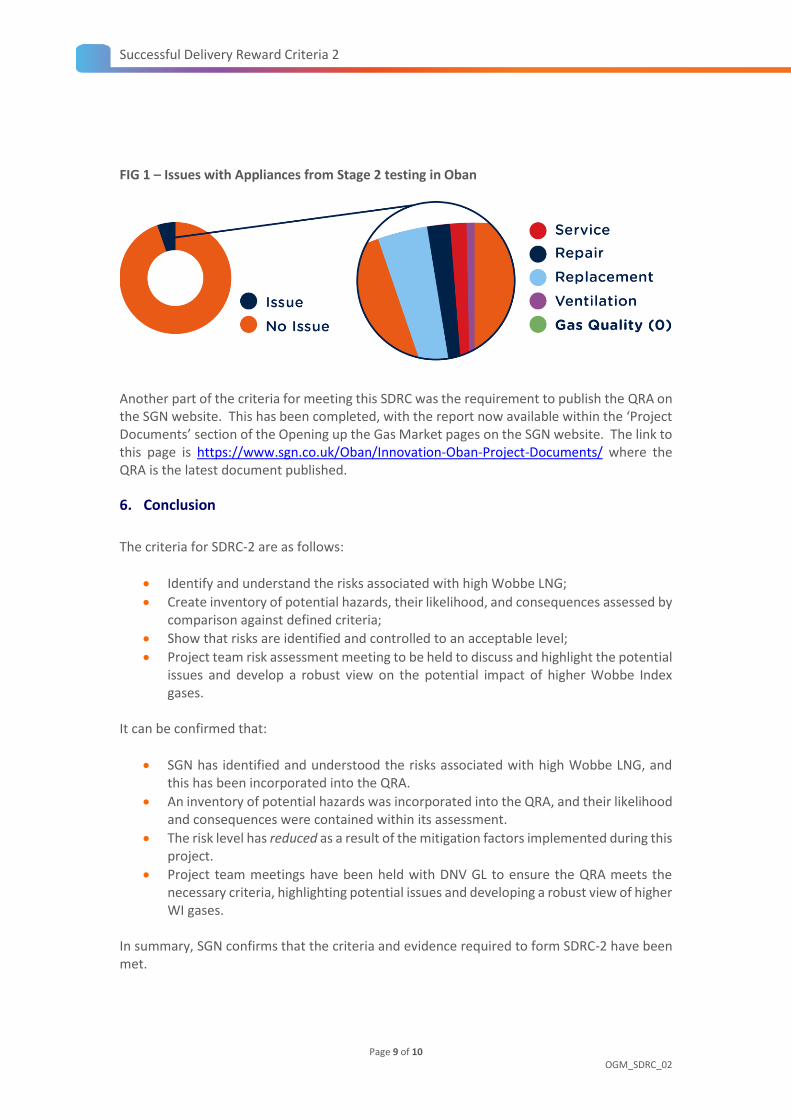
The results from the testing have shown that there have no appliances with issues as a result of gas quality (Fig 1).
Successful Delivery Reward Criteria 2
Page 9 of 10OGM_SDRC_02
FIG 1 – Issues with Appliances from Stage 2 testing in Oban
Another part of the criteria for meeting this SDRC was the requirement to publish the QRA on the SGN website. This has been completed, with the report now available within the ‘Project Documents’ section of the Opening up the Gas Market pages on the SGN website. The link to this page is https://www.sgn.co.uk/Oban/Innovation-Oban-Project-Documents/ where the QRA is the latest document published.
6. Conclusion
The criteria for SDRC-2 are as follows:
Identify and understand the risks associated with high Wobbe LNG;
Create inventory of potential hazards, their likelihood, and consequences assessed bycomparison against defined criteria;
Show that risks are identified and controlled to an acceptable level;
Project team risk assessment meeting to be held to discuss and highlight the potentialissues and develop a robust view on the potential impact of higher Wobbe Indexgases.
It can be confirmed that:
SGN has identified and understood the risks associated with high Wobbe LNG, andthis has been incorporated into the QRA.
An inventory of potential hazards was incorporated into the QRA, and their likelihoodand consequences were contained within its assessment.
The risk level has reduced as a result of the mitigation factors implemented during thisproject.
Project team meetings have been held with DNV GL to ensure the QRA meets thenecessary criteria, highlighting potential issues and developing a robust view of higherWI gases.
In summary, SGN confirms that the criteria and evidence required to form SDRC-2 have been met.

Successful Delivery Reward Criteria 2
Page 10 of 10OGM_SDRC_02
7. Appendices
1) Dave Lander Consulting – Current and Past Work2) DNV GL - Quantitative Risk Assessment

Page 1 of 28
davelanderconsulting Project number 0058
Report number DLC/0064
Title OPENING UP THE GAS MARKET – REVIEW OF CURRENT AND PAST WORK
Author D.F.LANDER
Revision 0
Date 0505/2014
Clients Scotia Gas Networks
Revision History:
0 Draft for comment (0505/2014)
Final Distribution:
Dave Lander Consulting Limited Registered in England and Wales, No 06725912 94 Sudeley, Dosthill, Tamworth, Staffordshire B77 1JU
tel: +44 (0)7901 510 905 e-mail: [email protected]
Page 2 of 28
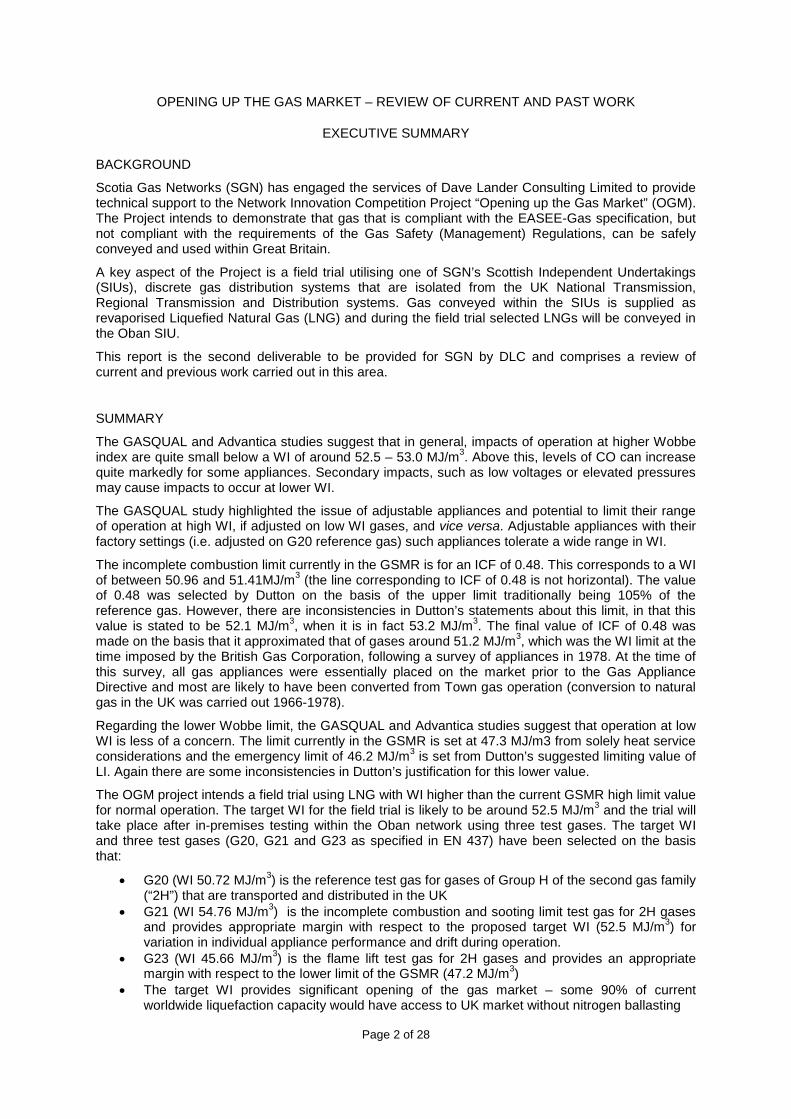
OPENING UP THE GAS MARKET – REVIEW OF CURRENT AND PAST WORK
EXECUTIVE SUMMARY
BACKGROUND
Scotia Gas Networks (SGN) has engaged the services of Dave Lander Consulting Limited to provide technical support to the Network Innovation Competition Project “Opening up the Gas Market” (OGM). The Project intends to demonstrate that gas that is compliant with the EASEE-Gas specification, but not compliant with the requirements of the Gas Safety (Management) Regulations, can be safely conveyed and used within Great Britain.
A key aspect of the Project is a field trial utilising one of SGN’s Scottish Independent Undertakings (SIUs), discrete gas distribution systems that are isolated from the UK National Transmission, Regional Transmission and Distribution systems. Gas conveyed within the SIUs is supplied as revaporised Liquefied Natural Gas (LNG) and during the field trial selected LNGs will be conveyed in the Oban SIU.
This report is the second deliverable to be provided for SGN by DLC and comprises a review of current and previous work carried out in this area.
SUMMARY
The GASQUAL and Advantica studies suggest that in general, impacts of operation at higher Wobbe index are quite small below a WI of around 52.5 – 53.0 MJ/m3. Above this, levels of CO can increase quite markedly for some appliances. Secondary impacts, such as low voltages or elevated pressures may cause impacts to occur at lower WI.
The GASQUAL study highlighted the issue of adjustable appliances and potential to limit their range of operation at high WI, if adjusted on low WI gases, and vice versa. Adjustable appliances with their factory settings (i.e. adjusted on G20 reference gas) such appliances tolerate a wide range in WI.
The incomplete combustion limit currently in the GSMR is for an ICF of 0.48. This corresponds to a WI of between 50.96 and 51.41MJ/m3 (the line corresponding to ICF of 0.48 is not horizontal). The value of 0.48 was selected by Dutton on the basis of the upper limit traditionally being 105% of the reference gas. However, there are inconsistencies in Dutton’s statements about this limit, in that this value is stated to be 52.1 MJ/m3, when it is in fact 53.2 MJ/m3. The final value of ICF of 0.48 was made on the basis that it approximated that of gases around 51.2 MJ/m3, which was the WI limit at the time imposed by the British Gas Corporation, following a survey of appliances in 1978. At the time of this survey, all gas appliances were essentially placed on the market prior to the Gas Appliance Directive and most are likely to have been converted from Town gas operation (conversion to natural gas in the UK was carried out 1966-1978).
Regarding the lower Wobbe limit, the GASQUAL and Advantica studies suggest that operation at low WI is less of a concern. The limit currently in the GSMR is set at 47.3 MJ/m3 from solely heat service considerations and the emergency limit of 46.2 MJ/m3 is set from Dutton’s suggested limiting value of LI. Again there are some inconsistencies in Dutton’s justification for this lower value.
The OGM project intends a field trial using LNG with WI higher than the current GSMR high limit value for normal operation. The target WI for the field trial is likely to be around 52.5 MJ/m3 and the trial will take place after in-premises testing within the Oban network using three test gases. The target WI and three test gases (G20, G21 and G23 as specified in EN 437) have been selected on the basis that:
• G20 (WI 50.72 MJ/m3) is the reference test gas for gases of Group H of the second gas family (“2H”) that are transported and distributed in the UK
• G21 (WI 54.76 MJ/m3) is the incomplete combustion and sooting limit test gas for 2H gases and provides appropriate margin with respect to the proposed target WI (52.5 MJ/m3) for variation in individual appliance performance and drift during operation.
• G23 (WI 45.66 MJ/m3) is the flame lift test gas for 2H gases and provides an appropriate margin with respect to the lower limit of the GSMR (47.2 MJ/m3)
• The target WI provides significant opening of the gas market – some 90% of current worldwide liquefaction capacity would have access to UK market without nitrogen ballasting
Page 3 of 28
• Past studies suggest that appliance operation should show only slight impact when operating with gases at the target WI.
Page 4 of 28
OPENING UP THE GAS MARKET – REVIEW OF CURRENT AND PAST WORK
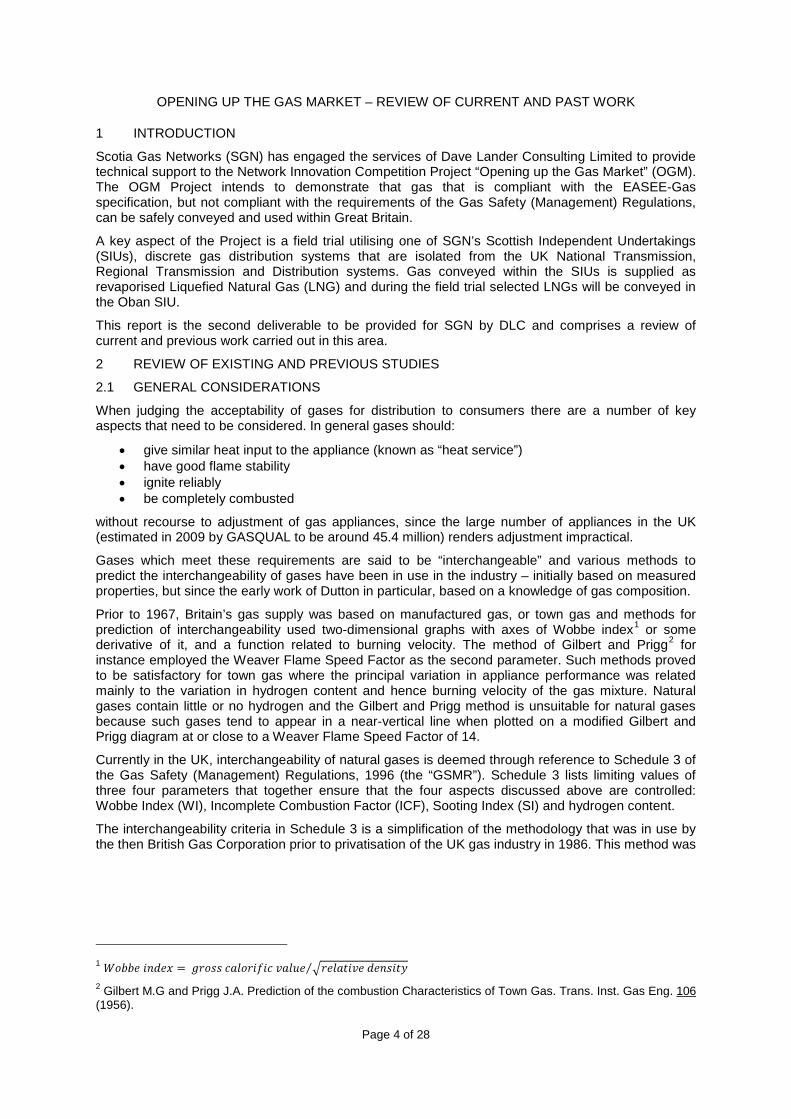
1 INTRODUCTION
Scotia Gas Networks (SGN) has engaged the services of Dave Lander Consulting Limited to provide technical support to the Network Innovation Competition Project “Opening up the Gas Market” (OGM). The OGM Project intends to demonstrate that gas that is compliant with the EASEE-Gas specification, but not compliant with the requirements of the Gas Safety (Management) Regulations, can be safely conveyed and used within Great Britain.
A key aspect of the Project is a field trial utilising one of SGN’s Scottish Independent Undertakings (SIUs), discrete gas distribution systems that are isolated from the UK National Transmission, Regional Transmission and Distribution systems. Gas conveyed within the SIUs is supplied as revaporised Liquefied Natural Gas (LNG) and during the field trial selected LNGs will be conveyed in the Oban SIU.
This report is the second deliverable to be provided for SGN by DLC and comprises a review of current and previous work carried out in this area.
2 REVIEW OF EXISTING AND PREVIOUS STUDIES
2.1 GENERAL CONSIDERATIONS
When judging the acceptability of gases for distribution to consumers there are a number of key aspects that need to be considered. In general gases should:
• give similar heat input to the appliance (known as “heat service”) • have good flame stability • ignite reliably • be completely combusted
without recourse to adjustment of gas appliances, since the large number of appliances in the UK (estimated in 2009 by GASQUAL to be around 45.4 million) renders adjustment impractical.
Gases which meet these requirements are said to be “interchangeable” and various methods to predict the interchangeability of gases have been in use in the industry – initially based on measured properties, but since the early work of Dutton in particular, based on a knowledge of gas composition.
Prior to 1967, Britain’s gas supply was based on manufactured gas, or town gas and methods for prediction of interchangeability used two-dimensional graphs with axes of Wobbe index1 or some derivative of it, and a function related to burning velocity. The method of Gilbert and Prigg2
Currently in the UK, interchangeability of natural gases is deemed through reference to Schedule 3 of the Gas Safety (Management) Regulations, 1996 (the “GSMR”). Schedule 3 lists limiting values of three four parameters that together ensure that the four aspects discussed above are controlled: Wobbe Index (WI), Incomplete Combustion Factor (ICF), Sooting Index (SI) and hydrogen content.
for instance employed the Weaver Flame Speed Factor as the second parameter. Such methods proved to be satisfactory for town gas where the principal variation in appliance performance was related mainly to the variation in hydrogen content and hence burning velocity of the gas mixture. Natural gases contain little or no hydrogen and the Gilbert and Prigg method is unsuitable for natural gases because such gases tend to appear in a near-vertical line when plotted on a modified Gilbert and Prigg diagram at or close to a Weaver Flame Speed Factor of 14.
The interchangeability criteria in Schedule 3 is a simplification of the methodology that was in use by the then British Gas Corporation prior to privatisation of the UK gas industry in 1986. This method was
1 2 Gilbert M.G and Prigg J.A. Prediction of the combustion Characteristics of Town Gas. Trans. Inst. Gas Eng. 106 (1956).
Page 5 of 28
based on the work of Dutton in the 1970s, which was initially reported in 19783, but reported in more detail in a landmark IGE Communication4
Following discussions between the gas industry and the UK Department for Trade and Industry (DTI), the UK government commissioned research during 2003 and further studies in 2004, leading to a public consultation
in 1984.
5 in December 2005 on future policy regarding the UK’s gas quality specifications (as embodied in the GSMR). Following consultation, the UK government policy6
In part, the UK government’s monitoring of developments within Europe has be formally achieved through a BSI steering group (GSE/-/4) that provided guidance to the UK representatives (J. Harrington-Tucker and D. Lander) for CEN BT group 197, which managed the first phase of work in response to a Mandate by the EC to CEN to develop a European Harmonised Standard for Gas Quality. The first phase conducted appliance testing and was carried out by a consortium of European appliance test laboratories (the GASQUAL consortium). The second phase of work is the development of the standard itself and guidance to the UK representative (D Lander) continues to be provided through GSE/-/4.
was that it saw no need for change in the interchangeability limits in the GSMR until 2020, that there was no perceived need for change after then, but it would continue to monitor developments (particularly those within Europe).
In the USA, the Natural Gas Council (NGC), comprising the four major industry organisations organized a NGC+ workshop to address the issues of gas interchangeability. An NGC+ white paper has been presented to the FERC recommending an Interim Guideline with ± 4% Wobbe Index limits around the historical local average up to a maximum 1400 btu/scf, a maximum heating value of 1100 btu/scf and two more parameters to address interchangeability issues. However, it is felt that the information from the US study is of limited value to this work because the US appliances are designed and built to differing standards from those within Europe.
The three main studies of relevance to the OGM are therefore the work of Dutton, the work commissioned by the DTI and the work carried out by GASQUAL. The work of Dutton was carried out on gas appliances that were placed on the market prior to the coming into force of the Gas Appliance Directive and is relevant today because there may still be pre-GAD appliances in use today; and also it forms the basis of the current limits within the GSMR in the UK. The work commissioned by the DTI was carried out by the then Advantica (now part of the DNV-GL group) and comprised tests on ten used GAD-compliant appliances. The GASQUAL tests were carried out on new GAD-compliant appliances.
Subsequent sections will therefore discuss these three studies and highlight the information and key learning points for the OGM project.
2.2 THE DUTTON INTERCHANGEABILITY STUDIES
2.2.1 THE EQUIVALENT MIXTURE
The approach developed by Dutton were carried out at a time when developments in gas chromatography, and in particular on-line or process instruments were becoming readily available. It was therefore natural that approaches relating appliance effects to gas composition to properties or calculated properties.
A key aspect of the Dutton approach is to simplify the composition of a gas mixture to four-component “equivalent” mixture. The actual components in the gas mixture is divided into four groups:
i. Methane ii. Propane iii. Hydrogen
3 Dutton B.C. Interchangeability Prediction – the Framework for a New Approach. J. Inst. Fuel 51 (1978). 4 Dutton B.C. Dutton. A new dimension to gas interchangeability. IGE Communication 1246. Presented at the 50th Autumn Meeting of the Institution of Gas Engineers. November 1984. 5 DTI. Future arrangements for Great Britain’s gas quality specifications. A public consultation. 29th December 2005 6 DBERR. Future arrangements for Great Britain’s gas quality specifications. Government Response to consultation on future arrangements for Great Britain’s gas quality specifications. November 2007.
Page 6 of 28
iv. Inerts
Hydrocarbons are assigned to the methane and propane groups by converting each hydrocarbon to an equivalent mixture of propane and methane that has the same ideal gas volume and same average number of carbon atoms per molecule of that hydrocarbon.
Inerts gases (nitrogen, carbon dioxide, oxygen, water vapour, etc.) are assumed to be nitrogen and the content of nitrogen is calculated as that amount that, when mixed with the non-inert components of the original mixture in their existing ratios, gives a Wobbe index equal to that of the original mixture.
2.2.2 APPLIANCE MALOPERATION
Key modes of appliance mal-operation were assessed for a number of appliances and an Index was developed that indicated tendency for such mal-operation. Furthermore, empirical relationships were developed to enable each Index to be calculated from the composition of the equivalent mixture. The four indices chosen are:
a) The Wobbe Index, which indicates heat service b) The Lift Index, which indicates flame stability c) The Incomplete Combustion Factor, which indicates tendency towards incomplete
combustion d) The Sooting Index, which indicates tendency towards production of soot.
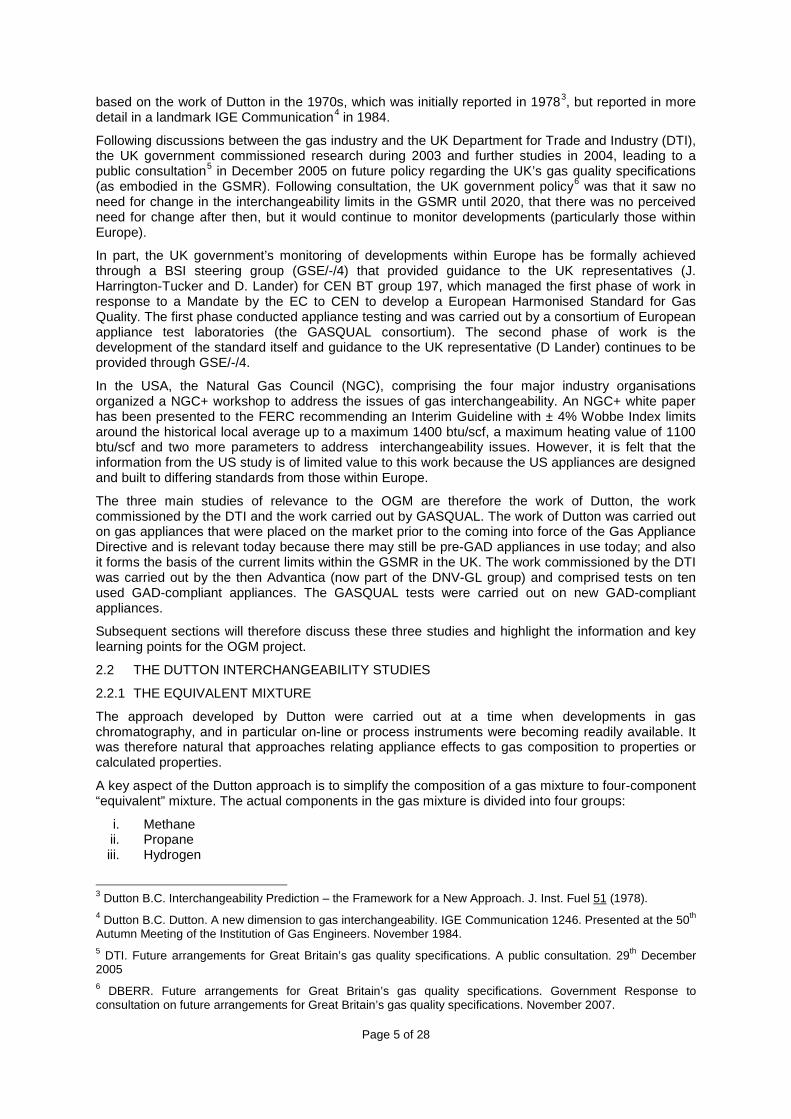
Lift Index (LI) was determined from testing of 30 cookers of varying age, style and burner type, all on a single test bed. Flame stability was assessed on a scale from Lift Number = 0 (No visible separation of the flame base and burner) to Lift Number = 6 (Complete detachment of 50% - 100% of the flame). Lift index for a particular test gas was calculated as the average Lift Number across all burners on the test rig.
Figure 1 below shows the results reported by Dutton in reference 4 for test gases containing zero hydrogen.
Figure 1: Lift Index results reported by Dutton in reference 4.
Incomplete Combustion Factor (ICF) was determined from test of eight instantaneous water heaters with 52 test gases comprising methane, propane, hydrogen and nitrogen.
Incomplete combustion can be assessed by determining the CO/CO2 ratio in the flue products and in general an increase in Wobbe index of around 1.5 MJ/m3 leads to an approximate doubling of CO/CO2 ratio. By comparing the CO/CO2 ratio for a given appliance over a range of heat input with a given test gas with that obtained with pure methane (the reference test gas for natural gases) the

Page 7 of 28
propensity towards incomplete combustion can be determined. This can be seen in Figure 2 below, an example test reported by Dutton in reference 4.
Figure 2: Example plots of CO/CO2 ratio reported by Dutton in reference 4.
ICF for a particular test gas and appliance was defined by Dutton as the average separation of the two plots for the test over the range of nominal input to 20% overload. The ICF for a particular test gas was taken to be the average of the eight water heaters of the test bed. Logarithms to base 2 were employed so the average separation
represents the number of times the CO/CO2 ratio in the reference gas has to be doubled to give the CO/CO2 ratio in the test gas:
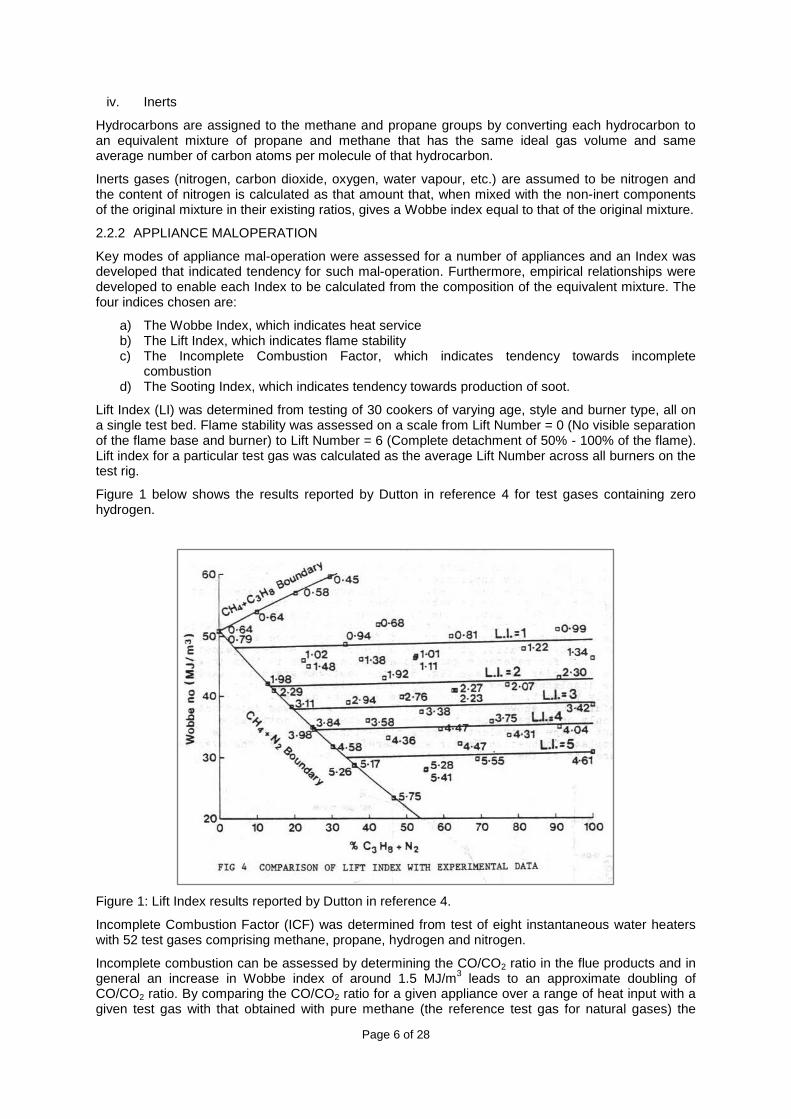
Plots of ICF reported by Dutton in reference 4 are shown in Figure 3 below.
Page 8 of 28
Figure 3: plots of ICF reported by Dutton in reference 4.
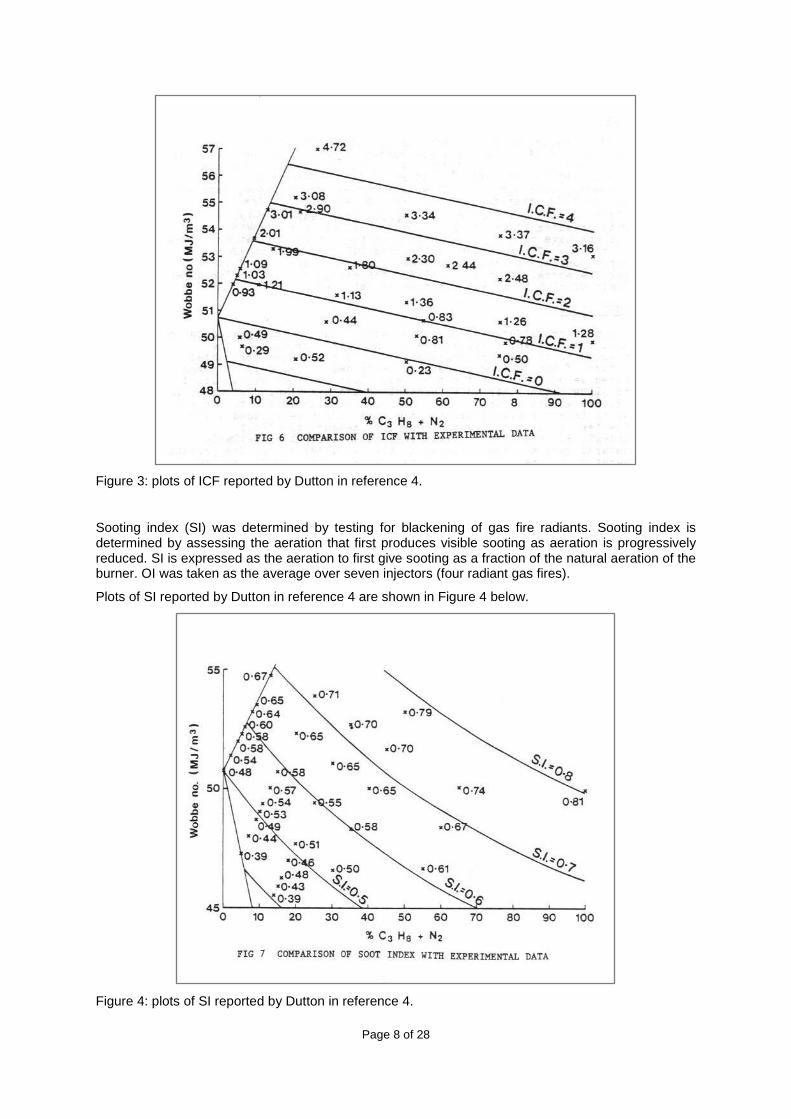
Sooting index (SI) was determined by testing for blackening of gas fire radiants. Sooting index is determined by assessing the aeration that first produces visible sooting as aeration is progressively reduced. SI is expressed as the aeration to first give sooting as a fraction of the natural aeration of the burner. OI was taken as the average over seven injectors (four radiant gas fires).
Plots of SI reported by Dutton in reference 4 are shown in Figure 4 below.
Figure 4: plots of SI reported by Dutton in reference 4.
Page 9 of 28
2.2.3 LIFT INDEX LIMIT
Regarding Lift Index, in reference 4, Dutton states that the traditional lean gas limit used in the past7,8
In fact the WI of G20 (the reference gas for H-gas, which is pure methane) is not 47.3 MJ/m3, but as follows:
was a WI of 5% below that of the reference gas and that this value equates to 47.3 MJ/m3 for H-gas.
Table 1: Wobbe indices of G20 reference gas according to various standards
ISO 6976:1983 (First Edition) ISO 6976:1995 (Second Edition) EN 437:2003
G20 50.71 MJ/m3 50.72 MJ/m3 50.72 MJ/m3
95% 48.18 MJ/m3 48.19 MJ/m3 48.19 MJ/m3
105% 53.25 MJ/m3 53.25 MJ/m3 53.25 MJ/m3
108% 54.77 MJ/m3 54.78 MJ/m3 54.78 MJ/m3
There is a small difference between values calculated according to the first edition of ISO 6976 and the current edition – at the time of publication of reference 7 the first edition was in use.
The value of 47.3 MJ/m3 cited by Dutton corresponds to the reference gas when saturated with water and not the dry gas.
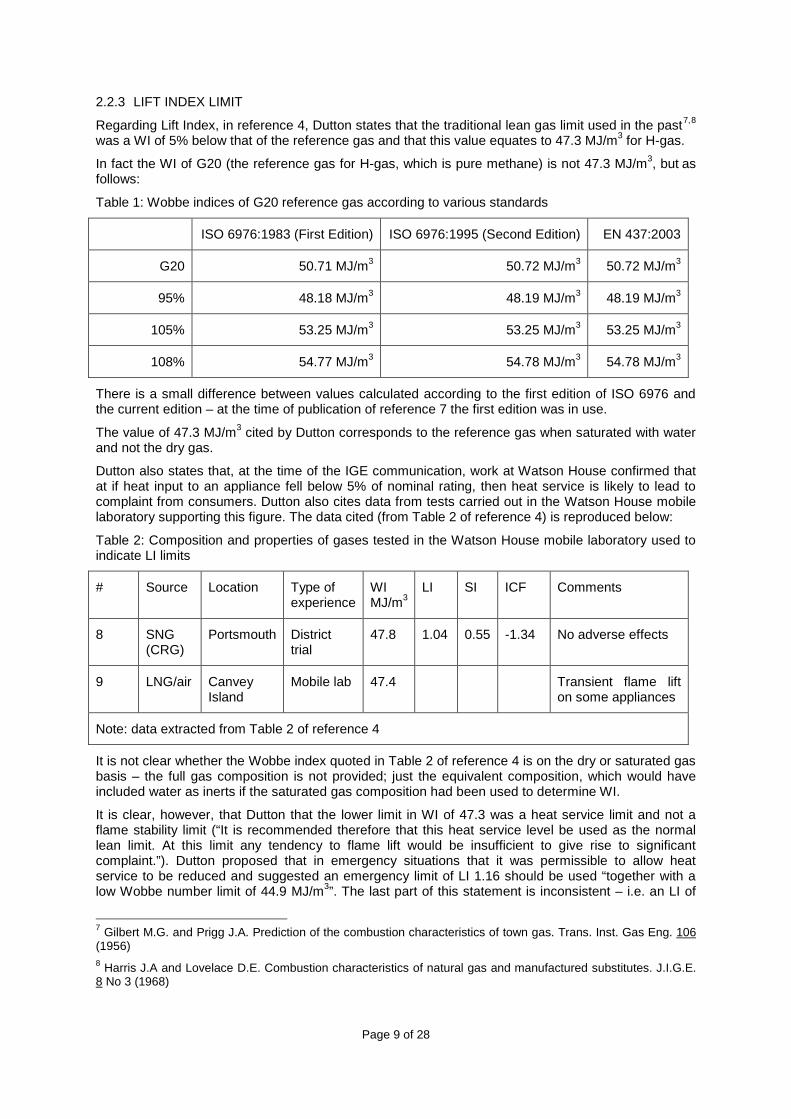
Dutton also states that, at the time of the IGE communication, work at Watson House confirmed that at if heat input to an appliance fell below 5% of nominal rating, then heat service is likely to lead to complaint from consumers. Dutton also cites data from tests carried out in the Watson House mobile laboratory supporting this figure. The data cited (from Table 2 of reference 4) is reproduced below:
Table 2: Composition and properties of gases tested in the Watson House mobile laboratory used to indicate LI limits
# Source Location Type of experience
WI MJ/m3
LI SI ICF Comments
8 SNG (CRG)
Portsmouth District trial
47.8 1.04 0.55 -1.34 No adverse effects
9 LNG/air Canvey Island
Mobile lab 47.4 Transient flame lift on some appliances
Note: data extracted from Table 2 of reference 4
It is not clear whether the Wobbe index quoted in Table 2 of reference 4 is on the dry or saturated gas basis – the full gas composition is not provided; just the equivalent composition, which would have included water as inerts if the saturated gas composition had been used to determine WI.
It is clear, however, that Dutton that the lower limit in WI of 47.3 was a heat service limit and not a flame stability limit (“It is recommended therefore that this heat service level be used as the normal lean limit. At this limit any tendency to flame lift would be insufficient to give rise to significant complaint.”). Dutton proposed that in emergency situations that it was permissible to allow heat service to be reduced and suggested an emergency limit of LI 1.16 should be used “together with a low Wobbe number limit of 44.9 MJ/m3”. The last part of this statement is inconsistent – i.e. an LI of
7 Gilbert M.G. and Prigg J.A. Prediction of the combustion characteristics of town gas. Trans. Inst. Gas Eng. 106 (1956) 8 Harris J.A and Lovelace D.E. Combustion characteristics of natural gas and manufactured substitutes. J.I.G.E. 8 No 3 (1968)
Page 10 of 28
1.16 is inconsistent with a Wobbe number of 44.9 MJ/m3 and this has been interpreted to mean that Dutton intended an emergency limit of LI 1.16 and an extreme emergency limit of 44.9 MJ/m3, which corresponds to LI 1.38. The extreme emergency limit corresponds to test gas G23 (saturated).
2.2.4 INCOMPLETE COMBUSTION FACTOR LIMITS
Regarding ICF, in reference 4, Dutton states that the traditional lean gas limit used in the past was a WI of 5% above that of the reference gas and that this value equates to 52.1 MJ/m3 for H-gas, with and emergency limit (+8%) of 53.6 MJ/m3. However, following a survey of gas appliances in 1978, it had been agreed that the normal and emergency limits be fixed at 51.2 MJ/m3 and 52.1 MJ/m3, respectively.
However, as with limit setting for Lift Index, Dutton appears to have set the ICF limit at a WI of +5% and 8% of that of the saturated reference gas and not that of the dry reference gas. Using values calculated with the 1983 edition of ISO 6976 in Table 1, the dry gas values traditionally employed are 53.25 MJ/m3 and 54.77 MJ/m3. If the limits finally proposed by Dutton are assumed to be for the saturated gas, then for the dry gas, they become 52.3 MJ/m3 and 53.3 MJ/m3, respectively.
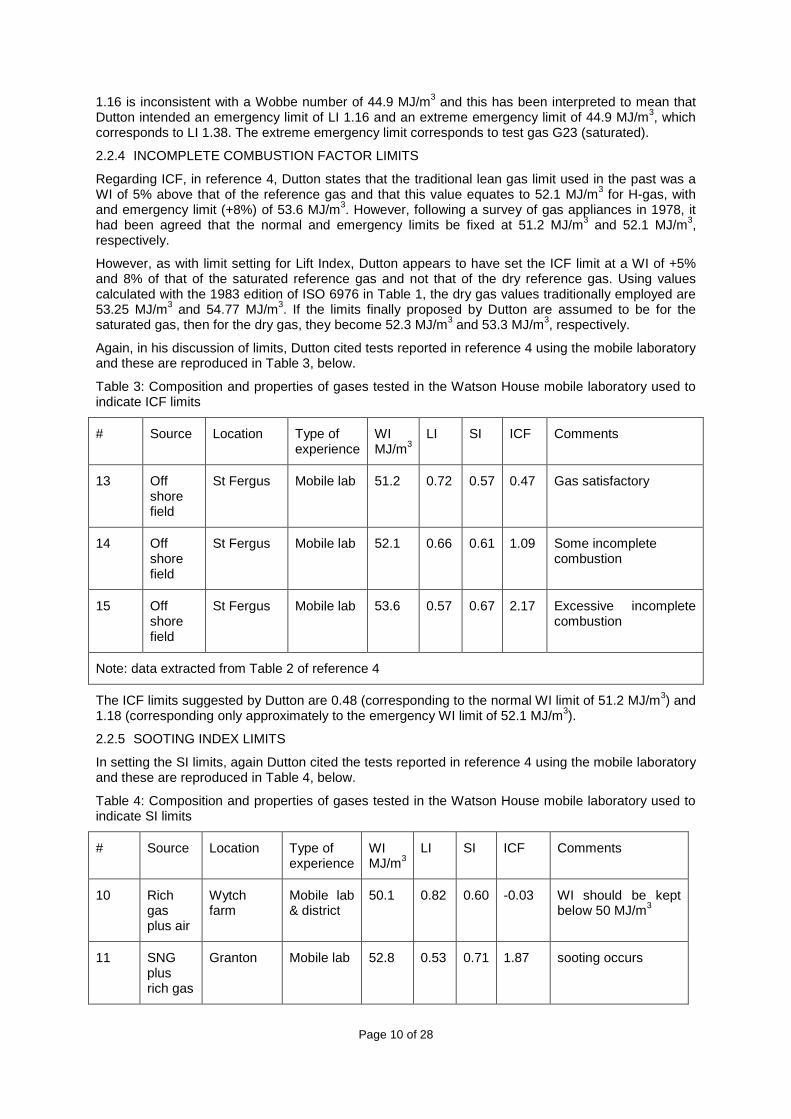
Again, in his discussion of limits, Dutton cited tests reported in reference 4 using the mobile laboratory and these are reproduced in Table 3, below.
Table 3: Composition and properties of gases tested in the Watson House mobile laboratory used to indicate ICF limits
# Source Location Type of experience
WI MJ/m3
LI SI ICF Comments
13 Off shore field
St Fergus Mobile lab 51.2 0.72 0.57 0.47 Gas satisfactory
14 Off shore field
St Fergus Mobile lab 52.1 0.66 0.61 1.09 Some incomplete combustion
15 Off shore field
St Fergus Mobile lab 53.6 0.57 0.67 2.17 Excessive incomplete combustion
Note: data extracted from Table 2 of reference 4
The ICF limits suggested by Dutton are 0.48 (corresponding to the normal WI limit of 51.2 MJ/m3) and 1.18 (corresponding only approximately to the emergency WI limit of 52.1 MJ/m3).
2.2.5 SOOTING INDEX LIMITS
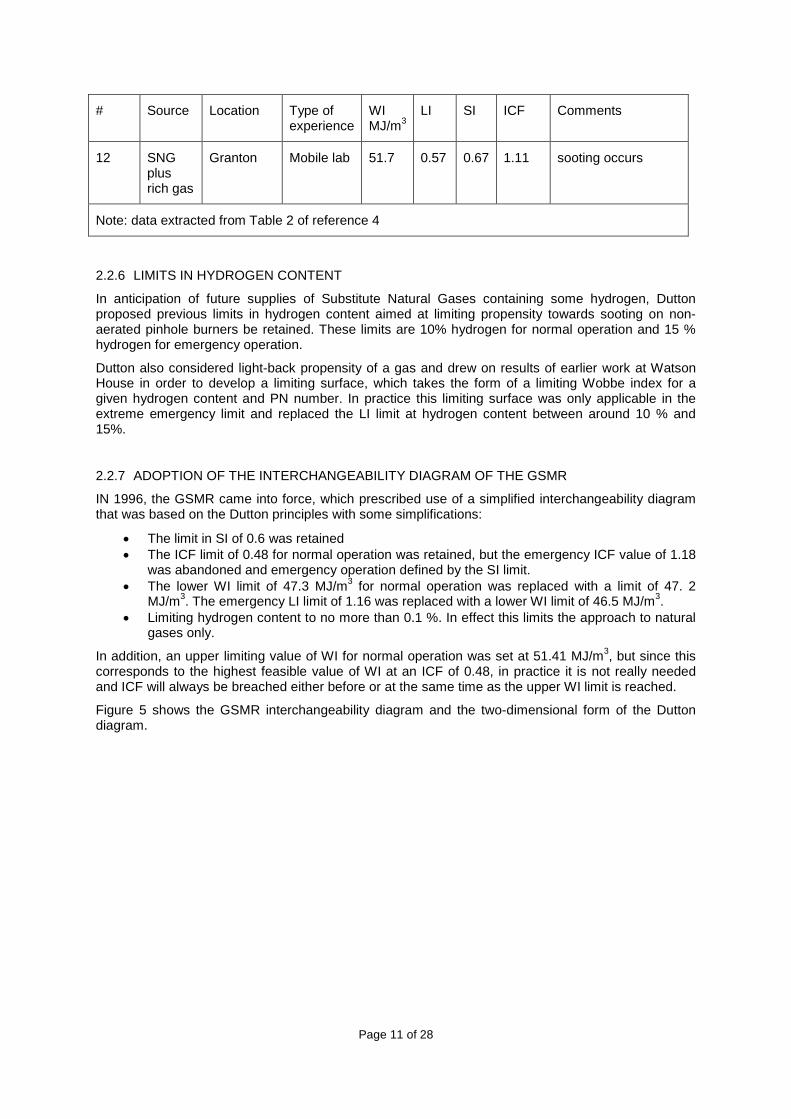
In setting the SI limits, again Dutton cited the tests reported in reference 4 using the mobile laboratory and these are reproduced in Table 4, below.
Table 4: Composition and properties of gases tested in the Watson House mobile laboratory used to indicate SI limits
# Source Location Type of experience
WI MJ/m3
LI SI ICF Comments
10 Rich gas plus air
Wytch farm
Mobile lab & district
50.1 0.82 0.60 -0.03 WI should be kept below 50 MJ/m3
11 SNG plus rich gas
Granton Mobile lab 52.8 0.53 0.71 1.87 sooting occurs
Page 11 of 28
# Source Location Type of experience
WI MJ/m3
LI SI ICF Comments
12 SNG plus rich gas
Granton Mobile lab 51.7 0.57 0.67 1.11 sooting occurs
Note: data extracted from Table 2 of reference 4
2.2.6 LIMITS IN HYDROGEN CONTENT
In anticipation of future supplies of Substitute Natural Gases containing some hydrogen, Dutton proposed previous limits in hydrogen content aimed at limiting propensity towards sooting on non-aerated pinhole burners be retained. These limits are 10% hydrogen for normal operation and 15 % hydrogen for emergency operation.
Dutton also considered light-back propensity of a gas and drew on results of earlier work at Watson House in order to develop a limiting surface, which takes the form of a limiting Wobbe index for a given hydrogen content and PN number. In practice this limiting surface was only applicable in the extreme emergency limit and replaced the LI limit at hydrogen content between around 10 % and 15%.
2.2.7 ADOPTION OF THE INTERCHANGEABILITY DIAGRAM OF THE GSMR
IN 1996, the GSMR came into force, which prescribed use of a simplified interchangeability diagram that was based on the Dutton principles with some simplifications:
• The limit in SI of 0.6 was retained • The ICF limit of 0.48 for normal operation was retained, but the emergency ICF value of 1.18
was abandoned and emergency operation defined by the SI limit. • The lower WI limit of 47.3 MJ/m3 for normal operation was replaced with a limit of 47. 2
MJ/m3. The emergency LI limit of 1.16 was replaced with a lower WI limit of 46.5 MJ/m3. • Limiting hydrogen content to no more than 0.1 %. In effect this limits the approach to natural
gases only.
In addition, an upper limiting value of WI for normal operation was set at 51.41 MJ/m3, but since this corresponds to the highest feasible value of WI at an ICF of 0.48, in practice it is not really needed and ICF will always be breached either before or at the same time as the upper WI limit is reached.
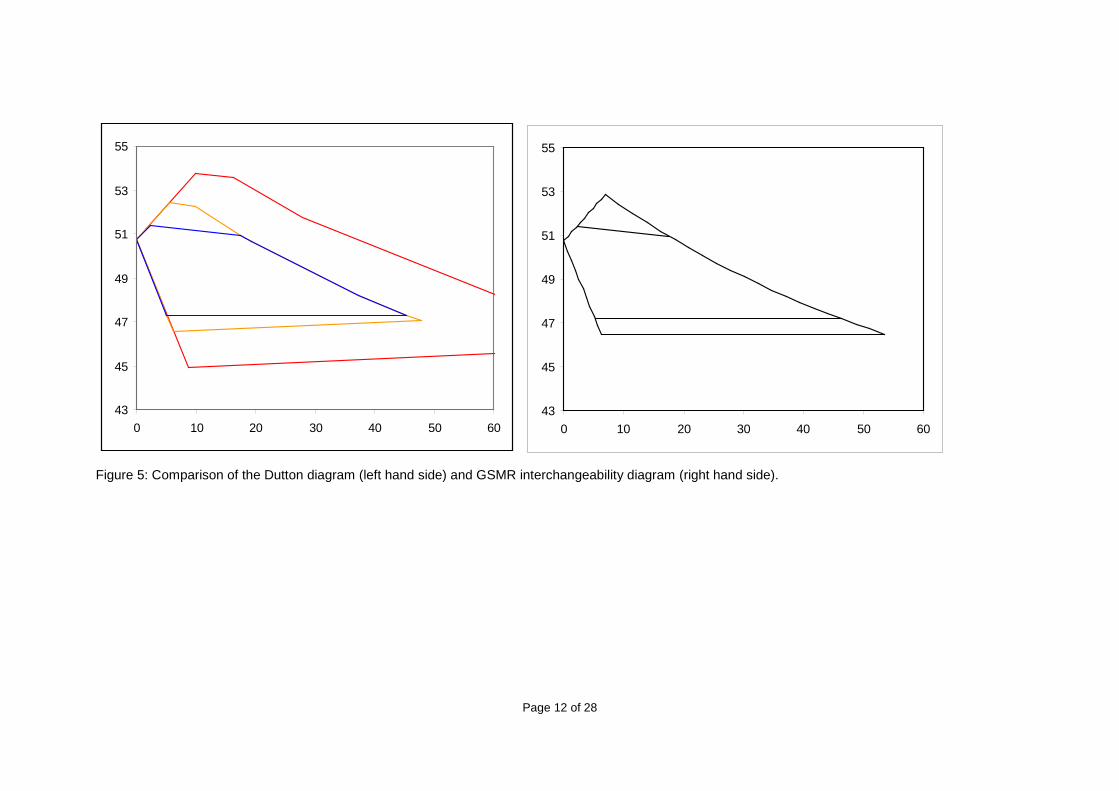
Figure 5 shows the GSMR interchangeability diagram and the two-dimensional form of the Dutton diagram.
Page 12 of 28
Figure 5: Comparison of the Dutton diagram (left hand side) and GSMR interchangeability diagram (right hand side).
43
45
47
49
51
53
55
0 10 20 30 40 50 6043
45
47
49
51
53
55
0 10 20 30 40 50 60
Page 13 of 28
2.3 THE ADVANTICA STUDIES COMMISSIONED BY THE DTI
2.3.1 GENERAL
These two studies were carried out by Advantica in 2004 and 2005 and comprised part of the work commissioned by the then UK Department of Trade and Industry as part of its review of the current interchangeability limits within the GSMR. Two studies were commissioned:
• A small “pilot” study9
• A follow-up study
, in which five used appliances were subject to detailed testing: a gas fire, a freestanding cooker, an instantaneous water heater, a standard fan-assisted boiler and a condensing boiler.
10
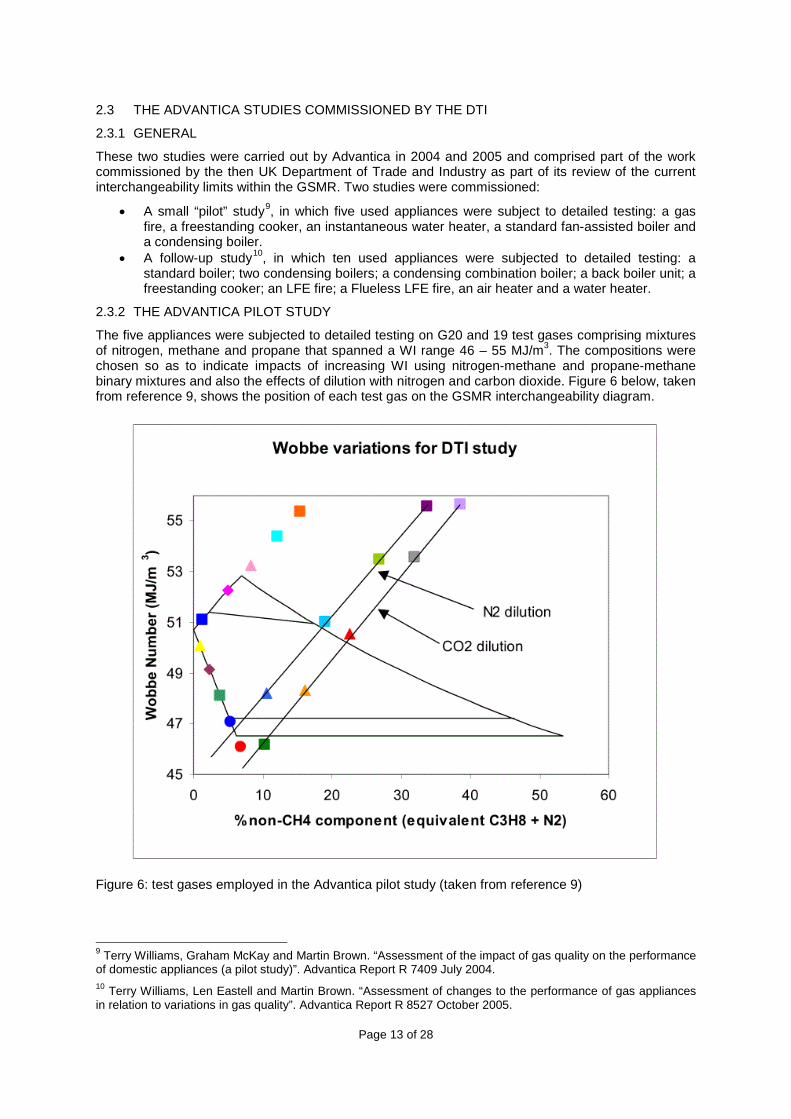
2.3.2 THE ADVANTICA PILOT STUDY
, in which ten used appliances were subjected to detailed testing: a standard boiler; two condensing boilers; a condensing combination boiler; a back boiler unit; a freestanding cooker; an LFE fire; a Flueless LFE fire, an air heater and a water heater.
The five appliances were subjected to detailed testing on G20 and 19 test gases comprising mixtures of nitrogen, methane and propane that spanned a WI range 46 – 55 MJ/m3. The compositions were chosen so as to indicate impacts of increasing WI using nitrogen-methane and propane-methane binary mixtures and also the effects of dilution with nitrogen and carbon dioxide. Figure 6 below, taken from reference 9, shows the position of each test gas on the GSMR interchangeability diagram.
Figure 6: test gases employed in the Advantica pilot study (taken from reference 9)
9 Terry Williams, Graham McKay and Martin Brown. “Assessment of the impact of gas quality on the performance of domestic appliances (a pilot study)”. Advantica Report R 7409 July 2004. 10 Terry Williams, Len Eastell and Martin Brown. “Assessment of changes to the performance of gas appliances in relation to variations in gas quality”. Advantica Report R 8527 October 2005.
Page 14 of 28
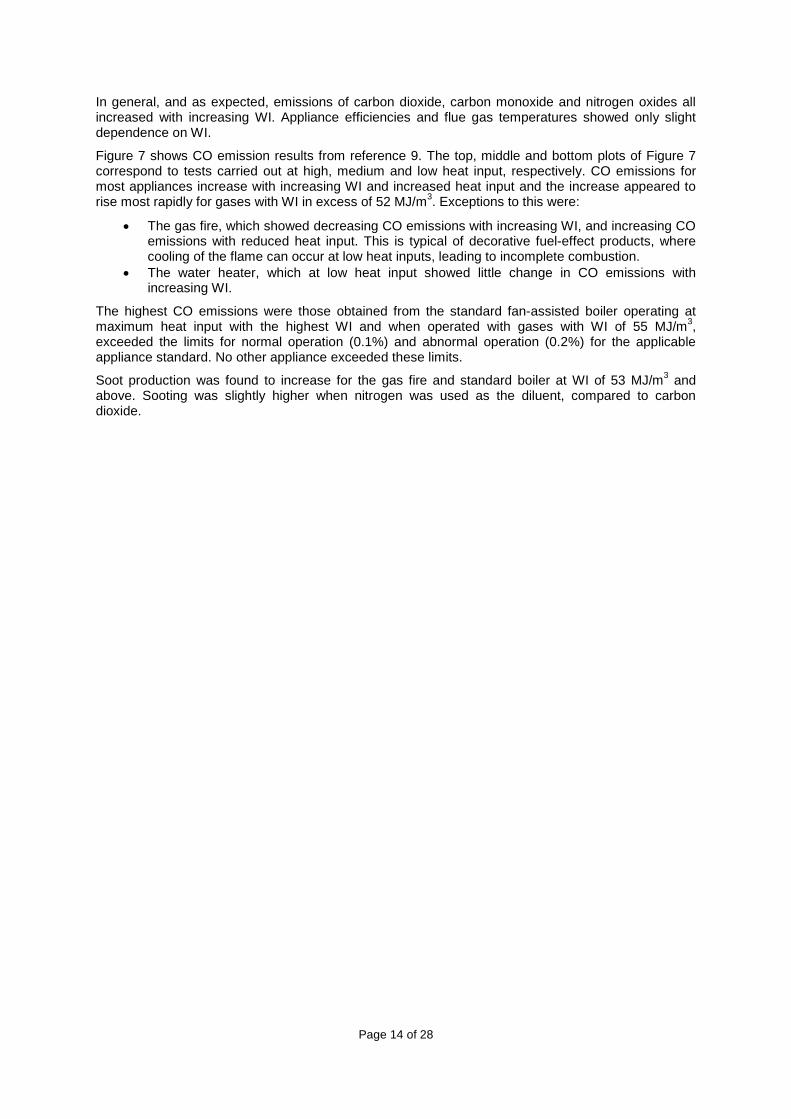
In general, and as expected, emissions of carbon dioxide, carbon monoxide and nitrogen oxides all increased with increasing WI. Appliance efficiencies and flue gas temperatures showed only slight dependence on WI.
Figure 7 shows CO emission results from reference 9. The top, middle and bottom plots of Figure 7 correspond to tests carried out at high, medium and low heat input, respectively. CO emissions for most appliances increase with increasing WI and increased heat input and the increase appeared to rise most rapidly for gases with WI in excess of 52 MJ/m3. Exceptions to this were:
• The gas fire, which showed decreasing CO emissions with increasing WI, and increasing CO emissions with reduced heat input. This is typical of decorative fuel-effect products, where cooling of the flame can occur at low heat inputs, leading to incomplete combustion.
• The water heater, which at low heat input showed little change in CO emissions with increasing WI.
The highest CO emissions were those obtained from the standard fan-assisted boiler operating at maximum heat input with the highest WI and when operated with gases with WI of 55 MJ/m3, exceeded the limits for normal operation (0.1%) and abnormal operation (0.2%) for the applicable appliance standard. No other appliance exceeded these limits.
Soot production was found to increase for the gas fire and standard boiler at WI of 53 MJ/m3 and above. Sooting was slightly higher when nitrogen was used as the diluent, compared to carbon dioxide.
Page 15 of 28
Figure 7: CO emission results from the Advantica pilot study (taken from reference 9).
2.3.3 THE ADVANTIC FOLLOW-UP STUDY
Following confirmation that increased WI could – at the highest levels at least – give some concern on some appliances, the DTI commissioned further work to extend the range of appliances tested and also evaluate the impact of long-term operation with a gas of high (51.4 MJ/m3) WI.
The gases employed in the testing covered the WI range 45 – 56 MJ/m3 and Figure 8 below, taken from reference 10, shows the position of each test gas on the GSMR interchangeability diagram.

Page 16 of 28
Testing was carried out on the appliances as received and also after servicing in accordance with the manufacturers’ instructions.
In general, emissions of CO increased with increasing WI and the increase in emissions was found to be substantial for most appliances with gases on WI in excess of 53 MJ/m3. Servicing was found to impact on emission levels and in general significant improvement was seen in most cases (although in one instance a marginal deterioration was seen after servicing).
Figure 8: test gases employed in the Advantica follow-up study (taken from reference 10)
2.3.3.1 SUMMARY OF RESULTS FROM THE ADVANTICA FOLLOW-UP STUDY
Condensing Boilers:
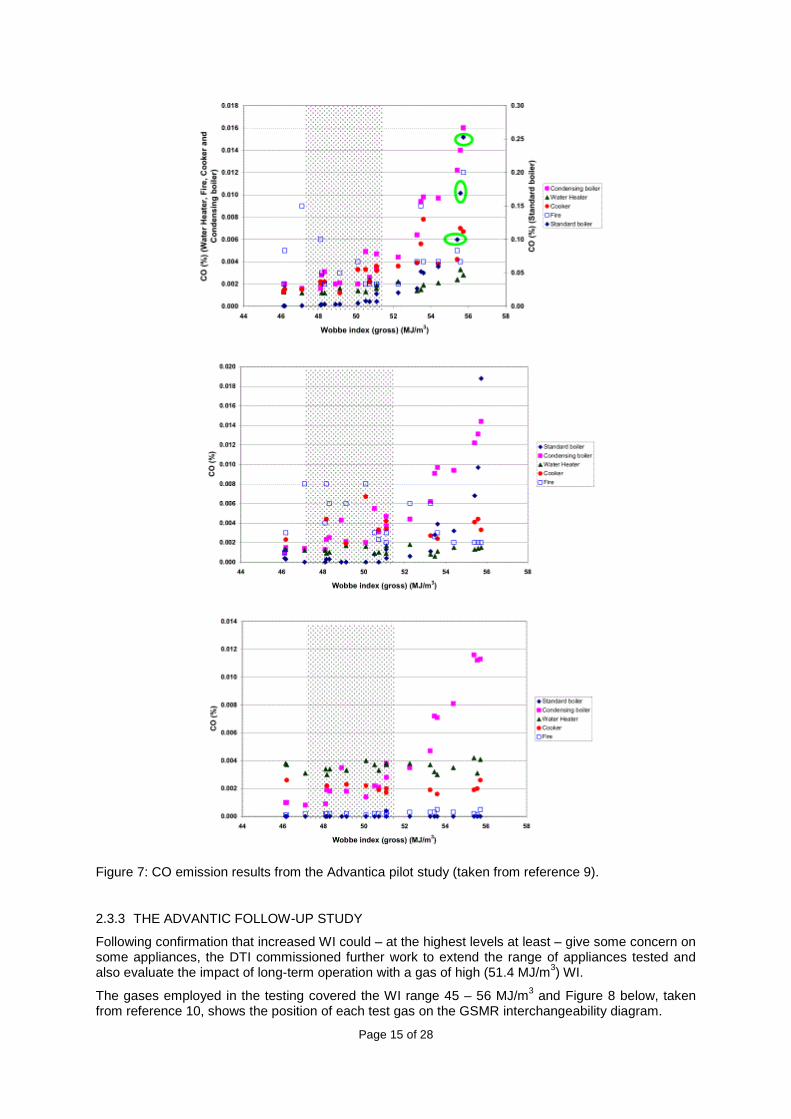
Figures 9 – 12 illustrate the increases seen and show CO emissions from the two condensing boilers that were tested at high and low rate.
Page 17 of 28
Figure 9: CO emission results from the Advantica follow-up study – Condensing Boiler 1 High rate (taken from reference 10).
Figure 10: CO emission results from the Advantica follow-up study – Condensing Boiler 1 Low rate (taken from reference 10).
Page 18 of 28
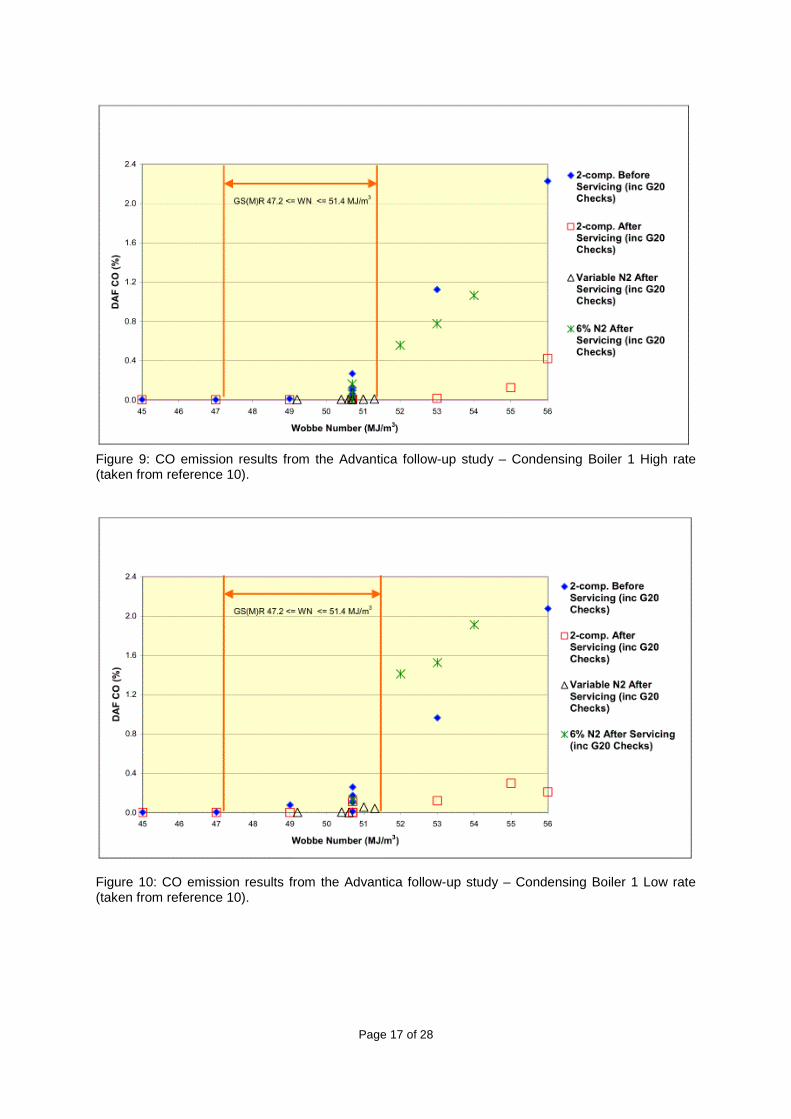
Figure 11: CO emission results from the Advantica follow-up study – Condensing Boiler 2 High rate (taken from reference 10).
Figure 12: CO emission results from the Advantica follow-up study – Condensing Boiler 2 Low rate (taken from reference 10).
Condensing boiler 1 was removed from a rented property and this would have indicated regular servicing. However when the boiler was examined prior to servicing, a number of faults were

Page 19 of 28
discovered. The main problem was that a metal air-mixing box was not secured correctly and had become dislodged. As a result there was considerable methane slippage and significant emissions of CO observed in the pre-servicing testing.
Standard boiler:
CO emissions were very low overall. At high heat input CO emissions remained flat with increasing WI, but for low heat input there was a slight increase in CO emissions.
Cooker:
At high heat input, across much of the WI range (i.e. above 47 MJ/m3), CO emissions were close to and exceeded the 0.1% threshold permitted by the standard for this appliance. Servicing appeared to have a slight detrimental effect on performance. Visual inspection suggested that there were some flame stability issues with the burner.
Back boiler unit:
In general CO levels were low and tended to increase only with gases above 53 MJ/m3. For lower WI gases, the CO emissions from the fire tended to dominate, whereas those from the boiler tended to dominate at higher WI.
LFE fire:
CO emissions were almost always in excess of the 01% threshold and relatively flat and characteristic of the fire and not a function of gas quality.
Air heater:
In general CO levels were low and tended to increase only with gases above 53 MJ/m3. The threshold value of 0.1% was exceeded at 56 MJ/m3, although after servicing the results were much reduced to below 0.04%.
Water heater:
In general CO levels were low and tended to increase only with gases above 53 MJ/m3. After servicing, the CO emissions exceeded the 0.1% threshold with the gas of WI 56 MJ/m3.
Condensing combination boiler:
At high heat input, CO levels were low and tended to increase steadily cross the whole WI range. At low heat input, CO levels were lower and tended to change little across the WI range.
Flueless fire:
Extremely low levels of CO were emitted, as might be expected from a Flueless appliance that incorporates a combustion catalyst.
2.4 THE GASQUAL STUDY COMMISSIONED BY THE EUROPEAN COMMISSION
2.4.1 BAC KGROUND TO THE GASQUAL STUDY
In January 2007, the European Commission issued mandate M/400 to CEN inviting them to draft a European Standard for Natural Gas corresponding to Group 2H. The mandate is the end result of a number of European initiatives driven by the need to develop a common European gas market. A key aspect felt to be inhibiting development of such a market is interoperability, a term which embraces a number of aspects (such as communications protocols, commercial mechanisms, units of
Page 20 of 28
measurement, etc.) but most important amongst these is a perceived barrier to free trade caused by differences between specifications for natural gas in many European countries.
The mandate was accepted by CEN and hence CEN are in the final stage of executing a large programme of work necessary to develop such a standard (or set of standards). This programme of work comprised two Phases:
• a first 2-year “research” phase, comprising the creation of an overview of the existing population of gas appliances, of certification, installation and inspection rules and practices and of the behaviour of domestic appliances;
• a second 3-year phase, comprising the drafting of European standards that set out minimum criteria for gas quality.
The first phase was carried out by an international consortium of appliance testing laboratories called GASQUAL, managed by CEN BT WG 197 - Gas Quality. It comprised three work packages (a market study, a study of appliance certification practices and a study of appliance installation and inspection rules and practices) designed to feed information into a fourth work package to select appliances for testing and the testing programme. A fifth work package comprises the appliance testing itself and the sixth work package drew conclusions.
The second phase is being carried out by CEN TC234 WG11 and is dues to complete its work in 2014.
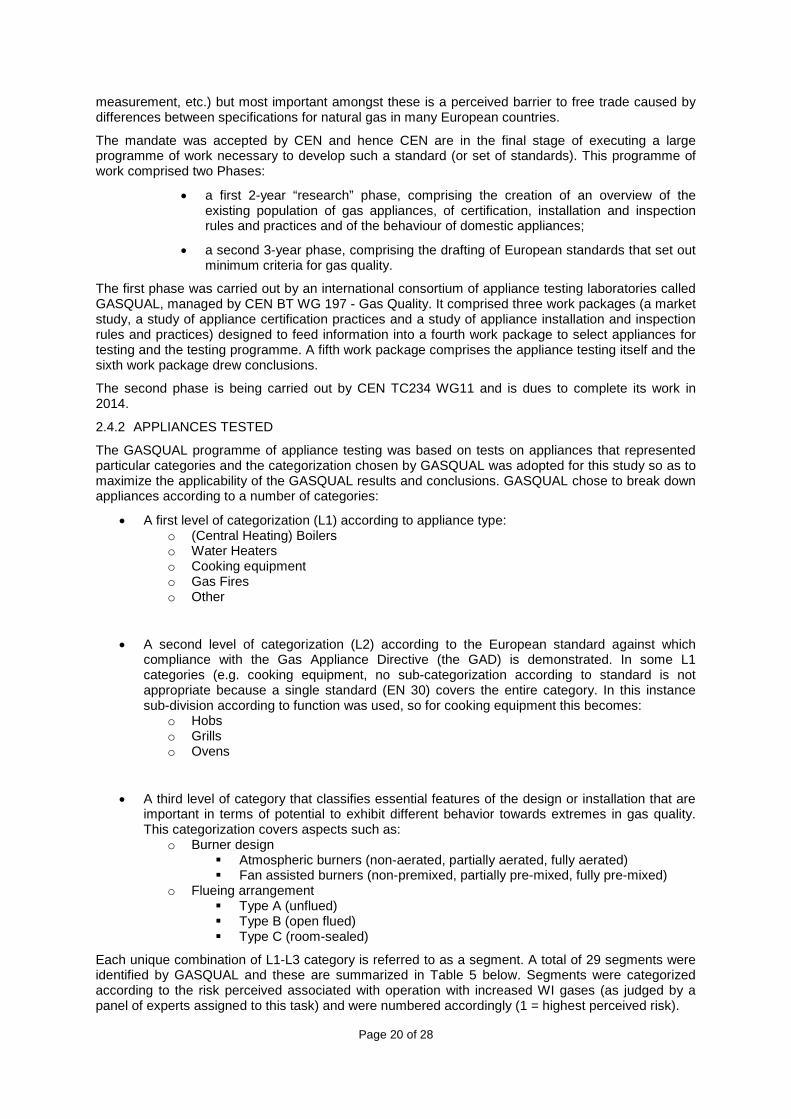
2.4.2 APPLIANCES TESTED
The GASQUAL programme of appliance testing was based on tests on appliances that represented particular categories and the categorization chosen by GASQUAL was adopted for this study so as to maximize the applicability of the GASQUAL results and conclusions. GASQUAL chose to break down appliances according to a number of categories:
• A first level of categorization (L1) according to appliance type: o (Central Heating) Boilers o Water Heaters o Cooking equipment o Gas Fires o Other
• A second level of categorization (L2) according to the European standard against which compliance with the Gas Appliance Directive (the GAD) is demonstrated. In some L1 categories (e.g. cooking equipment, no sub-categorization according to standard is not appropriate because a single standard (EN 30) covers the entire category. In this instance sub-division according to function was used, so for cooking equipment this becomes:
o Hobs o Grills o Ovens
• A third level of category that classifies essential features of the design or installation that are important in terms of potential to exhibit different behavior towards extremes in gas quality. This categorization covers aspects such as:
o Burner design Atmospheric burners (non-aerated, partially aerated, fully aerated) Fan assisted burners (non-premixed, partially pre-mixed, fully pre-mixed)
o Flueing arrangement Type A (unflued) Type B (open flued) Type C (room-sealed)
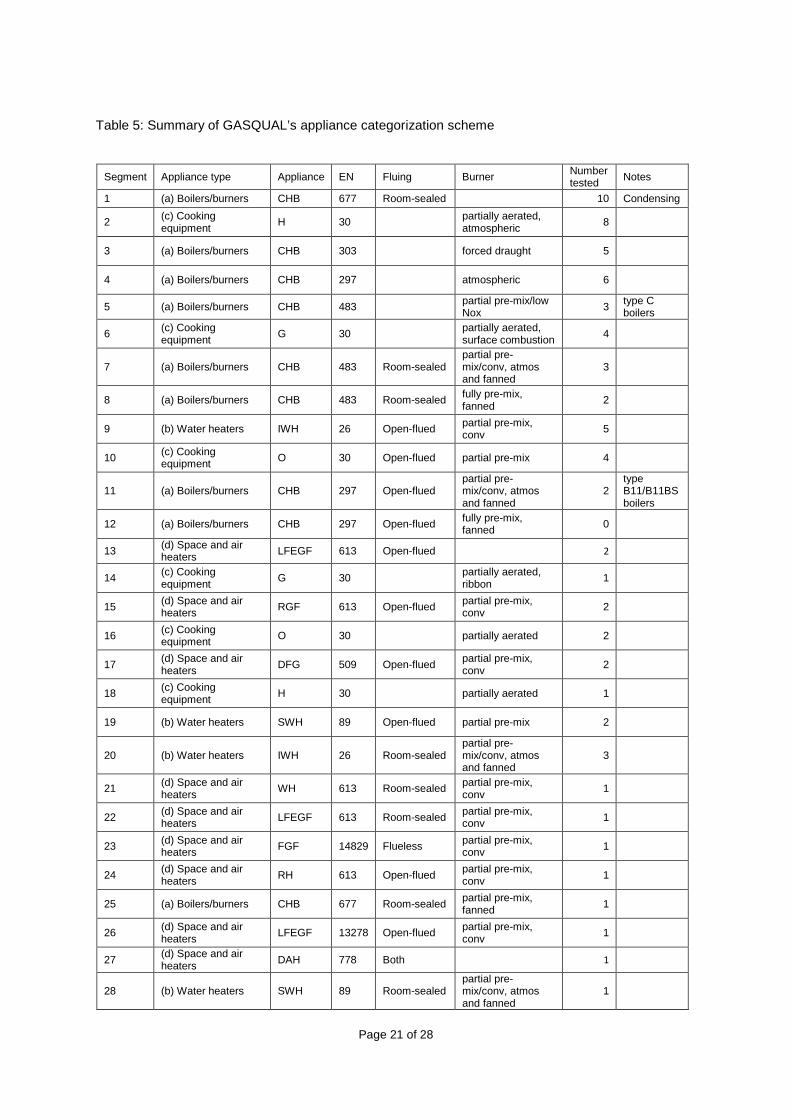
Each unique combination of L1-L3 category is referred to as a segment. A total of 29 segments were identified by GASQUAL and these are summarized in Table 5 below. Segments were categorized according to the risk perceived associated with operation with increased WI gases (as judged by a panel of experts assigned to this task) and were numbered accordingly (1 = highest perceived risk).
Page 21 of 28
Table 5: Summary of GASQUAL’s appliance categorization scheme
Segment Appliance type Appliance EN Fluing Burner Number tested Notes
1 (a) Boilers/burners CHB 677 Room-sealed
10 Condensing
2 (c) Cooking equipment H 30
partially aerated, atmospheric 8
3 (a) Boilers/burners CHB 303
forced draught 5
4 (a) Boilers/burners CHB 297
atmospheric 6
5 (a) Boilers/burners CHB 483
partial pre-mix/low Nox 3 type C
boilers
6 (c) Cooking equipment G 30
partially aerated, surface combustion 4
7 (a) Boilers/burners CHB 483 Room-sealed partial pre-mix/conv, atmos and fanned
3
8 (a) Boilers/burners CHB 483 Room-sealed fully pre-mix, fanned 2
9 (b) Water heaters IWH 26 Open-flued partial pre-mix,
conv 5
10 (c) Cooking equipment O 30 Open-flued partial pre-mix 4
11 (a) Boilers/burners CHB 297 Open-flued partial pre-mix/conv, atmos and fanned
2 type B11/B11BS boilers
12 (a) Boilers/burners CHB 297 Open-flued fully pre-mix, fanned 0
13 (d) Space and air
heaters LFEGF 613 Open-flued
2
14 (c) Cooking equipment G 30
partially aerated, ribbon 1
15 (d) Space and air
heaters RGF 613 Open-flued partial pre-mix, conv 2
16 (c) Cooking
equipment O 30
partially aerated 2
17 (d) Space and air heaters DFG 509 Open-flued partial pre-mix,
conv 2
18 (c) Cooking equipment H 30
partially aerated 1
19 (b) Water heaters SWH 89 Open-flued partial pre-mix 2
20 (b) Water heaters IWH 26 Room-sealed partial pre-mix/conv, atmos and fanned
3
21 (d) Space and air heaters WH 613 Room-sealed partial pre-mix,
conv 1
22 (d) Space and air heaters LFEGF 613 Room-sealed partial pre-mix,
conv 1
23 (d) Space and air heaters FGF 14829 Flueless partial pre-mix,
conv 1
24 (d) Space and air heaters RH 613 Open-flued partial pre-mix,
conv 1
25 (a) Boilers/burners CHB 677 Room-sealed partial pre-mix, fanned 1
26 (d) Space and air
heaters LFEGF 13278 Open-flued partial pre-mix, conv 1
27 (d) Space and air
heaters DAH 778 Both
1
28 (b) Water heaters SWH 89 Room-sealed partial pre-mix/conv, atmos and fanned
1
Page 22 of 28
Segment Appliance type Appliance EN Fluing Burner Number tested Notes
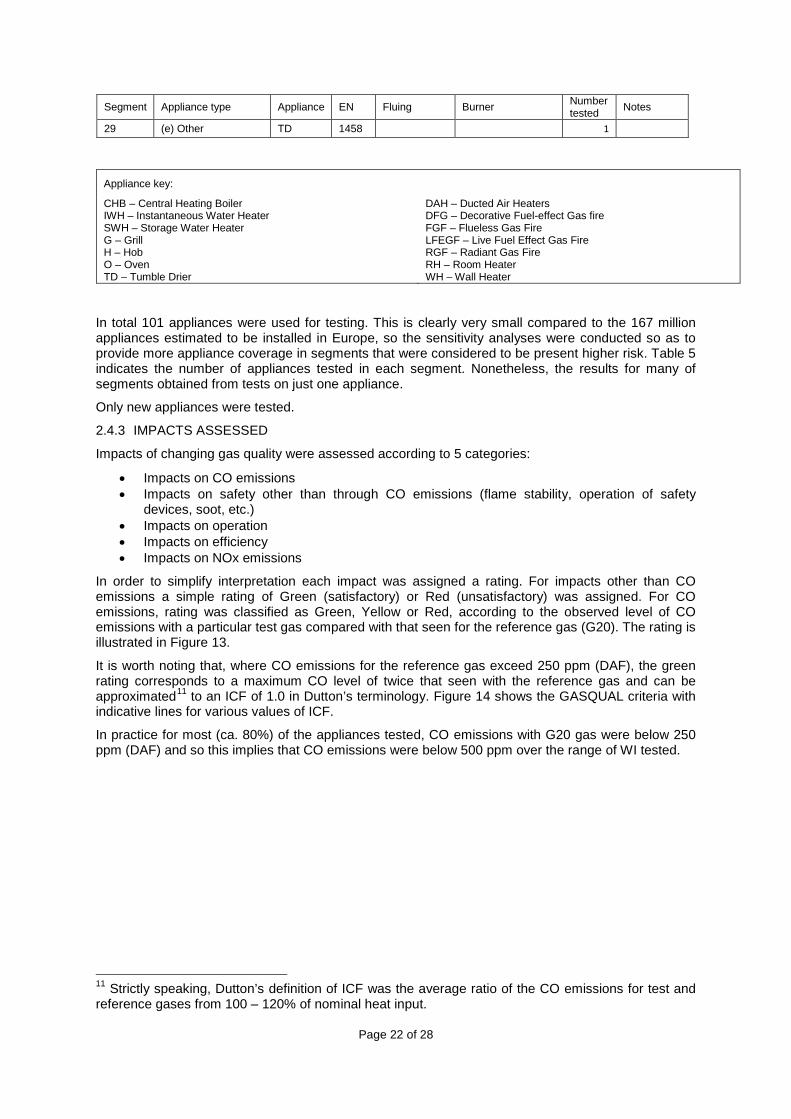
29 (e) Other TD 1458
1
Appliance key:
CHB – Central Heating Boiler IWH – Instantaneous Water Heater SWH – Storage Water Heater G – Grill H – Hob O – Oven TD – Tumble Drier
DAH – Ducted Air Heaters DFG – Decorative Fuel-effect Gas fire FGF – Flueless Gas Fire LFEGF – Live Fuel Effect Gas Fire RGF – Radiant Gas Fire RH – Room Heater WH – Wall Heater
In total 101 appliances were used for testing. This is clearly very small compared to the 167 million appliances estimated to be installed in Europe, so the sensitivity analyses were conducted so as to provide more appliance coverage in segments that were considered to be present higher risk. Table 5 indicates the number of appliances tested in each segment. Nonetheless, the results for many of segments obtained from tests on just one appliance.
Only new appliances were tested.
2.4.3 IMPACTS ASSESSED
Impacts of changing gas quality were assessed according to 5 categories:
• Impacts on CO emissions • Impacts on safety other than through CO emissions (flame stability, operation of safety
devices, soot, etc.) • Impacts on operation • Impacts on efficiency • Impacts on NOx emissions
In order to simplify interpretation each impact was assigned a rating. For impacts other than CO emissions a simple rating of Green (satisfactory) or Red (unsatisfactory) was assigned. For CO emissions, rating was classified as Green, Yellow or Red, according to the observed level of CO emissions with a particular test gas compared with that seen for the reference gas (G20). The rating is illustrated in Figure 13.
It is worth noting that, where CO emissions for the reference gas exceed 250 ppm (DAF), the green rating corresponds to a maximum CO level of twice that seen with the reference gas and can be approximated11
In practice for most (ca. 80%) of the appliances tested, CO emissions with G20 gas were below 250 ppm (DAF) and so this implies that CO emissions were below 500 ppm over the range of WI tested.
to an ICF of 1.0 in Dutton’s terminology. Figure 14 shows the GASQUAL criteria with indicative lines for various values of ICF.
11 Strictly speaking, Dutton’s definition of ICF was the average ratio of the CO emissions for test and reference gases from 100 – 120% of nominal heat input.

Page 23 of 28
Figure 13: Impact rating criteria employed by GASQUAL consortium for CO emissions
Figure 14: Impact rating criteria employed by GASQUAL consortium for CO emissions compared with various values of Dutton’s Incomplete Combustion Factor.
0
500
1000
1500
2000
2500
3000
0 250 500 750 1000 1250 1500
COte
st (D
AF)
ppm
COref (DAF) ppm
GASQUAL CO emissions criteria
0
500
1000
1500
2000
2500
3000
0 250 500 750 1000 1250 1500
COte
st (D
AF)
ppm
COref (DAF) ppm
GASQUAL CO emissions criteria
ICF=0.48 ICF=1 ICF=1.263 ICF=2
Page 24 of 28
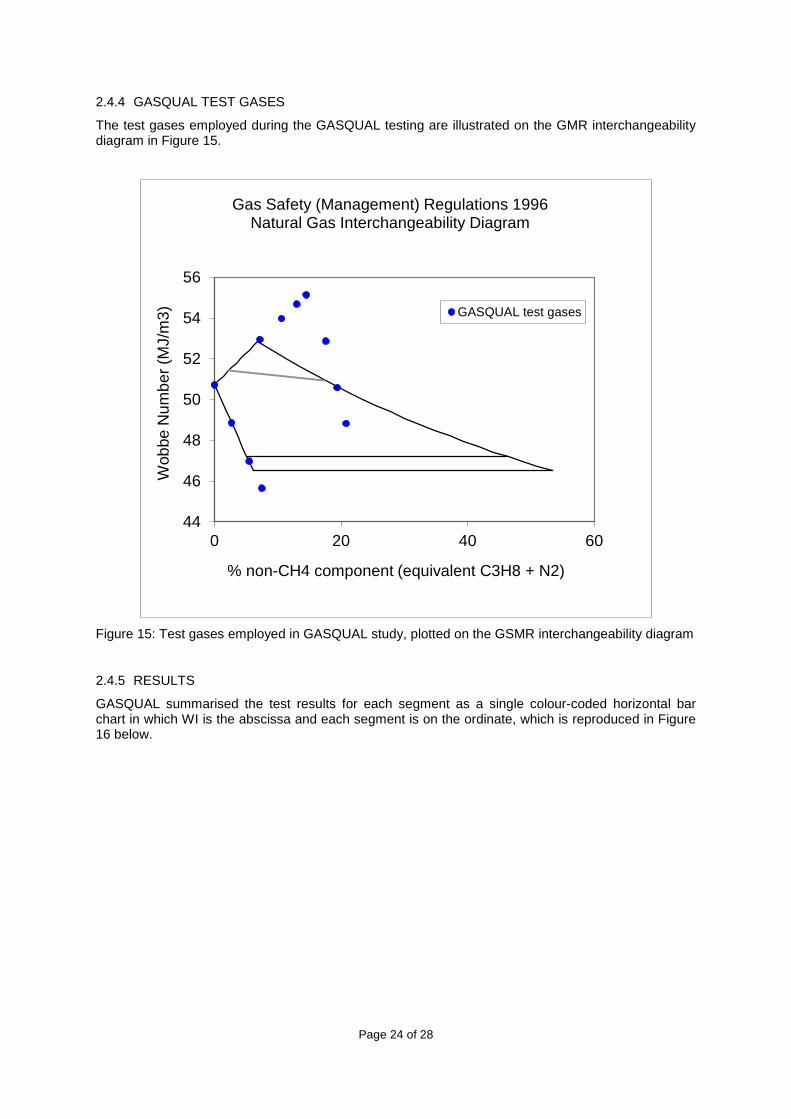
2.4.4 GASQUAL TEST GASES
The test gases employed during the GASQUAL testing are illustrated on the GMR interchangeability diagram in Figure 15.
Figure 15: Test gases employed in GASQUAL study, plotted on the GSMR interchangeability diagram
2.4.5 RESULTS
GASQUAL summarised the test results for each segment as a single colour-coded horizontal bar chart in which WI is the abscissa and each segment is on the ordinate, which is reproduced in Figure 16 below.
44
46
48
50
52
54
56
0 20 40 60
Wob
be N
umbe
r (M
J/m
3)
% non-CH4 component (equivalent C3H8 + N2)
Gas Safety (Management) Regulations 1996Natural Gas Interchangeability Diagram
GASQUAL test gases
Page 25 of 28
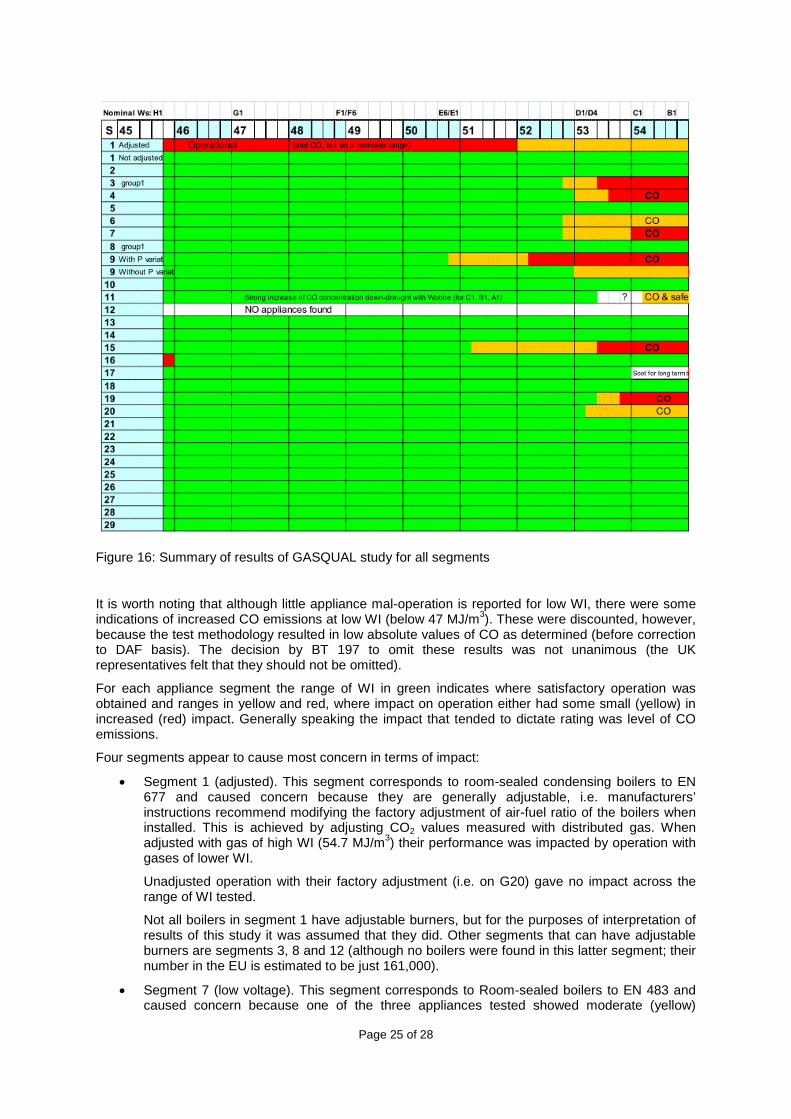
Figure 16: Summary of results of GASQUAL study for all segments
It is worth noting that although little appliance mal-operation is reported for low WI, there were some indications of increased CO emissions at low WI (below 47 MJ/m3). These were discounted, however, because the test methodology resulted in low absolute values of CO as determined (before correction to DAF basis). The decision by BT 197 to omit these results was not unanimous (the UK representatives felt that they should not be omitted).
For each appliance segment the range of WI in green indicates where satisfactory operation was obtained and ranges in yellow and red, where impact on operation either had some small (yellow) in increased (red) impact. Generally speaking the impact that tended to dictate rating was level of CO emissions.
Four segments appear to cause most concern in terms of impact:
• Segment 1 (adjusted). This segment corresponds to room-sealed condensing boilers to EN 677 and caused concern because they are generally adjustable, i.e. manufacturers’ instructions recommend modifying the factory adjustment of air-fuel ratio of the boilers when installed. This is achieved by adjusting CO2 values measured with distributed gas. When adjusted with gas of high WI (54.7 MJ/m3) their performance was impacted by operation with gases of lower WI.
Unadjusted operation with their factory adjustment (i.e. on G20) gave no impact across the range of WI tested.
Not all boilers in segment 1 have adjustable burners, but for the purposes of interpretation of results of this study it was assumed that they did. Other segments that can have adjustable burners are segments 3, 8 and 12 (although no boilers were found in this latter segment; their number in the EU is estimated to be just 161,000).
• Segment 7 (low voltage). This segment corresponds to Room-sealed boilers to EN 483 and caused concern because one of the three appliances tested showed moderate (yellow)
Page 26 of 28
impact at 53 MJ/m3 and higher (red) impact at 54 MJ/m3. However, these impacts were observed when WI was varied in combination with low voltage. With voltage at 230v, no impacts were observed below 55 MJ/m3.
• Segment 9 (with high pressure operation). This segment corresponds to open-flued instantaneous water heaters to EN 26 and caused concern because they showed moderate (yellow) impact at 51 MJ/m3 and higher (red) impact at 52 MJ/m3. However, these impacts were observed when WI was varied in combination with high pressure (appliances tested did not have a pressure regulator). When pressure was stable they showed moderate (yellow) impact at 53 MJ/m3 and higher (red) only above 54.7 MJ/m3. Assuming that pressure regulation is installed at the gas meter, then the latter test results are more applicable.
• Segment 15. This segment corresponds to open-flued radiant gas fires to EN 613 and caused concern because they showed moderate (yellow) impact at 51 MJ/m3 and higher (red) impact at 53.5 MJ/m3. However, these impacts were observed when WI was varied in combination with high pressure (appliances tested did not have a pressure regulator). When pressure was stable no problems were encountered.
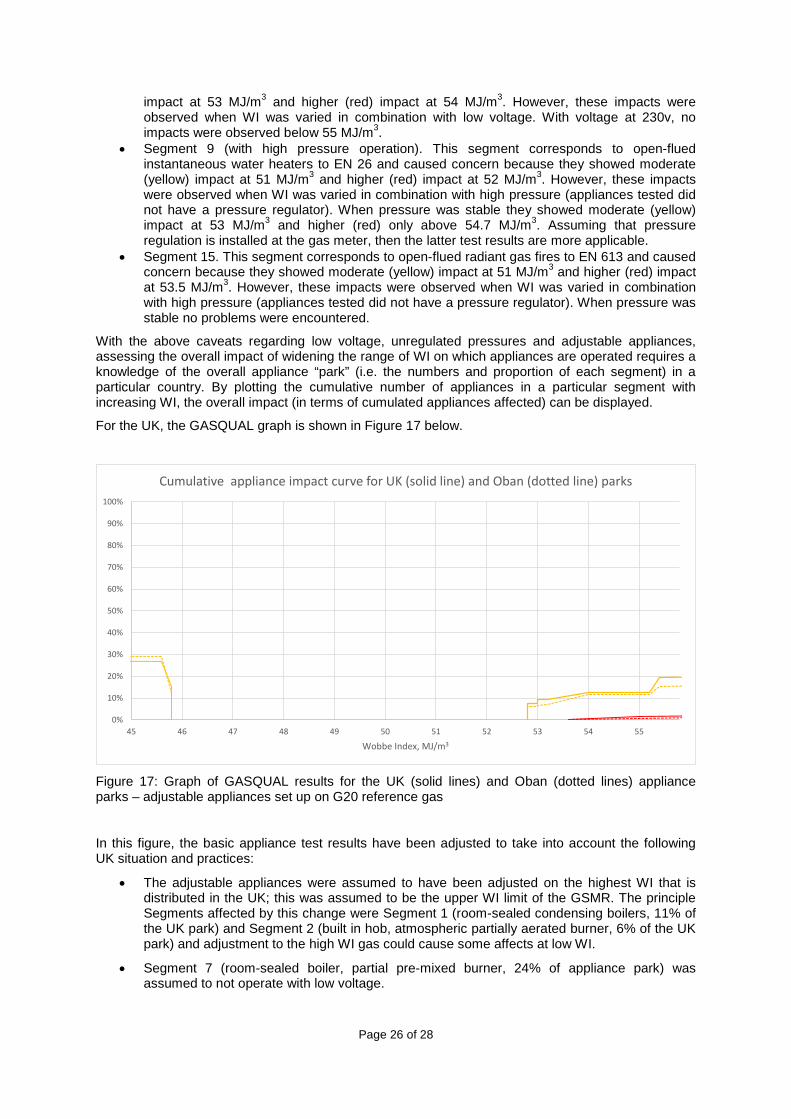
With the above caveats regarding low voltage, unregulated pressures and adjustable appliances, assessing the overall impact of widening the range of WI on which appliances are operated requires a knowledge of the overall appliance “park” (i.e. the numbers and proportion of each segment) in a particular country. By plotting the cumulative number of appliances in a particular segment with increasing WI, the overall impact (in terms of cumulated appliances affected) can be displayed.
For the UK, the GASQUAL graph is shown in Figure 17 below.
Figure 17: Graph of GASQUAL results for the UK (solid lines) and Oban (dotted lines) appliance parks – adjustable appliances set up on G20 reference gas
In this figure, the basic appliance test results have been adjusted to take into account the following UK situation and practices:
• The adjustable appliances were assumed to have been adjusted on the highest WI that is distributed in the UK; this was assumed to be the upper WI limit of the GSMR. The principle Segments affected by this change were Segment 1 (room-sealed condensing boilers, 11% of the UK park) and Segment 2 (built in hob, atmospheric partially aerated burner, 6% of the UK park) and adjustment to the high WI gas could cause some affects at low WI.
• Segment 7 (room-sealed boiler, partial pre-mixed burner, 24% of appliance park) was assumed to not operate with low voltage.
0%
10%
20%
30%
40%
50%
60%
70%
80%
90%
100%
45 46 47 48 49 50 51 52 53 54 55
Wobbe Index, MJ/m3
Cumulative appliance impact curve for UK (solid line) and Oban (dotted line) parks
Page 27 of 28
• Segments 15 (open-flued radiant gas fires, partial pre-mix burner, 5% of the UK appliance park) and 19 (open-flued storage water heater, partial pre-mix burner, 0.3% of the UK appliance park) were assumed to have a pressure regulator installed to prevent operation with excessive pressure at the appliance.
The yellow lines indicate initial effects of gas quality appearing in the operation of appliances – specifically it means that the CO level in the flue gas rose by no more than 500 ppm compared with the level observed with the reference gas (G2). At the high end of the WI range yellow level impacts start to occur at WI 52.8 MJ/m3.
The red lines indicate further effects of gas quality appearing in the operation of appliances – specifically it means that the CO level in the flue gas rose by more than 500 ppm compared with the level observed with the reference gas. At the high end of the WI range red level impacts start to occur at WI 53.6 MJ/m3.
The yellow line at the low end of the WI range (i.e. below 48.8 MJ/m3) arises because of setting of adjustable appliances might have occurred during installation/maintenance and for the UK it would suggest that such appliances might have to be reset with reference gas G2. However, in the SIU situation the WI of gas conveyed can be controlled and operation with such a low WI would not occur with LNG supplies.
Also shown in Figure 17 (as dotted lines) are the cumulative appliance impact curves for the estimated Oban appliance park12
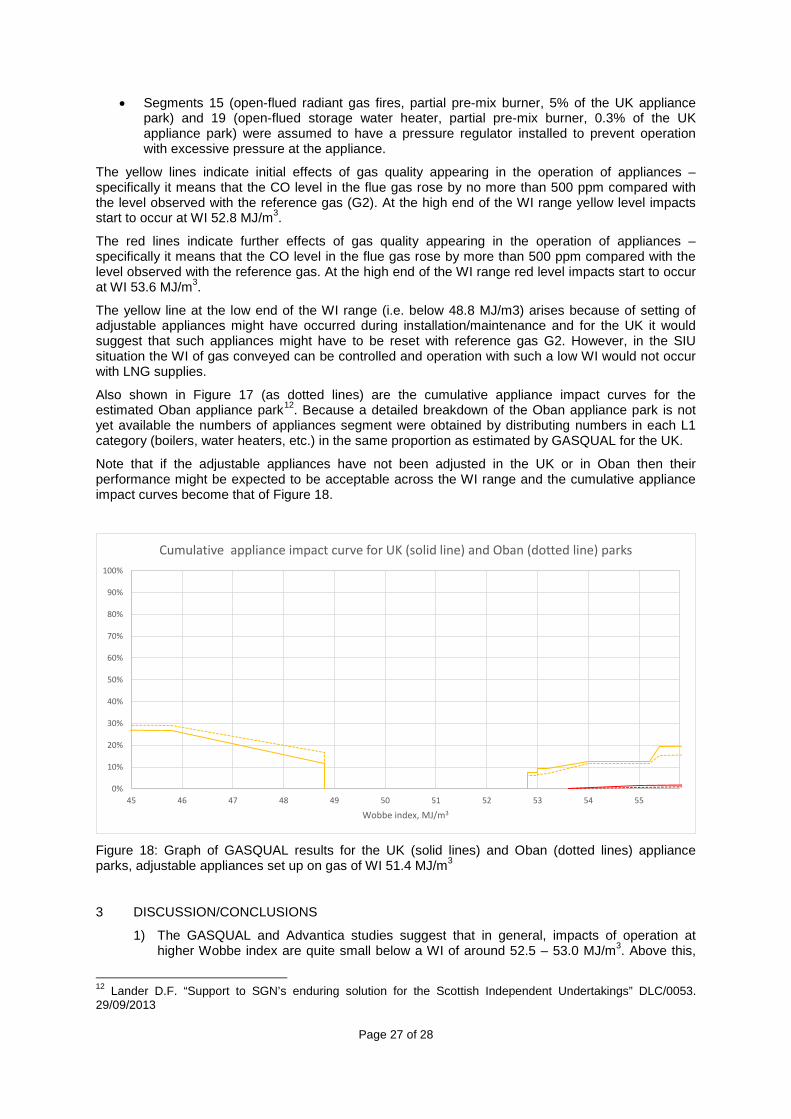
Note that if the adjustable appliances have not been adjusted in the UK or in Oban then their performance might be expected to be acceptable across the WI range and the cumulative appliance impact curves become that of Figure 18.
. Because a detailed breakdown of the Oban appliance park is not yet available the numbers of appliances segment were obtained by distributing numbers in each L1 category (boilers, water heaters, etc.) in the same proportion as estimated by GASQUAL for the UK.
Figure 18: Graph of GASQUAL results for the UK (solid lines) and Oban (dotted lines) appliance parks, adjustable appliances set up on gas of WI 51.4 MJ/m3
3 DISCUSSION/CONCLUSIONS
1) The GASQUAL and Advantica studies suggest that in general, impacts of operation at higher Wobbe index are quite small below a WI of around 52.5 – 53.0 MJ/m3. Above this,
12 Lander D.F. “Support to SGN’s enduring solution for the Scottish Independent Undertakings” DLC/0053. 29/09/2013
0%
10%
20%
30%
40%
50%
60%
70%
80%
90%
100%
45 46 47 48 49 50 51 52 53 54 55
Wobbe index, MJ/m3
Cumulative appliance impact curve for UK (solid line) and Oban (dotted line) parks
Page 28 of 28
levels of CO can increase quite markedly for some appliances. Secondary impacts, such as low voltages or elevated pressures may cause impacts to occur at lower WI.
2) The GASQUAL study highlighted the issue of adjustable appliances and potential to limit their range of operation at high WI, if adjusted on low WI gases, and vice versa. Adjustable appliances with their factory settings (i.e. adjusted on G20 reference gas) such appliances tolerate a wide range in WI.
3) The incomplete combustion limit currently in the GSMR is for an ICF of 0.48. This corresponds to a WI of between 50.96 and 51.41MJ/m3 (the line corresponding to ICF of 0.48 is not horizontal). The value of 0.48 was selected by Dutton on the basis of the upper limit traditionally being 105% of the reference gas. However, there are inconsistencies in Dutton’s statements about this limit, in that this value is stated to be 52.1 MJ/m3, when it is in fact 53.2 MJ/m3. The final value of ICF of 0.48 was made on the basis that it approximated that of gases around 51.2 MJ/m3, which was the WI limit at the time imposed by the British Gas Corporation, following a survey of appliances in 1978. At the time of this survey, all gas appliances were essentially placed on the market prior to the Gas Appliance Directive and most are likely to have been converted from Town gas operation (conversion to natural gas in the UK was carried out 1966-1978).
4) Regarding the lower Wobbe limit, the GASQUAL and Advantica studies suggest that operation at low WI is less of a concern. The limit currently in the GSMR is set at 47.3 MJ/m3 from solely heat service considerations and the emergency limit of 46.2 MJ/m3 is set from Dutton’s suggested limiting value of LI. Again there are some inconsistencies in Dutton’s justification for this lower value.
5) In order to gain most benefit from comparison with the work carried out by the GASQUAL consortium, it is recommended that appliances tested are categorised using the same scheme and also that observed impacts are categorised in the same way. The GASQUAL scheme for categorising CO emissions (i.e. red, amber and green levels of impact) should also be adopted.
6) The OGM project intends a field trial of higher WI gas following in-premises testing within its Oban network using three test gases. The three test gases have been selected so as to give optimum margins with respect to the GSMR limits and a proposed target WI for the field trial of around 52.5 MJ/m3. This would give significant opening up of the gas market and past studies suggest that appliance operation should show only slight impact at this level.
This Report is protected by copyright and may not be reproduced in whole or in part by any means without the approval in writing of DNV GL.
No Person, other than the Customer for whom it has been prepared, may place reliance on its contents and no duty of care is assumed by DNV
GL toward any Person other than the Customer.
This Report must be read in its entirety and is subject to any assumptions and qualifications expressed therein. Elements of this Report
contain detailed technical data which is intended for analysis only by persons possessing requisite expertise in its subject matter.
DNV GL is the trading name of GL Industrial Services UK Ltd
Registered in England and Wales No. 3294136 Registered Office: Holywell Park, Ashby Road, Loughborough, Leicestershire, LE11 3GR UK.
© 2014 GL Industrial Services UK Ltd
Report Number: 16171 5 January 2016
Quantitative Risk Assessment Evaluating the Risk Associated with Carbon
Monoxide and Changing Acceptable Gas Quality - Final Report
Prepared for: Prepared by:
Jamie McAinsh Hazel Richardson & Martin Brown
Innovation Project Manager
Scotia Gas Networks
Axis House
5 Lonehead Drive
Newbridge
Edinburgh
EH28 8TG
GL Industrial Services UK Ltd trading as DNV GL
Holywell Park
Ashby Road
Loughborough Leicestershire
LE11 3GR
United Kingdom
Tel: +44 (0)7807 576133
E-mail: [email protected]
Website: www.dnvgl.com
Customer Reference: SGN Opening up the Gas Market
Report Number: 16171 Issue: 2.3
DNV GL restricted Page i
Report Issue / Amendment Record
Report Title: Quantitative Risk Assessment Evaluating the Risk Associated with Carbon Monoxide and Changing Acceptable Gas Quality - Final Report
Report Number: 16171 Project Title: SGN Opening up the Gas Market
Project SAP Code: E-3247 and E-5308
Amendment details
Issue Description of Amendment Originator/Author
1.0 Original Martin Brown
Hazel Richardson
2.0 Incorporation of comments by SGN Hazel Richardson
Martin Brown
2.1 Incorporation of comments by Project Team Hazel Richardson
Martin Brown
2.2 Added micromort for solid fuel and addressed comment on extent of survey
Martin Brown
Sarah Kimpton
2.3 Report status changed to final Sarah Kimpton
2.4 Report Updated to reflect latest survey results and amended fault tree.
Hazel Richardson
Report approval
Issue Checked by Approved by Date
1.0 Sarah Kimpton Sarah Kimpton
5 February 2015
2.0 Martin Brown Sarah Kimpton
4 March 2015
2.1 Martin Brown Sarah Kimpton 4 March 2015
2.2 Martin Brown
Sarah Kimpton 10 March 2015
2.3 Hazel Richardson Sarah Kimpton
16 December 2015
2.4 Martin Brown
Sarah Kimpton 5 January 2016
Previous issues of this document shall be destroyed or marked SUPERSEDED
Report Number: 16171 Issue: 2.3
DNV GL restricted Page ii
Project Code: E-3247 and E-5308
Distribution
Name Company
Jamie McAinsh Innovation Project Manager
Scotia Gas Networks Axis House 5 Lonehead Drive Newbridge Edinburgh EH28 8TG
Report Number: 16171 Issue: 2.3
DNV GL restricted Page iii
Executive Summary
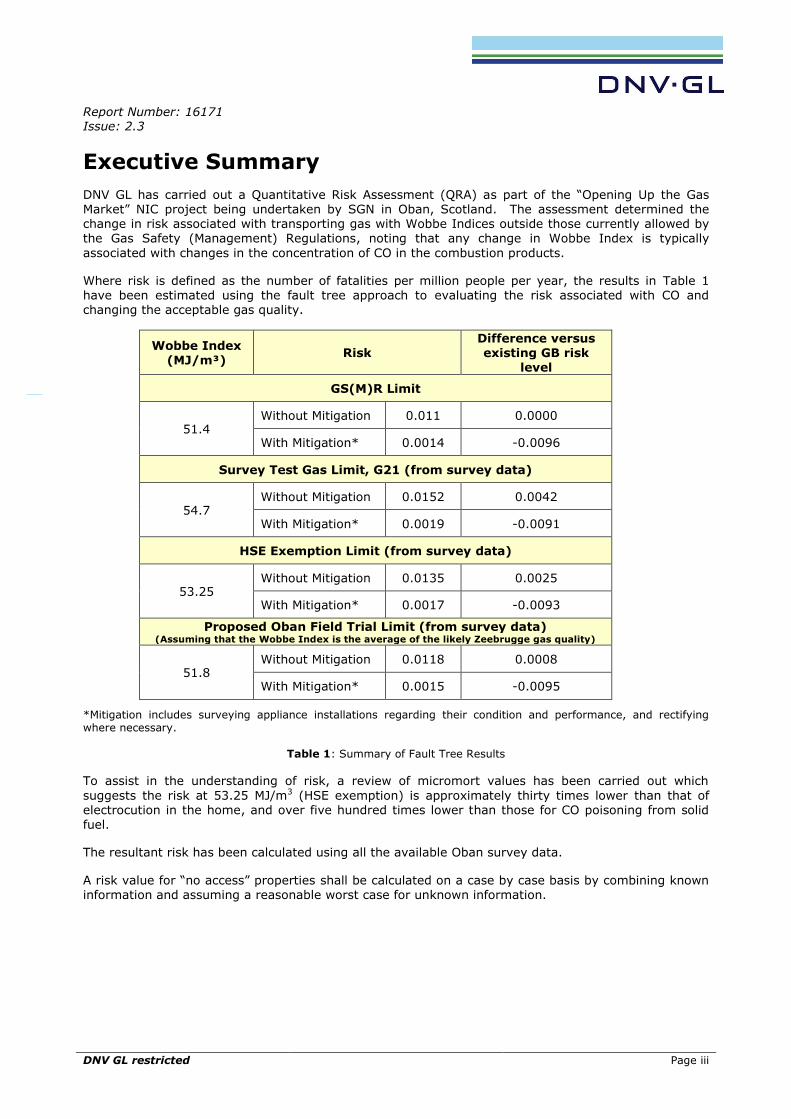
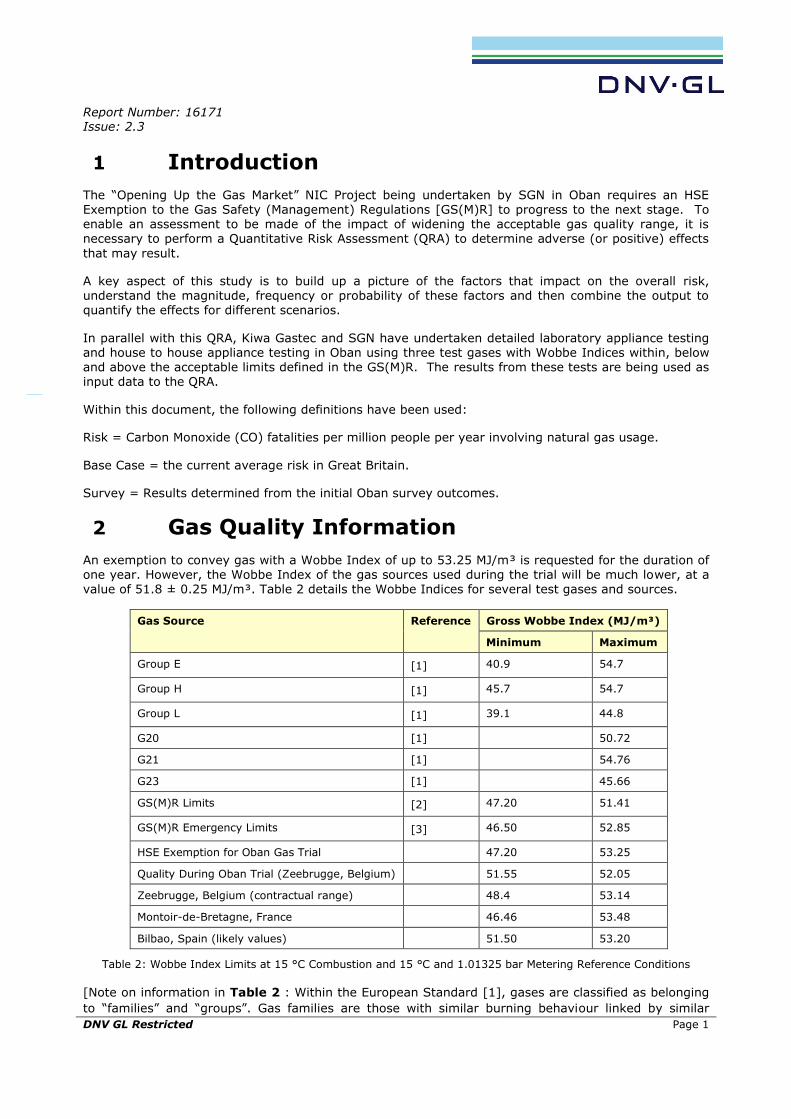
DNV GL has carried out a Quantitative Risk Assessment (QRA) as part of the “Opening Up the Gas Market” NIC project being undertaken by SGN in Oban, Scotland. The assessment determined the change in risk associated with transporting gas with Wobbe Indices outside those currently allowed by the Gas Safety (Management) Regulations, noting that any change in Wobbe Index is typically
associated with changes in the concentration of CO in the combustion products.
Where risk is defined as the number of fatalities per million people per year, the results in Table 1 have been estimated using the fault tree approach to evaluating the risk associated with CO and changing the acceptable gas quality.
Wobbe Index (MJ/m³)
Risk Difference versus existing GB risk
level
GS(M)R Limit
51.4 Without Mitigation 0.011 0.0000
With Mitigation* 0.0014 -0.0096
Survey Test Gas Limit, G21 (from survey data)
54.7 Without Mitigation 0.0152 0.0042
With Mitigation* 0.0019 -0.0091
HSE Exemption Limit (from survey data)
53.25 Without Mitigation 0.0135 0.0025
With Mitigation* 0.0017 -0.0093
Proposed Oban Field Trial Limit (from survey data) (Assuming that the Wobbe Index is the average of the likely Zeebrugge gas quality)
51.8 Without Mitigation 0.0118 0.0008
With Mitigation* 0.0015 -0.0095
*Mitigation includes surveying appliance installations regarding their condition and performance, and rectifying where necessary.
Table 1: Summary of Fault Tree Results
To assist in the understanding of risk, a review of micromort values has been carried out which
suggests the risk at 53.25 MJ/m3 (HSE exemption) is approximately thirty times lower than that of electrocution in the home, and over five hundred times lower than those for CO poisoning from solid fuel.
The resultant risk has been calculated using all the available Oban survey data.
A risk value for “no access” properties shall be calculated on a case by case basis by combining known information and assuming a reasonable worst case for unknown information.
Report Number: 16171 Issue: 2.3
DNV GL restricted Page iv
Contents
1 Introduction ............................................................................ 1
2 Gas Quality Information .......................................................... 1
3 Fault Tree Structure ................................................................ 2
3.1 Part 1 – CO Incident ........................................................................................ 3
3.2 Part 2 – Appliance producing high CO concentration ....................................... 6
3.3 Part 3 – Inadequate ventilation ....................................................................... 9
3.4 Part 4 – Inadequate Flue Function ................................................................ 10
3.5 Part 5 – Occupant Exposed for Sufficient Time .............................................. 11
4 Fault Tree Inputs .................................................................. 13
4.1 Frequencies ................................................................................................... 13
4.2 Probabilities .................................................................................................. 14
5 Fault Tree Factors ................................................................. 15
5.1 Tenure Type .................................................................................................. 15
5.2 Occupancy Type............................................................................................. 15
5.3 Occupant Age ................................................................................................ 15
5.4 Appliance Type .............................................................................................. 16
6 Statistical Approach .............................................................. 16
6.1 Frequency and Probability Calculations ......................................................... 16
6.1.1 Combining Probabilities.................................................................... 16
6.1.2 Combining Frequencies .................................................................... 17
6.1.3 Combining Frequencies and Probabilities ............................................ 17
6.2 Monte Carlo ................................................................................................... 17
7 Sensitivity Study ................................................................... 18
8 Current Results ..................................................................... 19
8.1 Risk Results ................................................................................................... 20
8.1.1 Absolute CO Risk ............................................................................ 21
8.1.2 Risk Factors ................................................................................... 21
9 No Access .............................................................................. 22
10 Summary ............................................................................... 22
11 References ............................................................................ 23
Appendix A Fault Tree .............................................................. A-1
Appendix B Micromorts ............................................................. B-1
Report Number: 16171 Issue: 2.3
DNV GL Restricted
Page 1
1 Introduction
The “Opening Up the Gas Market” NIC Project being undertaken by SGN in Oban requires an HSE Exemption to the Gas Safety (Management) Regulations [GS(M)R] to progress to the next stage. To enable an assessment to be made of the impact of widening the acceptable gas quality range, it is necessary to perform a Quantitative Risk Assessment (QRA) to determine adverse (or positive) effects
that may result.
A key aspect of this study is to build up a picture of the factors that impact on the overall risk, understand the magnitude, frequency or probability of these factors and then combine the output to quantify the effects for different scenarios.
In parallel with this QRA, Kiwa Gastec and SGN have undertaken detailed laboratory appliance testing and house to house appliance testing in Oban using three test gases with Wobbe Indices within, below and above the acceptable limits defined in the GS(M)R. The results from these tests are being used as input data to the QRA.
Within this document, the following definitions have been used:
Risk = Carbon Monoxide (CO) fatalities per million people per year involving natural gas usage.
Base Case = the current average risk in Great Britain.
Survey = Results determined from the initial Oban survey outcomes.
2 Gas Quality Information
An exemption to convey gas with a Wobbe Index of up to 53.25 MJ/m³ is requested for the duration of one year. However, the Wobbe Index of the gas sources used during the trial will be much lower, at a value of 51.8 ± 0.25 MJ/m³. Table 2 details the Wobbe Indices for several test gases and sources.
Gas Source Reference Gross Wobbe Index (MJ/m³)
Minimum Maximum
Group E [1] 40.9 54.7
Group H [1] 45.7 54.7
Group L [1] 39.1 44.8
G20 [1] 50.72
G21 [1] 54.76
G23 [1] 45.66
GS(M)R Limits [2] 47.20 51.41
GS(M)R Emergency Limits [3] 46.50 52.85
HSE Exemption for Oban Gas Trial 47.20 53.25
Quality During Oban Trial (Zeebrugge, Belgium) 51.55 52.05
Zeebrugge, Belgium (contractual range) 48.4 53.14
Montoir-de-Bretagne, France 46.46 53.48
Bilbao, Spain (likely values) 51.50 53.20
Table 2: Wobbe Index Limits at 15 °C Combustion and 15 °C and 1.01325 bar Metering Reference Conditions
[Note on information in Table 2 : Within the European Standard [1], gases are classified as belonging
to “families” and “groups”. Gas families are those with similar burning behaviour linked by similar
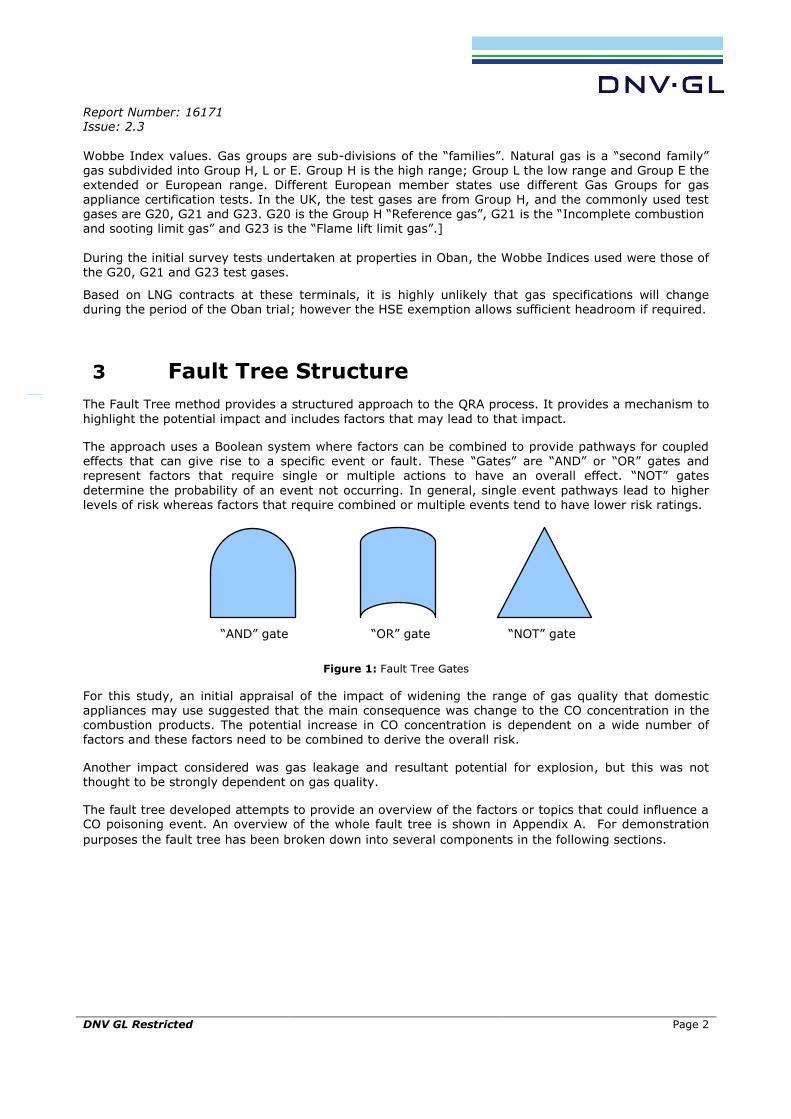
Report Number: 16171 Issue: 2.3
DNV GL Restricted
Page 2
Wobbe Index values. Gas groups are sub-divisions of the “families”. Natural gas is a “second family” gas subdivided into Group H, L or E. Group H is the high range; Group L the low range and Group E the extended or European range. Different European member states use different Gas Groups for gas appliance certification tests. In the UK, the test gases are from Group H, and the commonly used test gases are G20, G21 and G23. G20 is the Group H “Reference gas”, G21 is the “Incomplete combustion and sooting limit gas” and G23 is the “Flame lift limit gas”.]
During the initial survey tests undertaken at properties in Oban, the Wobbe Indices used were those of the G20, G21 and G23 test gases.
Based on LNG contracts at these terminals, it is highly unlikely that gas specifications will change during the period of the Oban trial; however the HSE exemption allows sufficient headroom if required.
3 Fault Tree Structure
The Fault Tree method provides a structured approach to the QRA process. It provides a mechanism to
highlight the potential impact and includes factors that may lead to that impact.
The approach uses a Boolean system where factors can be combined to provide pathways for coupled effects that can give rise to a specific event or fault. These “Gates” are “AND” or “OR” gates and represent factors that require single or multiple actions to have an overall effect. “NOT” gates
determine the probability of an event not occurring. In general, single event pathways lead to higher levels of risk whereas factors that require combined or multiple events tend to have lower risk ratings.
“AND” gate “OR” gate “NOT” gate
Figure 1: Fault Tree Gates
For this study, an initial appraisal of the impact of widening the range of gas quality that domestic appliances may use suggested that the main consequence was change to the CO concentration in the combustion products. The potential increase in CO concentration is dependent on a wide number of factors and these factors need to be combined to derive the overall risk.
Another impact considered was gas leakage and resultant potential for explosion, but this was not thought to be strongly dependent on gas quality.
The fault tree developed attempts to provide an overview of the factors or topics that could influence a CO poisoning event. An overview of the whole fault tree is shown in Appendix A. For demonstration
purposes the fault tree has been broken down into several components in the following sections.
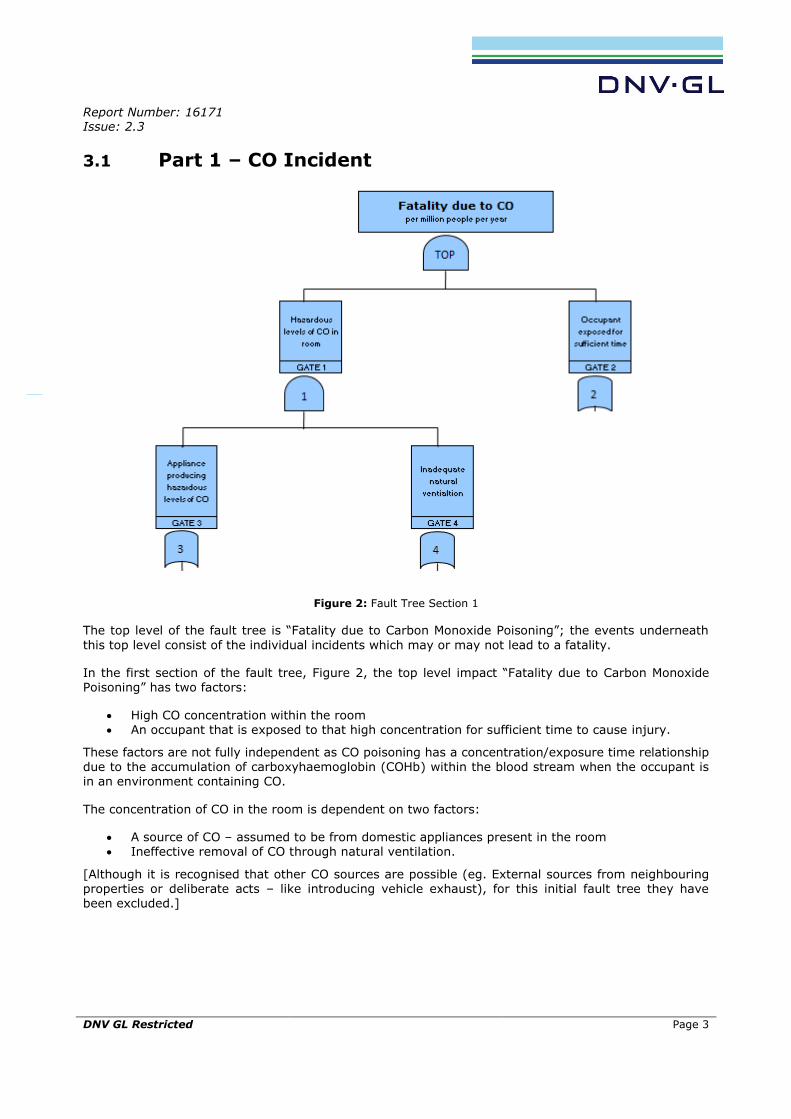
Report Number: 16171 Issue: 2.3
DNV GL Restricted
Page 3
3.1 Part 1 – CO Incident
Figure 2: Fault Tree Section 1
The top level of the fault tree is “Fatality due to Carbon Monoxide Poisoning”; the events underneath
this top level consist of the individual incidents which may or may not lead to a fatality.
In the first section of the fault tree, Figure 2, the top level impact “Fatality due to Carbon Monoxide Poisoning” has two factors:
High CO concentration within the room An occupant that is exposed to that high concentration for sufficient time to cause injury.
These factors are not fully independent as CO poisoning has a concentration/exposure time relationship
due to the accumulation of carboxyhaemoglobin (COHb) within the blood stream when the occupant is in an environment containing CO.
The concentration of CO in the room is dependent on two factors:
A source of CO – assumed to be from domestic appliances present in the room Ineffective removal of CO through natural ventilation.
[Although it is recognised that other CO sources are possible (eg. External sources from neighbouring properties or deliberate acts – like introducing vehicle exhaust), for this initial fault tree they have been excluded.]
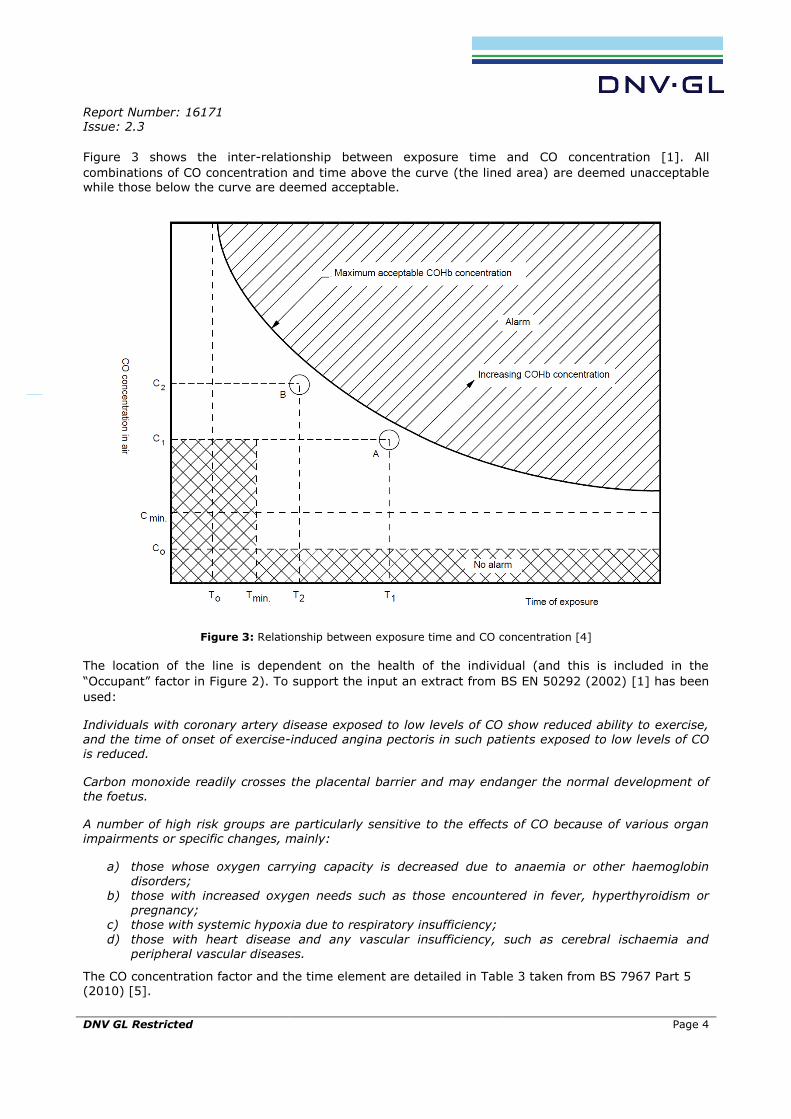
Report Number: 16171 Issue: 2.3
DNV GL Restricted
Page 4
Figure 3 shows the inter-relationship between exposure time and CO concentration [1]. All
combinations of CO concentration and time above the curve (the lined area) are deemed unacceptable while those below the curve are deemed acceptable.
Figure 3: Relationship between exposure time and CO concentration [4]
The location of the line is dependent on the health of the individual (and this is included in the
“Occupant” factor in Figure 2). To support the input an extract from BS EN 50292 (2002) [1] has been
used:
Individuals with coronary artery disease exposed to low levels of CO show reduced ability to exercise, and the time of onset of exercise-induced angina pectoris in such patients exposed to low levels of CO is reduced.
Carbon monoxide readily crosses the placental barrier and may endanger the normal development of the foetus.
A number of high risk groups are particularly sensitive to the effects of CO because of various organ impairments or specific changes, mainly:
a) those whose oxygen carrying capacity is decreased due to anaemia or other haemoglobin disorders;
b) those with increased oxygen needs such as those encountered in fever, hyperthyroidism or pregnancy;
c) those with systemic hypoxia due to respiratory insufficiency;
d) those with heart disease and any vascular insufficiency, such as cerebral ischaemia and peripheral vascular diseases.
The CO concentration factor and the time element are detailed in Table 3 taken from BS 7967 Part 5
(2010) [5].
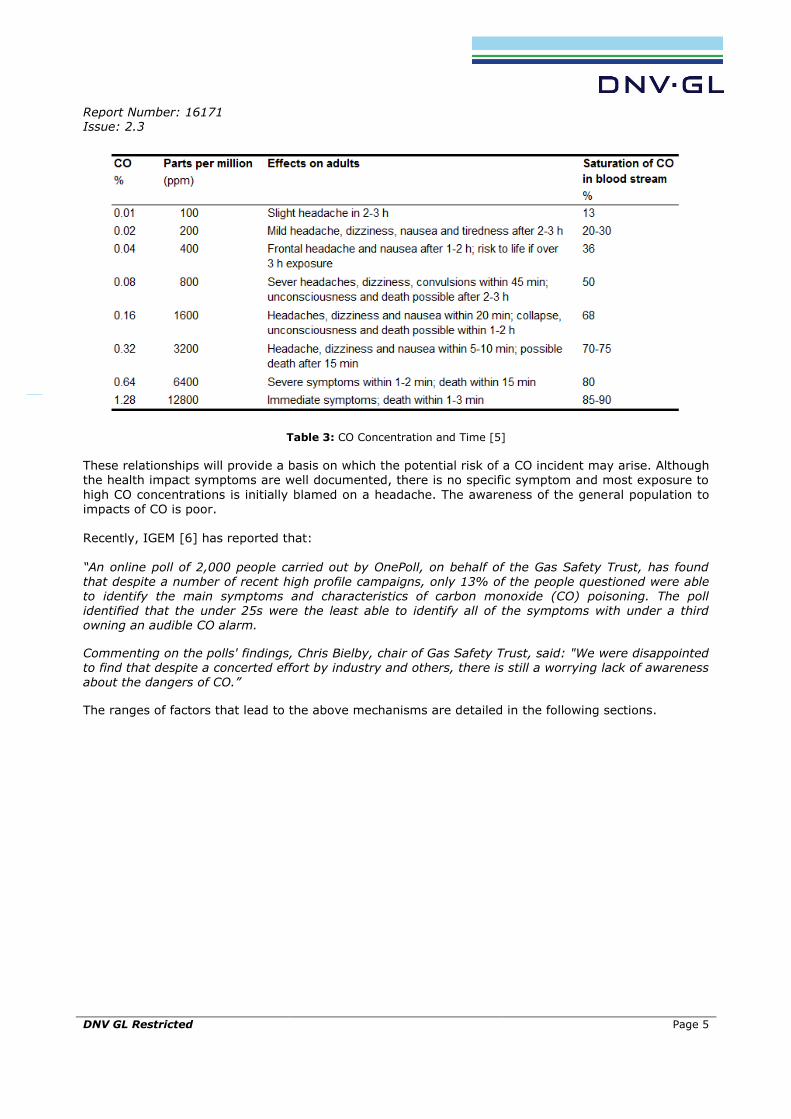
Report Number: 16171 Issue: 2.3
DNV GL Restricted
Page 5
Table 3: CO Concentration and Time [5]
These relationships will provide a basis on which the potential risk of a CO incident may arise. Although the health impact symptoms are well documented, there is no specific symptom and most exposure to
high CO concentrations is initially blamed on a headache. The awareness of the general population to impacts of CO is poor.
Recently, IGEM [6] has reported that:
“An online poll of 2,000 people carried out by OnePoll, on behalf of the Gas Safety Trust, has found that despite a number of recent high profile campaigns, only 13% of the people questioned were able to identify the main symptoms and characteristics of carbon monoxide (CO) poisoning. The poll identified that the under 25s were the least able to identify all of the symptoms with under a third owning an audible CO alarm.
Commenting on the polls' findings, Chris Bielby, chair of Gas Safety Trust, said: "We were disappointed to find that despite a concerted effort by industry and others, there is still a worrying lack of awareness about the dangers of CO.”
The ranges of factors that lead to the above mechanisms are detailed in the following sections.
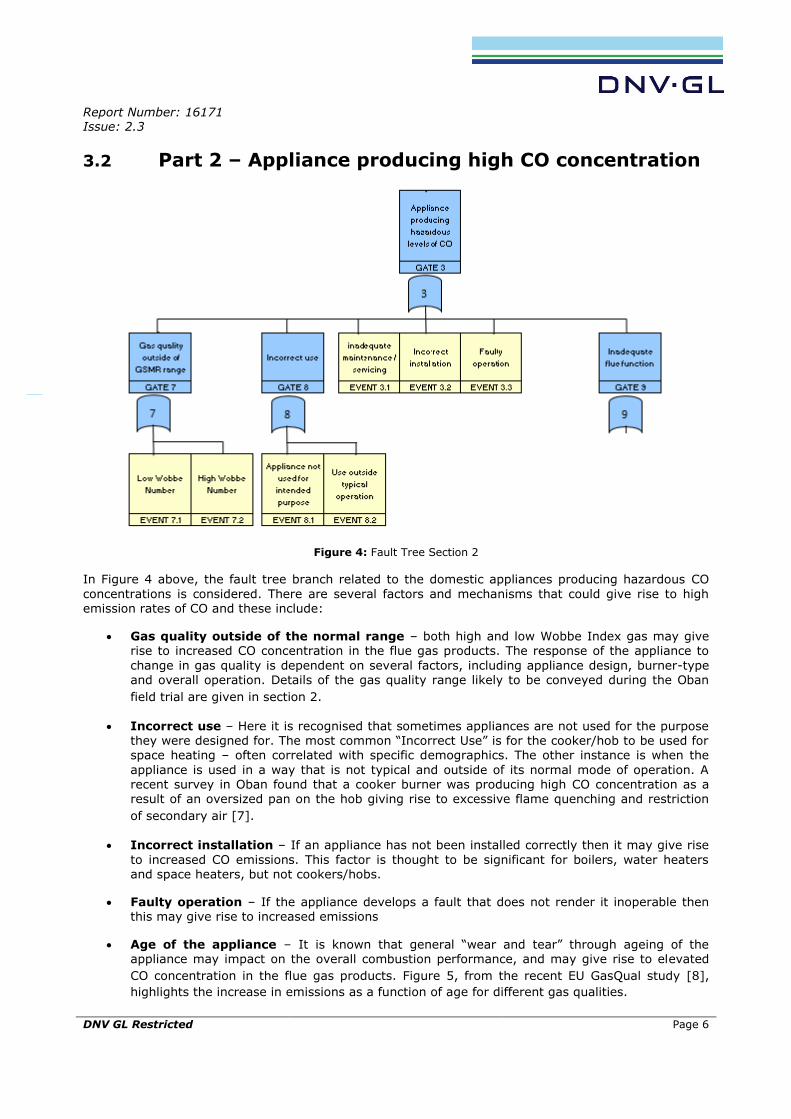
Report Number: 16171 Issue: 2.3
DNV GL Restricted
Page 6
3.2 Part 2 – Appliance producing high CO concentration
Figure 4: Fault Tree Section 2
In Figure 4 above, the fault tree branch related to the domestic appliances producing hazardous CO
concentrations is considered. There are several factors and mechanisms that could give rise to high emission rates of CO and these include:
Gas quality outside of the normal range – both high and low Wobbe Index gas may give rise to increased CO concentration in the flue gas products. The response of the appliance to
change in gas quality is dependent on several factors, including appliance design, burner-type and overall operation. Details of the gas quality range likely to be conveyed during the Oban
field trial are given in section 2.
Incorrect use – Here it is recognised that sometimes appliances are not used for the purpose they were designed for. The most common “Incorrect Use” is for the cooker/hob to be used for space heating – often correlated with specific demographics. The other instance is when the
appliance is used in a way that is not typical and outside of its normal mode of operation. A recent survey in Oban found that a cooker burner was producing high CO concentration as a result of an oversized pan on the hob giving rise to excessive flame quenching and restriction
of secondary air [7].
Incorrect installation – If an appliance has not been installed correctly then it may give rise
to increased CO emissions. This factor is thought to be significant for boilers, water heaters and space heaters, but not cookers/hobs.
Faulty operation – If the appliance develops a fault that does not render it inoperable then this may give rise to increased emissions
Age of the appliance – It is known that general “wear and tear” through ageing of the appliance may impact on the overall combustion performance, and may give rise to elevated
CO concentration in the flue gas products. Figure 5, from the recent EU GasQual study [8],
highlights the increase in emissions as a function of age for different gas qualities.
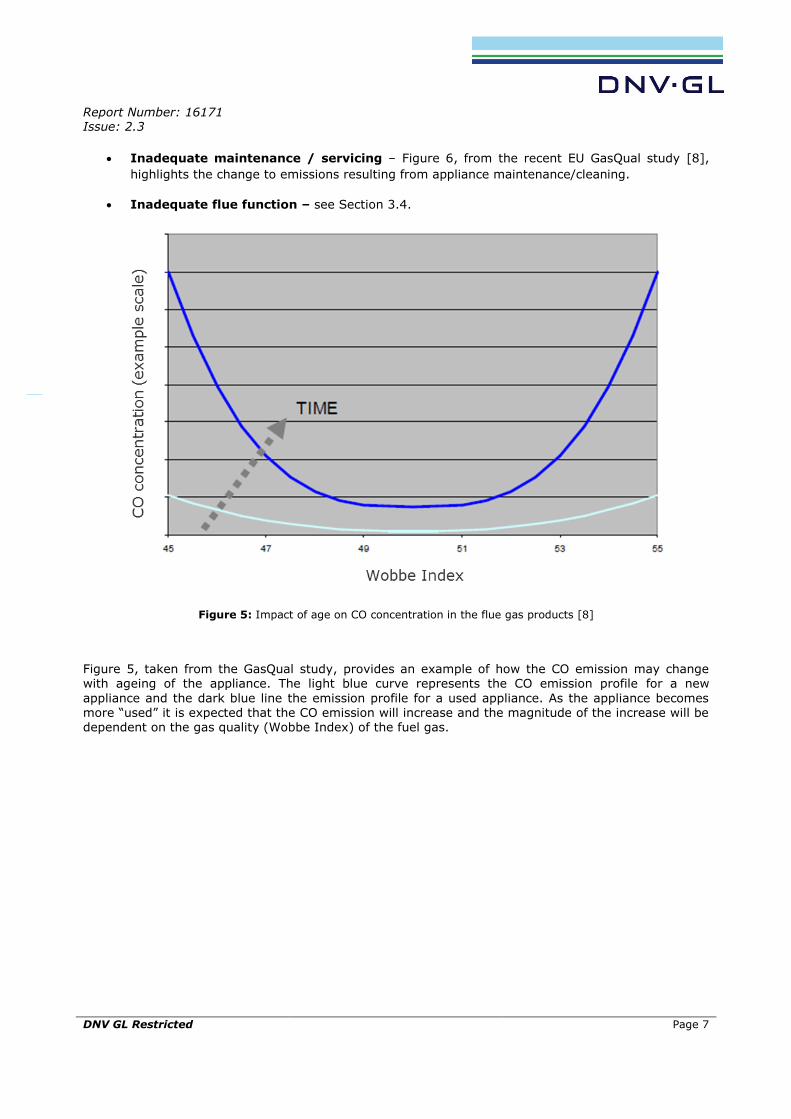
Report Number: 16171 Issue: 2.3
DNV GL Restricted
Page 7
Inadequate maintenance / servicing – Figure 6, from the recent EU GasQual study [8],
highlights the change to emissions resulting from appliance maintenance/cleaning.
Inadequate flue function – see Section 3.4.
Figure 5: Impact of age on CO concentration in the flue gas products [8]
Figure 5, taken from the GasQual study, provides an example of how the CO emission may change with ageing of the appliance. The light blue curve represents the CO emission profile for a new
appliance and the dark blue line the emission profile for a used appliance. As the appliance becomes more “used” it is expected that the CO emission will increase and the magnitude of the increase will be dependent on the gas quality (Wobbe Index) of the fuel gas.
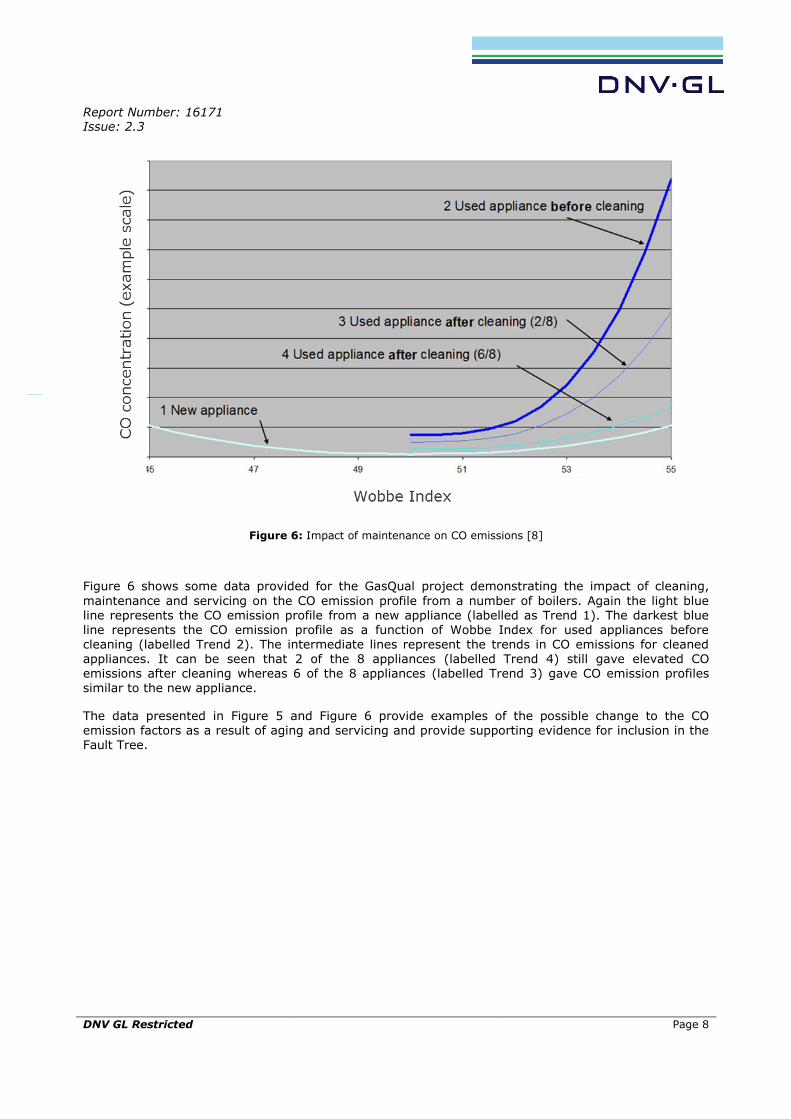
Report Number: 16171 Issue: 2.3
DNV GL Restricted
Page 8
Figure 6: Impact of maintenance on CO emissions [8]
Figure 6 shows some data provided for the GasQual project demonstrating the impact of cleaning,
maintenance and servicing on the CO emission profile from a number of boilers. Again the light blue line represents the CO emission profile from a new appliance (labelled as Trend 1). The darkest blue line represents the CO emission profile as a function of Wobbe Index for used appliances before cleaning (labelled Trend 2). The intermediate lines represent the trends in CO emissions for cleaned appliances. It can be seen that 2 of the 8 appliances (labelled Trend 4) still gave elevated CO emissions after cleaning whereas 6 of the 8 appliances (labelled Trend 3) gave CO emission profiles similar to the new appliance.
The data presented in Figure 5 and Figure 6 provide examples of the possible change to the CO emission factors as a result of aging and servicing and provide supporting evidence for inclusion in the Fault Tree.
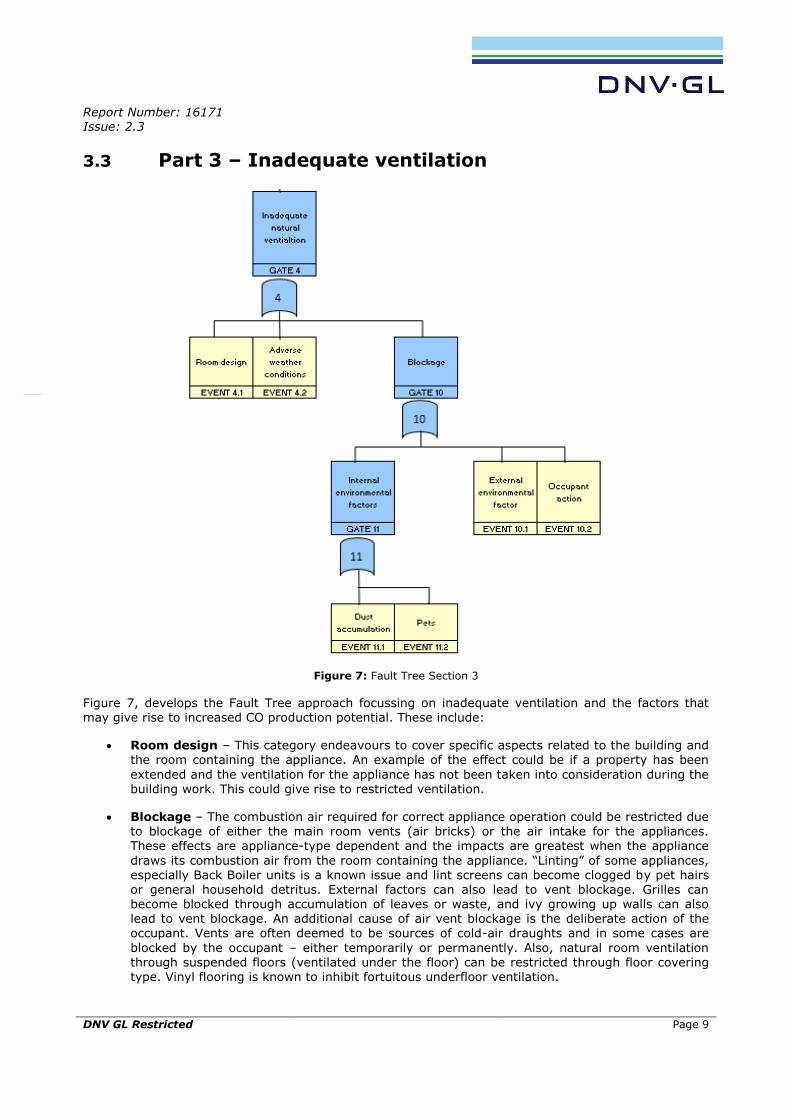
Report Number: 16171 Issue: 2.3
DNV GL Restricted
Page 9
3.3 Part 3 – Inadequate ventilation
Figure 7: Fault Tree Section 3
Figure 7, develops the Fault Tree approach focussing on inadequate ventilation and the factors that may give rise to increased CO production potential. These include:
Room design – This category endeavours to cover specific aspects related to the building and the room containing the appliance. An example of the effect could be if a property has been
extended and the ventilation for the appliance has not been taken into consideration during the building work. This could give rise to restricted ventilation.
Blockage – The combustion air required for correct appliance operation could be restricted due to blockage of either the main room vents (air bricks) or the air intake for the appliances. These effects are appliance-type dependent and the impacts are greatest when the appliance
draws its combustion air from the room containing the appliance. “Linting” of some appliances, especially Back Boiler units is a known issue and lint screens can become clogged by pet hairs or general household detritus. External factors can also lead to vent blockage. Grilles can become blocked through accumulation of leaves or waste, and ivy growing up walls can also lead to vent blockage. An additional cause of air vent blockage is the deliberate action of the occupant. Vents are often deemed to be sources of cold-air draughts and in some cases are
blocked by the occupant – either temporarily or permanently. Also, natural room ventilation through suspended floors (ventilated under the floor) can be restricted through floor covering type. Vinyl flooring is known to inhibit fortuitous underfloor ventilation.
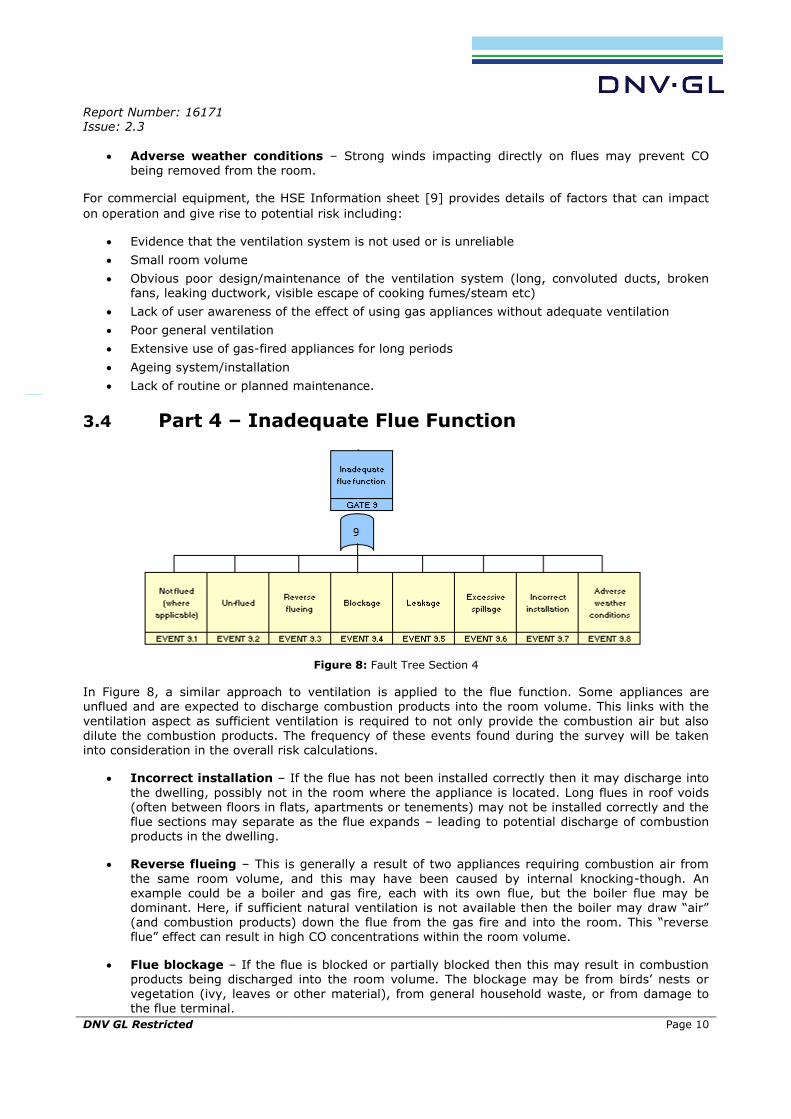
Report Number: 16171 Issue: 2.3
DNV GL Restricted
Page 10
Adverse weather conditions – Strong winds impacting directly on flues may prevent CO being removed from the room.
For commercial equipment, the HSE Information sheet [9] provides details of factors that can impact
on operation and give rise to potential risk including:
Evidence that the ventilation system is not used or is unreliable
Small room volume
Obvious poor design/maintenance of the ventilation system (long, convoluted ducts, broken fans, leaking ductwork, visible escape of cooking fumes/steam etc)
Lack of user awareness of the effect of using gas appliances without adequate ventilation
Poor general ventilation
Extensive use of gas-fired appliances for long periods
Ageing system/installation
Lack of routine or planned maintenance.
3.4 Part 4 – Inadequate Flue Function
Figure 8: Fault Tree Section 4
In Figure 8, a similar approach to ventilation is applied to the flue function. Some appliances are unflued and are expected to discharge combustion products into the room volume. This links with the
ventilation aspect as sufficient ventilation is required to not only provide the combustion air but also dilute the combustion products. The frequency of these events found during the survey will be taken into consideration in the overall risk calculations.
Incorrect installation – If the flue has not been installed correctly then it may discharge into
the dwelling, possibly not in the room where the appliance is located. Long flues in roof voids (often between floors in flats, apartments or tenements) may not be installed correctly and the flue sections may separate as the flue expands – leading to potential discharge of combustion products in the dwelling.
Reverse flueing – This is generally a result of two appliances requiring combustion air from
the same room volume, and this may have been caused by internal knocking-though. An example could be a boiler and gas fire, each with its own flue, but the boiler flue may be dominant. Here, if sufficient natural ventilation is not available then the boiler may draw “air” (and combustion products) down the flue from the gas fire and into the room. This “reverse flue” effect can result in high CO concentrations within the room volume.
Flue blockage – If the flue is blocked or partially blocked then this may result in combustion products being discharged into the room volume. The blockage may be from birds’ nests or
vegetation (ivy, leaves or other material), from general household waste, or from damage to the flue terminal.

Report Number: 16171 Issue: 2.3
DNV GL Restricted
Page 11
Flue leakage – If there is general “wear and tear” then the flue may leak in the dwelling. An example of this may be unlined flues in traditional chimneys. Here the older brick type flues may crack or the mortar fails giving a potential flue path into the dwelling.
Spillage – Spillage may occur when an appliance is first lit from cold. Without the draw from
the chimney, it is possible for the combustion products to enter the room. This event usually stops as the chimney/flue warms up, but there is the possibility that excessive spillage may occur in some circumstances. This can often be detected as staining or scorching around the vents of appliances
Adverse weather conditions – Strong winds impacting directly on flues may give rise to incorrect operation. This will be appliance type and flue specific.
Not flued (where applicable) – This refers to appliances which are required to have a flue but do not have one installed.
Un-flued – This refers to appliances which do not require a flue.
3.5 Part 5 – Occupant Exposed for Sufficient Time
Figure 9: Fault Tree Section 5

Report Number: 16171 Issue: 2.3
DNV GL Restricted
Page 12
In Figure 9 above, it is recognised that the occupant may be a factor in the build-up of CO in the dwelling by either failing to detect or mitigate the presence of combustion products. Here, the occupant may be unaware of CO poisoning symptoms, or there may not be a CO alarm in the property. The additional factors relate to incorrect location of CO alarms or faulty alarms.
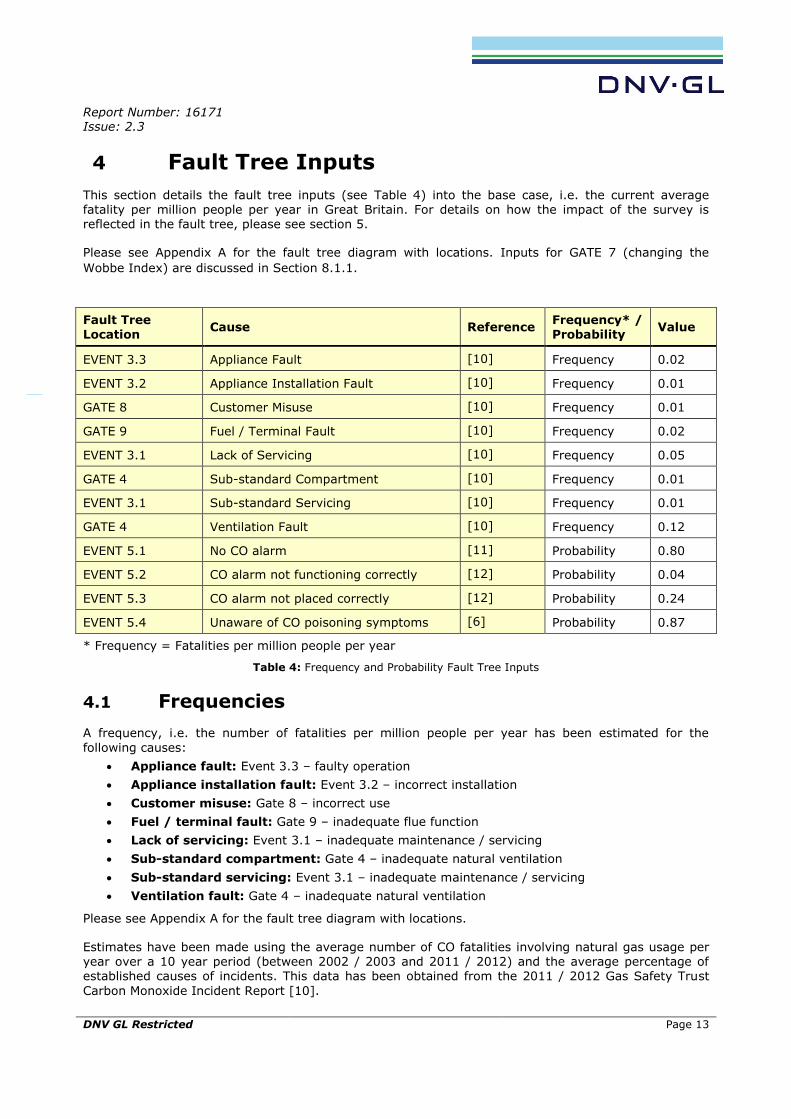
Report Number: 16171 Issue: 2.3
DNV GL Restricted
Page 13
4 Fault Tree Inputs
This section details the fault tree inputs (see Table 4) into the base case, i.e. the current average fatality per million people per year in Great Britain. For details on how the impact of the survey is reflected in the fault tree, please see section 5.
Please see Appendix A for the fault tree diagram with locations. Inputs for GATE 7 (changing the
Wobbe Index) are discussed in Section 8.1.1.
Fault Tree
Location Cause Reference
Frequency* /
Probability Value
EVENT 3.3 Appliance Fault [10] Frequency 0.02
EVENT 3.2 Appliance Installation Fault [10] Frequency 0.01
GATE 8 Customer Misuse [10] Frequency 0.01
GATE 9 Fuel / Terminal Fault [10] Frequency 0.02
EVENT 3.1 Lack of Servicing [10] Frequency 0.05
GATE 4 Sub-standard Compartment [10] Frequency 0.01
EVENT 3.1 Sub-standard Servicing [10] Frequency 0.01
GATE 4 Ventilation Fault [10] Frequency 0.12
EVENT 5.1 No CO alarm [11] Probability 0.80
EVENT 5.2 CO alarm not functioning correctly [12] Probability 0.04
EVENT 5.3 CO alarm not placed correctly [12] Probability 0.24
EVENT 5.4 Unaware of CO poisoning symptoms [6] Probability 0.87
* Frequency = Fatalities per million people per year
Table 4: Frequency and Probability Fault Tree Inputs
4.1 Frequencies
A frequency, i.e. the number of fatalities per million people per year has been estimated for the
following causes:
Appliance fault: Event 3.3 – faulty operation
Appliance installation fault: Event 3.2 – incorrect installation
Customer misuse: Gate 8 – incorrect use
Fuel / terminal fault: Gate 9 – inadequate flue function
Lack of servicing: Event 3.1 – inadequate maintenance / servicing
Sub-standard compartment: Gate 4 – inadequate natural ventilation
Sub-standard servicing: Event 3.1 – inadequate maintenance / servicing
Ventilation fault: Gate 4 – inadequate natural ventilation
Please see Appendix A for the fault tree diagram with locations.
Estimates have been made using the average number of CO fatalities involving natural gas usage per year over a 10 year period (between 2002 / 2003 and 2011 / 2012) and the average percentage of established causes of incidents. This data has been obtained from the 2011 / 2012 Gas Safety Trust
Carbon Monoxide Incident Report [10].
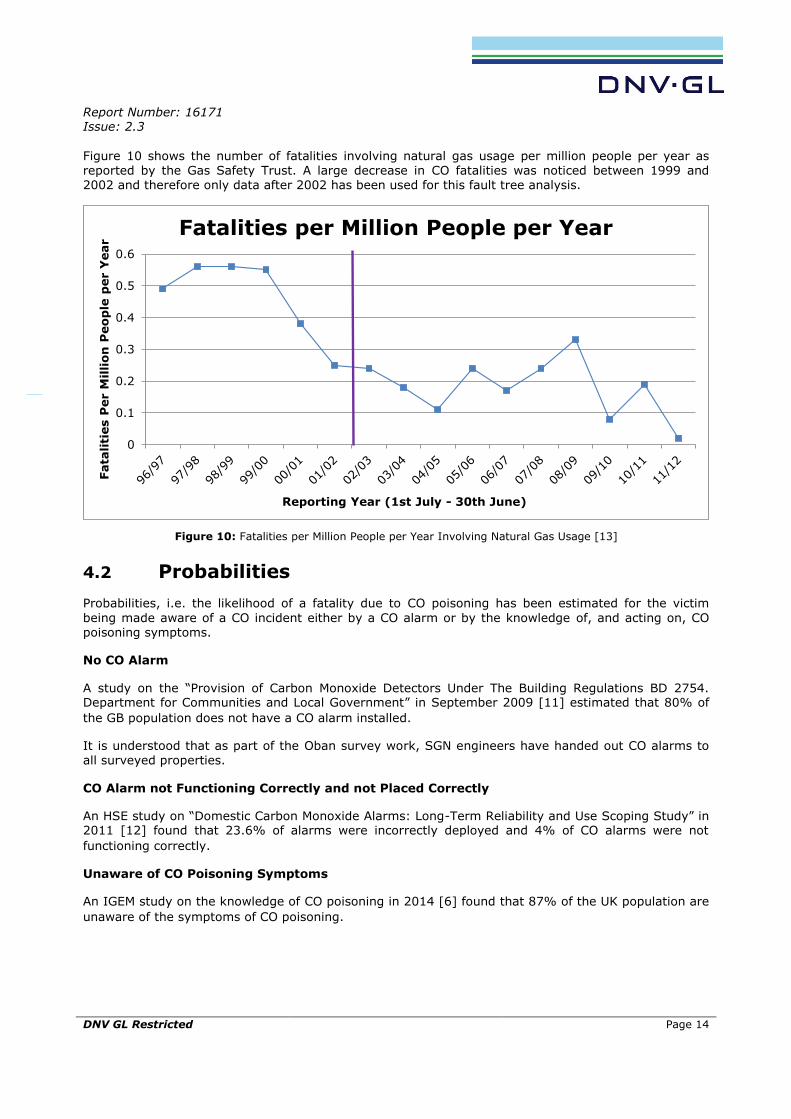
Report Number: 16171 Issue: 2.3
DNV GL Restricted
Page 14
Figure 10 shows the number of fatalities involving natural gas usage per million people per year as reported by the Gas Safety Trust. A large decrease in CO fatalities was noticed between 1999 and 2002 and therefore only data after 2002 has been used for this fault tree analysis.
Figure 10: Fatalities per Million People per Year Involving Natural Gas Usage [13]
4.2 Probabilities
Probabilities, i.e. the likelihood of a fatality due to CO poisoning has been estimated for the victim
being made aware of a CO incident either by a CO alarm or by the knowledge of, and acting on, CO poisoning symptoms.
No CO Alarm
A study on the “Provision of Carbon Monoxide Detectors Under The Building Regulations BD 2754. Department for Communities and Local Government” in September 2009 [11] estimated that 80% of
the GB population does not have a CO alarm installed.
It is understood that as part of the Oban survey work, SGN engineers have handed out CO alarms to all surveyed properties.
CO Alarm not Functioning Correctly and not Placed Correctly
An HSE study on “Domestic Carbon Monoxide Alarms: Long-Term Reliability and Use Scoping Study” in 2011 [12] found that 23.6% of alarms were incorrectly deployed and 4% of CO alarms were not
functioning correctly.
Unaware of CO Poisoning Symptoms
An IGEM study on the knowledge of CO poisoning in 2014 [6] found that 87% of the UK population are
unaware of the symptoms of CO poisoning.
0
0.1
0.2
0.3
0.4
0.5
0.6
Fata
liti
es P
er M
illio
n P
eo
ple
per Y
ear
Reporting Year (1st July - 30th June)
Fatalities per Million People per Year
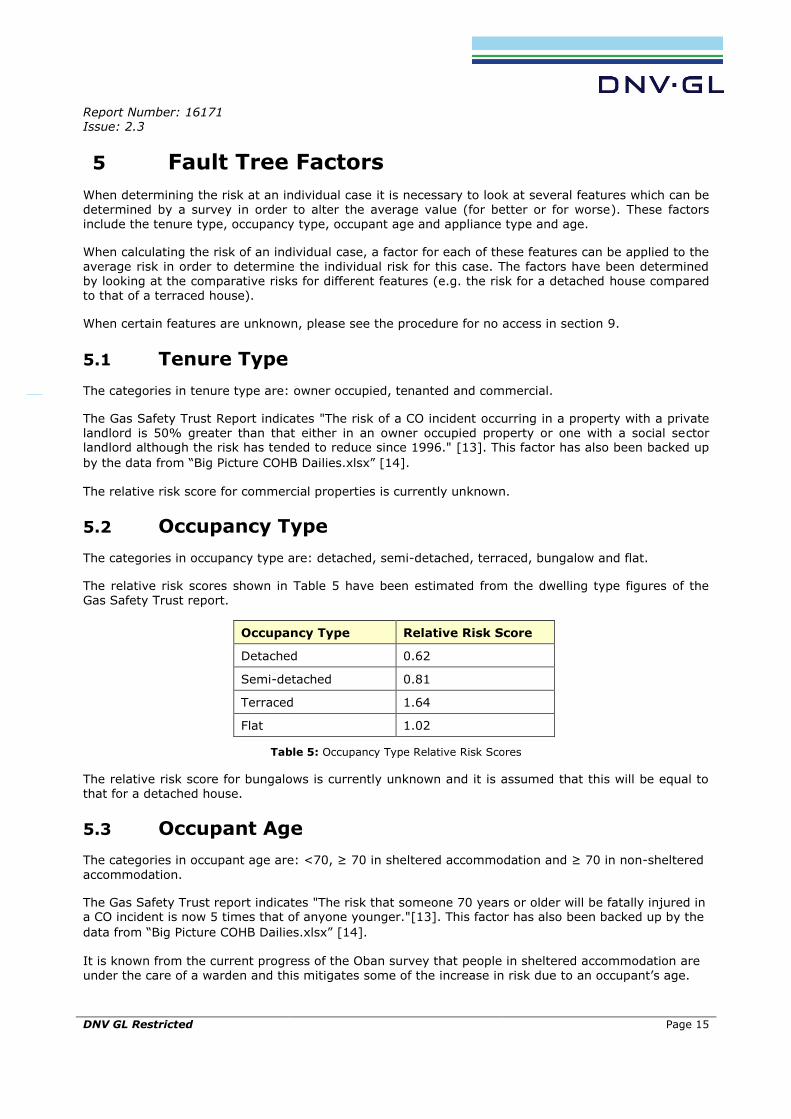
Report Number: 16171 Issue: 2.3
DNV GL Restricted
Page 15
5 Fault Tree Factors
When determining the risk at an individual case it is necessary to look at several features which can be determined by a survey in order to alter the average value (for better or for worse). These factors include the tenure type, occupancy type, occupant age and appliance type and age.
When calculating the risk of an individual case, a factor for each of these features can be applied to the average risk in order to determine the individual risk for this case. The factors have been determined by looking at the comparative risks for different features (e.g. the risk for a detached house compared to that of a terraced house).
When certain features are unknown, please see the procedure for no access in section 9.
5.1 Tenure Type
The categories in tenure type are: owner occupied, tenanted and commercial.
The Gas Safety Trust Report indicates "The risk of a CO incident occurring in a property with a private landlord is 50% greater than that either in an owner occupied property or one with a social sector landlord although the risk has tended to reduce since 1996." [13]. This factor has also been backed up
by the data from “Big Picture COHB Dailies.xlsx” [14].
The relative risk score for commercial properties is currently unknown.
5.2 Occupancy Type
The categories in occupancy type are: detached, semi-detached, terraced, bungalow and flat.
The relative risk scores shown in Table 5 have been estimated from the dwelling type figures of the Gas Safety Trust report.
Occupancy Type Relative Risk Score
Detached 0.62
Semi-detached 0.81
Terraced 1.64
Flat 1.02
Table 5: Occupancy Type Relative Risk Scores
The relative risk score for bungalows is currently unknown and it is assumed that this will be equal to that for a detached house.
5.3 Occupant Age
The categories in occupant age are: <70, ≥ 70 in sheltered accommodation and ≥ 70 in non-sheltered
accommodation.
The Gas Safety Trust report indicates "The risk that someone 70 years or older will be fatally injured in a CO incident is now 5 times that of anyone younger."[13]. This factor has also been backed up by the
data from “Big Picture COHB Dailies.xlsx” [14].
It is known from the current progress of the Oban survey that people in sheltered accommodation are under the care of a warden and this mitigates some of the increase in risk due to an occupant’s age.

Report Number: 16171 Issue: 2.3
DNV GL Restricted
Page 16
5.4 Appliance Type
The number of different appliances with different inherent CO poisoning risks as well as different risks for the age of each different appliance type is an extensive list and comparative risk factors are yet to be confirmed.
6 Statistical Approach
6.1 Frequency and Probability Calculations
Calculations have been carried out for combining probabilities and frequencies of events under “AND” and “OR” gates in the following way, see reference [15].
6.1.1 Combining Probabilities
6.1.1.1 AND
The probability of two or more independent events occurring at the same time is the product of their probabilities, see Figure 11. Examples of combining 2, 3 and 4 events in this way are shown below.
Figure 11: Combining AND Probabilities
𝑷(𝑨 𝒂𝒏𝒅 𝑩) = 𝑃(𝐴) ∙ 𝑃(𝐵)
𝑷(𝑨 𝒂𝒏𝒅 𝑩 𝒂𝒏𝒅 𝑪) = 𝑃(𝐴) ∙ 𝑃(𝐵) ∙ 𝑃(𝐶)
𝑷(𝑨 𝒂𝒏𝒅 𝑩 𝒂𝒏𝒅 𝑪 𝒂𝒏𝒅 𝑫) = 𝑃(𝐴) ∙ 𝑃(𝐵) ∙ 𝑃(𝐶) ∙ 𝑃(𝐷)
And so on.
6.1.1.2 OR
The probability of event A or event B occurring (not mutually exclusive) includes the probability of only event A occurring, only event B occurring and both event A and event B occurring at the same time. However you need to make sure that you don’t double count when both event A and event B occur, see Figure 12. Examples of combining 2, 3 and 4 events in this way are shown below.
P(A) P(B)
P (A and B)

Report Number: 16171 Issue: 2.3
DNV GL Restricted
Page 17
Figure 12: Combining OR Probabilities
𝑷(𝑨 𝒐𝒓 𝑩) = 𝑃(𝐴) + 𝑃(𝐵) − 𝑃(𝐴) ∙ 𝑃(𝐵)
𝑷(𝑨 𝒐𝒓 𝑩 𝒐𝒓 𝑪) = [𝑃(𝐴) + 𝑃(𝐵) + 𝑃(𝐶)] − [𝑃(𝐴) ∙ 𝑃(𝐵) + 𝑃(𝐴) ∙ 𝑃(𝐶) + 𝑃(𝐵) ∙ 𝑃(𝐶)] + 𝑃(𝐴) ∙ 𝑃(𝐵) ∙ 𝑃(𝐶)
𝑷(𝑨 𝒐𝒓 𝑩 𝒐𝒓 𝑪 𝒐𝒓 𝑫) = [𝑃(𝐴) + 𝑃(𝐵) + 𝑃(𝐶) + 𝑃(𝐷)]
−[𝑃(𝐴) ∙ 𝑃(𝐵) + 𝑃(𝐴) ∙ 𝑃(𝐶) + 𝑃(𝐴) ∙ 𝑃(𝐷) + 𝑃(𝐵) ∙ 𝑃(𝐶) + 𝑃(𝐵) ∙ 𝑃(𝐷) + 𝑃(𝐶) ∙ 𝑃(𝐷)]
+[𝑃(𝐴) ∙ 𝑃(𝐵) ∙ 𝑃(𝐶) + 𝑃(𝐴) ∙ 𝑃(𝐵) ∙ 𝑃(𝐷) + 𝑃(𝐴) ∙ 𝑃(𝐶) ∙ 𝑃(𝐷) + 𝑃(𝐵) ∙ 𝑃(𝐶) ∙ 𝑃(𝐷)]
−[𝑃(𝐴) ∙ 𝑃(𝐵) ∙ 𝑃(𝐶) ∙ 𝑃(𝐷)]
And so on.
6.1.2 Combining Frequencies
Frequencies are combined in a slightly different way to probabilities. Frequencies cannot be combined
under and gates, therefore they do not appear in this way within the fault tree.
When combining frequencies under or gates we simply add all the frequencies together. For example, if A occurred 3 days a week and B occurred 1 day a week, the frequency of A or B occurring would be 4 days a week (3/7 + 1/7 = 4/7).
𝑷(𝑨 𝒐𝒓 𝑩) = 𝑃(𝐴) + 𝑃(𝐵)
6.1.3 Combining Frequencies and Probabilities
Frequencies and probabilities cannot be combined under or gates, therefore they do not appear in this way within the fault tree.
To combine a frequency and probability under an and gate we need to multiply the two together. The result of multiplying a probability and a frequency is a frequency.
𝑷(𝑨𝒇𝒓𝒆𝒒𝒖𝒆𝒏𝒄𝒚 𝑨𝑵𝑫 𝑨𝒑𝒓𝒐𝒃𝒂𝒃𝒊𝒍𝒊𝒕𝒚) = 𝑃(𝐴𝑓𝑟𝑒𝑞𝑢𝑒𝑛𝑐𝑦) ∙ 𝑃(𝐴𝑝𝑟𝑜𝑏𝑎𝑏𝑖𝑙𝑖𝑡𝑦)
6.2 Monte Carlo
When calculating the risk of a particular area, e.g. Oban, then the average risk score for the UK could be fine-tuned by using population data for the features mentioned in Section 0 and the Monte Carlo
method.
Monte Carlo is a numerical method which is used to estimate uncertainty and bias error by running error calculations for a large number of hypothetical scenarios
Information from the 2011 Census for England and Wales [16], initial Oban survey results [17] and
supported housing information for older people in the UK [18] has been utilised in determining
population distributions for the Monte Carlo method.
P (A or B) P(A) P(B) P (A and B)
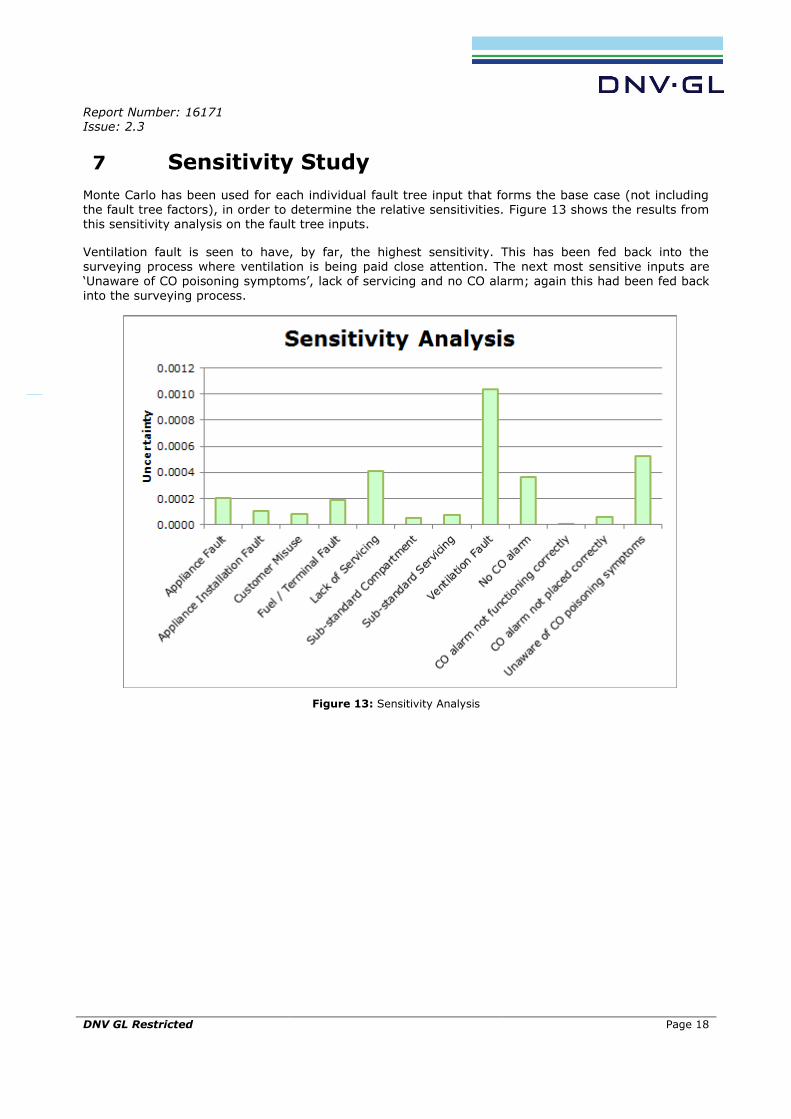
Report Number: 16171 Issue: 2.3
DNV GL Restricted
Page 18
7 Sensitivity Study
Monte Carlo has been used for each individual fault tree input that forms the base case (not including the fault tree factors), in order to determine the relative sensitivities. Figure 13 shows the results from this sensitivity analysis on the fault tree inputs.
Ventilation fault is seen to have, by far, the highest sensitivity. This has been fed back into the surveying process where ventilation is being paid close attention. The next most sensitive inputs are ‘Unaware of CO poisoning symptoms’, lack of servicing and no CO alarm; again this had been fed back into the surveying process.
Figure 13: Sensitivity Analysis
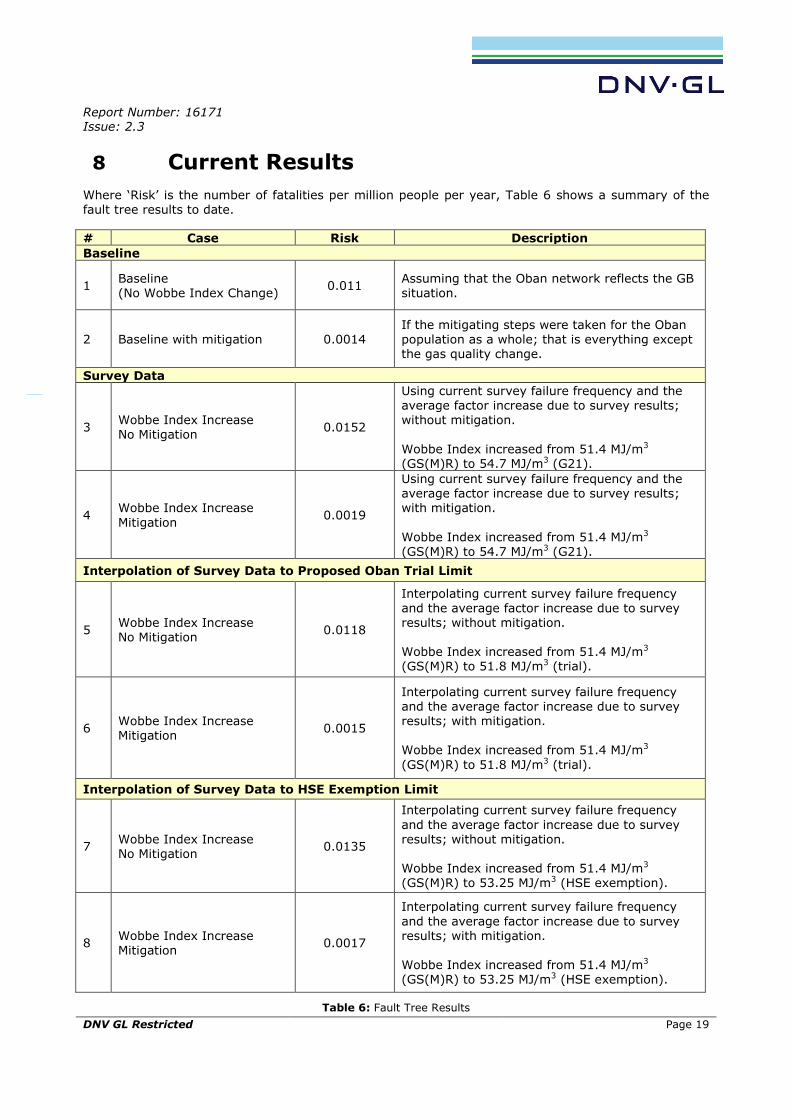
Report Number: 16171 Issue: 2.3
DNV GL Restricted
Page 19
8 Current Results
Where ‘Risk’ is the number of fatalities per million people per year, Table 6 shows a summary of the fault tree results to date.
# Case Risk Description
Baseline
1 Baseline (No Wobbe Index Change)
0.011 Assuming that the Oban network reflects the GB situation.
2 Baseline with mitigation 0.0014 If the mitigating steps were taken for the Oban population as a whole; that is everything except the gas quality change.
Survey Data
3 Wobbe Index Increase No Mitigation
0.0152
Using current survey failure frequency and the average factor increase due to survey results; without mitigation.
Wobbe Index increased from 51.4 MJ/m3 (GS(M)R) to 54.7 MJ/m3 (G21).
4 Wobbe Index Increase
Mitigation 0.0019
Using current survey failure frequency and the average factor increase due to survey results; with mitigation.
Wobbe Index increased from 51.4 MJ/m3
(GS(M)R) to 54.7 MJ/m3 (G21).
Interpolation of Survey Data to Proposed Oban Trial Limit
5 Wobbe Index Increase No Mitigation
0.0118
Interpolating current survey failure frequency and the average factor increase due to survey results; without mitigation. Wobbe Index increased from 51.4 MJ/m3 (GS(M)R) to 51.8 MJ/m3 (trial).
6 Wobbe Index Increase Mitigation
0.0015
Interpolating current survey failure frequency and the average factor increase due to survey results; with mitigation. Wobbe Index increased from 51.4 MJ/m3
(GS(M)R) to 51.8 MJ/m3 (trial).
Interpolation of Survey Data to HSE Exemption Limit
7 Wobbe Index Increase No Mitigation
0.0135
Interpolating current survey failure frequency
and the average factor increase due to survey results; without mitigation. Wobbe Index increased from 51.4 MJ/m3 (GS(M)R) to 53.25 MJ/m3 (HSE exemption).
8 Wobbe Index Increase Mitigation
0.0017
Interpolating current survey failure frequency
and the average factor increase due to survey results; with mitigation. Wobbe Index increased from 51.4 MJ/m3 (GS(M)R) to 53.25 MJ/m3 (HSE exemption).
Table 6: Fault Tree Results
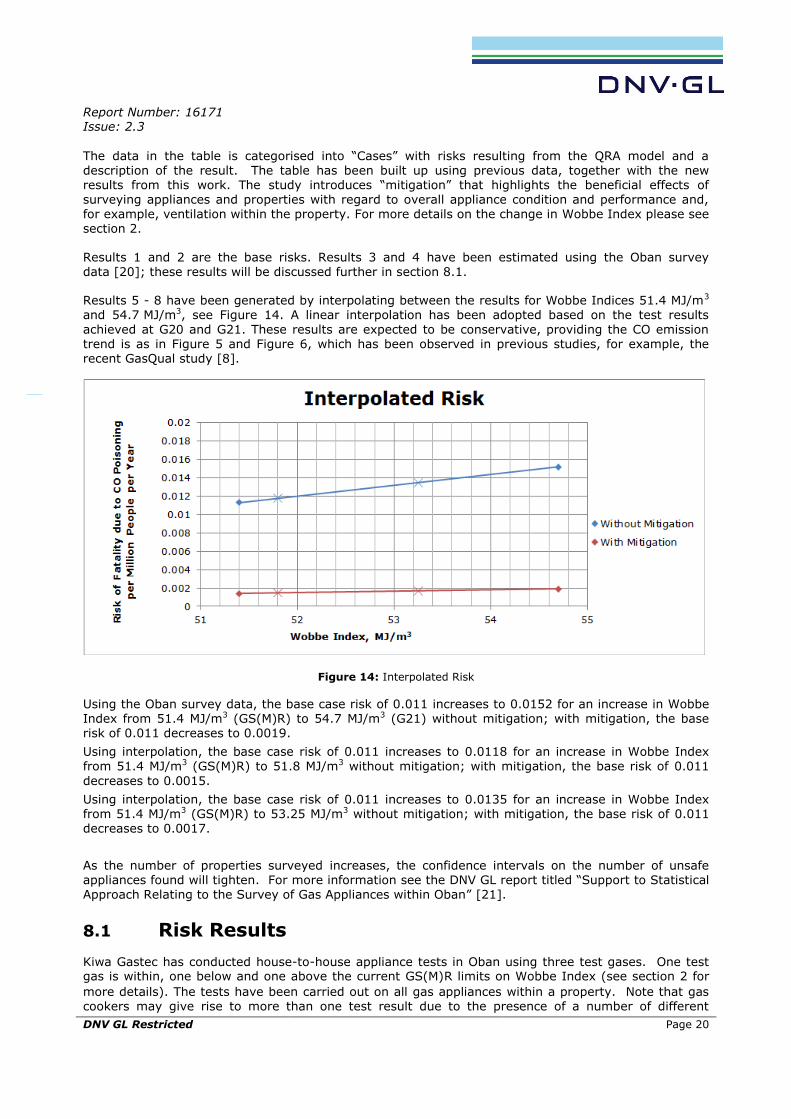
Report Number: 16171 Issue: 2.3
DNV GL Restricted
Page 20
The data in the table is categorised into “Cases” with risks resulting from the QRA model and a description of the result. The table has been built up using previous data, together with the new results from this work. The study introduces “mitigation” that highlights the beneficial effects of surveying appliances and properties with regard to overall appliance condition and performance and, for example, ventilation within the property. For more details on the change in Wobbe Index please see section 2.
Results 1 and 2 are the base risks. Results 3 and 4 have been estimated using the Oban survey data [20]; these results will be discussed further in section 8.1.
Results 5 - 8 have been generated by interpolating between the results for Wobbe Indices 51.4 MJ/m3 and 54.7 MJ/m3, see Figure 14. A linear interpolation has been adopted based on the test results
achieved at G20 and G21. These results are expected to be conservative, providing the CO emission trend is as in Figure 5 and Figure 6, which has been observed in previous studies, for example, the recent GasQual study [8].
Figure 14: Interpolated Risk
Using the Oban survey data, the base case risk of 0.011 increases to 0.0152 for an increase in Wobbe Index from 51.4 MJ/m3 (GS(M)R) to 54.7 MJ/m3 (G21) without mitigation; with mitigation, the base risk of 0.011 decreases to 0.0019.
Using interpolation, the base case risk of 0.011 increases to 0.0118 for an increase in Wobbe Index
from 51.4 MJ/m3 (GS(M)R) to 51.8 MJ/m3 without mitigation; with mitigation, the base risk of 0.011
decreases to 0.0015.
Using interpolation, the base case risk of 0.011 increases to 0.0135 for an increase in Wobbe Index from 51.4 MJ/m3 (GS(M)R) to 53.25 MJ/m3 without mitigation; with mitigation, the base risk of 0.011 decreases to 0.0017.
As the number of properties surveyed increases, the confidence intervals on the number of unsafe appliances found will tighten. For more information see the DNV GL report titled “Support to Statistical Approach Relating to the Survey of Gas Appliances within Oban” [21].
8.1 Risk Results
Kiwa Gastec has conducted house-to-house appliance tests in Oban using three test gases. One test gas is within, one below and one above the current GS(M)R limits on Wobbe Index (see section 2 for
more details). The tests have been carried out on all gas appliances within a property. Note that gas cookers may give rise to more than one test result due to the presence of a number of different

Report Number: 16171 Issue: 2.3
DNV GL Restricted
Page 21
burners – grills, ovens and large and small hob burners were each tested separately. Results have been calculated by estimating both the base risk associated with changing the Wobbe Index and the average risk factor of appliances surveyed. Please note that the data has not been screened by DNV GL, with the exception of ignoring records where CO ppm results are zero or blank, and the data has been used as received.
8.1.1 Absolute CO Risk
The percentage of appliances in the survey which have exhibited an absolute CO ppm value greater than or equal to 1000 ppm for decreased Wobbe Index (using test gas G23 as defined in EN 437) and
increased the Wobbe Index (using test gas G21 as defined in EN 437) have been inspected. G20 is the reference gas [22].
Four appliances exhibited a CO ppm value greater than or equal to 1000 ppm (1069, 1276, 1740 and 2105 ppm) for the G23 test gas from a total of 1875 records; this leads to a frequency of 0.0021.
18 appliances exhibited a CO ppm value greater than or equal to 1000 ppm (ranging from 1048 -
5652 ppm) for the G21 test gas from a total of 1916 records; this leads to a frequency of 0.0094.
In both cases, the percentage of extreme absolute CO values (>1000 ppm) is less than 1% of the surveyed properties.
8.1.2 Risk Factors
The risk factors have been estimated by looking at both the ratio between CO ppm values for G23 & G20 and G20 & G21 (i.e. the increase in CO from one Wobbe Index to another), as well as an upper
threshold for all values. The following rules have been applied, each increasing the base risk by a
conservative factor of 2.
Decreasing Wobbe Index:
G20 CO ≥ 200 ppm G23 CO ≥ 200 ppm Ratio between G23 and G20 ≥ 4
Increasing Wobbe Index:
G20 CO ≥ 200 ppm G21 CO ≥ 200 ppm Ratio between G20 and G21 ≥ 4
The upper threshold value of 200 ppm has been taken from the short-term exposure limit in the HSE standard for workplace exposure limits, EH40 [23]. Individual factors have been multiplied, an
example is shown in Figure 15.
Figure 15: Factor Calculation Example
Using the Kiwa Gastec test results, the average risk factors have been calculated as 1.1336 and 1.3446 for decreasing and increasing the Wobbe Index respectively.
The risk factors combined with the base risk gives 0.0128 and 0.0152 fatalities per million population
per year for decreasing and increasing the Wobbe Index respectively. When including mitigation, these values decrease to 0.0016 and 0.0019 respectively.
G20 = 50 ppm (factor = 1) G21 = 256 ppm (factor = 2) G23 = 65 ppm (factor = 1) Ratio between G23 and G20 = 1.3 (factor = 1) Ratio between G20 and G21 = 5.12 (factor = 2)
Increasing Wobbe Index Risk factor = 1 x 2 x 2 = 4
Decreasing Wobbe Index Risk factor = 1 x 1 x 1 = 1

Report Number: 16171 Issue: 2.3
DNV GL Restricted
Page 22
Micromorts are used as a comparative measure of risk for various hazards. A variety of micromorts are listed in Appendix B as a comparison for the risks of CO fatalities calculated for this project.
9 No Access
The more properties surveyed in Oban, the higher the accuracy of the estimated overall risk score for Oban. However, properties for which no access can be gained must be looked at on a case by case
basis.
When looking at individual cases all known factors about the property (see Section 5) can be applied. If
however, there is something unknown about the property (which is inevitable if a full inspection is not
undertaken), then a reasonable worst case must be assumed. For example, if the occupant age is unknown the reasonable worst case is that the occupant is over the age of 70.
10 Summary
Where risk is defined as the number of fatalities per million people per year, the results in Table 7 have been estimated using the fault tree approach to evaluating the risk associated with CO and changing the acceptable gas quality.
Wobbe Index
(MJ/m³) Risk
Difference versus existing GB risk
level
GS(M)R Limit
51.4 Without Mitigation 0.011 0.0000
With Mitigation* 0.0014 -0.0096
Survey Test Gas Limit, G21 (from survey data)
54.7 Without Mitigation 0.0152 0.0042
With Mitigation* 0.0019 -0.0091
HSE Exemption Limit (from survey data)
53.25 Without Mitigation 0.0135 0.0025
With Mitigation* 0.0017 -0.0093
Proposed Oban Field Trial Limit (from survey data) (Assuming that the Wobbe Index is the average of the likely Zeebrugge gas quality)
51.8 Without Mitigation 0.0118 0.0008
With Mitigation* 0.0015 -0.0095
*Mitigation includes surveying appliance installations regarding their condition and performance, and rectifying where necessary.
Table 7: Summary of Fault Tree Results
The resultant risk has been calculated using all the available Oban survey data. A risk value for “no
access” properties shall be calculated on a case by case basis by combining known information and assuming a reasonable worst case for unknown information.
Using interpolation of the latest survey results, the base risk of 0.011 increases to 0.0135 for an increase in Wobbe Index from 51.4 MJ/m3 (GS(M)R) to 53.25 MJ/m3 (HSE exemption). The risk values
for gas quality are approximately thirty times lower than those for electrocution in the home, and over
five hundred times lower than those for CO poisoning from solid fuel.
Report Number: 16171 Issue: 2.3
DNV GL Restricted
Page 23
11 References
[1] BS EN 437:2003+A1:2009 “Test Gases, Test Pressures, Appliance Categories”, Tables 1 and 2, 2009.
[2] Gas Safety (Management) Regulations 1996, Part I “Requirements Under Normal Conditions”, 1996.
[3] Gas Safety (Management) Regulations 1996, Part II “Requirements for Gas Conveyed to Prevent a Supply Emergency”, 1996.
[4] BS EN 50292:2002 “Electrical apparatus for the detection of carbon monoxide in domestic premises. Guide on the selection, installation, use and maintenance”, February 2002.
[5] BS 7967-5:2010 “Carbon monoxide in dwellings and other premises and the combustion performance of gas-fired appliances. Guide for using electronic portable combustion gas
analysers in non-domestic premises for the measurement of carbon monoxide and carbon dioxide levels and the determination of combustion performance”, September 2010.
[6] IGEM Flame newsfeed - Issue 70, IGEM, 5th June 2014.
[7] Rationale for the selection of 18 appliances for laboratory tests using gases over an extended Wobbe Index range, Kiwa, 2014.
[8] D6-1 Conclusions on domestic appliances, GasQual, January 2012.
[9] CAIS23 revision 2: Gas Safety in Catering and Hospitality, HSE, July 2013.
[10] Downstream Incident Data Report (DIDR) 2011/2012, Gas Safety Trust, 2012.
[11] Study on the Provision of Carbon Monoxide Detectors Under The Building Regulations BD 2754, Department for Communities and Local Government, September 2009.
[12] Domestic Carbon Monoxide Alarms Long-term Reliability and Use Scoping Study, HSE, 2011.
[13] Gas Safety Trust; Carbon Monoxide Trends Report – 1996 to 2010, Gas Safety Trust, 2011.
[14] Big Picture COHB Dailies.xlsx, Kiwa, 2014.
[15] “FaultTree+” software package (V11.2.3), Isograph Ltd.
[16] 2011 Census: Key Statistics for England and Wales, Office for National Statistics, March 2011.
[17] Oban_Survey_Results_Cleansed_v3.1.xlsx, Dave Lander Consulting, 2014.
[18] Supported Housing for Older People in the UK: An Evidence Review, Joseph Rowntree Foundation, December 2012.
[19] SGN Exemption Application for the Oban Field Trial, SGN, November 2014 – draft document by Dave Lander Consulting.
[20] Export-2015-01-30-13-48.xlsx, Kiwa, January 2014.
[21] 15870 “Support to Statistical Approach Relating to the Survey of Gas Appliances within Oban”, Suzanne Bradbury (DNV GL), 20th October 2014.
[22] BS EN 437:2003+A1:2009 “Test gases. Test pressures. Appliance categories” 31 May 2009
[23] EH40/2005 Workplace Exposure Limits, HSE, March 2013.
[24] “The Odds of Dying”, LiveScience.com, http://www.livescience.com/3780-odds-dying.html, 3rd March 2015 14:00
[25] Statistics on fatal injuries in the workplace in Great Britain 2014, The Health and Safety Executive, July 2014.
[26] Electrical Safety First Core Data Set - 2010, Electrical Safety First, http://www.electricalsafetyfirst.org.uk/news-and-campaigns/policies-and-research/statistics/, 3rd March 2015 14:00
[27] Re-valuation of Home Accidents, Transport Research Laboratory, March 2010
[28] 2010-Based Statistical Bulletin, Office for National Statistics, National Population Projections
October 2011.
[29] Home Population and Components of Change 2000-2013, Northern Ireland Statistics and Research Agency, 2014.
[30] Measuring National Well-being - Households and Families, 2012. Office for National Statistics 26 April 2012)
Report Number: 16171 Issue: 2.3
DNV GL Restricted
Page 24
[31] Off-gas consumers Information on households without mains gas heating. Consumer Focus http://www.consumerfocus.org.uk/files/2011/10/Off-gas-consumers.pdf
[32] CO-Gas Safety’s 20th Anniversary (1995-2015)
http://www.co-gassafety.co.uk/presspack/Press%20Pack%20%202015.pdf
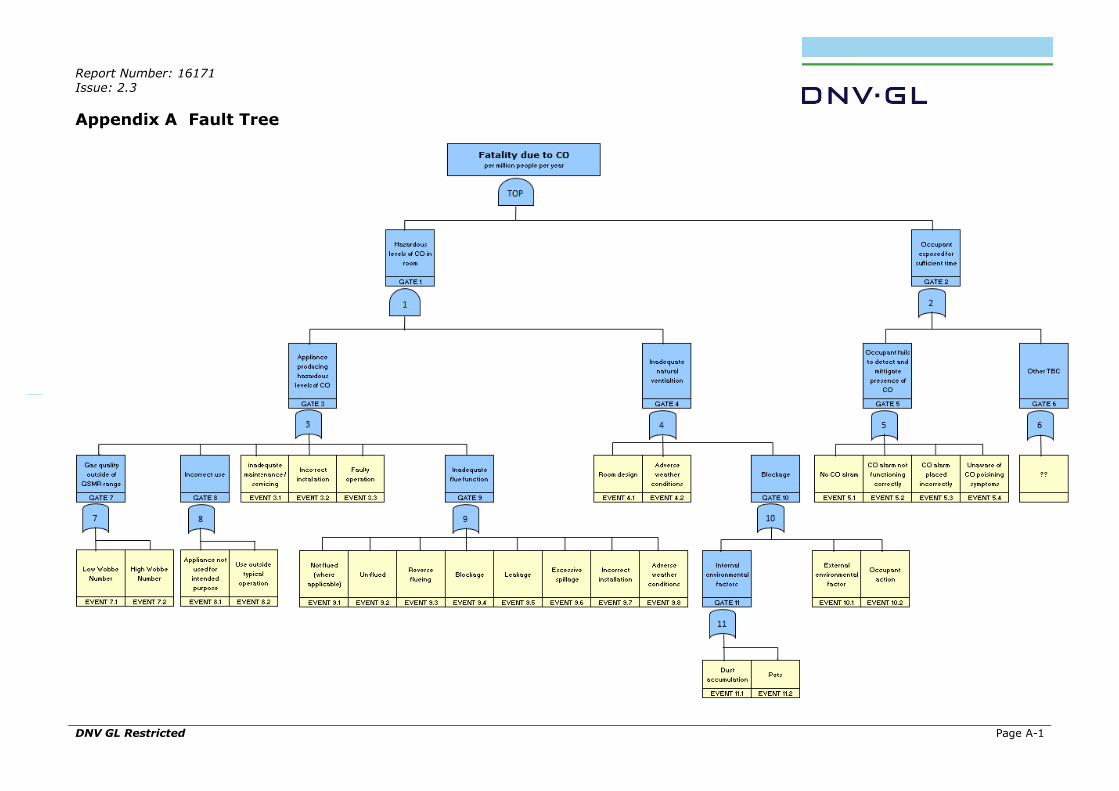
Report Number: 16171 Issue: 2.3
DNV GL Restricted Page A-1
Appendix A Fault Tree
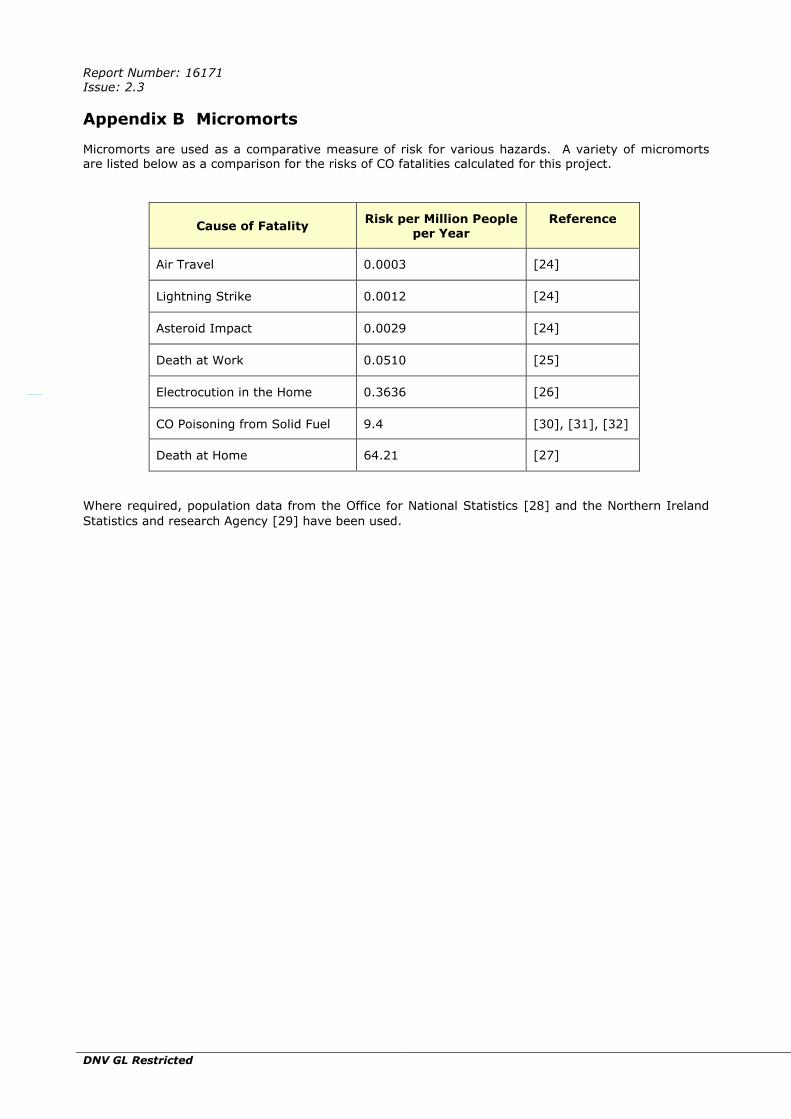
Report Number: 16171 Issue: 2.3
DNV GL Restricted Page B-1
Appendix B Micromorts
Micromorts are used as a comparative measure of risk for various hazards. A variety of micromorts are listed below as a comparison for the risks of CO fatalities calculated for this project.
Cause of Fatality Risk per Million People
per Year Reference
Air Travel 0.0003 [24]
Lightning Strike 0.0012 [24]
Asteroid Impact 0.0029 [24]
Death at Work 0.0510 [25]
Electrocution in the Home 0.3636 [26]
CO Poisoning from Solid Fuel 9.4 [30], [31], [32]
Death at Home 64.21 [27]
Where required, population data from the Office for National Statistics [28] and the Northern Ireland
Statistics and research Agency [29] have been used.
GB ROLL-OUT OF OUGM
Risk Factor Update Technical Note SGN
Report No.: 112EAPNU-3, Rev. 2
Document No.: 1
Date: 06/10/2016
DNV GL – Report No. 112EAPNU-3, Rev. 2 – www.dnvgl.com Page i
Project name: GB Roll-Out of OUGM DNV GL Oil and Gas
Technical Advisory
Holywell Park
Ashby Road
Loughborough
Leicestershire
LE11 3GR
Tel: +44 2038 164315
Report title: Risk Factor Update Technical Note
Customer: SGN, Axis House, 5 Lonehead Drive, Newbridge,
Edinburgh, EH28 8TG.
Contact person: Jamie McAinsh
Date of issue: 06/10/2016
Project No.: E-8518
Organisation unit: Energy Measurement & Compliance
Report No.: 112EAPNU-3, Rev. 2
Document No.: 1
Applicable contract(s) governing the provision of this Report:
Objective:
Prepared by: Verified by: Approved by:
Hazel Richardson
Senior Engineer
Martin Brown
Consultant
Sarah Kimpton
Senior Consultant
Copyright © DNV GL 2015. All rights reserved. This Report is protected by copyright and may not be reproduced in whole or in part by
any means without the approval in writing of DNV GL. No Person, other than the Customer for whom it has been prepared, may place
reliance on its contents and no duty of care is assumed by DNV GL toward any Person other than the Customer. This Report must be
read in its entirety and is subject to any assumptions and qualifications expressed therein. Elements of this Report contain detailed
technical data which is intended for analysis only by persons possessing requisite expertise in its subject matter. DNV GL and the
Horizon Graphic are trademarks of DNV GL AS. DNV GL Distribution: Keywords:
☐ Unrestricted distribution (internal and external) [Keywords]
☐ Unrestricted distribution within DNV GL
☒ Limited distribution within DNV GL after 3 years
☐ No distribution (confidential)
☐ Secret
Rev. No. Date Reason for Issue Prepared by Verified by Approved by
0 2016-09-30 First issue HR MB MB
1 2016-10-05 Second issue MB/SK SK MB
2 2016-10-06 Third issue HR/SK MB SK

Page 1
1 INTRODUCTION
DNV GL previously provided SGN with Report 16171 Quantitative Risk Assessment Evaluating the Risk
Associated with Carbon Monoxide and Changing Acceptable Gas Quality - Final Report /1/. SGN have
contracted DNV GL to update the QRA fault tree to give an updated quantification of change in risk
associated with an increase in Wobbe Index. This update utilises the data collected as part of the
Opening Up the Gas Market project, and in particular the data on appliance and flue types.
This technical note provides an overview of how the risk factors have been updated and the impact on
the calculated change in risk associated with an increase in Wobbe Index.
2 CALCULATION METHOD
The risk factors have been estimated by looking at both the ratio between CO ppm values for G20 & G21
gases (i.e. the increase in CO from one Wobbe Index to another), as well as an upper threshold for the
absolute CO ppm values. During the original analysis (report 16171 /1/) the following rules were applied,
with each increasing the base risk by a conservative factor of 2, whilst a factor of 1 is applied if the
statement is not true
G20 CO ≥ 200 ppm
G21 CO ≥ 200 ppm
Ratio between CO ppm(G21) and CO ppm (G20) ≥ 4
The upper threshold value of 200 ppm was taken from the short-term exposure limit in the HSE standard
for workplace exposure limits, EH40 /2/.
The ratio factor highlights the sensitivity of the appliance to change in gas quality, irrespective of the
starting baseline emission on G20. It forms the “belt and braces” approach to understanding the impact
of gas quality and is introduced to account for the impact of appliance ageing. It is known that, in
general, emissions increase with appliance use and age, and as such it is appropriate to introduce a
factor that accounts for this. Previous appliance testing suggested that a reasonable estimate for a G20
CO emission on an appliance that had been correctly installed and operated was around 50 ppm. [Note
this estimate has been corroborated by the appliance test work undertaken on the population of Oban
appliances where an average of 56 ppm was observed.] The maximum ratio that can result from this
50 ppm to the G21 CO emission threshold of 200 ppm is thus equal to 4. This factor was deemed an
appropriate ratio factor to use to provide a conservative estimate of risk.
Individual factors have been multiplied to create a “Total factor”, and an example is shown below.
Example 1
G20 = 50 ppm Factor = 1
G21 = 256 ppm Factor = 2
Ratio between G20 and G21 = 5.12 Factor = 2
Total Factor = 1 x 2 x 2 = 4
The total factor was calculated for all individual appliance data. The set of individual appliance data was
then averaged with no weighting factors, and the resulting value contains information from appliances
Page 2
where there is no material change i.e. a factor of 1, to appliances with a more sensitive response to WI
and these may have a higher factor.
The base risk was then multiplied by this average total factor, the difference between these two values
resulted in the percentage change in risk from G20 to G211. The estimated change in risk for a Wobbe
Index of 53.25 MJ/m3 (the HSE exemption limit) was then interpolated between these two values, using
a linear fit. The linear fit was recognised as a conservative approach and agreed for the HSE exemption.
3 NOTABLE CONSIDERATIONS
For the new study, the method of calculation has remained the same as noted above, with only the rules
governing the multiplying factors and threshold values changing.
The following points discuss two further changes to the method / data which were considered:
Quadratic Interpolation – with only three points of data, there are too few points to justify a
curve fit and the uncertainties in any fitted values would be very high. A linear interpolation is
the only justifiable route but it will over-estimate the value at 53.25 MJ/m3 – this fulfils the
conservative best estimate criterion supported by HSE.
Removal of Beko grill data from incident data – in recent years there have been a number of
deaths caused by a design fault in Beko grills; these deaths do not appear to be statistical
outliers and there are five Beko grills within the Oban data set. It was not therefore seen as
statistically sound to remove this data. However, it should be noted that this design flaw has led
to an extensive product recall.
4 UPDATED RULES
The changes considered the following:
Different CO ppm threshold values by flue type:
o Flueless (FL) and open flue (OF) appliances
o Fan flue (FF), room-sealed balanced flue (BF) and room sealed fanned balanced flue (FBF)
appliances
o Room sealed appliances will not vent into the room and will only be a hazard if they are
not sealed properly.
Increase in CO ppm threshold:
o Investigation of 250 ppm CO emission threshold for OF and FL appliances and 500 ppm
for FF, FBF and BF appliances. 250 ppm is not unreasonable for the OF and FL appliances,
and these two concentrations were used in some of the GasQual work.
Increased ratio:
o The ratio value can be increased from 4 to 5 – which parallels the change from 200 to
250 ppm for the CO threshold.
The scenarios in Table 1 have been investigated.
1 Report 16171 /1/ determined the relative change in risk from increasing the Wobbe Index and not the absolute change in risk.
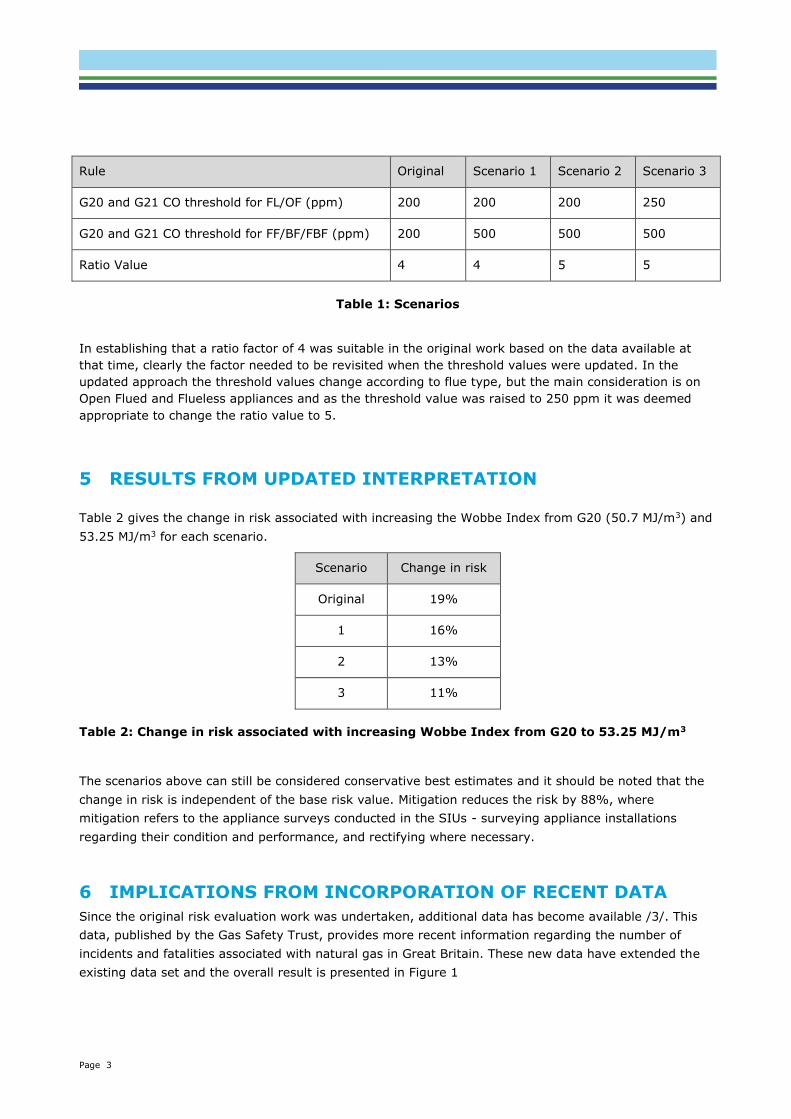
Page 3
Rule Original Scenario 1 Scenario 2 Scenario 3
G20 and G21 CO threshold for FL/OF (ppm) 200 200 200 250
G20 and G21 CO threshold for FF/BF/FBF (ppm) 200 500 500 500
Ratio Value 4 4 5 5
Table 1: Scenarios
In establishing that a ratio factor of 4 was suitable in the original work based on the data available at
that time, clearly the factor needed to be revisited when the threshold values were updated. In the
updated approach the threshold values change according to flue type, but the main consideration is on
Open Flued and Flueless appliances and as the threshold value was raised to 250 ppm it was deemed
appropriate to change the ratio value to 5.
5 RESULTS FROM UPDATED INTERPRETATION
Table 2 gives the change in risk associated with increasing the Wobbe Index from G20 (50.7 MJ/m3) and
53.25 MJ/m3 for each scenario.
Scenario Change in risk
Original 19%
1 16%
2 13%
3 11%
Table 2: Change in risk associated with increasing Wobbe Index from G20 to 53.25 MJ/m3
The scenarios above can still be considered conservative best estimates and it should be noted that the
change in risk is independent of the base risk value. Mitigation reduces the risk by 88%, where
mitigation refers to the appliance surveys conducted in the SIUs - surveying appliance installations
regarding their condition and performance, and rectifying where necessary.
6 IMPLICATIONS FROM INCORPORATION OF RECENT DATA
Since the original risk evaluation work was undertaken, additional data has become available /3/. This
data, published by the Gas Safety Trust, provides more recent information regarding the number of
incidents and fatalities associated with natural gas in Great Britain. These new data have extended the
existing data set and the overall result is presented in Figure 1
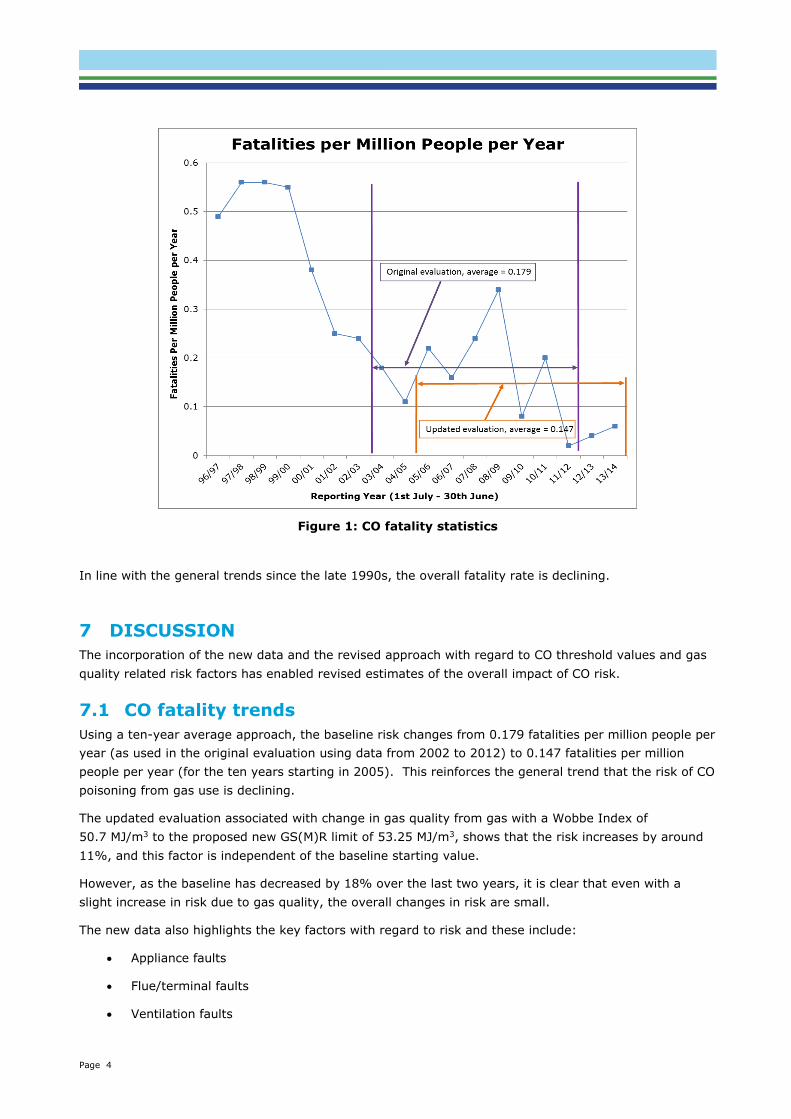
Page 4
Figure 1: CO fatality statistics
In line with the general trends since the late 1990s, the overall fatality rate is declining.
7 DISCUSSION
The incorporation of the new data and the revised approach with regard to CO threshold values and gas
quality related risk factors has enabled revised estimates of the overall impact of CO risk.
7.1 CO fatality trends
Using a ten-year average approach, the baseline risk changes from 0.179 fatalities per million people per
year (as used in the original evaluation using data from 2002 to 2012) to 0.147 fatalities per million
people per year (for the ten years starting in 2005). This reinforces the general trend that the risk of CO
poisoning from gas use is declining.
The updated evaluation associated with change in gas quality from gas with a Wobbe Index of
50.7 MJ/m3 to the proposed new GS(M)R limit of 53.25 MJ/m3, shows that the risk increases by around
11%, and this factor is independent of the baseline starting value.
However, as the baseline has decreased by 18% over the last two years, it is clear that even with a
slight increase in risk due to gas quality, the overall changes in risk are small.
The new data also highlights the key factors with regard to risk and these include:
Appliance faults
Flue/terminal faults
Ventilation faults
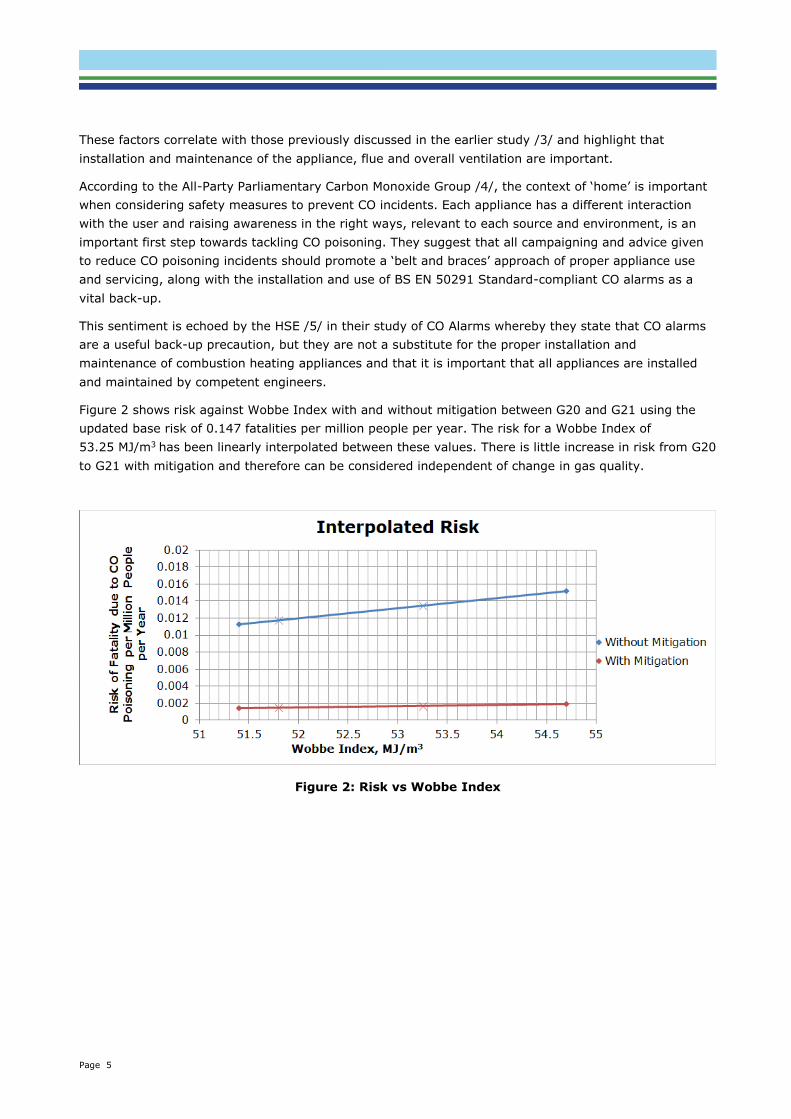
Page 5
These factors correlate with those previously discussed in the earlier study /3/ and highlight that
installation and maintenance of the appliance, flue and overall ventilation are important.
According to the All-Party Parliamentary Carbon Monoxide Group /4/, the context of ‘home’ is important
when considering safety measures to prevent CO incidents. Each appliance has a different interaction
with the user and raising awareness in the right ways, relevant to each source and environment, is an
important first step towards tackling CO poisoning. They suggest that all campaigning and advice given
to reduce CO poisoning incidents should promote a ‘belt and braces’ approach of proper appliance use
and servicing, along with the installation and use of BS EN 50291 Standard-compliant CO alarms as a
vital back-up.
This sentiment is echoed by the HSE /5/ in their study of CO Alarms whereby they state that CO alarms
are a useful back-up precaution, but they are not a substitute for the proper installation and
maintenance of combustion heating appliances and that it is important that all appliances are installed
and maintained by competent engineers.
Figure 2 shows risk against Wobbe Index with and without mitigation between G20 and G21 using the
updated base risk of 0.147 fatalities per million people per year. The risk for a Wobbe Index of
53.25 MJ/m3 has been linearly interpolated between these values. There is little increase in risk from G20
to G21 with mitigation and therefore can be considered independent of change in gas quality.
Figure 2: Risk vs Wobbe Index

Page 6
7.2 ALARP
ALARP (As Low As Reasonably Possible) calculations have been carried out to determine the justifiable
spend for mitigating the CO risks associated with the change in gas quality. The parameters used in the
calculation are shown in Table 3; they are based on data from the Rail Safety and Standards Board. /6/
Input Value Comment
Value of preventing a
fatality £1,889,000 From Rail Safety and Standards Board /6/
Gross Disproportion
Factor 10 Conservative estimate from HSE guidelines
Number of gas
consumers 50,000,000
Average occupancy of 2.3 people in approximately
22,000,000 properties served by gas
Table 3: Parameters used in the ALARP calculations
Two conditions have been tested:
Applying the mitigation measures that were undertaken during the Opening Up the Gas Market
Project (that is, checking all appliances in GB and maintaining/replacing appliances as required)
The continuation of nitrogen ballasting of LNG at a cost of £325M per annum
Two values of the baseline risk have been used as described in section 7.1:
0.179 fatalities per million people per year for the ten-year average starting from 2002
0.147 fatalities per million people per year for the ten-year average starting from 2005.
The increase in risk associated with changing the Wobbe Index from 50.7 MJ/m3 to the proposed new
GS(M)R limit of 53.25 MJ/m3 was 11%, and this factor is independent of the baseline starting value.
The risk of fatalities following the mitigation measures undertaken during the Opening Up the Gas
Market Project is also independent of the baseline value and remains at 0.027 fatalities per million
people per year.
The results of the calculations are shown in Table 4 and Table 5.
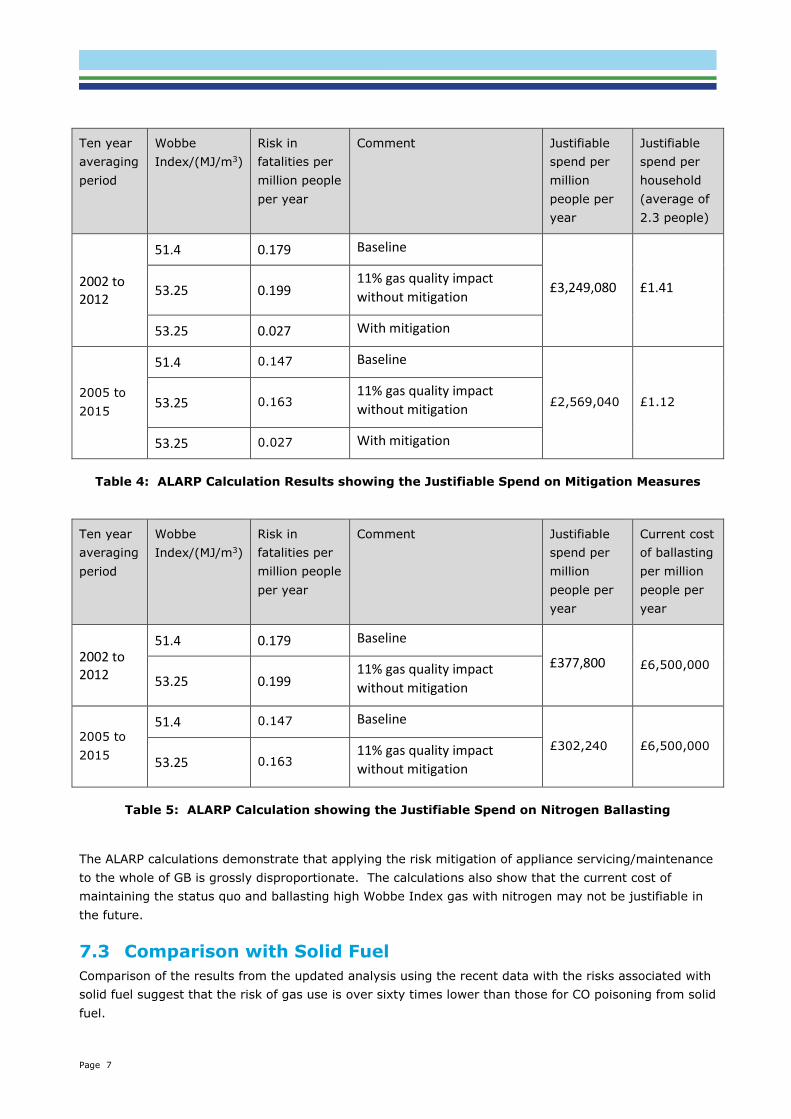
Page 7
Ten year
averaging
period
Wobbe
Index/(MJ/m3)
Risk in
fatalities per
million people
per year
Comment Justifiable
spend per
million
people per
year
Justifiable
spend per
household
(average of
2.3 people)
2002 to 2012
51.4 0.179 Baseline
£3,249,080 £1.41 53.25 0.199 11% gas quality impact
without mitigation
53.25 0.027 With mitigation
2005 to
2015
51.4 0.147 Baseline
£2,569,040 £1.12 53.25 0.163 11% gas quality impact
without mitigation
53.25 0.027 With mitigation
Table 4: ALARP Calculation Results showing the Justifiable Spend on Mitigation Measures
Ten year
averaging
period
Wobbe
Index/(MJ/m3)
Risk in
fatalities per
million people
per year
Comment Justifiable
spend per
million
people per
year
Current cost
of ballasting
per million
people per
year
2002 to 2012
51.4 0.179 Baseline
£377,800 £6,500,000 53.25 0.199
11% gas quality impact
without mitigation
2005 to
2015
51.4 0.147 Baseline
£302,240 £6,500,000
53.25 0.163 11% gas quality impact
without mitigation
Table 5: ALARP Calculation showing the Justifiable Spend on Nitrogen Ballasting
The ALARP calculations demonstrate that applying the risk mitigation of appliance servicing/maintenance
to the whole of GB is grossly disproportionate. The calculations also show that the current cost of
maintaining the status quo and ballasting high Wobbe Index gas with nitrogen may not be justifiable in
the future.
7.3 Comparison with Solid Fuel
Comparison of the results from the updated analysis using the recent data with the risks associated with
solid fuel suggest that the risk of gas use is over sixty times lower than those for CO poisoning from solid
fuel.

Page 8
8 REFERENCES
/1/ DNV GL, Report 16171 Quantitative Risk Assessment Evaluating the Risk Associated with
Carbon Monoxide and Changing Acceptable Gas Quality - Final Report, January 2016.
/2/ EH40/2005 Workplace Exposure Limits, HSE, March 2013
/3/ DIDR Carbon Monoxide Incident Report (2013/14). Gas Safety Trust. Published 2015.
/4/ All-Party Parliamentary Carbon Monoxide Group, 2015. From Awareness to Action
/5/ HSE, 2011. Domestic Carbon Monoxide Alarms. Long-term reliability and use scoping study
/6/ Rail Safety and Standards Board Guidance on the use of cost-benefit analysis when determining
whether a measure is necessary to ensure safety so far as is reasonably practicable July 2014
http://www.rssb.co.uk/risk-analysis-and-safety-reporting/risk-analysis/taking-safe-
decisions/taking-safe-decisions-safety-related-cba

Page 9
About DNV GL Driven by our purpose of safeguarding life, property and the environment, DNV GL enables organizations
to advance the safety and sustainability of their business. We provide classification and technical assurance along with software and independent expert advisory services to the maritime, oil and gas, and energy industries. We also provide certification services to customers across a wide range of industries. Operating in more than 100 countries, our 16,000 professionals are dedicated to helping our customers make the world safer, smarter and greener.