OPEN COAST - University of Florida
29
FLORIDN SGI4Nr COLEGE SEAVALL DESIGN ON THE OPEN COAST by Todd L. Walton, Jr. & William Sensabaugh Report Number 29 June 1979 O . . CI~~- .. .
Transcript of OPEN COAST - University of Florida

FLORIDNSGI4Nr COLEGE
SEAVALL DESIGN ON THE OPEN COASTby Todd L. Walton, Jr. & William Sensabaugh
Report Number 29 June 1979
O . .CI~~- .. .
DISCLAIMER
The suggested design procedure of seawalls as describedin this publication shall be at the sole risk and responsibilityof the user with no liability of any nature whatsoever on thepart of the authors, the Marine Advisory Program-Sea Grant, orthe Florida State University System. It is suggested that forany design a registered professional engineer with experiencebe consulted.
TABLE OF CONTENTS
List of Figures. . . . . . . . . . . . . . . . .... . . ii
Introduction . . . . . . . . . . . . . . . .... .....
Effects of Seawalls on the Beach System. . . . . . . . . 2
Site Design Considerations . . . . . . . . . . . . . . . 5
Calculation of Beach Profile Changes Due toLong Term Effects . . . . . . . . . . . . . . . . . . 5
Calculation of Beach Profile Change Due toStorm Effects . . . . . . . . . . . . . . . .... ... 5
Scour ... . . . . . . . . . . . . .... . . . . . . . 7
Wave Forces . . . . . . . . . . . . . . . . ... .. . 8
Special Design Considerations. . . . . . . . . . . . .. 9
Return Wall Design Length . . . .. . . . . . . . . . 9
Summary Review of Design Methods . . . . . . . . ... . 12
Anchorage Design. . . . . . . . . . . . . . . . . . . 14
Example Design for Seawall. . . . . . . . . . . ... 17
i

LIST OF FIGURES
Figure Page
1 Anchored Seawall (or "Bulkhead) 2
2 Qualitative Effects of Continuous Seawall onStorm Profile 3
3 Effect of Seawall of Limited Length on Stormor Long-Term Beach Plan Form 4
4 Effects on an Adjacent Beach Caused by aVertical Faced Seawall 4
5 Beach Profile Change Due to Storm 6
6 Inadequate Return Wall Length 10
7 Graph For Use in Design of Return WallLength 11
8 Return Wall Design Length 12
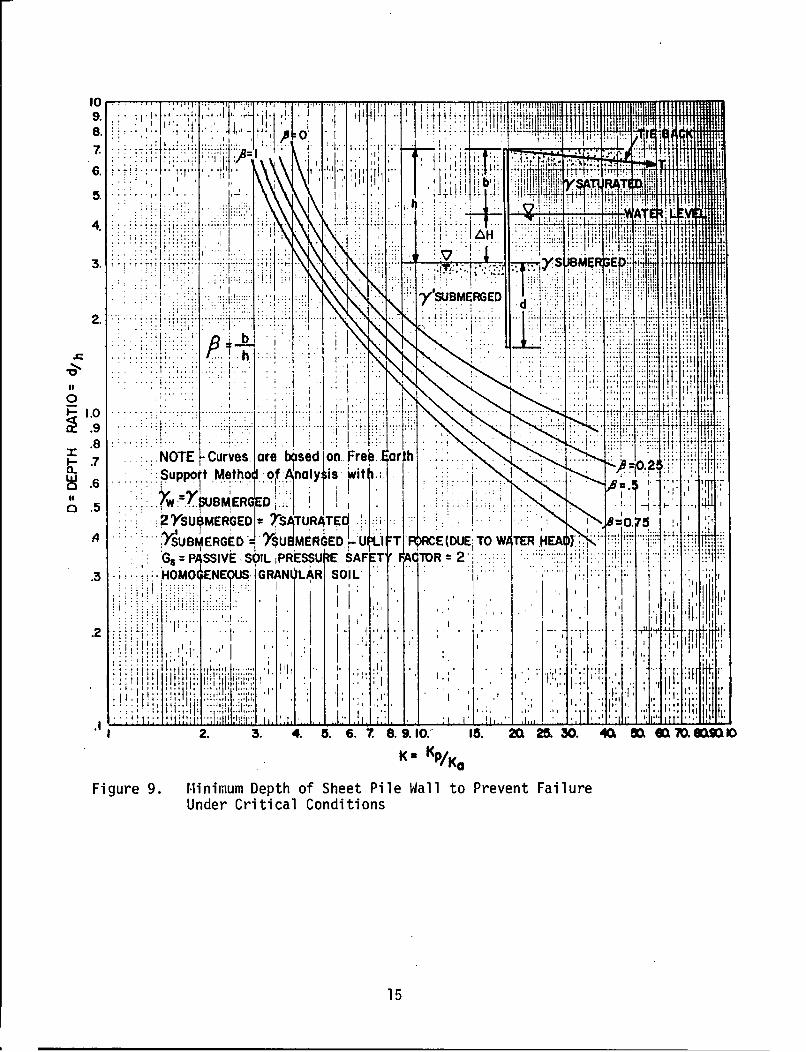
9 Minimum Depth of Sheet Pile Wall to PreventFailure Under Critical Conditions 15
10 Types of Anchoring Systems 16
11 Location of Anchorage for Full PassiveResistance 16
12 Proposed Seawall Location and Design ProfileAssumptions 18
13 Design Assumptions 19
ii
INTRODUCTION
Seawall design on the open coast is an often overlooked problem inthe State of Florida as well as other areas of the South Atlantic and GulfCoasts. Escoffier [1] mentions numerous seawall failures and improperdesign considerations along the Mississippi Gulf Coast which were exposedby hurricanes after the seawalls were built.
In Florida the problem is even more apparent due to its rapidlyexpanding coastal population. Present seawall design inadequacies weremade apparent recently after Hurricane Eloise (September 1975), whenrepermitting of over 8,000 feet of damaged or destroyed seawalls had tobe handled by the Bureau of Beaches and Shores, Florida Department ofNatural Resources. Presently, seawalls designed for the open coast arerunning $150 - $300 per lineal foot. In some areas, the cost of seawallreplacement may be higher than the replacement cost of the upland constructionit protects.
The basic function of all seawalls is to support, stabilize, and protectupland property and construction against wave action and erosion. The im-portance of any specific design used must take into consideration theconsequences of seawall failure, as well as the initial cost of seawalls.Unfortunately, in past practice, seawall design has been governed by theamount of money the upland owner was willing to pay, with little thought asto whether the structure would endure the critical environment in which itwas placed. The attitude contributed to the numerous costly failuresas noted after "Eloise".
Presently, the Bureau of Beaches and Shores, Florida Department ofNatural Resources requires a permit to build seaward of the coastal con-struction setback line established in most coastal counties of Florida [2].In the case of seawalls, permits will be granted conditional to two (2)factors: (1) substantiated need for a seawall; and (2) seawall plans thathave been designed by a professional engineer.
The first factor depends to a great extent on location and adjacentconstruction practices in the area. Due to adverse effects of seawallsin the littoral zone (which will be revievedin this bulletin), seawallapplications for areas of coast where no seawalls presently exist will mostprobably be turned down. However, if adjacent property owners have seawalls,even though the presently existing seawalls may be ineffective and detri-mental to the beach, it is recognized that protection of the upland propertyof the unseawalled portion of the beach may outweigh the detrimental effectsof the additional amount of seawall to the total beach system. In thesecases a seawall may be permitted, provided the seawall has been designedproperly.
This bulletin is meant to provide both insight into effects whichseawalls have on the beach system, and insight into proper design consider-ations for seawall construction on the open coast. Common types of seawallfailures, construction mistakes, and design weak points which consistentlyshow up in Florida seawalls have been considered in an earlier publication,Reference 3.

The present bulletin is not meant to be a design manual, al-thoughadequate references have been given which cover aspects of design for shoreprotective structures in great detail. As most seawalls on the open coastare of the anchored bulkhead type, the main emphasis will be towardanchored seawalls of the type shown in Figure 1.
It is hoped that this bulletin, along with Reference 3, will provide agood starting place for those involved in technical design and constructionsupervision aspects of seawalls.
SEAWALL
TIE BACK
%*<--DEADMAN"ANCHOR 1--
FILTERCLOTH --
Figure 1. Anchored Seawall (or "Bulkhead")
EFFECTS OF SEAWALLS ON THE BEACH SYSTEM
Seawalls have a detrimental effect on the natural beach profile througha number of related effects, all of which produce scour at the front of theseawall. Scour is defined here as lowering of the beach profile due to theeffects of the seawall only.
During storms, seawalls prevent landward erosion of the natural equi-librium beach profile. Typically, the natural profile of the sections ofbeach without seawalls will erode during storm conditions and establish asubmarine bar offshore, which, in turn, provides protection to the beach by"tripping" the higher waves and preventing them from reaching the beach.Any bar built seaward of the seawall, though, must gain its sand througheither a corresponding lowering of the portion of profile abutting the sea-wall or else from the adjacent unseawalled beach. Most likely, a combinationof both of these events occurs during any storm.
2

Scour at seawalls may also be attributed to the fact that waves areexpending their energy on a much shorter section of beach when a seawall ispresent. Water levels in the sand bed in front of the seawall will corre-spondingly be much higher due to wave reflection and to the fact that watercannot percolate back through the beach as its path is diverted seaward bythe seawall. This effect in turn causes higher pore pressures within thesand which "fluidizes" to an extent the sand in front of the seawall andhence erosion takes place.
One other effect of seawall encroachment is the fact that seawalls con-fine any existing longshore currents across the surf zone. This constrictedsurf zone causes higher velocities in front of seawalls with correspondingscour of the seabed.
The fact that the natural beach profile is not allowed to erode andbuild its "defensive" outer bar in a normal manner coupled with higherlongshore currents experienced in front of the seawall, cause the wholeprofile in front of the seawall and adjacent to it to be lower than thestorm beach profile without the seawall (See Figure 2). As a consequence,higher waves can reach the seawall and the areas adjacent to it, and thuscause greater beach recessions near the seawall than experienced out of thezone of seawall influence (See Figure 3). Figure 4 shows a seawall at PanamaCity which survived Hurricane Eloise, but caused detrimental effects on theadjacent property due to the effect discussed above as well as the turbulenceand reflected waves caused by the return walls (i.e. walls perpendicular tothe main seawall at its ends).
ives __ Shore
-- Continuous Sewall
PLAN VIEW
Normal water leStorm water level \
_ _ -_ /i-- Normaolbeach profile-_Jt , * without Tseawao
,* Storm beach profile"' " .y without seawoll
Storm profile with seowallNormal beach profile withor without seawoll
ELEVATION VIEW
Figure 2. Qualitative Effects of Continuous Seawall onStorm Beach Profile
3

Initial shoreline position undernormal wove conditions
II .
- Shoreline due to storm or longS term erosion, without seawall
Shoreline due to storm or longterm erosion, with seawall
WavesSeowoll of limited length
Return Wall
I ,
PLAN VIEW
Figure 3. Effect of Seawall of Limited Length on Storm orLong-Term Beach Plan Form
Figure 4. Effects on an Adjacent Beach Caused by a VerticalFaced Seawall (Courtesy of Professor Byron Spangler)
4

SITE DESIGN CONSIDERATIONS
CALCULATION OF BEACH PROFILE CHANGES DUE TO LONG TERM EFFECTS
As most shore lines in Florida and elsewhere along the open coast areeroding, it is important to consider the long term effects of beach profilemodification over the intended life of a seawall. For long term effects,it is reasonable to assume that the structure would have no effect on reducingthe erosion of the beach seaward of the seawall. This aspect of design isdiscussed adequately in Reference 4, and consists of assuming that the foreshoreand above water portions of the equilibrium beach profile remain constant inshape over a long period of time and shift landward at a rate equal to thelong term annual shoreline recession rate. Figure 5-2 of Reference 4 presentsaspects of this design consideration which will not be discussed further here.
CALCULATION OF BEACH PROFILE CHANGE DUE TO STORM EFFECTS
Of most importance to the design of any seawall located on the opencoast is the beach profile change brought about by a large storm or hurricane.Although beach profile changes due to storm wave and tide effects on a naturalbeach are not the same as those occurringon a seawalled beach, it is still agood starting point in design to consider natural beach profile lowering dueto storms.
Due to the large beach profile changes associated with extratropicalstorms and hurricanes, it is important to consider the effects of such astorm in the design of a seawall. Typically, most seawall failures occurduring the heavy surf and high tide conditions accompanying storms.
Beach profile changes due to'storms is an important aspect of researchwhich has not been looked into thoroughly to date. Various references [5, 6]treat this subject somewhat incompletely, due to a lack of good data fromwhich to make engineering predictions of beach profile changes after storms.The present "crude" approximation for beach profile changes during storms isbased on some aspects of both References [5] and [6] and additionally on anextensive set of beach profile data taken along the Panhandle Coast of Floridaboth before and after Hurricane "Eloise" in September 1975.
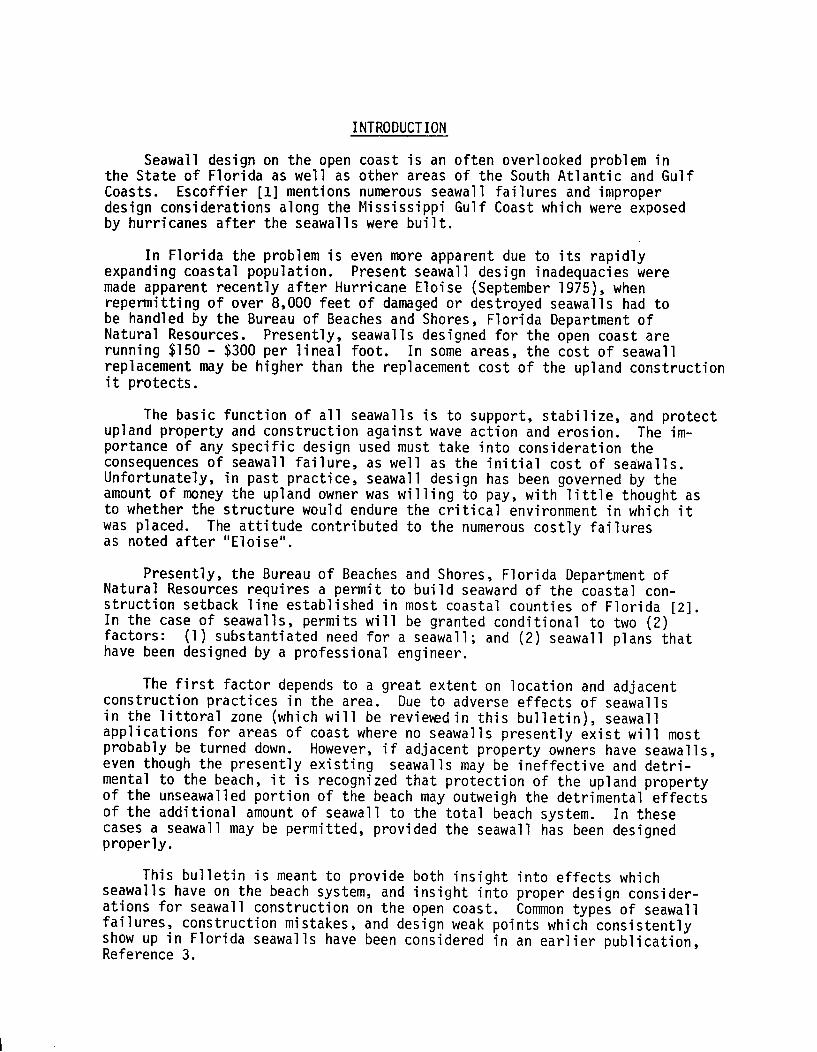
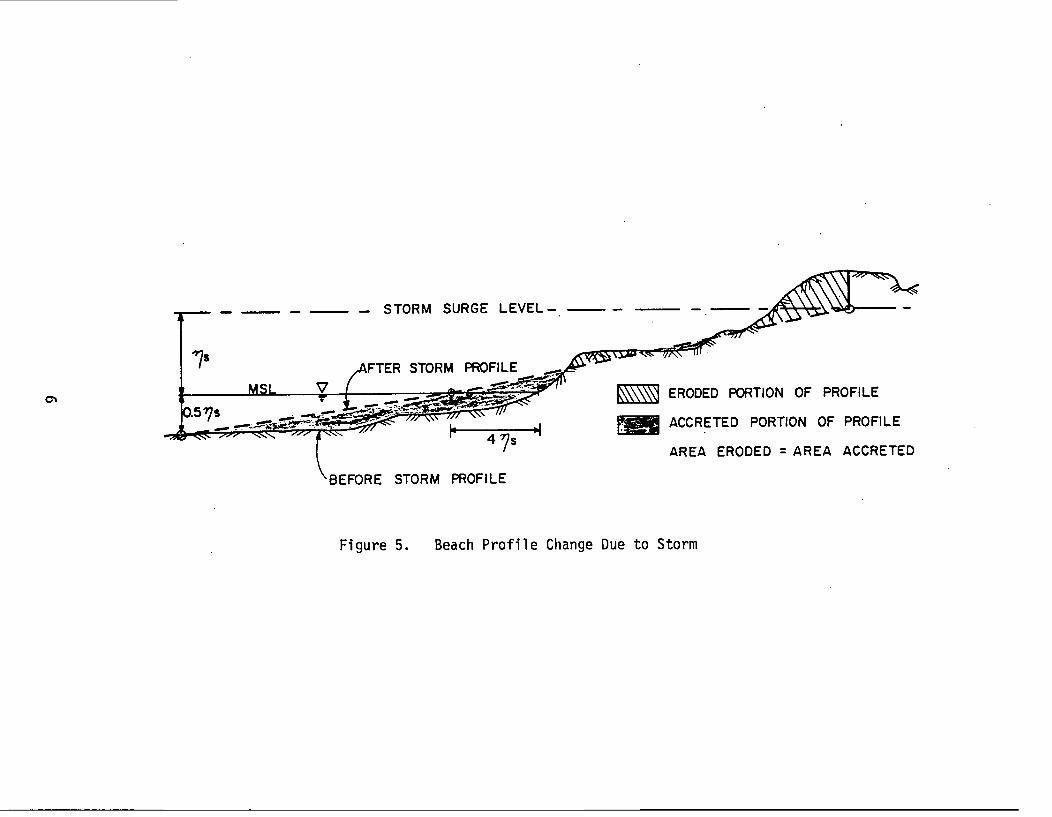
The natural beach profile and the "after storm" approximated profile areshown in Figure 5. To obtain the after storm profile, one needs informationon the before storm profile and the design storm tide level for the area.Storm surge levels and their associated probabilities can be obtained fromeither the Flood Insurance Administration (which maintains offices in variouslocations throughout the United States), or from a county building and zoningdepartment, assuming flood levels have been determined via the Flood InsuranceProgram for the county.
The "after storm" beach profile is found as per Figure 5 by: (1) es-tablishing the point on the pre-storm beach profile with a water depth equalto 0.5 ns (ns = design storm suge level); (2) connecting the point so deter-mined with a point on mean sea level (MSL) seaward of the pre-storm shorelineby an amount equal to 4ns; (3) finding a point on a horizontal line rs feetabove the MSL such that when a line is drawn between it and the new profilepoint on the MSL, the area eroded between pre and post storm profiles willequal the area accreted.
The "after storm" profile given by this method should provide a "rough"approximation for use in seawall design in areas where dunes exist and thedesign storm tide does not overtop the dunes, and where considerable building
5
STORM SURGE LEVEL-.
'~ .AFTER STORM PROFILE
MS ---L " S ERODED PORTION OF PROFILE
"5 6 "•'•p/'^ . ACCRETED PORTION OF PROFILE" 4 7S =s' AREA ERODED = AREA ACCRETED
BEFORE STORM PROFILE
Figure 5. Beach Profile Change Due to Storm

encroachment has not taken place. This method was applied for a number ofcases in the Florida Panhandle area and gave reasonable results although insome areas an alternative design method may have to be found.
Any lowering of the beach profile due to the storm effect at the seawardside of the "proposed" seawall location should be considered for design pur-poses when adjacent areas are relatively unencumbered by seawalls. Althoughmany areas of the after storm beach profile may have a gain of sand, it isrecommended for seawall design purposes that no portion of the beach be con-sidered higher after a storm than prior to the storm.
Once this "after storm" profile is established, it becomes necessary toconsider the additional effects that placement of a vertical wall will haveon the beach profile. These effects will be discussed under the section onscour.
As many areas have been developed heavily along the coast and no longerhave dune structures', the above method cannot be used in many instances andan assumption must be made as to the after storm effects based on experience.
SCOUR
Presently, there are few field measurements of scour experienced atseawalls after storms. Typically, by the time post storm damage surveysare completed, the effects of scour at the seawall during storms may wellbe masked by after storm beach accretion effects.
Presently, Reference [4] recommends that:
"the maximum depth of a scour trough below the naturalbed is about equal to the height of the maximum unbrokenwave that can be supported by the original depth ofwater at the toe of the structure."
This criteria appears to be based on limited field observations of scour atseawalls made prior to 1950. More recently, many laboratory studies have beenmade of scour [7, 8, 9, 10, 11, 12, 13], but are somewhat open to wide inter-pretation as to their validity on the open coast, since the vast majority oflaboratory tests made do not reasonably account for modeling scale law effectsof sediment size. Only one set of tests [9] has been done in a two dimensionalmodeling basin of appreciable size comparable to prototype conditions, whichenables a reasonable comparison of what might happen under breaking wave con-ditions at a long seawall. The results of this set of tests [9] gives scourat the toe of the wall ranging from S/Ho = 0.25 - 2.5 (S = scour depth, Ho =deep water wave height). The scour was found to be dependent on the locationof the wall in the surf zone in relation to wave breaking and on the wavesteepness. Sediment size and density is also an important parameter althoughonly one size of material was used in these large wave tank model tests.
It should be realized that scour conditions for the two dimensional casein the laboratory can only be compared to the real case of an infinitely longseawall. The three dimensional effect in nature will modify the scour pattern,depending on both the length of the wall and location of the wall in relationto the surf width zone. As noted earlier, an encroachment on the surf zoneby a seawall will confine the longshore current in the surf zone such thatthis current may be expected to increase in speed along with a consequentscouring of the bottom.
7

A theoretical model [14] has been developed for a quasi-three dimensionalase (longshore current effects are included) of a seawall in the surf zonewhich predicts scour due to the increasing longshore current effect.
From this model an estimate of the scour at the seawall can be made.Based on a number of limiting assumptions as noted in the theoretical model[14], an equation for scour can be derived of the form:
S-- b= 1.60 (1 - Xs) 2 5
where S = scour depth at toe of seawall
Hb = breaking wave height
Xs = dimensionless location of seawall in relation to the surfzone (i.e. for the seawall located at the shoreline Xs = 1.0)
The above formula has been derived on the basis of perfect reflection atthe wall. In the above theoretical three dimensional model as well as thetwo dimensional laboratory experiments, it can be found that reducing thereflection coefficient of the wall (by either sloping the wall or other meanssuch as placing a rock revetment in front of the wall) will reduce the scourtrough.
Again, in the above theoretical case, only an infinitely long seawallhas been considered. Shorter walls would be expected to have consequentlyless scour due to an available supply of sand furnished to the front of theseawall by adjacent properties. This fact may in part explain why mostobservations of seawall scour in nature are far less than those which mightbe expected from models or theories. One additional limitation to the modelpresented in [14] is that zero scour would be experienced if the seawall islocated directly at the shoreline when in fact a large scour is experiencedhere under similar conditions in wave tank testing.
For a seawall having an unprotected toe (i.e. no rock blanket and filtertoe protection) it appears reasonable (in light of field and laboratory data)to consider a maximum scour depth equal to the "rule of thumb" expressedearlier and given in Reference [4] after applying considerations for beachprofile changes due to long term erosion and short term storm effects. Itshould be noted that "apparent" seawall scour observed at Panama City afterHurricane "Eloise" hit the coast was considerably less than the maximumpredicted by the rule of thumb. Most seawalls with cap elevations less than10' above grade experienced a maximum of 2-3 feet scour.
Reference [3] discusses the use of toe protection to prevent scour fromoccurring.
WAVE FORCES
Typical seawall failures in Florida caused by wave forces occur dueto a loss of backfill material. When the seawall can no longer transmit theextremely large hydrodynamic forces to the backfill material it fails in shearor moment. Cases of seawall failure in shear or inward bending moment wherebackfill has been emplaced properly and retained are almost nonexistent.Which implies that good backfill is capable of readily transmitting the high
8

hydrodynamic forces to the soil behind the seawall. Thus, if cohesionlessclean sand is used as a backfill material and the fill is graded to the topof the seawall, and precautions are taken to insure that the fill will notbe lost (i.e. filter material to retain backfill behind the wall and adequatereturn wall length), it appears reasonable not to consider wave loadings onthe structure but only static water loadings.
Should additional precautions not be taken to insure backfill retention(or if the backfill material is not of a clean cohesionless sand), wave forcesmust be considered. A reasonable approach to seawall design for hydrodynamicforces is to consider the most severe case of waves breaking on a structureor broken waves on the structure, depending on the height of the wall, thedesign storm surge level, and the location of the seawall.
Wave forces for design can be based on the methods proposed in Reference[4], section 7.33 and 7.34 on breaking wave and broken wave forces on verticalwalls.
SPECIAL DESIGN CONSIDERATIONS
RETURN WALL DESIGN LENGTH
An often occurringmode of failure in seawalls is that the backfillmaterial behind the seawall is lost either through the joints of the seawallface or via flanking of the seawall by wave action with consequent water(and backfill material) drainage around the ends of the seawall. As manyseawalls are not designed to take the high wave forces due to broken waves, theydepend for their structural integrity on transmitting the dynamic wave forcesthrough the structure into the backfill. When this backfill is lost, the sea-wall can fail in shear or moment, due to the wave forces. Prevention of back-fill loss by use of return walls (often referred to as "wing" walls) long enoughso as not to be flanked in a storm is a major concern often not addressed. Anexample of a return wall which was not long enough to prevent flanking duringHurricane "Eloise" is shown in Figure 6.
The design return wall length must take into consideration recessionexperienced by the natural beach profile during a storm, as well as an addi-tional length due to the higher beach recession rates experienced near theseawall, as noted earlier in the discussion of scour and shown in Figure 3.No existing design criteria suggestlength of return wall to prevent flanking,although measurements of flanking of seawalls in the Panhandle area of Florida(after Hurricane "Eloise") are presented in Figure 7.
Seawall return walls should extend into the dune line far enough toprevent flanking when erosion of the dune occurs. This would entail carryingthe return walls to the after storm beach profile contour elevation equal tothe seawall cap elevation. Use of the method discussed earlier for approximatingafter storm beach response can be used for this evaluation. If, for example,a seawall has a crest elevation of +10 feet MSL (mean sea level), the returnwalls should extend into the dunes a distance, x, shoreward from the 10 footcontour line of the dune; where x = recession of the 10 foot contour lineduring the design storm and can be estimated by the method discussed earlieron beach profile change due to storm effects.
9

As seawalls cause anomalous detrimental effects on adjacent unseawalled
areas (see Figures 2, 3), it is important to carry the return walls an additional
distance, x', beyond the storm recession distance, x, to account for these effects.
This distance x' appears to be strongly dependent on the height of the seawall.
Using an extensive set of beach elevation data taken along Panama City Beach
after Hurricane "Eloise" in September 1975, the distance x' versus length ofseawall was plotted for various vertical faced structures where a clear pictureof this effect could be seen. This data is presented in Figure 7. From thisfigure, a "rough" estimate can be made for the distance x'. As an example,consider that a seawall of 300 feet in length is to be built to survive stormconditions similar to "Eloise". From Figure 7 for a seawall length of 300 feet,the distance x' can be conservatively estimated as 45 feet. To this must beadded the expected contour recession distance, x, for the storm along with anyadditional distance necessary to tie in to the existing beach profile at capelevation.
Figure 6. Inadequate Return Wall Length (Courtesy ofProfessor Byron Spangler)
10

8 ...... P i---- ATFLT PPR 1 - IMIT FI R F ANING HF RETUIRN WALL
S.-- : - -_ (FROM "ELOISE" DATA): i-::::::.
----------- 4
..._: .RECESSION AT BEACH DURING STORM IF SEAWALL IS NOT'PRESENT=X
- -40 - i- SEAWALL-
CAPI HbGHT'?)--
~- ChONTOUR PRIOR 10oSTOMS--20-- -,---- --- -- . . --- 7 CONTOUR AFTER STORM - .
:/zznz- ...... z E .. Ii---.-. . - ..-...... -.. ........... . ...... ........... .. .. ...................:. ... ....:.: *- Eo s :Sr:e --^.__ :z:: : ==;I========= =-= ~^=== ==== T==r=== = =: : r-- : :: ::: ::-:-:: :- :- :.. : :: -::
S ------ - ----W=West Sid----- --z----- ....
100 300 500 700 900 1100 1300
LENGTH OF SEAWALL(OR STRUCTURE)
Figure 7. Graph For Use in Design of Return Wall Length

Total return wall design length is shown in Figure 8 for a hypotheticaldesign situation.
In the event that excessive return wall length must be provided for, itmay be cheaper to design the seawall on the assumption that the backfill maybe lost and to consider wave forces on the front of the wall as a possiblefailure mechanism.
ESIGN STORM SURGE LEVEL
CAP ELEVATION.71s PROPOSED / \
/ v SEAWALL
MSL
RETURN WALL LENGTH
PRE-STORM PROFILE (UNSEAWALLED)- - - -- POST-STORM PROFILE (UNSEAWALLED)
----- POST-STORM PROFILE ADJACENT TO SEAWALL
Figure 8. Return Wall Design Length
SUMMARY REVIEW OF DESIGN METHODS
The following discussion has been prepared to assist in the evaluation
of the more typical seawalls used along Florida's coastline. Although the
discussion addresses the more academic design considerations, it should bere-emphasized that many seawall failures occur because of flanking by waveaction, damaged or missing tiebacks, poor construction or inadequate meansof relieving excess overtopping rather than design calculations or methodsbeing inaccurate. A good seawall design is meaningless unless the wall is
constructed in accordance with the design plans.
12

Typical seawalls on Florida's beaches are of relatively low flexibility(reinforced concrete), and are constructed in relatively homogenous cleansand. Furthermore, typical walls are jetted into place and backfilled withclean sand. This does not imply that all seawalls built on Florida's coastare of this type or that these assumptions may automatically be assured forall walls. However, the above limitations apply to the vast majority ofseawalls designed on the open coast of Florida and therefore these assumptionswill be used in a later design example.
Anchored Bulkhead Design. A number of different analytical approacheshave been proposed for investigating stability and moments in anchoredretaining walls. These approaches include:
1. Danish Rules2. Fixed Earth Support
a. Equivalent Beamb. Graphical
3. Free Earth Support4. Braced CutThe Danish Rules involve empirically based procedures [15, 16] developed
in the early 1900's by the Danish Society of Engineers. Although many existingbulkheads have been successfully constructed based on these rules, researchhas shown significant inconsistencies in the assumed lateral pressure dis-
tribution. In view of recent test results, the use of the Danish Rules appearsunjustified.
The Fixed Earth Support, Equivalent Beam method, is based on the assumptionthat the bulkhead deflections are such that the elastic line of the bulkheadwill reverse its curvature at a point of contraflexure [16, 17]. This allowsconsideration of a bulkhead as two beams, pinned at the point of contraflexure.Since this procedure tacitly assumes no deflection of the toe of the sheetpile, the depth of the imbedment required for conventional seawalls is generallygreater than that computed on the free earth assumption. It should be noted,however, that this procedure assumes a rather simplistic soil pressure distri-bution and predicts lower bending moments than those based on a free earthassumption.
The Fixed Earth Support, Graphical Method [16], is also based on theassumption that there is no deflection about the toe of the bulkhead. Thismethod, however, involves an extremely time-consuming graphical trial anderror method of determining the required imbedment.
The Free-Earth Support method of analysis is perhaps the oldest andmost conservative design procedure [16, 17, 18]. It assumes a Coulomb typesoil pressure distribution with no deflection at the anchor point. Analysisby this procedure yields a minimum depth of imbedment required to stabilizethe wall against toe-out failure and the maximum bending moment is computedon the basis of this imbedment. It should be noted that this procedure doesnot assume that any inherent advantage is gained by imbedding a bulkheaddeeper than required for stability against toe-out failure. It also assumesthat slight yield of the wall will take place at the anchor point such thatbackfill loading on the wall will assume an active pressure distribution.
Model tests by Rowe [18] established a relationship between the flexibilityof a bulkhead and the bending moment within the bulkhead. Moment reduction
13
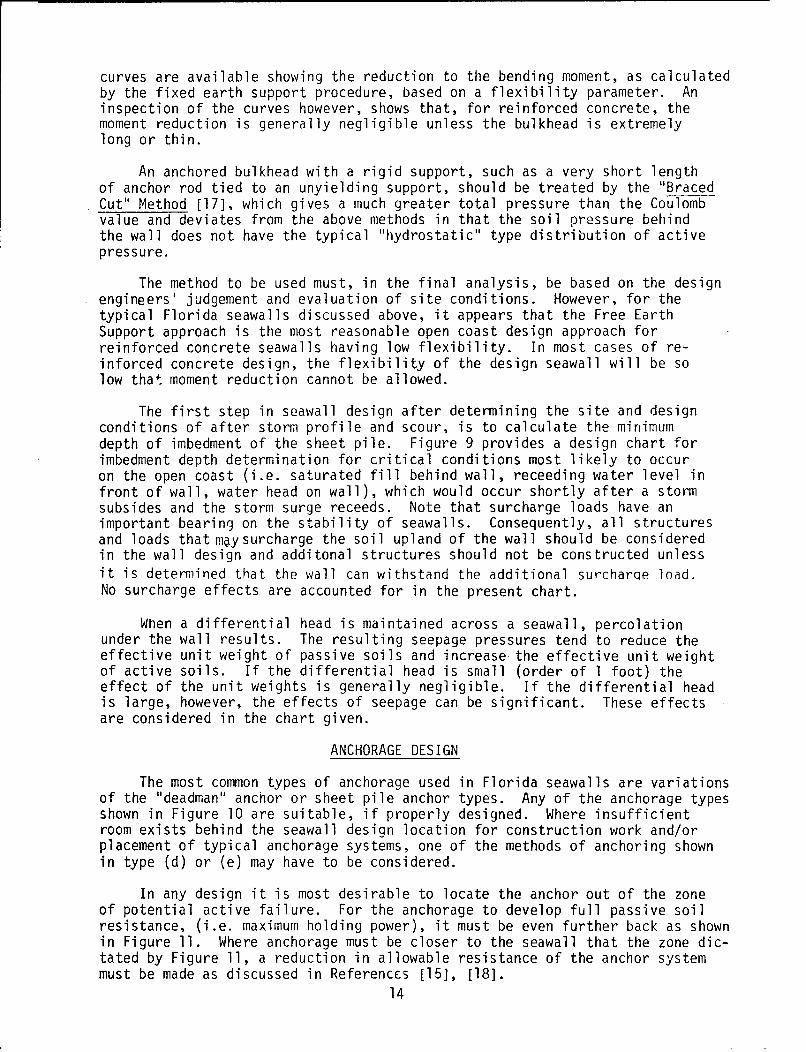
curves are available showing the reduction to the bending moment, as calculatedby the fixed earth support procedure, based on a flexibility parameter. Aninspection of the curves however, shows that, for reinforced concrete, themoment reduction is generally negligible unless the bulkhead is extremelylong or thin.
An anchored bulkhead with a rigid support, such as a very short lengthof anchor rod tied to an unyielding support, should be treated by the "BracedCut" Method [17], which gives a much greater total pressure than the Coulombvalue and deviates from the above methods in that the soil pressure behindthe wall does not have the typical "hydrostatic" type distribution of activepressure.
The method to be used must, in the final analysis, be based on the designengineers' judgement and evaluation of site conditions. However, for thetypical Florida seawalls discussed above, it appears that the Free EarthSupport approach is the most reasonable open coast design approach forreinforced concrete seawalls having low flexibility. In most cases of re-inforced concrete design, the flexibility of the design seawall will be solow that moment reduction cannot be allowed.
The first step in seawall design after determining the site and designconditions of after storm profile and scour, is to calculate the minimumdepth of imbedment of the sheet pile. Figure 9 provides a design chart forimbedment depth determination for critical conditions most likely to occuron the open coast (i.e. saturated fill behind wall, receeding water level infront of wall, water head on wall), which would occur shortly after a stormsubsides and the storm surge receeds. Note that surcharge loads have animportant bearing on the stability of seawalls. Consequently, all structuresand loads that maysurcharge the soil upland of the wall should be consideredin the wall design and additonal structures should not be constructed unlessit is determined that the wall can withstand the additional surcharge load.No surcharge effects are accounted for in the present chart.
When a differential head is maintained across a seawall, percolationunder the wall results. The resulting seepage pressures tend to reduce theeffective unit weight of passive soils and increase the effective unit weightof active soils. If the differential head is small (order of 1 foot) theeffect of the unit weights is generally negligible. If the differential headis large, however, the effects of seepage can be significant. These effectsare considered in the chart given.
ANCHORAGE DESIGN
The most common types of anchorage used in Florida seawalls are variationsof the "deadman" anchor or sheet pile anchor types. Any of the anchorage typesshown in Figure 10 are suitable, if properly designed. Where insufficientroom exists behind the seawall design location for construction work and/orplacement of typical anchorage systems, one of the methods of anchoring shownin type (d) or (e) may have to be considered.
In any design it is most desirable to locate the anchor out of the zoneof potential active failure. For the anchorage to develop full passive soilresistance, (i.e. maximum holding power), it must be even further back as shownin Figure 11. Where anchorage must be closer to the seawall that the zone dic-tated by Figure 11, a reduction in allowable resistance of the anchor systemmust be made as discussed in References [15], [18].
14
10 .. . .+ +
5 R1
9 . : II. . ii '
I. .. . .' n It :8 ! ! , 1 ' .',ru L "i
5. | .: : i; *
4. 7i
SUBMERGED
2.
7 .-. . , - .;* :ii!i :·:'^ :' ",: : ']L-i!,.-•' • -- |..
,, , i I , :. .m. .
S. : ::.:;, :ii .::h .:
.... ..qp a...... ... ..
0. «: ! h . .. . . ...... ...1.0: i4 5 . . .. .. W . .. .:.-. . ... .. . ... • . : . ' ... . ... . . [ ..9 ;.
. NOTE..... Curves are based on "Fre a h .
.6 Sui : •i Metho nty i :o s w it
.5 : 8UMERG D I
2YSU MERGED rS• TUR5TEd I
: I" \ : .
G P SSIVE S IL PR SSU E SAF T OR2.3 HOMO ENE S GRAN LAR SOIL
.2 ii'
15
•: :: . . I: " :
' : 'i . : " .. .;: " ' .. .. . . . ., . :.. :l :
... .: I.II.
" 2. 3. 4. 5. 6.7 8.9.IO." iS. 2Q 25.30 42 O2 71O6O.9O.IO
.K. KP/ Ka
ii G,+

Original OriginalGround Backfill Ground-, Backfill
:. Sand S grovelcompacted inlayers laer •Precost concrete
Concrete cost against (a)Precast concreteorginiol soil
DEADMAN ANCHORS
Final ground
CompressinOT n / Tension pile
S" --- Tension•'• '\ pile
Orgino ground Compression Pile T anchor pull
(b)PILE ANCHORS
Backfill
Pairs of sheet pilesContinuous sheet i"-driven to a greater
pies " depth of frequent --intervals as
(c) vertical support (d) (e)
SHEET PILE ANCHORS FOOTING ANCHOR SCREW ANCHOR
Figure 10. Types of Anchoring Systems
452 4/2
ANCHORAGETIE ROD
I -45° 4/2
Figure 11. Location of Anchorage for Full Passive Resistance
16

A number of adequate design methods exist for anchorage design (15, 16,17, 18, 19, 20), and should be compiled with in design of the anchorage system.Each method depends on the type of anchorage used and the soil conditions forwhich it can be properly applied. Care must be exercised to see that theanchorage system does not settle after construction. Additionally, the soilwithin the passive wedge of the anchorage should be compacted to at least 90percent of maximum density unless the deadman is forced against firm naturalsoil. Reference [1] states that if tiebacks are used they should be designedas both tension and compression members.
EXAMPLE DESIGN FOR SEAWALL
Seawall is to be located as shown in Figure 12, and have a cap elevationof +10 MSL and be 200 feet in length.
(1) Consider effects of long term "historical" shoreline changes: Inthe present case it will be assumed that the shoreline has been stablefor the past 50 years and therefore expected long term equilibriumprofile changes are negligible. Where these changes are not negli-gible, long term equilibrium profile changes as discussed earliershould be considered.(2) Consider effects of design storm level for short term profilemodification:
Consider for the present case a design storm surge of 11 feet MSL.Figure 12 shows the before and after storm profiles for the seawallsite. The "after storm" profile has been constructed as discussedpreviously. At the proposed seawall location a profile lowering of1.7 feet should be accounted for in design. Also note in Figure 12,a recession of the 10 foot (cap elevation) contour a distance of 34feet.(3) Consider additional effects of scour due to vertical facedseawall depth of water at seawall face = 3' = dsslope of beach - 1:15; from Reference [4] for an assumed storm waveperiod of 8 seconds Hb = 1.6; therefore breaking wave Hb at seawall
ds
face = 1.6 ds = 1.6(3') = 4.8'. An additional scour of 3 feet will beconsidered (note this assumption is unconservative according to Reference4). The reduction in scour from the Reference 4 approach is considereda benefit of having a good dune system in the area. The use of a rockand filter toe scour protection properly designed in accordance withReference [3] will help to prevent scour from occuring. In the presentcase no seawall toe protection will be considered and the scour will betaken into consideration in design.(4) Design length of return wallslength necessary to tie in to 10' contour = 10'additional length due to storm effects, X = 34'additional length due to effects of seawall, X' = 35'total length of design return walls 79'
If the return walls can be tied into an upland structure to preventloss of backfill this length may not be necessary. The primary purposeof the return walls is to hold the backfill to prevent the primary wallfrom failure due to storm wave action.(5) Design calculations (See Figure 13)(Footnotes to go with calculations are numbered along with an asterickand are referred to in the notes for Design Calculations section).
17

i" ' Proposed Seawall Location
- -C' Elevation '-- -1 Design Storm Surge Level= I I'.. -- CCp Elevation= 10'
Profile Lowering=l.1 15(due to storm) .. -
34' 1 6 4 77s=444 5; .After Storm Profile
S 8-6 - Before Storm Profile (ie profile on whicho seawall is built)
S 2 -SI I I I I
0 20 40 60 80 100Horizontal Scale - Feet
Figure 12. Proposed Seawall Location and Design Profile Assumptions

.. .... .. . --- Cap Elevation = +10
'Ap I '*-Sand Level at Front of SeawallS' 1.7+3.0=47' After Construction
L h=6
Backfill of Coarse V ,Clean Sand 4*
Design Sand Level atFront of Seowall 2* 3
d=9' MSL
Figure 13. Design Assumptions
The design method used is the Free Earth Support Method due to theuse of reinforced concrete design having low wall flexibility. Nosurcharge loading is assumed in this design, although, if a substantialstructure such as a house is to be built adjacent to the seawall, addi-tional loadings must be considered on the wall [15, 16, 17, 18].
List of Notations
Yw = weight of seawater 64#/ft3
ysub = submerged unit weight of backfill (= 64#/ft3 , assumed fromReference [20] for clean sand)
Ysat = saturated unit weight of backfill (= 128#/ft3 , assumed fromReference [20] for clean sand)
Ka = active pressure coefficient 6*(.27 for 350 assumed from Reference[20] for clean sand)
Kp = passive pressure coefficient 6*(3.70 for = 350 assumed fromReference [20] for clean sand)
d = depth of imbedment
b = height of saturated fill
AH = water table difference between front and back of wall
h = b + AH
Gs = factor of safety for passive pressure distribution (= 2.0, 7*)
0 = vertical angle of tie rods
19

Ap(L-)h = horizontal anchor pull per l.f. of wall (#/1.f.)
where Ap = anchor pullL = length of wall
-minimum depth of pile embedment-from Figure 9:
K = .K 3.70 = 13.7Ka 0.27
b
d~D=A 1.5
h = 6' therefore d = 9'
Thus, for given design conditions seawall should go 9' + 13.7' belowexisting profile for a reasonable conservative design, i.e. total slab lengthh + d = 6' + 9' = 15'.
-Anchor Pull-
Summing horizontal forces acting on the wall
Ap Kp d2 (AH + d)2 AH2 AHd
FH 0 h Ysub - K Ysub 2 w ( +
Ap(L-)h = 1527#/1.f. of seawall
-Point of Zero Shear-
Solve for point of zero shear which is also point of maximum moment.First locate whether point of zero shear is above or below sand level.
Ap AH2 AH2
(-)h - Ka Ysub 2 w - = Shear at design sand level = 64#/ft.
therefore point of maximum moment is above the sand level at a distance Xfrom top of wall. In this problem it is conservative to estimate it at sandlevel.
-Maximum Bending Moment in Wall-
Maximum bending moment estimated at sand level is:
Ap AH3 AH3
max = (~)h X - K Ysub 6 - Yw
S 6500 ft. - # = 6.4 K - feetMax ft. of wall ft. of wall
20

Actual structural design for the seawall will not be carried further althoughif reinforced concrete is used, it is recommended that walls no less than 8"thick be considered with at least a 3" concrete covering of all reinforcingsteel.
Although design details have not been addressed, it should be noted thatthe seawall cap must have adequate dimensions and reinforcement to:
(a) withstand the bending moment resulting from the loads on thetie-back rods and sheet piles,(b) securely hold the sheet pile in place.
In addition, adequate development length must be provided for tie-back rodsto prevent pull-out, and tie-back rods must be protected against corrosion.Methods for protection of tie-back rods from corrosion include coating therods with bitumastic and wrapping with burlap, or encasement in concrete.
NOTES FOR DESIGN CALCULATIONS
1* Water level behind wall is assumed to be at top of cap. In any storm inwhich waves break on the seawall, a significant amount of over-toppingwill probably occur. Additionally, heavy rains often occur during a stormand may saturate the soil behind the wall. Drainage provided for in theseawall may not be sufficient to relieve excess hydrostatic pressurebehind the wall.
2* Design sand level on the seaward side of the seawall takes into accountprofile lowering due to storm wave effects on adjacent unseawalled beachwhich carries over onto seawalled portion of beach and also scour due tobreaking waves on the vertical structure.The difference in original sand level and design sand level is:
1.7' profile lowering due to design storm+3.0' scour at vertical faced structure=4.7' total difference
3* The most severe loading conditions for seawalls generally occur some timeafter the maximum storm surge when the backfill is still at or near sat-uration but the water level at the exposed face of the wall has dropped.
4* This analysis is based on the assumption that the backfill behind thewall, for a minimum distance equal to the height of the wall, consists ofrelatively homogenous, clean sand. The magnitude and distribution of activesoil pressures would be different for backfill not comprised on clean sand.The use of material, other than clean sand, for backfill is discouragingbecause: a. Silty sand, silt or clay does not drain as freely as clean
sand.b. The use of a filter media will not stop the loss of fines
if a silty backfill is used.c. If the backfill contains an appreciable amount of clay, the
lateral earth pressure may not remain at an active stateand may regain values near that of earth pressure at rest.Refer to References [15, 16].
5* When large head differentials exist between the seawall front face andthe assumed water level behind the wall, the upward seepage pressure infron of the seawall should be taken into consideration. This upwardseepage pressure effectively reduces the weight of the soil in front ofthe wall. An approximation to the weight reduction can be given as:
Ay = 2OAh (Reference [17]) where Ay= weight reduction in Ibs/ft3
Ah= water level difference in feetFor the case considered, making a first assumption that Ah- D the effectivebuoyant weight of the soil in front of the wall becomes 73#/ft 3 - 20#/ft3 =53#/ft3. 21
6* Active and Passive Pressure Coefficients can be found in Reference [20].
They depend on both fill slope angle, coefficient of internal frictionfor soil, and wall friction angle. It is felt best to ignore the effectsof any wall friction for open coast seawall design since critical conditionswill occur for a wet (hence lubricated) seawall.
7* Reference [16] recommends a value of 2.0 for non-cohesive soils. Thisfactor will in effect increase the depth of imbedment to account for theuncertainty in passive pressure development and distribution in front ofthe wall. Often a factor of safety of 1.0 is used for analysis of D andthen the embedment depth D is effectively increased by 20-70%. This
depth of embedment increase is for the same effect as the factor of safetyof 2.0. Alternatively in the design given, Gs = 1.0 can be used to findD and then the given D is increased by 70%. Either of these methods isequivalent.
8* In cases where the backfill cannot be lost (i.e. adequate return walllength has been provided) design for wave forces should not be necessaryprovided the backfill is of clean noncohesive sand and extends to the topof the wall. In cases where these assumptions cannot be met, it is necessaryto design for the worst wave conditions to be expected at the seawall site.
If breaking waves might be experienced on the seawall during the storm forwhich the design water level has been chosen, then breaking wave conditionsshould provide the critical design criteria for seawall overtopping and/orshear failure. Reference [4] should prove invaluable for wave forcecalculations in design.
22
REFERENCES
1. Escoffier, F. "Design and Performance of Sea Walls in Mississippi Sound,"Proceedings of Second Conference of Coastal Engineering. 1951, pp. 257-67.
2. Purpura, J. A., and Sensabaugh, W. M. "Coastal Construction Setback Line,"Marine Advisory Program, Publication SG-74-002. University of Florida,Gainesville, Florida 1974.
3. Seawall and Revetment Effectiveness, Cost and Construction, C. Collier, May1975, Marine Advisory Program, Publication SG-6. University of Florida,Gainesville, Florida.
4. U.S. Army Coastal Engineering Research Center: Shore Protection Manual,U.S. Government Printing Office, 1973, pp. 5-5,5-7.
5. Edelman, T. "Dune Erosion During Storm Conditions," Proc. 11th Conferenceon Coastal Engineering, American Society of Civil Engineers. New York,1968, 719.
6. Vallianos, L. Beach Fill Planning - Brunswick County, North Carolina, inProc. 14th Int. Conf. on Coastal Engineering, American Society of CivilEngineers, New York, 1975, 1350.
7. Russell, R. C. H., and Inglis, C. "The Influence of a Vertical Wall on aBeach in Front of It," Proceedings of the Minnesota InternationalHydraulics Convention, Minneapolis, Minnesota, 1953, pp. 221-226.
8. Sawagari, T. "Scouring Due to Wave Action at the Toe of a Permeable CoastalStructure," Proceedings of the Tenth Conference on Coastal Engineering,1966, pp. 1036-1047.
9. Sato, S., Tanaka, N., and Irie, I., "Study on Scouring at the Foot of CoastalStructures," Proceedings of the Eleventh Conference on Coastal Engineering,1968, pp. 579-598.
10. Herbich, J. B., and Ko, S. C. "Scour of Sand Beaches in Front of Seawalls,"Proceedings of the Eleventh Conference on Coastal Engineering, 1968,pp. 622-643.
11. Kadib, Abdel-Latif. "Beach Profile as Affected by Vertical Walls," BeachErosion Board, U.S. Army Corps of Engineers Tech Memo No. 134, 1963.
12. Chesnutt, C. B., and Schiller, R. E., Jr. "Scour of Simulated Gulf CoastSand Beaches Due to Wave Action in Front of Sea Walls and Dune Barriers,"COE Report No. 139, TAMU-SG-71-207, May, 1971.
13. Herbich, J. B., Murphy, H. D., and Van Weele, B. "Scour of Flat Sand BeachesDue to Wave Action in Front of Sea Walls," Proceedings of the SantaBarbara Specialty Conference on Coastal Engineering, 1965, pp. 705-726.
14. "The Effect of Vertical Seawalls on Longshore Currents," D. F. Jones, Ph.D.Thesis, University of Florida, 1975.
15. U.S. Steel: Steel Sheet Piling Design Manual, April 1972.
23

16. Tschebotarioff, Gregory P. "Foundations, Retaining and Earth Structures,"2nd Edition, McGraw Hill.
17. Leonards, G. A. "Foundation Engineering," McGraw Hill Book Co., Inc.New York, 1962.
18. Terzagi, Karl: ANCHORED BULKHEADS, Trans. ASCE 1954.
19. "Foundation Engineering," Peck, Hanson, Thornburn - Second Edition,John Wiley & Sons, Inc., 1974.
20. Department of the Navy, Naval Facilities Engineering Command: DESIGNMANUAL - SOIL MECHANICS, FOUNDATIONS, and EARTH STRUCTURES, DM-7, March 1971.
21. "Prestressed Concrete Sheetpiles for Bulkheads and Retaining Walls," byW. E. Dean, Civil Engineering Magazine, April 1960.
22. "Concrete Shore Protection," Portland Cement.Association, Skokie, Illinois,1955.
23. Staff Report on Design of Reinforced Concrete Seawalls, Bureau of Beachesand Shores, Dept. of Natural Resources, State of Florida, Tallahassee, 1976.
24. American Concrete Institute: BUILDING CODE REQUIREMENTS FOR REINFORCEDCONCRETE (ACI 318-71), 1971.
25. Variance Permit File, Bureau of Beaches and Shores, Department of NaturalResources, State of Florida, Tallahassee.
26. "The Effect of Waves on Rubble-Mound Structures," F. Raichlen, AnnualReview of Fluid Mechanics, Vol. 7, 1975.
24

The Florida Sea Grant College is supported by award of the Office of Sea Grant,National Oceanic and Atmospheric Administration, U.S. Department of Commerce,grant number 04-8-M01-76, under provisions of the National Sea Grant Collegeand Programs Act of 1966. The Florida Sea Grant College was initiated in 1972with three major components: applied marine research, education, and advisoryservices.
This public document was promulgated at a cost of $515.58or $.17ýcents per copy, to provide current information onseawall design and construction along the open coast. Costdoes not include postage and handling.
State University System of Florida Sea Grant Reports are published by theMarine Advisory Program which functions as a component of the FloridaCooperative Extension Service, John T. Woeste, Dean, in conductingCooperative Extension work in Agriculture, Home Economics, and MarineSciences, State of Florida, U.S. Department of Agriculture, U.S. Departmentof Commerce, and Boards of County Commissioners, cooperating. Printed anddistributed in furtherance of the Acts of Congress of May 8 and June 14, 1914.
6/3M/79
Copies of this and other Florida Sea Grant and MarineAdvisory Program publications are available from:
Marine Advisory ProgramG022 McCarty HallUniversity of FloridaGainesville, FL 32611