Open Archive Toulouse Archive Ouverte (OATAO)oatao.univ-toulouse.fr/13624/1/Fogel__13624.pdf ·...
9
Any correspondence concerning this service should be sent to the repository administrator: [email protected] Identification number: DOI: 10.1016/j.compscitech.2015.02.002 Official URL: http://dx.doi.org/10.1016/j.compscitech.2015.02.002 This is an author-deposited version published in: http://oatao.univ-toulouse.fr/ Eprints ID: 13624 To cite this version: Fogel, Mathieu and Parlevliet, Patricia and Geistbeck, Matthias and Olivier, Philippe and Dantras, Eric Thermal, rheological and electrical analysis of MWCNTs/epoxy matrices. (2015) Composites Science and Technology, vol. 110. pp. 118-125. ISSN 0266-3538 Open Archive Toulouse Archive Ouverte (OATAO) OATAO is an open access repository that collects the work of Toulouse researchers and makes it freely available over the web where possible.
Transcript of Open Archive Toulouse Archive Ouverte (OATAO)oatao.univ-toulouse.fr/13624/1/Fogel__13624.pdf ·...

Any correspondence concerning this service should be sent to the repository administrator:
Identification number: DOI: 10.1016/j.compscitech.2015.02.002
Official URL: http://dx.doi.org/10.1016/j.compscitech.2015.02.002
This is an author-deposited version published in: http://oatao.univ-toulouse.fr/
Eprints ID: 13624
To cite this version:
Fogel, Mathieu and Parlevliet, Patricia and Geistbeck, Matthias and Olivier,
Philippe and Dantras, Eric Thermal, rheological and electrical analysis of
MWCNTs/epoxy matrices. (2015) Composites Science and Technology, vol.
110. pp. 118-125. ISSN 0266-3538
Open Archive Toulouse Archive Ouverte (OATAO) OATAO is an open access repository that collects the work of Toulouse researchers and
makes it freely available over the web where possible.

Thermal, rheological and electrical analysis of MWCNTs/epoxy matrices
Mathieu Fogel a,b,⇑, Patricia Parlevliet a, Matthias Geistbeck a, Philippe Olivier c, Éric Dantras b
aAirbus Group Innovations, Composite Technologies, 81663 Munich, GermanybUniversité Paul Sabatier, Physique des Polymères, Institut Carnot CIRIMAT, 31062 Toulouse Cedex 9, FrancecUniversité de Toulouse, Institut Clément Ader, 31077 Toulouse Cedex 4, France
Keywords:
A. Carbon NanotubesA. Nano compositesD. RheologyB. Electrical propertiesB. Curing
a b s t r a c t
In this study, the cure kinetics, rheological and electrical behaviors of the MWCNTs/epoxy nanocompos-ites produced using a three-roll mill are studied. After defining the domain of linear response, theinfluence of temperature and MWCNTs on the shear viscosity has been investigated. The shear-thinningeffect caused by adding CNTs to the epoxy matrix is more pronounced at increased temperature andMWCNT weight content. Furthermore, a mechanical manifestation of the percolation phenomenonmay have been observed. At last the electrical conductivity was investigated to characterize thepercolation behavior and determine the best CNT content/electrical properties ratio.
1. Introduction
The high aspect ratio as well as their good electrical propertiesmakes Carbon Nanotubes (CNT) attractive when trying to improvematrix dominated properties of Carbon Fibre ReinforcedComposites (CFRP) used in the aerospace industry. Inserting CNTsin the polymer matrix of CFRPs may lead to an increase inthrough-thickness electrical conductivity expected in order to par-tially fulfill electrical conductivity requirements traditionally metby metallic structures.
Several methods to disperse Carbon Nanotubes in epoxy matri-ces in order to achieve a sufficient particle distribution have beenpresented in the literature. One of these methods consists in apply-ing high shear forces with a three roll mill to break up the CNTagglomerates and disperse them in the epoxy matrix. Very goodresults have been reported using this equipment [1]. A majoradvantage of this technique, beside the good dispersion stateobtained, is the up-scalability in order to efficiently manufacturelarger amounts of nanocomposites. Therefore, this will be themethod of choice in this research.
A large number of papers have dealt with the effect of CNTs onthe epoxy cure kinetics. El Sawi et al. [2] showed that DoubleWalled Carbon Nanotubes (DWCNTs) have an acceleration effecton the polymerization rate of an epoxy polymer but that no signif-icant effect was noted on the glass transition temperature of the
epoxy resin. This study revealed as well that a shear thinning effectof DWCNTs was observed and was more pronounced at increasedtemperature.
Concerning the electrical conductivity behavior, Barrau et al. [3]have investigated the DC and AC conductivities of CNT/epoxy nanocomposites made by dispersing nanotubes in an ultrasonic bath inthe epoxy matrix. Their investigations showed a frequency depen-dence of the measured conductivity followed by a DC plateau. Theexperimental results showed a DC conductivity percolationthreshold, pc = 0.3 wt%. Furthermore, since then, the works ofGojny et al. [4] and Vavouliotis et al. [5] have shown that percola-tion thresholds as low as 0.1 wt% can be achieved by usinguntreated MWCNTs dispersed with a calendering device.
In order to manufacture CNT modified CFRP using state of theart infusion processes (Resin Transfer Molding, Resin TransferInfusion, etc. . .) a few challenges have to be overcome. Indeedthe change in thermoset resin properties due to the insertion ofCNTs (high viscosity, CNTs filtration effect) makes it almost impos-sible. That is why alternative CFRP processing methods have to bedeveloped. One of the alternatives could be to spray CNT/epoxydispersions on the dry carbon fibres, followed by a controlled cur-ing process. Manufacturing CNT doped CFRP with such a techniquerequires a good knowledge of the processing parameters involved,considering that the spray gun operates at higher processing tem-peratures and shear rates. That is why, it is proposed in this workto study the thermal, rheological and electrical behavior of the CNTdoped epoxy to pave the way for such a potential CFRP manufac-turing process.
http://dx.doi.org/10.1016/j.compscitech.2015.02.002
⇑ Corresponding author at: Airbus Group Innovations, Composite Technologies,81663 Munich, Germany.
2. Materials and methods
2.1. Materials
The epoxy matrix used in this study is the commercially avail-able MVR 444 provided by Cytec Industries Inc. Based on theinformation provided in the material data sheet, it can beassumed that this thermosetting resin is based on four chemicalcomponents: tetraglycidyl 4,40-diaminodiphenylmethane,representing between 50% and 100% of the resin preparation;4,40-Methylenebis(2,6-diethylaniline), (between 10% and 25%);4,40-Methylenebis(2-Isopropyl-6-Methylaniline, (between 5% and10%) and Diethyltoluenediamine, (between 5% and 10%). Thisepoxy matrix is a single component resin where the epoxy pre-polymer and amine hardener are already mixed together anddegassed. It is typically used to manufacture aerospace compositecomponents using vacuum assisted resin transfer molding and isusually cured at 180 °C.
The Carbon Nanotubes selected are Multi-Walled CarbonNanotubes (MWCNT) provided by Arkema (France). A masterbatchbased on Cytec’s MVR 444 resin was prepared by Arkema usingtheir Graphistrength C S1-25 MWCNTs as an additive (25 wt%).With this method the CNT masterbatch is based on the same resinas the one used to dilute to the final CNT concentration, and bythus ensuring perfect compatibility. The as-received degree of cureof this thermoset masterbatch was determined to be a = 0.03(measured with differential scanning calorimetry).
2.2. Dispersion of CNT and processing parameters
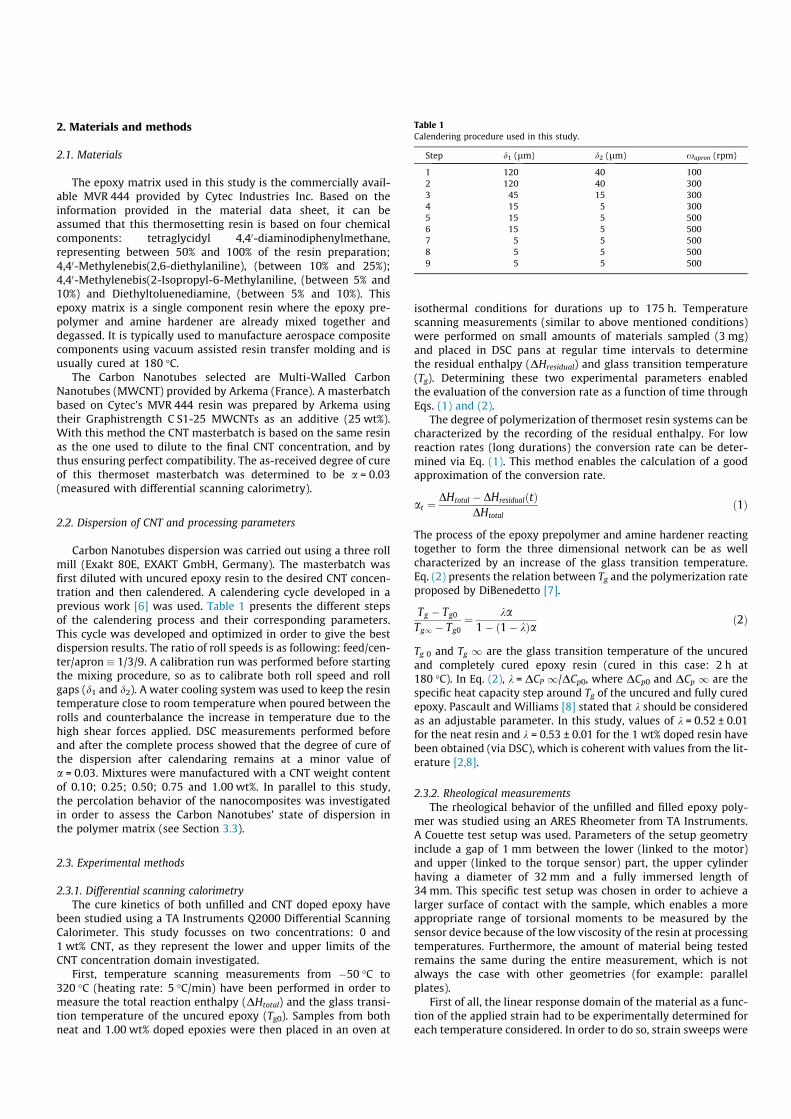
Carbon Nanotubes dispersion was carried out using a three rollmill (Exakt 80E, EXAKT GmbH, Germany). The masterbatch wasfirst diluted with uncured epoxy resin to the desired CNT concen-tration and then calendered. A calendering cycle developed in aprevious work [6] was used. Table 1 presents the different stepsof the calendering process and their corresponding parameters.This cycle was developed and optimized in order to give the bestdispersion results. The ratio of roll speeds is as following: feed/cen-ter/apron � 1/3/9. A calibration run was performed before startingthe mixing procedure, so as to calibrate both roll speed and rollgaps (d1 and d2). A water cooling system was used to keep the resintemperature close to room temperature when poured between therolls and counterbalance the increase in temperature due to thehigh shear forces applied. DSC measurements performed beforeand after the complete process showed that the degree of cure ofthe dispersion after calendaring remains at a minor value ofa = 0.03. Mixtures were manufactured with a CNT weight contentof 0.10; 0.25; 0.50; 0.75 and 1.00 wt%. In parallel to this study,the percolation behavior of the nanocomposites was investigatedin order to assess the Carbon Nanotubes’ state of dispersion inthe polymer matrix (see Section 3.3).
2.3. Experimental methods
2.3.1. Differential scanning calorimetry
The cure kinetics of both unfilled and CNT doped epoxy havebeen studied using a TA Instruments Q2000 Differential ScanningCalorimeter. This study focusses on two concentrations: 0 and1 wt% CNT, as they represent the lower and upper limits of theCNT concentration domain investigated.
First, temperature scanning measurements from ÿ50 °C to320 °C (heating rate: 5 °C/min) have been performed in order tomeasure the total reaction enthalpy (DHtotal) and the glass transi-tion temperature of the uncured epoxy (Tg0). Samples from bothneat and 1.00 wt% doped epoxies were then placed in an oven at
isothermal conditions for durations up to 175 h. Temperaturescanning measurements (similar to above mentioned conditions)were performed on small amounts of materials sampled (3 mg)and placed in DSC pans at regular time intervals to determinethe residual enthalpy (DHresidual) and glass transition temperature(Tg). Determining these two experimental parameters enabledthe evaluation of the conversion rate as a function of time throughEqs. (1) and (2).
The degree of polymerization of thermoset resin systems can becharacterized by the recording of the residual enthalpy. For lowreaction rates (long durations) the conversion rate can be deter-mined via Eq. (1). This method enables the calculation of a goodapproximation of the conversion rate.
at ¼DHtotal ÿ DHresidualðtÞ
DHtotal
ð1Þ
The process of the epoxy prepolymer and amine hardener reactingtogether to form the three dimensional network can be as wellcharacterized by an increase of the glass transition temperature.Eq. (2) presents the relation between Tg and the polymerization rateproposed by DiBenedetto [7].
Tg ÿ Tg0
Tg1 ÿ Tg0¼
ka1ÿ ð1ÿ kÞa
ð2Þ
Tg 0 and Tg 1 are the glass transition temperature of the uncuredand completely cured epoxy resin (cured in this case: 2 h at180 °C). In Eq. (2), k = DCP 1/DCp0, where DCp0 and DCp 1 are thespecific heat capacity step around Tg of the uncured and fully curedepoxy. Pascault and Williams [8] stated that k should be consideredas an adjustable parameter. In this study, values of k = 0.52 ± 0.01for the neat resin and k = 0.53 ± 0.01 for the 1 wt% doped resin havebeen obtained (via DSC), which is coherent with values from the lit-erature [2,8].
2.3.2. Rheological measurements
The rheological behavior of the unfilled and filled epoxy poly-mer was studied using an ARES Rheometer from TA Instruments.A Couette test setup was used. Parameters of the setup geometryinclude a gap of 1 mm between the lower (linked to the motor)and upper (linked to the torque sensor) part, the upper cylinderhaving a diameter of 32 mm and a fully immersed length of34 mm. This specific test setup was chosen in order to achieve alarger surface of contact with the sample, which enables a moreappropriate range of torsional moments to be measured by thesensor device because of the low viscosity of the resin at processingtemperatures. Furthermore, the amount of material being testedremains the same during the entire measurement, which is notalways the case with other geometries (for example: parallelplates).
First of all, the linear response domain of the material as a func-tion of the applied strain had to be experimentally determined foreach temperature considered. In order to do so, strain sweeps were
Table 1
Calendering procedure used in this study.
Step d1 (lm) d2 (lm) xapron (rpm)
1 120 40 1002 120 40 3003 45 15 3004 15 5 3005 15 5 5006 15 5 5007 5 5 5008 5 5 5009 5 5 500

performed under isothermal conditions at 60 °C, 80 °C and 100 °Cin a range of strains from 10ÿ2 to 8 � 102%. These measurementswere performed each time for a few selected shearing frequencies:10ÿ2; 5 � 10ÿ2; 10ÿ1; 1; 10; 80 Hz. It was chosen to record only thetorsional moment (Torque) as this is the only raw data not beingprocessed by the rheometer software. The aim was here to deter-mine the frequency domain and strains, for which the materialexhibits a linear response to the stress applied: a requirement todetermine the complex viscosity g�ðxÞ. In the same way as forthe cure kinetics analysis we chose to focus on the lower and upperlimits of the CNT concentration domain (pristine epoxy and1.00 wt% CNT doped).
In a second time, the rheological behavior was investigated as afunction of shear frequency. Frequency sweeps were performed atthe selected temperatures of 60 °C, 80 °C, and 100 °C for theselected strains and frequency domain, determined to ensure mea-surements inside the linear response domain of the material (seeSection 2.2). For this second part all of the CNT content range (from0 to 1.00 wt%) was analyzed.
2.3.3. Dynamic dielectric spectroscopy
AC conductivitymeasurementswere performedwith a SolartronSchlumberger gain/phase analyzer SI 1260 together with a Novo-control interface (broadband dielectric converter) in the frequencyrange of 10ÿ1–106 Hz. Themeasurements were performed in a tem-perature range of ÿ150–150 °C using a controlled nitrogen thermalregulation system (Quatro Novocontrol). The nanocomposite
samples (3 mm thick) were cured 2 h at 180 °C, coated with a silverpaint, and placed between two gold plated brass electrodes. Electri-cal conductivity measurements were carried out by recording thecomplex conductivity r⁄(x). The real part, r0(x) of the complexconductivity r⁄(x) was investigated. The value of r0(x) at 101 Hzwas considered as DC conductivity rDC. The complex conductivityobtained from the complex impedance can be written as followsEq. (3), where rDC is the direct current conductivity [9].
r�ðxÞ ¼ r0 þ ir00 with r0ðxÞ ¼ rDC þ Axs ð3Þ
3. Results and discussion
3.1. Cure kinetics
Fig. 1 presents four of the conversion rate (a) graphs obtainedthrough the residual enthalpy measured (s symbol on the graphs),and the monitoring of the Tg (h symbol), for pristine (left-hand sideof the picture) and 1 wt% CNT doped epoxy (right-hand side) at the60 °C (top of the figure) and 100 °C (bottom) isotherms. We firstnotice a good agreement between results obtained following thetwo methods. In the graph, these results were fitted using aleast square fitting method (plain line for Tg and dashed line forDHresidual). A comparison to an existing model can be found laterin the paper.
In Fig. 1, two noticeable stages can be pointed out. First, forshort times spent on the isotherm (i.e. between 0 and 75 h at
Fig. 1. Conversion rate as a function of polymerization time.

60 °C and between 0 and 10 h at 100 °C), we notice a strong andsteady increase of a. This is directly related to the 3D cross linkingof the polymer. Indeed, in this first step (gelation), the amine andepoxy groups are free to react with one another. As the conversionrate continues to increase, it will eventually reach the point whereTg comes above the selected isotherms (Tg > Tisotherm). We noticethat as soon as it reaches this point, the increase in a is then sloweddown. The polymer has then reached its vitrification state. In thisstate the molecular mobility is reduced and the chemical reactionsare limited by the diffusion of the chemical species, which trans-lates to a slower increase of the conversion rate. It finally stabilizesto a plateau, a final maximal degree of cure being reached(a(max)60°C = 0.70 and a(max)100°C = 0.80). The results indicate avery similar curing behavior to other epoxy amine systems [10].It can be noticed that no significant influence of the CNTs on theevolution of the degree of cure could be observed.
From Fig. 1, we can also deduce the time available to process theresin without interfering with its chemical state. At 60 °C this pro-cessing window has a duration of 20 h and at 100 °C a duration of2 h, which is useful information for the CNT/epoxy spraying pro-cess. It is essential to perform the rheological analysis inside thiswindow in order to be sure to observe only molecular mobilityinduced phenomenon and no chemical phenomenon such as gela-tion or vitrification.
The cure kinetics of epoxy resins can be modeled by a few cat-alytic and autocatalytic phenomenological models. The cure kinet-ics model developed by Kamal and Sourour [11,12] is based uponboth catalytic and autocatalytic mechanisms, and is the mostwidely used in the literature for epoxy systems [13]. This modelwas therefore chosen in order to model the curing kinetics of theMVR 444. It is expressed by Eq. (4).
dadt
¼ ðk1 þ k2amÞð1ÿ aÞn ð4Þ
where a is the degree of cure, da/dt the curing rate. k1 is the param-eter describing the rate constant of the reaction with the partialorder m and k2 is the parameter corresponding to the autocatalyticreaction with the partial order n. In this study, the four parametersof the Kamal and Sourour model have to be determined;m, n, k1 andk2. A least square fitting algorithm using the Kamal Sourour equa-tion was used on both set of data (60 °C and 100° isothermal cur-ing). We observed that the Kamal Sourour equation fits theexperimental data very well. The four parameters of the modeldetermined using this method are summarized in Table 2. The reac-tion orders m and n are in good agreement with the literature onepoxies [14]. We notice that these orders of the curing reactionare not influenced by the curing temperature or by the addition ofCNTs. It can be noticed that for the curing at 100 °C, k1, which isthe parameter describing the rate constant of the reaction withthe partial order m is almost equal to zero for both neat and CNTdoped epoxy. This means that the associated reaction (the reactionof an epoxide with a primary amine producing a secondary amine)is discriminated compared to the reaction represented by k2 (withthe partial order n). The parameter n is the parameter correspond-ing to the autocatalytic reaction of this secondary amine reactingwith another epoxy group to form a tertiary amine. It has been
noticed that at 100 °C, k2 is increased by one order of magnitudecompared to 60 °C. Furthermore, at 60 °C, we notice that k1 isincreased by the addition of CNTs confirming their accelerationeffect on the curing kinetics at this temperature, having an acceler-ation effect on this first reaction only, as no effect of the nanotubeson k2 could be noticed.
3.2. Influence of MWCNTs on the rheological properties of the epoxy
polymer
In this subsection, the rheological behavior of the uncuredepoxy is studied at three selected isotherms inside the processingrange of the spray gun (60, 80 and 100 °C) both for pristine andCNT modified resin. The duration of the test does not exceed thedurations mentioned in the previous section, so it can assumedthat da/dt � 0 (and a � 0) during the measurement. After definingthe domain of linear response, the influence of temperature andMWCNTs on the shear viscosity will be presented.
Fig. 2 shows the strain sweeps (from 10ÿ2 up to 8 � 102% strain)for two of the three selected isotherms (60 and 100 °C, as they rep-resent the limits of the domain investigated), each time for theselected shearing frequencies. The vertical dashed lines are readingguides representing the two strain levels considered: 10% and100%. The rheological behavior as a function of the applied straincan be divided in two parts. For the lower strain levels (low tor-sional moments measured), the response of the material is erraticand does not follow any linear trend. On the other hand, as soon asa critical strain level is achieved, the material follows a lineartrend, indicating a linear response of the material. Therefore, thematerial presents a linear response for the shearing frequenciesfrom 5 � 10ÿ2 to 80 Hz for both 10% and 100% strain and for allthree temperatures considered (60 °C, 80 °C and 100 °C).
For the 1.00 wt% doped resin, two cases have to be distinguished.First, at 60 °C (Fig. 2 top right), the doped polymer exhibits the sametype of response as observed for the neat resin. Here again, thematerial presents a linear response for the shearing frequenciesfrom 5 � 10ÿ2 to 80 Hz for both 10% and 100% strain and for all therange of temperatures considered (from 60 °C to 100 °C). However,when testing at 100 °C (Fig. 2 bottom right), a different behavior isobserved. For low shearing frequencies (100 °C: 10ÿ2 to 10 Hz),experimental points are not aligned and cannot be interpolated(with respect to strain level) by a linear function. A change in itsslope and a curved form of the graphs with CNTs is observed. Weare in the case of a nonlinear response of the material. This nonlin-ear response observed can be a manifestation of either the hetero-geneity of the material or a homogeneous material but exhibiting acomplex mechanical response. In any case, as having a linearresponse of the material is required in order to define the viscosityfunction g⁄ (shear modulus), one can only determine and representg0 for temperatures and strain rates where a linear response isobserved. For the second part of the rheological study, it has beendecided to work in the linear response domain by choosing not toinvestigate the rheological behavior at 100% strain to stay exclu-sively inside the domain of linear response.
Fig. 3 presents the real part of the complex viscosity (g0) as afunction of the shearing frequency (f) for the epoxy resin doped
Table 2
Cure kinetics parameters for neat and 1 wt% doped MVR 444.
m n k1 k2
60 °C MVR 444 0.71 1.28 2.20 � 106 9.43 � 102
MVR 444 + 1 wt% CNTs 0.70 1.36 1.24 � 103 8.57 � 102
100 °C MVR 444 0.70 1.34 1.00 � 1018 6.72 � 101
MVR 444 + 1 wt% CNTs 0.62 1.43 1.00 � 1018 5.49 � 101

from 0 to 1.00 wt% CNTs for the three temperatures (60, 80 and100 °C) and for a strain rate of 10% (enabling to stay inside thedomain of linear response). From the experiments it can be noticedthat the behavior observed is different depending on the testingtemperature. At 60 °C and for CNT contents from 0 to 0.75 wt%the polymer exhibits a Newtonian or quasi Newtonian behavior,as the value of the real part of the complex viscosity remainsalmost the same for all the range of frequencies investigated. Onlythe epoxy dispersion containing 1.00 wt% CNTs undergoes adecrease in the g0 value with increasing frequency, characterizinga shear thinning behavior. At 80 °C a different trend could benoticed. For CNT weight fractions from 0 to 0.25 wt% the behavioris still Newtonian as at 60 °C, though for higher CNT contents theshear thinning behavior is more pronounced. Indeed the shearthinning effect is already present from 0.50 wt% and up to1.00 wt%. At last for the results at T = 100 °C, the same Newtonianbehavior is observed for concentrations from 0 to 0.25 wt% CNTsand shear thinning behavior from 0.50 to 1.00 wt%. Although thesame shear thinning behavior is observed here the trend followedby the shape of the curve is different compared to the one observedat 80 °C. A deviation in the decreasing trend is observed as a sort of‘‘bump’’ along the graph appears.
To further investigate this shear thinning behavior observed,the Carreau Yasuda rheological model [15,16] (Eq. (5)) was usedto fit the obtained experimental results:
gÿ g0
g0 ÿ g1
¼ 1þ ðs � f Þ2h inÿ1
2ð5Þ
where g0 and g1 are respectively the viscosity values at very lowand very high shearing rates, n is the shear thinning index, charac-terizing the degree of shear thinning compared to a Newtonianbehavior (where n = 1), and s is a characteristic time of the shearthinning behavior.
For all temperatures studied, the data was fitted with this equa-tion (see dashed lines in Fig. 3). In most cases a very good correla-tion of the experimental values with the Carreau Yasuda model isobtained. Only the experimental results at 100 °C seem to deviatefrom the theoretical model for the epoxy doped with 0.75 wt% and1.00 wt% CNTs. For these two dispersions, as mentioned in the pre-vious paragraph, a small ‘‘bump’’ can be noticed along the graph.This could be an expression of a re-agglomeration of the nano-tubes. More experiments have to be done to investigate thishypothesis.
When examining the zero shear viscosity (low shearing rates:g0) of the MWCNT doped epoxy in Fig. 3, a temperature and CNTamount dependency can be noticed. In order to make easier theinvestigation of this parameter, Fig. 4 presents the evolution ofg0 as a function of temperature (the dashed lines represent the lin-ear trend followed by the experimental data). The zero shear vis-cosity g0 seems to follow a different trend whether the CNTamount is below or above a critical loading (between 0.25 and0.50 wt%). It shows a linear dependency of g0 with the tempera-ture T, however two different trends have been noticed. On onehand, for CNT concentrations from 0 to 0.25 wt%, g0 decreaseslinearly while the temperature increases. On the other hand, for
Fig. 2. Torsional moment as a function of the applied strain.

CNT concentrations higher or equal to 0.50 wt%,g0 increases whilethe temperature increases.
Earlier works [17–21,23] have reported that the viscoelasticproperties observed are strongly dependent on the dispersion stateand interactions of the nanofillers inside the polymer matrix.Pötschke et al. [17,19] suggested that the rheological behaviorcan be of use in order to identify the percolation threshold ofCNT/polycarbonate composites. They observed that the resistivitythreshold occurred in the same concentration range as the increase
in melt viscosity found at low frequencies. Starting from a CNTloading of 2 wt%, the frequency dependence of the viscosity curveschanged significantly and a step increase in viscosity was observedat low frequencies. In this study the percolation threshold wasfound at 2 wt%. Furthermore, Sumfleth et al. [20] also discussedthe different percolation phenomena found in the electrical behav-ior of the cured epoxy/CNT nanocomposites as well as in the rheo-logical properties of the CNT-filled suspensions. This comparisongave a comprehensive insight in the network forming process.The electrical percolation threshold of the cured samples wasfound to occur at lower CNT content than the percolation for thestorage modulus of the uncured suspension (one order of magni-tude: 0.025 vs 0.2 wt%). This was linked to the re-agglomerationprocess occurring during curing, which is usually promoted byhigh-shear forces and elevated temperature.
Based on Fig. 4 and these observations from the relevant litera-ture, we presume that there might be a relation between the for-mation of the percolation network and the mechanical behaviorof the CNT/epoxy suspension. In the uncured suspension, polymerchain interactions might be found (although negligible), the intro-duced CNT-monomer interaction and especially CNT–CNT interac-tions dominate and are responsible for the increase of g at lowshear rates [17]. With the increase of nanofiller loading, an inter-connected network structure is formed above a critical particleloading, this dense network prevents polymer chain and monomermobility which might be the explanation of the increase in zero-shear viscosity with temperature (Fig. 4). On the other hand, belowthis critical particle loading, increasing temperature decreases thezero-shear viscosity as the thermal agitation promotes monomer
Fig. 3. Logarithmic frequency sweeps for neat and CNT doped epoxy (100 °C).
Fig. 4. Influence of the temperature on the viscosity at low shearing frequencies g0.

mobility in an environment where they are free to move (no CNTnetwork obstruction). At last, in this study, a lower percolationonset in suspension could not be observed, as in Sumfleth et al.[20], which might be a manifestation of a re-agglomeration processoccurring in the uncured suspensions at high CNT contents andtemperature.
3.3. Electrical conductivity
Fig. 5 shows themeasured DC conductivity at room temperatureof the MWCNTs/epoxy nano composites as a function of the CNTweight fraction. It can be observed that the nano composite exhibitsbetween a first plateau before and another one after the percolationthreshold a clear increase in DC conductivity by 11 orders ofmagnitude. The percolation threshold was found to be aroundpc = 0.25 wt% CNTs and the maximal conductivity was alreadyachieved for a CNT content of 0.75 wt% is rDC(max) = 6 � 10ÿ3 S m1.
The presence of a percolation threshold indicates the existenceof a percolation path for the electrical charges to travel through thematerial. Above this CNT loading, the conduction phenomenon isdue to the formation of a connecting path thanks to the CNT bun-dles network inside the epoxy matrix. The percolation theory [22]defines the insulator conductor transition and the correspondingpercolation threshold achieved via Eq. (6):
r ¼ r0ðpÿ pcÞt for p > pc ð6Þ
where r0 is a constant, p is the CNT weight fraction, pc the CNTweight fraction corresponding to the percolation threshold and t
the critical exponent. In Fig. 5, the data post percolation(P0.25 wt% CNTs) is fitted with Eq. (6) (solid red line). The interpo-lation of the experimental values leads to the determination of theabove mentioned parameters: pc = 0.25 wt%; r0 = 1.07 � 10ÿ2 S m1
and t = 1.18.The state of dispersion of the nanotubes inside the epoxy matrix
can be assessed via the measurement of the DC conductivity of thenanocomposite [22]. The lower the percolation threshold is, thebetter the CNTs are dispersed. A low percolation threshold signifiesthe presence of a homogeneous dispersion state, with few to noCNT bundles. Our percolation threshold obtained is slightly abovethe lowest percolation threshold achieved for these materials anddispersion process [4,5], but in the average range of what has beenreported in the literature [14,24] for mechanically dispersed nano-tubes, indicating that a very homogeneous, well dispersed threedimensional nanotube network was obtained.
4. Conclusions
In this study, MWCNTs were dispersed in an epoxy matrix usingthe calendering dispersion process and the cure kinetics, rheologi-cal and electrical behaviors of these dispersions were investigated.
First, the curing reaction kinetics was studied. No clear influ-ence of the MWCNTs on the curing reaction kinetics at the selectedcuring temperatures of 60 °C and 100 °C has been noted. It hasbeen found that the curing kinetics at these temperatures is inaccordance with the Kamal and Sourour model. We also were ableto deduce the time available to process the resin without interfer-ing with its chemical state.
Secondly, the linear response domain from a rheological pointof view was determined by performing strain sweeps at theselected isotherms (from 60 to 100 °C), each time for a few selectedshearing frequencies. Parameters for which the torque measuredfollowed a linear trend were next selected. Shear rate sweeps wereconsequently performed at the previously selected parameters andfor short durations to avoid any chemical effect and focus only onrheological behavior. For temperatures P80 °C, a shear thinningbehavior was observed for concentrations P0.50 wt% CNTs. Dis-persions with concentrations 60.25 wt% exhibit a Newtonianbehavior, as for all dispersions 60.75 wt% CNTs when tested<80 °C. This shear thinning behavior followed the Carreau Yasudamodel. Furthermore we noticed a rheological manifestation ofthe percolation behavior. Indeed, we found out that the viscosityat low shearing rates seems to follow a different trend as a functionof temperature, whether the MWCNT concentration is below orabove the percolation threshold. Focusing on a dispersion contain-ing 0.75 wt% CNT, it has been observed that at elevated tempera-tures (80 °C and 100 °C) a shear thinning behavior can beobserved. This is useful for such a spraying process, which submitsthe sprayed material to high shear forces when operating. A shortreview of the literature available showed that shear levels of 103–104 sÿ1 may be reached [25]. In this case of a shear thinning behav-ior, the viscosity of the dispersion in then decreased at higher shearrates and subsequently the spraying process is facilitated.
The dispersion state of the nanotubes inside the epoxy matrixwas accessed by the measure of the DC conductivity, revealing apercolation threshold at around pc = 0.25 wt% CNTs and that themaximal DC conductivity of 10ÿ2 S m1 was achieved for a CNT con-centration of 0.75 wt% CNTs. This concentration will be chosen forthe spraying process as it is the best CNT loading/conductivityachieved ration. The dispersion state of the nanotubes inside theepoxy matrix after the spraying process remains to be investigated.
This study helped settle the basic parameters in order todevelop a method of spraying CNTs dispersed inside an epoxymatrix. In a more comprehensive way, this might be a more gen-eral way of inserting nanoparticules inside the matrix of CFRPmaterials either for Liquid Composite Molding processes as wellas for prepreg materials.
Acknowledgements
This work has received funding from the Seventh FrameworkProgram of the European Commission under Grant AgreementNo. 265593 (Project ELECTRICAL) and No. 284562 (ProjectSARISTU).
References
[1] Gojny F, Wichmann M, Köpke U, Fiedler B, Schulte K. Influence of differentcarbon nanotubes on the mechanical properties of epoxy matrix composites –a comparative study. Compos Sci Technol 2004;64:2363–71.
[2] El Sawi I, Olivier P, Demont P, Bougherara H. Investigation of the effect ofdouble-walled carbon nanotubes on the curing reaction kinetics and shearflow of an epoxy. J Appl Polym Sci 2012;126:358–66.
Fig. 5. Dependence of the DC conductivity on the CNTs weight fraction of MWCNTs/epoxy.
[3] Barrau S,Demont P, PeigneyA, LaurentC, LacabanneC.DCandACconductivity ofcarbon nanotubes – polyepoxy composites. Macromolecules 2003;36:5187–94.
[4] Gojny FH, Wichmann MHG, Fiedler B, Kinloch IA, Bauhofer W, Windle AH, et al.Evaluation and identification of electrical and thermal conduction mechanismsin carbon nanotube/epoxy composites. Polymer 2006;47:2036–45.
[5] Vavouliotis A, Fiamegou E, Karapappas P, Psarras GC, Kostopoulos V. DC and ACconductivity in epoxy resin/multiwall carbon nanotubes percolative system.Polym Compos 2010;31(31):1874–80.
[6] MaillotAL, LuingeH, SchulteK. CNTmodified carbonfiberReinforced compositesfor aerospace applications. In: Proceedings of the 16th international conferenceon composite structures; 2011 June 28–30, Porto, Portugal.
[7] DiBenedetto AT. Prediction of the glass transition temperature of polymers: amodel based on the principle of corresponding states. J Polym Sci. Part B1987;25:1949–69.
[8] Pascault JP, Williams RJJ. Glass transition temperature versus conversionrelationships for thermosetting polymers. J Polym Sci Part B 1990;28:89–95.
[9] Jonscher AK. The universal dielectric response. Nature (London) 1977;267:673.[10] Puglia D, Valentini L, Armentano I, Kenny JM. Effects of single-walled carbon
nanotube incorporation on the cure reaction of epoxy resin and its detectionby Raman spectroscopy. Diam Relat Mater 2003;12:827–32.
[11] Kamal MR, Sourour S. Kinetics and thermal characterization of thermoset cure.Polym Eng Sci 1973;13:59–64.
[12] Sourour S, Kamal MR. Differential scanning calorimetry of epoxy cure:isothermal cure kinetics. Thermochim Acta 1976;14:41–59.
[13] Rabearison N, Jochum C, Grandidier JC. A cure kinetics, diffusion controlledand temperature dependant, identification of the Araldite LY556 epoxy. JMater Sci 2011;46:787–96.
[14] El Sawi I, Olivier P, Demont P, Bougherara H. Processing and electricalcharacterization of a unidirectional CFRP composite filled with DWCNT.Compos Sci Technol 2012;73:19–26.
[15] Carreau PJ. Rheological equations from molecular network theories. J Rheol1972;16:99.
[16] Yasuda K, Armstrong RC, Cohen RE. Shear flow properties of concentratedsolutions of linear and star branched polystyrene. Rheol Acta 1981;20:10.
[17] Pötschke P, Fornes TD, Paul DR. Rheological behavior of multiwalled carbonnanotube/polycarbonate composites. Polymer 2002;43:3247–55.
[18] Kotsilkova R, Nesheva D, Nedkov I, Krusteva E, Stavrev S. Rheological,electrical, and microwave properties of polymers with nanosized carbonparticles. J Appl Polym Sci 2004;92:2220–7.
[19] McClory C, Pötschke P, McNally T. Influence of screw speed on electrical andrheological percolation of melt-mixed high-impact polystyrene/MWCNTnanocomposites. Macromol Mater Eng 2011;296:59–69.
[20] Sumfleth J, Buschhorn ST, Schulte K. Comparison of rheological and electricalpercolation phenomena in carbon black and carbon nanotube filled epoxypolymers. J Mater Sci 2010;46:659–69.
[21] Liu Y, Wilkinson A. Processing behaviour of a nanocomposite matrix formultiscale composites. In: Proceedings of the 16th European conference oncomposite materials; 2014 June 22–26, Seville, Spain.
[22] Stauffer G. In: Introduction to percolation theory. London: Taylor and Francis;1985.
[23] Li J, Ma PC, ChowWS, To CK, Tang BZ, Kim JK. Correlations between percolationthreshold, dispersion state, and aspect ratio of carbon nanotubes. Adv FunctMater 2007;17:3207–15.
[24] Barrau S, Demont P, Perez E, Peigney A, Laurent C, Lacabanne C. Effect ofpalmitic acid on the electrical conductivity of carbon nanotubes – epoxy resin.Macromolecules 2003;36:9678–80.
[25] Barnes HA, Hutton JF, Walters K. In: An introduction to rheol-ogy. Amsterdam: Elsevier; 1989.