Open Access Spirometry Longitudinal Data Analysis Software...
9
94 The Open Medical Informatics Journal, 2010, 4, 94-102 1874-4311/10 2010 Bentham Open Open Access Spirometry Longitudinal Data Analysis Software (SPIROLA) for Analysis of Spirometry Data in Workplace Prevention or COPD Treatment Eva Hnizdo *,1 , Tieliang Yan 2 , Artak Hakobyan 2 , Paul Enright 3 , Lu-Ann Beeckman-Wagner 1 , John Hankinson 4 , James Fleming 5 and Edward Lee Petsonk 1 1 Division of Respiratory Disease Studies, National Institute for Occupational Safety and Health, Centers for Disease Control and Prevention, 1095 Willowdale Road, Morgantown, WV 26505, USA 2 System Research & Applications International, Inc., Morgantown, WV 26505, USA 3 University of Arizona, Tucson, AZ, USA 4 Hankinson Consulting, Valdosta, GA, USA 5 Phoenix Fire Department, Phoenix, Arizona, USA Abstract: Chronic obstructive pulmonary disease (COPD) is one of the leading causes of morbidity and mortality. Periodic spirometry is often recommended for individuals with potential occupational exposure to respiratory hazards and in medical treatment of respiratory disease, to prevent COPD or improve treatment outcome. To achieve the full potential of spirometry monitoring in preserving lung function, it is important to maintain acceptable precision of the longitudinal measurements, apply interpretive strategies that identify individuals with abnormal test results or excessive loss of lung function in a timely manner, and use the results for intervention on respiratory disease prevention or treatment modification. We describe novel, easy-to-use visual and analytical software, Spirometry Longitudinal Data Analysis software (SPIROLA), designed to assist healthcare providers in the above aspects of spirometry monitoring. Software application in ongoing workplace spirometry-based medical monitoring programs helped to identify increased spirometry data variability due to deteriorating test quality and subsequent improvement following interventions, and helped to enhance identification of individuals with excessive decline in lung function. Keywords: Spirometry monitoring, prevention, COPD, longitudinal spirometry. INTRODUCTION Chronic obstructive pulmonary disease (COPD) is one of the leading causes of morbidity and mortality [1]. COPD often profoundly diminishes the affected individual’s quality of life. Furthermore, excessive decline in lung function is associated with premature functional impairment and disability, early retirement from work, and increased morbidity and mortality [2-5]. Fortunately, the severe consequence of COPD can be prevented through early recognition and effective interventions directed at controlling known risk factors, including occupational factors [6-11]. Workplace monitoring of spirometry tests of forced expiratory volume in one second (FEV 1 ) and forced vital capacity (FVC) is widely accepted as a key step in the early (preclinical) recognition of both obstructive and restrictive lung diseases [12-15]. Professional recommendations emphasize several key steps in achieving the full potential of spirometry monitoring in disease prevention. These include: (i) maintaining acceptable longitudinal data variability (i.e., precision); (ii) applying interpretative strategies that have good sensitivity, yet sufficient specificity, to identify *Address correspondence to this author at the Division of Respiratory Disease Studies, National Institute for Occupational Safety and Health, 1095 Willowdale Road, Morgantown, WV 26505, USA; Tel: 304-285-6031; Fax: 304-285-6111; E-mail: [email protected] individuals who may be at risk of experiencing excessive loss of lung function (i.e., those at risk of developing lung function impairment); and (iii) using health monitoring results, including symptoms, to target and monitor intervention [12-17]. Computer software has the potential to assist healthcare providers in achieving these steps and thus to help in preserving lung health. In this paper, we describe an easy-to-use visual and analytical tool, Spirometry Longitudinal Data Analysis software (SPIROLA) [18] designed for use by healthcare providers as an aid in spirometry monitoring. We outline SPIROLA’s methodology and functions, and present results from its application in ongoing monitoring programs. The software can be downloaded free of charge from the internet [18]. METHODOLOGICAL BACKGROUND One of the objectives in spirometry monitoring is to characterize the time-related pattern of lung function decline in adult individuals. This section describes methods SPIROLA uses to identify individuals whose decline in lung function is greater than expected and the method for monitoring longitudinal spirometry data precision and quality. FEV 1 is the most suitable of the spirometry measures for evaluation of lung function changes over time as it is least
Transcript of Open Access Spirometry Longitudinal Data Analysis Software...
94 The Open Medical Informatics Journal, 2010, 4, 94-102
1874-4311/10 2010 Bentham Open
Open Access
Spirometry Longitudinal Data Analysis Software (SPIROLA) for Analysis of Spirometry Data in Workplace Prevention or COPD Treatment
Eva Hnizdo*,1
, Tieliang Yan2, Artak Hakobyan
2, Paul Enright
3, Lu-Ann Beeckman-Wagner
1,
John Hankinson4, James Fleming
5 and Edward Lee Petsonk
1
1Division of Respiratory Disease Studies, National Institute for Occupational Safety and Health, Centers for Disease
Control and Prevention, 1095 Willowdale Road, Morgantown, WV 26505, USA
2System Research & Applications International, Inc., Morgantown, WV 26505, USA
3University of Arizona, Tucson, AZ, USA
4Hankinson Consulting, Valdosta, GA, USA
5Phoenix Fire Department, Phoenix, Arizona, USA
Abstract: Chronic obstructive pulmonary disease (COPD) is one of the leading causes of morbidity and mortality.
Periodic spirometry is often recommended for individuals with potential occupational exposure to respiratory hazards and
in medical treatment of respiratory disease, to prevent COPD or improve treatment outcome. To achieve the full potential
of spirometry monitoring in preserving lung function, it is important to maintain acceptable precision of the longitudinal
measurements, apply interpretive strategies that identify individuals with abnormal test results or excessive loss of lung
function in a timely manner, and use the results for intervention on respiratory disease prevention or treatment
modification. We describe novel, easy-to-use visual and analytical software, Spirometry Longitudinal Data Analysis
software (SPIROLA), designed to assist healthcare providers in the above aspects of spirometry monitoring. Software
application in ongoing workplace spirometry-based medical monitoring programs helped to identify increased spirometry
data variability due to deteriorating test quality and subsequent improvement following interventions, and helped to
enhance identification of individuals with excessive decline in lung function.
Keywords: Spirometry monitoring, prevention, COPD, longitudinal spirometry.
INTRODUCTION
Chronic obstructive pulmonary disease (COPD) is one of the leading causes of morbidity and mortality [1]. COPD often profoundly diminishes the affected individual’s quality of life. Furthermore, excessive decline in lung function is associated with premature functional impairment and disability, early retirement from work, and increased morbidity and mortality [2-5].
Fortunately, the severe
consequence of COPD can be prevented through early recognition and effective interventions directed at controlling known risk factors, including occupational factors [6-11].
Workplace monitoring of spirometry tests of forced expiratory volume in one second (FEV1) and forced vital capacity (FVC) is widely accepted as a key step in the early (preclinical) recognition of both obstructive and restrictive lung diseases [12-15]. Professional recommendations emphasize several key steps in achieving the full potential of spirometry monitoring in disease prevention. These include: (i) maintaining acceptable longitudinal data variability (i.e., precision); (ii) applying interpretative strategies that have good sensitivity, yet sufficient specificity, to identify
*Address correspondence to this author at the Division of Respiratory
Disease Studies, National Institute for Occupational Safety and Health, 1095
Willowdale Road, Morgantown, WV 26505, USA; Tel: 304-285-6031; Fax:
304-285-6111; E-mail: [email protected]
individuals who may be at risk of experiencing excessive loss of lung function (i.e., those at risk of developing lung function impairment); and (iii) using health monitoring results, including symptoms, to target and monitor intervention [12-17].
Computer software has the potential to
assist healthcare providers in achieving these steps and thus to help in preserving lung health.
In this paper, we describe an easy-to-use visual and analytical tool, Spirometry Longitudinal Data Analysis software (SPIROLA) [18] designed for use by healthcare providers as an aid in spirometry monitoring. We outline SPIROLA’s methodology and functions, and present results from its application in ongoing monitoring programs. The software can be downloaded free of charge from the internet [18].
METHODOLOGICAL BACKGROUND
One of the objectives in spirometry monitoring is to characterize the time-related pattern of lung function decline in adult individuals. This section describes methods SPIROLA uses to identify individuals whose decline in lung function is greater than expected and the method for monitoring longitudinal spirometry data precision and quality.
FEV1 is the most suitable of the spirometry measures for evaluation of lung function changes over time as it is least

Spirometry Longitudinal Data Analysis Software The Open Medical Informatics Journal, 2010, Volume 4 95
variable within a person, least prone to measurement error, and is decreased in both obstructive and restrictive impairment. In healthy adult never-smokers with normal body weight, FEV1 declines at about 27 ml/yr, starting at around 27 years of age, and the decline appears to be linear over the working lifetime [19, 20]. The decline with age can be estimated using a simple linear regression model, FEV1=a+b age, where the slope b represents the rate of FEV1 change (e.g., in milliliters per year, ml/yr) [19].
The variability of longitudinal FEV1 measurements around the predicted line determines the precision of the estimated rate of decline b and is measured by its standard error S.E.(b) estimated as [21]:
S.E.(b) = w 12(P 1) / t P(P +1) (1)
where t is the duration of follow-up in years, w is the
within-person standard deviation and P is the number of
equally spaced repeated measurements done during the
follow-up. Fig. (1) shows the estimated values for S.E. (b)
[using equation (1)] for four individuals with varying
inherent within-person variation (from low 50 to high 250
ml), for increasing years of follow-up. The solid line is based
on P=2, i.e., baseline comparison with a test taken at a
specific year, and the dotted line is based on P=t, i.e., all
annual measurements. The one-sided upper 95% confidence
limit (95% UCL) for the person’s rate of decline measured
by the slope b is calculated as (95% UCL)=b+1.645 S.E.(b).
Depending on the magnitude of individual’s within-person
variation, it generally takes 5 or more years to estimate an
individual’s “true” rate of decline with sufficient precision.
Fig. (1). Decline in S.E. (b) in relation to follow-up time and
varying within-person variation w . Solid line is based on P=2
(i.e., baseline and a measurements at a specific year), dotted line is based on P=number of years.
Fig. (1) demonstrates that in prospectively collected spirometry data where testing is done on an annual or less frequent basis as in spirometry monitoring, the slopes provided by the linear regression model during the first five to eight years, depending on individual’s within-person
variation, are generally imprecise and may not provide a reliable estimate of the “true” rate of decline [21-24]. Nevertheless, during this early period there is a need to determine whether a person’s observed decline in lung function exceeds what would be expected based upon an expected rate of decline and expected FEV1 variability. The American Thoracic Society (ATS) recommends a limit of annual decline for FEV1 of 15% as clinically significant decline [25]. The American College of Occupational and Environmental Medicine (ACOEM) has proposed a longitudinal reference limit based on a 15% annual FEV1 decline for working populations [14, 15]. However, the fixed limit of 15% is too wide for maintaining acceptable data precision in a relatively healthy workforce, and too insensitive to detect acute adverse effects in some workplace situations where excessive decline over a short period of time has been observed (see below) [22, 23, 26].
Alternatively, the limit of longitudinal decline (LLD) that approximates the one-sided upper 95% CL for a referent rate of decline and that takes into account the monitoring program’s average FEV1 within-person variation has been proposed for the evaluation of longitudinal changes in individuals [22, 23]. LLDa represents the absolute limit for the maximal decline over time t and is defined as follows:
LLDa=t (b+1.645 S.E.(b)) (2)
where b is a referent rate of decline and S.E.(b) is the
standard error of b as described in equation (1). Since the
within-person variation w in equation (1) is usually
unknown for an individual during the early years of follow-
up, one can approximate w by the monitoring program’s
average within-person standard deviation; this can be
estimated on a group of n individuals, by the pair-wise
within-person standard deviation sp as:
sp =1
2n(FEV11i FEV12i )
2
i=1
n
, (3)
where FEV11i and FEV12i are FEV1 measurements repeated approximately one year apart in an ith individual, as done for annual spirometry monitoring.
Alternatively, a relative limit of longitudinal decline, LLDr, for percent decline from the baseline value FEV1 can be calculated using equation (1) with the parameters standardized by baseline FEV1baseline as b/FEV1baseline and S.E.(b/FEV1baseline), where the relative pair-wise within-person variation sr calculated as:
sr =1
2n
FEV11i FEV12i(FEV11i + FEV12i ) / 2
2
i=1
n
(4)
is substituted for w in equation (1). The LLDr limit has
better applicability for groups that vary with respect to
gender, height, race, or ethnicity (i.e., factors that affect
FEV1 size) [23]. Alternatively, published estimates of within-
person variation can be used [23].
The LLD method has been proposed for the purposes of maintaining longitudinal data precision in workers’ populations and identifying workers who may experience
���
���
���
���
���
���
��
�� � � � � � � ��
� ����������
����
����
����
���
�
�
�
�
�
�
�
�
���
����
���
��

96 The Open Medical Informatics Journal, 2010, Volume 4 Hnizdo et al.
excessive decline during the early (1-8) years of follow-up [22, 23]. If an individual’s FEV1 decline exceed the LLD limit, a first step in the evaluation should include increase in precision of the longitudinal measurements by review of data quality or re-testing in near future, before further steps are taken. Generally, after 5 to 8 years of follow-up, the individual’s own regression slope reaches sufficient precision and can be used for decision-making [21-24].
Fig. (1) demonstrates that for a monitoring program to be effective at timely identification of excessive decline in lung function and at disease prevention, it is important to maintain acceptable precision of the longitudinal measurements. Monitoring the program’s absolute and relative pair-wise within-person variation statistic sr or sp helps to maintain longitudinal data precision at an acceptable level [16]. In addition, monitoring test quality grades assigned by a spirometer at a testing session can help to monitor percentage of tests that do not adhere to ATS/ European Respiratory Society (ERS) recommendations. Monitoring of precision or test quality grades, overall and by a spirometry technician, allows prompt investigation into the source of increased variation (e.g., instrument malfunction, procedural errors, effects of exposure, technician related errors) [16, 27].
SOFTWARE METHODS AND FUNCTIONS
Development and Testing
From the onset of its development in 2005, SPIROLA software has been piloted by several large ongoing monitoring programs. In these programs SPIROLA is used by physicians and their needs were considered in its development. In one program, an Occupational Medicine Inc.
® (OMI) spirometry system automatically loads
spirometry results into SPIROLA to be displayed at the time of individuals’ medical examinations.
Software Environment and Data Requirement
SPIROLA runs on PC with Microsoft Windows system and requires Microsoft Windows 2000/XP/Vista, Microsoft.NET Framework 2.0 and Database engine, which are Microsoft default options. The User Manual, provided by the Help menu, describes installation procedure, data input, functions, and theoretical background on which the data analysis is based. The SPIROLA databases should be kept in a secured folder and use a shared folder if multiple users are using the data.
At a minimum, SPIROLA requires the following data: a unique personal identifier, age, height, race/ethnicity, best FEV1 and FVC test values, and date of test. Where the spirometry system provides quality indices for a testing session (i.e., quality grades for acceptability and repeatability, second best FEV1 and FVC, technician or provider code), these data can be also uploaded into SPIROLA database and analyzed by SPIROLA. Data for intervention decision-making (e.g., weight, occupational exposure factors, smoking data, and questionnaire responses) can be included in the database for display in individual records.
SPIROLA main menu options are easy to operate and allow for a spirometry file selection, a group selection and
evaluation, evaluation of individual’s data, monitoring of longitudinal spirometry data precision and tests quality scores, and automatic selection of individuals whose tests need review because of abnormal findings.
Functions for Group Evaluation
The following functions are provided to assist in evaluating data at a group level:
(i) Monitoring longitudinal data precision. To achieve and maintain acceptable longitudinal FEV1 data precision over time, the program’s data precision is monitored on an annual basis using the absolute and relative pair-wise within-person variation statistics, sp (ml) and sr (%), respectively (see Background).
(ii) Monitoring the group mean FEV1 and FVC values. Time-trends in mean FEV1 and FVC are displayed to help to identify effects taking place at a group level (e.g., due to occupational hazard, smoking cessation program). To adjust for time-related changes in a group’s demographics, SPIROLA monitors also the mean predicted values estimated from standard or user supplied reference equations and z-score. Z-score reflects the mean difference between the observed and predicted values expressed in the standard deviation units, standardized for demographic data distribution.
(iii) Monitoring spirometry quality control. To optimize the spirometry quality control for the monitoring program and individual technicians, SPIROLA analyzes tests’ quality grades assigned by a spirometer at a testing session [28, 29]. SPIROLA monitors on a quarterly basis: (i) the percentage of tests that do not meet the ATS/ERS criteria for acceptability and repeatability, and (ii) the percentage of tests that do not meet repeatability criteria (i.e., >150 ml between the two best FEV1 and FVC measurements). The user can specify quality grades and cutoff points appropriate for a spirometer type.
(iv) Screening for individuals with abnormal results. Individuals identified to have abnormal lung function results are listed in Risk List. Risk List provides summary statistics on a number screened and found with specific type of abnormal results (see below).
SPIROLA’s Functions for Individual Evaluation
The following functions are provided to assist in evaluating data at an individual level:
(i) Evaluating the most recent spirometry test results. As recommended by the ATS/ERS and ACOEM, the most recent best FEV1, FVC, and FEV1/FVC values are compared to U.S. population-based reference values (default) [30] or to user-defined reference values [25,28].
Individuals whose
values are below the lower limit of normal (LLN, i.e., values that have 5% probability of being normal in a healthy non-smoker population) are identified for further evaluation and listed in the Risk List.
(ii) Evaluating longitudinal changes in FEV1. Time-trends for FEV1, FVC, and their percent predicted values and the FEV1/FVC ratio are displayed graphically. During the first seven years of follow-up, SPIROLA applies the limit of longitudinal decline (LLD) criterion to identify FEV1 measurements that decline excessively from the baseline
Spirometry Longitudinal Data Analysis Software The Open Medical Informatics Journal, 2010, Volume 4 97
measurement(s). The LLD can be specified in absolute values (LLDa) or in relative values as percentage (LLDr), or as the ACOEM limit; [14,15] a default limit is based on within-person variation of 4% [23]. Beginning with the fourth year of follow-up, the changes in the rate of FEV1 decline due to each longitudinal data point are monitored graphically. The later function is useful in monitoring the effect of intervention or identification of events leading to deterioration in the rate of decline. Beginning with eight years of follow-up, SPIROLA evaluates whether an individual is at risk of developing FEV1 values that has low probability of being normal (i.e., <0.1 percentile which is comparable to 60% predicted, defined by ATS as moderate impairment), based on the level of FEV1 and the rate of FEV1 decline [31].
(iv) Evaluating longitudinal FEV1 data variability. Within-person variation in FEV1 and FVC is calculated when there are three or more longitudinal measurements and evaluated for the probability of being normal.
(v) An Individual’s report displays. An individual’s report display results of data analyses together with demographic data. If there are abnormal findings, the individual report suggests steps to be considered in further evaluation. These include: (a) assessment of the individual’s longitudinal data; obvious outliers can be excluded temporarily from the analysis; (b) review of the baseline and most recent spirometry tracings and test quality; (c) re-testing in near future to confirm the results; and (d) only if abnormal test results are confirmed, further steps such as further medical evaluation and intervention on potential risk factors are recommended.
(vi) Tagging individuals for further evaluation. The software enables the user to create a list of individuals for quality control or re-testing, and intervention.
The project proposal and methods were approved by the NIOSH Human Subject Review Board.
RESULTS
Results presented are examples from application of SPIROLA to data from several ongoing monitoring programs. The examples have been selected to demonstrate SPIROLA functions and to show how the results can help healthcare providers.
Group Evaluation of Spirometry Data Precision and Mean Lung Function Values
Application of SPIROLA in 2005 for the evaluation of data precision in one of the monitoring programs prompted concerns about spirometry quality. Fig. (2, bottom part) shows that the annual values of absolute and relative pair-wise within-person variation, sp (ml) (left axis) and sr (%) (right axis), had declined gradually from the program’s inception in 1988 until 1999, indicating improving data quality, but then the statistics showed a marked increase in data variability from 2000. In June 2001, a volumetric spirometer, used since 1988, had been replaced by a new flow-based spirometer. Data generated by the new spirometer resulted in a marked increase in data variability since 2000; the year 2000 includes repeated measurements
done in 2001. Prompted by the SPIROLA results, interventions to improve spirometry quality was initiated in 2005 and involved the following measures: technician training through a NIOSH-approved spirometry training course [32] in April 2005; replacement of a flow-based spirometer by a volumetric spirometer in December 2005; a computerized central-quality control by a senior technician from September 2006; and SPIROLA’s quality grades analysis from January 2008. Taken together, the interventions resulted in a substantial decrease in the within-person variation from 2006. The observation in 2008 is based on first observations made from after January 2008 and includes repeated tests made mainly because of quality issues. The sr (right axis) value of 4% achieved from 2006-7 signifies acceptable data precision and corresponds to annual LLDr value of 10% [22, 23].
Fig. (2, top charts) also shows trends for the observed (green line) and predicted (yellow line) group mean FEV1 and FVC values by year. As there were no changes in the employment pattern since the intervention onset in 2005, the increase in the observed means in relation to the predicted means and the increase in the z-scores (red line) was mainly due to the improvement in spirometry quality. Charts shown in Fig. (2) can be displayed individually also.
Evaluation of Spirometry Quality Grades
Fig. (3) shows SPIROLA’s chart generated from the analysis of quality indices (the grades assigned by a spirometer, within-test repeatability, and relative pair-wise within-person variation), in this case summarized across all technicians, by quartiles. Individual technicians’ charts can be also shown.
The quality of the FEV1 test was mostly acceptable, based on the small percentage of tests that did not meet the ATS/ERS criteria of acceptability and repeatability (<10%) (green lines ), within-test repeatability (<10%) (blue line
), and pair-wise within-person variation of 4%22
(red line); a yellow circle indicates small sample size. On the other hand, a large percentage of the FVC measurements did not meet the ATS/ERS criteria. Additional training in 2008 help to improve acceptability of FVC measurements; most of the unacceptable tests failed to fulfill the end of test criteria [28].
Analysis by technicians permitted specific guidance to individual technicians.
Screening for Individuals with Abnormal Tests Results: Risk List
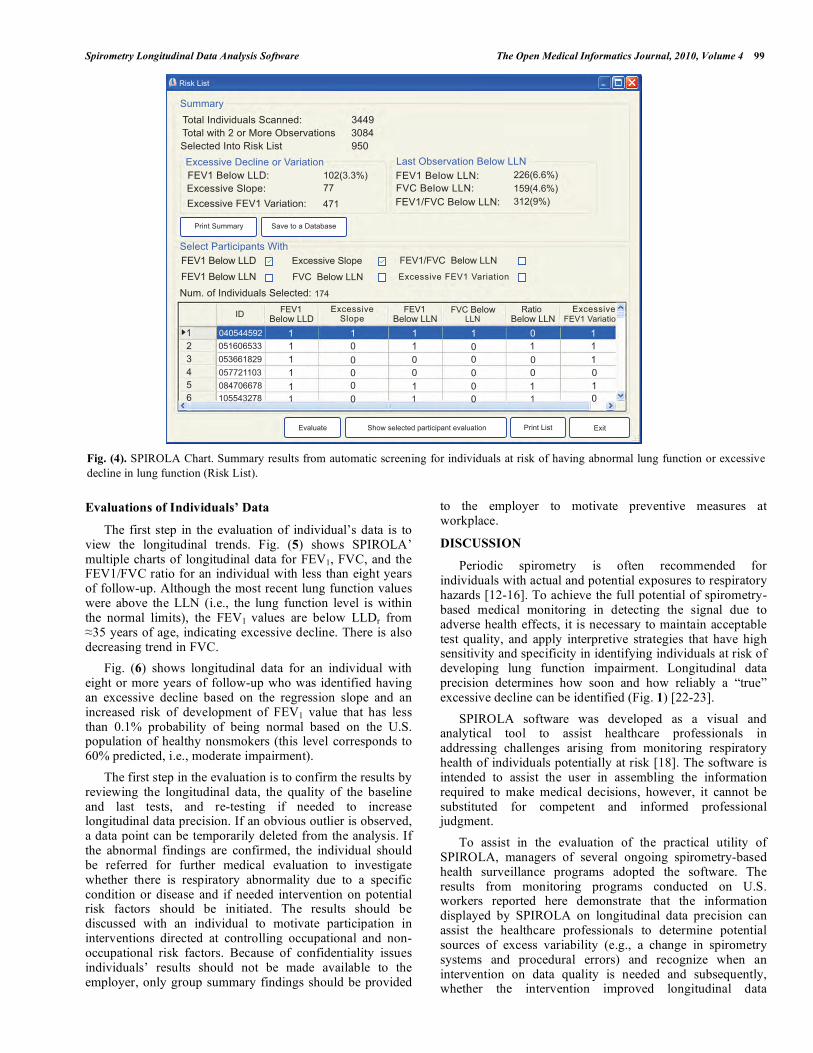
The summary results from one monitoring program (Fig. 4) show that there were 3,449 workers who had at least one spirometry test during the screening period. Of these, 312 (9%) were selected into the risk list because the FEV1/FVC ratio was below LLN at the most recent test. Of the 3,084 individuals who had at least two longitudinal observations, 174 (5.6%) were selected into the risk list because of potential excessive decline: in 102 (3.3%) the excessive decline was assessed using LLDr as the duration of follow-up was less than 8 years; and in 77 the identification was based on the linear regression slope and the risk of developing FEV1 value that has <0.1% probability of being normal (i.e., moderate impairment).

98 The Open Medical Informatics Journal, 2010, Volume 4 Hnizdo et al.
Fig. (2). SPIROLA chart. Upper part shows trends in group FEV1 and FVC means, for the predicted (yellow line), observed (green line) and
z-scores (red line) values, and bottom part shows absolute (green) and relative (red) pair-wise within-person variation sr or sp, by year.
Fig. (3). Percentage of tests that does not meet the ATS/ERS criteria for acceptability and repeatability for FVC (green, ) and FEV1 (green,
), repeatability (respective blue lines), and relative pair-wise within-person variation sr (red line ), a summary chart by technicians and
quartiles (yellow triangles indicate a small sample size).
���
����
����
����
����
���
����
����
�� ���� ���� ��� ���� ���� ���� ����
�� ��!"#�����
���$%��&���'��"#�(��$���)�
*!�+���
,"������&��-���$�-�� � ,"������&��-���$�-�� �
�� ���� ���� ��� ���� ���� ���� ����
���
����
����
����
����
���
����
������� ��� ���� ���� ��� ��� ���� �� ���� ��� �������� ���� ��� ���� ���� ��� ���� ���� ���� ����
��� ��� ���� ���� ��� ��� ���� �� ���� ��� �������� ���� ��� ���� ���� ��� ���� ���� ���� ����
���
���
���
���
���
!���
!���
!���
���
���
���
���
���
!���
!���
!���
*!�+���
�� ��!"#�����
���
���
���
���
���
��
�
�� ���� ���� ��� ���� ���� ���� ����
�� ��!"#�����,"������&��-���$�-�� �
��� ��� ��� �� ���� ���� ��� ���� ��� ���� ���� ��� ��� ��� ��� ���� ��� ���� ���� ���� ���
��$. -"% $� ���)��/�-��0��+ � �$
����
����
� �� ������
���� �� �
�����
��
!!�� �+-���#�� + #�$-!! (��$��#������� (��$�����1
���� ��
������������ �� ������
�
�
��
��
�
�
�
�
�0234�5�)���
� � '��"#��� �+- �$ 2$% 6 %"� ��6� "�- �$ '��"#��6� "�- �$ 0� $- 3 �7�� �- 2$-��6�$- �$ 8"��- �$$� �� 8"� -��9�$-�� :� #4#- �$�
���$%��&���'��"#�(��$��)9
(��$�&����
�)
������
(��$�&����
)9
�����
�0234�5�)���
� � '��"#��� �+- �$ 2$% 6 %"� ��6� "�- �$ '��"#��6� "�- �$ 0� $- 3 �7�� �- 2$-��6�$- �$ 8"��- �$$� �� 8"� -��9�$-�� :� #4#- �$�
8"� -��'��%�;�3�#��- � -���$%�0� �!� ���< -= $!#����$�)�� �- �$��1�
��
��
��
��
��
��
�
���� ���� ��� ��� ���� ����
�� ��!"#�����
8'���)� 8'��)9 3�#����)� 3�#���)9 �� 8'����-
&����++�#-�� -���$%���#��-�� -�;�&�����)2��+ �+ �����)9���>"������$%�-��- $.����� �$��-� �$. ����=��>"� -��.��%����.���$� $����$%���#��-�� -���� "�� $�����#����$-�-=��#��+�$-�.���&�-��-��-=�-�%��$�-����-�-=�������5��?�3��+� -�� �
���.�-�#��+�$-��=�" %������ �����1�&���>"� -��.��%����$%���#��-�� -�����.�-�#��+�$-��=�" %������ ����1�&���#� �!� ���� -= $!#����$�6�� �- �$����%� $���
!!4#���-��!! (��$�����1(��$��#�������
0��+�$-�.���1
�
Spirometry Longitudinal Data Analysis Software The Open Medical Informatics Journal, 2010, Volume 4 99
Evaluations of Individuals’ Data
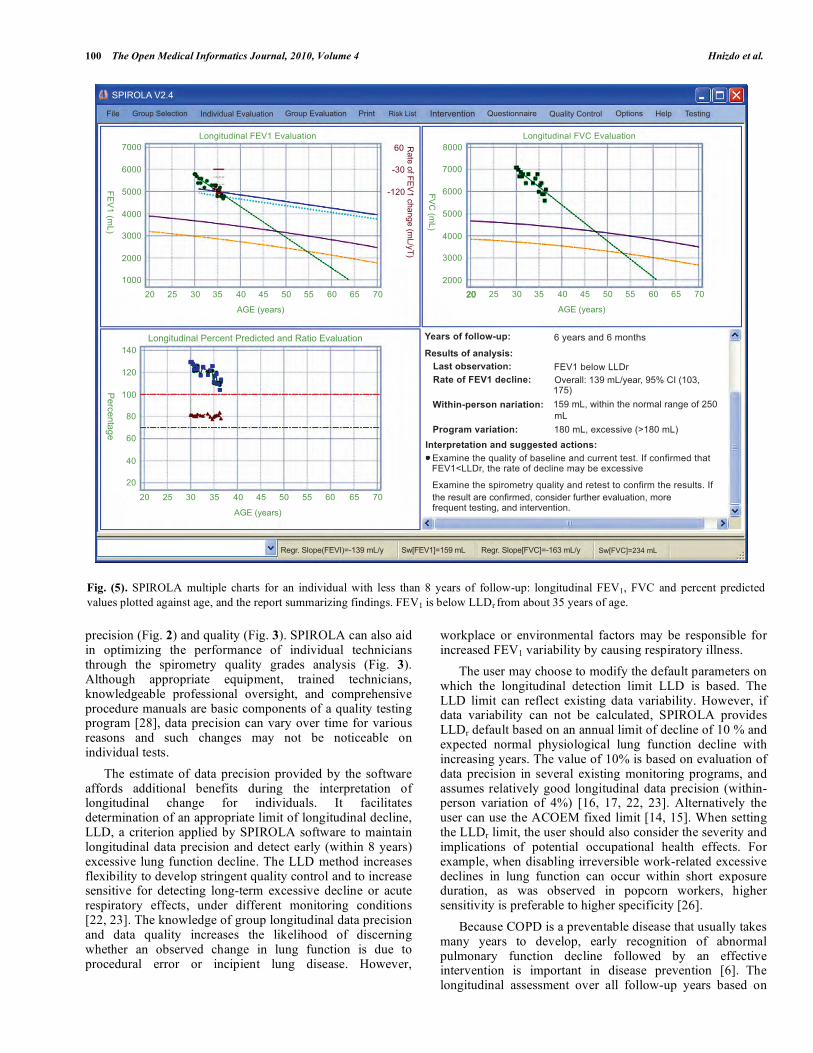
The first step in the evaluation of individual’s data is to view the longitudinal trends. Fig. (5) shows SPIROLA’ multiple charts of longitudinal data for FEV1, FVC, and the FEV1/FVC ratio for an individual with less than eight years of follow-up. Although the most recent lung function values were above the LLN (i.e., the lung function level is within the normal limits), the FEV1 values are below LLDr from
35 years of age, indicating excessive decline. There is also decreasing trend in FVC.
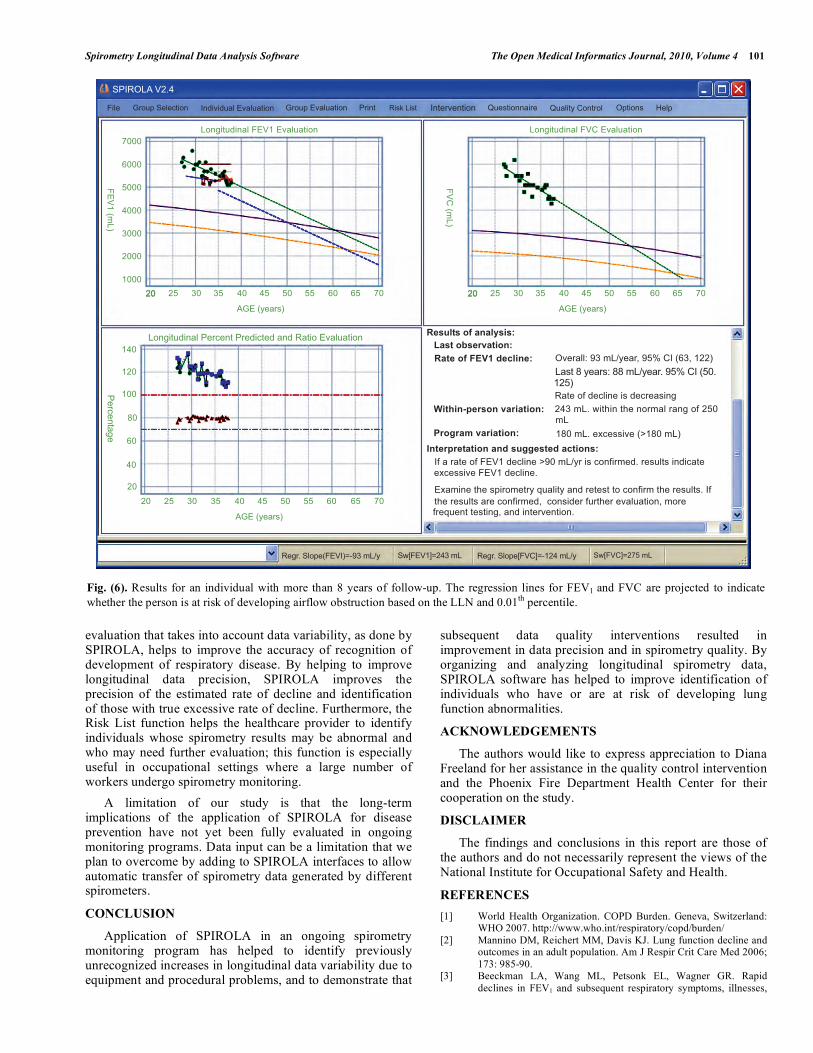
Fig. (6) shows longitudinal data for an individual with eight or more years of follow-up who was identified having an excessive decline based on the regression slope and an increased risk of development of FEV1 value that has less than 0.1% probability of being normal based on the U.S. population of healthy nonsmokers (this level corresponds to 60% predicted, i.e., moderate impairment).
The first step in the evaluation is to confirm the results by reviewing the longitudinal data, the quality of the baseline and last tests, and re-testing if needed to increase longitudinal data precision. If an obvious outlier is observed, a data point can be temporarily deleted from the analysis. If the abnormal findings are confirmed, the individual should be referred for further medical evaluation to investigate whether there is respiratory abnormality due to a specific condition or disease and if needed intervention on potential risk factors should be initiated. The results should be discussed with an individual to motivate participation in interventions directed at controlling occupational and non-occupational risk factors. Because of confidentiality issues individuals’ results should not be made available to the employer, only group summary findings should be provided
to the employer to motivate preventive measures at workplace.
DISCUSSION
Periodic spirometry is often recommended for individuals with actual and potential exposures to respiratory hazards [12-16]. To achieve the full potential of spirometry-based medical monitoring in detecting the signal due to adverse health effects, it is necessary to maintain acceptable test quality, and apply interpretive strategies that have high sensitivity and specificity in identifying individuals at risk of developing lung function impairment. Longitudinal data precision determines how soon and how reliably a “true” excessive decline can be identified (Fig. 1) [22-23].
SPIROLA software was developed as a visual and analytical tool to assist healthcare professionals in addressing challenges arising from monitoring respiratory health of individuals potentially at risk [18]. The software is intended to assist the user in assembling the information required to make medical decisions, however, it cannot be substituted for competent and informed professional judgment.
To assist in the evaluation of the practical utility of SPIROLA, managers of several ongoing spirometry-based health surveillance programs adopted the software. The results from monitoring programs conducted on U.S. workers reported here demonstrate that the information displayed by SPIROLA on longitudinal data precision can assist the healthcare professionals to determine potential sources of excess variability (e.g., a change in spirometry systems and procedural errors) and recognize when an intervention on data quality is needed and subsequently, whether the intervention improved longitudinal data
Fig. (4). SPIROLA Chart. Summary results from automatic screening for individuals at risk of having abnormal lung function or excessive
decline in lung function (Risk List).
3 �7�� �-
�"�����
��-� �2$% 6 %"� ���+�$$�%@��-� �� -=������(����4����6�- �$��� �+-�%�2$-��3 �7�� �-
�A+��� 6��/�+ $�����)�� �- �$��)��B� �����/@�A+��� 6��� �#�@
�A+��� 6����)��)�� �- �$@
����������
�������1�
��
���-�4����6�- �$�B� �����,��)��B� �����,@�)9�B� �����,@��)�?�)9�B� �����,@
�������1��������1������1�
�� �+-�0��- + #�$-��< -=��)��B� �����/
��)��B� �����,
,"����&�2$% 6 %"� ���� �+-�%@
�A+��� 6��� �#�
�)9��B� �����,
��)�B� �����/2/ �A+��� 6�
� �#���)�
B� �����,�)9�B� ��
��,3�- �
B� �����,�A+��� 6�
��)��)�� �- �
��)�?�)9��B� �����,
�A+��� 6����)��)�� �- �$
������
������������������
��������
�������������������
������
������
������
������
������
������
�A -0� $-�� �-�=����� �+-�%�#��- + #�$-��6� "�- �$�6� "�-�
0� $-��"����� ��6��-����/�-�����
��
100 The Open Medical Informatics Journal, 2010, Volume 4 Hnizdo et al.
precision (Fig. 2) and quality (Fig. 3). SPIROLA can also aid in optimizing the performance of individual technicians through the spirometry quality grades analysis (Fig. 3). Although appropriate equipment, trained technicians, knowledgeable professional oversight, and comprehensive procedure manuals are basic components of a quality testing program [28], data precision can vary over time for various reasons and such changes may not be noticeable on individual tests.
The estimate of data precision provided by the software affords additional benefits during the interpretation of longitudinal change for individuals. It facilitates determination of an appropriate limit of longitudinal decline, LLD, a criterion applied by SPIROLA software to maintain longitudinal data precision and detect early (within 8 years) excessive lung function decline. The LLD method increases flexibility to develop stringent quality control and to increase sensitive for detecting long-term excessive decline or acute respiratory effects, under different monitoring conditions [22, 23]. The knowledge of group longitudinal data precision and data quality increases the likelihood of discerning whether an observed change in lung function is due to procedural error or incipient lung disease. However,
workplace or environmental factors may be responsible for increased FEV1 variability by causing respiratory illness.
The user may choose to modify the default parameters on which the longitudinal detection limit LLD is based. The LLD limit can reflect existing data variability. However, if data variability can not be calculated, SPIROLA provides LLDr default based on an annual limit of decline of 10 % and expected normal physiological lung function decline with increasing years. The value of 10% is based on evaluation of data precision in several existing monitoring programs, and assumes relatively good longitudinal data precision (within-person variation of 4%) [16, 17, 22, 23]. Alternatively the user can use the ACOEM fixed limit [14, 15]. When setting the LLDr limit, the user should also consider the severity and implications of potential occupational health effects. For example, when disabling irreversible work-related excessive declines in lung function can occur within short exposure duration, as was observed in popcorn workers, higher sensitivity is preferable to higher specificity [26].
Because COPD is a preventable disease that usually takes many years to develop, early recognition of abnormal pulmonary function decline followed by an effective intervention is important in disease prevention [6].
The
longitudinal assessment over all follow-up years based on
Fig. (5). SPIROLA multiple charts for an individual with less than 8 years of follow-up: longitudinal FEV1, FVC and percent predicted
values plotted against age, and the report summarizing findings. FEV1 is below LLDr from about 35 years of age.
��$. -"% $� ���)���6� "�- �$
�� �� �� �� �� �� �� �� �� �� �
5'���������
��$. -"% $� ��)9��6� "�- �$�� ���
!��
!���
3�-���&��
�)
��+=�$.�����?��
�
���
����
����
����
����
����
5'���������
����������������
������������ � ������������� ��������!"�#$%� ��
� �� ���������� �� ���
&��'������ �� ���
(�������� ����$��''��$�%� �����A�� $��-=��>"� -���&����� $���$%�+"���$-�-��-��2&�+�$& ���%�-=�-��)�C��/�;�-=����-���&�%�+ $����������A+��� 6�
�A�� $��-=���# ����-���>"� -���$%���-��-�-��+�$& ���-=�����" -���2&
&��>"�$-�-��- $.;��$%� $-��6�$- �$�
���������$%�����$-=�
46��� @�������?����;���1�92�����;��)���� �����/�
���������;�� -= $�-=��$���� ���$.���&�����������;��A+��� 6���D������
�)
9���
��
�0234�5�)���
� � '��"#��� �+- �$ 2$% 6 %"� ��6� "�- �$ '��"#��6� "�- �$ 0� $- 3 �7�� �- 2$-��6�$- �$ 8"��- �$$� �� 8"� -��9�$-�� :� #4#- �$� ���- $.
���
����
����
����
����
����
����
��
)����
��
���� �� �� �� �� �� �� �� �� �� �
��$. -"% $� �0��+�$-�0��% +-�%��$%�3�- ���6� "�- �$���
���
���
�
��
��
��
�� �� �� �� �� �� �� �� �� �� �
5'���������
0��+�$-�.�
3�.���� �#����)2��!������?� ��E��)�F������� 3�.���� �#�E�)9F�!������?� ��E�)9F�������
-=�����" -�����+�$& ���%;�+�$� %���&"�-=����6� "�- �$;�����
Spirometry Longitudinal Data Analysis Software The Open Medical Informatics Journal, 2010, Volume 4 101
evaluation that takes into account data variability, as done by SPIROLA, helps to improve the accuracy of recognition of development of respiratory disease. By helping to improve longitudinal data precision, SPIROLA improves the precision of the estimated rate of decline and identification of those with true excessive rate of decline. Furthermore, the Risk List function helps the healthcare provider to identify individuals whose spirometry results may be abnormal and who may need further evaluation; this function is especially useful in occupational settings where a large number of workers undergo spirometry monitoring.
A limitation of our study is that the long-term implications of the application of SPIROLA for disease prevention have not yet been fully evaluated in ongoing monitoring programs. Data input can be a limitation that we plan to overcome by adding to SPIROLA interfaces to allow automatic transfer of spirometry data generated by different spirometers.
CONCLUSION
Application of SPIROLA in an ongoing spirometry monitoring program has helped to identify previously unrecognized increases in longitudinal data variability due to equipment and procedural problems, and to demonstrate that
subsequent data quality interventions resulted in improvement in data precision and in spirometry quality. By organizing and analyzing longitudinal spirometry data, SPIROLA software has helped to improve identification of individuals who have or are at risk of developing lung function abnormalities.
ACKNOWLEDGEMENTS
The authors would like to express appreciation to Diana Freeland for her assistance in the quality control intervention and the Phoenix Fire Department Health Center for their cooperation on the study.
DISCLAIMER
The findings and conclusions in this report are those of the authors and do not necessarily represent the views of the National Institute for Occupational Safety and Health.
REFERENCES
[1] World Health Organization. COPD Burden. Geneva, Switzerland: WHO 2007. http://www.who.int/respiratory/copd/burden/
[2] Mannino DM, Reichert MM, Davis KJ. Lung function decline and outcomes in an adult population. Am J Respir Crit Care Med 2006;
173: 985-90. [3] Beeckman LA, Wang ML, Petsonk EL, Wagner GR. Rapid
declines in FEV1 and subsequent respiratory symptoms, illnesses,
Fig. (6). Results for an individual with more than 8 years of follow-up. The regression lines for FEV1 and FVC are projected to indicate
whether the person is at risk of developing airflow obstruction based on the LLN and 0.01th
percentile.
�0234�5�)���
� � '��"#��� �+- �$ 2$% 6 %"� ��6� "�- �$ '��"#��6� "�- �$ 0� $- 3 �7�� �- 2$-��6�$- �$ 8"��- �$$� �� 8"� -��9�$-�� :� #4#- �$�
��$. -"% $� ���)���6� "�- �$���
����
����
����
����
����
����
��
)����
��
���� �� �� �� �� �� �� �� �� �� �
5'���������
���� �� �� �� �� �� �� �� �� �� �
5'���������
��$. -"% $� �0��+�$-�0��% +-�%��$%�3�- ���6� "�- �$���
���
���
�
��
��
��
�� �� �� �� �� �� �� �� �� �� �
5'���������
0��+�$-�.�
3�.���� �#����)2��!�����?� ��E��)�F������� 3�.���� �#�E�)9F�!������?� ��E�)9F������
������������ � ������������� ��������!"�#$%� ��
� �� ���������� �� ���
&��'������ �� ���
(�������� ����$��''��$�%� ����
46��� @������?����;���1�92����;��������-�������@����?��������1�92���������3�-���&�%�+ $�� ��%�+���� $.��������� -= $�-=��$���� ���$.��&��������������A+��� 6���D������
2&�����-���&���)��%�+ $��D�����?��� ��+�$& ���%�����" -�� $% +�-��A+��� 6����)��%�+ $��
�A�� $��-=���# ����-���>"� -���$%���-��-�-��+�$& ���-=�����" -���2&-=�����" -������+�$& ���%;��+�$� %���&"�-=����6� "�- �$;�����&��>"�$-�-��- $.;��$%� $-��6�$- �$�
�)
9���
��
��$. -"% $� ��)9��6� "�- �$

102 The Open Medical Informatics Journal, 2010, Volume 4 Hnizdo et al.
and mortality in coal miners in the United States. Am J Respir Crit
Care Med 2001; 163: 633-9. [4] Sircar K, Hnizdo E, Petsonk E, Attfield M. Decline in lung
function and mortality: implication for medical monitoring. Occup Environ Med 2007; 64: 461-6.
[5] Anthonisen NR, Connet JE, Enright PL, Manfreda J, and the LHS Research group. Hospitalizations and mortality in the Lung Health
Study. Am J Respir Crit Care Med 2002;166: 333-9. [6] Anthonisen NR, Connett JE, Murray RP. Smoking and lung
function of Lung Health Study participants after 11 years. Am J Respir Crit Care Med 2002; 166: 675-97.
[7] Harber P, Tashkin DP, Simmons M, Crawford L, Hnizdo E, Connett J. Effect of Occupational Exposures on Decline of Lung
Function in Early COPD. Am J Respir Crit Care Med 2007; 176: 994-1000.
[8] Balmes J, Becklake M, Blanc P, et al. American Thoracic Society Statement: Occupational contribution to the burden of airway
disease. Am J Respir Crit Care Med 2003; 167: 787-97. [9] Leigh JP, Romano PS, Schenker MB, Kreiss K. Costs of
occupational COPD and asthma. Chest 2002: 121: 264-72. [10] Hnizdo E, Sullivan PA, Bang KM, Wagner G. Association between
chronic obstructive pulmonary disease and employment by industry and occupation in the US population: A study of data from the
Third National Health and Nutrition Examination Survey. Am J Epidemol 2002; 156: 738-46.
[11] Weinmann S, Vollmer WM, Breen V, et al. COPD and occupational exposures: A case-control study. J Occup Environ
Med 2008; 50: 561-9. [12] Hankinson JL, Wagner GR. Medical screening using periodic
spirometry for detection of chronic lung disease. Occup Med: State Art Rev 1993; 8: 353-61.
[13] American College of Occupational and Environmental Medicine. Spirometry in the occupational setting. J Occup Environ Med 2000;
42: 228-45. [14] ACOEM Position Statement: Evaluating pulmonary function
change over time in the occupational setting. ACOEM Occupational and Environmental Lung Disorder Committee.
Available from: www.acoem.org/guidelines/article.asp?ID=59 [Last accessed: January 05, 2008].
[15] Townsend MC. Evaluating pulmonary function change over time in the occupational setting. ACOEM evidence-based statement. J
Occup Environ Med 2005; 47: 1307-16. [16] Hnizdo E, Yu L, Freyder L, Lefante J, Glindmeyer HW. Precision
of longitudinal lung function measurements—monitoring and interpretation. Occup Environ Med 2005; 62: 695-701.
[17] Wang ML, Avashia BH, Petsonk LE. Interpreting periodic lung function tests in individuals. The relationship between 1- to 5-year
and long-term FEV1 changes. Chest 2006; 130: 493-9.
[18] Spirometry Longitudinal Data Analysis (SPIROLA) software.
Available from: http://www.cdc.gov/niosh/topics/spirometry/spiro la.html [Last accessed April, 2010].
[19] Sherrill DL, Lebowitz MD, Knudson RJ, Burrows B. Continuous longitudinal regression equations for pulmonary function measures.
Eur Respir J 1992; 5: 452-62. [20] Pistelli F, Bottai M, Carrozzi L, et al. Reference equations for
spirometry from a general population sample in central Italy. Respir Med 2007; 101: 814-25.
[21] Schlesselman JJ. Planning a longitudinal study: II. Frequency of measurement and study duration. J Chron Dis 1973; 26: 553-8.
[22] Hnizdo E, Sircar K, Glindmeyer HW, Petsonk EL. Longitudinal limits of normal decline in lung function in an individual. J Occup
Environ Med 2006; 48: 625-34. [23] Hnizdo E, Yan T, Sircar K, Harber P, Fleming J, Glindmeyer HW.
Limits of longitudinal decline for the interpretation of annual changes in FEV1 in individuals. Occup Environ Med 2007; 64:
701-7. [24] Burrows B, Lebowitz MD, Camilli AE, Knudson RJ. Longitudinal
changes in forced expiratory volume in one second in adults. Am Rev Respir Dis 1986; 133: 974-80.
[25] American Thoracic Society. Lung function testing: selection of reference values and interpretative strategies. Am Rev Resp Dis
1991; 144: 1202-18. [26] Akpinar-Elci M, Travis WD, Lynch DA, Kreiss. Bronchiolitis
obliterans syndrome in popcorn production plant workers. Eur Respir J 2004; 24: 298-302.
[27] Becklake MR, White N. Sources of variation in spirometric measurements. Identifying the signal and dealing with the noise.
Occup Med: State Art Rev 1993; 8: 241-61. [28] Miller MR, Hankinson J, Brusasco V, et al. Standardization of
spirometry. Standardization of lung function testing. Eur Respir J 2005; 26: 319-38.
[29] Enright PL, Johnson LR, Connett JE, Voelker H, Buist AS. Spirometry in the Lung Heath Study. 1. Methods and quality
control. Am Rev Respir Dis 1991; 143: 1215-23. [30] Hankinson JL, Odencrantz JR, Fedan KB. Spirometric reference
values from a sample of the general US population. Am J Respir Crit Care Med 1999; 159: 179-87.
[31] Qaseem A, Snow V, Shekelle P, et al. Diagnosis and management of stable chronic obstructive pulmonary disease: a clinical practice
guideline from American College of Physicians. Ann Intern Med 2007; 147: 633-8.
[32] NIOSH spirometry training course. Available from: http://www.cdc.gov/niosh/topics/spirometry
Received: September 25, 2009 Revised: March 10, 2010 Accepted: March 19, 2010
© Hnizdo et al.; Licensee Bentham Open.
This is an open access article licensed under the terms of the Creative Commons Attribution Non-Commercial License (http://creativecommons.org/licenses/by-nc
/3.0/) which permits unrestricted, non-commercial use, distribution and reproduction in any medium, provided the work is properly cited.