
Induction of Caveolin during Adipogenesis and Association of
Upload
truongtuyenCategory
view
216download
0
1
Ontogeny and nutritional control of adipogenesis in zebrafish (Danio rerio) Edward J. Flynn III*, Chad M. Trent*, and John F. Rawls
Department of Cell and Molecular Physiology, University of North Carolina at Chapel Hill, Chapel Hill, NC 27599-7545, USA * These authors contributed equally to this work Corresponding author:
John F. Rawls, Department of Cell and Molecular Physiology, University of North Carolina at Chapel Hill, 111 Mason Farm Rd., Chapel Hill, NC 27599-7545, USA Tel: (919) 966-8340 Fax: (919) 966-6927 Email: [email protected] Running title:
Ontogeny and nutritional control of zebrafish adipogenesis
Abbreviations:
CHT, caudal hematopoietic tissue; dpf, days post-fertilization; Fabp, Fatty acid binding protein; MSC, mesenchymal stem cell; ORO, oil red O; Pparg, Peroxisome proliferator-activated
receptor gamma; SL, standard length; WISH, wholemount in situ hybridization
by guest, on July 6, 2018w
ww
.jlr.orgD
ownloaded from

2
ABSTRACT The global obesity epidemic demands an improved understanding of the developmental and environmental factors regulating fat storage. Adipocytes serve as major sites of fat storage and as regulators of energy balance and inflammation. The optical transparency of developing zebrafish provides new opportunities to investigate mechanisms governing adipocyte biology, however zebrafish adipocytes remain uncharacterized. We have developed methods for visualizing zebrafish adipocytes in vivo by labeling neutral lipid droplets with Nile Red. Our results establish that neutral lipid droplets first accumulate in visceral adipocytes during larval stages, and increase in number and distribution as zebrafish grow. We show that the cellular anatomy of zebrafish adipocytes is similar to mammalian white adipocytes, and identify peroxisome-proliferator activated receptor gamma (pparg) and fatty acid-binding protein 11a
(fabp11a) as markers of the zebrafish adipocyte lineage. By monitoring adipocyte development prior to neutral lipid deposition, we find that the first visceral preadipocytes appear in association with the pancreas shortly after initiation of exogenous nutrition. Zebrafish reared in the absence of food fail to form visceral preadipocytes, indicating that exogenous nutrition is required for adipocyte development. These results reveal homologies between zebrafish and mammalian adipocytes, and establish the zebrafish as a new model for adipocyte research. SUPPLEMENTARY KEYWORDS
preadipocyte, adipocyte, Nile Red, lipid droplet, in vivo imaging, nutrition, diet, obesity, pancreas, fish
by guest, on July 6, 2018w
ww
.jlr.orgD
ownloaded from

3
INTRODUCTION
The worldwide epidemic of obesity and associated complications such as type II diabetes, hypertension, and cardiovascular disease, has resulted in the designation of obesity as a major public health challenge of our time (1). Obesity is a disorder of energy imbalance in which an excess of energy intake over expenditure leads to increased storage of energy as neutral lipid (i.e., triacylglycerol) in adipose tissues. Storing excess energy as neutral lipid is an evolutionarily-conserved characteristic common to virtually all animals, providing a valuable energy source during periods of nutrient scarcity (2, 3). Vertebrates are capable of storing neutral lipid in several tissues with adipose tissue serving as the primary depot. The principal cellular component of adipose tissue is the adipocyte, a cell type specialized for storing fat in cytoplasmic neutral lipid droplets and endocrine control of energy balance (4, 5).
Current knowledge of adipocyte development and physiology is derived from research using mammalian model systems. Mammals develop two general types of adipose tissues: white adipose tissue (WAT) and brown adipose tissue (BAT). WAT is more abundant and serves primarily as a site of energy storage and mobilization, while BAT primarily functions in energy expenditure in the form of thermogenesis. WAT and BAT form in distinct anatomic depots during mammalian development, with different depots displaying distinctive patterns of gene expression, endocrine sensitivity, and association with metabolic diseases (2). Adipocytes within WAT (white adipocytes) and BAT (brown adipocytes) both contain cytoplasmic neutral lipid droplets, however mature white adipocytes typically contain a single large droplet (unilocular) while brown adipocytes contain multiple smaller lipid droplets. Previous studies have indicated that adipocytes develop from multipotent mesenchymal stem cells (MSCs). MSCs are classically considered to be derived from the mesoderm, although recent studies suggest that MSCs have additional developmental origins such as the neural crest or neuroepithelium (6, 7). In addition to producing adipocytes during development, MSCs are thought to populate distinct anatomical sites in adult animals, including bone marrow (8) and adipose tissue stroma and vasculature (9-11), where they can produce new adipocytes and other cell types. Multipotent adipogenic precursor cells have also been found in circulating blood (12), suggesting that tissue-associated MSCs or their progeny might colonize and differentiate in distant anatomical niches. Mammalian MSCs can produce a bipotential early adipocyte precursor (adipoblast) that is capable of differentiating into committed white or brown preadipocytes. Upon appropriate stimulation, these preadipocytes can terminally differentiate into mature adipocytes, as indicated by accumulation of cytoplasmic neutral lipid droplets. However, the intermediary stages of in vivo differentiation between the MSC and the mature adipocyte are not fully resolved.
Mammalian adipocyte biology is strongly influenced by environmental factors such as the nutrient supply. Mature adipocytes accumulate and mobilize neutral lipid as a function of nutrient availability, and nutrient availability during the early postnatal period can also exert a profound influence on the development of adipose tissues. For example, nutrient deprivation during early postnatal stages can lead to reduced fat mass and adipocyte cell number (13), while overnutrition during similar stages can result in increased number of both adipocytes and preadipocytes (14). Adipocyte number is specified during childhood and adolescence and then remains constant during adulthood (15), indicating that early environmental influences on adipogenesis during development can have important lifelong impacts on adiposity. However, the molecular and cellular mechanisms underlying nutritional control of adipogenesis are not well understood.
Mammalian models have provided many important insights into adipocyte biology, however analysis of mammalian adipogenesis has largely been performed using in vitro cell culture platforms that have the potential to deviate significantly from in vivo adipogenesis programs (16). Furthermore, in vivo genetic analyses of adipogenesis in mammals have largely been
by guest, on July 6, 2018w
ww
.jlr.orgD
ownloaded from

4
limited to “reverse” genetic approaches. As a result, our understanding of the mechanisms underlying adipocyte development and physiology remains incomplete, especially with respect to early developmental stages of this cell lineage. The gaps in our knowledge of adipogenesis are exemplified by the fact that the developmental origins of MSCs and their adipocyte progeny have not been fully resolved. Similarly, the genetic and cellular mechanisms controlling development of MSCs and adipocytes in vivo remain largely unknown (2, 17). These important gaps in our knowledge can be attributed in part to the inherent limitations and challenges of available mammalian model systems.
The zebrafish (Danio rerio) provides new opportunities to study adipogenesis through a combination of several unique attributes. First, zebrafish are optically transparent from the time of external fertilization through early adulthood, permitting in vivo observation of developmental and physiological processes. Second, zebrafish development occurs rapidly, with larvae hatching from their protective chorions at approximately 3 days post-fertilization (dpf), and feeding commencing at approximately 5 dpf. Zebrafish larvae enter metamorphosis beginning approximately 14 dpf, resulting in an adult body plan by 28 dpf. Third, zebrafish are amenable to high-throughput “forward” genetic and chemical screens (18), facilitating the identification of new genes and molecules that regulate adipogenesis and energy balance. Fourth, previous studies by our group and others have indicated that lipid metabolism pathways are conserved between fish and mammals (3, 19-23). The existence of adipocytes in adult zebrafish has been documented (24, 25), however zebrafish adipocyte development and physiology before adult stages has not been studied. As a consequence, the properties of zebrafish adipocytes have not been described, and tools for their in vivo observation and analysis have not been developed.
In contrast to zebrafish, the properties of adult adipose tissues in other aquacultured teleost fishes have been investigated. Like their mammalian counterparts, adult fish adipocytes store neutral lipid in the form of triacylglycerol and these stores are mobilized during periods of nutrient deprivation (26-28). Fat deposition in fish is also sensitive to nutrient availability (29, 30), and the enzymatic machinery responsible for fat deposition and mobilization in fish appears to be similar to that found in mammals (27). Cultured fish adipocytes express genes that are homologous to mammalian adipocyte markers (e.g., Peroxisome proliferator-activated receptor
gamma, CCAAT/enhancer binding protein alpha, Lipoprotein lipase, and Leptin) (31-34), and are also responsive to many of the same endocrine signals as mammalian adipocytes (e.g., insulin and glucagon) (33, 35). Recent studies have established methods for isolating stromovascular cells and preadipocytes from visceral adipose tissues in adult fish, and have shown that these cells can differentiate into adipocytes under appropriate culture conditions (32, 33). Taken together, these studies have provided important insights into the biology of adult fish adipocytes, and revealed extensive molecular and physiological homology between adult adipocytes in fish and mammals. However, previous analysis of fish adipocytes, like their mammalian counterparts, has focused on adult stages. Consequently, we understand very little of the developmental origins of fish adipocytes, and the environmental factors that regulate their formation.
In this study, we define methods to visualize zebrafish adipocytes in vivo, use these methods to describe the development of the zebrafish adipocyte lineage, and define a novel role for exogenous nutrition in the early development of zebrafish adipocytes. Our results establish the zebrafish as a new model organism for studying adipocyte development and physiology. MATERIALS AND METHODS
Animals and experimental conditions: All zebrafish experiments were conducted in conformity with the Public Health Service Policy on Humane Care and Use of Laboratory Animals using protocols approved by the Institutional Animal Care and Use Committee of the University of
by guest, on July 6, 2018w
ww
.jlr.orgD
ownloaded from

5
North Carolina at Chapel Hill. Wild-type zebrafish (TL strain) were raised under a 14 h light/10 h
dark cycle at a constant temperature of 28.0 ± 0.5oC using standard protocols (36). Zebrafish
embryos were raised in 100mm-diameter Petri dishes through 5 dpf at a maximum density of 40 embryos per 20 mL egg water. At 5 dpf, larvae were transferred to static 2 L tanks containing 1 L fresh egg water and fed to satiety twice per day with a 3:2 mixture of Active Spheres - Golden Pearls (Brine Shrimp Direct, Ogden, UT) and spirulina powder (Aquatic Eco-Systems, Apopka, FL, cat. SP1). At 10 dpf, the diet was changed to a 3:2 mixture of Rotifer Size I - Golden Pearls and spirulina powder, and tanks were placed on a slow drip of system water (pH 6.8,
conductivity 850 μS) on a recirculating zebrafish aquaculture system (Marine Biotech, Beverly,
MA). At the onset of metamorphosis at 14 dpf, tanks were moved onto flowing system water, and feedings were supplemented with a small amount of live artemia (Aquafauna Bio-Marine) and gradually weaned onto an exclusive live artemia diet over the course of several days. In addition to live artemia, adult zebrafish (>28 dpf) were fed a flake food mixture of 5 parts TetraMin flakes (Aquatic Eco-Systems, cat. 16623), 2 parts AquaTox flakes (Aquatic Eco-Systems, cat. AX5), 1 part Spirulina flakes (Aquatic Eco-Systems, cat. ZSF5), 1 part freeze-dried brine shrimp (Aquatic Eco-Systems, cat. SB113), 1 part Cyclopeeze (Argent Laboratories, Redmond, WA, cat. F-CYCL-FD30-CS). In some experiments, zebrafish were maintained in
100 μM phenylthiourea (PTU, Lancaster Synthesis Inc.) to inhibit melanin synthesis.
For starvation and refeeding experiments, zebrafish were maintained in static egg water to avoid introduction of digestible material from the recirculating aquaculture system. Animals used in these experiments were exclusively fed either a 3:2 mixture of Active Spheres - Golden Pearls and spirulina powder (for fish 5-10 dpf), or a 3:2 mixture of Rotifer Size I - Golden Pearls and spirulina powder (for fish >10 dpf).
In vivo labeling and imaging of zebrafish adipocytes: Nile Red (Invitrogen, cat. N-1142) was dissolved in acetone at 1.25 mg/mL, and stored in the dark at -20oC. Vessels containing live unanesthetized zebrafish were supplemented with Nile Red to a final working concentration of
0.5 μg/mL egg water, and then placed in the dark for 30 minutes. Zebrafish were then
anesthetized in Tricaine (MS-222; Sigma), mounted in 3% methylcellulose, and imaged using a Leica MZ 16F fluorescence stereomicroscope equipped with a GFP longpass-emission filter set (HQ480/40x, HQ510LP), a RGB liquid crystal color filter module, and a Retiga 2000R Fast 1394 cooled digital monochrome camera (QImaging, Tucson, AZ). Oil Red O staining (22) and staging of zebrafish embryos and larvae (37) was performed as previously described. Standard length (SL; the distance between the tip of the snout and the caudal peduncle) was measured using an eyepiece reticle, and used to provide a robust common metric for larval and adult zebrafish staging (David Parichy, personal communication). SL is reported as mean ± 95% confidence interval. Toluidine blue staining and electron microscopy: Zebrafish were euthanized by prolonged exposure to Tricaine, then fixed by immersion in 4% formaldehyde/2.5% glutaraldehyde in 0.1M sodium cacodylate buffer + 0.05% CaCl2 (pH 7.4) overnight to several days at 4˚C. The samples were post-fixed for 1 hour in potassium ferrocyanide-reduced osmium (38), dehydrated through a graded series of ethanol washes and embedded in Spurr’s epoxy resin (Polysciences, Warrington, PA). Transverse 1 �m cross-sections were cut in the region of the gut, stained with 1% toluidine blue/1% sodium borate and examined by light microscopy to locate representative adipocytes. Ultrathin sections were cut with a diamond knife (70-80 nm thickness), mounted on 200 mesh copper grids and stained with 4% aqueous uranyl acetate for 15 minutes followed by Reynolds’ lead citrate for 8 minutes (39). The sections were observed using a LEO EM-910 transmission electron microscope (LEO Electron Microscopy, Inc., Thornwood, NY),
by guest, on July 6, 2018w
ww
.jlr.orgD
ownloaded from

6
accelerating voltage of 80 kV. Digital images were taken using a Gatan Orius SC 1000 CCD Camera and DigitalMicrograph 3.11.0 software (Gatan, Inc., Pleasanton, CA). Measurement of total lipid: Total lipid in whole zebrafish was measured using the Folch method (40). Briefly, individual zebrafish were euthanized by overexposure to Tricaine, weighed to
determine total mass as wet weight, snap frozen and homogenized in 500 μl 2:1
chloroform:methanol, and then washed with 100 μl 0.9% NaCl. Homogenates were vortexed
and centrifuged at 2000 x g for 30 min, and then the lower layer was extracted, dried to completion on pre-weighed aluminum micro-weighboats, and weighed to measure total lipid mass per fish. Mass measurements are reported as mean ± sd. Wholemount in situ hybridization: Partial coding sequences of zebrafish pparg (Entrez Gene ID 557037), fabp11a (Entrez Gene ID 447944) and fabp11b (Entrez Gene ID 553579) genes were amplified by PCR using first-strand cDNA template derived from 6 dpf zebrafish larvae. For pparg, we PCR amplified a partial cDNA using forward primer 5’-GAAGATCCGTCTTCATCCTCAC-3’ and reverse primer 5’-GATCTGTCCGTAGGAGATCAGG-3’. The resulting PCR fragment was cloned into pCR2.1-TOPO (Invitrogen), linearized using HindIII, and transcribed using T7 RNA polymerase (Epicentre Biotechnologies) to generate DIG-labeled pparg antisense riboprobe. A partial fabp11a cDNA was amplified using forward primer 5’-GATCAAATCTCAATTTACAGCTGTTG-3’ and reverse primer 5’-TAATACGACTCACTATAGGG-TTCAAAGCACCATAAAGACTGATAAT-3’, and a partial fabp11b cDNA was amplified using forward primer 5’-AACACTTTGTGCTATTATCTGTC-3’ and reverse primer 5’-TAATACGACTCACTATAGGG-CCATCCGCAAGGCTCATAG-3’ (underlined sequences encode a T7 RNA polymerase promoter). PCR products were purified using Montage PCR Centrifugation Filters (Millipore), and used as template for in vitro transcription reactions using T7 RNA polymerase to generate DIG-labeled fabp11a or fabp11b antisense riboprobe. Sense riboprobes were used as negative controls in all experiments. In situ hybridization was performed as described (41), with the following modifications: (i) riboprobes were not hydrolyzed prior to hybridization, (ii) antibody blocking solution consisted of 5% heat-inactivated goat serum and 2 mg/ml BSA in PBS + 0.2% Tween-20, and (iii) antibody detection staining was performed using BM Purple (Roche). Wholemount images of stained fish were
captured using a Leica MZ 16F stereomicroscope, and 20 μm-thick cryosections were imaged
using a Leica DM5500 microscope. RESULTS
In vivo microscopy reveals spatial and temporal patterns of zebrafish adipogenesis
The optical transparency of the developing zebrafish provides new opportunities to monitor adipocyte ontogeny and physiology in a living vertebrate. However, methods for visualizing zebrafish adipocytes in vivo have not been developed. The defining characteristic of the adipocyte is the ability to store energy as neutral lipid in large cytoplasmic droplets. The fluorescent lipid probe Nile Red is quenched in an aqueous environment, and emits fluorescence upon excitation when incorporated into hydrophobic lipid environments. Importantly, the wavelengths of Nile Red fluorescence excitation and emission maxima are reduced (blue shift) when the probe is incorporated into neutral lipid (e.g., triacylglycerol) compared to polar lipid (e.g., phospholipid bilayers) (42). This property of Nile Red fluorescence permits the unambiguous detection of neutral lipid deposits within living cells and animals. We therefore used Nile Red to monitor adipocyte neutral lipid localization in live zebrafish as a function of developmental stage.
Zebrafish are born with a large yolk mass that serves as their principal nutrient supply through the onset of exogenous feeding that begins approximately 5 dpf (3.6 ± 0.1 mm SL).
by guest, on July 6, 2018w
ww
.jlr.orgD
ownloaded from

7
Consistent with previous reports, Nile Red staining of 5 dpf zebrafish revealed that the yolk mass is the major depot of neutral lipid in zebrafish embryos (Fig. 1A, B) (23). After the completion of yolk absorption at approximately 7 dpf, zebrafish were devoid of salient neutral lipid droplets until approximately 8 dpf (4.3 ± 0.1 mm SL) when we first observed small neutral lipid droplets in the right visceral cavity (Figs. 1C, D and 6K). The right-sided visceral position of these initial adipocytes coincides with the stereotypic position of the pancreas (43), suggesting that the first adipocytes form in close proximity to the pancreas. By 15 dpf (5.3 ± 0.1 mm SL), the number and size of neutral lipid droplets had increased, and their anatomic distribution had expanded (Fig. 1E, F). Upon completion of larval-adult metamorphosis at 28 dpf (9.6 ± 0.4 mm SL), the visceral cavity continued to contain the largest neutral lipid depot, with smaller depots appearing in pectoral fin plate, jaw, spinal column, subcutaneous, pericardial and periorbital positions (Fig. 3A). In older adults, adipose depots were also observed in subcutaneous locations along the dorsal and ventral midline and near the base of other fins (data not shown). We occasionally observed smaller neutral lipid droplets in the liver (data not shown) and intestinal epithelium (Fig. 3D), suggesting that Nile Red could also be used to monitor neutral lipid droplets in these tissues.
To confirm that the structures stained by Nile Red contain neutral lipid, we compared the in
vivo Nile Red staining pattern in individual 15 dpf zebrafish to that of Oil Red O, a terminal histochemical method for staining neutral lipid commonly used in zebrafish and other animals (Fig. 1G-I) (22, 32, 44). Zebrafish adipocyte lipid droplets that stained with Nile Red also stained with ORO, confirming that zebrafish adipocyte lipid droplets stained by Nile Red contain neutral lipid (Fig. 1G-I). Cellular anatomy of zebrafish adipocytes is conserved with mammalian white adipocytes
To define the cellular anatomy of zebrafish adipocytes and disclose potential homologies to mammalian adipocytes, we performed histological staining and transmission electron microscopy on visceral adipocytes in 28 dpf zebrafish. Toluidine blue stained sections confirmed that lipid droplets contained within zebrafish visceral adipocytes can achieve a wide
range of sizes, some exceeding 100 μm in diameter (Fig. 2A). Electron microscopy revealed
that some adipocytes contained multiple small lipid droplets (Fig. 2B), a hallmark of early stage terminal differentiation in mammalian white adipocytes (45). Congruently, mature adipocytes were found to contain a single large lipid droplet with an eccentric nucleus (Fig. 2D), similar to mature mammalian white adipocytes (45). Ultrastructural analysis revealed that zebrafish adipocytes, like their mammalian counterparts, are metabolically active as evidenced by enrichment in filamentous mitochondria and caveolae (Fig. 2B-E) (45). Adjacent adipocytes often formed direct intercellular contacts, potentially permitting cell-cell communication via gap junctions (Fig. 2E) (46). Zebrafish adipocytes were often found in close proximity to blood capillaries, potentially providing immediate access to lipoprotein-derived fatty acids and other factors available in the serum (Fig. 2B). Taken together, these data establish that the cellular anatomy of zebrafish visceral adipocytes is conserved with mammalian white adipocytes.
Zebrafish fat depots are mobilized in response to starvation, and deposited in response
to refeeding The principal function of adipocytes is to store energy as fat that can be used during periods
of nutrient scarcity. We therefore tested whether zebrafish adipocytes are capable of mobilizing their neutral lipid depots in response to starvation. Nile Red staining revealed that 28 dpf zebrafish raised on a normal diet developed adipose fat depots in multiple anatomical locations (Fig. 3A). To test the ability of zebrafish to mobilize its fat depots, we starved individual 28 dpf zebrafish and monitored fat depots longitudinally using Nile Red (Fig. 3). After 4 days of starvation, all fat depots were reduced in size (Fig. 3B). Reduction of the major depots in the viscera and pectoral fin plate appeared to be slower than other depots, however we speculate
by guest, on July 6, 2018w
ww
.jlr.orgD
ownloaded from

8
that this is due to the larger initial size of those major depots. Nile Red imaging of 35 dpf zebrafish starved for 7 days revealed a complete depletion of all fat stores (Fig. 3C). The depletion of fat depots during 7 days of starvation was accompanied by a 67% reduction in the total lipid mass in individual zebrafish (P<0.0001; Fig. 3F), indicating that the mobilized neutral lipid was rapidly metabolized. In addition to lipid depletion, starvation for 7 days caused a 58%
reduction in body mass (12.6 ± 2.9 mg in fed 28 dpf fish vs. 5.3 ± 2.3 mg in 35 dpf fish starved 7
days; P<0.001) and a 19% reduction in standard length due to kyphosis (9.5 ± 0.4 mm SL in fed
28 dpf fish vs. 7.7 ± 1.2 mm SL in 35 dpf fish starved 7 days; P<0.005). These reductions in
body mass, length, and lipid content in 35 dpf zebrafish starved for 7 days were not accompanied by appreciable increases in mortality or lethargy. These large reductions in lipid content and body size in starved zebrafish is similar in magnitude to starvation-induced reductions previously observed in other teleost fishes (26, 35).
To test the ability of zebrafish adipocytes to deposit fat in response to refeeding, 35 dpf zebrafish that had been starved for 7 days were returned to a normal diet and monitored using Nile Red. After 1 day of feeding, Nile Red stained the intestinal epithelium, presumably labeling new lipid droplets derived from the absorbed dietary lipid (Fig. 3D). Within 4 days after feeding was restored, neutral lipid was apparent in the same anatomical depots that contained fat before nutrient deprivation (Fig. 3E). This result suggests that starvation does not significantly alter the distribution of fat depots, and that adipose depots can be re-utilized upon refeeding. Fat deposition 4 days after refeeding was accompanied by a 172% increase in total lipid mass in individual zebrafish (P<0.001 vs. starved; Fig. 3F), confirming the Nile Red staining results. In addition to lipid accumulation, refeeding for 4 days resulted in a 198% increase in body mass (15.9 ± 2.3 mg; P<0.001 vs. starved) and a 26% increase in standard length (9.7 ± 0.7 mm SL;
P<0.001 vs. starved). These results demonstrate that refed fish can quickly recover lipid content, body mass and SL equivalent to fish fed constantly. Taken together, these results show that zebrafish adipocytes are able to mobilize their fat stores during periods of nutrient scarcity, and are able to rapidly deposit fat upon restoration of an exogenous nutrient supply. Zebrafish fabp11a and pparg are expressed by zebrafish adipocytes
Nile Red is a useful vital marker of neutral lipid droplets in terminally differentiated zebrafish adipocytes, however it does not permit visualization of the adipocyte lineage prior to neutral lipid deposition. We therefore sought to identify additional molecular markers of the zebrafish adipocyte lineage. Previous studies in mammalian models have identified genes that are expressed by preadipocytes and differentiated adipocytes including Peroxisome proliferator-
activated receptor gamma (Pparg), a nuclear receptor that controls transcription of genes involved in adipocyte development and lipid metabolism (16, 47-49). The zebrafish genome encodes a single ortholog of mammalian Pparg (pparg) (50), and previous immunohistochemical analysis in adult zebrafish has suggested that Pparg protein is present in adipocytes, intestinal epithelium, and other tissues (24). To determine whether pparg is expressed by adipocytes during earlier stages of zebrafish development, we used Nile Red vital staining to document the location of adipocytes containing lipid droplets in live 15 dpf zebrafish, and then processed the same animals for wholemount in situ hybridization (WISH) using a riboprobe directed against zebrafish pparg mRNA. Zebrafish pparg mRNA was present in visceral cells that also stained with Nile Red, demonstrating that pparg is expressed in terminally differentiated adipocytes as early as 15 dpf (Fig. 4A, B). Furthermore, transverse cryosections revealed that these adipocytes were located within the pancreas (Fig. 4C). In contrast, we did not detect pparg expression in any visceral cells lacking neutral lipid droplets (Fig. 4A, B). These results indicate that pparg is not robustly expressed in adipocyte precursors, however it remains possible that they express pparg at levels below the sensitivity of our assay. In accord with previous reports, we also observed pparg expression in the
by guest, on July 6, 2018w
ww
.jlr.orgD
ownloaded from

9
intestinal epithelium (Fig. 4B,C)(24, 51). Therefore, our results reveal that pparg is a marker of terminally-differentiated zebrafish adipocytes during initial stages of zebrafish adipogenesis.
Fatty acid binding protein 4 (Fabp4, also called aP2 and A-FABP) is a lipid chaperone that serves multiple roles in lipid transport and metabolism, and is a marker of the mammalian adipocyte lineage (52). Fabp4 is expressed by mammalian preadipocytes and adipocytes both in vivo and in vitro (16, 53), as well as in macrophages (54) and dendritic cells (55). The zebrafish genome encodes two homologs of mammalian Fabp4, fabp11a and fabp11b. Recent phylogenetic analyses revealed that these two paralogous zebrafish genes are homologous to members of a subfamily of mammalian fatty acid binding proteins that includes Fabp4, Fabp5, Fabp8, and Fabp9 (56, 57). These data suggest that the last common ancestor of zebrafish and mammals possessed a single Fabp gene that was duplicated once in the zebrafish lineage producing fabp11a and fabp11b, and duplicated multiple times in the mammalian lineage producing Fabp4, Fabp5, Fabp8, and Fabp9 (57). Although mammalian Fabp4 and Fabp5 are expressed by adipocytes (16, 53, 58), these genes as well as Fabp8 and Fabp9 are also expressed in other cell lineages (52). Previous expression pattern analysis of zebrafish fabp11a and fabp11b have been limited to embryonic and early larval stages (56, 57), and it remained unknown whether the zebrafish fabp11a and fabp11b genes are expressed within the adipocyte lineage. Zebrafish stained with Nile Red at 15 dpf were processed for WISH using a riboprobe directed against fabp11a or fabp11b mRNA. Colocalization of fabp11a transcript in differentiated adipocytes identified by Nile Red staining established that fabp11a is expressed by zebrafish adipocytes (Fig. 4D,E). Transverse sections revealed that these fabp11a-expressing cells are located within the pancreas (Fig. 4F), similar to the location of pparg-expressing adipocytes in age-matched animals (Fig. 4C). We also detected abundant fabp11a transcript in distinct cells that lacked neutral lipid and were located near mature adipocytes (Fig. 4D,E). Based on their anatomic location within the pancreas (Fig. 4F) and lack of salient neutral lipid droplets, we speculate that these fabp11a-expressing cells in the pancreas are adipocyte precursors (hereafter referred to as preadipocytes). Taken together, our data identify fabp11a as a marker of juvenile zebrafish adipocytes and possibly also their preadipocyte precursors.
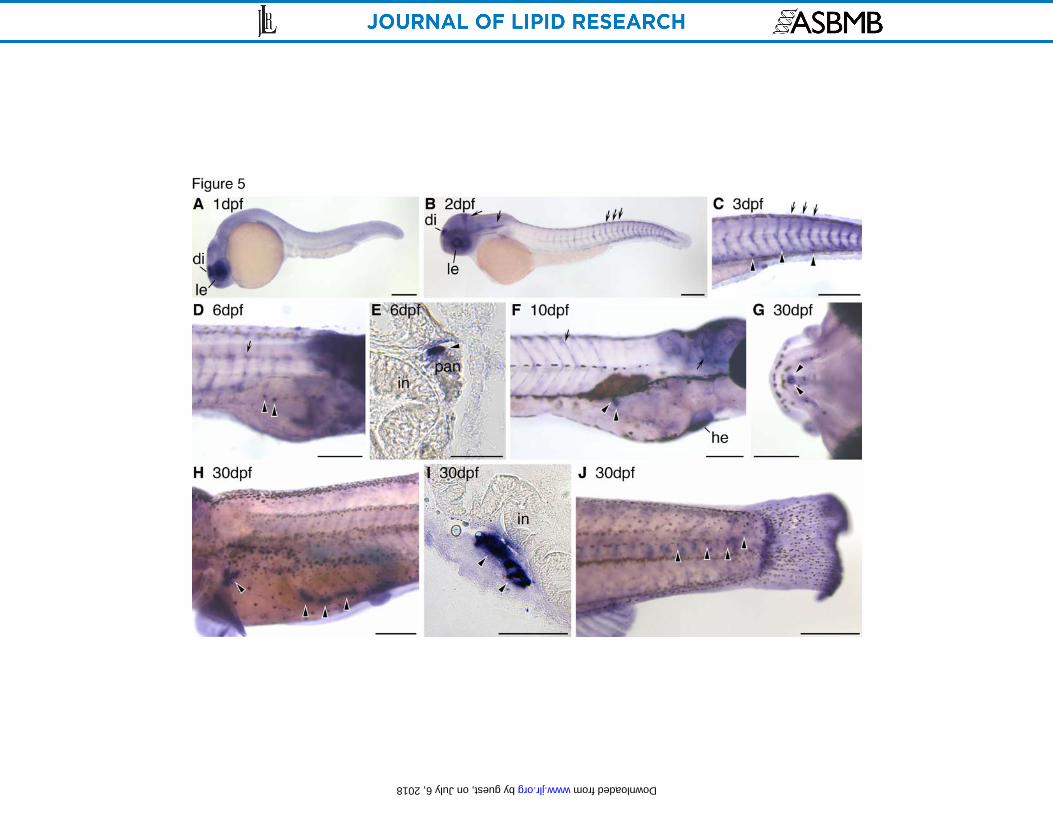
In order to determine if fabp11b is also expressed in the adipocyte lineage, we performed colocalization analysis between Nile Red staining and fabp11b expression. At 15dpf, no colocalization between Nile Red and fabp11b was observed (Fig. 4G, H). Moreover, we did not detect fabp11b expression in any cells resembling adipocytes or preadipocytes from 1-16 dpf (data not shown). Consistent with previous reports, we detected fabp11b expression in retina during embryonic and early larval stages (57), and also observed a novel fabp11b expression domain in the gills beginning at 15 dpf (data not shown). These results indicate that zebrafish fabp11b is not expressed by the adipocyte lineage. To identify potential developmental origins of the adipocyte lineage, we monitored fabp11a expression in zebrafish as a function of developmental stage using WISH. Consistent with previous reports, we observed fabp11a expression in the lens and diencephalon at 1 dpf (Fig. 5A) and in blood vessels by 2 dpf (Fig. 5B) (56). As early as 3 dpf, robust fabp11a expression was also detected in individual cells within the caudal hematopoietic tissue (CHT; Fig. 5C), the site of hematopoiesis at this developmental stage (59). Individual cells expressing fabp11a were observed in association with the pancreas as early as 6 dpf (Fig. 5D,E). Based on the expression of fabp11a and position within the pancreas prior to the appearance of the first terminally differentiated adipocytes in this location by 8 dpf, we infer that these cells are preadipocytes. Cells in this location continue to express fabp11a through 10 dpf (5.1 ± 0.2 mm SL; Fig. 5H) and the onset of neutral lipid deposition (Fig. 1D). These results support the notion that fabp11a is expressed by preadipocytes as well as differentiated adipocytes in larval stages of zebrafish development (Figs. 4, 5). Different mammalian adipose depots can display distinct patterns of gene expression (2), therefore we sought to determine if adipose depots in addition to the initial visceral adipose
by guest, on July 6, 2018w
ww
.jlr.orgD
ownloaded from

10
depot express fabp11a. We therefore assessed fabp11a mRNA expression by WISH in young adult zebrafish at 28 dpf when adipose depots have been established in the viscera, pectoral fin plate, jaw, and spinal column (Fig. 3A). Our in situ hybridization analysis revealed fabp11a expression in distinct cells in all these anatomical locations (Fig. 5G-J), suggesting that fabp11a continues to label adipocytes in major adipose depots into adult stages. Zebrafish adipogenesis requires exogenous nutrition
Nutrient availability during the early postnatal stages of mammalian ontogeny can exert a strong influence on adipocyte development (13, 14). To determine if availability of exogenous nutrition influences zebrafish adipogenesis, we monitored adipogenesis in zebrafish fed normally beginning at 5 dpf (fed) and also zebrafish raised in the absence of an exogenous nutrient supply (starved). Zebrafish fed normally formed adipocyte neutral lipid droplets by 8 dpf as determined by Nile Red fluorescence (Fig. 1). In contrast, starved zebrafish did not form adipocyte neutral lipid droplets through 15 dpf (data not shown), indicating that an exogenous nutrient supply is required for the formation of adipocyte neutral lipid droplets.
To determine the stage of zebrafish adipocyte development at which the nutrient supply is required, we examined expression of the preadipocyte/adipocyte marker fabp11a in fed and starved zebrafish using WISH. By 8 dpf, fed zebrafish formed fabp11a-positive preadipocytes and adipocytes in association with the pancreas (Fig. 6A, B; 4.3 ± 0.1 mm SL). In contrast, zebrafish starved through 8 dpf (Fig. 6D, E; 3.7 ± 0.1 mm SL) or 10 dpf (data not shown; 3.7 ± 0.1 mm SL) did not develop any fabp11a-expressing cells in the pancreas, suggesting that exogenous nutrition is required for the normal development of visceral preadipocytes. Interestingly, zebrafish starved through 8 dpf did possess supernumerary fabp11a-expressing cells in the CHT and the heart (Fig. 6F, I, J), regions typically devoid of fabp11a-expressing cells in age-matched fed animals (Fig. 6C, G, H). To determine if the effect of starvation on adipocyte development is reversible, we began feeding starved zebrafish at 8 dpf or 10 dpf and monitored formation of adipocyte lipid droplets using Nile Red (Fig. 6K and data not shown). Animals starved through 8 dpf or 10 dpf lacked fabp11a-expressing visceral preadipocytes at the initiation of feeding (Fig. 6A, D and data not shown). However, 2 or 3 days of feeding was sufficient to robustly establish neutral lipid droplets in visceral adipocytes in zebrafish starved through 8 dpf (Fig. 6K; 3.8 ± 0.1 mm SL) or 10dpf (data not shown; 3.9 ± 0.1 mm SL) respectively. Visceral adipocytes that formed in starved animals after feeding exhibit characteristics of normal adipocytes including expression fabp11a (Fig. 6L, M) but not fabp11b (data not shown). In conclusion, we demonstrate that the absence of exogenous nutrition results in reversible abrogation of adipocyte lineage development resulting in a reduction of preadipocytes and adipocytes associated with the pancreas. DISCUSSION
A zebrafish model for adipocyte research
Our current understanding of adipocyte biology is largely derived from rodent models and cell culture platforms. Although these model systems have been instrumental in revealing molecular mechanisms governing adipocyte differentiation and physiology, many important aspects of adipocyte development and adipose depot formation remain poorly understood. In this study, we provide a foundation for using the zebrafish model to address these gaps in our knowledge of adipogenesis. In vivo imaging and in situ hybridization analyses establish the temporal and spatial pattern of preadipocyte and adipocyte development in the zebrafish. Furthermore, we demonstrate that an exogenous nutrient supply is required for adipocyte development, and that mature adipocytes are able to mobilize and deposit lipid as a function of nutrient availability. The anatomical and molecular features of zebrafish adipocytes are
by guest, on July 6, 2018w
ww
.jlr.orgD
ownloaded from

11
homologous to those of mammalian white adipocytes, suggesting that results obtained in the zebrafish model can be translated to mammals. This is consistent with the notion that teleost fishes lack brown adipocytes which evolved with homeothermy and nonshivering thermoregulation in mammals (2). We anticipate that the optical transparency of the zebrafish allowing high-resolution in vivo imaging, combined with its amenability to genetic and chemical screens, will lead to the identification of novel factors and mechanisms governing adipocyte development and physiology.
Markers of the zebrafish adipocyte lineage The utility of the zebrafish to the analysis of adipocyte biology will depend heavily on our ability to visualize adipocytes in situ. The present study uses the vital fluorescent lipid probe Nile Red to visualize neutral lipid depots in living zebrafish. Although Nile Red is fluorescent when incorporated into any hydrophobic lipid environment, its excitation and emission wavelength maxima are reduced when incorporated into neutral lipid (42). Visualization of Nile Red staining using a longpass GFP filter permits the visualization of individual neutral lipid droplets by their yellow fluorescence emission, while the polar lipid throughout the rest of the animal emits red fluorescence (Figs. 1, 3, 4). Nile Red and other fluorescent lipid probes should continue to be useful tools for in vivo monitoring of lipid dynamics in adipocytes and other cell types in the zebrafish.
Nile Red allows visualization of adipocytes containing neutral lipid droplets, however visualization of the adipocyte lineage prior to the onset of neutral lipid accumulation requires additional markers. This study is the first to identify pparg as a marker of adipocytes during initial stages of zebrafish adipogenesis (Fig. 4A-C). Previous in vitro analysis in other teleost species (i.e., Pagrus major) revealed that pparg is expressed in cultured preadipocytes as well as adipocytes (34). Although we are unable to exclude the possibility that zebrafish preadipocytes express pparg below our applied level of detection, zebrafish pparg appears to be robustly expressed only in mature adipocytes after the onset of neutral lipid deposition. This study is also the first to analyze zebrafish fabp11a expression during adipogenesis, and we find that fabp11a is expressed by mature adipocytes in multiple anatomic depots (Figs. 4, 5). We also find that fabp11a is expressed by cells in the pancreas that lack neutral lipid droplets, and we speculate that these fabp11a-positive cells may be preadipocytes. In contrast, we did not detect expression of the paralogous gene fabp11b in zebrafish adipocytes, however we cannot exclude the possibility that fabp11b is expressed by adipocytes at later developmental stages or at levels below the sensitivity of our WISH assays. Lack of expression of the paralogous fabp11b gene by zebrafish adipocytes, combined with the fact that mammalian homologs Fabp4 and Fabp5 are expressed by adipocytes (53, 58), suggests that the Fabp homolog in the last common ancestor of fish and mammals was also expressed in adipocytes. Subsequent gene duplication and subfunctionalization in derivative vertebrate lineages would have allowed for adipocyte expression to be lost in a subset of duplicated genes (i.e., zebrafish fabp11b and mammalian Fabp8 and Fabp9).
Formation of zebrafish adipose depots
Our results establish that zebrafish adipocytes develop in several anatomic depots. Mammals also form distinct adipose depots with distinct molecular features and relationships to metabolic disease susceptibility (2). The mechanisms underlying this developmental and physiological heterogeneity remain largely unknown, and might represent useful targets for depot-specific therapeutic interventions. The appearance of adipose depots during zebrafish development occurs in an ordered manner, with the first and largest depot forming in the viscera beginning at approximately 8 dpf (Figs. 1 and 3). Although fabp11a and pparg can serve as a marker of zebrafish adipocytes, their expression in other cell types (e.g., blood vessels, heart, intestine; Figs. 4, 5) demands the identification of additional specific molecular markers of the
by guest, on July 6, 2018w
ww
.jlr.orgD
ownloaded from

12
zebrafish adipocyte lineage. These tools will be essential for defining the heterogeneity between and within zebrafish adipose depots, and interpreting results from genetic and chemical tests aimed at manipulating zebrafish adipogenesis.
A striking feature of zebrafish adipogenesis is the initial formation of adipocytes within the pancreas. Similar pancreatic localization of initial adipose depots has been observed during ontogeny of other teleost species (60), however the mechanisms underlying this developmental pattern remain unknown. One possibility is that a local signal produced in the pancreas is able to promote adipocyte differentiation. For example, insulin is known to be a potent pro-adipogenic factor in fish as well as mammals (33, 61), and high local concentrations of insulin around the pancreas during early larval stages may potentially stimulate adipogenesis in nearby precursors. Another non-exclusive possibility is that the adipocyte precursors located in or around the pancreas might be especially sensitive to a systemic proadipogenic signal. As discussed below, additional knowledge about the developmental origins and nutritional regulation of these early visceral adipocytes will help distinguish between these possibilities.
Although the development of adipose depots occurred in an ordered manner, the mobilization of adipose depots in response to starvation was qualitatively uniform across depots (Fig. 3). This indicates that the mechanisms underlying the temporal order of adipose depot formation do not strongly influence the order in which adipose depots are depleted during periods of nutrient deprivation. Similarly, fat deposition in response to re-feeding occurred in a qualitatively uniform manner across depots (Fig. 3). This suggests that starvation for 7 days does not significantly affect the distribution of adipose depots in adult zebrafish. However, future analyses will be required to define the molecular and cellular consequences of starvation on adipose depots.
Nutritional regulation of zebrafish adipocyte development
Early postnatal dietary manipulations can contribute significantly to adipocyte development and predisposition to metabolic disorders in mammals (13, 14), however the mechanisms underlying these events remain unclear. When zebrafish are fed beginning at 5 dpf, fabp11a-expressing preadipocytes appear in the pancreas as early as 6 dpf (Fig. 5) and begin to accumulate neutral lipid as early as 8 dpf (Fig. 1). We observed that fabp11a-expressing pancreatic preadipocytes fail to form in zebrafish larvae starved through 8 dpf or 10 dpf, suggesting that the exogenous nutrient supply is an important regulator of adipogenesis in zebrafish as well as mammals (Fig. 6). Interestingly, the lack of fabp11a-expressing preadipocytes in the pancreas of fish starved through 8 dpf was accompanied by an elevated number of cells expressing fabp11a in the CHT and heart. It remains unclear whether the fabp11a-expressing cells in the CHT and heart represent preadipocytes or other cell types. The mammalian homologs of zebrafish fabp11a (i.e., Fabp4, Fabp5, Fabp8, Fabp9) are expressed in several different cell types including macrophages and dendritic cells (52), and it is possible that zebrafish fabp11a is also expressed in these lineages.
Based on our data, we propose two models for the developmental origins and nutritional regulation of visceral adipocytes. In the first model, adipocytes that initially appear in the pancreas are derived from fabp11a-negative adipoblast precursors that are also located in the pancreas or in the adjacent stroma or vasculture. In response to exogenous feeding, these local adipoblasts could differentiate into fabp11a-expressing visceral preadipocytes and adipocytes. Consistent with this notion, previous studies in mammals have identified adipogenic mesenchymal stem cells (MSCs) residing in adipose tissue stroma and vasculature (9-11). In the second model, adipocytes that initially appear in the pancreas are derived from fabp11a-positive preadipocytes or adipoblasts that originate in the CHT. These CHT-associated precursors might be mobilized into circulation in response to exogenous feeding, and then colonize and complete differentiation within the pancreas. This model is consistent with previous studies establishing that the mammalian bone marrow is a rich source of MSCs (8).
by guest, on July 6, 2018w
ww
.jlr.orgD
ownloaded from

13
The CHT is the site of hematopoiesis in the zebrafish larvae, and contains hematopoietic cells as well as undefined cells with fibroblast morphology (59). It is therefore possible that zebrafish MSCs reside within the CHT where they produce adipocyte precursors that can be mobilized and recruited to peripheral locations upon appropriate stimulation. This is congruous with previous reports identifying multipotent adipogenic precursors in circulating blood (12). Importantly, the effects of starvation on adipogenesis were reversible: feeding starved animals for 2 days was sufficient to form pancreatic adipocytes (Fig. 6K). This suggests that adipocyte precursors, whether they reside within the CHT or within the viscera, remain competent to respond to nutritional cues by differentiating within the pancreas. We anticipate that lineage tracing analysis of zebrafish adipocyte precursors will help distinguish between these models.
Zebrafish research has traditionally focused on embryonic and early larval stages of development prior to the onset of exogenous feeding, and consequently very little is known about the roles of exogenous nutrition on zebrafish larval development and physiology. Our results establish that adipocyte development depends on the availability of an exogenous nutrient supply as early as 8 dpf, only 3 days after first feeding. It is likely that other developmental and physiological processes are also sensitive to the nutrient supply during early feeding stages. For example, we have previously shown that an exogenous nutrient supply is required as early as 6 dpf to facilitate robust metabolic and innate immune responses to the community of commensal microorganisms residing in the intestine (microbiota) (21). Interestingly, the intestinal microbiota has been identified as important environmental factor that regulates fat storage in adult mice. The presence of a microbiota stimulates fat deposition via microbial processing of dietary nutrients and regulation of host metabolism (62, 63). We anticipate that the zebrafish model will be a useful tool to define the respective roles of the diet, the microbiota, and other environmental factors on early stages of adipocyte development.
by guest, on July 6, 2018w
ww
.jlr.orgD
ownloaded from

14
ACKNOWLEDGEMENTS
The authors gratefully acknowledge James Minchin, Shiliang Wang, Daniel Pomp, Suk-Won Jin, and Rosalind Coleman for many helpful discussions; plus Victoria Madden, Kirk McNaughton, and Michela Osborn for valuable technical assistance. This work was funded by grants from the National Institutes of Health (DK056350, DK073695, and DK081426), the University of North Carolina at Chapel Hill, and a Pew Scholar Award to J.F.R..
by guest, on July 6, 2018w
ww
.jlr.orgD
ownloaded from

15
REFERENCES
1. Department of Health and Human Services (2001). The Surgeon General’s Call to
Action to Prevent and Decrease Overweight and Obesity. Public Health Service, Washington, DC.
2. Gesta, S., Y. H. Tseng, and C. R. Kahn. 2007. Developmental origin of fat: tracking obesity to its source. Cell 131: 242-256.
3. Schlegel, A., and D. Y. Stainier. 2007. Lessons from "lower" organisms: what worms, flies, and zebrafish can teach us about human energy metabolism. PLoS Genet 3: e199.
4. Fruhbeck, G., J. Gomez-Ambrosi, F. J. Muruzabal, and M. A. Burrell. 2001. The adipocyte: a model for integration of endocrine and metabolic signaling in energy metabolism regulation. Am J Physiol Endocrinol Metab 280: E827-847.
5. Macia, L., O. Viltart, C. Verwaerde, M. Delacre, A. Delanoye, C. Grangette, and I. Wolowczuk. 2006. Genes involved in obesity: Adipocytes, brain and microflora. Genes
Nutr 1: 189-212. 6. Billon, N., P. Iannarelli, M. C. Monteiro, C. Glavieux-Pardanaud, W. D. Richardson, N.
Kessaris, C. Dani, and E. Dupin. 2007. The generation of adipocytes by the neural crest. Development 134: 2283-2292.
7. Takashima, Y., T. Era, K. Nakao, S. Kondo, M. Kasuga, A. G. Smith, and S. Nishikawa. 2007. Neuroepithelial cells supply an initial transient wave of MSC differentiation. Cell 129: 1377-1388.
8. Pittenger, M. F., A. M. Mackay, S. C. Beck, R. K. Jaiswal, R. Douglas, J. D. Mosca, M. A. Moorman, D. W. Simonetti, S. Craig, and D. R. Marshak. 1999. Multilineage potential of adult human mesenchymal stem cells. Science 284: 143-147.
9. Tang, W., D. Zeve, J. M. Suh, D. Bosnakovski, M. Kyba, R. E. Hammer, M. D. Tallquist, and J. M. Graff. 2008. White fat progenitor cells reside in the adipose vasculature. Science 322: 583-586.
10. Zuk, P. A., M. Zhu, P. Ashjian, D. A. De Ugarte, J. I. Huang, H. Mizuno, Z. C. Alfonso, J. K. Fraser, P. Benhaim, and M. H. Hedrick. 2002. Human adipose tissue is a source of multipotent stem cells. Mol Biol Cell 13: 4279-4295.
11. Rodeheffer, M. S., K. Birsoy, and J. M. Friedman. 2008. Identification of white adipocyte progenitor cells in vivo. Cell 135: 240-249.
12. Hong, K. M., M. D. Burdick, R. J. Phillips, D. Heber, and R. M. Strieter. 2005. Characterization of human fibrocytes as circulating adipocyte progenitors and the formation of human adipose tissue in SCID mice. FASEB J 19: 2029-2031.
13. Faust, I. M., P. R. Johnson, and J. Hirsch. 1980. Long-term effects of early nutritional experience on the development of obesity in the rat. J Nutr 110: 2027-2034.
14. Dugail, I., A. Quignard-Boulange, and F. Dupuy. 1986. Role of adipocyte precursors in the onset of obesity induced by overfeeding in suckling rats. J Nutr 116: 524-535.
15. Spalding, K. L., E. Arner, P. O. Westermark, S. Bernard, B. A. Buchholz, O. Bergmann, L. Blomqvist, J. Hoffstedt, E. Naslund, T. Britton, H. Concha, M. Hassan, M. Ryden, J. Frisen, and P. Arner. 2008. Dynamics of fat cell turnover in humans. Nature 453: 783-787.
16. Soukas, A., N. D. Socci, B. D. Saatkamp, S. Novelli, and J. M. Friedman. 2001. Distinct transcriptional profiles of adipogenesis in vivo and in vitro. J Biol Chem 276: 34167-34174.
17. Billon, N., M. C. Monteiro, and C. Dani. 2008. Developmental origin of adipocytes: new insights into a pending question. Biol Cell 100: 563-575.
18. Patton, E. E., and L. I. Zon. 2001. The art and design of genetic screens: zebrafish. Nat. Rev. Genet. 2: 956-966.
by guest, on July 6, 2018w
ww
.jlr.orgD
ownloaded from

16
19. Farber, S. A., M. Pack, S. Y. Ho, I. D. Johnson, D. S. Wagner, R. Dosch, M. C. Mullins, H. S. Hendrickson, E. K. Hendrickson, and M. E. Halpern. 2001. Genetic analysis of digestive physiology using fluorescent phospholipid reporters. Science 292: 1385-1388.
20. Pickart, M. A., E. W. Klee, A. L. Nielsen, S. Sivasubbu, E. M. Mendenhall, B. R. Bill, E. Chen, C. E. Eckfeldt, M. Knowlton, M. E. Robu, J. D. Larson, Y. Deng, L. A. Schimmenti, L. B. Ellis, C. M. Verfaillie, M. Hammerschmidt, S. A. Farber, and S. C. Ekker. 2006. Genome-wide reverse genetics framework to identify novel functions of the vertebrate secretome. PLoS ONE 1: e104.
21. Rawls, J. F., M. A. Mahowald, R. E. Ley, and J. I. Gordon. 2006. Reciprocal gut microbiota transplants from zebrafish and mice to germ-free recipients reveal host habitat selection. Cell 127: 423-433.
22. Schlegel, A., and D. Y. Stainier. 2006. Microsomal triglyceride transfer protein is required for yolk lipid utilization and absorption of dietary lipids in zebrafish larvae. Biochemistry 45: 15179-15187.
23. Jones, K. S., A. P. Alimov, H. L. Rilo, R. J. Jandacek, L. A. Woollett, and W. T. Penberthy. 2008. A high throughput live transparent animal bioassay to identify non-toxic small molecules or genes that regulate vertebrate fat metabolism for obesity drug development. Nutr Metab (Lond) 5: 23.
24. Ibabe, A., E. Bilbao, and M. P. Cajaraville. 2005. Expression of peroxisome proliferator-activated receptors in zebrafish (Danio rerio) depending on gender and developmental stage. Histochem Cell Biol 123: 75-87.
25. Song, Y., and R. D. Cone. 2007. Creation of a genetic model of obesity in a teleost. FASEB J 21: 2042-2049.
26. Om, A. D., T. Umino, H. Nakagawa, T. Sasaki, K. Okada, M. Asano, and A. Nakagawa. 2001. The effects of dietary EPA and DHA fortification on lipolysis activity and physiological function in juvenile black sea bream Acanthopagrus schlegeli (Bleeker). Aquaculture Res. 32: 255-262.
27. Sheridan, M. A. 1988. Lipid dynamics in fish: aspects of absorption, transportation, deposition and mobilization. Comp Biochem Physiol B 90: 679-690.
28. Albalat, A., A. Saera-Vila, E. Capilla, J. Gutierrez, J. Perez-Sanchez, and I. Navarro. 2007. Insulin regulation of lipoprotein lipase (LPL) activity and expression in gilthead sea bream (Sparus aurata). Comp Biochem Physiol B Biochem Mol Biol 148: 151-159.
29. Company, R., J. Calduch-Giner, S. Kaushik, and J. Perez-Sanchez. 1999. Growth performance and adiposity in gilthead seabream (Sparus aurata): risks and benefits of the high energy diets. Aquaculture 171: 279-292.
30. Bellardi, S., M. L. Bianchini, L. Domenis, and G. B. Palmegiano. 1995. Effect of feeding schedule and feeding rate on size and number of adipocytes in rainbow trout Oncorhynchus mykiss. J World Aquacult Soc 26: 80-83.
31. Roy, S. S., M. Mukherjee, S. Bhattacharya, C. N. Mandal, L. R. Kumar, S. Dasgupta, I. Bandyopadhyay, and K. Wakabayashi. 2003. A new cell secreting insulin. Endocrinology 144: 1585-1593.
32. Vegusdal, A., H. Sundvold, T. Gjoen, and B. Ruyter. 2003. An in vitro method for studying the proliferation and differentiation of Atlantic salmon preadipocytes. Lipids 38: 289-296.
33. Oku, H., M. Tokuda, T. Okumura, and T. Umino. 2006. Effects of insulin, triiodothyronine and fat soluble vitamins on adipocyte differentiation and LPL gene expression in the stromal-vascular cells of red sea bream, Pagrus major. Comp Biochem Physiol B
Biochem Mol Biol 144: 326-333. 34. Oku, H., and T. Umino. 2008. Molecular characterization of peroxisome proliferator-
activated receptors (PPARs) and their gene expression in the differentiating adipocytes
by guest, on July 6, 2018w
ww
.jlr.orgD
ownloaded from

17
of red sea bream Pagrus major. Comp Biochem Physiol B Biochem Mol Biol 151: 268-277.
35. Albalat, A., J. Gutierrez, and I. Navarro. 2005. Regulation of lipolysis in isolated adipocytes of rainbow trout (Oncorhynchus mykiss): the role of insulin and glucagon. Comp Biochem Physiol A Mol Integr Physiol 142: 347-354.
36. Westerfield, M. 2000. The Zebrafish Book. A guide for the laboratory use of zebrafish (Danio rerio). Univ. of Oregon Press, Eugene, OR,
37. Kimmel, C. B., W. W. Ballard, S. R. Kimmel, B. Ullmann, and T. F. Schilling. 1995. Stages of embryonic development of the zebrafish. Dev. Dyn. 203: 253-310.
38. Russell, L. D., and S. Burguet. 1977. Ultrastructure of Leydig cells as revealed by secondary tissue treatment with a ferrocyanide:osmium mixture. Tissue Cell 9: 751-766.
39. Reynolds, E. S. 1963. The use of lead citrate at high pH as an electron-opaque stain in electron microscopy. J Cell Biol 17: 208-212.
40. Folch, J., M. Lees, and G. H. Sloane Stanley. 1957. A simple method for the isolation and purification of total lipides from animal tissues. J Biol Chem 226: 497-509.
41. Elizondo, M. R., B. L. Arduini, J. Paulsen, E. L. MacDonald, J. L. Sabel, P. D. Henion, R. A. Cornell, and D. M. Parichy. 2005. Defective skeletogenesis with kidney stone formation in dwarf zebrafish mutant for trpm7. Curr Biol 15: 667-671.
42. Greenspan, P., and S. D. Fowler. 1985. Spectrofluorometric studies of the lipid probe, nile red. J Lipid Res 26: 781-789.
43. Field, H. A., P. D. Dong, D. Beis, and D. Y. Stainier. 2003. Formation of the digestive system in zebrafish. II. Pancreas morphogenesis. Dev Biol 261: 197-208.
44. Sadler, K. C., A. Amsterdam, C. Soroka, J. Boyer, and N. Hopkins. 2005. A genetic screen in zebrafish identifies the mutants vps18, nf2 and foie gras as models of liver disease. Development 132: 3561-3572.
45. Napolitano, L. 1963. The differentiation of white adipose cells: an electron microscope study. J Cell Biol 18: 663-679.
46. Yanagiya, T., A. Tanabe, and K. Hotta. 2007. Gap-junctional communication is required for mitotic clonal expansion during adipogenesis. Obesity (Silver Spring) 15: 572-582.
47. Rosen, E. D., P. Sarraf, A. E. Troy, G. Bradwin, K. Moore, D. S. Milstone, B. M. Spiegelman, and R. M. Mortensen. 1999. PPAR gamma is required for the differentiation of adipose tissue in vivo and in vitro. Mol Cell 4: 611-617.
48. Barak, Y., M. C. Nelson, E. S. Ong, Y. Z. Jones, P. Ruiz-Lozano, K. R. Chien, A. Koder, and R. M. Evans. 1999. PPAR gamma is required for placental, cardiac, and adipose tissue development. Mol Cell 4: 585-595.
49. Tontonoz, P., and B. M. Spiegelman. 2008. Fat and beyond: the diverse biology of PPAR gamma. Annu Rev Biochem 77: 289-312.
50. Escriva, H., R. Safi, C. Hanni, M. C. Langlois, P. Saumitou-Laprade, D. Stehelin, A. Capron, R. Pierce, and V. Laudet. 1997. Ligand binding was acquired during evolution of nuclear receptors. Proc Natl Acad Sci U S A 94: 6803-6808.
51. Bertrand, S., B. Thisse, R. Tavares, L. Sachs, A. Chaumot, P. L. Bardet, H. Escriva, M. Duffraisse, O. Marchand, R. Safi, C. Thisse, and V. Laudet. 2007. Unexpected novel relational links uncovered by extensive developmental profiling of nuclear receptor expression. PLoS Genet 3: e188.
52. Furuhashi, M., and G. S. Hotamisligil. 2008. Fatty acid-binding proteins: role in metabolic diseases and potential as drug targets. Nat Rev Drug Discov 7: 489-503.
53. Hunt, C. R., J. H. Ro, D. E. Dobson, H. Y. Min, and B. M. Spiegelman. 1986. Adipocyte P2 gene: developmental expression and homology of 5'-flanking sequences among fat cell-specific genes. Proc Natl Acad Sci U S A 83: 3786-3790.
54. Makowski, L., J. B. Boord, K. Maeda, V. R. Babaev, K. T. Uysal, M. A. Morgan, R. A. Parker, J. Suttles, S. Fazio, G. S. Hotamisligil, and M. F. Linton. 2001. Lack of
by guest, on July 6, 2018w
ww
.jlr.orgD
ownloaded from

18
macrophage fatty-acid-binding protein aP2 protects mice deficient in apolipoprotein E against atherosclerosis. Nat Med 7: 699-705.
55. Rolph, M. S., T. R. Young, B. O. Shum, C. Z. Gorgun, C. Schmitz-Peiffer, I. A. Ramshaw, G. S. Hotamisligil, and C. R. Mackay. 2006. Regulation of dendritic cell function and T cell priming by the fatty acid-binding protein AP2. J Immunol 177: 7794-7801.
56. Liu, R. Z., V. Saxena, M. K. Sharma, C. Thisse, B. Thisse, E. M. Denovan-Wright, and J. M. Wright. 2007. The fabp4 gene of zebrafish (Danio rerio) - genomic homology with the mammalian FABP4 and divergence from the zebrafish fabp3 in developmental expression. FEBS J 274: 1621-1633.
57. Karanth, S., E. M. Denovan-Wright, C. Thisse, B. Thisse, and J. M. Wright. 2008. The evolutionary relationship between the duplicated copies of the zebrafish fabp11 gene and the tetrapod FABP4, FABP5, FABP8 and FABP9 genes. FEBS J 275: 3031-3040.
58. Hotamisligil, G. S., R. S. Johnson, R. J. Distel, R. Ellis, V. E. Papaioannou, and B. M. Spiegelman. 1996. Uncoupling of obesity from insulin resistance through a targeted mutation in aP2, the adipocyte fatty acid binding protein. Science 274: 1377-1379.
59. Murayama, E., K. Kissa, A. Zapata, E. Mordelet, V. Briolat, H. F. Lin, R. I. Handin, and P. Herbomel. 2006. Tracing hematopoietic precursor migration to successive hematopoietic organs during zebrafish development. Immunity 25: 963-975.
60. Umino, T., H. Nakagawa, and K. Arai. 1996. Development of adipose tissue in juvenile red sea bream. Fisheries Sci 62: 520-523.
61. Green, H., and O. Kehinde. 1975. An established preadipose cell line and its differentiation in culture. II. Factors affecting the adipose conversion. Cell 5: 19-27.
62. Bäckhed, F., H. Ding, T. Wang, L. V. Hooper, G. Y. Koh, A. Nagy, C. F. Semenkovich, and J. I. Gordon. 2004. The gut microbiota as an environmental factor that regulates fat storage. Proc Natl Acad Sci U S A 101: 15718-15723.
63. Bäckhed, F., J. K. Manchester, C. F. Semenkovich, and J. I. Gordon. 2007. Mechanisms underlying the resistance to diet-induced obesity in germ-free mice. Proc Natl Acad Sci
U S A 104: 979-984.
by guest, on July 6, 2018w
ww
.jlr.orgD
ownloaded from
19
FIGURE LEGENDS
Figure 1: Nile Red staining reveals adipogenesis in developing zebrafish. Live zebrafish at 5, 8, or 15 dpf were stained with Nile Red and imaged using a GFP longpass-emission filter set. Brightfield (A, C, E, G) and corresponding fluorescence images (B, D, F, H) are shown. Nile Red fluorescence emission maxima is shifted to shorter wavelengths when incorporated into neutral lipid, so neutral lipid depots in yolk (black arrowhead in B) and adipocytes (white arrowheads in D, F, H) appear yellow. (A, B) The yolk is the major neutral lipid depot in 5 dpf larvae. (C, D) After yolk resorption, the first adipocyte neutral lipid droplets form in the right viscera by 8 dpf. (E, F) By 15 dpf, adipocyte lipid droplets have increased in number within the viscera, and also appear in other locations (asterisk in F). An individual 15 dpf zebrafish stained with Nile Red (G, H) then stained with Oil Red O (ORO; I) reveals colocalization of Nile Red and ORO staining in adipocyte neutral lipid droplets. Swim bladder (sb), gall bladder (gb), and intestine (in) are indicated. Anterior is to the right, and dorsal to the top in all images. Scale
bars: 400 μm (A,B); 300 μm (C-F); 100 μm (G-I).
Figure 2: Cellular anatomy of zebrafish adipocytes. Zebrafish were fixed at 28 dpf and processed for transmission electron microscopy. Toluidine blue stained transverse section (A) and electron micrographs (B-E) show lipid droplets of varying sizes (asterisks) contained within adipocytes. Caveolae are indicated by black arrowheads in panel C. Swim bladder (sb), intestine (in), muscle (m), capillary (cp), red blood cell (rbc), and nuclei (nuc) are indicated.
Scale bars: 100 μm (A); 1 μm (B); 200 nm (C); 500 nm (D, E).
Figure 3: Zebrafish fat depots are mobilized in response to starvation, and deposited in
response to refeeding. Zebrafish were starved for 7 days beginning at 28 dpf and then refed for 4 days. Individual zebrafish were stained with Nile Red and imaged daily to monitor neutral lipid deposits (black arrowheads in A and E). Panels A-E depict an individual representative animal. (A) Zebrafish fed normally through 28 dpf develop salient neutral lipid depots in the viscera (v), pectoral fin plate (pf), pericardial region (c), jaw (j), periorbital region (o), subcutaneous positions (s), and spinal column (sc). (B) When starved for 4 days, neutral lipid depots were reduced in all locations, although the larger visceral and pectoral fin plate depots were the last to be exhausted. (C) After 7 days of starvation, all neutral lipid depots were depleted. (D) Refeeding for 1 day was sufficient to form transient neutral lipid deposits in the intestine (white arrow in D), and refeeding for 4 days was sufficient to reestablish neutral lipid depots in the same locations as before starvation (black arrowheads in E and A). Anterior is to the left, and dorsal to the top in all images. (F) To confirm these imaging results, we used the Folch method to extract and weigh total fat from individual zebrafish at 28 dpf before starvation, at 35 dpf after 7 days of starvation, and at 39 dpf after 4 days of refeeding (6-9 individuals/group). Results are shown as mean ± sd (***, P<0.0001; **, P<0.001). Scale bar: 1 mm. Figure 4: Zebrafish adipocytes express pparg and fabp11a. Individual zebrafish were stained with Nile Red at 15 dpf, imaged, and then processed for WISH using riboprobe directed against zebrafish pparg, fabp11a, or fabp11b mRNA. Cells labeled by WISH stain purple, in contrast to the brown melanin pigment contained within melanophores. Nile Red and WISH staining patterns were compared to detect colocalization. Wholemount (A, B, D, E, G, H) and transverse cryosections (C, F) from the trunk of the same individuals are shown. Both fabp11a and pparg mRNA colocalize with neutral lipid droplets within visceral adipocytes associated with the pancreas (black arrowheads). fabp11a mRNA is also observed in nearby cells lacking neutral lipid droplets (putative preadipocytes; white arrows in E) and blood vessels (black arrows in E), while pparg mRNA is also found in the intestinal epithelium (black arrow in C). (G,
by guest, on July 6, 2018w
ww
.jlr.orgD
ownloaded from

20
H) In contrast, visceral adipocytes containing neutral lipid droplets (black arrowheads in G) did not express fabp11b mRNA. Swim bladder (sb), gall bladder (gb), intestine (in), and pancreas (pan) are indicated. Dorsal is to the top in all panels, and anterior to the right in panels A, B, D,
and E. Scale bars: 100μm (A, B, D, E, G, H); 50μm (C, F).
Figure 5: Expression pattern of fabp11a reveals development of zebrafish adipocyte lineage. Zebrafish were fixed and processed for WISH using fabp11a riboprobe at different stages to reveal the location of putative preadipocytes and adipocytes (black arrowheads). Cells expressing fabp11a mRNA stain purple, in contrast to the brown melanin pigment contained within melanophores. Images show whole 1 dpf (A) and 2 dpf embryos (B), trunk of 3 dpf displaying fabp11a-expressing cells in the CHT (C), trunk of a 6 dpf larvae displaying visceral preadipocytes (D), transverse cryosection of a 6 dpf larvae showing pancreatic localization of a visceral preadipocyte (E), adipocytes in the trunk of a 10 dpf larvae (F), jaw (G) and trunk of a 28 dpf adult (H), transverse cryosection of a visceral adipocyte in a 28 dpf adult (I), and adipocytes in the caudal spinal column of a 28 dpf adult (J). Lens (le), diencephalon (di), blood vessels (black arrows), intestine (in), pancreas (pan), and heart (he) are indicated. Dorsal is to the top in all panels, and anterior is to the left (A, B, C, H, J) or right (D, F). Scale
bars: 200 μm (A-D, F, G); 50 μm (E, I); 400 μm (H, J).
Figure 6: Zebrafish adipogenesis is regulated by exogenous nutrition. Wholemount preparations (A, D, G, I) and transverse cryosections through the pancreas (B, E), heart (C, F) or CHT (H, J) of 8 dpf zebrafish that were either fed since 5 dpf (fed; A-C, G-H) or never fed (starved; D-F, I-J), and then processed for WISH using fabp11a riboprobe to reveal the location of preadipocytes (black arrowheads). Cells expressing fabp11a mRNA stain purple, in contrast to the brown melanin pigment contained within melanophores. Fed animals display fabp11a-expressing cells in the pancreas (A, B) whereas starved animals lack fabp11a-expressing cells in this location (D, E). In contrast, starved animals display supernumerary fabp11a-expressing cells in the heart (F) and CHT (I, J) compared to fed controls (C, G, H). Starved animals also displayed elevated fabp11a expression in the corpuscles of Stannius (white arrowhead in I) compared to fed controls (G). (K) Zebrafish that were fed since 5 dpf (fed) or starved through 8 dpf and then fed normally (starved) were labeled with Nile Red at 5, 8, 10, and 13 dpf to permit enumeration of adipocyte neutral lipid droplets (LD) in the right viscera (visceral LD; blue bars in K) and other anatomic locations (other LD; purple bars in K). The right Y-axes show the total number of adipocyte neutral lipid droplets per fish, whereas the left Y-axes show standard length measurements in mm (green lines in K). The black arrows in K mark the stage when animals began feeding. Data combined from two independent experiments is shown as mean ± 95% confidence intervals. (L) Nile Red staining of a 13dpf zebrafish starved through 8 dpf and then fed for 5 days reveals a large neutral lipid droplet within a visceral adipocyte (white arrowhead in L). (M) WISH of the same individual shows that fabp11a mRNA expression colocalizes with Nile Red staining (black arrowheads in M). A putative preadipocyte expressing fabp11a but lacking a large neutral lipid droplet is labeled with an asterisk in M. Blood vessels (black arrows), intestine (in), pancreas (p), myocardium (c), segmental muscle (m), notocord (nc), and swim bladder (sb) are indicated. Anterior is to the right, and dorsal to the top in panels A, D, G, I, L, and M. Scale bars: 200 μm (A, D, G, I); 50 μm (B, C, E, F, H, J); 100 μm (L,M).
by guest, on July 6, 2018w
ww
.jlr.orgD
ownloaded from