Online delivery of higher education has taken center stage ...
57
econstor Make Your Publications Visible. A Service of zbw Leibniz-Informationszentrum Wirtschaft Leibniz Information Centre for Economics Hardt, David; Nagler, Markus; Rincke, Johannes Working Paper Can Peer Mentoring Improve Online Teaching Effectiveness? An RCT during the Covid-19 Pandemic CESifo Working Paper, No. 8671 Provided in Cooperation with: Ifo Institute – Leibniz Institute for Economic Research at the University of Munich Suggested Citation: Hardt, David; Nagler, Markus; Rincke, Johannes (2020) : Can Peer Mentoring Improve Online Teaching Effectiveness? An RCT during the Covid-19 Pandemic, CESifo Working Paper, No. 8671, Center for Economic Studies and Ifo Institute (CESifo), Munich This Version is available at: http://hdl.handle.net/10419/229489 Standard-Nutzungsbedingungen: Die Dokumente auf EconStor dürfen zu eigenen wissenschaftlichen Zwecken und zum Privatgebrauch gespeichert und kopiert werden. Sie dürfen die Dokumente nicht für öffentliche oder kommerzielle Zwecke vervielfältigen, öffentlich ausstellen, öffentlich zugänglich machen, vertreiben oder anderweitig nutzen. Sofern die Verfasser die Dokumente unter Open-Content-Lizenzen (insbesondere CC-Lizenzen) zur Verfügung gestellt haben sollten, gelten abweichend von diesen Nutzungsbedingungen die in der dort genannten Lizenz gewährten Nutzungsrechte. Terms of use: Documents in EconStor may be saved and copied for your personal and scholarly purposes. You are not to copy documents for public or commercial purposes, to exhibit the documents publicly, to make them publicly available on the internet, or to distribute or otherwise use the documents in public. If the documents have been made available under an Open Content Licence (especially Creative Commons Licences), you may exercise further usage rights as specified in the indicated licence. www.econstor.eu
Transcript of Online delivery of higher education has taken center stage ...

econstorMake Your Publications Visible.
A Service of
zbwLeibniz-InformationszentrumWirtschaftLeibniz Information Centrefor Economics
Hardt, David; Nagler, Markus; Rincke, Johannes
Working Paper
Can Peer Mentoring Improve Online TeachingEffectiveness? An RCT during the Covid-19Pandemic
CESifo Working Paper, No. 8671
Provided in Cooperation with:Ifo Institute – Leibniz Institute for Economic Research at the University of Munich
Suggested Citation: Hardt, David; Nagler, Markus; Rincke, Johannes (2020) : Can PeerMentoring Improve Online Teaching Effectiveness? An RCT during the Covid-19 Pandemic,CESifo Working Paper, No. 8671, Center for Economic Studies and Ifo Institute (CESifo),Munich
This Version is available at:http://hdl.handle.net/10419/229489
Standard-Nutzungsbedingungen:
Die Dokumente auf EconStor dürfen zu eigenen wissenschaftlichenZwecken und zum Privatgebrauch gespeichert und kopiert werden.
Sie dürfen die Dokumente nicht für öffentliche oder kommerzielleZwecke vervielfältigen, öffentlich ausstellen, öffentlich zugänglichmachen, vertreiben oder anderweitig nutzen.
Sofern die Verfasser die Dokumente unter Open-Content-Lizenzen(insbesondere CC-Lizenzen) zur Verfügung gestellt haben sollten,gelten abweichend von diesen Nutzungsbedingungen die in der dortgenannten Lizenz gewährten Nutzungsrechte.
Terms of use:
Documents in EconStor may be saved and copied for yourpersonal and scholarly purposes.
You are not to copy documents for public or commercialpurposes, to exhibit the documents publicly, to make thempublicly available on the internet, or to distribute or otherwiseuse the documents in public.
If the documents have been made available under an OpenContent Licence (especially Creative Commons Licences), youmay exercise further usage rights as specified in the indicatedlicence.
www.econstor.eu

8671 2020
November 2020
Can Peer Mentoring Improve Online Teaching Effective-ness? An RCT during the COVID-19 Pandemic David Hardt, Markus Nagler, Johannes Rincke

Impressum:
CESifo Working Papers ISSN 2364-1428 (electronic version) Publisher and distributor: Munich Society for the Promotion of Economic Research - CESifo GmbH The international platform of Ludwigs-Maximilians University’s Center for Economic Studies and the ifo Institute Poschingerstr. 5, 81679 Munich, Germany Telephone +49 (0)89 2180-2740, Telefax +49 (0)89 2180-17845, email [email protected] Editor: Clemens Fuest https://www.cesifo.org/en/wp An electronic version of the paper may be downloaded · from the SSRN website: www.SSRN.com · from the RePEc website: www.RePEc.org · from the CESifo website: https://www.cesifo.org/en/wp

CESifo Working Paper No. 8671
Can Peer Mentoring Improve Online Teaching Effectiveness? An RCT during the
COVID-19 Pandemic
Abstract Online delivery of higher education has taken center stage but is fraught with issues of student self-organization. We conducted an RCT to study the effects of remote peer mentoring at a German university that switched to online teaching due to the COVID-19 pandemic. Mentors and mentees met one-on-one online and discussed topics like self-organization and study techniques. We find positive impacts on motivation, studying behavior, and exam registrations. The intervention did not shift earned credits on average, but we demonstrate strong positive effects on the most able students. In contrast to prior research, effects were more pronounced for male students. JEL-Codes: I200, I230, J240. Keywords: online education, EdTech, COVID-19, mentoring, higher education.
David Hardt Friedrich Alexander University Erlangen-
Nuremberg / Germany [email protected]
Markus Nagler
Friedrich Alexander University Erlangen-Nuremberg / Germany [email protected]
Johannes Rincke
Friedrich Alexander University Erlangen-Nuremberg / Germany
October 30, 2020 This field experiment was pre-registered at the AEA Social Science Registry under the ID AEARCTR-0005868 and has the approval from the ethics commission as well as from the data protection officer at the university where the experiment took place. Uschi Backes-Gellner, Fabian Dehos, Ulrich Glogowsky, Joshua Goodman, Philipp Lergetporer, Martin Watzinger, Kathrin Wernsdorf, and Martin West provided helpful comments and suggestions. We thank Jens Gemmel for excellent research assistance. We thank Sophie Andresen, Helen Dettmann, Eva-Maria Drasch, Daniel Geiger, Nina Graßl, Jana Hoffmann, Lukas Klostermeier, Alexander Lempp, Lennart Mayer, Jennifer Meyer, Annabell Peipp, Tobias Reiser, Sabrina Ried, Niklas Schneider, and Matthias Wiedemann for their excellent work as student mentors. Nagler gratefully acknowledges funding by the Joachim Herz Foundation through an Add-On Fellowship. Rincke gratefully acknowledges funding by the Innovationsfonds Lehre at the University of Erlangen-Nuremberg.

1 Introduction
Online delivery of tertiary education is on the rise throughout the world. Currently, theCOVID-19 pandemic has forced virtually all education institutions to switch to onlineteaching. The literature on online teaching has generally found this format of teachingto be somewhat inferior to classical classroom-based teaching (Brown and Liedholm,2002; Figlio et al., 2013; Joyce et al., 2015; Alpert et al., 2016; Bettinger et al., 2017b).This may be due to problems of disorganization among students in online teachingand a lack of personalization, as has been argued for massive open online courses(so-called MOOCs; see e.g. Banerjee and Duflo, 2014; McPherson and Bacow, 2015).Switching to online teaching may thus aggravate a situation in tertiary education inwhich many students struggle to successfully complete their studies in time (Himmleret al., 2019).1 Accordingly, students expect and experience negative consequences ofthe COVID-19-induced shift to online teaching for their study outcomes (Aucejo et al.,2020; Bird et al., 2020).
One way to improve on outcomes of online education could be to assist students intheir self-organization and enhance personalization by providing online peer-to-peermentoring. Leading universities have launched student coaching programs to supporttheir students during the COVID-19 crisis, and the American Economic Association(AEA) recommended in the early phase of the pandemic that graduate programsshould set up “more rigorous mentoring systems for students who will not be ableto benefit from the usual sorts of interactions with peers and professors”.2 However,evidence on the effectiveness of such mentoring programs is generally scarce forhigher education and nonexistent for online teaching environments, where they maybe particularly helpful.
In this paper, we report the results of a randomized controlled trial to study theeffects of peer mentoring at a large German public university that, due to the COVID-19pandemic, switched to online teaching for the summer term 2020. The context of thetrial was the core undergraduate program at the university’s School of Business andEconomics. Our sample comprises of 691 students enrolled in the second term ofthe program. To assess the effectiveness of the peer mentoring program, we combine
1A large share of students never obtain a degree, and those who do often take much longer thanthe design of the program would suggest. For instance, data from the National Center for EducationStatistics show that in the United States, less than 40 percent of a cohort entering four-year institutionsobtain a bachelor’s degree within four years. Data on other countries document that similar problemsare widespread. Overall, in OECD countries the completion rate at the tertiary level is only 70 percent.See, e.g., http://nces.ed.gov/programs/digest/d13/tables/dt13 326.10.asp.
2An example for such programs is the MIT’s Student Success Coaching program, seehttp://news.mit.edu/2020/student-coaching-calls-pandemic-0501 for details. The AEA published therecommendations on mentoring (together with other guidelines on graduate programs) on May 11,2020, via email to all members of the association.
2

administrative student data with complementary survey data that we collected beforethe start of the examination period in the summer term.
We designed a structured peer mentoring program that focused on providingstudents with general study skills, such as self-organization in a learning-from-homeenvironment, weekly study schedules, and techniques on how to study effectively.Mentors and mentees met one-on-one online. Overall, we designed a mentoringprogram consisting of five structured meetings, which took place every two to threeweeks. In every meeting, mentors would discuss specific topics, such as mentees’weekly study schedules, using materials and templates provided by us. The meetingswould then also involve follow-up discussions on how students were coping withputting previous inputs to practice. They would also involve discussions on topics thatmentees would suggest. Importantly, we specifically instructed mentors not to discussany coursework or any specific content-based problems with mentees. As mentors,we hired 15 students from a more advanced term in the same study program as thementees as student assistants. Importantly, the type of mentoring we offered could bescaled up easily and at low cost: Including one additional mentee into the program fora three-month teaching period would cost just about e60.3
The setting in which the mentoring program took place is typical for publicuniversities across the developed world. In each winter semester, about 700 activestudents enroll in the three-year (six-semester) bachelor’s program Economics andBusiness Studies.4 In each of the first two semesters, students are supposed to passexams in six core courses, each of them worth five credits. Administrative data from theacademic year 2018/19 shows that even in regular times, many students underperformrelative to the suggested curriculum in the first study year: after the first semester, only59 percent of students still enrolled at this point in time have completed courses worthat least 30 credits. The curriculum for the second semester comprises some coursesinvolving more rigorous methods relative to the first semester. As a result, the students’performance typically further decreases in the second semester: in 2019 (the year priorto the intervention), only about 25 percent of students had completed 60 credits at theend of their first study year. A key advantage of our setting is that the summer term2020 was conducted entirely online at the university because the German academicyear starts and ends later than is common internationally. Thus, all classes offered tostudents in the summer term were online-only classes with zero in-person teaching.
3All mentors were employed for three months during the summer term, based on work contractswith for hours per week and a monthly net pay of about e160. Employer wage costs were about e200per month and mentor.
4The program is broad and can lead to specializations in business administration, economics,information systems, and business and economics education.
3

We find that the peer mentoring program improved students’ outcomes and studybehavior. Students in the treatment group register for significantly more exams. Theysit and pass some of these, such that the average effects on passed credits are attenuated.Students’ GPA is unaffected by our intervention. Our baseline intent-to-treat effectshows an effect of around 1.4 additional credits for which students register, which isequivalent to 28% of an additional course. Given that the take-up rate in the treatmentgroup is around 40%, the associated instrumental variable estimates show an increaseof 3.4 credits, around 70% of an additional course. Of these, they pass 0.5 on average(IV estimation: 1.3 more credits passed). In the survey, students in the treatment groupreport significantly higher overall motivation to study, are more likely to report havingstudied continuously throughout the term, and are more likely to think they providedenough effort during the summer term to reach their goals. The largest effects are onstudents’ motivation, where instrumental variables estimates show increases of around0.5 points on a five-point Likert scale, around 17% relative to the average. In contrast,students’ views on departmental services or on online teaching in the summer term orin general seem unaffected.
The heterogeneity of our effects is in contrast to prior research on the impactsof peer mentoring in higher education. First, while prior research suggests thatweaker students struggle most in online learning environments (e.g., Figlio et al., 2013;Bettinger et al., 2017b), our results show that good students benefit more from thementoring program. For example, while the bottom two terciles of the distribution ofcredits earned in the winter term are unaffected, the upper tercile passes more thanone additional course in the summer term with treatment than without. In sum, forstudents in the upper tercile, the probability of reaching the designated performancegoal of 60 credits after two terms increases by around 9 percentage points, or 18%relative to the mean. This is interesting since many evaluations of in-person mentoringprograms in higher education that find no effect of academic support services explicitlyexclude good students (e.g., Angrist et al., 2009). Second, in line with the evidence fromprior research, we find that female students are more likely to sign up for the mentoringprogram conditional on invitation. However, in contrast to prior research (e.g., Angristet al., 2009), female students are not more likely to benefit from the intervention: ifanything, male students show stronger treatment effects of the program.
Our paper contributes to the growing but small literature on the online educationproduction function. This literature has generally found online teaching to be lesseffective than classroom-based teaching (see, e.g., Brown and Liedholm, 2002; Figlioet al., 2013; Joyce et al., 2015; Alpert et al., 2016). A key paper in this literature isBettinger et al. (2017b), who analyze students at a for-profit university that offerscourses both in-person and online. Using distance to this university interacted with
4

online course availability as an instrumental variable for online course taking, theyfind that students perform worse in online courses and that student achievementbecomes more variable in online environments. This may be due to problems ofdisorganization among students in online teaching, as has been argued for massiveopen online courses (e.g. Banerjee and Duflo, 2014; McPherson and Bacow, 2015). Theliterature on specific aspects of the online education production function is howeversmall. Bettinger et al. (2017a) study students at a for-profit college and randomlyallocate students to differentially sized online classrooms and find little effects. Wecontribute to this literature by providing the first evidence on the effectiveness of peermentoring programs for online higher education, to our knowledge.5
Our paper also contributes to the literature on the effectiveness of mentoringinterventions in higher education. The literature on mentoring has so far mostlyfocused on settings before the onset of tertiary education (see, e.g., Lavy and Schlosser,2005; Rodriguez-Planas, 2012; Oreopoulos et al., 2017).6 In tertiary (classroom-based)education, the results of mentoring interventions seem promising, although theliterature is not large. Bettinger and Baker (2014) show that a student coachingservice focusing on aligning long-term goals and self-organization and providingstudy skills increased university retention.7 In a paper that is close in spirit to ours,Angrist et al. (2009) test the impact of a combination of academic support services andfinancial incentives on students’ GPA. They find that this raises performance amongfemale students. We replicate their finding that female students are more likely tosign up for mentoring services, but do not find a similar heterogeneity in outcomes. Ifanything, men seem to benefit more from our mentoring program. Also in contrast toour results, they find no effects for academic support services that are not combinedwith financial incentives. In comparison to their intervention, our program is targetedmore towards individual mentor-mentee interactions, is more structured and specificregarding the advice given to mentees, and our intervention takes place in an onlineenvironment where, arguably, mentoring services may be more important. We thuscontribute to this literature by providing the first evidence on the effectiveness of (peer)mentoring in an online context, to the best of our knowledge, and by extending thesmall experimental literature on the effects of mentoring in higher education.
5For a paper on the potential extensive margin effects of online education, see Goodman et al. (2019).For research on the value of an online degree, see Deming et al. (2016). For research on potential costand competitive effects of online higher education on offline higher education, see Deming et al. (2015)and Deming et al. (2018), respectively.
6There is an additional related literature on assistance provision in higher education (see, e.g.Bettinger et al., 2012). For research on mentoring in other settings, see, e.g., Lyle and Smith (2014).
7Castleman and Page (2015) provide evidence of an effective text messaging mentoring for high-schoolgraduates.
5

Finally, our paper contributes to the literature on effective education responsesto the COVID-19 pandemic. Most research in this area has focused on primary orsecondary education (e.g., Bacher-Hicks et al., 2020; Grewenig et al., 2020). The papermost closely connected here is Carlana and Ferrara (2020), who conducted an RCTassigning middle school students in Italy an online mentor during the pandemic. Inline with our results, they find that online tutoring improves student performance andstudent well-being. We contribute to this research area by providing evidence on theeffectiveness of an online mentoring program in higher education in a setting whereteaching went online due to COVID-19. Although virtually all universities in the worldhave switched to online teaching due to the pandemic, evidence on useful measures toimprove the effectiveness of online teaching in this context remains nonexistent. Thisis despite early evidence suggesting that the shift led to worse outcomes in highereducation (Bird et al., 2020).
The remainder of this paper is structured as follows. In the next section, we providedetails on the setting and the experimental design. Section 3 informs about the dataand the empirical setup. We discuss the treatment effects on administrative studentoutcomes in Section 4. This includes average effects as well as heterogeneous effects byprior student performance and gender. Section 5 shows treatment effects on surveyoutcomes, including motivation and study behavior. The final section concludes.
2 Experimental Setting and Design
2.1 Experimental Setting
The setting of our experimental study is typical of public universities in Europe and theWestern world. The undergraduate study program Economics and Business Studies at theSchool of Business and Economics at the university where the trial was implementedrequires students to collect 180 credits to graduate. Students are expected to graduateafter three years (six semesters). The study plan assigns courses worth 30 creditsto each semester. Administrative data show that a large share of students do notcomplete 30 credits per semester, delaying their graduation. At the same time, surveydata collected from an earlier cohort of students suggests that most students do notwork full-time even if one aggregates the hours studied and the hours worked toearn income.8 The salient study plan and target of achieving 30 credits per term, thefact that most students do register for exams worth these credits, and the fact thatstudents do not seem to work enough to pass these exams suggests that many students
8On average in the first two semesters, survey participants spend about 13.3 hours per week attendingcourses, about 9.8 hours self-studying, and 7.5 hours to earn income.
6

have problems in self-organizing and/or studying efficiently. Most likely, given priorfindings on such problems in online education, these issues were exacerbated by theswitch to online teaching. This is where our program was supposed to intervene.
Due to the COVID-19 pandemic, in the summer term 2020 all courses of the Schoolof Business and Economics were conducted in online format. To this end, the universityacquired licenses of Zoom, an online video conference tool used widely in academicsettings during the pandemic to enable all lecturers to give online classes and seminars.While the exact implementation of online teaching differed by subject and instructor,this makes the setting similar to the setting of other academic institutions around theglobe during this pandemic.
A key advantage of our setting is that the summer term 2020 was conducted entirelyonline at the university because the German academic year starts and ends later thanis common internationally. Thus, students did not first take classes in-person beforeswitching to online classes as in other universities where the spring or summer termhad already started when the pandemic accelerated. The setting is thus cleaner thanwould be possible in other settings since spillovers from in-person to online teachingcan be ruled out.
2.2 The Mentoring Program
In the first week of the semester, students in the treatment group were informed viae-mail about the launch of a new mentoring program designed specifically for studentsin the second semester of the study program. They were invited to register for theprogram through a webpage.9
The mentoring program focused on self-organization and was supposed to makementees aware of potential problems and pitfalls of studying online. We designed thementoring program to involve five one-on-one online meetings between mentors andmentees. Each meeting was supposed to last between 30 and 45 minutes. The averagelength of meetings as reported to us by the mentors was around 40 minutes. For eachof the meetings, we provided mentors with structured information on how to conductthe session.
The first meeting was meant to focus on mentees’ expectations regarding theirperformance in the second term, and to contrast these expectations with averageperformance figures from previous student cohorts. The mentor was also instructedto provide practical advice on how to self-organize when working from home. In the
9The page asked for the students’ consent to use their personal information for research purposes inanonymized form and for their consent to pass along their name and e-mail address to their mentors.We sent reminder e-mails to students in the treatment group who did not register for the programwithin two days.
7

second meeting, mentors and mentees formulated specific goals that the mentee aimedto achieve in the term. This included aims regarding study effort (time schedule forthe study week, see Figures A.1 and A.2 in the Appendix) and courses to be taken. Italso included performance-based goals (number of exams to pass). The third meetingwas designed to focus on exam preparation (discuss timing of scheduled exams, reflecton implications for the mentee’s preparation). The main topic of the fourth meetingwas how to study effectively. This included the presentation of a simplified four-stagelearning model (see Figure A.3 in the Appendix) and how to implement the proposedlearning strategies in practice. In the fifth and final meeting, the mentor and thementee mainly discussed the mentee’s exam preparation, including a time schedulethat provided the mentee with guidance on how to specifically prepare for exams. Inall meetings, besides the main topics mentioned, the mentor and the mentee wereinstructed to discuss current general issues that the mentee was facing.10 To limit therisk of spillovers, we instructed all mentors to make sure that the information was onlyprovided to mentees and not to other students.
In the control group, there was no mentoring. However, the School of Businessand Economics provided general information on the topics that we focus on in thementoring for all students through its website. This included advice on how to workfrom home and general information on all issues regarding the online implementationof courses.
2.3 Recruitment and Training of Mentors
For administrative reasons, we had to initiate the hiring of the peer mentors about 4weeks before the start of the program. In total, we hired 15 mentors. Work contractswere specified such that each mentor would handle a maximum of 10 mentees. Thementoring program’s maximum capacity was therefore 150 students.
All mentors were students who successfully completed the first year of studies andduring the summer term were enrolled in the fourth semester of the study program.Thus, all mentors were in the upper tercile of the distribution of credits earned untilthe summer term. They had rather good GPAs, above average high-school GPAs, andwere likely to work in student jobs next to their studies. Among all applicants, weselected those that we felt were most able to work as mentors for students in lessadvanced cohorts. Eight of the mentors were females and seven were males.
10The mentors were asked to take brief notes about the content of the discussions during each meeting.We provided mentors with some structure for the notes in advance. Mentors were also instructed toprepare thoroughly for every individual meeting by recapturing the short notes they gathered duringthe prior meeting.
8

Figure 1: Timeline of Intervention
Note: This figure shows the timeline of our experiment.
Shortly before the start of the mentoring program, all mentors took part in an onlinekick-off meeting. In the kick-off meeting, the research team explained the purposeand the general structure of the program and laid out the planned sequence andcontents of the mentoring sessions to be held with each mentee. The mentors couldalso ask questions. The mentors were not informed about the fact that the programwas implemented in the context of an experiment. Mentors were informed about thefact that the program’s capacity was limited and that a random subset of all studentsin the second term was invited to participate.
On the next day, all mentors took part in a training given by professional coaches.The training focused on communications skills and took about five hours (excludingbreaks). Three weeks after the start of the program, the mentors took part in a shortsupervision meeting (about one hour) with the coaches. In addition, the members ofthe research team sent regular e-mails to the mentors (one e-mail before each of thefive waves of meetings) and answered questions in response to individual queries bythe mentors. Short feedback conversations also took place, mainly for us to get a senseon how the program was being implemented.
An overview of the timing of the project is displayed in Figure 1.
2.4 Sampling
About 850 students enrolled for the study program Economics and Business Studies inthe winter term of 2019. We excluded from the experiment students who droppedout after the first semester, who were not formally in their second semester in thesummer term 2020, for example because of having been enrolled at another universitybefore and having already completed courses from the first or second semester ofthe study program without having taken these exams at the university, and whocompleted less than a full course (5 credits) in the first term.11 This leaves us with694 students entering the second term. We randomly assigned half of the students to
11In Germany, some students enroll at a university because as students they have access to heavilysubsidized health insurance.
9

treatment and the other half to control. We used a stratified randomization schemewith gender and number of credits completed in the first term as strata variables. Afterthe intervention ended, we had to drop another three students from the sample whoin the meanwhile got credited for second-term courses earned elsewhere.12 Our finalsample thus consists of 691 students.
Because of the fixed capacity of the program and the (ex ante) unknown take-uprate, we first invited students sampled into treatment who did complete up to 30credits in their first term (369 students). We then successively invited three furthergroups of students sampled into treatment according to the number of credits earnedin the first semester, until all 344 students sampled into treatment got an invitationemail. In total, 142 students from the treatment group signed up for the mentoringprogram.
Assignment of Students to Mentors
We randomly assigned students who signed up for the program to mentors. In orderto achieve a balanced mix of mentee-mentor pairs in terms of gender, we used thementees’ gender as a strata variable in the assignment. Out of the 15 mentors, eightwere females and seven were males. Among students registered for the program, about54 percent were female. As a result, the number of mentee-mentor pairs in each of thementee-mentor gender combinations was similar.
3 Data and Empirical Strategy
3.1 Data
Administrative Data
We collected administrative data from the university in mid October 2020 to measureall outcomes related to exam participation and academic achievement, both in thewinter term 2019 and in the summer term 2020 (i.e., all of the students’ first studyyear). Our outcomes of interest are, first, the number of credits (students receive fivecredits for each examination that they pass) for which students register as a measurefor attempted examinations. This may be interpreted as a measure of student effort.Our primary outcome is, second, credits earned in the second term. This variablemeasures most directly the students’ academic achievement during the term in whichthe intervention took place. Note however that this might be a slow-moving variablesince study effort has cumulative gains over time. Following Angrist et al. (2009), we
12Students are free when to hand in certificates on credits earned elsewhere. As a result, such creditsoften show up with some delay in the administrative data.
10

did not exclude students who withdrew from the sample. Students who withdrewbefore registering for or earning any credits in the second term were coded as havingzero attempted and earned credits, respectively. We do not impute a GPA for thesestudents.
Third, we examine the impact on students’ GPA for passed courses, running from 1(passed) to 4 (best possible grade).13 Given that we expect (and find) impacts of thetreatment on the prior two main outcomes, treatment effects on GPA are not directlyinterpretable, though. This is in contrast to Angrist et al. (2009), whose main measureof academic achievement is students’ GPA. The reason for this difference is that in theGerman university system, students are typically free to choose the timing of takingtheir courses even when a core curriculum is suggested. In addition and as outlinedabove, many students do not attempt to complete the core curriculum in the suggestedtime period, making the extensive margin decision how many courses to take morerelevant than in the U.S. context.
The exams were scheduled after the end of the teaching period and took placebetween end of July and September 2020. All examination results had to be reportedto the department administration by the end of September. In addition, the universityprovided us with background information on individual students. The individualcharacteristics include information on enrollment, gender, age, type of high schoolcompleted, and information on high-school GPA (running from 1 as the worst to 4 asthe best grade).14
Survey Data
After the end of the intervention (i.e., after the fifth round of mentee-mentor meetingswas completed), we invited all students in the experimental sample (i.e., both from thetreatment and the control group) to an online survey. The survey was conducted on anexisting platform at the department that is frequently used to survey students. Studentswho completed the survey, which lasted around ten minutes, received a payoff of e8.00.The survey elicited the students’ assessment of their own study effort, their satisfactionwith the department’s effort to support online learning during the teaching term, viewson online teaching in general, and beliefs about one’s own academic achievement.The full set of survey questions is shown in Online Appendix C.1. We use all surveyresponses submitted until the official beginning of the examination period to avoidspillover effects from exams to survey data. Overall, 404 students (58.5% of the mainsample) participated in the survey.
13In Germany, a reversed scale is used, with 1 being the best and 4 being the worst (passing) grade.We recoded the GPA to align with the U.S. grading system.
14We again recoded the GPA to align with the U.S. system.
11

Control Treatment Difference Std. diff.Female 0.46 0.47 0.01 0.01
(0.50) (0.50) (0.04)Age 21.29 21.26 -0.03 -0.01
(2.48) (2.69) (0.20)High-school GPA 2.37 2.38 0.01 0.01
(0.57) (0.61) (0.05)Top-tier high-school type 0.76 0.74 -0.01 -0.02
(0.43) (0.44) (0.03)Foreign univ. entrance exam 0.07 0.08 0.02 0.04
(0.25) (0.27) (0.02)Earned credits in first term 25.23 25.26 0.02 0.00
(9.27) (8.93) (0.69)First enrollment 0.63 0.68 0.05 0.08
(0.48) (0.47) (0.04)Part-time student 0.09 0.08 -0.00 -0.01
(0.28) (0.28) (0.02)Obs. 347 344 691 691
Note: This table shows means of administrative student data (standard deviations inparentheses) by treatment status, together with differences between means and correspondingstandard errors (in parentheses) and standardized differences. In the line where we reporthigh-school GPA we need to drop 11 observations where we do not have information onstudents’ high-school GPA.
Table 1: Summary Statistics by Treatment Status
3.2 Balancing Checks and Take-Up
Balancing
Table 1 reports differences in means (together with standard errors) and standardizeddifferences on students’ individual characteristics. The characteristics includedcomprise gender, age (in years), high-school GPA, a dummy for the most common typeof high school certificate (“Gymnasium”), a dummy for students who obtained theirhigh school certificate abroad, credits earned in the first term, a dummy for studentswho are in their first year at university, and a dummy for full-time students.15 As canbe seen from Table 1, the treatment and control groups were well balanced across allindividual characteristics.
15Students can be in the first year of the study program, but in a more advanced year at universityif they were enrolled in a different program before. About 10% of students are enrolled as part-timestudents because their university education is integrated into a vocational training program.
12

Dependent Variable: Sign-up Sign-up w/o dropouts Sign-up
overall before first meeting any time Female Male
(1) (2) (3) (4) (5)
Treatment 0.41∗∗∗ 0.37∗∗∗ 0.32∗∗∗ 0.47∗∗∗ 0.36∗∗∗
(0.03) (0.03) (0.03) (0.04) (0.04)Obs. 691 691 691 324 367
Note: This table shows results of regressions of program take-up on initial treatment assignmentcontrolling for student gender (where possible) and credits earned in the winter term. Column (1) usesinitial program sign-up as the dependent variable. Column (2) uses program sign-up among thosewho met at least once with their mentors as the dependent variable. Column (3) uses an indicator ofwhether students met five times with their mentors as the dependent variable. Columns (4) and (5)use the same dependent variable as Column (1) but split the sample into female and male students,respectively. Standard errors are robust. * p<0.10, ** p<0.05, *** p<0.01
Table 2: Take-Up
Take-Up
Students who registered for the peer mentoring program could drop out at any timewith no penalty. Of the 142 students who signed up for the program, 128 met at leastonce with their mentors. 119 students met at least three times with their mentors.Overall, 109 students met five times with their mentors. Table 2 shows the take-up ofour program and the first stage of our instrumental variable estimations. 41 percent ofthe students who received the invitation signed up for the program (Column 1). Someof these students drop out even before the first meeting, leaving 37 percent of thoseinvited to sign up and taking at least one meeting (Column 2). Of those who wereever invited, 32% take all five meetings (Column 3). The final two columns show thatfemale students are more likely to sign up for the program (conditional on receivingan invitation). This is in line with the findings of Angrist et al. (2009). Conditional onthe invitation to sign up, students on average participate in 1.73 meetings. Conditionalon initial sign-up, students participate in 4.2 meetings on average. Conditional onparticipating in at least one meeting, they participate in 4.8 of the 5 meetings onaverage.
Table 3 shows that female and male mentors differ slightly in how they act asmentors. Female mentors conduct around 0.4 more meetings with their mentees thanmale mentors (Column 1). This effect is especially pronounced for female mentees,who attend around half a meeting more on average (Column 2). However, the averagelength of meetings (measured in hours) is a bit lower for female than for male mentors(Column 4). The effect of −0.07 corresponds to meetings held by female mentors beingshorter by around 4 minutes, relative to an average meeting length of 39 minutes.
13

Meetings
Dependent Variable: # attended Av. length (hours)
Mentees: All Female Male All Female Male
(1) (2) (3) (4) (5) (6)
Female mentor 0.40∗∗ 0.54∗∗ 0.28 -0.07∗∗∗ -0.06∗∗ -0.08∗∗
(0.17) (0.26) (0.23) (0.02) (0.03) (0.03)Mean dep. 4.66 4.57 4.76 0.65 0.65 0.64Obs. 128 70 58 128 70 58
Note: This table shows impacts of having a female mentor on mentoring characteristics. Thesample includes those who met at least once with their mentors. Columns (1) to (3) use thenumber of attended meetings as the dependent variable. Columns (4) to (6) use the averagemeeting length in hours as the dependent variable. All columns control for the number ofcredits earned in the winter term. Columns (1) and (4) additionally control for mentee gender.Standard errors are robust. * p<0.10, ** p<0.05, *** p<0.01
Table 3: Meetings by Mentor Gender
3.3 Estimation
To evaluate the treatment effects of the peer mentoring program on administrativestudent outcomes and survey responses, we run linear regressions according to theestimation equation
yi = α + βTreatmenti + γ1Femalei + γ2CreditsWTi + εi, (1)
where yi is the outcome of interest of student i, Treatmenti is an indicator for (random)assignment to treatment, Femalei is a dummy for the student’s gender that takes thevalue of one if the student is female, and CreditsWTi is the number of (ECTS) creditsearned by the student in the winter term 2019, the first term in which the studentswere enrolled in the study program. Each of the outcomes is thus regressed on thetreatment indicator and the vector of strata variables. We report robust standard errors.
Since not all students in the treatment group took up the offer to receive mentoringservices, we additionally run instrumental variable regressions using the randomizedtreatment assignment as an instrument for actual take-up. The main variable formeasuring program take-up is program sign-up (i.e., the first stage can be seen inColumn 1 of Table 2). The first stage is expectedly strong, with a Kleibergen-Paap Fstatistic of around 240.16
For several reasons, before implementing the intervention we considered it likelythat the treatment would have heterogeneous effects. First, this expectation was based
16As can be seen from Table 2, not all students who signed up made use of mentoring services. Wetherefore also estimated model variants where we used treatment assignment to instrument for actualservice use (not shown). Qualitatively, this makes no difference for our results.
14
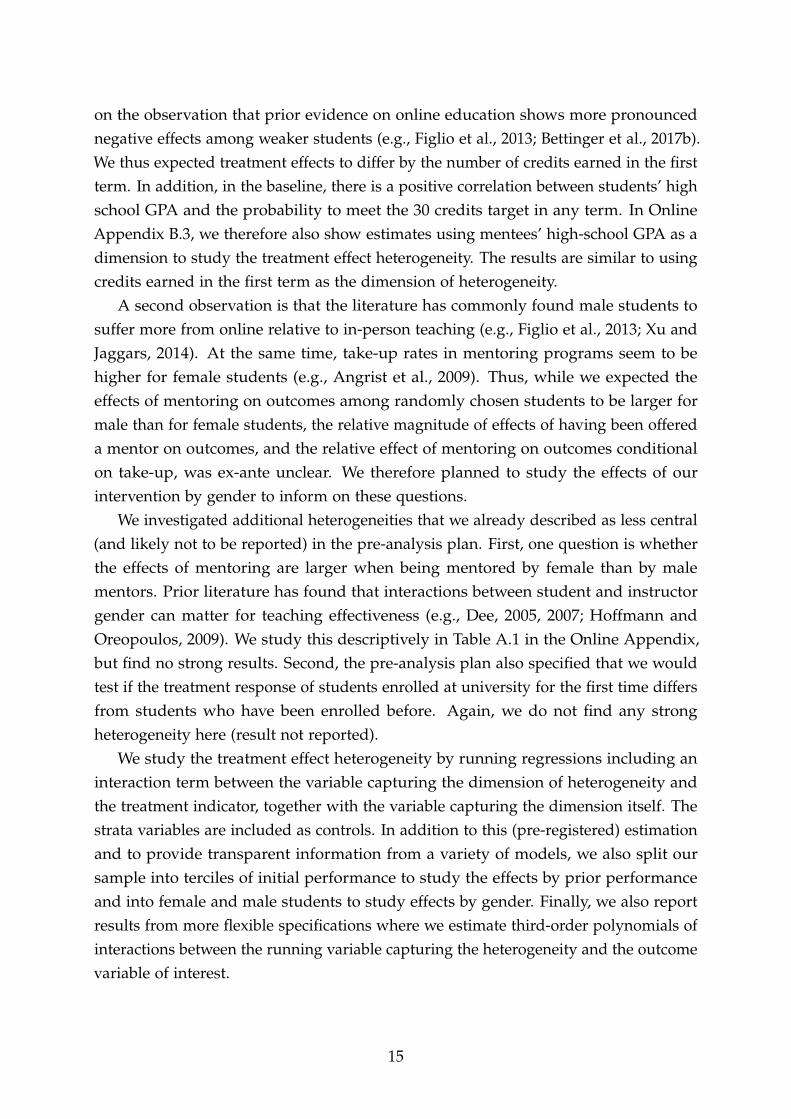
on the observation that prior evidence on online education shows more pronouncednegative effects among weaker students (e.g., Figlio et al., 2013; Bettinger et al., 2017b).We thus expected treatment effects to differ by the number of credits earned in the firstterm. In addition, in the baseline, there is a positive correlation between students’ highschool GPA and the probability to meet the 30 credits target in any term. In OnlineAppendix B.3, we therefore also show estimates using mentees’ high-school GPA as adimension to study the treatment effect heterogeneity. The results are similar to usingcredits earned in the first term as the dimension of heterogeneity.
A second observation is that the literature has commonly found male students tosuffer more from online relative to in-person teaching (e.g., Figlio et al., 2013; Xu andJaggars, 2014). At the same time, take-up rates in mentoring programs seem to behigher for female students (e.g., Angrist et al., 2009). Thus, while we expected theeffects of mentoring on outcomes among randomly chosen students to be larger formale than for female students, the relative magnitude of effects of having been offereda mentor on outcomes, and the relative effect of mentoring on outcomes conditionalon take-up, was ex-ante unclear. We therefore planned to study the effects of ourintervention by gender to inform on these questions.
We investigated additional heterogeneities that we already described as less central(and likely not to be reported) in the pre-analysis plan. First, one question is whetherthe effects of mentoring are larger when being mentored by female than by malementors. Prior literature has found that interactions between student and instructorgender can matter for teaching effectiveness (e.g., Dee, 2005, 2007; Hoffmann andOreopoulos, 2009). We study this descriptively in Table A.1 in the Online Appendix,but find no strong results. Second, the pre-analysis plan also specified that we wouldtest if the treatment response of students enrolled at university for the first time differsfrom students who have been enrolled before. Again, we do not find any strongheterogeneity here (result not reported).
We study the treatment effect heterogeneity by running regressions including aninteraction term between the variable capturing the dimension of heterogeneity andthe treatment indicator, together with the variable capturing the dimension itself. Thestrata variables are included as controls. In addition to this (pre-registered) estimationand to provide transparent information from a variety of models, we also split oursample into terciles of initial performance to study the effects by prior performanceand into female and male students to study effects by gender. Finally, we also reportresults from more flexible specifications where we estimate third-order polynomials ofinteractions between the running variable capturing the heterogeneity and the outcomevariable of interest.
15

4 The Impacts of Peer Mentoring on Administrative
Student Outcomes
In this section, we report our results on administrative student outcomes. We start byshowing average intent-to-treat and instrumental variable treatment effects on creditsfor which students registered, credits earned, and GPA in the summer term 2020. Wesubsequently show the heterogeneity of these effects by prior performance and gender.
4.1 Impacts on Average Outcomes
Figure 2 shows mean differences between treatment and control group for creditsregistered for, credits earned, and students’ GPA in the summer term.17 Panel (a) showsthe impacts on credits registered for. It shows that students who received a treatmentoffer register for around 1.4 more credits than students who did not receive the offer ofprogram participation. This difference is around 5% relative to the control group meanand corresponds to around 28% of an additional course. Thus, the treatment offershifted around every third student to register for an additional course. Students do notpass all courses for which they register. Panel (b) therefore shows differences betweentreatment and control group in credits earned. Students who received a treatment offerearn around 0.5 (or 10% of a course) more credits than students in the control group.This is an increase of around 3% relative to the control group mean. The differenceis statistically insignificant, though. Finally, Panel (c) shows that students’ GPA isvirtually unaffected, indicating that the change in attempted and earned credits didnot come at the expense of worse average grades.
We investigate these results further in Table 4. The odd-numbered columnsrepeat the ITT estimates displayed in Figure 2. The even-numbered columns showcorresponding IV estimates where we use treatment offer as an instrumental variablefor program sign-up. All columns control for students’ gender and the credits whichthey earned in their first term of study. Column (2) shows that students who signedup for the treatment register for around 3.4 more credits than those who did not. Thiscorresponds to around 67% of an additional course and 13% of the control group mean.Column (4) shows that they earn around 1.3 credits more, translating to 26% of anadditional course and 7% of the control group mean. Thus, students pass around40% of the additional credits for which they register to take the exam. These results
17The figures are analogous to Bergman et al. (2020). In all panels, the control mean is calculated asthe students’ mean in the control group. Treatment effects, reported in the top center of each panel, areestimated using an OLS regression of the outcome on a treatment indicator, an indicator for students’gender, and students’ credits earned in their first term. The treatment mean in the panel is calculated asthe control mean plus the estimated treatment effect. Standard errors reported in the panel are robust.
16

are statistically insignificant, however. Column (6) again shows that students’ GPA islargely unaffected.18
25.6327.02
Control Treatment
Difference: 1.39**SE: 0.70
0
5
10
15
20
25
30
Cre
dits
regi
ster
ed fo
r in
sum
mer
term
Note: Treatment mean is control mean plus estimated treatment effect of outcome on treatment indicator and controls for female & passed credits in first term. SE are robust.
(a) Credits registered for
17.38 17.91
Control Treatment
Difference: .54SE: .61
0
5
10
15
20
25
30
Cre
dits
ear
ned
in s
umm
er te
rm
Note: Treatment mean is control mean plus estimated treatment effect of outcome on treatment indicator and controls for female & passed credits in first term. SE are robust.
(b) Credits earned
2.50 2.53
Control Treatment
Difference: .03SE: .05
1
1.5
2
2.5
3
3.5
4
GPA
in s
umm
er te
rm
Note: Treatment mean is control mean plus estimated treatment effect of outcome on treatment indicator and controls for female & passed credits in first term. SE are robust.
(c) GPA
Figure 2: Student Outcomes in the Online Summer Term, by Treatment
Note: This figure shows student outcomes by treatment status. Panel (a) uses the number of credits forwhich students registered in the summer term 2020 as the outcome measure. Panel (b) uses the numberof credits earned in the summer term as outcome measure. Panel (c) uses average GPA (running from1=worst to 4=best) among earned credits as the outcome measure. In all panels, the control mean iscalculated as the students’ mean in the control group. Treatment effects, reported in the top center ofeach panel, are estimated using an OLS regression of the outcome on a treatment indicator, an indicatorfor students’ gender, and students’ credits earned in their first term. The treatment mean in the panelis calculated as the control mean plus the estimated treatment effect. Standard errors reported in thepanel are robust.
18Figure B.1 in the Online Appendix shows outcome distributions by treatment status.
17

Dependent Variable: Credits GPA
Registered for Earned
ITT IV ITT IV ITT IV
(1) (2) (3) (4) (5) (6)
Treatment 1.39∗∗ 3.37∗∗ 0.54 1.30 0.03 0.07(0.70) (1.69) (0.61) (1.47) (0.05) (0.11)
Mean dep. 26.33 26.33 17.66 17.66 2.52 2.52Obs. 691 691 691 691 595 595
Note: This table shows impacts of peer mentoring on administrative student outcomes usingEquation 1. The odd-numbered columns use OLS regressions. The even-numbered columnsinstrument a dummy for initial program take-up by the (random) treatment assignmentvariable. Columns (1) and (2) use the number of credits for which students registered in thesummer term 2020 as the dependent variable. Columns (3) and (4) use the number of earnedcredits in the summer term as the dependent variable. Columns (5) and (6) use students’average GPA (running from 1=worst to 4=best) among earned credits in the summer term asthe dependent variable. The number of observations differs from Columns (1)-(4) since wehave several students who do not earn any credits. Standard errors are robust. * p<0.10, **p<0.05, *** p<0.01
Table 4: Average Impacts of Online Peer Mentoring on Student Outcomes
4.2 Impacts by Prior Performance
As outlined before, prior evidence on the effectiveness of online education suggeststhat its negative effects are more pronounced for weaker students (e.g., Figlio et al.,2013; Bettinger et al., 2017b). We therefore investigate the heterogeneity of these effectsin Figure 3. The figure shows the empirical outcome differences (bubbles) and thepredicted outcome differences (red solid lines) by credits earned in the winter term,conditional on the strata variables. The underlying model is a third-order polynomialof interactions between the treatment dummy and students’ credits earned in thewinter term. The spikes indicate 95% confidence intervals.
Panel (a) considers as an outcome the credits students registered for. There ishardly any difference between treatment and control group along the lower part ofthe distribution of credits earned in the winter term, but the difference bends up forstudents at the upper end of the distribution. The same pattern can be seen in Panel(b), which shows the impacts on credits earned in the summer term. Here, the positiveimpact of the treatment on students in the upper part of the distribution of pastacademic achievement is even stronger. Finally, Panel (c) again shows that the effectson GPA are limited, no matter how students fared in the winter term. Overall, Figure3 demonstrates that the peer mentoring program helped relatively good students inpassing more courses. In contrast, the program did not significantly affect studentswho performed relatively poorly in their first term at university.
18

-40
-20
0
20
40
Cre
dits
regi
ster
ed fo
r in
sum
mer
term
0 10 20 30 40+
Credits in winter term
(a) Credits registered for
-10
0
10
20
30
Cre
dits
ear
ned
in s
umm
er te
rm
0 10 20 30 40+
Credits in winter term
(b) Credits earned
-1.5
-1
-.5
0
.5
1
GPA
in s
umm
er te
rm
0 10 20 30 40+
Credits in winter term
(c) GPA
Figure 3: Treatment Effects by Credits Earned in Winter Term
Note: This figure shows how student outcomes in the summer term relate to students’ prior performanceas measured by credits earned in the winter term. Panels (a) to (c) display heterogeneous treatmenteffects (relative to the control group) on credits registered for, credits earned, and students’ GPA amongearned credits in the summer term 2020, respectively. The bubbles represent empirical differencesbetween treatments, and the red solid lines indicate the treatment effects obtained from the modelyi = ∑3
j=0 β j · (xi)j + ∑3
j=0 γj · (xi)j · Ti + ui, where yi is the outcome of interest, xi is our measure for
prior performance, and Ti is an indicator for the treatment group. The spikes indicate 95% confidenceintervals (Huber-White standard errors). One student in the sample passed 45 credits in the winter termand is included in group “40+” for better visibility.
19

We investigate these patterns further in Table 5. In all panels of this table, we reportthe pre-registered interaction effects between treatment dummy and credits earnedalong with treatment effects in Column (1). In Columns (2) and (3), we report ITTand IV estimates for students in the bottom tercile of the distribution of credits in thewinter term, respectively. In Columns (4) and (5), we report analogous effects for themiddle tercile. And in Columns (6) and (7) we report these effects for the top tercile.
Panel (a) shows the impacts on credits for which students registered. The interactionterm is insignificant, but again points towards a higher treatment effect for those withmore credits in the winter term. This can be seen more clearly in the subsequentcolumns. While the effects for the bottom tercile are small, they increase in the middletercile, and in the top tercile we observe significant effects on credits registered for.The instrumental variable estimates in Column (7) suggest that students in the toptercile who received peer mentoring due to our initial offer register for around onemore course than similar students in the control group.
Panel (b) repeats this analysis for credits earned. The interaction effect shows thatstudents who passed more credits in the winter term benefit more from the program.The point estimates suggest a positive treatment effect starting at around 23 credits(or five courses) passed in the winter term in which students should have passed sixcourses. Again, the effects by tercile show that only those in the top tercile benefitfrom the program. In the highest tercile, treated students pass slightly more than oneadditional course than similar students in the control group. Panel (c) again showsthat we do not see any effects on GPA.
Online Appendix Figure B.2 illustrates this result further. The figure shows theshare of students who reach the institutionally recommended goal of having earned60 credits by the end of the second term, by treatment status and by students’ tercilein the distribution of credits earned in the winter term. By construction, the shareof students who reach the goal increases across terciles, with none of the students inthe control group of the lowest tercile reaching the goal to around 52% of students inthe control group in the highest tercile reaching it. While there is no change in theprobability of having reached the goal in the lowest tercile, there is a small differenceof around 2 percentage points for the middle tercile. For the highest tercile, there is adifference in the probability of reaching the study plan goal after two terms of almost10 percentage points (p-Value=0.059). This difference amounts to 18% of the controlgroup mean.
Overall, our results therefore paint a consistent picture: Those who fared well in thewinter term benefited from the peer mentoring program. In contrast, those who did not
20

earn as many credits in the winter term seem largely unaffected.19 This is interestingespecially because in many investigations of the effectiveness of (peer) mentoringprograms in higher education, good students are excluded from the investigation (e.g.,Angrist et al., 2009). Note that these results are in line with prior evidence that studentsperform better when being mentored or taught by persons similar to them (e.g. Dee,2005; Hoffmann and Oreopoulos, 2009).
4.3 Impacts by Gender
The literature on online education commonly found male students to suffer more fromonline relative to classroom education than female students (e.g., Figlio et al., 2013; Xuand Jaggars, 2014). We therefore also investigated the treatment effects by gender. Wereport the results from this analysis in Table 6. The structure of the table is analogousto Table 5. The first column reports the interaction between a dummy for femalestudent gender. Columns (2) and (3) report effects for female students. Columns (4)and (5) report results for male students.
Panel (a) again shows results for credits registered for. The first column shows apositive treatment effect for men, who register for around 2.7 more credits (more thanhalf an additional course) when offered treatment. The interaction effect is negativeand of around the same magnitude, suggesting that female students do not benefitfrom the program. This can also be seen in the remaining columns. While we do notsee any impact for female students, male students register for more than one additionalcourse in the instrumental variable estimates (Column 5).
Panel (b) shows a similar pattern for credits earned. The results are again attenuated,however. Column (1) shows an effect of around 0.9 more credits earned by malestudents, with zero effects for female students. Columns (2) and (3) again show noeffects for female students. In Columns (4) and (5), we see a positive but insignificanteffect on male students. Male students who take up the offer pass around 2.5 credits(half a course) more than students who do not. This is an increase of around 16%relative to the control group mean and suggests that male students pass around athird of the additional credits that they register for. Panel (c) again shows no effects onGPA.20
19For a similar analysis using high-school GPA as measure of prior performance, see Online AppendixB.3. The results are slightly more U-shaped, suggesting that weak students may also benefit somewhatfrom the program.
20In Online Appendix B.4, Figure B.4 shows bar charts for these results. Figures B.5 and B.6 showheterogeneous treatment effects by credits earned in the winter term, by gender. Again, both female andmale students benefit more when they passed more credits in the winter term. However, this pattern ismuch more pronounced for male students.
21

Panel A: Credits registered for
Lowest tercile Middle tercile Highest tercile
ITT ITT IV ITT IV ITT IV
(1) (2) (3) (4) (5) (6) (7)
Treatment -0.55 0.25 0.62 1.86 3.52 1.91∗∗∗ 5.32∗∗∗
(2.92) (1.77) (4.30) (1.27) (2.41) (0.69) (1.97)Treatment · credits (WT) 0.08
(0.10)Mean dep. 26.33 23.31 23.31 27.47 27.47 27.73 27.73Obs. 691 209 209 156 156 326 326
Panel B: Credits earned
(1) (2) (3) (4) (5) (6) (7)
Treatment -4.13∗∗∗ -0.89 -2.21 -0.91 -1.73 2.14∗∗ 5.95∗∗
(1.57) (1.06) (2.67) (1.51) (2.83) (0.83) (2.33)Treatment · credits (WT) 0.18∗∗∗
(0.06)Mean dep. 17.66 7.93 7.93 16.94 16.94 24.24 24.24Obs. 691 209 209 156 156 326 326
Panel C: GPA
(1) (2) (3) (4) (5) (6) (7)
Treatment 0.14 0.17 0.31 0.05 0.10 -0.02 -0.06(0.21) (0.12) (0.22) (0.09) (0.16) (0.07) (0.18)
Treatment · credits (WT) -0.00(0.01)
Mean dep. 2.52 2.01 2.01 2.25 2.25 2.84 2.84Obs. 595 129 129 144 144 322 322
Note: This table shows impacts of peer mentoring on administrative student outcomes by priorperformance adapting equation 1. In each panel, the first column uses the baseline sample. After thefirst column, the even-numbered columns use OLS regressions. The odd-numbered columns instrumenta dummy for initial program take-up by the (random) treatment assignment variable. Columns (2)and (3) use students in lowest tercile of the distribution of credits earned in the winter term, the firstterm in which the students studied. Columns (4) and (5) use those in the middle tercile and Columns(6) and (7) those in the highest tercile. The terciles are differentially large because earned credits arenot continuous. The regressions in Panel (a) use the number of credits for which students registeredin the summer term 2020 as the dependent variable. The regressions in Panel (b) use the numberof earned credits in the summer term as the dependent variable. The regressions in Panel (c) usestudents’ average GPA (running from 1=worst to 4=best) among earned credits in the summer termas the dependent variable. The number of observations differs from Panels (a) and (b) since we haveseveral students who do not earn any credits. Standard errors are robust. * p<0.10, ** p<0.05, ***p<0.01
Table 5: Treatment Effects by Credits Earned in Winter Term
22

Panel A: Credits registered for
Female Male
ITT ITT IV ITT IV
(1) (2) (3) (4) (5)
Treatment 2.67∗∗∗ -0.09 -0.19 2.65∗∗∗ 7.28∗∗∗
(0.99) (0.98) (2.10) (0.99) (2.72)Treatment · female -2.73∗
(1.40)Mean dep. 26.33 27.63 27.63 25.19 25.19Obs. 691 324 324 367 367
Panel B: Credits earned
(1) (2) (3) (4) (5)
Treatment 0.91 0.11 0.23 0.90 2.48(0.83) (0.90) (1.92) (0.83) (2.26)
Treatment · female -0.79(1.22)
Mean dep. 17.66 19.14 19.14 16.36 16.36Obs. 691 324 324 367 367
Panel C: GPA
(1) (2) (3) (4) (5)
Treatment 0.03 0.04 0.09 0.03 0.07(0.07) (0.08) (0.15) (0.07) (0.17)
Treatment · female 0.01(0.10)
Mean dep. 2.52 2.54 2.54 2.49 2.49Obs. 595 291 291 304 304
Note: This table shows impacts of peer mentoring on administrative studentoutcomes by gender, adapting equation 1. In each panel, the first column usesthe baseline sample. After the first column, the even-numbered columns use OLSregressions. The odd-numbered columns instrument a dummy for initial programtake-up by the (random) treatment assignment variable. Columns (2) and (3) usefemale students only. Columns (4) and (5) use male students only. The regressionsin Panel (a) use the number of credits for which students registered in the summerterm 2020 as the dependent variable. The regressions in Panel (b) use the numberof earned credits in the summer term as the dependent variable. The regressionsin Panel (c) use students’ average GPA (running from 1=worst to 4=best) amongearned credits in the summer term as the dependent variable. The number ofobservations differs from Panels (a) and (b) since we have several students who donot earn any credits. Standard errors are robust. * p<0.10, ** p<0.05, *** p<0.01
Table 6: Treatment Effects by Mentee Gender
23

These results stand in contrast to prior evidence on the effectiveness of mentoringprograms. Most importantly, Angrist et al. (2009) find that an in-person program thatcombined academic counseling with financial incentives did positively affect femalecollege students, while having no effects at all on male students. While our resultson the gender heterogeneity of the treatment effect on credits earned are impreciselyestimated, the patterns in our data do not suggest a similar heterogeneity as in Angristet al. (2009). If anything, in our context male students seem to benefit more fromthe peer mentoring program compared to female students. This may be explainedby the online teaching environment which has been shown to particularly impair theperformance of male students (e.g., Figlio et al., 2013).
4.4 Additional Analyses in the Online Appendix
We add to the pre-registered heterogeneity analyses in the Online Appendix. InOnline Appendix B.5, we follow Abadie et al. (2018) and Ferwerda (2014) and estimatetreatment effects using endogenous stratification approaches. In line with the analysisby prior performance, students in the upper tercile of the distribution of predictedoutcomes in the summer term seem to benefit most from the program. In OnlineAppendix B.6, we show results by students’ region of origin. We do not find strongheterogeneities here. If anything, students who come from the region where theuniversity is located seem to benefit more from the program.
In Online Appendix B.7, we also provide results from a sort of “value-added”analysis where we regress students’ outcomes in the summer term on their performancein the winter term, their observable characteristics, and a mentor dummy. We label theestimated mentor fixed effect in each outcome dimension the mentor’s “value-added”.We find that mentors differ substantially in their value-added. The value-addedestimates on earned credits range from minus 3 to plus 7 credits conditional onstudents’ observables. Thus, mentor differences seem to matter. We also test whetherthe value-added estimates are correlated across different outcomes measures. Whilementors’ value-added on credits earned and credits registered for are stronglycorrelated (ρ=0.56, p < 0.05), both measures are not substantially correlated withvalue-added on GPA. We caution that each mentor only advises up to 10 mentees, thusleading to substantial noise in the value-added estimates. However, the mentors wererandomly assigned to mentees, such that we do not have the problem of endogenoussorting of students to mentors common in the literature on teacher value-added. Withonly 15 mentors, we cannot credibly identify the sources of mentors’ performancedifferences.
24

5 Survey Evidence on Students’ Study Behavior and
Views
To better understand the channels through which the treatment effects operate, wenow turn to our survey on study behavior and students’ views on the departmentand on online teaching in the summer term and generally. We start by running thesame balancing checks that we conducted on the overall sample on the sample ofsurvey respondents. We also study the selectivity in survey participation by meansof mean-comparison tests between survey participants and non-participants. Table 7shows our results. As can be seen from the table, students who did participate in thesurvey differ slightly from students who did not participate (Columns 1-4). Participantsare somewhat younger, more likely to be female, have better high-school GPA, haveearned more credits in the winter term, and are more likely to be part-time students.Importantly, the likelihood of completing the survey seems unrelated to treatmentassignment. Columns (5) to (8) show that within the sample of survey participants, thetreatment and control groups were balanced across all individual characteristics.
Figure 4 shows results from ITT and IV estimations using equation 1 andinstrumenting take-up by treatment assignment, respectively. For better visibility,we show the treatment effects only and provide 90% confidence intervals. Allcorresponding tables can be found in Online Appendix C. All dependent variablesare survey responses to questions, measured on a five-point Likert scale where highervalues indicate higher agreement with the question. The specific questions can befound in Online Appendix C.1.
Panel (a) shows treatment effects on students’ assessment of their own studymotivation and study behavior in the summer term 2020. These are outcomes that thementoring program specifically targeted. The first two rows show positive impacts onstudents’ self-reported motivation. The estimated treatment effect in the instrumentalvariables estimation amounts to around half a point on a five-point Likert scale oraround 18% relative to the mean of the dependent variable. The next two rows showsignificant effects on students’ response to the question whether they managed tostudy continuously throughout the summer term. The subsequent two rows showsmaller effects on students’ response to the question whether they think they preparedfor exams in time. The final two rows again show significant effects on students’response to the question whether they think they provided enough effort to reachtheir goals. To complement these results, we also estimate average standardized effectsanalogous to Kling et al. (2004) and Clingingsmith et al. (2009) in Online AppendixTable C.5. This part of the survey shows an average standardized treatment effect ofaround 0.16 standard deviations (p-value = 0.048). In Online Appendix C.4, we show
25

the heterogeneity of these effects by credits earned in the winter term, analogously toSection 4.2. While the results are more noisy, the overall pattern of this heterogeneityis similar to the one in Figure 3.
Panel (b) shows that the treatment did not shift views on departmental services.The aspects include students services, communication by the department, whetherthere is a clear contact person from the department, as well as students’ views onwhether the department cares for their success or takes their concerns seriously. Themost pronounced effect is for students’ feeling whether the department cares for theirsuccess, with point estimates of around 0.2 points on a five-point Likert scale or 7%relative to the mean of the dependent variable. This is not significantly different fromzero, however. The associated average standardized effect is 0.03 standard deviations(p-value = 0.65).
Panel (c) then shows results on students’ views of online teaching in the summerterm 2020 and more generally. The first four rows show results on students’ satisfactionwith the departments’ online teaching content and technical implementation in thesummer term. Students’ views on these aspects of the summer term seem unaffected bythe treatment. The next two rows show students’ response to the question whether theyfrequently interacted with other students in some form. The null result is interestingsince it shows that the program did not merely substitute for interactions amongstudents. The final two rows show students’ views on online teaching more generally.We asked students whether they feel that online teaching can work in principle andwhether online teaching should play a large role in the future. Both sets of resultsare insignificantly different from zero. However, the response to students’ views onwhether online teaching should play an important role in the future shows a pointestimate in the IV regressions of 0.2 points on a five-point Likert scale or 6% relative tothe mean of the dependent variable. The associated standardized treatment effect ofthis part of the survey is 0.02 (p-value = 0.72).
In the survey, we additionally elicited students’ expectations of the likelihood ofcompleting their studies in time and the number of planned credits. The results arenoisy and show no difference between treatment and control group (not shown). Thecontrast to the results using administrative student outcomes shown in Section 4highlight the importance of analyzing actual administrative data instead of students’survey responses.
26

Surv
eypa
rtic
ipat
ion
Non
-par
tici
pant
sPa
rtic
ipan
tsD
iffer
ence
Std.
diff
.(1
)(2
)(3
)(4
)Tr
eatm
ent
grou
p0.
510.
49-0
.01
-0.0
2(0
.50)
(0.5
0)(0
.04)
Fem
ale
0.41
0.51
0.10
***
0.15
(0.4
9)(0
.50)
(0.0
4)A
ge21
.57
21.0
6-0
.50*
*-0
.13
(3.0
7)(2
.15)
(0.2
0)H
igh-
scho
olG
PA2.
242.
470.
23**
*0.
28(0
.55)
(0.6
0)(0
.05)
Top-
tier
high
-sch
oolt
ype
0.77
0.74
-0.0
3-0
.05
(0.4
2)(0
.44)
(0.0
3)Fo
reig
nun
iv.e
ntra
nce
exam
0.08
0.07
-0.0
2-0
.04
(0.2
8)(0
.25)
(0.0
2)Ea
rned
cred
its
infir
stte
rm21
.51
27.9
06.
39**
*0.
52(9
.86)
(7.4
6)(0
.66)
Firs
ten
rollm
ent
0.64
0.66
0.02
0.02
(0.4
8)(0
.47)
(0.0
4)Pa
rt-t
ime
stud
ent
0.05
0.11
0.07
***
0.18
(0.2
1)(0
.32)
(0.0
2)O
bs.
287
404
691
691
Wit
hin
surv
ey
Con
trol
Trea
tmen
tD
iffer
ence
Std.
diff
.(5
)(6
)(7
)(8
)
0.52
0.50
-0.0
2-0
.03
(0.5
0)(0
.50)
(0.0
5)20
.93
21.1
90.
260.
09(1
.79)
(2.4
6)(0
.21)
2.47
2.47
-0.0
1-0
.01
(0.5
5)(0
.64)
(0.0
6)0.
770.
70-0
.07
-0.1
1(0
.42)
(0.4
6)(0
.04)
0.07
0.06
-0.0
1-0
.04
(0.2
6)(0
.24)
(0.0
2)28
.00
27.8
0-0
.20
-0.0
2(7
.55)
(7.3
9)(0
.74)
0.62
0.70
0.07
0.11
(0.4
9)(0
.46)
(0.0
5)0.
120.
11-0
.02
-0.0
4(0
.33)
(0.3
1)(0
.03)
205
199
404
404
Tabl
e7:
Sort
ing
into
Surv
eyPa
rtic
ipat
ion
Not
e:Th
ista
ble
show
sse
lect
ion
into
surv
eypa
rtic
ipat
ion.
The
first
four
colu
mns
show
mea
nsad
min
istr
ativ
est
uden
tdat
aof
part
icip
ants
and
non-
part
icip
ants
alon
gw
ithdi
ffer
ence
sbe
twee
nbo
thgr
oups
.The
next
four
colu
mns
show
mea
nsan
ddi
ffer
ence
sin
adm
inis
trat
ive
stud
entd
ata
byin
itial
trea
tmen
tass
ignm
ent
amon
gsu
rvey
part
icip
ants
.W
ees
tim
ated
whe
ther
the
diff
eren
ces
betw
een
grou
psar
est
atis
tica
llysi
gnifi
cant
usin
gt-
test
sin
Col
umns
(3)
and
(7)
and
usin
gst
anda
rdiz
eddi
ffer
ence
sin
Col
umns
(4)
and
(8).
*p<
0.10
,**
p<
0.05
,***
p<
0.01
27

Mot
ivat
ion
ITT IV
Con
tinu
ous
stud
ying IT
T IV
Tim
ely
exam
pre
p.
ITT IV
Suf
fici
ent e
ffor
t
ITT IV
-.5-.2
50
.25
.5.7
51
5-Po
int i
kert
Ass
essm
ent o
f ow
n m
otiv
atio
n an
d st
udy
effo
rt
(a)
Ass
essm
ent
ofst
udy
beha
vior
Stu
dent
ser
vice
s
ITT IV
Com
mun
icat
ion
ITT IV
Cle
ar c
onta
ct p
erso
n
ITT IV
Car
es fo
r m
y su
cces
s
ITT IV
Tak
es m
y co
ncer
ns s
erio
usly
ITT IV
-.5-.2
50
.25
.5.7
51
5-Po
int L
iker
tA
sses
smen
t of d
epar
tmen
t ser
vice
s
(b)
Ass
essm
ent
ofde
part
men
tse
rvic
es
Onl
ine
cont
ent
ITT IV
Tec
hnic
al im
plem
enta
tion IT
T IV
Con
tact
to o
ther
stu
dent
s
ITT IV
Can
wor
k in
pri
ncip
le
ITT IV
Sho
uld
play
larg
e ro
le
ITT IV
-.5-.2
50
.25
.5.7
51
5-Po
int L
iker
tA
sses
smen
t of o
nlin
e te
achi
ng g
ener
ally
(c)
Ass
essm
ent
ofon
line
teac
hing
Figu
re4:
Impa
cts
ofM
ento
ring
onSu
rvey
Out
com
es
Not
e:Th
isfig
ure
show
sim
pact
sof
peer
men
tori
ngon
surv
eyre
spon
ses
adap
ting
Equa
tion
1.Fo
rea
chqu
esti
on,t
hefir
stro
wus
esO
LSre
gres
sion
s(l
abel
ed“I
TT”)
.The
seco
ndro
wus
es(r
ando
m)
trea
tmen
tas
sign
men
tas
anin
stru
men
tfo
rin
itia
lpro
gram
take
-up
(lab
eled
“IV
”).F
orth
efu
llse
tof
surv
eyqu
esti
ons,
plea
sese
eO
nlin
eA
ppen
dix
C.1
.Dia
mon
dsin
dica
teth
epo
int
esti
mat
es,b
ars
the
asso
ciat
edco
nfide
nce
boun
ds.F
ull(
red)
diam
onds
indi
cate
sign
ifica
nce
atth
ete
npe
rcen
tlev
el.H
ollo
wdi
amon
dsin
dica
teno
n-si
gnifi
canc
e.Th
eco
rres
pond
ing
tabl
esca
nbe
foun
din
Onl
ine
App
endi
xC
.2.S
tand
ard
erro
rsar
ero
bust
.
28

Overall, our results show that the treatment improved students’ motivation andstudy behavior, which is exactly what the peer mentoring program intended to shift.We thus view these survey outcomes as evidence on the mechanism through which thementoring program worked. The program seems to have affected students’ behaviorand well-being during the online summer term which led to more exam registrationsand somewhat better student outcomes. In contrast, views on departmental servicesor online teaching were not shifted significantly by the treatment. If anything, we seethat students feel somewhat more positively towards a future role of online teachingand that the department cares for their success.
6 Conclusion
This paper presents the first evidence on the potential role of remote peer mentoringprograms in online higher education. We conducted a field experiment that providedfirst year students with an online mentor from a more advanced term. The structuredone-on-one mentoring program focused on study behavior, (online education) studyskills, and students’ self-organization, some of the most common issues in onlineteaching. For our experiment, we leveraged the COVID-19-induced switch to onlineteaching at a large German public university, where the entire summer term wasconducted online.
Our peer mentoring program increased exam registrations and, somewhatattenuated, earned credits among affected students. In contrast to prior research, ourresults are more pronounced for previously good students. If anything, the programwas also more effective for men. The program strongly affected students’ behavior andwell-being during the online term. Our results thus provide the first evidence on theeffectiveness of a low-cost intervention such as peer mentoring to improve studentoutcomes and student well-being in online higher education.
Given the cumulative nature of human capital accumulation, our results on students’well-being and behavior may suggest that a more permanent peer mentoring programmay improve student outcomes even more. However, it may also be the case that thenovel nature of the mentoring program, combined with the unusual situation of arapid switch to online teaching, exacerbate any treatment effects. The potential role ofpeer mentoring programs in online education thus remains a valuable topic for futureresearch.
29

References
Abadie, A., M. M. Chingos, and M. R. West (2018): “Endogenous Stratification inRandomized Experiments,” Review of Economics and Statistics, 100, 567–580.
Alpert, W. T., K. A. Couch, and O. R. Harmon (2016): “A Randomized Assessmentof Online Learning,” American Economic Review: Papers & Proceedings, 106, 378–382.
Angrist, J., D. Lang, and P. Oreopoulos (2009): “Incentives and Services for CollegeAchievement: Evidence from a Randomized Trial,” American Economic Journal: AppliedEconomics, 1, 136–163.
Aucejo, E. M., J. French, M. P. U. Araya, and B. Zafar (2020): “The Impact ofCOVID-19 on Student Experiences and Expectations: Evidence from a Survey,”Journal of Public Economics, 191, 104271.
Bacher-Hicks, A., J. Goodman, and C. Mulhern (2020): “Inequality in HouseholdAdaptation to Schooling Shocks: Covid-Induced Online Learning Engagement inReal Time,” Journal of Public Economics.
Banerjee, A. V. and E. Duflo (2014): “(Dis)Organization and Success in an EconomicsMOOC,” American Economic Review: Papers & Proceedings, 104, 514–518.
Bergman, P., R. Chetty, S. DeLuca, N. Hendren, L. F. Katz, and C. Palmer
(2020): “Creating Moves to Opportunity: Experimental Evidence on Barriers toNeighborhood Choice,” NBER Working Paper No. 26164.
Bettinger, E. P. and R. B. Baker (2014): “The Effects of Student Coaching: AnEvaluation of a Randomized Experiment in Student Advising,” Educational Evaluationand Policy Analysis, 36, 3–19.
Bettinger, E. P., C. Doss, S. Loeb, A. Rogers, and E. S. Taylor (2017a): “The Effects ofClass Size in Online College Courses: Experimental Evidence,” Economics of EducationReview, 58, 68–85.
Bettinger, E. P., L. Fox, S. Loeb, and E. S. Taylor (2017b): “Virtual Classrooms: HowOnline College Courses Affect Student Success,” American Economic Review, 107,2855–2875.
Bettinger, E. P., B. T. Long, P. Oreopoulos, and L. Sanbonmatsu (2012): “The Roleof Application Assistance and Information in College Decisions: Results from theH&R Block Fafsa Experiment,” Quarterly Journal of Economics, 127, 1205–1242.
30

Bird, K. A., B. L. Castleman, and G. Lohner (2020): “Negative Impacts From theShift to Online Learning During the COVID-19 Crisis: Evidence from a StatewideCommunity College System,” EdWorkingPaper 20-299.
Brown, B. W. and C. F. Liedholm (2002): “Can Web Courses Replace the Classroomin Principles of Microeconomics?” American Economic Review: Papers and Proceedings,92, 444–448.
Carlana, M. and E. L. Ferrara (2020): “Apart but Connected: Online Tutoring toMitigate the Impact of COVID-19 on Educational Inequality,” Mimeo.
Castleman, B. L. and L. C. Page (2015): “Summer Nudging: Can Personalized TextMessages and Peer Mentor Outreach Increase College Going Among Low-IncomeHigh School Graduates?” Journal of Economic Behavior & Organization, 115, 144–160.
Clingingsmith, D., A. I. Khwaja, and M. Kremer (2009): “Estimating the Impact ofthe Hajj: Religion and Tolerance in Islam’s Global Gathering,” Quarterly Journal ofEconomics, 124, 1133–1170.
Dee, T. S. (2005): “A Teacher Like Me: Does Race, Ethnicity, or Gender Matter?”American Economic Review: Papers and Proceedings, 95, 158–165.
——— (2007): “Teachers and the Gender Gaps in Student Achievement,” Journal ofHuman Resources, 42, 528–554.
Deming, D. J., C. Goldin, L. F. Katz, and N. Yuchtman (2015): “Can Online LearningBend the Higher Education Cost Curve?” American Economic Review: Papers andProceedings, 105, 496–501.
Deming, D. J., M. Lovenheim, and R. W. Patterson (2018): “The Competitive Effectsof Online Education,” in Productivity in Higher Education, ed. by C. Hoxby andK. Stange.
Deming, D. J., N. Yuchtman, A. Abulafi, C. Goldin, and L. F. Katz (2016): “TheValue of Postsecondary Credentials in the Labor Market: An Experimental Study,”American Economic Review, 106, 778–806.
Ferwerda, J. (2014): “ESTRAT: Stata module to perform Endogenous Stratification forRandomized Experiments,” Statistical Software Components S457801.
Figlio, D., M. Rush, and L. Yin (2013): “Is It Live or Is It Internet? ExperimentalEstimates of the Effects of Online Instruction on Student Learning,” Journal of LaborEconomics, 31, 763–784.
31

Goodman, J., J. Melkers, and A. Pallais (2019): “Can Online Delivery IncreaseAccess to Education?” Journal of Labor Economics, 37, 1–34.
Grewenig, E., P. Lergetporer, K. Werner, L. Woessmann, and L. Zierow (2020):“COVID-19 and Educational Inequality: How School Closures Affect Low- andHigh-Achieving Students,” CESifo Working Paper No. 8648.
Himmler, O., R. Jaeckle, and P. Weinschenk (2019): “Soft Commitments, Reminders,and Academic Performance,” American Economic Journal: Applied Economics, 11,114–142.
Hoffmann, F. and P. Oreopoulos (2009): “A Professor Like Me: The Influence ofInstructor Gender on College Achievement,” Journal of Human Resources, 44, 479–494.
Joyce, T., S. Crockett, D. A. Jaeger, O. Altindag, and S. D. O’Connell (2015): “DoesClassroom Time Matter?” Economics of Education Review, 46, 64–77.
Kling, J. R., J. B. Liebman, L. F. Katz, and L. Sanbonmatsu (2004): “Movingto Opportunity and Tranquility: Neighborhood Effects on Adult EconomicSelf-Sufficiency and Health from a Randomized Housing Voucher Experiment,”KSG Working Paper No. RWP04-035.
Lavy, V. and A. Schlosser (2005): “Targeted Remedial Education for UnderperformingTeenagers: Costs and Benefits,” Journal of Labor Economics, 23, 839–874.
Lyle, D. S. and J. Z. Smith (2014): “The Effect of High-Performing Mentors on JuniorOfficer Promotion in the US Army,” Journal of Labor Economics, 32, 229–258.
McPherson, M. S. and L. S. Bacow (2015): “Online Higher Education: Beyond theHype Cycle,” Journal of Economic Perspectives, 29, 135–154.
Oreopoulos, P., R. S. Brown, and A. M. Lavecchia (2017): “Pathways to Education:An Integrated Approach to Helping At-Risk High School Students,” Journal of PoliticalEconomy, 125, 947–984.
Rodriguez-Planas, N. (2012): “Longer-Term Impacts of Mentoring, EducationalServices, and Learning Incentives: Evidence from a Randomized Trial in the UnitedStates,” American Economic Journal: Applied Economics, 4, 121–139.
Xu, D. and S. S. Jaggars (2014): “Performance Gaps between Online and Face-to-FaceCourses: Differences across Types of Students and Academic Subject Areas,” TheJournal of Higher Education, 85, 633–659.
32

APPENDIX: FOR ONLINE PUBLICATION ONLY UNLESS REQUESTEDOTHERWISE
A Additional Information on the Mentoring Program
A.1 Mentoring Program Structure: Examples
In this subsection, we show some examples of the content of the mentoring program.In Figure A.1, we show a screenshot of the weekly study plan that we provide as anexample plan for mentors. In Figure A.2, we show a screenshot of an actual weeklystudy plan handed in by a mentee. In Figure A.3 we show a screenshot of a brieflearning model with learning techniques that we instruct mentors to discuss with theirmentees.
Figure A.1: Example: Input for weekly Study Plan
Figure A.2: Example: Actual Weekly Study Plan
33

Figure A.3: Example: Input on How to Study Effectively
34

A.2 Mentoring Differences by Mentor Gender
In this subsection, we provide descriptive evidence on the efficiency of mentoringby mentor gender. We use only those students who signed up for the program, anendogenous outcome itself. Table A.1 shows impacts of having a female mentor oncredits for which students registered in the summer term, credits earned, and GPA. Ifanything, female mentors seem to be a bit more efficient. This is more pronounced formale mentees. The difference between all mentees’ outcomes by mentor gender areinsignificant, however.
Table A.1: Descriptive Results on Mentoring Effectiveness by Mentor Gender
Dep. Var.: Credits GPA
Registered for Earned
Mentees: All Female Male All Female Male All Female Male
(1) (2) (3) (4) (5) (6) (7) (8) (9)
Female mentor 0.75 -0.02 1.98 1.42 1.04 2.34 0.09 0.20 -0.06(1.35) (1.93) (1.64) (1.46) (1.92) (2.19) (0.12) (0.17) (0.15)
Mean dep. 29.21 29.50 28.86 19.84 20.73 18.78 2.61 2.60 2.62Obs. 128 70 58 128 70 58 120 65 55
Note: This table shows impacts of having a female mentor on outcomes. The sample includes those who metat least once with their mentors. Columns (1) to (3) use the number of credits for which students registered inthe summer term 2020 as the dependent variable. Columns (4) to (6) use the number of credits earned as thedependent variable. Columns (7) to (9) use students’ GPA among earned credits as the dependent variable(running from 1=worst to 4=best). All columns control for the number of credits earned in the winter termand for mentee gender. The number of observations differs for these results since not all students have creditsearned. Standard errors are robust. * p<0.10, ** p<0.05, *** p<0.01
35

B Additional Results for Administrative Student Outcomes
B.1 Distribution of Outcomes by Treatment Status
0
.02
.04
.06
Den
sity
0 10 20 30 40+
Credits registered for in summer term
Control Treatment
(a) Credits registered for
0
.01
.02
.03
.04
Den
sity
0 10 20 30 40+
Credits earned in summer term
Control Treatment
(b) Credits earned
.1
.2
.3
.4
.5
Den
sity
1 2 3 4
GPA in summer term
Control Treatment
(c) GPA
Figure B.1: Kernel Density Plots by Treatment Status
Note: This figure shows unadjusted Kernel density plots by treatment status. Panel (a) uses the numberof registered credits in the summer term 2020 as measure. Panel (b) uses earned credits in the same termas measure. Panel (c) uses GPA among earned credits (running from 1=worst to 4=best) as measure. Forbetter visibility, we assign students with above 40 credits to the group “40+” for both credits registeredfor and credits earned.
36

B.2 Effects on Reaching First Year Goal
0.00 0.004.17
6.84
51.52
61.02
Difference: 0 SE: -
Difference: 2.68SE: 3.61
Difference: 9.51**SE: 5.03
Control Treatment Control Treatment Control Treatment
Note: Treatment mean is control mean plus estimated treatment effect of outcome on treatment indicator and controls for female & passed credits in first term. SE are robust.
0
20
40
60
80Sh
are
of s
tude
nts
reac
hing
firs
t yea
r goa
l
Tercile 1 Tercile 2 Tercile 3
Figure B.2: Treatment Effects by Tercile of Credits Earned in Winter Term
Note: This figure shows the share of students that reached the first year goal of accumulating 60 creditsby students’ prior performance as measured by their tercile in the distribution of credits earned in thewinter term. The control mean is calculated as the students’ mean in the control group. Treatmenteffects, reported in the top center of each comparison, are estimated using an OLS regression of theoutcome on a treatment indicator, an indicator for students’ gender, and students’ credits earned intheir first term. The treatment mean is calculated as the control mean plus the estimated treatmenteffect. Standard errors reported are robust. * p<0.10, ** p<0.05, *** p<0.01
37
B.3 Heterogeneity by High School GPA
-5
0
5
10
15
Cre
dits
regi
ster
ed fo
r in
sum
mer
term
1.5 2 2.5 3 3.5 4
High school GPA
(a) Credits registered for
-5
0
5
10
Cre
dits
ear
ned
in s
umm
er te
rm
1.5 2 2.5 3 3.5 4
High school GPA
(b) Credits earned
-1
-.5
0
.5
GPA
in s
umm
er te
rm
1.5 2 2.5 3 3.5 4
High school GPA
(c) GPA
Figure B.3: Treatment Effects by Binned High School GPA
Note: This figure shows how student outcomes in the summer term relate to students’ prior performanceas measured by students’ binned high-school GPA. We bin high-school GPA (running from 1=worst to4=best) into bins of 0.5. Panels (a) to (c) display heterogeneous treatment effects (relative to the controlgroup) on credits registered for, credits earned, and students’ GPA among earned credits in the summerterm 2020, respectively. The bubbles represent empirical differences between treatments, and the redsolid lines indicate the treatment effects obtained from the model yi = ∑3
j=0 β j · (xi)j + ∑3
j=0 γj · (xi)j ·
Ti + ui, where yi is the outcome of interest, xi is our measure of prior performance, and Ti is an indicatorfor the treatment group. The spikes indicate 95% confidence bands (Huber-White standard errors). Wealso drop 11 observations where we do not have information on students’ high-school GPA.
38

Table B.1: Treatment Effects by High School GPA
Panel A: Credits registered for
Lowest tercile Middle tercile Highest tercile
ITT ITT IV ITT IV ITT IV
(1) (2) (3) (4) (5) (6) (7)
Treatment 2.82 2.99∗∗ 6.44∗∗ -0.77 -2.11 1.41 3.51
(2.33) (1.41) (3.01) (1.28) (3.53) (0.99) (2.43)
Treatment · H.S. GPA -0.64
(0.88)
Mean dep. 26.37 25.67 25.67 25.27 25.27 27.93 27.93
Obs. 680 224 224 208 208 248 248
Panel B: Credits earned
(1) (2) (3) (4) (5) (6) (7)
Treatment -9.94∗∗∗ -0.01 -0.01 -0.81 -2.21 2.09∗∗ 5.21∗∗
(1.71) (1.01) (2.17) (1.11) (3.06) (0.98) (2.41)
Treatment · H.S. GPA 4.37∗∗∗
(0.67)
Mean dep. 17.68 11.90 11.90 16.62 16.62 23.80 23.80
Obs. 680 224 224 208 208 248 248
Panel C: GPA
(1) (2) (3) (4) (5) (6) (7)
Treatment -0.67∗∗∗ 0.12 0.23 -0.07 -0.16 0.06 0.13
(0.16) (0.08) (0.17) (0.09) (0.22) (0.08) (0.18)
Treatment · H.S. GPA 0.29∗∗∗
(0.06)
Mean dep. 2.52 2.09 2.09 2.48 2.48 2.87 2.87
Obs. 586 175 175 180 180 231 231
Note: This table shows impacts of peer mentoring on administrative student outcomes by prior performance adaptingequation 1. In the figure, we use students’ final high-school GPA as measure of prior performance. The high-school GPA isrecoded to run from 1=worst to 4=best. In each panel, the first column uses the baseline sample. After the first column, theeven-numbered columns use OLS regressions. The odd-numbered columns instrument a dummy for initial program take-upby the (random) treatment assignment variable. Columns (2) and (3) use students in lowest tercile of the distribution ofhigh-school GPAs. Columns (4) and (5) use those in the middle tercile and Columns (6) and (7) those in the highest tercile.The terciles are differentially large because high-school GPA is not completely continuous. The regressions in Panel (a) use thenumber of credits for which students registered in the summer term 2020 as the dependent variable. The regressions in Panel(b) use the number of earned credits in the summer term as the dependent variable. The regressions in Panel (c) use students’average GPA (running from 1=worst to 4=best) among earned credits in the summer term as the dependent variable. Thenumber of observations differs from Panels (a) and (b) since we have several students who do not earn any credits. We alsodrop 11 observations where we do not have information on students’ high-school GPA. Standard errors are robust. * p<0.10,** p<0.05, *** p<0.01
39

B.4 More Heterogeneity by Gender
23.85
26.50
Control Treatment
Difference: 2.65***SE: 0.99
0
5
10
15
20
25
30
Cre
dits
regi
ster
ed fo
r in
sum
mer
term
Note: Treatment mean is control mean plus estimated treatment effect of outcome on treatment indicator and controls for female & passed credits in first term. SE are robust.
Male
27.69 27.60
Control Treatment
Difference: -0.09SE: 0.98
0
5
10
15
20
25
30
Cre
dits
regi
ster
ed fo
r in
sum
mer
term
Note: Treatment mean is control mean plus estimated treatment effect of outcome on treatment indicator and controls for female & passed credits in first term. SE are robust.
Female
15.8316.73
Control Treatment
Difference: .9SE: .83
0
5
10
15
20
25
30
Cre
dits
ear
ned
in s
umm
er te
rm
Note: Treatment mean is control mean plus estimated treatment effect of outcome on treatment indicator and controls for female & passed credits in first term. SE are robust.
Male
19.16 19.27
Control Treatment
Difference: .11SE: .90
0
5
10
15
20
25
30
Cre
dits
ear
ned
in s
umm
er te
rm
Note: Treatment mean is control mean plus estimated treatment effect of outcome on treatment indicator and controls for female & passed credits in first term. SE are robust.
Female
2.48 2.51
TreatmentControl
Difference: .03SE: .07
1
1.5
2
2.5
3
3.5
4
GPA
in s
umm
er te
rm
Note: Treatment mean is control mean plus estimated treatment effect of outcome on treatment indicator and controls for female & passed credits in first term. SE are robust.
Male
2.51 2.56
Control Treatment
Difference: .04SE: .08
1
1.5
2
2.5
3
3.5
4
GPA
in s
umm
er te
rm
Note: Treatment mean is control mean plus estimated treatment effect of outcome on treatment indicator and controls for female & passed credits in first term. SE are robust.
Female
Figure B.4: Mean Differences by Mentee Gender
Note: This figure shows student outcomes by treatment status and gender. The top panel uses creditsfor which students registered in the summer term 2020 as outcome. The middle panel uses the creditsearned in the summer term as outcome. The bottom panel uses average GPA (running from 1=worst to4=best) among earned credits as outcome. In all panels, the control mean is calculated as the students’mean in the control group. Treatment effects, reported in the top center of each panel, are estimatedusing an OLS regression of the outcome on a treatment indicator, an indicator for students’ gender, andstudents’ credits earned in their first term. The treatment mean in the panel is calculated as the controlmean plus the estimated treatment effect. Standard errors reported are robust.
40

-40
-20
0
20
40
Cre
dits
regi
ster
ed fo
r in
sum
mer
term
0 10 20 30 40+
Credits in winter term
Male
-40
-20
0
20
40
Cre
dits
regi
ster
ed fo
r in
sum
mer
term
0 10 20 30 40+
Credits in winter term
Female
Figure B.5: Effects on Credits Registered for by Gender, by Credits Earned in WinterTerm
Note: This figure shows how students’ credits for which they registered in the summer term 2020 relateto students’ prior performance as measured by students’ credits earned in the winter term. The leftpanel shows the results for male students while the right panel shows the results for female students.The bubbles represent empirical differences between treatments, and the red solid lines indicate thetreatment effects obtained from the model yi = ∑3
j=0 β j · (xi)j + ∑3
j=0 γj · (xi)j · Ti + ui, where yi is the
outcome of interest, xi is our measure of prior performance, and Ti is an indicator for the treatmentgroup. The spikes indicate 95% confidence bands (Huber-White standard errors). One student in thesample passed 45 credits in the winter term and is included in group “40+” for better visibility.
41

-20
-10
0
10
20
30
Cre
dits
ear
ned
in s
umm
er te
rm
0 10 20 30 40+
Credits in winter term
Male
-20
-10
0
10
20
30
Cre
dits
ear
ned
in s
umm
er te
rm
0 10 20 30 40+
Credits in winter term
Female
Figure B.6: Effects on Credits Earned by Gender and by Credits Earned in Winter Term
Note: This figure shows how students’ credits earned in the summer term 2020 relate to students’ priorperformance as measured by students’ credits earned in the winter term. The left panel shows theresults for male students while the right panel shows the results for female students. The bubblesrepresent empirical differences between treatments, and the red solid lines indicate the treatment effectsobtained from the model yi = ∑3
j=0 β j · (xi)j + ∑3
j=0 γj · (xi)j · Ti + ui, where yi is the outcome of interest,
xi is our measure of prior performance, and Ti is an indicator for the treatment group. The spikesindicate 95% confidence bands (Huber-White standard errors). One student in the sample passed 45credits in the winter term and is included in group “40+” for better visibility.
42

B.5 Endogenous Stratification
Table B.2: Endogenous Stratification
Panel A: Credits registered for
Predicted Outcome Group: Low Middle High
(1) (2) (3)
Repeated split sampleCoefficient 0.91 1.03 1.47
Std. Err. 1.45 0.94 0.90
Leave-one-outCoefficient 0.98 0.80 1.56
Std. Err. 1.59 1.22 1.01
Panel B: Credits earned
(1) (2) (3)
Repeated split sampleCoefficient -1.19 -0.15 2.76
Std. Err. 1.01 1.11 0.93
Leave-one-outCoefficient -1.38 0.08 2.30
Std. Err. 1.06 1.19 0.98
Panel C: GPA
(1) (2) (3)
Repeated split sampleCoefficient 0.13 -0.01 -0.00
Std. Err. 0.09 0.08 0.08
Leave-one-outCoefficient 0.14 -0.01 -0.04
Std. Err. 0.09 0.09 0.08
Note: This table shows impacts of peer mentoring on administrative studentoutcomes by students’ predicted outcome group (“Group”), following the proceduresoutlined in Abadie et al. (2018) and using the Stata package estrat by Ferwerda(2014). We use students’ gender, students’ earned credits in the winter term, andstudents’ high-school GPA as predictors. All regressions control for student genderand earned credits in the winter term. We use 100 RSS repetitions and 500 bootstraprepetitions, with 338 treated and 342 untreated observations in Panels A and B, sincewe do not have information on the high-school GPA of 11 students. The “low” grouphas 226 observations, the “middle” group 222 observations, and the “high” group 232observations. In Panel C, we use 290 treated and 296 untreated observations since wecannot compute GPAs for students that do not pass any credits.
43

B.6 Treatment Effects by Students’ Origin Region
Table B.3: Treatment Effects by Region of Origin
Panel A: Credits registered for
Regional Other
ITT ITT IV ITT IV
(1) (2) (3) (4) (5)
Treatment 0.19 1.37∗ 3.51∗ -0.08 -0.17
(1.57) (0.78) (1.98) (1.57) (3.37)
Treatment · regional 1.19
(1.76)
Mean dep. 26.29 25.84 25.84 28.06 28.06
Obs. 679 542 542 137 137
Panel B: Credits earned
(1) (2) (3) (4) (5)
Treatment 1.23 0.37 0.96 0.85 1.86
(1.51) (0.66) (1.67) (1.57) (3.38)
Treatment · regional -0.84
(1.65)
Mean dep. 17.66 16.69 16.69 21.48 21.48
Obs. 679 542 542 137 137
Panel C: GPA
(1) (2) (3) (4) (5)
Treatment -0.01 0.04 0.10 0.01 0.01
(0.10) (0.06) (0.14) (0.10) (0.20)
Treatment · regional 0.05
(0.12)
Mean dep. 2.52 2.49 2.49 2.64 2.64
Obs. 585 464 464 121 121
Note: This table shows impacts of peer mentoring on administrative student outcomes by students’region of high-school graduation adapting equation 1. Students are labeled “regional” if they obtainedtheir high-school graduation certificate in one of the three subregions of the region where the universityis located. In each panel, the first column uses the baseline sample. After the first column, theeven-numbered columns use OLS regressions. The odd-numbered columns instrument a dummy forinitial program take-up by the (random) treatment assignment variable. Columns (2) and (3) use localstudents. Columns (4) and (5) use all other students. The regressions in Panel (a) use the number of creditsfor which students registered in the summer term 2020 as the dependent variable. The regressions in Panel(b) use the number of earned credits in the summer term as the dependent variable. The regressions inPanel (c) use students’ average GPA (running from 1=worst to 4=best) among earned credits in the summerterm as the dependent variable. The number of observations differs from Panels (a) and (b) since we haveseveral students who do not earn any credits. Standard errors are robust. * p<0.10, ** p<0.05, *** p<0.01
44

B.7 Mentor “Value-Added”
In this subsection, we provide results from a sort of “value-added” analysis where weregress students’ outcomes in the summer term on their performance in the winter term,their observable characteristics, and a mentor dummy. We label the estimated mentorfixed effect in each outcome dimension the mentor’s “value-added”. Specifically, weestimate the following equation:
yi = α + xiβ + µj + εi (2)
where yi is the respective outcome of student i in the summer term, Xi is a vector ofobservable characteristics including past performance (credits earned in the winterterm and high-school GPA), students’ gender and age, a dummy whether studentsare from the region where the university is located, whether students obtained theiruniversity entrance qualification abroad, whether they are part-time students, andwhether the are enrolled at university for the first time. µj is the fixed effect of mentorj, which we interpret as mentors’ value-added. Standard errors are robust.
Figure B.7 shows the results. We find that mentors differ substantially in theirvalue-added. The value-added estimates on earned credits range from -3 credits to7 additional credits conditional on students’ observables. We also test whether thevalue-added estimates are correlated across different outcomes measures in Table B.4.While mentors’ value-added on credits earned and registered for are strongly correlated(ρ=0.56,p < 0.05), both measures are not substantially correlated with value-added onGPA. We again caution that each mentor only advises up to 10 mentees, thus leading tosubstantial noise in the value-added estimates. However, the mentors were randomlyassigned to mentees, such that we do not have the problem of endogenous sortingof students to mentors common in the literature on teacher value-added. We alsoonly have 15 mentors, such that we cannot credibly identify the sources of mentors’performance differences.
45

0
.1
.2
.3
Den
sity
-4 -2 0 2 4
Mentor FE
(a) Credits registered for
.04
.06
.08
.1
.12
.14
Den
sity
-4 -2 0 2 4 6
Mentor FE
(b) Credits earned
.6
.8
1
1.2
1.4
1.6
Den
sity
-.4 -.2 0 .2 .4
Mentor FE
(c) GPA
Figure B.7: Kernel Density Plots of Mentor Value-Added
Note: This figure shows Kernel density plots of mentor value-added, µj, in Equation 2. Panel (a) usesthe number of registered credits in the summer term 2020 as outcome measure. Panel (b) uses earnedcredits in the same term as outcome measure. Panel (c) uses GPA among earned credits (running from1=worst to 4=best) as outcome measure.
46

Mentor value-added (earned credits)
Mentor value-added (credits registered for) 0.525∗∗
(0.044)
Mentor value-added (GPA) -0.060(0.832)
p-values in parentheses∗ p < 0.10, ∗∗ p < 0.05, ∗∗∗ p < 0.01
Table B.4: Pairwise Correlations of Mentor Value-Added
47

B.8 Treatment Effects by Subject
Table B.5: Treatment Effects by Module
Panel A: ITT Estimates
Dep. Var.: # passed Passed in ST # passed
Core ST Sales Fin. Statements Macro Micro Fin. Maths. Core WT
(1) (2) (3) (4) (5) (6) (7)
Treatment 0.08 -0.04 -0.02 0.05∗ 0.06∗ 0.03 -0.05(0.09) (0.03) (0.03) (0.03) (0.03) (0.04) (0.04)
Mean dep. 2.34 0.68 0.47 0.39 0.42 0.37Obs. 691 691 691 691 691 691 691
Panel B: IV Estimates
(1) (2) (3) (4) (5) (6) (7)
Treatment 0.19 -0.09 -0.06 0.13∗ 0.14∗ 0.06 -0.12(0.22) (0.07) (0.08) (0.07) (0.07) (0.09) (0.09)
Mean dep. 2.34 0.68 0.47 0.39 0.42 0.37Obs. 691 691 691 691 691 691 691
Note: This table shows impacts of peer mentoring on the likelihood of passing specific core courses, adaptingequation 1. Panel (A) uses OLS regressions. Panel (B) instruments a dummy for initial program take-up by the(random) treatment assignment variable. Column (1) uses the sum of passed summer term core courses in thesummer term 2020 as the dependent variable. The core courses in the summer term are Sales, Financial Statements,Macroeconomics, Microeconomics, Financial Mathematics, and a language course (not shown). Columns (2)through (6) use separate dummy for each core course as dependent variable. Column (7) uses the sum of passedcourses in the summer term that were core courses in the winter term as dependent variable. Standard errors arerobust. * p<0.10, ** p<0.05, *** p<0.01
48

C Additional Survey Information and Evidence
C.1 Survey Questions
In this table, we show the exact questions that we asked students in the survey. Thesurvey was conducted in German, which is the official language of the program. Inaddition to these questions, we asked students to list the exams they intend to sit,module by module.
Label QuestionMotivation I was able to motivate myself well during the virtual summer semester.Continuous studying I was able to cope well with the challenge of continuously studying for
courses during the virtual summer semester.Timely exam prep. In the virtual summer semester, I started my exam preparation on time.Clear contact person I was always able to find a suitable contact person for questions and problems
concerning my studies.Sufficient effort Measured against my goals for this semester, my effort to study during the
lecture period was sufficient.Student services I am satisfied with the individual services offered by the School of Business,
Economics and Society during the virtual summer semester.Communication Overall, I am satisfied with the way the School of Business, Economics and
Society communicated during the virtual summer semester.Cares for my success I feel that the people in charge at the School of Business, Economics and
Society care for my academic success.Takes my concerns seriously I feel that my individual concerns and problems as a student are taken
seriously at the School of Business, Economics and Society.Online content I am satisfied with how the online teaching was implemented content-wise in
the virtual summer semester.Technical implementation I am satisfied with how the online teaching was technically implemented in
the virtual summer semester.Contact to other students During the virtual summer semester, I regularly had contact to other students
from my semester to discuss study matters.Can work in principle Based on my experiences in the virtual summer semester, I believe that online
teaching at the university can work well in principle.Should play large role Based on my experiences in the virtual summer semester, I believe that online
teaching should play an important role at university in the future.Prob. timely graduation I estimate the probability that I will complete my studies within the
designated period of study (six semesters) at [ ] percent.
Table C.1: Survey Questions
49

C.2 Regression Results
Table C.2: Treatment Effects on Assessment of Own Motivation and Study Effort
Dep. Var.: Motivation Continuous studying Timely exam prep. Sufficient effort
ITT IV ITT IV ITT IV ITT IV
(1) (2) (3) (4) (5) (6) (7) (8)
Treatment 0.22∗ 0.46∗ 0.19∗ 0.40∗ 0.11 0.23 0.20∗∗ 0.42∗∗
(0.12) (0.25) (0.11) (0.23) (0.11) (0.22) (0.10) (0.21)
Mean dep. 2.71 2.71 2.93 2.93 2.99 2.99 3.18 3.18Obs. 404 404 404 404 404 404 404 404
Note: This table shows impacts of peer mentoring on on survey outcomes, adapting equation 1. The odd-numberedcolumns use OLS. The even-numbered columns use (random) treatment assignment variable as an instrument forinitial program take-up. All dependent variables are measured on a five-point Likert scale where higher outcomesindicated more agreement with the question. The questions underlying the dependent variables are: (Columns 1and 2); (Columns 3 and 4); Columns (5 and (6); and (Columns 7 and 8). Standard errors are robust. * p<0.10, **p<0.05, *** p<0.01
50

Tabl
eC
.3:T
reat
men
tEf
fect
son
Ass
essm
ent
ofD
epar
tmen
tSe
rvic
es
Dep
artm
ent
serv
ices
Dep
artm
ent
rela
tion
s
Dep
.Var
.:Su
ppor
tse
rvic
eC
omm
unic
atio
nC
lear
cont
act
pers
onC
ares
abou
tm
ysu
cces
sTa
kes
my
conc
erns
seri
ousl
y
ITT
IVIT
TIV
ITT
IVIT
TIV
ITT
IV
(1)
(2)
(3)
(4)
(5)
(6)
(7)
(8)
(9)
(10)
Trea
tmen
t0.
010.
03-0
.05
-0.0
90.
070.
150.
110.
220.
020.
04(0
.09)
(0.1
8)(0
.10)
(0.2
0)(0
.10)
(0.2
2)(0
.10)
(0.2
1)(0
.10)
(0.2
0)
Mea
nde
p.3.
513.
513.
563.
563.
233.
233.
163.
163.
443.
44O
bs.
404
404
404
404
404
404
404
404
404
404
Not
e:Th
ista
ble
show
sim
pact
sof
peer
men
tori
ngon
onsu
rvey
outc
omes
,ada
ptin
geq
uatio
n1.
The
odd-
num
bere
dco
lum
nsus
eO
LS.T
heev
en-n
umbe
red
colu
mns
use
(ran
dom
)tr
eatm
ent
assi
gnm
ent
vari
able
asan
inst
rum
ent
for
init
ialp
rogr
amta
ke-u
p.A
lld
epen
den
tva
riab
les
are
mea
sure
don
afiv
e-po
int
Like
rtsc
ale
whe
rehi
gher
outc
omes
indi
cate
dm
ore
agre
emen
tw
ithth
equ
estio
n.Th
equ
estio
nsun
derl
ying
the
depe
nden
tva
riab
les
are:
(Col
umns
1an
d2)
;(C
olum
ns3
and
4);C
olum
ns(5
and
(6);
and
(Col
umns
7an
d8)
.Sta
ndar
der
rors
are
robu
st.*
p<
0.10
,**
p<
0.05
,***
p<
0.01
51
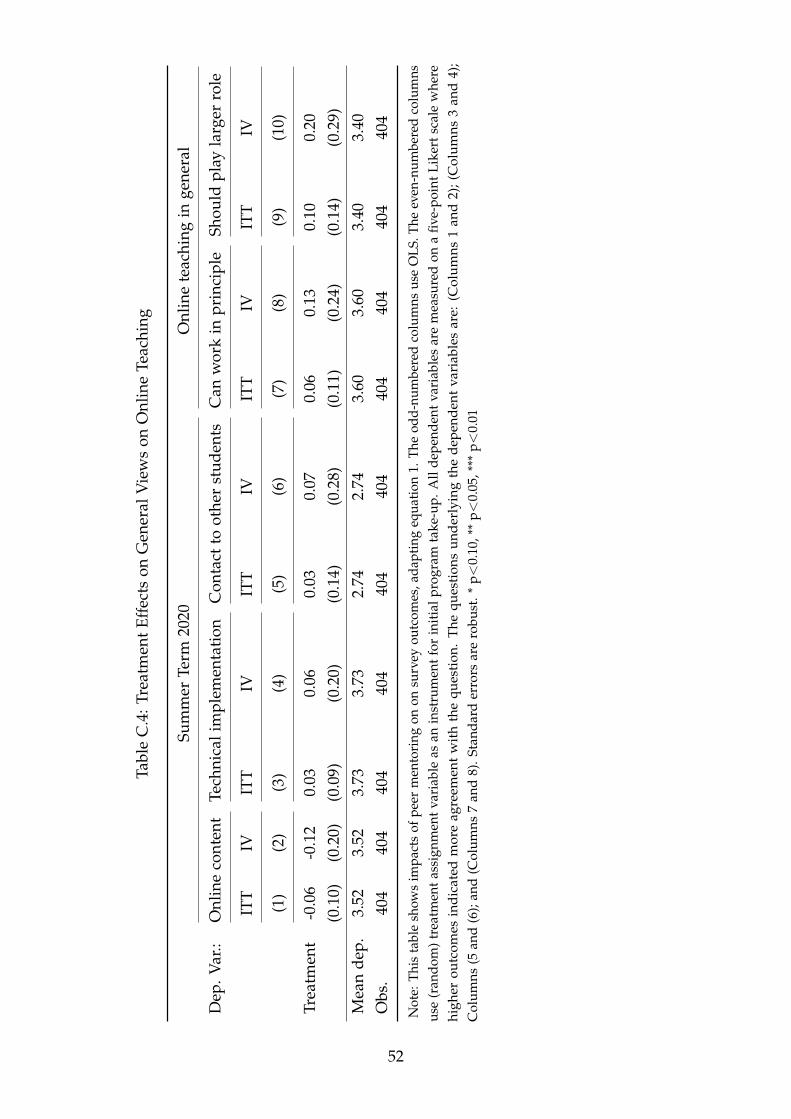
Tabl
eC
.4:T
reat
men
tEf
fect
son
Gen
eral
Vie
ws
onO
nlin
eTe
achi
ng
Sum
mer
Term
2020
Onl
ine
teac
hing
inge
nera
l
Dep
.Var
.:O
nlin
eco
nten
tTe
chni
cali
mpl
emen
tati
onC
onta
ctto
othe
rst
uden
tsC
anw
ork
inpr
inci
ple
Shou
ldpl
ayla
rger
role
ITT
IVIT
TIV
ITT
IVIT
TIV
ITT
IV
(1)
(2)
(3)
(4)
(5)
(6)
(7)
(8)
(9)
(10)
Trea
tmen
t-0
.06
-0.1
20.
030.
060.
030.
070.
060.
130.
100.
20(0
.10)
(0.2
0)(0
.09)
(0.2
0)(0
.14)
(0.2
8)(0
.11)
(0.2
4)(0
.14)
(0.2
9)
Mea
nde
p.3.
523.
523.
733.
732.
742.
743.
603.
603.
403.
40O
bs.
404
404
404
404
404
404
404
404
404
404
Not
e:Th
ista
ble
show
sim
pact
sof
peer
men
tori
ngon
onsu
rvey
outc
omes
,ada
ptin
geq
uatio
n1.
The
odd-
num
bere
dco
lum
nsus
eO
LS.T
heev
en-n
umbe
red
colu
mns
use
(ran
dom
)tr
eatm
ent
assi
gnm
ent
vari
able
asan
inst
rum
ent
for
init
ialp
rogr
amta
ke-u
p.A
llde
pend
ent
vari
able
sar
em
easu
red
ona
five-
poin
tLi
kert
scal
ew
here
high
erou
tcom
esin
dic
ated
mor
eag
reem
ent
wit
hth
equ
esti
on.
The
ques
tion
su
nder
lyin
gth
ed
epen
den
tva
riab
les
are:
(Col
um
ns1
and
2);(
Col
um
ns3
and
4);
Col
umns
(5an
d(6
);an
d(C
olum
ns7
and
8).S
tand
ard
erro
rsar
ero
bust
.*p<
0.10
,**
p<
0.05
,***
p<
0.01
52

C.3 Average Standardized Effects
Table C.5: Average Standardized Effects on Survey Outcomes
Assessment of..
Study behavior Department services Online teaching
(1) (2) (3)
Avg. effect 0.16∗∗ 0.03 0.02(0.08) (0.08) (0.07)
Obs. 404 404 404
Note: This table shows average standardized effects on survey outcomes by broad groupusing the methodology of Kling et al. (2004) and Clingingsmith et al. (2009). Standard errorsare robust. * p<0.10, ** p<0.05, *** p<0.01
53

C.4 Heterogeneity of Treatment Effects on Survey Outcomes by
Credits Earned in Winter Term
-4-2
02
4
Mot
ivat
ion
0 10 20 30 40+
Credits in winter term
(a) Motivation-4
-20
24
Con
tinu
ous
stud
ying
0 10 20 30 40+
Credits in winter term
(b) Continuous studying
-4-2
02
4
Tim
ely
exam
pre
p.
0 10 20 30 40+
Credits in winter term
(c) Timely exam prep.
-3-2
-10
12
Suffi
cien
t effo
rt
0 10 20 30 40+
Credits in winter term
(d) Sufficient effort
Figure C.1: Treatment Effects on Survey Outcomes by Credits Earned in Winter Term
Note: This figure shows how students’ survey responses relate to students’ prior performance asmeasured by students’ registered credits in the winter term, which was students’ first term at university.Panels (a) to (d) display heterogeneous treatment effects (relative to the control group) on students’responses to questions about their motivation during their summer term, their self-assessed abilityto study continuously in the summer term, their self-assessment of whether they prepared for examstimely, and their assessment of whether they studied enough to meet their goals in the summerterm, respectively. All responses are measured on a five-point Likert scale where higher valuessignal more agreement with the question or statement. The bubbles represent empirical differencesbetween treatments, and the red solid lines indicate the treatment effects obtained from the modelyi = ∑3
j=0 β j · (xi)j + ∑3
j=0 γj · (xi)j · Ti + ui, where yi is the outcome of interest, xi is our measure of
prior performance, and Ti is an indicator for the treatment group. The spikes indicate 95% confidencebands (Huber-White standard errors). One student in the sample passed 45 credits in the winter termand is included in group “40+” for better visibility.
54