Online Condition Monitoring System for Wind Turbine …830541/FULLTEXT01.pdf · Online Condition...
79
MEE10:109 Online Condition Monitoring System for Wind Turbine Case Study Asif Saeed Thesis in partial fulfillment for the degree of Master of Science in Electrical Engineering Blekinge Institute of Technology October 2008 Blekinge Institute of Technology School of Engineering Department of Applied Signal Processing Supervisor: Prof. Wlodek Kulesza Examiner: Prof. Wlodek Kulesza
Transcript of Online Condition Monitoring System for Wind Turbine …830541/FULLTEXT01.pdf · Online Condition...

MEE10:109
Online Condition Monitoring System for Wind Turbine
Case Study
Asif Saeed
Thesis in partial fulfillment for the degree of
Master of Science in Electrical Engineering
Blekinge Institute of Technology
October 2008
Blekinge Institute of Technology School of Engineering Department of Applied Signal Processing Supervisor: Prof. Wlodek Kulesza Examiner: Prof. Wlodek Kulesza

On Line Condition Monitoring System for Wind Turbine
On Line Condition Monitoring System for Wind Turbine
Case Study
Asif Saeed
Thesis in partial fulfillment for the degree of Master of Science in Electrical Engineering
Supervisor: Prof. Wlodek Kulesza
Sponsor: IUC Kalmar
Assist: Gila Control AB

On Line Condition Monitoring System for Wind Turbine
Distribution:
Blekinge Institute of Technology
School of Engineering
Department of Applied Signal Processing
University of Kalmar
Department of Technology
Phone: + 46 480 44 6300
Fax: + 46 480 44 6300
URL www.te.hik.se
E-mail: [email protected]
Gila Control AB
Gamla Revsuddevägen 4 380 30 Rockneby
Phone: + 46 480 66000/443400
Fax: + 46 480 66531
URL www.te.hik.se
E-mail: [email protected]
IUC Kalmar
Grondalsvägen 19B
SE -392 36
SWEDEN
Phone: + 46 480 45 1523
Fax: + 46 705 88 3505
URL www.iuc-kalmar.se

On Line Condition Monitoring System for Wind Turbine
Abstract:
Renewable energy plays a vital role in power industry to fulfil the growing demand of power in industrial sector and other utilities. Especially the wind power industry enormously expanded during the last few years. The fast expansion of the wind power market has also come with some problems that have been reported. The objective is to increase the reliability of wind turbine in order to prevent any break down, power outages and to increase the avaibility of the wind turbine generator.
The unforeseen failure of a component in a wind turbine or generator can have significant impact on the wind turbine economy; the right approach is to employ condition monitoring technique at every critical location of a wind turbine. The condition monitoring is a suitable method to prevent unplanned outages as a proactive maintenance strategy. Maintenance becomes vital for the preventation of unforeseen stoppages and complete break down of the machine in industrial facilities, their timely diagnosis and corrective measures can not be overseated. The prevention of catastrophic failures through early detection of incipient faults in the machine, increased the operational life with less failures and complete breakdown.
The study report focuses on the benefits for using a condition monitoring system for early fault detection. Various conventional and latest techniques of condition monitoring including signal processing methods for vibration analysis have been discussed. A basic frame work for the future work of condition monitoring system in wind turbine is also included. As a result of the study, the infrared thermography is proposed as an online condition monitoring for wind system, a thermographical approach has been proposed as a part of this thesis work. The infrared thermography technique is proposed as an integrated condition monitoring system to be used with the existing monitoring system as a retrofit design to increase the performance of early fault detection system.
Keywords: condition based maintenance, condition monitoring, maintenance system, vibration based maintenance, vibration monitoring, wind turbine condition monitoring.

On Line Condition Monitoring System for Wind Turbine
Acknowledgements:
Many thanks go the Almighty God for giving me this opportunity to be able to complete this thesis project.
I would like to thank my supervisor at the University of Kalmar Prof. Dr. Wlodek Kulesza for
taking time and giving me support and help during the entire period of my studies, has been and remain an asset in the future.
Many grateful thanks to Bodil Anjar of Gila Control for taking great interest in this work and giving
her valuable time and efforts.
I would also like to express sincere thanks to Erik Ciardi project coordinator in the Regional
Council in Kalmar County for his sincere efforts to arranged meeting with vattenfall.
I am also grateful to Pär Svensson (production chief) vattenfall for giving his valuable time in answering my technical questions during the meeting.
Furthermore, I would also like to thank Staffan Larsson at Kalmar Energy for giving technical
information about their wind turbines.
The project has been primarily financed by IUC Kalmar, which is gratefully acknowledged,
specially Jonathan Ramsden for talking interest to initiate this project.
Last but not least, I greatly appreciate and thank to PhD candidate François besnard for his fruitful discussion, advices and helpful suggestions.
Sincerely,
Asif Saeed
Kalmar, October 2008

Table of Contents
Chapter 1 Introduction 1. Introduction ……………………………..……………………………..…..……9
1.1 Problem setting and goal fo the study………………………………….….........10
1.2 Problem Analysis and overview of the report…………….…….…………....…11
Chapter 2 Wind turbine Basic
2.1 Wind turbine basic.............................................................................................. 14
2.2 The components of the wind power system ....................................................... 15
2.3 Overview of operation ........................................................................................ 20
2.4 Power Controlled Mechanism in Wind Turbines………………………..……..22
2.5 Data Acquisition system in wind turbine ........................................................... 25
Chapter 3 Condition Monitoring and Condition Based Maintenance
3.1 Condition Based Maintenance............................................................................... 28
3.2 Condition monitoring ............................................................................................ 32
3.3 Performance and Process parameters ………………………………….…..…….35
3.4 Sensor placement for Condition Monitoring System. .......................................... 39
3.6 Model for Condition monitoring system ……………………………...…….…...43
Chapter 4 Vibration Monitoring Based Maintenance
4.1 Vibration transducer ………………………………………………………..…....47
4.2 Feature monitoring indicator…………………………………………..….....…...49
4.3 Signal Processing Techniques ............................................................................... 54
4.3.1 Acceleration Enveloping…………………………………….…………………54
4.3 Signal Processing and Data Acquisition system for Vibration Analysis….…......56
4.3 Vibration Measurement System…………………………………………..….…..56
Chapter 5 Integration of Infrared Thermography in Condition Monitoring
5.1 Infrared Scan Process for Machine Health Monitoring. . ..................................... 59
5.2 Integration of Infrared Thermography with on line condition monitoring. ......... 61
5.3 The case study- Detection of rolling bearing degradation ................................... 62

Chapter 6 Conclusion, Suggestions and Future Work
6.1 Conclusion, Suggestions and Future Work. .................................................. …....68
References ……….…………………………………………………………...….…..70
Appendix A: Installation of Vibration sensors at different location of wind turbine converter.
Figure A1: vibration sensor installed at different location of turbine, sources.
Figure A2: installed at generator front bearing and at rear bearing locations.
Figure A3: sensors of Prűftechnik system mounted on main bearing and 2nd gearbox stage.
Figure A4: Vibration sensors on Gearbox and Generator.
Figure A5: Sensors at Turbine side.
Appendix B:
1. Information for Thermo Vision™ A320.
2. The IR control software for Diagnosis and prognosis to be used with Thermo Vision A320.
Appendix C:
1. Thermography Application papers-Inframation, The Thermography conference paper.
2. Detection of rolling bearing degradation using infrared thermography

Chapter 1 Introduction
The chapter is divided into four sections. The first section presents an introduction and objective to the problem, the second presents the task formulation and goal of this study project, the third deals with the limitation of the project work, the fourth gives an overview of the problem approach and methodology developed.

1. Introduction:
During the last few decades, wind power industries invested huge amount of money and resources to improve their productivity. The major goal was to optimize costs, operation, production, quality and time. In order to achieve this different improvement methods, tools and monitoring technique have been used to optimize the operation. Due to the high demand of uninterrupted operation in processing and other power industry, owners and stake holder focused on costs effective solution and total quality maintenance issues, this provoked the idea that led to the development of online condition monitoring system [1]. Large percentage of companies focuses on appropriate techniques, methods and mechanism that enable them to solve the problems in proactive fashion.
Due to large overheads in operation and maintenance of wind turbine specially in the off shore applications the owners and stake holders focus on the reliability and maintenance issues. For the wind turbine industry it is critical to cut cost on corrective maintenance and implement the proactive maintenance strategy. The state of the art maintenance strategy is defined by the implementation of online continuous condition monitoring system [2].
The application and implementation of condition monitoring system in rotating machines have a long history in the assets health management in thermal power plant and processing industries [3]. The technology has been further extended in the area of wind power industry, as wind firms are geographically spread over and usually located in remote areas, operational and maintenance cost should be reconsidered. The application and setup of centralized monitoring system for continuous monitoring of large number of identical machines need to be considered in monitoring strategy. To remotely monitor the condition of a wind turbine system requires a system for data acquisition and further processing of physical parameter. Whenever deterioration on a machine component initiates to develop, the physical properties and dynamic behaviour of this component are changed. Monitoring particular parameters from machine components allows us to identify failure modes related to that particular problem. The main advantage and benefit of implementing condition monitoring is to monitor the present condition of the component and the major goal is to increase the level of over all performance and efficiency of the machine, reduce frequency of break down and increase productivity. The second primary objective is to observe the condition of the wear tears in the component before it completely worns out and causes unplanned outage for maintenance [4]. By using condition monitoring technique or condition based maintenance; the maintenance staff carries out maintenance action accordingly when it is needed or as soon as the machine is available for shutdown to carry out maintenance work [5].
As it comes from the statistics, the majority of wind turbine failures appear to be initiated in the bearings. As a mater of fact; in the past few years the gear box failures are being reported even with latest robust design consideration and state of art production facilities for gearbox, generator and other wind turbine components, [6].
The study work has been sponsored by IUC Kalmar and assisted by Gila Control. IUC Kalmar is involved in the development of industries in Kalmar region and Gila Control, is preliminary involved in providing solution in the area of automation and control for different industries.
The major wind turbine manufactures are placed in Denmark and Germany; some components are manufactured in England, so it is vital to develop some parts, components, electrical and control systems, on line monitoring systems and even full wind turbines in Sweden to take active part in the development of wind turbine economy and to fulfil the indispensable requirements in this ever growing environmental friendly power industry. The Department of Regional Council in Kalmar county plays a role in the development of wind firms in Kalmar region, both on shore and off shore.
1.1 Problems setting and goal of the study:
The unforeseen failures of a component in a wind turbine or generator have significant impact on the wind turbine economy. The right approach is to employ a condition monitoring technique at every critical location of a wind turbine. The condition monitoring is the suitable method to prevent unplanned outages through health monitoring as a proactive maintenance strategy. By continuous supervision of a dynamic behaviour, incipient faults, anomalies and any wear tear within the machine can be easily detected much before the failure. This does not only prevent the complete failure, system interruption or bad quality production but also stops the secondary defect that can be induced to other parts of the machine and causes damages to other expensive parts of turbines [7].
The research question has been formulated based on the above problem discussion, “which
condition monitoring techniques and methods used for the early detection of incipient fault in a
rotating machine are most suitable for wind turbine converter”.
The goals of this study project cover three main areas.
1. To understand benefits of an online condition monitoring for wind turbine system.
2. To find out and discuss suitable techniques and methods available for fault identification of rotating machines.
3. To improve the existing condition monitoring system by integrating with another suitable condition monitoring technique, which is effective in detection and indication of incipient faults in gearbox of wind turbine.
The structure and design of the study and the methods of data collection is showed in the Fig. 1.1. The main steps for any researcher are to build and establish a framework through which the entire process of research work can be conducted according to guidelines provided by established frameworks. The first step towards this work is to define the methodology that is appropriate and suitable for the given task, which is given in the problem formulation section. The author first selected the company to initiate the work in the designated area; the second step in this study that has been carried out is to decide the aim of this case study work in the area of interest.

It is useful to determine the boundaries of the project to delineate it from similar projects already undertaken, further progress has been made by conducted search scientific papers and journals form different data bases to acquire the knowledge in the selected area. We are confident that there are some steps involved in the process of data collection in the research process. The data collection technique in this work is categorized in two types: primary data which comprises of data collection through company visits, telephone calls, questionnaire and company web site; and the secondary data which includes scientific papers study, Internet sources and text books. Findings and study collected data has been treated and summarized according to given set of rules as defined by the researchers. Data analysis is employed to examine the relationship of components mutually and with the physical existing system. Finally the case study presenting conclusion and recommendations based on the problem setting and goals of the study.
Fig. 1.1. Problem approach and methodology used in this case study project.
1.2 Problem Analysis and overview of the report:
To analyse the problems reported in wind turbine system and for an effective use of predictive condition based maintenance approach, the study reports the latest developed methods and techniques in monitoring the health of components. The benefits for using a condition monitoring system for early fault detection has also been analyzed. Different conventional and new techniques have been discussed in detail as a condition monitoring indicators and techniques for a wind turbine gear box, rotor and bearings. In the last section of the report an infrared thermography approach has been proposed as a part of this thesis work. The infrared thermography technique has been proposed as a retrofit design to use as an integrated part of existing condition monitoring system (CMS) in order to increase the over all performance of early fault detection system.
Aim of case study Scientific papers search
Conclusions/
Recommendation
Finding/Result
Analysis
Choice of company
Data Collection
Primary data
• Visit to company • Telephone calls • Questionnaire • Company web site Secondary data
• Scientific papers study • Internet sources • Text books

This study is limited to theoretical discussion of the condition monitoring techniques and monitoring parameters. Also the major components of wind turbine and model of condition monitoring system are analyzed. There is no detailed work carried out in practical level to further explore the possibilities of improvement in the interested area.
Chapter 1 - The chapter is divided into three sections. The first section presents an introduction and objective to the problem; the second presents the task formulation and goal of this study project; the third deals with the limitation of the project work, the fourth gives an overview of the problem approach and methodology developed.
Chapter 2 – The chapter is divided into three sections. The first section presents an introduction to wind turbine followed by wind turbine components, the section also describes the overview of operation of wind turbine. The second presents the types of wind turbine including the description of its major components.
Chapter 3 – The chapter is divided into four sections. The first section presents the theory of condition based maintenance, followed by condition monitoring and condition monitoring techniques, the next section presents the measurement requirement for process parameters and for condition based maintenance. The third section presents the feature extraction method to be used as condition monitoring indicator followed by, signal processing theory. The forth section is a subsequent of last chapters, the discussion starts with the object model for condition monitoring system. The chapter further progresses with the condition monitoring on wind turbine with detailed theory on sensor equipment for condition monitoring System in order to give the basic requirements for the monitoring system.
Chapter 4- This chapter divided into two sections, the first section presents the vibration monitoring based maintenance for monitoring and diagnostic of machine. The next section present the recent development in vibration measurement for vibration monitoring program.
Chapter 5- The chapter is divided into three sections. The first section presents the overview of infrared thermography as a condition monitoring technique, the section further covers about the integration of infrared thermography with online condition monitoring, which is the proposed of this thesis work. The second section presents the experiment on “detection of rolling bearing degradation using infrared thermography” The experiment result clear shows the correlation between the vibration and the temperature of the monitoring system. The experiment is presented here, in order to support and validate the idea of using an infrared thermography as a condition monitoring technique.
Chapter 6- This chapter presents the conclusion and recommendations of this thesis report. The chapter is divided into two sections to give the conclusion and recommendations of the study. The first section presents the conclusion and the second section come up with the suggestions which include future work for wind turbine.

Chapter 2 Wind Turbine Basic
“The development of wind turbine power generation has been expanding during the past years. The global market for the electrical power produced by the wind turbine generator (WTG) has been increasing steadily, which directly pushes the wind technology into a more competitive arena. Recently, there have been positive trends shown by the utilities to offer renewable energy to customers. Many customers who are environmentally conscious now have the option of subscribing to clean energy such as wind energy from the power provider. The European market has shown an ever-increasing demand for wind turbines” [8].

Chapter. 2. Wind Turbine Basic
2.1 Wind Turbine Basic:
A wind turbine defined as a rotating machine which converts kinetic energy extracted from the wind through the rotating blades of wind turbine to mechanical energy. If this mechanical energy is converted to electricity through induction generator, the machine is called the wind turbine or wind energy converter (WEC). Figure 2.1 shows the basic components of wind turbine system. In this chapter we present a brief overview about wind turbine, its basic components and principle of operation [9].
Figure 2.1. Basic components of wind turbine system.
Latest wind turbines consist of six major components this include the rotor, nacelle, tower, gear box, generator and balance of the system. The rotor is connected to the blades through a hub. The rotor blade then extracts kinetic energy from the wind and converts into mechanical energy, the hub supports the blades. Modern wind turbines also have a pitch mechanism that controls and changes the angle of the blade depending on the speed of wind and the rotation speed as desired. The enclosure at the top of the tower is nacelle which is the main structure and contains major components like the turbine generation, electronic control system and interface to connect with the power grid. The modern turbine also has an online condition monitoring system for continuous monitoring of dynamic behaviour of WEC. The whole structure of wind turbine is supported by a tower, which also raises nacelle to a height where maximum wind speeds can be extract that in turn maximizes energy extraction from wind. Recent development in wind turbine come up with different type and range of rotor diameter these are typically from 60 to 100 meters high, with blades up to 100 meters in diameter. At the ground level the electrical control and monitoring system are required to connect the turbine with the power grid for transmission of electricity to utilities. Figure 2.2 provides a schematic view of wind turbine and its component [10].
Wind
Rotor Blades
Hub
Tower
Nacelle

Chapter. 2. Wind Turbine Basic
Figure 2.2. Major components of wind turbine [11].
2.2 The components of the wind power system:
In addition to major components of the wind turbine there are several other mechanical, hydraulic and electrical systems that make the complete wind turbine generator, Fig 2.3 shows the major components of a turbine necessary for any wind turbine generator [22].
Figure 2.3 Overview of a major components of a Wind Power Plant sources [23].
The hub connects the turbine blades so it serves as cantered construction and servers as terminal by connecting the blades to the rotor shaft of the wind turbine. There is a number of structural design of hub, generally employed cast iron for its construction due to the reason that it is cheap and strong in compression. Blades are bolted to the hub flanges and the glued in the blade rotor [24]. Figure 2.3 shows the real view of hub. The hub also contains the mechanical and electrical system for control the blades position.
Nacelle
Hub
Rotor Blades
Tower
Wind
Chapter. 2. Wind Turbine Basic
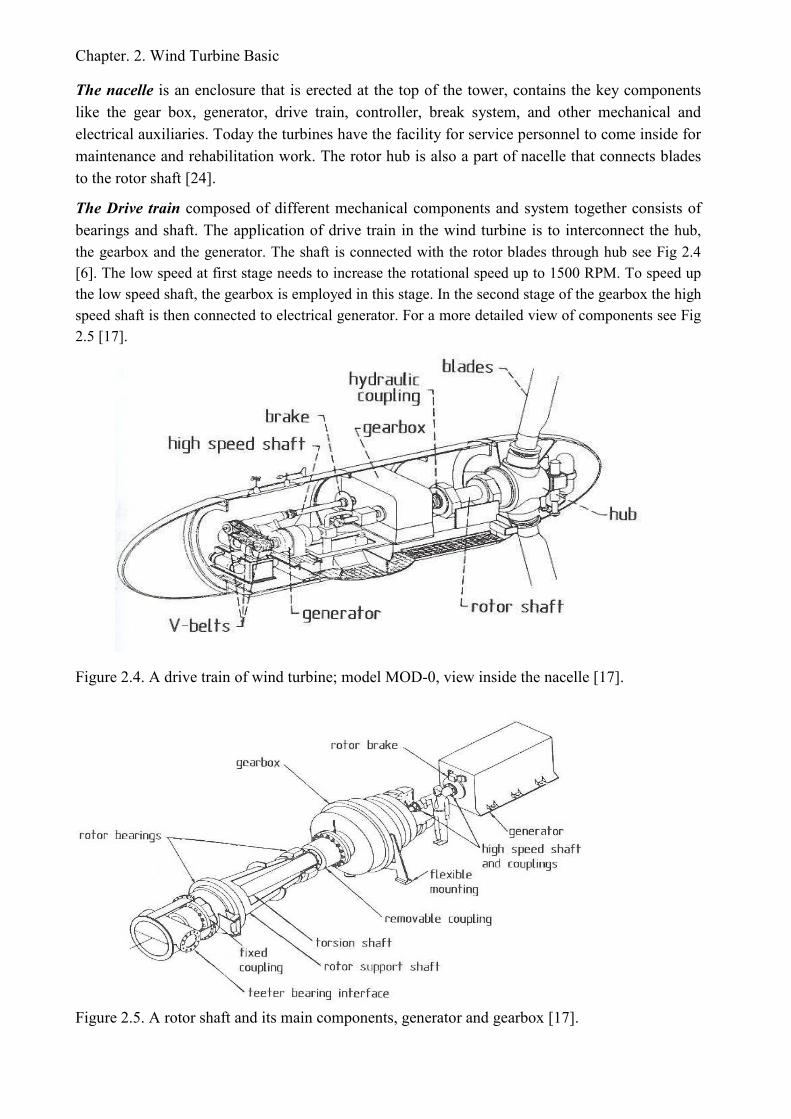
The nacelle is an enclosure that is erected at the top of the tower, contains the key components like the gear box, generator, drive train, controller, break system, and other mechanical and electrical auxiliaries. Today the turbines have the facility for service personnel to come inside for maintenance and rehabilitation work. The rotor hub is also a part of nacelle that connects blades to the rotor shaft [24].
The Drive train composed of different mechanical components and system together consists of bearings and shaft. The application of drive train in the wind turbine is to interconnect the hub, the gearbox and the generator. The shaft is connected with the rotor blades through hub see Fig 2.4 [6]. The low speed at first stage needs to increase the rotational speed up to 1500 RPM. To speed up the low speed shaft, the gearbox is employed in this stage. In the second stage of the gearbox the high speed shaft is then connected to electrical generator. For a more detailed view of components see Fig 2.5 [17].
Figure 2.4. A drive train of wind turbine; model MOD-0, view inside the nacelle [17].
Figure 2.5. A rotor shaft and its main components, generator and gearbox [17].
Chapter. 2. Wind Turbine Basic
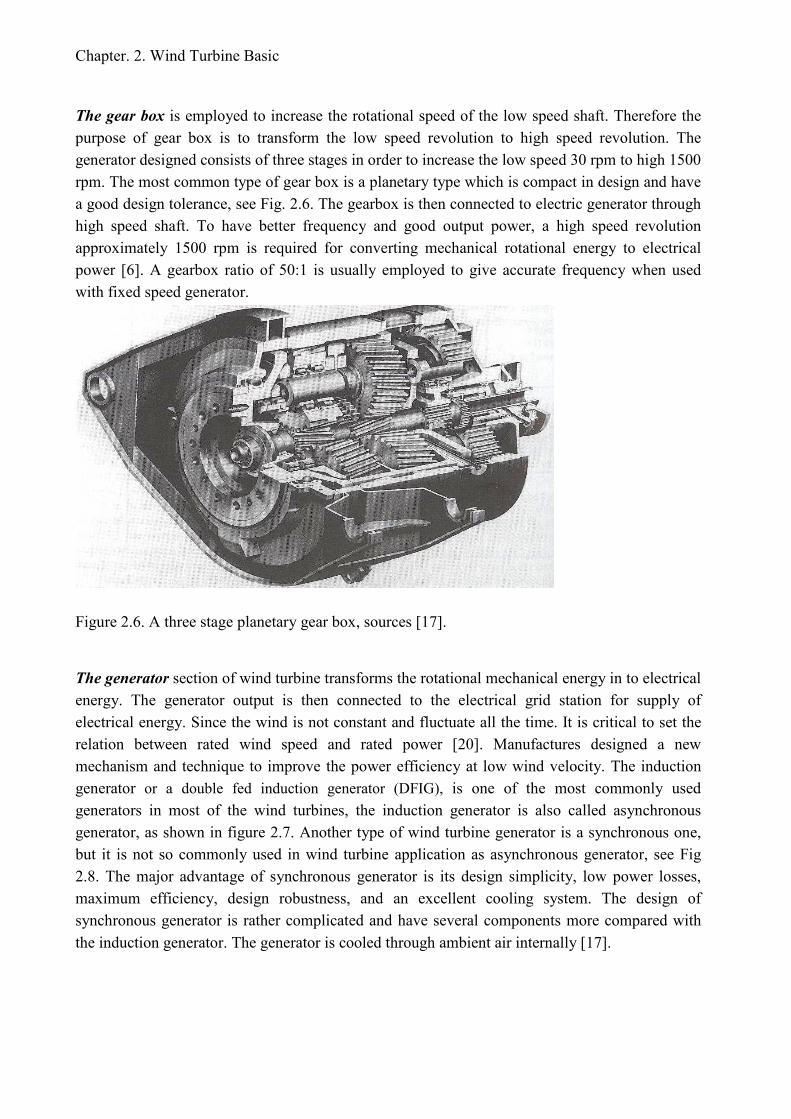
The gear box is employed to increase the rotational speed of the low speed shaft. Therefore the purpose of gear box is to transform the low speed revolution to high speed revolution. The generator designed consists of three stages in order to increase the low speed 30 rpm to high 1500 rpm. The most common type of gear box is a planetary type which is compact in design and have a good design tolerance, see Fig. 2.6. The gearbox is then connected to electric generator through high speed shaft. To have better frequency and good output power, a high speed revolution approximately 1500 rpm is required for converting mechanical rotational energy to electrical power [6]. A gearbox ratio of 50:1 is usually employed to give accurate frequency when used with fixed speed generator.
Figure 2.6. A three stage planetary gear box, sources [17].
The generator section of wind turbine transforms the rotational mechanical energy in to electrical energy. The generator output is then connected to the electrical grid station for supply of electrical energy. Since the wind is not constant and fluctuate all the time. It is critical to set the relation between rated wind speed and rated power [20]. Manufactures designed a new mechanism and technique to improve the power efficiency at low wind velocity. The induction generator or a double fed induction generator (DFIG), is one of the most commonly used generators in most of the wind turbines, the induction generator is also called asynchronous generator, as shown in figure 2.7. Another type of wind turbine generator is a synchronous one, but it is not so commonly used in wind turbine application as asynchronous generator, see Fig 2.8. The major advantage of synchronous generator is its design simplicity, low power losses, maximum efficiency, design robustness, and an excellent cooling system. The design of synchronous generator is rather complicated and have several components more compared with the induction generator. The generator is cooled through ambient air internally [17].

Chapter. 2. Wind Turbine Basic
Figure 2.7. A double feed induction generator of variable speed drive [25].
Figure 2.8. An Induction generator, manufacturer by AEG [17]. 1. End shield input side 2.End shield non -input side 3. Stator winding 4. Stator lamination 5. Housing 6. Rotor 7. Internal fan 8. Shield 9. Terminal board. 10 Terminal box 11. Outer bearing cover. 12. Inner bearing cover 13. Rolling bearing.

Chapter. 2. Wind Turbine Basic
To extract the maximum energy from the wind flow it is vital to align the rotor axis with the wind direction. Horizontal wind turbine commonly has forced yaw mechanism. The motor driven yaw mechanism or yaw drive are responsible to automatically set the orientation of the nacelle with the wind direction. In this arrangement an electrical or hydraulic system are responsible to align the machine with the wind direction. The yaw system works as an independent subsystem in wind turbine. Considering the construction of yaw system, some of its parts are assembled inside the nacelle and some parts at the top of the tower head [17]. The dammed and flexible joint between the nacelle and the tower is one the important issue in yaw mechanism. A flexible coupling is installed for shock absorbing and to sustain damping, in between the worm-wheel reduction and the pinion in view of its dampening and shock absorbing properties, see Fig 2.9 [26].
Figure 2.9. A yaw drive system of Enercon E-40; model NM-52 for [17].
The power system in any wind turbine comprises of all necessary system and equipment that is vital for converting mechanical energy in to electrical power. The electrical section also contains the electronic control system for smoothing, noise reduction, frequency and voltage regulation and over load protection. The section also contains other control auxiliaries with input and output circuit protection circuit, including grid interface circuit to connect with the main distribution supply. Figure 2.10 presents the one line diagram for electrical system in wind power system [17].

Chapter. 2. Wind Turbine Basic
Figure 2.10. A schematic diagram of electrical system of wind asynchronous generator. [25].
2.3 Overview of operations:
The principle of generating electricity is common in all types of wind turbine. The wind turbine extracts energy from wind through a rotor, which consists of blades that aerodynamically convert the wind energy into mechanical energy by employing a slow speed shaft. Mechanical torque generated through aerodynamic lift through a rotor blade is then transformed to rotating shaft. The hub of the rotor is attached to the low speed shaft of the wind turbine. The low speed shaft further is connected to the mechanical transmission or a gearbox that increases the rotor-shaft speed for the generator. Both these components are installed in the nacelle. At the other end of the gear box rotating shaft is connected to the electrical generator, which then converts the mechanical torque in to electromagnetic torque. At the time when the wind is very slow or in case if there is no wind the blades remain at a 45-degree angle in order to extract maximum energy from the winds [12]. When the wind strikes to the rotor blade which is connected to rotor hub, it creates positive pressure on the front of the blade of and negative pressure behind it. This difference in wind pressure turn the rotor of wind turbine [13]. Considering a 600 kW wind turbine the speed of rotor blades rotates about 19 to 30 revolutions per minute (RPM). The shaft which is connected with the hydraulics brake to allow the aerodynamic brakes for normal break operation. The gearbox which then increases the low speed shaft to high speed rotation approximately 50 times faster than the speed at low speed shaft. The wind turbine is also connected with a mechanical disc break for an emergency stoppage, in the condition if aerodynamic break is failed or in the case if the turbine takes out of service for maintenance.
As wind in not constant all the time and fluctuates at every instant, therefore different control mechanisms are being employed to control and monitor the transformation process and protect and guard the mechanical and electrical subsystem in the wind turbine against extreme uncontrol weather condition that could operates wind turbine in continuous extreme operating condition and leads to catastrophic failure [14].

Chapter. 2. Wind Turbine Basic
The wind turbine controller consists of a number of computers which continuously monitor the condition of the wind turbine and collect statistics on its operation. The controller also controls switches, hydraulic pumps, valves, yawing and motors within the wind turbine [15]. The configuration of gearbox depends on the type of wind turbine. As an example V29-225 kW is a two stage turbine with parallels shafts arrangement, but in V66-1,65MW the gear box is combined with planetary and helical arrangement of gear types. The electrical generator installed in wind turbine is commonly an induction generator type or an asynchronous generator. The wind turbines which are 660 kW and more are equipped with two generators in order to lower the over all noise level and also increase the output of generator. In the low capacity wind turbine like 225 kW the generator has changeable option to change the number of poles for generation of electricity usually changes between 8 poles as the little generator and 6 poles as the big generator, so in this case the rotor has two different speeds depending on the number of poles being connected with the generator. There a number of computers and supervisory control mechanism installed for continuously monitoring the dynamic behaviour of WEC. Please refer to Figure 2.12 for complete rear view and inside of the wind turbine system respectively. The control hierarchy and major subsystem are illustrated in Figure 2.11 showing the generalized model of wind turbine [14].
Figure 2.11 Generalized wind turbine model with control elements and hierarchy [16].
Wind Drive Train
Aerodyn.
Torque
Master Controller
Electrical Generator
Grid Interface
Power Grid
Mechanical Control
Mechanical Prtotection
Electrical Control
Electrical Prtotection
Voltage
Electric Power
Chapter. 2. Wind Turbine Basic
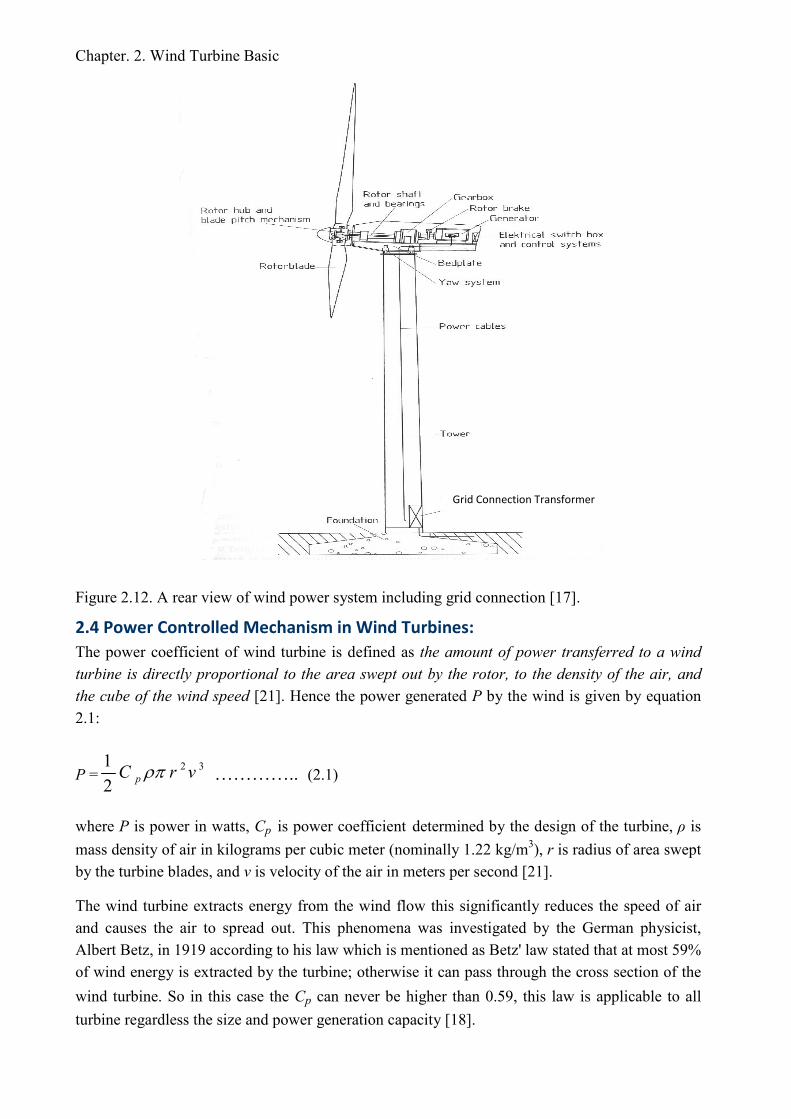
Figure 2.12. A rear view of wind power system including grid connection [17].
2.4 Power Controlled Mechanism in Wind Turbines: The power coefficient of wind turbine is defined as the amount of power transferred to a wind turbine is directly proportional to the area swept out by the rotor, to the density of the air, and the cube of the wind speed [21]. Hence the power generated P by the wind is given by equation 2.1:
P =32
21
vrC p ρπ ………….. (2.1)
where P is power in watts, Cp is power coefficient determined by the design of the turbine, ρ is mass density of air in kilograms per cubic meter (nominally 1.22 kg/m3), r is radius of area swept by the turbine blades, and v is velocity of the air in meters per second [21].
The wind turbine extracts energy from the wind flow this significantly reduces the speed of air and causes the air to spread out. This phenomena was investigated by the German physicist, Albert Betz, in 1919 according to his law which is mentioned as Betz' law stated that at most 59% of wind energy is extracted by the turbine; otherwise it can pass through the cross section of the
wind turbine. So in this case the Cp can never be higher than 0.59, this law is applicable to all turbine regardless the size and power generation capacity [18].
Grid Connection Transformer

Chapter. 2. Wind Turbine Basic
Mechanically, the turbine must be protected from rotational speeds above some value that could lead to catastrophic failure. Mechanical brakes are provided for stopping the turbine in emergency conditions, but are not used in normal operations. Controlling the power (and hence, torque) extracted from the moving air stream is the primary means for protecting the turbine from over-speed and emergency shutdown conditions. In fairly steady conditions, the power extracted from the air stream by the turbine blades can be characterized by equation (2.1). Since the wind speed and air density cannot be controlled, and the radius of the blades is fixed, the performance coefficient is the only means for torque control. In some wind turbines, blades are designed so
that Cp falls dramatically at high wind speed. This method of aerodynamic torque control is known as stall regulation, and is limited to preventing turbine over-speed during extreme gust conditions and limiting maximum shaft power to around the rating value in winds at or above the rated value. Large wind turbines employ a more sophisticated method of aerodynamic torque regulation that has benefits in addition to preventing mechanical over-speed. The performance coefficient can also be changed by adjusting the “angle of attack” of the blades, as it is done on some modern propeller-driven aircraft. Blade pitch adjustment allows the energy capture to be optimized over a wide range of wind speeds (even if the rotational speed of the shaft is relatively constant), while still providing for over-speed protection through large adjustments in pitch angle. Rotational speeds of large wind turbines are limited by maximum tip-speed ratios, and so for megawatt-class turbines with long blades are relatively low, in the 15 to 30 rpm range. With conventional electrical generators, a gearbox is necessary to match the generator speed to the blade speed [16].
The main purpose of a control system is to control the turbine according to given set points. The control system takes feedback from the sensors installed at different locations of the wind turbine that gives information about the wind speed, wind direction, yaw angle and power output to optimize the yaw and pitch of the turbine. The sequence and control section receives inputs from the sensors installed at different location, inside and outside the nacelle then takes appropriate measures to set the wind turbine as per operating condition according to predefined values stored inside the system by the manufacturer and some operating variables from the operator. Figure 2.13 shows the one line diagram of the control and sequence system of the wind turbine. The purpose of the operation control sequence or control system is to supervise the wind turbine and then generate the control sequence signal to take the appropriate measure to control, optimize and increase the efficiency of the wind turbine [29].
By considering the economical perspective it is not physible to design the turbine at higher wind speed rate. It is critical to limit and regulate the speed and power output at high wind speed. The high speed wind leads to runway that overloads the rotor that in turn causes the shaft to rotate at a very high speed causes overloaded to mechanical drive train transmission components, such overloading condition leads to catastrophic failure [19]. To address this issue two types of wind turbine are being in production which are based on pitch controlled and stall controlled mechanism [20].

Chapter. 2. Wind Turbine Basic
Figure 2.13. The one line diagram of the control and sequence system of the wind turbine [29].
(i)- Pitch Controlled Wind Turbines:
Ingenious methods were developed to control the pitch or the angle of attack that a rotor airfoil presents to the wind stream. In a spring operated mechanism, the higher rotational speed of the rotor generates a centrifugal force on a regulating balancing weight which compresses a spring. The compressed spring tends to restore the airfoil to its original angle of attack once the wind speed decreases. In pitch power controlled wind turbines an electronic controller senses the power output of the turbine several times per second. If the power level exceeds a prescribed safe level, an electronic signal is generated which turns or pitches the blades out of the wind. Different hi-tech state of the arts method were developed to control the pitch [19].
(ii)- Active Stall Controlled Wind Turbines:
Large wind turbines that have generating capacity more then 1 MW are installed with active stall power control mechanisms [19]. Otherwise it is not possible to achieve all the operating conditions at satisfactory level by employing only one fixed blade pitch angle. The operation that involves a number of different blade pitch angles employing an active stall controlled method.
The control of blade pitch angle depends the number of parameters; these control parameters have different set points for desired operation of wind turbine to control rotational speed, power, temperature, wind velocity, altitude and temperature changes [17]. To achieve a maximum torque at low wind speed condition this control mechanism pitches the blades at low wind velocity. As soon as the turbine generates a maximum rated power at this time the stall control mechanism works in a different mode then pitch controlled mechanism.
Gear Box
Power control system
Control system/ operational sequence control
Generator Transformer Rotor torque
Rotor speed
Wind velocity
Instructions of the operator
Opeartional conditions
Electrical torque (with variable speed generators)

Chapter. 2. Wind Turbine Basic
During the condition when the electrical generator is overloaded due to large wind, the control system pitches the rotor blade in an opposite direction and instead of increasing the angle of attack for the air it now decreases the angle of attack which reduces lift and thus decreases the rotational speed [19]. From the above discussion the operating mechanism of active stall is now understood that when the wind velocity increases it starts to increase the power of turbine, but once the power is reached to maximum rated power, the active stall mechanism starts to work in different way and thus reduces the angle of attack that in turn reduces the power. During this process the output power increases gradually after the cut point reached at maximum wind speed.
2.5 Data Acquisition System in wind turbine:
Mostly in the conventional wind turbine there are 30 to 50 monitoring sensors to measure the critical parameter like, temperature, wind direction, pressure, vibration, rotation counter, humidity, oil viscosity sensor. The wind turbines having rated output power greater then 1 MW are equipped with online condition monitoring system for continuous monitoring of above mentioned parameters at designated locations of wind turbine. The condition monitoring system for wind turbine gear box is a very basic type that is installed only for monitoring the measure parameters for the gear box of wind turbine [6].
Figure 2.14. The general architecture of data acquisition system in wind turbine [22].
Data
Turbine/Generator
PLC-1 DSM Main Server
Control System
Networking switching cabinet
Network switch
PLC-2 (Redundant)
Data from other turbines
Wind Firm
Sensors
SCADA Network

Chapter. 2. Wind Turbine Basic
In the modern wind turbine, specially in wind farm where there are a number of wind turbines, the condition monitoring system is integrated with the data acquisition system to make a complete supervisory and control data acquisition system to hook with the other wind turbine, Figure 2.14 show the general architecture of data acquisition system.
By installing different transducer like strain gauges, accelerometers, force and displacement sensors, anemometers, and different measurement instruments for electric measurements, there are approximately 200 test points that store in the data acquisition system, these signals are then amplified and sampled at a predetermined time rate through multiplexer the signal is then converted to digital data and now this digital information further converted to serial data stream by applying pulse code modulation technique (PCM) [17]. In this arrangement the transducer collected signals from different points of turbine for continuous monitoring are then collected by the dynamic scanning module (DSM), after received by the DSM module, the information then sends through supervisory and control data acquisition network (SCADA), where it is finally received by the main server computer for data processing, storage and analysis purpose. The server computer is also connected with control system to send the information about torque, gearbox, vibration, ambient temperature, generator, blade angle, yaw position, wind speed and wind direction [28].

Chapter. 3. Condition Monitoring Based Maintenance
Chapter 3
Condition Monitoring Based Maintenance
“The application of condition monitoring techniques has for decades been an integral part of asset management in thermal power plants, and the technology has in recent years increasingly been adopted by the wind power industry. The general capabilities of the vibration condition monitoring technology are therefore well known, but the adaptation to wind turbines has proven challenging due to inherent physical conditions such as rapidly varying loads and non-rigid machine foundations”[31].
The chapter is divided into four sections. The first section presents the theory of condition based maintenance, the chapter further progress by condition monitoring techniques, the second section gives the theory for performance and process parameters measurement for wind turbine. The third section presents the feature extraction method to be used as condition monitoring indicator followed by, signal processing theory. The forth section is a subsequent of last chapters, the discussion starts with the object model for condition monitoring system. The chapter further progresses with the condition monitoring on wind turbine with detailed theory on sensor equipment for condition monitoring System in order to give the basic requirements for the monitoring system.

Chapter. 3. Condition Monitoring Based Maintenance
3.1 Condition Based Maintenance:
Maintenance can be defined as actions that are taken to extend the life of a machine. The combination of all technical and administrative actions, including supervision actions, intended to monitor, control and retain an item, machine or process in, or restore it to, a state in which it can perform a required function [1]. Today, most maintenance actions are carried out by either the predetermined preventive or the corrective approach. The predetermined preventive approach has fixed maintenance intervals in order to prevent components, sub-systems or systems to degrade. Corrective maintenance is performed after an obvious fault or breakdown has occurred [32].
Figure 3.1: Different maintenance strategies [32].
The preventive maintenance is performed regularly to postpone failures or to prevent failures from occurring, and it includes periodic and condition based maintenance. Figure 3.1 shows the overall maintenance strategy being practiced. .
Maintenance
Preventive Corrective
Condition
Monitoring
Periodic
Online,
Periodic
Surveillance,
ISI
Prioritize and Schedule
Work
Service Equipment
Conditions Acceptable
stop Acceptable?
Post Maintenance
Test
Calendar or Operating Hour Dependant
Perform Work Planning on Equipment
Failures Work
Yes
Yes
No
No
Chapter. 3. Condition Monitoring Based Maintenance
Condition based maintenance (CBM) is defined as a set of tasks to execute for the detection of incipient fault of the machine to prevent any failure or major breakdown that prevent the normal operation. The CBM determines when the actions are needed to be performed [30]. Condition monitoring of the system may consist of online continuous or offline monitoring. In online monitoring it monitors the current status of the health of the component by monitoring the trend of the functional condition of the equipment in a predefined interval, so it serves as a watch dog, [33].
Condition based maintenance is a preventive maintenance type utilized in order to dynamically plan maintenance, can also be defined as: preventive maintenance based on performance and/or parameter monitoring and the subsequent actions [34], or as a set of maintenance actions based on real-time or near-real time assessment of equipment condition which is obtained from embedded sensors. Figure 3.2 shows condition based maintenance system using vibration and oil analysis method [35].
Condition based maintenance means that measurable parameters on a machine are monitored. The parameters will change as the health or condition of the machine get deteriorate. When a variation in the values of the parameter is discovered, it is analyzed and a diagnosis is given to solve the problem [36]. By using this type of maintenance one does not wait until the failure occurs, but considers the condition of the machine to maximize the utilization of the equipment. Condition based maintenance is performed to serve the following two purposes [38]:
• To determine if a fault exists in the monitored object, the nature of fault, and for how long period the component or machine can be severed uninterrupted before complete breakdown occurs and halt all operation.
• To detect and localized particular components in the machine that are under degrading condition and diagnose the fault.
There are several condition monitoring techniques, e.g. vibration monitoring, oil analysis, manual inspection, current, thermal, corrosion and performance monitoring [37]. The core objectives of condition based maintenance are:
1. To take appropriate measures before break down occurs.
2. To perform maintenance only when required.
3. To reduce the failure frequency and also number of breakdowns.
4. To minimize maintenance overheads and cost due to production lost.
5. To increase life of component and equipment.
6. To reduce inventory cost due to less spare parts requirement / effective inventory control.

Chapter. 3. Condition Monitoring Based Maintenance
Continious Online
Monitoring
Job Report
Daily
Lubrication
Inspection master
Schedules
Vibration Monitor
Emergency
Work
Oil changing
Daily inspection
Defect
Deviation
Machine to be
lubricated
Defect in
Machine
Vibration Analysis
Diagnosis
Vibration Analysis
Records
Maintenance Job
Planning &work
Execution of Job Vibration Monitoring
Vibration
Analysis
Lubrication master
Schedules
Figure 3.2. Block Diagram for condition based maintenance using vibration and oil analysis [39].
An employing predictive condition based maintenance strategy gives the advantage to prevent major damages to components or equipment. Reducing the fault frequency and severity gives the possibility to effectively increase the operational life of the machine. Acknowledge the fault or problems in advance significantly reduces the potential failure [40]. The continuous monitoring of condition of mechanical components, equipment train, performance and efficiency of complex process with regular interval of time ensures the maximum time between each repair, decreases the breakdown frequency, increases performance efficiency, reduces number of unplanned outages, and improves the overall availability of operating machine.

Chapter. 3. Condition Monitoring Based Maintenance
Condition based maintenance is a total plant management system that provides the ability to optimize the process and greatly reduces the overheads and cost of maintenance including spare parts consumption [41]. From many years of experience it is realized that condition based maintenance is a condition-driven proactive maintenance program. Industries that have implemented successful condition based maintenance show abundant improvements in machine reliability, availability, operating and maintenance costs. Great improvements can be achieved in: maintenance costs reduction, unscheduled machine breakdown, maintenance downtime, spare parts consumption and inventory [32].
Figure 3.3. An Integration of condition based maintenance with plant maintenance program [32].
Maintenance now become vital for the preventation of unforeseen stoppages and complete break down of the machine in industrial facilities, their timely diagnosis and corrective measures can not be overseated. In today complex industrial environment different aspect of maintenance have been employed for better understanding of maintenance activities and their implication on maintenance work [41]. In a broader sense establishing a good and right maintenance program is crucial, that requires expertise and quantitative analysis; which utilize integrated type of maintenance model. Figure 3.3 showing the condition monitoring system as an integral part of maintenance model from generation of fault condition to analysis and execution of maintenance work [32].
Preventive Maintenance
scheduled task
Planned CM
Run-to- failure
Performance and condition
Monitoring
Pm and Planned CM
Condition directed
Identification of
Maintenance
Work Tasks
Root cause Analysis-Identifies Equipment change
Unplanned CM
Work control
Work execution
Work close out

Chapter. 3. Condition Monitoring Based Maintenance
3.2 Condition monitoring: Condition monitoring which is generally referred as a predictive or proactive maintenance is one of the reliable and cost effective approach in maintaining and running costly equipment and machines in the industrial floor. It is a fact that by using developed technology we can measure and evaluate the over all health and condition of the asset in the plant floor, this allows to take intelligent decision for taking appropriate measure for maintenance [35]. Condition monitoring has been accepted as one of the effective method for detecting the present condition of the rotating machine to prevent from the catastrophic failures by predicting the incipient fault much before the time before it become severe. It has been acknowledge for a long time that the integrity of the machine can be evaluated by detailed analysis of the vibration spectrum [42]. As stated: The most effective and cost-efficient group of condition monitoring techniques is vibration analysis [37]. The vibration signals carry information about the structural resonance and other components in the machine through vibration transducer. The machine produces vibration which is specific to its vibration behaviour and character, when the machine operates in a good condition during the normal operation condition but as the degradation starts as a result of change in the characteristics of the vibration signals [43].
Condition monitoring system deals with the various types of the input data as a case vibration, acoustic emission, temperature, oil debris analysis etc. Condition monitorings based on oil debris, acoustic emission and vibration analysis are the most effective, reliable and well established in machine prognostic. Condition monitoring based on acoustic emission has more established method in the area of bearing monitoring than as for gears monitoring [36].
It is important to identify which machine condition monitoring technologies will be the most useful and cost effective in achieving your goals and objectives. Each technique is limited to specific types of machinery and is useful in identifying specific types of problems. Each technique also provides different short and long term economic benefits. A variety of technologies can be used as part of a comprehensive condition based maintenance programme [44]. As mechanical systems or machines account for the majority of plant equipment, therefore vibration monitoring is generally the key component of most condition based maintenance programmes. However, vibration monitoring cannot provide all of the information that is required for a successful condition based maintenance programme. Vibration monitoring technique is limited to monitoring the mechanical condition, but not other parameters necessary for maintaining the reliability and performance of the equipment. Therefore, a comprehensive condition based maintenance programme must include other monitoring and diagnostic techniques. These techniques include [32]:
1. Vibration analysis;
2. Temperature measurements;
3. Acoustic measurements;
4. Thermography;
5. Oil analysis;
8. Performance and process parameters monitoring;
9. Visual inspection.
Chapter. 3. Condition Monitoring Based Maintenance
1-Vibration analysis:
Vibration analysis is one of the proven and effective technology being used in condition monitoring. For the measurement of vibration different vibration transducers are applied, according to the frequency range. Vibration measurement is commonly done in gearbox, turbines, bearings and shaft. For wind turbine application the measurement is usually done at critical location where the load condition is maximum. i.e. wheels and bearings of the gearbox, bearings of the generator and the main bearing. Different types of sensors are being employed for the measurement of vibration these are: acceleration sensor, velocity sensor, displacement sensor.
Different vibration frequencies in a rotation machine are directly connected with the structure, geometry and speed of the machine, by determining the relation between the frequencies and the type of the defects, the causality of problems can be determined and the remaining useful life of components can be to estimated. The history of the equipment, it failure statistic, vibration trend, and degradation pattern are of vital importance by determining the health of the system and its future operating condition [32].
Using vibration analysis, the presence of a failure, or even an upcoming failure, can be detected because of the increase or modification in vibrations of industrial equipment. Since an analysis of vibrations is a powerful tool to set diagnosis of equipment, there has come up a number of different techniques to use. There are methods that only distinguish failures at a final state of evolution and there are others, more complex, that identify defects at an early phase of development. It is important to use the method that is best suited for each particular piece of equipment, and the most common technique is to get the overall vibration amplitude followed by a trend analysis.
The trend analysis is widely used because of its simplicity to put into practice. Alert (developing failure) and alarm (imminent failure) values are set for each machinery, and when they are reached, the machine needs to be monitored more frequently and a deeper analysis of the data needs to be conducted to identify flaws. It is important not to confuse the variations in vibrations due to failure with variations caused by alterations in the state of operation, e.g. load or speed of production. When a failure has been recognized it is possible to get an idea of the time left until a catastrophic failure occurs by looking at the intersection of the trend curve and the value of alarm. It is essential to find the “right” values of alarm since a low value may result in false alarms and a high value might fail to warn about catastrophic failures, which in turn may create scepticism towards the condition monitoring programme [36].
2-Temperature measurement:
Temperature is one of the important parameters for analysis and diagnostic purpose to predict the health of the machinery. Temperature measurement helps to detect the presence of any potential failure of the equipment related to temperature change in equipment; it gives the information about the ongoing deterioration process in the component by excessive mechanical friction due to faulty bearings, gears and in sufficient lubricant properties, loose and bad electrical connections [56]. All such phenomena causes temperature to increase to maximum level that is beyond the normal limit, this excessive rise in temperature further degrades the component properties that leads to catastrophic failure and cause complete breakdown of the system.

Chapter. 3. Condition Monitoring Based Maintenance
3-Acoustic emission:
Acoustic emission (AE) is a Non-Destructive Technique (NDT) for health diagnosis of a static system, but now this technique is gaining importance in fault diagnosis on rotating machinery. Acoustic emission is fall in the ultrasonic region and in the range between 20 kHz and 1 MHz (this range is not absolute and can vary). Acoustic emissions (AE) are defined as transient elastic waves generated from a rapid release of strain energy caused by a deformation or damage within or on the surface of a material [62]. AE has good application in detecting and diagnostic bearing health condition.
4-Thermographic analysis:
Thermography is a condition monitoring method that inspects mechanical equipment by obtaining heat distribution from the image. This method is based on the fact that all working components exude heat. By observing the heat pattern of the components a conclusion can be made on which components are damaged [46]. In real application this technique is use for inspecting mechanical and electrical system by taking the picture of heat patterns. This method is based on the fact that when the components in the system start to malfunction its temperature increases from normal operation condition, this increase in temperature might be caused due to lose connection in electrical circuits or distribution panels or a wear out bearing in any mechanical system, so by taking such heat patterns through infrared thermography, the fault and saviour condition in the system can be easily detected. It is a good evaluation method that can easily and rapidly scan large surface area for internal defects and malfunction [47].
5-Oil analysis:
Oil analysis is a predictive maintenance technique. By analysing the oil, we can see how the oil is contaminated from debris of surrounding elements. To check the level of contamination in the oil and to analyse the lubricant properties, a sample from the machine is sent to the laboratory to find out the debris contents in the sample. This procedure is made in order to get the exact information about the present state of the health of the oil as well as the machine [45]. Oil analysis may serve two main purposes:
- Safeguarding the oil quality and film thickness (contamination, moisture and debris);
- Safeguarding the components involved.
The oil analysis is of great importance when the defects in the machinery are identified, such approach simplifies repair action. The other importance of oil analysis is to check the quality of oil as it can be a source of increasing wear which reduces operational efficiency [48].
Oil debris analysis is a proven method for detecting debris contaminants in the oil; it is an effective way for detecting gear damage at an early stage so that the level of deterioration can be estimated. During the degradation process the debris of gears or bearing mix with oil; thus reduce its lubrication properties. By detecting the number of particles and their size one can determine gear- pitting damage at an early stage, which is not possible through vibration analysis [32].

Chapter. 3. Condition Monitoring Based Maintenance
6-Performance and process parameters monitoring.
For performance and process parameters monitoring, different parameters such as temperature, pressure, flow rate, electrical power and other electrical quantity like dielectric strength, resistance, and impedance are most commonly applied [49]. To ensure the reliability and operational issue, the relationship between power, wind velocity, rotor speed and blade angle to be determined which serves as a good performance indicator. Under the condition when large deviation is detected between allowable operating condition and current operating condition, directly result in an alarm when the signals become beyond predefined limit, to safeguard against any malfunction and to keep the operation under safe level. To keep the false triggering of alarm the level of detection should be at the appropriate level [32].
7-Visual observation and inspection.
Visual inspection or observation is one of the most common and oldest condition based maintenance technique, it includes hearing of sound of the machine, touching and visual inspection. In several cases the condition visual inspection is of great importance to identify a problem that was unidentified by other predictive maintenance or other technology. Such case may include loose parts, connection, terminals and components, visibly worn or broken parts, excessive temperature that reflects through structure or housing, oil leakages, corrosion, chattering gears or hot bearing housings [32].
3.3 Performance and process parameters:
To optimize the performance of wind turbines and for protection, safeguarding based on process parameters is of common practice. The control systems use the state of the art technology with enhanced diagnostic capabilities to ensure high performance. However safeguard against malfunction is still largely based on level detection or comparison of signals, which initiate an alarm condition when the monitored signal exceed the predefined limits as set by the manufacturer. The performance of the wind turbine is often used implicitly in a primitive form. For protection purposes, the relationship between shaft speed and blade angle and other process parameters such as acceleration, velocity, and displacement can be measured and in case of large deviations, an alarm is initiated [48].
(i) Measuring acceleration:
To measure the low frequency oscillation which is induced by wind turbine tower and structure including nacelle, the acceleration parameter of vibration is used. The information that collected form acceleration measurement can be used to calculate the Eigen frequencies of components of wind turbine and their related shift due to severity of fault. Refer table no 3.1 for the requirements necessary for acceleration measurement for condition monitoring and fault identification [77].

Chapter. 3. Condition Monitoring Based Maintenance
Table 3.1: Measurement requirements for acceleration value [77].
Note 1: Gravitational constant g=9.81 m/s²
(ii) Measuring velocity and displacement: The acceleration sensor or accelerometers are widely used for the measurement of oscillation, velocity and displacement. Through integration of acceleration signal and then by band pass filtering the velocity signal is generated. For the calculation of displacement signal this procedure repeated twice. This technique of acceleration measurement is a good approach to deduce all information that is vital for condition monitoring and fault findings in wind turbine [77].
(iii) Measuring vibration:
To evaluate and predict the condition of bearings and gears in rotating machines, which rotates at higher frequencies, vibration measurement is the most effective method as described above. To measure these higher frequencies the piezo electric transducers are most suitable for this purpose. To cover all mechanical vibration range the sensors available in a frequency range from 3 Hz up to 20 kHz [7].
Table 3.2: Measurement requirements for vibration parameter [77].
The parameters of vibration that will be measured (please refer to Table 3.3) should provide information that allows the inspection of specific machine elements, or the kind of fault.
Different transducer such as displacement, velocity and acceleration can be used for measurement of vibration, these transducer convert machine signal in electrical signal this gives the possibility to analyze the vibration signature to detect the presence of fault. The signals that are generated by machine are composed of different frequencies that can be analyzed. These are basically plots of amplitude versus corresponding frequencies. A time function of such signal is also used to represent the resultant of vibration magnitudes of different frequencies and plot it as a function of time to represent the mechanical motion [55].
Quantity Base Unit
Accuracy Band width Sensitivity Range Signal Type
Acceleration m/s2 5 % 0- 20 Hz 2 V/g2 +/- 2g Analogue, Pulse, Data
Quantity Base Unit Accuracy Band width Sensitivity Range Signal Type
Vibration m/s 5 % 3- 20 kHz 100mv/g +/- 20g Analogue

Chapter. 3. Condition Monitoring Based Maintenance
Table 3.3 - Parameters to be measured on predictive maintenance [65].
Each exciting force existing at different locations of the machine will generate one harmonic of the vibration determining a certain displacement, velocity, and acceleration; the accumulation of all harmonics to each variable will result in one multi-harmonic, exist on bearings. The components of vibration can be classified in two groups, distinguishable by the value of the frequency rotation of the axle. Thus, two groups of frequency have been established [65]:
1) Components of low frequency (frequency values up to 5 times the axle rpm).
2) Components of high frequency (frequency values higher than 5 times the axle rpm).
From the collected data, it is possible to make technical analysis for diagnosis purpose, and after the diagnose phase the nature of fault can be established and can also be determined which elements or component of the machine are more critical. The data log history of the machine may also help to establish the most frequently fault components of the machine for failure modes and effect analysis [65].
The principal cause of generator vibration is due to interrelation ship of (i) the dynamic behaviour of the rotor, (ii) stator core response to the magnetic forces in the air gap, (iii) EMF in the air gap between the fixed stator and the rotating rotor, and (iv) shaft bearings response to the forces that is transmitted to it by the rotor. The machine’s inertia, drive train, natural frequency and rotational speed are some of the parameter that influenced generator vibration. Every machine has its own vibration response that can term machine signature unique to its mechanical characteristics, this vibration machine signature is very helpful in finding and diagnosed the deviation from its normal behaviour because it serves as a finger print [58]. If there is any deviation in the normal operation limit the change in the vibration signature clearly alarm the abnormal condition that some this is happening within the machine and can cause sever distortion in the process and can lead to functional failure.
Parameter to be
measured
Nature of fault or defect to be detected
Amplitude of vibration
displacement
Unbalancing ,misalignment, excessive gap, bad coupling
Amplitude of vibration velocity
Bearing or damaged gear
Amplitude of vibration
acceleration
Excessive friction between components, lack of lubrication
Chapter. 3. Condition Monitoring Based Maintenance
During the machine start up and shut down condition the vibration signature are non stationary by nature means it changes the frequency along time. Conventional techniques are still very useful for feature extraction for a verity of range of faults in mechanical system. Despite the fact its effectiveness in detecting feature extraction in vibration signature there are still some problems in detection due to non-stationary and transient nature of such signal. To address the transient non stationery signals case there are different time-frequency and time-scale technique analysis were developed. Wavelet Transforms (WT), Short-Time Fourier Transform (STFT) and Wigner-Ville Distribution (WVD) are some good example in this area [57].
The STFT is efficient in this case but it also has some limitation because of its problem in choosing a window length, because due to this it simultaneously affects both frequency and time resolution. To get a good frequency resolution for analyzing the vibration signature there should be high window length to be selected, but this selection have a great impact on time resolution. The wavelet analysis (WT) has been successfully applied in the industry and has been greatly acknowledge in feature extraction of vibration signal analysis and also in signal processing area but this technique is also have some limitations that although it gives the information about spectral component in the frequency but it not gives any information that at which instant of time these spectral component appears [57].
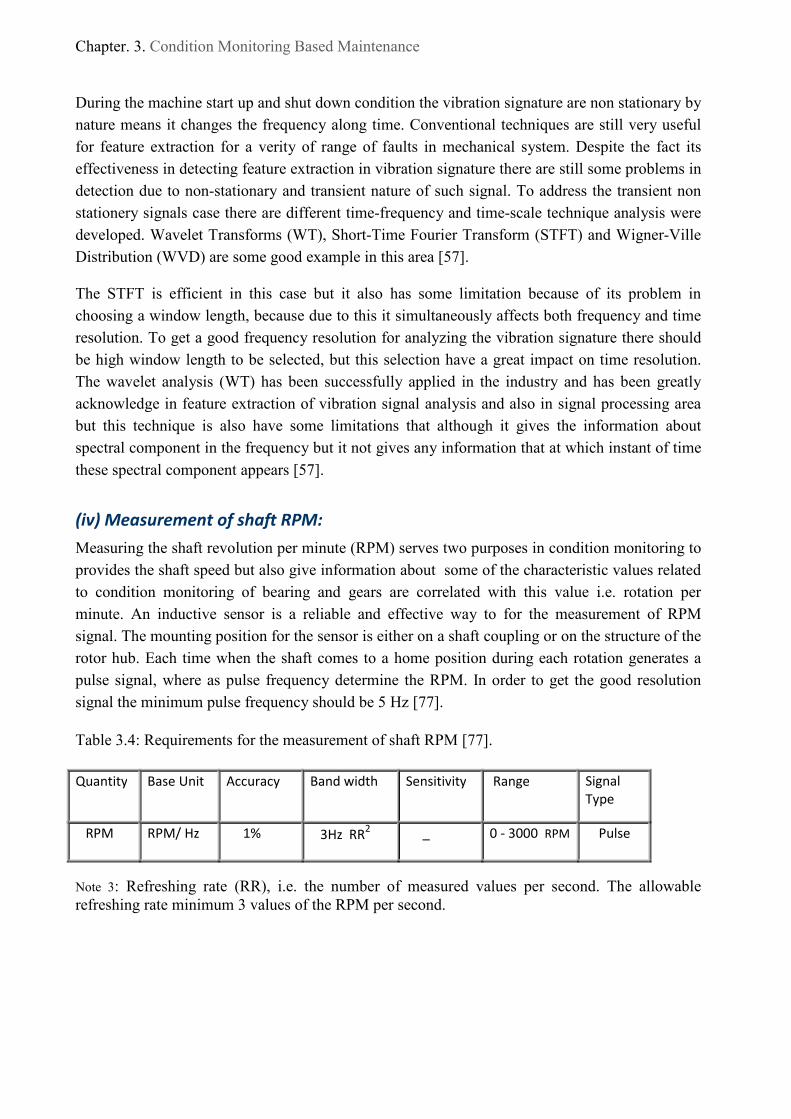
(iv) Measurement of shaft RPM:
Measuring the shaft revolution per minute (RPM) serves two purposes in condition monitoring to provides the shaft speed but also give information about some of the characteristic values related to condition monitoring of bearing and gears are correlated with this value i.e. rotation per minute. An inductive sensor is a reliable and effective way to for the measurement of RPM signal. The mounting position for the sensor is either on a shaft coupling or on the structure of the rotor hub. Each time when the shaft comes to a home position during each rotation generates a pulse signal, where as pulse frequency determine the RPM. In order to get the good resolution signal the minimum pulse frequency should be 5 Hz [77].
Table 3.4: Requirements for the measurement of shaft RPM [77].
Note 3: Refreshing rate (RR), i.e. the number of measured values per second. The allowable refreshing rate minimum 3 values of the RPM per second.
Quantity Base Unit Accuracy Band width Sensitivity Range Signal Type
RPM RPM/ Hz 1% 3Hz RR2 _ 0 - 3000 RPM Pulse

Chapter. 3. Condition Monitoring Based Maintenance
(v) Measurement of shaft Position:
The measurement of absolute position of the shaft is necessary in order to perform specialized algorithms of spectral analysis. In most of the situation a single pulse per shaft revolution is enough. This pulse signal can be obtained from the measurement as described above through the means of induction sensor. It is to be ensured that only pulse per shaft revolution is generated when passing one bolt in the shaft (indicating the home position of shaft for reference and calculation of each cycle) as a reference point. In case if the requirement for the higher resolution with interim values then, a position encoder is a good choice to serve this purpose [77].
Table 3.5: Requirements for the measurement of shaft position [77].
Note 3: The signal should have a refreshing rate of 3 values per second.
3.4 Sensor placement for Condition Monitoring System:
The condition monitoring system receives information from the inputs connected to the critical location of wind turbine through a robust sensor. This sensor collects information of different parameters of interest for continuous measurement of turbine and to perform real time evaluation of characteristic fault by using latest technology in digital signal processing methods [71]. Table 3.6 showing the basic sensor system for the monitoring of gear box vibration at different stages and also inboard and outboard bearings at generator site.
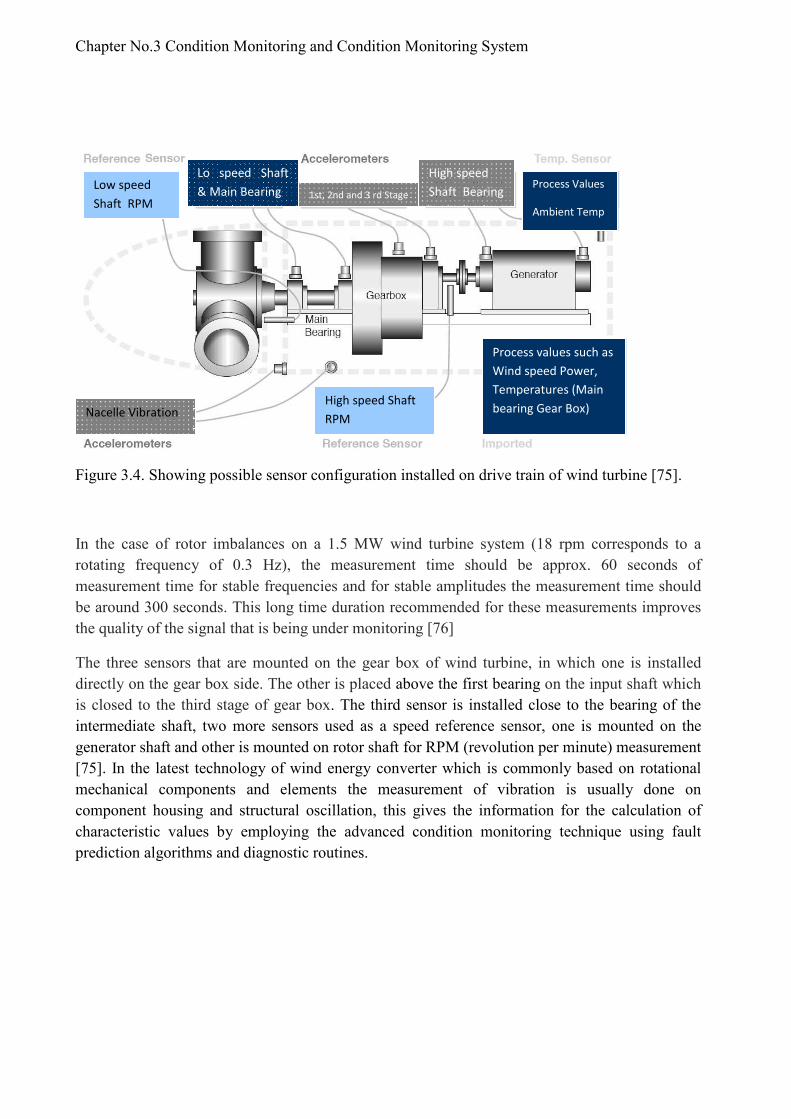
The possible configuration of sensor installed on the drive train is showing in figure 3.6. The type and configuration of the sensor depends on its placement at turbine and the frequency range relevant for the monitoring of parameter of interest at desired location. The configuration and types for such sensors are described below [48].
§ Position transducers suitable for the low frequency range;
§ Velocity sensors in the middle frequency area;
§ Accelerometers in the high frequency range;
§ SEE sensors (Spectral Emitted Energy) for high frequencies range are placed for monitoring of acoustic vibrations”.
The vibration induced by bearing and gear wheels can be monitor through the sensor operate frequency range cover from 1 Hz to 20,000 Hz. Three acceleration sensors are placed at the axial direction and other in the transverse direction, for the detection of nacelle oscillation. These sensors must be at frequency range from 0.1 Hz to 10 Hz.
Quantity Base Unit Accuracy Bandwidth Sensitivity Range Signal Type
Shaft position
degree 5 % 3Hz RR3 - 0-360
degree
Analogue,
Pulse, Data

Chapter No.3 Condition Monitoring and Condition Monitoring System The planetary input stage of the gear box is monitored through acceleration sensor for low frequency vibration measurement. There is also an additional sensor which is placed on the gear box for vibration signal measurement at a frequency range from 1 Hz to 10 kHz, which is closed to the intermediate stage and high speed bearing at generator side. The rotor condition is being measure through one sensor which is mounted at front main rotor bearing and the second sensor at gear box input stage [51].
Table 3.6. Shows the basic sensor equipment for the monitoring of gear box and generator [74].
S.no Sensor Components(monitored) Required Measurement
1 Main Bearing accelerometer
Turbine main bearing yes
2 Low speed Stage accelerometer
Planetary gears/ bearings yes
3 Intermediate speed Stage accelerometer
Planetary gears/ bearings yes
4 High speed Stage accelerometer
High speed gear bearing yes
5 Generator inboard accelerometer
Generator inboard bearing Yes
6 Generator outboard accelerometer
Generator outboard bearing Yes
7 Nacelle transverse accelerometer
Tower sway perpendicular to Turbine shaft axis
--
8 Nacelle axial accelerometer
Tower sway parallel to Turbine shaft axis
--
9 Power meter Power Yes- obtained from scada
10 Torque sensor Torque Yes- obtained from scada
11 Anemometer Wind velocity Yes- obtained from scada
In order to get the reliable and accurate measurement, the frequency of repeatable measurement is of primary importance when doing measurement on low speed drive train to monitor vibration. For accuracy in measurement and to measure the stable frequency value, at least 20 vibrations should be recorded.
Chapter No.3 Condition Monitoring and Condition Monitoring System
Figure 3.4. Showing possible sensor configuration installed on drive train of wind turbine [75].
In the case of rotor imbalances on a 1.5 MW wind turbine system (18 rpm corresponds to a rotating frequency of 0.3 Hz), the measurement time should be approx. 60 seconds of measurement time for stable frequencies and for stable amplitudes the measurement time should be around 300 seconds. This long time duration recommended for these measurements improves the quality of the signal that is being under monitoring [76]
The three sensors that are mounted on the gear box of wind turbine, in which one is installed directly on the gear box side. The other is placed above the first bearing on the input shaft which is closed to the third stage of gear box. The third sensor is installed close to the bearing of the intermediate shaft, two more sensors used as a speed reference sensor, one is mounted on the generator shaft and other is mounted on rotor shaft for RPM (revolution per minute) measurement [75]. In the latest technology of wind energy converter which is commonly based on rotational mechanical components and elements the measurement of vibration is usually done on component housing and structural oscillation, this gives the information for the calculation of characteristic values by employing the advanced condition monitoring technique using fault prediction algorithms and diagnostic routines.
High speed Shaft Bearing
Lo speed Shaft & Main Bearing Low speed
Shaft RPM
High speed Shaft RPM Nacelle Vibration
Process values such as Wind speed Power, Temperatures (Main bearing Gear Box)
1st, 2nd and 3 rd Stage Process Values
Ambient Temp

Chapter No.3 Condition Monitoring and Condition Monitoring System Figure 3.5 shows the basic orientation of sensors that are installed to measure the nacelle oscillation measurement in axial and transverse direction, related to the rotor axis.
Figure 3.5. Showing sensor configuration for nacelle oscillation measurement [75]. 1. Low speed shaft RPM tachometer 2. Low speed shaft accelerometer 3. Nacelle Vibration accelerometer. 4. Low speed shaft accelerometer 5. High speed shaft RPM sensor 6. Temperature sensor.
The torsional oscillation of the nacelle can be measured by using two transverse directed sensors that are mounted in front and behind of the vertical tower axis. By using static accelerometers the monitoring of nacelle oscillations can be achieved, in order to get the characteristic values for the detection of rotor faults, caused by rotational speed of the rotor. Therefore for the signal accuracy and validity the above mentioned parameter should be measured at very low frequency. The sensor works by measuring the applied force through sensor probe by acceleration. The applied input force is then converted to electric signal through strain gauges mounted to a small spring, the sensor is commercially available and have integrated electronic for necessary signal conversion and amplifier for signal amplification. Such sensor needs only external supply to produced output voltage or current signal as an input signal for processing. Refer to Figure 3.5 showing the mounting positions of the sensors at labels 2, 3 and 4. These sensors as labeled 2, 3 and 4 allow the measurement of the above mentioned nacelle oscillation to monitor the vibration at these locations. By refer to labels 5 and 6 in Figure 3.5 showing the vibration sensors positions at the gearbox and generator side. An advanced specialized algorithm for signal processing requires the absolute rotor position (e.g. narrow band analysis using Fast Fourier Transform algorithm). A good approach and effective way to get this position is through the application of an inductive distance sensor (label 1in Figure 3.5). This sensor generates one pulse after every complete revolution of rotor. The integration of the condition monitoring system with prognostic deterioration maintenance model gives valuable information about the present condition trend of the machine being monitor [51].
6 4 2
5 3
1

Chapter No.3 Condition Monitoring and Condition Monitoring System 3.5 Model for condition monitoring system:
Condition monitoring system (CMS) generally compose of electronic data acquisition module and further for vibration based condition monitoring, there is a number of accelerometers, and other transducer installed on the turbine drive train, main shaft, generator and main bearing [72]. The standard condition monitoring system can be divided in to three main components this includes data gathering or data collection followed by the data acquisition and finally fault diagnostic algorithm or fault diagnosis. In the first phase data is collected and then converted in to digital format for further processing.
In the next stage the data acquisition receives data from the data collection module for calculation the statistical function and values in frequency and time domain. This block further applies different techniques for analysing of data pattern for further processing [73].
Fig 3.6. The function model for the monitoring of wind turbine converter [72].
Vibration Generator
bearing, gearbox
Mean values Classification (power characteristic)
Rotional speed
(rotor, generator)
Characteristic values (BCU, RMS, Crest)
Electrical
Power
Wind speed
(anemometer)
Tower oscillation
(Axail, transversal)
Phase sensitive narrow Band analysis
(Amplitude and phase)
Narrow Band analysis (Tower bending Eigen frequency)
Alarm (Adaptive limit, learning,
Trend analysis)
Refrence(Learned chraraterstic)
Alarm (Deviation from learned
characteristic)
Time signals, pulse signals
Signal processing, Generation of characteristic values
Evaluation diagnosis
Alarm (adaptive limit, Learning, trend analysis, Fuzzy logic operation)
Alarm (Adaptive limit, learning, Trend analysis)

Chapter No.3 Condition Monitoring and Condition Monitoring System
The third block which is more critical and complex, because of working with diagnosing fault, due to its functionality and importance in machine fault diagnosis different methods and technique are developed and still major work is underdevelopment [73]. Newly developed analysis techniques like wavelet analysis, fuzzy logics, case based reasoning and neural networks for vibration or fault pattern recognition are being successfully applied and examined [56].
Condition monitoring system connect with the various types of the input data as a case vibration, acoustic emission, temperature, oil debris analysis etc. condition monitoring based on oil debris, acoustic emission and vibration analysis are the most effective, reliable and well established in machine prognostic. Condition monitoring based on acoustic emission has proved established method in the area of bearing monitoring than as for gears monitoring [60].
In order to achieve the over all performance and system optimization the condition monitoring system should be an integrated part of the wind turbine system [59]. In the above system the vibration monitoring is not the only measurable parameter but also other signals from wind turbine are necessary for measurement and analysis, which contain information on turbine components health that are critical in the monitoring and diagnostic process.

Chapter 4: Vibration Monitoring Based Maintenance
Chapter 4 Vibration Monitoring Based Maintenance
This chapter divided into two sections, the first section presents the vibration monitoring based maintenance for monitoring and diagnostic of machine. The next section present the recent development in vibration measurement for vibration monitoring program.

Chapter 4: Vibration Monitoring Based Maintenance Chapter 4 Vibration Monitoring Based Maintenance
Vibration analysis detects repetitive motion of a surface on rotating or oscillating machines. The repetitive motion may be caused by unbalance, misalignment, resonance, electrical effects, rolling element bearing faults, or many other problems. The history of the machine and the previous degradation pattern are important in determining the current and future operating condition of the machine [50]. Vibration monitoring based maintenance to monitor the present condition and dynamic behavior of the machine and on the basis of vibration analysis diagnosis of faults in the machine has become a key activity in condition based maintenance programs for many industries.
In the area of vibration monitoring based maintenance there are various relevant national and international standards are developed and published for the monitoring and analysis of rotating machines. These standards present the general guide lines and procedures for the selection criteria of parameters to be monitored, measurement technique, selection of testing instrument, measurement criteria, calibration of testing instruments, transducer selection and installation methods, diagnostic and progosnotic procedures, data communication equipment and protocols and finally result presentation for analysis of machine health.
Condition monitoring parameter like vibration measurements, should be carefully analyzed and interpret for better understanding of fault and normal conditions, this can not be achieved without knowing and in depth understanding of the deterioration process under subject matter. This clearly claim that a good understanding of fault ignition process, its developing mechanism and characteristics, and the relation between the physical changes in the component condition and the dynamic changes in the vibration spectrum is of prime importance, the following are the guide lines that should be considered during data analysis and prognostic phase.
Using vibration analysis as a condition monitoring based maintenance, gives an early warning of deterioration or detection of fault before any break down happen. The monitoring and evaluation of vibration trend analysis, performance of machine at different load and speed conditions are the common and vital goal for any proactive maintenance program. For the detection of vibration of rotation machinery different methods, techniques, and tolls are being used. These methods include vibration analysis, model-based techniques, and statistical analysis and artificial intelligence techniques [57].
To achieve cost effective vibration based maintenance, the management and effective use of vibration monitoring data is very important, the replacement criteria that has been decided for each component condition should automatically initiate the work order process for the execution of maintenance work.
For measuring vibration parameter the measurement locations is of high importance, because any deviation in the machine condition directly measure through such terminals or measurement points, for this reason the selection of measuring location gives the best possibility in order to precisely captured the signal form the machine. The major factors that take in to consideration are safety, the location where high sensitivity to change in machine condition can be easily recorded etc.

Chapter 4: Vibration Monitoring Based Maintenance There are four different characteristics of vibration that need to be considered before the measurement take in to account of any rotating machine or equipment. These four characteristics are: frequency, displacement, velocity and acceleration.
Frequency is of one the vibration characteristic and represents the repetitive periodic motion of an oscillation body. Its unit is cycles per second and usually express in hertz. The other way of expressing frequency is rotational speed and express in revolution per minute (rpm) [2]. The measurement of vibration frequency is a good diagnostic tool, it serves to identify or pinpoint specific mechanical or operational faults [52].
Vibration displacement is the measure of up and down movement of the oscillating or rotating body surface to calculate the peak to peak amplitude level [32]. The vibration displacement is also defined as the total distance travelled by the vibration body from one limit to another limit. The distance travelled is called peak-to-peak displacement. For the analysis purpose the frequency of the displacement should be known. The unit of displacement is meter [52].
The vibration velocity is defined as the change of the displacement per unit time of a surface as the machine vibrates. Thus, a vibration velocity is a direct measure of fatigue of a material of an oscillating body. In brief we can define vibration velocity is a measurement of the speed of movement of a machine component or machine itself during the operation as it undergoes oscillating motion. During the vibration the velocity is continuously changing throughout the cycle so only peak to peak value of velocity is consider for measurement. During the running condition of machine, the machine structure also vibrates along with, this up and down movement effects the velocity and cause to increase with this movement. The unit of measurement for vibration is mm/sec. [32].
The vibration acceleration is defined as the rate of change of velocity of the vibrating surface of the machine. It indicates and points out the presence of dynamic forces that generate vibration [32]. Vibration acceleration is another important characteristic of vibration signal that contains useful information about the machine condition and it can be used for the measurement of magnitude of vibration. As the vibration acceleration is not constant and continuously changes therefore only peak acceleration value is taken in to account for measuring acceleration in the vibration signal. The unit for the measurement of acceleration is mm/sec2 [52]. Figure 3.4 shows the accelerometer vibration sensor installed in the plant machine for vibration measurement.
4.1 Vibration transducer:
Different types of sensors are being employed for the measurement of vibration these are acceleration sensor (accelerometer), velocity sensor (velocity pickup), and displacement sensor (proximity probe). The vibration sensor when is fixed or installed in the machine, converts the physical movement in to electrical quantity. This signal which is converted by the vibration transducer represents the signature of a machine or component where is installed [32].
The accelerometer measures acceleration in the vibration signal. The accelerometer is widely applied in the industry the main reason for its broad acceptance in the maintenance industry is because of its wide frequency response, from 2 Hz to 10 kHz [32].

Chapter 4: Vibration Monitoring Based Maintenance As it is known from the study that vibration velocity gives the direct indication of vibration severity and clearly indicates the fatigue condition in material so it has advantage over vibration displacement. The benefits of measuring vibration velocity are:
Figure 4.1. Example of the accelerometers installed in the plant machine for vibration measurement [53].
(i) Vibration velocity is a direct and clear indicator of fatigue in the material as it considers both displacement and frequency at the same time.
(ii) As frequency is a component of the velocity so it is not essential to measure the frequency of the vibration signal in order to evaluate the severity of the vibration velocity.
(iii) To know the over all health condition of the machine the vibration velocity serves as a good indictor for this purpose to evaluate machine health.
Due to these reasons, the vibration velocity becomes the industry standard for evaluating general machine health condition based on vibration or vibration based maintenance [52].

Chapter 4: Vibration Monitoring Based Maintenance 4.2 Feature monitoring indicator:
There are several defects that can cause to increase the over all vibration level of the machine, thus it is a good condition monitoring indicator. The signature is the most important clue about the health of the machine as it contains the information about the health. Once the machine is commissioned and newly comes in operation. It vibration signature is stored and after the time progress the current vibration signature could compare with old vibration signature to find out any deviation between two values and if there is any out of limit conditions found it gives alarm conditions. But in reality it is difficult to find out the difference due to large variations and direct comparison of two signatures is difficult. The most effective and useful method is to employ the features extraction from the vibration signature data. It gives the advantage over other conventional technique as it provides the reduced data for the application of pattern recognition and tracking techniques. This study will come up with the necessary frame work that is essential for feature analysis of vibration data.
There is some useful statistical model or condition indicators as discussed; use for feature analysis, these features are grouped in five different groups, and these are [66],
1. Raw signal (RAW)
2. Residual signal (RES)
3. Difference signal (DIF)
4. Band-pass mesh signal (BPM)
5. Time synchronous averaged signal (TSA)
(1) The Raw Signal Preprocessing (RAW): denotes features that are calculated from the raw or conditioned data. The signal conditioning is achieved by multiplying the raw data points with by a calibration constant [66].
(2) Residual Signal (RES): this preprocessing technique calculates the residual signal consisting of the time synchronous averaged signal including the mesh and shaft components along with their harmonics removed [66]. In real application it can be done by using a high pass filter with the cut-off frequency located somewhere between DC and the basic mesh frequency. The feature include in this group is NA4.
(3) Difference Signal (DIF): by filtering the meshing components from the time synchronous averaged signal the difference signal can be determined. The meshing elements composed of the meshing frequency and its harmonics, the shaft frequency and its harmonics. This signal processing part comes after the residual signal section, where the mesh and shaft components along with their components have been filtered; the filtered signal then further removed from meshing frequency and its harmonics in the DIF section [66].
(4) Band-Pass Mesh Signal (BPM): In this section the time synchronous averaged signal is band pass filtered around the primary gear mesh frequency [67]. After obtained from the band pass filtered section the signal then applied for Hilbert transform to get the real and imaginary part of the signal. The envelop detected in this signal will then determine the modulation contain in the signal due to the sidebands.

Chapter 4: Vibration Monitoring Based Maintenance
(5) Time synchronous averaged signal (TSA): It is a statistical technique to extract the repetitive signals from the excessive noise in the vibration data. This technique is a good approach for balancing and vibration analysis. The good application of this technique is the waveform analysis of vibration signal from machine. It is an effective technique for gearbox vibration signal to distinguishing between spectral peaks that are very near and looks harmonic signal, but not exact harmonics of the machine. After performing a sufficient number of averages from the sample vibration data, spectrum peaks that are harmonics of the gear will still be visible and remain, while non-synchronous peaks will be cancelled out from the spectrum. The other statistical techniques and features that are mainly used for alarm purposes in industrial plants are: Kurtosis, Crest Factor, Enveloping, Demodulation, NA4 and FM0. These statistical parameter serve as a condition indicator for gear box monitoring and diagnostic technique, few of them are described here [68].
(i)- Kurtosis:
Kurtosis is defined as the statistic indicator used in the time history, it defines the impulsive character of the signal and serves an indicator of major peaks in the signal data. kurtosis is defined as the fourth statistic moment of the distribution; this method is an effective way in gears fault prognostic by indicating an error condition due to wear tear in gear as it causes increased in the vibration level.
The kurtosis is given by the equation as follow.
K= 221
4
)(*
])([
σ
µ
N
nyN
n∑=
− (4.1)
where y (n) is the raw time series at point n, is the mean of the fourth statistic moment, 2
σ
is the variance of the data, and N is the total number of data points [66].
(ii)- Crest Factor:
The simple method to measure the defects in time analysis is by employing the RMS method. The main disadvantage in this method is that it may not show the measure changes in the signal at an early stage of bearing and gear defects. A better and effective approach is to use the “crest factor” which is defined as the ratio of the peak level of the input signal to the RMS level. The increase in peak in the times series signal will also result in an increment of crest factor value. In normal case, crest factor may reach between 2 and 6. Usually the value above 6 indicates the severity of problem in the machine. This feature is applicable in detecting the variation or changes in the signal pattern mainly cause due to impulsive vibration sources coming due to gear tooth defects or due to defects in the outer race of the bearing. The crest factor is given by the equation as follow.

Chapter 4: Vibration Monitoring Based Maintenance
Crest Factor = RMS
PeakLevel (4.2)
In the equation (2) the Peak Level is the peak level of the raw time series, and RMS is the root
mean square of the raw data [66].
(iii)- Enveloping:
Enveloping is the technique that is commonly applied for monitoring the high frequency response of the mechanical system to periodic impacts such as gear or bearing faults. A short duration impulse is produced each time when ever a bearing in the loaded condition during machine operation comes in to direct contact with the surface having fault or pitting in its race, this irregular surface causes bearing to act abnormally when this part of defect comes under the contact with other surface of the bearing or a faulty gear tooth comes under contact with another tooth of the adjacent gear. This periodic impulse has an extremely short duration as compared with the interval between the pulses after each revolution. The energy generated from the defect pulse will be distributed at a very low level intensity over a wide frequencies range. Due to distribution of energy at a wider frequencies range it is very critical to detect any defects in the bearing using the conventional spectrum analysis. During the surface contact of faulty bearing, the impact generates a resonance at a very higher frequency in the system compare to the vibration produced by the other elements of the machine.
This structural energy which is in the form of narrow band can be easily detected compare with the gears or bearing defect frequencies which are highly distributed. As the wear in the gear starts to deteriorate causing its tooth wears, this process of deformation of gear teeth’s may increases the output shaft frequency, which is near the critical frequencies. This high frequency technique concentrate on the structure resonance to determine the failure type in a bearing or the health condition of a gear.
Figure 4.2 a) Showing attached vibration transducer (accelerometer) to collect vibration information from the bearing enclosure under monitoring [63].
Accelerometer Data
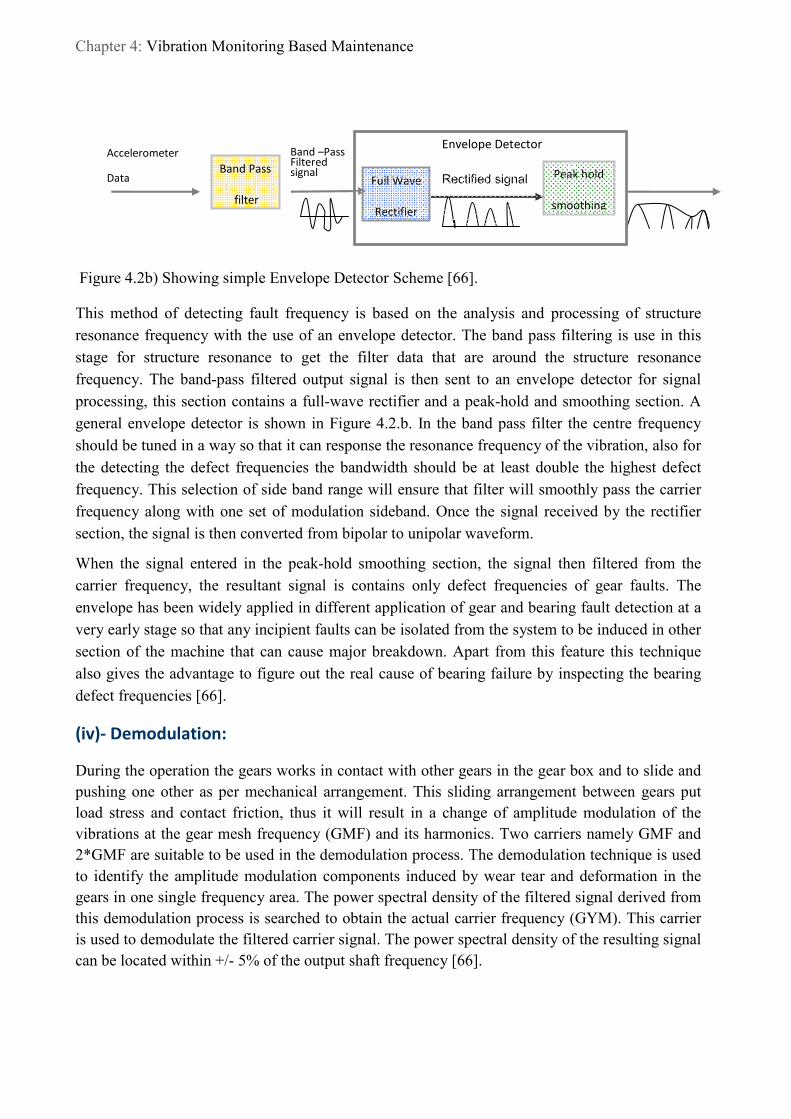
Chapter 4: Vibration Monitoring Based Maintenance
Figure 4.2b) Showing simple Envelope Detector Scheme [66].
This method of detecting fault frequency is based on the analysis and processing of structure resonance frequency with the use of an envelope detector. The band pass filtering is use in this stage for structure resonance to get the filter data that are around the structure resonance frequency. The band-pass filtered output signal is then sent to an envelope detector for signal processing, this section contains a full-wave rectifier and a peak-hold and smoothing section. A general envelope detector is shown in Figure 4.2.b. In the band pass filter the centre frequency should be tuned in a way so that it can response the resonance frequency of the vibration, also for the detecting the defect frequencies the bandwidth should be at least double the highest defect frequency. This selection of side band range will ensure that filter will smoothly pass the carrier frequency along with one set of modulation sideband. Once the signal received by the rectifier section, the signal is then converted from bipolar to unipolar waveform.
When the signal entered in the peak-hold smoothing section, the signal then filtered from the carrier frequency, the resultant signal is contains only defect frequencies of gear faults. The envelope has been widely applied in different application of gear and bearing fault detection at a very early stage so that any incipient faults can be isolated from the system to be induced in other section of the machine that can cause major breakdown. Apart from this feature this technique also gives the advantage to figure out the real cause of bearing failure by inspecting the bearing defect frequencies [66].
(iv)- Demodulation:
During the operation the gears works in contact with other gears in the gear box and to slide and pushing one other as per mechanical arrangement. This sliding arrangement between gears put load stress and contact friction, thus it will result in a change of amplitude modulation of the vibrations at the gear mesh frequency (GMF) and its harmonics. Two carriers namely GMF and 2*GMF are suitable to be used in the demodulation process. The demodulation technique is used to identify the amplitude modulation components induced by wear tear and deformation in the gears in one single frequency area. The power spectral density of the filtered signal derived from this demodulation process is searched to obtain the actual carrier frequency (GYM). This carrier is used to demodulate the filtered carrier signal. The power spectral density of the resulting signal can be located within +/- 5% of the output shaft frequency [66].
Peak hold
smoothing
Rectified signal
Band –Pass Filtered signal
Accelerometer
Data Band Pass
filter
Full Wave
Rectifier
Envelope Detector

Chapter 4: Vibration Monitoring Based Maintenance (vi)- FM4 parameter:
The FM4 is a good technique to detect the gear teeth defects. This parameter is a simple measurement that detects if the amplitude distribution of the difference signal is peaked or flat. A difference signal is determined by filtering the shaft and meshing frequencies, their harmonics, including the first order sidebands in the frequency domain. This indicator considers as the gears are in good working condition and have a difference signal with a Gaussian amplitude distribution, as on the other side if the gear box with defective gears will generates a difference signal with a maximum peak or a series of peaks that will cause a minimum peak amplitude distribution. In the case if more then one teeth is faulty then this will result in a flat distribution causes to decrease in kurtosis value.
FM4 =
∑
∑
=
−=
−
−
−
N
iii
N
ii
dd
ddN
1
22
1
4
)(
)( (4.3)
Where N denotes the total number of points in the time scale and d i represent the i-th point of the differential signal in the time record and d is the mean value of difference signal [68].
(v)- NA4 parameter: This parameter is a newly developed from of FM4 parameter. As in the FM4 case only the problem with a single gear defect can be located, NA4 come up with solution to address this issue so that any fault can be locate in case if more then one tooth is damaged. During the period when gear damage is under progress, the averaged values of variance increases, this results in a decrease of the NA4 parameter.
To deal with this issue the NA4* parameter was developed. As a comparison between two parameter NA4 and FM4 is that NA4 uses a residual signal to estimate kurtosis value. Another difference here the average value of variance is use.
So in the case if the gear damage increase and spreads from one tooth to another tooth at the same time the value of the average variance increases gradually and allows the NA4 parameter to grow with the increase of damage [68]. “NA4 is computed by dividing the fourth statistical moment of the residual signal by the current run time averaged variance of the residual signal, raised to the second power”. The NA4 parameter is defined by Equation no 3.
NA4 =
∑ ∑
∑
=
−
=
=
−
−
−
m
j
jij
N
i
N
ii
rrm
rrN
1
22
1
1
4
)(1
)( (4.4)
Where ir is the residual signal, −
r the mean value of the residual signal, N is the total number of data points in time record, and m is the current time record number in the run ensemble or current reading number [66].

Chapter 4: Vibration Monitoring Based Maintenance 4.3 Signal Processing Techniques for vibration analysis:
The most commonly applied signal processing techniques for machine vibration signal analysis are: joint time frequency analysis techniques, short time Fourier transform (STFT), Wigner Ville distribution (WVD), wavelet transform, fisher criterion and acceleration enveloping [64]. The
acceleration enveloping is the most widely applied technique; therefore our discussion is only limited to
acceleration enveloping signal processing method.
4.3.1 Acceleration Enveloping:
The acceleration enveloping method was originally developed as a high frequency resonance technique. The acceleration enveloping technique is based on the principle that when ever the fault occurs in the bearing, repetitive cyclic impacts generates during each rotation, such resonant impact is a broad band excitation type that also causes bearing supporting system to response resonant signal. The resonance generated from the defected bearing is of low level as compared with the excitation frequency of the unbalance shaft which is of higher values. The objective to detect the bearing fault is to capture the low amplitude signal which is cause by bearing defect excitation but without the addition of high amplitude rotational vibration signals and resonant frequency responses from the system. In order to put in effect a band pass filter is used to isolate the signal from resonant frequency responses and high amplitude rotational vibration signals. As soon as the damaged fault frequency response is captured, once the signal entered in the next stage for rectification, the envelope of the signal is detected in this stage. In the last stage the fast Fourier transform technique is applied to this envelope which then gives the frequency and the amplitude which is connected and associated with damaged bearing.
Any vibration transducer can detect bearing fault through using enveloping process, however in real practice the accelerometer has a distinctive advantage in detecting and capturing the damage response over sensor velocity and displacement sensors as the excited resonant frequency is of higher frequency range. In the recent past the envelop detection method uses a conventional technique by employing analog devices for the detection of bearing damages fault frequency, please refer Figure 4.3. Further this condition signal is then process by passing through an analog filter which is used to filter the noise from the signal i.e. to isolate the impulse response excited by the faulty bearing damage. After filtration the signal then further passed through a full wave rectifier module which is then change the negative half to the positive cycle. After the flip of the signal the signal then sent to the envelope detection module to identify it’s envelop. In the last phase of the process the signal then send to the signal analyzer for the identification of bearing damage signature.
In Figure 4.4 the analog to digital converter (A/D) has been employed for high speed and most accurate conversion gives the possibility to for more accurate vibration analysis.

Chapter 4: Vibration Monitoring Based Maintenance
Figure 4.3. The acceleration enveloping method for bearing damage detection using analog devices base approach [69].
The acceleration enveloping method works well in bearing damage detection, by undertaking the appropriate approach in designing the analog device for particular application. It depends on the desired application; the parameter setting of the analog devices used in this application can be configured accordingly, to match with the given condition of bearing selected for monitoring.
As an example the bearing support structure where it has been installed, may have different resonant structure in that case we need to design the filter with different cut off frequency to filter the bearing damage impulse response. In the same way for the different structural damping, there is a need to design and set the analog device with different time constant in order to match the impulse response [69].
Figure 4.4. The acceleration enveloping method for bearing damage detection using digital processing based approach [69].
Sensor Response
Band pass filter
Filtered Response
Rectifier Envelope Detector
Envelope
Spectrial Analyzer
Digital Filtering
Hilbert Transform and Envelope
Detection
Envelope
Spectrial Analysis
Spectrial Analyzer
A/D High speed Analog to digital
Sensor Response
Sensor Response

Chapter 4: Vibration Monitoring Based Maintenance 4.4 Signal Processing and Data Acquisition system for Vibration Analysis:
The objective of signal processing in prognostic, diagnostic and condition based maintenance are as follow: (i) to remove the noise and distortion, mixed with the original signal and recover the signal in its original form, (ii) clip and remove the unnecessary information from the signal which is not suitable for prognostic and diagnostic purpose, (iii) for effective use of such information the signal further transforms into more meaningful information so that required features of interest become more explicit for analyzing purpose. The transformation method may be Fourier analysis, wavelet transform or any other technique [51].
The time domain averaging analysis is used for extract the speed relation information from the signal which is superimposed with noise and resonance. To determine the machine specific signatures the spectrum analysis method is employed by magnitude and phase relationship.
The standard condition monitoring system can be divided into three main components this include data gathering or data collection followed by the data acquisition and finally fault diagnostic algorithm or fault diagnosis. In the first phase data is collected and then converted in to digital format for further processing. The next stage which is data acquisition receives data from the data collection module for calculation the statistical function and values in frequency and time domain. This block further applies different techniques for analysing of data pattern for further processing. The third stage which is more complex compare with first two stages as its function involve to diagnose fault, due to its functionality and importance in machine fault diagnosis different methods and technique are developed and still major work is underdevelopment. Newly developed analysis techniques like wavelet analysis, fuzzy logics, case based reasoning and neural networks for vibration or fault pattern recognition are being successfully applied [54].
4.5 Vibration measurement system:
In the recent development in integrated technology the development of high speed analog to digital converter (A/D), the acceleration enveloping dramatically change the vibration measurement technique. By employing this technique using A/D converter it is much easier, faster and accurate to take measurement using the acceleration enveloping based bearing damage detection method. One of the approach in digital signal processing is the realization of acceleration techniques see Figure 4.2 a. The conditioned signal from the accelerometer transducer is then converted to digital format through A/D converter one main feature of using digital converter is that it ensure low amplitude high frequency resonant signal excited from the bearing damage impulse. In the next step this digitized signal is then passed through the digital band pass filter for the filter of resonant noise signal excited by the bearing damage and mixed with the accelerometer signal. In the next step the enveloping detection algorithm is used for the detection of envelope in the filtered data. This result can be achieved by employing the Hilbert transform. The digital Hilbert transform is connected to the Fast Fourier transform FFT and can be easily accomplish.

Chapter 4: Vibration Monitoring Based Maintenance The condition monitoring systems based on vibration analysis technique monitors all the components of gear box such as gears, bearing and shafts. The typical components for any condition monitoring system is shown in Figure no 4.5. In order to have good signal to noise ration a vibration signal should be filtered and preamplifier. In the next stage the signal is further undergoes by two different processing. The overall vibration level is then monitored in an analog RMS detector section. If the level of the vibrations exceed the pre defined level the alarm is annunciate to indicate the severity of the monitor gearbox and to stop any deterioration process. To make the monitoring system more effective and sensitive to any kind of incipient fault the received analog signal is send to analog to digital converter (A/D) to digitize the received information. The time domain signal is synchronously averaged and again filtered to get the most appropriate component of the vibration signal. In the next stage of the process some selected condition indicators (CIs) are computed. In the final stage of this signal processing the computed condition indicators are compared in the decision module to take the appropriate step as per condition and severity of the components. In this decision making module if any of the computed condition indicators exceed the defined limit then it initiate the alarm condition [69].
Figure 4.5. Condition monitoring system based on vibration analysis [68].
Tacho signal
Stop signal generator
Classifier
Comparator
Signal filtrering and
averageing
Raw Vibration signal
Anti-aliasing filter
A/D
Analog to digital converter
Preamplification
Pre-Amplification RMS Detector
CIs= Condition Monitroing Indicators

Chapter 5: Integration of Infrared Thermography in Condition Monitoring
Chapter No. 5 Integration of Infrared Thermography with the Condition Monitoring
The chapter is divided into three sections. The first section presents the overview of infrared thermography as a condition monitoring technique; the discussion further covers the integration of Infrared thermography with online condition monitoring. The second section presents the experiment on “detection of rolling bearing degradation using infrared thermography” [79], the experiment result clear showed the correlation between the vibration and the temperature of the monitoring system. The experiment is presented here, in order to support and validate the idea of using an infrared thermography as a condition monitoring technique.

Chapter 5: Integration of Infrared Thermography in Condition Monitoring
Chapter No. 5 Integration of Infrared Thermography with Condition Monitoring
Infrared thermography is an excellent condition monitoring technique for diagnostic of equipment and machine. This technique allows to monitor thermal pattern of the equipment in the operating condition, running in full load condition. As a general rule all the equipment has an operating temperature limit which is suitable to use as a base line for detecting thermal changes and variations. This method of detecting thermal anomalies has a wide range in diagnostic and has application in different equipments and machines like, bearings, gear box, conveyor system, drivers, motors, electric generators etc. Such applications of infrared thermograph is recognized as one of the most versatile and effective condition monitoring tools. This method of thermal imaging improves the ability to predict machine failure and accordingly to plan maintenance action before it becomes sever and cause unplanned break down [78].
5.1 Infrared Scan Process for Machine Health Monitoring.
For continue monitoring of health of machine an IR monitoring scanning algorithm is given below showing full equipment scan process for fault detection using infrared thermal imaging camera, the IR scan is a part of integrated condition monitoring system applying with other technology for complete health monitoring.
An algorithm is showing in Fig 5.1, the scan process for the machine or equipment can be set by predefined time interval as appropriate. Once the scan process starts it takes the thermal images of a defined target to find out the thermal anomalies in the system by compare with the base line image of the equipment and if there is no deviation found then rescan process will be start after a time interval set by the user. In case if there is any abnormality found during the scan process then it will go to another further step to investigate the problem using IR thermal imaging software. The diagnosis process starts to identify the nature of problem; once the problem is identified it will then check with the priority of the problem as defined in the priority and alarm list by the maintenance planner. During this diagnostic phase if the problem is in sever and inadequate condition then it generates an IR report for the effective area of the target object with all necessary temperature gradient details and thermal patterns for detail investigation and repair to maintenance planner for necessary corrective action.

Chapter 5: Integration of Infrared Thermography in Condition Monitoring
Figure 5.1. IR monitoring scan process for the equipment.
In case if the nature of problem is not at high priority (depends on the nature of problem) then it
is added to waiting stack for rescanning process. If the abnormality is found but the problem is
not identified then it will further investigate through other means by employing vibration and
ultrasonic testing of the equipment.
No
Added to Que stack watch list
Immediate Attentation Warranted?
Perform Equipment Scan
Under Normal Condition
Abnormility Found
Follow normal scan Schedule
Investigate and Repair
Schedule for Re-scan
PM Planner writes
corrective work order
Yes
Yes
Yes Yes
No
Problem Identified?
Inspect with other Technology Schedule vibration, ultrasonic, Oil testing etc.
Yes
No
No
Generate IR report
and submit to Maintenance
No
Start

Chapter 5: Integration of Infrared Thermography in Condition Monitoring
5.2 Integration of Infrared Thermography with On-line Condition Monitoring:
The infrared red thermography approach is adopted in this project to be integrated with an existing condition monitoring system of wind turbine for continuous monitoring of wind turbine gear box for early detection of gear box anomalies. In the proposed model an FLIR camera A-320 has been used with IR control software. The vibration signal from gear box and main bearing is collected from accelerometer which is placed in the housing of gear box and near main bearing. The noise filter is also used with both accelerometers to filter the signal from the noise.
The temperature rise of the bearing and gears in the gear box depends on different factors. The increase in vibration is mainly due to the speed of the shaft so it also taken into consideration as it varies due to different rotor speed; therefore it is also one of the parameter that will cause the increase in temperature in the gear box. For the reason mentioned and in order to address this issue a tachometer is used in this arrangement to detect the speed of the main shaft, please refer to Figure 5.2. The output from tachometer at high speed shaft is attached to data acquisition board. Vibration signals from gear box and main bearing coming through accelerometers are also used as an input to data acquisition, signal processor board for signal processing. The output from data acquisition board is an input to the host controller where IR automation software is installed as a diagnostic program, the another input of controller comes from A-320 camera here it correlates with the input from data acquisition board the resulting trend will then be presented to the user display. The user then prompt to two different displays, the Display-1 presents the trend of temperature verses vibration and Display-2 presents the trend analysis of temperature with detail IR report of the target object for detail analysis.
Figure 5.2. Showing experimental setup for condition monitoring using IR approach.
Noise Filter
DAQ Board
And
Signal
Processor
Noise Filter
Host controller
IR Camera Interface
Tachometer from High speed shaft
Accelerometer from Gear Box
Infrared Camera A-320
Display-1
Trend Analysis of vibration and
Temp
Display-2
Trend analysis of Temp and detail IR
Report of the target object.
Accelerometer from Main Bearing

Chapter 5: Integration of Infrared Thermography in Condition Monitoring
5.3 The case study- Detection of rolling bearing degradation: To support and validate the method of infrared thermography to use as a prognostic online condition monitoring tool for gear box, an experiment has been presented here, that showed that infrared thermography is a good approach for detection of rolling bearing degradation. The experiment was conducted by A. Mazioud and J.F. Durastanti from Candau Laboratories Certes France [79] and an experimental test bench had been setup for verification and simulation purpose. The study deals with the detection and the diagnosis of spalling in rolling bearings. In this experimental setup the test rig had the possibility to create the defect in a progressive way, of spalling defect on the external ring of the rolling bearing.
Two measurements were taken simultaneously, the vibration measured in radial direction by using an accelerometer and the measurement of temperature on external race of bearing surface by using infrared camera. The results showed a significant correlation between both measurements. As the heat generated due to spalling defect and transfers between the rolling elements and the spalling at the outer race of the bearing, this state gives the possibility to evaluate the temperature rise due to the heat generated from the spalling defect at the bearing race, please refer to Figure 5.4.
Figure 5.4. Rise of temperature of the rolling bearing due to the presence of a spalling zone on the outside ring [79].
Periodic impacts are generated by a spalling zone located between one of both rings of the rolling bearing (an impact in every passage of a rolling on the spalling zone). These periodic impacts excites the mechanical system structure. The whole bearing cap is thus going to vibrate at its echo frequency. Due to the spalling zones situated between one of the rings of the rolling bearing; the periodic impacts are generated. These periodic impacts now become the source of excitation to excite the mechanical structure of the machine. These results the bearing cap to vibrate at its echo frequency. The damping of the vibration causes to convert a part of the damping vibratory energy into heat. This heat generation results in the increase of ring temperature, more specifically on the external surface of the bearing.
Heat Pattern Generated at Rolling
Bearing Outer Surface
Spalling zone on the outside ring Radial Vibration
Piezoelectric Accelerometer

Chapter 5: Integration of Infrared Thermography in Condition Monitoring
To summarize, the experimenter think that the measurement of this temperature rise might allow us to estimate the vibratory energy quantity generated by the periodic impacts, and therefore to estimate the level of the rolling degradation [79].
The value of the bearing frequency can be known from the bearing specifications given by manufacturer. As an example of such frequencies please refer Table 5.1. Table 5.1: Showing frequency of spalling defect [79].
The definition of the parameters given in Table 5.1 are as follow
Ni: Rotational speed of the internal ring;
Ne: Rotational speed of the outside ring;
fbe: Impact frequency if fault (spalling) is on the outside ring;
fbi: Impact frequency if fault (spalling) is on the internal ring;
fer: Impact frequency if fault (spalling) is on rolling element,
The methodology which has been adopted in the test rig is showing in Figure 5.3. The spalling in the bearing is located between the outer and inner race of the bearing, as the bearing rotates the periodic impacts are generated due to this spalling (as the bearing race comes in contact or comes in passage of a rolling on the effected zone of the bearing). Such periodic impacts generate vibration and excite the mechanical frame and structure of the test bench. The damping effect of the vibration thus converts a part of damping vibration into heat. This heat energy then induces to increase the temperature of the race of bearing specially the outer surface. To summarize this phenomena the experimenters conclude that measurement of this temperature increment enable us to estimate the vibratory level generated by the periodic impacts, and therefore to estimate the intensity of the rolling degradation [79]. An accelerometer is placed to measures the vibration level in the radial direction and for the measurement of bearing external surface temperature an infrared camera is employed, please refer Figure 5.3.
Ni rpm Ne rpm Ne rpm fbe (Hz) fbi (Hz) fer (Hz)
1 490,4 0 76.84 76.84 121.88 109.96

Chapter 5: Integration of Infrared Thermography in Condition Monitoring
Figure 5.3: Showing experimental setup of defect [79].
Figure 5.4: The inner and outer ring of the bearing [80].
Figure 5.5: The bearing cover as seen by infrared camera [79].
During experiment the rotation speed of the axis is maintained and kept constant at1500 rpm. The measurement taken for various forces applied by the tightening screw as shown in Figure 5.3.
At this stage vibration level measurement (value in mm/s) has been taken along with the bearing temperature on the external surface of the bearing cover has been recorded.
Spalling zone on the outside ring
Tightening screw
Accelerometer Rolling bearing
Rollings
Casing
Outside Ring
Inside Ring

Chapter 5: Integration of Infrared Thermography in Condition Monitoring
The result achieved from this experiment is presented in Figure 5.6.
Temperature °C
Figure 5.6. Evolution of the temperature of the bearing cap according to the vibratory level [79].
The result presented in Figure 5.6 shows a clear correlation between mechanical vibration and temperature effects. The thermal conductivity of the rolling bearing and the axis which is made of steel is 16.27 W/m. K (watts per kelvin-metre).
Figure 5.7 shows the temperature gradient on one section of this experimental bench for various values of the power generated inside the rolling bearing.
P= 14.8 W P= 44.4 W Figure 5.7. Showing temperatures gradient computed within the bearing cap during rotation [79].
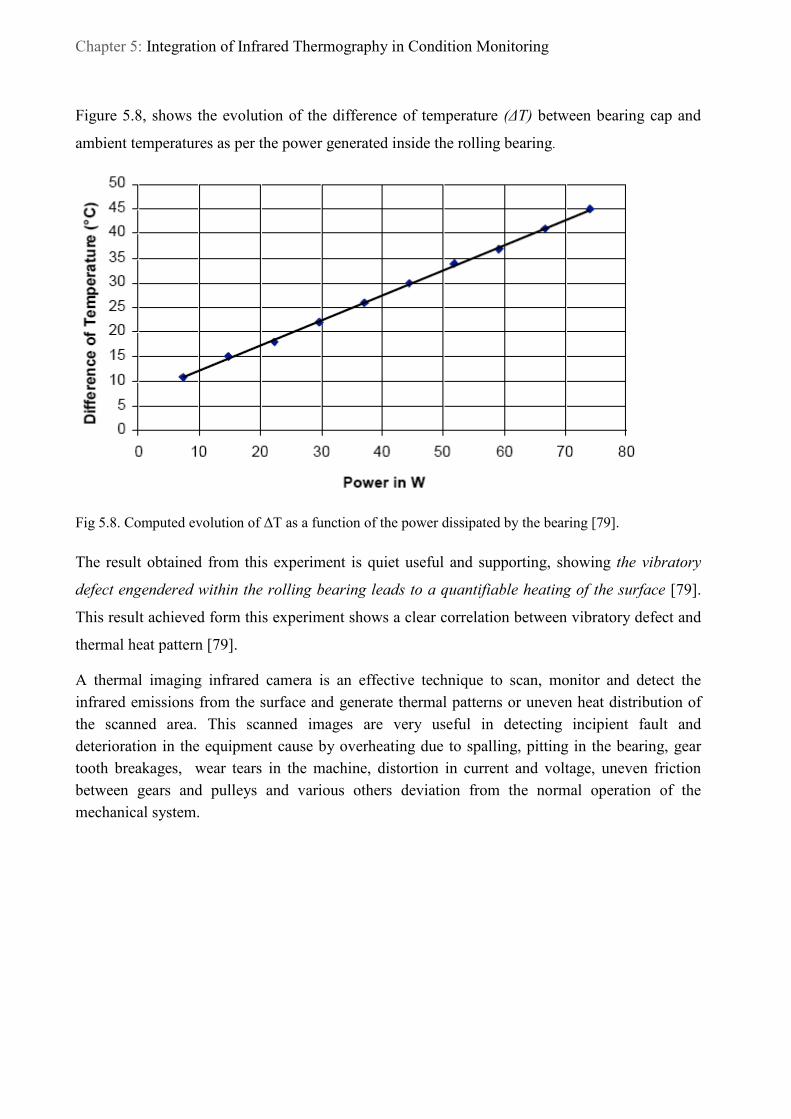
Chapter 5: Integration of Infrared Thermography in Condition Monitoring
Figure 5.8, shows the evolution of the difference of temperature (∆T) between bearing cap and
ambient temperatures as per the power generated inside the rolling bearing.
Fig 5.8. Computed evolution of ∆T as a function of the power dissipated by the bearing [79].
The result obtained from this experiment is quiet useful and supporting, showing the vibratory
defect engendered within the rolling bearing leads to a quantifiable heating of the surface [79].
This result achieved form this experiment shows a clear correlation between vibratory defect and
thermal heat pattern [79].
A thermal imaging infrared camera is an effective technique to scan, monitor and detect the infrared emissions from the surface and generate thermal patterns or uneven heat distribution of the scanned area. This scanned images are very useful in detecting incipient fault and deterioration in the equipment cause by overheating due to spalling, pitting in the bearing, gear tooth breakages, wear tears in the machine, distortion in current and voltage, uneven friction between gears and pulleys and various others deviation from the normal operation of the mechanical system.
Chapter 6: Conclusion, Suggestions and Future work
Chapter No. 6 Conclusion, Suggestions and Future work
This is the last chapter of this study, here author present the conclusion and recommendations of this study. The chapter is divided into two sections. The first section presents the conclusion and the second section come up with the suggestions which include future work for online condition monitoring of wind turbine system.

Chapter 6: Conclusion, Suggestions and Future work Chapter No. 6 Conclusion, Suggestions and Future Work
As it realized from the study that vibration monitoring is the most appropriate technique to monitor the health state of the machine and its components, for this reason it is acknowledged as a proven technology for condition based maintenance program to access the health of the system. From the study work it is concluded that employing condition monitoring has a primary objective to acquire components conditions to support condition based maintenance with the main goal to reduce the level of scheduled maintenance and also to detect the incipient fault that is developed in the system before it becomes worst and leads to catastrophic failure and cause unplanned outages of the system. To get all possible benefits from the condition monitoring system the system should be an integral part of the wind turbine.
As different methods and technologies that have been discussed in this study could be used as an integrated part of comprehensive condition based maintenance. Although vibration measurement is of great importance but this technique of monitoring components health state is limited to mechanical components, and does not cover all critical parameters of the system that could be essential for maintaining the health of the machinery. Therefore, a comprehensive condition based maintenance programme should implement other monitoring and diagnostic techniques. As a part of this thesis work the infrared thermography has been proposed to integrate with the existing condition monitoring system.
As infrared thermography (IRT) is a proven technology to investigate thermal anomalies as it provides complete thermal images of a machine or a machine component in processing industries power plants and in other areas. It is therefore proposed as a prognostic diagnostic technique for detecting anomalies in the gear box of wind turbine for early warning so that maintenance action can be planned much before any further wear tear could happened in the gear box which may cause serious damages to the costly components. It is therefore IRT technique can be used as a part of condition monitoring system to predict component failure and decrease down time.
As a conclusion of this study work the following points are summarized.
(i) To prevent unplanned breakdown, reduce frequency of maintenance and for proactive condition based maintenance it is effective to reduce the stoppages and increase the efficiency of the equipment by prolong the life of the machine by taking active measures during operation and maintenance. Employing condition monitoring for rotating machine is the only way to avoid catastrophic failure and reduce maintenance cost.
(ii) In the wind turbine, a rolling contact bearing is one of the components that require more work in signature analysis. There is a wide scope in fault signature analysis of rolling bearing by using vibration data.
(iii) Using vibration signal is an effective technique for fault localization. Different condition monitor indicators using signal processing techniques can be used for detection of anomalies in bearing and gear box. The fast Fourier transforms (FFT) and wavelets transform have a high scope in vibration analysis.

Chapter 6: Conclusion, Suggestions and Future work (iv) Acoustic emission technique shows a great potential in detecting fault in gearbox and bearing, a wide categories of faults in rolling element bearing and gear box can be addressed through using this method.
During this case study project interviews and open discussions have been conducted to know and acknowledge the problems being faced by the wind farm owners. After detailed study and discussion it is realized that complete operation, monitoring and maintenance of wind turbines are being performed by supplier. Wind turbine manufacturer usually does not supply O&M manuals (operation and maintenance) and other operational data base to the wind farm owners, this approach adopted by wind turbine manufactures makes the reason for the wind farm owner to be entirely depended on the supplier.
To meet the challenges of this industry and to develop the different system and components for wind turbine there is a crucial need of development centre who would complete source of information in this area and that works closely with wind firm operator, research centre, universities, companies engaged in producing components and system for wind turbine to be able to start and boost up wind turbine business in Sweden as a first phase.
These conclusions motivate further work to incorporate other condition monitoring parameters and technique with vibration monitoring to develop more robust intelligent systems for on line machine health and faults signature analysis.
Implementing condition monitoring system for a wind turbine system is new and challenging, therefore requires more attention and focus in different areas of the wind turbine. Implementing successful condition based maintenance needs a comprehensive coverage of the faults being reported in last several years. To handle and address vital issues of the turbines requires an effective condition monitoring system equipped with all necessary features and options needed to cover potential faults in the turbine system.
The condition monitoring system using IR thermography approach that has been presented in this report can be implemented for online condition monitoring a gear box in wind turbine. The next step towards development of intelligent CMS system is to build a proto type model that has been equipped and facilitated with all necessary tools and techniques needed to facilitate the development work. To validate such a model a test bench needs to be built that can provide facility to practically employ different vibration techniques for gearbox and bearing to study and analyze the result. In the third phase of project the development of intelligent CMS system is planed by employing artificial intelligence like fuzzy logic and neural network. Additional effort is then required to identify opportunities for improving reliability and performance of the CMS.

References
References:
[1] Adolfo Crespo Márquez, The Maintenance Management Framework: Models and Methods for system maintenance, Technology & Engineering; Springer, 2007.
[2] Jesse Agwandas Andrawus, “Maintenance Optimization for wind turbines”, Ph.D. dissertation, Robert Gordon University, April 2008. [3] Dr. Tomás Alvarez Tejedor, “Advanced Gas Turbine Asset and Performance Management at Endesa”, GE Energy, Spain, Tech. Rep. Vol.27 No.2, 2007.
[4] C. McGowan, “Condition Monitoring of Wind Turbines” Technology Overview, Seeded- Fault Testing, and Cost-Benefit Analysis, Electric Power Research Institute (EPRI), California, USA, Technical Rep. 1010419, 2006 [5] Teklehaimanot Tadele, “Improvement of Maintenance Management system”, Addais Raba University, Scholl of Graduates studies, faculty of Technology. 2007.
[6] Johan Ribrant, “Reliability performance and maintenance”, A survey of failures in wind power systems, Master Thesis, KTH School of Electrical Engineering, March 2006.
[7] P.Caselitz, J Giebhardt, T.Kruger and M. Mevenkamp, “Development of fault detection system for wind energy converters”, Institute of solar energy Technik (ISET), Kassel Germany, Presented at EWEC, Göteborg, Sweden, 1996.
[8] E. Muljadi and C.P. Butterfield, “Pitch-Controlled Variable-Speed Wind Turbine Generation”, NREL/CP-500-2714, Presented at the 1999 IEEE Industry Applications Society Annual Meeting Phoenix, Arizona October 1999.
[9] “Wind energy converters”Available at: http://www.stevens.edu/green/infrastructure/ campus.html. [Accessed: Dec. 04, 2008].
[10] George Sterzinger, “Wind turbine development, Renewable Energy Policy Project (REPP)”, Washington, USA, Technical Rep. 2004.
[11] “View inside the Nacelle”, Available at: http://visual.merriam-webster.com/energy/wind- energy/wind-turbines-electricity-production/nacelle-cross-section.php. [Accessed: Jan. 30, 2010].
[12] “How does a wind Turbine Work”, Available at: http://www.windfarming.co.za/turbines.htm. [Accessed: March. 20, 2008].
[13] “Wind Basic”, Available at: http://www.tobieminingenergy.com/wind-basics.htm. [Accessed: March. 03, 2008].
[14] Grzegorz Barzyk and Stanisław Kalisiak, “The Structure of Modern Wind Plants”, A View of Vestas Products, Technical University of Szczecin, Poland. 2006.
[15] “Wind Energy Conversion Systems”, Available at: http://www. copper canada.ca /publications/windpower/conversion.html. [Accessed: March. 20, 2008].
[16] R.M. Zavadil, “Wind Generation Technical Characteristics for the NYSERDA Wind Impacts Study”, Knoxville, USA, Technical Rep. 2003. [17] Erich Hau, “Wind Turbines”, Fundamentals, Technologies, Application, Economics, 2nd ed. ISBN: 978-3-540-24240-6. Krailling: Springer, 2006.
References
[18] “About wind turbines”, July 2006. Available at http://www.edinformatics.com/math_science alternative _energy /wind/about _ wind _ turbines.htm. [Accessed: March. 03, 2008]. [19] M.Ragheb, “Control of Wind Turbines”, January 2008. Available at: https://netfiles.uiuc.edu /mragheb/www/NPRE%20475%20Wind%20Power%20Systems/ Control%20 of%20Wind %20Turbines. Pdf. [Accessed: March. 03, 2008]. [20] Tony Burton, David Sharpe and Nick Jenkins, “Wind Energy hand book”, ISBN: 0471489972, New York: John Wiley, 2001. pp: 360. [21] B.Chitti Babu and K.B.Mohanty, “Doubly-Fed Induction Generator for Variable Speed Wind Energy Conversion Systems”, Modeling & Simulation, International Journal of Computer and Electrical Engineering, Vol. 2, No. 1, 1793-8163, June, 2008.
[22] Michele Lucente, “Condition Monitoring System in Wind Turbine Gearbox”, Master Thesis, KTH, Royal Institute of Technology, School of Electrical Engineering, Sweden, April 2008. [23] James F. Manwell, Jon G. McGowan, Anthony L. Rogers, “Wind Energy Explained”, Theory, Design and Application, ISBN: 04700155004, John Wiley & Sons, Feb 2010. [24] Anders Ahlstrom, “Aeroelastic Simulation of Wind Turbine Dynamics”, Doctoral Thesis, Royal Institute of Technology Department of Mechanics, Stockholm, Sweden, 2005.
[25] Paul Gipe, “Wind Power, Renewable Energy for Home, Farm, and Business”, ISBN13: 9781931498142, 2nd ed. Chelsea Green Publishing Company, 2004.
[26] Thommy Ekelund, “Yaw control for reduction of structural dynamic loads in wind turbines”, Control Engineering Laboratory, Chalmers University of Technology, Sweden, 2000.
[27] “Advanced maintenance and Repair for off shore wind farm using fault prediction and Condition Monitoring Techniques”. Funded by the European commission, DG TREN NNE5/2001/710, Technical Report; 2005, Available at: http://ec.europa.eu/energy/ renewables/wind_energy /doc/offshore.pdf, [Accessed: April, 22, 2008].
[28] Charlie Hatch, “Improved Wind Turbine Condition Monitoring Using Acceleration Enveloping”, GE Energy Bently Nevada, 2004.
[29] Bianchi, Fernando D., Battista, Hernán, Mantz, Ricardo J, “ Wind Turbine Control Systems”, Principles, Modelling and Gain Scheduling Design, XIX, 207 p. 105 illus. ISBN: 978-1-84628-492-2, Springer, 2007. [30] Jerry Rust, “Routine Inspections Play Key Role in Condition Based Maintenance”, Reliability Engineer Buzzi Unicem USA. Available at, http://tf7.com/beta/pdf/Routine Inspections & CBMBuzzi_FINAL.pdf. [Accessed: March .15, 2010].
[31] M. K. Pradhan & J. P. Bhol, “Trends and Perspectives in Industrial Maintenance Management”, Synergy Institute of Engineering and Technology, Dhenkanal Orissa, India. 2006 [32] “Implementation Strategies and Tools for Condition Based Maintenance at Nuclear Power Plants”, Nuclear Power Engineering Section International Atomic Energy Agency, Vienna, Austria, Tech Rep. May, 2007.
[33] S.K.Sethiya, “Condition Based Maintenance (CBM)”, Jan. 2006, Available at http://irsme.nic.in/files/cbm-sethiya.pdf [Accessed: April. 5, 2008].

References
[34] European Standard, SS-EN 13306, 2001, p.15. Available at: http://www2.arnes.si/~sspvjeme /SIST_EN_13306.pdf. [Accessed: Jan. 20, 2010].
[35] Steve Butcher, “Condition-Based Maintenance”, Logistics Management Institute. Available at: http://www.acq.osd.mil/log/mpp/senior_steering/condition/Butcher% 20CBM .ppt. [Accessed: Jan. 20, 2010].
[36] Pedregal, D. J., Carnero, C., “Vibration analysis diagnostics by continuous-time models”, A case study in Reliability Engineering and System Safety, vol. 94, no. 2, pp. 244-253, June 2009.
[37] Barron, R. “Engineering Condition Monitoring”, New York: Addison Wesley Longman Inc. 1996.
[38] Mobley, R., “An Introduction to Predictive Maintenance”, New York: Butterworth- Heinemann/ Elsevier Science, 2002.
[39] Bankim Shikari, “Automation in Condition Based Maintenance Using Vibration Analysis” Maulana Azad National Institute of Technology, Bhopal, India, 2008.
[40] “Condition-based Maintenance, (CBM) Across the Enterprise”; OSIsoft, Inc. San Leandro, CA. www.osisoft.com, Available at http://www.osisoft.com/WorkArea/linkit.aspx? LinkIdentifier=id&ItemID=3185, [Accessed: Nov. 20, 2008].
[41] Liliane Pintelon and Alejandro Parodi-Herz, “Maintenance: An Evolutionary Perspective”, 2008, Available at: http://www.buchhandel.de/WebApi1/GetMmo.asp?MmoId =5446785& mmoType = PDF. [Accessed: Dec.10, 2009].
[42] H.Ahmadi and P. Salami, “Electro-pump Fault Diagnosis of Marine Ship by Vibration Condition Monitoring”, University of Tehran, Karaj, Iran. 2009. Research Journal of Applied Sciences, Engineering and Technology 2(3): 204-207, 2010. ISSN: 2040-7467. May 10, 2010. [43] Troy V.Nguyen and Harold W. Nelson, “A System Approach to Machinery Condition Monitoring and Diagnostic”, Lockheed Martin Information Systems Ship Automation Systems Orlando, Florida, 2006.
[44] Henry C. Pusey, “Turbo machinery Condition Monitoring and Failure Prognosis”, SAVIAC /Hi-Test Laboratories, Winchester, Virginia. Research Journal of Sound and Vibration, March 2007. Available at: http://www.sandv.com/downloads/0703puse.pdf. [Accessed: Oct.20, 2009]
[45] Scheffer, C Girdhar, “Practical machinery vibration analysis and predictive maintenance”, Oxford: Newnes, (2004).
[46] Heiler, C., “Handbook of Non-destructive Evaluation”, McGraw-Hill Professional Publishing, 2001.
[47] “IR Thermography Primer”, FLIR Pocket Book out. Available at: http://www.triosmartcal. com.au /documents/Thermography%20Primer%20LR.pdf. [Accessed: Oct.20, 2009].
[48] T.W. Verbruggen, “Wind Turbine Operation & Maintenance based on Condition Monitoring”, WT-Ω, Final technical Rep. 2003. ECN-C--03-047. Available at: http://www.ecn.nl /docs/library/report/ 2003/c03047.pdf. [Accessed: Aug. 20, 2009].
[49] Tavner, P.J, “Review of condition monitoring of rotating electrical machines”, Sch. of Eng., Durham Univ., Durham, Publised in Electric Power Applications, IET, Volume: 2 Issue: 4, ISSN: 1751-8660, pp. 215 – 247, July 2008.

References
[50] Ian Howard, “A review of Rolling Element bearing Vibration- Detection, Diagnosis and Prognosis”, DSTO Aeronautical and Maritime Research Laboratory, Melbourne, Victoria 3001 Australia. AR No 008-339, October 1994.
[51] Marcus Bengtsson1, Erik Olsson, Peter Funk, and Mats Jackson, “Technical Design of Condition Based Maintenance System”, A Case Study using Sound Analysis and Case- Based Reasoning, Mälardalen University, Eskilstuna, Sweden, 2004.
[52] Dennis H. Shreve, “Introduction to Vibration Technology”, IRD Mechanalysis, Inc.Columbus, November 1994.
[53] Measuring displacement using accelerometers, By Renard Klubnik, Wilcoxon Research. Germantown, USA. March, 2008.
[54] Ulrich SÜDMERSEN, “Vibration Monitoring for Process Control and Optimization in Production Lines”, FORTEC-Forschungstechnik GmbH, Wunstorf, Germany, March, 2006.
[55] “Effective Machinery Measurements using Dynamic Signal Analyzers”, published in Hewlett Packard Application Note 243-1, Available at: http://www.me.ua.edu/me360/docs/HP- DSA.pdf. [Accessed: March.20, 2009].
[56] Pratesh Jayaswal and A. K.Wadhwani, “Machine Fault Signature Analysis”, Madhav Institute of Technology and Science, Gwalior, India Hindawi Publishing Corporation, International Journal of Rotating Machinery, Volume 2008, Article ID 583982, 10 pages.
[57] Darley Fiácrio and Arruda, “Application of wavelet transform to detect faults in rotating machinery”, , UNICAMP / Universidade Estadual de Campinas – Faculdade de Engenharia Mecânica CEFET-PI / Centro Federal de Educação Tecnológica do Piauí Caixa, Santiago, 2004,Vol-1, pp 616-624
[58] R. Oliquino, Jr., S. Islam and H. Eren, “Effects of Types of Faults on Generator Vibration Signatures”, Curtin University of Technology Western Australia, 2003.
[59] “Condition Monitoring System” Available at: http://www.nordex-online.com/en/produkte- service/service/condition-monitoring-system.html. [Accessed: Aprail.24, 2008].
[60] D. Mba, “Acoustic Emissions and monitoring bearing health”, Cranfield University, Cranfield, 2003, pp.447-451.
[61] Basim Al- Najjar, “Establishing and Running Cost effective Condition Based Maintenance Policy”, Department of Terotechnology, School of Technology and Design, Växjö University, SE-351 95 Växjö, Sweden, May 1999.
[62] D. Mba & Raj B.K.N. Rao, “Development of Acoustic Emission Technology for Condition Monitoring and Diagnosis of Rotating Machines”; Bearings, Pumps, Gearboxes, Engines and Rotating Structures, Cranfield University, UK. The Shock and Vibration Digest, 2006, Vol 38(1), pp3-16.
[63] Nathan Weller, “Acceleration Enveloping. Higher Sensitivity, Earlier Detection”, GE Energy, Available at: http://www.gepower.com/prod_serv/products/oc/en/orbit /downloads/2q04accelenvel.pdf. [Accessed: July. 13, 2008].
[64] Adrian I. Cuc, “Vibration-Based Techniques for Damage Detection and Health Monitoring of Mechanical Systems”, Master Thesis, University of South Carolina, United States, 2002.
References
[65] Rui Francisco Martins Marçal, “Managing Incipient Faults in Rotating Machines based on Vibration Analysis and Fuzzy Logic”, Federal Technological University of Paran UTFPR Engineering Management Program, Ponta Grossa, Brazil, 2006.
[66] Mitchell Lebold, Katherine McClintic, Robert Campbell, Carl Byington, and Kenneth Maynard, “Review of vibration analysis methods for gearbox diagnostics and prognostics”, Applied Research Laboratory, The Pennsylvania State University, State College. Proceedings of the 54th Meeting of the Society for Machinery Failure Prevention Technology, Virginia Beach, VA, May 1-4, 2000, p. 623-634.
[67] Kwok F. Tom, “Survey of Diagnostic Techniques for Dynamic Components”, Sensors and Electron Devices Directorate, ARL, Army Research Laboratory, Adelphi, MD, Available at: http://www.arl.army.mil/arlreports/2010/ARL-TR-5082.pdf, [Accessed: Feb.20, 2010]. [68] P. Večeř, M. Kreidl, R.Šmíd, “Condition Indicators for Gearbox”, Condition Monitoring Systems, Czech Technical University in Prague, Acta Polytechnica Vol. 45, 2005.
[4] C. McGowan, “Condition Monitoring of Wind Turbines” Technology Overview, Seeded- Fault Testing, and Cost-Benefit Analysis, Electric Power Research Institute (EPRI), California, USA, Technical Rep. 1010419, 2006
[69] Huageng Luo, Hai Qiu, George Ghanime, Melinda Hirz and Geo Van Der, “Synthesized synchronous sampling technique for bearing damage detection”, Merwe.Metals Branch Metals, Ceramics and NDE Division. Air force research laboratory materials and manufacturing directorate, United States Air Force. Technical Rep. March, 2009.
[70] J Michael Robichaud, “Reference Standards for Vibration Monitoring and Analysis”, Bretech Engineering Ltd., 70 Crown Street, Saint John, NB Canada, 2004.
[71] Mathew A, Zhang S, Ma, Lin, Earle, Tom and Hargreaves, “Reducing maintenance cost through effective prediction analysis and process integration”, Management, Queensland University of Technology, George Street, Brisbane, Queensland, Australia, ), Cooperative Research Centre for Integrated Engineering Asset, 2006, Advances in Vibration Engineering 5(2):pp. 87-96. [72] P. Caselitz, J.Giebhardt, “Advanced Condition Monitoring system for Wind Energy Converters”, Institut für Solare Energieversorgungstechnik (ISET), Avd. Königstor, Kassel, Germany, 2005.
[73] By, S.K.Sethiya, “Condition Based Maintenance (CBM)”, 2007. Available at: http://irsme.nic.in/files/cbm-sethiya.pdf. [Accessed: March.28, 2008].
[74] Timothy J. Clark, Richard F. Bauer, and James R. Rasmussen, “Wind Power”, GE Energy, 2004, Available at, http://www.ge energy.com/prod_serv/products/oc/en/orbit/downloads/ 2q04windpower.pdf [Accessed: March .25, 2009].
[75] “Remote monitoring of wind turbines”, published in uptime magazine, dated: Feb. 2008.
[76] Edwin Becker, “Monitoring low-speed drive train components”, Extended measurement times, 2008. Available at: http://www.pruftechnik.nl/images/TD12_en.pdf. [Accessed: June, 23, 2008].
[77] Jochen Giebhardt, “Condition Monitoring for Wind Turbines”, European Commission, under 6th RTD programme frame work, 2002, Kassel, Germany, Technical Report, Project Upwind. Contract No.019945 (SES6), 2006.

References
[78] “Analyzing Mechanical Systems Using Infrared Thermography”, 2008, Available at: http:// www.maintenanceworld.com/Articles/petersonpredict/Analyzing-Mechanical-Systems- Using-Infrared-Thermography.html. [Accessed: March.10, 2010].
[79] A. Mazioud, j.f.Durastanti, L. Ibos, e. Surugue, Y. Candau, “Detection of rolling bearing degradation using infrared thermography”, Laboratoire CERTES (EA 3481) IUT of Sénart, Lieusaint, France, 2006.
[80] Dave Boyer, “Sizing and Applying Rolling Element Bearings”, Rexnord Industires, 2007. Available at: http://www.pump-zone.com/bearings/bearings/sizing-and-applying- rolling- element-Bearings.html. [Accessed: March. 10, 2010].
[81] Wiggelinkhuizen, E.J., Rademakers L.W.M.M., Verbruggen, T.W.Watson, S.J., Xiang, J. Giebel, G, Becker, E and Christensen, A.J. “Condition Monitoring for Offshore Win Farms”, DTU - Risø National Laboratory, Denmark, Gram & Juhl ApS, Denmark, Prüftechnik CM GmbH – D, Netherlands, Final technical Report, Conmow, NNE5-2001-00804, 2002.
[82] “Clever Farm final report”. Available at: http://www.cleverfarm.com/docs/CleverFarm %20final%20report%20%20 publishable%20version.pdf, Technical Report, ERK-CT- 1999-00006, 2003. [Accessed: May. 17, 2008].

Appendix:
Appendix A: Installation of Vibration sensors at different location of wind turbine converter.
Figure A1: Showing vibration sensor installed at different location of turbine, sources [27].
Figure A2: showing installed at generator front bearing and at rear bearing locations [27].

Figure A3: Vibration sensors of Prűftechnik system mounted on main bearing and 2nd gearbox stage [81]
Figure A4: Vibration sensors on Gearbox and Generator [82]
Figure A5: showing Sensors at Turbine side [82].

Appendix B:
1. Information for Thermo Vision™ A320 please refers attachment.
2. The IR control software for Diagnosis and prognosis to be used with Thermo Vision A320. Please refer attachment.
Appendix C:
1. Using Infrared surveys in Dunaferr Steel works, “Complex Diagnostic System”, 2004. Refer attachment.
2. Using Infrared Thermography on offshore Platform Equipment, By, Albert Amedee Ohliger ChevronTexaco Inc – Energy Research and Technology Company, 2002, Refer attachment.
3. Detection of rolling bearing degradation using infrared thermography by A. Mazioud, J.F.Durastanti, L. Ibos, E. Surugue, Y. Candau, Laboratoire CERTES (EA 3481) IUT of Sénart, Lieusaint, 77127, France, 2006. Please refer attachment.

Blekinge Institute of Technology
School of Engineering
Department of Applied Signal Processing
SE- 371 79 Karlskrona Sweden
Under Adequate Condition