Online | 6 months | 6 Terms
24
Online | 6 months | 6 Terms
Transcript of Online | 6 months | 6 Terms

Online | 6 months | 6 Terms
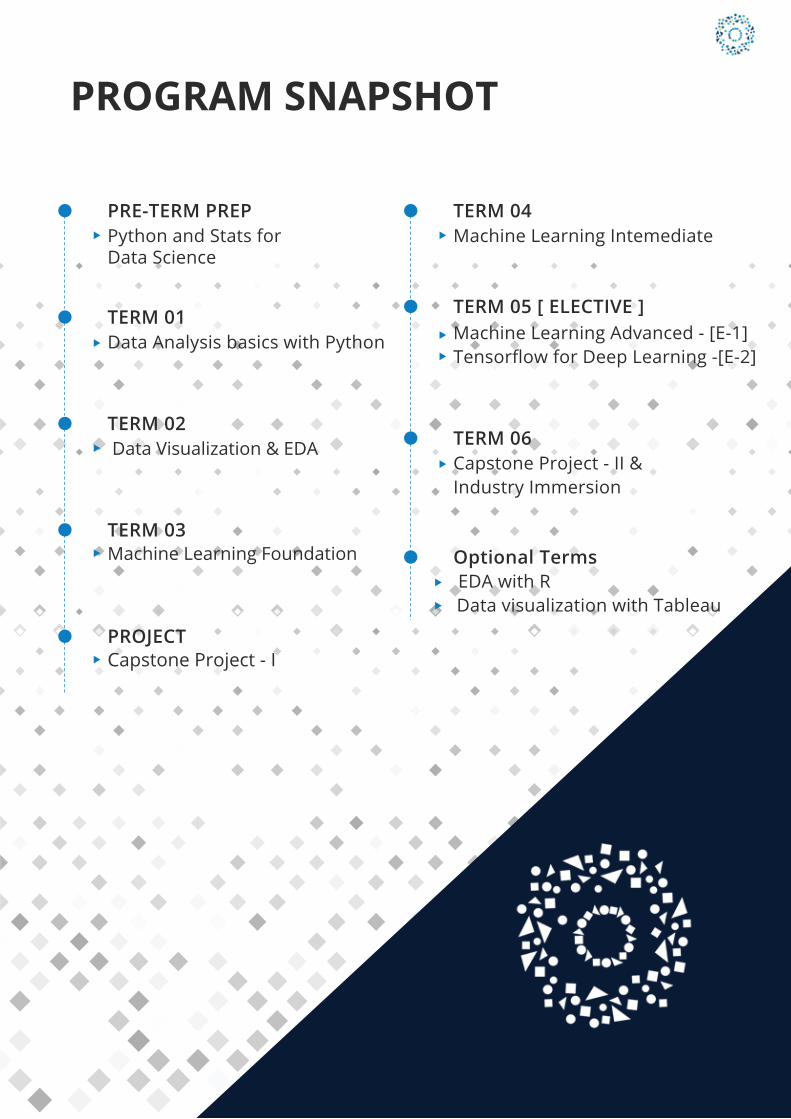
PRE-TERM PREPPython and Stats forData Science
TERM 01Data Analysis basics with Python
TERM 02 Data Visualization & EDA
TERM 03Machine Learning Foundation
PROJECTCapstone Project - I
TERM 04Machine Learning Intemediate
TERM 05 [ ELECTIVE ]Machine Learning Advanced - [E-1]Tensorflow for Deep Learning -[E-2]
TERM 06Capstone Project - II &Industry Immersion
Optional Terms EDA with R Data visualization with Tableau
PROGRAM SNAPSHOT

Term 1:
DATA ANALYSIS BASICS WITH PYTHON
Module 1 :Data Science
Fundamentals
Thought Experiment: Data Science from a layman's perspectiveBrief intro to Data ScienceHow companies use Data ScienceOverview of Data Science project lifecycleWalkthrough of data types and data challenges
Module 2 : Recap of Python for Data Science
In class quiz for Python BasicsCommon Python concepts and sample questionsVariable, Inbuilt datatyes, functions, modules and PackagesFile operations and error handling
Module 3 :Recap of Statistics
for Data Science
In class quiz for Descriptive StatisticsCommon charts usedIn class quiz for Inferential StatisticsProbability, Central Limit theorem, Normal Distribution & Hypothesis testing
Module 4 : Mathematical
operations using Numpy
Introduction to Numpy ArraysHow to apply mathematical operations in NumpyArray manipulation using NumpyBroadcast values across Arrays using Numpy
Module 5 : Data manipulation
with Pandas
Types of Data Structures in PandasClean data using PandasManipulating data in PandasHow to deal with missing values Hands-on: Implement Numpy arrays and Pandas Dataframes

Term Projects
Indian Premier League 2008-2018
Analyse key success factors for top cricket team at IPLThe matches dataset contains 18 variables and 600+ observations . The deliveries dataset contains 21 variables and 160k+ observations of the IPL 2018 season.
Car Sales Advertisment
Analyse the car sale data in Ukraine.
The dataset contains 10 variables and 9k+ observations of the car sales data in Ukraine.
Olympic 1896- 2014
Analyse which country have won the most medals at Olympic games.
The dataset contains 9 variables and 31.2k observations of the summer olympic games (1896 - 2014)
1000 movies data
Analyse the IMDB 1000 most popular movies and come up with interesting insights.
The dataset contains 12 variables and 1000 observations of the top 1000 popular movies for past 10 years
Restaurant across America data
Analyse the availability and accessibility of food across America
The dataset contains 10 variables and 10k observation of the fast food restaurants in America.
Mini Project :Data manipulation
Projects
Project Expectation settingProject TimelinesGithub for Project SubmissionPresentation guidelines
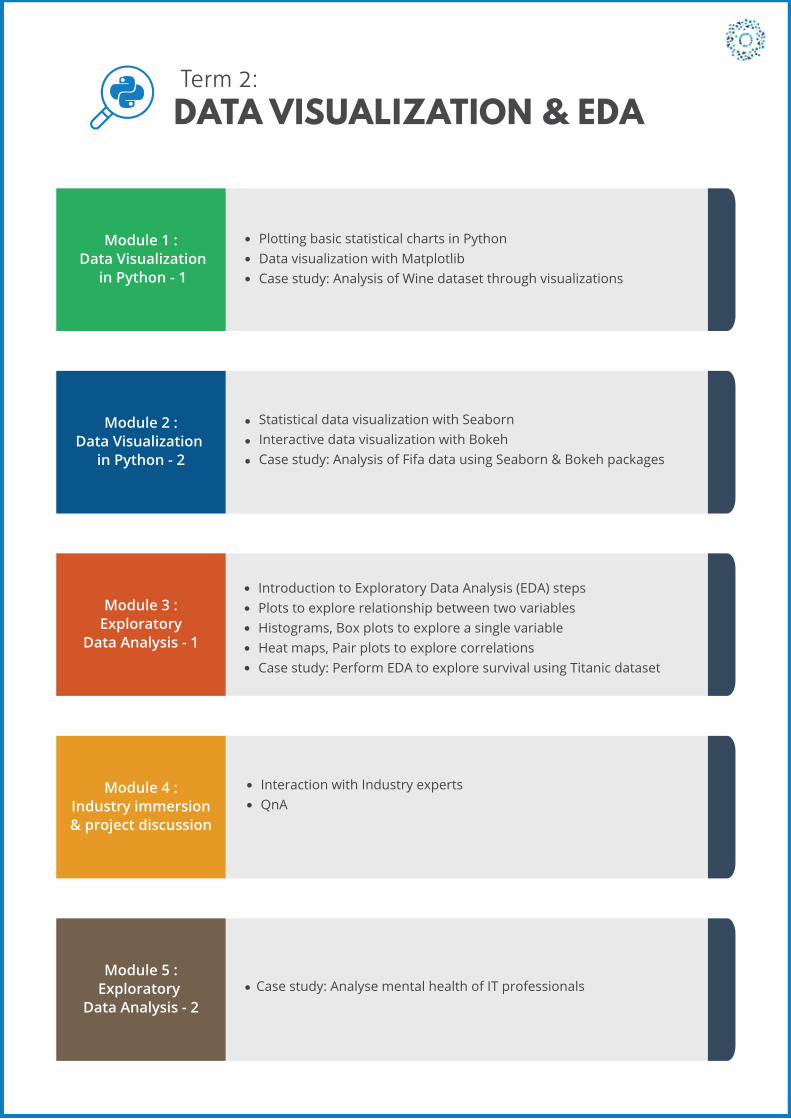
Term 2:
DATA VISUALIZATION & EDA
Module 1 : Data Visualization
in Python - 1
Plotting basic statistical charts in PythonData visualization with MatplotlibCase study: Analysis of Wine dataset through visualizations
Module 2 :Data Visualization
in Python - 2
Statistical data visualization with SeabornInteractive data visualization with BokehCase study: Analysis of Fifa data using Seaborn & Bokeh packages
Module 3 : Exploratory
Data Analysis - 1
Module 4 : Industry immersion & project discussion
Introduction to Exploratory Data Analysis (EDA) stepsPlots to explore relationship between two variablesHistograms, Box plots to explore a single variableHeat maps, Pair plots to explore correlationsCase study: Perform EDA to explore survival using Titanic dataset
Module 5 :Exploratory
Data Analysis - 2Case study: Analyse mental health of IT professionals
Interaction with Industry expertsQnA

Term Projects
Indian Premier League 2008-2018
Analyse key success factors for top cricket team at IPLThe matches dataset contains 18 variables and 600+ observations . The deliveries dataset contains 21 variables and 160k+ observations of the IPL 2018 season.
Car Sales Advertisment
Analyse the car sale data in Ukraine.
The dataset contains 10 variables and 9k+ observations of the car sales data in Ukraine.
Olympic 1896- 2014
Analyse which country have won the most medals at Olympic games.
The dataset contains 9 variables and 31.2k observations of the summer olympic games (1896 - 2014)
1000 movies data
Analyse the IMDB 1000 most popular movies and come up with interesting insights.
The dataset contains 12 variables and 1000 observations of the top 1000 popular movies for past 10 years
Restaurant across America data
Analyse the availability and accessibility of food across America
The dataset contains 10 variables and 10k observation of the fast food restaurants in America.
Module 6: Project presentation Top 3 teams present their projects details to the entire cohort

Term 3:
MACHINE LEARNING FOUNDATION
Module 1 :Introduction to
Machine Learning (ML)
What is Machine Learning ?Use Cases of Machine LearningTypes of Machine Learning - Supervised to Unsupervised methodsMachine Learning workflow
Module 2 :Linear Regression
Introduction to Linear RegressionUse cases of Linear RegressionHow to fit a Linear Regression model?Evaluating and interpreting results from Linear Regression modelsCase study: How linear regression helps determine demand
Module 3 :Logistic Regression
Introduction to Logistic RegressionLogistic Regression use casesUnderstand use of odds & Logit function to perform logistic regressionCase study:Predicting default cases in the Banking Industry
Module 4 :Decision trees
& Random Forests
Introduction to Decision Trees & Random Forest Understanding criterion(Entropy & Information Gain) used in Decision TreesUsing Ensemble methods in Decision TreesApplications of Random ForestCase study:Predict passengers survival in a Ship mishap
Module 5 :Model evaluation
techniques
Introduction to evaluation metrics and model selection in Machine LearningImportance of Confusion matrix for predictionsMeasures of model evaluation - Sensitivity, specificity, precision, recall & f-scoreUse AUC-ROC curve to decide best modelCase study:Applying model evaluation techniques to prior case study

Term Projects
Predicting temperatures in World War II
Predict the maximum temperature when minimum temperatue is known.
The dataset contains 31 varibales and 100k+ observations of the weather conditions during World War II.
Candy Classification
Classify if a candy is a chocolate or not based on its features
The dataset contains 13 variables and 86 observations to predict the most or least popular Halloween candy.
Predicting Housing prices
Predict final sales price of each house of residential homes in Iowa.
The train dataset contains 81 variables and 1461 observations. The test dataset contains 80 variables and 1460 observations of the house. prices at any anonymous location.
Credit Card Fraud Detection
Identify the fraudulent credit card transactions.
The dataset contains 31 variables and 285k observations of transactions made by credit cards in September 2013 by european cardholders.
Predicting risk in Life insuranceDevelop a predictive model that accurately classifies risk, imapcting public perception of the industry.The train dataset contains 128 variables and 59.4k observations. The test dataset contains 127 variables and 19.8k observations of the insurance applicants.

Term 4:MACHINE LEARNING INTEMEDIATE
Module 1 :Dimensionality
Reduction using PCA
Unsupervised Learning: Introduction to Curse of DimensionalityWhat is dimensionality reduction?Technique used in PCA to reduce dimensionsApplications of Principle component Analysis (PCA)Case study: Optimize model performance using PCA on high dimension dataset
Module 3 :Naïve Bayes classifier
Introduction to Naïve Bayes classification Refresher on Probability theoryApplications of Naive Bayes Algorithm in Machine LearningCase study : Classify Junk emails based on probability
Module 4 : K-means
clustering technique
Introduction to K-means clustering Decide clusters by adjusting centroidsFind optimal 'k value' in kmeansUnderstand applications of clustering in Machine LearningCase study : Segment flower species in Iris flower data
Module 5 : Support vectormachines (SVM)
Introduction to SVMFigure decision boundaries using support vectorsIdentify hyperplane in SVMApplications of SVM in Machine LearningCase Study : Predicting wine quality without tasting the wine
Module 2 :KNN (K- Nearest
neighbours)
Introduction to KNNCalculate neighbours using distance measures Find optimal value of K in KNN methodAdvantage & disadvantages of KNNCase Study:Classify malicious websites using close neighbour technique
Term Projects
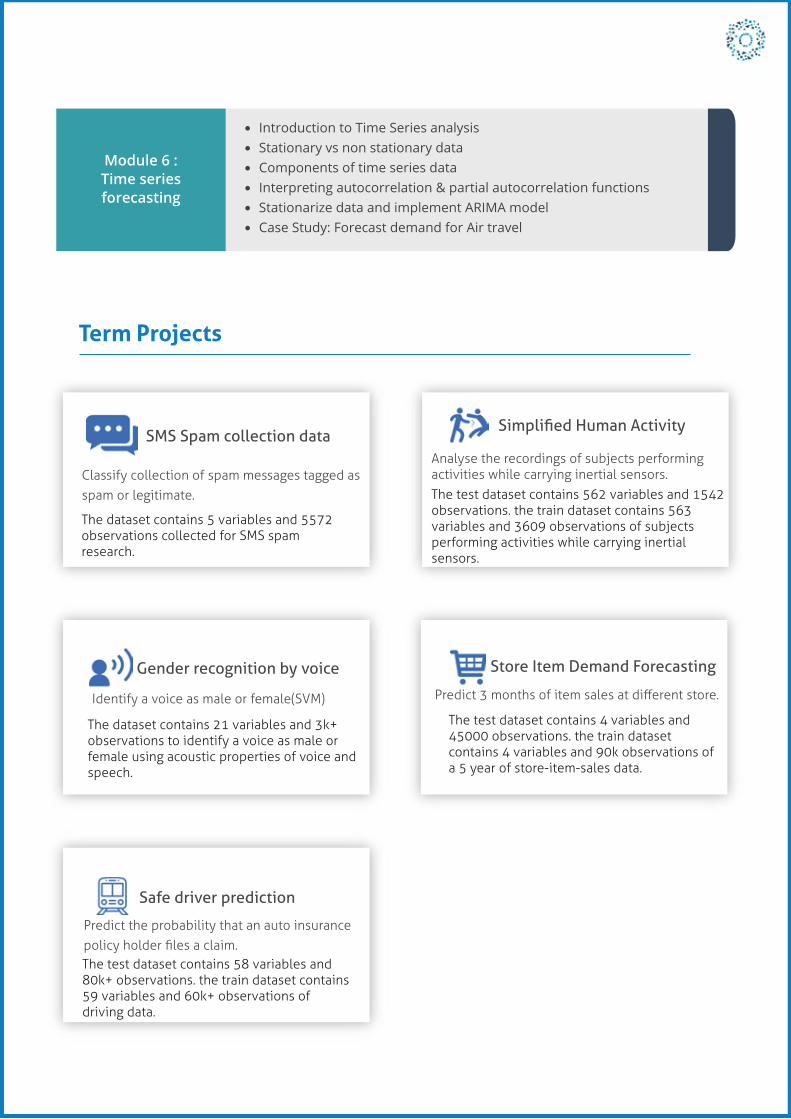
SMS Spam collection data
The dataset contains 5 variables and 5572 observations collected for SMS spam research.
Classify collection of spam messages tagged as spam or legitimate.
Simplified Human Activity
Analyse the recordings of subjects performing activities while carrying inertial sensors.The test dataset contains 562 variables and 1542 observations. the train dataset contains 563 variables and 3609 observations of subjects performing activities while carrying inertial sensors.
Gender recognition by voice
The dataset contains 21 variables and 3k+ observations to identify a voice as male or female using acoustic properties of voice and speech.
Identify a voice as male or female(SVM)
Store Item Demand Forecasting
The test dataset contains 4 variables and 45000 observations. the train dataset contains 4 variables and 90k observations of a 5 year of store-item-sales data.
Predict 3 months of item sales at different store.
Safe driver prediction
The test dataset contains 58 variables and 80k+ observations. the train dataset contains 59 variables and 60k+ observations of driving data.
Predict the probability that an auto insurance policy holder files a claim.
Module 6 :Time seriesforecasting
Introduction to Time Series analysis Stationary vs non stationary dataComponents of time series dataInterpreting autocorrelation & partial autocorrelation functionsStationarize data and implement ARIMA modelCase Study: Forecast demand for Air travel

Term 5 [ Elective ]:
MACHINE LEARNING ADVANCED
Module 1 :Introduction to
Apriori Algorithm
Applications of Apriori algorithm Understand Association ruleDeveloping product recommendations using association rulesCase study : Analyse online data using association rules
Module 3 :Linear Discriminant
Analysis (LDA)
Recap of dimensionality reduction concepts Types of dimensionality reductionDimensionality reduction using LDACase Study : Apply LDA to determine Liquor Quality
Module 4 :Anomaly Detection
Introduction to Anomaly detectionHow Anomaly detection works? Types of Anomaly detection: Density based, Clustering etc.Case Study:Detect anomalies on health data
Module 5 : Ensemble learning
Introduction to Ensemble LearningWhat are Bagging and Boosting techniques?What is Bias variance trade off?Case study : Predict wage (annual income) classes from adult census data
Module 2 :Recommender
Systems
Introduction to Recommender systems Types of Recommender systems - collaborative, content based & Hybrid Types of similarity matrix (cosine , Jaccard, Pearson correlation)Case Study:Build Recommender systems on Movie data

Term Projects
Apriori Algorithm(Market Basket Analysis)
The dataset contains 8 variables and 542k observa-tions of all the transaction of 2011 and 2011 for a UK based and registered non - store online retail.
MovieLens Dataset
The combined dataset consists of 4 different dataset. The links dataset have 3 variables and 9k+ observation, the movies dataset have 3 variables and 9k observation. The ratings dataset have 4 variables and 100k observa-tion. The tags dataset have 4 variables and 1297 observations.
Module 6 :Stacking
Introduction to stackingUse Cases of stackingHow stacking improves machine learning models? Case Study:Predict survivors in Titanic case
Module 8 :Neural Networks
Introduction to Neural networksWhat are Perceptrons & Types of Perceptrons?Workflow of a Neural network & analogy with biological neuronsCase Study : Apply computer vision for digit recognition on MNIST data
Module 7 :Optimization
Introduction to optimization in MLApplications of optimization methods Optimization techniques: Linear Programming using Excel solver How Stochastic Gradient Descent(SGD) Works?Case study: Apply SGD on Regression data (sklearn dataset)
Market Basket Analysis of e-commerce data of transaction of 2010 and 2011
Predict the name of movies and based upon the reviews of the other critics having similar taste.

Property Inspection prediction
Predict a transformed count of hazards or pre-ex-isting damages using dataset of property informa-tion.
Pokemon Dataset(LDA)
The dataset contains 41 variables and 801 observation of data on pokemon from all 7 generations.
Letter recognition
The test dataset contains 17 variables and 4000 observations. the train dataset contains 18 variables and 16k observation of 26 capital letters of english alphabet based on their different attributes.
Build a pokemon dream team of 6 pokemon that inflicts the most damage while remaining impervious to any other team of 6 pokemon.
Predict a transformed count of hazards or pre-existing damages using dataset of property information.
Predict the letter category based on its attributes.

Term 5 [ Elective ]:
TENSORFLOW FOR DEEP LEARNING
Module 1 :Artificial Intelligence
Introduction to Artificial Intelligence Breakthroughs in the field of AIOverview of advanced Machine Learning algorithmsWeights and Bias estimation using gradient descent optimization
Module 3 :Tensorflow
programmingin Python
Module 4 :Introduction toDeep Learning
Module 5 : Optimization of Deep
Neural Networks
Hyperparameters in deep neural networks Filters in Convolutional Neural NetworksMax pooling and paddingDropout and Regularization in Deep learning
Module 2 :Getting startedwith Tensorflow
Installing Tensorflow in PythonIntroduction to data flow graphs in TensorflowFunctions, operations and execution pipeline in TensorflowRegression technique in TensorflowCase Study: Predict Boston Housing Prices using Tensorflow
Classification in TensorflowIntroduction to Tensorboard visualizationActivation functions in Tensorflow
An overview on Deep Neural NetworksReal world applications of Deep Neural NetworksNeural Networks using TensorflowOptimization techniques employed in Neural NetworksCase Study: Classify handwritten digits (MNIST) using logistic regression

Module 6 :Introduction to
Convolutional NeuralNetworks
Introduction to Convolutional Neural Networks(CNN's) Evaluate, Improve and tune Convolutional Neural NetworksObject Classification, localization and segmentation Reusing models with Transfer learningCase Study: Classify handwritten digits (MNIST) using Deep Neural networks with RELU on Keras
Module 8 :Recurrent Neural
networks
Module 9 :Recursive neural
networks forSentiment Analysis
Module 10 : Revision of concepts
and Term Project
Module 7 :Introduction to
Natural LanguageProcessing
Introduction to NLPIntrodution to Word embeddingsSimple Word Vector representations: word2vec, GloVeImplementation of word2vec model in Keras
Intoduction to Recurrent neural networks based language modelsIntroduction to Gated Recurrent unitsLSTMs for machine translationCase Study: Perform Sentiment Analysis using word embedding Seq2Seq LSTM Model translation
Introduction to Sequence to sequence learningConvolutional Neural networks for Sentence classificationTrain Recursive Neural Networks for Sentiment analysis Introduction to Dynamic memory networksCase Study: Explore Pride and Prejudice book to perform Char-RNN
Project: Bulid a Chatbot using Slack ClassIntegrate Chatbot with Bot server

Term Projects
Build Chatbot using slack Class
Develop a chatbot to simulate a human asa conversational partner
This chatbot allows us translate user submitted conversations from English to Hindi

In this capstone project, students will be provided with data collected by a major
Telecom operator on the demographic behaviour of users using different
handsets.
Students are required to do the initial bit of data cleansing, pre-processing and
then upload this data to SQL server via a web hosting platform that will be
provided to them.
This data from SQL server will be used to create a dashboard for the
company using D3.js scripts. D3,js scripts will be provided to students upfront.
These dashboards are reflective of how interactive visualizations can help
companies make strategies such as what demographies to cater to, how men and
women customers behave differently, which geographies are popular and ones
that need more investment from the company in terms of finance and marketing?
James Telco Bond
Term 6:
CAPSTONE PROJECT - I

This capstone project will focus more on applying machine learning concepts
rather than data gathering and storing aspects. Students will be provided with
data collected by a major Taxi Aggregator of taxi bookings done in a leading city.
As budding data science consultants, students are required to do exploratory data
analysis & present an initial report.
After that the students are required to create an UI that displays the
observations regarding taxi usage across the city from the analysis and the
website should also have a provision for the company to forecast demand for
taxis at a specific time in the day.
The taxi bookings data provided will be in csv format and dashboards for the
company need to be created using D3.js scripts. The D3.js scripts will be provided
to the students beforehand.
Demand Planners
Term 6:
CAPSTONE PROJECT - II

OPTIONAL TERMS
EDA with R
Module 1 :Data Science
Fundamentals
Thought Experiment: Data science @ Google Introduction to Data ScienceReal world use-cases of Data ScienceWalkthrough of data types Data Science project lifecycle
Module 3 :Playing around with
Data objects in R
Module 4 :Descriptivestatistics - 1
Module 5 : Descriptivestatistics - 2
Introduction to ProbabilityProbability Distributions used in Data Science Quantiles, percentiles, and standard scoreCase Study : Analyse student's performance at school
Module 2 :Introduction to
programming in R
Installing R and R Studio Basic Commands in R Installing packages Setting working directory Exercises: Basic exercises in R Programming
Data structuresBasic Data management Loops and FunctionsSaving output Exercises: Loops and functions in R
Introduction to Statistics Descriptive StatisticsMeasures of central tendencyMeasures of Dispersion and shapeCase Study: Investigation of Crime statistics in Beaufort

Module 6 :Inferential
Statistics - 1
Introduction to Inferential StatisticsPopulation and SamplesCentral Limit TheoremCase Study: Sampling data for Business analysis
Module 8 :Intermediate R:Importing data
Module 9 :Intermediate R : DataManipulation using
Tidyverse
Module 10 : Intermediate R:
Restructuring Data
Module 7 :Inferential
Statistics - 2
Introduction to Hypothesis TestingConfidence IntervalsTests of significance: p-valueCase Study: Apply Inferential statistics & Central limit theorem using Python
Loading data from R librariesImporting data from Excel and CSV filesConnecting SQL databasesWebscraping using RCase study: Webscraping websites using scrapy package
Identifying NULL values in datasetsIntroduction to data imputation methodsCreating new variables and recoding variablesType conversions Case Study: Using Tidyverse in Data Manipulation
Managing Date valuesNumerical and Character functionsAggregating & Restructuring dataSorting, merging datasetsExercises : Subsetting datasets for use in Predictive analytics
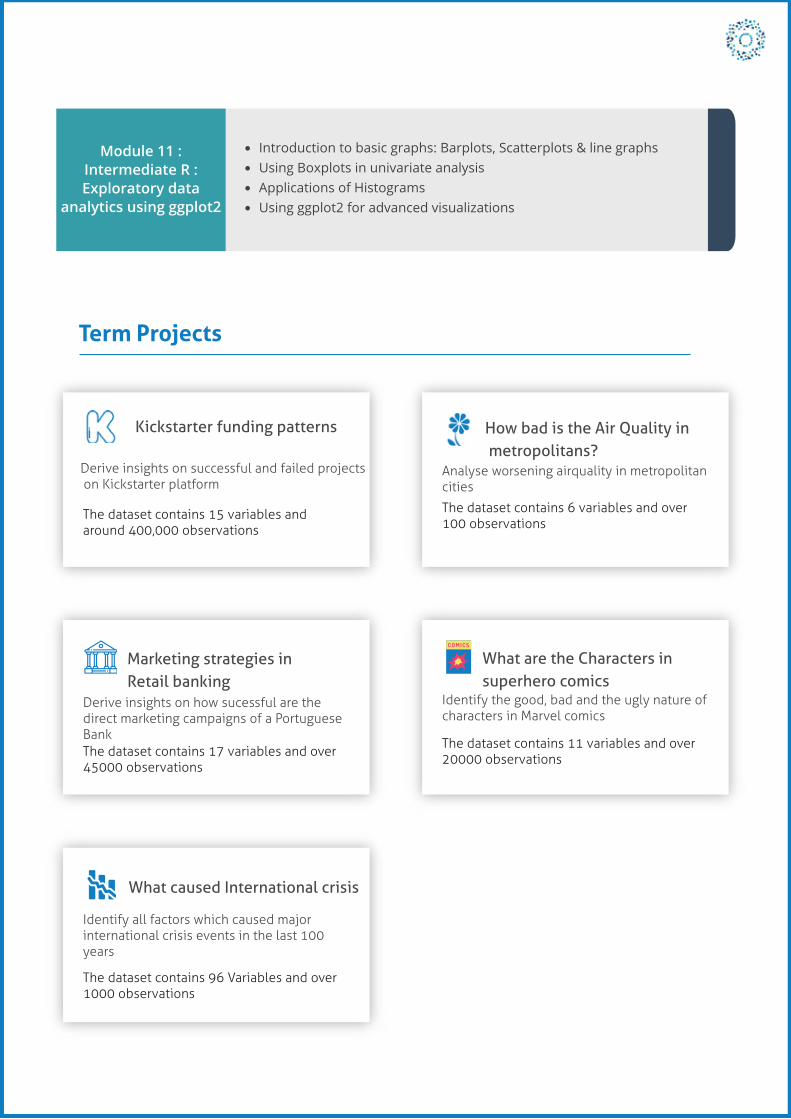
Term Projects
Kickstarter funding patterns
Derive insights on successful and failed projects on Kickstarter platform
The dataset contains 15 variables and around 400,000 observations
How bad is the Air Quality in metropolitans?
Analyse worsening airquality in metropolitan cities
The dataset contains 6 variables and over 100 observations
Marketing strategies in Retail banking
Derive insights on how sucessful are the direct marketing campaigns of a Portuguese BankThe dataset contains 17 variables and over 45000 observations
What are the Characters in superhero comics
Identify the good, bad and the ugly nature of characters in Marvel comics
The dataset contains 11 variables and over 20000 observations
What caused International crisis
Identify all factors which caused major international crisis events in the last 100 years
The dataset contains 96 Variables and over 1000 observations
Module 11 :Intermediate R :Exploratory data
analytics using ggplot2
Introduction to basic graphs: Barplots, Scatterplots & line graphsUsing Boxplots in univariate analysisApplications of HistogramsUsing ggplot2 for advanced visualizations

OPTIONAL TERMS
DATA VISUALIZATION WITH TABLEAU
Module 1 :Introduction toVisual Analytics
Introduction to data visualizationUnderstanding Tableau ecosystem in industryLoading data files in TableauCreating first visualizationsCase Study: Sales performance Analysis
Module 3 :Data joining &
blending in Tableau
Introduction to SQL joinsPerforming data blending in TableauCreating dual axis charts in TableauIntroduction to descriptive statistics and Visual analyticsCase Study : Analyse trends in Retail businesses
Module 4 : Predicitve Analyticsusing Tableau and R
Introduction to R programming tool & R studioInstalling R and R studioApplications of linear regression in predictionData crunching: Creating groups, sets & parametersCase Study: Forecast revenues
Module 5 : Interactive
Dashboard Design
Introduction to principles of dashboard designCustom geocoding in TableauDeveloping dashboard products using TableauIntroduction to writing storyline in TableauCase Study: Customer segmentation dashboard
Module 2 :Data Visualization
using Tableau
Introduction to graphs - bar graph and line graphWorking with continuous measures & discrete variablesHeat maps and Geographical data visualizationsCreating map ViewsCase Study: Analyse Natural calamity trend and effect

Term Projects
Hubway data visualizationchallenge
Produce visualizations that reveal interestinguser patterns about how people in Bostongets around on Hubway
The dataset contains 1 million observations on bike usage by residents of Boston
Module 6 :Advanced Calculations
using Tableau
Introduction to calculations: Date calculationsUsing LOD calculations: INCLUDE, EXCLUDE & FIXED functionsWorking with Table calculationsExporting data from TableauCase Study: Analyse sales across geographies, products & customers
Module 8 :Revision of
concepts andProject discussion
Revision of key concepts: data blending, writing calculations, LOD calcuations etc.Review of Tableau project portfolioCommunicating data insights using reporting toolsTableau Interview prep Discussing EDA objectives of final project
Module 7 :Applications of
advanced Calculationsusing Tableau
Introduction to customer churn analysisEstimating customer life time valueApplications of context filtering Applications of logical functions in Tableau Case Study: Analyse retail sales data to predict customer behaviour

For Further details, write to us [email protected]
Need to know
August 2018Program Start
INR 2 Lakh + GSTProgram Fee
06 months (Incl. Capstone Projects)Duration
Background in Programming (Not Mandatory)
Laptop with 4 GB RAM
Prerequisite
50 scholarships (each with 70% tuition waiver) for professionals passionate about making a career in Data Science & furthering INSAID’s mission of putting India on the global AI map.
Scholarships
Talk to our Admissions team today or attend the next Data Science MasterClass to know more