For the six months ended 30 June 2017 - RNS Submit · For the six months ended 30 June 2017 ... 6...
132
Interim Report For the six months ended 30 June 2017
Transcript of For the six months ended 30 June 2017 - RNS Submit · For the six months ended 30 June 2017 ... 6...
Interim ReportFor the six months ended
30 June 2017
BOI Interim Report 2017 FRONT.qxp_Layout 1 27/07/2017 20:29 Page i

BOI Interim Report 2017 FRONT.qxp_Layout 1 27/07/2017 20:29 Page ii
Interim Reportfor the six months ended 30 June 2017
BOI Interim Report 2017 FRONT.qxp_Layout 1 27/07/2017 20:29 Page 1
Interim Report - six months ended 30 June 20172
Forward-Looking statement
This document contains forward-looking statements with respect to certain of The Governor and Company of the Bank of Ireland (the
‘Bank’) and its subsidiaries’ (collectively the ‘Group’) plans and its current goals and expectations relating to its future financial condition
and performance, the markets in which it operates and its future capital requirements. These forward-looking statements often can be
identified by the fact that they do not relate only to historical or current facts. Generally, but not always, words such as ‘may,’ ‘could,’
‘should,’ ‘will,’ ‘expect,’ ‘intend,’ ‘estimate,’ ‘anticipate,’ ‘assume,’ ‘believe,’ ‘plan,’ ‘seek,’ ‘continue,’ ‘target,’ ‘goal,’ ‘would,’ or their
negative variations or similar expressions identify forward-looking statements, but their absence does not mean that a statement is not
forward-looking.
Examples of forward-looking statements include among others, statements regarding the Group’s near term and longer term future capital
requirements and ratios, level of ownership by the Irish Government, loan to deposit ratios, expected impairment charges, the level of
the Group’s assets, the Group’s financial position, future income, business strategy, projected costs, margins, future payment of dividends,
the implementation of changes in respect of certain of the Group’s pension schemes, estimates of capital expenditures, discussions with
Irish, United Kingdom, European and other regulators and plans and objectives for future operations. Such forward-looking statements
are inherently subject to risks and uncertainties, and hence actual results may differ materially from those expressed or implied by such
forward-looking statements.
Investors should read ‘Principal risks and uncertainties’ in this document beginning on page 40 and also the discussion of risk in the
Group’s Annual Report for the year ended 31 December 2016.
Nothing in this document should be considered to be a forecast of future profitability or financial position and none of the information in
this document is or is intended to be a profit forecast or profit estimate. Any forward-looking statement speaks only as at the date it is
made. The Group does not undertake to release publicly any revision to these forward-looking statements to reflect events, circumstances
or unanticipated events occurring after the date hereof.
For further information please contact:
Andrew Keating Alan Hartley Pat Farrell
Group Chief Financial Officer Director of Group Investor Relations Head of Group Communications
Tel: +353 76 623 5141 Tel: +353 76 623 4850 Tel: +353 76 623 4770
BOI Interim Report 2017 FRONT.qxp_Layout 1 27/07/2017 20:29 Page 2
Interim Report - six months ended 30 June 2017 3
Contents
Key highlights 4
Performance summary 4
Group Chief Executive’s review 6
Operating and financial review (incorporating risk management) 9
Basis of presentation 9
Group income statement 9
Group balance sheet (incorporating liquidity and funding) 17
Capital 23
Divisional performance 27
Principal risks and uncertainties 40
Asset quality and impairment 41
Responsibility statement 53
Independent review report 54
Consolidated interim financial statements and notes (unaudited) 55
Other information 97
Supplementary asset quality and forbearance disclosures 99
Consolidated average balance sheet and interest rates 124
Rates of exchange 125
Credit ratings 125
Stock Exchange Listings 125
Glossary 126
View this report onlineThis Interim Report and other information relating to Bank of Ireland is available at:
www.bankofireland.com/investor
BOI Interim Report 2017 FRONT.qxp_Layout 1 27/07/2017 20:29 Page 3
Interim Report - six months ended 30 June 20174
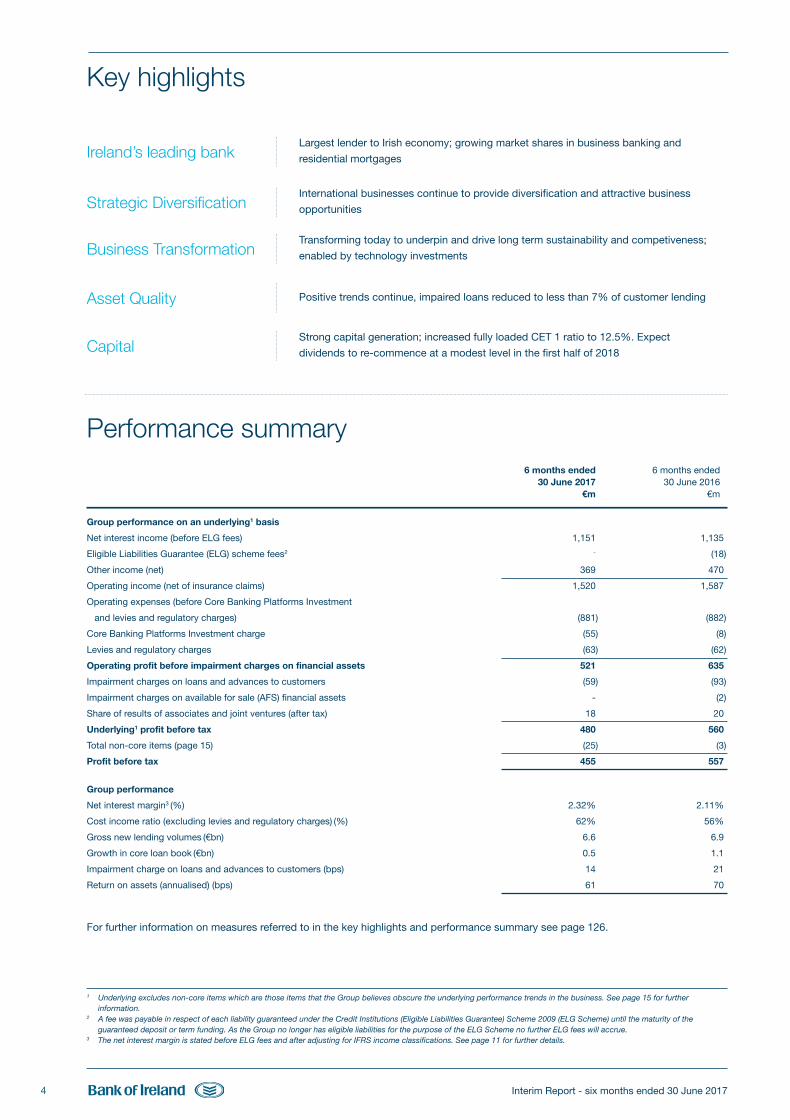
Key highlights
Performance summary6 months ended 6 months ended
30 June 2017 30 June 2016€m €m
Group performance on an underlying1 basis
Net interest income (before ELG fees) 1,151 1,135
Eligible Liabilities Guarantee (ELG) scheme fees2 - (18)
Other income (net) 369 470
Operating income (net of insurance claims) 1,520 1,587
Operating expenses (before Core Banking Platforms Investment
and levies and regulatory charges) (881) (882)
Core Banking Platforms Investment charge (55) (8)
Levies and regulatory charges (63) (62)
Operating profit before impairment charges on financial assets 521 635
Impairment charges on loans and advances to customers (59) (93)
Impairment charges on available for sale (AFS) financial assets - (2)
Share of results of associates and joint ventures (after tax) 18 20
Underlying1 profit before tax 480 560
Total non-core items (page 15) (25) (3)
Profit before tax 455 557
Group performance
Net interest margin3 (%) 2.32% 2.11%
Cost income ratio (excluding levies and regulatory charges) (%) 62% 56%
Gross new lending volumes (€bn) 6.6 6.9
Growth in core loan book (€bn) 0.5 1.1
Impairment charge on loans and advances to customers (bps) 14 21
Return on assets (annualised) (bps) 61 70
For further information on measures referred to in the key highlights and performance summary see page 126.
Ireland’s leading bank
1 Underlying excludes non-core items which are those items that the Group believes obscure the underlying performance trends in the business. See page 15 for furtherinformation.
2 A fee was payable in respect of each liability guaranteed under the Credit Institutions (Eligible Liabilities Guarantee) Scheme 2009 (ELG Scheme) until the maturity of theguaranteed deposit or term funding. As the Group no longer has eligible liabilities for the purpose of the ELG Scheme no further ELG fees will accrue.
3 The net interest margin is stated before ELG fees and after adjusting for IFRS income classifications. See page 11 for further details.
Largest lender to Irish economy; growing market shares in business banking and
residential mortgages
Strategic DiversificationInternational businesses continue to provide diversification and attractive business
opportunities
Business TransformationTransforming today to underpin and drive long term sustainability and competiveness;
enabled by technology investments
Asset Quality Positive trends continue, impaired loans reduced to less than 7% of customer lending
CapitalStrong capital generation; increased fully loaded CET 1 ratio to 12.5%. Expect
dividends to re-commence at a modest level in the first half of 2018
BOI Interim Report 2017 FRONT.qxp_Layout 1 27/07/2017 20:29 Page 4
Interim Report - six months ended 30 June 2017 5
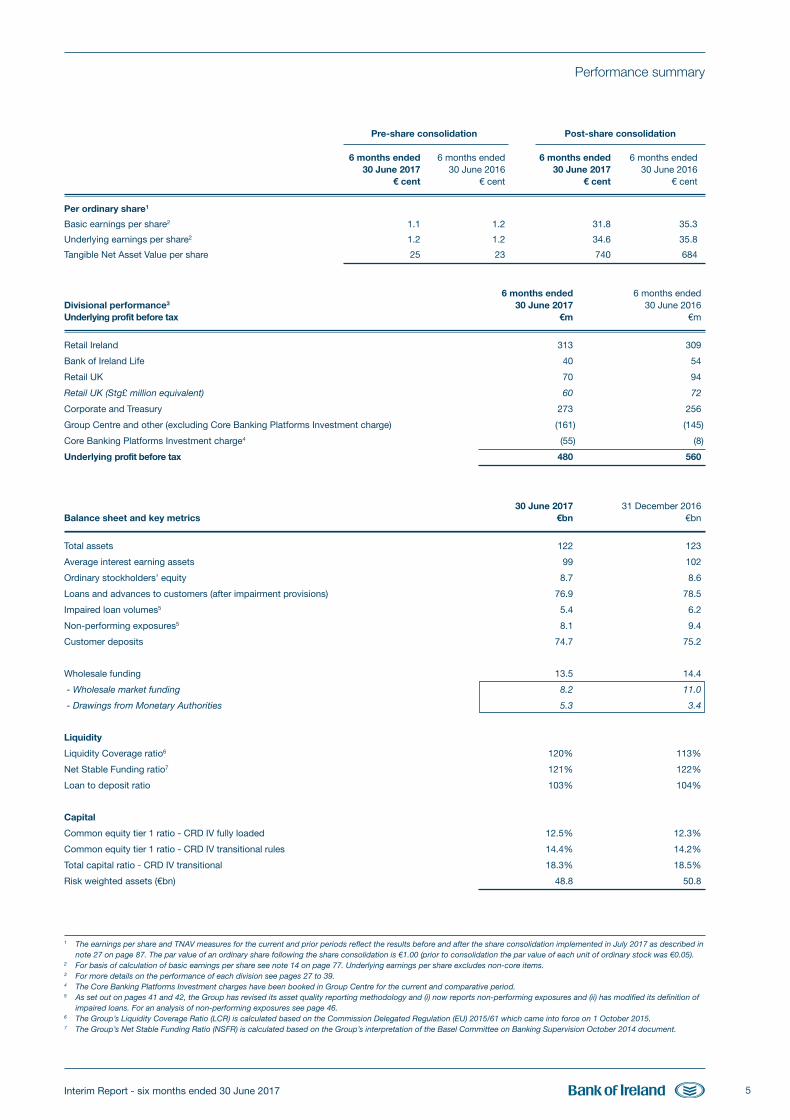
Performance summary
Pre-share consolidation Post-share consolidation
6 months ended 6 months ended 6 months ended 6 months ended30 June 2017 30 June 2016 30 June 2017 30 June 2016
€ cent € cent € cent € cent
Per ordinary share1
Basic earnings per share2 1.1 1.2 31.8 35.3
Underlying earnings per share2 1.2 1.2 34.6 35.8
Tangible Net Asset Value per share 25 23 740 684
6 months ended 6 months endedDivisional performance3 30 June 2017 30 June 2016Underlying profit before tax €m €m
Retail Ireland 313 309
Bank of Ireland Life 40 54
Retail UK 70 94
Retail UK (Stg£ million equivalent) 60 72
Corporate and Treasury 273 256
Group Centre and other (excluding Core Banking Platforms Investment charge) (161) (145)
Core Banking Platforms Investment charge4 (55) (8)
Underlying profit before tax 480 560
30 June 2017 31 December 2016Balance sheet and key metrics €bn €bn
Total assets 122 123
Average interest earning assets 99 102
Ordinary stockholders’ equity 8.7 8.6
Loans and advances to customers (after impairment provisions) 76.9 78.5
Impaired loan volumes5 5.4 6.2
Non-performing exposures5 8.1 9.4
Customer deposits 74.7 75.2
Wholesale funding 13.5 14.4
- Wholesale market funding 8.2 11.0
- Drawings from Monetary Authorities 5.3 3.4
Liquidity
Liquidity Coverage ratio6 120% 113%
Net Stable Funding ratio7 121% 122%
Loan to deposit ratio 103% 104%
Capital
Common equity tier 1 ratio - CRD IV fully loaded 12.5% 12.3%
Common equity tier 1 ratio - CRD IV transitional rules 14.4% 14.2%
Total capital ratio - CRD IV transitional 18.3% 18.5%
Risk weighted assets (€bn) 48.8 50.8
1 The earnings per share and TNAV measures for the current and prior periods reflect the results before and after the share consolidation implemented in July 2017 as described innote 27 on page 87. The par value of an ordinary share following the share consolidation is €1.00 (prior to consolidation the par value of each unit of ordinary stock was €0.05).
2 For basis of calculation of basic earnings per share see note 14 on page 77. Underlying earnings per share excludes non-core items. 3 For more details on the performance of each division see pages 27 to 39. 4 The Core Banking Platforms Investment charges have been booked in Group Centre for the current and comparative period. 5 As set out on pages 41 and 42, the Group has revised its asset quality reporting methodology and (i) now reports non-performing exposures and (ii) has modified its definition of
impaired loans. For an analysis of non-performing exposures see page 46.6 The Group’s Liquidity Coverage Ratio (LCR) is calculated based on the Commission Delegated Regulation (EU) 2015/61 which came into force on 1 October 2015. 7 The Group’s Net Stable Funding Ratio (NSFR) is calculated based on the Group’s interpretation of the Basel Committee on Banking Supervision October 2014 document.
BOI Interim Report 2017 FRONT.qxp_Layout 1 27/07/2017 20:29 Page 5
Interim Report - six months ended 30 June 20176
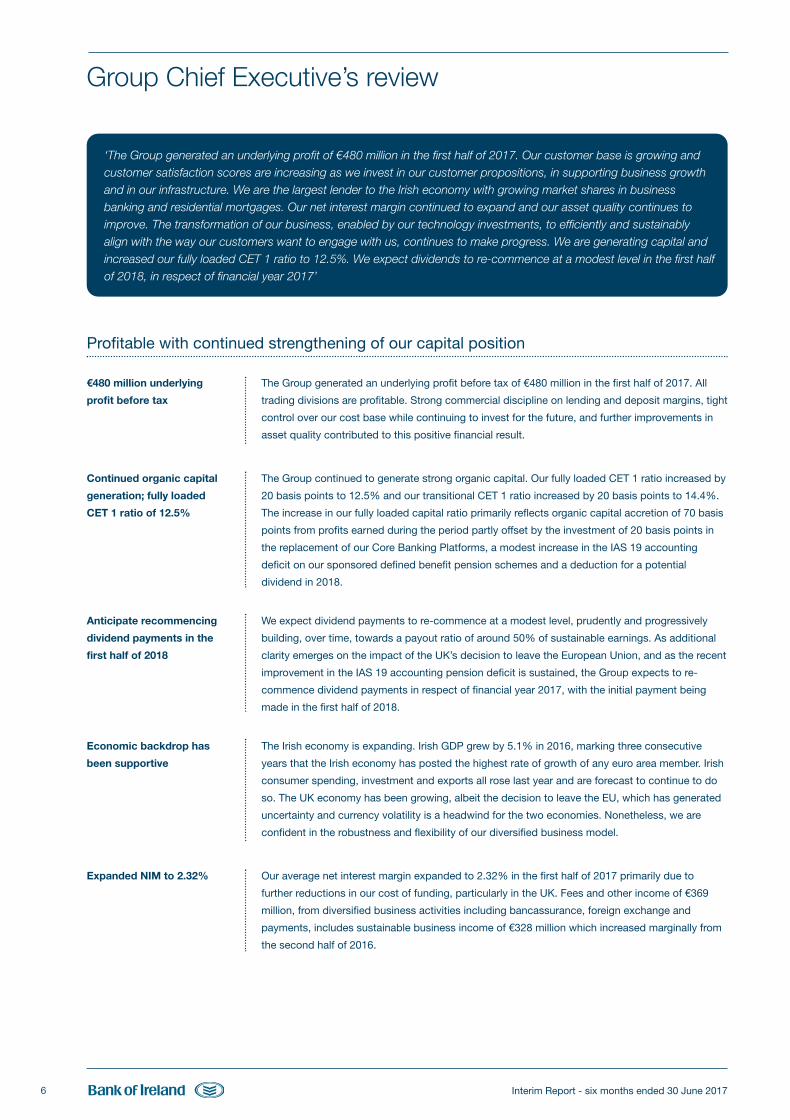
Group Chief Executive’s review
‘The Group generated an underlying profit of €480 million in the first half of 2017. Our customer base is growing andcustomer satisfaction scores are increasing as we invest in our customer propositions, in supporting business growthand in our infrastructure. We are the largest lender to the Irish economy with growing market shares in businessbanking and residential mortgages. Our net interest margin continued to expand and our asset quality continues toimprove. The transformation of our business, enabled by our technology investments, to efficiently and sustainablyalign with the way our customers want to engage with us, continues to make progress. We are generating capital andincreased our fully loaded CET 1 ratio to 12.5%. We expect dividends to re-commence at a modest level in the first halfof 2018, in respect of financial year 2017’
Profitable with continued strengthening of our capital position
€480 million underlying
profit before tax
The Group generated an underlying profit before tax of €480 million in the first half of 2017. All
trading divisions are profitable. Strong commercial discipline on lending and deposit margins, tight
control over our cost base while continuing to invest for the future, and further improvements in
asset quality contributed to this positive financial result.
Continued organic capital
generation; fully loaded
CET 1 ratio of 12.5%
The Group continued to generate strong organic capital. Our fully loaded CET 1 ratio increased by
20 basis points to 12.5% and our transitional CET 1 ratio increased by 20 basis points to 14.4%.
The increase in our fully loaded capital ratio primarily reflects organic capital accretion of 70 basis
points from profits earned during the period partly offset by the investment of 20 basis points in
the replacement of our Core Banking Platforms, a modest increase in the IAS 19 accounting
deficit on our sponsored defined benefit pension schemes and a deduction for a potential
dividend in 2018.
Anticipate recommencing
dividend payments in the
first half of 2018
We expect dividend payments to re-commence at a modest level, prudently and progressively
building, over time, towards a payout ratio of around 50% of sustainable earnings. As additional
clarity emerges on the impact of the UK’s decision to leave the European Union, and as the recent
improvement in the IAS 19 accounting pension deficit is sustained, the Group expects to re-
commence dividend payments in respect of financial year 2017, with the initial payment being
made in the first half of 2018.
Economic backdrop has
been supportive
The Irish economy is expanding. Irish GDP grew by 5.1% in 2016, marking three consecutive
years that the Irish economy has posted the highest rate of growth of any euro area member. Irish
consumer spending, investment and exports all rose last year and are forecast to continue to do
so. The UK economy has been growing, albeit the decision to leave the EU, which has generated
uncertainty and currency volatility is a headwind for the two economies. Nonetheless, we are
confident in the robustness and flexibility of our diversified business model.
Expanded NIM to 2.32% Our average net interest margin expanded to 2.32% in the first half of 2017 primarily due to
further reductions in our cost of funding, particularly in the UK. Fees and other income of €369
million, from diversified business activities including bancassurance, foreign exchange and
payments, includes sustainable business income of €328 million which increased marginally from
the second half of 2016.
BOI Interim Report 2017 FRONT.qxp_Layout 1 27/07/2017 20:29 Page 6
Interim Report - six months ended 30 June 2017 7
Group Chief Executive’s review
Core loan books growing;
Largest lender to Irish
economy with growing
market shares
Our core loan books continued to grow, by €0.5 billion in the first half of 2017, on a constant
currency basis. Gross new lending volumes of €6.6 billion for the first six months of 2017 were in
line with the same period in 2016 on a constant currency basis, while redemptions of €7.2 billion
remained in line with previous periods. Redemptions included €1.0 billion relating to the continued
amortisation of RoI tracker mortgages, redemptions from our impaired book and our non-core GB
Business Banking and Corporate loan books. We remain the largest lender to the Irish economy
with growing market shares in business banking and residential mortgages. We provided €3.4
billion of credit to personal and business customers in Ireland in the first half of 2017 while
maintaining our commercial discipline.
Focussed on maintaining
tight control on costs;
Transformation programme
is making progress
We have continued to maintain tight control over costs, while at the same time, making
appropriate investments in our businesses, infrastructure and initiatives to further enhance our
customer propositions. Operating expenses of €881 million in the first half of 2017 were in line
with the first half of 2016. Our Core Banking Platforms Investment programme is making progress
and we invested €105 million in this programme in the first half of 2017, of which c.50% was
charged directly to the income statement with the remaining balance capitalised. Levies and
regulatory charges of €63 million were incurred.
Asset quality trends
continue to improve
Our asset quality continues to improve. Reflecting the continuing improvement in the credit quality
of our loan portfolios and our actions to reduce our impaired loan portfolios, the net customer
loan impairment charge was €59 million in the first half of 2017 with a lower charge expected for
the second half of 2017. We reduced our impaired loans by €0.8 billion in the first half of the year
to €5.4 billion while non-performing exposures also reduced over the period by €1.3 billion to €8.1
billion. The Group has revised its asset quality reporting methodology to align with EBA guidance
on non-performing and forborne classifications, with a net neutral impact on the Group’s capital
ratios and impairment provisions.
New holding company
established
In early 2017, the Single Resolution Board and the Bank of England advised the Group that their
preferred resolution strategy consisted of a single point of entry bail-in. As a consequence, and
following the relevant shareholder and High Court approvals, Bank of Ireland Group plc was
introduced as the listed holding company of the Group. Trading in the new ordinary shares (which
also reflected the stock consolidation programme) commenced on 10 July 2017.
All divisions continue to perform strongly
Strong Irish franchises
supporting Irish economic
growth
Our Retail Ireland and Bank of Ireland Life divisions reported combined underlying profits before
tax of €353 million in the first half of 2017. Our Irish mortgage business has performed strongly
over the period with a mortgage strategy led by competitive fixed rate products which provide
value, certainty and stability for our customers and the Group. Our residential mortgage lending in
Ireland grew by over 30% in the first half of 2017 with an increase in new lending market share to
26%.
Ireland’s number 1 business
bank; Ireland’s only
bancassurer
We are the number 1 bank for Irish businesses and we continue to be the largest provider of new
business lending into the Irish economy. The Group is the only bancassurer in the Irish market and
our Bank of Ireland Life division saw sales volumes increase year on year by c.20% with a new
business market share of c.20%.
BOI Interim Report 2017 FRONT.qxp_Layout 1 27/07/2017 20:29 Page 7
Interim Report - six months ended 30 June 20178
Our People are a key differentiator for our business
The capability, determination and commitment of our people continues to be a key differentiator in how we do business. I should like to
acknowledge the ongoing skills, dedication and support of all my colleagues throughout the Group, who enable us to deliver on our
shared objectives for our customers and stakeholders. I am confident that my colleagues’ professionalism and dedication will continue
to be a key driver of the Group’s success into the future.
Focussed on delivering attractive and sustainable returns for our business
In March 2017, I announced my intention to retire from the Group later this year. I have been in my current role since February 2009
and the intervening period has seen a number of important milestones for the Group including its recapitalisation from the private
sector as well as the repayment of all State Aid completed in 2013 with a significant positive cash return to Irish taxpayers for their
support and investment in the Group during the financial crisis. The Group has announced the appointment of Ms. Francesca
McDonagh as the new Group CEO who will take up the position on 2 October 2017. I want to thank our Board and all of my colleagues
across the Group, past and present, for their wise counsel, support, professionalism and commitment throughout my time with the
Group and for which I am extremely grateful.
In the first half of 2017, we have continued to deliver against the strategic objectives we have set for ourselves and have articulated to
our shareholders. The strength of our franchises and the positive impacts of the investments we have been making are reflected in the
strength of our financial performance. The Group will continue to invest in our people, businesses and infrastructure to enhance our
distribution platforms, transform our customer propositions and experiences and to deliver sustainable efficiencies. My colleagues will
remain focussed on ensuring that we continue to responsibly develop our profitable, long term franchises and better serve our
customers in a way that delivers attractive sustainable returns to our shareholders.
Richie Boucher
27 July 2017
Group Chief Executive’s review
Diversification through our
banking franchises in the UK
Our Retail UK division provides chosen strategic diversification, primarily through our separately
regulated, capitalised and self-funded subsidiary Bank of Ireland (UK) plc, and generated an
underlying profit before tax of £60 million in the first half of 2017. With over 3 million customers,
our business in Great Britain is largely focussed on providing banking services in the domestic
consumer sector, primarily operating via attractive partnerships with two of the UK’s most trusted
brands, the Post Office and the Automobile Association (AA).
Ireland’s number one
international corporate bank;
International Acquisition
Finance continues to
perform strongly
Our Corporate and Treasury division provides banking services to our larger business customers
and generated an underlying profit before tax of €273 million in the first half of 2017. We continue
to be Ireland’s number one corporate bank, with new lending volumes of €1.9 billion in the first
half of 2017. Our international Acquisition Finance business, which accounts for c.10% of Group
income, delivered another strong performance during the first half of the year.
BOI Interim Report 2017 FRONT.qxp_Layout 1 27/07/2017 20:29 Page 8
Interim Report - six months ended 30 June 2017 9
Operating and financial review (incorporating risk management)
Group income statement
Summary consolidated income statement on an underlying1 basis
6 months ended 6 months ended 30 June 2017 30 June 2016 Change Table €m €m %
Net interest income (before ELG fees) 1 1,151 1,135 1%
Eligible Liabilities Guarantee (ELG) scheme fees2 - (18) n/m
Net other income 2 369 470 (21%)
Operating income (net of insurance claims) 1,520 1,587 (4%)
Operating expenses (before Core Banking Platforms Investment
and levies and regulatory charges) 3 (881) (882) -
Core Banking Platforms Investment charge 3 (55) (8) n/m
Levies and regulatory charges 3 (63) (62) 2%
Operating profit before impairment charges on financial assets 521 635 (18%)
Impairment charges on loans and advances to customers 4,5 (59) (93) 37%
Impairment charges on available for sale (AFS) financial assets - (2) n/m
Share of results of associates and joint ventures (after tax) 18 20 (10%)
Underlying1 profit before tax 480 560 (14%)
Non-core items 6 (25) (3) n/m
Profit before tax 455 557 (18%)
Tax charge (84) (118) 29%
Profit for the period 371 439 (15%)
Key metrics
Net interest margin3 (%) 2.32% 2.11%
Cost income ratio (excluding levies and regulatory charges) (%) 62% 56%
Impairment charge on loans and advances to customers (bps) 14 21
Principal rates of exchange used in the preparation of the Interim Financial Statements are set out on page 125.
This operating and financial review is presented on an underlying
basis. For an explanation of underlying see page 15.
Percentages presented throughout this document are calculated
on the absolute underlying figures and so may differ from the
percentage variances calculated on the rounded numbers
presented. Where the percentages are not measured this is
indicated by n/m.
The income statements are presented for the six months ended
30 June 2017 compared to the six months ended 30 June 2016.
The balance sheets are presented for 30 June 2017 compared to
31 December 2016.
References to ‘the State’ throughout this document should be
taken to refer to the Republic of Ireland, its Government and,
where and if relevant, Government departments, agencies and
local Government bodies.
Basis of presentation
1 Underlying excludes non-core items which are those items that the Group believes obscure the underlying performance trends in the business. See page 15 for further information.2 A fee was payable in respect of each liability guaranteed under the Credit Institutions (Eligible Liabilities Guarantee) Scheme 2009 (ELG Scheme) until the maturity of the
guaranteed deposit or term funding. As the Group no longer has eligible liabilities for the purpose of the ELG Scheme no further ELG fees will accrue.3 The net interest margin is stated before ELG fees and after adjusting for IFRS income classifications.
BOI Interim Report 2017 FRONT.qxp_Layout 1 27/07/2017 20:29 Page 9
Interim Report - six months ended 30 June 201710
Profit before tax was €455 million for the six months ended 30
June 2017, a decrease of €102 million or 18% compared to the
same period in 2016.
Underlying profit before tax was €480 million for the six months
ended 30 June 2017, a decrease of €80 million or 14% on the
same period in 2016 primarily due to:
• Lower gains on sale of sovereign bonds / other assets of €15
million, compared to €160 million in the same period in 2016.
• Higher investment in our core banking platforms - €55 million
charge in the six months ended 30 June 2017 compared to
€8 million in the same period in 2016.
partially offset by;
• Higher net interest and business income - €52 million higher
than the same period in 2016.
• Lower impairment charges - €36 million lower than the same
period in 2016.
• Absence of ELG Scheme fees in 2017 (2016: €18 million).
Net interest income has increased by €16 million compared to
the same period in 2016, primarily reflecting lower funding costs
(reflecting the maturity of the CoCo1 and lower UK deposit costs)
partially offset by the impacts of the ongoing low interest rate
environment and weaker sterling.
Other income was €101 million lower than in 2016, primarily
reflecting lower additional gains in the current period. Other
income includes gains of €16 million primarily related to the sale
of bonds and other financial instruments. In the prior period, the
Group recognised gains of €157 million, primarily reflecting a €95
million gain on the sale of shares in VISA Europe and gains of €54
million on the sale of sovereign bonds as part of a rebalancing of
the Group’s liquid asset portfolio.
Operating expenses (before Core Banking Platforms Investment
and levies and regulatory charges) of €881 million for the six
months ended 30 June 2017 are in line with the same period in
2016, reflecting the Group’s ongoing tight control of its costs,
partially offset by further investment in our people, compliance
with the growing regulatory environment, investment in
technology and business growth. Our Core Banking Platforms
programme is making progress and we invested a further €105
million in this programme in the first half of 2017, with an income
statement charge of €55 million (30 June 2016: €8 million). The
Group has incurred levies and regulatory charges of €63 million in
the six months ended 30 June 2017, compared to €62 million in
the same period in 2016.
Net impairment charges on loans and advances to customers of
€59 million (14 basis points) for the six months ended 30 June
2017 were €34 million or 37% lower compared to €93 million (21
basis points) in the same period of 2016. The significant
reduction in impairment charges in the first half of 2017 reflects
the strong performance of the Group’s loan portfolios, ongoing
reductions in non-performing exposures and impaired loans, and
a continued positive economic environment in the countries in
which the Group’s portfolios are located.
Income from associates and joint ventures was €18 million for the
six months ended 30 June 2017 compared to €20 million for the
same period in 2016.
Non-core items were a net charge of €25 million for the six
months ended 30 June 2017, primarily reflecting costs
associated with the Group’s restructuring programme of €17
million, costs associated with the Group’s corporate
reorganisation and establishment of a new holding company of
€7 million, a loss of €5 million on the disposal / liquidation of
business activities and a charge relating to movements in the
Group’s credit spreads of €4 million, partially offset by a gain
relating to the gross-up of policyholder tax in the Life business of
€8 million.
The Group continues to closely monitor any Brexit related
impacts from the UK decision to trigger Article 50 and leave the
EU, including foreign exchange rates and interest rates. The risks
and uncertainties arising from the UK decision to trigger Article
50 are included in the Principal Risks and Uncertainties section
on page 40.
Summary consolidated income statement on an underlying basis (continued)
1 The €1 billion 10% Convertible Contingent Capital Note.
Operating and financial review
BOI Interim Report 2017 FRONT.qxp_Layout 1 27/07/2017 20:29 Page 10
Interim Report - six months ended 30 June 2017 11
Operating and financial review
Operating income (net of insurance claims)
Net interest income
TABLE: 1 6 months ended 6 months ended 30 June 2017 30 June 2016 ChangeNet interest income / net interest margin €m €m %
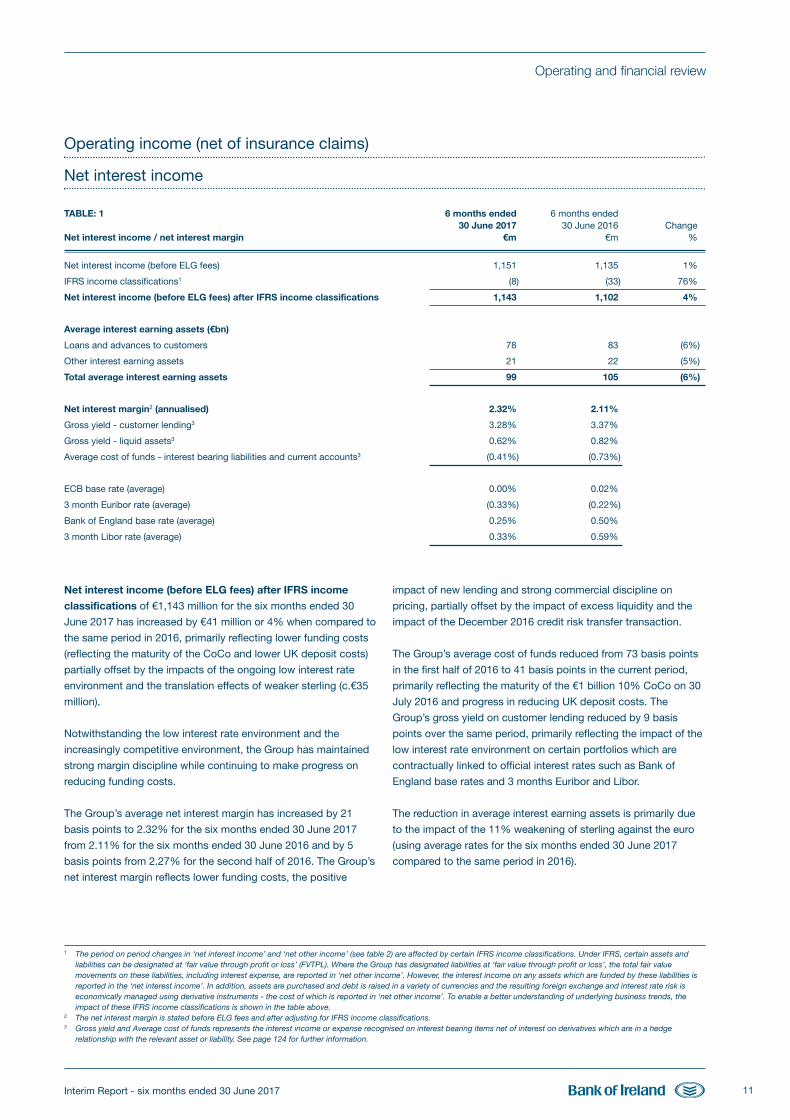
Net interest income (before ELG fees) 1,151 1,135 1%
IFRS income classifications1 (8) (33) 76%
Net interest income (before ELG fees) after IFRS income classifications 1,143 1,102 4%
Average interest earning assets (€bn)
Loans and advances to customers 78 83 (6%)
Other interest earning assets 21 22 (5%)
Total average interest earning assets 99 105 (6%)
Net interest margin2 (annualised) 2.32% 2.11%
Gross yield - customer lending3 3.28% 3.37%
Gross yield - liquid assets3 0.62% 0.82%
Average cost of funds - interest bearing liabilities and current accounts3 (0.41%) (0.73%)
ECB base rate (average) 0.00% 0.02%
3 month Euribor rate (average) (0.33%) (0.22%)
Bank of England base rate (average) 0.25% 0.50%
3 month Libor rate (average) 0.33% 0.59%
Net interest income (before ELG fees) after IFRS income
classifications of €1,143 million for the six months ended 30
June 2017 has increased by €41 million or 4% when compared to
the same period in 2016, primarily reflecting lower funding costs
(reflecting the maturity of the CoCo and lower UK deposit costs)
partially offset by the impacts of the ongoing low interest rate
environment and the translation effects of weaker sterling (c.€35
million).
Notwithstanding the low interest rate environment and the
increasingly competitive environment, the Group has maintained
strong margin discipline while continuing to make progress on
reducing funding costs.
The Group’s average net interest margin has increased by 21
basis points to 2.32% for the six months ended 30 June 2017
from 2.11% for the six months ended 30 June 2016 and by 5
basis points from 2.27% for the second half of 2016. The Group’s
net interest margin reflects lower funding costs, the positive
impact of new lending and strong commercial discipline on
pricing, partially offset by the impact of excess liquidity and the
impact of the December 2016 credit risk transfer transaction.
The Group’s average cost of funds reduced from 73 basis points
in the first half of 2016 to 41 basis points in the current period,
primarily reflecting the maturity of the €1 billion 10% CoCo on 30
July 2016 and progress in reducing UK deposit costs. The
Group’s gross yield on customer lending reduced by 9 basis
points over the same period, primarily reflecting the impact of the
low interest rate environment on certain portfolios which are
contractually linked to official interest rates such as Bank of
England base rates and 3 months Euribor and Libor.
The reduction in average interest earning assets is primarily due
to the impact of the 11% weakening of sterling against the euro
(using average rates for the six months ended 30 June 2017
compared to the same period in 2016).
1 The period on period changes in ‘net interest income’ and ‘net other income’ (see table 2) are affected by certain IFRS income classifications. Under IFRS, certain assets andliabilities can be designated at ‘fair value through profit or loss’ (FVTPL). Where the Group has designated liabilities at ‘fair value through profit or loss’, the total fair valuemovements on these liabilities, including interest expense, are reported in ‘net other income’. However, the interest income on any assets which are funded by these liabilities isreported in the ‘net interest income’. In addition, assets are purchased and debt is raised in a variety of currencies and the resulting foreign exchange and interest rate risk iseconomically managed using derivative instruments - the cost of which is reported in ‘net other income’. To enable a better understanding of underlying business trends, theimpact of these IFRS income classifications is shown in the table above.
2 The net interest margin is stated before ELG fees and after adjusting for IFRS income classifications. 3 Gross yield and Average cost of funds represents the interest income or expense recognised on interest bearing items net of interest on derivatives which are in a hedge
relationship with the relevant asset or liability. See page 124 for further information.
BOI Interim Report 2017 FRONT.qxp_Layout 1 27/07/2017 20:29 Page 11
Interim Report - six months ended 30 June 201712
Operating and financial review
Net other income
TABLE: 2 6 months ended 6 months ended 30 June 2017 30 June 2016 ChangeNet other income €m €m %
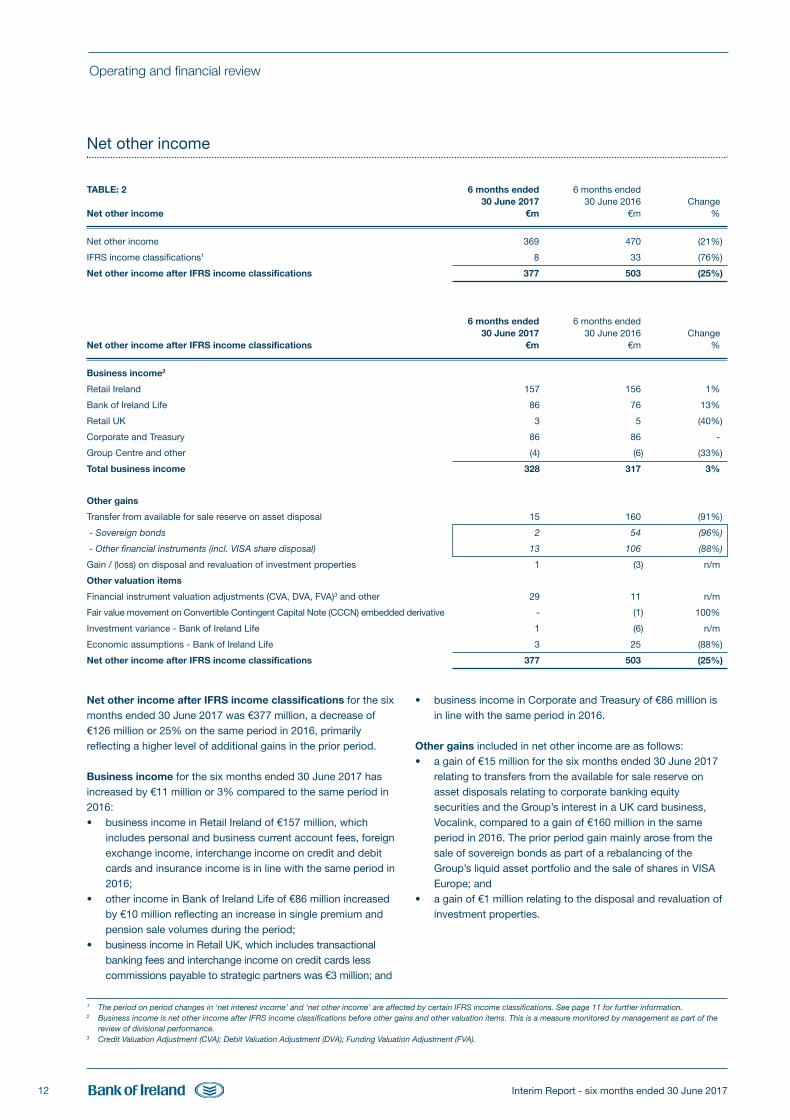
Net other income 369 470 (21%)
IFRS income classifications1 8 33 (76%)
Net other income after IFRS income classifications 377 503 (25%)
6 months ended 6 months ended 30 June 2017 30 June 2016 ChangeNet other income after IFRS income classifications €m €m %
Business income2
Retail Ireland 157 156 1%
Bank of Ireland Life 86 76 13%
Retail UK 3 5 (40%)
Corporate and Treasury 86 86 -
Group Centre and other (4) (6) (33%)
Total business income 328 317 3%
Other gains
Transfer from available for sale reserve on asset disposal 15 160 (91%)
- Sovereign bonds 2 54 (96%)
- Other financial instruments (incl. VISA share disposal) 13 106 (88%)
Gain / (loss) on disposal and revaluation of investment properties 1 (3) n/m
Other valuation items
Financial instrument valuation adjustments (CVA, DVA, FVA)3 and other 29 11 n/m
Fair value movement on Convertible Contingent Capital Note (CCCN) embedded derivative - (1) 100%
Investment variance - Bank of Ireland Life 1 (6) n/m
Economic assumptions - Bank of Ireland Life 3 25 (88%)
Net other income after IFRS income classifications 377 503 (25%)
1 The period on period changes in ‘net interest income’ and ‘net other income’ are affected by certain IFRS income classifications. See page 11 for further information.2 Business income is net other income after IFRS income classifications before other gains and other valuation items. This is a measure monitored by management as part of the
review of divisional performance. 3 Credit Valuation Adjustment (CVA); Debit Valuation Adjustment (DVA); Funding Valuation Adjustment (FVA).
Net other income after IFRS income classifications for the sixmonths ended 30 June 2017 was €377 million, a decrease of€126 million or 25% on the same period in 2016, primarilyreflecting a higher level of additional gains in the prior period.
Business income for the six months ended 30 June 2017 hasincreased by €11 million or 3% compared to the same period in2016:• business income in Retail Ireland of €157 million, which
includes personal and business current account fees, foreignexchange income, interchange income on credit and debitcards and insurance income is in line with the same period in2016;
• other income in Bank of Ireland Life of €86 million increasedby €10 million reflecting an increase in single premium andpension sale volumes during the period;
• business income in Retail UK, which includes transactionalbanking fees and interchange income on credit cards lesscommissions payable to strategic partners was €3 million; and
• business income in Corporate and Treasury of €86 million isin line with the same period in 2016.
Other gains included in net other income are as follows:• a gain of €15 million for the six months ended 30 June 2017
relating to transfers from the available for sale reserve onasset disposals relating to corporate banking equitysecurities and the Group’s interest in a UK card business,Vocalink, compared to a gain of €160 million in the sameperiod in 2016. The prior period gain mainly arose from thesale of sovereign bonds as part of a rebalancing of theGroup’s liquid asset portfolio and the sale of shares in VISAEurope; and
• a gain of €1 million relating to the disposal and revaluation ofinvestment properties.
BOI Interim Report 2017 FRONT.qxp_Layout 1 27/07/2017 20:29 Page 12
Interim Report - six months ended 30 June 2017 13
Operating and financial review
Other valuation items included in net other income are as
follows:
• a gain of €29 million due to valuation adjustments on financial
instruments (CVA, DVA, FVA) and other primarily relate to
market movements during the period;
• a €1 million investment variance in Bank of Ireland Life in the
six months ended 30 June 2017 reflecting growth in
investment markets during the period; and
• a gain of €3 million arose as a result of economic assumption
changes and interest rate movements in Bank of Ireland Life
for the six months ended 30 June 2017 compared to a gain of
€25 million in the same period in 2016. The 2016 gain
primarily related to Solvency II transitioning impacts.
Net other income (continued)
Operating expenses
TABLE: 3 6 months ended 6 months ended 30 June 2017 30 June 2016 ChangeOperating expenses €m €m %
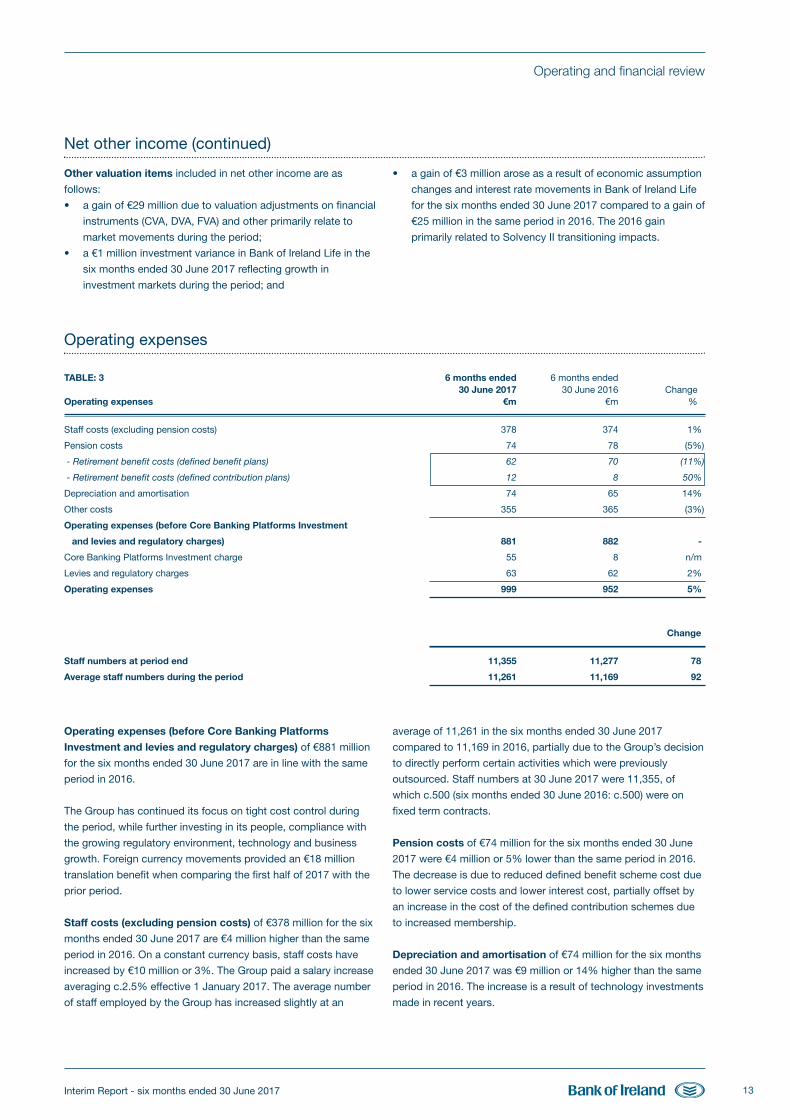
Staff costs (excluding pension costs) 378 374 1%
Pension costs 74 78 (5%)
- Retirement benefit costs (defined benefit plans) 62 70 (11%)
- Retirement benefit costs (defined contribution plans) 12 8 50%
Depreciation and amortisation 74 65 14%
Other costs 355 365 (3%)
Operating expenses (before Core Banking Platforms Investment
and levies and regulatory charges) 881 882 -
Core Banking Platforms Investment charge 55 8 n/m
Levies and regulatory charges 63 62 2%
Operating expenses 999 952 5%
Change
Staff numbers at period end 11,355 11,277 78
Average staff numbers during the period 11,261 11,169 92
Operating expenses (before Core Banking Platforms
Investment and levies and regulatory charges) of €881 million
for the six months ended 30 June 2017 are in line with the same
period in 2016.
The Group has continued its focus on tight cost control during
the period, while further investing in its people, compliance with
the growing regulatory environment, technology and business
growth. Foreign currency movements provided an €18 million
translation benefit when comparing the first half of 2017 with the
prior period.
Staff costs (excluding pension costs) of €378 million for the six
months ended 30 June 2017 are €4 million higher than the same
period in 2016. On a constant currency basis, staff costs have
increased by €10 million or 3%. The Group paid a salary increase
averaging c.2.5% effective 1 January 2017. The average number
of staff employed by the Group has increased slightly at an
average of 11,261 in the six months ended 30 June 2017
compared to 11,169 in 2016, partially due to the Group’s decision
to directly perform certain activities which were previously
outsourced. Staff numbers at 30 June 2017 were 11,355, of
which c.500 (six months ended 30 June 2016: c.500) were on
fixed term contracts.
Pension costs of €74 million for the six months ended 30 June
2017 were €4 million or 5% lower than the same period in 2016.
The decrease is due to reduced defined benefit scheme cost due
to lower service costs and lower interest cost, partially offset by
an increase in the cost of the defined contribution schemes due
to increased membership.
Depreciation and amortisation of €74 million for the six months
ended 30 June 2017 was €9 million or 14% higher than the same
period in 2016. The increase is a result of technology investments
made in recent years.
BOI Interim Report 2017 FRONT.qxp_Layout 1 27/07/2017 20:29 Page 13
Interim Report - six months ended 30 June 201714
Operating and financial review
Other costs including technology, property, outsourced services
and other non-staff costs were €355 million for the six months
ended 30 June 2017 compared with €365 million for the same
period in 2016. Other costs are broadly flat on a constant
currency basis. The Group continues to invest in strategic
initiatives including technology, distribution channels in RoI and
UK, customer acquisition and improved propositions and is also
generating cost savings and efficiencies across its businesses.
Core Banking Platforms Investment charge
Our Core Banking Platforms programme is making progress and
we invested a further €105 million in this programme in the first
half of 2017, of which €56 million was capitalised on the balance
sheet (compared to €9 million in the six months ended 30 June
2016) and €49 million was charged directly to the income
statement. The total income statement charge of €55 million
(compared to €8 million in the six months ended 30 June 2016)
also includes €6 million of an amortisation charge relating to
assets capitalised previously and the release of software licence
prepayments incurred in 2016.
Levies and regulatory charges
The Group has incurred levies and regulatory charges of €63
million in the six months ended 30 June 2017, compared to €62
million in the same period in 2016. The charge in the six months
to 30 June 2017 primarily reflects the Group’s full year
contributions to the Single Resolution Fund (SRF) and the
Deposit Guarantee Scheme (DGS) fund.
The Finance Act 2016, which was signed into law in December
2016, confirmed the revised basis on which the Irish bank levy
will be calculated for the years 2017 to 2021. Under this revised
basis, the Group expects to record a charge of c.€30 million in
the second half of 2017, compared to a charge of €38 million in
the second half of 2016.
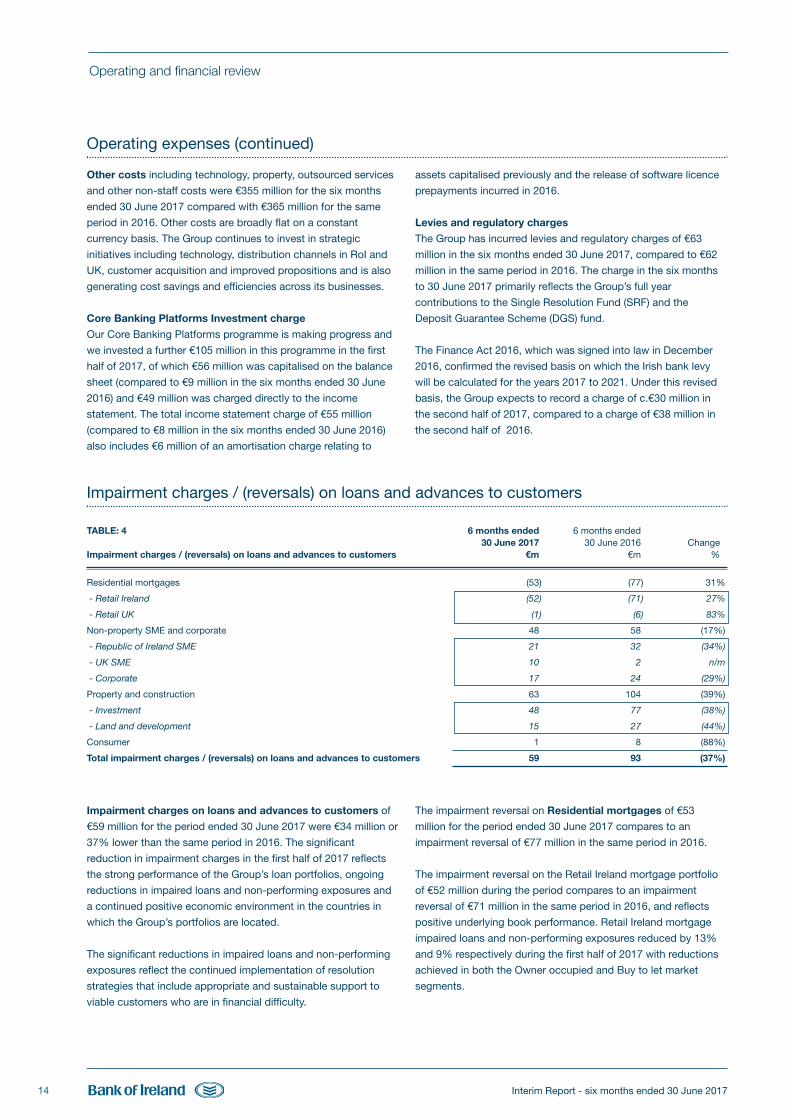
Impairment charges on loans and advances to customers of
€59 million for the period ended 30 June 2017 were €34 million or
37% lower than the same period in 2016. The significant
reduction in impairment charges in the first half of 2017 reflects
the strong performance of the Group’s loan portfolios, ongoing
reductions in impaired loans and non-performing exposures and
a continued positive economic environment in the countries in
which the Group’s portfolios are located.
The significant reductions in impaired loans and non-performing
exposures reflect the continued implementation of resolution
strategies that include appropriate and sustainable support to
viable customers who are in financial difficulty.
The impairment reversal on Residential mortgages of €53
million for the period ended 30 June 2017 compares to an
impairment reversal of €77 million in the same period in 2016.
The impairment reversal on the Retail Ireland mortgage portfolio
of €52 million during the period compares to an impairment
reversal of €71 million in the same period in 2016, and reflects
positive underlying book performance. Retail Ireland mortgage
impaired loans and non-performing exposures reduced by 13%
and 9% respectively during the first half of 2017 with reductions
achieved in both the Owner occupied and Buy to let market
segments.
Impairment charges / (reversals) on loans and advances to customers
TABLE: 4 6 months ended 6 months ended 30 June 2017 30 June 2016 ChangeImpairment charges / (reversals) on loans and advances to customers €m €m %
Residential mortgages (53) (77) 31%
- Retail Ireland (52) (71) 27%
- Retail UK (1) (6) 83%
Non-property SME and corporate 48 58 (17%)
- Republic of Ireland SME 21 32 (34%)
- UK SME 10 2 n/m
- Corporate 17 24 (29%)
Property and construction 63 104 (39%)
- Investment 48 77 (38%)
- Land and development 15 27 (44%)
Consumer 1 8 (88%)
Total impairment charges / (reversals) on loans and advances to customers 59 93 (37%)
Operating expenses (continued)
BOI Interim Report 2017 FRONT.qxp_Layout 1 27/07/2017 20:29 Page 14
Interim Report - six months ended 30 June 2017 15
Operating and financial review
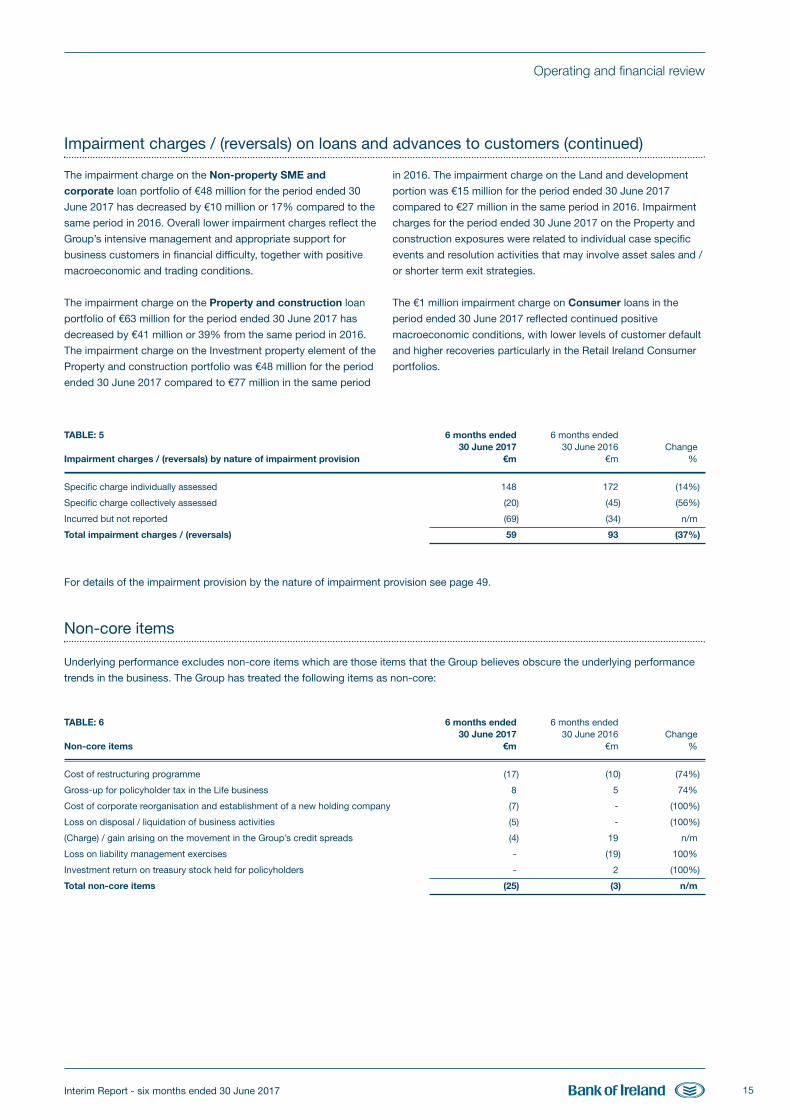
Impairment charges / (reversals) on loans and advances to customers (continued)
TABLE: 5 6 months ended 6 months ended 30 June 2017 30 June 2016 ChangeImpairment charges / (reversals) by nature of impairment provision €m €m %
Specific charge individually assessed 148 172 (14%)
Specific charge collectively assessed (20) (45) (56%)
Incurred but not reported (69) (34) n/m
Total impairment charges / (reversals) 59 93 (37%)
For details of the impairment provision by the nature of impairment provision see page 49.
Non-core items
Underlying performance excludes non-core items which are those items that the Group believes obscure the underlying performance
trends in the business. The Group has treated the following items as non-core:
TABLE: 6 6 months ended 6 months ended 30 June 2017 30 June 2016 ChangeNon-core items €m €m %
Cost of restructuring programme (17) (10) (74%)
Gross-up for policyholder tax in the Life business 8 5 74%
Cost of corporate reorganisation and establishment of a new holding company (7) - (100%)
Loss on disposal / liquidation of business activities (5) - (100%)
(Charge) / gain arising on the movement in the Group’s credit spreads (4) 19 n/m
Loss on liability management exercises - (19) 100%
Investment return on treasury stock held for policyholders - 2 (100%)
Total non-core items (25) (3) n/m
The impairment charge on the Non-property SME and
corporate loan portfolio of €48 million for the period ended 30
June 2017 has decreased by €10 million or 17% compared to the
same period in 2016. Overall lower impairment charges reflect the
Group’s intensive management and appropriate support for
business customers in financial difficulty, together with positive
macroeconomic and trading conditions.
The impairment charge on the Property and construction loan
portfolio of €63 million for the period ended 30 June 2017 has
decreased by €41 million or 39% from the same period in 2016.
The impairment charge on the Investment property element of the
Property and construction portfolio was €48 million for the period
ended 30 June 2017 compared to €77 million in the same period
in 2016. The impairment charge on the Land and development
portion was €15 million for the period ended 30 June 2017
compared to €27 million in the same period in 2016. Impairment
charges for the period ended 30 June 2017 on the Property and
construction exposures were related to individual case specific
events and resolution activities that may involve asset sales and /
or shorter term exit strategies.
The €1 million impairment charge on Consumer loans in the
period ended 30 June 2017 reflected continued positive
macroeconomic conditions, with lower levels of customer default
and higher recoveries particularly in the Retail Ireland Consumer
portfolios.
BOI Interim Report 2017 FRONT.qxp_Layout 1 27/07/2017 20:29 Page 15
Interim Report - six months ended 30 June 201716
Operating and financial review
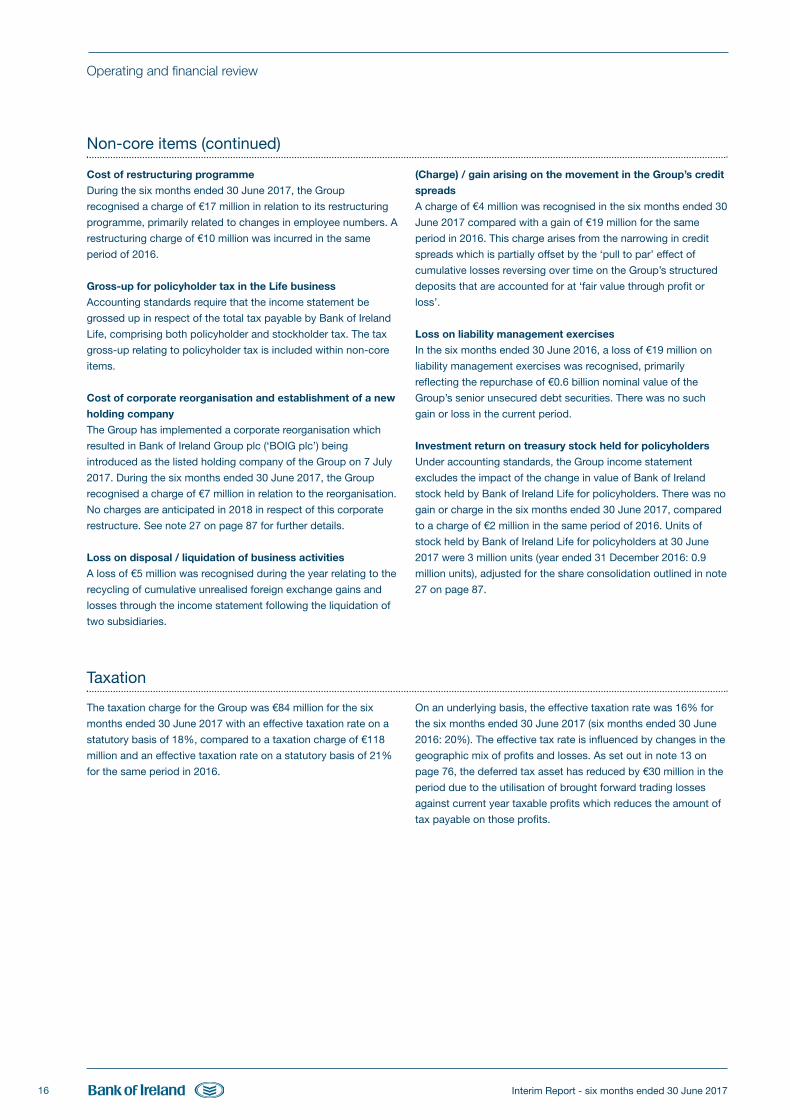
Non-core items (continued)
Cost of restructuring programme
During the six months ended 30 June 2017, the Group
recognised a charge of €17 million in relation to its restructuring
programme, primarily related to changes in employee numbers. A
restructuring charge of €10 million was incurred in the same
period of 2016.
Gross-up for policyholder tax in the Life business
Accounting standards require that the income statement be
grossed up in respect of the total tax payable by Bank of Ireland
Life, comprising both policyholder and stockholder tax. The tax
gross-up relating to policyholder tax is included within non-core
items.
Cost of corporate reorganisation and establishment of a new
holding company
The Group has implemented a corporate reorganisation which
resulted in Bank of Ireland Group plc (‘BOIG plc’) being
introduced as the listed holding company of the Group on 7 July
2017. During the six months ended 30 June 2017, the Group
recognised a charge of €7 million in relation to the reorganisation.
No charges are anticipated in 2018 in respect of this corporate
restructure. See note 27 on page 87 for further details.
Loss on disposal / liquidation of business activities
A loss of €5 million was recognised during the year relating to the
recycling of cumulative unrealised foreign exchange gains and
losses through the income statement following the liquidation of
two subsidiaries.
(Charge) / gain arising on the movement in the Group’s credit
spreads
A charge of €4 million was recognised in the six months ended 30
June 2017 compared with a gain of €19 million for the same
period in 2016. This charge arises from the narrowing in credit
spreads which is partially offset by the ‘pull to par’ effect of
cumulative losses reversing over time on the Group’s structured
deposits that are accounted for at ‘fair value through profit or
loss’.
Loss on liability management exercises
In the six months ended 30 June 2016, a loss of €19 million on
liability management exercises was recognised, primarily
reflecting the repurchase of €0.6 billion nominal value of the
Group’s senior unsecured debt securities. There was no such
gain or loss in the current period.
Investment return on treasury stock held for policyholders
Under accounting standards, the Group income statement
excludes the impact of the change in value of Bank of Ireland
stock held by Bank of Ireland Life for policyholders. There was no
gain or charge in the six months ended 30 June 2017, compared
to a charge of €2 million in the same period of 2016. Units of
stock held by Bank of Ireland Life for policyholders at 30 June
2017 were 3 million units (year ended 31 December 2016: 0.9
million units), adjusted for the share consolidation outlined in note
27 on page 87.
Taxation
The taxation charge for the Group was €84 million for the six
months ended 30 June 2017 with an effective taxation rate on a
statutory basis of 18%, compared to a taxation charge of €118
million and an effective taxation rate on a statutory basis of 21%
for the same period in 2016.
On an underlying basis, the effective taxation rate was 16% for
the six months ended 30 June 2017 (six months ended 30 June
2016: 20%). The effective tax rate is influenced by changes in the
geographic mix of profits and losses. As set out in note 13 on
page 76, the deferred tax asset has reduced by €30 million in the
period due to the utilisation of brought forward trading losses
against current year taxable profits which reduces the amount of
tax payable on those profits.
BOI Interim Report 2017 FRONT.qxp_Layout 1 27/07/2017 20:29 Page 16
Interim Report - six months ended 30 June 2017 17
Operating and financial review
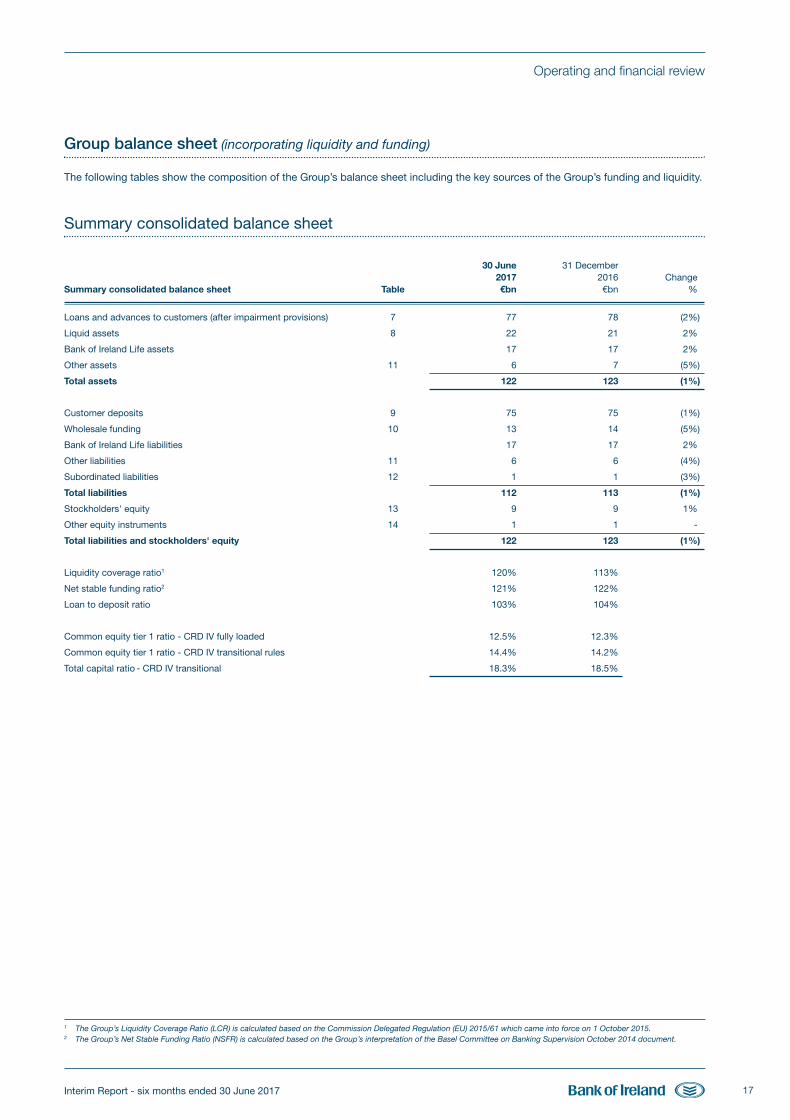
Group balance sheet (incorporating liquidity and funding)
The following tables show the composition of the Group’s balance sheet including the key sources of the Group’s funding and liquidity.
Summary consolidated balance sheet
30 June 31 December 2017 2016 ChangeSummary consolidated balance sheet Table €bn €bn %
Loans and advances to customers (after impairment provisions) 7 77 78 (2%)
Liquid assets 8 22 21 2%
Bank of Ireland Life assets 17 17 2%
Other assets 11 6 7 (5%)
Total assets 122 123 (1%)
Customer deposits 9 75 75 (1%)
Wholesale funding 10 13 14 (5%)
Bank of Ireland Life liabilities 17 17 2%
Other liabilities 11 6 6 (4%)
Subordinated liabilities 12 1 1 (3%)
Total liabilities 112 113 (1%)
Stockholders' equity 13 9 9 1%
Other equity instruments 14 1 1 -
Total liabilities and stockholders' equity 122 123 (1%)
Liquidity coverage ratio1 120% 113%
Net stable funding ratio2 121% 122%
Loan to deposit ratio 103% 104%
Common equity tier 1 ratio - CRD IV fully loaded 12.5% 12.3%
Common equity tier 1 ratio - CRD IV transitional rules 14.4% 14.2%
Total capital ratio - CRD IV transitional 18.3% 18.5%
1 The Group’s Liquidity Coverage Ratio (LCR) is calculated based on the Commission Delegated Regulation (EU) 2015/61 which came into force on 1 October 2015. 2 The Group’s Net Stable Funding Ratio (NSFR) is calculated based on the Group’s interpretation of the Basel Committee on Banking Supervision October 2014 document.
BOI Interim Report 2017 FRONT.qxp_Layout 1 27/07/2017 20:29 Page 17
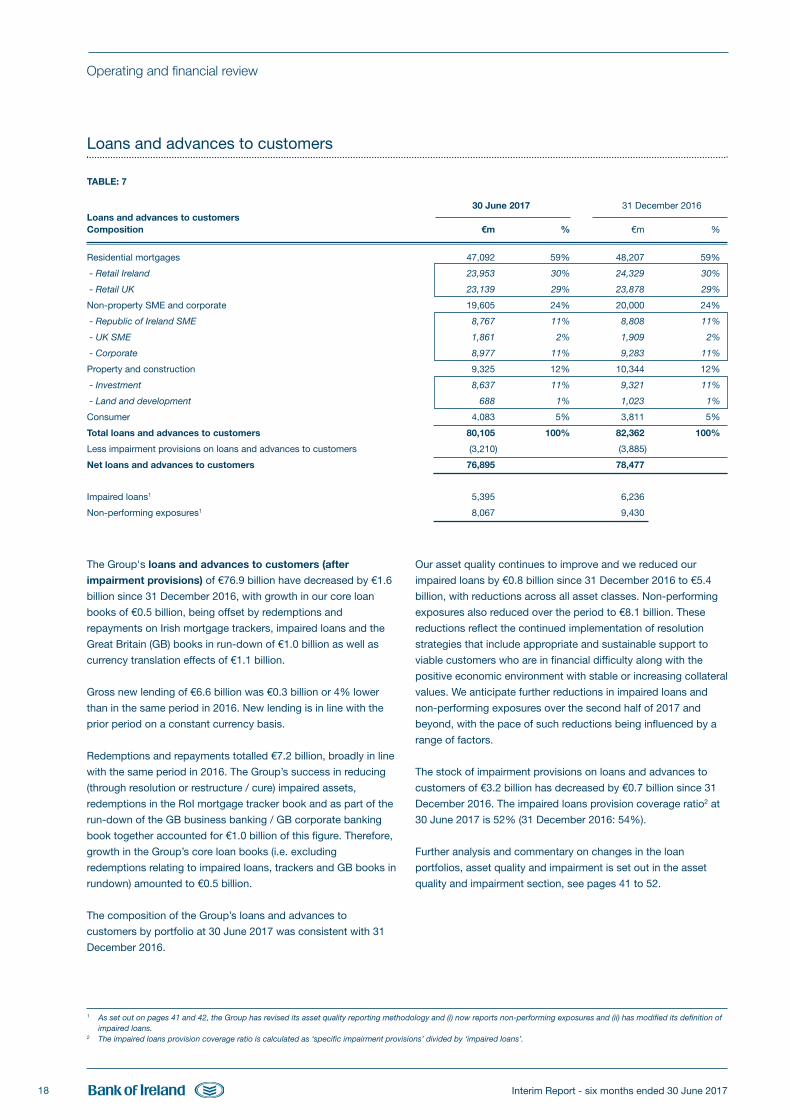
Interim Report - six months ended 30 June 201718
Operating and financial review
The Group's loans and advances to customers (after
impairment provisions) of €76.9 billion have decreased by €1.6
billion since 31 December 2016, with growth in our core loan
books of €0.5 billion, being offset by redemptions and
repayments on Irish mortgage trackers, impaired loans and the
Great Britain (GB) books in run-down of €1.0 billion as well as
currency translation effects of €1.1 billion.
Gross new lending of €6.6 billion was €0.3 billion or 4% lower
than in the same period in 2016. New lending is in line with the
prior period on a constant currency basis.
Redemptions and repayments totalled €7.2 billion, broadly in line
with the same period in 2016. The Group’s success in reducing
(through resolution or restructure / cure) impaired assets,
redemptions in the RoI mortgage tracker book and as part of the
run-down of the GB business banking / GB corporate banking
book together accounted for €1.0 billion of this figure. Therefore,
growth in the Group’s core loan books (i.e. excluding
redemptions relating to impaired loans, trackers and GB books in
rundown) amounted to €0.5 billion.
The composition of the Group’s loans and advances to
customers by portfolio at 30 June 2017 was consistent with 31
December 2016.
Our asset quality continues to improve and we reduced our
impaired loans by €0.8 billion since 31 December 2016 to €5.4
billion, with reductions across all asset classes. Non-performing
exposures also reduced over the period to €8.1 billion. These
reductions reflect the continued implementation of resolution
strategies that include appropriate and sustainable support to
viable customers who are in financial difficulty along with the
positive economic environment with stable or increasing collateral
values. We anticipate further reductions in impaired loans and
non-performing exposures over the second half of 2017 and
beyond, with the pace of such reductions being influenced by a
range of factors.
The stock of impairment provisions on loans and advances to
customers of €3.2 billion has decreased by €0.7 billion since 31
December 2016. The impaired loans provision coverage ratio2 at
30 June 2017 is 52% (31 December 2016: 54%).
Further analysis and commentary on changes in the loan
portfolios, asset quality and impairment is set out in the asset
quality and impairment section, see pages 41 to 52.
Loans and advances to customers
TABLE: 7 30 June 2017 31 December 2016Loans and advances to customers Composition €m % €m %
Residential mortgages 47,092 59% 48,207 59%
- Retail Ireland 23,953 30% 24,329 30%
- Retail UK 23,139 29% 23,878 29%
Non-property SME and corporate 19,605 24% 20,000 24%
- Republic of Ireland SME 8,767 11% 8,808 11%
- UK SME 1,861 2% 1,909 2%
- Corporate 8,977 11% 9,283 11%
Property and construction 9,325 12% 10,344 12%
- Investment 8,637 11% 9,321 11%
- Land and development 688 1% 1,023 1%
Consumer 4,083 5% 3,811 5%
Total loans and advances to customers 80,105 100% 82,362 100%
Less impairment provisions on loans and advances to customers (3,210) (3,885)
Net loans and advances to customers 76,895 78,477
Impaired loans1 5,395 6,236
Non-performing exposures1 8,067 9,430
1 As set out on pages 41 and 42, the Group has revised its asset quality reporting methodology and (i) now reports non-performing exposures and (ii) has modified its definition ofimpaired loans.
2 The impaired loans provision coverage ratio is calculated as ‘specific impairment provisions’ divided by ‘impaired loans’.
BOI Interim Report 2017 FRONT.qxp_Layout 1 27/07/2017 20:29 Page 18
Interim Report - six months ended 30 June 2017 19
Operating and financial review
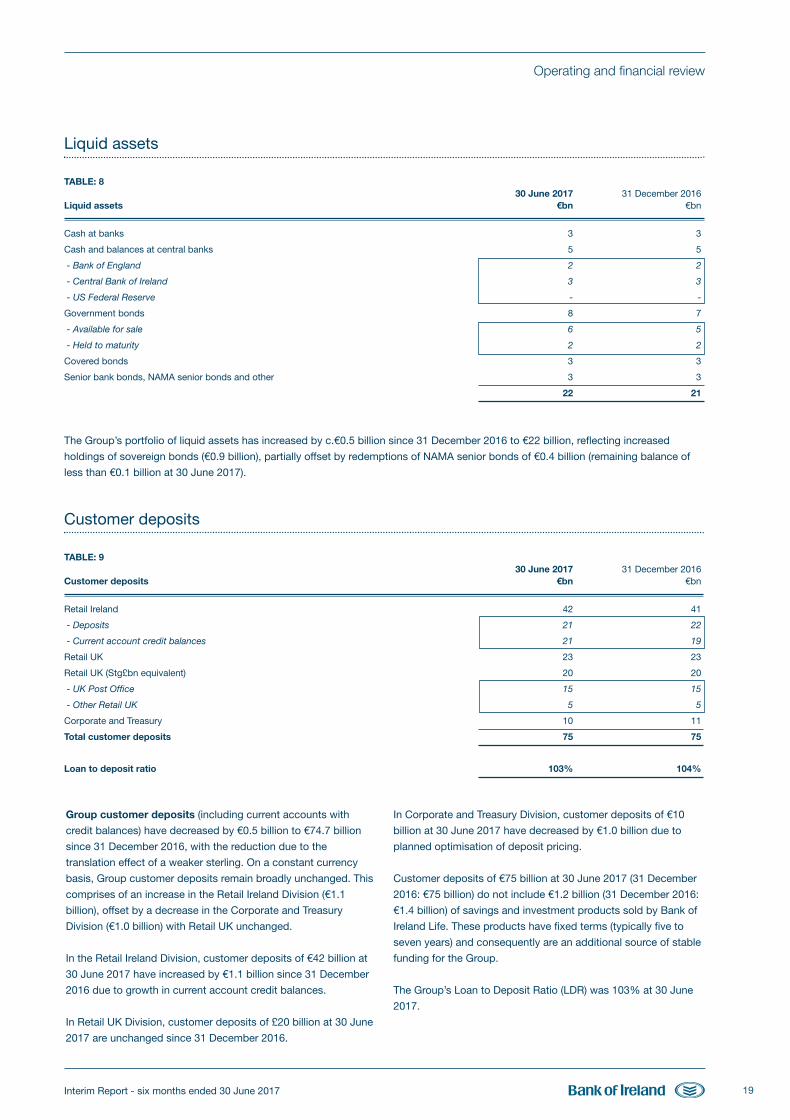
Liquid assets
TABLE: 8 30 June 2017 31 December 2016Liquid assets €bn €bn
Cash at banks 3 3
Cash and balances at central banks 5 5
- Bank of England 2 2
- Central Bank of Ireland 3 3
- US Federal Reserve - -
Government bonds 8 7
- Available for sale 6 5
- Held to maturity 2 2
Covered bonds 3 3
Senior bank bonds, NAMA senior bonds and other 3 3
22 21
The Group’s portfolio of liquid assets has increased by c.€0.5 billion since 31 December 2016 to €22 billion, reflecting increased
holdings of sovereign bonds (€0.9 billion), partially offset by redemptions of NAMA senior bonds of €0.4 billion (remaining balance of
less than €0.1 billion at 30 June 2017).
Customer deposits
TABLE: 9 30 June 2017 31 December 2016Customer deposits €bn €bn
Retail Ireland 42 41
- Deposits 21 22
- Current account credit balances 21 19
Retail UK 23 23
Retail UK (Stg£bn equivalent) 20 20
- UK Post Office 15 15
- Other Retail UK 5 5
Corporate and Treasury 10 11
Total customer deposits 75 75
Loan to deposit ratio 103% 104%
Group customer deposits (including current accounts with
credit balances) have decreased by €0.5 billion to €74.7 billion
since 31 December 2016, with the reduction due to the
translation effect of a weaker sterling. On a constant currency
basis, Group customer deposits remain broadly unchanged. This
comprises of an increase in the Retail Ireland Division (€1.1
billion), offset by a decrease in the Corporate and Treasury
Division (€1.0 billion) with Retail UK unchanged.
In the Retail Ireland Division, customer deposits of €42 billion at
30 June 2017 have increased by €1.1 billion since 31 December
2016 due to growth in current account credit balances.
In Retail UK Division, customer deposits of £20 billion at 30 June
2017 are unchanged since 31 December 2016.
In Corporate and Treasury Division, customer deposits of €10
billion at 30 June 2017 have decreased by €1.0 billion due to
planned optimisation of deposit pricing.
Customer deposits of €75 billion at 30 June 2017 (31 December
2016: €75 billion) do not include €1.2 billion (31 December 2016:
€1.4 billion) of savings and investment products sold by Bank of
Ireland Life. These products have fixed terms (typically five to
seven years) and consequently are an additional source of stable
funding for the Group.
The Group’s Loan to Deposit Ratio (LDR) was 103% at 30 June
2017.
BOI Interim Report 2017 FRONT.qxp_Layout 1 27/07/2017 20:29 Page 19
Interim Report - six months ended 30 June 201720
Operating and financial review
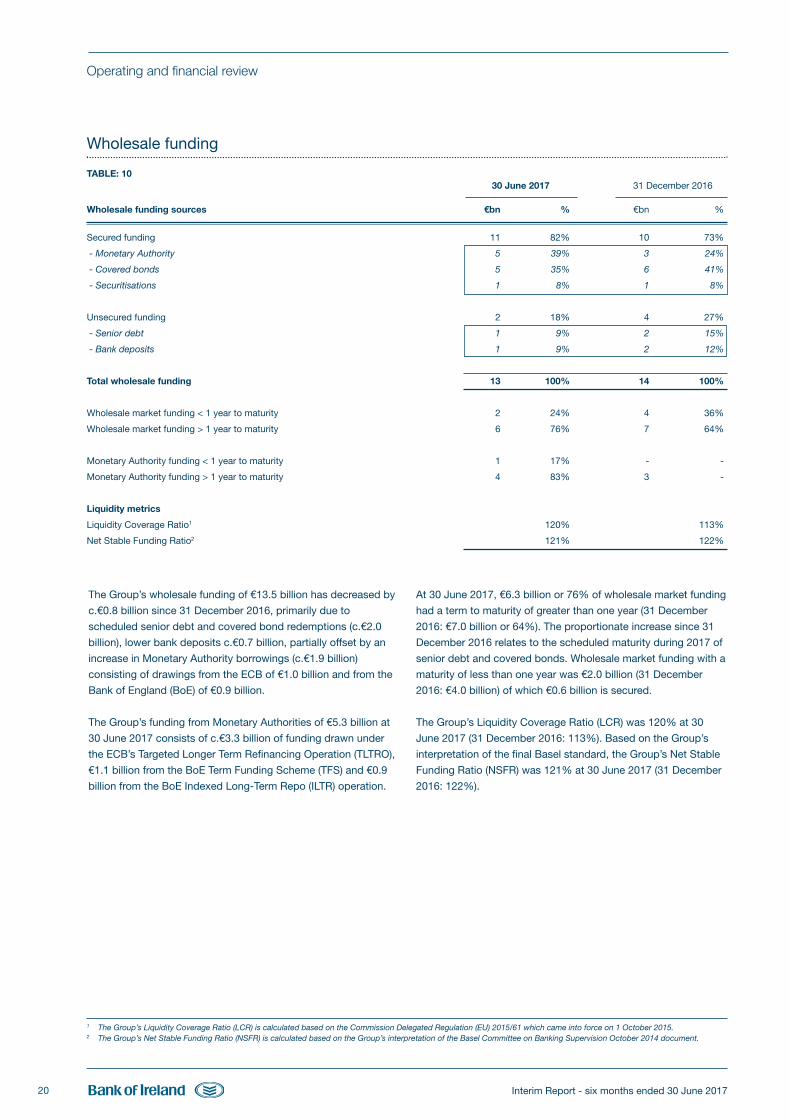
Wholesale funding
TABLE: 10 30 June 2017 31 December 2016 Wholesale funding sources €bn % €bn %
Secured funding 11 82% 10 73%
- Monetary Authority 5 39% 3 24%
- Covered bonds 5 35% 6 41%
- Securitisations 1 8% 1 8%
Unsecured funding 2 18% 4 27%
- Senior debt 1 9% 2 15%
- Bank deposits 1 9% 2 12%
Total wholesale funding 13 100% 14 100%
Wholesale market funding < 1 year to maturity 2 24% 4 36%
Wholesale market funding > 1 year to maturity 6 76% 7 64%
Monetary Authority funding < 1 year to maturity 1 17% - -
Monetary Authority funding > 1 year to maturity 4 83% 3 -
Liquidity metrics
Liquidity Coverage Ratio1 120% 113%
Net Stable Funding Ratio2 121% 122%
The Group’s wholesale funding of €13.5 billion has decreased by
c.€0.8 billion since 31 December 2016, primarily due to
scheduled senior debt and covered bond redemptions (c.€2.0
billion), lower bank deposits c.€0.7 billion, partially offset by an
increase in Monetary Authority borrowings (c.€1.9 billion)
consisting of drawings from the ECB of €1.0 billion and from the
Bank of England (BoE) of €0.9 billion.
The Group’s funding from Monetary Authorities of €5.3 billion at
30 June 2017 consists of c.€3.3 billion of funding drawn under
the ECB’s Targeted Longer Term Refinancing Operation (TLTRO),
€1.1 billion from the BoE Term Funding Scheme (TFS) and €0.9
billion from the BoE Indexed Long-Term Repo (ILTR) operation.
At 30 June 2017, €6.3 billion or 76% of wholesale market funding
had a term to maturity of greater than one year (31 December
2016: €7.0 billion or 64%). The proportionate increase since 31
December 2016 relates to the scheduled maturity during 2017 of
senior debt and covered bonds. Wholesale market funding with a
maturity of less than one year was €2.0 billion (31 December
2016: €4.0 billion) of which €0.6 billion is secured.
The Group’s Liquidity Coverage Ratio (LCR) was 120% at 30
June 2017 (31 December 2016: 113%). Based on the Group’s
interpretation of the final Basel standard, the Group’s Net Stable
Funding Ratio (NSFR) was 121% at 30 June 2017 (31 December
2016: 122%).
1 The Group’s Liquidity Coverage Ratio (LCR) is calculated based on the Commission Delegated Regulation (EU) 2015/61 which came into force on 1 October 2015. 2 The Group’s Net Stable Funding Ratio (NSFR) is calculated based on the Group’s interpretation of the Basel Committee on Banking Supervision October 2014 document.
BOI Interim Report 2017 FRONT.qxp_Layout 1 27/07/2017 20:29 Page 20
Interim Report - six months ended 30 June 2017 21
Operating and financial review
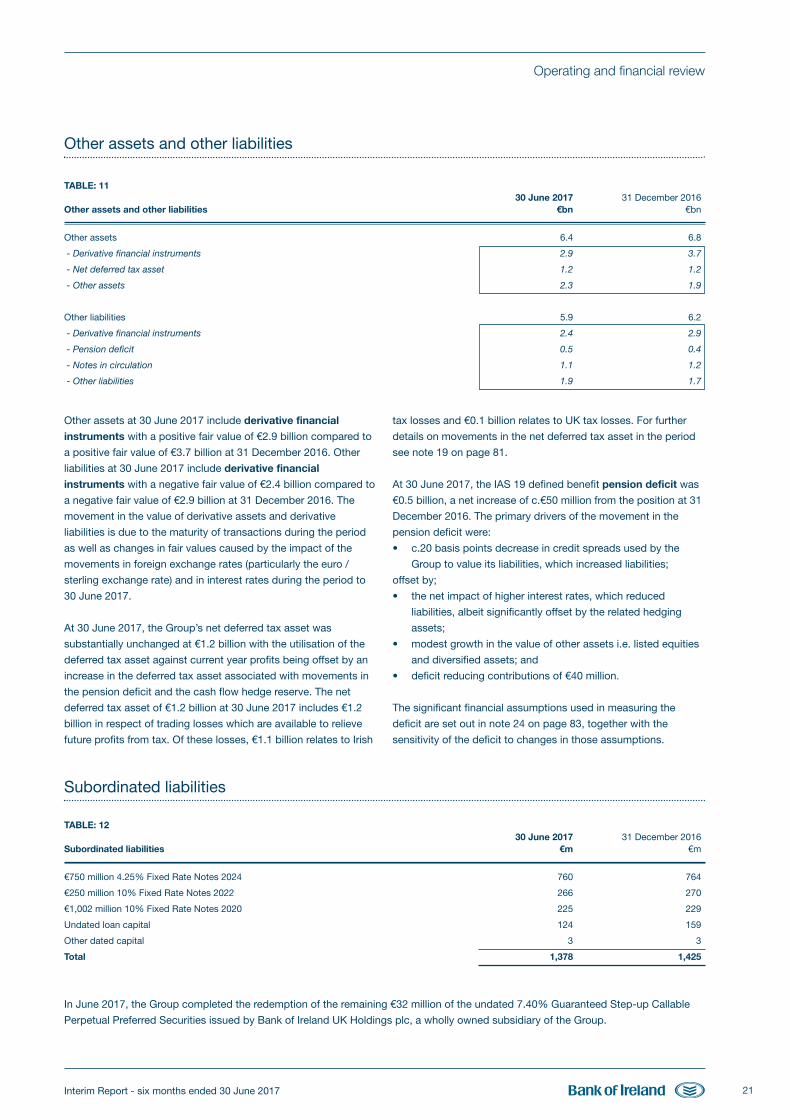
Other assets and other liabilities
TABLE: 11 30 June 2017 31 December 2016Other assets and other liabilities €bn €bn
Other assets 6.4 6.8
- Derivative financial instruments 2.9 3.7
- Net deferred tax asset 1.2 1.2
- Other assets 2.3 1.9
Other liabilities 5.9 6.2
- Derivative financial instruments 2.4 2.9
- Pension deficit 0.5 0.4
- Notes in circulation 1.1 1.2
- Other liabilities 1.9 1.7
Other assets at 30 June 2017 include derivative financial
instruments with a positive fair value of €2.9 billion compared to
a positive fair value of €3.7 billion at 31 December 2016. Other
liabilities at 30 June 2017 include derivative financial
instruments with a negative fair value of €2.4 billion compared to
a negative fair value of €2.9 billion at 31 December 2016. The
movement in the value of derivative assets and derivative
liabilities is due to the maturity of transactions during the period
as well as changes in fair values caused by the impact of the
movements in foreign exchange rates (particularly the euro /
sterling exchange rate) and in interest rates during the period to
30 June 2017.
At 30 June 2017, the Group’s net deferred tax asset was
substantially unchanged at €1.2 billion with the utilisation of the
deferred tax asset against current year profits being offset by an
increase in the deferred tax asset associated with movements in
the pension deficit and the cash flow hedge reserve. The net
deferred tax asset of €1.2 billion at 30 June 2017 includes €1.2
billion in respect of trading losses which are available to relieve
future profits from tax. Of these losses, €1.1 billion relates to Irish
tax losses and €0.1 billion relates to UK tax losses. For further
details on movements in the net deferred tax asset in the period
see note 19 on page 81.
At 30 June 2017, the IAS 19 defined benefit pension deficit was
€0.5 billion, a net increase of c.€50 million from the position at 31
December 2016. The primary drivers of the movement in the
pension deficit were:
• c.20 basis points decrease in credit spreads used by the
Group to value its liabilities, which increased liabilities;
offset by;
• the net impact of higher interest rates, which reduced
liabilities, albeit significantly offset by the related hedging
assets;
• modest growth in the value of other assets i.e. listed equities
and diversified assets; and
• deficit reducing contributions of €40 million.
The significant financial assumptions used in measuring the
deficit are set out in note 24 on page 83, together with the
sensitivity of the deficit to changes in those assumptions.
Subordinated liabilities
TABLE: 12 30 June 2017 31 December 2016Subordinated liabilities €m €m
€750 million 4.25% Fixed Rate Notes 2024 760 764
€250 million 10% Fixed Rate Notes 2022 266 270
€1,002 million 10% Fixed Rate Notes 2020 225 229
Undated loan capital 124 159
Other dated capital 3 3
Total 1,378 1,425
In June 2017, the Group completed the redemption of the remaining €32 million of the undated 7.40% Guaranteed Step-up Callable
Perpetual Preferred Securities issued by Bank of Ireland UK Holdings plc, a wholly owned subsidiary of the Group.
BOI Interim Report 2017 FRONT.qxp_Layout 1 27/07/2017 20:29 Page 21
Interim Report - six months ended 30 June 201722
Operating and financial review
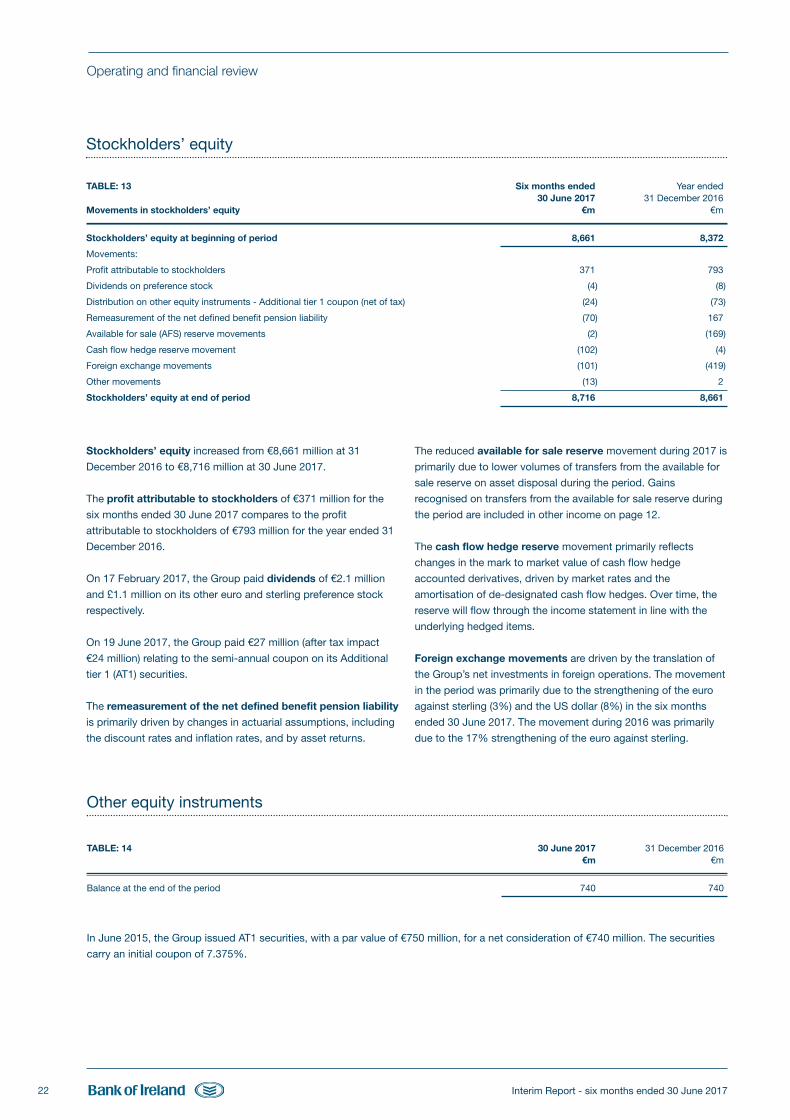
Stockholders’ equity
TABLE: 13 Six months ended Year ended 30 June 2017 31 December 2016Movements in stockholders’ equity €m €m
Stockholders’ equity at beginning of period 8,661 8,372
Movements:
Profit attributable to stockholders 371 793
Dividends on preference stock (4) (8)
Distribution on other equity instruments - Additional tier 1 coupon (net of tax) (24) (73)
Remeasurement of the net defined benefit pension liability (70) 167
Available for sale (AFS) reserve movements (2) (169)
Cash flow hedge reserve movement (102) (4)
Foreign exchange movements (101) (419)
Other movements (13) 2
Stockholders’ equity at end of period 8,716 8,661
Stockholders’ equity increased from €8,661 million at 31
December 2016 to €8,716 million at 30 June 2017.
The profit attributable to stockholders of €371 million for the
six months ended 30 June 2017 compares to the profit
attributable to stockholders of €793 million for the year ended 31
December 2016.
On 17 February 2017, the Group paid dividends of €2.1 million
and £1.1 million on its other euro and sterling preference stock
respectively.
On 19 June 2017, the Group paid €27 million (after tax impact
€24 million) relating to the semi-annual coupon on its Additional
tier 1 (AT1) securities.
The remeasurement of the net defined benefit pension liability
is primarily driven by changes in actuarial assumptions, including
the discount rates and inflation rates, and by asset returns.
The reduced available for sale reserve movement during 2017 is
primarily due to lower volumes of transfers from the available for
sale reserve on asset disposal during the period. Gains
recognised on transfers from the available for sale reserve during
the period are included in other income on page 12.
The cash flow hedge reserve movement primarily reflects
changes in the mark to market value of cash flow hedge
accounted derivatives, driven by market rates and the
amortisation of de-designated cash flow hedges. Over time, the
reserve will flow through the income statement in line with the
underlying hedged items.
Foreign exchange movements are driven by the translation of
the Group’s net investments in foreign operations. The movement
in the period was primarily due to the strengthening of the euro
against sterling (3%) and the US dollar (8%) in the six months
ended 30 June 2017. The movement during 2016 was primarily
due to the 17% strengthening of the euro against sterling.
Other equity instruments
TABLE: 14 30 June 2017 31 December 2016€m €m
Balance at the end of the period 740 740
In June 2015, the Group issued AT1 securities, with a par value of €750 million, for a net consideration of €740 million. The securities
carry an initial coupon of 7.375%.
BOI Interim Report 2017 FRONT.qxp_Layout 1 27/07/2017 20:29 Page 22
Interim Report - six months ended 30 June 2017 23
Operating and financial review
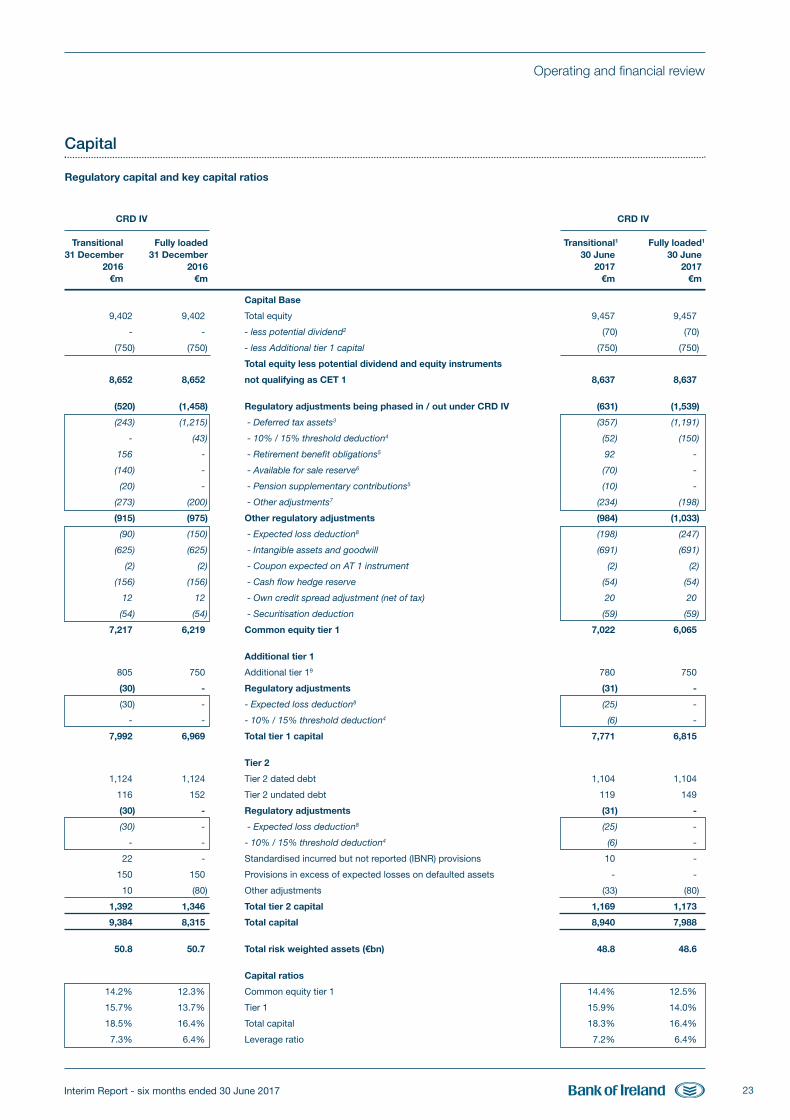
Capital
Regulatory capital and key capital ratios
CRD IV CRD IV
Transitional Fully loaded Transitional1 Fully loaded1
31 December 31 December 30 June 30 June 2016 2016 2017 2017 €m €m €m €m Capital Base
9,402 9,402 Total equity 9,457 9,457
- - - less potential dividend2 (70) (70)
(750) (750) - less Additional tier 1 capital (750) (750)
Total equity less potential dividend and equity instruments
8,652 8,652 not qualifying as CET 1 8,637 8,637
(520) (1,458) Regulatory adjustments being phased in / out under CRD IV (631) (1,539)
(243) (1,215) - Deferred tax assets3 (357) (1,191)
- (43) - 10% / 15% threshold deduction4 (52) (150)
156 - - Retirement benefit obligations5 92 -
(140) - - Available for sale reserve6 (70) -
(20) - - Pension supplementary contributions5 (10) -
(273) (200) - Other adjustments7 (234) (198)
(915) (975) Other regulatory adjustments (984) (1,033)
(90) (150) - Expected loss deduction8 (198) (247)
(625) (625) - Intangible assets and goodwill (691) (691)
(2) (2) - Coupon expected on AT 1 instrument (2) (2)
(156) (156) - Cash flow hedge reserve (54) (54)
12 12 - Own credit spread adjustment (net of tax) 20 20
(54) (54) - Securitisation deduction (59) (59)
7,217 6,219 Common equity tier 1 7,022 6,065
Additional tier 1
805 750 Additional tier 19 780 750
(30) - Regulatory adjustments (31) -
(30) - - Expected loss deduction8 (25) - - - - 10% / 15% threshold deduction4 (6) -
7,992 6,969 Total tier 1 capital 7,771 6,815
Tier 2
1,124 1,124 Tier 2 dated debt 1,104 1,104
116 152 Tier 2 undated debt 119 149
(30) - Regulatory adjustments (31) -
(30) - - Expected loss deduction8 (25) - - - - 10% / 15% threshold deduction4 (6) -
22 - Standardised incurred but not reported (IBNR) provisions 10 -
150 150 Provisions in excess of expected losses on defaulted assets - -
10 (80) Other adjustments (33) (80)
1,392 1,346 Total tier 2 capital 1,169 1,173
9,384 8,315 Total capital 8,940 7,988
50.8 50.7 Total risk weighted assets (€bn) 48.8 48.6
Capital ratios
14.2% 12.3% Common equity tier 1 14.4% 12.5%
15.7% 13.7% Tier 1 15.9% 14.0%
18.5% 16.4% Total capital 18.3% 16.4%
7.3% 6.4% Leverage ratio 7.2% 6.4%
BOI Interim Report 2017 FRONT.qxp_Layout 1 27/07/2017 20:29 Page 23
Interim Report - six months ended 30 June 201724
Operating and financial review
Capital (continued)
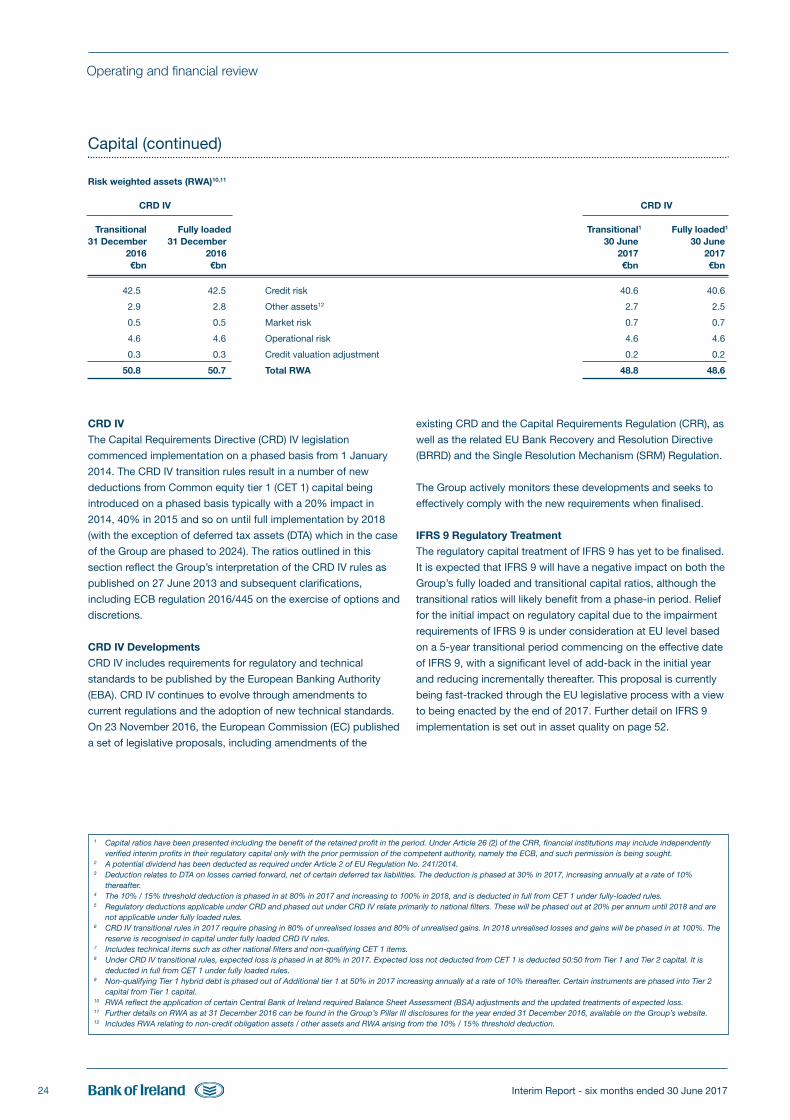
Risk weighted assets (RWA)10,11
CRD IV CRD IV
Transitional Fully loaded Transitional1 Fully loaded1
31 December 31 December 30 June 30 June 2016 2016 2017 2017 €bn €bn €bn €bn
42.5 42.5 Credit risk 40.6 40.6
2.9 2.8 Other assets12 2.7 2.5
0.5 0.5 Market risk 0.7 0.7
4.6 4.6 Operational risk 4.6 4.6
0.3 0.3 Credit valuation adjustment 0.2 0.2
50.8 50.7 Total RWA 48.8 48.6
CRD IV
The Capital Requirements Directive (CRD) IV legislation
commenced implementation on a phased basis from 1 January
2014. The CRD IV transition rules result in a number of new
deductions from Common equity tier 1 (CET 1) capital being
introduced on a phased basis typically with a 20% impact in
2014, 40% in 2015 and so on until full implementation by 2018
(with the exception of deferred tax assets (DTA) which in the case
of the Group are phased to 2024). The ratios outlined in this
section reflect the Group’s interpretation of the CRD IV rules as
published on 27 June 2013 and subsequent clarifications,
including ECB regulation 2016/445 on the exercise of options and
discretions.
CRD IV Developments
CRD IV includes requirements for regulatory and technical
standards to be published by the European Banking Authority
(EBA). CRD IV continues to evolve through amendments to
current regulations and the adoption of new technical standards.
On 23 November 2016, the European Commission (EC) published
a set of legislative proposals, including amendments of the
existing CRD and the Capital Requirements Regulation (CRR), as
well as the related EU Bank Recovery and Resolution Directive
(BRRD) and the Single Resolution Mechanism (SRM) Regulation.
The Group actively monitors these developments and seeks to
effectively comply with the new requirements when finalised.
IFRS 9 Regulatory Treatment
The regulatory capital treatment of IFRS 9 has yet to be finalised.
It is expected that IFRS 9 will have a negative impact on both the
Group’s fully loaded and transitional capital ratios, although the
transitional ratios will likely benefit from a phase-in period. Relief
for the initial impact on regulatory capital due to the impairment
requirements of IFRS 9 is under consideration at EU level based
on a 5-year transitional period commencing on the effective date
of IFRS 9, with a significant level of add-back in the initial year
and reducing incrementally thereafter. This proposal is currently
being fast-tracked through the EU legislative process with a view
to being enacted by the end of 2017. Further detail on IFRS 9
implementation is set out in asset quality on page 52.
1 Capital ratios have been presented including the benefit of the retained profit in the period. Under Article 26 (2) of the CRR, financial institutions may include independentlyverified interim profits in their regulatory capital only with the prior permission of the competent authority, namely the ECB, and such permission is being sought.
2 A potential dividend has been deducted as required under Article 2 of EU Regulation No. 241/2014.3 Deduction relates to DTA on losses carried forward, net of certain deferred tax liabilities. The deduction is phased at 30% in 2017, increasing annually at a rate of 10%
thereafter.4 The 10% / 15% threshold deduction is phased in at 80% in 2017 and increasing to 100% in 2018, and is deducted in full from CET 1 under fully-loaded rules.5 Regulatory deductions applicable under CRD and phased out under CRD IV relate primarily to national filters. These will be phased out at 20% per annum until 2018 and are
not applicable under fully loaded rules.6 CRD IV transitional rules in 2017 require phasing in 80% of unrealised losses and 80% of unrealised gains. In 2018 unrealised losses and gains will be phased in at 100%. The
reserve is recognised in capital under fully loaded CRD IV rules.7 Includes technical items such as other national filters and non-qualifying CET 1 items.8 Under CRD IV transitional rules, expected loss is phased in at 80% in 2017. Expected loss not deducted from CET 1 is deducted 50:50 from Tier 1 and Tier 2 capital. It is
deducted in full from CET 1 under fully loaded rules.9 Non-qualifying Tier 1 hybrid debt is phased out of Additional tier 1 at 50% in 2017 increasing annually at a rate of 10% thereafter. Certain instruments are phased into Tier 2
capital from Tier 1 capital.10 RWA reflect the application of certain Central Bank of Ireland required Balance Sheet Assessment (BSA) adjustments and the updated treatments of expected loss.11 Further details on RWA as at 31 December 2016 can be found in the Group’s Pillar III disclosures for the year ended 31 December 2016, available on the Group’s website.12 Includes RWA relating to non-credit obligation assets / other assets and RWA arising from the 10% / 15% threshold deduction.
BOI Interim Report 2017 FRONT.qxp_Layout 1 27/07/2017 20:29 Page 24
Interim Report - six months ended 30 June 2017 25
Operating and financial review
Capital requirements / buffers
Following the 2016 Supervisory Review and Evaluation Process
(SREP), the Group is required to maintain a CET 1 ratio of 8.0%
on a transitional basis from 1 January 2017. This includes a Pillar
I requirement of 4.5%, a Pillar II requirement (P2R) of 2.25% and
a capital conservation buffer for 2017 of 1.25%. Pillar II guidance
(P2G) is not disclosed in accordance with regulatory preference.
The Group expects to maintain a CET 1 ratio in excess of 12% on
a transitional basis and on a fully loaded basis at the end of the
phase-in period. This includes meeting applicable regulatory
capital requirements plus an appropriate management buffer.
The Central Bank of Ireland (CBI) has advised that the Group will
be required to maintain an O-SII (Other Systematically Important
Institution) buffer, which will be phased in as follows: 0.5% from
July 2019, 1.0% from July 2020 and 1.5% from July 2021. Both
the SREP requirement and the O-SII buffer are subject to annual
review by the Single Supervisory Mechanism (SSM) and the CBI
respectively.
In addition, both the CBI (RoI) and Financial Policy Committee
(FPC) (UK) have set the Countercyclical capital buffer (CCyB) at
0% from 1 January 2017. On 27 June 2017, the FPC announced
that it had decided to increase the UK countercyclical capital
buffer rate to 0.5% from 0%, with binding effect from 27 June
2018. The FPC noted that, absent a material change in the
outlook, and consistent with its stated policy for a standard risk
environment and of moving gradually, the FPC expects to
increase the countercyclical buffer rate to 1% at its November
2017 meeting, with binding effect a year after that. The CBI
confirmed that CCyB is to be maintained at 0%, with effect from
1 July 2017. The countercyclical capital buffer is subject to
quarterly review by the CBI and FPC.
Risk weighted assets
Risk weighted assets (RWA) at 30 June 2017 of €48.8 billion
compares to RWA of €50.8 billion at 31 December 2016. The
decrease of €2.0 billion in Credit RWA is primarily due to the
impact of foreign exchange movements (€0.7 billion) and changes
in book size and quality (€1.3 billion).
Transitional ratio
The CET 1 ratio at 30 June 2017 of 14.4% compares to the
ratio at 31 December 2016 of 14.2%. The increase of c.20 basis
points is primarily due to organic capital generation (+c.85 basis
points) partially offset by an increase in CRD phasing for 2017 (-
c.20 basis points), investment in the Group’s Core Banking
Platforms (-c.20 basis points), the transitional impact of an
increase in the IAS 19 pension deficit (-c.10 basis points) and an
accrual for a potential dividend (-c.15 basis points) in line with
regulatory guidance (c.20% of sustainable earnings).
Fully loaded ratio
The Group’s fully loaded CET 1 ratio, is estimated at 12.5% as at
30 June 2017, which has increased from 12.3% as at 31
December 2016. The increase of c.20 basis points is primarily
due to organic capital generation (+c.70 basis points), investment
in the Group’s Core Banking Platforms (-c.20 basis points), the
fully loaded impact of an increase in the IAS 19 pension deficit
(-c.15 basis points) and an accrual for a potential dividend (-c.15
basis points) in line with regulatory guidance (c.20% of
sustainable earnings).
Leverage ratio
The leverage ratio at 30 June 2017 is 7.2% on a CRD IV
transitional basis (31 December 2016: 7.3%), 6.4% on a pro-
forma fully loaded basis (31 December 2016: 6.4%). The Group
expects its leverage ratio to remain above the Basel committee
indicated minimum level leverage ratio of 3%.
Distribution policy
The Group’s aim is to have a sustainable dividend. The Group
expects dividend payments to re-commence at a modest level,
prudently and progressively building, over time, towards a payout
ratio of around 50% of sustainable earnings. The dividend level
and the rate of progression will reflect, amongst other things, the
strength of the Group’s capital and capital generation, the
Directors’ assessment of the growth and investment
opportunities available, any capital the Group retains to cover
uncertainties and any impact from the evolving regulatory and
accounting environments.
As additional clarity emerges on the impact of the UK’s decision
to leave the European Union, and as the more recent
improvement in the IAS 19 accounting pension deficit is
sustained, the Group expects to re-commence dividend
payments in respect of financial year 2017, with the initial
payment being made in the first half of 2018.
Capital (continued)
BOI Interim Report 2017 FRONT.qxp_Layout 1 27/07/2017 20:29 Page 25

THIS PAGE HAS INTENTIONALLY BEEN LEFT BLANK
BOI Interim Report 2017 FRONT.qxp_Layout 1 27/07/2017 20:29 Page 26
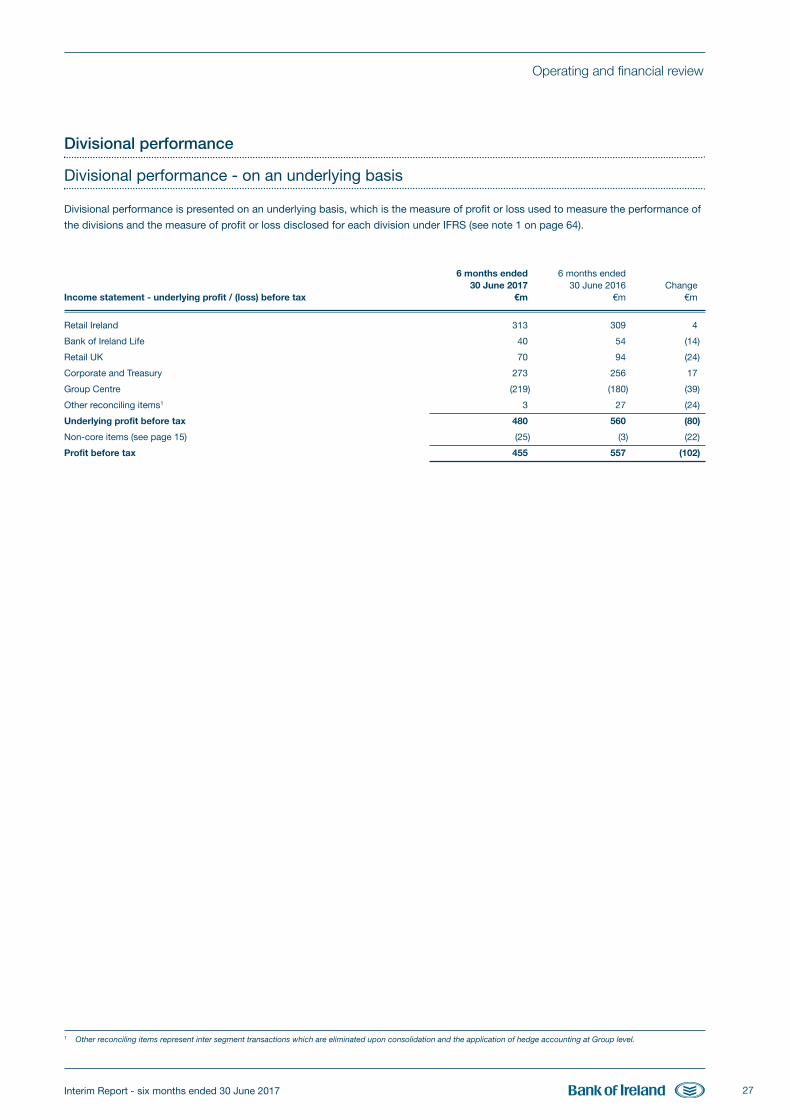
Interim Report - six months ended 30 June 2017 27
Divisional performance
Divisional performance - on an underlying basis
Divisional performance is presented on an underlying basis, which is the measure of profit or loss used to measure the performance of
the divisions and the measure of profit or loss disclosed for each division under IFRS (see note 1 on page 64).
6 months ended 6 months ended 30 June 2017 30 June 2016 ChangeIncome statement - underlying profit / (loss) before tax €m €m €m
Retail Ireland 313 309 4
Bank of Ireland Life 40 54 (14)
Retail UK 70 94 (24)
Corporate and Treasury 273 256 17
Group Centre (219) (180) (39)
Other reconciling items1 3 27 (24)
Underlying profit before tax 480 560 (80)
Non-core items (see page 15) (25) (3) (22)
Profit before tax 455 557 (102)
Operating and financial review
1 Other reconciling items represent inter segment transactions which are eliminated upon consolidation and the application of hedge accounting at Group level.
BOI Interim Report 2017 FRONT.qxp_Layout 1 27/07/2017 20:29 Page 27
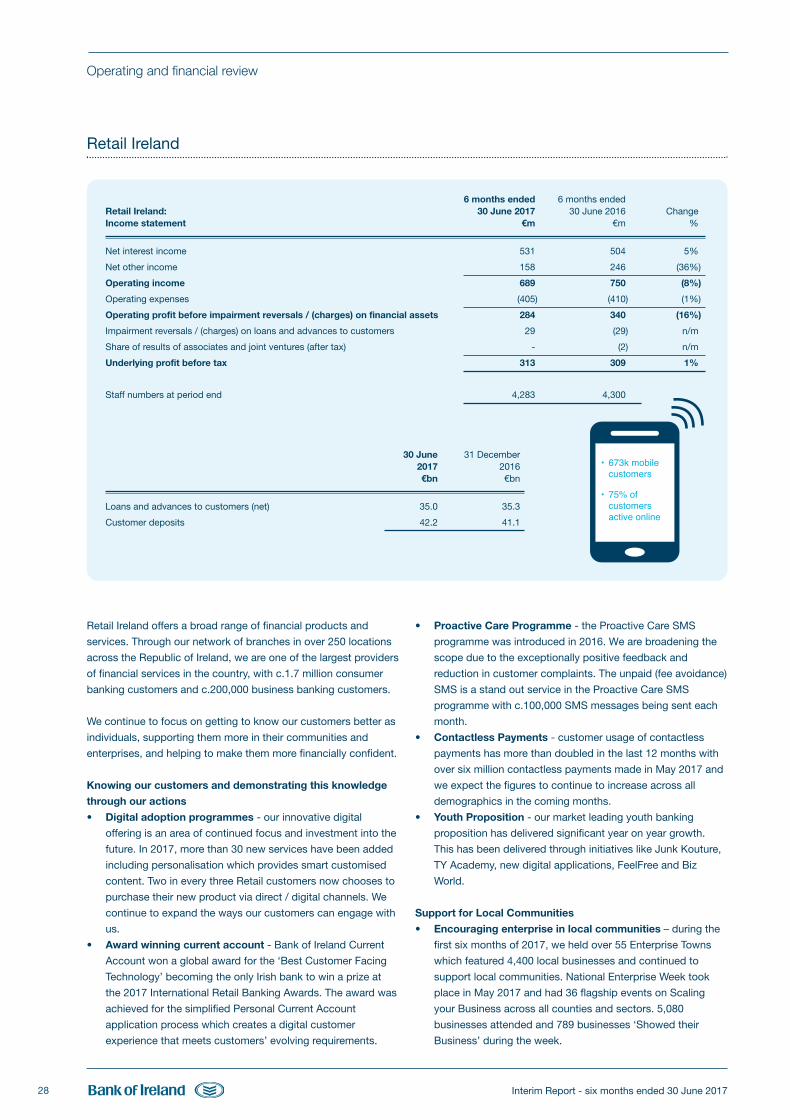
Interim Report - six months ended 30 June 201728
6 months ended 6 months endedRetail Ireland: 30 June 2017 30 June 2016 ChangeIncome statement €m €m %
Net interest income 531 504 5%
Net other income 158 246 (36%)
Operating income 689 750 (8%)
Operating expenses (405) (410) (1%)
Operating profit before impairment reversals / (charges) on financial assets 284 340 (16%)
Impairment reversals / (charges) on loans and advances to customers 29 (29) n/m
Share of results of associates and joint ventures (after tax) - (2) n/m
Underlying profit before tax 313 309 1%
Staff numbers at period end 4,283 4,300
30 June 31 December 2017 2016 €bn €bn
Loans and advances to customers (net) 35.0 35.3
Customer deposits 42.2 41.1
Retail Ireland
Operating and financial review
• 673k mobile customers
• 75% of customers active online
Retail Ireland offers a broad range of financial products and
services. Through our network of branches in over 250 locations
across the Republic of Ireland, we are one of the largest providers
of financial services in the country, with c.1.7 million consumer
banking customers and c.200,000 business banking customers.
We continue to focus on getting to know our customers better as
individuals, supporting them more in their communities and
enterprises, and helping to make them more financially confident.
Knowing our customers and demonstrating this knowledge
through our actions
• Digital adoption programmes - our innovative digital
offering is an area of continued focus and investment into the
future. In 2017, more than 30 new services have been added
including personalisation which provides smart customised
content. Two in every three Retail customers now chooses to
purchase their new product via direct / digital channels. We
continue to expand the ways our customers can engage with
us.
• Award winning current account - Bank of Ireland Current
Account won a global award for the ‘Best Customer Facing
Technology’ becoming the only Irish bank to win a prize at
the 2017 International Retail Banking Awards. The award was
achieved for the simplified Personal Current Account
application process which creates a digital customer
experience that meets customers’ evolving requirements.
• Proactive Care Programme - the Proactive Care SMS
programme was introduced in 2016. We are broadening the
scope due to the exceptionally positive feedback and
reduction in customer complaints. The unpaid (fee avoidance)
SMS is a stand out service in the Proactive Care SMS
programme with c.100,000 SMS messages being sent each
month.
• Contactless Payments - customer usage of contactless
payments has more than doubled in the last 12 months with
over six million contactless payments made in May 2017 and
we expect the figures to continue to increase across all
demographics in the coming months.
• Youth Proposition - our market leading youth banking
proposition has delivered significant year on year growth.
This has been delivered through initiatives like Junk Kouture,
TY Academy, new digital applications, FeelFree and Biz
World.
Support for Local Communities
• Encouraging enterprise in local communities – during the
first six months of 2017, we held over 55 Enterprise Towns
which featured 4,400 local businesses and continued to
support local communities. National Enterprise Week took
place in May 2017 and had 36 flagship events on Scaling
your Business across all counties and sectors. 5,080
businesses attended and 789 businesses ‘Showed their
Business’ during the week.
BOI Interim Report 2017 FRONT.qxp_Layout 1 27/07/2017 20:29 Page 28
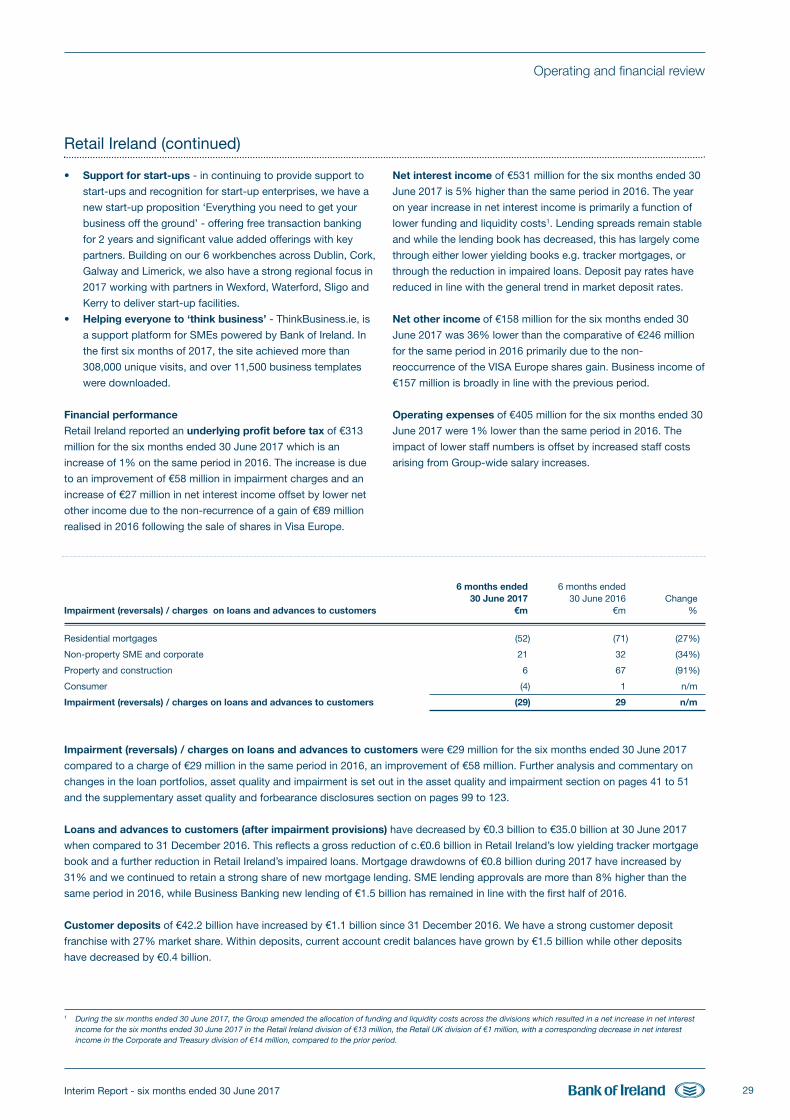
Interim Report - six months ended 30 June 2017 29
Retail Ireland (continued)
Operating and financial review
1 During the six months ended 30 June 2017, the Group amended the allocation of funding and liquidity costs across the divisions which resulted in a net increase in net interestincome for the six months ended 30 June 2017 in the Retail Ireland division of €13 million, the Retail UK division of €1 million, with a corresponding decrease in net interestincome in the Corporate and Treasury division of €14 million, compared to the prior period.
6 months ended 6 months ended 30 June 2017 30 June 2016 ChangeImpairment (reversals) / charges on loans and advances to customers €m €m %
Residential mortgages (52) (71) (27%)
Non-property SME and corporate 21 32 (34%)
Property and construction 6 67 (91%)
Consumer (4) 1 n/m
Impairment (reversals) / charges on loans and advances to customers (29) 29 n/m
Impairment (reversals) / charges on loans and advances to customers were €29 million for the six months ended 30 June 2017
compared to a charge of €29 million in the same period in 2016, an improvement of €58 million. Further analysis and commentary on
changes in the loan portfolios, asset quality and impairment is set out in the asset quality and impairment section on pages 41 to 51
and the supplementary asset quality and forbearance disclosures section on pages 99 to 123.
Loans and advances to customers (after impairment provisions) have decreased by €0.3 billion to €35.0 billion at 30 June 2017
when compared to 31 December 2016. This reflects a gross reduction of c.€0.6 billion in Retail Ireland’s low yielding tracker mortgage
book and a further reduction in Retail Ireland’s impaired loans. Mortgage drawdowns of €0.8 billion during 2017 have increased by
31% and we continued to retain a strong share of new mortgage lending. SME lending approvals are more than 8% higher than the
same period in 2016, while Business Banking new lending of €1.5 billion has remained in line with the first half of 2016.
Customer deposits of €42.2 billion have increased by €1.1 billion since 31 December 2016. We have a strong customer deposit
franchise with 27% market share. Within deposits, current account credit balances have grown by €1.5 billion while other deposits
have decreased by €0.4 billion.
• Support for start-ups - in continuing to provide support to
start-ups and recognition for start-up enterprises, we have a
new start-up proposition ‘Everything you need to get your
business off the ground’ - offering free transaction banking
for 2 years and significant value added offerings with key
partners. Building on our 6 workbenches across Dublin, Cork,
Galway and Limerick, we also have a strong regional focus in
2017 working with partners in Wexford, Waterford, Sligo and
Kerry to deliver start-up facilities.
• Helping everyone to ‘think business’ - ThinkBusiness.ie, is
a support platform for SMEs powered by Bank of Ireland. In
the first six months of 2017, the site achieved more than
308,000 unique visits, and over 11,500 business templates
were downloaded.
Financial performance
Retail Ireland reported an underlying profit before tax of €313
million for the six months ended 30 June 2017 which is an
increase of 1% on the same period in 2016. The increase is due
to an improvement of €58 million in impairment charges and an
increase of €27 million in net interest income offset by lower net
other income due to the non-recurrence of a gain of €89 million
realised in 2016 following the sale of shares in Visa Europe.
Net interest income of €531 million for the six months ended 30
June 2017 is 5% higher than the same period in 2016. The year
on year increase in net interest income is primarily a function of
lower funding and liquidity costs1. Lending spreads remain stable
and while the lending book has decreased, this has largely come
through either lower yielding books e.g. tracker mortgages, or
through the reduction in impaired loans. Deposit pay rates have
reduced in line with the general trend in market deposit rates.
Net other income of €158 million for the six months ended 30
June 2017 was 36% lower than the comparative of €246 million
for the same period in 2016 primarily due to the non-
reoccurrence of the VISA Europe shares gain. Business income of
€157 million is broadly in line with the previous period.
Operating expenses of €405 million for the six months ended 30
June 2017 were 1% lower than the same period in 2016. The
impact of lower staff numbers is offset by increased staff costs
arising from Group-wide salary increases.
BOI Interim Report 2017 FRONT.qxp_Layout 1 27/07/2017 20:29 Page 29
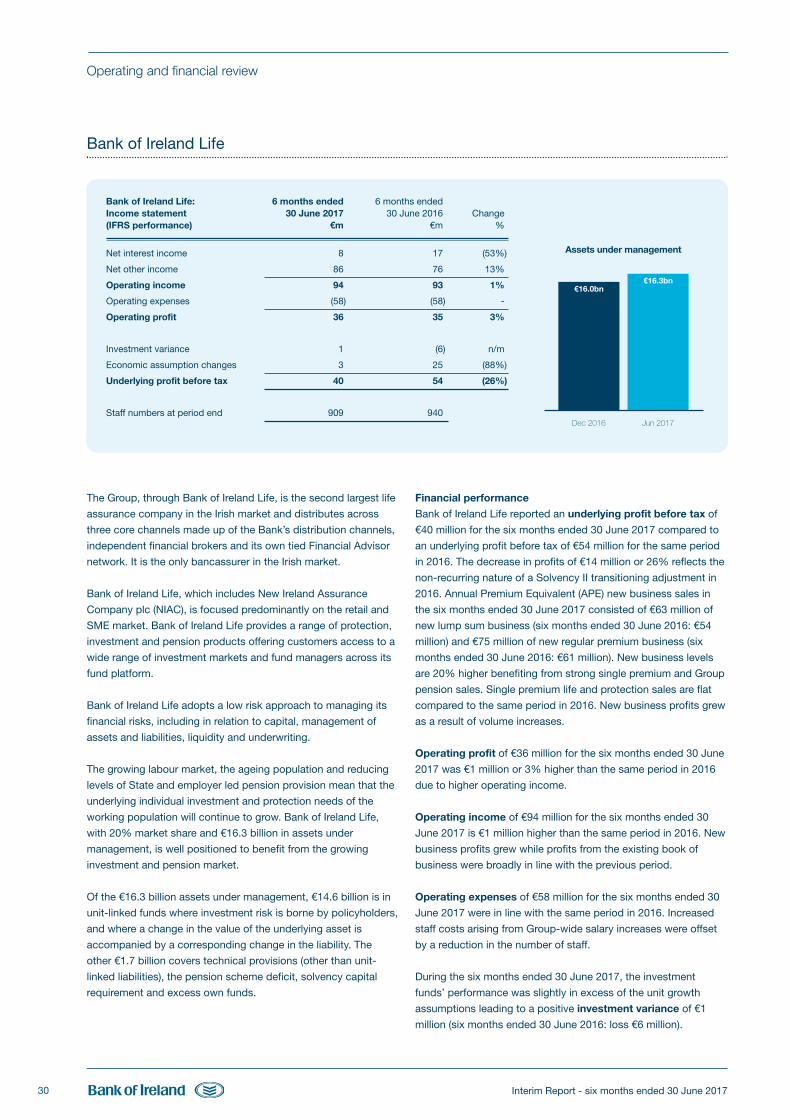
€16.3bn
Interim Report - six months ended 30 June 201730
Bank of Ireland Life
Operating and financial review
The Group, through Bank of Ireland Life, is the second largest life
assurance company in the Irish market and distributes across
three core channels made up of the Bank’s distribution channels,
independent financial brokers and its own tied Financial Advisor
network. It is the only bancassurer in the Irish market.
Bank of Ireland Life, which includes New Ireland Assurance
Company plc (NIAC), is focused predominantly on the retail and
SME market. Bank of Ireland Life provides a range of protection,
investment and pension products offering customers access to a
wide range of investment markets and fund managers across its
fund platform.
Bank of Ireland Life adopts a low risk approach to managing its
financial risks, including in relation to capital, management of
assets and liabilities, liquidity and underwriting.
The growing labour market, the ageing population and reducing
levels of State and employer led pension provision mean that the
underlying individual investment and protection needs of the
working population will continue to grow. Bank of Ireland Life,
with 20% market share and €16.3 billion in assets under
management, is well positioned to benefit from the growing
investment and pension market.
Of the €16.3 billion assets under management, €14.6 billion is in
unit-linked funds where investment risk is borne by policyholders,
and where a change in the value of the underlying asset is
accompanied by a corresponding change in the liability. The
other €1.7 billion covers technical provisions (other than unit-
linked liabilities), the pension scheme deficit, solvency capital
requirement and excess own funds.
Financial performance
Bank of Ireland Life reported an underlying profit before tax of
€40 million for the six months ended 30 June 2017 compared to
an underlying profit before tax of €54 million for the same period
in 2016. The decrease in profits of €14 million or 26% reflects the
non-recurring nature of a Solvency II transitioning adjustment in
2016. Annual Premium Equivalent (APE) new business sales in
the six months ended 30 June 2017 consisted of €63 million of
new lump sum business (six months ended 30 June 2016: €54
million) and €75 million of new regular premium business (six
months ended 30 June 2016: €61 million). New business levels
are 20% higher benefiting from strong single premium and Group
pension sales. Single premium life and protection sales are flat
compared to the same period in 2016. New business profits grew
as a result of volume increases.
Operating profit of €36 million for the six months ended 30 June
2017 was €1 million or 3% higher than the same period in 2016
due to higher operating income.
Operating income of €94 million for the six months ended 30
June 2017 is €1 million higher than the same period in 2016. New
business profits grew while profits from the existing book of
business were broadly in line with the previous period.
Operating expenses of €58 million for the six months ended 30
June 2017 were in line with the same period in 2016. Increased
staff costs arising from Group-wide salary increases were offset
by a reduction in the number of staff.
During the six months ended 30 June 2017, the investment
funds’ performance was slightly in excess of the unit growth
assumptions leading to a positive investment variance of €1
million (six months ended 30 June 2016: loss €6 million).
Bank of Ireland Life: 6 months ended 6 months endedIncome statement 30 June 2017 30 June 2016 Change(IFRS performance) €m €m %
Net interest income 8 17 (53%)
Net other income 86 76 13%
Operating income 94 93 1%
Operating expenses (58) (58) -
Operating profit 36 35 3%
Investment variance 1 (6) n/m
Economic assumption changes 3 25 (88%)
Underlying profit before tax 40 54 (26%)
Staff numbers at period end 909 940
Assets under management
Dec 2016 Jun 2017
€16.0bn
BOI Interim Report 2017 FRONT.qxp_Layout 1 27/07/2017 20:29 Page 30
Interim Report - six months ended 30 June 2017 31
Bank of Ireland Life (continued)
Operating and financial review
Interest rates have risen in particular towards the end of June
2017. The overall impact of the change in interest rates, including
the impact on the economic assumptions was positive,
resulting in a €3 million gain for the six months ended 30 June
2017 (six months ended 30 June 2016: €25 million). The higher
economic assumption gains in the first half of 2016 were primarily
due to Solvency II transitioning impacts. The discount rate
applied to future cash flows was 6.04% at 30 June 2017, an
increase of 0.21% when compared to 31 December 2016. The
future assumed growth rate on unit-linked assets increased by
0.25% to 3.50% at 30 June 2017. These increases were driven
by an increase in 10 year swap rates during 2017.
The following table outlines the Embedded value (EV) performance.
6 months ended 6 months ended Bank of Ireland Life: income statement 30 June 2017 30 June 2016 Change(Embedded value performance) €m €m %
New business profits 8 5 60%
Existing business profits 33 36 (8%)
Expected return 24 25 (4%)
Experience variance 11 9 22%
Assumption changes (2) 2 n/m
Intercompany payments (5) (6) 17%
Interest payments (2) (3) 33%
Operating profit 34 32 6%
Investment variance 2 (9) n/m
Economic assumption changes 4 19 (79%)
Underlying profit before tax 40 42 (5%)
The table below summarises the overall balance sheet of Bank of Ireland Life on an EV basis at 30 June 2017 compared to the value at
31 December 2016.
30 June 2017 31 December 2016€m €m
Net assets 452 428
Value of In Force 672 666
Less Tier 2 subordinated capital / debt (104) (140)
Less pension scheme deficit (76) (96)
Total Embedded value 944 858
BOI Interim Report 2017 FRONT.qxp_Layout 1 27/07/2017 20:29 Page 31
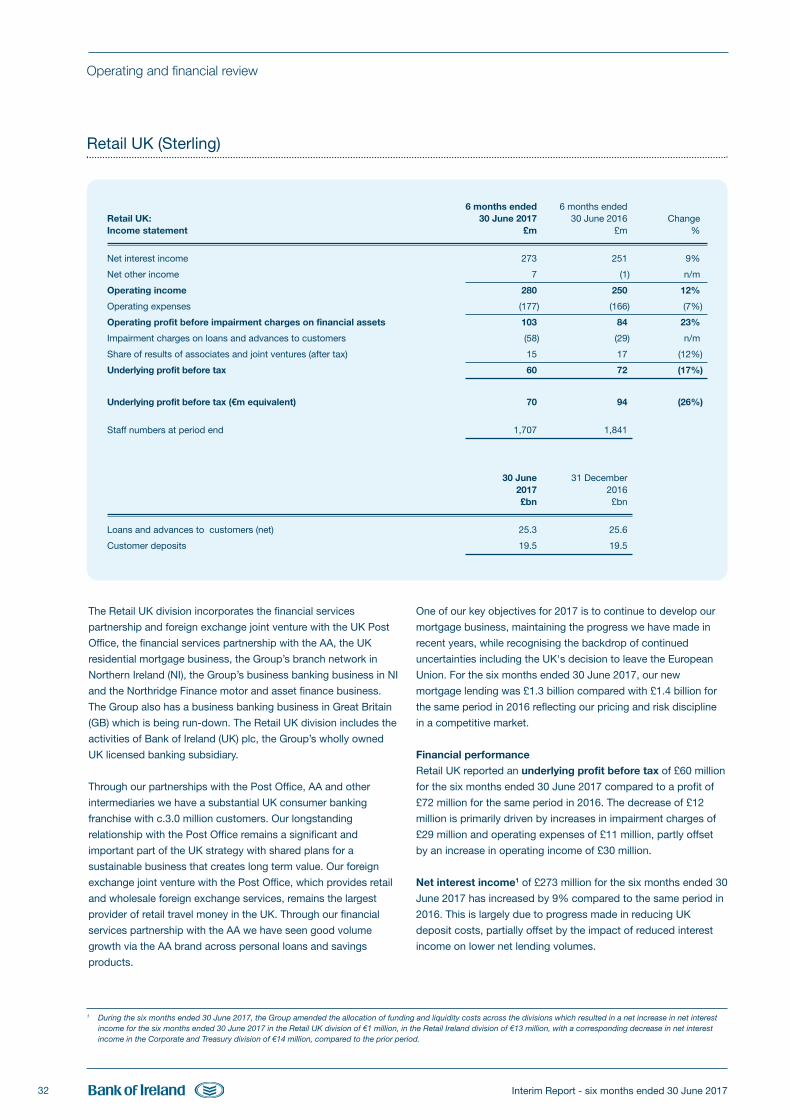
Interim Report - six months ended 30 June 201732
6 months ended 6 months endedRetail UK: 30 June 2017 30 June 2016 ChangeIncome statement £m £m %
Net interest income 273 251 9%
Net other income 7 (1) n/m
Operating income 280 250 12%
Operating expenses (177) (166) (7%)
Operating profit before impairment charges on financial assets 103 84 23%
Impairment charges on loans and advances to customers (58) (29) n/m
Share of results of associates and joint ventures (after tax) 15 17 (12%)
Underlying profit before tax 60 72 (17%)
Underlying profit before tax (€m equivalent) 70 94 (26%)
Staff numbers at period end 1,707 1,841
30 June 31 December 2017 2016 £bn £bn
Loans and advances to customers (net) 25.3 25.6
Customer deposits 19.5 19.5
Retail UK (Sterling)
Operating and financial review
The Retail UK division incorporates the financial services
partnership and foreign exchange joint venture with the UK Post
Office, the financial services partnership with the AA, the UK
residential mortgage business, the Group’s branch network in
Northern Ireland (NI), the Group’s business banking business in NI
and the Northridge Finance motor and asset finance business.
The Group also has a business banking business in Great Britain
(GB) which is being run-down. The Retail UK division includes the
activities of Bank of Ireland (UK) plc, the Group’s wholly owned
UK licensed banking subsidiary.
Through our partnerships with the Post Office, AA and other
intermediaries we have a substantial UK consumer banking
franchise with c.3.0 million customers. Our longstanding
relationship with the Post Office remains a significant and
important part of the UK strategy with shared plans for a
sustainable business that creates long term value. Our foreign
exchange joint venture with the Post Office, which provides retail
and wholesale foreign exchange services, remains the largest
provider of retail travel money in the UK. Through our financial
services partnership with the AA we have seen good volume
growth via the AA brand across personal loans and savings
products.
One of our key objectives for 2017 is to continue to develop our
mortgage business, maintaining the progress we have made in
recent years, while recognising the backdrop of continued
uncertainties including the UK's decision to leave the European
Union. For the six months ended 30 June 2017, our new
mortgage lending was £1.3 billion compared with £1.4 billion for
the same period in 2016 reflecting our pricing and risk discipline
in a competitive market.
Financial performance
Retail UK reported an underlying profit before tax of £60 million
for the six months ended 30 June 2017 compared to a profit of
£72 million for the same period in 2016. The decrease of £12
million is primarily driven by increases in impairment charges of
£29 million and operating expenses of £11 million, partly offset
by an increase in operating income of £30 million.
Net interest income1 of £273 million for the six months ended 30
June 2017 has increased by 9% compared to the same period in
2016. This is largely due to progress made in reducing UK
deposit costs, partially offset by the impact of reduced interest
income on lower net lending volumes.
1 During the six months ended 30 June 2017, the Group amended the allocation of funding and liquidity costs across the divisions which resulted in a net increase in net interestincome for the six months ended 30 June 2017 in the Retail UK division of €1 million, in the Retail Ireland division of €13 million, with a corresponding decrease in net interestincome in the Corporate and Treasury division of €14 million, compared to the prior period.
BOI Interim Report 2017 FRONT.qxp_Layout 1 27/07/2017 20:29 Page 32
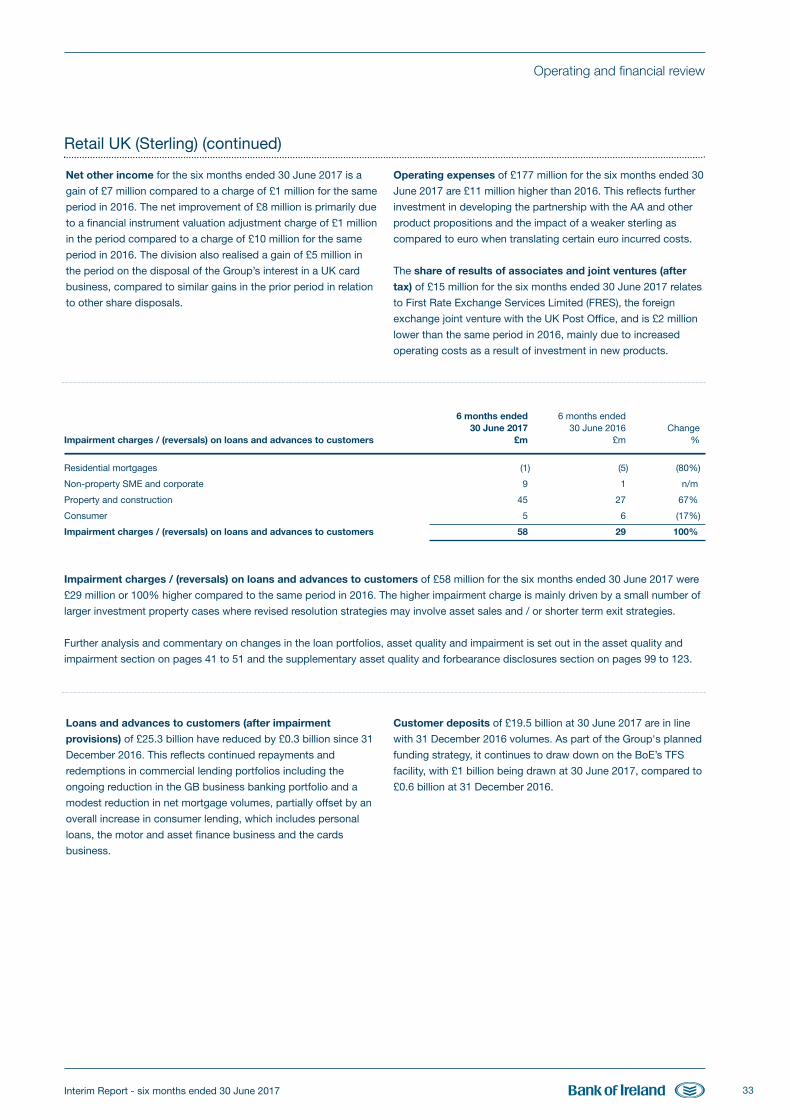
Interim Report - six months ended 30 June 2017 33
Retail UK (Sterling) (continued)
Operating and financial review
6 months ended 6 months ended 30 June 2017 30 June 2016 ChangeImpairment charges / (reversals) on loans and advances to customers £m £m %
Residential mortgages (1) (5) (80%)
Non-property SME and corporate 9 1 n/m
Property and construction 45 27 67%
Consumer 5 6 (17%)
Impairment charges / (reversals) on loans and advances to customers 58 29 100%
Impairment charges / (reversals) on loans and advances to customers of £58 million for the six months ended 30 June 2017 were
£29 million or 100% higher compared to the same period in 2016. The higher impairment charge is mainly driven by a small number of
larger investment property cases where revised resolution strategies may involve asset sales and / or shorter term exit strategies.
Further analysis and commentary on changes in the loan portfolios, asset quality and impairment is set out in the asset quality and
impairment section on pages 41 to 51 and the supplementary asset quality and forbearance disclosures section on pages 99 to 123.
Net other income for the six months ended 30 June 2017 is a
gain of £7 million compared to a charge of £1 million for the same
period in 2016. The net improvement of £8 million is primarily due
to a financial instrument valuation adjustment charge of £1 million
in the period compared to a charge of £10 million for the same
period in 2016. The division also realised a gain of £5 million in
the period on the disposal of the Group’s interest in a UK card
business, compared to similar gains in the prior period in relation
to other share disposals.
Operating expenses of £177 million for the six months ended 30
June 2017 are £11 million higher than 2016. This reflects further
investment in developing the partnership with the AA and other
product propositions and the impact of a weaker sterling as
compared to euro when translating certain euro incurred costs.
The share of results of associates and joint ventures (after
tax) of £15 million for the six months ended 30 June 2017 relates
to First Rate Exchange Services Limited (FRES), the foreign
exchange joint venture with the UK Post Office, and is £2 million
lower than the same period in 2016, mainly due to increased
operating costs as a result of investment in new products.
Loans and advances to customers (after impairment
provisions) of £25.3 billion have reduced by £0.3 billion since 31
December 2016. This reflects continued repayments and
redemptions in commercial lending portfolios including the
ongoing reduction in the GB business banking portfolio and a
modest reduction in net mortgage volumes, partially offset by an
overall increase in consumer lending, which includes personal
loans, the motor and asset finance business and the cards
business.
Customer deposits of £19.5 billion at 30 June 2017 are in line
with 31 December 2016 volumes. As part of the Group's planned
funding strategy, it continues to draw down on the BoE’s TFS
facility, with £1 billion being drawn at 30 June 2017, compared to
£0.6 billion at 31 December 2016.
BOI Interim Report 2017 FRONT.qxp_Layout 1 27/07/2017 20:29 Page 33
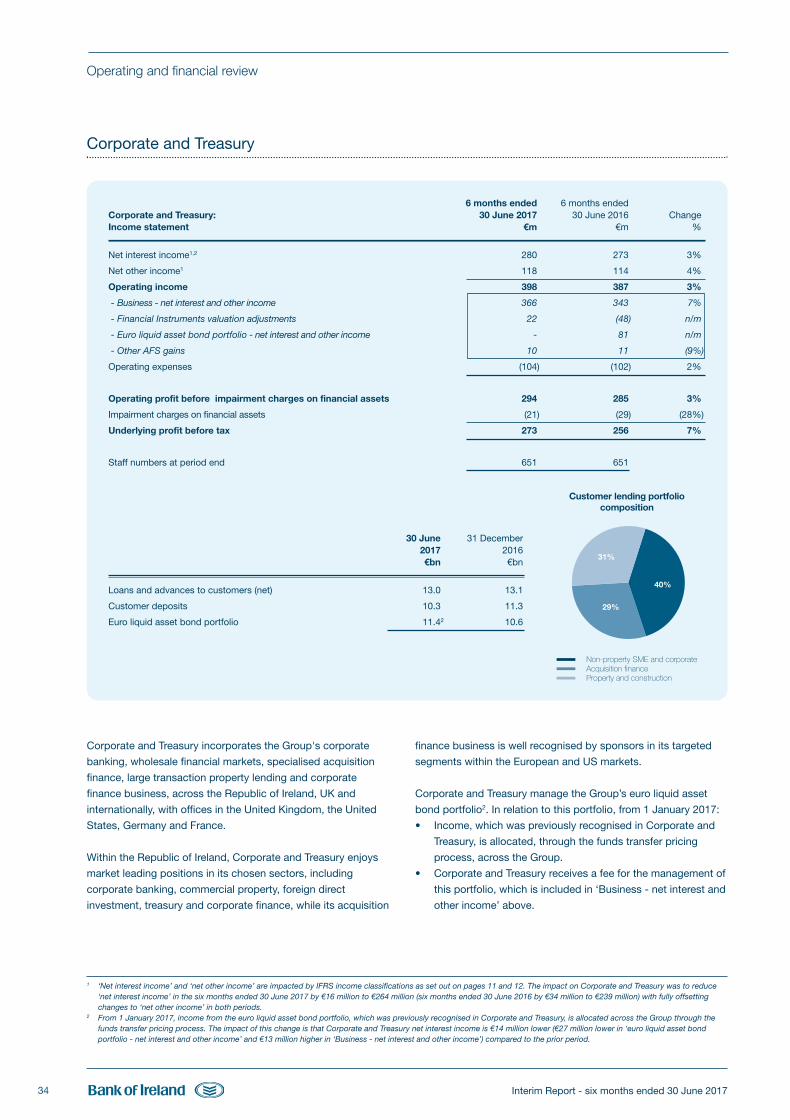
Interim Report - six months ended 30 June 201734
Corporate and Treasury
Operating and financial review
Customer lending portfolio composition
40%
31%
29%
Non-property SME and corporateAcquisition financeProperty and construction
6 months ended 6 months endedCorporate and Treasury: 30 June 2017 30 June 2016 ChangeIncome statement €m €m %
Net interest income1,2 280 273 3%
Net other income1 118 114 4%
Operating income 398 387 3%
- Business - net interest and other income 366 343 7%
- Financial Instruments valuation adjustments 22 (48) n/m
- Euro liquid asset bond portfolio - net interest and other income - 81 n/m
- Other AFS gains 10 11 (9%)
Operating expenses (104) (102) 2%
Operating profit before impairment charges on financial assets 294 285 3%
Impairment charges on financial assets (21) (29) (28%)
Underlying profit before tax 273 256 7%
Staff numbers at period end 651 651
30 June 31 December 2017 2016 €bn €bn
Loans and advances to customers (net) 13.0 13.1
Customer deposits 10.3 11.3
Euro liquid asset bond portfolio 11.42 10.6
Corporate and Treasury incorporates the Group's corporate
banking, wholesale financial markets, specialised acquisition
finance, large transaction property lending and corporate
finance business, across the Republic of Ireland, UK and
internationally, with offices in the United Kingdom, the United
States, Germany and France.
Within the Republic of Ireland, Corporate and Treasury enjoys
market leading positions in its chosen sectors, including
corporate banking, commercial property, foreign direct
investment, treasury and corporate finance, while its acquisition
finance business is well recognised by sponsors in its targeted
segments within the European and US markets.
Corporate and Treasury manage the Group’s euro liquid asset
bond portfolio2. In relation to this portfolio, from 1 January 2017:
• Income, which was previously recognised in Corporate and
Treasury, is allocated, through the funds transfer pricing
process, across the Group.
• Corporate and Treasury receives a fee for the management of
this portfolio, which is included in ‘Business - net interest and
other income’ above.
1 ‘Net interest income’ and ‘net other income’ are impacted by IFRS income classifications as set out on pages 11 and 12. The impact on Corporate and Treasury was to reduce‘net interest income’ in the six months ended 30 June 2017 by €16 million to €264 million (six months ended 30 June 2016 by €34 million to €239 million) with fully offsettingchanges to ‘net other income’ in both periods.
2 From 1 January 2017, income from the euro liquid asset bond portfolio, which was previously recognised in Corporate and Treasury, is allocated across the Group through thefunds transfer pricing process. The impact of this change is that Corporate and Treasury net interest income is €14 million lower (€27 million lower in ‘euro liquid asset bondportfolio - net interest and other income’ and €13 million higher in ‘Business - net interest and other income’) compared to the prior period.
BOI Interim Report 2017 FRONT.qxp_Layout 1 27/07/2017 20:29 Page 34
35
Operating and financial review
Corporate and Treasury (continued)
Interim Report - six months ended 30 June 2017
Corporate Banking
• Continuing strong new business.
• Retained position as Ireland’s number one corporate bank
and continued to win in excess of 60% of banking
relationships arising from new foreign direct investment in
Ireland.
• Supporting the ongoing recovery in the Irish economy while
selectively growing our UK corporate business through a
focused sector strategy.
• Corporate Banking won four awards in the Finance Dublin
Deals of the year awards in May 2017 (‘M&A Deal of the
year’, ‘Loans and Financing – Public Bodies’, ‘Loans and
Financing - Large Corporate’, and ‘Debt Capital Markets -
Refinancing’).
Global Markets
• Supporting Bank of Ireland Group and customers in
evaluating and managing foreign exchange, interest rate
hedging and other treasury needs, against the backdrop of
uncertain market conditions.
• Continued investment in enhancing customers’ experience
and improving communications. There has also been
increased customer adoption and usage of Bank of Ireland
FXPay, our online foreign exchange payments platform.
• Global Markets saw strong customer activity across
treasury product lines for the six month ended 30 June
2017. This was underpinned by growth in the underlying
Irish and UK economies and in international trade.
Financial performance
The division reported an underlying profit before tax of €273
million for the six months ended 30 June 2017 an increase of €17
million or 7% compared to the same period of 2016.
Business - net interest and other income is €23 million higher
than the prior period at €366 million primarily due to:
• Lower funding costs, and
• The impact of the change in treatment of the euro liquid asset
bond portfolio.
Financial instruments valuation adjustments and other is €70
million higher than the prior period at €22 million primarily due to
negative fair value movements in the prior period on derivatives
which economically hedged the Group (which largely eliminated
on consolidation).
Euro liquid asset bond portfolio - net interest and other
income, from 1 January 2017, is allocated across the Group
through funds transfer pricing. Net funds transfer pricing costs
and the management fee received to manage this portfolio are
reflected in Business - net interest and other income.
Operating expenses of €104 million for the six months 30 June
2017 increased by 2%, primarily as a result of investment in
infrastructure and technology and increased staff costs arising
from Group-wide salary increases.
Impairment charges on financial assets (including available
for sale financial assets) of €21 million for the six months ended
30 June 2017 have decreased by €8 million or 28% compared to
€29 million the same period in 2016. Impairment charges on
available for sale (AFS) financial assets are €nil for the six months
ended 30 June 2017 compared to a charge of €2 million in the
same period in 2016. Further analysis and commentary on
changes in the loan portfolios asset quality and impairment is set
out in the asset quality and impairment section on pages 41 to 51
and the supplementary asset quality and forbearance disclosures
section on pages 99 to 123.
Loans and advances to customers (after impairment
provisions) of €13.0 billion at 30 June 2017 were higher than 31
December 2016 by €0.1 billion, on a constant currency basis. The
movement is primarily reflective of net new lending in our core
books and the continued deleveraging of non-core loan books.
Customer deposits of €10.3 billion at 30 June 2017 have
decreased by €1.0 billion since 31 December 2016 due to
optimisation of deposit pricing. The deposit book primarily
comprises a mixture of corporate, State, SME and retail customer
accounts.
The euro liquid asset bond portfolio of €11.4 billion at 30 June
2017 was €0.8 billion higher than at 31 December 2016 due to
increased holdings of sovereign bonds (€0.9 billion),
supranational bonds (€0.4 billion), senior financial bonds (€0.1
billion) which were partially offset by lower holdings of covered
bonds (€0.2 billion) and repayments of €0.4 billion on NAMA
senior bonds.
BOI Interim Report 2017 FRONT.qxp_Layout 1 27/07/2017 20:29 Page 35
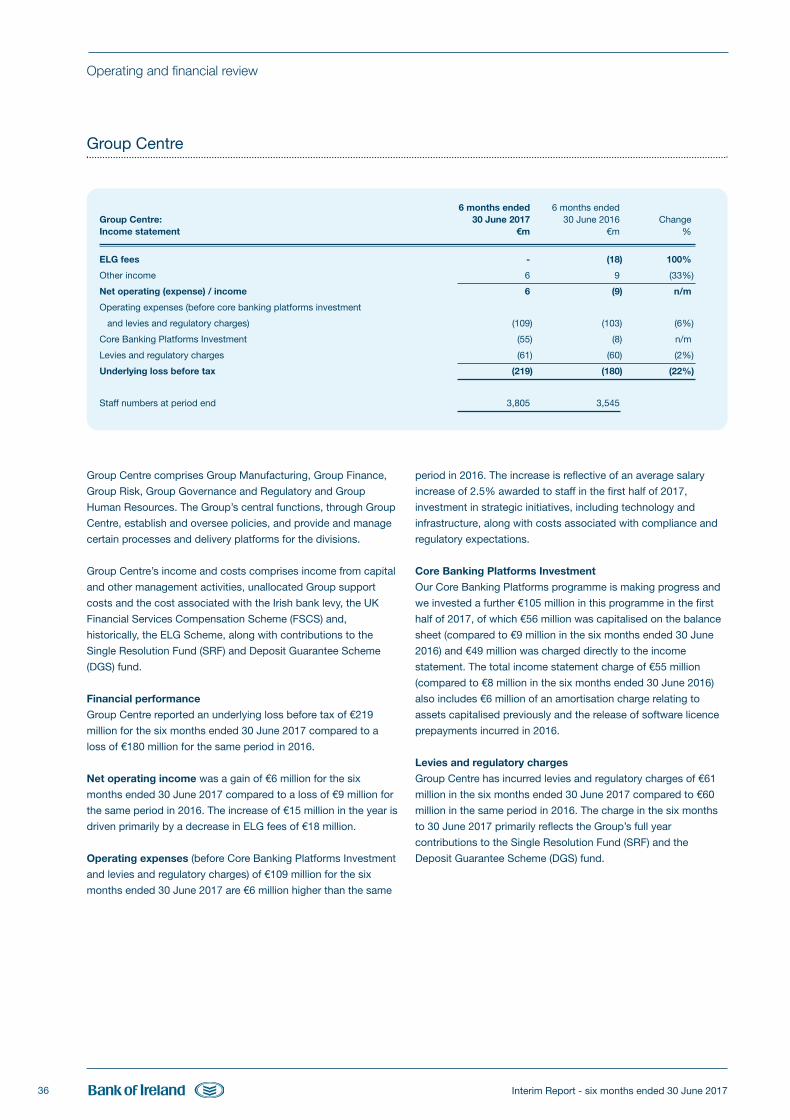
Interim Report - six months ended 30 June 201736
Group Centre
Operating and financial review
Group Centre comprises Group Manufacturing, Group Finance,
Group Risk, Group Governance and Regulatory and Group
Human Resources. The Group’s central functions, through Group
Centre, establish and oversee policies, and provide and manage
certain processes and delivery platforms for the divisions.
Group Centre’s income and costs comprises income from capital
and other management activities, unallocated Group support
costs and the cost associated with the Irish bank levy, the UK
Financial Services Compensation Scheme (FSCS) and,
historically, the ELG Scheme, along with contributions to the
Single Resolution Fund (SRF) and Deposit Guarantee Scheme
(DGS) fund.
Financial performance
Group Centre reported an underlying loss before tax of €219
million for the six months ended 30 June 2017 compared to a
loss of €180 million for the same period in 2016.
Net operating income was a gain of €6 million for the six
months ended 30 June 2017 compared to a loss of €9 million for
the same period in 2016. The increase of €15 million in the year is
driven primarily by a decrease in ELG fees of €18 million.
Operating expenses (before Core Banking Platforms Investment
and levies and regulatory charges) of €109 million for the six
months ended 30 June 2017 are €6 million higher than the same
period in 2016. The increase is reflective of an average salary
increase of 2.5% awarded to staff in the first half of 2017,
investment in strategic initiatives, including technology and
infrastructure, along with costs associated with compliance and
regulatory expectations.
Core Banking Platforms Investment
Our Core Banking Platforms programme is making progress and
we invested a further €105 million in this programme in the first
half of 2017, of which €56 million was capitalised on the balance
sheet (compared to €9 million in the six months ended 30 June
2016) and €49 million was charged directly to the income
statement. The total income statement charge of €55 million
(compared to €8 million in the six months ended 30 June 2016)
also includes €6 million of an amortisation charge relating to
assets capitalised previously and the release of software licence
prepayments incurred in 2016.
Levies and regulatory charges
Group Centre has incurred levies and regulatory charges of €61
million in the six months ended 30 June 2017 compared to €60
million in the same period in 2016. The charge in the six months
to 30 June 2017 primarily reflects the Group’s full year
contributions to the Single Resolution Fund (SRF) and the
Deposit Guarantee Scheme (DGS) fund.
6 months ended 6 months endedGroup Centre: 30 June 2017 30 June 2016 ChangeIncome statement €m €m %
ELG fees - (18) 100%
Other income 6 9 (33%)
Net operating (expense) / income 6 (9) n/m
Operating expenses (before core banking platforms investment
and levies and regulatory charges) (109) (103) (6%)
Core Banking Platforms Investment (55) (8) n/m
Levies and regulatory charges (61) (60) (2%)
Underlying loss before tax (219) (180) (22%)
Staff numbers at period end 3,805 3,545
BOI Interim Report 2017 FRONT.qxp_Layout 1 27/07/2017 20:29 Page 36

THIS PAGE HAS INTENTIONALLY BEEN LEFT BLANK
BOI Interim Report 2017 FRONT.qxp_Layout 1 27/07/2017 20:29 Page 37
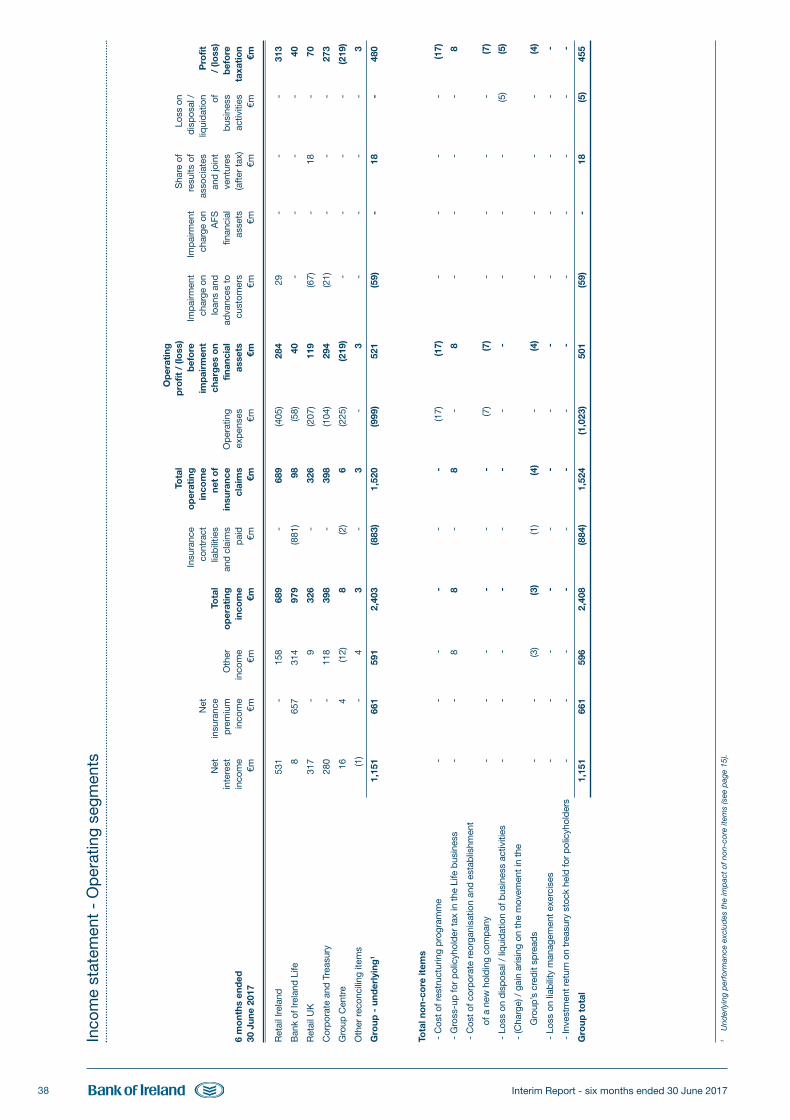
Interim Report - six months ended 30 June 201738
Inco
me
stat
emen
t -
Op
erat
ing
segm
ents
Op
erat
ing
Tota
lp
rofit
/ (l
oss
)S
hare
of
Loss
on
Insu
ranc
eo
per
atin
gb
efo
reIm
pai
rmen
tIm
pai
rmen
t re
sults
of
dis
pos
al /
Net
cont
ract
inco
me
imp
airm
ent
char
ge o
nch
arge
on
asso
ciat
es
liqui
dat
ion
Pro
fitN
etin
sura
nce
Tota
llia
bili
ties
net
of
char
ges
on
loan
s an
d
AFS
and
join
t of
/ (lo
ss)
inte
rest
p
rem
ium
O
ther
o
per
atin
gan
d c
laim
sin
sura
nce
Op
erat
ing
finan
cial
adva
nces
tofin
anci
alve
ntur
es
bus
ines
sb
efo
re6
mo
nths
end
edin
com
e in
com
e in
com
e in
com
e p
aid
clai
ms
exp
ense
sas
sets
cust
omer
sas
sets
(aft
er ta
x)
activ
ities
taxa
tio
n30
Jun
e 20
17
€m
€m
€m
€m€m
€m€m
€m€m
€m€m
€m€m
Ret
ail I
rela
nd53
1-
158
689
-68
9(4
05)
284
29-
--
313
Ban
k of
Irel
and
Life
865
731
497
9(8
81)
98(5
8)40
--
--
40
Ret
ail U
K31
7-
932
6-
326
(207
)11
9(6
7)-
18-
70
Cor
por
ate
and
Tre
asur
y28
0-
118
398
-39
8(1
04)
294
(21)
--
-27
3
Gro
up C
entr
e16
4(1
2)8
(2)
6(2
25)
(219
)-
--
-(2
19)
Oth
er r
econ
cilin
g ite
ms
(1)
-4
3-
3-
3-
--
-3
Gro
up -
und
erly
ing
11,
151
661
591
2,40
3(8
83)
1,52
0(9
99)
521
(59)
-18
-48
0
Tota
l no
n-co
re it
ems
- C
ost o
f res
truc
turin
g p
rogr
amm
e-
--
--
-(1
7)(1
7)-
--
-(1
7)
- G
ross
-up
for
pol
icyh
old
er ta
x in
the
Life
bus
ines
s-
-8
8-
8-
8-
--
-8
- C
ost o
f cor
por
ate
reor
gani
satio
n an
d e
stab
lishm
ent
of a
new
hol
din
g co
mp
any
--
--
--
(7)
(7)
--
--
(7)
- Lo
ss o
n d
isp
osal
/ li
qui
dat
ion
of b
usin
ess
activ
ities
--
--
--
--
--
-(5
)(5
)
- (C
harg
e) /
gai
n ar
isin
g on
the
mov
emen
t in
the
Gro
up’s
cre
dit
spre
ads
--
(3)
(3)
(1)
(4)
-(4
)-
--
-(4
)
- Lo
ss o
n lia
bili
ty m
anag
emen
t exe
rcis
es-
--
--
--
--
--
--
- In
vest
men
t ret
urn
on tr
easu
ry s
tock
hel
d fo
r po
licyh
olde
rs-
--
--
--
--
--
--
Gro
up t
ota
l 1,
151
661
596
2,40
8(8
84)
1,52
4(1
,023
)50
1(5
9)-
18(5
)45
5
1U
nder
lyin
g p
erfo
rman
ce e
xclu
des
the
imp
act
of n
on-c
ore
item
s (s
ee p
age
15).
BOI Interim Report 2017 FRONT.qxp_Layout 1 27/07/2017 20:29 Page 38
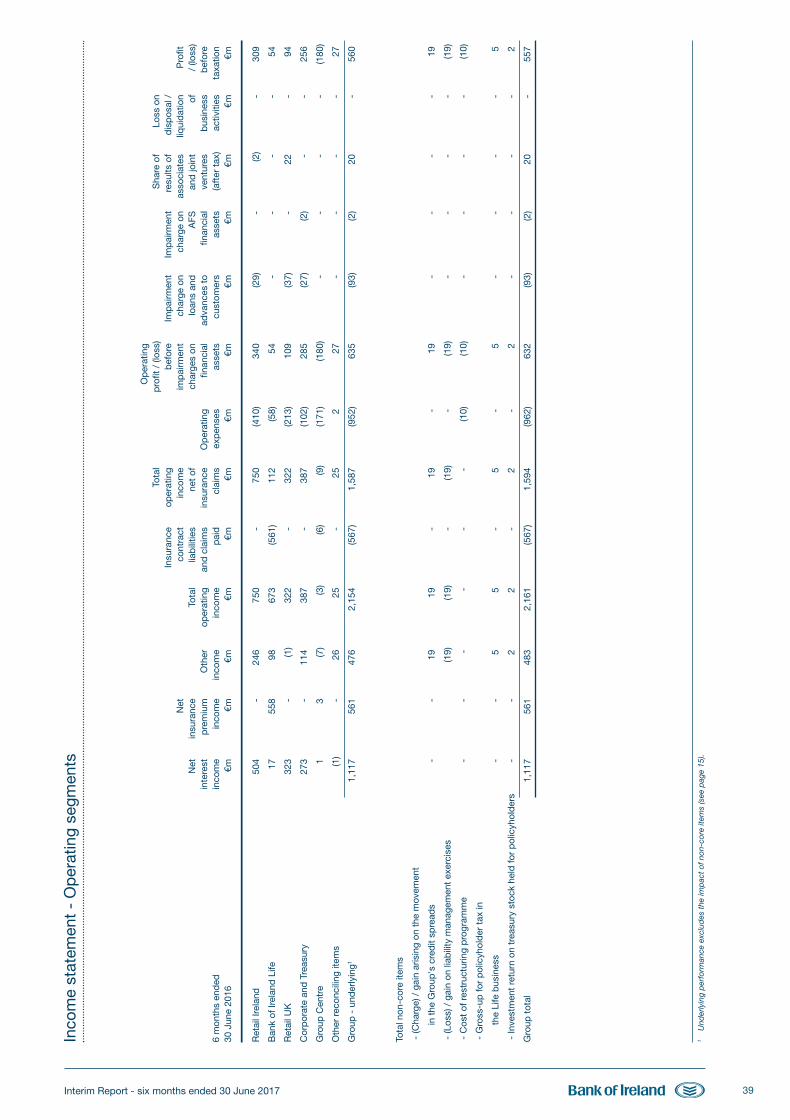
Interim Report - six months ended 30 June 2017 39
Inco
me
stat
emen
t -
Op
erat
ing
segm
ents
Op
erat
ing
Tota
lp
rofit
/ (l
oss)
Sha
re o
fLo
ss o
nIn
sura
nce
oper
atin
gb
efor
eIm
pai
rmen
tIm
pai
rmen
t re
sults
of
dis
pos
al /
Net
cont
ract
inco
me
imp
airm
ent
char
ge o
nch
arge
on
asso
ciat
es
liqui
dat
ion
Pro
fitN
etin
sura
nce
Tota
llia
bili
ties
net
of
char
ges
onlo
ans
and
A
FSan
d jo
int
of/
(loss
)in
tere
st
pre
miu
m
Oth
er
oper
atin
g an
d c
laim
sin
sura
nce
Op
erat
ing
finan
cial
ad
vanc
es t
ofin
anci
alve
ntur
es
bus
ines
sb
efor
e6
mon
ths
end
edin
com
e in
com
e in
com
e in
com
e p
aid
clai
ms
exp
ense
sas
sets
cust
omer
sas
sets
(aft
er t
ax)
activ
ities
taxa
tion
30 J
une
2016
€m
€m
€m
€m
€m€m
€m€m
€m€m
€m€m
€m
Ret
ail I
rela
nd50
4-
246
750
-75
0(4
10)
340
(29)
-(2
)-
309
Ban
k of
Irel
and
Life
1755
898
673
(561
)11
2(5
8)54
--
--
54
Ret
ail U
K32
3-
(1)
322
-32
2(2
13)
109
(37)
-22
-94
Cor
por
ate
and
Tre
asur
y27
3-
114
387
-38
7(1
02)
285
(27)
(2)
--
256
Gro
up C
entr
e1
3(7
)(3
)(6
)(9
)(1
71)
(180
)-
--
-(1
80)
Oth
er r
econ
cilin
g ite
ms
(1)
-26
25-
252
27-
--
-27
Gro
up -
und
erly
ing1
1,11
756
147
62,
154
(567
)1,
587
(952
)63
5(9
3)(2
)20
-56
0
Tota
l non
-cor
e ite
ms
- (C
harg
e) /
gai
n ar
isin
g on
the
mov
emen
t
in t
he G
roup
's c
red
it sp
read
s-
-19
19-
19-
19-
--
-19
- (L
oss)
/ g
ain
on li
abili
ty m
anag
emen
t ex
erci
ses
(19)
(19)
-(1
9)-
(19)
--
--
(19)
- C
ost
of r
estr
uctu
ring
pro
gram
me
--
--
--
(10)
(10)
--
--
(10)
- G
ross
-up
for
pol
icyh
old
er t
ax in
the
Life
bus
ines
s -
-5
5-
5-
5-
--
-5
- In
vest
men
t re
turn
on
trea
sury
sto
ck h
eld
for
pol
icyh
old
ers
--
22
-2
-2
--
--
2
Gro
up t
otal
1,
117
561
483
2,16
1(5
67)
1,59
4(9
62)
632
(93)
(2)
20-
557
1U
nder
lyin
g p
erfo
rman
ce e
xclu
des
the
imp
act
of n
on-c
ore
item
s (s
ee p
age
15).
BOI Interim Report 2017 FRONT.qxp_Layout 1 27/07/2017 20:29 Page 39
Interim Report - six months ended 30 June 201740
Operating and financial review
Principal risks and uncertainties facing the Group for the
remaining six months of 2017 are listed below. This summary
should not be regarded as a complete and comprehensive
statement of all potential risks / uncertainties. Other factors not
yet identified, or not currently material, may adversely affect the
Group.
Business and strategic risk is the risk arising from changes in
external factors (such as the macroeconomic environment,
customer behaviour and competitive landscape) that impact the
demand for and / or profitability of our products and services and
/ or our future strategy. This risk also includes the risk that the
Group does not make appropriate strategic decisions or that
strategic decisions do not have the intended effect. It also
includes Brexit risks since as well as implications for trade and for
both the UK and Irish economies, there are potentially negative
consequences for the Group’s customers as well as for the
Group’s operations in terms of currency fluctuations, legal and
regulatory changes and people impacts.
Conduct risk is the risk that the Group and / or its staff conducts
business in an inappropriate or negligent manner that leads to
adverse customer outcomes. Examples of conduct risk include
staff misconduct whether through corruption or negligence, risk
of customer detriment due to improper / inappropriate advice and
the risk of misalignment of market performance expectations.
Credit risk is the risk of loss resulting from a counterparty being
unable to meet its contractual obligations to the Group in respect
of loans or other financial transactions.
Funding and liquidity risk may arise from a sudden and
significant withdrawal of customer deposits, disruption to the
access of funding from wholesale markets, or a deterioration in
either the Group’s or the Irish sovereign credit ratings which could
adversely impact the Group’s funding and liquidity position.
Life insurance risk is the result of unexpected variation in the
amount and timing of claims associated with insurance benefits.
This variation, arising from changing customer life expectancy,
health or behaviour characteristics, may be short or long term in
nature.
Market risk is the risk of loss arising from movements in interest
rates, foreign exchange rates or other market prices. Market risk
arises from the structure of the balance sheet, the Group’s
business mix and discretionary risk-taking.
Operational risks which may result in financial loss, disruption of
services to customers, and damage to our reputation, include the
availability, resilience and security of our core IT systems and the
potential for failings in our customer processes. This risk also
includes transformation risk recognizing the current important
stage of the Group’s multi-year investment programme to replace
our core banking platforms. It also includes the risk of
cybersecurity attacks which target financial institutions and
corporates as well as governments and other institutions. The risk
of these attacks remains material as their frequency,
sophistication and severity continue to develop in an increasingly
digital world.
Pension risk is the risk in the Group’s defined benefit pension
schemes that the assets are inadequate or fail to generate returns
that are sufficient to meet the schemes’ liabilities. This risk
crystallises for the sponsor when a deficit emerges of a size
which implies a material probability that the liabilities will not be
met. The defined benefit pension schemes are subject to market
fluctuations and these movements impact the Group’s capital
position.
People risks include the continuing impact of remuneration
restrictions on the Group in a recovering labour market, which
may be further exacerbated post Brexit with increasing
competition for skilled resources and / or restricted mobility
between jurisdictions. It also includes people management,
recruitment and retention risks in relation to the Group’s
transformation and digitalisation of banking products and
services, as the Group adapts to the changing needs and
preferences of our customer base.
Regulatory risk is the risk that the Group fails to meet new or
existing regulatory and / or legislative requirements which may
lead to financial losses and / or reputational damage risk.
Reputation risk is the risk to earnings or franchise value arising
from an adverse perception of the Group’s image on the part of
customers, suppliers, counterparties, shareholders, investors,
staff, legislators, regulators or partners.
The Group also faces other significant and emerging risks:
Capital adequacy risk; Macroeconomic conditions; Geopolitical
uncertainty; Resolution risk; Tax rates, legislation and practice;
Risk in relation to Irish Government shareholding; Litigation and
regulatory proceedings; and the Impact of accounting standards
such as IFRS 9.
Further detail on risks facing the Group, including key mitigating
considerations, may be found in the principal risks and
uncertainties section on pages 63 to 71 of the Group’s Annual
Report for the year ended 31 December 2016.
Principal risks and uncertainties
BOI Interim Report 2017 FRONT.qxp_Layout 1 27/07/2017 20:29 Page 40
Interim Report - six months ended 30 June 2017 41
Operating and financial review
Asset quality and impairment
Asset quality - loans and advances to customers
The information below including referenced footnotes forms an integral part of the interim financial statements as described in the
Basis of preparation on page 61.
The Group has revised its asset quality reporting methodology to
align with EBA guidance on non-performing and forborne
classifications1.
The Group now reports ‘non-performing exposures’ and
‘impaired’ loans replacing the previous classification of ‘non-
performing’ loans which comprised ‘probationary residential
mortgages’ and ‘defaulted’ loans.
Previously the Group did not apply a set time period after which
the forborne classification on a performing loan was
discontinued. Exit criteria are now applied in line with EBA
guidance.
All exposures that are subject to forbearance and have a specific
provision are reported as both forborne and impaired whereas
previously in the non-mortgage portfolios where an exposure
carried a specific provision it was reported as ‘impaired’ and not
reported as ‘forborne’.
The Group’s definition of impaired loans has been modified to
remove non-mortgage loans that are greater than 90 days in
arrears but where a specific provision is not required, instead
these loans are now classified as ‘greater than 90 days in arrears
and not impaired’.
The Group classifies forborne and non-forborne loans and
advances to customers as ‘neither past due nor impaired’, ‘past
due but not impaired’ and ‘impaired’ in line with the requirements
of IFRS 7.
Forbearance occurs when a borrower is granted an amendment
to contractual repayment terms (forbearance measure), for
reasons relating to the actual or apparent financial stress or
distress of that borrower. An exposure continues to be classified
as forborne until such time as it satisfies conditions to exit
forbearance in line with EBA guidance. Loans that have never
been forborne or loans that no longer require to be reported as
‘forborne’ are classified as ‘non-forborne loans’.
The Group applies internal ratings to both forborne and non-
forborne loans based on an assessment of the credit quality of
the customer, as part of its credit risk management system. A
thirteen point credit grade rating scale is used for more complex,
individually managed loans, including wholesale, corporate and
business lending. A seven point credit grade rating scale is used
for standard products (including mortgages, personal and small
business loans).
‘Neither past due nor impaired’ ratings are summarised as
set out below:
Mappings to external rating agencies are indicative only, as
additional factors such as collateral will be taken into account by
the Group in assigning a credit grade to a counterparty:
• High quality ratings apply to loans to customers, strong
corporate and business counterparties and consumer
banking borrowers (including Residential mortgages) with
whom the Group has an excellent repayment experience.
High quality ratings are derived from grades 1 to 4 on the
thirteen point grade scale, grades 1 and 2 on the seven point
grade scale. These ratings are broadly aligned to AAA, AA+,
AA, AA-, A+, A, A-, BBB+ and BBB for the external major
rating agencies.
• Satisfactory quality ratings apply to good quality loans that
are performing as expected, including loans to small and
medium sized enterprises, leveraged entities and more
recently established businesses. Satisfactory quality ratings
also include some element of the Group’s retail portfolios. For
both forborne and non-forborne loans, satisfactory quality
ratings are derived from grades 5 to 7 on the thirteen point
grade scale and grade 3 on the seven point grade scale.
These ratings are broadly equivalent to BBB-, BB+, BB and
BB-. In addition, satisfactory quality ratings apply to certain
mortgage forbearance arrangements where the customer is
making full interest and capital repayments.
• Acceptable quality ratings apply to loans to customers with
increased risk profiles that are subject to closer monitoring
and scrutiny by lenders with the objective of managing risk
and moving accounts to an improved rating category. For
both forborne and non-forborne loans, Acceptable quality
ratings are derived from grades 8 and 9 on the thirteen point
grade scale and grade 4 within the seven point scale. These
ratings are broadly equivalent to external ratings of B+. In
addition, acceptable quality ratings apply to certain mortgage
forbearance arrangements where the customer is making at
least full interest payments.
• Lower quality ratings apply to those loans that are neither in
arrears nor impaired where the Group requires a work down
or work out of the relationship unless an early reduction in
risk is achievable. For both forborne and non-forborne loans,
lower quality ratings are derived from outstandings within
rating grades 10 and 11 on the thirteen point grade scale,
grade 5 on the seven point grade scale and external ratings
equivalent to B or below. In addition, lower quality ratings
apply to certain mortgage forbearance arrangements where
the customer is making less than full interest payments.
1 In particular the EBA’s ‘Implementing Technical Standards on supervisory reporting on forbearance and non-performing exposures.
BOI Interim Report 2017 FRONT.qxp_Layout 1 27/07/2017 20:29 Page 41
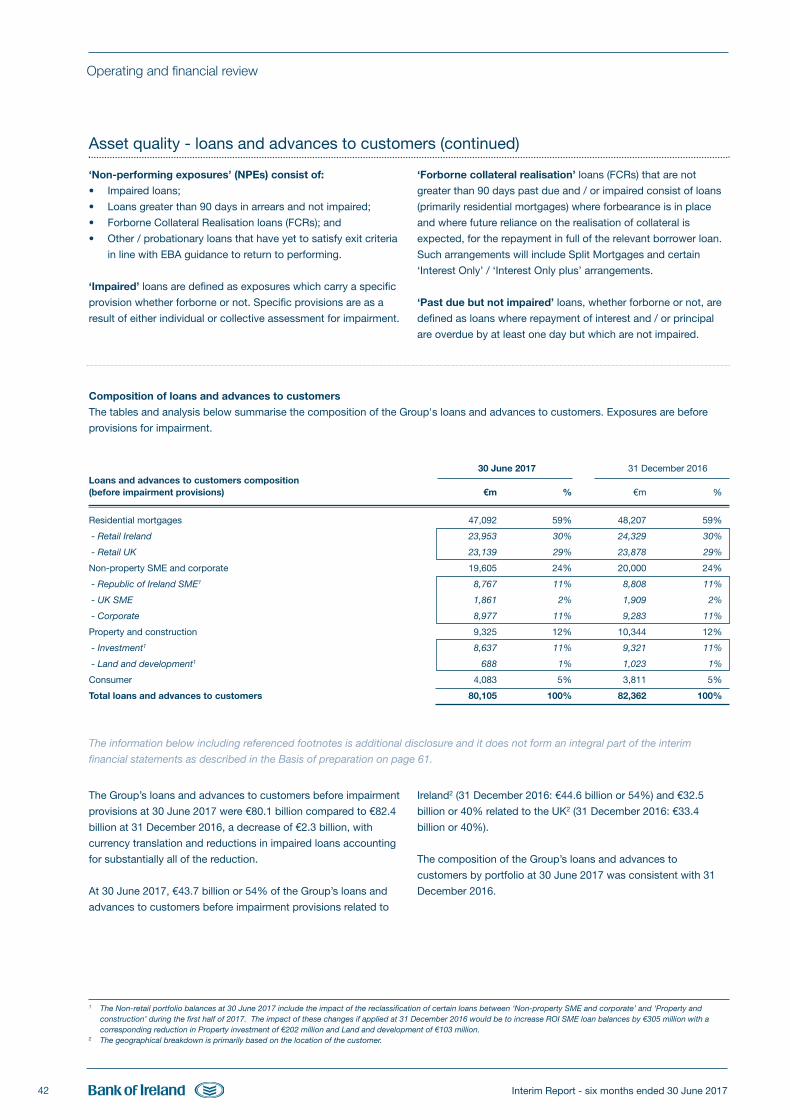
Interim Report - six months ended 30 June 201742
Operating and financial review
Asset quality - loans and advances to customers (continued)
Composition of loans and advances to customers
The tables and analysis below summarise the composition of the Group's loans and advances to customers. Exposures are before
provisions for impairment.
30 June 2017 31 December 2016Loans and advances to customers composition (before impairment provisions) €m % €m %
Residential mortgages 47,092 59% 48,207 59%
- Retail Ireland 23,953 30% 24,329 30%
- Retail UK 23,139 29% 23,878 29%
Non-property SME and corporate 19,605 24% 20,000 24%
- Republic of Ireland SME1 8,767 11% 8,808 11%
- UK SME 1,861 2% 1,909 2%
- Corporate 8,977 11% 9,283 11%
Property and construction 9,325 12% 10,344 12%
- Investment1 8,637 11% 9,321 11%
- Land and development1 688 1% 1,023 1%
Consumer 4,083 5% 3,811 5%
Total loans and advances to customers 80,105 100% 82,362 100%
The information below including referenced footnotes is additional disclosure and it does not form an integral part of the interim
financial statements as described in the Basis of preparation on page 61.
The Group’s loans and advances to customers before impairment
provisions at 30 June 2017 were €80.1 billion compared to €82.4
billion at 31 December 2016, a decrease of €2.3 billion, with
currency translation and reductions in impaired loans accounting
for substantially all of the reduction.
At 30 June 2017, €43.7 billion or 54% of the Group’s loans and
advances to customers before impairment provisions related to
Ireland2 (31 December 2016: €44.6 billion or 54%) and €32.5
billion or 40% related to the UK2 (31 December 2016: €33.4
billion or 40%).
The composition of the Group’s loans and advances to
customers by portfolio at 30 June 2017 was consistent with 31
December 2016.
1 The Non-retail portfolio balances at 30 June 2017 include the impact of the reclassification of certain loans between ‘Non-property SME and corporate’ and ‘Property andconstruction’ during the first half of 2017. The impact of these changes if applied at 31 December 2016 would be to increase ROI SME loan balances by €305 million with acorresponding reduction in Property investment of €202 million and Land and development of €103 million.
2 The geographical breakdown is primarily based on the location of the customer.
‘Non-performing exposures’ (NPEs) consist of:
• Impaired loans;
• Loans greater than 90 days in arrears and not impaired;
• Forborne Collateral Realisation loans (FCRs); and
• Other / probationary loans that have yet to satisfy exit criteria
in line with EBA guidance to return to performing.
‘Impaired’ loans are defined as exposures which carry a specific
provision whether forborne or not. Specific provisions are as a
result of either individual or collective assessment for impairment.
‘Forborne collateral realisation’ loans (FCRs) that are not
greater than 90 days past due and / or impaired consist of loans
(primarily residential mortgages) where forbearance is in place
and where future reliance on the realisation of collateral is
expected, for the repayment in full of the relevant borrower loan.
Such arrangements will include Split Mortgages and certain
‘Interest Only’ / ‘Interest Only plus’ arrangements.
‘Past due but not impaired’ loans, whether forborne or not, are
defined as loans where repayment of interest and / or principal
are overdue by at least one day but which are not impaired.
BOI Interim Report 2017 FRONT.qxp_Layout 1 27/07/2017 20:29 Page 42
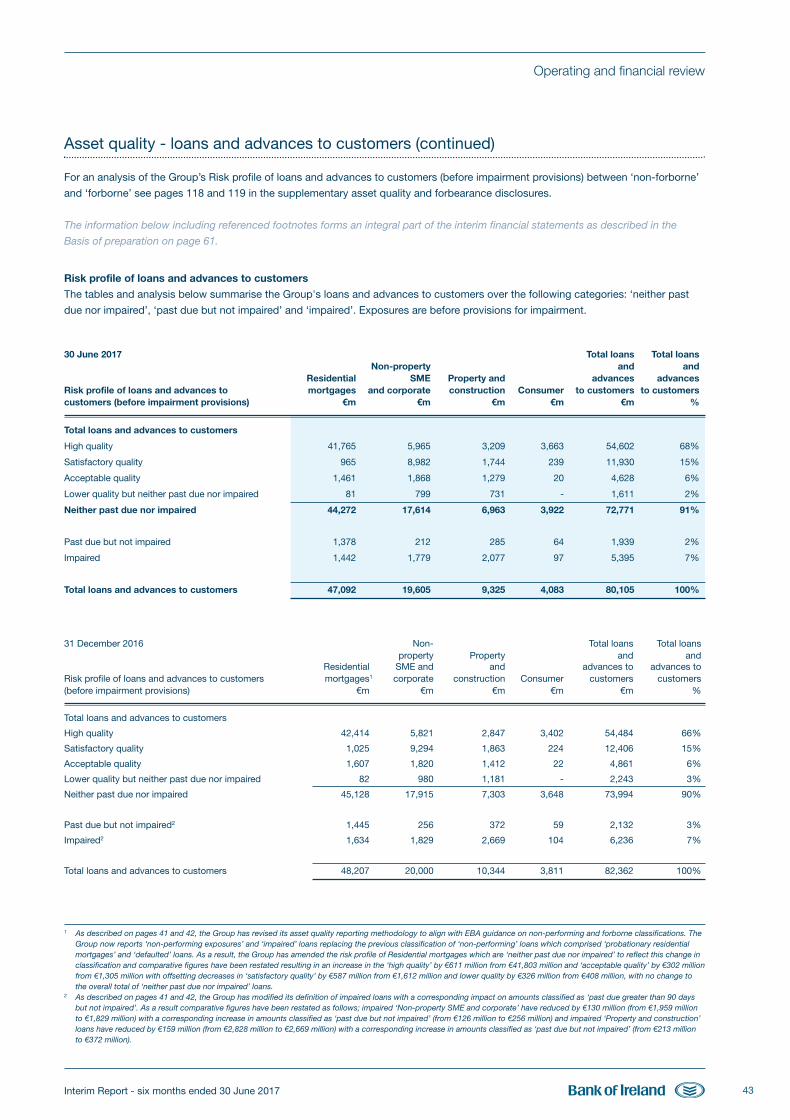
Interim Report - six months ended 30 June 2017 43
Operating and financial review
Asset quality - loans and advances to customers (continued)
For an analysis of the Group’s Risk profile of loans and advances to customers (before impairment provisions) between ‘non-forborne’
and ‘forborne’ see pages 118 and 119 in the supplementary asset quality and forbearance disclosures.
The information below including referenced footnotes forms an integral part of the interim financial statements as described in the
Basis of preparation on page 61.
Risk profile of loans and advances to customers
The tables and analysis below summarise the Group's loans and advances to customers over the following categories: ‘neither past
due nor impaired’, ‘past due but not impaired’ and ‘impaired’. Exposures are before provisions for impairment.
30 June 2017 Total loans Total loans Non-property and and
Residential SME Property and advances advancesRisk profile of loans and advances to mortgages and corporate construction Consumer to customers to customerscustomers (before impairment provisions) €m €m €m €m €m %
Total loans and advances to customers
High quality 41,765 5,965 3,209 3,663 54,602 68%
Satisfactory quality 965 8,982 1,744 239 11,930 15%
Acceptable quality 1,461 1,868 1,279 20 4,628 6%
Lower quality but neither past due nor impaired 81 799 731 - 1,611 2%
Neither past due nor impaired 44,272 17,614 6,963 3,922 72,771 91%
Past due but not impaired 1,378 212 285 64 1,939 2%
Impaired 1,442 1,779 2,077 97 5,395 7%
Total loans and advances to customers 47,092 19,605 9,325 4,083 80,105 100%
31 December 2016 Non- Total loans Total loans property Property and and
Residential SME and and advances to advances toRisk profile of loans and advances to customers mortgages1 corporate construction Consumer customers customers (before impairment provisions) €m €m €m €m €m %
Total loans and advances to customers
High quality 42,414 5,821 2,847 3,402 54,484 66%
Satisfactory quality 1,025 9,294 1,863 224 12,406 15%
Acceptable quality 1,607 1,820 1,412 22 4,861 6%
Lower quality but neither past due nor impaired 82 980 1,181 - 2,243 3%
Neither past due nor impaired 45,128 17,915 7,303 3,648 73,994 90%
Past due but not impaired2 1,445 256 372 59 2,132 3%
Impaired2 1,634 1,829 2,669 104 6,236 7%
Total loans and advances to customers 48,207 20,000 10,344 3,811 82,362 100%
1 As described on pages 41 and 42, the Group has revised its asset quality reporting methodology to align with EBA guidance on non-performing and forborne classifications. TheGroup now reports ‘non-performing exposures’ and ‘impaired’ loans replacing the previous classification of ‘non-performing’ loans which comprised ‘probationary residentialmortgages’ and ‘defaulted’ loans. As a result, the Group has amended the risk profile of Residential mortgages which are ‘neither past due nor impaired’ to reflect this change inclassification and comparative figures have been restated resulting in an increase in the ‘high quality’ by €611 million from €41,803 million and ‘acceptable quality’ by €302 millionfrom €1,305 million with offsetting decreases in ‘satisfactory quality’ by €587 million from €1,612 million and lower quality by €326 million from €408 million, with no change tothe overall total of ‘neither past due nor impaired’ loans.
2 As described on pages 41 and 42, the Group has modified its definition of impaired loans with a corresponding impact on amounts classified as ‘past due greater than 90 daysbut not impaired’. As a result comparative figures have been restated as follows; impaired ‘Non-property SME and corporate’ have reduced by €130 million (from €1,959 millionto €1,829 million) with a corresponding increase in amounts classified as ‘past due but not impaired’ (from €126 million to €256 million) and impaired ‘Property and construction’loans have reduced by €159 million (from €2,828 million to €2,669 million) with a corresponding increase in amounts classified as ‘past due but not impaired’ (from €213 millionto €372 million).
BOI Interim Report 2017 FRONT.qxp_Layout 1 27/07/2017 20:29 Page 43
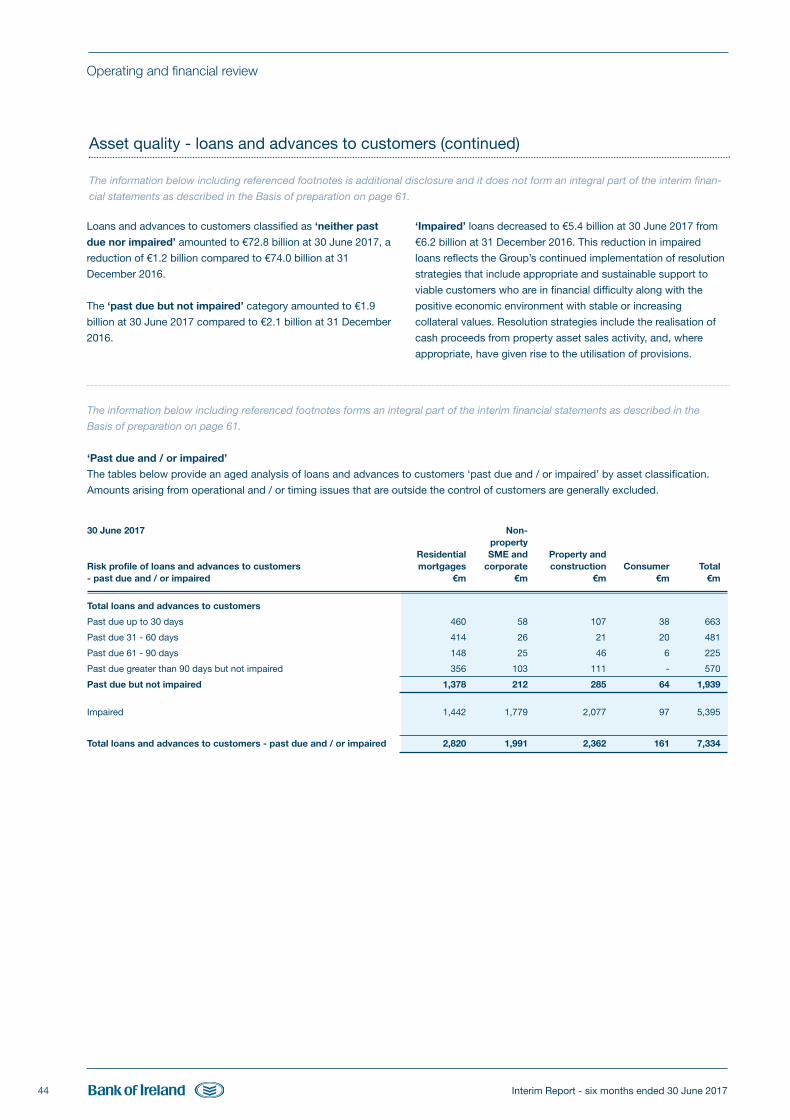
Interim Report - six months ended 30 June 201744
Operating and financial review
Asset quality - loans and advances to customers (continued)
Loans and advances to customers classified as ‘neither past
due nor impaired’ amounted to €72.8 billion at 30 June 2017, a
reduction of €1.2 billion compared to €74.0 billion at 31
December 2016.
The ‘past due but not impaired’ category amounted to €1.9
billion at 30 June 2017 compared to €2.1 billion at 31 December
2016.
‘Impaired’ loans decreased to €5.4 billion at 30 June 2017 from
€6.2 billion at 31 December 2016. This reduction in impaired
loans reflects the Group’s continued implementation of resolution
strategies that include appropriate and sustainable support to
viable customers who are in financial difficulty along with the
positive economic environment with stable or increasing
collateral values. Resolution strategies include the realisation of
cash proceeds from property asset sales activity, and, where
appropriate, have given rise to the utilisation of provisions.
The information below including referenced footnotes forms an integral part of the interim financial statements as described in the
Basis of preparation on page 61.
‘Past due and / or impaired’
The tables below provide an aged analysis of loans and advances to customers ‘past due and / or impaired’ by asset classification.
Amounts arising from operational and / or timing issues that are outside the control of customers are generally excluded.
30 June 2017 Non- property Residential SME and Property and
Risk profile of loans and advances to customers mortgages corporate construction Consumer Total- past due and / or impaired €m €m €m €m €m
Total loans and advances to customers
Past due up to 30 days 460 58 107 38 663
Past due 31 - 60 days 414 26 21 20 481
Past due 61 - 90 days 148 25 46 6 225
Past due greater than 90 days but not impaired 356 103 111 - 570
Past due but not impaired 1,378 212 285 64 1,939
Impaired 1,442 1,779 2,077 97 5,395
Total loans and advances to customers - past due and / or impaired 2,820 1,991 2,362 161 7,334
The information below including referenced footnotes is additional disclosure and it does not form an integral part of the interim finan-
cial statements as described in the Basis of preparation on page 61.
BOI Interim Report 2017 FRONT.qxp_Layout 1 27/07/2017 20:29 Page 44
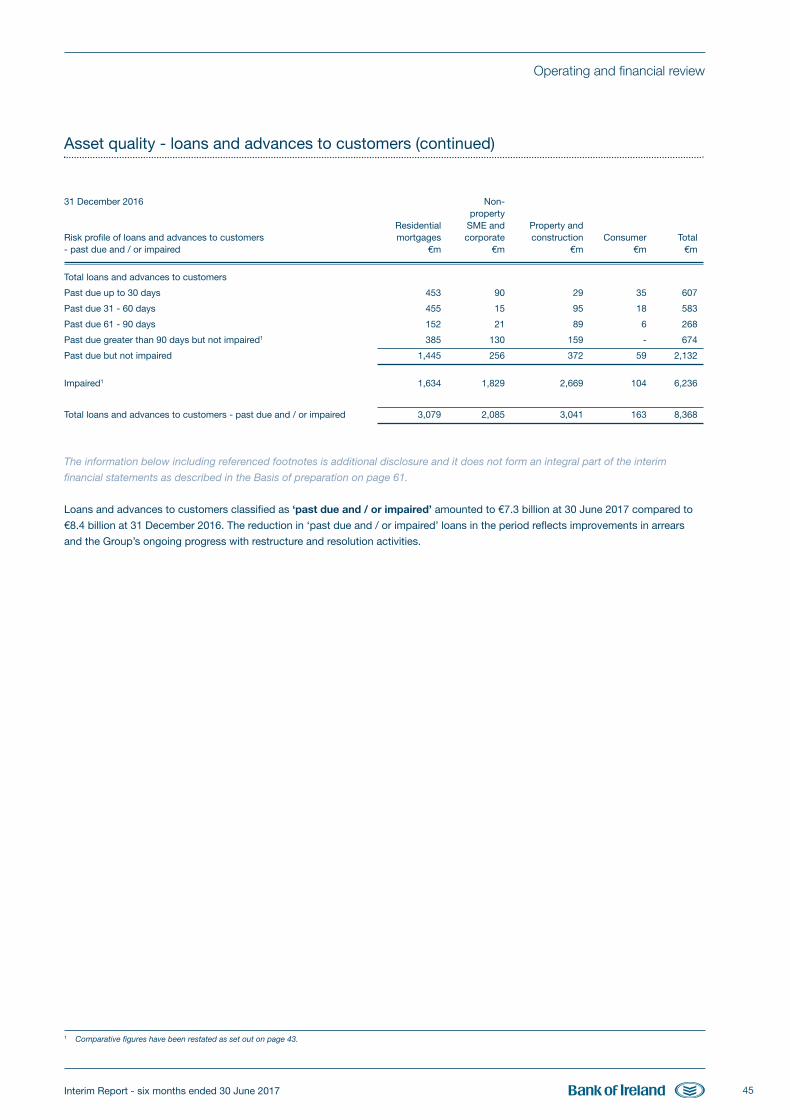
Interim Report - six months ended 30 June 2017 45
Operating and financial review
Asset quality - loans and advances to customers (continued)
31 December 2016 Non- property Residential SME and Property and
Risk profile of loans and advances to customers mortgages corporate construction Consumer Total- past due and / or impaired €m €m €m €m €m
Total loans and advances to customers
Past due up to 30 days 453 90 29 35 607
Past due 31 - 60 days 455 15 95 18 583
Past due 61 - 90 days 152 21 89 6 268
Past due greater than 90 days but not impaired1 385 130 159 - 674
Past due but not impaired 1,445 256 372 59 2,132
Impaired1 1,634 1,829 2,669 104 6,236
Total loans and advances to customers - past due and / or impaired 3,079 2,085 3,041 163 8,368
The information below including referenced footnotes is additional disclosure and it does not form an integral part of the interim
financial statements as described in the Basis of preparation on page 61.
Loans and advances to customers classified as ‘past due and / or impaired’ amounted to €7.3 billion at 30 June 2017 compared to
€8.4 billion at 31 December 2016. The reduction in ‘past due and / or impaired’ loans in the period reflects improvements in arrears
and the Group’s ongoing progress with restructure and resolution activities.
1 Comparative figures have been restated as set out on page 43.
BOI Interim Report 2017 FRONT.qxp_Layout 1 27/07/2017 20:29 Page 45
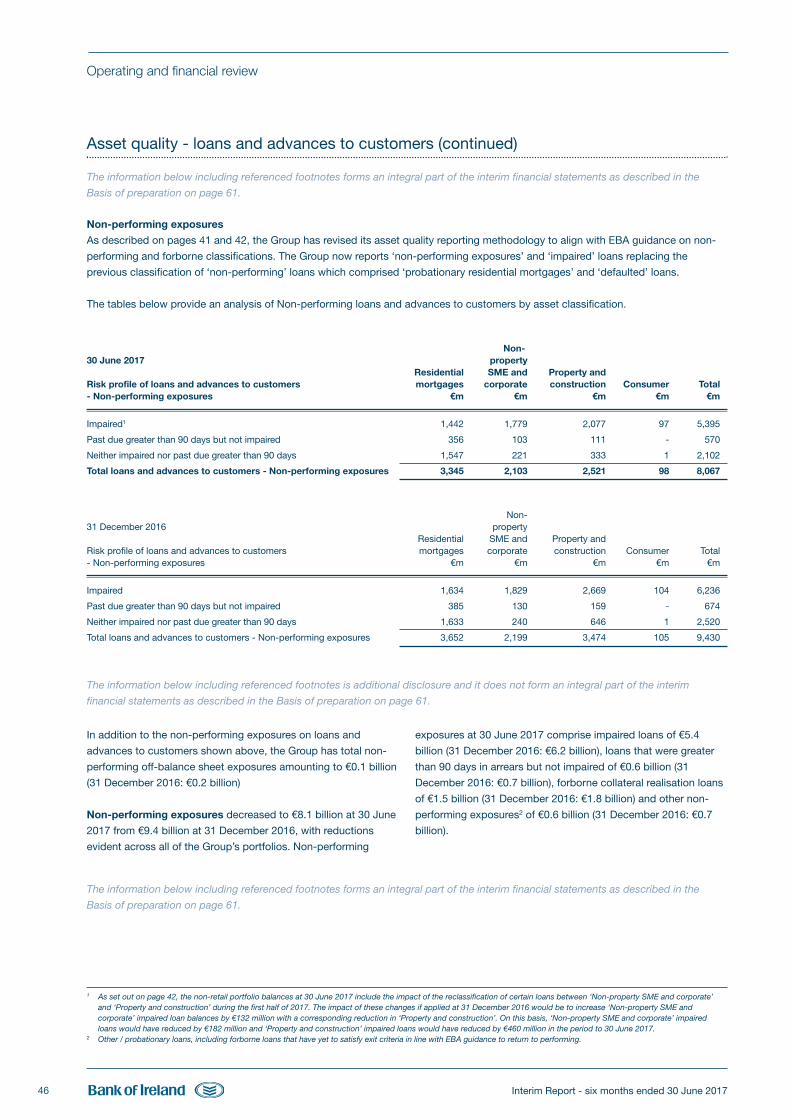
Interim Report - six months ended 30 June 201746
Operating and financial review
Asset quality - loans and advances to customers (continued)
The information below including referenced footnotes forms an integral part of the interim financial statements as described in the
Basis of preparation on page 61.
Non-performing exposures
As described on pages 41 and 42, the Group has revised its asset quality reporting methodology to align with EBA guidance on non-
performing and forborne classifications. The Group now reports ‘non-performing exposures’ and ‘impaired’ loans replacing the
previous classification of ‘non-performing’ loans which comprised ‘probationary residential mortgages’ and ‘defaulted’ loans.
The tables below provide an analysis of Non-performing loans and advances to customers by asset classification.
Non- 30 June 2017 property Residential SME and Property and Risk profile of loans and advances to customers mortgages corporate construction Consumer Total- Non-performing exposures €m €m €m €m €m
Impaired1 1,442 1,779 2,077 97 5,395
Past due greater than 90 days but not impaired 356 103 111 - 570
Neither impaired nor past due greater than 90 days 1,547 221 333 1 2,102
Total loans and advances to customers - Non-performing exposures 3,345 2,103 2,521 98 8,067
Non- 31 December 2016 property Residential SME and Property and
Risk profile of loans and advances to customers mortgages corporate construction Consumer Total- Non-performing exposures €m €m €m €m €m
Impaired 1,634 1,829 2,669 104 6,236
Past due greater than 90 days but not impaired 385 130 159 - 674
Neither impaired nor past due greater than 90 days 1,633 240 646 1 2,520
Total loans and advances to customers - Non-performing exposures 3,652 2,199 3,474 105 9,430
The information below including referenced footnotes is additional disclosure and it does not form an integral part of the interim
financial statements as described in the Basis of preparation on page 61.
In addition to the non-performing exposures on loans and
advances to customers shown above, the Group has total non-
performing off-balance sheet exposures amounting to €0.1 billion
(31 December 2016: €0.2 billion)
Non-performing exposures decreased to €8.1 billion at 30 June
2017 from €9.4 billion at 31 December 2016, with reductions
evident across all of the Group’s portfolios. Non-performing
exposures at 30 June 2017 comprise impaired loans of €5.4
billion (31 December 2016: €6.2 billion), loans that were greater
than 90 days in arrears but not impaired of €0.6 billion (31
December 2016: €0.7 billion), forborne collateral realisation loans
of €1.5 billion (31 December 2016: €1.8 billion) and other non-
performing exposures2 of €0.6 billion (31 December 2016: €0.7
billion).
1 As set out on page 42, the non-retail portfolio balances at 30 June 2017 include the impact of the reclassification of certain loans between ‘Non-property SME and corporate’and ‘Property and construction’ during the first half of 2017. The impact of these changes if applied at 31 December 2016 would be to increase ‘Non-property SME andcorporate’ impaired loan balances by €132 million with a corresponding reduction in ‘Property and construction’. On this basis, ‘Non-property SME and corporate’ impairedloans would have reduced by €182 million and ‘Property and construction’ impaired loans would have reduced by €460 million in the period to 30 June 2017.
2 Other / probationary loans, including forborne loans that have yet to satisfy exit criteria in line with EBA guidance to return to performing.
The information below including referenced footnotes forms an integral part of the interim financial statements as described in the
Basis of preparation on page 61.
BOI Interim Report 2017 FRONT.qxp_Layout 1 27/07/2017 20:29 Page 46
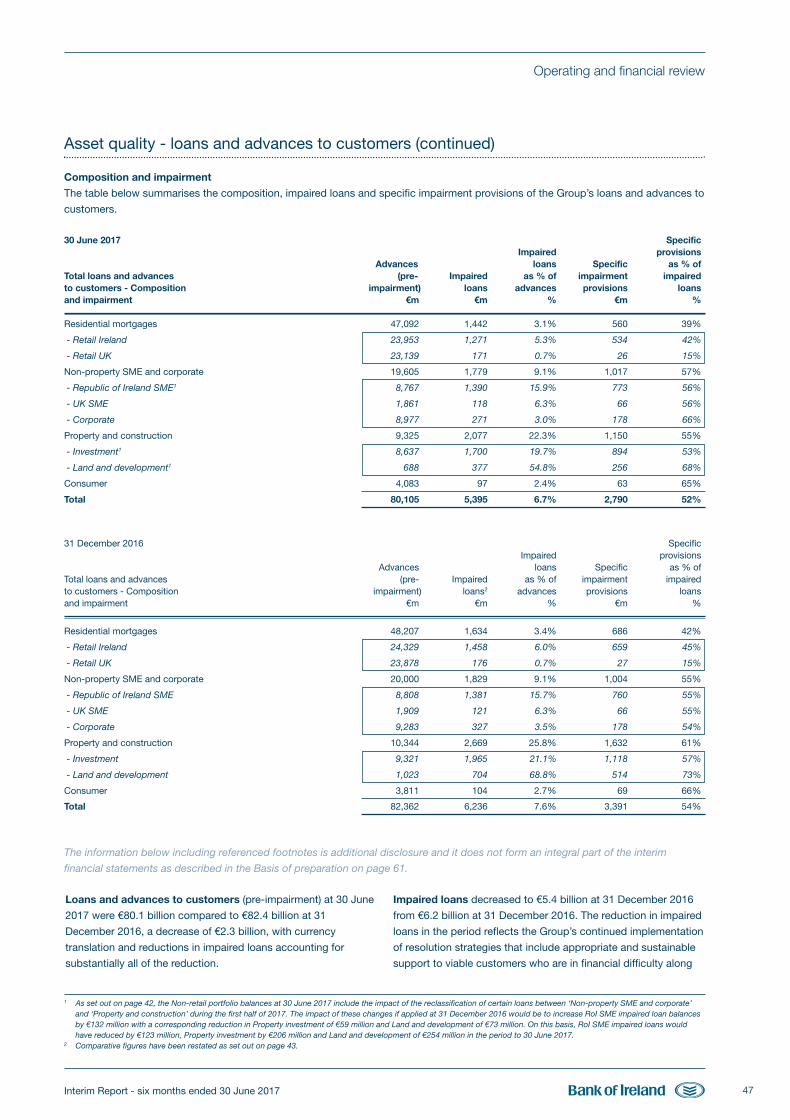
Interim Report - six months ended 30 June 2017 47
Operating and financial review
The information below including referenced footnotes is additional disclosure and it does not form an integral part of the interim
financial statements as described in the Basis of preparation on page 61.
Loans and advances to customers (pre-impairment) at 30 June
2017 were €80.1 billion compared to €82.4 billion at 31
December 2016, a decrease of €2.3 billion, with currency
translation and reductions in impaired loans accounting for
substantially all of the reduction.
Impaired loans decreased to €5.4 billion at 31 December 2016
from €6.2 billion at 31 December 2016. The reduction in impaired
loans in the period reflects the Group’s continued implementation
of resolution strategies that include appropriate and sustainable
support to viable customers who are in financial difficulty along
Asset quality - loans and advances to customers (continued)
Composition and impairment
The table below summarises the composition, impaired loans and specific impairment provisions of the Group’s loans and advances to
customers.
30 June 2017 SpecificImpaired provisions
Advances loans Specific as % of Total loans and advances (pre- Impaired as % of impairment impaired to customers - Composition impairment) loans advances provisions loansand impairment €m €m % €m %
Residential mortgages 47,092 1,442 3.1% 560 39%
- Retail Ireland 23,953 1,271 5.3% 534 42%
- Retail UK 23,139 171 0.7% 26 15%
Non-property SME and corporate 19,605 1,779 9.1% 1,017 57%
- Republic of Ireland SME1 8,767 1,390 15.9% 773 56%
- UK SME 1,861 118 6.3% 66 56%
- Corporate 8,977 271 3.0% 178 66%
Property and construction 9,325 2,077 22.3% 1,150 55%
- Investment1 8,637 1,700 19.7% 894 53%
- Land and development1 688 377 54.8% 256 68%
Consumer 4,083 97 2.4% 63 65%
Total 80,105 5,395 6.7% 2,790 52%
31 December 2016 SpecificImpaired provisions
Advances loans Specific as % of Total loans and advances (pre- Impaired as % of impairment impaired to customers - Composition impairment) loans2 advances provisions loansand impairment €m €m % €m %
Residential mortgages 48,207 1,634 3.4% 686 42%
- Retail Ireland 24,329 1,458 6.0% 659 45%
- Retail UK 23,878 176 0.7% 27 15%
Non-property SME and corporate 20,000 1,829 9.1% 1,004 55%
- Republic of Ireland SME 8,808 1,381 15.7% 760 55%
- UK SME 1,909 121 6.3% 66 55%
- Corporate 9,283 327 3.5% 178 54%
Property and construction 10,344 2,669 25.8% 1,632 61%
- Investment 9,321 1,965 21.1% 1,118 57%
- Land and development 1,023 704 68.8% 514 73%
Consumer 3,811 104 2.7% 69 66%
Total 82,362 6,236 7.6% 3,391 54%
1 As set out on page 42, the Non-retail portfolio balances at 30 June 2017 include the impact of the reclassification of certain loans between ‘Non-property SME and corporate’and ‘Property and construction’ during the first half of 2017. The impact of these changes if applied at 31 December 2016 would be to increase RoI SME impaired loan balancesby €132 million with a corresponding reduction in Property investment of €59 million and Land and development of €73 million. On this basis, RoI SME impaired loans wouldhave reduced by €123 million, Property investment by €206 million and Land and development of €254 million in the period to 30 June 2017.
2 Comparative figures have been restated as set out on page 43.
BOI Interim Report 2017 FRONT.qxp_Layout 1 27/07/2017 20:29 Page 47
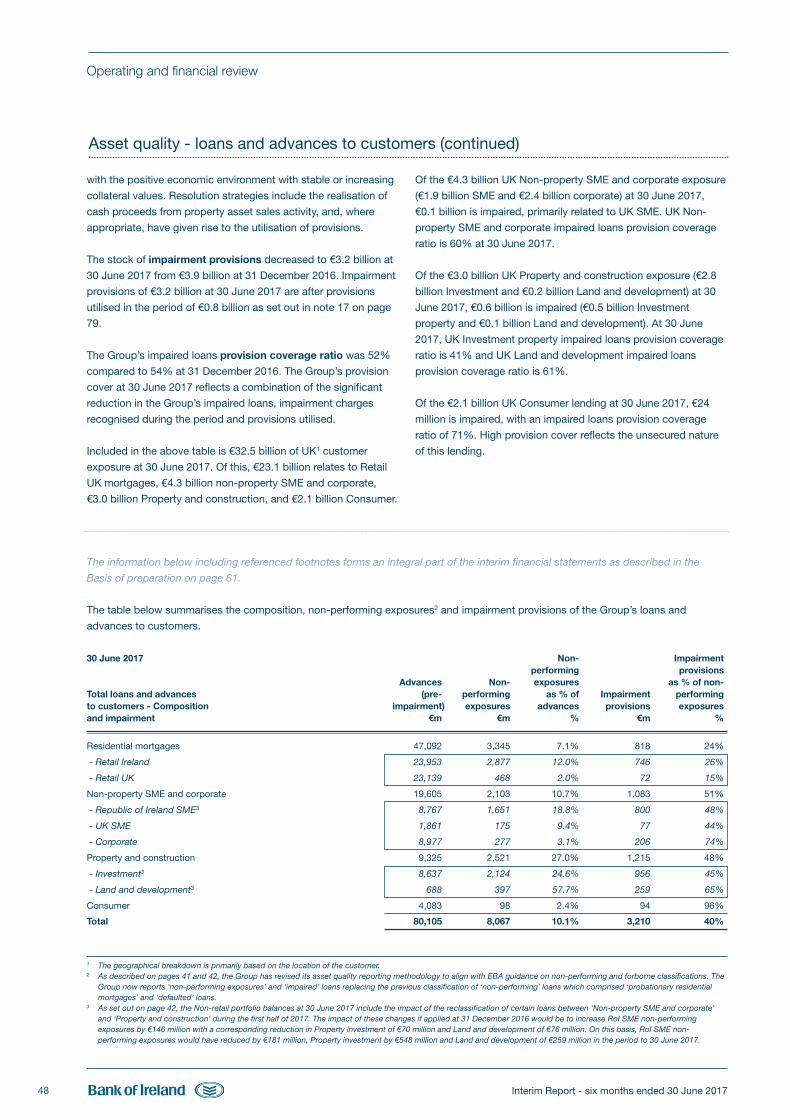
Interim Report - six months ended 30 June 201748
Operating and financial review
Asset quality - loans and advances to customers (continued)
with the positive economic environment with stable or increasing
collateral values. Resolution strategies include the realisation of
cash proceeds from property asset sales activity, and, where
appropriate, have given rise to the utilisation of provisions.
The stock of impairment provisions decreased to €3.2 billion at
30 June 2017 from €3.9 billion at 31 December 2016. Impairment
provisions of €3.2 billion at 30 June 2017 are after provisions
utilised in the period of €0.8 billion as set out in note 17 on page
79.
The Group’s impaired loans provision coverage ratio was 52%
compared to 54% at 31 December 2016. The Group’s provision
cover at 30 June 2017 reflects a combination of the significant
reduction in the Group’s impaired loans, impairment charges
recognised during the period and provisions utilised.
Included in the above table is €32.5 billion of UK1 customer
exposure at 30 June 2017. Of this, €23.1 billion relates to Retail
UK mortgages, €4.3 billion non-property SME and corporate,
€3.0 billion Property and construction, and €2.1 billion Consumer.
Of the €4.3 billion UK Non-property SME and corporate exposure
(€1.9 billion SME and €2.4 billion corporate) at 30 June 2017,
€0.1 billion is impaired, primarily related to UK SME. UK Non-
property SME and corporate impaired loans provision coverage
ratio is 60% at 30 June 2017.
Of the €3.0 billion UK Property and construction exposure (€2.8
billion Investment and €0.2 billion Land and development) at 30
June 2017, €0.6 billion is impaired (€0.5 billion Investment
property and €0.1 billion Land and development). At 30 June
2017, UK Investment property impaired loans provision coverage
ratio is 41% and UK Land and development impaired loans
provision coverage ratio is 61%.
Of the €2.1 billion UK Consumer lending at 30 June 2017, €24
million is impaired, with an impaired loans provision coverage
ratio of 71%. High provision cover reflects the unsecured nature
of this lending.
The information below including referenced footnotes forms an integral part of the interim financial statements as described in the
Basis of preparation on page 61.
The table below summarises the composition, non-performing exposures2 and impairment provisions of the Group’s loans and
advances to customers.
30 June 2017 Non- Impairmentperforming provisions
Advances Non- exposures as % of non-Total loans and advances (pre- performing as % of Impairment performing to customers - Composition impairment) exposures advances provisions exposuresand impairment €m €m % €m %
Residential mortgages 47,092 3,345 7.1% 818 24%
- Retail Ireland 23,953 2,877 12.0% 746 26%
- Retail UK 23,139 468 2.0% 72 15%
Non-property SME and corporate 19,605 2,103 10.7% 1,083 51%
- Republic of Ireland SME3 8,767 1,651 18.8% 800 48%
- UK SME 1,861 175 9.4% 77 44%
- Corporate 8,977 277 3.1% 206 74%
Property and construction 9,325 2,521 27.0% 1,215 48%
- Investment3 8,637 2,124 24.6% 956 45%
- Land and development3 688 397 57.7% 259 65%
Consumer 4,083 98 2.4% 94 96%
Total 80,105 8,067 10.1% 3,210 40%
1 The geographical breakdown is primarily based on the location of the customer. 2 As described on pages 41 and 42, the Group has revised its asset quality reporting methodology to align with EBA guidance on non-performing and forborne classifications. The
Group now reports ‘non-performing exposures’ and ‘impaired’ loans replacing the previous classification of ‘non-performing’ loans which comprised ‘probationary residentialmortgages’ and ‘defaulted’ loans.
3 As set out on page 42, the Non-retail portfolio balances at 30 June 2017 include the impact of the reclassification of certain loans between ‘Non-property SME and corporate’and ‘Property and construction’ during the first half of 2017. The impact of these changes if applied at 31 December 2016 would be to increase RoI SME non-performingexposures by €146 million with a corresponding reduction in Property investment of €70 million and Land and development of €76 million. On this basis, RoI SME non-performing exposures would have reduced by €181 million, Property investment by €548 million and Land and development of €259 million in the period to 30 June 2017.
BOI Interim Report 2017 FRONT.qxp_Layout 1 27/07/2017 20:29 Page 48
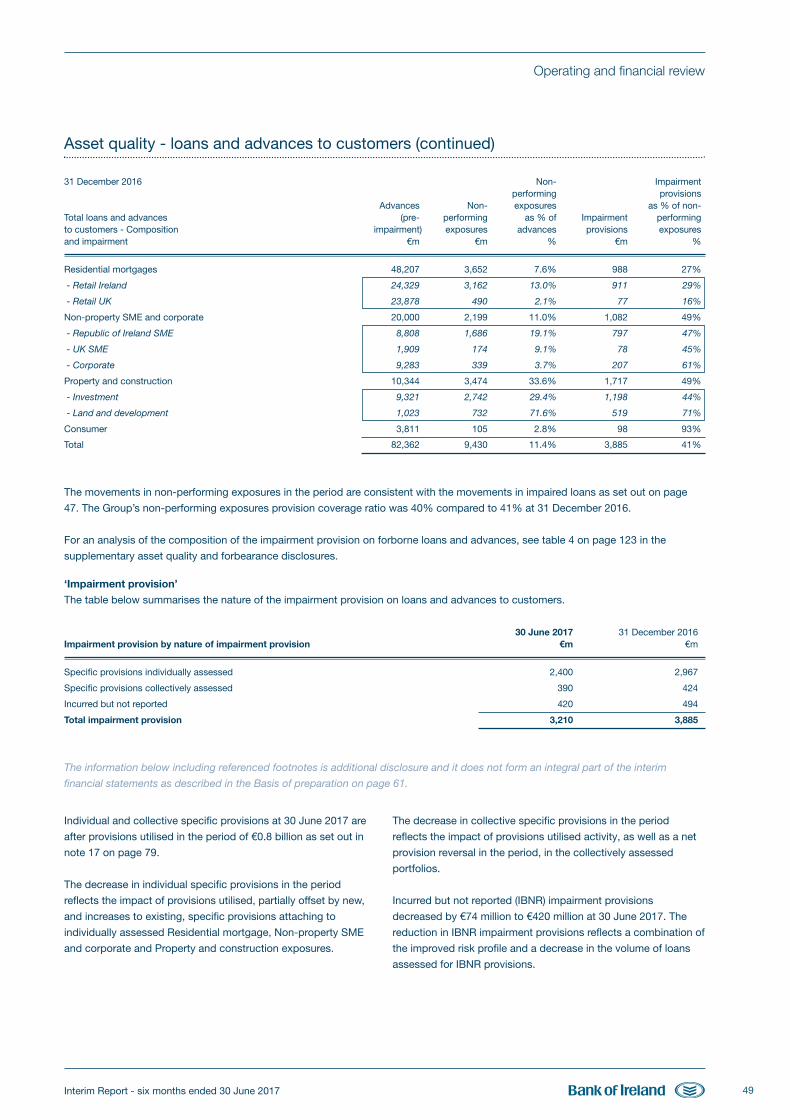
Interim Report - six months ended 30 June 2017 49
Operating and financial review
Individual and collective specific provisions at 30 June 2017 are
after provisions utilised in the period of €0.8 billion as set out in
note 17 on page 79.
The decrease in individual specific provisions in the period
reflects the impact of provisions utilised, partially offset by new,
and increases to existing, specific provisions attaching to
individually assessed Residential mortgage, Non-property SME
and corporate and Property and construction exposures.
The decrease in collective specific provisions in the period
reflects the impact of provisions utilised activity, as well as a net
provision reversal in the period, in the collectively assessed
portfolios.
Incurred but not reported (IBNR) impairment provisions
decreased by €74 million to €420 million at 30 June 2017. The
reduction in IBNR impairment provisions reflects a combination of
the improved risk profile and a decrease in the volume of loans
assessed for IBNR provisions.
Asset quality - loans and advances to customers (continued)
31 December 2016 Non- Impairmentperforming provisions
Advances Non- exposures as % of non-Total loans and advances (pre- performing as % of Impairment performing to customers - Composition impairment) exposures advances provisions exposuresand impairment €m €m % €m %
Residential mortgages 48,207 3,652 7.6% 988 27%
- Retail Ireland 24,329 3,162 13.0% 911 29%
- Retail UK 23,878 490 2.1% 77 16%
Non-property SME and corporate 20,000 2,199 11.0% 1,082 49%
- Republic of Ireland SME 8,808 1,686 19.1% 797 47%
- UK SME 1,909 174 9.1% 78 45%
- Corporate 9,283 339 3.7% 207 61%
Property and construction 10,344 3,474 33.6% 1,717 49%
- Investment 9,321 2,742 29.4% 1,198 44%
- Land and development 1,023 732 71.6% 519 71%
Consumer 3,811 105 2.8% 98 93%
Total 82,362 9,430 11.4% 3,885 41%
The movements in non-performing exposures in the period are consistent with the movements in impaired loans as set out on page
47. The Group’s non-performing exposures provision coverage ratio was 40% compared to 41% at 31 December 2016.
For an analysis of the composition of the impairment provision on forborne loans and advances, see table 4 on page 123 in the
supplementary asset quality and forbearance disclosures.
‘Impairment provision’
The table below summarises the nature of the impairment provision on loans and advances to customers.
30 June 2017 31 December 2016Impairment provision by nature of impairment provision €m €m
Specific provisions individually assessed 2,400 2,967
Specific provisions collectively assessed 390 424
Incurred but not reported 420 494
Total impairment provision 3,210 3,885
The information below including referenced footnotes is additional disclosure and it does not form an integral part of the interim
financial statements as described in the Basis of preparation on page 61.
BOI Interim Report 2017 FRONT.qxp_Layout 1 27/07/2017 20:29 Page 49
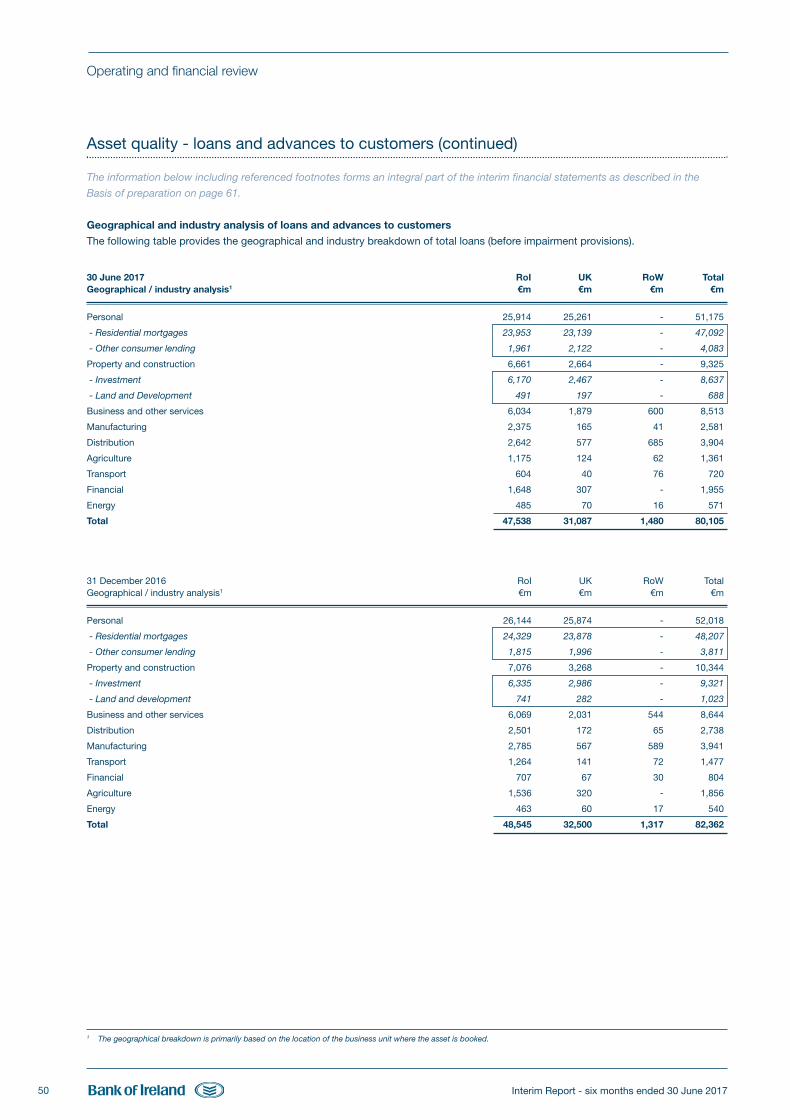
Interim Report - six months ended 30 June 201750
Operating and financial review
Asset quality - loans and advances to customers (continued)
The information below including referenced footnotes forms an integral part of the interim financial statements as described in the
Basis of preparation on page 61.
Geographical and industry analysis of loans and advances to customers
The following table provides the geographical and industry breakdown of total loans (before impairment provisions).
30 June 2017 RoI UK RoW TotalGeographical / industry analysis1 €m €m €m €m
Personal 25,914 25,261 - 51,175
- Residential mortgages 23,953 23,139 - 47,092
- Other consumer lending 1,961 2,122 - 4,083
Property and construction 6,661 2,664 - 9,325
- Investment 6,170 2,467 - 8,637
- Land and Development 491 197 - 688
Business and other services 6,034 1,879 600 8,513
Manufacturing 2,375 165 41 2,581
Distribution 2,642 577 685 3,904
Agriculture 1,175 124 62 1,361
Transport 604 40 76 720
Financial 1,648 307 - 1,955
Energy 485 70 16 571
Total 47,538 31,087 1,480 80,105
31 December 2016 RoI UK RoW TotalGeographical / industry analysis1 €m €m €m €m
Personal 26,144 25,874 - 52,018
- Residential mortgages 24,329 23,878 - 48,207
- Other consumer lending 1,815 1,996 - 3,811
Property and construction 7,076 3,268 - 10,344
- Investment 6,335 2,986 - 9,321
- Land and development 741 282 - 1,023
Business and other services 6,069 2,031 544 8,644
Distribution 2,501 172 65 2,738
Manufacturing 2,785 567 589 3,941
Transport 1,264 141 72 1,477
Financial 707 67 30 804
Agriculture 1,536 320 - 1,856
Energy 463 60 17 540
Total 48,545 32,500 1,317 82,362
1 The geographical breakdown is primarily based on the location of the business unit where the asset is booked.
BOI Interim Report 2017 FRONT.qxp_Layout 1 27/07/2017 20:29 Page 50
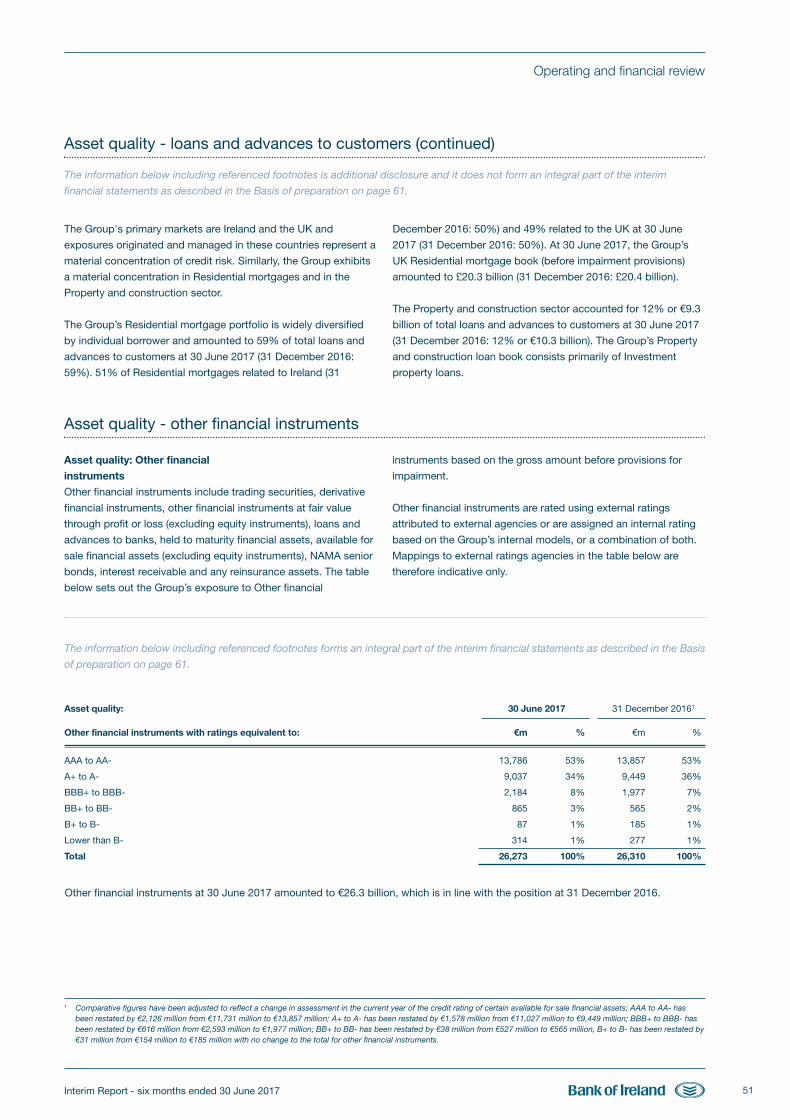
Interim Report - six months ended 30 June 2017 51
Operating and financial review
Asset quality - loans and advances to customers (continued)
The Group's primary markets are Ireland and the UK and
exposures originated and managed in these countries represent a
material concentration of credit risk. Similarly, the Group exhibits
a material concentration in Residential mortgages and in the
Property and construction sector.
The Group’s Residential mortgage portfolio is widely diversified
by individual borrower and amounted to 59% of total loans and
advances to customers at 30 June 2017 (31 December 2016:
59%). 51% of Residential mortgages related to Ireland (31
December 2016: 50%) and 49% related to the UK at 30 June
2017 (31 December 2016: 50%). At 30 June 2017, the Group’s
UK Residential mortgage book (before impairment provisions)
amounted to £20.3 billion (31 December 2016: £20.4 billion).
The Property and construction sector accounted for 12% or €9.3
billion of total loans and advances to customers at 30 June 2017
(31 December 2016: 12% or €10.3 billion). The Group’s Property
and construction loan book consists primarily of Investment
property loans.
The information below including referenced footnotes is additional disclosure and it does not form an integral part of the interim
financial statements as described in the Basis of preparation on page 61.
Asset quality: Other financial
instruments
Other financial instruments include trading securities, derivative
financial instruments, other financial instruments at fair value
through profit or loss (excluding equity instruments), loans and
advances to banks, held to maturity financial assets, available for
sale financial assets (excluding equity instruments), NAMA senior
bonds, interest receivable and any reinsurance assets. The table
below sets out the Group’s exposure to Other financial
instruments based on the gross amount before provisions for
impairment.
Other financial instruments are rated using external ratings
attributed to external agencies or are assigned an internal rating
based on the Group’s internal models, or a combination of both.
Mappings to external ratings agencies in the table below are
therefore indicative only.
The information below including referenced footnotes forms an integral part of the interim financial statements as described in the Basis
of preparation on page 61.
Asset quality: 30 June 2017 31 December 20161
Other financial instruments with ratings equivalent to: €m % €m %
AAA to AA- 13,786 53% 13,857 53%
A+ to A- 9,037 34% 9,449 36%
BBB+ to BBB- 2,184 8% 1,977 7%
BB+ to BB- 865 3% 565 2%
B+ to B- 87 1% 185 1%
Lower than B- 314 1% 277 1%
Total 26,273 100% 26,310 100%
Asset quality - other financial instruments
Other financial instruments at 30 June 2017 amounted to €26.3 billion, which is in line with the position at 31 December 2016.
1 Comparative figures have been adjusted to reflect a change in assessment in the current year of the credit rating of certain available for sale financial assets; AAA to AA- hasbeen restated by €2,126 million from €11,731 million to €13,857 million; A+ to A- has been restated by €1,578 million from €11,027 million to €9,449 million; BBB+ to BBB- hasbeen restated by €616 million from €2,593 million to €1,977 million; BB+ to BB- has been restated by €38 million from €527 million to €565 million, B+ to B- has been restated by€31 million from €154 million to €185 million with no change to the total for other financial instruments.
BOI Interim Report 2017 FRONT.qxp_Layout 1 27/07/2017 20:29 Page 51
Interim Report - six months ended 30 June 201752
Operating and financial review
Asset quality - IFRS 9 financial instruments
Significant information about the Group’s IFRS 9 Programme andkey aspects of its IFRS 9 implementation were disclosed in theGroup’s Annual Report for the year ended 31 December 2016.Appropriate updates are provided below.
Overall implementationThe ‘build’ phase of the Programme is expected to be substantiallycompleted by the end of the third quarter of 2017, allowing forappropriate testing, refinement and dry-run of models, technologyinfrastructure and processes in advance of ‘go-live’ on 1 January2018. Testing of certain components of the Group’s overall IFRS 9solution commenced in the first half of 2017.
Classification and measurementBased on progress to date in the assessment of business modelsand the contractual cash flow characteristics of assets, the Groupexpects that the classification requirements of IFRS 9 will result inno change in measurement basis for the vast majority of theGroup’s financial assets.
The Group does not expect to avail at transition of the optionunder IFRS 9 to elect to measure certain equity investments atfair value through other comprehensive income.
The Group does not intend to avail of the ‘overlay approach’available to issuers of insurance contracts which is outlined inamendments to IFRS 4 which were published by the IASB inSeptember 2016 and are awaiting EU endorsement.
ImpairmentDevelopment of the Group’s expected credit losses (ECL) modelsuite is at an advanced stage, with multiple futuremacroeconomic scenarios being incorporated into the models.
The Group will finalise its qualitative and quantitative stagingcriteria in the second half of 2017, including the threshold(s) formovement in probability of default (PD) to be applied indetermining whether an asset has experienced a significantincrease in credit risk.
The Group expects to apply the low credit risk expedient to mostdebt securities measured at amortised cost or at fair valuethrough other comprehensive income and similarly to loans andadvances to central banks, credit institutions and investmentfirms. ‘Low credit risk’ is expected to encompass PD grades 1 to5 on the Group’s internal PD rating system, which broadly alignswith ratings of AAA to BBB- for the external major ratingagencies.
Detailed development work is continuing on the operating modeland governance framework that will apply post transition to IFRS9. It will leverage existing arrangements where appropriate andbe consistent with the Group’s three lines of defence approach torisk management. New or revised operating processes are beingdeveloped to ensure business readiness on transition to IFRS 9.
ECL models and model methodologies are expected to besubject to approval by the Risk Measurement Committee, which
is responsible for approval and oversight of the Group’s riskmeasurement systems.
The formulation of multiple future macroeconomic scenarios andassociated probability weightings will be a cross-functionalactivity and subject to approval by the Group Risk PolicyCommittee, the Group’s most senior management riskcommittee. It is expected that at least three such scenarios willbe formulated at each reporting date.
The Court will retain ultimate responsibility, on therecommendation of Group Audit Committee, for approving theGroup Impairment Policy and the Group’s financial statements.
Quantitative impact and regulatory treatmentTransition to the classification and measurement requirements ofIFRS 9 is not expected to have a material quantitative impact onthe Group’s total financial assets and liabilities.
Transition to the impairment requirements of IFRS 9 may result in amaterial increase in impairment provisions at transition, but areasonable estimate currently cannot be made primarily as theGroup’s staging criteria have yet to be finalised; the incorporation ofmultiple future macroeconomic scenarios into the Group’s ECLmodel suite is not yet complete; and the composition of the Group’sportfolios and the macro-economic conditions and outlook that willprevail at transition are not known.
There continues to be uncertainty regarding the regulatory andtax treatment of the initial impact of transition to IFRS 9. Relief forthe initial impact on regulatory capital due to the impairmentrequirements of IFRS 9 is under consideration at EU level basedon a 5-year transitional period commencing on the effective dateof IFRS 9, with a significant level of add-back in the initial yearand reducing incrementally thereafter. For the purposes of UKCorporation Tax, transitional adjustments arising from theadoption of IFRS 9 in respect of credit losses are to be spreadover a 10 year period. Irish Corporation Tax rules relating to thetransition to IFRS 9 have not yet been established.
In June 2017, the EBA issued its draft methodology for the 2018EU-wide stress test which will cover a three year period to theend of 2020 and incorporate the impact of IFRS 9. Based on thedraft methodology, the baseline and adverse scenarios will eachbe based on a single future macroeconomic scenario; the fullimpact of the macroeconomic scenario must be applied in year 1of the stress test for initial stage 2 and 3 assets; capital ratiosunder the stress test will be published on both a transitional andfully loaded basis; and no hurdle rates or thresholds will bespecified but competent authorities will apply the results as aninput to the supervisory review and evaluation process (SREP).The final methodology is to be published in early 2018.
The Group expects to provide quantitative information on theimpact of transition to IFRS 9 in its Group’s Annual Report for theyear ended 31 December 2017.
BOI Interim Report 2017 FRONT.qxp_Layout 1 27/07/2017 20:29 Page 52
Interim Report - six months ended 30 June 2017 53
Responsibility Statementfor the six months ended 30 June 2017
The Directors are responsible for preparing the Interim Report in accordance with International Accounting Standard 34 as adopted by
the European Union, the Transparency (Directive 2004/109/EC) Regulations 2007 and the Transparency Rules of the Central Bank of
Ireland.
The Directors confirm that to the best of each Director’s knowledge and belief the condensed set of interim financial statements have
been prepared in accordance with IAS 34 and that they give a true and fair view of the assets, liabilities, financial position and profit of
the Group and that as required by the Transparency (Directive 2004/109/EC) Regulations 2007, the Interim Report includes a fair review
of:
• important events that have occurred during the first six months of the year;
• the impact of those events on the condensed financial statements;
• a description of the principal risks and uncertainties for the remaining six months of the financial year (see page 40);
• details of any related parties’ transactions that have materially affected the Group’s financial position or performance in the six
months ended 30 June 2017; and
• details of any changes to related parties’ transactions described in the Group’s Annual Report for the year ended 31 December
2016 that could have a material effect on the financial position or performance of the Group in the six months ended 30 June 2017.
The Directors are responsible for the maintenance and integrity of the corporate and financial information included on the Bank’s
website.
Legislation in Ireland governing the preparation and dissemination of financial statements may differ from legislation in other
jurisdictions.
Signed on behalf of the Court by
27 July 2017
Archie G Kane
Governor
Patrick Kennedy
Deputy Governor
Richie Boucher
Group Chief Executive
BOI Interim Report 2017 BACK.qxp_Layout 1 27/07/2017 20:08 Page 53
Interim Report - six months ended 30 June 201754
Independent Review Report to The Governor and Company of the Bank of Ireland
Report on the condensed consolidated interim financial statements
Our conclusionWe have reviewed The Governor and Company of the Bank of Ireland’s condensed consolidated interim financial statements (the‘interim financial statements’), defined below, in the Interim Report of The Governor and Company of the Bank of Ireland (the ‘Bank’)for the six months ended 30 June 2017. Based on our review, nothing has come to our attention that causes us to believe that theinterim financial statements are not prepared, in all material respects, in accordance with International Accounting Standard 34,‘Interim Financial Reporting’, as adopted by the European Union and the Transparency (Directive 2004/109/EC) Regulations 2007 andthe Transparency Rules of the Central Bank of Ireland.
What we have reviewedThe interim financial statements, which are prepared by the Bank, comprise:• the Consolidated income statement and Consolidated condensed statement of comprehensive income for the period then ended;• the Consolidated balance sheet as at 30 June 2017;• the Consolidated condensed statement of changes in equity for the period then ended;• the Consolidated condensed cash flow statement for the period then ended;• the Basis of preparation and accounting policies;• the Notes to the interim financial statements; and• the information described as being an integral part of the interim financial statements as set out in the interim financial statements
paragraph on the Basis of preparation and accounting policies on page 61.
The interim financial statements included in the Interim Report have been prepared in accordance with International AccountingStandard 34, ‘Interim Financial Reporting’, as adopted by the European Union and the Transparency (Directive 2004/109/EC)Regulations 2007 and the Transparency Rules of the Central Bank of Ireland.
As disclosed in the Basis of preparation on page 61, the financial reporting framework that has been applied in the preparation of thefull annual financial statements of the Group is applicable law and International Financial Reporting Standards (IFRSs) as adopted bythe European Union.
Responsibilities for the interim financial statements and the review
Our responsibilities and those of the DirectorsThe Interim Report, including the interim financial statements, is the responsibility of, and has been approved by, the Directors. TheDirectors are responsible for preparing the Interim Report in accordance with the Transparency (Directive 2004/109/EC) Regulations2007 and the Transparency Rules of the Central Bank of Ireland.
Our responsibility is to express a conclusion on the interim financial statements in the Interim Report based on our review. This report,including the conclusion, has been prepared for and only for the Bank for the purpose of complying with the Transparency (Directive2004/109/EC) Regulations 2007 and the Transparency Rules of the Central Bank of Ireland and for no other purpose. We do not, ingiving this conclusion, accept or assume responsibility for any other purpose or to any other person to whom this report is shown orinto whose hands it may come save where expressly agreed by our prior consent in writing.
What a review of interim financial statements involvesWe conducted our review in accordance with International Standard on Review Engagements (UK and Ireland) 2410, ‘Review of InterimFinancial Information Performed by the Independent Auditor of the Entity’ issued by the Auditing Practices Board for use in the UnitedKingdom and Ireland. A review of interim financial information consists of making enquiries, primarily of persons responsible forfinancial and accounting matters, and applying analytical and other review procedures.
A review is substantially less in scope than an audit conducted in accordance with International Standards on Auditing (Ireland) and,consequently, does not enable us to obtain assurance that we would become aware of all significant matters that might be identified inan audit. Accordingly, we do not express an audit opinion.
We have read the other information contained in the Interim Report and considered whether it contains any apparent misstatements ormaterial inconsistencies with the information in the interim financial statements.
PricewaterhouseCoopersChartered AccountantsDublin
27 July 2017
BOI Interim Report 2017 BACK.qxp_Layout 1 27/07/2017 20:08 Page 54
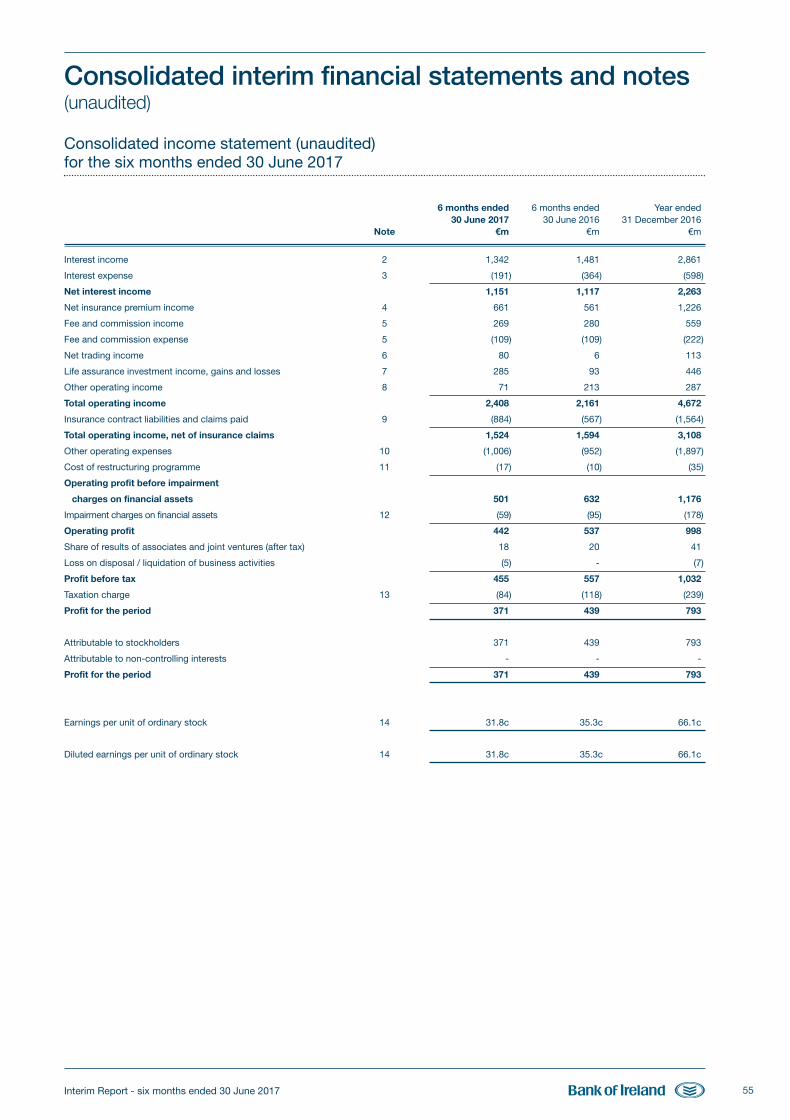
Interim Report - six months ended 30 June 2017 55
Consolidated interim financial statements and notes(unaudited)
6 months ended 6 months ended Year ended30 June 2017 30 June 2016 31 December 2016
Note €m €m €m
Interest income 2 1,342 1,481 2,861
Interest expense 3 (191) (364) (598)
Net interest income 1,151 1,117 2,263
Net insurance premium income 4 661 561 1,226
Fee and commission income 5 269 280 559
Fee and commission expense 5 (109) (109) (222)
Net trading income 6 80 6 113
Life assurance investment income, gains and losses 7 285 93 446
Other operating income 8 71 213 287
Total operating income 2,408 2,161 4,672
Insurance contract liabilities and claims paid 9 (884) (567) (1,564)
Total operating income, net of insurance claims 1,524 1,594 3,108
Other operating expenses 10 (1,006) (952) (1,897)
Cost of restructuring programme 11 (17) (10) (35)
Operating profit before impairment
charges on financial assets 501 632 1,176
Impairment charges on financial assets 12 (59) (95) (178)
Operating profit 442 537 998
Share of results of associates and joint ventures (after tax) 18 20 41
Loss on disposal / liquidation of business activities (5) - (7)
Profit before tax 455 557 1,032
Taxation charge 13 (84) (118) (239)
Profit for the period 371 439 793
Attributable to stockholders 371 439 793
Attributable to non-controlling interests - - -
Profit for the period 371 439 793
Earnings per unit of ordinary stock 14 31.8c 35.3c 66.1c
Diluted earnings per unit of ordinary stock 14 31.8c 35.3c 66.1c
Consolidated income statement (unaudited)for the six months ended 30 June 2017
BOI Interim Report 2017 BACK.qxp_Layout 1 27/07/2017 20:08 Page 55
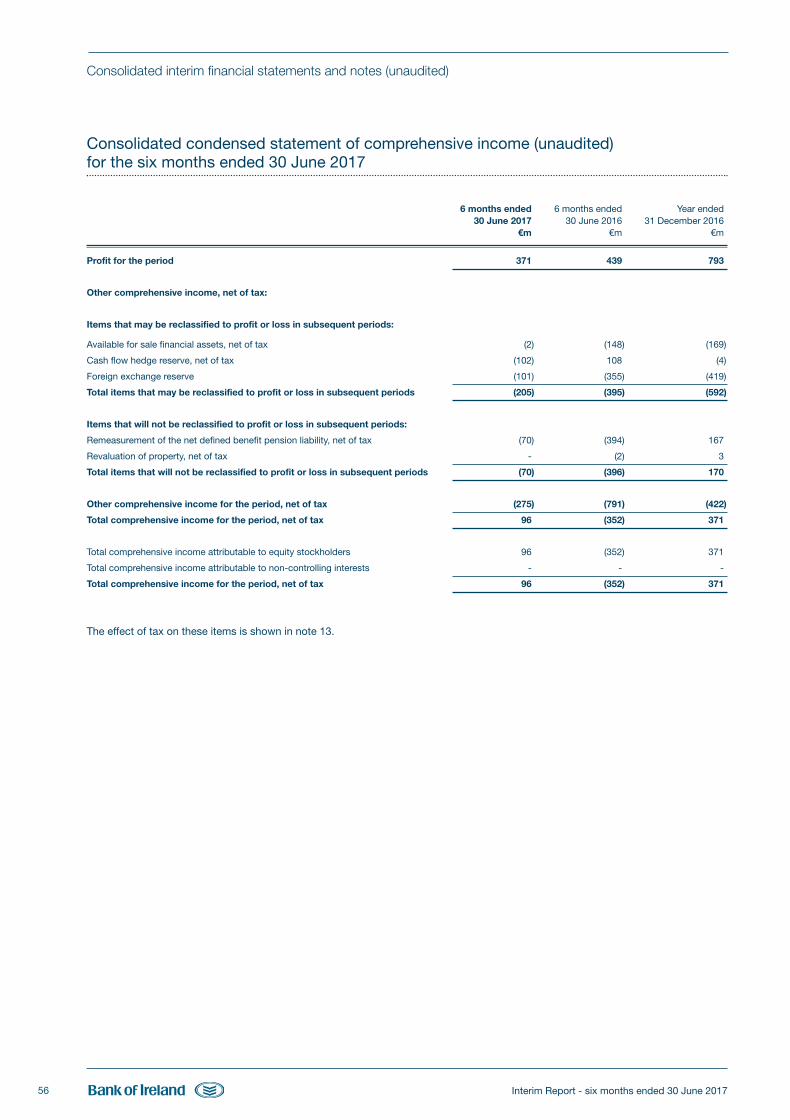
Interim Report - six months ended 30 June 201756
6 months ended 6 months ended Year ended30 June 2017 30 June 2016 31 December 2016
€m €m €m
Profit for the period 371 439 793
Other comprehensive income, net of tax:
Items that may be reclassified to profit or loss in subsequent periods:
Available for sale financial assets, net of tax (2) (148) (169)
Cash flow hedge reserve, net of tax (102) 108 (4)
Foreign exchange reserve (101) (355) (419)
Total items that may be reclassified to profit or loss in subsequent periods (205) (395) (592)
Items that will not be reclassified to profit or loss in subsequent periods:
Remeasurement of the net defined benefit pension liability, net of tax (70) (394) 167
Revaluation of property, net of tax - (2) 3
Total items that will not be reclassified to profit or loss in subsequent periods (70) (396) 170
Other comprehensive income for the period, net of tax (275) (791) (422)
Total comprehensive income for the period, net of tax 96 (352) 371
Total comprehensive income attributable to equity stockholders 96 (352) 371
Total comprehensive income attributable to non-controlling interests - - -
Total comprehensive income for the period, net of tax 96 (352) 371
The effect of tax on these items is shown in note 13.
Consolidated condensed statement of comprehensive income (unaudited)for the six months ended 30 June 2017
Consolidated interim financial statements and notes (unaudited)
BOI Interim Report 2017 BACK.qxp_Layout 1 27/07/2017 20:08 Page 56
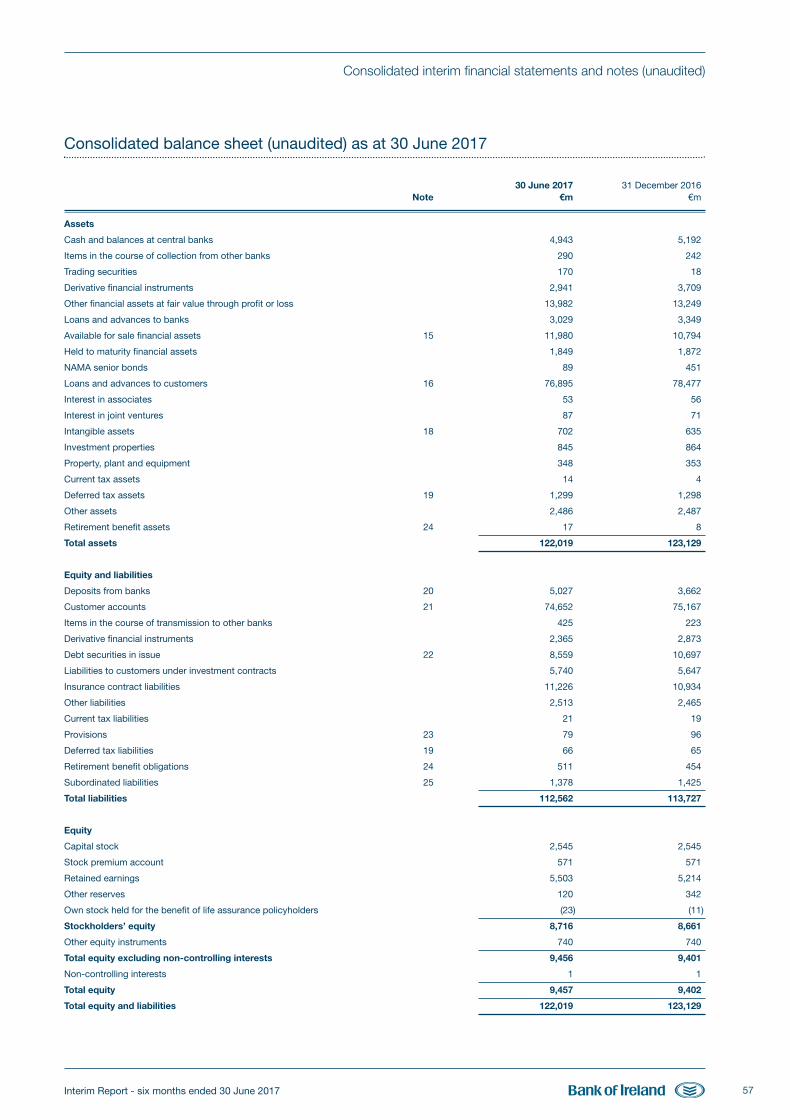
Interim Report - six months ended 30 June 2017 57
Consolidated interim financial statements and notes (unaudited)
30 June 2017 31 December 2016Note €m €m
Assets
Cash and balances at central banks 4,943 5,192
Items in the course of collection from other banks 290 242
Trading securities 170 18
Derivative financial instruments 2,941 3,709
Other financial assets at fair value through profit or loss 13,982 13,249
Loans and advances to banks 3,029 3,349
Available for sale financial assets 15 11,980 10,794
Held to maturity financial assets 1,849 1,872
NAMA senior bonds 89 451
Loans and advances to customers 16 76,895 78,477
Interest in associates 53 56
Interest in joint ventures 87 71
Intangible assets 18 702 635
Investment properties 845 864
Property, plant and equipment 348 353
Current tax assets 14 4
Deferred tax assets 19 1,299 1,298
Other assets 2,486 2,487
Retirement benefit assets 24 17 8
Total assets 122,019 123,129
Equity and liabilities
Deposits from banks 20 5,027 3,662
Customer accounts 21 74,652 75,167
Items in the course of transmission to other banks 425 223
Derivative financial instruments 2,365 2,873
Debt securities in issue 22 8,559 10,697
Liabilities to customers under investment contracts 5,740 5,647
Insurance contract liabilities 11,226 10,934
Other liabilities 2,513 2,465
Current tax liabilities 21 19
Provisions 23 79 96
Deferred tax liabilities 19 66 65
Retirement benefit obligations 24 511 454
Subordinated liabilities 25 1,378 1,425
Total liabilities 112,562 113,727
Equity
Capital stock 2,545 2,545
Stock premium account 571 571
Retained earnings 5,503 5,214
Other reserves 120 342
Own stock held for the benefit of life assurance policyholders (23) (11)
Stockholders’ equity 8,716 8,661
Other equity instruments 740 740
Total equity excluding non-controlling interests 9,456 9,401
Non-controlling interests 1 1
Total equity 9,457 9,402
Total equity and liabilities 122,019 123,129
Consolidated balance sheet (unaudited) as at 30 June 2017
BOI Interim Report 2017 BACK.qxp_Layout 1 27/07/2017 20:08 Page 57
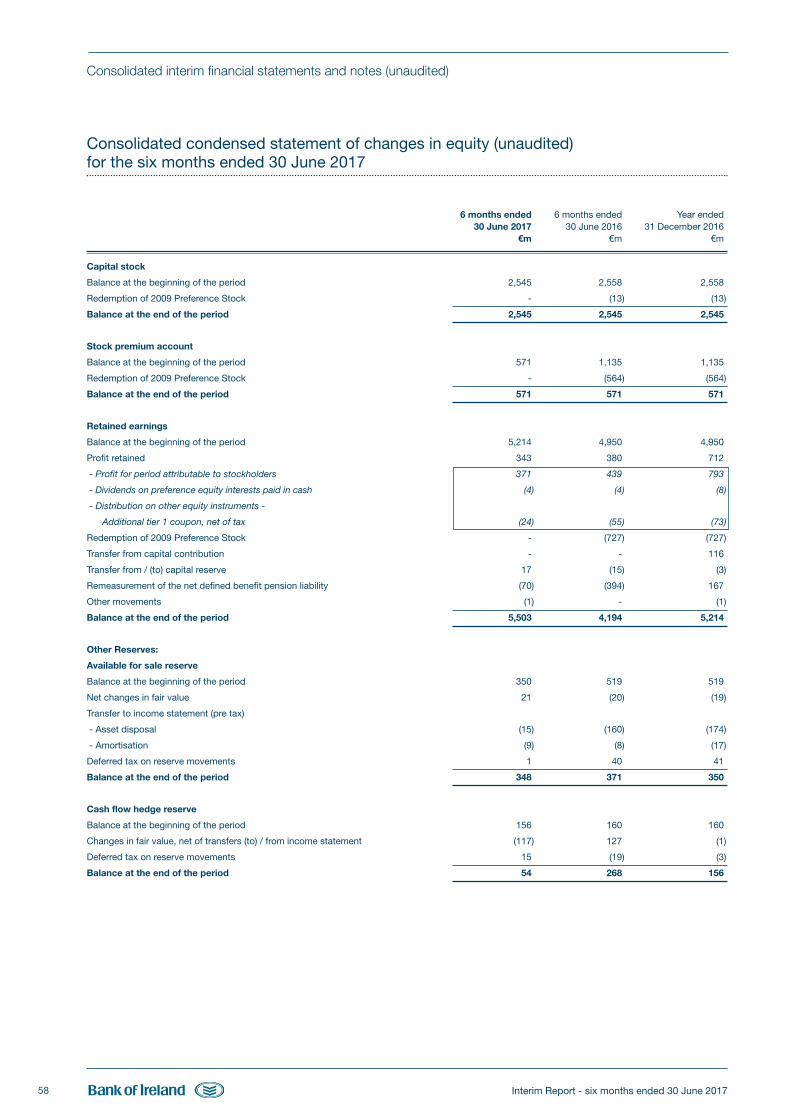
Interim Report - six months ended 30 June 201758
Consolidated interim financial statements and notes (unaudited)
Consolidated condensed statement of changes in equity (unaudited)for the six months ended 30 June 2017
6 months ended 6 months ended Year ended30 June 2017 30 June 2016 31 December 2016
€m €m €m
Capital stock
Balance at the beginning of the period 2,545 2,558 2,558
Redemption of 2009 Preference Stock - (13) (13)
Balance at the end of the period 2,545 2,545 2,545
Stock premium account
Balance at the beginning of the period 571 1,135 1,135
Redemption of 2009 Preference Stock - (564) (564)
Balance at the end of the period 571 571 571
Retained earnings
Balance at the beginning of the period 5,214 4,950 4,950
Profit retained 343 380 712
- Profit for period attributable to stockholders 371 439 793
- Dividends on preference equity interests paid in cash (4) (4) (8)
- Distribution on other equity instruments -
Additional tier 1 coupon, net of tax (24) (55) (73)
Redemption of 2009 Preference Stock - (727) (727)
Transfer from capital contribution - - 116
Transfer from / (to) capital reserve 17 (15) (3)
Remeasurement of the net defined benefit pension liability (70) (394) 167
Other movements (1) - (1)
Balance at the end of the period 5,503 4,194 5,214
Other Reserves:
Available for sale reserve
Balance at the beginning of the period 350 519 519
Net changes in fair value 21 (20) (19)
Transfer to income statement (pre tax)
- Asset disposal (15) (160) (174)
- Amortisation (9) (8) (17)
Deferred tax on reserve movements 1 40 41
Balance at the end of the period 348 371 350
Cash flow hedge reserve
Balance at the beginning of the period 156 160 160
Changes in fair value, net of transfers (to) / from income statement (117) 127 (1)
Deferred tax on reserve movements 15 (19) (3)
Balance at the end of the period 54 268 156
BOI Interim Report 2017 BACK.qxp_Layout 1 27/07/2017 20:08 Page 58
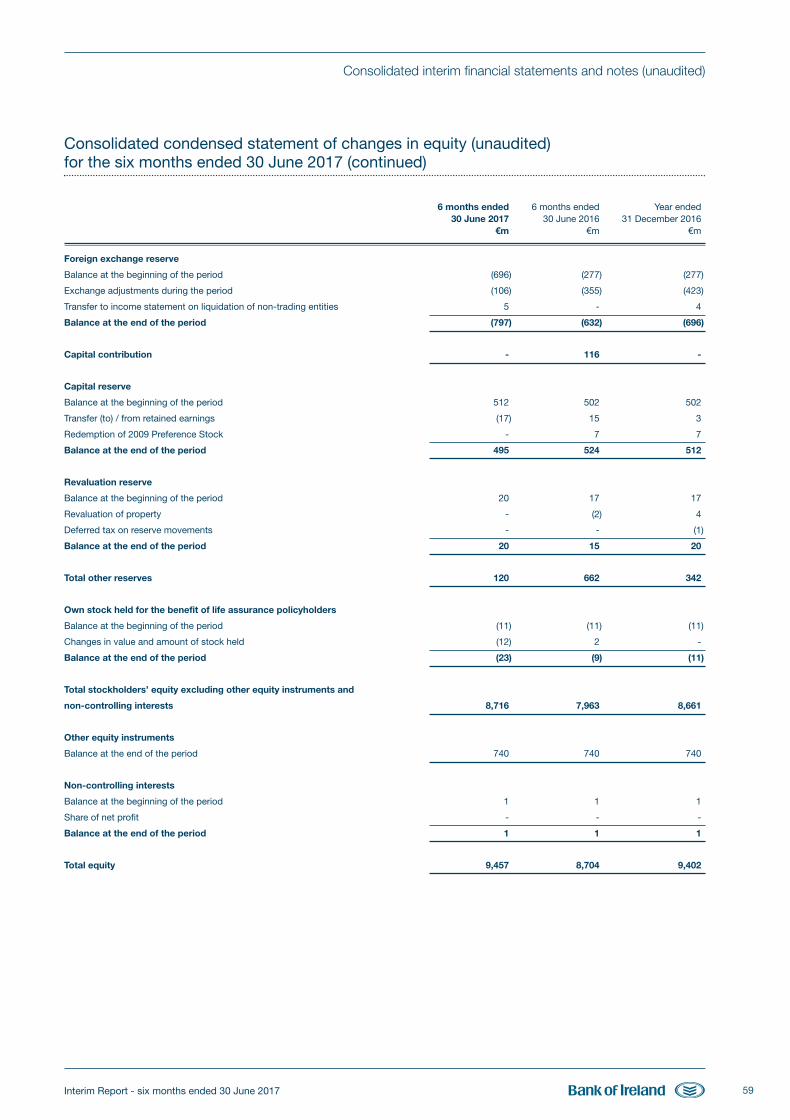
Interim Report - six months ended 30 June 2017 59
Consolidated interim financial statements and notes (unaudited)
Consolidated condensed statement of changes in equity (unaudited)for the six months ended 30 June 2017 (continued)
6 months ended 6 months ended Year ended30 June 2017 30 June 2016 31 December 2016
€m €m €m
Foreign exchange reserve
Balance at the beginning of the period (696) (277) (277)
Exchange adjustments during the period (106) (355) (423)
Transfer to income statement on liquidation of non-trading entities 5 - 4
Balance at the end of the period (797) (632) (696)
Capital contribution - 116 -
Capital reserve
Balance at the beginning of the period 512 502 502
Transfer (to) / from retained earnings (17) 15 3
Redemption of 2009 Preference Stock - 7 7
Balance at the end of the period 495 524 512
Revaluation reserve
Balance at the beginning of the period 20 17 17
Revaluation of property - (2) 4
Deferred tax on reserve movements - - (1)
Balance at the end of the period 20 15 20
Total other reserves 120 662 342
Own stock held for the benefit of life assurance policyholders
Balance at the beginning of the period (11) (11) (11)
Changes in value and amount of stock held (12) 2 -
Balance at the end of the period (23) (9) (11)
Total stockholders’ equity excluding other equity instruments and
non-controlling interests 8,716 7,963 8,661
Other equity instruments
Balance at the end of the period 740 740 740
Non-controlling interests
Balance at the beginning of the period 1 1 1
Share of net profit - - -
Balance at the end of the period 1 1 1
Total equity 9,457 8,704 9,402
BOI Interim Report 2017 BACK.qxp_Layout 1 27/07/2017 20:08 Page 59
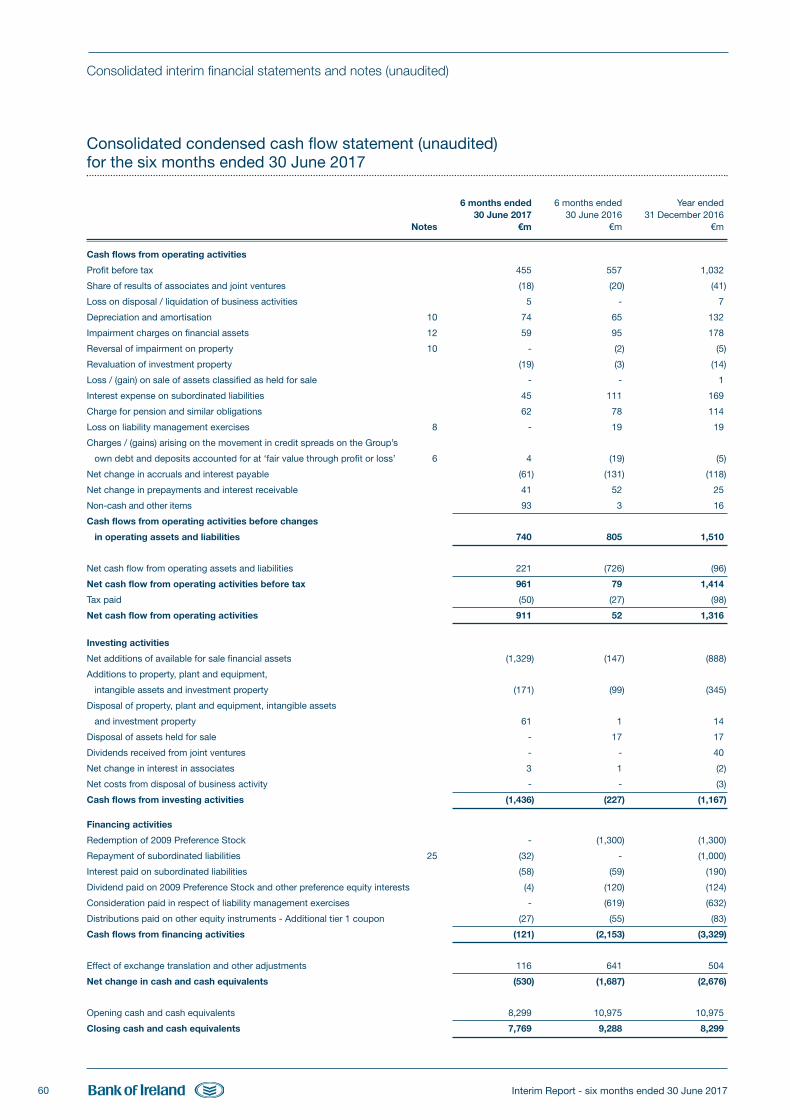
Interim Report - six months ended 30 June 201760
Consolidated condensed cash flow statement (unaudited)for the six months ended 30 June 2017
6 months ended 6 months ended Year ended30 June 2017 30 June 2016 31 December 2016
Notes €m €m €m
Cash flows from operating activities
Profit before tax 455 557 1,032
Share of results of associates and joint ventures (18) (20) (41)
Loss on disposal / liquidation of business activities 5 - 7
Depreciation and amortisation 10 74 65 132
Impairment charges on financial assets 12 59 95 178
Reversal of impairment on property 10 - (2) (5)
Revaluation of investment property (19) (3) (14)
Loss / (gain) on sale of assets classified as held for sale - - 1
Interest expense on subordinated liabilities 45 111 169
Charge for pension and similar obligations 62 78 114
Loss on liability management exercises 8 - 19 19
Charges / (gains) arising on the movement in credit spreads on the Group’s
own debt and deposits accounted for at ‘fair value through profit or loss’ 6 4 (19) (5)
Net change in accruals and interest payable (61) (131) (118)
Net change in prepayments and interest receivable 41 52 25
Non-cash and other items 93 3 16
Cash flows from operating activities before changes
in operating assets and liabilities 740 805 1,510
Net cash flow from operating assets and liabilities 221 (726) (96)
Net cash flow from operating activities before tax 961 79 1,414
Tax paid (50) (27) (98)
Net cash flow from operating activities 911 52 1,316
Investing activities
Net additions of available for sale financial assets (1,329) (147) (888)
Additions to property, plant and equipment,
intangible assets and investment property (171) (99) (345)
Disposal of property, plant and equipment, intangible assets
and investment property 61 1 14
Disposal of assets held for sale - 17 17
Dividends received from joint ventures - - 40
Net change in interest in associates 3 1 (2)
Net costs from disposal of business activity - - (3)
Cash flows from investing activities (1,436) (227) (1,167)
Financing activities
Redemption of 2009 Preference Stock - (1,300) (1,300)
Repayment of subordinated liabilities 25 (32) - (1,000)
Interest paid on subordinated liabilities (58) (59) (190)
Dividend paid on 2009 Preference Stock and other preference equity interests (4) (120) (124)
Consideration paid in respect of liability management exercises - (619) (632)
Distributions paid on other equity instruments - Additional tier 1 coupon (27) (55) (83)
Cash flows from financing activities (121) (2,153) (3,329)
Effect of exchange translation and other adjustments 116 641 504
Net change in cash and cash equivalents (530) (1,687) (2,676)
Opening cash and cash equivalents 8,299 10,975 10,975
Closing cash and cash equivalents 7,769 9,288 8,299
Consolidated interim financial statements and notes (unaudited)
BOI Interim Report 2017 BACK.qxp_Layout 1 27/07/2017 20:08 Page 60
Interim Report - six months ended 30 June 2017 61
Consolidated interim financial statements and notes (unaudited)
Basis of preparation and accounting policies
Basis of preparation
The interim financial statements of The Governor and Company of the Bank of Ireland (the ‘Bank’) and its subsidiaries (collectively the
‘Group’) for the six months ended 30 June 2017 have been prepared in accordance with International Accounting Standard 34, ‘Interim
Financial Reporting’, as issued by the International Accounting Standards Board and as adopted by the European Union. These interim
financial statements should be read in conjunction with the Group’s audited financial statements for the year ended 31 December
2016, which were prepared in accordance with International Financial Reporting Standards (IFRS) as adopted by the EU and with
those parts of the Companies Act 2014 applicable to companies reporting under IFRS and with the European Union (Credit
Institutions: Financial Statement) Regulations, 2015.
Statutory financial statementsThese interim financial statements do not comprise statutory financial statements within the meaning of the Companies Act 2014 (as
amended). The statutory financial statements for the year ended 31 December 2016 were approved by the Court of Directors on 23
February 2017, contained an unqualified audit report and were filed with the Companies Registration Office on 31 May 2017.
Interim financial statementsThe interim financial statements comprise the Consolidated income statement, Consolidated condensed statement of comprehensive
income, Consolidated balance sheet, Consolidated condensed statement of changes in equity, Consolidated condensed cash flow
statement, Basis of preparation and accounting policies and the Notes to the consolidated interim financial statements on pages 55 to
95. The interim financial statements include the information that is described as being an integral part of the interim financial
statements contained in the Asset quality and impairment section of the Operating and financial review. The interim financial
statements also include the tables in Other Information - Supplementary Asset Quality and forbearance disclosures described as being
an integral part of the interim financial statements as described further on page 99.
Going concern
The time period that the Directors have considered in evaluating the appropriateness of the going concern basis in preparing the
interim financial statements for the six months ended 30 June 2017 is a period of twelve months from the date of approval of these
interim financial statements (the ‘period of assessment’).
In making this assessment, the Directors considered the Group’s business, profitability projections, funding and capital plans, taking
due account of the availability of collateral to access the Eurosystem under both base and plausible stress scenarios, together with a
range of other factors such as the outlook for the Irish economy, along with ongoing developments in the eurozone.
The matters of primary consideration by the Directors are set out below:
Capital
The Group has developed capital plans under base and stress scenarios and the Directors believe that the Group has sufficient capital
to meet its regulatory capital requirements throughout the period of assessment.
Funding and liquidity
The Directors have considered the Group’s funding and liquidity position and are satisfied that the Group has sufficient funding and
liquidity throughout the period of assessment, including sufficient collateral for funding if required from the relevant Monetary
Authorities.
Conclusion
On the basis of the above, the Directors consider it appropriate to prepare the interim financial statements on a going concern basis
having concluded that there are no material uncertainties related to events or conditions that may cast significant doubt on the Group’s
ability to continue as a going concern over the period of assessment.
Accounting policies
Accounting policies
The accounting policies and methods of computation and presentation applied by the Group in the preparation of these interim
financial statements are consistent with those set out on pages 195 to 217 of the Group’s Annual Report for the year ended 31
December 2016, with the following exceptions.
BOI Interim Report 2017 BACK.qxp_Layout 1 27/07/2017 20:08 Page 61
Interim Report - six months ended 30 June 201762
Consolidated interim financial statements and notes (unaudited)
As part of the revision of its asset quality reporting methodology as set out in more detail on pages 41 and 42, the Group’s definition of
impaired loans has been modified to remove non-mortgage loans that are greater than 90 days in arrears but where a specific
provision is not required, instead these loans are classified as ‘greater than 90 days in arrears and not impaired’. In addition, all
exposures that are subject to forbearance and have a specific provision are now reported as both forborne and impaired whereas
previously in the non-mortgage portfolios where an exposure carried a specific provision it was reported as ‘impaired’ and not reported
as ‘forborne’. These changes do not impact any of the line items in the primary financial statements for the current or prior period, nor
do they impact the calculation of basic or diluted earnings per share. As a result the accounting policy on forbearance has been
updated as follows:
Forbearance occurs when a borrower is granted a temporary or permanent concession or an agreed change (‘forbearance measure’) to a
loan for reasons relating to the actual or apparent financial stress or distress of that borrower. Forbearance has not occurred if the concession
or agreed change to a loan granted to a borrower is not related to the actual or apparent financial stress or distress of that borrower.
Prior to any decision to grant forbearance the Group performs an assessment of a customer’s financial circumstances and ability to
repay. This assessment includes an individual assessment for impairment of the loan. If the Group determines that no objective
evidence of impairment exists for an individually assessed forborne asset, whether significant or not, it includes the asset in a group of
loans with similar credit risk characteristics and collectively assesses them for impairment.
Where the forborne loan is considered to be impaired the amount of the loss is measured as the difference between the asset’s
carrying amount and the present value of estimated future cash flows (excluding future credit losses that have not been incurred)
discounted at the asset’s original effective interest rate before the modification of terms. The carrying amount of the asset is reduced
through the use of an allowance account and the amount of the loss is recognised in the income statement. If a forborne asset has a
variable interest rate, the discount rate for measuring any impairment loss is the current effective interest rate determined under the
contract before the modification of terms. As a practical expedient, the Group may measure impairment on the basis of an instrument’s
fair value using an observable market price.
Assets to which forbearance has been applied continue to be reported as forborne until such time as they satisfy conditions to exit
forbearance in line with EBA guidance on non-performing and forborne classifications.
Where the cash flows from a forborne loan are considered to have expired, the original asset is derecognised and a new asset is
recognised, initially measured at fair value. Any difference between the carrying value of the original asset and the fair value of the new
asset on initial recognition is recognised in the income statement. Interest accrues on the new asset based on the current market rates
in place at the time of the renegotiation.
New accounting pronouncementsThere have been no new standards or amendments to standards adopted by the Group during the six months ended 30 June 2017
which have had a material impact on the Group.
Significant information about the Group's IFRS 9 Programme and key aspects of its IFRS 9 implementation were disclosed in the
Group’s Annual Report for the year ended 31 December 2016. The 'build' phase of the Programme is expected to be substantially
completed by the end of the third quarter of 2017, allowing for appropriate testing, refinement and dry-run of models, technology
infrastructure and processes in advance of 'go-live' on 1 January 2018. Testing of certain components of the Group's overall IFRS 9
solution commenced in the first half of 2017. The Group expects to provide additional disclosure on IFRS 9, including quantitative
information on the impact of transition, in the Group’s Annual Report for the year ended 31 December 2017.
Critical accounting estimates and judgementsThe preparation of interim financial statements requires the Group to make estimates and judgements that impact the reported
amounts of assets and liabilities, income and expense. There have been no significant changes to the Group's approach to, and
methods of, making critical accounting estimates and judgements compared to those applied at 31 December 2016, as set out on
pages 217 to 220 of the Group’s Annual Report for the year ended 31 December 2016.
Comparatives
Comparative figures have been adjusted where necessary, to conform with changes in presentation or where additional analysis has
been provided in the current period. Any adjustments to comparatives are disclosed in the relevant note or supplementary asset
quality disclosure as appropriate.
Basis of preparation and accounting policies (continued)
BOI Interim Report 2017 BACK.qxp_Layout 1 27/07/2017 20:08 Page 62
Interim Report - six months ended 30 June 2017 63
Consolidated interim financial statements and notes (unaudited)
Notes to the consolidated interim financial statements
Index Page
1 Operating segments 64
2 Interest income 71
3 Interest expense 71
4 Net insurance premium income 72
5 Fee and commission income and expense 72
6 Net trading income 72
7 Life assurance investment income, gains and losses 73
8 Other operating income 73
9 Insurance contract liabilities and claims paid 74
10 Other operating expenses 74
11 Cost of restructuring programme 75
12 Impairment charges on financial assets 75
13 Taxation 76
14 Earnings per share 77
15 Available for sale financial assets 78
16 Loans and advances to customers 78
17 Impairment provisions 79
18 Intangible assets 80
19 Deferred tax 81
20 Deposits from banks 81
21 Customer accounts 82
22 Debt securities in issue 82
23 Provisions 83
24 Retirement benefit obligations 83
25 Subordinated liabilities 85
26 Summary of relations with the State 86
27 Corporate reorganisation 87
28 Liquidity risk and profile 88
29 Fair values of assets and liabilities 89
30 Contingent liabilities and commitments 94
31 Post balance sheet events 95
32 Approval of Interim Report 95
BOI Interim Report 2017 BACK.qxp_Layout 1 27/07/2017 20:08 Page 63
Interim Report - six months ended 30 June 201764
Consolidated interim financial statements and notes (unaudited)
1 Operating segments
The Group has five reportable operating segments which reflect the internal financial and management reporting structure and are
organised as follows:
Retail Ireland
Retail Ireland is managed through a number of business units namely Distribution Channels, Customer Propositions (including
Customer and Wealth Management and Bank of Ireland Mortgage Bank) and Business Banking (including Bank of Ireland Finance).
Bank of Ireland Life
Bank of Ireland Life (which includes the Group’s life assurance subsidiary New Ireland Assurance Company plc) distributes protection,
investment and pension products to the Irish market, through independent brokers, its financial advisors (direct sales force) and the
Group’s distribution channels.
Retail UK
The Retail UK Division incorporates the financial services relationship and foreign exchange joint venture with the UK Post Office, the
financial services partnership with the AA, the UK residential mortgage business, the Group’s branch network in Northern Ireland (NI),
the Group’s business banking business in NI and the Northridge motor and asset finance business. The Group also has a business
banking business in Great Britain (GB) which is being run-down. The Retail UK division includes the activities of Bank of Ireland (UK) plc,
the Group’s wholly owned UK licensed banking subsidiary.
Corporate and Treasury
The Corporate and Treasury Division comprises Corporate Banking, Global Markets and IBI Corporate Finance. It also manages the
Group’s euro area liquid asset bond portfolio.
Group Centre
Group Centre comprises Group Manufacturing, Group Finance, Group Risk, Group Governance and Regulatory and Group Human
Resources. The Group’s central functions, through Group Centre, establish and oversee polices and provide and manage certain
processes and delivery platforms for the divisions.
Other reconciling items
Other reconciling items represent inter segment transactions which are eliminated upon consolidation and the application of hedge
accounting at Group level.
Basis of preparation of segmental information
The analysis of results by operating segment is based on the information used by the chief operating decision maker to allocate
resources and assess performance. Transactions between the business segments are on normal commercial terms and conditions.
Internal charges and transfer pricing adjustments have been reflected in the performance of each business. Revenue sharing
agreements are used to allocate external customer revenues to a business segment on a reasonable basis.
The measures of segmental assets and liabilities provided to the chief operating decision maker are not adjusted for transfer pricing
adjustments or revenue sharing agreements as the impact on the measures of segmental assets and liabilities is not significant.
Capital expenditure comprises additions to property, plant and equipment and intangible assets.
The Group’s management reporting and controlling systems use accounting policies that are the same as those referenced in 'Group
accounting policies' on pages 195 to 217 of the Group’s Annual Report for the year ended 31 December 2016, other than as noted on
page 62. On an ongoing basis, the Group reviews the methodology for allocating funding and liquidity costs in order to ensure that the
allocations continue to reflect each division’s current funding requirement. During the six months ended 30 June 2017, the Group
amended the basis of allocating liquid asset income across the divisions which resulted in an increase in net interest income for the six
months ended 30 June 2017 in the Retail Ireland division of €13 million and in the Retail UK division of €1 million with a corresponding
decrease in net interest income in the Corporate and Treasury division of €14 million, compared to the former basis.
BOI Interim Report 2017 BACK.qxp_Layout 1 27/07/2017 20:08 Page 64
Interim Report - six months ended 30 June 2017 65
Consolidated interim financial statements and notes (unaudited)
1 Operating segments (continued)
Gross external revenue comprises interest income, net insurance premium income, fee and commission income, net trading income,
life assurance investment income gains and losses, other operating income and share of results of associates and joint ventures.
There were no revenues deriving from transactions with a single external customer that amounted to 10% or more of the Group’s
revenues.
The Group measures the performance of its operating segments through a measure of segment profit or loss which is referred to as
‘Underlying profit’ in its internal management reporting systems. Underlying profit excludes:
• Cost of restructuring programme;
• Gross-up for policyholder tax in the Life business;
• Cost of corporate reorganisation and establishment of a new holding company;
• Gain / loss on disposal / liquidation of business activities;
• Gains / charges arising on the movement in the Group's credit spreads;
• Gain / loss on liability management exercises; and
• Investment return on treasury stock held for policyholders.
BOI Interim Report 2017 BACK.qxp_Layout 1 27/07/2017 20:09 Page 65
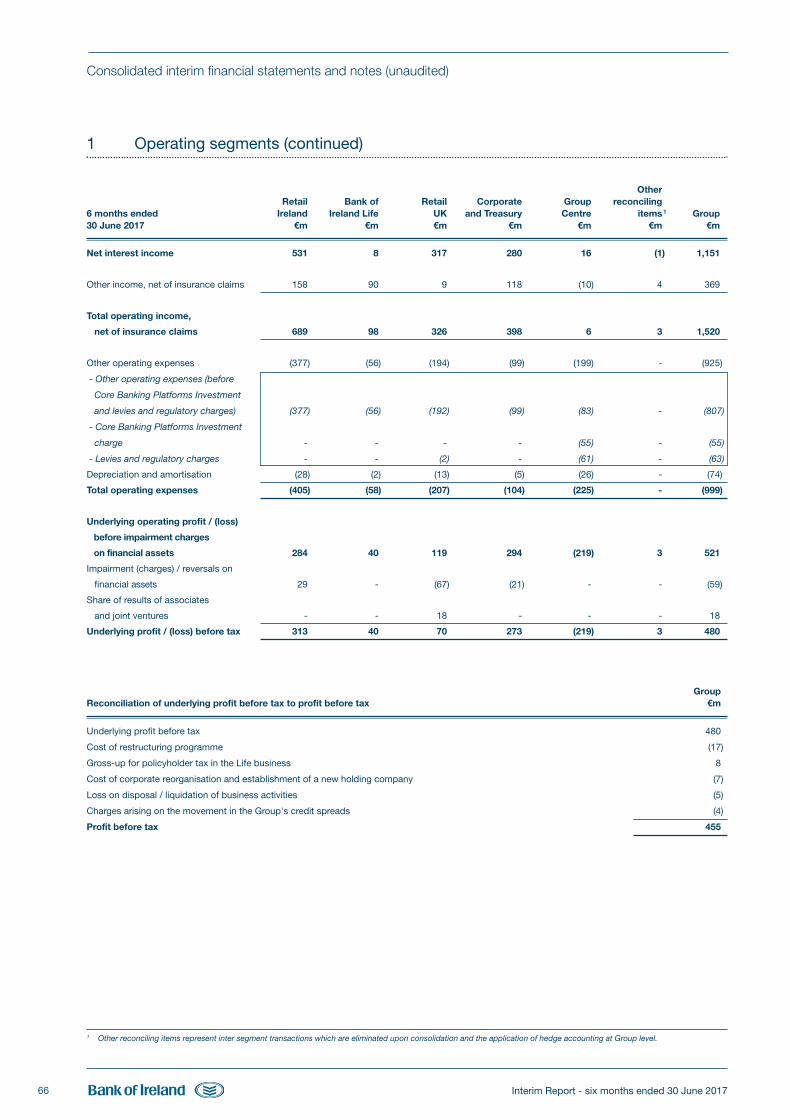
Interim Report - six months ended 30 June 201766
Consolidated interim financial statements and notes (unaudited)
1 Operating segments (continued)
OtherRetail Bank of Retail Corporate Group reconciling
6 months ended Ireland Ireland Life UK and Treasury Centre items1 Group30 June 2017 €m €m €m €m €m €m €m
Net interest income 531 8 317 280 16 (1) 1,151
Other income, net of insurance claims 158 90 9 118 (10) 4 369
Total operating income,
net of insurance claims 689 98 326 398 6 3 1,520
Other operating expenses (377) (56) (194) (99) (199) - (925)
- Other operating expenses (before
Core Banking Platforms Investment
and levies and regulatory charges) (377) (56) (192) (99) (83) - (807)
- Core Banking Platforms Investment
charge - - - - (55) - (55)
- Levies and regulatory charges - - (2) - (61) - (63)
Depreciation and amortisation (28) (2) (13) (5) (26) - (74)
Total operating expenses (405) (58) (207) (104) (225) - (999)
Underlying operating profit / (loss)
before impairment charges
on financial assets 284 40 119 294 (219) 3 521
Impairment (charges) / reversals on
financial assets 29 - (67) (21) - - (59)
Share of results of associates
and joint ventures - - 18 - - - 18
Underlying profit / (loss) before tax 313 40 70 273 (219) 3 480
GroupReconciliation of underlying profit before tax to profit before tax €m
Underlying profit before tax 480
Cost of restructuring programme (17)
Gross-up for policyholder tax in the Life business 8
Cost of corporate reorganisation and establishment of a new holding company (7)
Loss on disposal / liquidation of business activities (5)
Charges arising on the movement in the Group's credit spreads (4)
Profit before tax 455
1 Other reconciling items represent inter segment transactions which are eliminated upon consolidation and the application of hedge accounting at Group level.
BOI Interim Report 2017 BACK.qxp_Layout 1 27/07/2017 20:09 Page 66
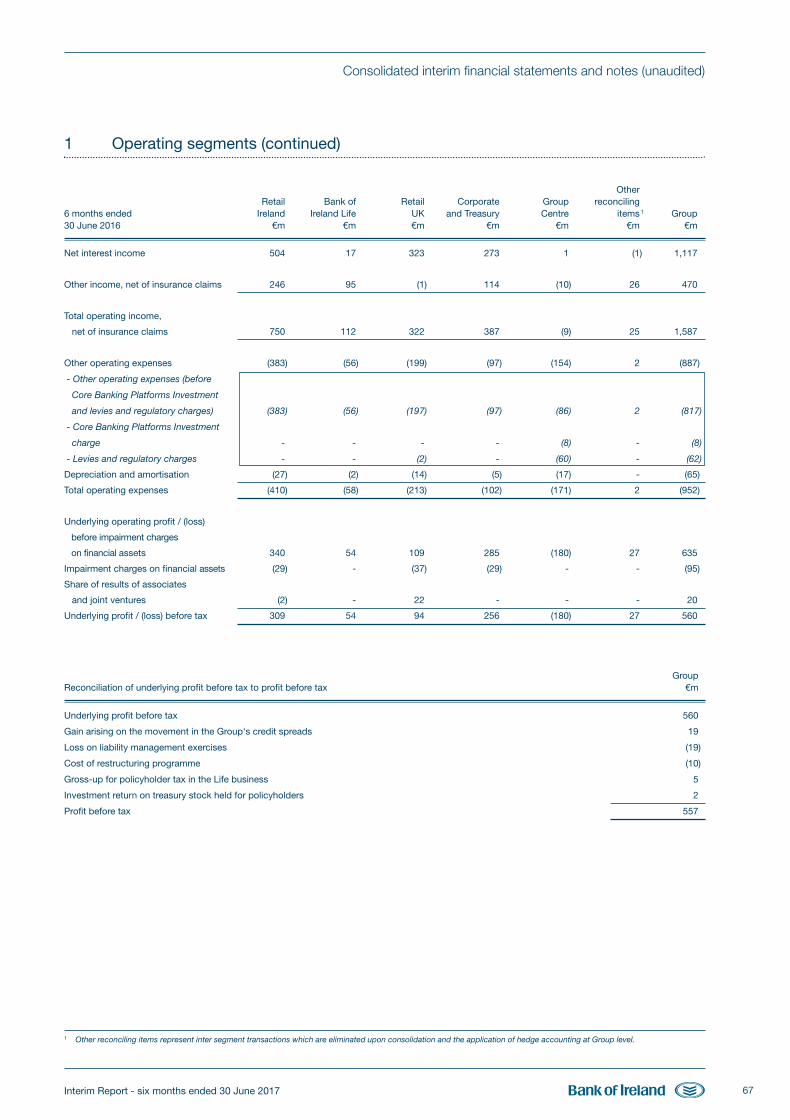
Interim Report - six months ended 30 June 2017 67
Consolidated interim financial statements and notes (unaudited)
1 Operating segments (continued)
OtherRetail Bank of Retail Corporate Group reconciling
6 months ended Ireland Ireland Life UK and Treasury Centre items1 Group30 June 2016 €m €m €m €m €m €m €m
Net interest income 504 17 323 273 1 (1) 1,117
Other income, net of insurance claims 246 95 (1) 114 (10) 26 470
Total operating income,
net of insurance claims 750 112 322 387 (9) 25 1,587
Other operating expenses (383) (56) (199) (97) (154) 2 (887)
- Other operating expenses (before
Core Banking Platforms Investment
and levies and regulatory charges) (383) (56) (197) (97) (86) 2 (817)
- Core Banking Platforms Investment
charge - - - - (8) - (8)
- Levies and regulatory charges - - (2) - (60) - (62)
Depreciation and amortisation (27) (2) (14) (5) (17) - (65)
Total operating expenses (410) (58) (213) (102) (171) 2 (952)
Underlying operating profit / (loss)
before impairment charges
on financial assets 340 54 109 285 (180) 27 635
Impairment charges on financial assets (29) - (37) (29) - - (95)
Share of results of associates
and joint ventures (2) - 22 - - - 20
Underlying profit / (loss) before tax 309 54 94 256 (180) 27 560
GroupReconciliation of underlying profit before tax to profit before tax €m
Underlying profit before tax 560
Gain arising on the movement in the Group's credit spreads 19
Loss on liability management exercises (19)
Cost of restructuring programme (10)
Gross-up for policyholder tax in the Life business 5
Investment return on treasury stock held for policyholders 2
Profit before tax 557
1 Other reconciling items represent inter segment transactions which are eliminated upon consolidation and the application of hedge accounting at Group level.
BOI Interim Report 2017 BACK.qxp_Layout 1 27/07/2017 20:09 Page 67
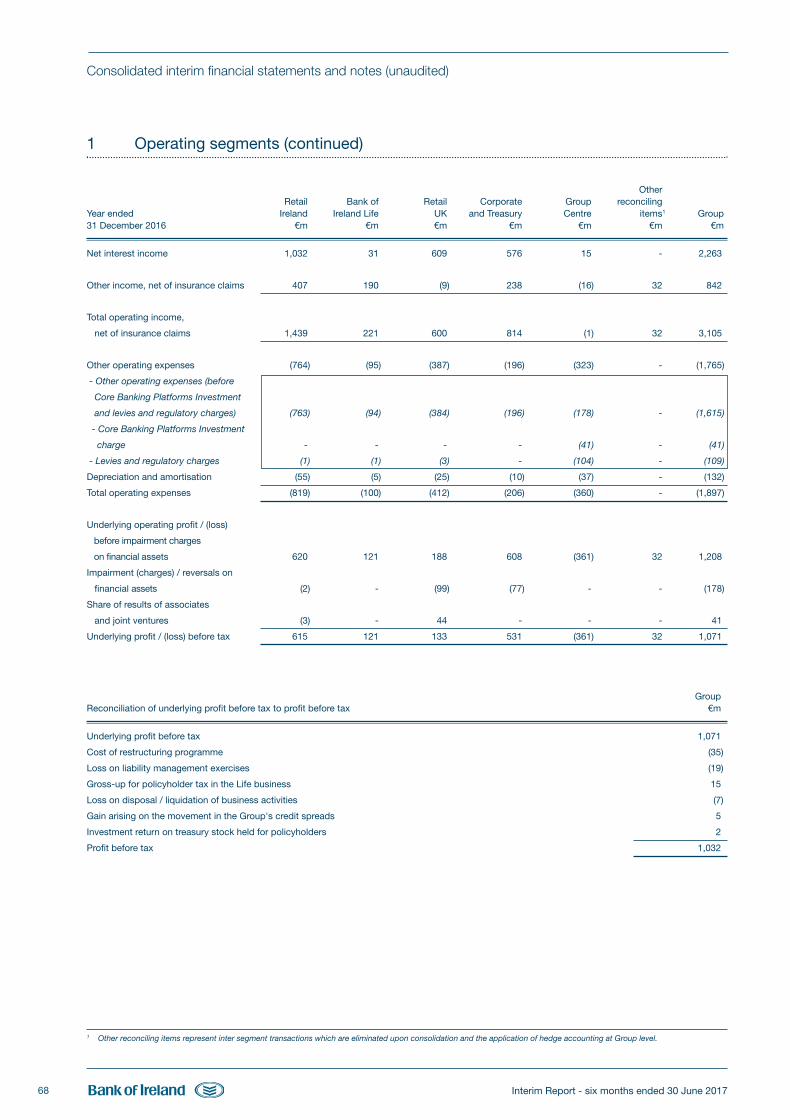
Interim Report - six months ended 30 June 201768
Consolidated interim financial statements and notes (unaudited)
1 Operating segments (continued)
OtherRetail Bank of Retail Corporate Group reconciling
Year ended Ireland Ireland Life UK and Treasury Centre items1 Group31 December 2016 €m €m €m €m €m €m €m
Net interest income 1,032 31 609 576 15 - 2,263
Other income, net of insurance claims 407 190 (9) 238 (16) 32 842
Total operating income,
net of insurance claims 1,439 221 600 814 (1) 32 3,105
Other operating expenses (764) (95) (387) (196) (323) - (1,765)
- Other operating expenses (before
Core Banking Platforms Investment
and levies and regulatory charges) (763) (94) (384) (196) (178) - (1,615)
- Core Banking Platforms Investment
charge - - - - (41) - (41)
- Levies and regulatory charges (1) (1) (3) - (104) - (109)
Depreciation and amortisation (55) (5) (25) (10) (37) - (132)
Total operating expenses (819) (100) (412) (206) (360) - (1,897)
Underlying operating profit / (loss)
before impairment charges
on financial assets 620 121 188 608 (361) 32 1,208
Impairment (charges) / reversals on
financial assets (2) - (99) (77) - - (178)
Share of results of associates
and joint ventures (3) - 44 - - - 41
Underlying profit / (loss) before tax 615 121 133 531 (361) 32 1,071
GroupReconciliation of underlying profit before tax to profit before tax €m
Underlying profit before tax 1,071
Cost of restructuring programme (35)
Loss on liability management exercises (19)
Gross-up for policyholder tax in the Life business 15
Loss on disposal / liquidation of business activities (7)
Gain arising on the movement in the Group's credit spreads 5
Investment return on treasury stock held for policyholders 2
Profit before tax 1,032
1 Other reconciling items represent inter segment transactions which are eliminated upon consolidation and the application of hedge accounting at Group level.
BOI Interim Report 2017 BACK.qxp_Layout 1 27/07/2017 20:09 Page 68
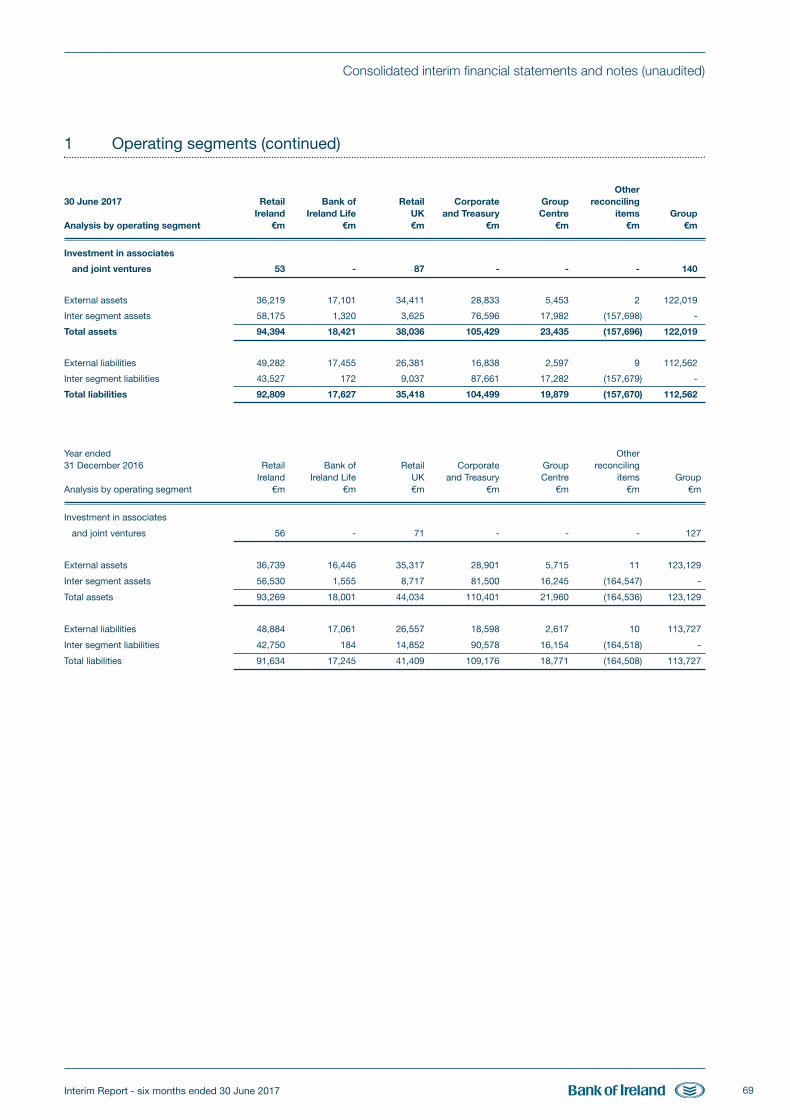
Interim Report - six months ended 30 June 2017 69
Consolidated interim financial statements and notes (unaudited)
1 Operating segments (continued)
Other30 June 2017 Retail Bank of Retail Corporate Group reconciling
Ireland Ireland Life UK and Treasury Centre items GroupAnalysis by operating segment €m €m €m €m €m €m €m
Investment in associates
and joint ventures 53 - 87 - - - 140
External assets 36,219 17,101 34,411 28,833 5,453 2 122,019
Inter segment assets 58,175 1,320 3,625 76,596 17,982 (157,698) -
Total assets 94,394 18,421 38,036 105,429 23,435 (157,696) 122,019
External liabilities 49,282 17,455 26,381 16,838 2,597 9 112,562
Inter segment liabilities 43,527 172 9,037 87,661 17,282 (157,679) -
Total liabilities 92,809 17,627 35,418 104,499 19,879 (157,670) 112,562
Year ended Other31 December 2016 Retail Bank of Retail Corporate Group reconciling
Ireland Ireland Life UK and Treasury Centre items GroupAnalysis by operating segment €m €m €m €m €m €m €m
Investment in associates
and joint ventures 56 - 71 - - - 127
External assets 36,739 16,446 35,317 28,901 5,715 11 123,129
Inter segment assets 56,530 1,555 8,717 81,500 16,245 (164,547) -
Total assets 93,269 18,001 44,034 110,401 21,960 (164,536) 123,129
External liabilities 48,884 17,061 26,557 18,598 2,617 10 113,727
Inter segment liabilities 42,750 184 14,852 90,578 16,154 (164,518) -
Total liabilities 91,634 17,245 41,409 109,176 18,771 (164,508) 113,727
BOI Interim Report 2017 BACK.qxp_Layout 1 27/07/2017 20:09 Page 69
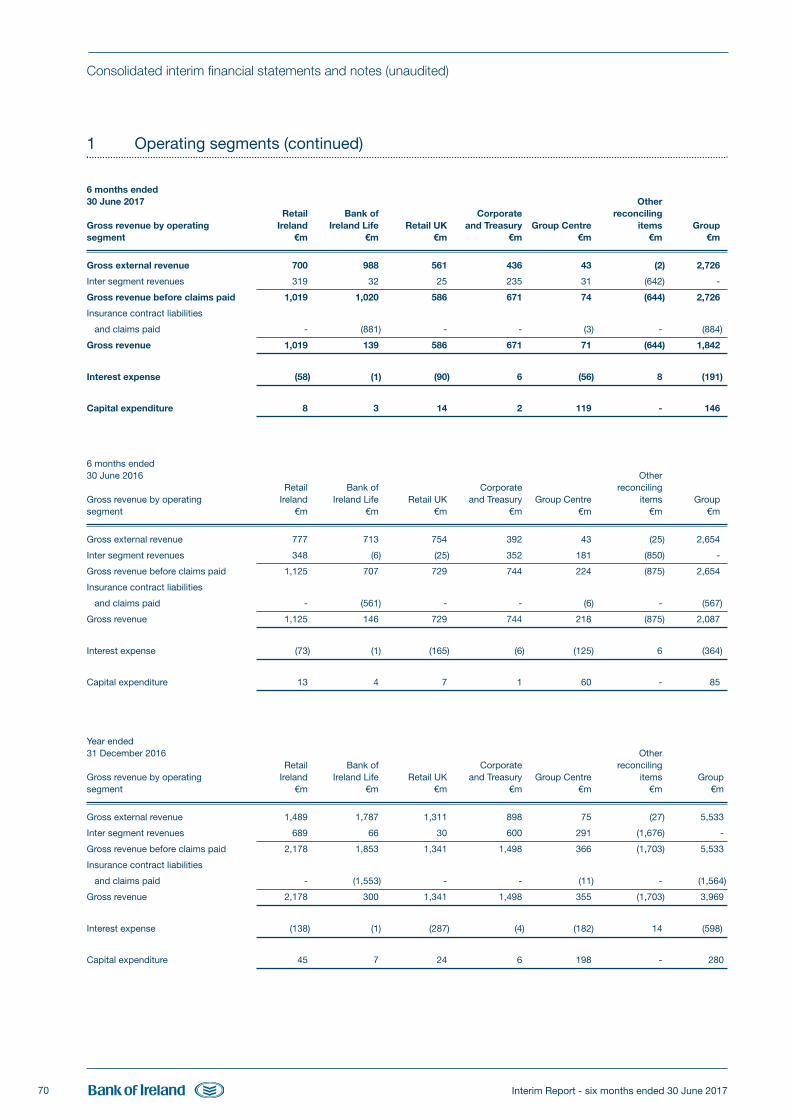
70
Consolidated interim financial statements and notes (unaudited)
Interim Report - six months ended 30 June 2017
1 Operating segments (continued)
6 months ended30 June 2017 Other
Retail Bank of Corporate reconcilingGross revenue by operating Ireland Ireland Life Retail UK and Treasury Group Centre items Groupsegment €m €m €m €m €m €m €m
Gross external revenue 700 988 561 436 43 (2) 2,726
Inter segment revenues 319 32 25 235 31 (642) -
Gross revenue before claims paid 1,019 1,020 586 671 74 (644) 2,726
Insurance contract liabilities
and claims paid - (881) - - (3) - (884)
Gross revenue 1,019 139 586 671 71 (644) 1,842
Interest expense (58) (1) (90) 6 (56) 8 (191)
Capital expenditure 8 3 14 2 119 - 146
6 months ended30 June 2016 Other
Retail Bank of Corporate reconcilingGross revenue by operating Ireland Ireland Life Retail UK and Treasury Group Centre items Groupsegment €m €m €m €m €m €m €m
Gross external revenue 777 713 754 392 43 (25) 2,654
Inter segment revenues 348 (6) (25) 352 181 (850) -
Gross revenue before claims paid 1,125 707 729 744 224 (875) 2,654
Insurance contract liabilities
and claims paid - (561) - - (6) - (567)
Gross revenue 1,125 146 729 744 218 (875) 2,087
Interest expense (73) (1) (165) (6) (125) 6 (364)
Capital expenditure 13 4 7 1 60 - 85
Year ended31 December 2016 Other
Retail Bank of Corporate reconcilingGross revenue by operating Ireland Ireland Life Retail UK and Treasury Group Centre items Groupsegment €m €m €m €m €m €m €m
Gross external revenue 1,489 1,787 1,311 898 75 (27) 5,533
Inter segment revenues 689 66 30 600 291 (1,676) -
Gross revenue before claims paid 2,178 1,853 1,341 1,498 366 (1,703) 5,533
Insurance contract liabilities
and claims paid - (1,553) - - (11) - (1,564)
Gross revenue 2,178 300 1,341 1,498 355 (1,703) 3,969
Interest expense (138) (1) (287) (4) (182) 14 (598)
Capital expenditure 45 7 24 6 198 - 280
BOI Interim Report 2017 BACK.qxp_Layout 1 27/07/2017 20:09 Page 70
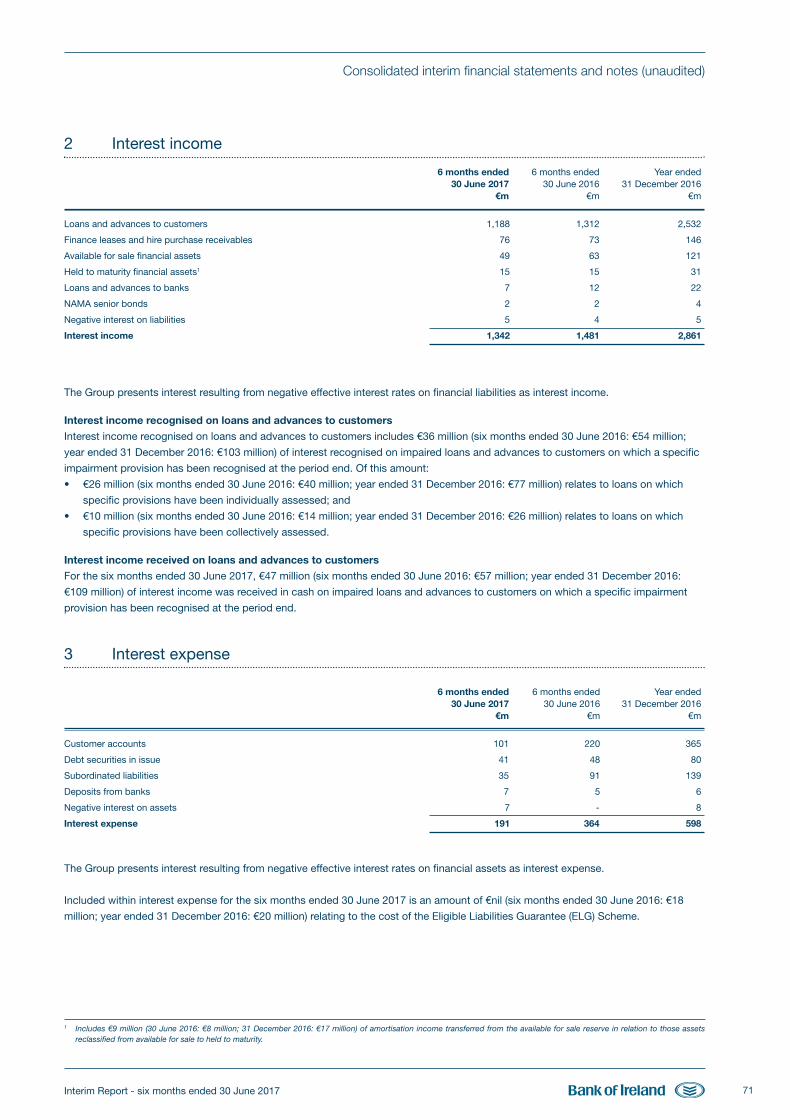
71
Consolidated interim financial statements and notes (unaudited)
Interim Report - six months ended 30 June 2017
2 Interest income
6 months ended 6 months ended Year ended30 June 2017 30 June 2016 31 December 2016
€m €m €m
Loans and advances to customers 1,188 1,312 2,532
Finance leases and hire purchase receivables 76 73 146
Available for sale financial assets 49 63 121
Held to maturity financial assets1 15 15 31
Loans and advances to banks 7 12 22
NAMA senior bonds 2 2 4
Negative interest on liabilities 5 4 5
Interest income 1,342 1,481 2,861
The Group presents interest resulting from negative effective interest rates on financial liabilities as interest income.
Interest income recognised on loans and advances to customers
Interest income recognised on loans and advances to customers includes €36 million (six months ended 30 June 2016: €54 million;
year ended 31 December 2016: €103 million) of interest recognised on impaired loans and advances to customers on which a specific
impairment provision has been recognised at the period end. Of this amount:
• €26 million (six months ended 30 June 2016: €40 million; year ended 31 December 2016: €77 million) relates to loans on which
specific provisions have been individually assessed; and
• €10 million (six months ended 30 June 2016: €14 million; year ended 31 December 2016: €26 million) relates to loans on which
specific provisions have been collectively assessed.
Interest income received on loans and advances to customers
For the six months ended 30 June 2017, €47 million (six months ended 30 June 2016: €57 million; year ended 31 December 2016:
€109 million) of interest income was received in cash on impaired loans and advances to customers on which a specific impairment
provision has been recognised at the period end.
3 Interest expense
6 months ended 6 months ended Year ended30 June 2017 30 June 2016 31 December 2016
€m €m €m
Customer accounts 101 220 365
Debt securities in issue 41 48 80
Subordinated liabilities 35 91 139
Deposits from banks 7 5 6
Negative interest on assets 7 - 8
Interest expense 191 364 598
The Group presents interest resulting from negative effective interest rates on financial assets as interest expense.
Included within interest expense for the six months ended 30 June 2017 is an amount of €nil (six months ended 30 June 2016: €18
million; year ended 31 December 2016: €20 million) relating to the cost of the Eligible Liabilities Guarantee (ELG) Scheme.
1 Includes €9 million (30 June 2016: €8 million; 31 December 2016: €17 million) of amortisation income transferred from the available for sale reserve in relation to those assetsreclassified from available for sale to held to maturity.
BOI Interim Report 2017 BACK.qxp_Layout 1 27/07/2017 20:09 Page 71
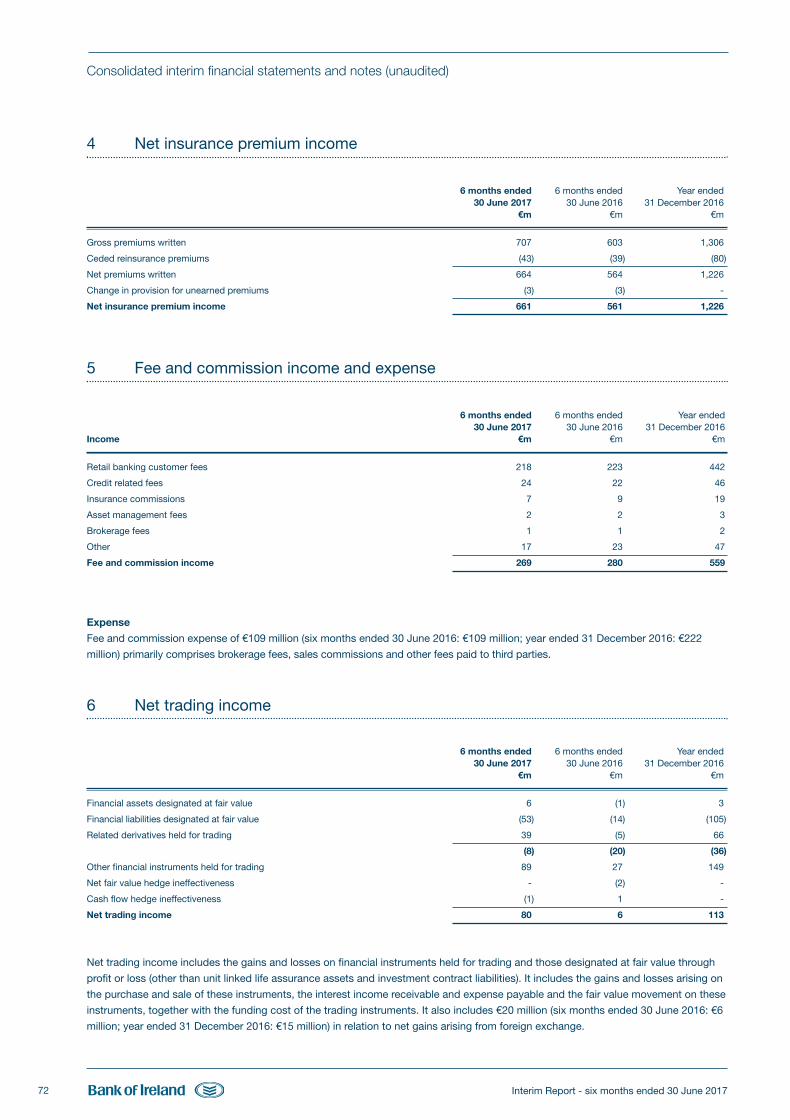
72
Consolidated interim financial statements and notes (unaudited)
Interim Report - six months ended 30 June 2017
4 Net insurance premium income
6 months ended 6 months ended Year ended30 June 2017 30 June 2016 31 December 2016
€m €m €m
Gross premiums written 707 603 1,306
Ceded reinsurance premiums (43) (39) (80)
Net premiums written 664 564 1,226
Change in provision for unearned premiums (3) (3) -
Net insurance premium income 661 561 1,226
5 Fee and commission income and expense
6 months ended 6 months ended Year ended30 June 2017 30 June 2016 31 December 2016
Income €m €m €m
Retail banking customer fees 218 223 442
Credit related fees 24 22 46
Insurance commissions 7 9 19
Asset management fees 2 2 3
Brokerage fees 1 1 2
Other 17 23 47
Fee and commission income 269 280 559
Expense
Fee and commission expense of €109 million (six months ended 30 June 2016: €109 million; year ended 31 December 2016: €222
million) primarily comprises brokerage fees, sales commissions and other fees paid to third parties.
6 Net trading income
6 months ended 6 months ended Year ended30 June 2017 30 June 2016 31 December 2016
€m €m €m
Financial assets designated at fair value 6 (1) 3
Financial liabilities designated at fair value (53) (14) (105)
Related derivatives held for trading 39 (5) 66
(8) (20) (36)
Other financial instruments held for trading 89 27 149
Net fair value hedge ineffectiveness - (2) -
Cash flow hedge ineffectiveness (1) 1 -
Net trading income 80 6 113
Net trading income includes the gains and losses on financial instruments held for trading and those designated at fair value through
profit or loss (other than unit linked life assurance assets and investment contract liabilities). It includes the gains and losses arising on
the purchase and sale of these instruments, the interest income receivable and expense payable and the fair value movement on these
instruments, together with the funding cost of the trading instruments. It also includes €20 million (six months ended 30 June 2016: €6
million; year ended 31 December 2016: €15 million) in relation to net gains arising from foreign exchange.
BOI Interim Report 2017 BACK.qxp_Layout 1 27/07/2017 20:09 Page 72
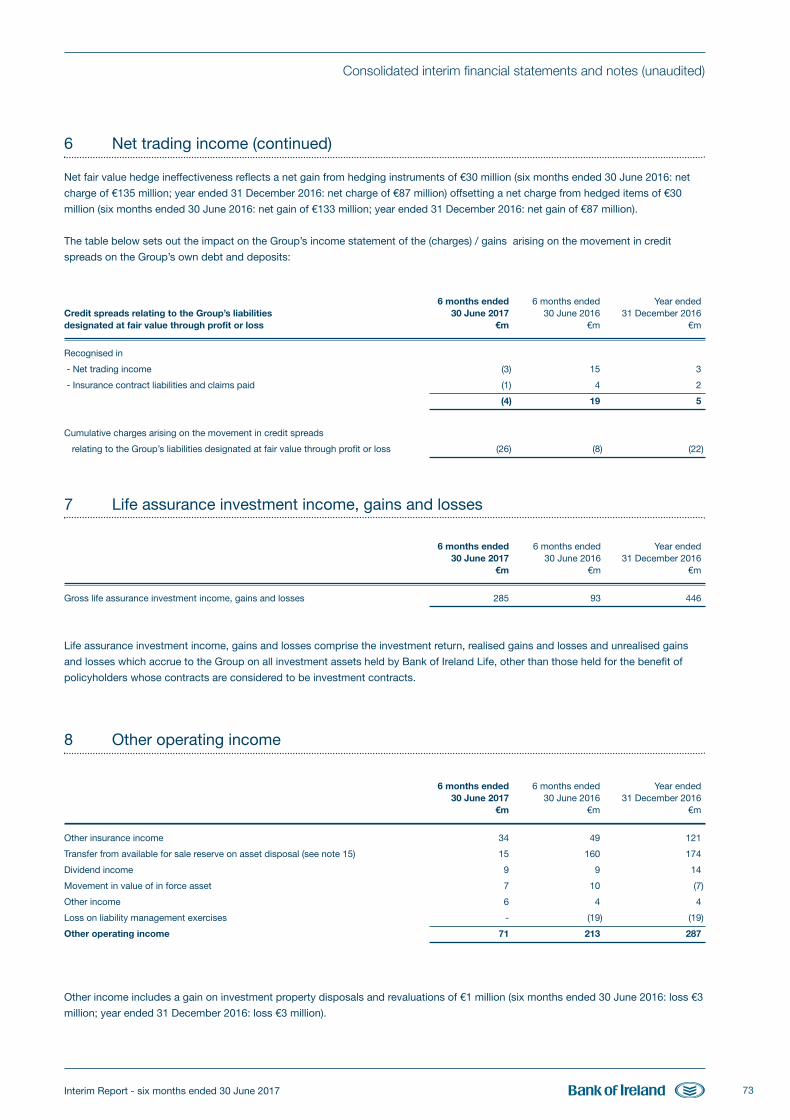
73
Consolidated interim financial statements and notes (unaudited)
Interim Report - six months ended 30 June 2017
6 Net trading income (continued)
Net fair value hedge ineffectiveness reflects a net gain from hedging instruments of €30 million (six months ended 30 June 2016: net
charge of €135 million; year ended 31 December 2016: net charge of €87 million) offsetting a net charge from hedged items of €30
million (six months ended 30 June 2016: net gain of €133 million; year ended 31 December 2016: net gain of €87 million).
The table below sets out the impact on the Group’s income statement of the (charges) / gains arising on the movement in credit
spreads on the Group’s own debt and deposits:
6 months ended 6 months ended Year endedCredit spreads relating to the Group’s liabilities 30 June 2017 30 June 2016 31 December 2016designated at fair value through profit or loss €m €m €m
Recognised in
- Net trading income (3) 15 3
- Insurance contract liabilities and claims paid (1) 4 2
(4) 19 5
Cumulative charges arising on the movement in credit spreads
relating to the Group’s liabilities designated at fair value through profit or loss (26) (8) (22)
7 Life assurance investment income, gains and losses
6 months ended 6 months ended Year ended30 June 2017 30 June 2016 31 December 2016
€m €m €m
Gross life assurance investment income, gains and losses 285 93 446
Life assurance investment income, gains and losses comprise the investment return, realised gains and losses and unrealised gains
and losses which accrue to the Group on all investment assets held by Bank of Ireland Life, other than those held for the benefit of
policyholders whose contracts are considered to be investment contracts.
8 Other operating income
6 months ended 6 months ended Year ended30 June 2017 30 June 2016 31 December 2016
€m €m €m
Other insurance income 34 49 121
Transfer from available for sale reserve on asset disposal (see note 15) 15 160 174
Dividend income 9 9 14
Movement in value of in force asset 7 10 (7)
Other income 6 4 4
Loss on liability management exercises - (19) (19)
Other operating income 71 213 287
Other income includes a gain on investment property disposals and revaluations of €1 million (six months ended 30 June 2016: loss €3
million; year ended 31 December 2016: loss €3 million).
BOI Interim Report 2017 BACK.qxp_Layout 1 27/07/2017 20:09 Page 73
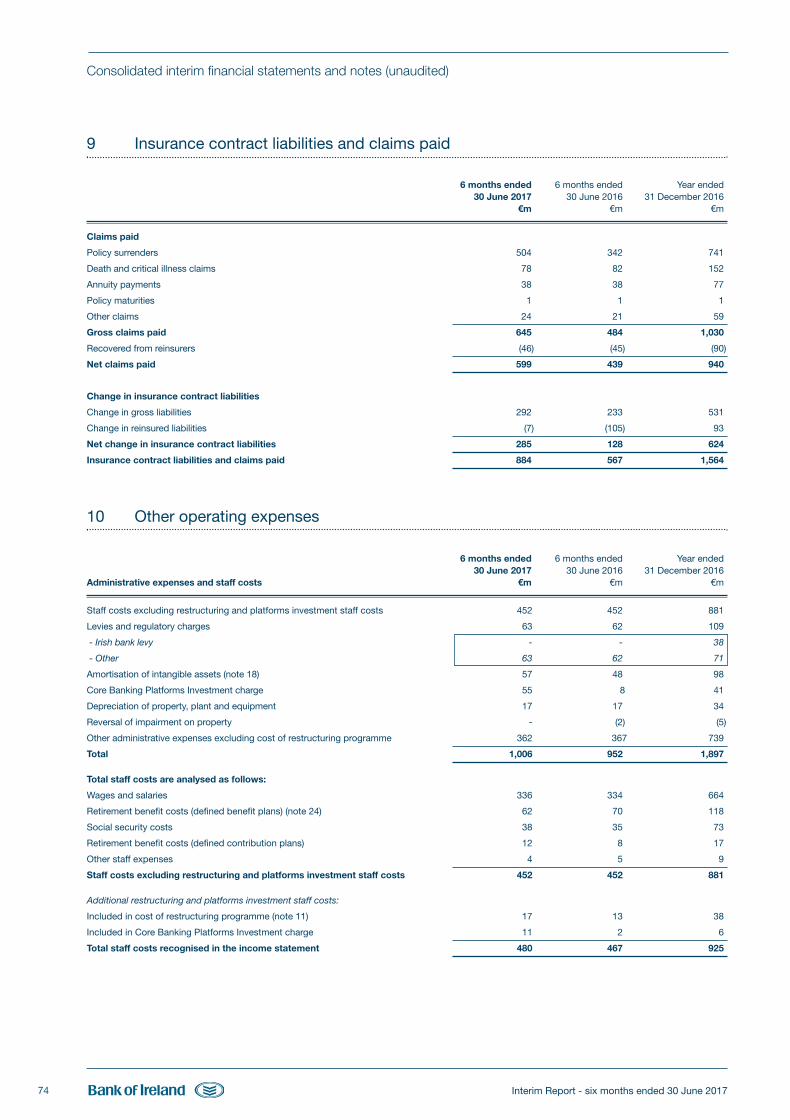
74
Consolidated interim financial statements and notes (unaudited)
Interim Report - six months ended 30 June 2017
9 Insurance contract liabilities and claims paid
6 months ended 6 months ended Year ended30 June 2017 30 June 2016 31 December 2016
€m €m €m
Claims paid
Policy surrenders 504 342 741
Death and critical illness claims 78 82 152
Annuity payments 38 38 77
Policy maturities 1 1 1
Other claims 24 21 59
Gross claims paid 645 484 1,030
Recovered from reinsurers (46) (45) (90)
Net claims paid 599 439 940
Change in insurance contract liabilities
Change in gross liabilities 292 233 531
Change in reinsured liabilities (7) (105) 93
Net change in insurance contract liabilities 285 128 624
Insurance contract liabilities and claims paid 884 567 1,564
10 Other operating expenses
6 months ended 6 months ended Year ended30 June 2017 30 June 2016 31 December 2016
Administrative expenses and staff costs €m €m €m
Staff costs excluding restructuring and platforms investment staff costs 452 452 881
Levies and regulatory charges 63 62 109
- Irish bank levy - - 38
- Other 63 62 71
Amortisation of intangible assets (note 18) 57 48 98
Core Banking Platforms Investment charge 55 8 41
Depreciation of property, plant and equipment 17 17 34
Reversal of impairment on property - (2) (5)
Other administrative expenses excluding cost of restructuring programme 362 367 739
Total 1,006 952 1,897
Total staff costs are analysed as follows:
Wages and salaries 336 334 664
Retirement benefit costs (defined benefit plans) (note 24) 62 70 118
Social security costs 38 35 73
Retirement benefit costs (defined contribution plans) 12 8 17
Other staff expenses 4 5 9
Staff costs excluding restructuring and platforms investment staff costs 452 452 881
Additional restructuring and platforms investment staff costs:
Included in cost of restructuring programme (note 11) 17 13 38
Included in Core Banking Platforms Investment charge 11 2 6
Total staff costs recognised in the income statement 480 467 925
BOI Interim Report 2017 BACK.qxp_Layout 1 27/07/2017 20:09 Page 74
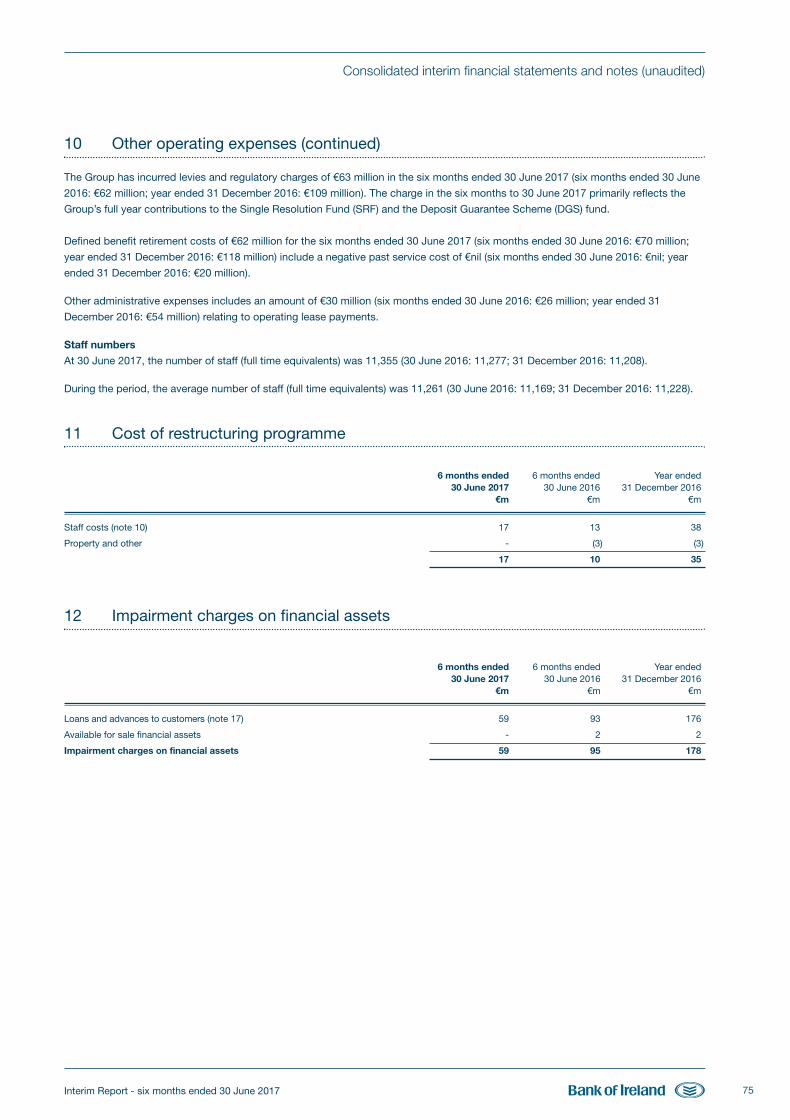
75
Consolidated interim financial statements and notes (unaudited)
Interim Report - six months ended 30 June 2017
10 Other operating expenses (continued)
The Group has incurred levies and regulatory charges of €63 million in the six months ended 30 June 2017 (six months ended 30 June
2016: €62 million; year ended 31 December 2016: €109 million). The charge in the six months to 30 June 2017 primarily reflects the
Group’s full year contributions to the Single Resolution Fund (SRF) and the Deposit Guarantee Scheme (DGS) fund.
Defined benefit retirement costs of €62 million for the six months ended 30 June 2017 (six months ended 30 June 2016: €70 million;
year ended 31 December 2016: €118 million) include a negative past service cost of €nil (six months ended 30 June 2016: €nil; year
ended 31 December 2016: €20 million).
Other administrative expenses includes an amount of €30 million (six months ended 30 June 2016: €26 million; year ended 31
December 2016: €54 million) relating to operating lease payments.
Staff numbers
At 30 June 2017, the number of staff (full time equivalents) was 11,355 (30 June 2016: 11,277; 31 December 2016: 11,208).
During the period, the average number of staff (full time equivalents) was 11,261 (30 June 2016: 11,169; 31 December 2016: 11,228).
11 Cost of restructuring programme
6 months ended 6 months ended Year ended30 June 2017 30 June 2016 31 December 2016
€m €m €m
Staff costs (note 10) 17 13 38
Property and other - (3) (3)
17 10 35
12 Impairment charges on financial assets
6 months ended 6 months ended Year ended30 June 2017 30 June 2016 31 December 2016
€m €m €m
Loans and advances to customers (note 17) 59 93 176
Available for sale financial assets - 2 2
Impairment charges on financial assets 59 95 178
BOI Interim Report 2017 BACK.qxp_Layout 1 27/07/2017 20:09 Page 75
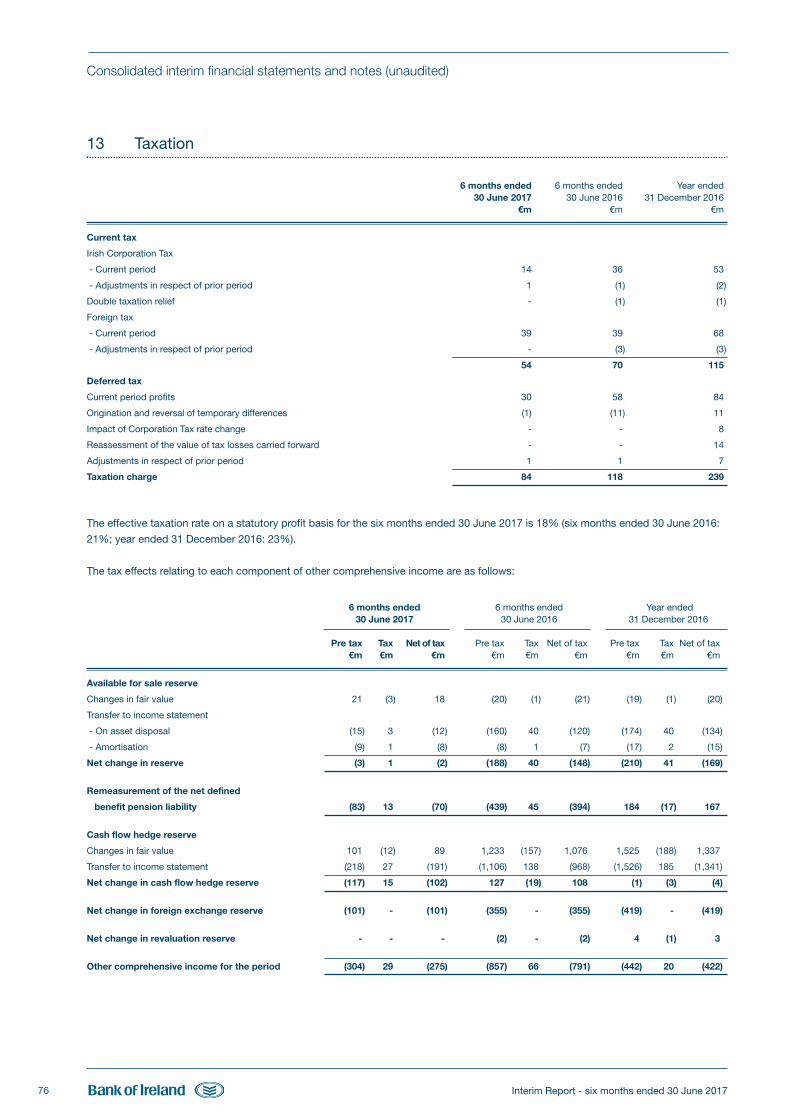
76
Consolidated interim financial statements and notes (unaudited)
Interim Report - six months ended 30 June 2017
13 Taxation
6 months ended 6 months ended Year ended30 June 2017 30 June 2016 31 December 2016
€m €m €m
Current tax
Irish Corporation Tax
- Current period 14 36 53
- Adjustments in respect of prior period 1 (1) (2)
Double taxation relief - (1) (1)
Foreign tax
- Current period 39 39 68
- Adjustments in respect of prior period - (3) (3)
54 70 115
Deferred tax
Current period profits 30 58 84
Origination and reversal of temporary differences (1) (11) 11
Impact of Corporation Tax rate change - - 8
Reassessment of the value of tax losses carried forward - - 14
Adjustments in respect of prior period 1 1 7
Taxation charge 84 118 239
The effective taxation rate on a statutory profit basis for the six months ended 30 June 2017 is 18% (six months ended 30 June 2016:
21%; year ended 31 December 2016: 23%).
The tax effects relating to each component of other comprehensive income are as follows:
6 months ended 6 months ended Year ended 30 June 2017 30 June 2016 31 December 2016
Pre tax Tax Net of tax Pre tax Tax Net of tax Pre tax Tax Net of tax €m €m €m €m €m €m €m €m €m
Available for sale reserve
Changes in fair value 21 (3) 18 (20) (1) (21) (19) (1) (20)
Transfer to income statement
- On asset disposal (15) 3 (12) (160) 40 (120) (174) 40 (134)
- Amortisation (9) 1 (8) (8) 1 (7) (17) 2 (15)
Net change in reserve (3) 1 (2) (188) 40 (148) (210) 41 (169)
Remeasurement of the net defined
benefit pension liability (83) 13 (70) (439) 45 (394) 184 (17) 167
Cash flow hedge reserve
Changes in fair value 101 (12) 89 1,233 (157) 1,076 1,525 (188) 1,337
Transfer to income statement (218) 27 (191) (1,106) 138 (968) (1,526) 185 (1,341)
Net change in cash flow hedge reserve (117) 15 (102) 127 (19) 108 (1) (3) (4)
Net change in foreign exchange reserve (101) - (101) (355) - (355) (419) - (419)
Net change in revaluation reserve - - - (2) - (2) 4 (1) 3
Other comprehensive income for the period (304) 29 (275) (857) 66 (791) (442) 20 (422)
BOI Interim Report 2017 BACK.qxp_Layout 1 27/07/2017 20:09 Page 76
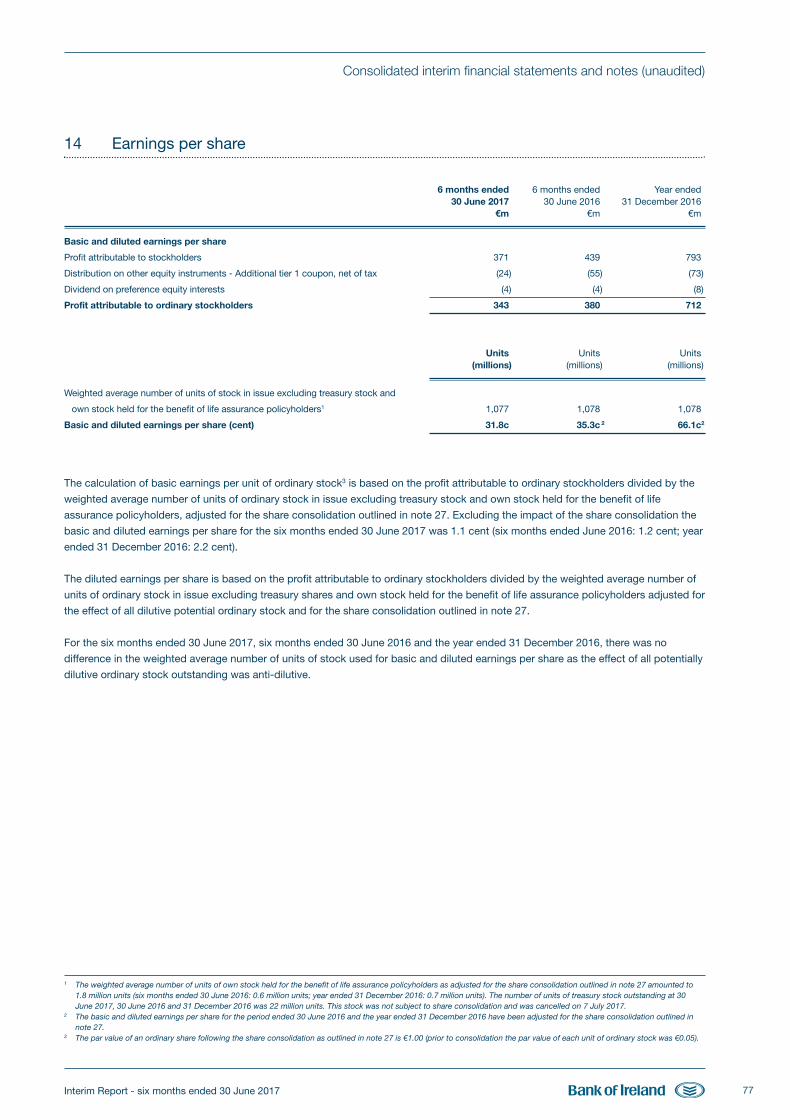
77
Consolidated interim financial statements and notes (unaudited)
Interim Report - six months ended 30 June 2017
14 Earnings per share
6 months ended 6 months ended Year ended30 June 2017 30 June 2016 31 December 2016
€m €m €m
Basic and diluted earnings per share
Profit attributable to stockholders 371 439 793
Distribution on other equity instruments - Additional tier 1 coupon, net of tax (24) (55) (73)
Dividend on preference equity interests (4) (4) (8)
Profit attributable to ordinary stockholders 343 380 712
Units Units Units(millions) (millions) (millions)
Weighted average number of units of stock in issue excluding treasury stock and
own stock held for the benefit of life assurance policyholders1 1,077 1,078 1,078
Basic and diluted earnings per share (cent) 31.8c 35.3c 2 66.1c2
The calculation of basic earnings per unit of ordinary stock3 is based on the profit attributable to ordinary stockholders divided by the
weighted average number of units of ordinary stock in issue excluding treasury stock and own stock held for the benefit of life
assurance policyholders, adjusted for the share consolidation outlined in note 27. Excluding the impact of the share consolidation the
basic and diluted earnings per share for the six months ended 30 June 2017 was 1.1 cent (six months ended June 2016: 1.2 cent; year
ended 31 December 2016: 2.2 cent).
The diluted earnings per share is based on the profit attributable to ordinary stockholders divided by the weighted average number of
units of ordinary stock in issue excluding treasury shares and own stock held for the benefit of life assurance policyholders adjusted for
the effect of all dilutive potential ordinary stock and for the share consolidation outlined in note 27.
For the six months ended 30 June 2017, six months ended 30 June 2016 and the year ended 31 December 2016, there was no
difference in the weighted average number of units of stock used for basic and diluted earnings per share as the effect of all potentially
dilutive ordinary stock outstanding was anti-dilutive.
1 The weighted average number of units of own stock held for the benefit of life assurance policyholders as adjusted for the share consolidation outlined in note 27 amounted to1.8 million units (six months ended 30 June 2016: 0.6 million units; year ended 31 December 2016: 0.7 million units). The number of units of treasury stock outstanding at 30June 2017, 30 June 2016 and 31 December 2016 was 22 million units. This stock was not subject to share consolidation and was cancelled on 7 July 2017.
2 The basic and diluted earnings per share for the period ended 30 June 2016 and the year ended 31 December 2016 have been adjusted for the share consolidation outlined innote 27.
3 The par value of an ordinary share following the share consolidation as outlined in note 27 is €1.00 (prior to consolidation the par value of each unit of ordinary stock was €0.05).
BOI Interim Report 2017 BACK.qxp_Layout 1 27/07/2017 20:09 Page 77
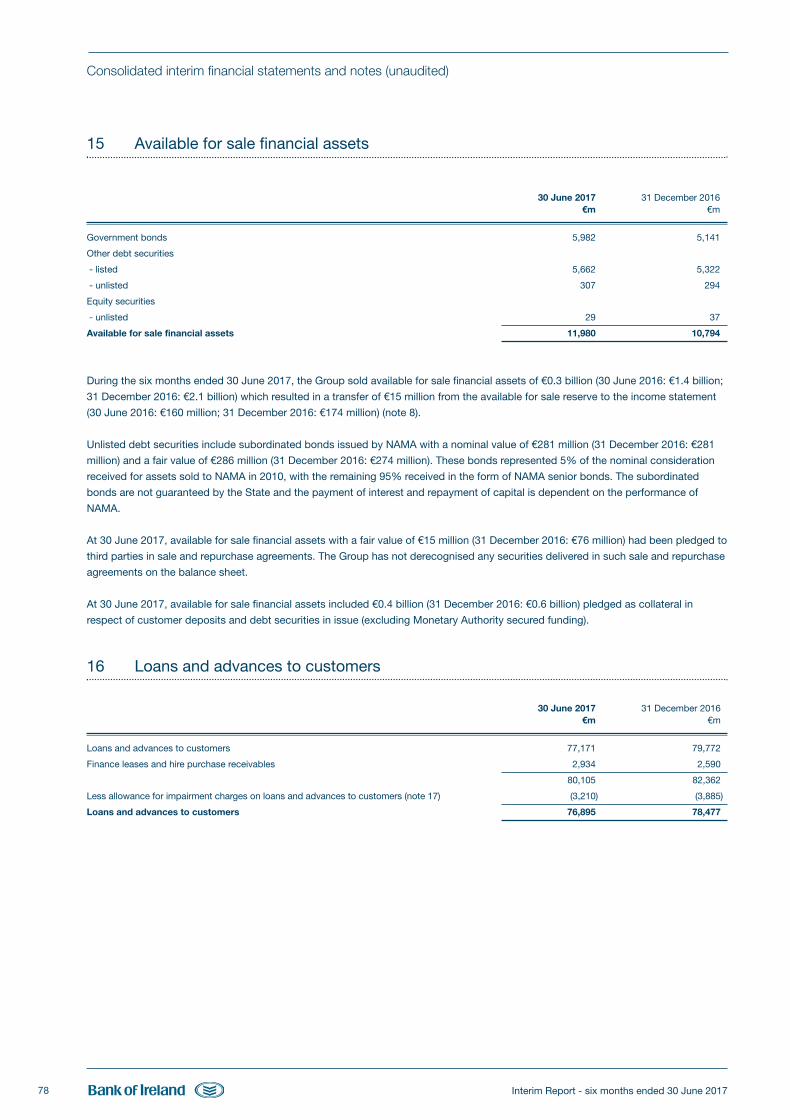
Interim Report - six months ended 30 June 201778
Consolidated interim financial statements and notes (unaudited)
15 Available for sale financial assets
30 June 2017 31 December 2016€m €m
Government bonds 5,982 5,141
Other debt securities
- listed 5,662 5,322
- unlisted 307 294
Equity securities
- unlisted 29 37
Available for sale financial assets 11,980 10,794
During the six months ended 30 June 2017, the Group sold available for sale financial assets of €0.3 billion (30 June 2016: €1.4 billion;
31 December 2016: €2.1 billion) which resulted in a transfer of €15 million from the available for sale reserve to the income statement
(30 June 2016: €160 million; 31 December 2016: €174 million) (note 8).
Unlisted debt securities include subordinated bonds issued by NAMA with a nominal value of €281 million (31 December 2016: €281
million) and a fair value of €286 million (31 December 2016: €274 million). These bonds represented 5% of the nominal consideration
received for assets sold to NAMA in 2010, with the remaining 95% received in the form of NAMA senior bonds. The subordinated
bonds are not guaranteed by the State and the payment of interest and repayment of capital is dependent on the performance of
NAMA.
At 30 June 2017, available for sale financial assets with a fair value of €15 million (31 December 2016: €76 million) had been pledged to
third parties in sale and repurchase agreements. The Group has not derecognised any securities delivered in such sale and repurchase
agreements on the balance sheet.
At 30 June 2017, available for sale financial assets included €0.4 billion (31 December 2016: €0.6 billion) pledged as collateral in
respect of customer deposits and debt securities in issue (excluding Monetary Authority secured funding).
16 Loans and advances to customers
30 June 2017 31 December 2016 €m €m
Loans and advances to customers 77,171 79,772
Finance leases and hire purchase receivables 2,934 2,590
80,105 82,362
Less allowance for impairment charges on loans and advances to customers (note 17) (3,210) (3,885)
Loans and advances to customers 76,895 78,477
BOI Interim Report 2017 BACK.qxp_Layout 1 27/07/2017 20:09 Page 78
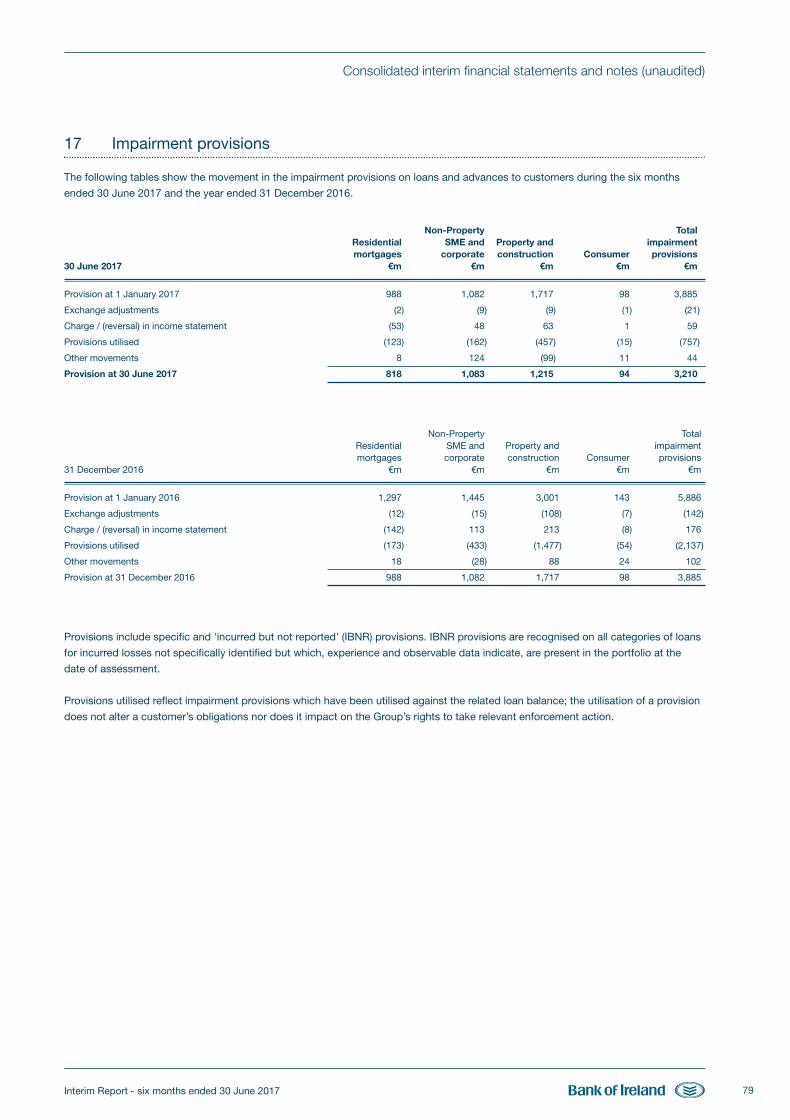
Interim Report - six months ended 30 June 2017 79
Consolidated interim financial statements and notes (unaudited)
17 Impairment provisions
The following tables show the movement in the impairment provisions on loans and advances to customers during the six months
ended 30 June 2017 and the year ended 31 December 2016.
Non-Property Total Residential SME and Property and impairment mortgages corporate construction Consumer provisions30 June 2017 €m €m €m €m €m
Provision at 1 January 2017 988 1,082 1,717 98 3,885
Exchange adjustments (2) (9) (9) (1) (21)
Charge / (reversal) in income statement (53) 48 63 1 59
Provisions utilised (123) (162) (457) (15) (757)
Other movements 8 124 (99) 11 44
Provision at 30 June 2017 818 1,083 1,215 94 3,210
Non-Property Total Residential SME and Property and impairment mortgages corporate construction Consumer provisions31 December 2016 €m €m €m €m €m
Provision at 1 January 2016 1,297 1,445 3,001 143 5,886
Exchange adjustments (12) (15) (108) (7) (142)
Charge / (reversal) in income statement (142) 113 213 (8) 176
Provisions utilised (173) (433) (1,477) (54) (2,137)
Other movements 18 (28) 88 24 102
Provision at 31 December 2016 988 1,082 1,717 98 3,885
Provisions include specific and 'incurred but not reported' (IBNR) provisions. IBNR provisions are recognised on all categories of loans
for incurred losses not specifically identified but which, experience and observable data indicate, are present in the portfolio at the
date of assessment.
Provisions utilised reflect impairment provisions which have been utilised against the related loan balance; the utilisation of a provision
does not alter a customer’s obligations nor does it impact on the Group’s rights to take relevant enforcement action.
BOI Interim Report 2017 BACK.qxp_Layout 1 27/07/2017 20:09 Page 79
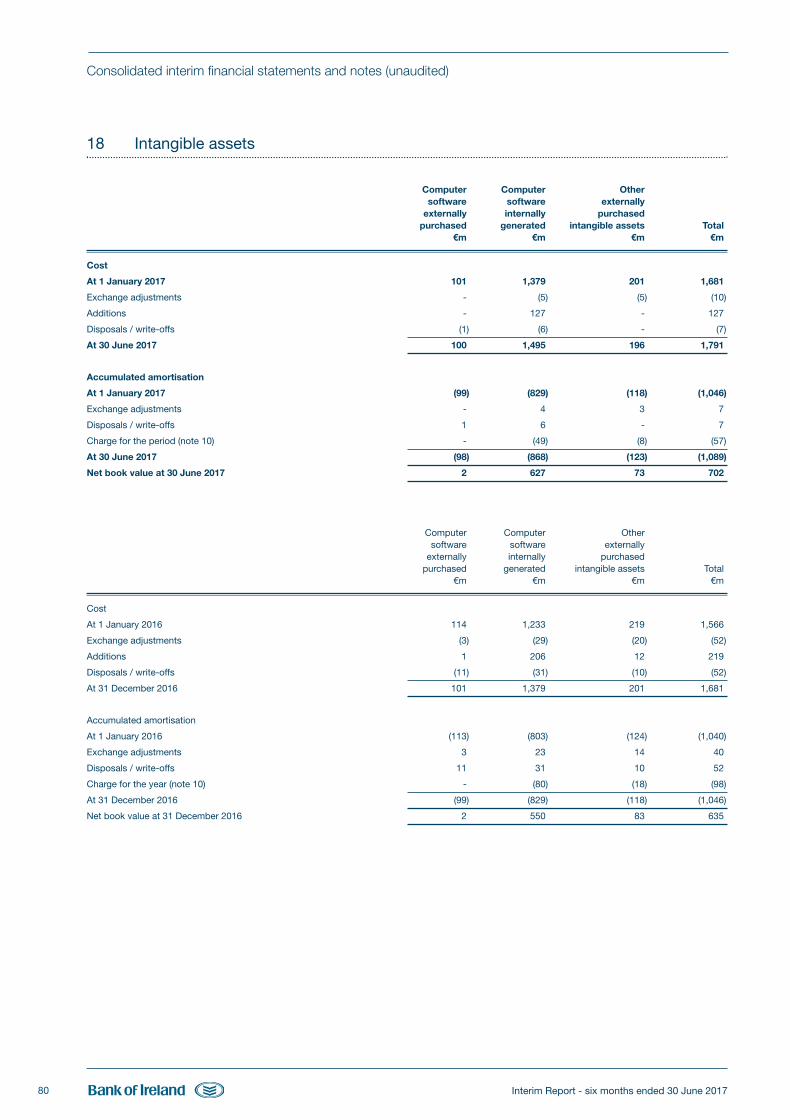
80
Consolidated interim financial statements and notes (unaudited)
Interim Report - six months ended 30 June 2017
18 Intangible assets
Computer Computer Other software software externally externally internally purchased purchased generated intangible assets Total €m €m €m €m
Cost
At 1 January 2017 101 1,379 201 1,681
Exchange adjustments - (5) (5) (10)
Additions - 127 - 127
Disposals / write-offs (1) (6) - (7)
At 30 June 2017 100 1,495 196 1,791
Accumulated amortisation
At 1 January 2017 (99) (829) (118) (1,046)
Exchange adjustments - 4 3 7
Disposals / write-offs 1 6 - 7
Charge for the period (note 10) - (49) (8) (57)
At 30 June 2017 (98) (868) (123) (1,089)
Net book value at 30 June 2017 2 627 73 702
Computer Computer Other software software externally externally internally purchased purchased generated intangible assets Total €m €m €m €m
Cost
At 1 January 2016 114 1,233 219 1,566
Exchange adjustments (3) (29) (20) (52)
Additions 1 206 12 219
Disposals / write-offs (11) (31) (10) (52)
At 31 December 2016 101 1,379 201 1,681
Accumulated amortisation
At 1 January 2016 (113) (803) (124) (1,040)
Exchange adjustments 3 23 14 40
Disposals / write-offs 11 31 10 52
Charge for the year (note 10) - (80) (18) (98)
At 31 December 2016 (99) (829) (118) (1,046)
Net book value at 31 December 2016 2 550 83 635
BOI Interim Report 2017 BACK.qxp_Layout 1 27/07/2017 20:09 Page 80
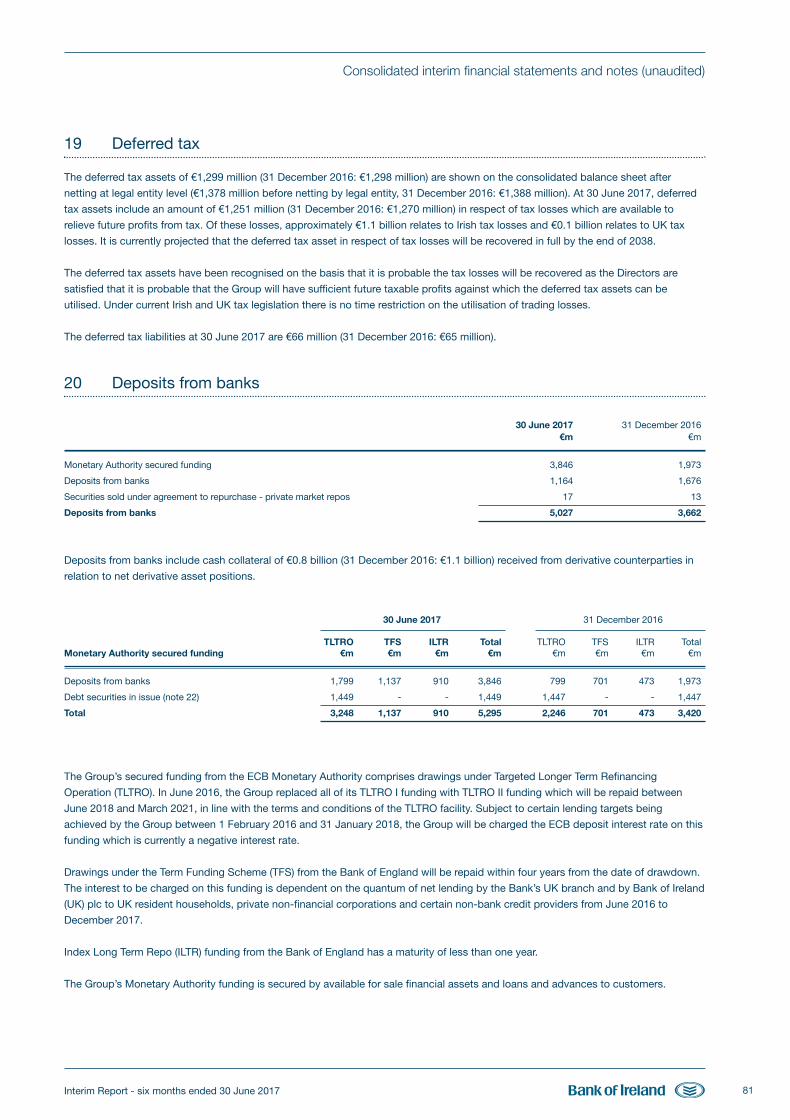
Interim Report - six months ended 30 June 2017 81
Consolidated interim financial statements and notes (unaudited)
19 Deferred tax
The deferred tax assets of €1,299 million (31 December 2016: €1,298 million) are shown on the consolidated balance sheet after
netting at legal entity level (€1,378 million before netting by legal entity, 31 December 2016: €1,388 million). At 30 June 2017, deferred
tax assets include an amount of €1,251 million (31 December 2016: €1,270 million) in respect of tax losses which are available to
relieve future profits from tax. Of these losses, approximately €1.1 billion relates to Irish tax losses and €0.1 billion relates to UK tax
losses. It is currently projected that the deferred tax asset in respect of tax losses will be recovered in full by the end of 2038.
The deferred tax assets have been recognised on the basis that it is probable the tax losses will be recovered as the Directors are
satisfied that it is probable that the Group will have sufficient future taxable profits against which the deferred tax assets can be
utilised. Under current Irish and UK tax legislation there is no time restriction on the utilisation of trading losses.
The deferred tax liabilities at 30 June 2017 are €66 million (31 December 2016: €65 million).
20 Deposits from banks
30 June 2017 31 December 2016€m €m
Monetary Authority secured funding 3,846 1,973
Deposits from banks 1,164 1,676
Securities sold under agreement to repurchase - private market repos 17 13
Deposits from banks 5,027 3,662
Deposits from banks include cash collateral of €0.8 billion (31 December 2016: €1.1 billion) received from derivative counterparties in
relation to net derivative asset positions.
30 June 2017 31 December 2016 TLTRO TFS ILTR Total TLTRO TFS ILTR TotalMonetary Authority secured funding €m €m €m €m €m €m €m €m
Deposits from banks 1,799 1,137 910 3,846 799 701 473 1,973
Debt securities in issue (note 22) 1,449 - - 1,449 1,447 - - 1,447
Total 3,248 1,137 910 5,295 2,246 701 473 3,420
The Group’s secured funding from the ECB Monetary Authority comprises drawings under Targeted Longer Term Refinancing
Operation (TLTRO). In June 2016, the Group replaced all of its TLTRO I funding with TLTRO II funding which will be repaid between
June 2018 and March 2021, in line with the terms and conditions of the TLTRO facility. Subject to certain lending targets being
achieved by the Group between 1 February 2016 and 31 January 2018, the Group will be charged the ECB deposit interest rate on this
funding which is currently a negative interest rate.
Drawings under the Term Funding Scheme (TFS) from the Bank of England will be repaid within four years from the date of drawdown.
The interest to be charged on this funding is dependent on the quantum of net lending by the Bank’s UK branch and by Bank of Ireland
(UK) plc to UK resident households, private non-financial corporations and certain non-bank credit providers from June 2016 to
December 2017.
Index Long Term Repo (ILTR) funding from the Bank of England has a maturity of less than one year.
The Group’s Monetary Authority funding is secured by available for sale financial assets and loans and advances to customers.
BOI Interim Report 2017 BACK.qxp_Layout 1 27/07/2017 20:09 Page 81
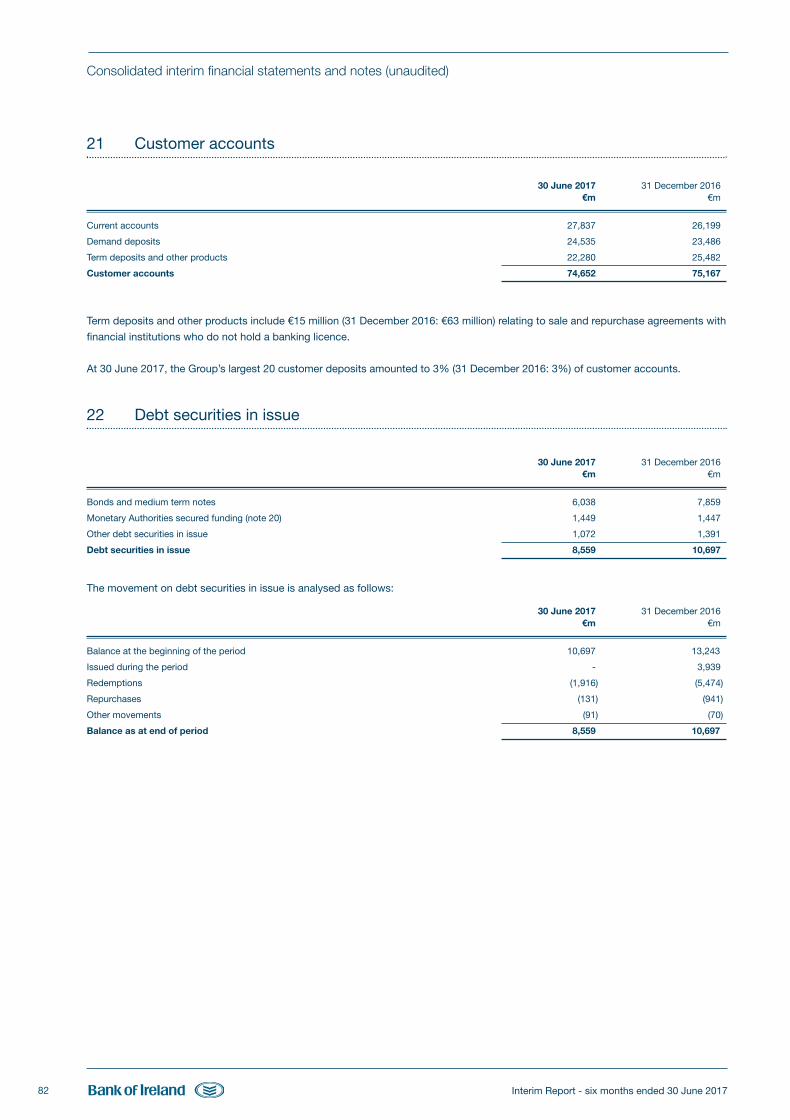
82
Consolidated interim financial statements and notes (unaudited)
Interim Report - six months ended 30 June 2017
21 Customer accounts
30 June 2017 31 December 2016€m €m
Current accounts 27,837 26,199
Demand deposits 24,535 23,486
Term deposits and other products 22,280 25,482
Customer accounts 74,652 75,167
Term deposits and other products include €15 million (31 December 2016: €63 million) relating to sale and repurchase agreements with
financial institutions who do not hold a banking licence.
At 30 June 2017, the Group’s largest 20 customer deposits amounted to 3% (31 December 2016: 3%) of customer accounts.
22 Debt securities in issue
30 June 2017 31 December 2016€m €m
Bonds and medium term notes 6,038 7,859
Monetary Authorities secured funding (note 20) 1,449 1,447
Other debt securities in issue 1,072 1,391
Debt securities in issue 8,559 10,697
The movement on debt securities in issue is analysed as follows:
30 June 2017 31 December 2016€m €m
Balance at the beginning of the period 10,697 13,243
Issued during the period - 3,939
Redemptions (1,916) (5,474)
Repurchases (131) (941)
Other movements (91) (70)
Balance as at end of period 8,559 10,697
BOI Interim Report 2017 BACK.qxp_Layout 1 27/07/2017 20:09 Page 82
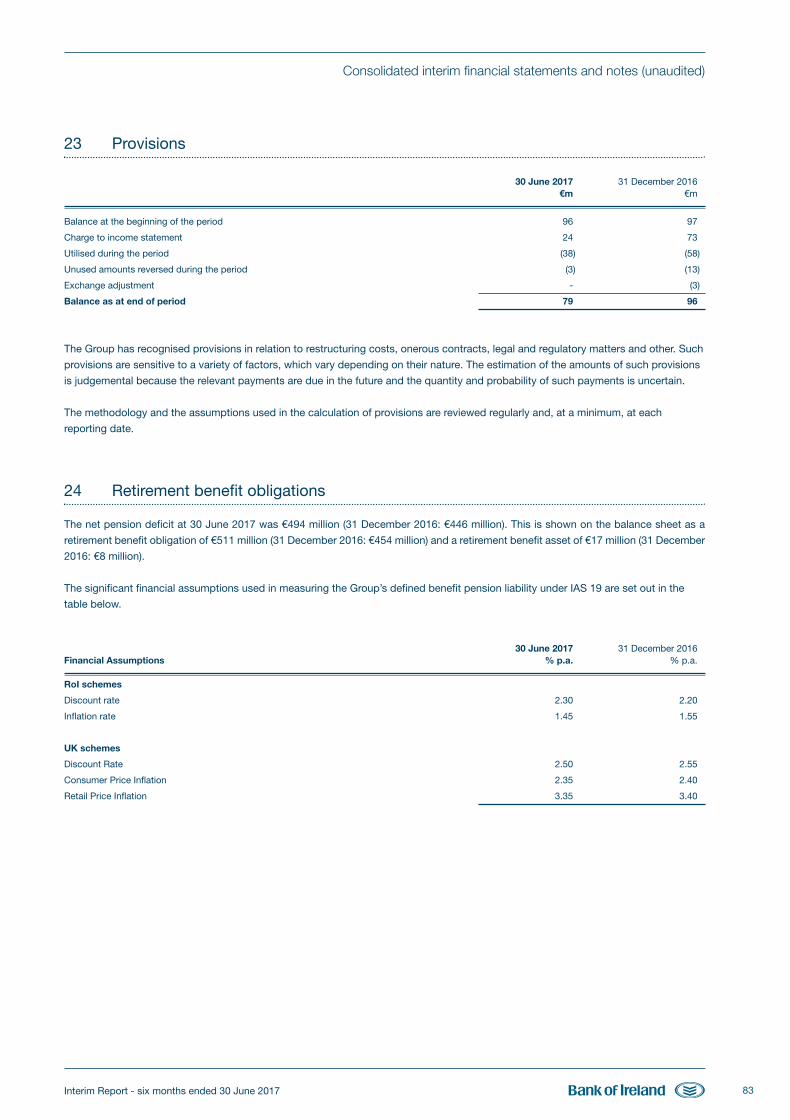
Interim Report - six months ended 30 June 2017 83
Consolidated interim financial statements and notes (unaudited)
23 Provisions
30 June 2017 31 December 2016 €m €m
Balance at the beginning of the period 96 97
Charge to income statement 24 73
Utilised during the period (38) (58)
Unused amounts reversed during the period (3) (13)
Exchange adjustment - (3)
Balance as at end of period 79 96
The Group has recognised provisions in relation to restructuring costs, onerous contracts, legal and regulatory matters and other. Such
provisions are sensitive to a variety of factors, which vary depending on their nature. The estimation of the amounts of such provisions
is judgemental because the relevant payments are due in the future and the quantity and probability of such payments is uncertain.
The methodology and the assumptions used in the calculation of provisions are reviewed regularly and, at a minimum, at each
reporting date.
24 Retirement benefit obligations
The net pension deficit at 30 June 2017 was €494 million (31 December 2016: €446 million). This is shown on the balance sheet as a
retirement benefit obligation of €511 million (31 December 2016: €454 million) and a retirement benefit asset of €17 million (31 December
2016: €8 million).
The significant financial assumptions used in measuring the Group’s defined benefit pension liability under IAS 19 are set out in the
table below.
30 June 2017 31 December 2016Financial Assumptions % p.a. % p.a.
RoI schemes
Discount rate 2.30 2.20
Inflation rate 1.45 1.55
UK schemes
Discount Rate 2.50 2.55
Consumer Price Inflation 2.35 2.40
Retail Price Inflation 3.35 3.40
BOI Interim Report 2017 BACK.qxp_Layout 1 27/07/2017 20:09 Page 83
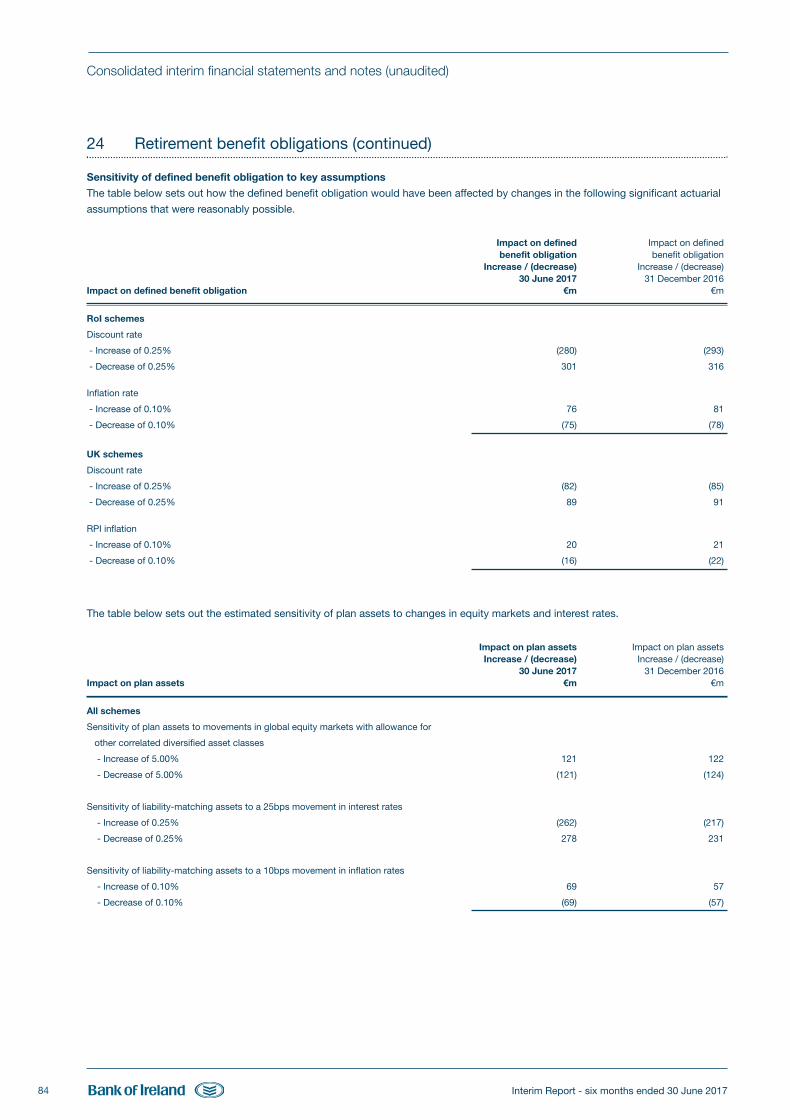
Interim Report - six months ended 30 June 201784
Consolidated interim financial statements and notes (unaudited)
24 Retirement benefit obligations (continued)
Sensitivity of defined benefit obligation to key assumptions
The table below sets out how the defined benefit obligation would have been affected by changes in the following significant actuarial
assumptions that were reasonably possible.
Impact on defined Impact on defined benefit obligation benefit obligation Increase / (decrease) Increase / (decrease) 30 June 2017 31 December 2016
Impact on defined benefit obligation €m €m
RoI schemes
Discount rate
- Increase of 0.25% (280) (293)
- Decrease of 0.25% 301 316
Inflation rate
- Increase of 0.10% 76 81
- Decrease of 0.10% (75) (78)
UK schemes
Discount rate
- Increase of 0.25% (82) (85)
- Decrease of 0.25% 89 91
RPI inflation
- Increase of 0.10% 20 21
- Decrease of 0.10% (16) (22)
The table below sets out the estimated sensitivity of plan assets to changes in equity markets and interest rates.
Impact on plan assets Impact on plan assets Increase / (decrease) Increase / (decrease) 30 June 2017 31 December 2016
Impact on plan assets €m €m
All schemes
Sensitivity of plan assets to movements in global equity markets with allowance for
other correlated diversified asset classes
- Increase of 5.00% 121 122
- Decrease of 5.00% (121) (124)
Sensitivity of liability-matching assets to a 25bps movement in interest rates
- Increase of 0.25% (262) (217)
- Decrease of 0.25% 278 231
Sensitivity of liability-matching assets to a 10bps movement in inflation rates
- Increase of 0.10% 69 57
- Decrease of 0.10% (69) (57)
BOI Interim Report 2017 BACK.qxp_Layout 1 27/07/2017 20:09 Page 84
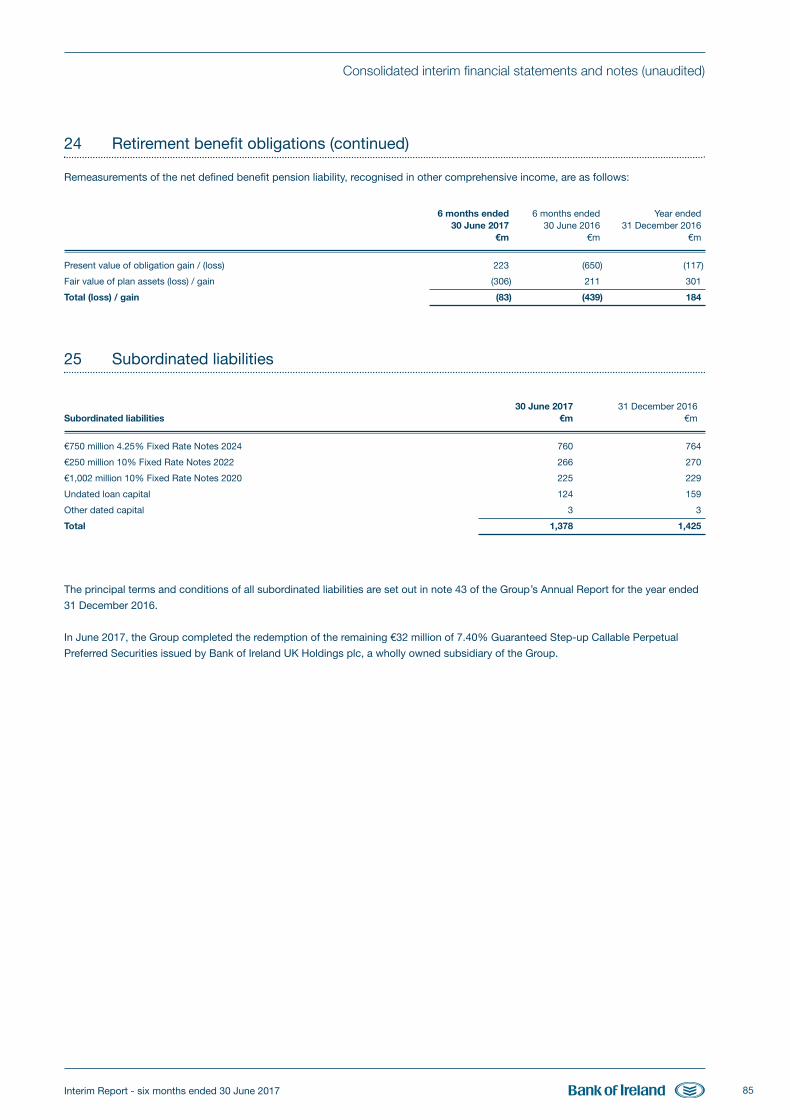
Interim Report - six months ended 30 June 2017 85
Consolidated interim financial statements and notes (unaudited)
24 Retirement benefit obligations (continued)
Remeasurements of the net defined benefit pension liability, recognised in other comprehensive income, are as follows:
6 months ended 6 months ended Year ended30 June 2017 30 June 2016 31 December 2016
€m €m €m
Present value of obligation gain / (loss) 223 (650) (117)
Fair value of plan assets (loss) / gain (306) 211 301
Total (loss) / gain (83) (439) 184
25 Subordinated liabilities
30 June 2017 31 December 2016Subordinated liabilities €m €m
€750 million 4.25% Fixed Rate Notes 2024 760 764
€250 million 10% Fixed Rate Notes 2022 266 270
€1,002 million 10% Fixed Rate Notes 2020 225 229
Undated loan capital 124 159
Other dated capital 3 3
Total 1,378 1,425
The principal terms and conditions of all subordinated liabilities are set out in note 43 of the Group’s Annual Report for the year ended
31 December 2016.
In June 2017, the Group completed the redemption of the remaining €32 million of 7.40% Guaranteed Step-up Callable Perpetual
Preferred Securities issued by Bank of Ireland UK Holdings plc, a wholly owned subsidiary of the Group.
BOI Interim Report 2017 BACK.qxp_Layout 1 27/07/2017 20:09 Page 85
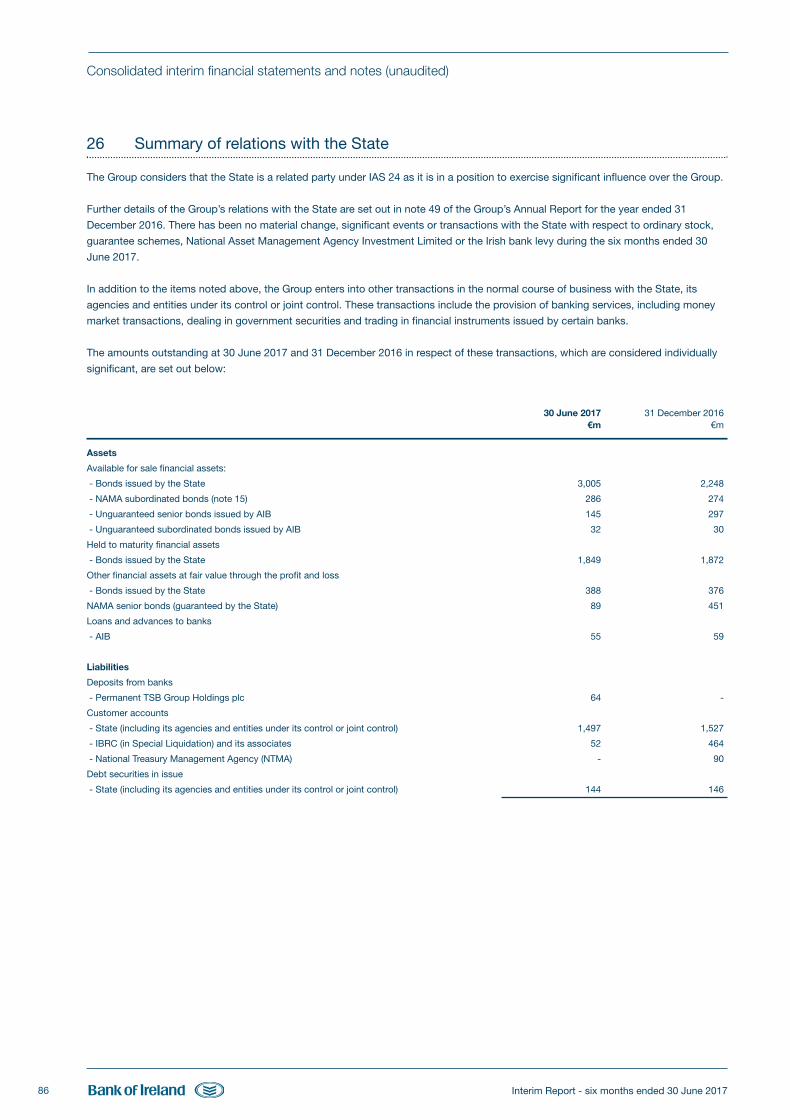
Interim Report - six months ended 30 June 201786
Consolidated interim financial statements and notes (unaudited)
26 Summary of relations with the State
The Group considers that the State is a related party under IAS 24 as it is in a position to exercise significant influence over the Group.
Further details of the Group’s relations with the State are set out in note 49 of the Group’s Annual Report for the year ended 31
December 2016. There has been no material change, significant events or transactions with the State with respect to ordinary stock,
guarantee schemes, National Asset Management Agency Investment Limited or the Irish bank levy during the six months ended 30
June 2017.
In addition to the items noted above, the Group enters into other transactions in the normal course of business with the State, its
agencies and entities under its control or joint control. These transactions include the provision of banking services, including money
market transactions, dealing in government securities and trading in financial instruments issued by certain banks.
The amounts outstanding at 30 June 2017 and 31 December 2016 in respect of these transactions, which are considered individually
significant, are set out below:
30 June 2017 31 December 2016€m €m
Assets
Available for sale financial assets:
- Bonds issued by the State 3,005 2,248
- NAMA subordinated bonds (note 15) 286 274
- Unguaranteed senior bonds issued by AIB 145 297
- Unguaranteed subordinated bonds issued by AIB 32 30
Held to maturity financial assets
- Bonds issued by the State 1,849 1,872
Other financial assets at fair value through the profit and loss
- Bonds issued by the State 388 376
NAMA senior bonds (guaranteed by the State) 89 451
Loans and advances to banks
- AIB 55 59
Liabilities
Deposits from banks
- Permanent TSB Group Holdings plc 64 -
Customer accounts
- State (including its agencies and entities under its control or joint control) 1,497 1,527
- IBRC (in Special Liquidation) and its associates 52 464
- National Treasury Management Agency (NTMA) - 90
Debt securities in issue
- State (including its agencies and entities under its control or joint control) 144 146
BOI Interim Report 2017 BACK.qxp_Layout 1 27/07/2017 20:09 Page 86
Interim Report - six months ended 30 June 2017 87
Consolidated interim financial statements and notes (unaudited)
27 Corporate reorganisation
Establishment of new holding company, Bank of Ireland Group plc
The Group announced in February 2017 that it had been notified by the Single Resolution Board (the ‘SRB’) that the resolution
authorities (being the SRB and the Bank of England working together within the Resolution College) had reached a joint decision on
the Group resolution plan for the Group and in that context had settled on a single point of entry bail-in strategy at a holding company
level as the preferred resolution strategy. It was also announced that the reorganisation would be implemented by a scheme of
arrangement under the Companies Act 2014 (the ‘Scheme’).
On 28 April 2017, the ordinary stockholders of the Bank approved the resolutions necessary to implement the corporate reorganisation
and subsequently on 23 June 2017 the High Court approved the Scheme.
The Scheme became effective on 7 July 2017 and as a result BOIG plc became the new parent entity of the Bank on that date.
Holders of ordinary stock in the Bank on 7 July 2017 were issued with BOIG plc shares on the basis of the exchange ratio of one BOIG
plc share for each individual holding of 30 units of ordinary stock in the Bank (which included a rounding up mechanism).
As a result, a total of 1,078,822,872 units of €1.00 per unit ordinary shares in BOIG plc, representing its entire issued ordinary share
capital, were listed on the Irish Stock Exchange and the London Stock Exchange on 10 July 2017.
Under IFRS, the Scheme is considered to be a corporate reorganisation that does not change the substance of the existing Group of
which the Bank is the parent. The new Group, of which BOIG plc is the parent (the ‘BOIG plc Group’), is considered to be a
continuation of the existing Group. Predecessor accounting will apply to the Scheme, such that the consolidated financial statements
of the BOIG plc Group will incorporate the assets and liabilities of the existing Group at their existing consolidated carrying values as at
the date of the Scheme, and will include the full year's results of the existing Group, including comparatives. The net assets of the
BOIG plc Group immediately after implementation of the Scheme did not differ from the net assets of the existing Group immediately
before the Scheme.
BOIG plc capital reduction
On 10 July 2017, BOIG plc applied to the High Court for approval of a capital reduction to create distributable reserves (within the
meaning of Section 117 of the Companies Act 2014). A capital reduction is a legal procedure and does not reduce regulatory capital.
The capital reduction was approved by the High Court on 27 July 2017 and distributable reserves of €5.5 billion will be created in BOIG
plc once the relevant filings are registered with the Companies Registration Office.
BOI Interim Report 2017 BACK.qxp_Layout 1 27/07/2017 20:09 Page 87
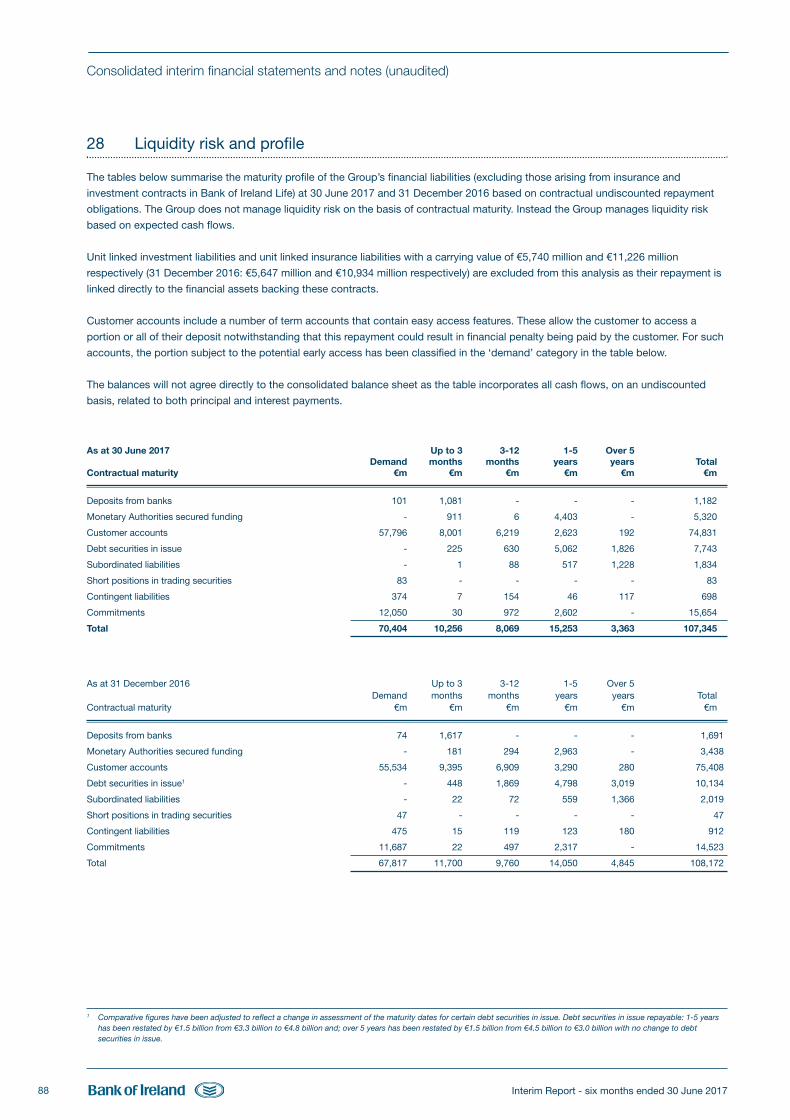
Interim Report - six months ended 30 June 201788
Consolidated interim financial statements and notes (unaudited)
28 Liquidity risk and profile
The tables below summarise the maturity profile of the Group’s financial liabilities (excluding those arising from insurance and
investment contracts in Bank of Ireland Life) at 30 June 2017 and 31 December 2016 based on contractual undiscounted repayment
obligations. The Group does not manage liquidity risk on the basis of contractual maturity. Instead the Group manages liquidity risk
based on expected cash flows.
Unit linked investment liabilities and unit linked insurance liabilities with a carrying value of €5,740 million and €11,226 million
respectively (31 December 2016: €5,647 million and €10,934 million respectively) are excluded from this analysis as their repayment is
linked directly to the financial assets backing these contracts.
Customer accounts include a number of term accounts that contain easy access features. These allow the customer to access a
portion or all of their deposit notwithstanding that this repayment could result in financial penalty being paid by the customer. For such
accounts, the portion subject to the potential early access has been classified in the ‘demand’ category in the table below.
The balances will not agree directly to the consolidated balance sheet as the table incorporates all cash flows, on an undiscounted
basis, related to both principal and interest payments.
As at 30 June 2017 Up to 3 3-12 1-5 Over 5 Demand months months years years TotalContractual maturity €m €m €m €m €m €m
Deposits from banks 101 1,081 - - - 1,182
Monetary Authorities secured funding - 911 6 4,403 - 5,320
Customer accounts 57,796 8,001 6,219 2,623 192 74,831
Debt securities in issue - 225 630 5,062 1,826 7,743
Subordinated liabilities - 1 88 517 1,228 1,834
Short positions in trading securities 83 - - - - 83
Contingent liabilities 374 7 154 46 117 698
Commitments 12,050 30 972 2,602 - 15,654
Total 70,404 10,256 8,069 15,253 3,363 107,345
As at 31 December 2016 Up to 3 3-12 1-5 Over 5 Demand months months years years TotalContractual maturity €m €m €m €m €m €m
Deposits from banks 74 1,617 - - - 1,691
Monetary Authorities secured funding - 181 294 2,963 - 3,438
Customer accounts 55,534 9,395 6,909 3,290 280 75,408
Debt securities in issue1 - 448 1,869 4,798 3,019 10,134
Subordinated liabilities - 22 72 559 1,366 2,019
Short positions in trading securities 47 - - - - 47
Contingent liabilities 475 15 119 123 180 912
Commitments 11,687 22 497 2,317 - 14,523
Total 67,817 11,700 9,760 14,050 4,845 108,172
1 Comparative figures have been adjusted to reflect a change in assessment of the maturity dates for certain debt securities in issue. Debt securities in issue repayable: 1-5 yearshas been restated by €1.5 billion from €3.3 billion to €4.8 billion and; over 5 years has been restated by €1.5 billion from €4.5 billion to €3.0 billion with no change to debtsecurities in issue.
BOI Interim Report 2017 BACK.qxp_Layout 1 27/07/2017 20:09 Page 88
Interim Report - six months ended 30 June 2017 89
Consolidated interim financial statements and notes (unaudited)
29 Fair values of assets and liabilities
A definition of fair value and the fair value hierarchy, description of the methods, assumptions and processes used to calculate fairvalues of assets and liabilities is set out on pages 291 to 294 of the Group’s Annual Report for the year ended 31 December 2016. At30 June 2017, there has been no significant change to those methods, assumptions, processes or the Group’s policy for assessingtransfers between the different levels of the fair value hierarchy.
Sensitivity of level 3 valuations
(a) Derivative financial instrumentsCertain derivatives are valued using unobservable inputs relating to counterparty credit such as credit grade, which are significantto their valuation. The effect of using reasonably possible alternative assumptions in the valuation of these derivatives would be toincrease their fair value by up to €4 million or decrease their fair value by up to €4 million, with a corresponding impact on theincome statement. Where the impact of unobservable inputs is material to the valuation of the asset or liability, it is categorised aslevel 3 on the fair value hierarchy.
In addition, a small number of derivative financial instruments are valued using significant unobservable inputs other thancounterparty credit (level 3 inputs). However, changing one or more assumptions used in the valuation of these derivatives wouldnot have a significant impact as they are entered into to hedge the exposure arising on certain customer accounts (see below),leaving the Group with no net valuation risk due to the unobservable inputs.
(b) Available for sale (AFS) financial assetsA small number of assets have been valued using vendor prices, which are not considered to represent observable market data(level 3 inputs).
(c) Interest in associatesInvestments in associates which are venture capital investments are accounted for at fair value through profit or loss and arevalued in accordance with the ‘International Private Equity and Venture Capital Valuation Guidelines’. This requires the use ofvarious inputs such as discounted cash flow analysis and comparison with the earnings multiples of listed comparative companiesamongst others. Using reasonably possible alternative assumptions would not have a material impact on the value of the assets.As the inputs are unobservable, the valuation is deemed to be based on level 3 inputs.
(d) Customer accounts and deposits by banks
A small number of customer accounts are valued using additional non-observable inputs (level 3 inputs). However, changing one or
more assumptions used in the valuation of these customer accounts would not have a significant impact as these customer
accounts are hedged with offsetting derivatives, leaving the Group with no net valuation risk due to those non-observable inputs.
(e) Debt securities in issue
The significant unobservable input is the Group’s credit spread, the estimation of which is judgemental. A 1% increase / (decrease)
in the estimated credit spread at 30 June 2017 would result in a decrease of €52 million / (increase of €52 million) respectively in
the fair value of the liabilities, with a corresponding impact on the income statement.
Fair value on offsetting positions
Where the Group manages certain financial assets and financial liabilities on the basis of its net exposure to either market risks or
credit risk, the Group applies the exception allowed under paragraph 48 of IFRS 13. That exception permits the Group to measure the
fair value of a group of financial assets and financial liabilities on the basis of the price that would be received to sell a net long position
(i.e. an asset) for a particular risk exposure or paid to transfer a net short position (i.e. a liability) for a particular risk exposure in an
orderly transaction between market participants at the measurement date under current market conditions. Accordingly, the Group
measures the fair value of the group of financial assets and financial liabilities consistently with how market participants would price
the net risk exposure at the measurement date.
BOI Interim Report 2017 BACK.qxp_Layout 1 27/07/2017 20:09 Page 89
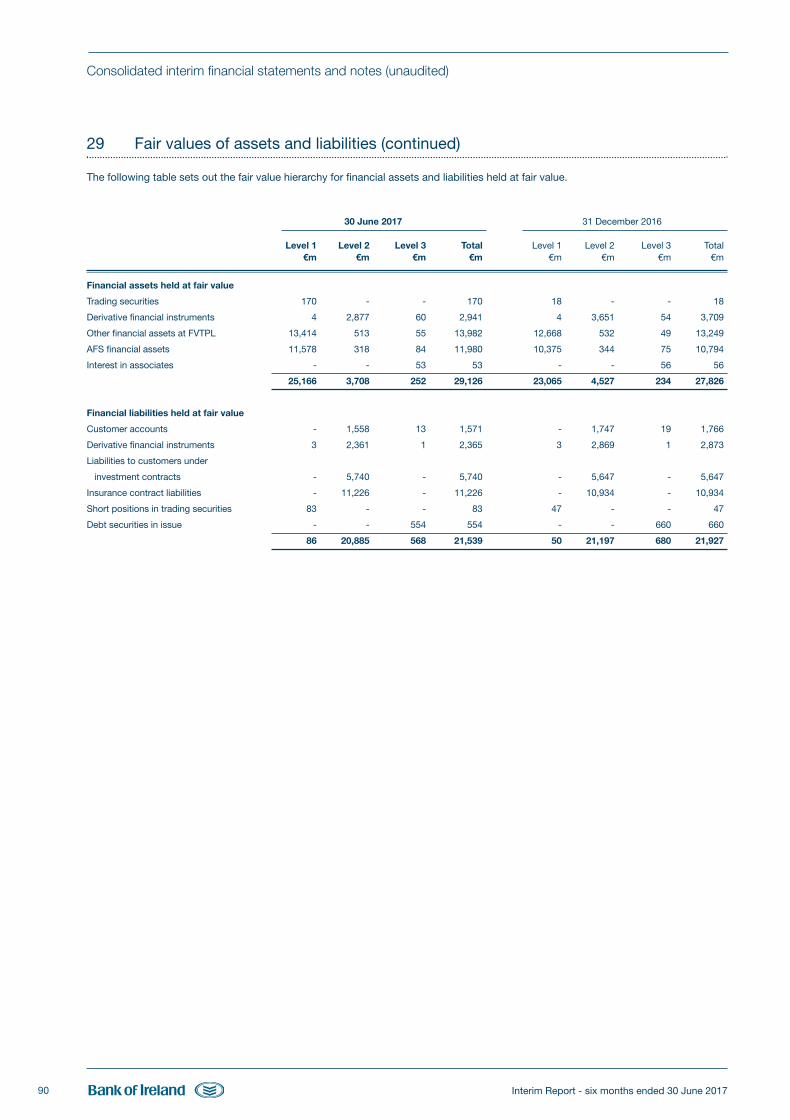
Interim Report - six months ended 30 June 201790
Consolidated interim financial statements and notes (unaudited)
29 Fair values of assets and liabilities (continued)
The following table sets out the fair value hierarchy for financial assets and liabilities held at fair value.
30 June 2017 31 December 2016
Level 1 Level 2 Level 3 Total Level 1 Level 2 Level 3 Total €m €m €m €m €m €m €m €m
Financial assets held at fair value
Trading securities 170 - - 170 18 - - 18
Derivative financial instruments 4 2,877 60 2,941 4 3,651 54 3,709
Other financial assets at FVTPL 13,414 513 55 13,982 12,668 532 49 13,249
AFS financial assets 11,578 318 84 11,980 10,375 344 75 10,794
Interest in associates - - 53 53 - - 56 56
25,166 3,708 252 29,126 23,065 4,527 234 27,826
Financial liabilities held at fair value
Customer accounts - 1,558 13 1,571 - 1,747 19 1,766
Derivative financial instruments 3 2,361 1 2,365 3 2,869 1 2,873
Liabilities to customers under
investment contracts - 5,740 - 5,740 - 5,647 - 5,647
Insurance contract liabilities - 11,226 - 11,226 - 10,934 - 10,934
Short positions in trading securities 83 - - 83 47 - - 47
Debt securities in issue - - 554 554 - - 660 660
86 20,885 568 21,539 50 21,197 680 21,927
BOI Interim Report 2017 BACK.qxp_Layout 1 27/07/2017 20:09 Page 90
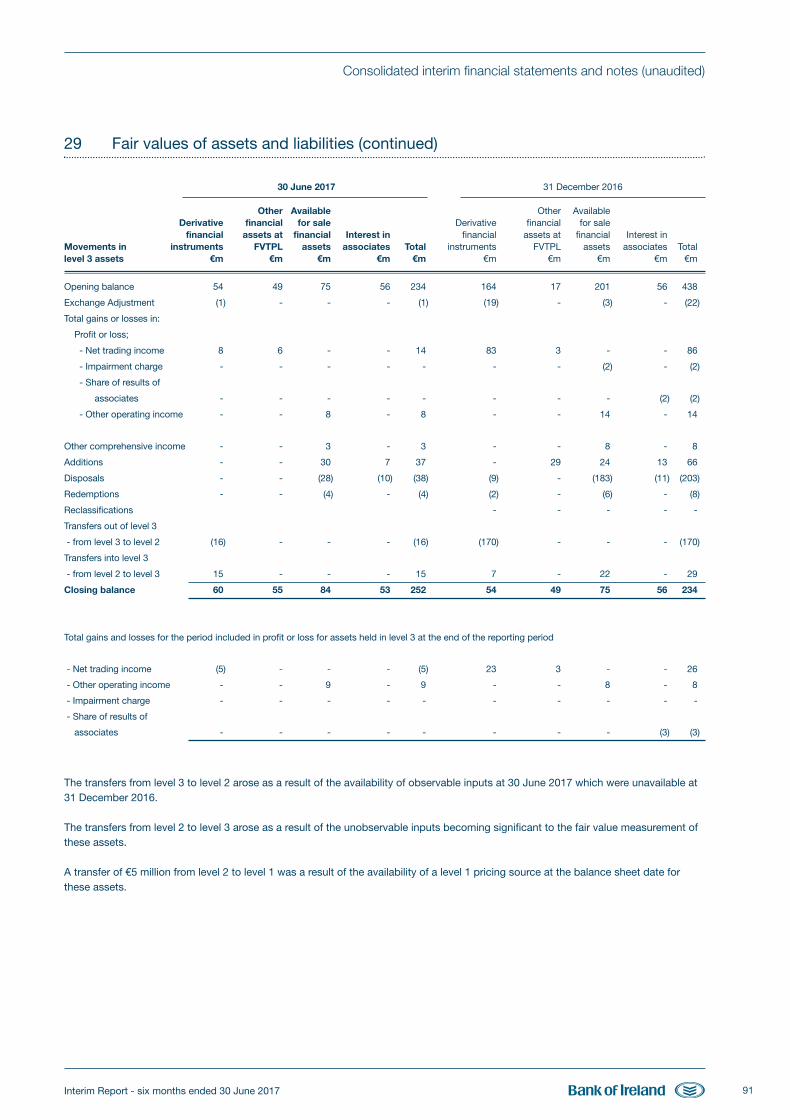
Interim Report - six months ended 30 June 2017 91
Consolidated interim financial statements and notes (unaudited)
29 Fair values of assets and liabilities (continued)
30 June 2017 31 December 2016 Other Available Other Available Derivative financial for sale Derivative financial for sale financial assets at financial Interest in financial assets at financial Interest in
Movements in instruments FVTPL assets associates Total instruments FVTPL assets associates Totallevel 3 assets €m €m €m €m €m €m €m €m €m €m
Opening balance 54 49 75 56 234 164 17 201 56 438
Exchange Adjustment (1) - - - (1) (19) - (3) - (22)
Total gains or losses in:
Profit or loss;
- Net trading income 8 6 - - 14 83 3 - - 86
- Impairment charge - - - - - - - (2) - (2)
- Share of results of
associates - - - - - - - - (2) (2)
- Other operating income - - 8 - 8 - - 14 - 14
Other comprehensive income - - 3 - 3 - - 8 - 8
Additions - - 30 7 37 - 29 24 13 66
Disposals - - (28) (10) (38) (9) - (183) (11) (203)
Redemptions - - (4) - (4) (2) - (6) - (8)
Reclassifications - - - - -
Transfers out of level 3
- from level 3 to level 2 (16) - - - (16) (170) - - - (170)
Transfers into level 3
- from level 2 to level 3 15 - - - 15 7 - 22 - 29
Closing balance 60 55 84 53 252 54 49 75 56 234
Total gains and losses for the period included in profit or loss for assets held in level 3 at the end of the reporting period
- Net trading income (5) - - - (5) 23 3 - - 26
- Other operating income - - 9 - 9 - - 8 - 8
- Impairment charge - - - - - - - - - -
- Share of results of
associates - - - - - - - - (3) (3)
The transfers from level 3 to level 2 arose as a result of the availability of observable inputs at 30 June 2017 which were unavailable at31 December 2016.
The transfers from level 2 to level 3 arose as a result of the unobservable inputs becoming significant to the fair value measurement ofthese assets.
A transfer of €5 million from level 2 to level 1 was a result of the availability of a level 1 pricing source at the balance sheet date forthese assets.
BOI Interim Report 2017 BACK.qxp_Layout 1 27/07/2017 20:09 Page 91
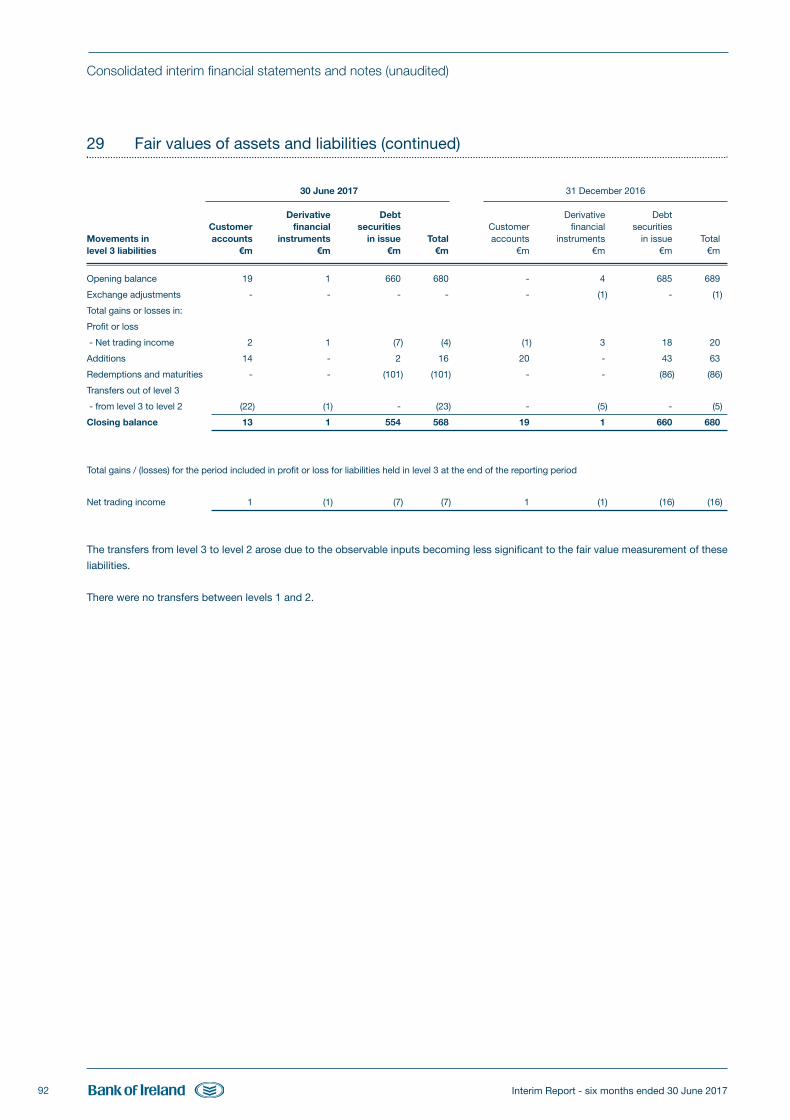
Interim Report - six months ended 30 June 201792
Consolidated interim financial statements and notes (unaudited)
29 Fair values of assets and liabilities (continued)
30 June 2017 31 December 2016 Derivative Debt Derivative Debt Customer financial securities Customer financial securities
Movements in accounts instruments in issue Total accounts instruments in issue Totallevel 3 liabilities €m €m €m €m €m €m €m €m
Opening balance 19 1 660 680 - 4 685 689
Exchange adjustments - - - - - (1) - (1)
Total gains or losses in:
Profit or loss
- Net trading income 2 1 (7) (4) (1) 3 18 20
Additions 14 - 2 16 20 - 43 63
Redemptions and maturities - - (101) (101) - - (86) (86)
Transfers out of level 3
- from level 3 to level 2 (22) (1) - (23) - (5) - (5)
Closing balance 13 1 554 568 19 1 660 680
Total gains / (losses) for the period included in profit or loss for liabilities held in level 3 at the end of the reporting period
Net trading income 1 (1) (7) (7) 1 (1) (16) (16)
The transfers from level 3 to level 2 arose due to the observable inputs becoming less significant to the fair value measurement of these
liabilities.
There were no transfers between levels 1 and 2.
BOI Interim Report 2017 BACK.qxp_Layout 1 27/07/2017 20:09 Page 92
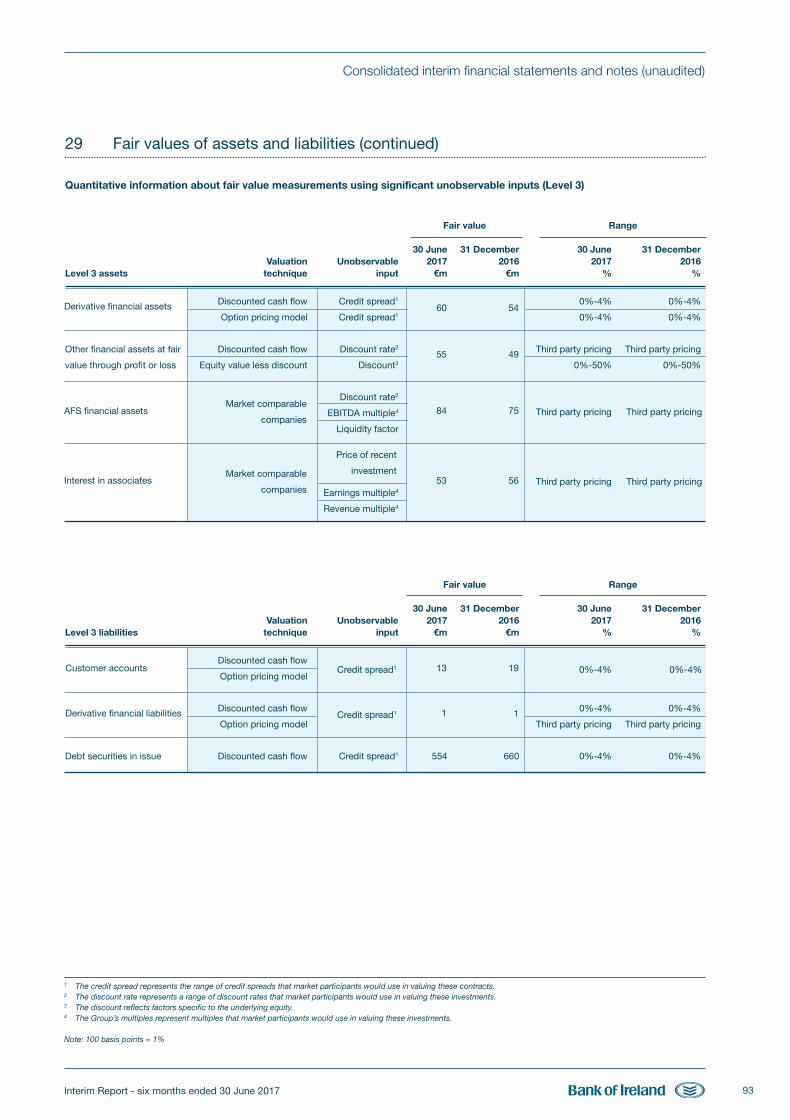
Interim Report - six months ended 30 June 2017 93
Consolidated interim financial statements and notes (unaudited)
29 Fair values of assets and liabilities (continued)
Quantitative information about fair value measurements using significant unobservable inputs (Level 3)
Fair value Range
30 June 31 December 30 June 31 December Valuation Unobservable 2017 2016 2017 2016
Level 3 assets technique input €m €m % %
Discounted cash flow Credit spread1 0%-4% 0%-4%
Option pricing model Credit spread1 0%-4% 0%-4%
Other financial assets at fair Discounted cash flow Discount rate2 Third party pricing Third party pricing
value through profit or loss Equity value less discount Discount3 0%-50% 0%-50%
Discount rate2
EBITDA multiple4
Liquidity factor
Earnings multiple4
Revenue multiple4
Fair value Range
30 June 31 December 30 June 31 December Valuation Unobservable 2017 2016 2017 2016
Level 3 liabilities technique input €m €m % %
Discounted cash flow
Option pricing model
Discounted cash flow 0%-4% 0%-4%
Option pricing model Third party pricing Third party pricing
Debt securities in issue Discounted cash flow Credit spread1 554 660 0%-4% 0%-4%
Market comparable
companies
60
AFS financial assets
Derivative financial assets
Derivative financial liabilities
54
84 75Market comparable
companies
55 49
Interest in associates 53 56
1 1
Third party pricingThird party pricing
Price of recent
investment
Customer accounts Credit spread1 13 19 0%-4%0%-4%
Third party pricingThird party pricing
Credit spread1
1 The credit spread represents the range of credit spreads that market participants would use in valuing these contracts.2 The discount rate represents a range of discount rates that market participants would use in valuing these investments.3 The discount reflects factors specific to the underlying equity.4 The Group’s multiples represent multiples that market participants would use in valuing these investments.
Note: 100 basis points = 1%
BOI Interim Report 2017 BACK.qxp_Layout 1 27/07/2017 20:09 Page 93
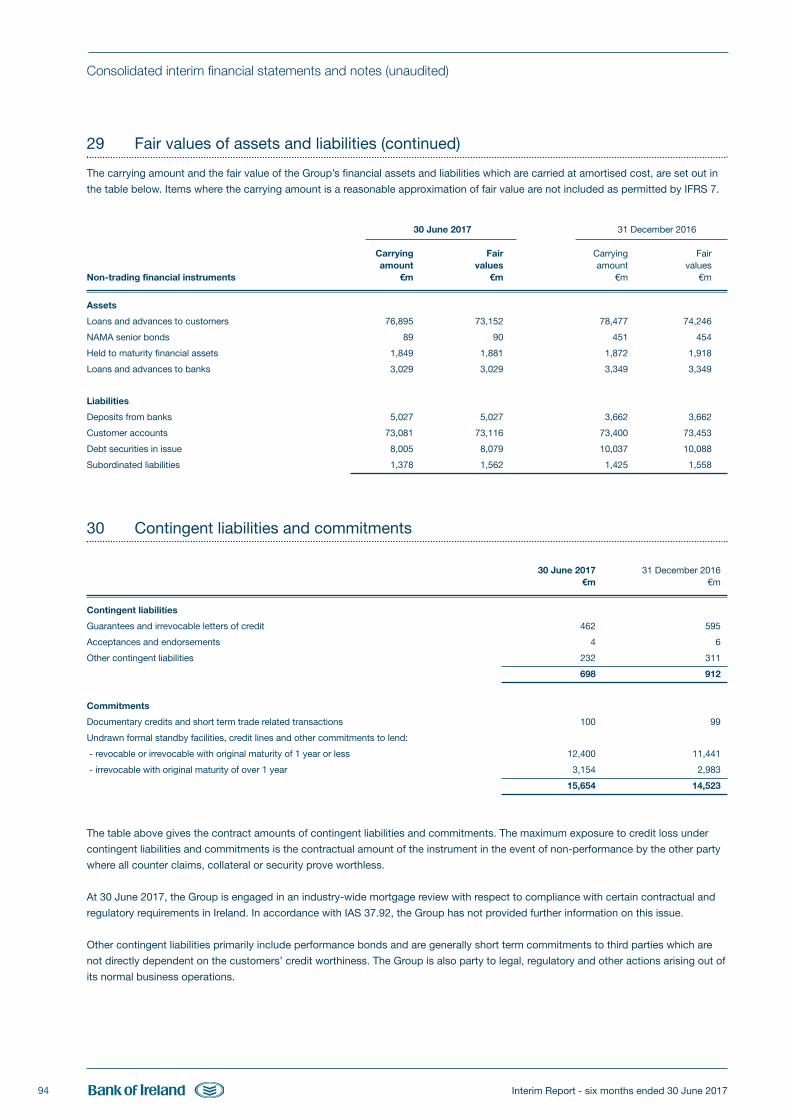
Interim Report - six months ended 30 June 201794
Consolidated interim financial statements and notes (unaudited)
29 Fair values of assets and liabilities (continued)
The carrying amount and the fair value of the Group’s financial assets and liabilities which are carried at amortised cost, are set out in
the table below. Items where the carrying amount is a reasonable approximation of fair value are not included as permitted by IFRS 7.
30 June 2017 31 December 2016
Carrying Fair Carrying Fairamount values amount values
Non-trading financial instruments €m €m €m €m
Assets
Loans and advances to customers 76,895 73,152 78,477 74,246
NAMA senior bonds 89 90 451 454
Held to maturity financial assets 1,849 1,881 1,872 1,918
Loans and advances to banks 3,029 3,029 3,349 3,349
Liabilities
Deposits from banks 5,027 5,027 3,662 3,662
Customer accounts 73,081 73,116 73,400 73,453
Debt securities in issue 8,005 8,079 10,037 10,088
Subordinated liabilities 1,378 1,562 1,425 1,558
30 Contingent liabilities and commitments
30 June 2017 31 December 2016€m €m
Contingent liabilities
Guarantees and irrevocable letters of credit 462 595
Acceptances and endorsements 4 6
Other contingent liabilities 232 311
698 912
Commitments
Documentary credits and short term trade related transactions 100 99
Undrawn formal standby facilities, credit lines and other commitments to lend:
- revocable or irrevocable with original maturity of 1 year or less 12,400 11,441
- irrevocable with original maturity of over 1 year 3,154 2,983
15,654 14,523
The table above gives the contract amounts of contingent liabilities and commitments. The maximum exposure to credit loss under
contingent liabilities and commitments is the contractual amount of the instrument in the event of non-performance by the other party
where all counter claims, collateral or security prove worthless.
At 30 June 2017, the Group is engaged in an industry-wide mortgage review with respect to compliance with certain contractual and
regulatory requirements in Ireland. In accordance with IAS 37.92, the Group has not provided further information on this issue.
Other contingent liabilities primarily include performance bonds and are generally short term commitments to third parties which are
not directly dependent on the customers’ credit worthiness. The Group is also party to legal, regulatory and other actions arising out of
its normal business operations.
BOI Interim Report 2017 BACK.qxp_Layout 1 27/07/2017 20:09 Page 94
Interim Report - six months ended 30 June 2017 95
Consolidated interim financial statements and notes (unaudited)
31 Post balance sheet events
The corporate reorganisation pursuant to which BOIG plc became the listed holding company of the Group completed on 7 July 2017.
On 27 July 2017, the High Court approved a capital reduction that created distributable reserves in BOIG plc which will be available for
distribution once the relevant filings are registered with the Companies Registration Office, see note 27 for further details.
Mr. Richard Goulding was appointed as a Non-executive Director on the Board of BOIG plc and the Court of Directors of the Bank with
effect from 20 July 2017.
On 26 July 2017, the Group announced that Mr Richie Boucher will step down as Chief Executive Officer (CEO) and resign from the
Board of BOIG plc and the Court of Directors of the Bank with effect from 1 October 2017. As previously announced, Ms Francesca
McDonagh will succeed Mr Boucher as CEO. Ms McDonagh will also take up the position of Executive Director on the Board of BOIG
plc and the Court of Directors of the Bank on 2 October 2017.
32 Approval of Interim Report
The Court of Directors approved the Interim Report on 27 July 2017.
BOI Interim Report 2017 BACK.qxp_Layout 1 27/07/2017 20:09 Page 95

THIS PAGE HAS INTENTIONALLY BEEN LEFT BLANK
BOI Interim Report 2017 BACK.qxp_Layout 1 27/07/2017 20:09 Page 96

Otherinformation
BOI Interim Report 2017 BACK.qxp_Layout 1 27/07/2017 20:09 Page 97
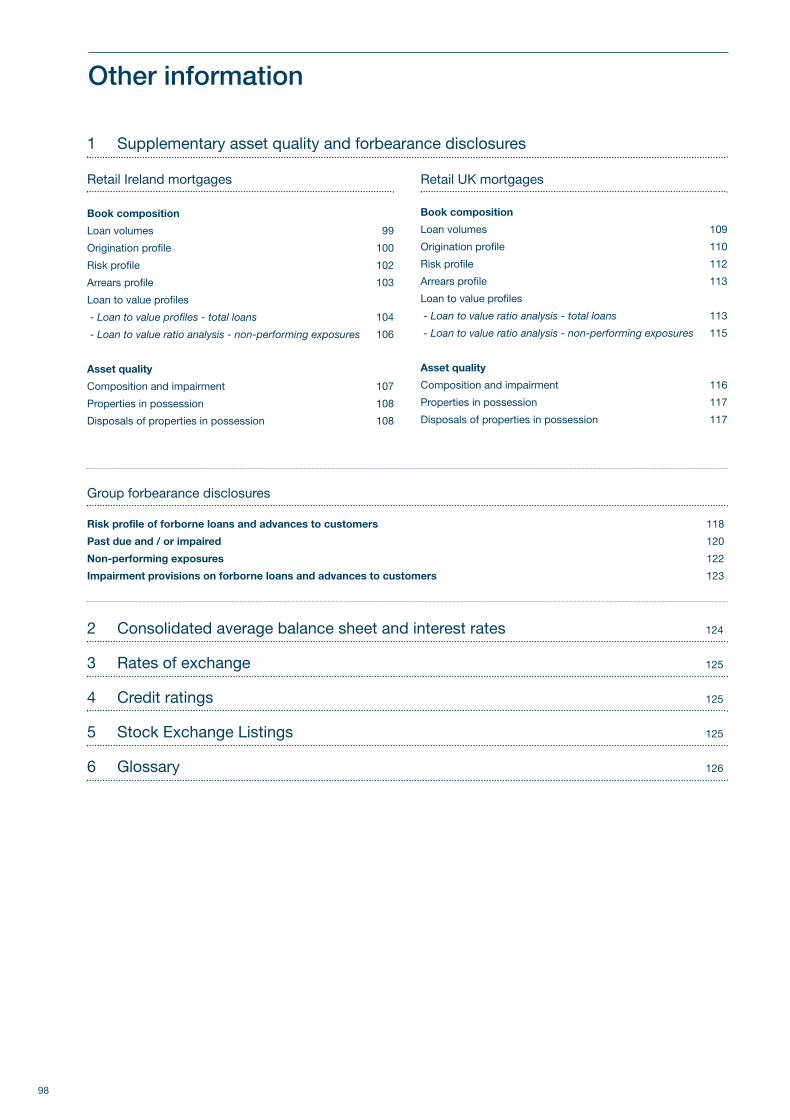
98
Other information
Group forbearance disclosures
Risk profile of forborne loans and advances to customers 118
Past due and / or impaired 120
Non-performing exposures 122
Impairment provisions on forborne loans and advances to customers 123
Retail Ireland mortgages
Book composition
Loan volumes 99
Origination profile 100
Risk profile 102
Arrears profile 103
Loan to value profiles
- Loan to value profiles - total loans 104
- Loan to value ratio analysis - non-performing exposures 106
Asset quality
Composition and impairment 107
Properties in possession 108
Disposals of properties in possession 108
Retail UK mortgages
Book composition
Loan volumes 109
Origination profile 110
Risk profile 112
Arrears profile 113
Loan to value profiles
- Loan to value ratio analysis - total loans 113
- Loan to value ratio analysis - non-performing exposures 115
Asset quality
Composition and impairment 116
Properties in possession 117
Disposals of properties in possession 117
2 Consolidated average balance sheet and interest rates 124
3 Rates of exchange 125
4 Credit ratings 125
5 Stock Exchange Listings 125
6 Glossary 126
1 Supplementary asset quality and forbearance disclosures
BOI Interim Report 2017 BACK.qxp_Layout 1 27/07/2017 20:09 Page 98
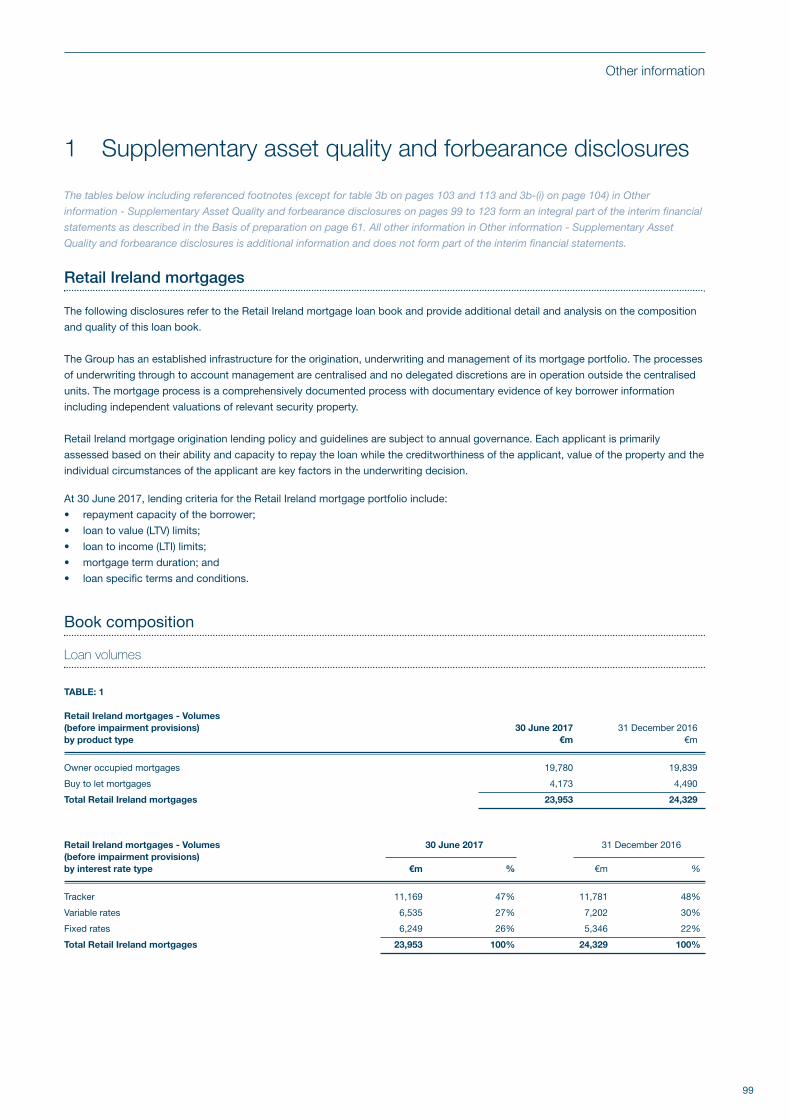
99
Other information
1 Supplementary asset quality and forbearance disclosures
The tables below including referenced footnotes (except for table 3b on pages 103 and 113 and 3b-(i) on page 104) in Other
information - Supplementary Asset Quality and forbearance disclosures on pages 99 to 123 form an integral part of the interim financial
statements as described in the Basis of preparation on page 61. All other information in Other information - Supplementary Asset
Quality and forbearance disclosures is additional information and does not form part of the interim financial statements.
Retail Ireland mortgages
The following disclosures refer to the Retail Ireland mortgage loan book and provide additional detail and analysis on the composition
and quality of this loan book.
The Group has an established infrastructure for the origination, underwriting and management of its mortgage portfolio. The processes
of underwriting through to account management are centralised and no delegated discretions are in operation outside the centralised
units. The mortgage process is a comprehensively documented process with documentary evidence of key borrower information
including independent valuations of relevant security property.
Retail Ireland mortgage origination lending policy and guidelines are subject to annual governance. Each applicant is primarily
assessed based on their ability and capacity to repay the loan while the creditworthiness of the applicant, value of the property and the
individual circumstances of the applicant are key factors in the underwriting decision.
At 30 June 2017, lending criteria for the Retail Ireland mortgage portfolio include:
• repayment capacity of the borrower;
• loan to value (LTV) limits;
• loan to income (LTI) limits;
• mortgage term duration; and
• loan specific terms and conditions.
Book composition
Loan volumes
TABLE: 1
Retail Ireland mortgages - Volumes (before impairment provisions) 30 June 2017 31 December 2016by product type €m €m
Owner occupied mortgages 19,780 19,839
Buy to let mortgages 4,173 4,490
Total Retail Ireland mortgages 23,953 24,329
Retail Ireland mortgages - Volumes 30 June 2017 31 December 2016(before impairment provisions) by interest rate type €m % €m %
Tracker 11,169 47% 11,781 48%
Variable rates 6,535 27% 7,202 30%
Fixed rates 6,249 26% 5,346 22%
Total Retail Ireland mortgages 23,953 100% 24,329 100%
BOI Interim Report 2017 BACK.qxp_Layout 1 27/07/2017 20:09 Page 99
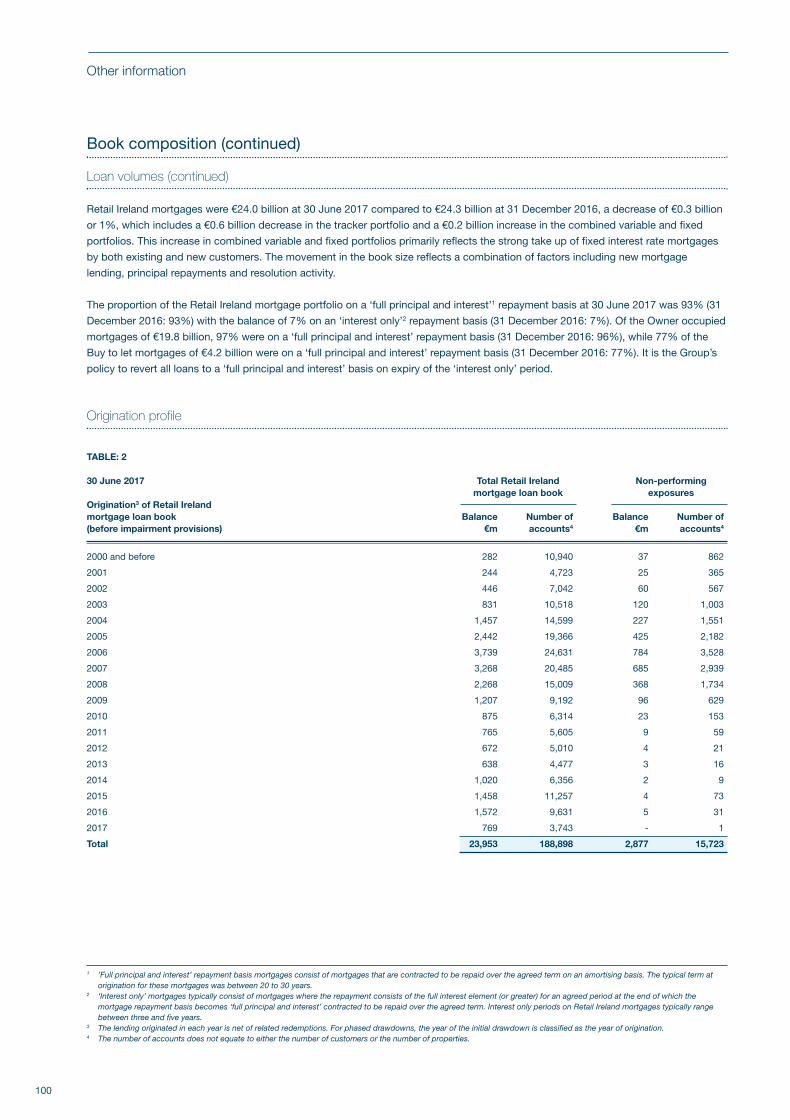
100
Other information
Book composition (continued)
Loan volumes (continued)
Retail Ireland mortgages were €24.0 billion at 30 June 2017 compared to €24.3 billion at 31 December 2016, a decrease of €0.3 billion
or 1%, which includes a €0.6 billion decrease in the tracker portfolio and a €0.2 billion increase in the combined variable and fixed
portfolios. This increase in combined variable and fixed portfolios primarily reflects the strong take up of fixed interest rate mortgages
by both existing and new customers. The movement in the book size reflects a combination of factors including new mortgage
lending, principal repayments and resolution activity.
The proportion of the Retail Ireland mortgage portfolio on a ‘full principal and interest’1 repayment basis at 30 June 2017 was 93% (31
December 2016: 93%) with the balance of 7% on an ‘interest only’2 repayment basis (31 December 2016: 7%). Of the Owner occupied
mortgages of €19.8 billion, 97% were on a ‘full principal and interest’ repayment basis (31 December 2016: 96%), while 77% of the
Buy to let mortgages of €4.2 billion were on a ‘full principal and interest’ repayment basis (31 December 2016: 77%). It is the Group’s
policy to revert all loans to a ‘full principal and interest’ basis on expiry of the ‘interest only’ period.
Origination profile
TABLE: 2 30 June 2017 Total Retail Ireland Non-performing mortgage loan book exposuresOrigination3 of Retail Ireland mortgage loan book Balance Number of Balance Number of(before impairment provisions) €m accounts4 €m accounts4
2000 and before 282 10,940 37 862
2001 244 4,723 25 365
2002 446 7,042 60 567
2003 831 10,518 120 1,003
2004 1,457 14,599 227 1,551
2005 2,442 19,366 425 2,182
2006 3,739 24,631 784 3,528
2007 3,268 20,485 685 2,939
2008 2,268 15,009 368 1,734
2009 1,207 9,192 96 629
2010 875 6,314 23 153
2011 765 5,605 9 59
2012 672 5,010 4 21
2013 638 4,477 3 16
2014 1,020 6,356 2 9
2015 1,458 11,257 4 73
2016 1,572 9,631 5 31
2017 769 3,743 - 1
Total 23,953 188,898 2,877 15,723
1 ’Full principal and interest’ repayment basis mortgages consist of mortgages that are contracted to be repaid over the agreed term on an amortising basis. The typical term atorigination for these mortgages was between 20 to 30 years.
2 ‘Interest only’ mortgages typically consist of mortgages where the repayment consists of the full interest element (or greater) for an agreed period at the end of which themortgage repayment basis becomes ‘full principal and interest’ contracted to be repaid over the agreed term. Interest only periods on Retail Ireland mortgages typically rangebetween three and five years.
3 The lending originated in each year is net of related redemptions. For phased drawdowns, the year of the initial drawdown is classified as the year of origination. 4 The number of accounts does not equate to either the number of customers or the number of properties.
BOI Interim Report 2017 BACK.qxp_Layout 1 27/07/2017 20:09 Page 100
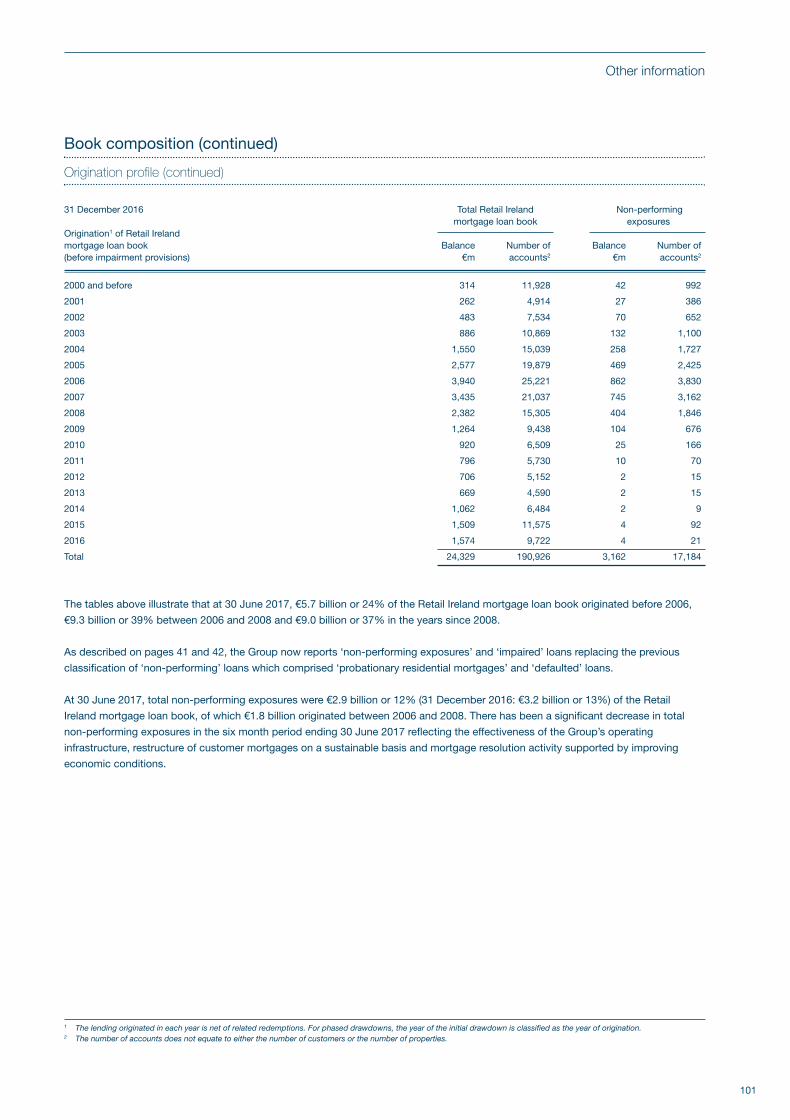
101
Other information
Book composition (continued)
Origination profile (continued)
31 December 2016 Total Retail Ireland Non-performing mortgage loan book exposuresOrigination1 of Retail Ireland mortgage loan book Balance Number of Balance Number of(before impairment provisions) €m accounts2 €m accounts2
2000 and before 314 11,928 42 992
2001 262 4,914 27 386
2002 483 7,534 70 652
2003 886 10,869 132 1,100
2004 1,550 15,039 258 1,727
2005 2,577 19,879 469 2,425
2006 3,940 25,221 862 3,830
2007 3,435 21,037 745 3,162
2008 2,382 15,305 404 1,846
2009 1,264 9,438 104 676
2010 920 6,509 25 166
2011 796 5,730 10 70
2012 706 5,152 2 15
2013 669 4,590 2 15
2014 1,062 6,484 2 9
2015 1,509 11,575 4 92
2016 1,574 9,722 4 21
Total 24,329 190,926 3,162 17,184
The tables above illustrate that at 30 June 2017, €5.7 billion or 24% of the Retail Ireland mortgage loan book originated before 2006,
€9.3 billion or 39% between 2006 and 2008 and €9.0 billion or 37% in the years since 2008.
As described on pages 41 and 42, the Group now reports ‘non-performing exposures’ and ‘impaired’ loans replacing the previous
classification of ‘non-performing’ loans which comprised ‘probationary residential mortgages’ and ‘defaulted’ loans.
At 30 June 2017, total non-performing exposures were €2.9 billion or 12% (31 December 2016: €3.2 billion or 13%) of the Retail
Ireland mortgage loan book, of which €1.8 billion originated between 2006 and 2008. There has been a significant decrease in total
non-performing exposures in the six month period ending 30 June 2017 reflecting the effectiveness of the Group’s operating
infrastructure, restructure of customer mortgages on a sustainable basis and mortgage resolution activity supported by improving
economic conditions.
1 The lending originated in each year is net of related redemptions. For phased drawdowns, the year of the initial drawdown is classified as the year of origination. 2 The number of accounts does not equate to either the number of customers or the number of properties.
BOI Interim Report 2017 BACK.qxp_Layout 1 27/07/2017 20:09 Page 101
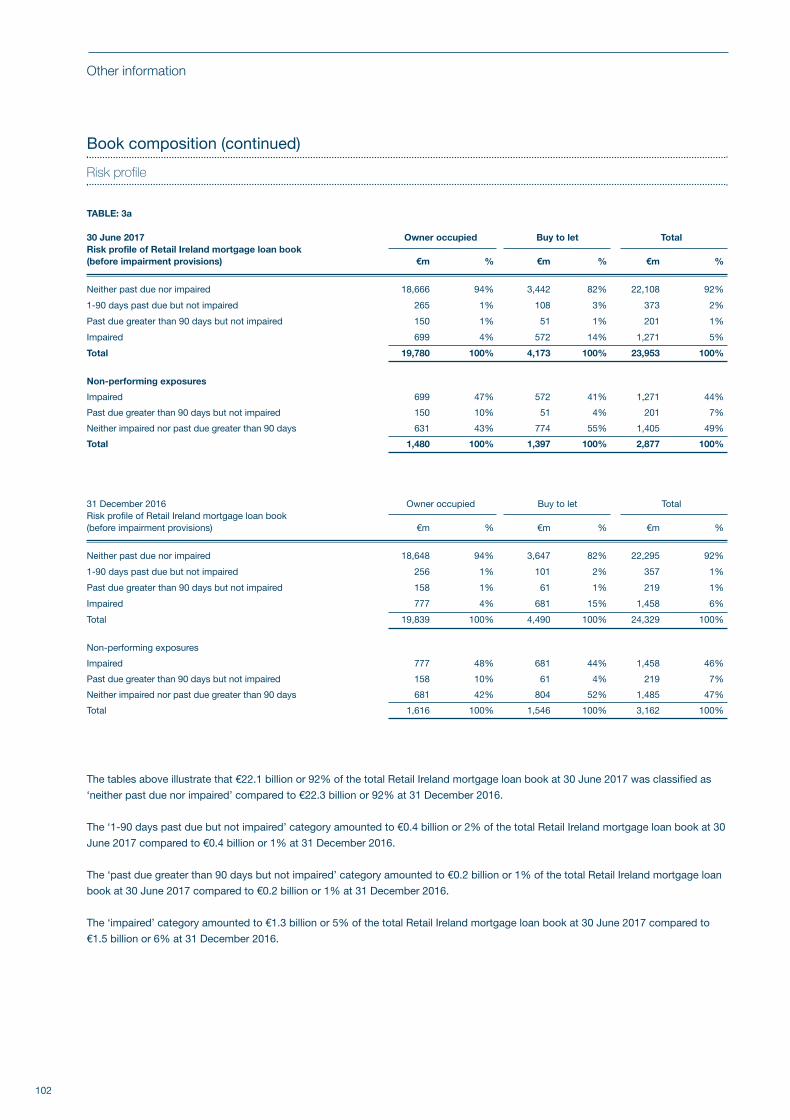
102
Other information
Book composition (continued)
Risk profile
TABLE: 3a
30 June 2017 Owner occupied Buy to let TotalRisk profile of Retail Ireland mortgage loan book(before impairment provisions) €m % €m % €m %
Neither past due nor impaired 18,666 94% 3,442 82% 22,108 92%
1-90 days past due but not impaired 265 1% 108 3% 373 2%
Past due greater than 90 days but not impaired 150 1% 51 1% 201 1%
Impaired 699 4% 572 14% 1,271 5%
Total 19,780 100% 4,173 100% 23,953 100%
Non-performing exposures
Impaired 699 47% 572 41% 1,271 44%
Past due greater than 90 days but not impaired 150 10% 51 4% 201 7%
Neither impaired nor past due greater than 90 days 631 43% 774 55% 1,405 49%
Total 1,480 100% 1,397 100% 2,877 100%
31 December 2016 Owner occupied Buy to let TotalRisk profile of Retail Ireland mortgage loan book(before impairment provisions) €m % €m % €m %
Neither past due nor impaired 18,648 94% 3,647 82% 22,295 92%
1-90 days past due but not impaired 256 1% 101 2% 357 1%
Past due greater than 90 days but not impaired 158 1% 61 1% 219 1%
Impaired 777 4% 681 15% 1,458 6%
Total 19,839 100% 4,490 100% 24,329 100%
Non-performing exposures
Impaired 777 48% 681 44% 1,458 46%
Past due greater than 90 days but not impaired 158 10% 61 4% 219 7%
Neither impaired nor past due greater than 90 days 681 42% 804 52% 1,485 47%
Total 1,616 100% 1,546 100% 3,162 100%
The tables above illustrate that €22.1 billion or 92% of the total Retail Ireland mortgage loan book at 30 June 2017 was classified as
‘neither past due nor impaired’ compared to €22.3 billion or 92% at 31 December 2016.
The ‘1-90 days past due but not impaired’ category amounted to €0.4 billion or 2% of the total Retail Ireland mortgage loan book at 30
June 2017 compared to €0.4 billion or 1% at 31 December 2016.
The ‘past due greater than 90 days but not impaired’ category amounted to €0.2 billion or 1% of the total Retail Ireland mortgage loan
book at 30 June 2017 compared to €0.2 billion or 1% at 31 December 2016.
The ‘impaired’ category amounted to €1.3 billion or 5% of the total Retail Ireland mortgage loan book at 30 June 2017 compared to
€1.5 billion or 6% at 31 December 2016.
BOI Interim Report 2017 BACK.qxp_Layout 1 27/07/2017 20:09 Page 102
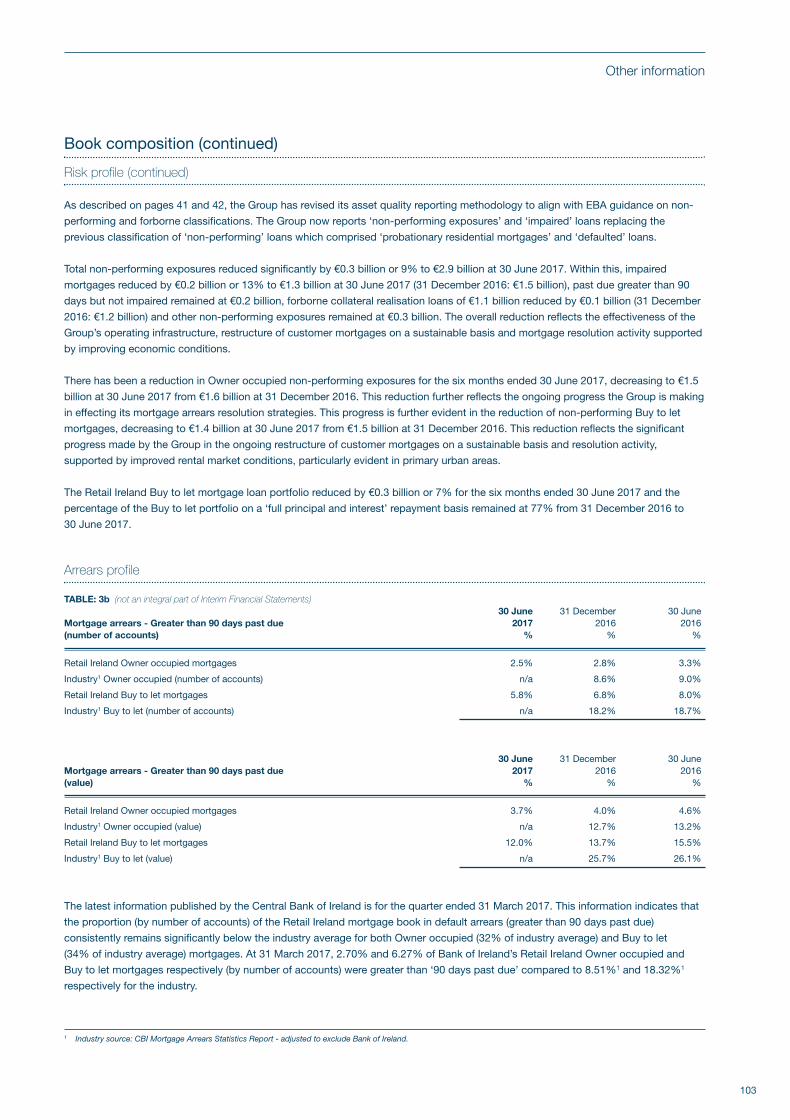
103
Other information
Book composition (continued)
Risk profile (continued)
As described on pages 41 and 42, the Group has revised its asset quality reporting methodology to align with EBA guidance on non-
performing and forborne classifications. The Group now reports ‘non-performing exposures’ and ‘impaired’ loans replacing the
previous classification of ‘non-performing’ loans which comprised ‘probationary residential mortgages’ and ‘defaulted’ loans.
Total non-performing exposures reduced significantly by €0.3 billion or 9% to €2.9 billion at 30 June 2017. Within this, impaired
mortgages reduced by €0.2 billion or 13% to €1.3 billion at 30 June 2017 (31 December 2016: €1.5 billion), past due greater than 90
days but not impaired remained at €0.2 billion, forborne collateral realisation loans of €1.1 billion reduced by €0.1 billion (31 December
2016: €1.2 billion) and other non-performing exposures remained at €0.3 billion. The overall reduction reflects the effectiveness of the
Group’s operating infrastructure, restructure of customer mortgages on a sustainable basis and mortgage resolution activity supported
by improving economic conditions.
There has been a reduction in Owner occupied non-performing exposures for the six months ended 30 June 2017, decreasing to €1.5
billion at 30 June 2017 from €1.6 billion at 31 December 2016. This reduction further reflects the ongoing progress the Group is making
in effecting its mortgage arrears resolution strategies. This progress is further evident in the reduction of non-performing Buy to let
mortgages, decreasing to €1.4 billion at 30 June 2017 from €1.5 billion at 31 December 2016. This reduction reflects the significant
progress made by the Group in the ongoing restructure of customer mortgages on a sustainable basis and resolution activity,
supported by improved rental market conditions, particularly evident in primary urban areas.
The Retail Ireland Buy to let mortgage loan portfolio reduced by €0.3 billion or 7% for the six months ended 30 June 2017 and the
percentage of the Buy to let portfolio on a ‘full principal and interest’ repayment basis remained at 77% from 31 December 2016 to
30 June 2017.
Arrears profile
TABLE: 3b (not an integral part of Interim Financial Statements) 30 June 31 December 30 JuneMortgage arrears - Greater than 90 days past due 2017 2016 2016(number of accounts) % % %
Retail Ireland Owner occupied mortgages 2.5% 2.8% 3.3%
Industry1 Owner occupied (number of accounts) n/a 8.6% 9.0%
Retail Ireland Buy to let mortgages 5.8% 6.8% 8.0%
Industry1 Buy to let (number of accounts) n/a 18.2% 18.7%
30 June 31 December 30 JuneMortgage arrears - Greater than 90 days past due 2017 2016 2016(value) % % %
Retail Ireland Owner occupied mortgages 3.7% 4.0% 4.6%
Industry1 Owner occupied (value) n/a 12.7% 13.2%
Retail Ireland Buy to let mortgages 12.0% 13.7% 15.5%
Industry1 Buy to let (value) n/a 25.7% 26.1%
The latest information published by the Central Bank of Ireland is for the quarter ended 31 March 2017. This information indicates that
the proportion (by number of accounts) of the Retail Ireland mortgage book in default arrears (greater than 90 days past due)
consistently remains significantly below the industry average for both Owner occupied (32% of industry average) and Buy to let
(34% of industry average) mortgages. At 31 March 2017, 2.70% and 6.27% of Bank of Ireland’s Retail Ireland Owner occupied and
Buy to let mortgages respectively (by number of accounts) were greater than ‘90 days past due’ compared to 8.51%1 and 18.32%1
respectively for the industry.
1 Industry source: CBI Mortgage Arrears Statistics Report - adjusted to exclude Bank of Ireland.
BOI Interim Report 2017 BACK.qxp_Layout 1 27/07/2017 20:09 Page 103
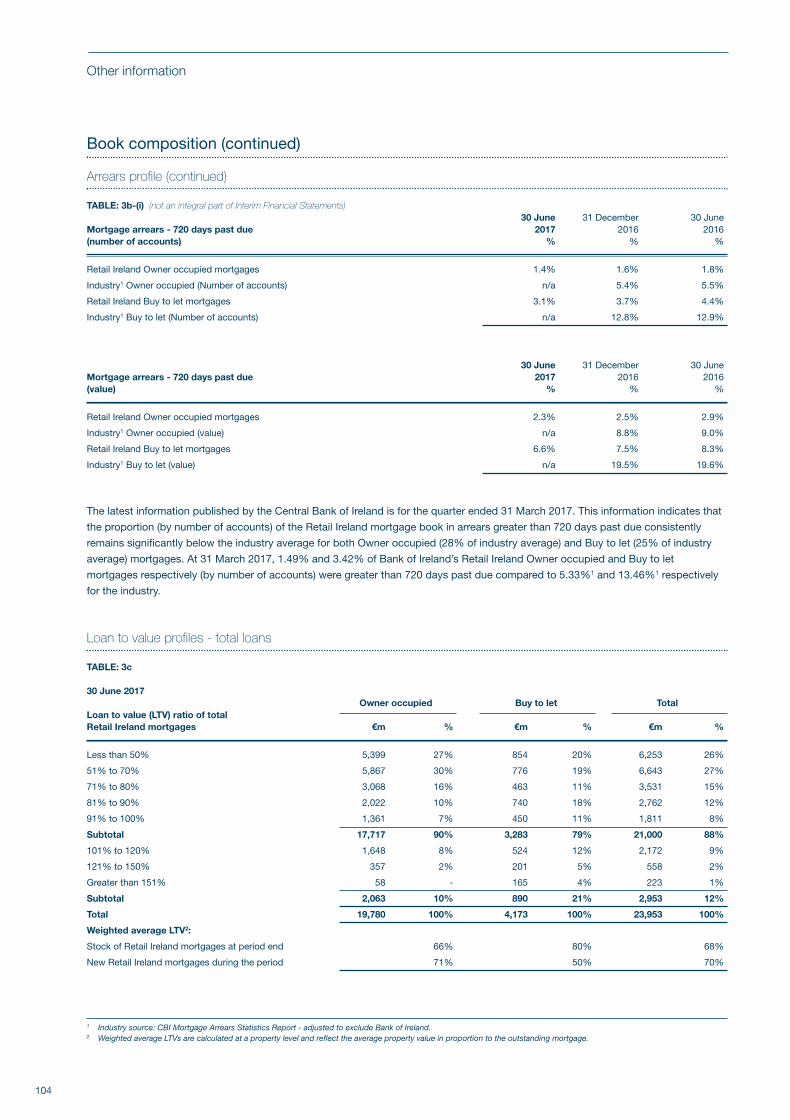
104
Other information
Book composition (continued)
Arrears profile (continued)
TABLE: 3b-(i) (not an integral part of Interim Financial Statements) 30 June 31 December 30 JuneMortgage arrears - 720 days past due 2017 2016 2016(number of accounts) % % %
Retail Ireland Owner occupied mortgages 1.4% 1.6% 1.8%
Industry1 Owner occupied (Number of accounts) n/a 5.4% 5.5%
Retail Ireland Buy to let mortgages 3.1% 3.7% 4.4%
Industry1 Buy to let (Number of accounts) n/a 12.8% 12.9%
30 June 31 December 30 June Mortgage arrears - 720 days past due 2017 2016 2016(value) % % %
Retail Ireland Owner occupied mortgages 2.3% 2.5% 2.9%
Industry1 Owner occupied (value) n/a 8.8% 9.0%
Retail Ireland Buy to let mortgages 6.6% 7.5% 8.3%
Industry1 Buy to let (value) n/a 19.5% 19.6%
The latest information published by the Central Bank of Ireland is for the quarter ended 31 March 2017. This information indicates that
the proportion (by number of accounts) of the Retail Ireland mortgage book in arrears greater than 720 days past due consistently
remains significantly below the industry average for both Owner occupied (28% of industry average) and Buy to let (25% of industry
average) mortgages. At 31 March 2017, 1.49% and 3.42% of Bank of Ireland’s Retail Ireland Owner occupied and Buy to let
mortgages respectively (by number of accounts) were greater than 720 days past due compared to 5.33%1 and 13.46%1 respectively
for the industry.
Loan to value profiles - total loans
TABLE: 3c
30 June 2017Owner occupied Buy to let Total
Loan to value (LTV) ratio of totalRetail Ireland mortgages €m % €m % €m %
Less than 50% 5,399 27% 854 20% 6,253 26%
51% to 70% 5,867 30% 776 19% 6,643 27%
71% to 80% 3,068 16% 463 11% 3,531 15%
81% to 90% 2,022 10% 740 18% 2,762 12%
91% to 100% 1,361 7% 450 11% 1,811 8%
Subtotal 17,717 90% 3,283 79% 21,000 88%
101% to 120% 1,648 8% 524 12% 2,172 9%
121% to 150% 357 2% 201 5% 558 2%
Greater than 151% 58 - 165 4% 223 1%
Subtotal 2,063 10% 890 21% 2,953 12%
Total 19,780 100% 4,173 100% 23,953 100%
Weighted average LTV2:
Stock of Retail Ireland mortgages at period end 66% 80% 68%
New Retail Ireland mortgages during the period 71% 50% 70%
1 Industry source: CBI Mortgage Arrears Statistics Report - adjusted to exclude Bank of Ireland. 2 Weighted average LTVs are calculated at a property level and reflect the average property value in proportion to the outstanding mortgage.
BOI Interim Report 2017 BACK.qxp_Layout 1 27/07/2017 20:09 Page 104
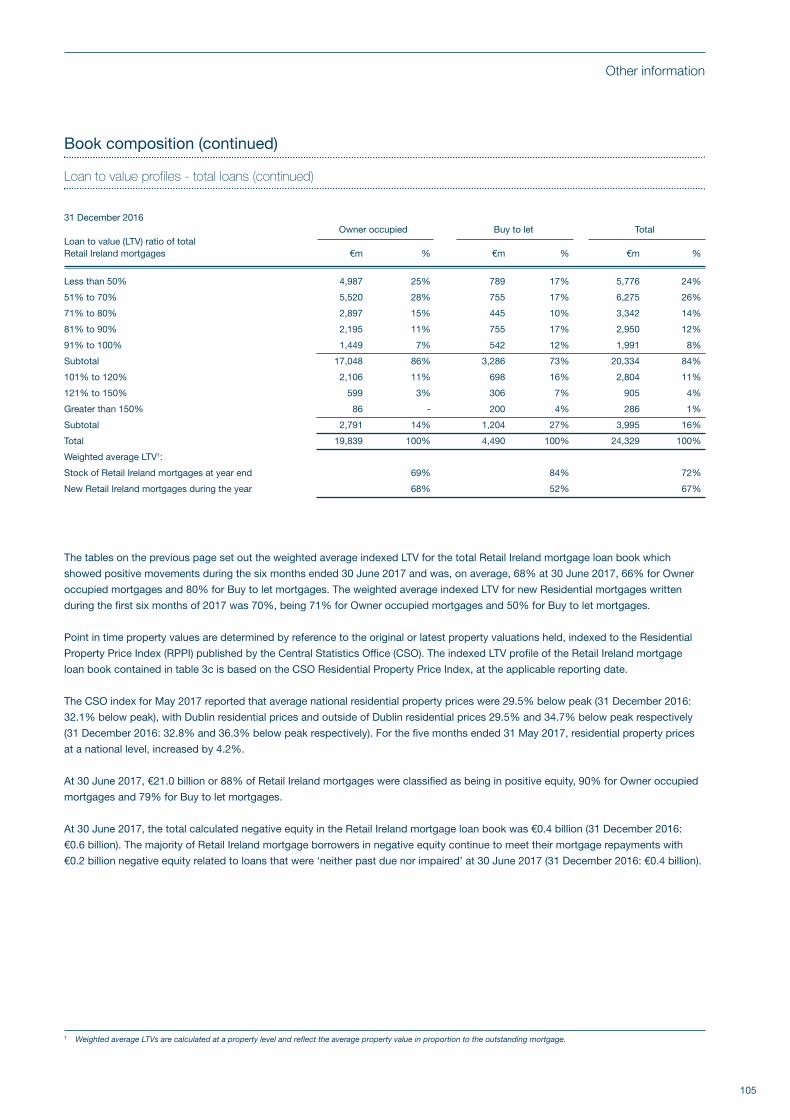
105
Other information
Book composition (continued)
Loan to value profiles - total loans (continued)
31 December 2016Owner occupied Buy to let Total
Loan to value (LTV) ratio of totalRetail Ireland mortgages €m % €m % €m %
Less than 50% 4,987 25% 789 17% 5,776 24%
51% to 70% 5,520 28% 755 17% 6,275 26%
71% to 80% 2,897 15% 445 10% 3,342 14%
81% to 90% 2,195 11% 755 17% 2,950 12%
91% to 100% 1,449 7% 542 12% 1,991 8%
Subtotal 17,048 86% 3,286 73% 20,334 84%
101% to 120% 2,106 11% 698 16% 2,804 11%
121% to 150% 599 3% 306 7% 905 4%
Greater than 150% 86 - 200 4% 286 1%
Subtotal 2,791 14% 1,204 27% 3,995 16%
Total 19,839 100% 4,490 100% 24,329 100%
Weighted average LTV1:
Stock of Retail Ireland mortgages at year end 69% 84% 72%
New Retail Ireland mortgages during the year 68% 52% 67%
The tables on the previous page set out the weighted average indexed LTV for the total Retail Ireland mortgage loan book which
showed positive movements during the six months ended 30 June 2017 and was, on average, 68% at 30 June 2017, 66% for Owner
occupied mortgages and 80% for Buy to let mortgages. The weighted average indexed LTV for new Residential mortgages written
during the first six months of 2017 was 70%, being 71% for Owner occupied mortgages and 50% for Buy to let mortgages.
Point in time property values are determined by reference to the original or latest property valuations held, indexed to the Residential
Property Price Index (RPPI) published by the Central Statistics Office (CSO). The indexed LTV profile of the Retail Ireland mortgage
loan book contained in table 3c is based on the CSO Residential Property Price Index, at the applicable reporting date.
The CSO index for May 2017 reported that average national residential property prices were 29.5% below peak (31 December 2016:
32.1% below peak), with Dublin residential prices and outside of Dublin residential prices 29.5% and 34.7% below peak respectively
(31 December 2016: 32.8% and 36.3% below peak respectively). For the five months ended 31 May 2017, residential property prices
at a national level, increased by 4.2%.
At 30 June 2017, €21.0 billion or 88% of Retail Ireland mortgages were classified as being in positive equity, 90% for Owner occupied
mortgages and 79% for Buy to let mortgages.
At 30 June 2017, the total calculated negative equity in the Retail Ireland mortgage loan book was €0.4 billion (31 December 2016:
€0.6 billion). The majority of Retail Ireland mortgage borrowers in negative equity continue to meet their mortgage repayments with
€0.2 billion negative equity related to loans that were ‘neither past due nor impaired’ at 30 June 2017 (31 December 2016: €0.4 billion).
1 Weighted average LTVs are calculated at a property level and reflect the average property value in proportion to the outstanding mortgage.
BOI Interim Report 2017 BACK.qxp_Layout 1 27/07/2017 20:09 Page 105
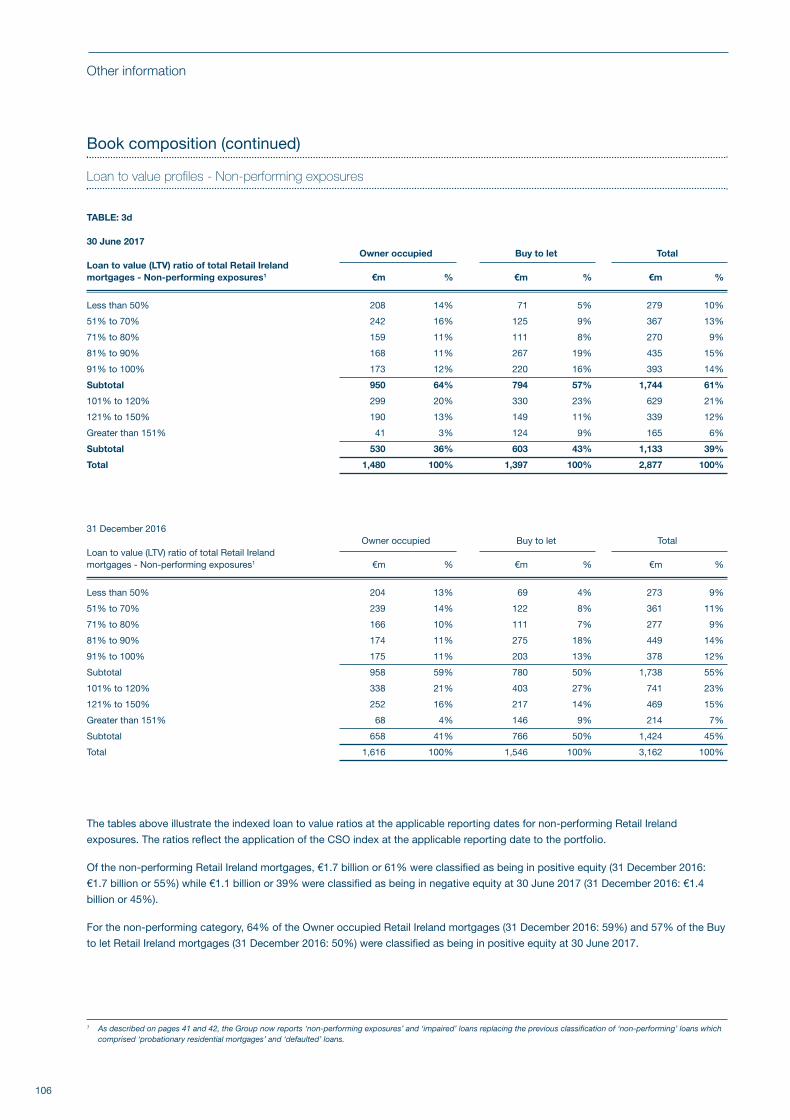
106
Other information
Book composition (continued)
Loan to value profiles - Non-performing exposures
TABLE: 3d
30 June 2017Owner occupied Buy to let Total
Loan to value (LTV) ratio of total Retail Ireland mortgages - Non-performing exposures1 €m % €m % €m %
Less than 50% 208 14% 71 5% 279 10%
51% to 70% 242 16% 125 9% 367 13%
71% to 80% 159 11% 111 8% 270 9%
81% to 90% 168 11% 267 19% 435 15%
91% to 100% 173 12% 220 16% 393 14%
Subtotal 950 64% 794 57% 1,744 61%
101% to 120% 299 20% 330 23% 629 21%
121% to 150% 190 13% 149 11% 339 12%
Greater than 151% 41 3% 124 9% 165 6%
Subtotal 530 36% 603 43% 1,133 39%
Total 1,480 100% 1,397 100% 2,877 100%
31 December 2016Owner occupied Buy to let Total
Loan to value (LTV) ratio of total Retail Ireland mortgages - Non-performing exposures1 €m % €m % €m %
Less than 50% 204 13% 69 4% 273 9%
51% to 70% 239 14% 122 8% 361 11%
71% to 80% 166 10% 111 7% 277 9%
81% to 90% 174 11% 275 18% 449 14%
91% to 100% 175 11% 203 13% 378 12%
Subtotal 958 59% 780 50% 1,738 55%
101% to 120% 338 21% 403 27% 741 23%
121% to 150% 252 16% 217 14% 469 15%
Greater than 151% 68 4% 146 9% 214 7%
Subtotal 658 41% 766 50% 1,424 45%
Total 1,616 100% 1,546 100% 3,162 100%
The tables above illustrate the indexed loan to value ratios at the applicable reporting dates for non-performing Retail Ireland
exposures. The ratios reflect the application of the CSO index at the applicable reporting date to the portfolio.
Of the non-performing Retail Ireland mortgages, €1.7 billion or 61% were classified as being in positive equity (31 December 2016:
€1.7 billion or 55%) while €1.1 billion or 39% were classified as being in negative equity at 30 June 2017 (31 December 2016: €1.4
billion or 45%).
For the non-performing category, 64% of the Owner occupied Retail Ireland mortgages (31 December 2016: 59%) and 57% of the Buy
to let Retail Ireland mortgages (31 December 2016: 50%) were classified as being in positive equity at 30 June 2017.
1 As described on pages 41 and 42, the Group now reports ‘non-performing exposures’ and ‘impaired’ loans replacing the previous classification of ‘non-performing’ loans whichcomprised ‘probationary residential mortgages’ and ‘defaulted’ loans.
BOI Interim Report 2017 BACK.qxp_Layout 1 27/07/2017 20:09 Page 106
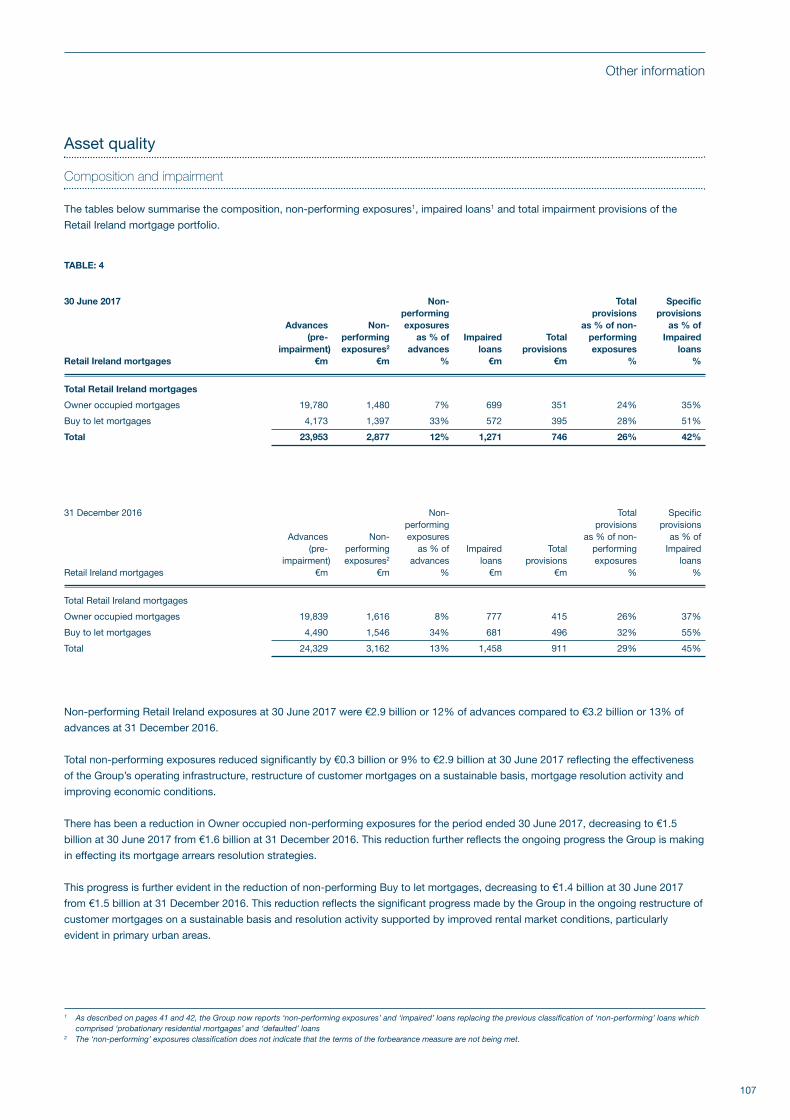
107
Other information
Asset quality
Composition and impairment
The tables below summarise the composition, non-performing exposures1, impaired loans1 and total impairment provisions of the
Retail Ireland mortgage portfolio.
TABLE: 4
30 June 2017 Non- Total Specificperforming provisions provisions
Advances Non- exposures as % of non- as % of (pre- performing as % of Impaired Total performing Impaired
impairment) exposures2 advances loans provisions exposures loansRetail Ireland mortgages €m €m % €m €m % %
Total Retail Ireland mortgages
Owner occupied mortgages 19,780 1,480 7% 699 351 24% 35%
Buy to let mortgages 4,173 1,397 33% 572 395 28% 51%
Total 23,953 2,877 12% 1,271 746 26% 42%
31 December 2016 Non- Total Specificperforming provisions provisions
Advances Non- exposures as % of non- as % of (pre- performing as % of Impaired Total performing Impaired
impairment) exposures2 advances loans provisions exposures loansRetail Ireland mortgages €m €m % €m €m % %
Total Retail Ireland mortgages
Owner occupied mortgages 19,839 1,616 8% 777 415 26% 37%
Buy to let mortgages 4,490 1,546 34% 681 496 32% 55%
Total 24,329 3,162 13% 1,458 911 29% 45%
Non-performing Retail Ireland exposures at 30 June 2017 were €2.9 billion or 12% of advances compared to €3.2 billion or 13% of
advances at 31 December 2016.
Total non-performing exposures reduced significantly by €0.3 billion or 9% to €2.9 billion at 30 June 2017 reflecting the effectiveness
of the Group’s operating infrastructure, restructure of customer mortgages on a sustainable basis, mortgage resolution activity and
improving economic conditions.
There has been a reduction in Owner occupied non-performing exposures for the period ended 30 June 2017, decreasing to €1.5
billion at 30 June 2017 from €1.6 billion at 31 December 2016. This reduction further reflects the ongoing progress the Group is making
in effecting its mortgage arrears resolution strategies.
This progress is further evident in the reduction of non-performing Buy to let mortgages, decreasing to €1.4 billion at 30 June 2017
from €1.5 billion at 31 December 2016. This reduction reflects the significant progress made by the Group in the ongoing restructure of
customer mortgages on a sustainable basis and resolution activity supported by improved rental market conditions, particularly
evident in primary urban areas.
1 As described on pages 41 and 42, the Group now reports ‘non-performing exposures’ and ‘impaired’ loans replacing the previous classification of ‘non-performing’ loans whichcomprised ‘probationary residential mortgages’ and ‘defaulted’ loans
2 The ‘non-performing’ exposures classification does not indicate that the terms of the forbearance measure are not being met.
BOI Interim Report 2017 BACK.qxp_Layout 1 27/07/2017 20:09 Page 107
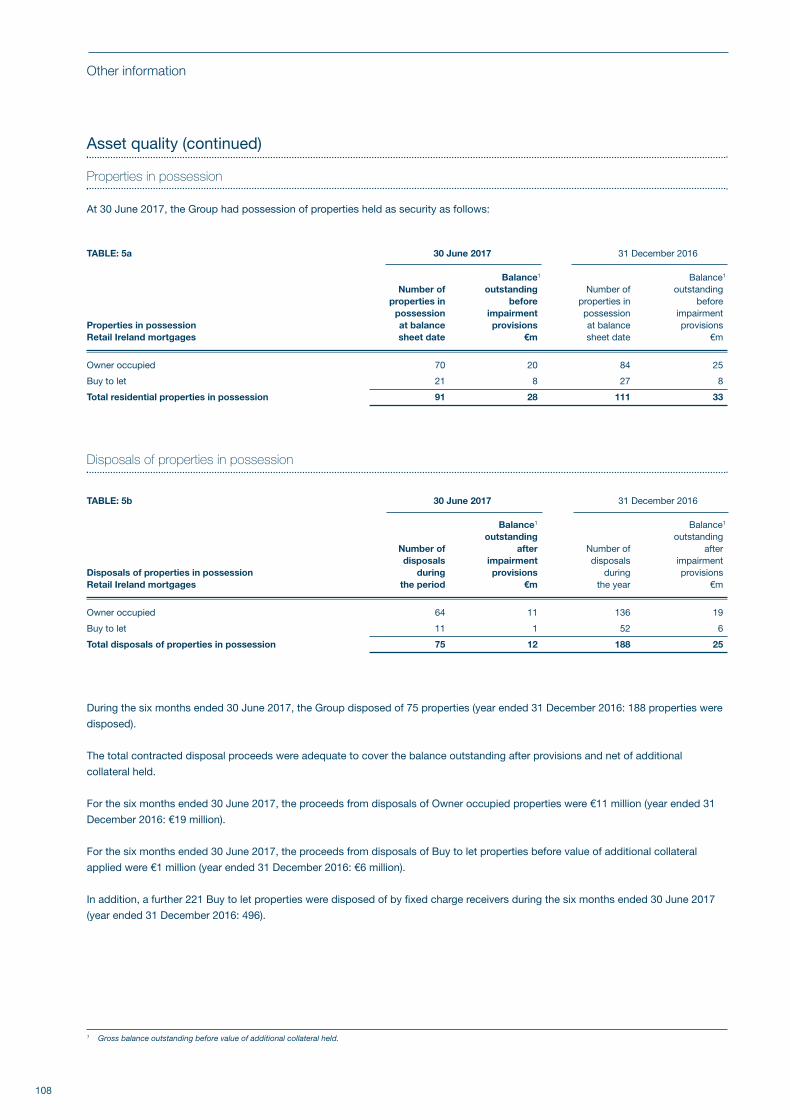
108
Other information
Asset quality (continued)
Properties in possession
At 30 June 2017, the Group had possession of properties held as security as follows:
TABLE: 5a 30 June 2017 31 December 2016
Balance1 Balance1
Number of outstanding Number of outstanding properties in before properties in before possession impairment possession impairmentProperties in possession at balance provisions at balance provisionsRetail Ireland mortgages sheet date €m sheet date €m
Owner occupied 70 20 84 25
Buy to let 21 8 27 8
Total residential properties in possession 91 28 111 33
Disposals of properties in possession
TABLE: 5b 30 June 2017 31 December 2016
Balance1 Balance1
outstanding outstanding Number of after Number of after disposals impairment disposals impairmentDisposals of properties in possession during provisions during provisionsRetail Ireland mortgages the period €m the year €m
Owner occupied 64 11 136 19
Buy to let 11 1 52 6
Total disposals of properties in possession 75 12 188 25
During the six months ended 30 June 2017, the Group disposed of 75 properties (year ended 31 December 2016: 188 properties were
disposed).
The total contracted disposal proceeds were adequate to cover the balance outstanding after provisions and net of additional
collateral held.
For the six months ended 30 June 2017, the proceeds from disposals of Owner occupied properties were €11 million (year ended 31
December 2016: €19 million).
For the six months ended 30 June 2017, the proceeds from disposals of Buy to let properties before value of additional collateral
applied were €1 million (year ended 31 December 2016: €6 million).
In addition, a further 221 Buy to let properties were disposed of by fixed charge receivers during the six months ended 30 June 2017
(year ended 31 December 2016: 496).
1 Gross balance outstanding before value of additional collateral held.
BOI Interim Report 2017 BACK.qxp_Layout 1 27/07/2017 20:09 Page 108
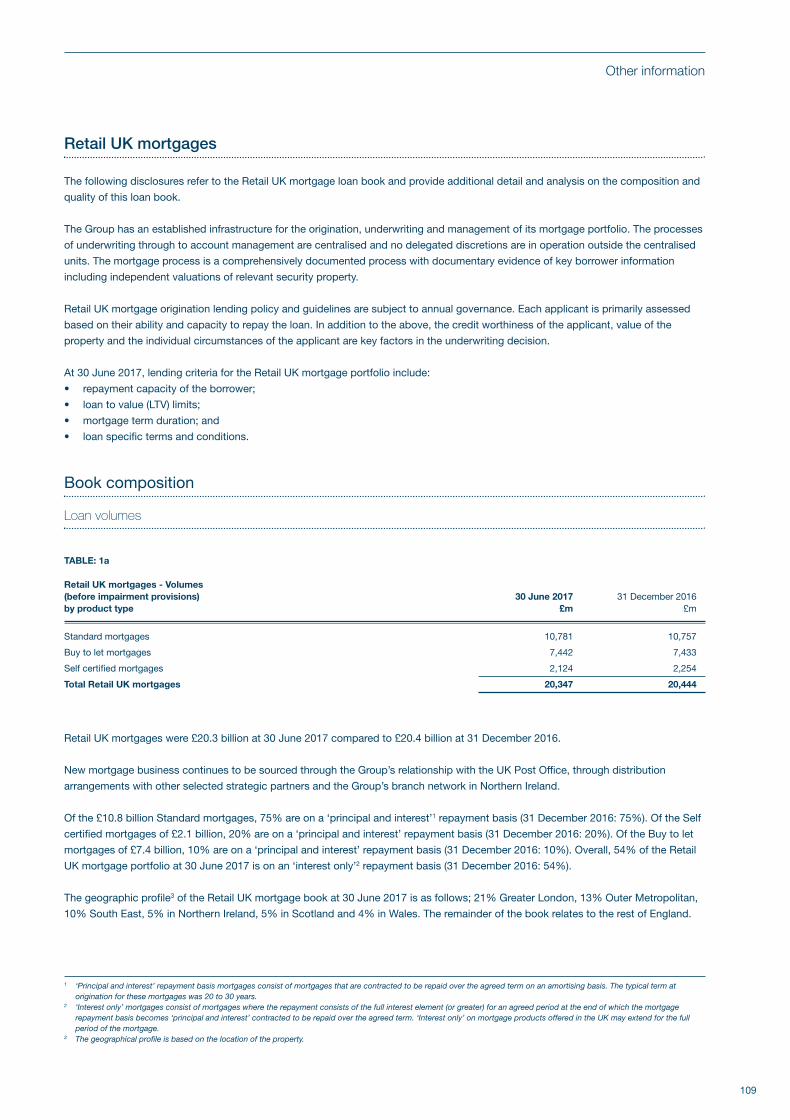
109
Other information
Retail UK mortgages
The following disclosures refer to the Retail UK mortgage loan book and provide additional detail and analysis on the composition and
quality of this loan book.
The Group has an established infrastructure for the origination, underwriting and management of its mortgage portfolio. The processes
of underwriting through to account management are centralised and no delegated discretions are in operation outside the centralised
units. The mortgage process is a comprehensively documented process with documentary evidence of key borrower information
including independent valuations of relevant security property.
Retail UK mortgage origination lending policy and guidelines are subject to annual governance. Each applicant is primarily assessed
based on their ability and capacity to repay the loan. In addition to the above, the credit worthiness of the applicant, value of the
property and the individual circumstances of the applicant are key factors in the underwriting decision.
At 30 June 2017, lending criteria for the Retail UK mortgage portfolio include:
• repayment capacity of the borrower;
• loan to value (LTV) limits;
• mortgage term duration; and
• loan specific terms and conditions.
Book composition
Loan volumes
TABLE: 1a Retail UK mortgages - Volumes (before impairment provisions) 30 June 2017 31 December 2016by product type £m £m
Standard mortgages 10,781 10,757
Buy to let mortgages 7,442 7,433
Self certified mortgages 2,124 2,254
Total Retail UK mortgages 20,347 20,444
Retail UK mortgages were £20.3 billion at 30 June 2017 compared to £20.4 billion at 31 December 2016.
New mortgage business continues to be sourced through the Group’s relationship with the UK Post Office, through distribution
arrangements with other selected strategic partners and the Group’s branch network in Northern Ireland.
Of the £10.8 billion Standard mortgages, 75% are on a ‘principal and interest’1 repayment basis (31 December 2016: 75%). Of the Self
certified mortgages of £2.1 billion, 20% are on a ‘principal and interest’ repayment basis (31 December 2016: 20%). Of the Buy to let
mortgages of £7.4 billion, 10% are on a ‘principal and interest’ repayment basis (31 December 2016: 10%). Overall, 54% of the Retail
UK mortgage portfolio at 30 June 2017 is on an ‘interest only’2 repayment basis (31 December 2016: 54%).
The geographic profile3 of the Retail UK mortgage book at 30 June 2017 is as follows; 21% Greater London, 13% Outer Metropolitan,
10% South East, 5% in Northern Ireland, 5% in Scotland and 4% in Wales. The remainder of the book relates to the rest of England.
1 ‘Principal and interest’ repayment basis mortgages consist of mortgages that are contracted to be repaid over the agreed term on an amortising basis. The typical term atorigination for these mortgages was 20 to 30 years.
2 ‘Interest only’ mortgages consist of mortgages where the repayment consists of the full interest element (or greater) for an agreed period at the end of which the mortgagerepayment basis becomes ‘principal and interest’ contracted to be repaid over the agreed term. ‘Interest only’ on mortgage products offered in the UK may extend for the fullperiod of the mortgage.
3 The geographical profile is based on the location of the property.
BOI Interim Report 2017 BACK.qxp_Layout 1 27/07/2017 20:09 Page 109
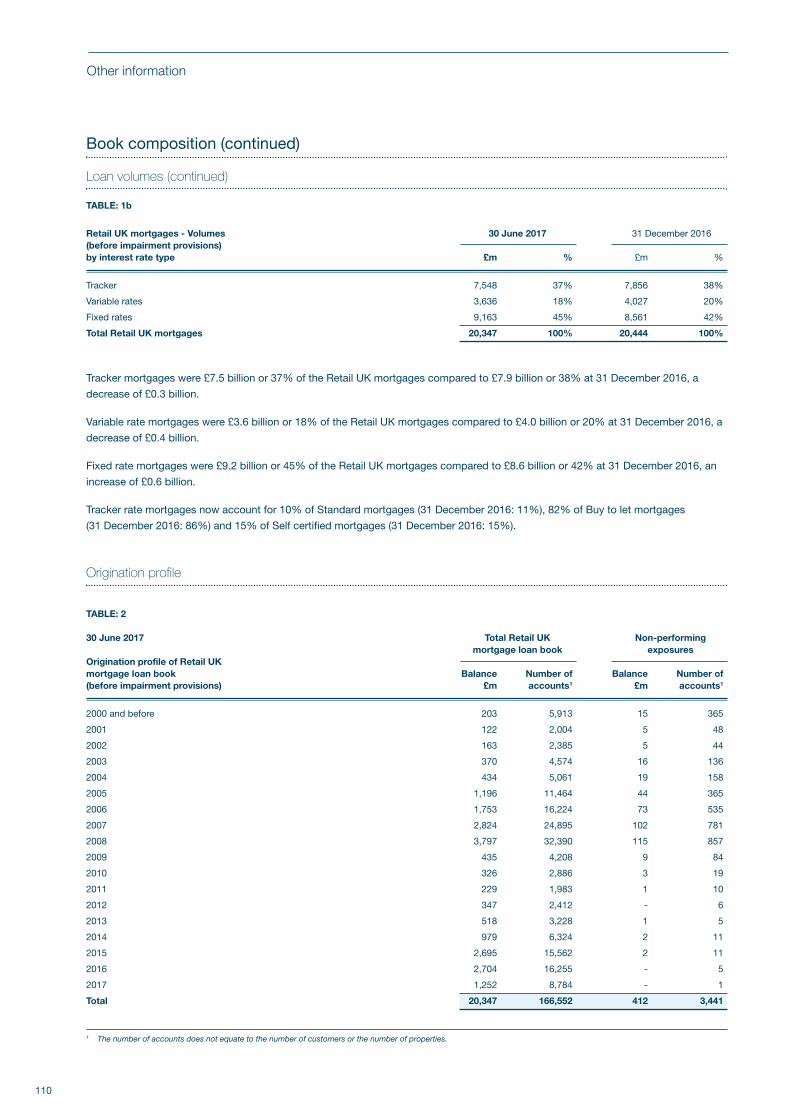
110
Other information
Book composition (continued)
Loan volumes (continued)
TABLE: 1b
Retail UK mortgages - Volumes 30 June 2017 31 December 2016(before impairment provisions) by interest rate type £m % £m %
Tracker 7,548 37% 7,856 38%
Variable rates 3,636 18% 4,027 20%
Fixed rates 9,163 45% 8,561 42%
Total Retail UK mortgages 20,347 100% 20,444 100%
Tracker mortgages were £7.5 billion or 37% of the Retail UK mortgages compared to £7.9 billion or 38% at 31 December 2016, a
decrease of £0.3 billion.
Variable rate mortgages were £3.6 billion or 18% of the Retail UK mortgages compared to £4.0 billion or 20% at 31 December 2016, a
decrease of £0.4 billion.
Fixed rate mortgages were £9.2 billion or 45% of the Retail UK mortgages compared to £8.6 billion or 42% at 31 December 2016, an
increase of £0.6 billion.
Tracker rate mortgages now account for 10% of Standard mortgages (31 December 2016: 11%), 82% of Buy to let mortgages
(31 December 2016: 86%) and 15% of Self certified mortgages (31 December 2016: 15%).
Origination profile
TABLE: 2 30 June 2017 Total Retail UK Non-performing mortgage loan book exposuresOrigination profile of Retail UKmortgage loan book Balance Number of Balance Number of(before impairment provisions) £m accounts1 £m accounts1
2000 and before 203 5,913 15 365
2001 122 2,004 5 48
2002 163 2,385 5 44
2003 370 4,574 16 136
2004 434 5,061 19 158
2005 1,196 11,464 44 365
2006 1,753 16,224 73 535
2007 2,824 24,895 102 781
2008 3,797 32,390 115 857
2009 435 4,208 9 84
2010 326 2,886 3 19
2011 229 1,983 1 10
2012 347 2,412 - 6
2013 518 3,228 1 5
2014 979 6,324 2 11
2015 2,695 15,562 2 11
2016 2,704 16,255 - 5
2017 1,252 8,784 - 1
Total 20,347 166,552 412 3,441
1 The number of accounts does not equate to the number of customers or the number of properties.
BOI Interim Report 2017 BACK.qxp_Layout 1 27/07/2017 20:09 Page 110
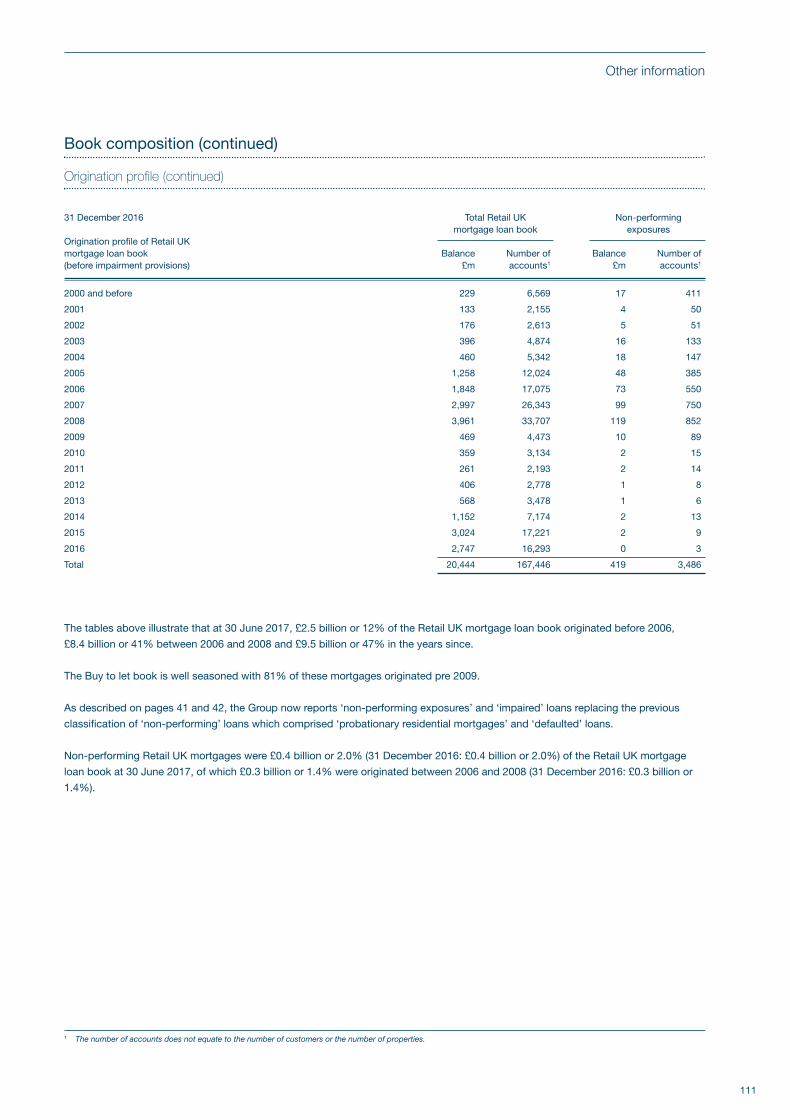
111
Other information
Book composition (continued)
Origination profile (continued)
31 December 2016 Total Retail UK Non-performing mortgage loan book exposuresOrigination profile of Retail UKmortgage loan book Balance Number of Balance Number of(before impairment provisions) £m accounts1 £m accounts1
2000 and before 229 6,569 17 411
2001 133 2,155 4 50
2002 176 2,613 5 51
2003 396 4,874 16 133
2004 460 5,342 18 147
2005 1,258 12,024 48 385
2006 1,848 17,075 73 550
2007 2,997 26,343 99 750
2008 3,961 33,707 119 852
2009 469 4,473 10 89
2010 359 3,134 2 15
2011 261 2,193 2 14
2012 406 2,778 1 8
2013 568 3,478 1 6
2014 1,152 7,174 2 13
2015 3,024 17,221 2 9
2016 2,747 16,293 0 3
Total 20,444 167,446 419 3,486
The tables above illustrate that at 30 June 2017, £2.5 billion or 12% of the Retail UK mortgage loan book originated before 2006,
£8.4 billion or 41% between 2006 and 2008 and £9.5 billion or 47% in the years since.
The Buy to let book is well seasoned with 81% of these mortgages originated pre 2009.
As described on pages 41 and 42, the Group now reports ‘non-performing exposures’ and ‘impaired’ loans replacing the previous
classification of ‘non-performing’ loans which comprised ‘probationary residential mortgages’ and ‘defaulted’ loans.
Non-performing Retail UK mortgages were £0.4 billion or 2.0% (31 December 2016: £0.4 billion or 2.0%) of the Retail UK mortgage
loan book at 30 June 2017, of which £0.3 billion or 1.4% were originated between 2006 and 2008 (31 December 2016: £0.3 billion or
1.4%).
1 The number of accounts does not equate to the number of customers or the number of properties.
BOI Interim Report 2017 BACK.qxp_Layout 1 27/07/2017 20:09 Page 111
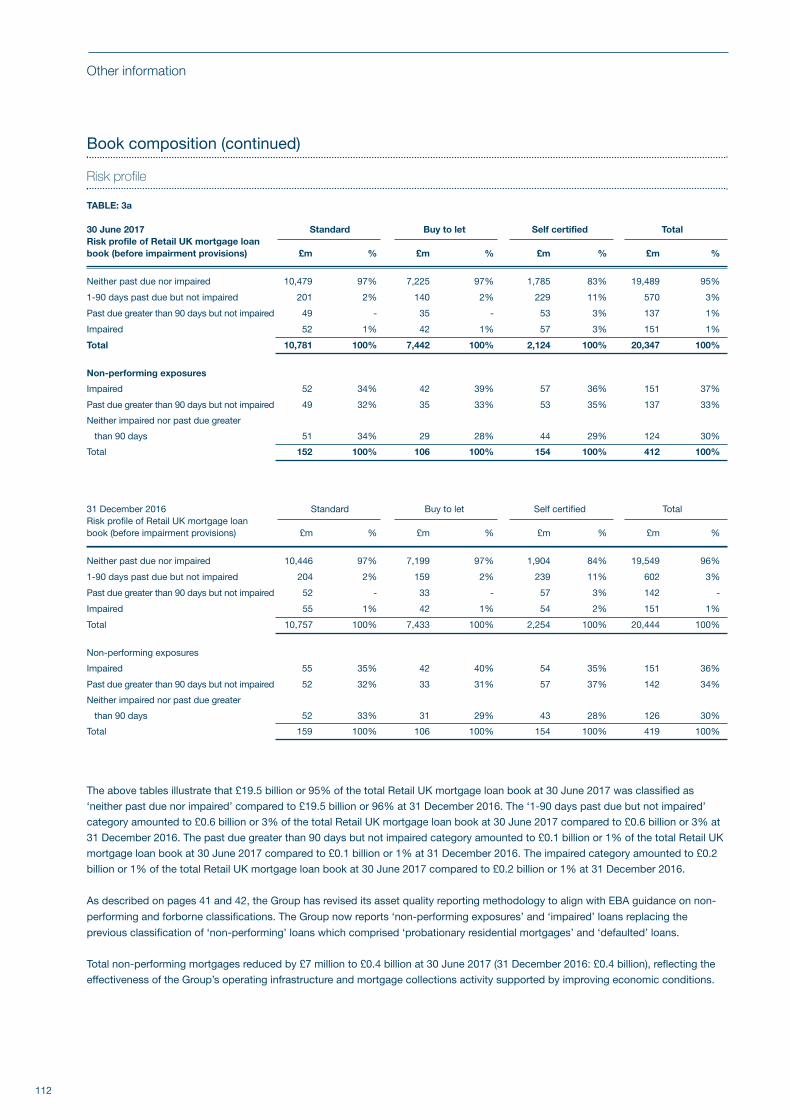
112
Other information
Book composition (continued)
Risk profile
TABLE: 3a
30 June 2017 Standard Buy to let Self certified TotalRisk profile of Retail UK mortgage loanbook (before impairment provisions) £m % £m % £m % £m %
Neither past due nor impaired 10,479 97% 7,225 97% 1,785 83% 19,489 95%
1-90 days past due but not impaired 201 2% 140 2% 229 11% 570 3%
Past due greater than 90 days but not impaired 49 - 35 - 53 3% 137 1%
Impaired 52 1% 42 1% 57 3% 151 1%
Total 10,781 100% 7,442 100% 2,124 100% 20,347 100%
Non-performing exposures
Impaired 52 34% 42 39% 57 36% 151 37%
Past due greater than 90 days but not impaired 49 32% 35 33% 53 35% 137 33%
Neither impaired nor past due greater
than 90 days 51 34% 29 28% 44 29% 124 30%
Total 152 100% 106 100% 154 100% 412 100%
31 December 2016 Standard Buy to let Self certified TotalRisk profile of Retail UK mortgage loanbook (before impairment provisions) £m % £m % £m % £m %
Neither past due nor impaired 10,446 97% 7,199 97% 1,904 84% 19,549 96%
1-90 days past due but not impaired 204 2% 159 2% 239 11% 602 3%
Past due greater than 90 days but not impaired 52 - 33 - 57 3% 142 -
Impaired 55 1% 42 1% 54 2% 151 1%
Total 10,757 100% 7,433 100% 2,254 100% 20,444 100%
Non-performing exposures
Impaired 55 35% 42 40% 54 35% 151 36%
Past due greater than 90 days but not impaired 52 32% 33 31% 57 37% 142 34%
Neither impaired nor past due greater
than 90 days 52 33% 31 29% 43 28% 126 30%
Total 159 100% 106 100% 154 100% 419 100%
The above tables illustrate that £19.5 billion or 95% of the total Retail UK mortgage loan book at 30 June 2017 was classified as
‘neither past due nor impaired’ compared to £19.5 billion or 96% at 31 December 2016. The ‘1-90 days past due but not impaired’
category amounted to £0.6 billion or 3% of the total Retail UK mortgage loan book at 30 June 2017 compared to £0.6 billion or 3% at
31 December 2016. The past due greater than 90 days but not impaired category amounted to £0.1 billion or 1% of the total Retail UK
mortgage loan book at 30 June 2017 compared to £0.1 billion or 1% at 31 December 2016. The impaired category amounted to £0.2
billion or 1% of the total Retail UK mortgage loan book at 30 June 2017 compared to £0.2 billion or 1% at 31 December 2016.
As described on pages 41 and 42, the Group has revised its asset quality reporting methodology to align with EBA guidance on non-
performing and forborne classifications. The Group now reports ‘non-performing exposures’ and ‘impaired’ loans replacing the
previous classification of ‘non-performing’ loans which comprised ‘probationary residential mortgages’ and ‘defaulted’ loans.
Total non-performing mortgages reduced by £7 million to £0.4 billion at 30 June 2017 (31 December 2016: £0.4 billion), reflecting the
effectiveness of the Group’s operating infrastructure and mortgage collections activity supported by improving economic conditions.
BOI Interim Report 2017 BACK.qxp_Layout 1 27/07/2017 20:09 Page 112
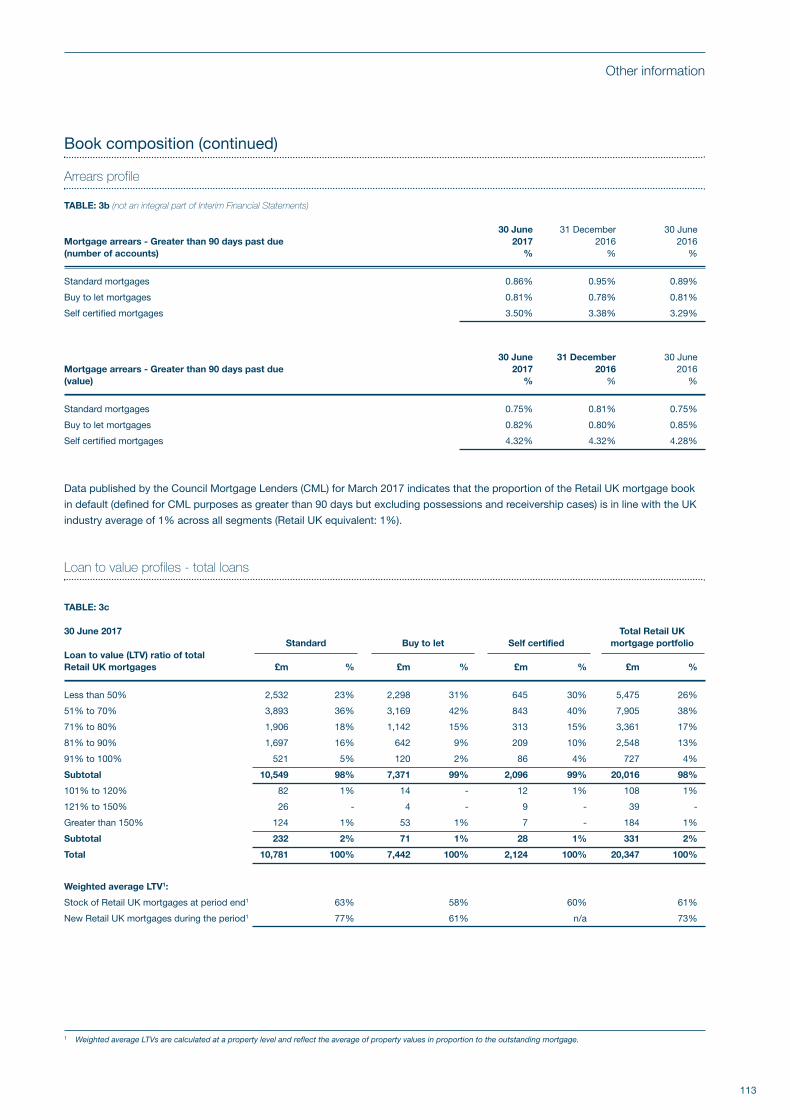
113
Other information
Book composition (continued)
Arrears profile
TABLE: 3b (not an integral part of Interim Financial Statements)
30 June 31 December 30 JuneMortgage arrears - Greater than 90 days past due 2017 2016 2016 (number of accounts) % % %
Standard mortgages 0.86% 0.95% 0.89%
Buy to let mortgages 0.81% 0.78% 0.81%
Self certified mortgages 3.50% 3.38% 3.29%
30 June 31 December 30 JuneMortgage arrears - Greater than 90 days past due 2017 2016 2016(value) % % %
Standard mortgages 0.75% 0.81% 0.75%
Buy to let mortgages 0.82% 0.80% 0.85%
Self certified mortgages 4.32% 4.32% 4.28%
Data published by the Council Mortgage Lenders (CML) for March 2017 indicates that the proportion of the Retail UK mortgage book
in default (defined for CML purposes as greater than 90 days but excluding possessions and receivership cases) is in line with the UK
industry average of 1% across all segments (Retail UK equivalent: 1%).
Loan to value profiles - total loans
TABLE: 3c
30 June 2017 Total Retail UKStandard Buy to let Self certified mortgage portfolio
Loan to value (LTV) ratio of totalRetail UK mortgages £m % £m % £m % £m %
Less than 50% 2,532 23% 2,298 31% 645 30% 5,475 26%
51% to 70% 3,893 36% 3,169 42% 843 40% 7,905 38%
71% to 80% 1,906 18% 1,142 15% 313 15% 3,361 17%
81% to 90% 1,697 16% 642 9% 209 10% 2,548 13%
91% to 100% 521 5% 120 2% 86 4% 727 4%
Subtotal 10,549 98% 7,371 99% 2,096 99% 20,016 98%
101% to 120% 82 1% 14 - 12 1% 108 1%
121% to 150% 26 - 4 - 9 - 39 -
Greater than 150% 124 1% 53 1% 7 - 184 1%
Subtotal 232 2% 71 1% 28 1% 331 2%
Total 10,781 100% 7,442 100% 2,124 100% 20,347 100%
Weighted average LTV1:
Stock of Retail UK mortgages at period end1 63% 58% 60% 61%
New Retail UK mortgages during the period1 77% 61% n/a 73%
1 Weighted average LTVs are calculated at a property level and reflect the average of property values in proportion to the outstanding mortgage.
BOI Interim Report 2017 BACK.qxp_Layout 1 27/07/2017 20:09 Page 113
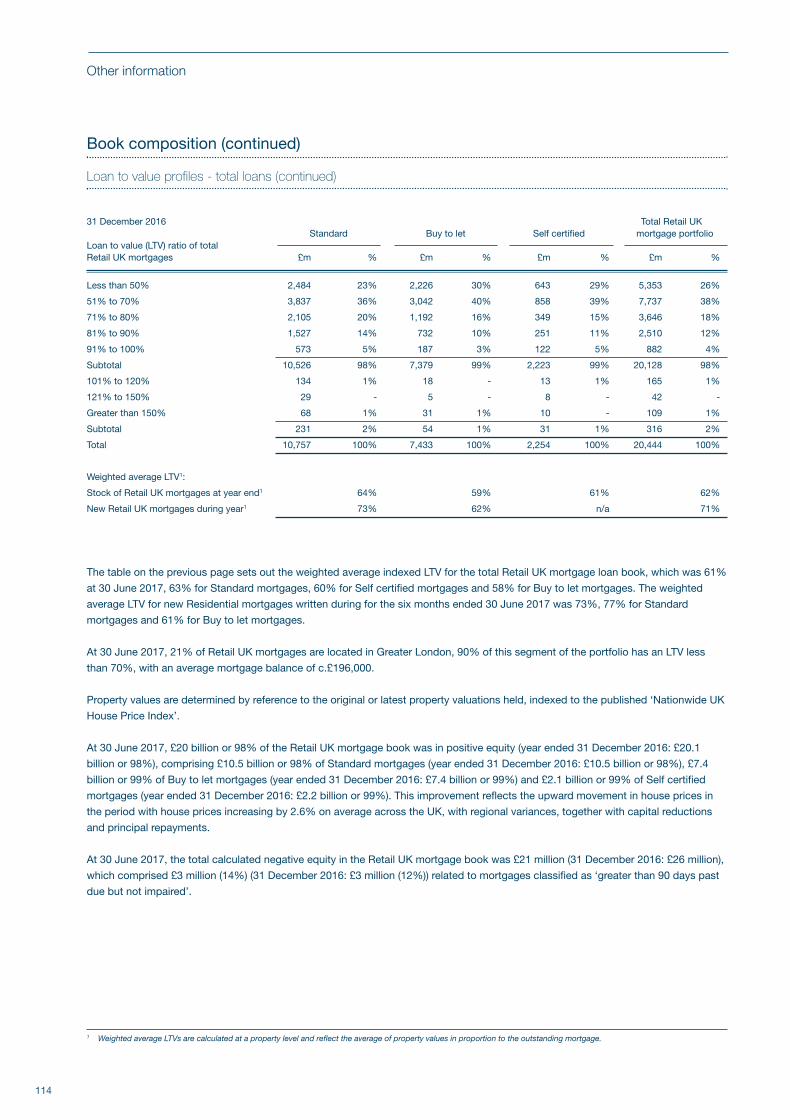
114
Other information
1 Weighted average LTVs are calculated at a property level and reflect the average of property values in proportion to the outstanding mortgage.
Book composition (continued)
Loan to value profiles - total loans (continued)
31 December 2016 Total Retail UKStandard Buy to let Self certified mortgage portfolio
Loan to value (LTV) ratio of totalRetail UK mortgages £m % £m % £m % £m %
Less than 50% 2,484 23% 2,226 30% 643 29% 5,353 26%
51% to 70% 3,837 36% 3,042 40% 858 39% 7,737 38%
71% to 80% 2,105 20% 1,192 16% 349 15% 3,646 18%
81% to 90% 1,527 14% 732 10% 251 11% 2,510 12%
91% to 100% 573 5% 187 3% 122 5% 882 4%
Subtotal 10,526 98% 7,379 99% 2,223 99% 20,128 98%
101% to 120% 134 1% 18 - 13 1% 165 1%
121% to 150% 29 - 5 - 8 - 42 -
Greater than 150% 68 1% 31 1% 10 - 109 1%
Subtotal 231 2% 54 1% 31 1% 316 2%
Total 10,757 100% 7,433 100% 2,254 100% 20,444 100%
Weighted average LTV1:
Stock of Retail UK mortgages at year end1 64% 59% 61% 62%
New Retail UK mortgages during year1 73% 62% n/a 71%
The table on the previous page sets out the weighted average indexed LTV for the total Retail UK mortgage loan book, which was 61%
at 30 June 2017, 63% for Standard mortgages, 60% for Self certified mortgages and 58% for Buy to let mortgages. The weighted
average LTV for new Residential mortgages written during for the six months ended 30 June 2017 was 73%, 77% for Standard
mortgages and 61% for Buy to let mortgages.
At 30 June 2017, 21% of Retail UK mortgages are located in Greater London, 90% of this segment of the portfolio has an LTV less
than 70%, with an average mortgage balance of c.£196,000.
Property values are determined by reference to the original or latest property valuations held, indexed to the published ‘Nationwide UK
House Price Index’.
At 30 June 2017, £20 billion or 98% of the Retail UK mortgage book was in positive equity (year ended 31 December 2016: £20.1
billion or 98%), comprising £10.5 billion or 98% of Standard mortgages (year ended 31 December 2016: £10.5 billion or 98%), £7.4
billion or 99% of Buy to let mortgages (year ended 31 December 2016: £7.4 billion or 99%) and £2.1 billion or 99% of Self certified
mortgages (year ended 31 December 2016: £2.2 billion or 99%). This improvement reflects the upward movement in house prices in
the period with house prices increasing by 2.6% on average across the UK, with regional variances, together with capital reductions
and principal repayments.
At 30 June 2017, the total calculated negative equity in the Retail UK mortgage book was £21 million (31 December 2016: £26 million),
which comprised £3 million (14%) (31 December 2016: £3 million (12%)) related to mortgages classified as ‘greater than 90 days past
due but not impaired’.
BOI Interim Report 2017 BACK.qxp_Layout 1 27/07/2017 20:09 Page 114
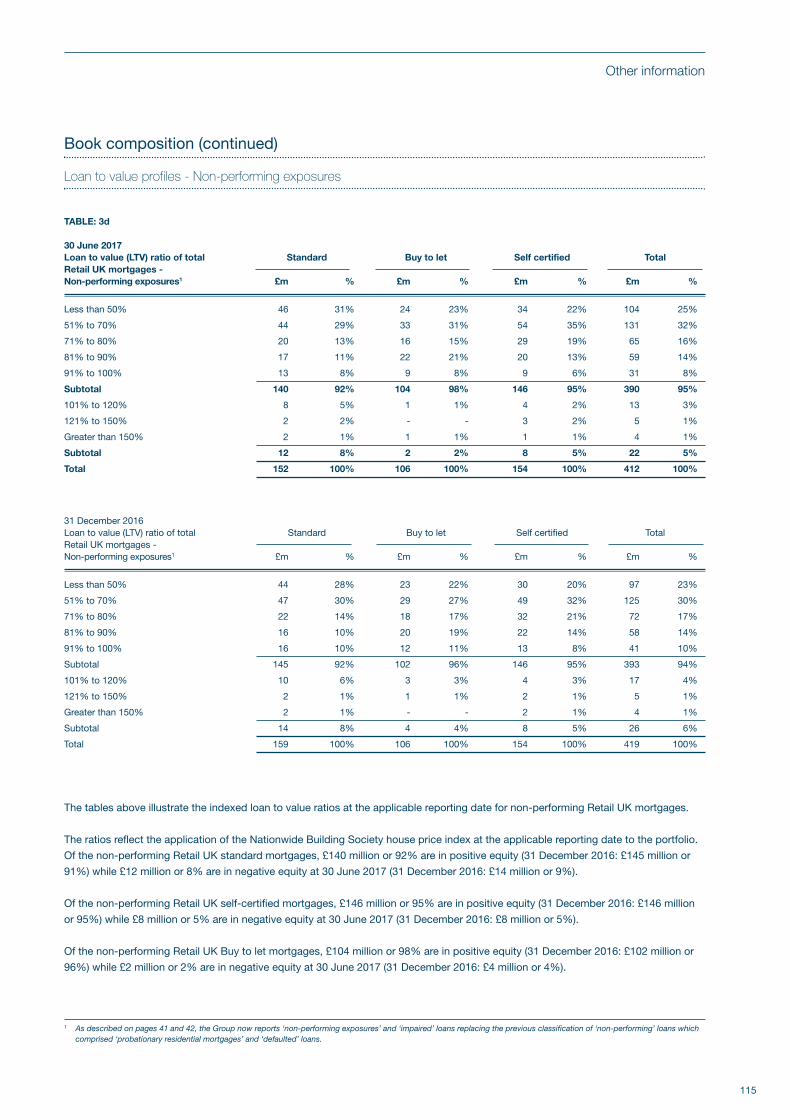
115
Other information
Book composition (continued)
Loan to value profiles - Non-performing exposures
TABLE: 3d
30 June 2017Loan to value (LTV) ratio of total Standard Buy to let Self certified TotalRetail UK mortgages - Non-performing exposures1 £m % £m % £m % £m %
Less than 50% 46 31% 24 23% 34 22% 104 25%
51% to 70% 44 29% 33 31% 54 35% 131 32%
71% to 80% 20 13% 16 15% 29 19% 65 16%
81% to 90% 17 11% 22 21% 20 13% 59 14%
91% to 100% 13 8% 9 8% 9 6% 31 8%
Subtotal 140 92% 104 98% 146 95% 390 95%
101% to 120% 8 5% 1 1% 4 2% 13 3%
121% to 150% 2 2% - - 3 2% 5 1%
Greater than 150% 2 1% 1 1% 1 1% 4 1%
Subtotal 12 8% 2 2% 8 5% 22 5%
Total 152 100% 106 100% 154 100% 412 100%
31 December 2016Loan to value (LTV) ratio of total Standard Buy to let Self certified TotalRetail UK mortgages - Non-performing exposures1 £m % £m % £m % £m %
Less than 50% 44 28% 23 22% 30 20% 97 23%
51% to 70% 47 30% 29 27% 49 32% 125 30%
71% to 80% 22 14% 18 17% 32 21% 72 17%
81% to 90% 16 10% 20 19% 22 14% 58 14%
91% to 100% 16 10% 12 11% 13 8% 41 10%
Subtotal 145 92% 102 96% 146 95% 393 94%
101% to 120% 10 6% 3 3% 4 3% 17 4%
121% to 150% 2 1% 1 1% 2 1% 5 1%
Greater than 150% 2 1% - - 2 1% 4 1%
Subtotal 14 8% 4 4% 8 5% 26 6%
Total 159 100% 106 100% 154 100% 419 100%
The tables above illustrate the indexed loan to value ratios at the applicable reporting date for non-performing Retail UK mortgages.
The ratios reflect the application of the Nationwide Building Society house price index at the applicable reporting date to the portfolio.
Of the non-performing Retail UK standard mortgages, £140 million or 92% are in positive equity (31 December 2016: £145 million or
91%) while £12 million or 8% are in negative equity at 30 June 2017 (31 December 2016: £14 million or 9%).
Of the non-performing Retail UK self-certified mortgages, £146 million or 95% are in positive equity (31 December 2016: £146 million
or 95%) while £8 million or 5% are in negative equity at 30 June 2017 (31 December 2016: £8 million or 5%).
Of the non-performing Retail UK Buy to let mortgages, £104 million or 98% are in positive equity (31 December 2016: £102 million or
96%) while £2 million or 2% are in negative equity at 30 June 2017 (31 December 2016: £4 million or 4%).
1 As described on pages 41 and 42, the Group now reports ‘non-performing exposures’ and ‘impaired’ loans replacing the previous classification of ‘non-performing’ loans whichcomprised ‘probationary residential mortgages’ and ‘defaulted’ loans.
BOI Interim Report 2017 BACK.qxp_Layout 1 27/07/2017 20:09 Page 115
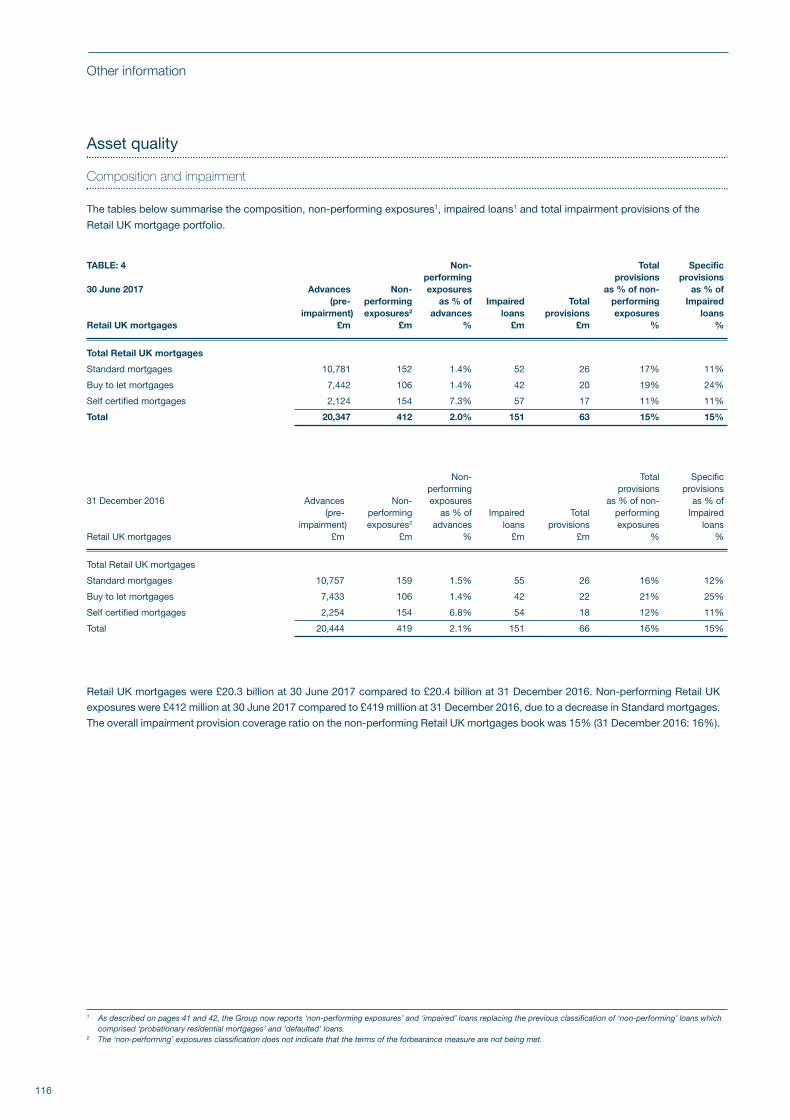
116
Other information
Asset quality
Composition and impairment
The tables below summarise the composition, non-performing exposures1, impaired loans1 and total impairment provisions of the
Retail UK mortgage portfolio.
TABLE: 4 Non- Total Specificperforming provisions provisions
30 June 2017 Advances Non- exposures as % of non- as % of (pre- performing as % of Impaired Total performing Impaired
impairment) exposures2 advances loans provisions exposures loansRetail UK mortgages £m £m % £m £m % %
Total Retail UK mortgages
Standard mortgages 10,781 152 1.4% 52 26 17% 11%
Buy to let mortgages 7,442 106 1.4% 42 20 19% 24%
Self certified mortgages 2,124 154 7.3% 57 17 11% 11%
Total 20,347 412 2.0% 151 63 15% 15%
Non- Total Specificperforming provisions provisions
31 December 2016 Advances Non- exposures as % of non- as % of (pre- performing as % of Impaired Total performing Impaired
impairment) exposures2 advances loans provisions exposures loansRetail UK mortgages £m £m % £m £m % %
Total Retail UK mortgages
Standard mortgages 10,757 159 1.5% 55 26 16% 12%
Buy to let mortgages 7,433 106 1.4% 42 22 21% 25%
Self certified mortgages 2,254 154 6.8% 54 18 12% 11%
Total 20,444 419 2.1% 151 66 16% 15%
Retail UK mortgages were £20.3 billion at 30 June 2017 compared to £20.4 billion at 31 December 2016. Non-performing Retail UK
exposures were £412 million at 30 June 2017 compared to £419 million at 31 December 2016, due to a decrease in Standard mortgages.
The overall impairment provision coverage ratio on the non-performing Retail UK mortgages book was 15% (31 December 2016: 16%).
1 As described on pages 41 and 42, the Group now reports ‘non-performing exposures’ and ‘impaired’ loans replacing the previous classification of ‘non-performing’ loans whichcomprised ‘probationary residential mortgages’ and ‘defaulted’ loans.
2 The ‘non-performing’ exposures classification does not indicate that the terms of the forbearance measure are not being met.
BOI Interim Report 2017 BACK.qxp_Layout 1 27/07/2017 20:09 Page 116
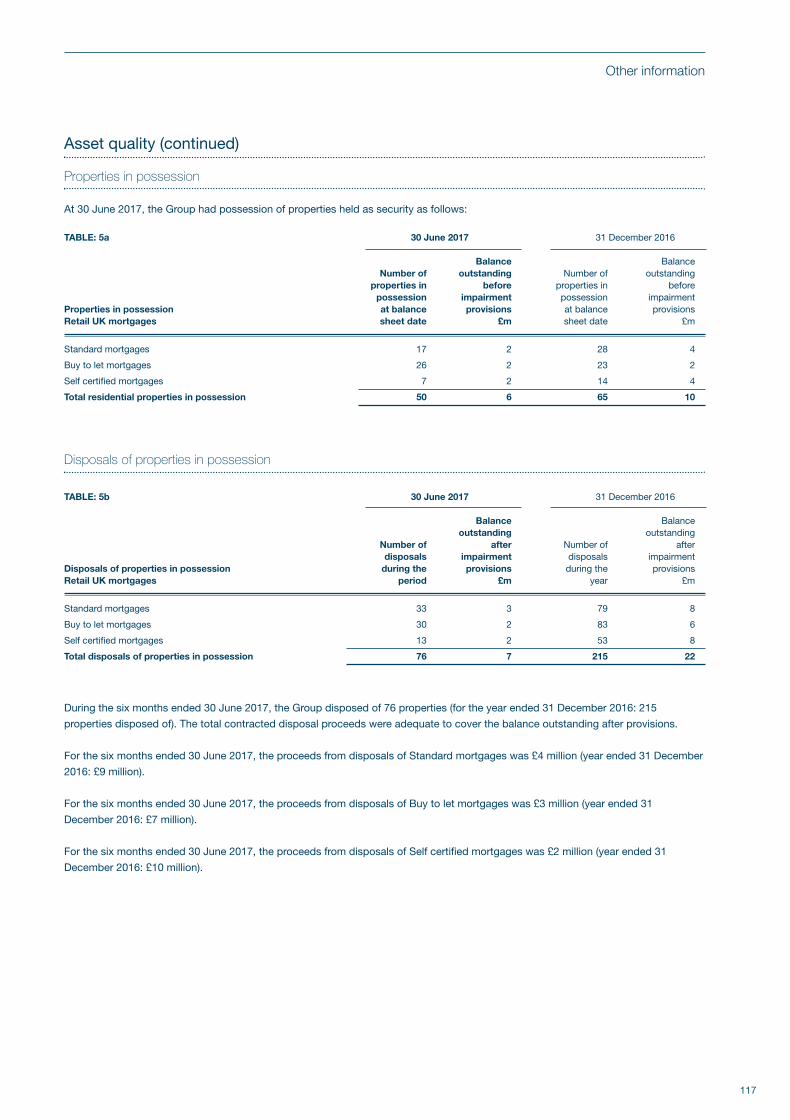
117
Other information
Asset quality (continued)
Properties in possession
At 30 June 2017 , the Group had possession of properties held as security as follows:
TABLE: 5a 30 June 2017 31 December 2016
Balance Balance Number of outstanding Number of outstanding properties in before properties in before possession impairment possession impairmentProperties in possession at balance provisions at balance provisionsRetail UK mortgages sheet date £m sheet date £m
Standard mortgages 17 2 28 4
Buy to let mortgages 26 2 23 2
Self certified mortgages 7 2 14 4
Total residential properties in possession 50 6 65 10
Disposals of properties in possession
TABLE: 5b 30 June 2017 31 December 2016
Balance Balance outstanding outstanding Number of after Number of after disposals impairment disposals impairmentDisposals of properties in possession during the provisions during the provisionsRetail UK mortgages period £m year £m
Standard mortgages 33 3 79 8
Buy to let mortgages 30 2 83 6
Self certified mortgages 13 2 53 8
Total disposals of properties in possession 76 7 215 22
During the six months ended 30 June 2017, the Group disposed of 76 properties (for the year ended 31 December 2016: 215
properties disposed of). The total contracted disposal proceeds were adequate to cover the balance outstanding after provisions.
For the six months ended 30 June 2017, the proceeds from disposals of Standard mortgages was £4 million (year ended 31 December
2016: £9 million).
For the six months ended 30 June 2017, the proceeds from disposals of Buy to let mortgages was £3 million (year ended 31
December 2016: £7 million).
For the six months ended 30 June 2017, the proceeds from disposals of Self certified mortgages was £2 million (year ended 31
December 2016: £10 million).
BOI Interim Report 2017 BACK.qxp_Layout 1 27/07/2017 20:09 Page 117
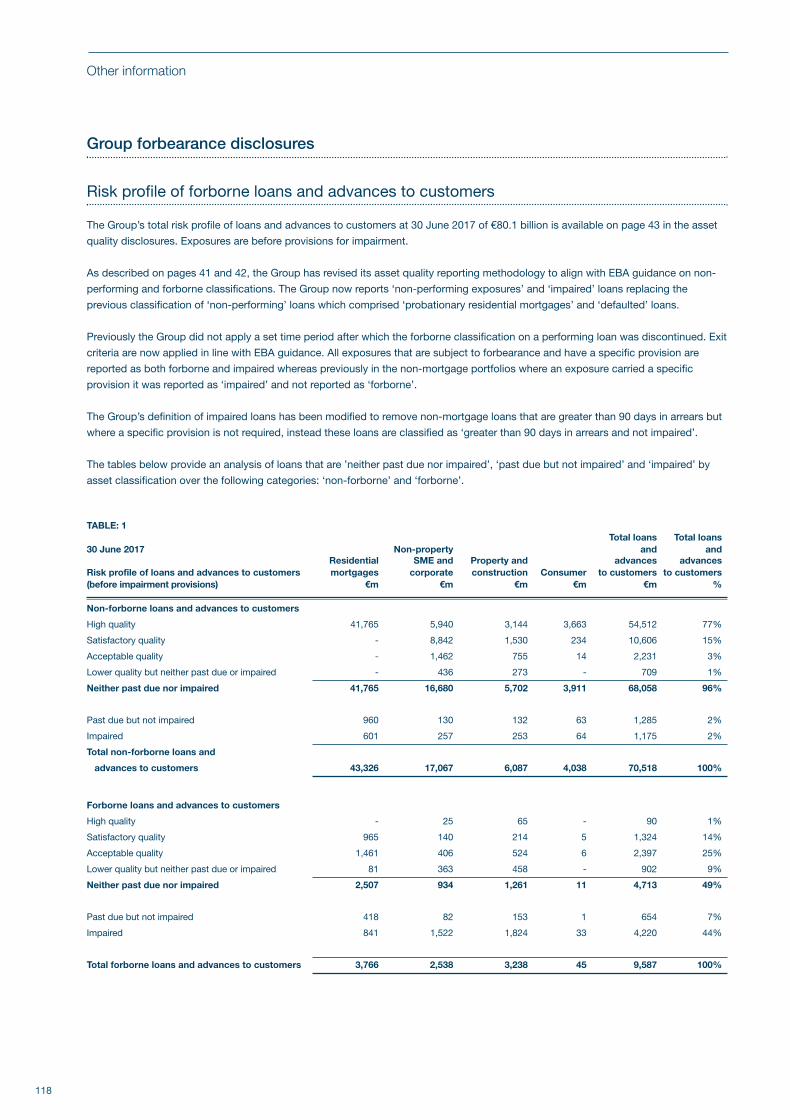
118
Other information
Group forbearance disclosures
Risk profile of forborne loans and advances to customers
The Group’s total risk profile of loans and advances to customers at 30 June 2017 of €80.1 billion is available on page 43 in the asset
quality disclosures. Exposures are before provisions for impairment.
As described on pages 41 and 42, the Group has revised its asset quality reporting methodology to align with EBA guidance on non-
performing and forborne classifications. The Group now reports ‘non-performing exposures’ and ‘impaired’ loans replacing the
previous classification of ‘non-performing’ loans which comprised ‘probationary residential mortgages’ and ‘defaulted’ loans.
Previously the Group did not apply a set time period after which the forborne classification on a performing loan was discontinued. Exit
criteria are now applied in line with EBA guidance. All exposures that are subject to forbearance and have a specific provision are
reported as both forborne and impaired whereas previously in the non-mortgage portfolios where an exposure carried a specific
provision it was reported as ‘impaired’ and not reported as ‘forborne’.
The Group’s definition of impaired loans has been modified to remove non-mortgage loans that are greater than 90 days in arrears but
where a specific provision is not required, instead these loans are classified as ‘greater than 90 days in arrears and not impaired’.
The tables below provide an analysis of loans that are ’neither past due nor impaired’, ‘past due but not impaired’ and ‘impaired’ by
asset classification over the following categories: ‘non-forborne’ and ‘forborne’.
TABLE: 1Total loans Total loans
30 June 2017 Non-property and andResidential SME and Property and advances advances
Risk profile of loans and advances to customers mortgages corporate construction Consumer to customers to customers(before impairment provisions) €m €m €m €m €m % Non-forborne loans and advances to customers
High quality 41,765 5,940 3,144 3,663 54,512 77%
Satisfactory quality - 8,842 1,530 234 10,606 15%
Acceptable quality - 1,462 755 14 2,231 3%
Lower quality but neither past due or impaired - 436 273 - 709 1%
Neither past due nor impaired 41,765 16,680 5,702 3,911 68,058 96%
Past due but not impaired 960 130 132 63 1,285 2%
Impaired 601 257 253 64 1,175 2%
Total non-forborne loans and
advances to customers 43,326 17,067 6,087 4,038 70,518 100%
Forborne loans and advances to customers
High quality - 25 65 - 90 1%
Satisfactory quality 965 140 214 5 1,324 14%
Acceptable quality 1,461 406 524 6 2,397 25%
Lower quality but neither past due or impaired 81 363 458 - 902 9%
Neither past due nor impaired 2,507 934 1,261 11 4,713 49%
Past due but not impaired 418 82 153 1 654 7%
Impaired 841 1,522 1,824 33 4,220 44%
Total forborne loans and advances to customers 3,766 2,538 3,238 45 9,587 100%
BOI Interim Report 2017 BACK.qxp_Layout 1 27/07/2017 20:09 Page 118
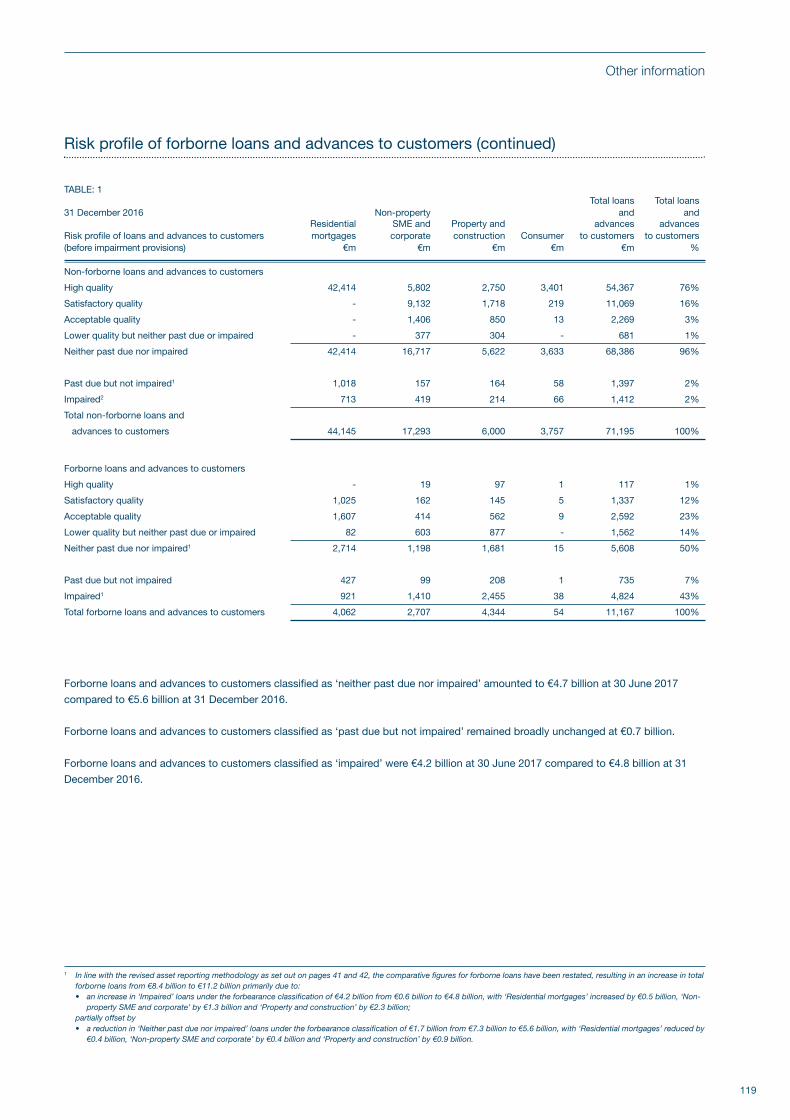
119
Other information
Risk profile of forborne loans and advances to customers (continued)
TABLE: 1Total loans Total loans
31 December 2016 Non-property and andResidential SME and Property and advances advances
Risk profile of loans and advances to customers mortgages corporate construction Consumer to customers to customers(before impairment provisions) €m €m €m €m €m % Non-forborne loans and advances to customers
High quality 42,414 5,802 2,750 3,401 54,367 76%
Satisfactory quality - 9,132 1,718 219 11,069 16%
Acceptable quality - 1,406 850 13 2,269 3%
Lower quality but neither past due or impaired - 377 304 - 681 1%
Neither past due nor impaired 42,414 16,717 5,622 3,633 68,386 96%
Past due but not impaired1 1,018 157 164 58 1,397 2%
Impaired2 713 419 214 66 1,412 2%
Total non-forborne loans and
advances to customers 44,145 17,293 6,000 3,757 71,195 100%
Forborne loans and advances to customers
High quality - 19 97 1 117 1%
Satisfactory quality 1,025 162 145 5 1,337 12%
Acceptable quality 1,607 414 562 9 2,592 23%
Lower quality but neither past due or impaired 82 603 877 - 1,562 14%
Neither past due nor impaired1 2,714 1,198 1,681 15 5,608 50%
Past due but not impaired 427 99 208 1 735 7%
Impaired1 921 1,410 2,455 38 4,824 43%
Total forborne loans and advances to customers 4,062 2,707 4,344 54 11,167 100%
Forborne loans and advances to customers classified as ‘neither past due nor impaired’ amounted to €4.7 billion at 30 June 2017
compared to €5.6 billion at 31 December 2016.
Forborne loans and advances to customers classified as ‘past due but not impaired’ remained broadly unchanged at €0.7 billion.
Forborne loans and advances to customers classified as ‘impaired’ were €4.2 billion at 30 June 2017 compared to €4.8 billion at 31
December 2016.
1 In line with the revised asset reporting methodology as set out on pages 41 and 42, the comparative figures for forborne loans have been restated, resulting in an increase in totalforborne loans from €8.4 billion to €11.2 billion primarily due to:• an increase in ‘Impaired’ loans under the forbearance classification of €4.2 billion from €0.6 billion to €4.8 billion, with ‘Residential mortgages’ increased by €0.5 billion, ‘Non-
property SME and corporate’ by €1.3 billion and ‘Property and construction’ by €2.3 billion; partially offset by • a reduction in ‘Neither past due nor impaired’ loans under the forbearance classification of €1.7 billion from €7.3 billion to €5.6 billion, with ‘Residential mortgages’ reduced by
€0.4 billion, ‘Non-property SME and corporate’ by €0.4 billion and ‘Property and construction’ by €0.9 billion.
BOI Interim Report 2017 BACK.qxp_Layout 1 27/07/2017 20:09 Page 119
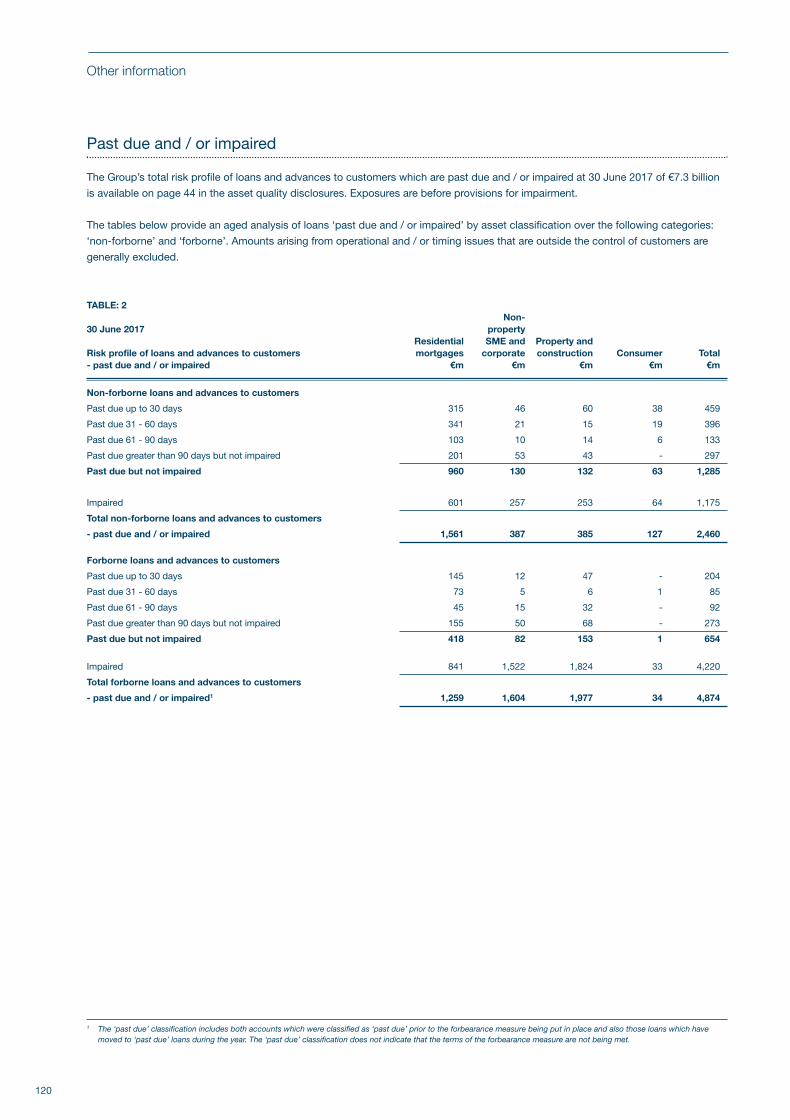
120
Other information
Past due and / or impaired
The Group’s total risk profile of loans and advances to customers which are past due and / or impaired at 30 June 2017 of €7.3 billion
is available on page 44 in the asset quality disclosures. Exposures are before provisions for impairment.
The tables below provide an aged analysis of loans ‘past due and / or impaired’ by asset classification over the following categories:
‘non-forborne’ and ‘forborne’. Amounts arising from operational and / or timing issues that are outside the control of customers are
generally excluded.
TABLE: 2 Non- 30 June 2017 property Residential SME and Property and Risk profile of loans and advances to customers mortgages corporate construction Consumer Total- past due and / or impaired €m €m €m €m €m
Non-forborne loans and advances to customers
Past due up to 30 days 315 46 60 38 459
Past due 31 - 60 days 341 21 15 19 396
Past due 61 - 90 days 103 10 14 6 133
Past due greater than 90 days but not impaired 201 53 43 - 297
Past due but not impaired 960 130 132 63 1,285
Impaired 601 257 253 64 1,175
Total non-forborne loans and advances to customers
- past due and / or impaired 1,561 387 385 127 2,460
Forborne loans and advances to customers
Past due up to 30 days 145 12 47 - 204
Past due 31 - 60 days 73 5 6 1 85
Past due 61 - 90 days 45 15 32 - 92
Past due greater than 90 days but not impaired 155 50 68 - 273
Past due but not impaired 418 82 153 1 654
Impaired 841 1,522 1,824 33 4,220
Total forborne loans and advances to customers
- past due and / or impaired1 1,259 1,604 1,977 34 4,874
1 The ‘past due’ classification includes both accounts which were classified as ‘past due’ prior to the forbearance measure being put in place and also those loans which havemoved to ‘past due’ loans during the year. The ‘past due’ classification does not indicate that the terms of the forbearance measure are not being met.
BOI Interim Report 2017 BACK.qxp_Layout 1 27/07/2017 20:09 Page 120
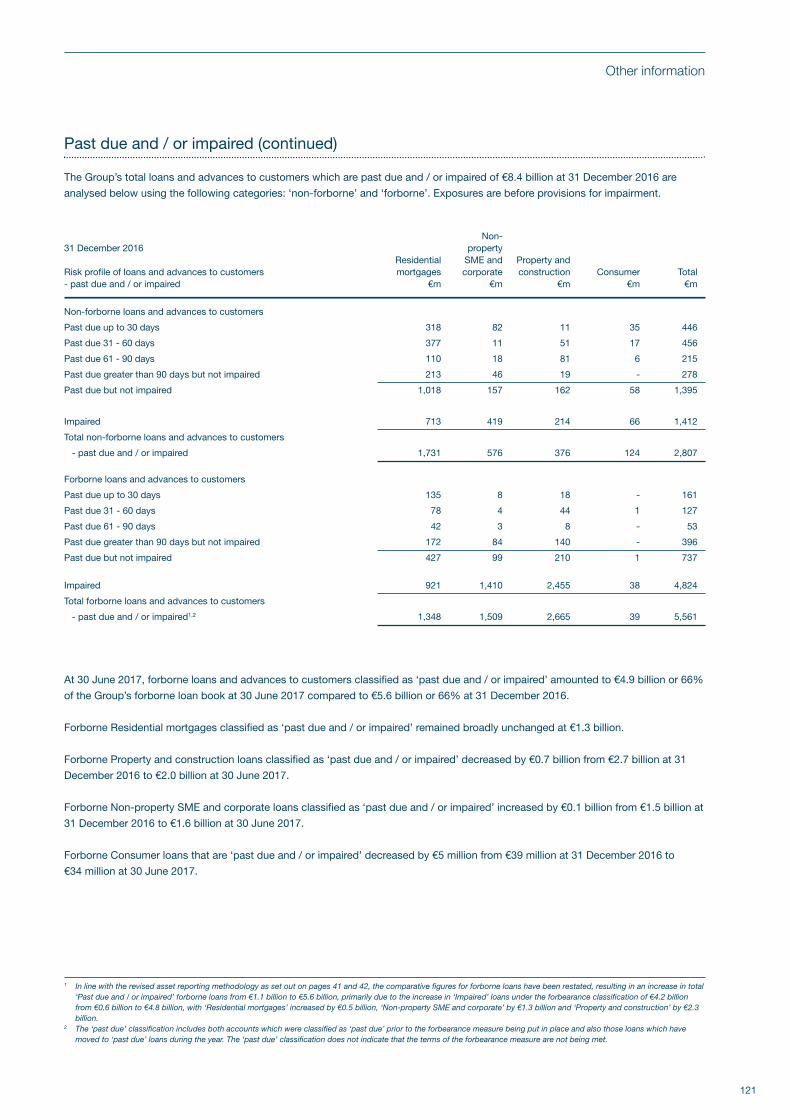
121
Other information
Past due and / or impaired (continued)
The Group’s total loans and advances to customers which are past due and / or impaired of €8.4 billion at 31 December 2016 are
analysed below using the following categories: ‘non-forborne’ and ‘forborne’. Exposures are before provisions for impairment.
Non- 31 December 2016 property Residential SME and Property and
Risk profile of loans and advances to customers mortgages corporate construction Consumer Total- past due and / or impaired €m €m €m €m €m
Non-forborne loans and advances to customers
Past due up to 30 days 318 82 11 35 446
Past due 31 - 60 days 377 11 51 17 456
Past due 61 - 90 days 110 18 81 6 215
Past due greater than 90 days but not impaired 213 46 19 - 278
Past due but not impaired 1,018 157 162 58 1,395
Impaired 713 419 214 66 1,412
Total non-forborne loans and advances to customers
- past due and / or impaired 1,731 576 376 124 2,807
Forborne loans and advances to customers
Past due up to 30 days 135 8 18 - 161
Past due 31 - 60 days 78 4 44 1 127
Past due 61 - 90 days 42 3 8 - 53
Past due greater than 90 days but not impaired 172 84 140 - 396
Past due but not impaired 427 99 210 1 737
Impaired 921 1,410 2,455 38 4,824
Total forborne loans and advances to customers
- past due and / or impaired1,2 1,348 1,509 2,665 39 5,561
At 30 June 2017, forborne loans and advances to customers classified as ‘past due and / or impaired’ amounted to €4.9 billion or 66%
of the Group’s forborne loan book at 30 June 2017 compared to €5.6 billion or 66% at 31 December 2016.
Forborne Residential mortgages classified as ‘past due and / or impaired’ remained broadly unchanged at €1.3 billion.
Forborne Property and construction loans classified as ‘past due and / or impaired’ decreased by €0.7 billion from €2.7 billion at 31
December 2016 to €2.0 billion at 30 June 2017.
Forborne Non-property SME and corporate loans classified as ‘past due and / or impaired’ increased by €0.1 billion from €1.5 billion at
31 December 2016 to €1.6 billion at 30 June 2017.
Forborne Consumer loans that are ‘past due and / or impaired’ decreased by €5 million from €39 million at 31 December 2016 to
€34 million at 30 June 2017.
1 In line with the revised asset reporting methodology as set out on pages 41 and 42, the comparative figures for forborne loans have been restated, resulting in an increase in total‘Past due and / or impaired’ forborne loans from €1.1 billion to €5.6 billion, primarily due to the increase in ‘Impaired’ loans under the forbearance classification of €4.2 billionfrom €0.6 billion to €4.8 billion, with ‘Residential mortgages’ increased by €0.5 billion, ‘Non-property SME and corporate’ by €1.3 billion and ‘Property and construction’ by €2.3billion.
2 The ‘past due’ classification includes both accounts which were classified as ‘past due’ prior to the forbearance measure being put in place and also those loans which havemoved to ‘past due’ loans during the year. The ‘past due’ classification does not indicate that the terms of the forbearance measure are not being met.
BOI Interim Report 2017 BACK.qxp_Layout 1 27/07/2017 20:09 Page 121
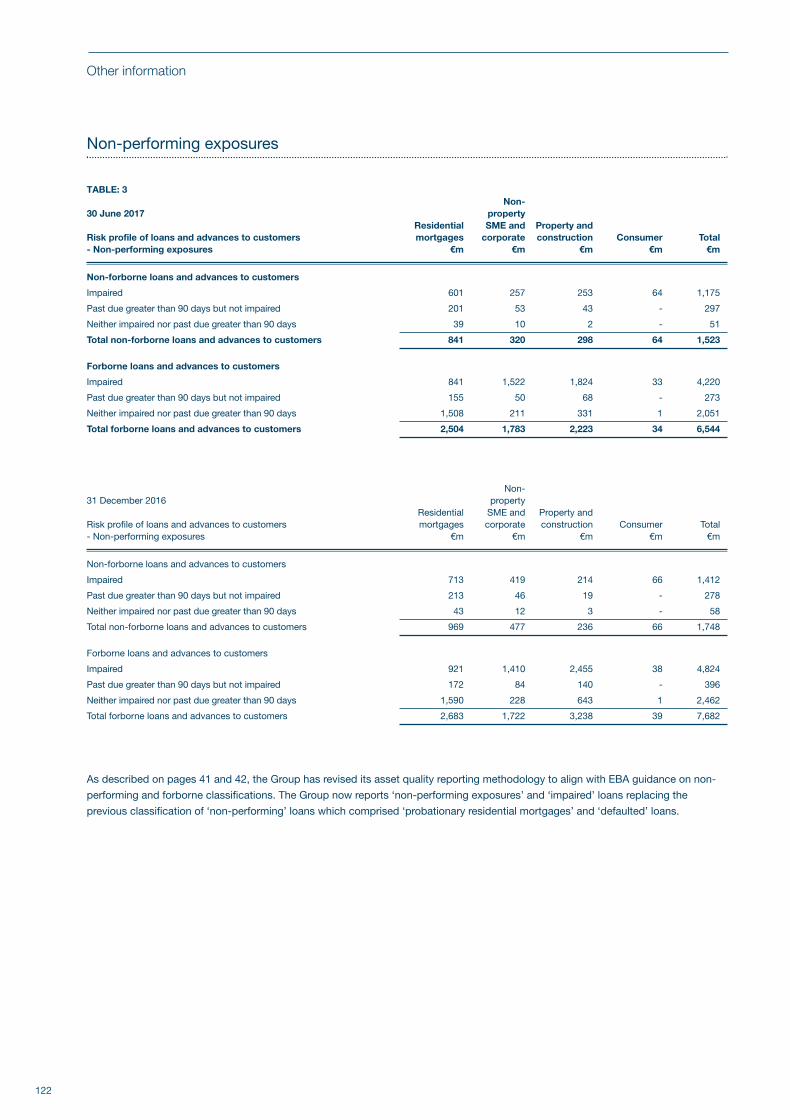
122
Other information
Non-performing exposures
TABLE: 3 Non- 30 June 2017 property Residential SME and Property and Risk profile of loans and advances to customers mortgages corporate construction Consumer Total- Non-performing exposures €m €m €m €m €m
Non-forborne loans and advances to customers
Impaired 601 257 253 64 1,175
Past due greater than 90 days but not impaired 201 53 43 - 297
Neither impaired nor past due greater than 90 days 39 10 2 - 51
Total non-forborne loans and advances to customers 841 320 298 64 1,523
Forborne loans and advances to customers
Impaired 841 1,522 1,824 33 4,220
Past due greater than 90 days but not impaired 155 50 68 - 273
Neither impaired nor past due greater than 90 days 1,508 211 331 1 2,051
Total forborne loans and advances to customers 2,504 1,783 2,223 34 6,544
Non- 31 December 2016 property Residential SME and Property and
Risk profile of loans and advances to customers mortgages corporate construction Consumer Total- Non-performing exposures €m €m €m €m €m
Non-forborne loans and advances to customers
Impaired 713 419 214 66 1,412
Past due greater than 90 days but not impaired 213 46 19 - 278
Neither impaired nor past due greater than 90 days 43 12 3 - 58
Total non-forborne loans and advances to customers 969 477 236 66 1,748
Forborne loans and advances to customers
Impaired 921 1,410 2,455 38 4,824
Past due greater than 90 days but not impaired 172 84 140 - 396
Neither impaired nor past due greater than 90 days 1,590 228 643 1 2,462
Total forborne loans and advances to customers 2,683 1,722 3,238 39 7,682
As described on pages 41 and 42, the Group has revised its asset quality reporting methodology to align with EBA guidance on non-
performing and forborne classifications. The Group now reports ‘non-performing exposures’ and ‘impaired’ loans replacing the
previous classification of ‘non-performing’ loans which comprised ‘probationary residential mortgages’ and ‘defaulted’ loans.
BOI Interim Report 2017 BACK.qxp_Layout 1 27/07/2017 20:09 Page 122
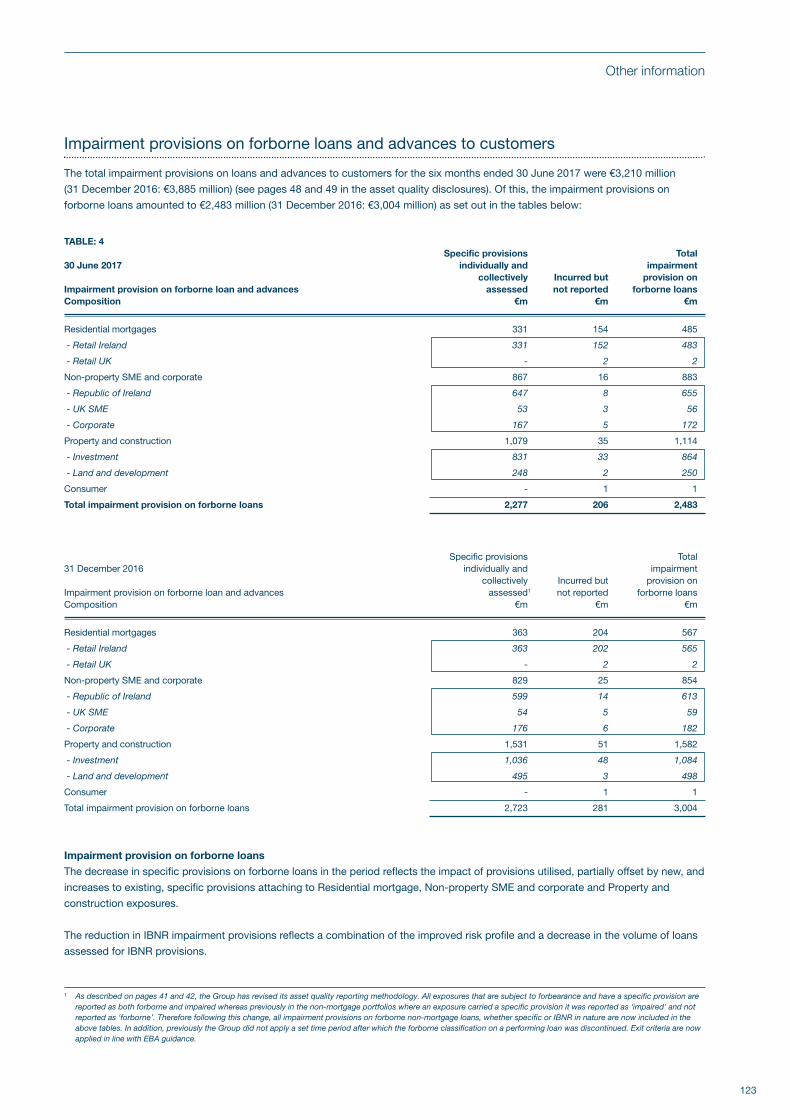
123
Other information
Impairment provisions on forborne loans and advances to customers
The total impairment provisions on loans and advances to customers for the six months ended 30 June 2017 were €3,210 million
(31 December 2016: €3,885 million) (see pages 48 and 49 in the asset quality disclosures). Of this, the impairment provisions on
forborne loans amounted to €2,483 million (31 December 2016: €3,004 million) as set out in the tables below:
TABLE: 4 Specific provisions Total30 June 2017 individually and impairment collectively Incurred but provision on Impairment provision on forborne loan and advances assessed not reported forborne loansComposition €m €m €m
Residential mortgages 331 154 485
- Retail Ireland 331 152 483
- Retail UK - 2 2
Non-property SME and corporate 867 16 883
- Republic of Ireland 647 8 655
- UK SME 53 3 56
- Corporate 167 5 172
Property and construction 1,079 35 1,114
- Investment 831 33 864
- Land and development 248 2 250
Consumer - 1 1
Total impairment provision on forborne loans 2,277 206 2,483
Specific provisions Total31 December 2016 individually and impairment collectively Incurred but provision on Impairment provision on forborne loan and advances assessed1 not reported forborne loansComposition €m €m €m
Residential mortgages 363 204 567
- Retail Ireland 363 202 565
- Retail UK - 2 2
Non-property SME and corporate 829 25 854
- Republic of Ireland 599 14 613
- UK SME 54 5 59
- Corporate 176 6 182
Property and construction 1,531 51 1,582
- Investment 1,036 48 1,084
- Land and development 495 3 498
Consumer - 1 1
Total impairment provision on forborne loans 2,723 281 3,004
Impairment provision on forborne loans
The decrease in specific provisions on forborne loans in the period reflects the impact of provisions utilised, partially offset by new, and
increases to existing, specific provisions attaching to Residential mortgage, Non-property SME and corporate and Property and
construction exposures.
The reduction in IBNR impairment provisions reflects a combination of the improved risk profile and a decrease in the volume of loans
assessed for IBNR provisions.
1 As described on pages 41 and 42, the Group has revised its asset quality reporting methodology. All exposures that are subject to forbearance and have a specific provision arereported as both forborne and impaired whereas previously in the non-mortgage portfolios where an exposure carried a specific provision it was reported as ‘impaired’ and notreported as ‘forborne’. Therefore following this change, all impairment provisions on forborne non-mortgage loans, whether specific or IBNR in nature are now included in theabove tables. In addition, previously the Group did not apply a set time period after which the forborne classification on a performing loan was discontinued. Exit criteria are nowapplied in line with EBA guidance.
BOI Interim Report 2017 BACK.qxp_Layout 1 27/07/2017 20:09 Page 123
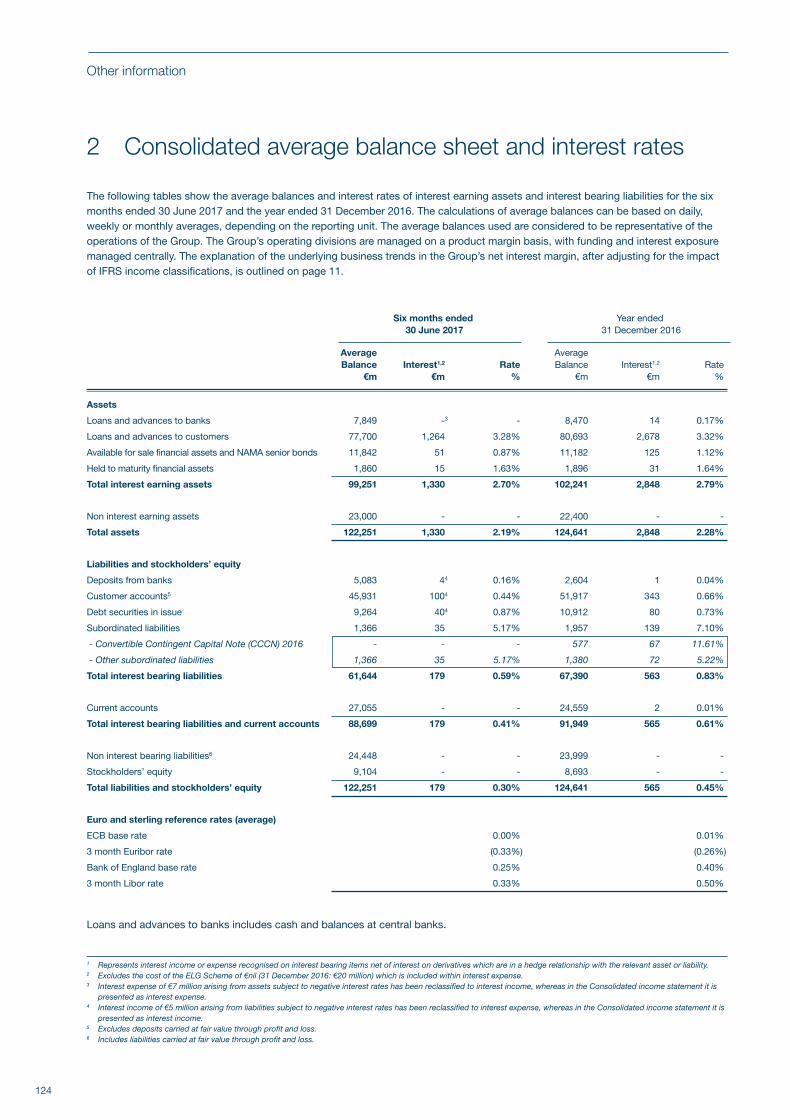
124
Other information
1 Represents interest income or expense recognised on interest bearing items net of interest on derivatives which are in a hedge relationship with the relevant asset or liability.2 Excludes the cost of the ELG Scheme of €nil (31 December 2016: €20 million) which is included within interest expense.3 Interest expense of €7 million arising from assets subject to negative interest rates has been reclassified to interest income, whereas in the Consolidated income statement it is
presented as interest expense.4 Interest income of €5 million arising from liabilities subject to negative interest rates has been reclassified to interest expense, whereas in the Consolidated income statement it is
presented as interest income.5 Excludes deposits carried at fair value through profit and loss.6 Includes liabilities carried at fair value through profit and loss.
2 Consolidated average balance sheet and interest rates
The following tables show the average balances and interest rates of interest earning assets and interest bearing liabilities for the sixmonths ended 30 June 2017 and the year ended 31 December 2016. The calculations of average balances can be based on daily,weekly or monthly averages, depending on the reporting unit. The average balances used are considered to be representative of theoperations of the Group. The Group’s operating divisions are managed on a product margin basis, with funding and interest exposuremanaged centrally. The explanation of the underlying business trends in the Group’s net interest margin, after adjusting for the impactof IFRS income classifications, is outlined on page 11.
Six months ended Year ended 30 June 2017 31 December 2016
Average AverageBalance Interest1,2 Rate Balance Interest1,2 Rate
€m €m % €m €m %
Assets
Loans and advances to banks 7,849 -3 - 8,470 14 0.17%
Loans and advances to customers 77,700 1,264 3.28% 80,693 2,678 3.32%
Available for sale financial assets and NAMA senior bonds 11,842 51 0.87% 11,182 125 1.12%
Held to maturity financial assets 1,860 15 1.63% 1,896 31 1.64%
Total interest earning assets 99,251 1,330 2.70% 102,241 2,848 2.79%
Non interest earning assets 23,000 - - 22,400 - -
Total assets 122,251 1,330 2.19% 124,641 2,848 2.28%
Liabilities and stockholders’ equity
Deposits from banks 5,083 44 0.16% 2,604 1 0.04%
Customer accounts5 45,931 1004 0.44% 51,917 343 0.66%
Debt securities in issue 9,264 404 0.87% 10,912 80 0.73%
Subordinated liabilities 1,366 35 5.17% 1,957 139 7.10%
- Convertible Contingent Capital Note (CCCN) 2016 - - - 577 67 11.61%
- Other subordinated liabilities 1,366 35 5.17% 1,380 72 5.22%
Total interest bearing liabilities 61,644 179 0.59% 67,390 563 0.83%
Current accounts 27,055 - - 24,559 2 0.01%
Total interest bearing liabilities and current accounts 88,699 179 0.41% 91,949 565 0.61%
Non interest bearing liabilities6 24,448 - - 23,999 - -
Stockholders’ equity 9,104 - - 8,693 - -
Total liabilities and stockholders’ equity 122,251 179 0.30% 124,641 565 0.45%
Euro and sterling reference rates (average)
ECB base rate 0.00% 0.01%
3 month Euribor rate (0.33%) (0.26%)
Bank of England base rate 0.25% 0.40%
3 month Libor rate 0.33% 0.50%
Loans and advances to banks includes cash and balances at central banks.
BOI Interim Report 2017 BACK.qxp_Layout 1 27/07/2017 20:09 Page 124
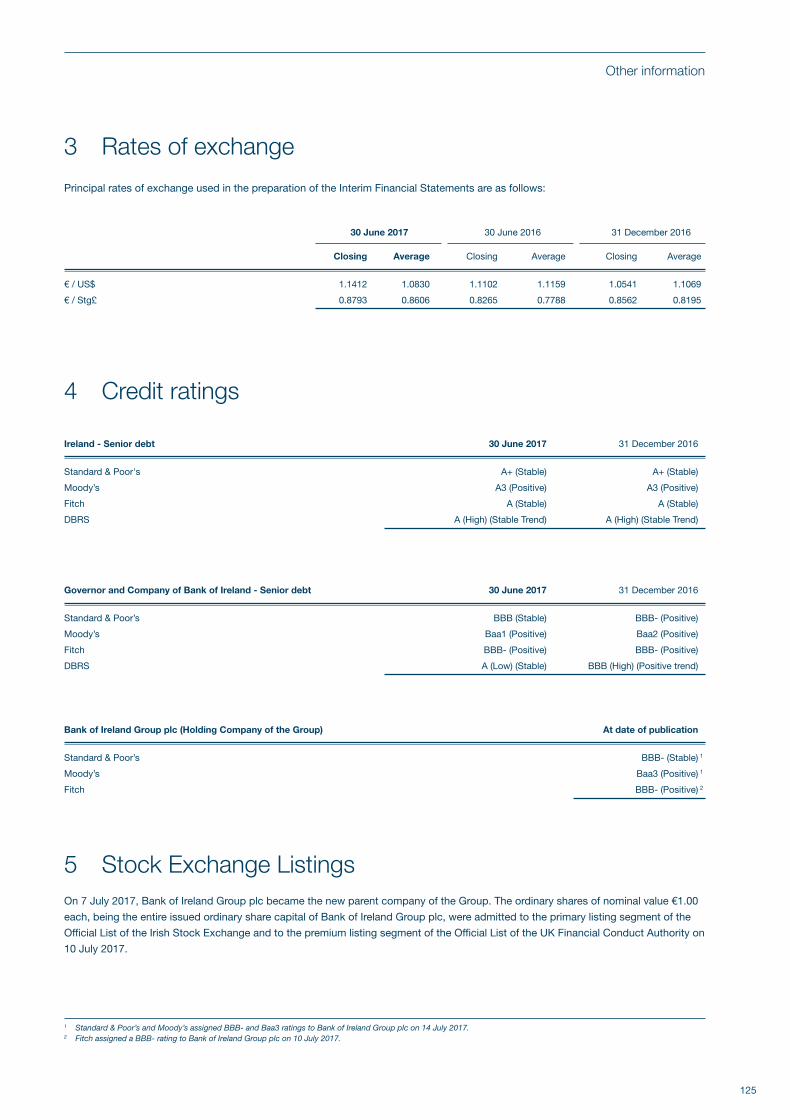
125
Other information
3 Rates of exchange
Principal rates of exchange used in the preparation of the Interim Financial Statements are as follows:
30 June 2017 30 June 2016 31 December 2016
Closing Average Closing Average Closing Average
€ / US$ 1.1412 1.0830 1.1102 1.1159 1.0541 1.1069
€ / Stg£ 0.8793 0.8606 0.8265 0.7788 0.8562 0.8195
4 Credit ratings
Ireland - Senior debt 30 June 2017 31 December 2016
Standard & Poor's A+ (Stable) A+ (Stable)
Moody’s A3 (Positive) A3 (Positive)
Fitch A (Stable) A (Stable)
DBRS A (High) (Stable Trend) A (High) (Stable Trend)
Governor and Company of Bank of Ireland - Senior debt 30 June 2017 31 December 2016
Standard & Poor’s BBB (Stable) BBB- (Positive)
Moody’s Baa1 (Positive) Baa2 (Positive)
Fitch BBB- (Positive) BBB- (Positive)
DBRS A (Low) (Stable) BBB (High) (Positive trend)
Bank of Ireland Group plc (Holding Company of the Group) At date of publication
Standard & Poor’s BBB- (Stable) 1
Moody’s Baa3 (Positive) 1
Fitch BBB- (Positive) 2
5 Stock Exchange ListingsOn 7 July 2017, Bank of Ireland Group plc became the new parent company of the Group. The ordinary shares of nominal value €1.00
each, being the entire issued ordinary share capital of Bank of Ireland Group plc, were admitted to the primary listing segment of the
Official List of the Irish Stock Exchange and to the premium listing segment of the Official List of the UK Financial Conduct Authority on
10 July 2017.
1 Standard & Poor’s and Moody’s assigned BBB- and Baa3 ratings to Bank of Ireland Group plc on 14 July 2017.2 Fitch assigned a BBB- rating to Bank of Ireland Group plc on 10 July 2017.
BOI Interim Report 2017 BACK.qxp_Layout 1 27/07/2017 20:09 Page 125
126
Other information
6 Glossary
Further information related to certain measures referred to in the Key Highlights and PerformanceSummary
Average cost of funds represents the interest expense recognised on interest bearing liabilities, net of interest on derivatives which
are in a hedge relationship with the relevant liability. See page 11 and page 124 for further information.
Business income is net other income after IFRS income classifications before other gains and other valuation items. See page 12 for
further details.
Constant currency: To enable a better understanding of performance, certain variances are calculated on a constant currency basis
by adjusting for the impact of movements in exchange rates during the period as follows:
• For balance sheet items, by reference to the closing rate at the end of the current and prior period ends; and
• For items relating to the income statement, by reference to the current and prior period average rates.
Cost income ratio is calculated on an underlying basis (excluding non-core items) as operating expenses excluding levies and
regulatory charges divided by operating income (net of insurance claims).
Forborne collateral realisation loans (FCRs) that are not greater than 90 days past due and / or impaired consist of loans (primarily
residential mortgages) where forbearance is in place and where future reliance on the realisation of collateral is expected, for the
repayment in full of the relevant borrower loan. Such arrangements will include Split Mortgages and certain ‘Interest Only’ / ‘Interest
Only plus’ arrangements.
Growth in core loan book is gross new lending volumes less redemptions & repayments, excluding those related to (1) the RoI tracker
mortgage book, (2) impaired loans and (3) GB business banking / GB corporate banking books which were previously mandated by the
EU for run-down. See page 18 for further details.
Gross new lending volumes represent loans and advances to customers drawn down during the period and portfolio acquisitions.
Gross yield represents the interest income recognised on interest bearing assets, net of interest on derivatives which are in a hedge
relationship with the relevant asset. See page 11 and page 124 for further information.
Impairment charge on loans and advances to customers (bps) is the net impairment charge on loans and advances to customers
divided by average gross loans and advances to customers (including held for sale).
Liquid assets are comprised of cash and balances at central banks, loans and advances to banks (excluding balances in Bank of
Ireland Life), held to maturity financial assets, NAMA senior bonds and certain available for sale financial assets. See page 19 for
further details.
Liquid asset spread is calculated as gross yield on interest bearing liquid assets less the average cost of funds. See page 11 for
further detail.
Loan asset spread is calculated as gross yield on loans and advances to customers less the average cost of funds. See page 11 for
further detail.
Loan to deposit ratio is calculated as being net loans and advances to customers divided by customer deposits.
Net interest margin is stated before ELG fees and after adjusting for IFRS income classifications. See page 11 for further details.
Non-performing exposures consist of impaired loans, loans greater than 90 days in arrears and not impaired, Forborne Collateral
Realisation loans (FCRs) and other / probationary loans that have yet to satisfy exit criteria in line with EBA guidance to return to
performing.
BOI Interim Report 2017 BACK.qxp_Layout 1 27/07/2017 20:09 Page 126

127
Other information
Organic capital generation consists of attributable profit, AFS reserve movements, the reduction in DTA deduction (DTAs that rely on
future profitability), movements in the Expected Loss deduction and RWA book size and quality movements.
Return on assets is calculated as being statutory net profit (being profit after tax) divided by total assets, in line with the requirement
in the European Union (Capital Requirements) Regulations 2014.
Tangible Net Asset Value (TNAV) per share is calculated as stockholder equity excluding amounts not attributable to ordinary
stockholders and intangible assets divided by the number of ordinary shares in issue as adjusted for the stock consolidation
implemented on 7 July 2017 and for own stock held for the benefit of life assurance policyholders.
Underlying excludes non-core items which are those items that the Group believes obscure the underlying performance trends in the
business. See page 15 for further information.
Wholesale funding is comprised of deposits by banks (including collateral received) and debt securities in issue.
Glossary (continued)
BOI Interim Report 2017 BACK.qxp_Layout 1 27/07/2017 20:09 Page 127

THIS PAGE HAS INTENTIONALLY BEEN LEFT BLANK
BOI Interim Report 2017 BACK.qxp_Layout 1 27/07/2017 20:09 Page 128

BOI Interim Report 2017 BACK.qxp_Layout 1 27/07/2017 20:09 Page 129

BOI Interim Report 2017 BACK.qxp_Layout 1 27/07/2017 20:09 Page 130