
ONCOLOGIA Evaluation of a Novel Mouse Model of Pancreatic ... · O Tiago (aka Tigas, como gosto de...
97
INSTITUTO DE CIÊNCIAS BIOMÉDICAS ABEL SALAZAR Ana Isabel da Rocha Sá. Evaluation of a Novel Mouse Model of Pancreatic Neuroendocrine Tumors Evaluation of a Novel Mouse Model of Pancreatic Neuroendocrine Tumors Ana Isabel da Rocha Sá Evaluation of a Novel Mouse Model of Pancreatic Neuroendocrine Tumors Ana Isabel da Rocha Sá M 2017 M .ICBAS 2017 MESTRADO ONCOLOGIA
Transcript of ONCOLOGIA Evaluation of a Novel Mouse Model of Pancreatic ... · O Tiago (aka Tigas, como gosto de...
INST
ITU
TO
DE C
IÊNC
IAS B
IOM
ÉDIC
AS A
BEL SA
LAZ
AR
Ana Isabel da R
ocha Sá. Evaluation of a Novel M
ouse Model of
Pancreatic Neuroendocrine Tum
ors
Evaluation of a Novel M
ouse Model of Pancreatic
Neuroendocrine Tum
ors
Ana Isabel da Rocha Sá
Evaluation of a Novel Mouse Model of Pancreatic Neuroendocrine Tumors
Ana Isabel da Rocha Sá
M 2017
M.IC
BAS 2017
MESTRADO
ONCOLOGIA

Ana Isabel da Rocha Sá
EVALUATION OF A NOVEL MOUSE MODEL
OF PANCREATIC NEUROENDOCRINE TUMORS
Dissertação de Candidatura ao grau de Mestre
em Oncologia, submetida ao Instituto de
Ciências Biomédicas Abel Salazar da
Universidade do Porto.
Orientador – Doutor João Pedro Rico de Oliveira Vinagre
Categoria – Investigador Assistente do Grupo Cancer Signalling and Metabolism (I3S/IPATIMUP), Professor Afiliado (FMUP)
Afiliação – Instituto de Investigação e Inovação em Saúde/Instituto de Patologia e Imunologia Molecular da Universidade do Porto (I3S/IPATIMUP), Faculdade de Medicina da Universidade do Porto (FMUP)
Coorientador – Professora Doutora Ana Paula Soares Dias Ferreira
Categoria – Professor Auxiliar (FMUP), Coordenadora do Grupo Cancer Signalling and Metabolism (I3S/IPATIMUP)
Afiliação – Faculdade de Medicina da Universidade do Porto (FMUP), Instituto de Investigação e Inovação em Saúde/Instituto de Patologia e Imunologia Molecular da Universidade do Porto (I3S/IPATIMUP)


Be afraid…
And do it anyway.


AGRADECIMENTOS
Fui avisada que escrever estes agradecimentos seria mais difícil do que estava à
espera. Vou ter que concordar, já que se avizinha uma longa lista, cheia de pessoas
importantes que me fazem estar grata por estarem presentes, e sem as quais não estaria
hoje a terminar este ciclo. Preciso então de lhes prestar uma pequena mas justa
“homenagem” por tudo aquilo que fizeram por mim.
Começo por agradecer ao meu orientador, o Doutor João Vinagre. Não há palavras
que descrevam todo o conhecimento, ajuda e bom humor que me transmitiu no último ano.
Antes de iniciar este percurso, era difícil imaginar uma pessoa que admirasse desta forma,
com toda a sua facilidade de comunicar, ensinar, fazer rir e de acalmar em momentos em
que eu própria desanimava. Obrigada por me ter permitido embarcar neste seu projeto,
que a cada resultado se tornava mais interessante e abria mais portas para novos achados.
Dessa forma, por ter sido um guia, por me ter feito sentir tão “acolhida” durante todo este
percurso, pela atenção, pela boa disposição que nunca deixou de me transmitir, a mim e a
todos à sua volta, e por mil e uma expressões inovadoras e engraçadas, um enorme
obrigada.
À Professora Doutora Paula Soares, minha co-orientadora, agradeço ter permitido
a minha entrada no Cancer Signalling and Metabolism, e por ter acompanhado de perto e
com olhar atento todo o meu percurso neste projeto de mestrado.
Não poderia deixar de agradecer também à Professora Doutora Carmen Jerónimo,
diretora do Mestrado em Oncologia, por ter aceite o meu ingresso neste ciclo de estudos.
Senti-me verdadeiramente sortuda neste último ano. Estive todos os dias rodeada
de pessoas que ganharam um lugar especial na minha vida, que tornaram a rotina tudo
menos rotineira e que me proporcionaram memórias e momentos que vão ser sempre
recordados. A Lili tornou-se a minha companheira há dois anos. Foi uma alegria saber que
iríamos fazer este percurso juntas. Deixa-me feliz perceber o quanto já passámos em tão
pouco tempo, o quão bem nos conhecemos e o quanto fomos o apoio uma da outra desde
o início. Estamos lá nos momentos bons e nos menos bons, em que conseguimos
encontrar sempre uma maneira de nos consolarmos. Sinto-me especial como conhecer tão
bem o seu jeito tão caraterístico. Por isso, obrigada, ‘miga’, por teres estado sempre lá.
O Tiago (aka Tigas, como gosto de lhe chamar) tornou-se, além de meu lab partner,
um grande amigo. Lembro-me de ter pensado que tinha destruído as probabilidades de
uma relação cordial depois de lhe secar a caneta de acetato a escrever num bloco de
parafina (pouco depois da primeira vez em que falei com ele!), mas a verdade é que,

surpreendentemente e ainda sem perceber como tão naturalmente, ficámos cada vez mais
amigos. São incontáveis as vezes que já me fez rir, com fotos e vídeos de nossa autoria,
nomenclaturas improváveis e com as suas expressões luso-inglesas tão caraterísticas e
inesperadas. E claro que nunca é demais agradecer por ter sido tão crucial e ter estado
presente em todo o trabalho que desenvolvi durante este ano. Foi muito bom ter descoberto
estas coisas tão ‘fixes’ e poder partilhá-las!
A Sofia, a minha Mr. Duarte. Uma certa frase que lhe disse há já quase um ano
ficou mítica, e não é que se revelou inteiramente verdade. Fico feliz de ver aquela cara
sempre que chego todos os dias, é um facto. Tornou-se uma confidente e alguém que
todos os dias me espanta com a sua genuinidade, me faz rir como se não houvesse
amanhã, e que está sempre pronta a ajudar (até com picadas com agulhas em unhas
negras!). ‘Gurl’, obrigada pela pessoa que és e por dares mais cor aos meus dias há um
ano. “Se não fosses tu…”.
À Silvana, que demorou um pouquinho mais de tempo a ‘revelar-se’, mas quando
o fez, surpreendeu-me como uma das melhores pessoas que já conheci. Pensar que pode
e eventualmente vai chegar o dia em que depois do almoço não vem lá ela com a sua
auréola positiva e os seus ‘quoé?’ é impensável. Não quero (nem posso) perder as nossas
dissertações e teorias sobre Game of Thrones, filmes, viagens, ver o mundo, gatos e
vídeos de leões falantes. Olho para ela e vejo a pessoa que adoraria tornar-me daqui a
uns anos, com toda a sua ternura, descontração e simplicidade.
À Cristina, que estava sempre pronta a ouvir e a contar histórias, como as de partos
improváveis em FAFE, ou a abrir discussões sobre écleres serem ou não tíbias.
À Catarina, a ‘querida amiga’, um membro devoto do clube das descabeladas com
teses para entregar/defender, que esteve sempre pronta a ajudar, a ouvir com afinco os
nossos problemas, e a mandar uma das suas belas risadas malévolas que me deixam
sempre bem-disposta.
À Ana Pestana, que me ajudou numa fase final da tese, de muita ansiedade, mas
que culminou com um ‘moranguinho do nordeste’ que de vez em quando ainda vou
admirar.
E a todos os outros membros deste grupo especial que é o Cancer Signaling and
Metabolism, em que há sempre alguém pronto a ajudar. Há pessoas para as quais nem há
muitas palavras porque palavras não bastam. Estas pessoas são “O” exemplo. Com toda
a sua simplicidade, tornam cada dia um dia bom, um dia ‘hilário’, um dia rico. Tornam a
vida mais completa com almoços e jantares, incursões às minis a 40 cêntimos, passeios,
lanches, momentos de varanda ou mensagens de aniversário vergonhosas.

Quero agradecer à Sara, o meu Vivalde, que é a pessoa mais genuína e divertida
que conheci até hoje. Não é cliché dizer que é minha irmã, além de ser a minha melhor
amiga. Conhece-me como ninguém, e tem sido um apoio fundamental que me ajudou a
ultrapassar os piores momentos de ansiedade e tristeza.
Um obrigada enorme também ao Nuno, que é uma verdadeira Anabela de
Malhadas e que por isso me faz sorrir todos os dias. É a pessoa a quem recorro quando
estou numa alhada, e sei que ele vem em meu auxílio, mesmo que isso signifique dar-me
cabo do juízo meia hora. Seja para uma alhada seja para um passeio domingueiro em
Miramar, um pôr-do-sol nas Virtudes ou até uma ida a Barcelona… ou Budapeste!
Agradeço à Ana Évora, que foi a minha companheira inseparável de 3 anos de
Bioquímica, com um Erasmus pelo meio, que mudou cada uma de nós e a nossa maneira
de pensar, olhando o mundo com outros olhos. Isto depois de termos vindo a crescer juntas
desde os 12 anos. Fomos ‘As Anas’ em Portugal, na Hungria, e espero sermos por muitos
anos.
Tenho ainda de agradecer a todo o meu grupo de meninas com quem o número de
histórias é infindável. A Marta e a Verónica estão comigo há 17 anos, e mais uns quantos
estão certamente por vir. Por tudo aquilo que já me ajudaram a ultrapassar e por todos os
momentos que já vivemos, dão o verdadeiro sentido à expressão ‘para os bons e maus
momentos’.
A minha Juju torna tudo mais doce, e consegue sempre confortar-me com a sua
ternura. A Carol nunca deixa de me surpreender com a sua lealdade e com o quanto é uma
amiga presente, mesmo estando longe. A Vanessa, pelo quanto é igual a mim em 1001
sentidos, deixa-me destroçada por não poder estar com ela a criar histórias das nossas
todos os dias. Tanto mais poderia ser dito para cada uma delas, de tantos anos de
companheirismo e ‘irmandade’. Mas, para já, fica apenas o meu obrigada. É bom o
pensamento de nós todas juntas, tal e qual como somos hoje, mas daqui a 50 anos, e essa
imagem não é nada difícil de criar.
À minha mãe, o maior dos obrigadas. Por tudo aquilo que fez por mim em 23 anos.
Por tudo o que me proporcionou, pelo quanto é forte e pelo quanto me faz forte. Por ainda
hoje me proteger como se fosse uma menina. Por falar de mim com um orgulho do qual
espero ser merecedora. Por muito que não cheguemos a acordo sobre muitas coisas, ela
é o meu maior porto de abrigo. A pessoa que sabe sempre o que dizer para me confortar
e que me surpreende com os conselhos certos, na hora certa. Obrigada por me ter feito a
pessoa que sou. Na sua fragilidade, é a pessoa mais forte que conheço. Acho que nunca
lho disse, mas é o meu ídolo.

Obrigada também ao meu irmão Filipe, que é um irmão galinha disfarçado, mas
que não engana ninguém. As nossas zangas em criança e adolescentes hoje são motivo
para nos rirmos. Agradeço também à minha cunhada Ana, pelo seu apoio e por acreditar
que posso sempre ir mais longe. E obrigada às duas pequeninas deles, as minhas
sobrinhas lindas, que embora só possam ler e compreender esta dedicatória daqui a muitos
anos, me proporcionaram dos momentos de felicidade mais pura, ternura e (des)sanidade
mental desde o momento em que nasceram!
Em último lugar, um agradecimento diferente mas o mais especial de todos. Um
obrigada ao meu pai, por a ele dever tudo o que sou. Apesar de ele não me poder ver a
terminar esta fase, sinto que está perto de alguma forma. Basta fechar os olhos e posso
quase ouvir um ‘parabéns meu anjo’. É a ele que dedico esta e qualquer outra conquista
daqui para a frente. Sempre foi o meu mentor, o meu conselheiro, o meu professor. Não
há ninguém mais a quem dedicar esta tese que não ao meu melhor amigo.


VII

VIII
ABBREVIATIONS
α Alpha cells
β Beta cells
δ Delta cells
γ Gamma cells
ACTH Adrenocortical hormone
ADD ATRX-DNMT3-DNMT3L
AJCC American Joint Committee for Cancer
ALT Alternative lengthening of telomeres
APB ALT-associated PML nuclear body
ATRX Alpha thalassemia/mental retardation X-linked
ATRXt Shorter isoform of ATRX
BRCA2 Breast cancer gene 2
CD56 Cluster differentiation of neural cell adhesion antigen
CDKNB1 Cyclin dependent kinase inhibitor 1B
CgA Chromogranin A
CHEK2 Checkpoint kinase 2
Cre Cyclisation recombination enzyme
DAB 3,3’ Diaminobenzidine
DAXX Death domain associated protein
DEPDC5 DEP domain containing 5
DNA Deoxyribonucleic acid
EMA Epithelial membrane antigen
ENETS European Neuroendocrine Tumor Society
FAS Fas cell surface death receptor
FFPE Formalin-fixed paraffin embedded tissue
G4 G4 DNA quadruplexes
GRH Growth releasing hormone
H3.3 Histone variant 3.3
H3K4me0 Unmodified histone 3 lysine 4
H3K9me3 Trimethylation of histone 3 lysine 9
HE Hematoxylin and Eosin
HIER Heat induced epitope retrieval
HP1 Heterochromatin protein 1
HPF High power field
HR Homologous recombination
Id1 Inhibitor of DNA binding 1
IHC Immunohistochemistry
IF Immunofluorescence
IL Interleukin 6
Isl Insulin gene enhancer protein
LCA Leucocytic common antigen

IX
LI Leucocytic infiltration
LOH Loss of heterozygosity
LoxP Locus of X over P1
LS Lesions score
MAP MUTYH associated polyposis
MEN1 Multiple endocrine neoplasia type 1
MiNEN Mixed neuroendocrine/non-neuroendocrine neoplasm
mTOR Mammalian target of rapamycin
NEC Neuroendocrine carcinoma
NET Neuroendocrine tumor
NET G1 Neuroendocrine tumor grade 1
NET G2 Neuroendocrine tumor grade 2
NET G3 Neuroendocrine tumor grade 3
NF1 Neurofibromatosis type 1
NSE Neuronal specific enolase
O6-MGMT O6 methylguanine DNA methyltransferase
PAX8 Paired box 8
PBS Phosphate buffered saline buffer
PCR Polymerase chain reaction
PDGF Platelet-derived growth factor
PDIC Poorly differentiated invasive carcinoma
Pdx1 Pancreatic and duodenal homeobox 1
PHD Plant homeodomain
PIK3CA Phosphatidylinositol 3 kinase
PML Promyelocytic leukaemia
PNET Pancreatic neuroendocrine tumor
PP Pancreatic polypeptide
PTEN Phosphatase and tensin homologue
RIP Rat insulin promoter
RT Room temperature SETD2 Histone modifier SET domain containing 2
SWI/SNP SWItch/sucrose non-fermentable
SYN Synaptophysin
TBS Tris buffered saline buffer
Tel-FISH Telomere fluorescence in situ hybridization
TERT Telomerase reverse transcriptase
TGF-α Transforming growth factor alpha
TNM Tumor-node-metastasis
TSC1 Tuberous sclerosis complex 1
TSC2 Tuberous sclerosis complex 2
UICC Union for International Cancer Control
VEGF Vascular endothelial growth factor
VHL Von Hippel-Lindau

X
VIP Vasoactive intestinal peptide
WHO World Health Organization

XI
XII
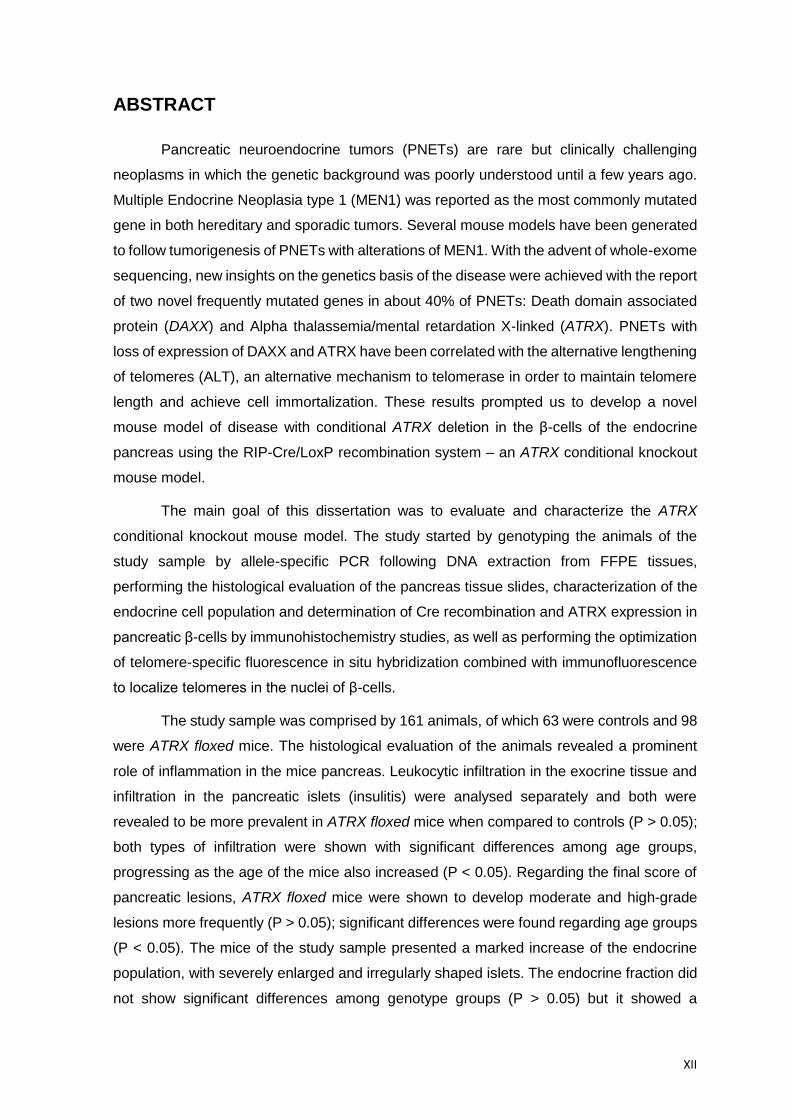
ABSTRACT
Pancreatic neuroendocrine tumors (PNETs) are rare but clinically challenging
neoplasms in which the genetic background was poorly understood until a few years ago.
Multiple Endocrine Neoplasia type 1 (MEN1) was reported as the most commonly mutated
gene in both hereditary and sporadic tumors. Several mouse models have been generated
to follow tumorigenesis of PNETs with alterations of MEN1. With the advent of whole-exome
sequencing, new insights on the genetics basis of the disease were achieved with the report
of two novel frequently mutated genes in about 40% of PNETs: Death domain associated
protein (DAXX) and Alpha thalassemia/mental retardation X-linked (ATRX). PNETs with
loss of expression of DAXX and ATRX have been correlated with the alternative lengthening
of telomeres (ALT), an alternative mechanism to telomerase in order to maintain telomere
length and achieve cell immortalization. These results prompted us to develop a novel
mouse model of disease with conditional ATRX deletion in the β-cells of the endocrine
pancreas using the RIP-Cre/LoxP recombination system – an ATRX conditional knockout
mouse model.
The main goal of this dissertation was to evaluate and characterize the ATRX
conditional knockout mouse model. The study started by genotyping the animals of the
study sample by allele-specific PCR following DNA extraction from FFPE tissues,
performing the histological evaluation of the pancreas tissue slides, characterization of the
endocrine cell population and determination of Cre recombination and ATRX expression in
pancreatic β-cells by immunohistochemistry studies, as well as performing the optimization
of telomere-specific fluorescence in situ hybridization combined with immunofluorescence
to localize telomeres in the nuclei of β-cells.
The study sample was comprised by 161 animals, of which 63 were controls and 98
were ATRX floxed mice. The histological evaluation of the animals revealed a prominent
role of inflammation in the mice pancreas. Leukocytic infiltration in the exocrine tissue and
infiltration in the pancreatic islets (insulitis) were analysed separately and both were
revealed to be more prevalent in ATRX floxed mice when compared to controls (P > 0.05);
both types of infiltration were shown with significant differences among age groups,
progressing as the age of the mice also increased (P < 0.05). Regarding the final score of
pancreatic lesions, ATRX floxed mice were shown to develop moderate and high-grade
lesions more frequently (P > 0.05); significant differences were found regarding age groups
(P < 0.05). The mice of the study sample presented a marked increase of the endocrine
population, with severely enlarged and irregularly shaped islets. The endocrine fraction did
not show significant differences among genotype groups (P > 0.05) but it showed a

XIII
progressive increase as the animals age also progressed (P < 0.05). Hyperplasic and
coalescent islets were shown to maintain a strong pattern of insulin expression, while the
expression of glucagon is dispersed and in a less extent than expected. About 12% of the
subjects developed pancreatic tumors that lack staining for the conventional markers of
neuroendocrine lineage. Cre recombinase was found to be expressed specifically in the
nuclei of β-cells. ATRX expression was also observed in the nuclei of control, heterozygous
and homozygous mice. The optimized protocol of telomere-specific FISH combined with
immunofluorescence allowed the localization of telomeres in the nuclei of pancreatic β-cells.
Extensive exocrine and endocrine infiltrations, islet hyperplasia and pancreatic
tumor development were found to be dependent on age, and might play as key factors
affecting the progression of these pathologies. The characterization of the inflammation
detected in this study sample, previously undescribed, either for the RIP-Cre strain or any
mouse model of pancreatic neuroendocrine tumorigenesis, is a novel result that will require
further investigation. A panel of immunohistochemistry markers will be further adapted to
assess the neuroendocrine background of tumors, as well as the hypothesized poorly
differentiated phenotype. Cre recombinase and ATRX expression will be characterized in
full extent to allow the assessment of the Cre/LoxP system recombination efficiency. These
were unexpected and interesting findings that report for the first time a unique model of
ATRX conditional knockout mouse model.

XIV
RESUMO
Os tumores neuroendócrinos do pâncreas (PNETs) compreendem um grupo de
neoplasias raras, mas desafiantes do ponto de vista clínico, e cuja composição genética
era pouco conhecida até recentemente. As mutações do gene da neoplasia endócrina
múltipla tipo 1 (MEN1) eram reconhecidas como as alterações mais frequentes em tumores
hereditários, assim como nos esporádicos. Diversos modelos foram desenvolvidos para se
seguir o processo tumorigénico dos PNETs baseados em alterações no MEN1. A
sequenciação completa do exoma permitiu a aquisição de novos dados a respeito da base
genética da doença, nomeadamente ao reportar dois novos genes frequentemente
mutados em PNETs: DAXX e ATRX. Os PNETs com perda de expressão de DAXX e ATRX
foram ainda relacionados com o mecanismo alternativo de alongamento dos telómeros
(ALT), uma alternativa à telomerase para as células manterem os seus telómeros e assim
poderem aspirar atingir um estado de imortalidade. Estes resultados levaram-nos a
desenvolver um novo modelo de doença que se baseia na deleção condicional do ATRX
nas células β-pancreáticas, usando um sistema de recombinação RIP-Cre/LoxP.
O principal objetivo desta dissertação foi avaliar e caraterizar o modelo de doença
de remoção do gene ATRX das células β-pancreáticas, um modelo condicional. O estudo
iniciou-se pela genotipagem dos animais da população em estudo após ter sido extraído
DNA de tecidos parafinados; seguiu-se a avaliação histológica das lâminas de tecido
pancreático, assim como a caraterização da população celular endócrina e a determinação
da recombinação da Cre e consequente expressão de ATRX em células β-pancreáticas
através de estudos imunohistoquímicos. Foi também realizada a otimização de FISH
específico para telómeros, combinado com imunofluorescência de modo a localizar
telómeros nos núcleos de células β.
A população do estudo revelou ser composta por 161 animais, dos quais 63 são
controlos e 98 têm sequências loxP a flanquear o ATRX. A avaliação histológica indicou
um papel proeminente de inflamação nos pâncreas dos animais. As infiltrações leucocíticas
no tecido exócrino e nas ilhotas pancreáticas (insulite) foram analisadas separadamente,
e ambas se revelaram mais prevalentes em animais com o ATRX flanqueado quando
comparado com animais controlo (P > 0.05); ambos os tipos de infiltração demonstraram
diferenças significativas entre grupos de idade, progredindo à medida que a idade dos
animais também aumentava (P < 0.05). Em relação à quantificação de lesões pancreáticas,
os animais com o ATRX flanqueado demonstraram desenvolver lesões moderadas e de
grau elevado mais frequentemente (P > 0.05); diferenças significativas foram encontradas
em relação a grupos de idade (P < 0.05). Os murganhos da amostra apresentaram ainda

XV
um acentuado incremento na fração endócrina, com ilhotas aumentadas e de forma
irregular. A fração endócrina não demonstrou diferenças significativas entre grupos de
genótipo (P > 0.05), mas demonstrou um aumento progressivo à medida que a idade dos
animais também progrediu (P < 0.05). Ilhotas hiperplásicas e coalescentes demonstraram
manter um padrão forte de expressão de insulina, enquanto a expressão de glucagon se
revelou dispersa e numa menor extensão daquela que seria esperada. Cerca de 12% dos
indivíduos desenvolveram tumores pancreáticos que não apresentam expressão dos
marcadores convencionais de linhagem neuroendócrina. Foi demonstrada a expressão da
proteína Cre especificamente nos núcleos de células β. A expressão de ATRX foi também
observada no núcleo de murganhos controlo, heterozigóticos e homozigóticos. O protocolo
otimizado de FISH específico para telómeros combinado com imunofluorescência permitiu
a localização de telómeros nos núcleos de células β pancreáticas.
A extensa infiltração exócrina e endócrina, hiperplasia de ilhotas e desenvolvimento
de tumores pancreáticos foram demonstrados ser dependentes da idade, e provavelmente
participam como fatores chave a afetar a progressão destas patologias. A inflamação
detetada na amostra, previamente não descrita, quer para a estirpe RIP-Cre, como para
qualquer um dos modelos animais de tumorigénese em tumores neuroendócrinos
pancreáticos, é um resultado inovador que requer uma investigação mais detalhada no
futuro. Um painel de marcadores imunohistoquímicos será adaptado futuramente para
avaliar o fenótipo neuroendócrino dos tumores, assim como o seu possível fenótipo de
tumor pouco diferenciado. A expressão de Cre e ATRX será caraterizada em toda a
população para permitir a avaliação da eficiência da recombinação do sistema Cre/LoxP.
Estes resultados foram inesperados e interessantes, reportando pela primeira vez um
modelo animal único para a perda condicional do gene ATRX em células β-pancreáticas.
ABBREVIATIONS ............................................................................................... VIII
ABSTRACT .......................................................................................................... XII
RESUMO............................................................................................................. XIV
1. INTRODUCTION ........................................................................................... 1 1.1. The pancreas .................................................................................................. 1 1.2. Pancreatic neuroendocrine tumors ............................................................... 2
1.2.1. Classification of pancreatic neuroendocrine tumors ....................................... 3 1.2.1.1. Functionality ............................................................................................... 3 1.2.1.2. Tumor biology and morphology .................................................................. 4 1.2.1.3. TNM staging system ................................................................................... 5 1.2.1.4. Association with inherited genetic syndromes ............................................ 6 1.2.2. Histopathology ............................................................................................... 7 1.2.3. Immunohistochemistry ................................................................................... 7
1.3. Genetic profile of sporadic pancreatic neuroendocrine tumors ................. 8 1.4. Alpha-Thalassaemia/Mental Retardation X-linked (ATRX) ......................... 10 1.5. Death domain associated protein ................................................................ 12 1.6. ATRX/DAXX complex and deposition of H3.3 ............................................. 12 1.7. Alternative Lengthening of Telomeres (ALT) .............................................. 13 1.8. ALT in the context of PNETs ........................................................................ 15 1.9. Animal models .............................................................................................. 16
1.9.1. Cre-loxP system in animal models ............................................................... 16 1.9.2. Knockout model ........................................................................................... 17
2. OBJECTIVES .............................................................................................. 19
3. MATERIALS AND METHODS .................................................................... 21 3.1. Generation of ATRX conditional knockout mice ........................................ 21 3.2. Study sample ................................................................................................ 22 3.3. DNA Extraction from Formalin-fixed Paraffin Embedded Tissues (FFPE) 22 3.4. Genotyping of the sample ............................................................................ 22 3.5. Hematoxylin-Eosin staining ......................................................................... 23 3.6. Immunohistochemistry ................................................................................ 23
3.6.1. Ki-67 ............................................................................................................ 24 3.6.2. Chromogranin A .......................................................................................... 24 3.6.3. Synaptophysin ............................................................................................. 24 3.6.4. Cre-recombinase ......................................................................................... 25 3.6.5. ATRX ........................................................................................................... 25 3.6.6. Insulin .......................................................................................................... 25 3.6.7. Glucagon ..................................................................................................... 25
3.7. Ki-67 labelling index ..................................................................................... 26 3.8. Endocrine fraction measurement ................................................................ 26 3.9. Telomere-specific fluorescence in situ hybridization (tel-FISH) ................ 26 3.10. Immunofluorescence and telomere-specific FISH...................................... 27 3.11. Statistical analysis ........................................................................................ 28
4. RESULTS .................................................................................................... 29 4.1. Study population .......................................................................................... 29 4.2. Genotype Evaluation .................................................................................... 29 4.3. Histopathological evaluation ....................................................................... 31
4.3.1. Pancreatic lesions ....................................................................................... 31
4.3.2. Hyperplasia of pancreatic islets ................................................................... 36 4.3.3. Characterization of endocrine cell population .............................................. 39 4.3.4. Pancreatic Tumors ...................................................................................... 42
4.4. Cre recombinase expression in pancreatic islets ...................................... 44 4.5. ATRX expression in pancreatic islets ......................................................... 44 4.6. Telomere FISH and Immunofluorescence ................................................... 46
5. DISCUSSION .............................................................................................. 47
6. CONCLUSIONS AND FUTURE PERSPECTIVES ..................................... 55
7. REFERENCES ............................................................................................ 57
APPENDIX I ......................................................................................................... 67
APPENDIX II ........................................................................................................ 68
APPENDIX III ....................................................................................................... 69
APPENDIX IV ....................................................................................................... 70
FIGURE INDEX
Figure 1. Pancreas tissue stained with hematoxylin and eosin (H&E). Representation of
pancreas exocrine tissue and an islet of Langerhans (endocrine)............................... 1
Figure 2. Comparison between human and mice Langerhans islets and cell population
differential peptide hormone expression. A: Human pancreatic islet (H&E). B-D:
Immunohistochemistry staining for insulin, glucagon and somatostatin, respectively, in
a human pancreas. E: Mouse islet (H&E). F-I: Staining for insulin, glucagon,
somatostatin and pancreatic polypeptide, respectively. Adapted with permission from
Asa et al. (2011) [5] and Wieczorek et al. (1998) [3]. .................................................. 2
Figure 3. Schematic representation of the ATRX gene; the boxes represent the 36 exons
(top row). The full-length protein (280 kDa) is represented on the down row; the
truncated isoform (200 kDa) is shown on the middle row. ......................................... 11
Figure 4. Schematic mechanism for ATRX/DAXX chromatin landscaping through deposition
of H3.3 and interaction with G4-DNA structures. Amorim et al. [53]. ......................... 14
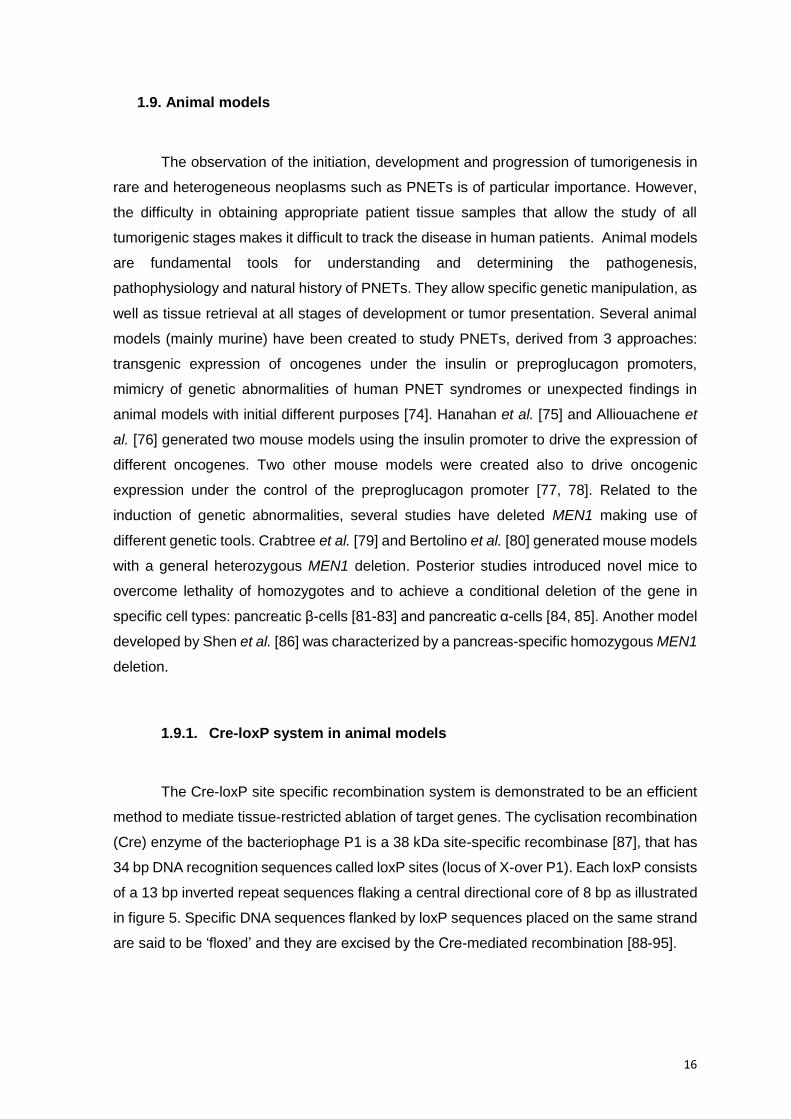
Figure 5. The loxP system consists of an 8 bp core region flanked by two 13 bp inverted
repeats. .................................................................................................................... 17
Figure 6. Strategy for targeted deletion of exon 18 of the ATRX gene. Adapted from Bérubé
et al. (2005) and Garrick et al. (2006). ...................................................................... 18
Figure 7. Animals genotypes, mating schemes and expected offspring. ......................... 21
Figure 8. Gel electrophoresis of allele-specific PCR for genotype evaluation (ATRX loxP
and Cre detection). ................................................................................................... 29
Figure 9. Genotype distribution of the study sample........................................................ 30
Figure 10. Illustration of leukocytic infiltration grading (Scores 1, 3 and 5). Original
magnification: 100X. ................................................................................................. 32
Figure 11. Illustration of insulitis grading (Scores 1-4). Original magnification: 100X. ...... 32
Figure 12. Bar charts of LI frequency among (A) genotype groups and (B) age groups (Mann
Whitney Test, *P < 0.05)........................................................................................... 33
Figure 13. Bar charts of insulitis frequency among (A) genotype groups and (B) age groups
(Mann Whitney Test, *P < 0.05; **P < 0.01). ............................................................. 34
Figure 14. Bar charts for lesions score among (A) genotype and (B) age groups (Mann
Whitney Test, *P < 0.05; **P < 0.001). ...................................................................... 36
Figure 15. Comparison of (A) a normal-sized islet with a mean diameter of 75 µm and (B)
a hyperplasic islet with 940 µm of diameter. Original magnification: 100X. ............... 37
Figure 16. Boxplots of endocrine fraction among (A) genotype and (B) age groups (Mann
Whitney Test; *P < 0.05, **P < 0.001). ...................................................................... 38
Figure 17. Representation of (A) an irregular-shaped islet and (B) islet coalescence. Original
magnifications: 100X and 40X, A and B, respectively. .............................................. 39
Figure 18. Immunohistochemistry staining of normal-sized islet for (A) insulin and (B)
glucagon. Original magnification: 200X. ................................................................... 39

Figure 19. Immunohistochemistry staining of hyperplasic and coalescent islets for insulin
(A, C) and glucagon (B, D). Original magnification: 40X. .......................................... 40
Figure 20. Immunohistochemistry staining for insulin (A) and glucagon (B) in islets with peri-
insulitis. Original magnification: 100X. ...................................................................... 41
Figure 21. Immunohistochemistry staining for insulin (A, B, C) and (D) glucagon in highly
infiltrated islets. Original magnification: 200X. .......................................................... 41
Figure 22. Tumor stained with hematoxylin and eosin (H&E). Original magnifications: 40X
and 200X, respectively. ............................................................................................ 43
Figure 23. IHC staining of a tumor sample for (A) CgA, (B) SYN, (C) insulin and (D) Ki-67.
Internal controls are shown for CgA, SYN and insulin. Original magnifications: 40X and
100X. ........................................................................................................................ 43
Figure 24. Cre recombinase expression in the nucleus of pancreatic β-cells.
Immunohistochemistry staining for (A) negative control and (B) RIP-Cre+/- mouse.
Original magnification: 400X. .................................................................................... 44
Figure 25. ATRX expression in the nucleus of pancreatic β-cells. Immunohistochemistry
staining for (A) negative control, (B) ATRXX/x mouse, (C) ATRXFLOX/X mouse and (D)
ATRXFLOX/FLOX mouse. Original magnification: 400X. ................................................ 45
Figure 26. Telomere-specific FISH in pancreas tissue. Original magnifications: 400X and
1000X. ...................................................................................................................... 46
Figure 27. Immunofluorescence for insulin combined with telomere-FISH to co-localize
telomeric DNA sequences within pancreatic islets. Original magnifications: 630X and
1000X. ...................................................................................................................... 46
Figure 28. Ki-67 labeling index obtained with ImmunoRatio. ........................................... 67
Figure 29. Endocrine fraction measurement using ImageJ, showing islet circumvention (A)
and the color threshold tool that selects all pancreatic tissue excluding interlobular
areas (B). ................................................................................................................. 68
Figure 30. Illustrative grading of edema (Scores 1 to 4). ................................................. 70
Figure 1. ......................................................................................................................... 38

TABLE INDEX
Table 1. Preparation of telomere-specific FISH probe mix .............................................. 27
Table 2. Distribution of mice in age groups ..................................................................... 29
Table 3. Description of pancreatic tumors in the study sample ........................................ 42

1
1. INTRODUCTION
1.1. The pancreas
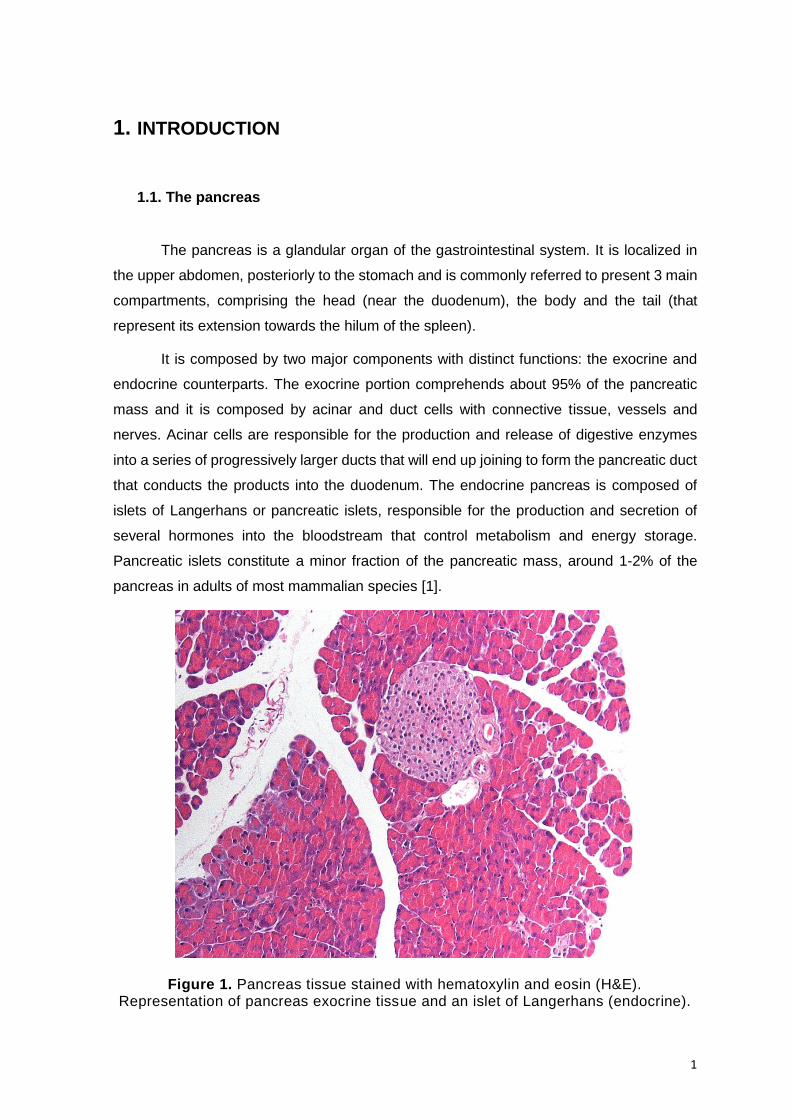
The pancreas is a glandular organ of the gastrointestinal system. It is localized in
the upper abdomen, posteriorly to the stomach and is commonly referred to present 3 main
compartments, comprising the head (near the duodenum), the body and the tail (that
represent its extension towards the hilum of the spleen).
It is composed by two major components with distinct functions: the exocrine and
endocrine counterparts. The exocrine portion comprehends about 95% of the pancreatic
mass and it is composed by acinar and duct cells with connective tissue, vessels and
nerves. Acinar cells are responsible for the production and release of digestive enzymes
into a series of progressively larger ducts that will end up joining to form the pancreatic duct
that conducts the products into the duodenum. The endocrine pancreas is composed of
islets of Langerhans or pancreatic islets, responsible for the production and secretion of
several hormones into the bloodstream that control metabolism and energy storage.
Pancreatic islets constitute a minor fraction of the pancreatic mass, around 1-2% of the
pancreas in adults of most mammalian species [1].
Figure 1. Pancreas tissue stained with hematoxylin and eosin (H&E). Representation of pancreas exocrine tissue and an islet of Langerhans (endocrine).

2
Islets of Langerhans are highly-vascularized micro-organs consisting of different
neuroendocrine cell populations and are members of the diffuse endocrine system.
Comparative studies of pancreatic islets among different species have determined
variations in both their composition and architecture [2, 3]. Human islets have an average
diameter of 50 μM and are composed of specific cells that have the capacity to produce,
store and secret specific peptide hormones, i.e., β-cells produce insulin (75-80%) which
occupy the majority of the islet, α-cells are responsible for glucagon (15%), δ-cells for
somatostatin (5%), and rare γ-cells produce and release pancreatic polypeptide (PP). In
mice, islets are larger, with an average diameter of 116 μM. They present a well-defined
structure with a central core of β-cells (60-80%) with the remaining endocrine cells being
dispersed at the periphery of the islet and in a similar frequency when compared to humans:
α-cells (15-20%), δ-cells (<10%) and PP-cells (<1%) [2, 4].
Figure 2. Comparison between human and mice Langerhans islets and cell population differential peptide hormone expression. A: Human pancreatic islet
(H&E). B-D: Immunohistochemistry staining for insulin, glucagon and somatostatin, respectively, in a human pancreas. E: Mouse islet (H&E). F-I: Staining for insulin,
glucagon, somatostatin and pancreatic polypeptide, respectively. Adapted with permission from Asa et al. (2011) [5] and Wieczorek et al. (1998) [3].
1.2. Pancreatic neuroendocrine tumors
Pancreatic neuroendocrine tumors (PNETs) are a rare and heterogeneous group of
tumors, with distinct functional and biological behavior depending on location, tumor size
and clinical symptoms that pose diagnostic and therapeutic challenges [6-8]. A spectrum of
these neoplasms can be found in the pancreas, ranging from well-differentiated neoplasms
to poorly-differentiated carcinomas. They represent less than 3% of all pancreatic tumors

3
with an annual incidence of 1 per 100.000 people. This value increases in autopsy studies,
which usually identify clinically unrecognizable, asymptomatic and small lesions, resulting
therefore in a higher incidence [5, 8-10]. A better prognosis and improved long-term survival
is observed for PNET patients when compared with patients presenting pancreatic
adenocarcinoma. The overall 5-year survival rate for PNETs is in the range of 30% for
nonfunctional tumors and up to 97% in insulinomas [8, 11, 12]. However, the prognosis
worsens substantially in patients presenting poorly differentiated neoplasms or carcinomas
and most importantly with the presence of metastatic disease.
Pancreatic neuroendocrine tumors have no significant gender predilection and can
occur at all ages, with an incidence peak between the third and sixth decade of life [5, 10,
11, 13].
Until a few years ago, PNETs were also called islet cell tumors. However, recent
evidence suggests two possible origins for these tumors: mature endocrine cells in the
pancreas (α, β, δ and γ cells) or multipotent stem cells that can differentiate into endocrine
and exocrine cells in the pancreas [5, 11, 14, 15].
1.2.1. Classification of pancreatic neuroendocrine tumors
During the last decades, the refinement of a classification system for PNETs was
gained with the increasing interest in these tumors comprehension and with the consequent
better understanding of these neoplasms. Currently, the classification of PNETs relies
mainly in four categories to understand the disease: functionality, as “functional or
nonfunctional”, according to the presence of a clinical syndrome as a consequence of
inadequate hormone production; tumor biology and morphological features, to determine
what is the aggressiveness and expected outcome of the tumor/disease; “tumor-node-
metastasis (TNM) classification”, in order to evaluate what is the spread of the disease; and,
finally, if there is an association with inherited syndromes to determine if we are in the
presence of “sporadic or syndromic-associated” neoplasm [10].
1.2.1.1. Functionality
A clinically functioning PNET gives rise to signs and symptoms of hormone excess.
The clinical symptoms of functional tumors can include Whipple’s triad, carcinoid syndrome
and watery diarrhea/hypokalemia/aclorhydria syndrome [9, 15]. There are several types of
functional tumors according to the hormone they produce that can present specific clinical

4
signs. Insulinomas are the most common functioning PNETs and the secretion of insulin in
excess results in hypoglycemia; less than 10% of these tumors are malignant [14, 16].
Gastrinomas are the second most incident tumors and normally associate with the Zollinger-
Ellison syndrome (ZES). ZES is associated with an excessive secretion of gastric acid
causing peptic ulcers, gastric esophagus reflux disease and diarrhea. About 60 to 90% of
gastrinomas have malignant potential, contrarily to what is observed in insulinomas [16].
VIPomas, glucagonomas, somatostatinomas (SSomas), growth hormone releasing
hormone (GRH) tumors (GRHomas), and adrenocorticotropic hormone (ACTH) producing
tumors (ACTHomas) have been established as rare functioning tumors with high malignant
potential [7, 16]. VIPomas give rise to a disorder known as pancreatic cholera causing a
profound and chronic watery diarrhea, as well as severe dehydration. Glucagonomas cause
a spectrum of features including rashes, glucose intolerance and weight loss. SSomas are
known to cause diabetes mellitus, cholelithiasis and diarrhea. The main symptoms of
GRHomas and ACTHomas are acromegaly and Cushing’s syndrome, respectively [7, 16].
Other types of functioning tumors are described but their incidence is exceedingly rare. This
wide variety of hormone-producing tumors reflects the heterogeneity of tumor cell origin.
Approximately 60% to 90% of PNETs are classified as nonfunctioning since they
are not associated to a specific hormonal hypersecretion syndrome [16-18]. Although they
might produce and secrete hormones, their quantity and biological activity may not be
enough to produce distinct clinical syndromes. These tumors only become clinically
apparent when they reach a certain size causing a compression effect and/or invading
adjacent organs or even when they metastasize at distance; they can also be detected
incidentally when performing abdominal imaging for other reasons [5, 19].
1.2.1.2. Tumor biology and morphology
The second category of classification is based on the features of tumor biology and
morphology which has evolved over the years. In 2010, the World Health Organization
(WHO) released a classification system for PNETs using a proliferation-based grading
system; the system relies in the mitotic count (per 10 HPF) or in the proliferation
measurement based on the Ki-67 labelling index. Based on the WHO 2010 classification,
the tumors were divided in 4 categories: hyperplastic and preoplastic lesions, mixed
adenoneuroendocrine carcinoma, neuroendocrine tumors (NET) Grade 1 and 2 and
neuroendocrine carcinomas (NEC) Grade 3. NET G1 comprised less than 2 mitotic counts
per 10 HPF, with a Ki-67 labeling index of less or equal to 2%. NET G2 included 2-20 mitotic

5
counts per 10 HPF, and 3 to 20% of Ki-67 labeling. NEC G3 was assigned to more than 20
mitotic counts per 10 HPF and a Ki-67 labeling index of more than 20%. The PNETs
included in G1 or G2 categories were well-differentiated NET, whereas G3 tumors were
poorly differentiated NEC, distinguishing additionally the small and large cell subtypes in
NEC [20].
A new WHO classification of endocrine tumors was recently released and updated
the classification system with the introduction of novel features for PNETs. The tumors are
now divided in 3 main categories: Mixed neuroendocrine-non-neuroendocrine neoplasms
(MiNEN); NET G1/G2/G3 (well-differentiated neuroendocrine neoplasms, NEN); and NEC
G3 (poorly differentiated NEN, large or small cell types). Relatively to the 2010
classification, the Ki-67 index of NET G2 tumors was updated, becoming less than 3%
(instead of ≤ 2%). An additional Grade 3 sub-category was added to well-differentiated
neoplasms, with a labelling index of more than 20% and more than 20 mitotic counts per
10 HPF. NEC G3 (poorly differentiated carcinomas) continue to present a Ki-67 proliferative
index superior to 20%, as well as more than 20 mitotic counts per 10 HPF [21].
1.2.1.3. TNM staging system
The evaluation of the extension of the disease is inferred in the tumor-node-
metastasis (TNM) staging system, an important tool for the stratification of patients into
different stages at diagnosis. The planning of therapeutic approaches is based on this
staging system, whose success depends on the ability to reflect the biology and natural
history of the cancer. In 2006, the European Neuroendocrine Tumor Society (ENETS)
proposed a staging system for PNETs and in 2010, the World Health Organization (WHO),
Union for International Cancer Control (UICC), and the American Joint Committee for
Cancer (AJCC) also released an updated system. Both are used nowadays and they are
predictive of patient outcome, using identical TNM terminologies but referring to slightly
different extents of disease. According to the ENETS TNM staging system, the 5-year
survival rate for stage I disease is almost 100%, 93% for stage II, 65% for stage III and 35%
for stage IV [22]. Using the AJCC/UICC/WHO TNM staging, the 5-year survival rates for
stages I, II, III and IV are 92%, 84%, 81% and 57%, respectively [12]. There are slight
discrepancies between the two staging systems: a cohort study of 1072 post-surgical
PNETs patients proved a superiority of the ENETS system when compared to the
AJCC/UICC/WHO system for stratifying risk of death and creating risk-based treatment
guidelines [23]. However, using either system does not appear to have an adverse effect
on diagnosis and management.

6
1.2.1.4. Association with inherited genetic syndromes
A small fraction, about 10%, of PNETs arise in the context of different inherited
syndromes: Multiple Endocrine Neoplasia type 1 (MEN1), Von Hippel-Lindau disease
(VHL), Neurofibromatosis type 1 (NF1) and Tuberous Sclerosis (TSC). The most prevalent
syndrome is MEN1, in which up to 80% of patients develop PNETs [11, 14, 24]. These
patients are also predisposed to develop adenomas of the parathyroid and pituitary glands.
This is an autosomal-dominant condition due to germline mutations in MEN1 tumor
suppressor gene at chromosome 11q13 which encodes menin, a nuclear protein that
interacts with many other proteins or transcription factors important for cell growth
regulation, cell cycle progression and other cellular processes [8, 25, 26]. PNETs
associated with MEN1 develop at earlier ages when compared to sporadic tumors [5], and
they display a wide variety of molecular abnormalities, such as chromosomal loss,
chromosomal loss with duplication, mitotic recombination or point mutation of the wild-type
allele [5, 24].
The second most prevalent syndrome is the VHL disease, an autosomal-dominant
condition in which 10% to 17% of patients develop PNETs [24, 27]. The disease may
present other types of benign and malignant neoplasms, including retinal angiomas, clear
cell renal cell carcinomas, phaeochromocytomas, paragangliomas, among others. VHL
disease is caused by mutations in the VHL tumor suppressor gene on chromosome 3p25
that encodes for pVHL, an important protein in the regulation of angiogenic growth and the
activity of various factors such as VEGF, PDGF, TGFα and erythropoietin [5, 8, 25].
NF1 is an autosomal dominant disorder characterized by the occurrence of
neurofibromas, central nervous system gliomas, phaeochromocytomas, paragangliomas,
amongst other manifestations [5, 25]. The disease is caused by mutation in the NF1 gene
on chromosome 17q11.2 that encodes the protein neurofibromin, which affects cell growth,
signalling regulated by activation of p21, Ras and through the mTOR pathway. PNETs occur
in less than 10% of NF1 patients[14, 24].
TSC is an autosomal dominant disorder, caused by mutations in one of two genes:
TSC1 gene (which encodes the protein hamartin) or TSC2 gene (which encodes the protein
tuberin). These two proteins form a dimer important for various cellular processes. PNETs
have been reported in only a small percentage of TS patients [24].

7
1.2.2. Histopathology
Pancreatic neuroendocrine tumors are typically well-circumscribed and have
morphological features that depend on their level of differentiation [11]. Well-differentiated
PNETs have tumor cells arranged in solid nests surrounded by thin vascular stroma and
trabecular and/or gland-like formations. Tubuloacinar units and perivascular
pseudorosettes are also considered specific of these tumors [5, 11, 28]. They present
characteristic cytological features: round to ovoid cells with eosinophilic and granular
cytoplasm and a recognizable dispersed chromatin pattern in the nuclei [5, 28]. As for
poorly-differentiated neuroendocrine carcinomas, they are sub-divided in two groups based
on cell size: small- and large-cell variants. The large-cell variant has cells with prominent
nucleoli and variable cytoplasm; on the other hand, the small-cell variant presents cells with
round, ovoid or spindle-shaped nuclei in which the chromatin is coarse, with high nucleus-
to-cytoplasm ratio and prominent nuclear molding. The large-cell variant presents higher
cellular atypia [5, 28]. Necrosis is common in both these variants. It is common for poorly-
differentiated neuroendocrine carcinomas to morphologically resemble poorly differentiated
adenocarcinomas or anaplastic carcinomas of the pancreas [28].
1.2.3. Immunohistochemistry
PNETs are associated with cell lineage markers responsible for the production of
cytoplasmic or membrane neuroendocrine granules, which can be highlighted by
immunohistochemistry. These markers can be used when performing a differential
diagnosis. A stronger staining pattern is normally obtained for well-differentiated tumors
when compared to poorly differentiated cases. Chromogranin A (CgA) and synaptohysin
(SYN) are the most used markers, but others such as the Cluster of Differentiation of neural
cell adhesion (CD56) and Neuronal Specific Enolase (NSE) are also used [11, 28]. CgA
belongs to the family of granin glycoproteins, which constitute major components of
secretory granules of various neuronal and endocrine cells. It constitutes a valuable and
specific marker of neuroendocrine tumors. It is a vital factor in the diagnosis and monitoring
of disease, since its serum concentrations correlate with the degree of tumor differentiation,
hepatic metastization, disease progression and treatment efficacy [29, 30]. Synaptophysin
is a protein detected in tumors of neuroendocrine differentiation and it has also been
considered a sensitive but a less specific marker of these tumors [31]. CD56 antibody
constitutes a less specific neuroendocrine marker, but it is still useful in the differential

8
diagnosis of these tumors [28]. As for NSE, it is an integral membrane glycoprotein of
neuronal synaptic vesicles; it lacks specificity when compared to CgA or SYN but it can be
useful when combined with the latter [11, 32].
1.3. Genetic profile of sporadic pancreatic neuroendocrine tumors
About 90% of PNETs arise as sporadic neoplasms. The pathogenesis and genetic
background of these tumors still lacks understanding but the research concerning the matter
has been vastly growing over the years.
Chromosomal gains or losses have been consistently reported in PNETs. Losses in
chromosomes 1, 3p, 6q, 11q, 17p or 22q were already observed, as well as gains in
chromosomes 4 or 9q. The most common and well-characterized abnormality identified a
few years ago was loss of heterozygosity (LOH) at chromosome 11q13, which includes the
locus of the MEN1 gene; both sporadic and familial PNETs present LOH overlapping this
region. This genetic event has been identified in sporadic gastrinomas, insulinomas,
glucagonomas, VIPomas and non-functioning tumors, and reported with an overall
incidence of approximately 35% [19, 25, 33-35]. The tumor suppressor genes pRb and p53
were shown to be usually intact in well-differentiated PNETs; however, p53 abnormalities
are common in poorly differentiated NECs [13, 19]. O6-methylguanine-DNA-
methyltransferase (O6-MGMT) also appears to be downregulated in malignant tumors when
compared to the benign ones; in contrast, the proto-oncogene MET is up-regulated in the
malignant cases [25].
Due to the insufficient information about these tumors either to predict prognosis or
to develop personalized treatments aiming to improve disease management, it was
necessary to gain a deeper insight into the genetic basis of PNETs. In 2011, Jiao et al. [36]
performed the exome sequencing of a set of well-characterized sporadic PNETs from 68
patients. In total, somatic mutations in MEN1, death domain-associated protein (DAXX),
alpha thalassemia/mental retardation X-linked (ATRX), and members of the mammalian
target of rapamycin (mTOR) pathway (phosphatase and tensin homolog (PTEN), TSC2 and
phosphatidylinositol 3-kinase (PIK3CA)) were identified in 44,1%, 25%, 17,6%, 7.3%, 8,8%
and 1,4%, respectively. About 43% of the PNETs studied harboured a mutation in DAXX or
ATRX which had not been reported previously and were mutually exclusive. This finding
was consistent with the knowledge of their putative function within the same pathway, which
will be explored further ahead. The authors also established these two genes as PNET
tumor suppressor genes due to their high ratio of inactivating mutations. Another interesting

9
hypothesis was raised by the authors due to the differences in survival of the patients, in
which the mutations in MEN1 and DAXX/ATRX could identify a biologically specific
subgroup of PNETs with prolonged survival; recent studies have not been concordant with
the previous findings [35, 37, 38]. Lastly, 14% of the tumors with mutations in members of
the mTOR pathway were of special interest due to the availability of inhibitors of the mTOR
pathway for patient treatment.
More recently, the whole genome landscape of PNETs was analysed in 102
clinically sporadic tumors [35]. The aim was to define the molecular pathology of these
tumors more extensively, as well as to identify novel candidate mechanisms of
pathogenesis. In a small subset of the studied PNETs a novel mutational signature was
found. It referred to somatic pathogenic mutations or germline inactivating mutations in the
base-excision-repair gene MUTYH-associated polyposis (MAP). MAP is characterized by
an increased lifetime risk of colorectal cancer with the development of colonic adenomatous
polyps, a smaller risk of duodenal cancer development, and a moderate risk for
extraintestinal malignancies, such as ovarian, bladder and skin cancers, with a tendency
for breast cancer [39]. The data from Scarpa et al. [35] suggests an additional role for
MUTYH deficiency in PNETs. The discovery of these deleterious mutations in MUTYH
prompted the authors to screen the germline DNA of all patients: 6 deleterious germline
MEN1 mutations were found, as well as single novel truncating germline mutations in cyclin
dependent kinase inhibitor 1B (CDKNB1) and VHL. The germline mutations were
associated with somatic LOH in each of the previous cases. The checkpoint kinase
(CHEK2), a DNA-damage repair tumor suppressor gene in breast cancer and other
cancers, was also found to present predicted damaging germline variants in a small number
of cases (4%). As for somatic driver mutations in PNETs, the data from these authors is
consistent with previous literature reports, adding some new findings. MEN1 was the most
frequently mutated of the studied genes, with a prevalence of 37% within these tumors.
Mutually exclusive inactivating mutations in DAXX and ATRX were found respectively in
22% and 10% of the study sample, consistent with the report of Jiao et al. (2011) and other
authors throughout the recent years [40, 41]. Additionally, mTOR pathway genes PTEN and
DEP domain containing 5 (DEPDC5) were also frequently mutated, as well as the mTOR
pathway’s negative regulators TSC1 and TSC2; PTEN mutations were mutually exclusive
from mutations in the latter genes. The histone modifier SET domain containing 2 (SETD2)
was also found to be mutated in a small subset of the tumors (5%). Overall, four pathways
were reported to be commonly altered in PNETs: i) DNA damage repair (MUTYH, CHEK2,
BRCA2); ii) Chromatin remodelling (MEN1, SETD2); iii) Telomere maintenance and altered

10
telomere length (DAXX, ATRX); iv) and, mTOR pathway activation (PTEN, DEPDC5, TSC1,
TSC2) [35].
It is important to emphasize the findings regarding DAXX and ATRX consistent with
previous reports: they were present in one third of the studied PNETs and correlated with
somatic telomere repeat content and telomere length, mainly by activation of the alternative
lengthening of telomeres, the so-called ALT pathway. As mentioned above, according to
Jiao et al. [36] tumor mutations in MEN1, DAXX/ATRX or the combination of both MEN1
and DAXX/ATRX mutations were associated with prolonged survival relatively to wild-type
patients. Contrarily to the initial observations, Marinoni et al. [37] demonstrated that patients
with DAXX/ATRX protein loss presented a poorer disease outcome associated with tumor
size and metastasis, as well as a reduced relapse-free survival and increased tumor-
specific death. The previous results have been further confirmed in two other recent studies
reporting the association between DAXX/ATRX loss in PNETs with aggressive
clinicopathological features and shorter disease-free-survival and disease-specific-survival
[38, 42].
The contradictory results obtained from these studies may reflect different cohorts
and different stages enrichment of the patient sample: the recent studies [37, 38, 42] had
more diverse samples when compared to the original study [36], in which most patients
presented highly aggressive tumors and metastatic disease. Nevertheless, mutations in
DAXX/ATRX are likely to define biologically specific subgroups of PNETs and may be useful
to predict patient outcome in a stage-specific manner.
1.4. Alpha-Thalassaemia/Mental Retardation X-linked (ATRX)
ATRX is located on the long arm of the human X chromosome (Xq21.1) and it
encompasses 36 exons. The gene is highly conserved between mouse and human, having
an homology of 85% [43]. The respective protein is a member of the SNF2 subgroup of the
SWItch/sucrose non-fermentable (SWI/SNF) protein family protein; its members have been
shown to modulate a number of cellular processes such as transcription, DNA repair, mitotic
recombination and to remodel chromatin through ATP hydrolysis. The 280 kDa protein
contains two highly conserved domains: a globular N-terminal plant homeodomain (PHD)
denominated ATRX-DNMT3-DNMT3L (ADD) domain and seven helicase subdomains
located at the C-terminus that confer ATPase chromatin remodelling activity to the protein
[43-47]. A truncated isoform of ATRX, ATRXt (200 kDa), was demonstrated to be produced
when intron 11 is not spliced from the primary transcript, retaining the PHD domain but not

11
the SNF2 domain (figure 3). Like the full-length protein, ATRXt is highly conserved between
mouse and human homologues [46-48].
Figure 3. Schematic representation of the ATRX gene; the boxes represent the 36 exons (top row). The full-length protein (280 kDa) is represented on the down row;
the truncated isoform (200 kDa) is shown on the middle row.
SWI/SNF protein family members are widely implicated in cancer and other human
syndromes of mental retardation and genomic instability [48-50]. Mutations in ATRX were
originally identified in patients with X-linked alpha thalassaemia mental retardation
syndrome, a rare disease with an uncertain prevalence estimated to be less than 10 people
per million [51]. Male patients present not only alpha thalassemia (caused by reduced
production of structurally intact α-globin genes), but also developmental delay, facial
abnormalities, gonadal dysgenesis, skeletal abnormalities, short stature, seizures, cardiac
defects and renal urinary abnormalities. Female carriers tend to be physically and
intellectually normal [49-52].
ATRX is expressed exclusively in the nucleus. Immunofluorescence studies have
demonstrated a preference binding of the protein within promyelocytic leukaemia (PML)
nuclear bodies and to repetitive heterochromatic regions, such as telomeric and pericentric
DNA repeats and ribosomal DNA. It has already been demonstrated that guanidine (G)-rich
repeats can lead to the formation of G-quadruplexes DNA (G4-DNA) structures. Telomeric
DNA is particularly prone to form these secondary structures, which are known to form
barriers to several nuclear processes (DNA replication, transcription) due to their capacity
of inducing replication fork stalling, leading to replicative stress and ultimately DNA damage
that requires reparation. ATRX, as a chromatin remodeler, is recruited to telomere ends,
participating in the resolution of these G4 secondary structures by directly binding to them,
as it was previously shown in vitro [45]. ATRX loss is therefore thought to cause genomic
instability by failing to prevent the formation of G-quadruplexes [43-45, 50, 53, 54].
An increasing number of studies has focused on the many functions of ATRX in
establishment and/or maintenance of the telomeres stability. The mechanism of chromatin

12
stability in which ATRX is involved also comprises DAXX protein; their interaction is vital for
the deposition of the histone variant H3.3 at these regions of the genome, as it will be further
explored.
1.5. Death domain associated protein
DAXX is a highly conserved protein associated with both nuclear and cytoplasmic
events during apoptosis. It was firstly identified in the cytoplasm as a protein that binds to
the death domain of the transmembrane death receptor FAS, potentiating FAS-induced
apoptosis. The nuclear DAXX molecules associate with PML bodies and other subnuclear
domains [53, 55].
1.6. ATRX/DAXX complex and deposition of H3.3
Histones are the main protein components of chromatin with the function of
packaging and organizing DNA at its fundamental unit: the nucleosome. The nucleosome’s
core is composed of a hetero-octamer of histones, comprising a tetramer of (H3-H4)2
flanked by two dimers of H2A-H2B [56, 57]. This highly organized dynamic permits the
compaction of the genome, while enabling cellular processes such as transcription,
replication, recombination and repair at the same time [54]. Histone variants differ from their
primary sequences and they emerged as an important way to control chromatin function by
altering the biochemical structure of the nucleosome. In mammals, five Histone 3 variants
have been identified so far. H3.3 is a conserved histone variant with 96% of homology when
compared to the major specie H3.1. The canonical histone H3.1 is synthetized in the S-
phase and deposited only during DNA replication but H3.3 is expressed throughout the cell
cycle [54, 57, 58]. The slight substitutions in H3.3 relatively to its canonical counterpart are
thought to mediate interactions with chaperone complexes which are unique to this variant
and facilitate its replication-independent deposition. H3.3 has been considered as a mark
of transcriptional activity [59]. However, recent studies have enlightened the enrichment of
H3.3 at telomeres or centromeres which are silent chromatin loci [49, 60, 61].
A robust interaction between DAXX and ATRX has been described: they are
components of the same ATP-dependent chromatin-remodelling complex. DAXX interacts
with the linker region of ATRX located between the ADD and ATPase domains. This
complex was found to be essential for the deposition of H3.3 at telomeres and pericentric
heterochromatin to maintain telomere integrity [43, 50, 54, 58, 60, 62]. ATRX acts as a

13
chromatin remodeler, being responsible for recruiting DAXX to telomeres, while DAXX acts
as a specific H3.3 chaperone [49, 54, 58].
1.7. Alternative Lengthening of Telomeres (ALT)
Telomeric DNA presents G-rich sequences that can be synthesized by telomerase,
a reverse transcriptase enzyme. Continued cell proliferation eventually leads to senescence
or apoptosis since most somatic tissues do not have sufficient telomerase activity to prevent
telomere attrition [63].
The process of tumorigenesis usually depends on extensive cell proliferation and on
the avoidance of telomere shortening and senescence to acquire immortality, which is
considered one of the major hallmarks of cancer [64]. About 85% of all cancers achieve
immortality through the reactivation of telomerase; however, the remaining 10-15%
maintain their telomere length by a telomerase-independent mechanism – Alternative
Lengthening of Telomeres (ALT) [44, 53, 63, 65, 66]. Cells with the ALT pathway activated
exhibit different characteristics when compared to the ones that express the telomerase
subunit (TERT). Those differences include telomere length heterogeneity, ranging from
undetectable to extremely long, a finding consistently demonstrated by telomere specific in
situ hybridization (tel-FISH) [66, 67]; telomere recombination with the presence of
extrachromosomal (linear and circular) telomeric repeats [68]; high frequency of telomeric
sister chromatid exchange events [43, 69]; and the observation of ALT-associated PML
nuclear bodies (APBs) that differ from the common PML nuclear bodies [63, 70].
The cells that present an ALT phenotype depend on homologous recombination
(HR) DNA-repair mechanism to maintain their telomere length. According to this hypothesis,
the synthesis of new telomeric DNA mediated by recombination uses an existing telomeric
sequence from an adjacent chromosomal telomere as a copy template [63, 66]. However,
this mechanism was still poorly understood and insufficiently characterized. In 2016, Dilley
et al. [71] defined the break-induced telomere synthesis and demonstrated a specialized
replisome underlying ALT telomere maintenance.
While epithelial cancers rely more frequently on telomerase reactivation or re-
expression, tumors of mesenchymal origin are reported to activate ALT more frequently.
ALT phenotype is more prevalent in neuroblastomas, tumors of the central nervous system
(astrocytoma, glioblastoma, oligodendroglioma and medulloblastoma), sarcomas
(osteosarcoma, leiomyosarcoma, liposarcoma and chondrosarcomas) and neuroendocrine

14
tumors (pancreatic and paragangliomas). The mechanism has also been observed in
common cancers, such as breast carcinoma [53, 63, 72].
In 2012, Lovejoy et al. [72] reported ATRX to be either undetectable or severely
depleted in approximately 90% of human ALT cell lines, results that established a strong
correlation between the initiation or maintenance of ALT and a deficiency in the
DAXX/ATRX pathway. There is a strong suggestion that ATRX acts as a suppressor of the
ALT pathway since mutations in ATRX and/or DAXX found in recent high throughput
genome sequencing of a variety of ALT expressing tumors appear to be mutually exclusive
to mutations in the TERT promoter that lead to telomerase re-expression.
The theoretical mechanism of DAXX/ATRX role in chromatin landscaping and
initiation of ALT involves the previously mentioned G4-DNA secondary structures. ATRX
localization to heterochromatin by binding to the histone variant H3.3 occurs through
interaction of its ADD domain with an H3.3 N-terminal tail, trimethylated at Lys9 (H3K9me3)
and unmodified at Lys4 (H3K4me0) and also through interaction with heterochromatin
protein 1 (HP1). When ATRX arrives to its binding site, it facilitates the deposition of H3.3
in combination with DAXX. This deposition is thought to induce chromatin changes that
prevent the formation of the previously mentioned G4-DNA structures [53].
G4-DNA secondary structures are associated with increased stalling of replication
forks at telomeric sites, which is a known trigger of HR, an event that gathers increasingly
more evidence to be determinant of the ALT pathway [44, 53, 65]. By preventing the
formation of G4 structures through the deposition of H3.3 in combination with DAXX, ATRX
plays a central role in ALT cells.
Figure 4. Schematic mechanism for ATRX/DAXX chromatin landscaping through deposition of H3.3 and interaction with G4-DNA structures. Amorim et al. [53].

15
This complex of chromatin remodelling is therefore fundamental in the repression of
ALT. All these observations and understand of the way ATRX operates may provide clues
for future development of therapies to treat tumors with an ALT background [43, 63, 65, 66,
72].
1.8. ALT in the context of PNETs
As previously stated, mutations in the DAXX/ATRX pathway represent the second
most common somatic genetic event in PNETs, following mutations in MEN1 gene [35, 36,
43]. These novel tumor suppressor genes interact with one another to function in chromatin
remodeling at telomeric regions. Mutations in either one of the genes are associated with
loss of nuclear expression of the respective proteins by immunohistochemistry. The
telomere status in PNETs in which ATRX and DAXX mutational status had been previously
determined was therefore evaluated to correlate it with the ALT phenotype.
In 2011, Heaphy et al. [41] performed telomere-specific tel-FISH in a sample of 41
PNETs. In 25 of them (61%) ultrabright telomere FISH signals were detected which is a
characteristic feature of the ALT due to unbalanced telomere length. Of the studied 41
tumors, 19 presented mutations either in ATRX or DAXX; all the mutated cases were ALT-
positive. Additionally, 6 tumors with no detectable mutations in both genes were also ALT-
positive. These results pointed to a perfect correlation between ATRX or DAXX inactivation
and the presence of ALT phenotype in these tumors.
In 2012, deWilde et al. [40] evaluated the loss of the proteins’ expression and
acquisition of the ALT phenotype, this time in a subset of MEN1 syndrome associated
PNETs. In their study, loss of nuclear expression of ATRX and/or DAXX occurred in 6% of
MEN1 well-differentiated PNETs; this loss of expression perfectly correlated with the
presence of the ALT phenotype. Our group reported an incidence of 7% of TERT promoter
mutations in their study sample and the majority of cases had germline mutations in MEN1
or VHL [73]. This finding suggests that PNETs associated with hereditary syndromes may
rely on other types of mechanisms to maintain their telomere length.
16
1.9. Animal models
The observation of the initiation, development and progression of tumorigenesis in
rare and heterogeneous neoplasms such as PNETs is of particular importance. However,
the difficulty in obtaining appropriate patient tissue samples that allow the study of all
tumorigenic stages makes it difficult to track the disease in human patients. Animal models
are fundamental tools for understanding and determining the pathogenesis,
pathophysiology and natural history of PNETs. They allow specific genetic manipulation, as
well as tissue retrieval at all stages of development or tumor presentation. Several animal
models (mainly murine) have been created to study PNETs, derived from 3 approaches:
transgenic expression of oncogenes under the insulin or preproglucagon promoters,
mimicry of genetic abnormalities of human PNET syndromes or unexpected findings in
animal models with initial different purposes [74]. Hanahan et al. [75] and Alliouachene et
al. [76] generated two mouse models using the insulin promoter to drive the expression of
different oncogenes. Two other mouse models were created also to drive oncogenic
expression under the control of the preproglucagon promoter [77, 78]. Related to the
induction of genetic abnormalities, several studies have deleted MEN1 making use of
different genetic tools. Crabtree et al. [79] and Bertolino et al. [80] generated mouse models
with a general heterozygous MEN1 deletion. Posterior studies introduced novel mice to
overcome lethality of homozygotes and to achieve a conditional deletion of the gene in
specific cell types: pancreatic β-cells [81-83] and pancreatic α-cells [84, 85]. Another model
developed by Shen et al. [86] was characterized by a pancreas-specific homozygous MEN1
deletion.
1.9.1. Cre-loxP system in animal models
The Cre-loxP site specific recombination system is demonstrated to be an efficient
method to mediate tissue-restricted ablation of target genes. The cyclisation recombination
(Cre) enzyme of the bacteriophage P1 is a 38 kDa site-specific recombinase [87], that has
34 bp DNA recognition sequences called loxP sites (locus of X-over P1). Each loxP consists
of a 13 bp inverted repeat sequences flaking a central directional core of 8 bp as illustrated
in figure 5. Specific DNA sequences flanked by loxP sequences placed on the same strand
are said to be ‘floxed’ and they are excised by the Cre-mediated recombination [88-95].
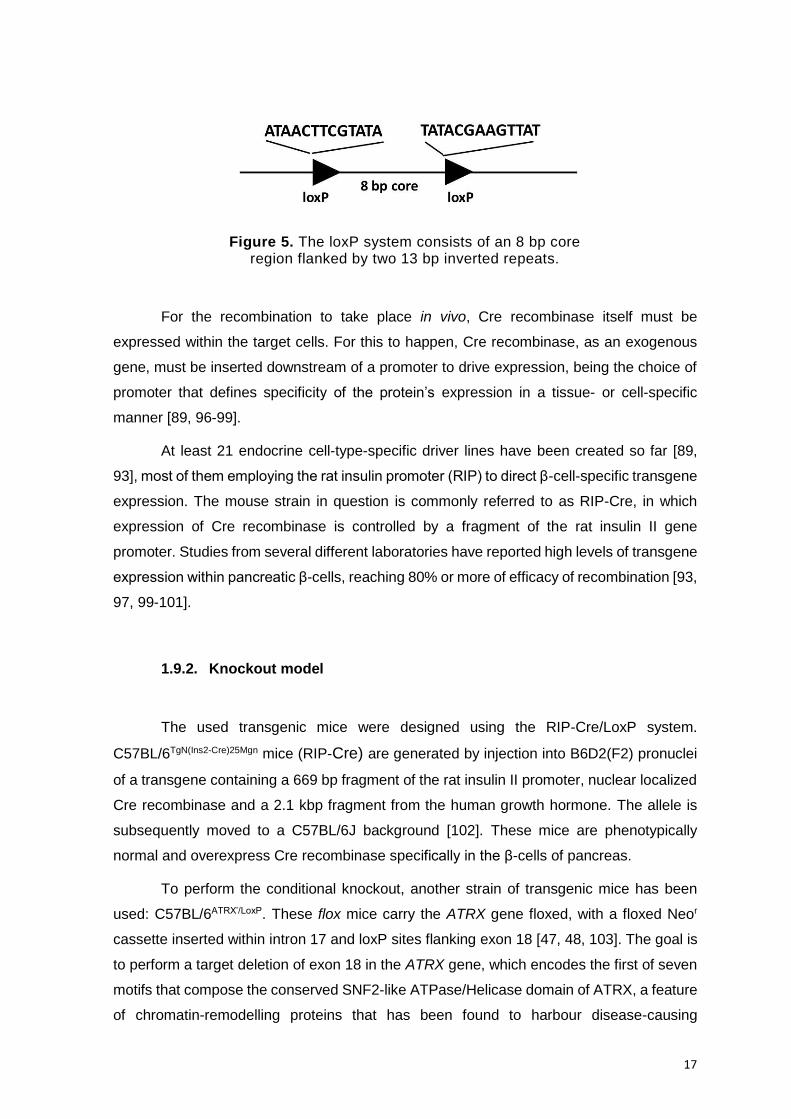
17
For the recombination to take place in vivo, Cre recombinase itself must be
expressed within the target cells. For this to happen, Cre recombinase, as an exogenous
gene, must be inserted downstream of a promoter to drive expression, being the choice of
promoter that defines specificity of the protein’s expression in a tissue- or cell-specific
manner [89, 96-99].
At least 21 endocrine cell-type-specific driver lines have been created so far [89,
93], most of them employing the rat insulin promoter (RIP) to direct β-cell-specific transgene
expression. The mouse strain in question is commonly referred to as RIP-Cre, in which
expression of Cre recombinase is controlled by a fragment of the rat insulin II gene
promoter. Studies from several different laboratories have reported high levels of transgene
expression within pancreatic β-cells, reaching 80% or more of efficacy of recombination [93,
97, 99-101].
1.9.2. Knockout model
The used transgenic mice were designed using the RIP-Cre/LoxP system.
C57BL/6TgN(Ins2-Cre)25Mgn mice (RIP-Cre) are generated by injection into B6D2(F2) pronuclei
of a transgene containing a 669 bp fragment of the rat insulin II promoter, nuclear localized
Cre recombinase and a 2.1 kbp fragment from the human growth hormone. The allele is
subsequently moved to a C57BL/6J background [102]. These mice are phenotypically
normal and overexpress Cre recombinase specifically in the β-cells of pancreas.
To perform the conditional knockout, another strain of transgenic mice has been
used: C57BL/6ATRX’/LoxP. These flox mice carry the ATRX gene floxed, with a floxed Neor
cassette inserted within intron 17 and loxP sites flanking exon 18 [47, 48, 103]. The goal is
to perform a target deletion of exon 18 in the ATRX gene, which encodes the first of seven
motifs that compose the conserved SNF2-like ATPase/Helicase domain of ATRX, a feature
of chromatin-remodelling proteins that has been found to harbour disease-causing
Figure 5. The loxP system consists of an 8 bp core region flanked by two 13 bp inverted repeats.

18
mutations in several pathologies, including PNETs [44-47]. Deletion of the specific exon
leads to the disruption of this domain. Excising exon 18 still allows the production of the
shorter isoform of the protein (ATRXt), comprising exons 1 to 11 [46-48].
Figure 6. Strategy for targeted deletion of exon 18 of the ATRX gene. Adapted from Bérubé et al. (2005) and Garrick et al. (2006).
Once Cre recombinase is expressed in the β-cells of the endocrine pancreas and
recognizes loxP sites, exon 18 will be conditionally excised [89, 98, 99], thus generating a
mouse with ATRX disrupted in this specific type of cells.
As above stated, a great progress has been made in the last few years regarding
the molecular pathogenesis of PNETs. Breakthrough studies reported a high prevalence of
mutations in either ATRX or DAXX, and such finding paved the way for other studies to
confirm and consolidate these findings in the disease. However, a deeper understanding of
the role of this alteration in the disease is required to improve a better knowledge in the
diagnosis, prognosis and/or treatment of the disease. The warranted study of tumorigenesis
in vivo in this context prompted us to develop a mouse model in which ATRX is conditionally
deleted in the pancreatic β-cells – an ATRX conditional knockout mice.

19
2. OBJECTIVES
The general aim of this project was to evaluate a novel mouse model of pancreatic
neuroendocrine tumors – an ATRX conditional knockout model.
In order to fulfil our objective several tasks were defined. The initial approach defined
was to characterize our population composition. For this goal, we evaluated the Cre-Lox
operational system by genotyping the mice that were included in the study. The next
objective was the histological evaluation of the pancreas of the animals. This part consisted
in a microscopic evaluation of features present in study animals, and since it was a
conditional deletion in specific cells, to characterize this endocrine population. A final task
was the creation/optimization of tools that will be further used in the exploration of this
model.

20

21
3. MATERIALS AND METHODS
3.1. Generation of ATRX conditional knockout mice
To generate the conditional knockout of ATRX in the pancreas β-cells we performed
the crossing of the two mouse strains above stated. The crossings were performed to obtain
an offspring with distinct genetic backgrounds and, therefore, allow the creation of 3
experimental groups regarding ATRX status: control, heterozygous and homozygous
groups.
The control group comprises animals from both genders without loxP sites flaking
exon 18 of ATRX, that maintain the gene undisrupted in their genome.
The heterozygous group is composed exclusively by female mice, since ATRX is
located on chromosome X. They present loxP sites flanking ATRX in only one of the alleles
giving rise to heterozygous animals.
The homozygous group comprises both genders. If it is a female, ATRX will be
flanked by loxP sites in both alleles; if it is a male, only one of its alleles is loxP flanked.
The possible genotypes, mating schemes and respective possible offspring are
summarized in figure 7.
Figure 7. Animals genotypes, mating schemes and expected offspring.

22
3.2. Study sample
The study sample is composed of 161 animals of which 75 (46,6%) are males and
86 (53,4%) are females.
For each animal, the pancreas was collected and a fragment was formalin-fixed and
paraffin-embedded (FFPE) for posterior histological examination. For the majority of
individuals and when feasible, other organs were collected, such as spleen, lungs and liver,
or other organs revealing macroscopic alterations. Other organs were collected less
frequently in the population, such as kidneys, ovaries, skin and thymus and processed
equally for posterior histological evaluation. A series of biological material were also stored
in a biobank, such as urine, blood and serum samples at -80 ºC.
3.3. DNA Extraction from Formalin-fixed Paraffin Embedded Tissues (FFPE)
For each FFPE sample, the slides were deparaffinized with xylene and cleaned with
absolute ethanol. Lysis solution (300 μL Citogene kit, Citomed, Portugal) was performed to
lysate cells, followed by the addition of proteinase K (15 μL of a 20mg/mL solution; P2308,
Sigma-Aldrich, USA) which was left overnight at 55ºC under agitation for protein
degradation. The next day, an additional 10 μL of proteinase k could be added if the
digestion was not complete. DNA extraction continued with using a protein precipitation
solution (100 μL Citogene kit, Citomed), followed by DNA precipitation with isopropanol and
a series of washes with hydrated alcohols. The final elution was in 20 μL of DNAse/RNAse-
free water and DNA concentration was measured by spectrophotometry (Nanodrop Lite,
Thermo fisher scientific, USA). The DNA samples were stored at -20ºC.
3.4. Genotyping of the sample
The confirmation of the Cre-LoxP status was performed by RIP-Cre transgene and
LoxP-insert specific alleles detection by PCR. To this purpose a multiplex assay was
developed for the detection of the loxP sequences with the primers ATRX_int17_F
(GGAGAGGGAAGGAGGAAATG) and ATRX_int17_R (TAGCCATACCTGCAACCACA)
and for the RIP-Cre transgene with oIMR1084_F (GCGGTCTGGCAGTAAAAACTATC) and
oIMR1085_R (GTGAAACAGCATTGCTGTCACTT). The reaction was constituted by 3.5 μL
of H2O, 5 μL of master mix (MyTaq, Bioline, UK), 0.25 μL of each primer and up to 0,1 μg
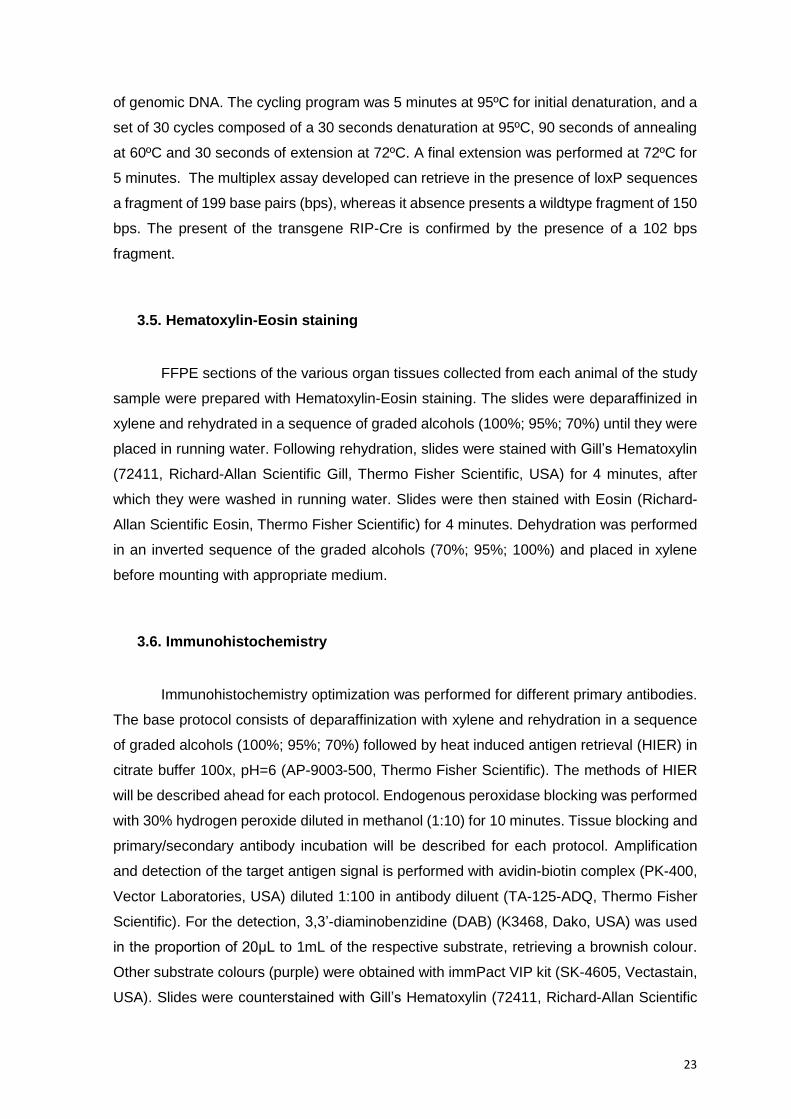
23
of genomic DNA. The cycling program was 5 minutes at 95ºC for initial denaturation, and a
set of 30 cycles composed of a 30 seconds denaturation at 95ºC, 90 seconds of annealing
at 60ºC and 30 seconds of extension at 72ºC. A final extension was performed at 72ºC for
5 minutes. The multiplex assay developed can retrieve in the presence of loxP sequences
a fragment of 199 base pairs (bps), whereas it absence presents a wildtype fragment of 150
bps. The present of the transgene RIP-Cre is confirmed by the presence of a 102 bps
fragment.
3.5. Hematoxylin-Eosin staining
FFPE sections of the various organ tissues collected from each animal of the study
sample were prepared with Hematoxylin-Eosin staining. The slides were deparaffinized in
xylene and rehydrated in a sequence of graded alcohols (100%; 95%; 70%) until they were
placed in running water. Following rehydration, slides were stained with Gill’s Hematoxylin
(72411, Richard-Allan Scientific Gill, Thermo Fisher Scientific, USA) for 4 minutes, after
which they were washed in running water. Slides were then stained with Eosin (Richard-
Allan Scientific Eosin, Thermo Fisher Scientific) for 4 minutes. Dehydration was performed
in an inverted sequence of the graded alcohols (70%; 95%; 100%) and placed in xylene
before mounting with appropriate medium.
3.6. Immunohistochemistry
Immunohistochemistry optimization was performed for different primary antibodies.
The base protocol consists of deparaffinization with xylene and rehydration in a sequence
of graded alcohols (100%; 95%; 70%) followed by heat induced antigen retrieval (HIER) in
citrate buffer 100x, pH=6 (AP-9003-500, Thermo Fisher Scientific). The methods of HIER
will be described ahead for each protocol. Endogenous peroxidase blocking was performed
with 30% hydrogen peroxide diluted in methanol (1:10) for 10 minutes. Tissue blocking and
primary/secondary antibody incubation will be described for each protocol. Amplification
and detection of the target antigen signal is performed with avidin-biotin complex (PK-400,
Vector Laboratories, USA) diluted 1:100 in antibody diluent (TA-125-ADQ, Thermo Fisher
Scientific). For the detection, 3,3’-diaminobenzidine (DAB) (K3468, Dako, USA) was used
in the proportion of 20μL to 1mL of the respective substrate, retrieving a brownish colour.
Other substrate colours (purple) were obtained with immPact VIP kit (SK-4605, Vectastain,
USA). Slides were counterstained with Gill’s Hematoxylin (72411, Richard-Allan Scientific

24
Gill, Thermo Fisher Scientific), sequentially dehydrated and mounted. All the washing steps
were performed with Tris-buffered saline (TBS) buffer (10%).
3.6.1. Ki-67
HIER was performed in a pressure cooker in citrate buffer 10x (pH=6). The antigen
retrieval proceeded as follows: 1 minute at 65 ºC and 10 minutes at 125 ºC. Tissue blocking
was performed with swine serum (X0901, Dako) diluted 1:5 in antibody diluent for 30
minutes in humid chamber at room temperature (RT). Incubation with primary antibody
rabbit monoclonal antibody clone SP6 anti-Ki-67 (275R-1, Sigma-Aldrich) was performed
overnight at 4ºC in a dilution of 1:100 in antibody diluent. Incubation with secondary
antibody, biotinylated swine anti-rabbit immunoglobulins (E0353, Dako) diluted 1:100, was
performed for 30 minutes in humid chamber at RT.
3.6.2. Chromogranin A
HIER was performed in a steamer set in citrate buffer 10x (pH=6) for 45 minutes.
Tissue blocking was performed with swine serum diluted 1:5 in antibody diluent for 30
minutes in humid chamber at RT. Incubation with primary antibody rabbit polyclonal
antibody anti-chromogranin A (259003, Synaptic Systems, Germany) was performed for 1
hour at RT in a dilution of 1:400. Incubation with secondary antibody biotinylated swine anti-
rabbit immunoglobulins diluted 1:100 was performed for 30 minutes in humid chamber at
RT.
3.6.3. Synaptophysin
HIER was performed in a steamer set in citrate buffer 10x (pH=6) for 45 minutes.
Tissue blocking was performed with swine serum diluted 1:5 in antibody diluent for 30
minutes in humid chamber at RT. Incubation with primary antibody rabbit monoclonal clone
SP11 antibody anti-synaptophysin (RM-9111-S0, Thermo Scientific) was performed for 1
hour at RT in a dilution of 1:100. Incubation with secondary antibody biotinylated swine anti-
rabbit immunoglobulins diluted 1:100 was performed for 30 minutes in humid chamber at
RT.

25
3.6.4. Cre-recombinase
HIER was performed in a steamer set in citrate buffer 10x (pH=6) for 40 minutes.
Tissue blocking was performed with swine serum diluted 1:5 in antibody diluent for 30
minutes in humid chamber at RT. An additional incubation with mouse serum (S2160-020,
Biowest, France) was performed for 1 hour at RT. Incubation with primary antibody rabbit
polyclonal antibody anti-Cre (69050-3, Merck Millipore, USA) was performed overnight at
4ºC in a dilution of 1:1000. Incubation with secondary antibody biotinylated swine anti-rabbit
immunoglobulins was performed for 30 minutes diluted 1:100 in humid chamber at RT.
3.6.5. ATRX
HIER was performed in a steamer set in citrate buffer 10x (pH=6) for 40 minutes.
Tissue blocking was performed with swine serum diluted 1:5 in antibody diluent for 30
minutes in humid chamber at RT. Incubation with primary antibody rabbit polyclonal
antibody anti-ATRX (HPA001906, Sigma-Aldrich) was performed overnight at 4ºC in a
dilution of 1:500 in antibody diluent. Incubation with secondary antibody (biotinylated swine
anti-Rabbit Immunoglobulins) was performed for 30 minutes diluted 1:100 in humid
chamber at RT.
3.6.6. Insulin
HIER was performed in a steamer set in citrate buffer 10x (pH=6) for 40 minutes.
Tissue blocking was performed with goat serum (X0907, Dako) diluted 1:5 in antibody
diluent for 30 minutes in humid chamber at RT. Incubation with primary antibody mouse
polyclonal antibody anti-insulin (18-0056, Zymed, USA) was performed overnight at 4ºC
diluted 1:200. Incubation with secondary antibody biotinylated goat anti-mouse
immunoglobulins was performed for 30 minutes diluted 1:100 in humid chamber at RT.
3.6.7. Glucagon
HIER was performed in a steamer set in citrate buffer 10x (pH=6) for 40 minutes.
Tissue blocking was performed with swine serum diluted 1:5 in antibody diluent for 30
minutes in humid chamber at RT. Incubation with primary antibody rabbit polyclonal
antibody anti-glucagon ready-to-use (N1541, Dako) was performed for 1 hour in humid
chamber at RT. Incubation with secondary antibody biotinylated swine anti-rabbit
immunoglobulins was performed for 30 minutes diluted 1:100 in humid chamber at RT.

26
3.7. Ki-67 labelling index
A set of 3 photos of each tumor were uploaded to the online software ImmunoRatio
(http://153.1.200.58:8080/immunoratio/), that counts and retrieves a percentage of Ki-67
immunostained cells by separating staining components (diaminobenzidine and
hematoxylin) while applying an adaptive thresholding for nuclear area segmentation. The
software provides an image with the ratio of DAB per nuclear area, while showing the cells
it recognized as immunostained (please refer to appendix I).
The final value of Ki-67 labelling index was obtained by calculating the mean of the
percentage obtained for the 3 photos of each tumor case.
3.8. Endocrine fraction measurement
The portion of endocrine area within the total pancreatic tissue of each animal was
measured using the software ImageJ (https://imagej.nih.gov/ij/). A minimum of 9 photos of
each pancreas slide were taken to achieve a minimum of 4.000.000 μM2 of tissue
(comprising both exocrine and endocrine areas) and obtain an accurate and comparable
percentage for each subject. The proper scale is introduced in the software so the results
are obtained in the stipulated unit. We then performed the circumvention of the islets for the
calculations. The programme therefore enabled the calculation of the areas inside the
circumvented margins (appendix II). The colour threshold tool selects all tissue (endocrine
and exocrine portions), deleting only the intra/interlobular areas of the pancreas, as well as
blood vessels and pancreatic ducts (illustrated in appendix II). Both values obtained were
used to calculate the endocrine counterpart size ratio within the total area of pancreatic
tissue.
3.9. Telomere-specific fluorescence in situ hybridization (tel-FISH)
FFPE tissues were deparaffinized with xylene, rehydrated in a sequence of graded
ethanol for analysis (100%; 95%; 70%) and washed in distilled water. The slides were then
washed in 1% Tween 20 wash (99% distilled water, 1% Tween 20) for 1 minute. HIER was
performed in citrate buffer 10x (pH=6) for 30 minutes in a steamer set. Following HIER, the
slides were washed in distilled water for 1 minute and washed in 70%, 95% and 100%
ethanol for analysis (6 minutes each). The slides were then allowed to completely dry before

27
applying the probe mix (the components and final concentrations are described in table 1).
Following the application of the probe mix and the coverslip, the slides were denatured at
84ºC for 5 minutes in a hybridizer (Dako Citomation, Dako). The slides hybridized for 2
hours at RT in a dark humidified chamber. Following hybridization, the tissue slides were
washed twice for 15 minutes in peptide nucleic acid (PNA) wash buffer (70% of deionized
formamide, 29% of distilled water and 1% of 1M Tris HCl, pH 7.5), 3 times in PBS-T (0,1%)
for 5 minutes and finally dehydrated in a sequence of graded ethanol for analysis (70%;
95%; 100%) for 5 minutes each. The slides were then allowed to completely dry in a dark
chamber; when dry, they were mounted in vectashield without DAPI (H-1000, Vector
Laboratories) and vectashield with DAPI (H-1200, Vector Laboratories) in a proportion of
3:1. The slides were stored at 4ºC in a dark chamber. The protocol was adapted from
Cesare et al. (2015) [104].
Table 1. Preparation of telomere-specific FISH probe mix
Stock solution 1 slide (25 µl) Final concentration
0.1M Na2HPO4 2.5 10 mM
1M NaCl 0.25 10 mM
1M Tris pH 7.5 0.25 10 mM
Deionized formamide 17.5 70%
Probe (67 µg/ml) 0.3 0.8 µg/ml)
dH2O 3.95 -
3.10. Immunofluorescence and telomere-specific FISH
FFPE tissues were deparaffinized with xylene and rehydrated in a sequence of
graded ethanol for analysis (100%; 95%; 70%). The slides were then washed in distilled
water and 1% Tween 20 wash for 1 minute. HIER was performed in citrate buffer 10x (pH=6)
for 30 minutes in a steamer set. Slides were washed in PBS-T 3 times for 5 minutes, and
then incubated with goat serum for 30 minutes. Incubation with primary antibody mouse
polyclonal antibody anti-insulin was performed for 2 hours at RT in a dark chamber.

28
Incubation with secondary antibody goat anti-mouse Alexa Fluor 594 (Z25007, Invitrogen,
USA) was performed for 30 minutes at RT in dark chamber. After PBS-T washing, the slides
were fixated in 10% formalin in distilled water for 20 minutes after which they were allowed
to dry. Following the application of the probe mix (as described in table 1) and the coverslip,
the slides were denatured at 84ºC for 10 minutes in a hybridizer. Hybridization was
performed for 2 hours at RT in dark chamber. The slides were then washed twice for 15
minutes with PNA wash buffer and 3 times for 5 minutes each in PBS-T. Dehydration in a
sequence of graded ethanol for analysis followed (70%; 95; 100%), for 5 minutes each.
After the slides dried, they were mounted in vectashield without DAPI and vectashield with
DAPI in a proportion of 2:1. The slides were stored at 4ºC in a dark chamber.
3.11. Statistical analysis
Differences in leukocytic infiltration, insulitis, pancreatic lesions score and endocrine
fraction among genotype and age groups were assessed by non-parametric Kruskall-Wallis
test, followed by pairwise comparisons using Mann-Whitney U Test.
Two-tailed P-values were derived from these statistical tests, using the program
SPSS Version 24.0, Chicago, USA. The results were considered statistically significant at
P < 0.05.

29
4. RESULTS
4.1. Study population
The study sample comprises 161 animals, of which 75 are males (46.6%) and 86
(53.4%) are females. The age median is 16 (3-33) months.
Table 2. Distribution of mice in age groups
Number (n) Percentage
Less than 6 months 20 12.4
6 – 12 months 27 16.8
12 – 18 months 48 29.8
More than 18 months 66 41.0
4.2. Genotype Evaluation
Allele-specific PCR was used for the confirmation of Cre recombinase transgene and
loxP alleles identification in the mouse genomes. The following gel electrophoresis (figure
8) illustrates the genotype assessment based in the presence or absence of amplification
and respective fragment size as described below.
CTRL
RIP-Cre+
RIP-Cre-
loxP+
100 bps
200 bps
Marker
Figure 8. Gel electrophoresis of allele-specific PCR for genotype evaluation (ATRX loxP and
Cre detection).
500 bps

30
Figure 9. Genotype distribution of the study sample.
In the control sample lane, it is possible to detect 3 bands. The band with 102 bps
(highlighted in blue) represents positivity for RIP-Cre transgene; when this band is not
observed, the animal does not present the transgene in its genome.
The band of 199 bp (highlighted in orange) represents the detection of loxP
sequences. In this case, the animal is homozygous and its gender must be previously
known: if it is a female, the genotype is ATRXFLOX/FLOX; if it is a male, the genotype is
ATRXFLOX/Y, since ATRX is located on chromosome X.
In case of a heterozygous animal for loxP, an intermediate band of 150 bp between
the last two reported is observed (highlighted in green). Only female mice can be
heterozygous (ATRXFLOX/X). Male mice are either controls or homozygous.
In case of positivity for the RIP-Cre transgene, but absence of loxP-inserts
(highlighted in red) the subject is included in the control group.
Following genotype evaluation, the study sample of our study was comprised by:
39.1% (n=63) controls (of which 63.5% are males [n=40] and 36.5% [n=23] are females);
36.6% [n=59] heterozygous mice; and 24.2% [n=39] homozygous mice (89.7% [n=35]
males, 10.3% [n=4] females).
The study sample was then divided in two main genotype groups: controls (n=63)
and ATRX floxed animals (n=98), which are further addressed as flox mice.
Controls
(n=63)
Homozygous
(n=39)
Heterozygous
(n=59)

31
4.3. Histopathological evaluation
4.3.1. Pancreatic lesions
The histological evaluation of pancreatic tissue slides of the subjects revealed a
notable presence pancreatic lesions with a prominent role of inflammation in 141 of the 161
(87.6%) animals. To categorize and evaluate the pancreatic lesions, a score with several
criteria was adapted.
Edema is caused by the retention of excess fluid within the body’s tissues and it was
one of the parameters evaluated in the mice pancreas. The histological grading was
adapted from Dembínski et al. [105] and uses a scale from 0 to 4: 0= absent; 1= interlobular
edema; 2= interlobular and scarce intralobular edema; 3= interlobular and moderate
intralobular edema; 4= interlobular and severe intralobular edema. Edema grading is
illustrated in appendix IV.
Vacuolization is also a criteria, referring to the percentage of acinar cells involved,
using a scale from 0 to 3: 0= absent; 1= <25% acinar cells involved; 2= 25-50% of acinar
cells involved; 3= >50% of acinar cells involved [105].
Hemorrhagia was another of the parameters evaluated to assess pancreatic lesion.
The adopted scale included the following scores: 0= absent; 1= 1-2 hemorrhagic foci per
slide; 2= 3-5 hemorrhagic foci per slide; 3= >5 hemorrhagic foci per slide [105].
To evaluate and quantify infiltration in the pancreas, two different parameters were
considered: perivascular/periductal and diffuse leukocytic infiltration (LI) and infiltration in
the pancreatic islets (insulitis). Leukocytic infiltration grading was adapted from Dembínski
et al. [105] and uses a scale of 0 to 5: 0= absent; 1= scarce perivascular/periductal
infiltration alone; 2= scarce perivascular/periductal infiltration and scarce diffuse infiltration;
3= moderate perivascular/periductal and absent to scarce diffuse infiltration; 4= moderate
perivascular/periductal and diffuse infiltration; 5= abundant diffuse infiltration. Insulitis was
graded by adapting a scale from 0 to 4: 0= absent; 1= infiltrates in small foci at the islet
periphery; 2= infiltrates surrounding the islet (peri-insulitis); 3= < 50% of intraislet infiltration;
4= extensive infiltration, >50% of the islet. The scale was adapted from Papaccio et al.
[106].
Below are illustrations representing some of the attributed grades of leukocytic
infiltration, figure 10, as well as scores 1 to 4 for insulitis grading, figure 11.
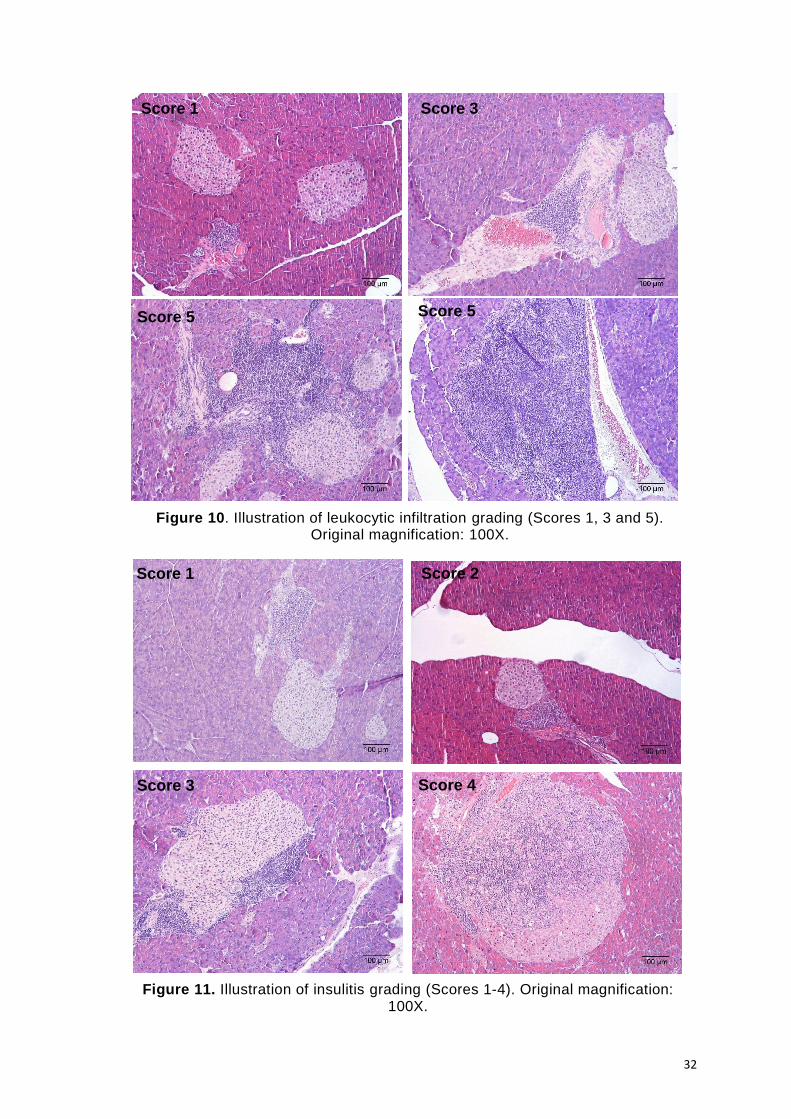
32
Score 1 Score 3
Score 5 Score 5
Score 1 Score 2
Score 3 Score 4
Figure 10. Illustration of leukocytic infiltration grading (Scores 1, 3 and 5). Original magnification: 100X.
Figure 11. Illustration of insulitis grading (Scores 1-4). Original magnification: 100X.

33
The frequency of leukocytic infiltration and insulitis according to genotype (control
and flox animals) and age groups (less than 6 months; 6 to 12 months; 12 to 18 months;
more than 18 months) is shown below in figures 12 and 13, respectively.
1 2 3 4 50
10
20
30
Leukocytic infiltration score
Fre
qu
en
cy
< 6 months
6-12 months
12-18 months
> 18 months
*
**
*
1 2 3 4 50
10
20
30
Leukocytic infiltration score
Fre
qu
en
cy
Controls
Flox mice
A
B
Figure 12. Bar charts of LI frequency among (A) genotype groups and (B) age groups (Mann Whitney Test, *P < 0.05).
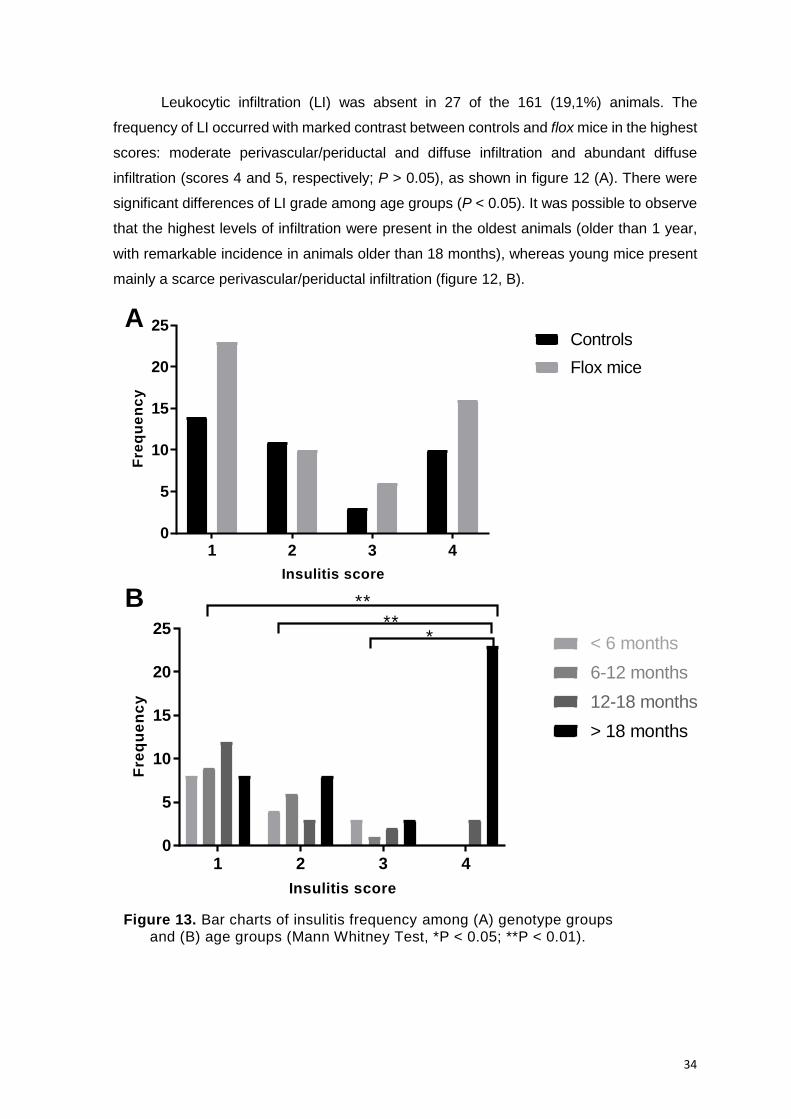
34
Leukocytic infiltration (LI) was absent in 27 of the 161 (19,1%) animals. The
frequency of LI occurred with marked contrast between controls and flox mice in the highest
scores: moderate perivascular/periductal and diffuse infiltration and abundant diffuse
infiltration (scores 4 and 5, respectively; P > 0.05), as shown in figure 12 (A). There were
significant differences of LI grade among age groups (P < 0.05). It was possible to observe
that the highest levels of infiltration were present in the oldest animals (older than 1 year,
with remarkable incidence in animals older than 18 months), whereas young mice present
mainly a scarce perivascular/periductal infiltration (figure 12, B).
A
B
Figure 13. Bar charts of insulitis frequency among (A) genotype groups and (B) age groups (Mann Whitney Test, *P < 0.05; **P < 0.01).
1 2 3 40
5
10
15
20
25
Insulitis score
Fre
qu
en
cy
< 6 months
6-12 months
12-18 months
> 18 months
****
*
1 2 3 40
5
10
15
20
25
Insulitis score
Fre
qu
en
cy
Controls
Flox mice

35
Insulitis was absent in 48 (29.8%) mice of the study sample. It was more pronounced
in flox subjects when compared to controls in the group that presents small foci of infiltrates
in the islet periphery (score 1; P > 0.05) and in the groups of intra-islet infiltration (scores 3
and 4; P > 0.05), as shown in figure 13 A. When stratifying by age, there were significant
differences regarding insulitis among the different groups and a notorious prevalence of
severe insulitis (score 4) in mice older than 18 months, as shown in figure 13 B. Severe
insulitis (score 4) was not found in mice younger than 12 months, figure 13 B.
A final score to determine the grade of the lesions was built based on the sum of the
5 evaluated parameters. Due to their higher pathological relevance, leukocytic infiltration
and insulitis were accounted in the final score with a doubled weight value. Overall, the
score ranged from 1 to 25 but for the descriptive analysis of the lesions, they were grouped
in 3 main categories: 1 to 8 comprises low grade lesions, 9 to 20 includes moderate lesions
and a score value of more than 20 comprises animals with high grade lesions. 38 of the 141
(26.9%) animals presented low grade lesions; 84 (59,6%) presented moderate lesions and
19 (13,5%) developed high grade lesions. The analysis of the pancreatic lesions score
distributed by genotype and age groups is presented below in figure 14, A and B
respectively.
A
Low-grade Moderate High-grade0
20
40
60
Lesions score
Fre
qu
en
cy
Controls
Flox mice

36
Flox mice developed low, moderate and high-grade lesions more frequently (figure
14, A). However, the differences of pancreatic lesions among the control and flox groups
are not significant (P > 0.05). In the group of animals that develop high-grade lesions, the
contrast among age groups is noteworthy, with a much higher frequency in mice with more
than 18 months when compared to younger subjects. Low-grade lesions, moderate lesions
and high-grade lesions presented significant differences among different age groups (P <
0.05 and P < 0.001).
4.3.2. Hyperplasia of pancreatic islets
The histological evaluation of the mice pancreas also revealed a major increase in
the endocrine area – hyperplasia of pancreatic islets.
To assess the pancreatic endocrine portion, we used the software ImageJ as
described in materials and methods for endocrine and exocrine area ratio quantification.
B
Figure 14. Bar charts for lesions score among (A) genotype and (B) age groups (Mann Whitney Test, *P < 0.05; **P < 0.001).
Low-grade Moderate High-grade0
10
20
30
40
Lesions score
Fre
qu
en
cy
< 6 months
6-12 months
12-18 months
> 18 months
**
* *

37
The analysis of pancreatic endocrine fraction revealed the existence of hyperplastic
islets with a highly enlarged diameter compared to normal-sized islets, as illustrated in figure
15.
The median of endocrine fraction obtained for this population was 8.3%, with a
minimum of 0.5% and a maximum of 34.1%.
The statistical analysis of the endocrine fraction regarding the genotype revealed a
slightly higher median for controls than for flox mice (8.7 and 8.1, respectively; P > 0.05),
illustrated in figure 16 A. Stratification by age groups, revealed that the medians are
gradually higher (5.3, 6.8, 8.4 and 14.2, from young to older mice), with a significant
difference among groups (P < 0.05 and P < 0.001), as represented in figure 16 B.
B A
Figure 15. Comparison of (A) a normal-sized islet with a mean diameter of 75 µm and (B) a hyperplasic islet with 940 µm of diameter. Original magnification: 100X.

38
< 6 months 6-12 months 12-18 months >18 months
0
10
20
30
40
Age
En
do
cri
ne
fra
cti
on
< 6 months
6-12 months
12-18 months
>18 months
***
****
A
Controls Flox mice 0
10
20
30
40
Genotype
En
do
cri
ne
fra
cti
on
Controls
Flox mice
B
Figure 1. Figure 16. Boxplots of endocrine fraction among (A) genotype and (B) age groups (Mann Whitney Test; *P < 0.05, **P < 0.001).

39
Adding to their increased size, hyperplasic islets often present irregular shapes.
Coalescence of adjacent islets is also very common. These features are represented in
figure 17.
4.3.3. Characterization of endocrine cell population
To characterize the pancreatic endocrine cell population, immunohistochemistry for
insulin and glucagon was performed. These hormones are produced by β- and α-cells,
respectively. Together, these two types of cells comprise the majority of cell population of
the islets, with a percentage of 60% to 80% and 15% to 20%, respectively. δ-cells (<10%)
and PP-cells (<1%) represent only a very small fraction of this population. As expected, the
architecture of normal-sized islets is represented by a β-cell core surrounded by α-cells in
its periphery, as represented in figure 18. β-cells represent up to 85% of cell content, while
α-cells represent about 10% of the endocrine population.
A B
Figure 17. Representation of (A) an irregular-shaped islet and (B) islet coalescence. Original magnifications: 100X and 40X, A and B, respectively.
Figure 18. Immunohistochemistry staining of normal-sized islet for (A) insulin and (B) glucagon. Original magnification: 200X.

40
Hyperplasic and coalescent islets maintain their strong pattern of insulin expression,
with staining in the majority of the islet population (figure 19, A and C). However, a
homogenous expression of glucagon in the periphery of hyperplasic and irregular islets is
not observed; instead, it presents itself in the middle of the endocrine portions and in a much
less extent relatively to what is expected. This may point to a disrupted architecture of the
islets (figure 19, B and D).
Islets with mononuclear lymphocytic infiltrates in their surroundings or intra-islet
infiltration continue to express insulin in the majority of cells, but, once again reveal a
disrupted pattern of glucagon expression in their midst, as illustrated in figures 20 and 21.
A B
C D
Figure 19. Immunohistochemistry staining of hyperplasic and coalescent islets for insulin (A, C) and glucagon (B, D). Original magnification: 40X.

41
A B
A B
C D
Figure 21. Immunohistochemistry staining for insulin (A, B, C) and (D) glucagon in highly infiltrated islets. Original magnification: 200X.
Figure 20. Immunohistochemistry staining for insulin (A) and glucagon (B) in islets with peri-insulitis. Original magnification: 100X.

42
4.3.4. Pancreatic Tumors
Of the 161 studied mice, 20 (12.4%) presented pancreatic tumors. 15 out of the 20
(75.0%) tumors arose in flox mice, while the remaining were in controls. The table below
presents the genotype and age of the mice, as well as the ki-67 proliferative index of the
tumors.
Table 3. Description of pancreatic tumors in the study sample
The differential diagnosis of PNETs can be obtained by immunohistochemistry using
two classical markers that aid in lineage determination: chromogranin A (CgA) and
synaptophysin (SYN). All 20 tumors were negative for both markers. Insulin is also not
expressed in these tumors. The following images illustrate the architecture and
immunohistochemistry staining pattern of the mentioned markers in one of the tumor
samples.
Genotype Age (months) Ki-67 index (%)
ATRXFLOX/X 14 22,7
ATRXX/Y 16 23,0
ATRXFLOX/X 18 16,8
ATRXFLOX/X 18 17,5
ATRXX/Y 18 16,8
ATRXFLOX/X 18 10,6
ATRXX/Y 18 25,0
ATRXFLOX/X 19 34,1
ATRXX/Y 20 11,1
ATRXFLOX/X 21 15,5
ATRXX/Y 22 26,7
ATRXFLOX/X 22 16,3
ATRXFLOX/X 22 40,7
ATRXFLOX/X 22 9,3
ATRXFLOX/Y 22 20,5
ATRXFLOX/X 22 41,9
ATRXFLOX/X 22 13,8
ATRXFLOX/Y 23 7,6
ATRXFLOX/Y 24 70,0
ATRXFLOX/X 24 59,8

43
A B
C D
Figure 22. Tumor stained with hematoxylin and eosin (H&E). Original magnifications: 40X and 200X, respectively.
Figure 23. IHC staining of a tumor sample for (A) CgA, (B) SYN, (C) insulin and (D) Ki-67. Internal controls are shown for CgA, SYN and insulin. Original
magnifications: 40X and 100X.

44
4.4. Cre recombinase expression in pancreatic islets
Genotyping confirms the presence or absence of RIP-Cre transgene in the mouse
genome. However, as previously addressed, for recombination to take place in vivo, Cre
recombinase needs to be expressed specifically in the nucleus of β-cells.
Immunohistochemistry staining confirms the expression, as illustrated in figure 24. A
heterogeneous pattern amongst islets of the same animal was observed: some present a
high percentage of expressing cells, while other islets hold a lower fraction of expressing
cells.
4.5. ATRX expression in pancreatic islets
As described in materials and methods, there are 3 main groups of mice in the study
sample regarding ATRX status: controls (ATRXX/X or ATRXX/Y), heterozygous (ATRXFLOX/X)
and homozygous (ATRXFLOX/FLOX or ATRXFLOX/Y) animals.
A B
Figure 24. Cre recombinase expression in the nucleus of pancreatic β-cells. Immunohistochemistry staining for (A) negative control and (B) RIP-Cre+/- mouse. Original
magnification: 400X.

45
To evaluate the presence or absence of the protein in the pancreatic tissue,
immunohistochemistry was performed. Control mice maintain the expression of ATRX in β-
cells, as well as heterozygous females, since the second allele is wild-type and the cells
retain the capacity of producing the protein. Homozygous mice maintained expression of
the protein, even if in a seemingly less extent. These results are illustrated in figure 25.
A B
C D
Figure 25. ATRX expression in the nucleus of pancreatic β-cells. Immunohistochemistry staining for (A) negative control, (B) ATRXX/x mouse, (C) ATRXFLOX/X mouse and (D) ATRXFLOX/FLOX mouse. Original magnification: 400X.

46
4.6. Telomere FISH and Immunofluorescence
In humans, ATRX mutations are known to induce the alternative lengthening of
telomere mechanism, the so-called ALT mechanism. As previously mentioned, ALT,
presents a typical phenotype that can be evaluated by FISH. To localize telomeres in the
nucleus of pancreatic tissue, telomere-specific fluorescence in situ hybridization (tel-FISH)
was performed. Telomeres are observed as bright green foci in the nuclei of cells (figure
26). Additionally, to co-localize telomeric sequences specifically in pancreatic β-cells,
immunofluorescence was combined with tel-FISH. In figure 27, telomeres are shown in
green bright foci in the nucleus, while β-cells are visualized in red, since
immunofluorescence was performed for the staining of insulin. Although at the moment, it
was not possible do evaluate a considerable number of mice with this technique, the tool is
optimized for further evaluation.
Figure 27. Immunofluorescence for insulin combined with telomere-FISH to co-localize telomeric DNA sequences within pancreatic islets. Original magnifications:
630X and 1000X.
Figure 26. Telomere-specific FISH in pancreas tissue. Original magnifications: 400X and 1000X.

47
5. DISCUSSION
Animal models allow the study of a wide range of human diseases. In some cancer
models, they enable researchers to follow tumorigenesis in a stepwise manner, something
hard to achieve in human patients where tumors, generally, appear in different stages of
development, not giving the opportunity to sometimes understand the first phases of
tumorigenic development. Although rare, PNETs pose significant challenges to Clinicians.
Their clinical manifestations often resemble other pathologies, which can result in a
prolonged development as a result of a misdiagnose. Several animal models have been
designed to mimic and understand the initiation and progress of tumorigenesis in PNETs,
as reviewed by Babu et al. [74], but it is recognized that more animal models in the disease
are needed. Most of the models addressed the most oncogenic event known in PETs, the
MEN1 alterations. Since ATRX was recently reported with a high mutational frequency in
PNETs [35, 36], a conditional knockout model was developed to allow the evaluation of the
gene’s disruption in tumor development. At least 21 lines using endocrine genes have been
used so far to drive Cre expression, 14 of which rely on insulin gene promoter [89]. Some
of the most recent mouse models of PNETs have also employed the RIP-Cre system to
conditionally delete MEN1 [80, 81, 83]. These studies reported a successful deletion of the
gene, generating PNETs in the majority of the individuals.
This study started by performing an overall histological evaluation of the mice
pancreas in which inflammation was observed as a prominent finding, ranging from scarce
perivascular or periductal foci of mononuclear lymphocytes to abundant diffuse infiltrates in
the exocrine tissue (figure 10). Islet-associated mononuclear cell infiltration, termed insulitis,
was also a very common finding (figure 11). Although not statistically significant (P > 0.05),
the frequencies of the highest scores of leukocytic infiltration and insulitis were higher in
flox mice when compared to controls (figure 12 A and 13 A). Both infiltrations were shown
to progress with age: animals with more than 18 months of age presented remarkable
higher levels of infiltration, while the majority of mice with 6 months of age or less had only
scarce perivascular/periductal infiltrations or infiltrates in small foci at the islet periphery
(figure 12 B and 13 B). The results were similar when an analysis was performed for the
lesions score, including the grading of not only the leukocytic infiltration and insulitis but
also edema, hemorrhagia and vacuolization (figure 14, A and B). Flox mice presented a
higher tendency for developing moderate and high-grade lesions (figure 14 A); however,
the difference among groups was not significant (P > 0.05). Age, on the other hand, proved
to be determinant for the development of pancreatic lesions of higher grade; in fact, the
majority of animals that developed these lesions were older than 18 months (figure 14 B).

48
Insulitis is a characteristic lymphocytic infiltration limited to the islets of Langerhans
that arises alongside decreased β-cell mass in the context of diabetes type 1 [107]. In 1994,
Campbell et al. [108] developed a transgenic mouse model with expression of interleukin 6
(IL-6) controlled by the rat insulin promoter (RIP), promoting an overexpression specifically
in β-cells. IL-6 is a cytokine that has been long proved to have an important role on the
progression of auto-immunity and destruction of β-cells in diabetes type 1. The authors
reported evidence of both peri- and intra-islet infiltration and an association of IL-6 with
enlarged and often irregular-shaped islets. Similar to what happens in our model, the
mononuclear cell infiltration was evidently more extensive in older mice. Their findings thus
supported the hypothesis in which the localized production of this cytokine was sufficient to
induce a progressive islet-specific inflammatory response [108]. This study also reported a
disrupted architecture of the islets in terms of cell population, since a reduction in number
and intensity staining of insulin positive cells was found. Pancreatic islets of our study
sample do not present this kind of disruption: although severely enlarged (figure 15 B) and
with an irregular shape (figure 17 A), the islets maintain their strong staining pattern of
insulin staining throughout all their extension (figure 19, A and C). On the other hand,
exocrine tissue damage or pancreatitis were not found in the model [108], contrarily to what
happens in the individuals of our sample, in which a leukocytic infiltration outside the islets
is found severe in older mice (figure 12 B) and with a seemingly higher tendency for
developing in flox mice when compared to controls (figure 12 A).
As previously stated, it was found that the pancreatic islets of the ATRX conditional
knockout mouse model were highly hyperplasic. It is important to emphasize that the normal
portion of endocrine area of an adult mammalian is 1 to 2% on average [1]. Mouse islets
are reported to have an average diameter of 116 µm, an increased value compared to
human islets [4]. In the present model, the median of endocrine portion of the population is
approximately 8%, with some subjects reaching an extreme of more than 30%, as portrayed
in the boxplots of figure 16. These findings were verified in both flox mice and controls, with
a slightly increased median for the latter as previously shown in figure 16 A, a difference
which was not statistically significant (P > 0.05). The median of endocrine fraction
significantly progressed as the animals’ age incremented (figure 16, B; P < 0.05 and P <
0.001).
Such results alerted us for studies in which the RIP-Cre strain was analyzed in order
to determine if this animal per se could have alterations [93]. Results from three laboratories
highlighted that even in the absence of genes targeted by loxP sites, RIP-Cre mice are
glucose intolerant, with the possibility of impaired insulin secretion in its origin [93]. The
authors also reported several cases of abnormal islet structure, with α-cells dispersed within

49
these complexes, instead of localized in their periphery [93], a pattern similar to the one we
found, with an aberrant and scattered staining of glucagon in hyperplasic islets (figure 19,
B and D). Another study investigated the background of the RIP-Cre strain and reported an
increase in islet size in comparison to wild-type littermates, owing this to a possible
morphologic response to impaired glucose [109]. The authors also pointed to the fact that
while no reduction in islet number was observed, there was a reduction in β-cell mass
(evidenced by the loss of insulin staining), which could be relevant for the development of
glucose intolerance. In our study sample, we observe indeed a great increase of islet mass:
instead of the reported 1-2% of endocrine portion of a normal pancreas in adult mammalians
[1], we verified an increased median value of 8% for our study population (figure 16). This
was significantly associated to mice aging (figure 16, B), as it was previously reported by
other authors [109]. Our islets maintain their strong expression of insulin and their only
architectural abnormality is dispersion of α-cells among the islet (figure 19, A-D).
The endocrine portion of our mice is then highly hyperplasic, while maintaining a
strong expression of insulin and an abnormal expression of glucagon, associated with both
controls, flox mice and aging (figure 16). Adding to this, there is a high incidence of
mononuclear cell infiltration in these islets (figure 13); insulitis has not been reported so far
in any study relating to RIP-Cre mice. Infiltrated islets remarkably maintain their expression
of insulin as previously shown in figures 20 (A) and 21 (A). The glucose intolerance and
insulin impairment described for this strain need to be evaluated in our sample as they were
proven to be almost a hallmark of RIP-Cre mice [93, 109]. However, these events induce
β-cell mass reduction, which was not detected in the ATRX conditional knockout model
(figure 19, A and C).
We hypothesize that our control mice, which are all genotyped as RIP-Cre+/- are also
associated with the onset of pancreatic lesions and endocrine fraction increase and that
there are no significant differences of these features between RIP-Cre controls and RIP-
Cre/ATRX floxed animals.
Several models have been reported to mimic PNETs. Crabtree et al. described a
mouse model of MEN1 targeting by deleting 3 exons by homologous recombination.
Homozygous embryos perished between days 11 to 13, while in the heterozygous
population, 40% of mice developed islet hyperplasia and tumors by their 9th month of age
[79]. The authors observed gradual steps of tumorigenesis, starting in hyperplasic islets,
followed by focal atypia and tumors [79]. Two years later, the same authors reported the
development of another mouse model of MEN1, in which the deletion of exons 3 to 8 of the
MEN1 gene was performed using the RIP-Cre/LoxP system, directing a specific deletion in
β-cells to overcome embryonic lethality in homozygous embryos [81]. At 60 weeks of age,

50
more than 80% of homozygous mice developed multiple pancreatic islet adenomas.
Hyperplasic islets were also found in these mice, with a consistent pattern of insulin
expression; they posteriorly developed focal atypia, with abnormally sized and shaped cells,
culminating in the development of pancreatic islet tumors. The authors related the loss of
menin in β-cells to the atypical phenotype of islets. Tumorigenesis did not appear until the
mice were 6 to 12 months old, and the evidence pointed towards the fact that adenoma
formation probably involved additional somatic events to MEN1 deletion [81]. Bertolino et
al. followed the same rationale: they began by reporting a mouse model with MEN1
disruption by homologous recombination [80] and later that year (2003) published the
results of a model with conditional deletion of the gene in pancreatic β-cells using the RIP-
Cre/Lox system [82]. The first study reported hyperplasia and dysplasia in 65% of the
population by 8 to 12 months, with 22% of adenomas and 8,7% of carcinomas. As the age
of the mice progressed, the fraction of adenomas and carcinomas increased, with more
than 60% of carcinomas found in the group of mice with 19 to 26 months of age.
Immunohistochemistry staining for insulin showed that the majority of neoplasms were
insulinomas, but advanced islet carcinomas showed either weak or complete loss of
expression [80]. The second study published by the authors reported enlarged islets by 2
months of age, a feature which tended to progress with aging. Insulinomas were found at 6
months of age, and by 10 months of age all the mice comprising the sample presented
tumors; the increased frequency of tumors was then associated with aging. After 10 months
of age, all the transgenic mice developed advanced insulinomas (carcinomas), which were
shown to progressively loose insulin-staining. This finding suggested a dedifferentiation
process during tumor development [82]. The authors reinforced the advantage of a
conditional knockout approach for monitoring of the whole process of tumorigenesis:
hyperplasia, dysplasia and adenoma/carcinoma formation. One more study has performed
the conditional inactivation of MEN1 in β-cells using the same system [83]. Biondi et al. also
reported prominent hyperplasia of the pancreatic islets at 12 months of age, which were
positively stained for insulin. There was an additional development of islet cell tumors in 7
animals of the tumor sample [83]. In 2009, another mouse model was developed for
mimicking pancreatic neuroendocrine tumors, using once more the Cre/LoxP system in
which Cre expression was driven by a different promoter, the pancreatic and duodenal
homeobox 1 (Pdx1) [86]. Pdx1 is a regulator of pancreatic organogenesis; initially, it is
expressed in all pancreatic progenitor cells, but postnatally it is only present in β-cells. The
exocrine and glandular components of the pancreas were observed with a normal pattern,
while the endocrine fraction was reported as enlarged and hyperplasic as early as 5 months
of age[86]. These mice exhibited a progression to insulinoma by the age of 10 to 12 months,
while exocrine cells remained phenotypically normal [86].

51
All the data obtained from these mouse models and others (with target deletions in
α-cells, for example [75, 77, 84, 85]) were reviewed by Babu et al. (2013). They established
a multistage pathogenesis for PNETs: the 1st stage is hyperplasia of the pancreatic islets,
followed by dysplasia/atypia and culminating in the generation of neuroendocrine tumors
[74].
In our study population, besides the prominent mononuclear infiltrates in both
exocrine and endocrine tissues, hyperplasia of the pancreatic islets was one of the main
findings as consistently addressed before. The endocrine portion is severely increased, and
while this could be explained by use of the RIP-Cre transgene [109], it appears that this is
not the case. Enlarged islets of RIP-Cre mice loose β-cells mass, and this is not observed
in our population; on the contrary, the strong and coherent insulin staining pattern proves
the proliferation of these cells, as illustrated in figure 19 (A and C). Such results are
compatible with the ones found for some of the previously reported PNET mouse models
[81, 83]. These islets are also found to frequently coalesce with one another (figure 19);
many islets enter a stage of coalescence, in which adjacent islets form even larger,
irregularly shaped ones. This is thought to be a prior stage to islet adenomas and PNETs.
This finding has been reported as a previous step in adenoma formation in a mouse model
of transgenic expression of thymidylate synthase (an essential enzyme for DNA synthesis)
[110].
It is of interest to characterize the expression of ATRX in such hyperplasic and
irregular islets in the future to try to establish a possible causal relationship between its loss
and the onset of islet hyper/dysplasia, as it has been done for MEN1 models that lost
expression of menin in their endocrine portions.
In this study, 20 pancreatic tumors were found in 161 studied animals (12.4%); they
were found in both the control and flox groups (5 controls, 12 heterozygous and 3
homozygous mice; pancreatic tumors are described in table 3). To accurately confirm the
tumors’ diagnosis, there are postulated immunohistochemical markers defining
neuroendocrine differentiation that can be used. Chromogranin A and synaptophysin are
the most used markers. It was observed that all tumors lack expression of both markers
(figure 23, A and B). They also do not present any expression of insulin, which was
evaluated since insulinomas arise from β-cells and are the most common type of PNETs
(this finding is illustrated in figure 23 C). The age of the mice in which these tumors arose
ranges from 14 to 24 months. The Ki-67 labeling index provided the evidence that we are
dealing with highly proliferative tumors. If the most recent grading system released by WHO
for endocrine tumors is to be applied in the found neoplasms, these tumors would be
categorized mainly as G2 and G3 [21]. Adding to this and according to the histological
52
pattern, the hypothesis of a poorly differentiated neuroendocrine carcinoma phenotype was
raised. In human cases, the diagnosis of large-cell neuroendocrine carcinoma is confirmed
by immunohistochemical staining for CgA and SYN, being their extent and intensity usually
less than in well-differentiated NETs [111]. These markers were not to be expressed in the
tumors (figure 23, A and B). However, there are additional neuroendocrine markers possible
to be tested in these samples. CD56 is the cluster differentiation (CD) of neural cell
adhesion antigen and it has been used (although in a less extent than the previously
mentioned markers) for the diagnosis of neuroendocrine neoplasms [5, 11, 13, 112], being
also a possible marker to be applied. Paired Box 8 (PAX8) is a crucial transcription factor
for the development of the kidneys, thyroid and Mullerian ducts that has recently been also
related to pancreatic neuroendocrine tumors [113, 114], being considered as a tool for the
differential diagnosis of NETs [115]. Insulin Gene Enhancer Protein ISL-1 (Islet-1) is a
transcription factor involved in the embryogenesis of the islets of Langerhans, being
therefore a sensitive lineage-specific marker for PNETs expressed strongly in the nucleus
of tumor cells. It is also considered a reliable marker for PNET metastases [116]. Both these
markers could be potentially used additionally to evaluate the neuroendocrine phenotype of
the tumors. Pdx1 is a transcription factor essential for pancreatic development and β-cell
maturation, being expressed in pancreatic cell progenitors and immature cells of endocrine
lineage that has been associated with not only PNETs but other precursor lesions and
neoplasms of the pancreas [117]. Given its presence in immature pancreatic cells, it would
be a useful marker to confirm the hypothesis of a poorly differentiated phenotype for the
tumors of our sample.
In 2013, Hunter et al. described a mouse model of pancreatic neuroendocrine
tumorigenesis in which while the majority of tumors were well-differentiated insulinomas, a
subset of tumors were identified and characterized as poorly differentiated invasive
carcinomas (PDICs) [118]. Similarly to what happens in the tumors of our study sample, the
H&E staining provided a possible PNET phenotype with highly proliferative indexes. The
immunohistochemical characterization, however, revealed that these neoplasms had
completely lost expression of CgA, while maintaining a subtle heterogeneous expression of
SYN. This class of tumors was also reported to lose staining of insulin (as observed in other
PNET mouse models in which carcinomas developed [80, 82]) and markers of β-cell
differentiation, such as Pdx1. Thus, to achieve confirmation of the apparent
dedifferentiation, the authors evaluated the expression of inhibitor of DNA binding 1 (Id1) in
PDICs. Id1 is an inhibitor of DNA binding proteins that has been shown to inhibit
differentiation, stimulate proliferation and to be expressed in cancer stem cells [119]. The

53
majority of PDIC cells were found to exhibit a specific nuclear staining pattern, proving the
poorly differentiated phenotype of the neoplasms [118].
If a neuroendocrine phenotype is not proved by immunohistochemistry staining for
any of these markers, to achieve the diagnosis of tumors a panel of markers must be
followed, bearing in mind that pancreatic neoplasms arise from different backgrounds [120,
121]. Pancreatic ductal adenocarcinomas represent about 90% of all malignant pancreatic
tumors [120]. Immunohistochemistry staining for cytokeratin AE1/AE3 will allow the
confirmation or exclusion of an epithelial nature of the tumors [28]. Another possible marker
to ascertain an epithelial origin is the Epithelial Membrane Antigen (EMA) which is highly
expressed in most adenocarcinomas [122]. If the tumors have a mesenchymal origin,
immunohistochemistry staining for vimentin (an intermediate filament of mesenchymal
tissue) will confirm this phenotype. Specifically, among the group of non-epithelial tumors,
pancreatic lymphoma arose as a proposed diagnosis. A valuable marker to rule out or
confirm this hypothesis would be the Leukocytic Common Antigen (LCA or CD45), which is
a membrane glycoprotein restricted to leukocytes that allows the distinction between
hematopoietic and non-hematopoietic neoplasms[123]. In order to identify the lineage of
these tumors we will perform a battery of tests that will eventually shed some light on its
origin.
We have also hypothesized that hyperplasic and irregular islets could be an initial
step in tumorigenesis in this model as they are in many others of PNETs [74], however, it
is precocious to establish a conclusion and further studies are required to associate such
with ATRX loss, since both RIP-Cre controls and ATRX floxed mice developed pancreatic
tumors, although the second group presented a higher prevalence (table 3). The tumors
were found in animals with approximately 16 to 24 months; if these tumors are proven to
have a poorly differentiated neuroendocrine phenotype, the advanced age is a strong
contributor to this evolution, as previously reported [80, 82].
In PNETs, the loss of either ATRX or DAXX has been correlated with the ALT
phenotype, as previously stated [38, 40-42]. In the context of ALT activation, telomere-
specific FISH allows the detection of ultrabright telomere FISH signals, which constitute
hallmarks of the pathway due to the unbalanced telomere length as a consequence of a
homologous recombination process. The optimization of a protocol of telomere-specific
FISH for FFPE tissues has been performed; the optimization also included the combination
of tel-FISH with immunofluorescence staining for insulin, in order to co-localize telomeres
in the nuclei of β-cells. We plan to combine the protocol of tel-FISH with immunostaining for
PML-bodies, searching for the presence of ALT-associated PML nuclear bodies, the so-
called APBs, and apply it to our tumor sample to investigate a possible activation of this

54
alternative mechanism of cell immortalization[73]. ALT positivity has been related to
aggressive clinical behavior, advanced disease and poor survival in human PNET patients
[38, 42]. In case the alternative lengthening of telomeres is found in this tumor subset, it will
be more evidence of an aggressive phenotype. Understanding the complexity of this model
requires also that all stages must be verified in order to not exclude pivotal steps that could
lead to misinformation.
Cre recombinase was found to be expressed specifically in the nucleus of pancreatic
β-cells, as expected (illustrated in figure 24). Magnuson and Osipovich reported the protein
to be expressed in more than 80% of these cells from a collection of data from different
studies [89]. We observed that despite some islets express this percentage or more, others
present a much lower percentage of Cre expression, a pattern that varies between islets of
the same animal. This variability needs now to be extrapolated to a higher number of
samples to fully understand the average of Cre expression in the population. By crossing
Rip-Cre+/- mice with mice that have loxP sites flanking exon 18 of ATRX, if Cre recombinase
is expressed in the offspring’s β-cells, it is expected to recognize these sites and excise the
exon, disrupting the gene. To confirm this disruption, the protein’s expression needed to be
characterized in the pancreatic tissue: as expected, control mice maintain the expression
of ATRX, as well as heterozygous mice, which is expected since the remaining wild-type
allele retains its original features and allows the production of the protein. Our next step will
involve the determination of the physical excision of the exon 18 of ATRX by cDNA (from
RNA) sequencing. Female homozygous mice (ATRXFLOX/FLOX) maintained their expression
of ATRX in pancreatic islets; however, the number of expressing cells is lower when
compared to control or heterozygous mice (as shown in figure 25). The RIP-Cre strain is
reported to achieve recombination in more than 85% of β-cells based on results from
several laboratories [102], which would mean a major loss of ATRX in the targeted cells.
However, as previously stated, with the excision of exon 18, an isoform of the protein
(ATRXt) may be produced [46-48]. The characterization of the protein’s loss needs to be
performed in a full extent in this study sample, for us to confirm the recombination efficiency
reported for the system, regarding the fact that if the protein is present in homozygous mice
it may be the expression of ATRX’s isoform without the SNF2 domain. Beyond that, the
easiest answer would be that the expression of ATRX in both heterozygous and
homozygous females is also probably due its production in other pancreatic islet cell types.
Thus, to ascertain if ATRX is being expressed in α-cells, for example, a double staining
immunohistochemistry/immunofluorescence protocol for ATRX and glucagon is warranted.

55
6. CONCLUSIONS AND FUTURE PERSPECTIVES
The ATRX conditional knockout mouse has proven to be a challenging animal
model.
The main unexpected histological finding was a prominent spontaneous
inflammation in both the exocrine and endocrine tissues, previously not found, or
unreported, either for the RIP-Cre strain or any mouse model of pancreatic neuroendocrine
tumorigenesis. The cause of these infiltrations and their cellular characterization will now
need to be further investigated. Islet hyperplasia was highly incident among the study
sample. RIP-Cre mice have been reported to develop enlarged islets that loose β-cell mass
which is not observed in the subjects of our study sample that maintain a strong expression
of insulin-producing cells throughout the hyperplasic islets, once more reflecting the
uniqueness of this model.
Approximately 12% of mice comprising the cohort developed pancreatic tumors.
The neoplasms were highly proliferative and lack immunohistochemistry staining for the
conventional neuroendocrine markers of differentiation. The hypothesis of a poorly
differentiated neuroendocrine phenotype will have to be tested using markers of
dedifferentiation. If the neuroendocrine origin is proven absent, a panel of markers must be
adopted to reach a final diagnosis for the original cell lineage. Additionally, to all these
findings, once a better understanding of the primary tumor is achieved we will be able to
focus on distant disease. It would be expectable that such a highly aggressive tumor would
have distant metastasis, which is found in our model. For a sake of simplicity, metastasis
were excluded from this initial evaluation. Tumours and metastasis will have to be
characterized regarding their ALT status given the reported association between ATRX loss
and ALT activation in human cancers.
Cre recombinase and ATRX expression need to be analysed in the total population
to provide the percentage of achieved recombination provided by the Cre-LoxP system.
Extensive exocrine and endocrine infiltrations, islet hyperplasia and pancreatic tumors were
observed in both controls and flox mice, without significant differences between groups.
Age appears as the key factor affecting the progression of these pathological findings. Since
the stratification by age demonstrated to present major differences, the animals will be
followed and euthanized in shorter and stipulated time periods, so that the hyperplasia
onset, possible dysplasia and consequent adenoma and PNET formation may be tracked
and all stages of pathogenesis are observed.

56
It is known that the creation of a new model of disease is labor intensive. Although
in theory the conditional knockout of ATRX in the β-cells seemed a breeze, in practical
terms, it was revealed that this model presents a high complexity. And these, as they may
seem complicating factors, or “bad news”, are indeed fascinating findings that confirm once
more that the tumorigenic initiation and/or progression is a multifactorial process in cancer.

57
7. REFERENCES
1. Longnecker, D.S., Anatomy and Histology of the Pancreas. Pancreapedia: The
Exocrine Pancreas Knowledge Base, 2014.
2. Kim, A., et al., Islet architecture: A comparative study. Islets, 2009. 1(2): p. 129-36.
3. Wieczorek, G., A. Pospischil, and E. Perentes, A comparative
immunohistochemical study of pancreatic islets inlaboratory animals (rats, dogs,
minipigs, nonhuman primates). Experimental and Toxicologic Pathology, 1998.
50(3): p. 151-172.
4. Steiner, D.J., et al., Pancreatic islet plasticity: interspecies comparison of islet
architecture and composition. Islets, 2010. 2(3): p. 135-145.
5. Asa, S.L., Pancreatic endocrine tumors. Mod Pathol, 2011. 24 Suppl 2: p. S66-77.
6. Niederle, M.B., et al., Gastroenteropancreatic neuroendocrine tumours: the current
incidence and staging based on the WHO and European Neuroendocrine Tumour
Society classification: an analysis based on prospectively collected parameters.
Endocr Relat Cancer, 2010. 17(4): p. 909-18.
7. Jensen, R.T., et al., ENETS Consensus Guidelines for the management of
patients with digestive neuroendocrine neoplasms: functional pancreatic endocrine
tumor syndromes. Neuroendocrinology, 2012. 95(2): p. 98-119.
8. Ehehalt, F., et al., Neuroendocrine tumors of the pancreas. The oncologist, 2009.
14(5): p. 456-467.
9. Ito, T., H. Igarashi, and R.T. Jensen, Pancreatic neuroendocrine tumors: clinical
features, diagnosis and medical treatment: advances. Best Pract Res Clin
Gastroenterol, 2012. 26(6): p. 737-53.
10. Mukherjee, J. and K. Lee, Classification of endocrine tumors of the pancreas.
Pancreatic Cancer, Cystic Neoplasms and Endocrine Tumors: Diagnosis and
Management, 2015: p. 283.
11. Reid, M.D., et al., Neuroendocrine tumors of the pancreas: current concepts and
controversies. Endocr Pathol, 2014. 25(1): p. 65-79.
12. Muniraj, T., et al., Pancreatic neuroendocrine tumors. Dis Mon, 2013. 59(1): p. 5-
19.
13. Chen, M., et al., Molecular pathology of pancreatic neuroendocrine tumors. J
Gastrointest Oncol, 2012. 3(3): p. 182-8.
14. Oberg, K., Pancreatic endocrine tumors. Semin Oncol, 2010. 37(6): p. 594-618.
15. Zhou, C., et al., Pancreatic neuroendocrine tumors: a comprehensive review. Int J
Cancer, 2012. 131(5): p. 1013-22.

58
16. Falconi, M., et al., ENETS Consensus Guidelines Update for the Management of
Patients with Functional Pancreatic Neuroendocrine Tumors and Non-Functional
Pancreatic Neuroendocrine Tumors. Neuroendocrinology, 2016. 103(2): p. 153-71.
17. Cloyd, J.M. and G.A. Poultsides, Non-functional neuroendocrine tumors of the
pancreas: Advances in diagnosis and management. World J Gastroenterol, 2015.
21(32): p. 9512-25.
18. Lee, L.C., et al., Small, nonfunctioning, asymptomatic pancreatic neuroendocrine
tumors (PNETs): role for nonoperative management. Surgery, 2012. 152(6): p.
965-74.
19. Ro, C., et al., Pancreatic neuroendocrine tumors: biology, diagnosis, and
treatment. Chinese journal of cancer, 2013. 32(6): p. 312.
20. Capelli, P., M. Fassan, and A. Scarpa, Pathology - grading and staging of GEP-
NETs. Best Pract Res Clin Gastroenterol, 2012. 26(6): p. 705-17.
21. V. Lloyd R., Y.O.R., Kloppel G., Rossi J., WHO Classification of Tumours of
Endocrine Organs. 4th Edition ed. 2017, Lyon International Agency for Research
on Cancer (IARC).
22. Scarpa, A., et al., Pancreatic endocrine tumors: improved TNM staging and
histopathological grading permit a clinically efficient prognostic stratification of
patients. Mod Pathol, 2010. 23(6): p. 824-33.
23. Rindi, G., et al., TNM staging of neoplasms of the endocrine pancreas: results
from a large international cohort study. J Natl Cancer Inst, 2012. 104(10): p. 764-
77.
24. Jensen, R.T., et al., Inherited pancreatic endocrine tumor syndromes: advances in
molecular pathogenesis, diagnosis, management, and controversies. Cancer,
2008. 113(7 Suppl): p. 1807-43.
25. Oberg, K., The genetics of neuroendocrine tumors. Semin Oncol, 2013. 40(1): p.
37-44.
26. Agarwal, S.K., et al., Menin molecular interactions: insights into normal functions
and tumorigenesis. Horm Metab Res, 2005. 37(6): p. 369-74.
27. Metz, D.C. and R.T. Jensen, Gastrointestinal neuroendocrine tumors: pancreatic
endocrine tumors. Gastroenterology, 2008. 135(5): p. 1469-92.
28. Kasajima, A., S. Yazdani, and H. Sasano, Pathology diagnosis of pancreatic
neuroendocrine tumors. J Hepatobiliary Pancreat Sci, 2015. 22(8): p. 586-93.
29. Gut, P., et al., Chromogranin A - unspecific neuroendocrine marker. Clinical utility
and potential diagnostic pitfalls. Arch Med Sci, 2016. 12(1): p. 1-9.

59
30. Nikou, G.C., et al., Chromogranin a levels in diagnosis, treatment and follow-up of
42 patients with non-functioning pancreatic endocrine tumours. Pancreatology,
2008. 8(4-5): p. 510-9.
31. Wiedenmann, B., et al., Synaptophysin: a marker protein for neuroendocrine cells
and neoplasms. Proceedings of the National Academy of Sciences, 1986. 83(10):
p. 3500-3504.
32. Strosberg, J.R., et al., Biology and treatment of metastatic gastrointestinal
neuroendocrine tumors. Gastrointest Cancer Res, 2008. 2(3): p. 113-125.
33. Corbo, V., et al., MEN1 in pancreatic endocrine tumors: analysis of gene and
protein status in 169 sporadic neoplasms reveals alterations in the vast majority of
cases. Endocr Relat Cancer, 2010. 17(3): p. 771-83.
34. Hessman, O., et al., Mutation of the multiple endocrine neoplasia type 1 gene in
nonfamilial, malignant tumors of the endocrine pancreas. Cancer research, 1998.
58(3): p. 377-379.
35. Scarpa, A., et al., Whole-genome landscape of pancreatic neuroendocrine
tumours. Nature, 2017. 543(7643): p. 65-71.
36. Jiao, Y., et al., DAXX/ATRX, MEN1, and mTOR pathway genes are frequently
altered in pancreatic neuroendocrine tumors. Science, 2011. 331(6021): p. 1199-
203.
37. Marinoni, I., et al., Loss of DAXX and ATRX are associated with chromosome
instability and reduced survival of patients with pancreatic neuroendocrine tumors.
Gastroenterology, 2014. 146(2): p. 453-460. e5.
38. Kim, J.Y., et al., Alternative Lengthening of Telomeres in Primary Pancreatic
Neuroendocrine Tumors Is Associated with Aggressive Clinical Behavior and Poor
Survival. Clinical Cancer Research, 2017. 23(6): p. 1598-1606.
39. Vogt, S., et al., Expanded extracolonic tumor spectrum in MUTYH-associated
polyposis. Gastroenterology, 2009. 137(6): p. 1976-85 e1-10.
40. de Wilde, R.F., et al., Loss of ATRX or DAXX expression and concomitant
acquisition of the alternative lengthening of telomeres phenotype are late events in
a small subset of MEN-1 syndrome pancreatic neuroendocrine tumors. Mod
Pathol, 2012. 25(7): p. 1033-9.
41. Heaphy, C.M., et al., Altered telomeres in tumors with ATRX and DAXX mutations.
Science, 2011. 333(6041): p. 425.
42. Singhi, A.D., et al., Alternative Lengthening of Telomeres and Loss of DAXX/ATRX
Expression Predicts Metastatic Disease and Poor Survival in Patients with
Pancreatic Neuroendocrine Tumors. Clinical Cancer Research, 2016.

60
43. Watson, L.A., H. Goldberg, and N.G. Bérubé, Emerging roles of ATRX in cancer.
2015.
44. Clynes, D., D.R. Higgs, and R.J. Gibbons, The chromatin remodeller ATRX: a
repeat offender in human disease. Trends Biochem Sci, 2013. 38(9): p. 461-6.
45. Law, M.J., et al., ATR-X syndrome protein targets tandem repeats and influences
allele-specific expression in a size-dependent manner. Cell, 2010. 143(3): p. 367-
78.
46. Garrick, D., et al., A conserved truncated isoform of the ATR-X syndrome protein
lacking the SWI/SNF-homology domain. Gene, 2004. 326: p. 23-34.
47. Berube, N.G., et al., The chromatin-remodeling protein ATRX is critical for
neuronal survival during corticogenesis. J Clin Invest, 2005. 115(2): p. 258-67.
48. Garrick, D., et al., Loss of Atrx affects trophoblast development and the pattern of
X-inactivation in extraembryonic tissues. PLoS Genet, 2006. 2(4): p. e58.
49. Wong, L.H., et al., ATRX interacts with H3.3 in maintaining telomere structural
integrity in pluripotent embryonic stem cells. Genome Res, 2010. 20(3): p. 351-60.
50. Leung, J.W., et al., Alpha thalassemia/mental retardation syndrome X-linked gene
product ATRX is required for proper replication restart and cellular resistance to
replication stress. J Biol Chem, 2013. 288(9): p. 6342-50.
51. Gibbons, R., Alpha thalassaemia-mental retardation, X linked. Orphanet J Rare
Dis, 2006. 1: p. 15.
52. Stevenson, R.E., Alpha-Thalassemia X-linked intellectual disability syndrome.
2014.
53. Amorim, J.P., et al., The Role of ATRX in the Alternative Lengthening of
Telomeres (ALT) Phenotype. Genes (Basel), 2016. 7(9).
54. Lewis, P.W., et al., Daxx is an H3.3-specific histone chaperone and cooperates
with ATRX in replication-independent chromatin assembly at telomeres.
Proceedings of the National Academy of Sciences, 2010. 107(32): p. 14075-
14080.
55. Salomoni, P. and A.F. Khelifi, Daxx: death or survival protein? Trends Cell Biol,
2006. 16(2): p. 97-104.
56. Elsaesser, S.J., A.D. Goldberg, and C.D. Allis, New functions for an old variant: no
substitute for histone H3.3. Curr Opin Genet Dev, 2010. 20(2): p. 110-7.
57. Szenker, E., D. Ray-Gallet, and G. Almouzni, The double face of the histone
variant H3.3. Cell Res, 2011. 21(3): p. 421-34.
58. Drane, P., et al., The death-associated protein DAXX is a novel histone chaperone
involved in the replication-independent deposition of H3.3. Genes Dev, 2010.
24(12): p. 1253-65.

61
59. Schwartz, B.E. and K. Ahmad, Transcriptional activation triggers deposition and
removal of the histone variant H3.3. Genes Dev, 2005. 19(7): p. 804-14.
60. Goldberg, A.D., et al., Distinct factors control histone variant H3.3 localization at
specific genomic regions. Cell, 2010. 140(5): p. 678-91.
61. Mito, Y., J.G. Henikoff, and S. Henikoff, Histone replacement marks the
boundaries of cis-regulatory domains. Science, 2007. 315(5817): p. 1408-1411.
62. Voon, H.P. and L.H. Wong, New players in heterochromatin silencing: histone
variant H3.3 and the ATRX/DAXX chaperone. Nucleic Acids Res, 2016. 44(4): p.
1496-501.
63. Cesare, A.J. and R.R. Reddel, Alternative lengthening of telomeres: models,
mechanisms and implications. Nat Rev Genet, 2010. 11(5): p. 319-30.
64. Hanahan, D. and R.A. Weinberg, Hallmarks of cancer: the next generation. Cell,
2011. 144(5): p. 646-74.
65. Clynes, D., et al., Suppression of the alternative lengthening of telomere pathway
by the chromatin remodelling factor ATRX. Nat Commun, 2015. 6: p. 7538.
66. Nabetani, A. and F. Ishikawa, Alternative lengthening of telomeres pathway:
recombination-mediated telomere maintenance mechanism in human cells. J
Biochem, 2011. 149(1): p. 5-14.
67. Bryan, T., et al., Telomere elongation in immortal human cells without detectable
telomerase activity. The EMBO journal, 1995. 14(17): p. 4240.
68. Ogino, H., et al., Release of telomeric DNA from chromosomes in immortal human
cells lacking telomerase activity. Biochemical and biophysical research
communications, 1998. 248(2): p. 223-227.
69. Bechter, O.E., et al., Telomeric recombination in mismatch repair deficient human
colon cancer cells after telomerase inhibition. Cancer research, 2004. 64(10): p.
3444-3451.
70. Yeager, T.R., et al., Telomerase-negative immortalized human cells contain a
novel type of promyelocytic leukemia (PML) body. Cancer research, 1999. 59(17):
p. 4175-4179.
71. Dilley, R.L., et al., Break-induced telomere synthesis underlies alternative telomere
maintenance. Nature, 2016.
72. Lovejoy, C.A., et al., Loss of ATRX, genome instability, and an altered DNA
damage response are hallmarks of the alternative lengthening of telomeres
pathway. PLoS Genet, 2012. 8(7): p. e1002772.
73. Vinagre, J., et al., TERT promoter mutations in pancreatic endocrine tumours are
rare and mainly found in tumours from patients with hereditary syndromes. Sci
Rep, 2016. 6: p. 29714.

62
74. Babu, V., N. Paul, and R. Yu, Animal models and cell lines of pancreatic
neuroendocrine tumors. Pancreas, 2013. 42(6): p. 912-923.
75. Hanahan, D., Heritable formation of pancreatic β-cell tumours in transgenic mice
expressing recombinant insulin/simian virus 40 oncogenes. Nature, 1985.
315(6015): p. 115-122.
76. Alliouachene, S., et al., Constitutively active Akt1 expression in mouse pancreas
requires S6 kinase 1 for insulinoma formation. The Journal of clinical investigation,
2008. 118(11): p. 3629.
77. Efrat, S., et al., Glucagon gene regulatory region directs oncoprotein expression to
neurons and pancreatic a cells. Neuron, 1988. 1(7): p. 605-613.
78. Lee, Y.C., S.L. Asa, and D.J. Drucker, Glucagon gene 5'-flanking sequences direct
expression of simian virus 40 large T antigen to the intestine, producing carcinoma
of the large bowel in transgenic mice. Journal of Biological Chemistry, 1992.
267(15): p. 10705-10708.
79. Crabtree, J.S., et al., A mouse model of multiple endocrine neoplasia, type 1,
develops multiple endocrine tumors. Proceedings of the National Academy of
Sciences, 2001. 98(3): p. 1118-1123.
80. Bertolino, P., et al., Heterozygous Men1 mutant mice develop a range of endocrine
tumors mimicking multiple endocrine neoplasia type 1. Mol Endocrinol, 2003.
17(9): p. 1880-92.
81. Crabtree, J.S., et al., Of Mice and MEN1: Insulinomas in a Conditional Mouse
Knockout. Molecular and Cellular Biology, 2003. 23(17): p. 6075-6085.
82. Bertolino, P., et al., Pancreatic β-cell-specific ablation of the multiple endocrine
neoplasia type 1 (MEN1) gene causes full penetrance of insulinoma development
in mice. Cancer research, 2003. 63(16): p. 4836-4841.
83. Biondi, C.A., et al., Conditional inactivation of the MEN1 gene leads to pancreatic
and pituitary tumorigenesis but does not affect normal development of these
tissues. Molecular and cellular biology, 2004. 24(8): p. 3125-3131.
84. Lu, J., et al., Alpha cell-specific Men1 ablation triggers the transdifferentiation of
glucagon-expressing cells and insulinoma development. Gastroenterology, 2010.
138(5): p. 1954-65.
85. Shen, H.C., et al., Multiple endocrine neoplasia type 1 deletion in pancreatic alpha-
cells leads to development of insulinomas in mice. Endocrinology, 2010. 151(8): p.
4024-30.
86. Shen, H.C., et al., Recapitulation of pancreatic neuroendocrine tumors in human
multiple endocrine neoplasia type I syndrome via Pdx1-directed inactivation of
Men1. Cancer Res, 2009. 69(5): p. 1858-66.

63
87. Sternberg, N. and D. Hamilton, Bacteriophage P1 site-specific recombination: I.
Recombination between loxP sites. Journal of molecular biology, 1981. 150(4): p.
467-486.
88. Deng, C.-X., The Use of Cre–loxP Technology and Inducible Systems to Generate
Mouse Models of Cancer. 2012: p. 17-36.
89. Magnuson, M.A. and A.B. Osipovich, Pancreas-specific Cre driver lines and
considerations for their prudent use. Cell Metab, 2013. 18(1): p. 9-20.
90. Sauer, B. and N. Henderson, Site-specific DNA recombination in mammalian cells
by the Cre recombinase of bacteriophage P1. Proceedings of the National
Academy of Sciences, 1988. 85(14): p. 5166-5170.
91. Ray, M.K., et al., Beta cell-specific ablation of target gene using Cre-loxP system
in transgenic mice. Journal of Surgical Research, 1999. 84(2): p. 199-203.
92. Smith, L., Good planning and serendipity: exploiting the Cre/Lox system in the
testis. Reproduction, 2011. 141(2): p. 151-161.
93. Lee, J.Y., et al., RIP-Cre revisited, evidence for impairments of pancreatic beta-cell
function. J Biol Chem, 2006. 281(5): p. 2649-53.
94. Carter, M. and J. Shieh, Visualizing nervous system function. Guide to Research
Techniques in Neuroscience, Elsevier Inc., Canada, 2010: p. 169-189.
95. Urban, A. and J. Rossier, 9 Genetic targeting of specific neuronal cell types in the
cerebral cortex. Progress in brain research, 2012. 196: p. 163.
96. Ray, M., et al., A mouse model for beta cell-specific ablation of target gene (s)
using the Cre-loxP system. Biochemical and biophysical research
communications, 1998. 253(1): p. 65-69.
97. Gannon, M., et al., Analysis of the Cre‐mediated recombination driven by rat
insulin promoter in embryonic and adult mouse pancreas. Genesis, 2000. 26(2): p.
139-142.
98. Fex, M., et al., Rat insulin promoter 2-Cre recombinase mice bred onto a pure
C57BL/6J background exhibit unaltered glucose tolerance. Journal of
Endocrinology, 2007. 194(3): p. 551-555.
99. Kulkarni, R.N., et al., Tissue-specific knockout of the insulin receptor in pancreatic
β cells creates an insulin secretory defect similar to that in type 2 diabetes. Cell,
1999. 96(3): p. 329-339.
100. Postic, C., et al., Dual roles for glucokinase in glucose homeostasis as determined
by liver and pancreatic β cell-specific gene knock-outs using Cre recombinase.
Journal of Biological Chemistry, 1999. 274(1): p. 305-315.
101. Magnuson, M.A. and A.B. Osipovich, Pancreas-specific Cre driver lines and
considerations for their prudent use. Cell metabolism, 2013. 18(1): p. 9-20.

64
102. Laboratory, T.J. MOUSE STRAIN DATASHEET - 003573. 2017 [cited 2017;
Available from: https://www.jax.org/strain/003573.
103. Laboratory, T.J. Mouse Genome Informatics 2017 [cited 2017; Atrxtm1Rjg].
Available from: http://www.informatics.jax.org/allele/MGI:3528480.
104. Cesare, A.J., C.M. Heaphy, and R.J. O'Sullivan, Visualization of Telomere Integrity
and Function In Vitro and In Vivo Using Immunofluorescence Techniques. Curr
Protoc Cytom, 2015. 73: p. 12 40 1-31.
105. Dembiński, A., et al., Effect of ischemic preconditioning on pancreatic regeneration
and pancreatic expression of vascular endothelial growth factor and platelet-
derived growth factor-A in ischemia/reperfusion-induced pancreatitis. Journal of
physiology and pharmacology: an official journal of the Polish Physiological
Society, 2006. 57(1): p. 39-58.
106. Papaccio, G., et al., Prevention of spontaneous autoimmune diabetes in NOD
mice by transferring in vitro antigen-pulsed syngeneic dendritic cells.
Endocrinology, 2000. 141(4): p. 1500-1505.
107. In't Veld, P., Insulitis in human type 1 diabetes: The quest for an elusive lesion.
Islets, 2011. 3(4): p. 131-138.
108. Campbell, I.L., et al., Islet inflammation and hyperplasia induced by the pancreatic
islet-specific overexpression of interleukin-6 in transgenic mice. The American
journal of pathology, 1994. 145(1): p. 157.
109. Pomplun, D., et al., Alterations of pancreatic beta-cell mass and islet number due
to Ins2-controlled expression of Cre recombinase: RIP-Cre revisited; part 2. Horm
Metab Res, 2007. 39(5): p. 336-40.
110. Chen, M., et al., Transgenic expression of human thymidylate synthase
accelerates the development of hyperplasia and tumors in the endocrine pancreas.
Vol. 26. 2007. 4817-24.
111. La Rosa S., S.F., Pancreatic Neuroendocrine Neoplasms: Pratical Approach to
Diagnosis, Classification and Therapy. 2015: Springer.
112. Bryson, G., et al., Detection of the CD56+/CD45− immunophenotype by flow
cytometry in neuroendocrine malignancies. Journal of clinical pathology, 2002.
55(7): p. 535-537.
113. Long, K.B., et al., PAX8 Expression in well-differentiated pancreatic endocrine
tumors: correlation with clinicopathologic features and comparison with
gastrointestinal and pulmonary carcinoid tumors. The American journal of surgical
pathology, 2010. 34(5): p. 723-729.
114. Sangoi, A.R., et al., PAX8 expression reliably distinguishes pancreatic well-
differentiated neuroendocrine tumors from ileal and pulmonary well-differentiated
65
neuroendocrine tumors and pancreatic acinar cell carcinoma. Mod Pathol, 2011.
24(3): p. 412-24.
115. Liau, J.-Y., et al., The diagnostic utility of PAX8 for neuroendocrine tumors: an
immunohistochemical reappraisal. Applied Immunohistochemistry & Molecular
Morphology, 2016. 24(1): p. 57-63.
116. Graham, R.P., et al., Islet-1 is a sensitive but not entirely specific marker for
pancreatic neuroendocrine neoplasms and their metastases. The American journal
of surgical pathology, 2013. 37(3): p. 399-405.
117. Park, J.Y., et al., Pdx1 expression in pancreatic precursor lesions and neoplasms.
Applied immunohistochemistry & molecular morphology: AIMM/official publication
of the Society for Applied Immunohistochemistry, 2011. 19(5): p. 444.
118. Hunter, K.E., et al., Identification and characterization of poorly differentiated
invasive carcinomas in a mouse model of pancreatic neuroendocrine
tumorigenesis. PLoS One, 2013. 8(5): p. e64472.
119. Perk, J., A. Iavarone, and R. Benezra, Id family of helix-loop-helix proteins in
cancer. Nature reviews. Cancer, 2005. 5(8): p. 603.
120. Hackeng, W.M., et al., Surgical and molecular pathology of pancreatic neoplasms.
Diagn Pathol, 2016. 11(1): p. 47.
121. Wong, H.H. and P. Chu, Immunohistochemical features of the gastrointestinal tract
tumors. J Gastrointest Oncol, 2012. 3(3): p. 262-84.
122. Pinkus, G.S. and P.J. Kurtin, Epithelial membrane antigen—a diagnostic
discriminant in surgical pathology: immunohistochemical profile in epithelial,
mesenchymal, and hematopoietic neoplasms using paraffin sections and
monoclonal antibodies. Human pathology, 1985. 16(9): p. 929-940.
123. Kurtin, P.J. and G.S. Pinkus, Leukocyte common antigen—a diagnostic
discriminant between hematopoietic and nonhematopoietic neoplasms in paraffin
sections using monoclonal antibodies: correlation with immunologic studies and
ultrastructural localization. Human pathology, 1985. 16(4): p. 353-365.

66

67
APPENDIX I
Figure 28. Ki-67 labeling index obtained with ImmunoRatio.

68
APPENDIX II
Figure 29. Endocrine fraction measurement using ImageJ, showing islet circumvention (A) and the color threshold tool that selects all pancreatic tissue excluding interlobular
areas (B).
A B
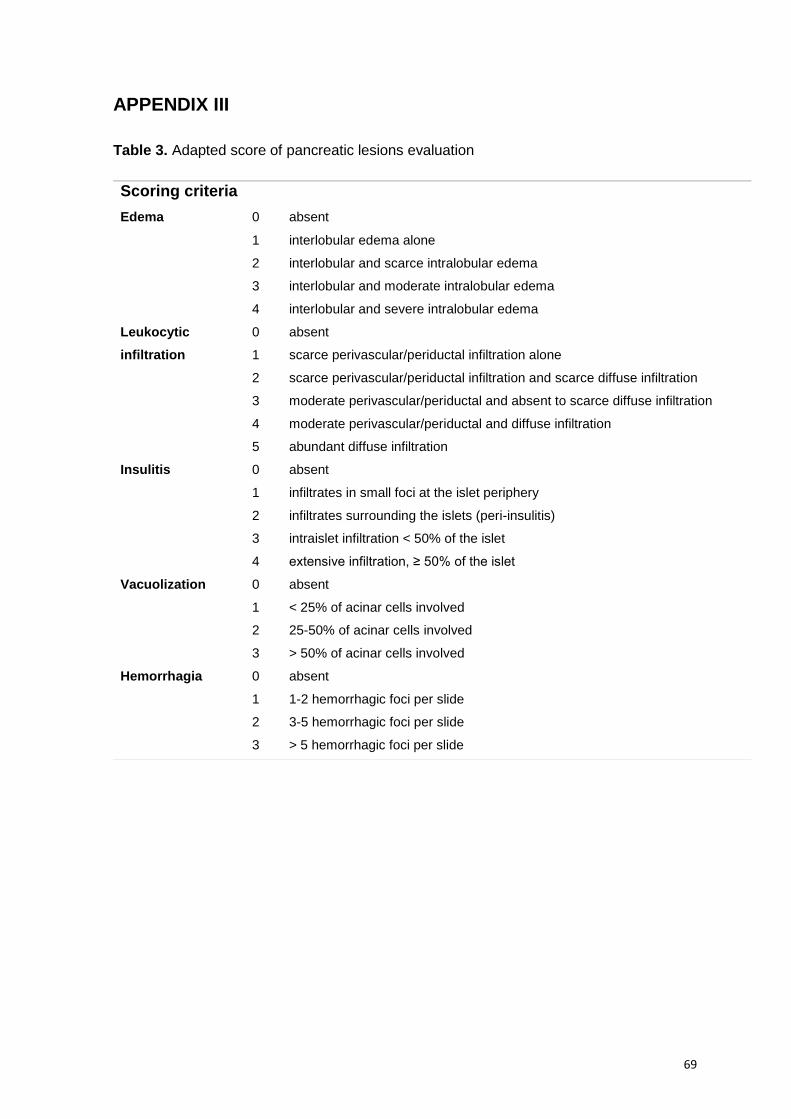
69
APPENDIX III
Table 3. Adapted score of pancreatic lesions evaluation
Scoring criteria
Edema 0 absent
1 interlobular edema alone
2 interlobular and scarce intralobular edema
3 interlobular and moderate intralobular edema
4 interlobular and severe intralobular edema
Leukocytic
infiltration
0 absent
1 scarce perivascular/periductal infiltration alone
2 scarce perivascular/periductal infiltration and scarce diffuse infiltration
3 moderate perivascular/periductal and absent to scarce diffuse infiltration
4 moderate perivascular/periductal and diffuse infiltration
5 abundant diffuse infiltration
Insulitis 0 absent
1 infiltrates in small foci at the islet periphery
2 infiltrates surrounding the islets (peri-insulitis)
3 intraislet infiltration < 50% of the islet
4 extensive infiltration, ≥ 50% of the islet
Vacuolization 0 absent
1 < 25% of acinar cells involved
2 25-50% of acinar cells involved
3 > 50% of acinar cells involved
Hemorrhagia 0 absent
1 1-2 hemorrhagic foci per slide
2 3-5 hemorrhagic foci per slide
3 > 5 hemorrhagic foci per slide

70
APPENDIX IV
Figure 30. Illustrative grading of edema (Scores 1 to 4).
Score 1 Score 2
Score 3 Score 4

71
APPENDIX V

72


![Panagiotis Tigas University of Oxford arXiv:1905.07444v2 [cs.CR] … · 2019-05-23 · as Ad Highlighter [61] are prone to DOM obfuscation attacks. They assume thatthe elements of](https://static.fdocuments.in/doc/165x107/5f4acb37cdd69703016a40d6/panagiotis-tigas-university-of-oxford-arxiv190507444v2-cscr-2019-05-23-as.jpg)


