On the thermal decomposition of acetaldehyde and...
36
234 On the Thermal Decomposition of Acetaldehyde and Ethylene Oxide By R. V. Seddon, B.Sc., and Professor M orris W. T ravers, F.R.S., Chemistry Department, The University, Bristol (. Received12 November, 1935 —Revised 24 March, 1936) 1— Introduction The object of this investigation was as follows. It had been observed in this laboratory that the thermal decomposition of acetaldehyde, and of a number of other organic compounds, was, over a wide range of experimental conditions, associated with phenomena which are generally assumed to be criteria of the operation of chain mechanism. The rate of chemical change at any moment seemed to be determined rather by antecedent conditions than by conditions obtaining at the moment. It did not diminish with time during the earlier stages, as the classical theory of chemical reaction demands, and the rate graphs showed dis- continuities. Further, the reactions proceeded more slowly in packed than in empty vessels. The processes referred to differed only from those which are considered to be definitely influenced by the operation of chain mechanism, such as the oxides of chlorine, in that in the latter case the total energy change in the processes taking place between the formation of a primary centre, in accordance with the Maxwell-Boltzmann principle, and the completion of reaction, represented by the quantity (E + Q), is relatively large, while for such compounds as acetaldehyde it is relatively small. However, the dispersal of this energy must ultimately be by collision. In any process represented by 2A # A'A' -* B, dispersal of the energy, or part of it, in the second stage, by collision with a molecule of A will increase the probability of the formation of a new primary centre. Where (E + Q) is large and the molecule is simple, the probability is large, and where (E + Q) is small and the molecule large, the probability is small. However, it is never zero. Something more seemed to be wanted to bring cases such as that of acetaldehyde into line with compounds such as the oxides of chlorine, but the idea furnished a basis for an attack on the problem. It seemed to be possible to test this view of the case by studying the on May 6, 2018 http://rspa.royalsocietypublishing.org/ Downloaded from
Transcript of On the thermal decomposition of acetaldehyde and...

234
On the Thermal Decomposition of Acetaldehyde and Ethylene Oxide
By R. V. Seddon, B.Sc., and Professor Morris W. Travers, F.R.S., Chemistry Department, The University, Bristol
(. Received 12 November, 1935—Revised 24 March, 1936)
1—Introduction
The object of this investigation was as follows. It had been observed in this laboratory that the thermal decomposition of acetaldehyde, and of a number of other organic compounds, was, over a wide range of experimental conditions, associated with phenomena which are generally assumed to be criteria of the operation of chain mechanism. The rate of chemical change at any moment seemed to be determined rather by antecedent conditions than by conditions obtaining at the moment. It did not diminish with time during the earlier stages, as the classical theory of chemical reaction demands, and the rate graphs showed discontinuities. Further, the reactions proceeded more slowly in packed than in empty vessels. The processes referred to differed only from those which are considered to be definitely influenced by the operation of chain mechanism, such as the oxides of chlorine, in that in the latter case the total energy change in the processes taking place between the formation of a primary centre, in accordance with the Maxwell-Boltzmann principle, and the completion of reaction, represented by the quantity (E + Q), is relatively large, while for such compounds as acetaldehyde it is relatively small. However, the dispersal of this energy must ultimately be by collision. In any process represented by
2A # A'A' -* B,
dispersal of the energy, or part of it, in the second stage, by collision with a molecule of A will increase the probability of the formation of a new primary centre. Where (E + Q) is large and the molecule is simple, the probability is large, and where (E + Q) is small and the molecule large, the probability is small. However, it is never zero. Something more seemed to be wanted to bring cases such as that of acetaldehyde into line with compounds such as the oxides of chlorine, but the idea furnished a basis for an attack on the problem.
It seemed to be possible to test this view of the case by studying the
on May 6, 2018http://rspa.royalsocietypublishing.org/Downloaded from

The Thermal Decomposition o f Acetaldehyde 235
thermal decomposition of acetaldehyde, and ethylene oxide, both of which decompose mainly in accordance with the equation
. c 2h 4o = c h 4 + CO,
the rates of decomposition being closely comparable at 400°, so that the neighbourhood of this temperature was selected for the investigation. The thermal decomposition of ethylene oxide has been studied by Heikert and Mack,* using the pressure difference method. According to Parks and Huffman,! the free energy of chemical change (AF) accompanying the thermal decomposition of gaseous acetaldehyde to CH4 and CO at 400° is —19-6 k. cals. No definite data are available for ethylene oxide, but the total heat change (AH) in the process,
(CH2)20 -> CH3CHO,
derived from the heats of combustion of the two compounds is —30-7 k.cals. Since the thermal properties of the two compounds are very similar, the free energy of decomposition of ethylene oxide at 400° cannot be very far from —50 k. cals. It was therefore expected that the decomposition of acetaldehyde would proceed in a manner more closely in accord with the classical theory than would ethylene oxide; or if departure from the classical theory was observed, and could be accounted for by means of the chain theory, it would be the more marked for ethylene oxide.
The first set of experiments, carried out at about 400° C, certainly confirmed the view that there was a very strong resemblance between the processes involved in the decomposition of acetaldehyde and of ethylene oxide, and that the phenomena accompanying thermal decomposition closely resembled those observed for compounds in which the chemical change is accompanied by a considerable energy change. In both cases the velocity of decomposition increased at first with time, over the initial period, and the rate at any moment seemed to be determined rather by pre-existing conditions than by the conditions obtaining at that moment. As had been anticipated, the phenomena were more marked for ethylene oxide, the graphs exhibiting for this substance what may be termed an induction period. Marked breaks occurred in the reaction graphs in both cases (see figs. 3-7). The rate of reaction, that is the rate of formation of methane, which we considered to represent the rate of the main reaction, was retarded by packing the tube for acetaldehyde, but not for ethylene oxide.
* ‘ J. Amer. Chem. Soc.,’ vol. 51 p. 2706 (1929).t “ Free Energies of Organic Compounds ” (1932).
on May 6, 2018http://rspa.royalsocietypublishing.org/Downloaded from

236 R. V. Seddon and M. W. Travers
We had found that in each case two reactions seemed to operate. Both compounds, in empty tubes, decomposed mainly into carbon monoxide and methane; but there was with each what appeared to be a secondary reaction, which, for acetaldehyde, led to the formation of propylene, carbon monoxide, and water, and for ethylene oxide to ethylene, carbon monoxide, and hydrogen. We assumed that these were entirely different chemical processes. However, we observed that, with acetaldehyde, on packing the tube, the rate of formation of the main reaction diminished, while the rate of the secondary reaction increased. As an explanation we suggested that the main reaction was retarded by the destruction of primary centres at the walls of the vessel, and that the energy was not dispersed, but used in the formation of secondary or degenerate centres, from which the secondary reaction originated.
However, at this stage, in order to determine the cause of the apparent discrepancies between our results and those of Hinshelwood and his coworkers, whose experiments with acetaldehyde covered a range of temperature from 430° to 600° C, one of us (M. W. T.) carried out a further series of experiments with acetylene at 500°, with particular attention to the nature of the so-called secondary process, and the effect of packing the reaction tube. While these experiments led to the conclusion that propylene was formed at the higher, as at the lower temperature, a new and very important fact was observed. It was found that if experiments were carried out with an empty tube and with a packed tube, at the same temperature and initial concentration of acetaldehyde, the rate of decomposition of the acetaldehyde, calculated as the sum of the rates of the two processes, was the same, whether the process involving the formation of methane and carbon monoxide predominated over that resulting in the formation of propylene, carbon monoxide, and water, or vice versa. This discovery at once accounted for the apparent negative catalytic effect produced either by increasing the surface or restricting the dimensions of the reaction space, and removed a difficulty arising out of the fact that there were obvious objections to an explanation involving the assumption that the active nuclei in the gas, at upwards of an atmosphere pressure, could reach the walls of the vessels in very large numbers. The two processes must be initiated by the formation of one kind of primary nucleus, which passes through the transition state, and arrives at a state from which the probability of return, through the transition state to acetaldehyde, is very small. On the other hand, while the intermediate product is not a chemical compound, it has a life long enough to permit of a considerable proportion of the particles travelling to the surface, without undergoing change while still in the gaseous state. Such tran-
on May 6, 2018http://rspa.royalsocietypublishing.org/Downloaded from
The Thermal Decomposition Acetaldehyde 237
sition products are visualized by Semenoff, and their existence is required to account for many of the processes which he discusses. These changes involve the transformation of the energy (E + Q), and do not involve further activation of the intermediates, by collision, or otherwise. However, while it may now appear that one of the criteria of chain mechanism has been eliminated, other facts have been observed which show how closely reactions such as those which we are studying resemble such processes as the decomposition of chlorine monoxide and the oxidation of hydrocarbons.
2— Preparation of the Compounds
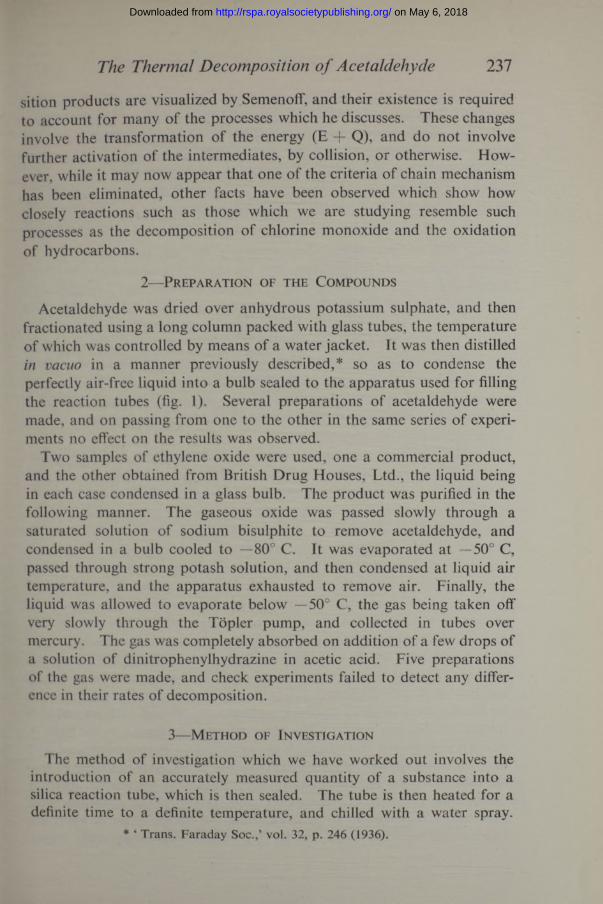
Acetaldehyde was dried over anhydrous potassium sulphate, and then fractionated using a long column packed with glass tubes, the temperature of which was controlled by means of a water jacket. It was then distilled in vacuo in a manner previously described,* so as to condense the perfectly air-free liquid into a bulb sealed to the apparatus used for filling the reaction tubes (fig. 1). Several preparations of acetaldehyde were made, and on passing from one to the other in the same series of experiments no effect on the results was observed.
Two samples of ethylene oxide were used, one a commercial product, and the other obtained from British Drug Houses, Ltd., the liquid being in each case condensed in a glass bulb. The product was purified in the following manner. The gaseous oxide was passed slowly through a saturated solution of sodium bisulphite to remove acetaldehyde, and condensed in a bulb cooled to —80° C. It was evaporated at —50° C, passed through strong potash solution, and then condensed at liquid air temperature, and the apparatus exhausted to remove air. Finally, the liquid was allowed to evaporate below —50° C, the gas being taken off very slowly through the Topler pump, and collected in tubes over mercury. The gas was completely absorbed on addition of a few drops of a solution of dinitrophenylhydrazine in acetic acid. Five preparations of the gas were made, and check experiments failed to detect any difference in their rates of decomposition.
3— Method of Investigation
The method of investigation which we have worked out involves the introduction of an accurately measured quantity of a substance into a silica reaction tube, which is then sealed. The tube is then heated for a definite time to a definite temperature, and chilled with a water spray.
* ‘ Trans. Faraday Soc.,’ vol. 32, p. 246 (1936).
on May 6, 2018http://rspa.royalsocietypublishing.org/Downloaded from

The contents are then analysed completely. A weak point in the method may be connected with the method of heating the reaction tubes, which may introduce an error due to the delay in establishing thermal equilibrium. Our practice is to raise the temperature of the furnace, which consists of a cylinder of heat-resisting steel, pierced with holes for the reception of the tubes, and heated electrically, to a temperature just so much above the reaction temperature that the temperature of the whole mass falls to the reaction temperature within a few seconds after introducing the reaction tube. Any tendency for the temperature to rise above the reaction temperature can be checked immediately by introducing a cold iron rod into a hole in the steel cylinder, and a tendency for the temperature to fall can be corrected by means of a heating coil filling a hole through the axis of the block. By hand adjustment the temperature of the reaction tube can be kept very close to the reaction temperature. However, using plain silica tubes the shortest period of reaction was, except in experiments at 500° C, rarely less than 10 and usually not less than 15 minutes; but in such experiments, even when the rate of a process was represented by a practically linear graph, no error due to temperature lag was observed.
For the series of experiments between 360° and 420° C an apparatus was used by means of which the pure air-free acetaldehyde from a bulb in which it was condensed was admitted to a space which could be sealed at the entry and exit by raising and lowering the mercury in U-tubes, which served as stopcocks. The volume, and temperature, and the pressure of the aldehyde vapour after raising the mercury being determined, its mass was known from the measurements, combined with actual determinations of the volume of carbon dioxide obtained by the complete combustion of measured quantities of the vapour. The measured volume of vapour, which could be the same or different as was desired, was then allowed to condense in the exhausted silica reaction tube, cooled with liquid air, which was then sealed. The method was somewhat cumbersome, and for the experiments at 500° C an apparatus was used which is shown diagrammatically in fig. 1. It was found that there was no disadvantage in using stopcocks, which were greased with an ordinary rubber-vaseline tap grease. The aldehyde was condensed in the bulb A, which was kept in a thermos flask containing ice. It communicated with the measuring vessel C through the stopcock B. C was arranged so that its volume could be adjusted by admitting or withdrawing mercury through the stopcock D. Between C and the rest of the apparatus were two stopcocks, E and F, so as to minimize the chance of air or hydrogen leaking into C. The stopcocks B, E, F, and G were diagonally bored,
238 R. V. Seddon and M. W. Travers
on May 6, 2018http://rspa.royalsocietypublishing.org/Downloaded from

and were sealed above and below with mercury. The reaction tube was connected at H, and the apparatus for exhausting and introducing hydrogen, which has been described elsewhere,* is connected on the right-hand side of G. In these experiments, space between the stopcocks B and E and the vessel C were enclosed in a cardboard casing, for as the temperature of the laboratory was always very close to 20° C, the temperature correction was small. In other experiments this part of the apparatus was immersed in a water bath.
The Thermal Decomposition o f Acetaldehyde 239
JMercury seal Nickel foil — Cork and\__
\ Shellac j
M ercury
Aldehyde
Fig. 1.
The silica reaction tube was connected with the apparatus, exhausted, filled with hydrogen, and heated by means of a portable electric furnace overnight to 600° C. In the morning the tube was exhausted, cooled with liquid oxygen, and filled with the reagent. Three minutes were allowed for equilibrium to be established after opening the stopcock B, which was then closed, and the stopcock E was allowed to remain open for half a minute, while the acetaldehyde condensed in the reaction tube.
It was very important to observe the pre-treatment routine so as to remove oxygen from the walls of the reaction tube. In the early stages of our work, we found that the rate of formation of methane, for any
* ‘ Proc. Roy. Soc.,’ A, vol. 135, p. 3, fig. 2 (1932).
on May 6, 2018http://rspa.royalsocietypublishing.org/Downloaded from
240 R. V. Seddon and M. W. Travers
stated conditions, depended on the manner of pre-treating the tubes, and this was an additional reason for observing the routine.
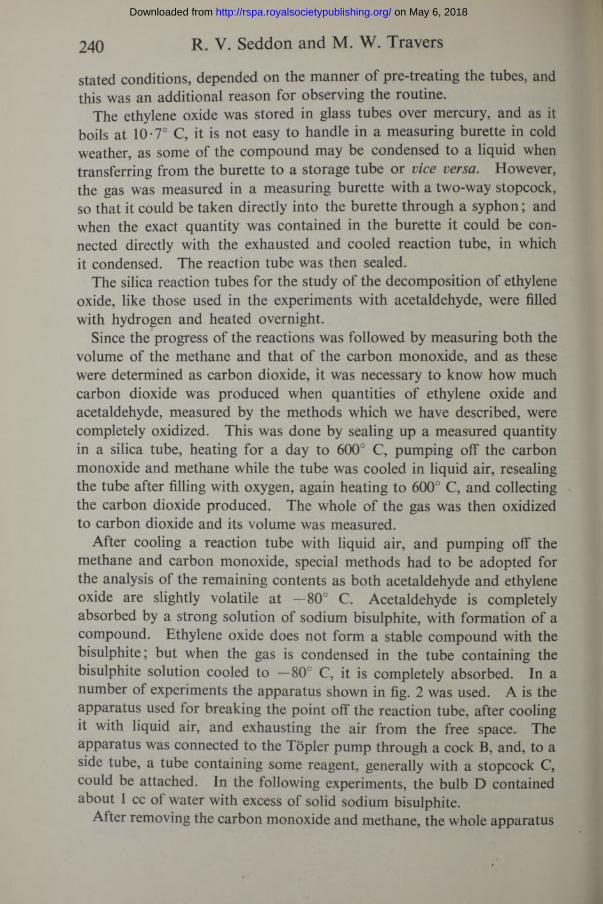
The ethylene oxide was stored in glass tubes over mercury, and as it boils at 10-7° C, it is not easy to handle in a measuring burette in cold weather, as some of the compound may be condensed to a liquid when transferring from the burette to a storage tube or vice versa. However, the gas was measured in a measuring burette with a two-way stopcock, so that it could be taken directly into the burette through a syphon; and when the exact quantity was contained in the burette it could be connected directly with the exhausted and cooled reaction tube, in which it condensed. The reaction tube was then sealed.
The silica reaction tubes for the study of the decomposition of ethylene oxide, like those used in the experiments with acetaldehyde, were filled with hydrogen and heated overnight.
Since the progress of the reactions was followed by measuring both the volume of the methane and that of the carbon monoxide, and as these were determined as carbon dioxide, it was necessary to know how much carbon dioxide was produced when quantities of ethylene oxide and acetaldehyde, measured by the methods which we have described, were completely oxidized. This was done by sealing up a measured quantity in a silica tube, heating for a day to 600° C, pumping off the carbon monoxide and methane while the tube was cooled in liquid air, resealing the tube after filling with oxygen, again heating to 600° C, and collecting the carbon dioxide produced. The whole of the gas was then oxidized to carbon dioxide and its volume was measured.
After cooling a reaction tube with liquid air, and pumping off the methane and carbon monoxide, special methods had to be adopted for the analysis of the remaining contents as both acetaldehyde and ethylene oxide are slightly volatile at —80° C. Acetaldehyde is completely absorbed by a strong solution of sodium bisulphite, with formation of a compound. Ethylene oxide does not form a stable compound with the bisulphite; but when the gas is condensed in the tube containing the bisulphite solution cooled to —80° C, it is completely absorbed. In a number of experiments the apparatus shown in fig. 2 was used. A is the apparatus used for breaking the point off the reaction tube, after cooling it with liquid air, and exhausting the air from the free space. The apparatus was connected to the Topler pump through a cock B, and, to a side tube, a tube containing some reagent, generally with a stopcock C, could be attached. In the following experiments, the bulb D contained about 1 cc of water with excess of solid sodium bisulphite.
After removing the carbon monoxide and methane, the whole apparatus
on May 6, 2018http://rspa.royalsocietypublishing.org/Downloaded from

The Thermal Decomposition of Acetaldehyde 241
being exhausted, the cock B was closed, the cock C opened, the bulb D cooled with liquid air, and the reaction tube was then allowed to heat up to air temperature, when any volatile products condensed in D. The cock C was then closed, and the bulb allowed to heat up to air temperature, when residual ethylene oxide or acetaldehyde combined with the bi-
Fig. 2.
sulphite, or dissolved in the water. The bulb was then cooled to —80° C, and the gases, if any, were pumped off and collected.
4— The N ature of the Chemical Changes which Take Place when A cetaldehyde and Ethylene Oxide are D ecomposed
The main product, when the reaction tube is not packed, is generally a mixture of carbon monoxide and methane, the former being always in
on May 6, 2018http://rspa.royalsocietypublishing.org/Downloaded from

242 R. V. Seddon and M. W. Travers
slight excess of the latter. As has already been stated, we completed a considerable proportion of the experimental work assuming that the formation of carbon monoxide and methane represented in each case a process, indicated by the equation,
C2H40 -* CO + CH4, (a)
which was quite distinct from the secondary process, or processes, which take place in either case. That view seems to be no longer tenable.
For acetaldehyde, it appears that part of the compound also undergoes change, in accordance with the equations,
2C2H40 -> CH2: CH . CH2 . CHO + HaO» CH2: CH . CH3 + CO + HaO. (b)
The quantity of methane formed is a measure of the rate of the first process (a), and the difference (CO — CH4) is a measure of the second process (b). Some of the propylene is condensed to higher hydrocarbons, and, as was anticipated from the results of work on the ethane-ethylene- hydrogen system,* more condensation takes place than when the hydrocarbon propylene is itself heated. Also, hydrogen is liberated in the condensation process, but most of it is taken up by the propylene, with formation of propane.
The quantity 3(CO — CH4) in gram atoms carbon per litre is equal to the quantity (propylene + condensation products) in the same units, and the quantity 4(CO — CH4) is equal to the corresponding quantity of acetaldehyde involved. The quantity of acetaldehyde involved in the two processes in gram atoms of carbon per litre is given by,
2CH4 + 4(CO - CH4) = 4CO - 2CH4in the same units.
No free hydrogen could be detected in the gas at 400° C, and only small quantities at 500° C. It does not seem likely, therefore, that ketene, CH2:CO, is an intermediate in these reactions. The question of the enol-keto change will be dealt with later.
With ethylene oxide we have only been able to detect ethane, ethylene, hydrogen, and a little acetaldehyde as products of side reactions. The reaction which results in the formation of ethylene, as a secondary product, and of ethane as a tertiary product, and which appears to take place in the gas phase, may probably be represented by the equation,
2CaH40 = 2CO + 2H2 + C2H4.* ‘ Trans. Faraday Soc.,’ vol. 32, p. 236 (1936).
on May 6, 2018http://rspa.royalsocietypublishing.org/Downloaded from

The Thermal Decomposition o f Acetaldehyde 243
From analogy with the behaviour of acetaldehyde, it may be assumed that here again we have a single primary process yielding two sets of products, and that the total amount of ethylene oxide decomposed in any time interval is given by the sum (CO + CH4) in the same units.
It is possible that dioxan is a product of a side reaction, but, as the following experiment shows, only to a small extent. A quantity of ethylene oxide, equivalent to 0-03134 gram atoms of carbon per litre, was heated for 1 hour at 400° C. The gases were removed in the usual manner, using an apparatus, similar to that shown in fig. 2, in which two tubes, E and F, replaced the tube D. The ethylene oxide was allowed to evaporate into a tube E, which contained chromic acid, and was cooled with liquid air, while the reaction tube was maintained at —50° C. The tube E was then sealed. The reaction tube was then heated to air temperature, and the contents allowed to evaporate into a second similar tube F, which was also sealed. The two tubes were then heated to oxidize the contents, and the carbon dioxide in them was determined. The result of the experiment is given in Table I.
T able I
Ethylene oxide takenCH4 ............................CO ............................C 0 2 from tube D ..
Unaccounted for
gm atoms C
0-03134 0-00251 0-00300 0-02533 0-00025 0-00025
The amount of high-boiling product, which is very small, is probably condensate from the ethylene.
When considering the mechanism of the decomposition of acetaldehyde and ethylene oxide, we had to enquire into the validity of a statement which occurs in a paper by Bone, Haffner, and Ranee.* They state that in the process of oxidizing ethylene there is formed “ vinyl alcohol, any accumulation of which in the medium is immediately transformed into an equilibrium mixture of the isomers, in proportions dependent upon temperature and pressure. In experiments at 300°, and at atmospheric pressure, such equilibrium ratios were approximately 4 vinyl alcohol, 10 ethylene oxide, and 1 acetaldehyde” . Thermodynamic considerations suggest that if equilibrium exists between ethylene oxide and acetaldehyde at 400° C, the concentration of the former, under the con-
* ‘ Proc. Roy. Soc.,’ A, vol. 143, p. 10 (1933).
on May 6, 2018http://rspa.royalsocietypublishing.org/Downloaded from

ditions of our experiments must be very small. We will deal with this point first.
A method based upon the Schiff reaction was used. In the first place a measured quantity of aldehyde vapour was condensed in a glass tube replacing the reaction tube in fig. 1, containing about 30 cc of water, and was cooled with liquid air. The tube was sealed, warmed to melt the ice, and thoroughly shaken. The liquid was then transferred to a flask already containing 3 cc of a saturated solution of sodium bisulphite and 2 or 3 drops of a 0 -2% solution of phenol phthalein, which had been decolorized by addition of a saturated solution of sulphur dioxide. On addition of the solution of aldehyde the pink colour was restored, and after cooling to near the ice point, the solution was titrated with standard sulphuric acid, the almost complete disappearance of the pink colour indicating the end point, which was not, however, very sharp. In Table II, series I, the figures in column e are the quantities of sulphuric acid which should have been added, if the compound (NaHS03 . C2H40) had been formed. The quantities in column / are the quantities of acid actually used; and the quantities in column h are obtained from the formula, h = fx e/b. Column g is the theoretical quantity of acid required.
Table II—Temperature 400° T ube N .T . 1
244 R. V. Seddon and M. W. Travers
a b c d e / g hTime Initial CO c h 4 Final ■ -A
minutes c 2h 4o • c 2h 4o Standard H 2S 0 4 solution
Series I0 0-04183 0-00 0 0 0 004183 11-75 13-14 11-75
0-04215 0-00514 0 00471 0-03598 10-10 — 9-80
Series II0 0-04195 0-00 0 00 0-04195 11-51 12-28 11-51
15 0-04226 0-00129 0-00120 0-04088 10-12 — 11-1430 0-04225 0-00531 0-00405 0-03565 10-00 — 9-7250 0-04230 0-00779 0-00654 0-03326 9-10 — 9-0660 0-04249 0-00882 0-00713 0-03188 9-00 — 8-64
Quantities of acetaldehyde were now heated for varying periods, and at the end of each experiment the contents of the reaction tube were distilled into a tube containing water, using the apparatus shown in fig. 2, and analysed in the manner described. The figures in column f (series II) are now the actual experimental results obtained by titration, and those in column h the values arrived at by calculation. It appears that,
on May 6, 2018http://rspa.royalsocietypublishing.org/Downloaded from
The Thermal Decomposition o f Acetaldehyde 245
within the limits of experimental error, the acetaldehyde which is not decomposed into the gaseous products remains as acetaldehyde.
Similar experiments carried out with ethylene oxide showed that the compound which had not been heated did not restore the pink colour to the saturated bisulphite solution containing phenol phthalein, which had been neutralized with sulphurous acid. The residue after heating did, however, contain a very small quantity of a substance reacting similarly to acetaldehyde, certainly not more than 2%.
The problem of the keto-enol change has been the subject of a large number of investigations, and its nature is still uncertain. However, it is clear that though the process may be represented by the equation
—CO . CH2— = —C(OH): CH—,
the enol form does not contain an alcoholic hydroxyl group,* but certainly contains a —C : C— bond.
In a footnote to the paper by Bone, Haffner, and Ranee ( cit.), reference is made to the determination of vinyl alcohol, and we are informed that the method used is that of Poleck and Thiimmel.t These authors give the following description of the method. 4-5 volumes of a saturated solution of potassium bicarbonate are mixed with 1 volume of a saturated solution of mercuric chloride, and the solution is shaken with an ethereal solution containing vinyl alcohol, such as commercial ether, for 2 minutes, when a white precipitate is formed. The water fraction is then removed and boiled, when the white precipitate turns yellow. This was found to happen as described, and when the ether was again treated with the mercury solution no precipitate formed. In this way ether can be freed from the substance which gives this reaction, and this can also be effected by shaking the ether with potash solution (P. and T.). It is necessary to allow the solution to stand for a few hours before the precipitation of the mercury compound is complete. This suggests the possibility of the completion of the process involving keto-enol conversion.
Two samples of acetaldehyde vapour were measured out in the usual way, and one was condensed directly into a tube containing 10 cc of purified ether, while the other was heated in a silica reaction tube for half an hour to 400° before transferring to a tube containing pure ether. Both quantities of ether were transferred to flasks containing the mercury solution, the mixtures were thoroughly shaken and allowed to stand over
* Sidgwick, ‘ J. Chem. Soc.,’ vol. 127, p. 907 (1925); Venkatiswaran and Bhagavan- tam, ‘ Ind. J. Phys.,’ vol. 5, p. 129 (1930); Bawn, ‘ J. Chem. Soc.,’ p. 1189 (1932).
t ‘ Ber. deuts. chem. Ges.,’ vol. 11, p. 2863 (1889).
on May 6, 2018http://rspa.royalsocietypublishing.org/Downloaded from

246 R. V. Seddon and M. W. Travers
night. In both cases, contrary to the statement of Poleck and Thummel, a white precipitate was formed. A sample of aldehyde vapour dissolved in water gave the same result. However, i f a considerable quantity o f aldehyde, about 1 cc, was shaken up with the mercury solution, no precipitate was formed. All these experiments were repeated, and carefully checked.
There is certainly some evidence to the effect that only compounds which can assume an enol form give the mercury reaction; and on general grounds, considering the easy reversibility of the keto-enol change, one would not select such a process for the estimation of the enol content of a mixture, but rather one coming very quickly to an end. It seems clear that the method cannot be used as means of estimating the enol form of acetaldehyde, vinyl alcohol, but it seems reasonably certain that the enol form exists, and may play an important part in the processes which we are considering.
Several attempts were made to estimate the acetaldehyde (or vinyl alcohol) content of a sample of the gas by the mercury oxide method, gravimetrically. However, it is not to be expected that a compound supposed to have the formula, C2H40 , HgaO, HgCl2, would be precipitated pure. The result was always 10 to 15% too high.
Gaseous ethylene oxide dissolved in ether or in water does not give a precipitate with the mercury solution. However, when the ethylene oxide has been heated it certainly contains a very small quantity of a compound which gives a positive result with the mercury test and also with Schiff’s reagent. In an experiment at 400° C, with an initial concentration of 0 -04220 gram mols per litre of ethylene oxide, the quantities of acetaldehyde (or vinyl alcohol) shown in Table III were detected by determining the quantity of mercury precipitated.
T able IIITime, minutes . . . . 30 40£ 57 65Aldehyde................... 0 00090 0 00095 0 00028 0 00062
The maximum quantity of acetaldehyde found was of the order of 2% of the ethylene oxide taken. This confirms the result obtained by the Schiff method. From these experiments it appears that acetaldehyde cannot be a product of the thermal decomposition of ethylene oxide. Acetaldehyde is formed in small quantity by the thermal decomposition of ethylene oxide. The important question as to whether acetaldehyde exists in the enol or keto form remains unanswered.
on May 6, 2018http://rspa.royalsocietypublishing.org/Downloaded from
5—the R ates of D ecomposition of A cetaldehyde and EthyleneOxide
While we were under the impression that the formation of methane and carbon monoxide represented in each case a definite process, we were much troubled by the fact that it was difficult to obtain consistent results for the rate of decomposition of acetaldehyde. It was only possible to do so by using a single reaction tube for a whole series of experiments, and pretreating it in exactly the same way before each experiment.
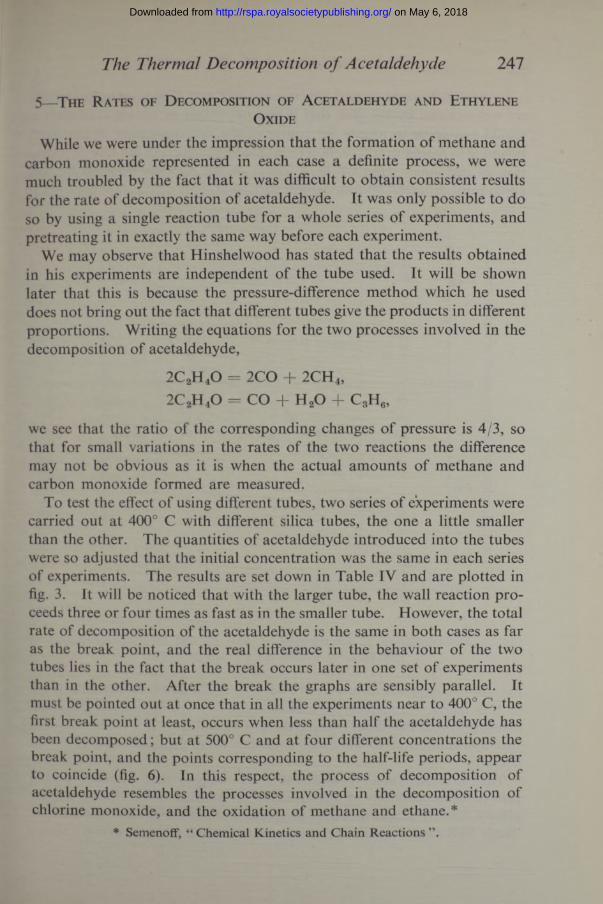
We may observe that Hinshelwood has stated that the results obtained in his experiments are independent of the tube used. It will be shown later that this is because the pressure-difference method which he used does not bring out the fact that different tubes give the products in different proportions. Writing the equations for the two processes involved in the decomposition of acetaldehyde,
2C2H 40 = 2CO + 2CH4,2C2H 40 = CO + H 20 + C3H6,
we see that the ratio of the corresponding changes of pressure is 4/3, so that for small variations in the rates of the two reactions the difference may not be obvious as it is when the actual amounts of methane and carbon monoxide formed are measured.
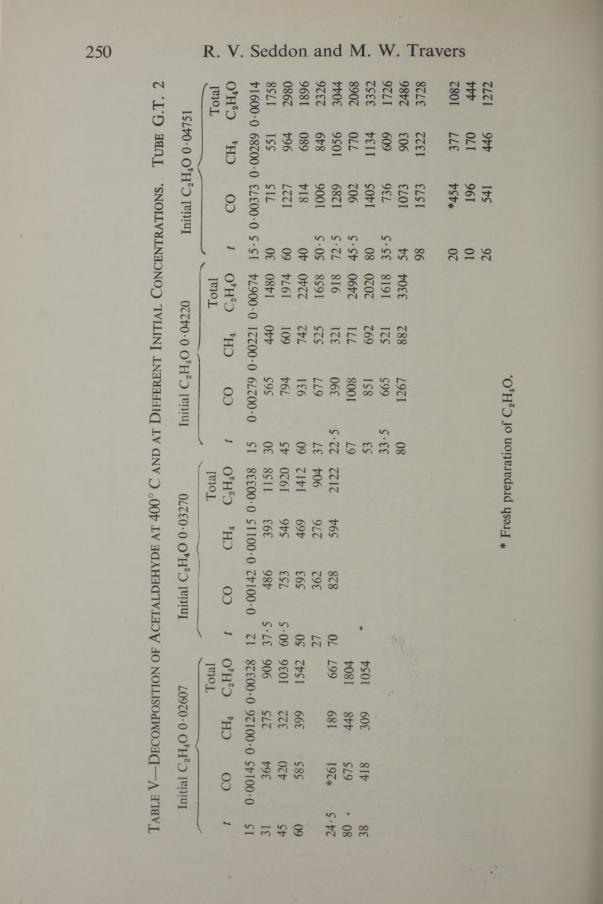
To test the effect of using different tubes, two series of experiments were carried out at 400° C with different silica tubes, the one a little smaller than the other. The quantities of acetaldehyde introduced into the tubes were so adjusted that the initial concentration was the same in each series of experiments. The results are set down in Table IV and are plotted in fig. 3. It will be noticed that with the larger tube, the wall reaction proceeds three or four times as fast as in the smaller tube. However, the total rate of decomposition of the acetaldehyde is the same in both cases as far as the break point, and the real difference in the behaviour of the two tubes lies in the fact that the break occurs later in one set of experiments than in the other. After the break the graphs are sensibly parallel. It must be pointed out at once that in all the experiments near to 400° C, the first break point at least, occurs when less than half the acetaldehyde has been decomposed; but at 500° C and at four different concentrations the break point, and the points corresponding to the half-life periods, appear to coincide (fig. 6). In this respect, the process of decomposition of acetaldehyde resembles the processes involved in the decomposition of chlorine monoxide, and the oxidation of methane and ethane.*
* Semenoff, “ Chemical Kinetics and Chain Reactions ” .
The Thermal Decomposition o f Acetaldehyde 247
on May 6, 2018http://rspa.royalsocietypublishing.org/Downloaded from

248 R. V. Seddon and M. W. Travers
In the experiments carried out between 360° and 420° C on acetaldehyde, we were guided by the idea that it was important to obtain such data as would enable us to follow the course of the decomposition of that compound into methane and carbon monoxide by observing the rate of formation of methane. Had we been aware of the relation between the two apparently different decomposition processes, and of the fact brought to
Minutes
F ig. 3—Decomposition of acetaldehyde at 400° C, and initial concentration of 0 03987. x = tube NT; © = tube NT 1. .
light by the experiment just described, and confirmed by other data given in this paper, we should have paid much more attention to the exact investigation of the initial parts of the x — t graphs, for it is from such data that information as to the exact nature of these processes will be forthcoming.
The data in Table V and Table VI suggest that at 400° C the rate of decomposition of acetaldehyde is, at least in the initial stages, almost directly proportional to the initial concentration, and the data in Table VIII suggest a similar conclusion regarding ethylene oxide. How-
on May 6, 2018http://rspa.royalsocietypublishing.org/Downloaded from

VOL. o < >Ta
ble
IV—
Dec
om
posi
tio
n o
f A
cet
ald
ehy
de
at
400°
C a
nd
In
itia
l C
on
cen
tra
tio
n 0
-039
81, i
n D
iffe
ren
t T
ube
s
Tube
N.T
. C
apac
ity 3
8 -5
cc.
Inte
rnal
dia
met
er 1
9 - 5
mm
tCO
ch
4(C
O -
CH
4)To
tal
CH
3CH
O
150-
0027
90
0022
10
0005
80
0067
430
565
440
125
1380
4579
460
119
319
7260
931
742
189
2240
3767
752
515
216
5822
-539
032
169
918
6710
0877
123
724
9053
851
692
159
2020
33-5
655
521
134
1578
8012
6788
238
533
04
Tube
N.T
1.
Cap
acity
30 -
1 cc
. In
tern
al d
iam
eter
17
mm
tC
Oc
h4
(CO
- C
H4)
Tot
alC
H3C
HO
100
0018
30
0017
40-
0000
90-
0038
420
372
330
4282
830
513
462
5111
2840
650
572
7814
5650
720
619
101
1642
6080
872
286
1788
8011
1898
313
525
0641
652
571
8114
6615
293
270
2363
226
542
469
7312
30
c/a
\
toThe Thermal Decomposition o f Acetaldehyde
on
May
6, 2
018
http
://rs
pa.r
oyal
soci
etyp
ublis
hing
.org
/D
ownl
oade
d fr
om
Tabl
e V
—D
eco
mpo
siti
on
of
Ac
eta
ldeh
yd
e a
t 40
0° C
an
d a
t D
iffe
ren
t In
itia
l C
on
cen
tra
tio
ns.
Tu
be G
.T. 2
Initi
al C
2H40
0-0
2607
Initi
al C
2H40
0 -0
3270
Initi
al C
2H40
0-0
4220
Initi
al C
2H40
0-0
4751
Tota
lTo
tal
z'T
otal
''N
S ----
-To
tal
tCO
ch
4c
2h4o
tC
O
ch
4c
2h4o
tC
Oc
h4
c2h
4oC
Oc
h4
c2h
4o15
0-00
145
0-00
126
0-00
328
120-
0014
2 0-
0011
5 0-
0033
815
0-00
279
0-00
221
0-00
674
15-5
0-0
0373
0-0
0289
0-0
0914
3136
427
590
637
-548
6 39
311
5830
565
440
1480
3071
555
117
5845
420
322
1036
60-5
753
546
1920
4579
460
119
7460
1227
964
2980
6058
539
915
4250
593
469
1412
6093
174
222
4040
814
680
1896
2736
2 27
690
437
677
525
1658
50-5
1006
849
2326
24-5
*261
189
667
7082
8 59
421
2222
-539
032
191
872
-512
8910
5630
4480
•
675
448
1804
6710
0877
124
9045
-590
277
020
6838
418
309
1054
5385
169
220
2080
1405
1134
3352
33-5
665
521
1618
35-5
736
609
1726
8012
6788
233
0454
1073
903
2486
9815
7313
2237
28
20*4
5437
710
8210
196
170
444
2654
144
612
72*
Fres
h pr
epar
atio
n of
C2H
40.
250 R. V. Seddon and M. W
on
May
6, 2
018
http
://rs
pa.r
oyal
soci
etyp
ublis
hing
.org
/D
ownl
oade
d fr
om

C/3 to
Tab
le V
I—D
eco
mpo
siti
on
of
Ac
eta
ldeh
yd
e a
t T
empe
ra
tur
es B
etw
een
360
° a
nd
420
° C
Init
ial
CH
3CH
O 0
-025
07.
Tu
be N
.T.
A42
0° C
B40
0° C
C38
0° C
D36
0° C
S/
—---
\ '
Tot
alTo
tal
Tota
lT
otal
tCO
ch
4c
h3c
ho
tC
Oc
h4
CH
3CH
Ot
CO
ch
4C
H3C
HO
tC
Oc
h4
CH
3CH
O
7-5
0 00
121
0-00
109
0-00
226
150-
0014
2 0-
0012
70-
0031
415
0-00
017
0-00
058
0-00
168
100-
0002
6 0-
0002
10-
0006
2
12-5
242
213
542
2523
520
353
427
117
108
252
2053
4811
6
2037
933
684
436
345
274
832
4018
315
542
230
6860
152
27-5
490
4543
934
110
7450
224
187
522
1542
3794
1528
5_
53-5
508
391
1250
6026
422
263
212
-532
3166
1020
918
047
670
568
442
1388
7032
426
077
67-
522
2048
565
5813
040
373
297
898
2199
9321
017
-549
4311
0
1429
523
571
050
445
353
1074
33-5
146
122
340
916
714
837
230
286
226
690
1048
3811
617
-5_
345
—37
-535
628
585
820
101
8623
010
-520
917
448
820
198
161
470
23-5
104
9622
445
201
165
474
22-5
*507
415
1198
7-5
*68
6115
035
157
130
368
32-5
694
580
1608
12-5
120
107
266
3013
511
032
020
424
369
958
17-5
186
154
436
22-5
243
202
568
* Fr
esh
acet
alde
hyde
.
toThe Thermal Decomposition o f Acetaldehyde
on
May
6, 2
018
http
://rs
pa.r
oyal
soci
etyp
ublis
hing
.org
/D
ownl
oade
d fr
om

252 R. V. Seddon and M. W. Travers
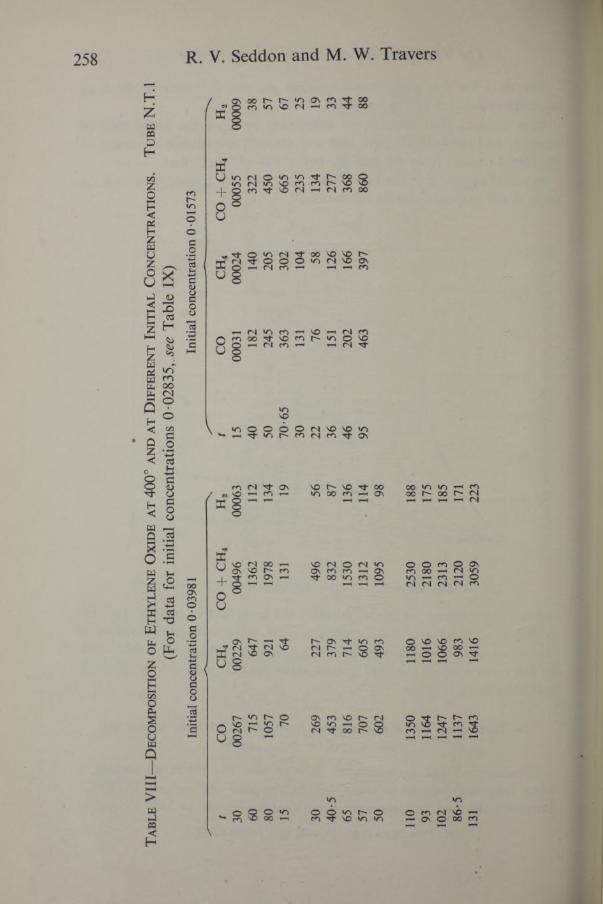
ever, the data only give the general form of the graphs, which are similar to those in figs. 4 and 5. The data in Tables VI and IX, plotted in figs. 4 and 5, show that the temperature coefficient of decomposition of ethylene
S3 0-012
« 0-008
o 0-006
U 0-004
MinutesFig. A— Decomposition of acetaldehyde between 360° and 420° C; initial concentra
tion 0-02507.
oxide is very much greater than that of acetaldehyde. The form of the graphs does not permit the calculation of exact numerical relationships.
The experiments at 500° C were carried out after the rest of the investigation had been completed, so as to allow the range of temperature in our investigation to overlap that covered by Hinshelwood and his co-workers.
on May 6, 2018http://rspa.royalsocietypublishing.org/Downloaded from
Tota
l C2H
40 d
ecom
pose
d gr
am a
tom
s oi
car
Don
pe
r lit
re
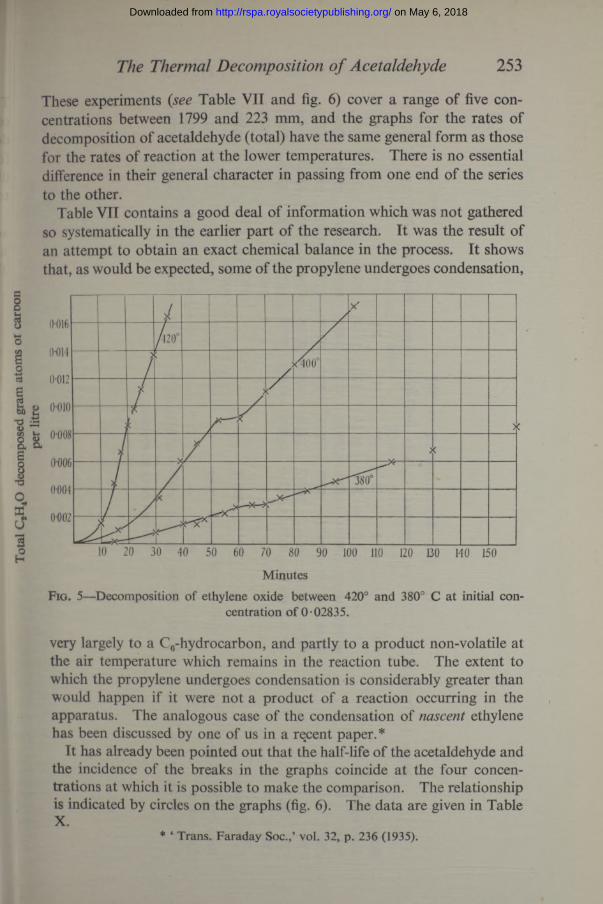
These experiments ( see Table VII and fig. 6) cover a range of five concentrations between 1799 and 223 mm, and the graphs for the rates of decomposition of acetaldehyde (total) have the same general form as those for the rates of reaction at the lower temperatures. There is no essential difference in their general character in passing from one end of the series to the other.
Table VII contains a good deal of information which was not gathered so systematically in the earlier part of the research. It was the result of an attempt to obtain an exact chemical balance in the process. It shows that, as would be expected, some of the propylene undergoes condensation,
The Thermal Decomposition of Acetaldehyde 253
10 20 30 40 50 60 70 80 90 100 110 120 B0 140 150
MinutesFig. 5—Decomposition of ethylene oxide between 420° and 380° C at initial con
centration of 0-02835.
very largely to a C6-hydrocarbon, and partly to a product non-volatile at the air temperature which remains in the reaction tube. The extent to which the propylene undergoes condensation is considerably greater than would happen if it were not a product of a reaction occurring in the apparatus. The analogous case of the condensation of nascent ethylene has been discussed by one of us in a recent paper.*
It has already been pointed out that the half-life of the acetaldehyde and the incidence of the breaks in the graphs coincide at the four concentrations at which it is possible to make the comparison. The relationship is indicated by circles on the graphs (fig. 6). The data are given in Table X.
* ‘ Trans. Faraday Soc.,’ vol. 32, p. 236 (1935).
on May 6, 2018http://rspa.royalsocietypublishing.org/Downloaded from

to
Ta
ble
VII—
Ac
eta
ldeh
yd
e a
t 50
0° C
*
Seri
es
I—T
ube
N
.P.T
. 37
-7
cc.
Init
ial
C2H
40 0
-074
64;
Init
ial
Pres
sur
e 17
99 m
m
Seri
al
......
......
......
......
......
......
.....
...
89
23
111
105
67
4Ti
me,
min
...
......
......
......
......
.....
...
34-
55
7-5
8-75
1011
-25
12-5
1517
-520
H (
at)..
......
......
......
......
......
......
.....
. 00
012
0000
800
044
0002
800
010
0003
500
023
0004
500
064
0004
400
096
CO
....
......
......
......
......
......
......
.....
...
0066
801
345
0166
202
203
0255
302
630
0253
902
700
0286
203
039
0300
3c
h4
......
......
......
......
•.....
......
.... .
..
0059
101
159
0141
201
987
0218
502
387
0230
702
410
0255
002
580
0263
8C
O -
CH
4 ...
......
......
......
......
....
. 00
077
0018
600
250
0021
600
386
0024
300
232
0029
000
312
0045
900
365
co2
......
......
......
......
......
......
.....
——
——
——
0002
8—
—00
039
C3 h
ydro
carb
on...
......
......
......
.... .
. .
——
0033
500
431
——
—i0
0434
i 10
0070
1*—
0062
7
Rat
io C
02/h
ydro
carb
on...
.....
—3
042-
89—
——
——
——
Non
-vol
atile
...
......
......
......
.... .
. .
---—
0013
4—
——
—00
119
0009
3—
0009
5C
2H40
dec
ompo
sed.
......
......
.....
. 01
490
0269
003
824
0483
805
842
0574
605
542
0598
006
348
0699
606
736
* Pr
opyl
ene
and
prop
ane.
R.. V. Seddon and M. W
on
May
6, 2
018
http
://rs
pa.r
oyal
soci
etyp
ublis
hing
.org
/D
ownl
oade
d fr
om

Ta
ble
VII—
(con
tinue
d)Se
ries
II—
Tube
34-
4 cc
Se
ries
III
—T
ube
72
0 cc
Init
ial
C2H
40 0
-050
08;
Init
ial
Pres
sur
e 12
07 m
m
Init
ial
C2H
40 0
025
92; I
nit
ial
Pres
sur
e 57
7 m
ms
Seria
l ...
......
......
......
......
......
.....
.....
23
14
23
41
5Ti
me,
min
...
......
......
......
......
.....
....
46-
59
125
8m
1520
h2
......
......
......
......
......
......
......
....
.....
0000
400
016
0000
400
044
0000
200
008
0001
400
022
0001
4C
O...
......
......
......
......
......
......
....
......
.. 00
308
0087
301
262
0147
000
206
0040
500
548
0059
800
738
CH«
......
......
......
......
......
......
......
.....
0027
000
813
0113
401
299
0016
700
352
0048
000
514
0064
6c
o-
ch
4...
......
......
......
......
. ....
....
0003
800
060
0012
800
171
0003
900
053
0006
400
084
0009
2C
3 hyd
roca
rbon
....
......
......
.... .
......
. 00
047
0009
100
191
0025
600
063
0009
300
115
0014
900
156
Non
-vol
atile
...
......
......
......
...00
030
——
——
—00
008
0001
0C
2H4O
dec
ompo
sed
......
......
......
.. 00
692
0186
602
780
0328
200
490
0091
601
216
%01
364
0166
0
K) Ui c/1The Thermal Decomposition o f Acetaldehyde
on
May
6, 2
018
http
://rs
pa.r
oyal
soci
etyp
ublis
hing
.org
/D
ownl
oade
d fr
om

K> L/l G\
Ser
ies
V—T
ub
e 7
2*0
cc
Seri
es I
V—T
ub
e 7
2-0
cc
In
itia
l C
2H40
0-0
0934
;In
itia
l C
2H40
0-0
1463
; In
itia
l Pr
essu
re
353
mm
In
itia
l Pr
essu
re
226
mm
:
✓----
------
------
------
------
-----
------
-----
~-----
------
------
---:--
------
------
------
------
--
"■ "
nSe
rial
...
......
......
......
......
......
......
......
......
3
4 1
2 5
2 4
1 3
Tim
e, m
in
......
......
......
......
......
......
......
. 5
7-5
10
20
30
5 10
15
25
CO
......
......
......
......
......
......
......
......
......
.....
0009
35
0017
4 00
228
0037
1 00
443
0005
9s
0014
55
0021
25
0025
2C
H4
......
......
......
......
......
......
......
......
......
. 00
0775
00
153
0019
6 00
316
0039
2 46
5 00
118s
00
186
0022
0 _
A ...
......
......
......
......
......
......
......
......
......
.. 00
016
0002
1 00
032
0005
5 00
051
13
27
0002
65
0003
2 ^
C3 h
ydro
carb
on .
......
......
......
......
......
....
—
—
—
0007
9 00
111
19
—
0008
0 00
085
pcC
2H40
dec
ompo
sed
......
......
......
......
...
0021
9 00
348
0058
4 00
852
0098
8 14
5 00
345
0047
8 00
568
a C/5
tah
**.
.. ..
..
...^
......
....
.... .
...
. .
jf
ei
i'
:
V. Seddon and M. W
on
May
6, 2
018
http
://rs
pa.r
oyal
soci
etyp
ublis
hing
.org
/D
ownl
oade
d fr
om
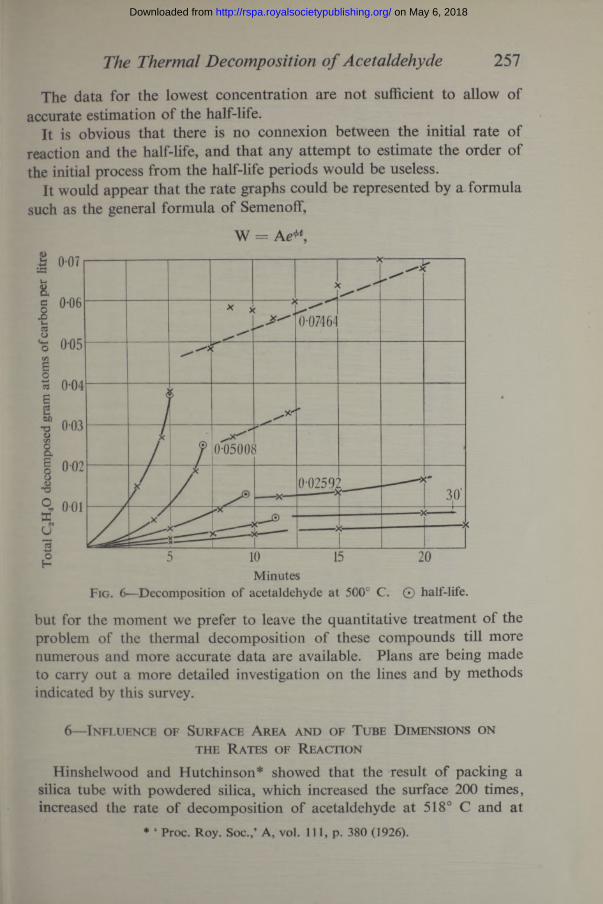
The Thermal Decomposition o f Acetaldehyde 257
The data for the lowest concentration are not sufficient to allow of accurate estimation of the half-life.
It is obvious that there is no connexion between the initial rate of reaction and the half-life, and that any attempt to estimate the order of the initial process from the half-life periods would be useless.
It would appear that the rate graphs could be represented by a formula such as the general formula of Semenoff,
W = Ae*\
g 0-06007464
0-04
005008
0 02592
MinutesFig. 6—Decomposition o f acetaldehyde at 500° C. © half-life.
but for the moment we prefer to leave the quantitative treatment of the problem of the thermal decomposition of these compounds till more numerous and more accurate data are available. Plans are being made to carry out a more detailed investigation on the lines and by methods indicated by this survey.
6—Influence of Surface Area and of Tube D imensions on the Rates of Reaction
Hinshelwood and Hutchinson* showed that the result of packing a silica tube with powdered silica, which increased the surface 200 times, increased the rate of decomposition of acetaldehyde at 518° C and at
* ‘ Proc. Roy. Soc.,’ A, vol. I l l , p. 380 (1926).
on May 6, 2018http://rspa.royalsocietypublishing.org/Downloaded from
K> OO
Tabl
e V
III—
Dec
om
posi
tio
n o
f E
thy
len
e O
xid
e a
t 40
0° a
nd
at
Dif
fer
ent
Init
ial
Co
nc
entr
ati
on
s. T
ube
N.T
.l(F
or d
ata
for
initi
al c
once
ntra
tions
0-0
2835
, se
e Ta
ble
IX)
Initi
al c
once
ntra
tion
0 03
981
Initi
al c
once
ntra
tion
0 01
573
\---
-V
tCO
ch
4C
O +
ch
4h
2t
CO
ch
4C
O +
ch
4h
230
0026
700
229
0049
600
063
1500
031
0002
400
055
0000
960
715
647
1362
112
4018
214
032
238
8010
5792
119
7813
450
245
205
450
5715
7064
131
1970
-65
363
302
665
6730
131
104
235
2530
269
227
496
5622
7658
134
1940
-545
337
983
287
3615
112
627
733
6581
671
415
3013
646
202
166
368
4457
707
605
1312
114
9546
339
786
088
5060
249
310
9598
110
1350
1180
2530
188
9311
6410
1621
8017
510
212
4710
6623
1318
586
-511
3798
321
2017
113
116
4314
1630
5922
3
R. V. Seddon and M. W. Travers
on
May
6, 2
018
http
://rs
pa.r
oyal
soci
etyp
ublis
hing
.org
/D
ownl
oade
d fr
om

Tabl
e IX
—D
eco
mpo
siti
on
of
Eth
yle
ne
Ox
ide
at
Dif
fer
ent
Tem
per
atu
res
. In
itia
l (C
H2)
20 0
-028
35.
Tu
be
N.T
. 1
420°
C40
0° C
380°
CX
XX
/CO
ch
4 C
O +
ch
4h
2/
CO
ch
4 C
O +
ch
4h
2t
CO
ch
4 C
O +
ch
4h
215
0024
100
200
0044
100
049
16-3
300
058
0045
0010
300
013
1500
011
0000
800
019
0000
225
555
464
1019
9931
-33
219
179
398
4730
4737
84—
3586
877
516
4314
045
406
324
730
4745
8956
145
1720
475
395
870
8860
-548
841
590
381
5512
497
221
2722
-553
544
598
093
80-5
706
589
1295
111
6515
413
328
737
17-5
364
304
668
7553
490
401
891
8275
179
156
335
3930
771
602
1373
126
3933
626
560
154
8521
018
039
042
1089
7316
222
7060
849
211
0088
9524
521
245
748
2149
842
091
898
102
917
803
1720
146
7015
812
928
732
55
510
—40
7767
144
1812
037
031
168
170
47-5
9885
183
2415
045
938
884
777
59-2
514
612
126
730
115-
2531
727
759
469
The Thermal Decomposition o f Acetaldehyde 259
on
May
6, 2
018
http
://rs
pa.r
oyal
soci
etyp
ublis
hing
.org
/D
ownl
oade
d fr
om

260 R. V. Seddon and M. W. Travers
Table X—Experiments with A cetaldehyde at 500° CInitial concentration Initial pressure
mmHalf-life
min0-07464 1799 5
5008 1207 72592 577 9-51463 353 11-25
pressures between 290 and 360 mm by one-third. Fletcher and Hinshel- wood* packed a silica bulb with silica capillary tubes, and found that the rate of reaction at 560° C diminished slightly. Winckler and Hinshel- woodf measured the rates of decomposition of acetaldehyde in those bulbs which had been used for earlier experiments, and which were, a empty, b packed with tubes, and c packed with silica spheres, but which were otherwise subjected to the same conditions. They carried out experiments at 562° C, and at 240 mm pressure. They found that the final pressure was in the order given above in proportion 230, 220, and 185. Assuming that the pressure difference was constant, and replotting the data to the same end point, they found no evidence of acceleration or retardation in the main reaction. We have shown that since the pressure changes resulting from the two processes are relatively little different, the difference of 25% in the ultimate volume is far from being negligible.
We have already shown that in experiments at 400° C (p. 247), in the case of two tubes in which the rate of what we have called the secondary decomposition of acetaldehyde is very different, under identical conditions of temperature and concentration, the total rate of decomposition is the same up to the break point. This shows that though the surface may influence the nature of the products profoundly, it does not influence the initial rate of change of the acetaldehyde. We have also carried out experiments with packed and empty bulbs, though our present technique has not enabled us to investigate the rates of change in heavily packed bulbs over short time intervals, on account of the difficulty of eliminating temperature lag. The amounts of reactant decomposed for short time intervals in packed bulbs may be a little low.
In the experiments at 400° and 500° C the same reaction tube was used, packed with nearly the same amount of silica in the form of thin rods, so as to increase the surface in the ratio of about 1 to 5, and to reduce the volume in the ratio of about 1 -0 to 0 • 6, At 400° C (Table XI), the rate of the so-called main reaction is reduced to about one-half, and the so-called
* * Proc. Roy. Soc.,’ A, vol. 141, p. 41 (1933).t ‘ Proc. Roy. Soc.,’ A, vol. 144, p. 355 (1934).
on May 6, 2018http://rspa.royalsocietypublishing.org/Downloaded from

The Thermal Decomposition of Acetaldehyde 261
Table XI—D ecomposition of A cetaldehyde in Empty and Packed Tube at 400° C. Initial C2H40 0-02607
Time CO c h 4C5
hydro CO - c h 4 Total
1f 15 0-00175 0*00167carbon
0-00008C2H400-00366
Empty 37-7 cc \ 20 210 197 — 13 4461( 26-5 237 218 0-00005 19 512
f 20 0-00143 93 36 50 386Packed 23 • 0 cc 30 215 143 47 72 574
secondary reaction is increased on the average by nearly four times. The rate of the secondary process then becomes sensibly equal to that of the primary process. Data for comparison at 500° C are set down in Table VII, Series I, and in Table XII. From these data it is again seen that the rate of the primary reaction is reduced to about one-half, and that of the secondary reaction is increased by about four times.
From these experiments it would appear that in each series the rate of decomposition of acetaldehyde (total) for the shortest time interval is lower with the packed tube. The results in general show a close identity between the rates in the two sets of experiments and, taking the whole of these experiments in conjunction with the experiments with different empty tubes, we believe that we are justified in the conclusion that both the so-called primary and secondary methods of decomposition of acetaldehyde originate in a common activation process.
With ethylene oxide, experiments at 400° C indicated that the effect of packing the tube was practically negligible. The results of the experiments are given in Table XIII.
7—The Influence of Hydrogen, Methane, etc., on the Ratesof D ecomposition
Hinshelwood and Hutchinson* state that the products of reaction have no influence on the rate of decomposition of acetaldehyde. Hinshelwood and Askeyt found that hydrogen had some effect in increasing the rate of decomposition, and suggested that the bimolecular process was unaffected, but only the unimolecular process (low pressure), which occurred simultaneously. At the Discussion of the Royal Society in May, 1935, we
* ‘ Proc. Roy. Soc.,’ A, vol. I l l , p. 380 (1926). t ‘ Proc. Roy. Soc.,’ A, vol. 116, p. 163 (1927).
on May 6, 2018http://rspa.royalsocietypublishing.org/Downloaded from

K> O' to
Ta
ble
XII
—A
cet
ald
ehy
de
at
500°
C i
n P
ac
ked
Tu
be N
.T.P
. 29
*4 c
c In
itia
l C
oH.O
0-0
7374
; In
itia
l Pr
essu
re
1776
mm
Seri
al
......
......
......
......
......
......
......
.....
2Ti
me,
min
...
......
......
......
......
......
.. 6
H (a
t) ...
......
......
......
......
......
......
....
0 00
040
CO
...
......
......
......
......
......
......
......
......
11
58C
H4
......
......
......
......
..
658
CO -
CH
4 ...
......
......
......
......
......
.. 50
0C
02
—
C3 h
ydro
carb
on...
......
......
......
......
....
1206
Rat
io C
02/h
ydro
carb
on...
......
......
....
—N
on-v
olat
ile
......
......
......
......
......
.....
250
C2H
40 d
ecom
pose
d....
......
......
......
. 03
316
16
79
810
1111
-50-
0007
80
0012
8—
0-00
054
0191
620
5002
116
0213
812
1710
4711
2011
2566
910
0399
610
1333
710
3
1775
2703
—02
675
2-98
3-00
—3-
04—
447
—•
—
0523
006
100
0622
406
302
38
45
1213
1616
0-00
104
0-00
106
0-00
120
0-00
152
2260
0220
321
5421
6013
8311
5611
5911
3587
710
4799
510
2511
—9
20*(
0233
1)25
6110
0360
)- '
-__
—2-
7833
1—
404
0050
206
374
0648
064
8065
02
H i-t p < CD
* Pr
opyl
ene
and
prop
ane.
V. Seddon and M. W
on
May
6, 2
018
http
://rs
pa.r
oyal
soci
etyp
ublis
hing
.org
/D
ownl
oade
d fr
om

The Thermal Decomposition of Acetaldehyde 263
called attention to the phenomenon which is now discussed. Since then Hinshelwood and Fletcher have published further observations on the influence of hydrogen in relation to the suggested different states of activation which, according to Hinshelwood’s theory, initiate the decomposition process.*
Table XIII—Ethylene Oxide in Empty and Packed Tube
Time CO c h 4c 2
hydro h 2 CO + c h 4
E m p ty ........ . . . 39 0-00434 0-00354
carbon
000031 0-00076 0-0078825 216 179 15 52 385
Packed ........ . . . 26 225 191 20 31 41638 443 370 35 62 813
It seems clear from the following experiments that the effect of hydrogen and methane is intimately associated with surface conditions. A very large number of experiments was carried out, but very few of them will be described.
The influence of hydrogen on the rate of decomposition of acetaldehyde at 400° is well illustrated by the experiments of which the data are set down in Table XIV and are plotted in fig. 7. It will be seen on reference to the figure that a number of points lie on the graph abed, which has the normal form of the graph representing the initial stage of this process. However, there are three practically parallel graphs, less steeply inclined, about which the remaining points lie. We will now follow through the experiment.
In the first place, the experiments in Series A were carried out without adding hydrogen. The points lie on the graph abef. Then four experiments (Series B) were carried out adding hydrogen, with the result that the break point was depressed, and the four points lie on a graph bg. The addition of more hydrogen (Series C) had at first no effect, but the decomposition corresponding to the last two points in the series was very large. At this stage the tube seemed to settle down into a state such that the points representing the rate of decomposition of acetaldehyde lay on the graph abode, whether hydrogen were added or not (Series D, E, F).
It will be noticed that the first addition of hydrogen seemed to eliminate the secondary process (Series B), the second addition (Series D) seemed to enhance it.
* ‘ Trans. Faraday Soc.,’ vol. 30, p. 614 (1934).
on May 6, 2018http://rspa.royalsocietypublishing.org/Downloaded from
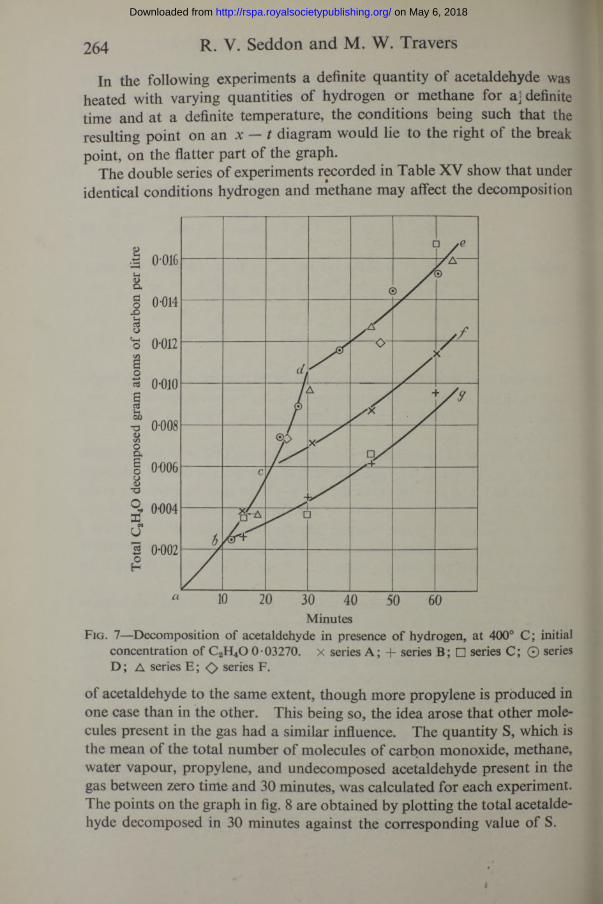
264 R. V. Seddon and M. W. Travers
In the following experiments a definite quantity of acetaldehyde was heated with varying quantities of hydrogen or methane for aj definite time and at a definite temperature, the conditions being such that the resulting point on an x — t diagram would lie to the right of the break point, on the flatter part of the graph.
The double series of experiments recorded in Table XV show that under identical conditions hydrogen and methane may affect the decomposition
.5 0 016
*3 0-012
<5 0-010
T3 0-008
i 0-004
B 0-002
MinutesFig. 7—Decomposition of acetaldehyde in presence of hydrogen, at 400° C ; initial
concentration of C2H40 0-03270. x series A; + series B; □ series C; © series D ; A series E ; <> series F.
of acetaldehyde to the same extent, though more propylene is produced in one case than in the other. This being so, the idea arose that other molecules present in the gas had a similar influence. The quantity S, which is the mean of the total number of molecules of carbon monoxide, methane, water vapour, propylene, and undecomposed acetaldehyde present in the gas between zero time and 30 minutes, was calculated for each experiment. The points on the graph in fig. 8 are obtained by plotting the total acetaldehyde decomposed in 30 minutes against the corresponding value of S.
on May 6, 2018http://rspa.royalsocietypublishing.org/Downloaded from

Table XIV—Effect of Hydrogen on the Decomposition of A cetaldehyde at 400° C, and Initial Concentration 0 -03270 for Varying
Time Intervals. Tube N.T.
The Thermal Decomposition of Acetaldehyde 265
Series th 2
added CO c h 4 CO - c h 4Total
CH3CHO S
A 1 15 00000 00165 00139 00026 00382 017302 31 00000 316 274 41 712 18133 45 00000 395 357 38 866 18514 60 00000 530 489 41 * 1142 1921
B 1 15 00565 00129 00127 00002 00262 019832 30 557 220 216 4 448 20253 45 559 292 278 14 612 20674 60 574 451 423 28 958 2161
C 1 15 00960 00159 00133 00026 00350 022122 30 970 181 178 3 365 22133 45 957 523 316 7 660 23784 60 953 704 527 177 1662 2577
D 1 12 00000 00142 00115 00027 00238 017452 22-5 00000 313 256 57 00740 18203 37*5 00000 486 393 93 1158 19254 60*5 00000 753 546 107 1520 20655 50 00000 593 469 126 1442 19946 27 00000 362 276 84 888 1828
E 1 15*5 00970 00168 00150 00018 00372 022132 30*5 970 411 339 72 966 23623 45 972 533 433 100 1266 24374 64 964 673 553 120 1586 2513
F 1 25 01634 00316 00264 00052 00736 026382 47 1618 512 427 85 1194 02742
Table XV- Action of Hydrogen and of Methane on A cetaldehyde at 400° C. Initial C2H40 0-02505; Time of Heating 30 m in;
T ube G.T. 1 Hydrogen experiments
Serialh 2
addedh 2
found CO c h 4Total
CO - CH4 CH3CHO SA 1 00000 00000 00272 00266 00006 00556 01391
2 536 534 400 404 4 824 17213 758 765 812 804 8 1640 20434 854 857 603 603 0 1206 19815 1051 1064 286 285 1 572 2424
B 1 617 618 297 292 5 604 17112 680 686 251 245 6 514 1720Experiments in Series B were carried out after the methane experiments.
VOL. C L V I.— A. T
on May 6, 2018http://rspa.royalsocietypublishing.org/Downloaded from

266 R. V. Seddon and M. W. Travers
Table XV—(continued)Methane experiments
CH4 Total XSerial added CO c h 4 CO - c h 4 CHgCHO s
1 00000 00264 00247 00017 00462 014202 641 826 777 49 1750 20103 588 558 521 37 1190 18434 505 391 346 45 872 17225 813 562 513 59 1262 19696 385 348 317 31 758 16347 322 336 307 29 730 1580
fc o-oio
0-014 0-016 0-018 0-020 0-022 0-024
Fig. 8—Influence of hydrogen and methane on the decomposition of acetaldehyde at 400° C. Initial concentration C2H40 0-02505. X hydrogen; 0 methane.
Table XVI—Effect of Methane on the D ecomposition of A cetalde-HYDE. T e m p e r a t u r e 4 0 0 ° C ; T im e of H e a t in g 30 m i n ; I n it ia l
C H g C H O 0 - 0 3 8 7 3c h 4 CO c h 4 Total
added formed CO - c h 4 CH3CHO s______ ____ ___ .
00000 00484 00416 00068 01104 02212787 566 425 141 1314 02608920 614 485 129 1456 2767
1033 910 721 184 2198 29941115 749 652 97 1692 29161324 649 512 137 1572 29921809 612 433 179 1582 3146
on May 6, 2018http://rspa.royalsocietypublishing.org/Downloaded from

Garner.
H
Hy*
HH
p P
I &
£L*
co
jr*
O CD
W CO r 3
p o ?r p o cT a OQ CD 3 p p 'C S-dS
"ft
rf
? o P- 5o‘ o c CO co O* P CO r# p1 7 o
E? O 3 sr o’ P4 o p CD o *-+> P co P4 O a p h CD C/
3 CD P *-» O P4 C/3 o p4 o ST 3 31
p o o p o p 22 O* P CD P* P < cd <—K o o o p < CD o p «—b p4
p p ?r C/3
P P ap4 CD
O Cl
HH
P
3 |
If |
t~
" n
°P*
P < CD H-f
S5. ^
g r.
2 °
w '
CD 3 O*to *&■ o
n a
2. 3*
3 ^
P cd
3
g§
Oa
2.
CO ft
CD
CD O O
P
P
•“*
I* O
^
o £3H CD P
O O* P
H P4 CD CD $ CD O O *“+3 r-K p4 CD P a a
p CD 5* < CD f/3-
P O H o OQ CD P o *“i
p
p
o
* I
§o
^ 8
a 3
°
P4 P P4 CD
r-b
h-*
■o'<g 3
p a
5 s
§ a
a- &
o
p-
a4 CD P H
CD P*
00, C
D<§
: s*
cr fT f
t cr o
£3 3 CD P* P P CD o p r-f p4 CD P CD o ►"+3 a CD O O 3 Xj o CO a o p
_
p
tr cd
p
C
ft
<
x 3
3- p
-p
- CD
CD P* P P CD S' q CD P C/3 CD co <—K P4 CD P o ►“+3 P o o' P p f-K LO O o o O P4 go'cr CD CD P 1—
»• I CD CO 3* 00 P4 P C CD
P4 CD co P 3 ’
CD < P 3* CD
rv 00
& ^
5
£
CTQ ^
ft.
3-P
CO a4 CD o o 3 CD
go 5
1*
OQ p4 p p a
o 3 p 5’ CD a p4 CD P* CD >-* f—b P CD P a a P* o' p
< CD O H CD co P h-p CO O O CD co P3 O P a
p CD a CD O o 3 o 2. £+■ o’ 3 o a.
^3
pp
°-
p a CD HX3 P o o ’
p
o 3 C“K P CD P O CD £ s CD P "C a CD P o3 5 * p ?d o o co CDP CD P* o’ p
3 0 VO 1 pH Pj p CD P CD 2, 3 CD 3*C3 ^
§ 3
§ §
<-+ f-K
3 3“
p o’ &*
3 8
o O 3
O’o
to o
l-M co
P
P ? = o 2
Sa
• ^ s CD P v; Cl CD -P Q O P
001Tota
l C2H
40 d
ecom
pose
d gr
am a
tom
s of
ca
rbon
per
litr
e
Kjft
o> cbo> 00
s
—y
S3* CD HH
P ^
«
OO
5°®
s
00 w
5’ ^ q ^
1 ^
CD °
Vi O
q S'
'C o N
a o>
a ^2
,P
^3
CD
3 p 'C p CD O o p co 51 CD CD a 2. CJQ*
p p o p p
p 3 o p p o l"-t"3 a CD O O 3 "O o 2. rH-* O* P P-* P1
Table XYI contains data for another set of experiments with methane at a higher concentration. The data are plotted in fig. 9.
on
May
6, 2
018
http
://rs
pa.r
oyal
soci
etyp
ublis
hing
.org
/D
ownl
oade
d fr
om
268 R. V. Seddon and M. W. Travers
Summary and Conclusions
The thermal decomposition of acetaldehyde has been studied between 360° and 500° C, and that of ethylene oxide between 380° and 420° C. The processes have been followed by heating measured quantities of the vapours for definite time intervals in silica apparatus, and making detailed analyses of the products.
In each case, in empty tubes, the main product is methane and carbon dioxide, the latter always in excess of the former. With acetaldehyde a second reaction gives rise to propylene, water vapour, and carbon monoxide, and with ethylene oxide a second reaction gives rise to ethylene, hydrogen, and carbon monoxide. Condensation products are formed in both cases by the hydrocarbons.
With acetaldehyde the rate of the first reaction is diminished when the reaction tube is packed, and that of the second reaction is increased. The rate of decrease in the rate of decomposition of the acetaldehyde associated with the first reaction is, however, equivalent to the increase in decomposition associated with the second. The rate of decomposition of the acetaldehyde is therefore independent of the nature of the reaction vessel, whichever product predominates. It seems to be probable, therefore, that the single initiation process must operate in either case. Without making any assumption as to the method of formation of initial active centres, it would appear that a transition state must be passed through, and a state reached which is sufficiently stable to permit of a proportion of the particles reaching the walls, even when the density of the gas phase is high, without undergoing change. Those which reach the walls within the lifetime of a particle are adsorbed, and form propylene, water vapour, and carbon monoxide, while a proportion decompose in the gas phase into methane and carbon monoxide. The particles may be radicals, or may be single or double C2H40-complexes. The existence of such “ intermediates ” is assumed for many processes in which chain mechan- i sms operate (Semenoff, loc. cit.).
The surface appears to have no influence on the rate of decomposition of ethylene oxide, and it is assumed that two processes operate in the gas phase, also having a common origin.
With both substances, the rate of reaction does not diminish with time over the initial period. With ethylene oxide the curvature of the — graphs towards the x-axis is very marked, while for acetaldehyde the graphs are nearly linear. In each case the velocity suddenly slows down alter a time.
The temperature coefficient of thermal decomposition is considerably greater for ethylene oxide than for acetaldehyde.
on May 6, 2018http://rspa.royalsocietypublishing.org/Downloaded from

The Thermal Decomposition of Acetaldehyde 269
For acetaldehyde, the nature of the phenomena associated with the break point has been the subject of a considerable amount of investigation. Its position has been found to be determined by the surface of the reaction vessel, the gas in the vessel, and the temperature. At 500° C it appears to coincide exactly with the point at which half of the acetaldehyde has been decomposed. At lower temperatures it occurs spontaneously at a point at which less than half of the acetaldehyde has been decomposed, and varying in position with different reaction vessels. It can be raised to a position in the neighbourhood of that corresponding to the decomposition of half of the acetaldehyde by adding methane or hydrogen, which appear to have the same influence quantitatively. It would appear that that portion of the x — tgraph which represents the decomposition of acetaldehyde as taking place with accelerated velocity also represents a condition in which not more than one out of each pair of molecules of acetaldehyde present in the apparatus undergoes chemical change. We cannot put forward any suggestion of a mechanism to explain this phenomenon; but we may point out that it may in some way account for the fact that the decomposition process has characteristics which are usually associated with processes involving a very much larger energy change.
We have not attempted to deal with any of the phenomena numerically, for before this is done a more accurate study of them should be made over a fairly wide range of temperature and concentration, particularly directed to determining the exact form of the initial portions of the x — t graphs. It is hoped to be able to carry out this work in the near future. For the present it suffices to state that the decomposition of these compounds is associated with phenomena which make it necessary to include them amongst processes in which the rate of change at any moment is not determined by conditions obtaining at the moment, as the classical theory demands, but at some earlier time.
on May 6, 2018http://rspa.royalsocietypublishing.org/Downloaded from