On the Derivation of Estimators of Foster-Greer-Thorbecke ... the Derivation of Estimators... · On...
13
CBN Journal of Applied Statistics Vol. 4 No.1 (June, 2013) 1 On the Derivation of Estimators of Foster-Greer-Thorbecke (FGT) Poverty Indices Oyedeji I. Osowole 1 and Adebayo T. Bamiduro 2 Poverty analysis has relied heavily on data in summarized form and this has created dearth of knowledge on the statistical properties of Foster-Greer-Thorbecke (FGT) poverty indices. This study derived estimators of FGT poverty indices from first principles in an attempt to provide an insight into some intrinsic characteristics of FGT indices. The estimators are found to be reasonably unbiased and consistent. The estimates of the indices obtained from the estimators are approximately 53%, 22% and 12% for the head count, poverty gap and square poverty gap indices. From the conventional method, the estimates are approximately 52%, 21% and 11% respectively. The results therefore establish the validity of the derived estimators as adequate alternative measures of the three basic poverty dimensions of proportion, depth and severity. Keywords: FGT poverty indices, First principles, Intrinsic characteristics, Poverty dimensions, Fundamental freedoms of action and choice. JEL Classification: C13, O2 1.0 Introduction Poverty amid plenty is the world’s greatest challenge. Poor people live without fundamental freedoms of action and choice that the better off take for granted (Sen, 1999). According to the World Bank (1999), poverty is hunger; lack of shelter; to be sick and not able to go to school; not knowing how to read; not being able to speak properly; not having a job; fear for the future; losing a child to illness brought about by unclean water; powerlessness; lack of representation and freedom. These are all dimensions of poverty. Indeed, of the world’s 6 billion people, 2.8 billion live on less than $2 a day, and 1.2 billion live on less than $1 a day. In rich countries less than 1 child in 100 does not reach its fifth birthday, while in the poorest countries as many as five children in hundred do not. Also while in rich countries fewer than 5 percent of all children under five are malnourished, in poor countries as many as 50 percent are (World bank, 2001). 1 Department of Statistics, University of Ibadan, Nigeria. Email: [email protected] 2 Department of Statistics, University of Ibadan. Email: [email protected]
Transcript of On the Derivation of Estimators of Foster-Greer-Thorbecke ... the Derivation of Estimators... · On...

CBN Journal of Applied Statistics Vol. 4 No.1 (June, 2013) 1
On the Derivation of Estimators of
Foster-Greer-Thorbecke (FGT) Poverty Indices
Oyedeji I. Osowole
1 and Adebayo T. Bamiduro
2
Poverty analysis has relied heavily on data in summarized form and this has created
dearth of knowledge on the statistical properties of Foster-Greer-Thorbecke (FGT)
poverty indices. This study derived estimators of FGT poverty indices from first
principles in an attempt to provide an insight into some intrinsic characteristics of
FGT indices. The estimators are found to be reasonably unbiased and consistent. The
estimates of the indices obtained from the estimators are approximately 53%, 22%
and 12% for the head count, poverty gap and square poverty gap indices. From the
conventional method, the estimates are approximately 52%, 21% and 11%
respectively. The results therefore establish the validity of the derived estimators as
adequate alternative measures of the three basic poverty dimensions of proportion,
depth and severity.
Keywords: FGT poverty indices, First principles, Intrinsic characteristics,
Poverty dimensions, Fundamental freedoms of action and choice.
JEL Classification: C13, O2
1.0 Introduction
Poverty amid plenty is the world’s greatest challenge. Poor people live
without fundamental freedoms of action and choice that the better off take for
granted (Sen, 1999). According to the World Bank (1999), poverty is hunger;
lack of shelter; to be sick and not able to go to school; not knowing how to
read; not being able to speak properly; not having a job; fear for the future;
losing a child to illness brought about by unclean water; powerlessness; lack
of representation and freedom. These are all dimensions of poverty. Indeed, of
the world’s 6 billion people, 2.8 billion live on less than $2 a day, and 1.2
billion live on less than $1 a day. In rich countries less than 1 child in 100
does not reach its fifth birthday, while in the poorest countries as many as five
children in hundred do not. Also while in rich countries fewer than 5 percent
of all children under five are malnourished, in poor countries as many as 50
percent are (World bank, 2001).
1 Department of Statistics, University of Ibadan, Nigeria. Email: [email protected]
2 Department of Statistics, University of Ibadan. Email: [email protected]

2 On the Derivation of Estimators of
Foster-Greer-Thorbecke (FGT) Poverty Indices Osowole & Bamiduro
Sanyal (1991) and Schubert (1994) saw poverty as either absolute or relative
or both. Absolute poverty is that which could be applied at all times in all
societies such as the level of income necessary for bare subsistence, while
relative poverty relates to the living standard of the poor to the standards that
prevail elsewhere in the society in which they live. However, there is no
general consensus on the definition of poverty. This is not unconnected to its
multidimensional nature, which affects many aspects of human conditions,
including physical, moral, social, and psychological aspects. Hence, many
criteria have been used to define poverty. While an economist would approach
the subject from the view point of wants, needs and effective demand, the
psychologist may look at it from the standpoint of deprivation, esteem and
ego. But whatever perspective it is viewed, it is obvious that it is a condition
of life that is so degrading as to insult human dignity (Omonona et al, 2008).
The great majority of Africa lives on barely $0.65 a day and this number is
growing relentlessly. Moreover, a severe lack of capabilities (education,
health, nutrition) among Africa’s poor threatens to make poverty dynastic,
with the descendants of the poor also remaining poor. The rural poor account
for 80 percent of African poverty, but urban poverty is substantial and appears
to be growing (World Bank, 2001, Nwaobi, 2000 and Collier and Gunning,
1999). Africa is not only poor; it also suffers from vast inequality in incomes,
in assets, in control over public resources, and in access to essential services,
as well as pervasive insecurity. These dimensions of poverty and deprivation
are worsening in many parts of the region while in some areas there are
indications of deterioration in the general health of the population, particularly
among the poor and children. Not surprisingly, the elimination of deep
poverty has emerged as the overriding objective of development in Africa
(Nwaobi, 2003).
In Nigeria, widespread and severe poverty is a reality. It is a reality that
depicts lack of food, clothes, education and other basic amenities. Severely
poor people lack the most basic necessities of life to a degree that it can be
wondered how they manage to survive. There are several effects and
deficiencies associated with poverty in Nigeria. One of the main effects of
poverty is poor health, as reflected in Nigeria’s high infant mortality and low
life expectancy. Poor people in Nigeria face several health issues as they lack
basic health amenities and competent medical practitioners. Most children do
not have the opportunity of being immunized and this leads to certain physical

CBN Journal of Applied Statistics Vol. 4 No.1 (June, 2013) 3
defects in some of the children. Their health has become low priority and as
they have little or no choices, they live with whatever they are provided with,
whether healthy or not (Ucha, 2010).This poverty situation in Nigeria presents
a paradox because despite the human and material endowments of Nigeria, a
large proportion of her population is still poor (Soludo, 2006).
On measurement of poverty, Foster et al. (1984), Grootaert and Braithwaite
(1998) and Ravallion (1996) observe that the most frequently used
measurements are:
(i) the head count poverty index given by the percentage of the
population that live in the household with a consumption per capita
less than the poverty line;
(ii) poverty gap index which reflects the depth of poverty by taking
into account how far the average poor person’s income is from the
poverty line; and
(iii) the distributionally sensitive measure of squared poverty gap
defined as the mean of the squared proportionate poverty gap
which reflects the severity of poverty.
This traditional poverty analytical approach which involves the setting of a
poverty line, z, for classifying households into poor and non-poor,
respectively, is adopted in this study with the poverty line defined as the 2/3
of mean per capita household expenditure, y. The three poverty indices above
are commonly referred to as Foster-Greer-Thorbecke (FGT) poverty index
(Foster et. al.(1984)). This is defined as
∑ (
)
( )
where is the poverty line, is the per capita expenditure for household ,
is the sensitivity of the index to poverty and N is the total number of
households. is an indicator function such that
{
The index becomes head count index (HCI) when , poverty gap index
(PGI) when and square poverty gap index (SPGI) when in that
order.

4 On the Derivation of Estimators of
Foster-Greer-Thorbecke (FGT) Poverty Indices Osowole & Bamiduro
This paper attempts to derive the estimators of Foster-Greer-Thorbecke (FGT)
poverty index in an attempt to reduce the gap in literature on the limited
knowledge of statistical properties of these indices due to the fact that
available data for measuring poverty are usually obtained in summary form.
The characteristics of these estimators, as alternative measures of the three
basic poverty dimensions will equally be considered.
2.0 Estimators of FGT Poverty Indices
2.1 Estimator of Head Count Index
The head count index, HCI is defined as
HCI = 0
1
1
( )j
Nz y
jN z
j
I y z
= 1
1
( )N
jN
j
I y z
(1)
N is the number of individual households in the population, z is the poverty
line. Let be the number of individuals whose per capita income is below the
poverty line obtained from .
From (1), HCI = 0
1
1
j
Mz y
N z
j
= 1
1
1M
MN N
j
P
(2)
Let n be the size of the random sample selected from N and suppose m is the
number of the poor in the sample, then the head count index, P, the proportion
of the poor in the population will be estimated by given by
∑ (
)
(3)
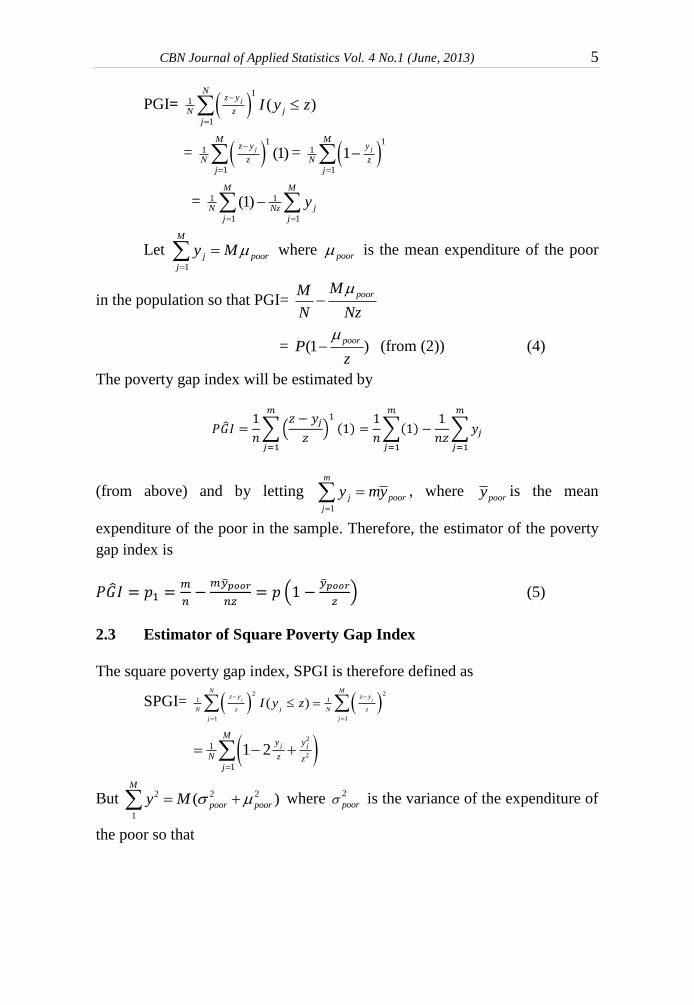
2.2 Estimator of Poverty Gap Index
The poverty gap index, PGI is defined as
CBN Journal of Applied Statistics Vol. 4 No.1 (June, 2013) 5
PGI= 1
1
1
( )j
Nz y
jN z
j
I y z
= 1
1
1
(1)j
Mz y
N z
j
= 1
1
1
1 j
My
N z
j
= 1 1
1 1
(1)M M
jN Nz
j j
y
Let 1
M
j poor
j
y M
where poor is the mean expenditure of the poor
in the population so that PGI=
= (from (2)) (4)
The poverty gap index will be estimated by
∑(
)
∑
∑
(from above) and by letting 1
m
j poor
j
y my
, where is the mean
expenditure of the poor in the sample. Therefore, the estimator of the poverty
gap index is
(
) (5)
2.3 Estimator of Square Poverty Gap Index
The square poverty gap index, SPGI is therefore defined as
SPGI= 2 2
1 1
1 1
( )j j
N Mz y z y
jN z N z
j j
I y z
2
2
1
1
1 2 j j
My y
N z zj
But where 2
poor is the variance of the expenditure of
the poor so that
poorMM
N Nz
(1 )poor
Pz
poory
2 2 2
1
( )M
poor poory M
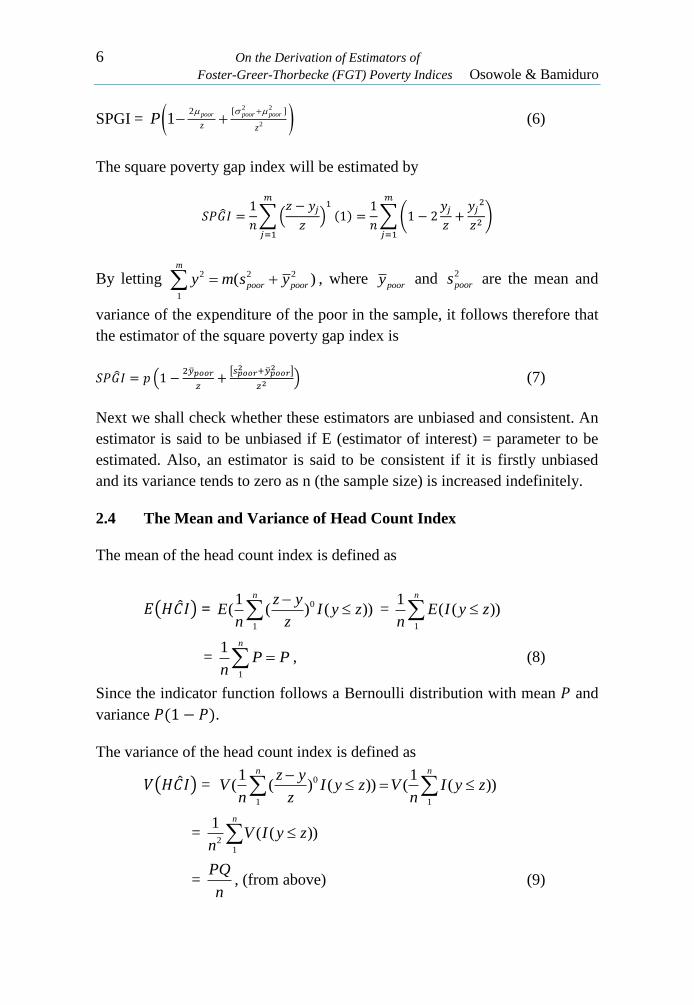
6 On the Derivation of Estimators of
Foster-Greer-Thorbecke (FGT) Poverty Indices Osowole & Bamiduro
SPGI = 2 2
2
2 [ ]1 poor poor poor
z zP
(6)
The square poverty gap index will be estimated by
∑(
)
∑(
)
By letting , where and are the mean and
variance of the expenditure of the poor in the sample, it follows therefore that
the estimator of the square poverty gap index is
(
[
]
) (7)
Next we shall check whether these estimators are unbiased and consistent. An
estimator is said to be unbiased if E (estimator of interest) = parameter to be
estimated. Also, an estimator is said to be consistent if it is firstly unbiased
and its variance tends to zero as n (the sample size) is increased indefinitely.
2.4 The Mean and Variance of Head Count Index
The mean of the head count index is defined as
( ) = 0
1
1( ( ) ( ))
n z yE I y z
n z
=
1
1( ( ))
n
E I y zn
= 1
1 n
P Pn
, (8)
Since the indicator function follows a Bernoulli distribution with mean and
variance .
The variance of the head count index is defined as
( ) = 0
1 1
1 1( ( ) ( )) ( ( ))
n nz yV I y z V I y z
n z n
= 2
1
1( ( ))
n
V I y zn
= PQ
n, (from above) (9)
2 2 2
1
( )m
poor poory m s y poory2
poors

CBN Journal of Applied Statistics Vol. 4 No.1 (June, 2013) 7
2.5 The Mean and Variance of Poverty Gap Index
The mean of the poverty gap index is defined as
( )= 1
1
1 -[ ( ) ( )]
n z yE I y z
n z
= 1
1 1 1
1 - 1[ ( ) ( )] [ ( ) ( )]
n n nz y yE I y z E I y z I y z
n z n z
( ) = 1 1
1 1( ( )) ( ( ))
n n
E I y z E yI y zn nz
= 1 1
1 1n npoorMM
n N nz N
= 1
1 1( ) ( )
npoorMnM
n N nz N
= 1 1
( ) ( )poornMnM
n N nz N
= poorMM
N Nz
= (1 )poor
Pz
(10)
The variance of the poverty gap index is defined as
1
21 1 1
1 1 1( ( ) ( )) ( (1 ) ( )) [ ( ) ( )]
n n nz y y yV I y z V I y z V I y z I y z
n z n z n z
Recall that ( ) ( ) ( ) 2 ( , )V A B V A V B Cov A B where ( )A I y z and
( )y
B I y zz
Note that 1
( ) ( ( ) and ( )n
V A V I y z PQ V A nPQ
2 2
2 2
1 1( ) ( ( ) [ ( ( ) [ ( ( )]V B V yI y z E y I y z E yI y z
z z (Recall
2 2V(X)=E(X )-{E(X)} )
It should be noted that by letting 1
poor
my my and 2 2 2
1
( )m
poor poory m s y
as before, then

8 On the Derivation of Estimators of
Foster-Greer-Thorbecke (FGT) Poverty Indices Osowole & Bamiduro
2 2 2( ( )) , ( ( )) ( ( )) [ ]poor
poor poor
MM ME I y z E yI y z and E y I y z
N N N
Thus 2 2 2
2
1( ) [ ] [ ]poor poor poor
M MV B
z N N
2 2 2
2
1[ ] [ ]poor poor poorP P
z
2 2 2 2 2 2 2 2
2 21
1[ ] [ ] , ( ) [ ] [ ]
n
poor poor poor poor poor poor
nP P V B P P
z z
Now
( , ) ( ) ( ) ( )
{ ( ). ( )} { ( )} { ( )}
Cov A B E AB E A E B
y yE I y z I y z E I y z E I y z
z z
2{ ( )} { ( )} { ( )}y y
E I y z E I y z E I y zz z
2 2{ ( )} { ( )} { ( )} [ ][ ]poor
y M y y M ME I y z E I y z E I y z
z N z z N Nz
{ ( )} { ( )} [ ]
( )( )
poor poor
poor poor
y y M ME I y z PE I y z P
z z Nz Nz
P P Pz z
2 (1 )poor poor poor poorP P P PQP
z z z z
1
, ( , )n
poornPQCov A B
z
Therefore variance of the poverty gap index, 1( )V p
becomes
2 2 2 2
1 2 2
21( ) [ ] [ ]
poor
poor poor poor
nPQnV p nPQ P P
n z z
2 2 2 2
2
21 1[ ] [ ]
poor
poor poor poor
PQPQ P P
n z z
2 2 2 2
2 2
21 poor poor poor poorPQ P P PPQ
n z z z

CBN Journal of Applied Statistics Vol. 4 No.1 (June, 2013) 9
=
2 2
2 2
2 (1 )1 poor poor poorPQ P P PPQ
n z z z
2 2
2 2
2
2
2
21
1(1 )
poor poor poor
poor poor
PQ PQ PPQ
n z z z
PPQ
n z z
(11)
Therefore the mean and variance of the poverty gap index are (1 )poor
Pz
and
2
2
2
1(1 )
poor poorPPQ
n z z
respectively.
2.6 The Mean and Variance of Square Poverty Gap Index
The mean of the square poverty gap index is defined as
( ) = 2 2
1 1
1 1( ( ) ( )) [ (1 ) ( ( )]
n nz y yE I y z E I y z
n z n z
2
21 1 1
1 2 1( ( )) ( ( )) ( ( ( ))
n n n
nE I y z E yI y z E y I y z
z z
= 2 2
2
2[ ]
poor
poor poor
n
n
MM M
N Nz Nz
2 2
2
2 2
2
2 [ ]1
21
poor poor poor
poor poor poor
M
N z z
Pz z
(12)
The variance of the square poverty gap index is defined as
2
2( ) ({1 } ( ))y
V p V I y zz
. Using the approach under poverty gap index, we
have that 4 2 2
2[ ] [(1 ) ( )] ( [(1 ) ( )])y y
V p E I y z E I y zz z
so that:
10 On the Derivation of Estimators of
Foster-Greer-Thorbecke (FGT) Poverty Indices Osowole & Bamiduro
44[(1 ) ( )] ( ( ) ( ( ))
2 3 46 4
( ( )) ( ( )) ( ( ))2 3 4
y yE I y z E I y z E I y z
z z
y y yE I y z E I y z E I y z
z z z
=
2 2
3, 4,
2 3 4
4 6 ( ) 4poor poor poor poor poorP P P PP
z z z z
2 2( [(1 ) ( )])y
E I y zz
=
2 2
2 2
2
2 [ ](1 )
poor poor poorP
z z
(from (12))
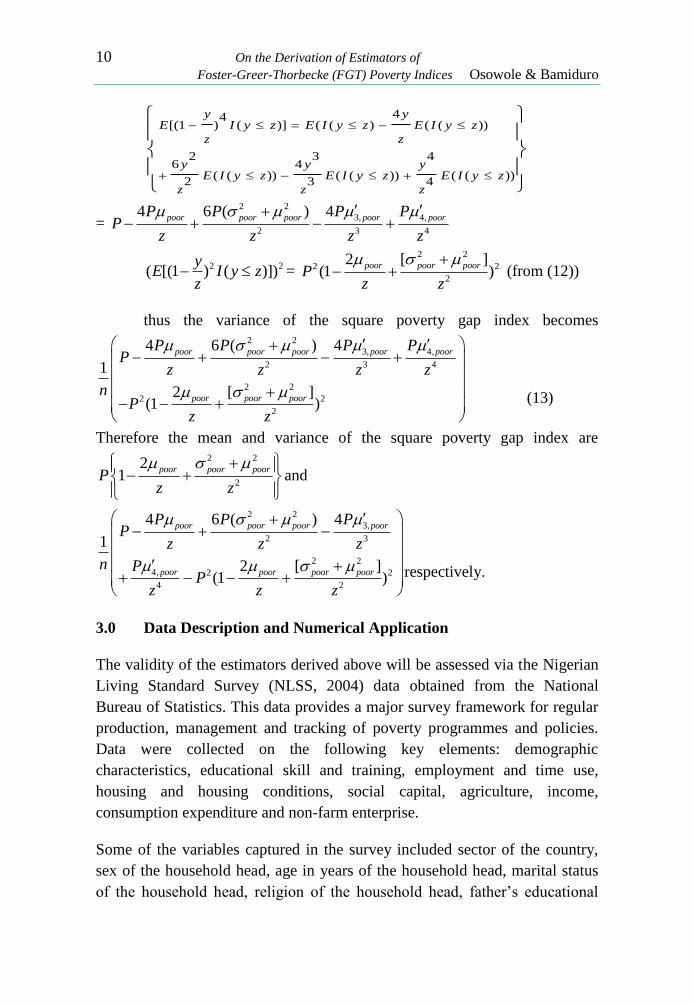
thus the variance of the square poverty gap index becomes 2 2
3, 4,
2 3 4
2 2
2 2
2
4 6 ( ) 4
1
2 [ ](1 )
poor poor poor poor poor
poor poor poor
P P P PP
z z z z
nP
z z
(13)
Therefore the mean and variance of the square poverty gap index are
2 2
2
21
poor poor poorP
z z
and
2 2
3,
2 3
2 2
4, 2 2
4 2
4 6 ( ) 4
1
2 [ ](1 )
poor poor poor poor
poor poor poor poor
P P PP
z z z
n PP
z z z
respectively.
3.0 Data Description and Numerical Application
The validity of the estimators derived above will be assessed via the Nigerian
Living Standard Survey (NLSS, 2004) data obtained from the National
Bureau of Statistics. This data provides a major survey framework for regular
production, management and tracking of poverty programmes and policies.
Data were collected on the following key elements: demographic
characteristics, educational skill and training, employment and time use,
housing and housing conditions, social capital, agriculture, income,
consumption expenditure and non-farm enterprise.
Some of the variables captured in the survey included sector of the country,
sex of the household head, age in years of the household head, marital status
of the household head, religion of the household head, father’s educational

CBN Journal of Applied Statistics Vol. 4 No.1 (June, 2013) 11
level, father’s work, mother’s educational level, mother’s work, household
size, expenditure of own produce, household expenditure on food, occupation
group the household head belongs, educational group for highest level
attained by the household, literacy of the household head and educational age
grouping. The survey was designed to give estimates at National, Zonal and
State levels.
The first stage was a cluster of housing units called Enumeration Area (EA),
while the second stage was the housing units. One hundred and twenty EAs
were selected and sensitized in each state, while sixty were selected in the
Federal Capital Territory. Ten EAs with five housing units were studied per
month. Thus a total of fifty housing units were canvassed per month in each
state and twenty-five in Abuja. The National Bureau of Statistics (Nigeria)
(NBS) field staff resident in the enumeration areas were responsible for data
collection for the survey. The total number of households with valid responses
in the survey was 19,158. The proxy used for poverty in this study was the per
capita expenditure of all the households. To obtain estimates for the estimators
earlier derived, a random sample of the per capita expenditure of 5000
households was selected from the 19,158 households. From the whole and
sampled datasets, the tables below are obtained:
4.0 Discussion of Results
Table 1: Estimates of FGT Indices obtained from Pα
z = N 23,734
P0 P1 P2
0.52098 0.21201 0.11406
Table 1 gives the estimates of the FGT poverty indices obtained directly from
the conventional Pα index while Table 2gives estimates of the FGT indices
obtained from the derived estimators. The head count, poverty gap and square
poverty indices are approximately 52%, 21% and 11% from the Pα index.
From the estimators, the indices are approximately 53%, 22% and 12%
respectively for the head count, poverty gap and square poverty indices in that
order. The appropriateness of the estimators is not in doubt due to closeness of
the estimates of the FGT poverty indices obtained from the two approaches.
These estimators are indeed unbiased since in each case, since E (estimator) =
parameter of interest. Also, they are generally consistent since the estimators

12 On the Derivation of Estimators of
Foster-Greer-Thorbecke (FGT) Poverty Indices Osowole & Bamiduro
are firstly unbiased and their variances tend to zero as n is increased
indefinitely.
Table 2: Estimates of FGT Indices obtained from the Derived Estimators
5.0 Conclusion
This paper has attempted to fill some gaps in knowledge on the statistical
properties of Forster-Greer-Thorbecke (FGT) poverty indices by deriving
estimators for these indices. The estimators are found to be unbiased and
consistent and the estimates from the derived estimators correlate well with
estimates obtained directly from the Pα index. This confirms the validity of the
derived estimators as an alternative computational approach in estimating the
FGT poverty indices. Therefore an insight has been provided by this study
into some possible characteristics of the FGT poverty indices.
References
Collier, P. and J. Gunning (1999). “Explaining African Economic
Performance”, Journal of Economic Literature, March, XXXVI 64 -
111.
Foster, J., Greer J. and Thorbecke, E. (1984). “A Class of Decomposable
Poverty Measures”,Econometrica. 52: 761-765.
Grootaert, C. and Braithwaite, J. (1998). “Poverty and Indicator Based
Targeting in Eastern Europe and former Soviet Union”, Washington,
D.C.: World Bank Policy Research Working Paper no. 1994.
NLSS (2004). A National Living Standard Survey conducted by the National
Bureau of Statistics (NBS), Abuja.
Index Estimator Estimate
P0
0.53240
P1
0.21600
P2
0.11549
where 𝒎=2662, 𝒏=5000, 𝒚 poor = N14103.2203, z= N23734, 𝒔𝒑𝒐𝒐𝒓𝟐 = N29437397.94
m1 z-y m0hci= ( ) (1)= = pn z n1
1 (1 ) (1 )poor poor poormy y ym m
pgi p pn nz n z z
2 2
2 2
2 [ ](1 )
poor poor poory s yspgi p p
z z

CBN Journal of Applied Statistics Vol. 4 No.1 (June, 2013) 13
Nwaobi, G.C. (2000).“The Knowledge Economics Trends and Perspectives”,
Lagos: Quanterb / Goan Communications.
Nwaobi, G.C. (2003). “Solving the Poverty Crisis in Nigeria: An Applied
General Equilibrium Approach”. December 17, 2012.
(http://ideas.repec.org/p/wpa/wuwpco/0312003.pdf)
Omonona, B.T, E.J. Udoh, and A.A. Adeniran (2008). “Poverty and its
Determinants among Nigerian Farming Households: Evidence from
Akinyele LGA of Oyo State, Nigeria”, European Journal of Social
Sciences, Volume 6, Number 3, Pp. 402-412.
Ravallion, M. (1996). “Issues in Measuring and Modelling Poverty”, The
Economic Journal,106 (September) Pp. 1328-1343.
Sanyal, B. (1991). “Organising the Self-Employed: The Poverty of the Urban
Informal Sector”, International Labour Review, 30(1): 39-56, 1991.
Schubert, R. (1994). “Poverty in Developing Countries: Its definition, extent
and implication”. Economics, 149/150: 17-40.
Sen, A. (1999). “Hunger and Public Action”, Oxford: Clarerdon
Soludo, C. (2006). Potential Impacts of the New Global Financial
Architecture on Poor Countries”, Edited by Charles Soludo, Monsuru
Rao, ISBN 9782869781580, 2006, CODERSIA, Senegal,
Paperback.80 pages
Ucha, C. (2010). “Poverty in Nigeria: Some Dimensions and Contributing
Factors”, Global Majority E-Journal, Vol.1, No.1, 46-56.
World Bank (1999). “Understanding and Responding to Poverty”, December
15, 2012 http//www.worldbank.org/Poverty/Mission/up/l.htm
World Bank (2001). “World Development Report 2000/2001 – Attacking
Poverty”, New York: Oxford University Press.