On Point 2015
71
On Point 2015
-
Upload
university-of-nevada-las-vegas -
Category
Documents
-
view
217 -
download
1
description
On Point and UNLV’s legislative website include important institutional information and metrics for the benefit of policy-makers, college staff and administrators, and the public.
Transcript of On Point 2015

On Point 2 0 1 5

On Point and UNLV’s legislative website include important institutional information and metrics for the benefit of policy-makers, college staff and administrators, and the public. For more information about our legislative priorities as well as an electronic version of this document, please scan the code below or visit unlv.edu/nvleg.

On Point
2015
University of Nevada, Las Vegas


Student Enrollment and FTE Fall Enrollment ................................................................ 3 Student Level Enrollment ................................................. 4 Undergraduate Enrollment by Residency ............................ 5 Undergraduate Minority Enrollment by Ethnicity .................. 6 Honors College Enrollment ............................................... 7 Millennium Scholarship Enrollment .................................... 8 New Freshmen and Transfer Enrollment ............................. 9 New Undergraduate Transfer Student Profile .................... 10 Graduate Student Enrollment .......................................... 11 Graduate FTE ................................................................ 12 WUE Enrollment by State of Origin .................................. 13 International Student Enrollment .................................... 14 Number of Undergraduates by Credits Enrolled ................. 15 Undergraduate Course Section Size ................................. 16 Weighted Student Credit Hours ....................................... 17 New Freshmen New Freshmen by Residency .......................................... 21 New Undergraduate Transfers by Residency ..................... 22 Average SAT Scores of New Freshmen ............................. 23 Average High School GPA of New Freshmen ..................... 24 Freshmen from Top 10% & Top 25% of High School Class .. 25 First to Second Year Retention Rate ................................. 26 Graduation Six-Year Graduation Rates by High School GPA ................. 29 Total Degrees Conferred /100 FTE ................................... 30 STEM Degrees Conferred ................................................ 31 STEM Doctoral Degrees Conferred ................................... 32 Persistence and Graduation of New Freshmen ................... 33 Persistence and Graduation of New Freshmen Minorities .... 34 Graduation Rates of New In-State Freshmen ................... 35 Graduation Rates of New Out-of-State Freshmen ............. 36 Persistence and Graduation of New Transfers.................... 37 Six-Year Graduation Rates of New Freshman Athletes ........ 38
TABLE OF CONTENTS

TABLE OF CONTENTS (continued)
Faculty University Student/Faculty Ratio.................................... 41 Undergraduate Student Credit Hours Taught by Type of Instructor .................................................................. 42 Undergraduate Student Credit Hours Taught by Tenure Track Faculty ....................................................................... 43 External Activity Total Gift Income ......................................................... 47 Total Gift & Commitment Support .................................. 48 Summary of Private Support: Total Number of Donors ..... 49 Summary of Private Support: Gift-Giving History ............. 50 Financial Information Economic Impact of UNLV on Southern Nevada ............... 53 2013-14 Actual Revenue .............................................. 54 2013-14 Actual Expenditures ........................................ 55 Institutional Support as a Percent of Total Expenditures ... 56 Higher Education Share of Nevada General Fund ............. 57 Total Sponsored Program Expenditures .......................... 58 Total Sponsored Program Expenditures Excluding Financial Aid ............................................................... 59 Total Sponsored Program Research Expenditures ............ 60 UNLV’s Tuition Rank Among WICHE Institutions .............. 61 Average Resident Tuition at WICHE Institutions ............... 62 Average Non-Resident Tuition at WICHE Institutions ........ 63

Student Enrollment and FTE


Fall Enrollment
3
Student Enrollment and FTE
Note: Includes state and non-state supported enrollment.
25,000
26,000
27,000
28,000
29,000
30,000
2005 2006 2007 2008 2009 2010 2011 2012 2013 2014
Fall Total Headcount
2005 28,1042006 27,9122007 27,9882008 28,6052009 29,0692010 28,2032011 27,3642012 27,3892013 27,8482014 28,515

Student Level Enrollment
4
Note: Students enrolled in graduate/professional dual degree programs are included in both categories. Includes state and non-state supported enrollment.
-
1,000
2,000
3,000
4,000
5,000
6,000
0
2,500
5,000
7,500
10,000
12,500
15,000
17,500
20,000
22,500
25,000
27,500
2005 2006 2007 2008 2009 2010 2011 2012 2013 2014
Un
derg
rad
uate
Gra
du
ate
/P
rofe
ssio
nal
Undergraduate
Graduate
Professional
Fall Undergraduate GraduateProfessional
(Law & Dental) Total
2005 22,077 5,260 786 28,1232006 21,853 5,281 799 27,9332007 21,962 5,250 796 28,0082008 22,149 5,656 812 28,6172009 22,708 5,556 822 29,0862010 22,538 4,880 804 28,2222011 22,138 4,446 794 27,3782012 22,432 4,204 766 27,4022013 23,099 4,023 742 27,8642014 23,813 4,010 715 28,538
Student Enrollment and FTE

Undergraduate Enrollment by Residency
0
5,000
10,000
15,000
20,000
25,000
2005 2006 2007 2008 2009 2010 2011 2012 2013 2014
Resident
Non-Resident
Student Enrollment and FTE
5
Fall Resident Non-Resident Total
2005 16,632 5,445 22,0772006 16,542 5,311 21,8532007 16,823 5,139 21,9622008 17,196 4,953 22,1492009 18,233 4,475 22,7082010 18,456 4,082 22,5382011 18,237 3,901 22,1382012 18,472 3,960 22,4322013 19,272 3,827 23,0992014 20,003 3,810 23,813

6
Student Enrollment and FTE
Note: Beginning in Fall 2009, race/ethnicity categories reflect new federal requirements and are not comparable to previous years.
0
2,000
4,000
6,000
8,000
10,000
12,000
14,000
16,000
2005 2006 2007 2008 2009 2010 2011 2012 2013 2014
Minority
Non-Minority
FallAfrican-
American AsianHispanic/
LatinoNative
American
Native Hawaiian/
Pacific Islander
Two or More Races
Minority Total
2005 1,796 3,117 2,498 242 - - 7,6532006 1,810 3,369 2,630 237 - - 8,0462007 1,885 3,682 2,840 225 - - 8,6322008 1,932 4,058 3,059 205 - - 9,2542009 1,891 3,643 3,784 175 530 874 10,8972010 1,877 3,512 3,982 154 533 1,029 11,0872011 1,747 3,674 4,204 128 471 1,155 11,3792012 1,764 3,589 4,751 90 430 1,387 12,0112013 1,754 3,759 5,313 69 386 1,750 13,0312014 1,814 3,667 5,937 71 343 2,057 13,889
Undergraduate Minority Enrollment By Ethnicity

Honors College Enrollment
7
0
100
200
300
400
500
600
2005 2006 2007 2008 2009 2010 2011 2012 2013 2014
Total
First-time Freshmen
Student Enrollment and FTE
Fall
Honors College
First-Time Freshmen
All Honors College
Students Enrolled
2005 115 5442006 93 5072007 109 5062008 110 4972009 97 4412010 94 4312011 94 4262012 63 3982013 123 4282014 183 525
Note: Includes full-time students only.

Millennium Scholarship Enrollment
8
0
1,000
2,000
3,000
4,000
5,000
6,000
7,000
2005 2006 2007 2008 2009 2010 2011 2012 2013 2014
All Millennium Scholars
First-time Freshman Millennium Scholars
Student Enrollment and FTE
Fall
First-time Freshmen Millennium Scholars
All Millennium Scholars Enrolled
2005 1,806 6,4172006 1,719 6,0022007 1,771 5,9772008 1,888 6,1102009 1,866 5,8952010 1,815 5,7052011 1,697 5,4032012 1,932 5,4382013 2,075 5,6092014 2,027 5,940

New Freshmen and Transfer Enrollment
9
Student Enrollment and FTE
1,500
2,000
2,500
3,000
3,500
4,000
2005 2006 2007 2008 2009 2010 2011 2012 2013 2014
Transfers
New Freshmen
FallNew
FreshmenTransfer Students Total
2005 3,177 2,349 5,5262006 2,768 2,090 4,8582007 2,978 2,160 5,1382008 3,255 2,302 5,5572009 3,236 2,513 5,7492010 3,115 2,314 5,4292011 2,870 2,411 5,2812012 3,294 2,343 5,6372013 3,773 2,465 6,2382014 3,865 2,378 6,243

Student Enrollment and FTE
10
# % # % # %NSHE Institutions 1,175 50% 1,202 49% 1,322 56% CSN 1,009 43% 1,015 41% 1,133 48% UNR 71 3% 98 4% 98 4% UNLV 37 2% 23 1% 21 1% NSC 24 1% 33 1% 27 1% TMCC 16 1% 19 1% 25 1% GBC 12 1% 9 0% 11 0% WNC 6 0.3% 5 0.2% 7 0.3%Non-NSHE Institutions 977 42% 1,075 44% 1,053 44%Singapore 191 8% 186 8% 3 0%Unknown - 0% 2 0% - 0%Total New Transfers 2,343 100% 2,465 100% 2,378 100%
Fall 2014Fall 2012 Fall 2013
Note: Does not include Singapore campus.
- 200 400 600 800 1,000 1,200
Non-NSHE
Other NSHE
CSN
Fall 2014
New Undergraduate Transfer Student Profile

11
0
1,000
2,000
3,000
4,000
5,000
6,000
2005 2006 2007 2008 2009 2010 2011 2012 2013 2014
Total
New
Student Enrollment and FTE
FallNew Graduate
StudentsTotal Graduate
Students
2005 1,092 5,2602006 1,363 5,2812007 1,241 5,2502008 1,369 5,6562009 1,467 5,5562010 1,397 4,8802011 1,401 4,4462012 1,365 4,2042013 1,212 4,0232014 1,263 4,010
Graduate Student Enrollment
Notes: 1) Excludes William S. Boyd School of Law and the School of Dental Medicine. 2) Includes state and non-state supported enrollments.

Graduate FTE
12
Student Enrollment and FTE
Notes: 1) Excludes William S. Boyd School of Law and the School of Dental Medicine. 2) Represents FTE generated by enrollment in graduate courses.
1,500
2,000
2,500
3,000
3,500
05-06 06-07 07-08 08-09 09-10 10-11 11-12 12-13 13-14
Academic Year Annual FTE
2005-06 2,6092006-07 2,9312007-08 3,2062008-09 3,0822009-10 3,1082010-11 2,9342011-12 2,4942012-13 2,4202013-14 2,467

Western Undergraduate Exchange (WUE)Enrollment by State of Origin
13
Student Enrollment and FTE
Fall 2005 2006 2007 2008 2009 2010 2011 2012 2013 2014California - - 50 149 255 222 182 313 403 428Hawai'i 597 510 436 371 311 175 107 136 163 204Washington 292 251 200 164 137 82 59 50 66 61Arizona 132 150 122 99 83 58 41 39 42 52Colorado 250 212 146 120 96 47 39 42 46 58Oregon 139 129 94 85 70 35 28 21 21 26Alaska 151 130 97 76 59 32 17 14 6 9Utah 95 85 54 47 33 21 16 18 9 12Wyoming 61 43 39 33 21 13 7 5 5 4Idaho 63 48 28 25 15 12 9 9 9 14New Mexico 88 79 52 36 23 11 12 9 10 9Montana 37 34 23 19 20 10 8 9 8 12South Dakota 20 21 17 14 13 4 3 2 3 2North Dakota 22 21 19 13 9 3 3 2 1 1N Mariana Islands 1TOTAL 1,947 1,713 1,377 1,251 1,145 725 531 669 795 897New Freshmen 296 206 149 176 181 21 149 180 254 253
0
200
400
600
800
1,000
1,200
1,400
1,600
1,800
2,000
2005 2006 2007 2008 2009 2010 2011 2012 2013 2014
Total Enrollment
New Freshmen
WUE scholarships are available to students from the WICHE states listed above. Non-resident stu-dents receiving these awards are charged 150% of the in-state tuition rate.

International Student Enrollment
14
0
200
400
600
800
1000
1200
2005 2006 2007 2008 2009 2010 2011 2012 2013 2014
Undergraduate
Graduate/Professional
Student Enrollment and FTE
FallUnder-
graduateGraduate/
Professional Total
2005 965 405 1,3702006 1,005 420 1,4252007 1,014 388 1,4022008 977 409 1,3862009 933 431 1,3642010 949 406 1,3552011 940 339 1,2792012 815 213 1,0282013 663 248 9112014 915 311 1,226

Number of Undergraduates by Credits Enrolled
15
Student Enrollment and FTE
20%
25%
30%
35%
40%
45%
50%
2005 2006 2007 2008 2009 2010 2011 2012 2013 2014
Less than 12 Credits
12-14 Credits
Greater than or equalto 15 Credits
Fall 1-11 12-14 15+ Total 1-11 12-14 15+2005 5,413 10,259 6,405 22,077 25% 46% 29%2006 5,906 9,787 6,160 21,853 27% 45% 28%2007 6,072 9,818 6,072 21,962 28% 45% 28%2008 6,079 10,200 5,870 22,149 27% 46% 27%2009 6,120 10,409 6,179 22,708 27% 46% 27%2010 5,821 10,728 5,989 22,538 26% 48% 27%2011 5,932 10,282 5,924 22,138 27% 46% 27%2012 6,401 10,195 5,836 22,432 29% 45% 26%2013 6,403 10,143 6,553 23,099 28% 44% 28%2014 6,176 9,926 7,711 23,813 26% 42% 32%
Undergraduates by Credits Enrolled Percent Distribution

Undergraduate Course Section Size
16
Student Enrollment and FTE
0%
10%
20%
30%
40%
50%
60%
70%
2005 2006 2007 2008 2009 2010 2011 2012 2013 2014
20-49 students
Fewer than 20 students
50 or more students
Fall 1 - 19 20 - 49 50 or more2005 29% 57% 14%2006 35% 53% 12%2007 37% 50% 13%2008 27% 57% 16%2009 28% 56% 16%2010 25% 57% 18%2011 28% 55% 18%2012 27% 54% 19%2013 26% 56% 18%2014 21% 60% 19%
Percentage of Students byCourse Section Size

Weighted Student Credit Hours
17
Student Enrollment and FTE
Note: Includes formula-funded student credit hours for courses completed by in-state students. Student credit hours are weighted in accordance to the relative cost of instruction, with weights defined by discipline clusters and level of instruction.
Lower Div. Upper Div.2011 138,997.5 185,053.6 80,515.6 36,998.5 441,565.2 2012 153,099.5 184,657.0 76,558.9 37,452.8 451,768.2 2013 162,503.0 187,726.6 75,818.1 37,176.7 463,224.3
Undergraduate Masters Doctoral TotalFall
Weig
hte
d S
tud
en
t C
red
it H
ou
rs
0
50,000
100,000
150,000
200,000
250,000
300,000
350,000
400,000
450,000
500,000
Fall 2011 Fall 2012 Fall 2013
Doctoral
Masters
Upper DivisionUndergraduateLower DivisionUndergraduate


New Freshmen


New Freshmen
New Freshmen by Residency
21
0
500
1,000
1,500
2,000
2,500
3,000
3,500
2005 2006 2007 2008 2009 2010 2011 2012 2013 2014
Residents
Non-Residents
Fall Residents Non-Residents Total
2005 2,387 790 3,1772006 2,220 548 2,7682007 2,359 619 2,9782008 2,607 648 3,2552009 2,690 546 3,2362010 2,689 426 3,1152011 2,421 449 2,8702012 2,683 611 3,2942013 3,102 671 3,7732014 3,183 682 3,865

New Undergraduate Transfers by Residency
22
New Freshmen
0
200
400
600
800
1,000
1,200
1,400
1,600
1,800
2,000
2005 2006 2007 2008 2009 2010 2011 2012 2013 2014
Residents
Non-Residents
Fall ResidentsNon-
Residents Total
2005 1,436 913 2,3492006 1,293 797 2,0902007 1,410 750 2,1602008 1,567 735 2,3022009 1,841 672 2,5132010 1,488 826 2,3142011 1,549 862 2,4112012 1,535 808 2,3432013 1,675 790 2,4652014 1,729 649 2,378

New Freshmen
960
970
980
990
1000
1010
1020
1030
1040
2006 2007 2008 2009 2010 2011 2012 2013 2014
Average SAT Scores of New Freshmen
23
Residents
Non-Residents
Note: Test scores are required for admission beginning in fall 2013.
Fall ResNon-Res Total Res
Non-Res Total Res
Non-Res Total
2003 512 489 505 518 509 515 1,030 998 1,0202004 509 487 502 514 510 513 1,023 997 1,0152005 512 486 504 516 510 514 1,028 996 1,0182006 503 491 501 519 512 517 1,022 1,003 1,0182007 507 489 503 517 523 518 1,024 1,012 1,0212008 505 483 500 516 519 517 1,021 1,002 1,0172009 504 487 501 514 522 515 1,018 1,009 1,0162010 509 486 505 518 518 518 1,027 1,004 1,0232011 505 479 501 508 512 508 1,013 991 1,0092012 498 483 495 502 506 502 1,000 989 9972013 501 486 498 504 513 506 1,002 994 1,0012014 503 482 500 501 510 503 1,001 986 999
SAT Verbal SAT Math SAT Total

Average High School GPA of New Freshmen
24
3.00
3.10
3.20
3.30
3.40
2005 2006 2007 2008 2009 2010 2011 2012 2013 2014
Residents
Non-Residents
New Freshmen
Fall ResidentNon-
Resident Total
2005 3.25 3.13 3.222006 3.29 3.22 3.282007 3.3 3.23 3.292008 3.27 3.17 3.252009 3.27 3.19 3.262010 3.23 3.18 3.232011 3.23 3.19 3.232012 3.24 3.22 3.242013 3.19 3.26 3.212014 3.23 3.25 3.24

Freshmen from Top 10% & Top 25% of High School Class
25
New Freshmen
0%
10%
20%
30%
40%
50%
60%
70%
2005 2006 2007 2008 2009 2010 2011 2012 2013 2014
Top 25%Top 10%
Fall Top 10 Percent
Top 25 Percent
2005 18% 45%2006 17% 48%2007 18% 50%2008 20% 52%2009 22% 53%2010 25% 58%2011 25% 56%2012 23% 54%2013 19% 47%2014 21% 51%

First to Second Year Retention Rate New Freshmen
26
New Freshmen
65%
70%
75%
80%
2004 2005 2006 2007 2008 2009 2010 2011 2012 2013
Entering Fall Term
Continued to Second Year
2004 72.2%2005 70.5%2006 74.6%2007 75.9%2008 73.2%2009 77.8%2010 76.4%2011 76.3%2012 77.3%2013 76.7%

Graduation


Six-Year Graduation Rates by High School GPA
29
Graduation
0%
10%
20%
30%
40%
50%
60%
70%
2002 2003 2004 2005 2006 2007 2008
3.5 and higher
3.0 to 3.49
2.5 to 2.99
2.0 to 2.49
GPA Range 2003 2004 2005 2006 2007 2008
3.5 and higher 55% 58% 58% 59% 61% 58%3.0 to 3.49 38% 39% 36% 37% 40% 34%2.5 to 2.99 26% 22% 25% 24% 20% 23%2.0 to 2.49 13% 22% 16% 11% 14% 21%
3.5 and higher 782 881 847 784 867 9163.0 to 3.49 1,260 1,395 1,218 1,196 1,301 1,3552.5 to 2.99 668 684 753 449 477 6302.0 to 2.49 61 72 57 46 59 82
First Enrolled Fall of

Total Degrees Conferred/100 FTE
Graduation
30
Note: Excludes Professional degrees. Source: IPEDS Completions Survey
0.0
5.0
10.0
15.0
20.0
25.0
30.0
2008-09 2009-10 2010-11 2011-12 2012-13 2013-14
2008-09 2009-10 2010-11 2011-12 2012-13 2013-14
Baccalaureate 3,737 3,627 3,771 3,670 3,857 3,726
Master 1,222 1,264 1,277 1,217 1,010 928Doctoral 134 140 150 153 156 124Total 1,356 1,404 1,427 1,370 1,166 1,052
Grand Total 5,093 5,031 5,198 5,040 5,023 4,778
Annual FTE 19,543.9 20,086.5 19,718.9 18,579.6 18,499.5 19,268.6Degrees Conferred per 100 FTE
26.1 25.0 26.4 27.1 27.2 24.8

Science, Technology, Engineering, and Mathematics (STEM) Degrees Conferred
Graduation
31
Note: Excludes Professional degrees. STEM fields as defined by NSHE.
550
600
650
700
750
800
850
900
950
1000
1050
1100
04-05 05-06 06-07 07-08 08-09 09-10 10-11 11-12 12-13 13-14
Academic Year
Deg
rees
Co
nfe
rred
04-05 05-06 06-07 07-08 08-09 09-10 10-11 11-12 12-13 13-14Baccalaureate 468 522 553 562 567 571 593 605 622 698
Master 153 193 161 190 189 199 203 198 169 168Doctoral 10 13 26 44 70 70 72 71 61 68Total 163 206 187 234 259 269 275 269 230 236
Grand Total 631 728 740 796 826 840 868 874 852 934
% of Degrees Conferred 15% 16% 16% 15% 16% 17% 17% 17% 17% 19%
Academic Year

Science, Technology, Engineering, and Mathematics (STEM) Doctoral Degrees Conferred
Graduation
32
Note: Excludes Professional degrees. STEM fields as defined by the Carnegie Foundation.
0
20
40
60
80
100
120
140
160
180
04-05 05-06 06-07 07-08 08-09 09-10 10-11 11-12 12-13 13-14Academic Year
Do
cto
ral
Deg
rees
Co
nfe
rred
Academic YearAll Research Doctorates
STEM Research Doctorates
04-05 36 1005-06 59 1306-07 82 907-08 91 2308-09 134 2609-10 140 3710-11 151 3911-12 153 2312-13 156 2413-14 124 25
All Research Doctorates
STEM Research Doctorates

Persistence and Graduation of New Freshmen
33
Graduation
Fall Entered
4 years
5 years
6 years
6 years (Cumulative)
Still Enrolled
Still Enrolled or Graduated
1999 14% 18% 9% 41% 12% 53%2000 11% 20% 8% 39% 12% 51%2001 13% 18% 10% 41% 11% 52%2002 12% 19% 10% 41% 11% 52%2003 12% 18% 9% 39% 11% 50%2004 14% 18% 9% 41% 10% 51%2005 14% 18% 8% 40% 9% 49%2006 15% 19% 8% 42% 11% 53%2007 15% 19% 10% 43% 11% 54%2008 14% 16% 9% 39% 12% 52%
Graduation In

Persistence and Graduation of New Freshmen Minorities
34
Graduation
0%
10%
20%
30%
40%
50%
60%
1999 2000 2001 2002 2003 2004 2005 2006 2007 2008
Still Enrolled
Graduated within 6 years
Graduated within 5 years
Graduated within 4 years
Fall Entered
4 years
5 years
6 years
6 years (Cumulative)
Still Enrolled
Still Enrolled or Graduated
1999 11% 19% 8% 39% 13% 52%2000 10% 20% 9% 39% 13% 51%2001 10% 20% 10% 40% 13% 52%2002 11% 19% 8% 38% 12% 50%2003 10% 19% 11% 40% 13% 52%2004 13% 16% 9% 38% 12% 50%2005 12% 18% 8% 38% 10% 47%2006 13% 20% 8% 41% 12% 54%2007 12% 20% 11% 43% 13% 55%2008 13% 15% 10% 37% 14% 52%
Graduation In

Graduation Rates of New In-State Freshmen
35
Graduation
Fall Entered
4 years
5 years
6 years
6 years (Cumulative)
1999 12% 18% 10% 40%2000 10% 19% 9% 37%2001 10% 18% 11% 40%2002 12% 18% 11% 40%2003 10% 18% 10% 38%2004 12% 18% 10% 40%2005 12% 18% 9% 39%2006 13% 19% 9% 41%2007 12% 19% 10% 42%2008 13% 16% 9% 39%
Graduation In

Graduation Rates of New Out-of-State Freshmen
36
Graduation
Fall Entered
4 years
5 years
6 years
6 years (Cumulative)
1999 19% 19% 7% 44%2000 16% 21% 7% 44%2001 19% 18% 6% 43%2002 14% 21% 7% 43%2003 17% 17% 9% 43%2004 20% 17% 7% 44%2005 18% 18% 5% 41%2006 20% 19% 5% 44%2007 24% 18% 6% 48%2008 17% 17% 7% 41%
Graduation In

Persistence and Graduation of New Transfers
37
Graduation
Fall Entered
4 years
5 years
6 years
6 years (Cumulative)
Still Enrolled
Still Enrolled or Graduated
1999 42% 6% 3% 51% 5% 56%2000 42% 6% 3% 51% 5% 55%2001 42% 6% 3% 50% 5% 55%2002 41% 6% 3% 50% 5% 55%2003 42% 6% 3% 51% 5% 57%2004 44% 6% 3% 53% 4% 57%2005 43% 5% 3% 51% 4% 55%2006 45% 6% 3% 54% 4% 58%2007 45% 6% 3% 54% 4% 58%2008 47% 6% 3% 55% 4% 59%
Graduation In

Six-Year Graduation Rates of New Freshman Athletes
38
Graduation
0%
10%
20%
30%
40%
50%
60%
70%
80%
90%
100%
1998-99
1999-00
2000-01
2001-02
2002-03
2003-04
2004-05
2005-06
2006-07
2007-08
Entering Year
Graduation Rate
1998-99 52%1999-00 54%2000-01 56%2001-02 58%2002-03 52%2003-04 68%2004-05 57%2005-06 68%2006-07 63%2007-08 53%

Faculty


University Student/Faculty Ratio
41
Faculty
Note: Fall FTE students to total FTE faculty, calculated as defined in U.S. News and World Report America’s Best Colleges.
Academic Year
U.S. News & World Report
2004-05 202005-06 202006-07 182007-08 182008-09 202009-10 212010-11 222011-12 222012-13 212013-14 21

Undergraduate Student Credit Hours Taught by Type of Instructor
42
Faculty
0%
5%
10%
15%
20%
25%
30%
2010 2011 2012 2013 2014
Part-Time
Assoc Professor
Grad Asst
Asst Professor
Professor
Lecturer
Other
Fall Prof Assoc Asst LectPart Time
Grad Asst Other
2005 10.4% 12.8% 18.0% 6.6% 36.8% 12.9% 2.4%2006 10.0% 14.6% 18.1% 9.0% 33.7% 12.5% 2.2%2007 11.0% 15.9% 16.5% 7.0% 36.1% 11.3% 2.2%2008 11.7% 17.2% 14.2% 11.4% 28.9% 13.8% 2.6%2009 12.1% 19.1% 13.2% 8.1% 28.0% 16.2% 3.3%2010 14.2% 20.0% 15.3% 9.0% 22.5% 16.0% 2.9%2011 15.4% 17.6% 12.3% 9.4% 25.8% 16.6% 2.9%2012 15.0% 18.1% 13.4% 10.0% 25.9% 14.3% 3.3%2013 15.2% 15.2% 14.9% 9.3% 27.2% 14.7% 3.5%2014 12.9% 14.8% 18.5% 10.5% 27.1% 13.2% 3.1%

Faculty
Undergraduate Student Credit Hours Taught by Tenure Track Faculty
43
0%
5%
10%
15%
20%
25%
30%
35%
40%
45%
50%
2008 2009 2010 2011 2012 2013 2014
2008 2009 2010 2011 2012 2013 2014
College % % % % % % %
Business 48 49 69 66 63 68 58Education 20 18 27 16 13 13 9Engineering 52 53 56 58 61 59 54Fine Arts 36 37 37 35 32 34 31Health Sciences 44 45 46 77 55 45 36Hotel Administration 48 54 57 54 54 50 49Liberal Arts 29 27 30 29 26 25 22Nursing 30 32 23 7 14 23 21Public Health 32 41 51 46 45 41 36Sciences 57 52 58 47 53 46 43Urban Affairs 42 34 43 37 40 31 30Totals 39% 39% 44% 41% 40% 40% 34%
To
tal
Perc
en
t


External Activity


0
5
10
15
20
25
30
35
40
45
50
2005 2006 2007 2008 2009 2010 2011 2012 2013 2014
Total Gift Income
47
Note: Includes cash, in kind and service contributions only.
External Activity
Fiscal Year Total Gift Income2005 $32,238,8512006 $42,019,4722007 $45,664,5272008 $32,414,6542009 $37,612,4212010 $43,739,8372011 $30,350,5052012 $38,859,5282013 $33,071,9012014 $25,642,113
$ i
n M
illio
ns

Total Gift and Commitment Support
48
Note: Includes cash, in kind, service contributions, documented gift commitments and funds through private grants.
0
10
20
30
40
50
60
70
80
90
100
2005 2006 2007 2008 2009 2010 2011 2012 2013 2014
$ i
n M
illio
ns
Fiscal YearTotal Gifts &
Commitments
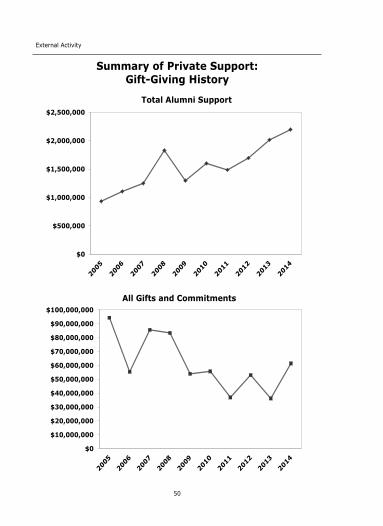
2005 $94,397,4622006 $55,380,3162007 $85,632,0082008 $83,406,3422009 $53,939,5462010 $55,732,0922011 $36,962,7702012 $53,081,2892013 $36,204,3422014 $61,479,367
External Activity

Summary of Private Support: Total Number of Donors
49
0
2,000
4,000
6,000
8,000
10,000
12,000
2005 2006 2007 2008 2009 2010 2011 2012 2013 2014
All Donors
Alumni Donors
External Activity
Fiscal Year
2005 2,665 $935,021 6,466 $94,397,4622006 2,293 $1,107,036 6,173 $55,380,3162007 2,263 $1,250,754 5,642 $85,632,0082008 2,265 $1,830,668 5,943 $83,406,3422009 3,155 $1,296,203 6,995 $53,939,5462010 4,558 $1,601,615 9,122 $55,732,0922011 4,709 $1,485,492 9,115 $36,962,9702012 4,721 $1,695,483 9,524 $53,081,2892013 5,161 $2,014,720 10,186 $36,204,3422014 5,349 $2,196,990 10,510 $61,479,367
Alumni Donors All Donors
Summary of Private Support: Gift-Giving History
50
External Activity
$0
$10,000,000
$20,000,000
$30,000,000
$40,000,000
$50,000,000
$60,000,000
$70,000,000
$80,000,000
$90,000,000
$100,000,000All Gifts and Commitments
$0
$500,000
$1,000,000
$1,500,000
$2,000,000
$2,500,000
Total Alumni Support
Summary of Private Support: Gift-Giving History
50
External Activity
$0
$10,000,000
$20,000,000
$30,000,000
$40,000,000
$50,000,000
$60,000,000
$70,000,000
$80,000,000
$90,000,000
$100,000,000All Gifts and Commitments
$0
$500,000
$1,000,000
$1,500,000
$2,000,000
$2,500,000
Total Alumni Support

Financial Information


Economic Impact of UNLV on Southern Nevada
Financial Information
53
Source: Center for Business and Economic Research, Lee Business School, UNLV
Including multiplier effects, UNLV generated $1.772 billion to the Southern Nevada economy during 2013.
UNLV’s direct economic impact, accounting for university and employment expenditures, student expenditures and visitor expenditures is estimated at nearly $1.05 billion in 2013.
For every dollar of state appropriation funds, the university generated $11.9 in economic activity to the Southern Nevada community.
Each dollar of student spending generated approximately 1.7 dollars of economic activity for Southern Nevada.
The Thomas & Mack Center contributed $338 million in direct impact and $398 million in total impact to the Southern Nevada economy in 2013.
By 2050, UNLV will supply the valley with at least 33,000 jobs and roughly $17.7 billion in economic activity.
UNLV’s economic impact on Southern Nevada’s economy is substantial; it
is forecasted to contribute 14,438 non-UNLV jobs and $9.1 billion to the Southern Nevada economy by 2050.

54
Total Actual Revenue = $583,732,759
Actual Revenue 2013-14
Financial Information
General Fund, 26.7%
Sponsored Programs,
16.0%
Tuition & Fees, 19.6%
Self Funded Activities,
19.1%
Auxiliary Enterprises,
10.1%
Gift Revenue, 3.63%
Indirect Cost Recovery, 1.3%
Investment Income, 2.5%
Misc. Revenue & Cash
Operations, 1.1%
General Fund 26.7%Sponsored Programs 16.0%Tuition & Fees 19.6%Self Funded Activities 19.1%Auxiliary Enterprises 10.1%Gift Revenue 3.6%Indirect Cost Recovery 1.3%Investment Income 2.5%Misc. Revenue & Cash Operations 1.1%

55
Total Actual Expenditures = $583,732,759
Financial Information
Actual Expenditures 2013-14
Academic Faculty,25.8%
Operating Exp, 20.1%
Admin Professional,
21.0%
Scholarships and fellowships,
14.6%
Support Salaries,
9.1%
Equipment, 0.3%
Graduate Assistants,
2.4%
Student Wages, 3.1%
Travel,1.3%
Utilities,2.3%
Academic Faculty 25.8%Operating Exp 20.1%Admin Professional 21.0%Scholarships and fellowships 14.6%Support Salaries 9.1%Equipment 0.3%Graduate Assistants 2.4%Student Wages 3.1%Travel 1.3%Utilities 2.3%

Note: Institutional expenditures have been restated for comparability purposes due to changes in IPEDS reporting requirements beginning Fiscal Year 2010. Source: Integrated Postsecondary Education Data System (IPEDS), Finance Survey
56
Institutional Support as a Percent of Total Expenditures
Financial Information
6.5%
7.0%
7.5%
8.0%
8.5%
9.0%
9.5%
2006 2007 2008 2009 2010 2011 2012 2013 2014
Fiscal Year
Total E&G Current Funds Expenditures
(millions)
Institutional Support
Expenditures (millions)
Institutional Support as a
percent of Total Expenditures
2006 $381.3 $34.0 8.9%2007 $418.2 $33.5 8.0%2008 $440.4 $35.2 8.0%2009 $438.6 $37.3 8.5%2010 $441.3 $35.7 8.1%2011 $431.5 $32.3 7.5%2012 $412.7 $31.2 7.6%2013 $420.3 $33.3 7.9%2014 $440.0 $33.6 7.6%

0%
5%
10%
15%
20%
25%
30%
35%
1995-97
1997-99
1999-01
2001-03
2003-05
2005-07
2007-09
2009-11
2011-13
2013-15
Higher Education Share of Nevada General Fund
57
UNLV % of NSHE
NSHE % of State
Financial Information
State(millions)
NSHEGeneral Fund
(millions)UNLV
(millions)NSHE
% of StateUNLV
% of NSHE
1995-97 $2,486.1 $462.4 $133.1 18.6% 28.8%1997-99 $2,954.7 $582.1 $162.8 19.7% 28.0%1999-01 $3,209.2 $622.6 $169.0 19.4% 27.1%2001-03 $3,796.0 $717.4 $189.3 18.9% 26.4%2003-05 $4,834.9 $989.4 $259.3 20.5% 26.2%2005-07 $5,798.0 $1,149.0 $312.1 19.8% 27.2%2007-09 $6,813.0 $1,325.3 $363.7 19.5% 27.4%2009-11 $6,946.0 $1,186.8 $310.8 17.1% 26.2%2011-13 $5,839.7 $945.6 $253.5 16.2% 26.8%2013-15 $6.596.1 $986.5 $261.9 15.0% 26.5%
Note: Represents the biennial total funding from the state for the formula-funded appropriation.

Total Sponsored Program Expenditures
Note: Sponsored program expenditures in instruction, research, public service, academic support, student services, institutional support, operations & maintenance and student financial aid, including scholarships and fellowships.
58
Financial Information
0
20
40
60
80
100
120
2005 2006 2007 2008 2009 2010 2011 2012 2013 2014
Fiscal Year Expenditures2005 79,843,914 2006 91,714,087 2007 104,936,865 2008 99,441,695 2009 87,406,279 2010 100,005,274 2011 96,329,369 2012 87,606,358 2013 86,928,442 2014 93,766,287
$ in
Millio
ns

Total Sponsored Program Expenditures Excluding Financial Aid
59
Note: Sponsored program expenditures in all activities excluding student financial aid (i.e. loans, scholarships and fellowships).
Financial Information
0
10
20
30
40
50
60
70
80
90
2005 2006 2007 2008 2009 2010 2011 2012 2013 2014
Fiscal Year Expenditures
2005 53,526,102 2006 66,100,907 2007 80,945,728 2008 74,363,352 2009 59,145,520 2010 62,205,152 2011 50,052,277 2012 42,853,319 2013 44,593,471 2014 48,144,405
$ in
Millio
ns

Total Sponsored Program Research Expenditures
Financial Information
60
0
10
20
30
40
50
60
2005 2006 2007 2008 2009 2010 2011 2012 2013 2014
$ i
n M
illio
ns
Fiscal YearResearch
Expenditures 2005 40,418,5062006 47,985,0912007 54,118,1792008 46,765,2932009 36,156,5892010 35,913,5522011 32,581,3292012 27,072,6422013 27,649,1632014 $31,027,377

UNLV’s Resident and Non-Resident Tuition Rank Among 36 WICHE Institutions
61
Notes: 1) Undergraduate tuition only. 2) WICHE is the Western Interstate Commission for Higher Education. 2) Includes public, four-year, high and very high research institutions.
Financial Information
0
5
10
15
20
25
30
35
40
2005 2006 2007 2008 2009 2010 2011 2012 2013 2014
In-State Tuition Rank
Out-of-State Tuition Rank
Fiscal Year
In-State Tuition Rank
Out-of-State Tuition Rank
2005 35 262006 34 292007 34 282008 34 232009 33 252010 31 242011 27 232012 28 242013 28 242014 29 26

Average Resident Tuition at WICHE Institutions
62
Financial Information
$1,000
$3,000
$5,000
$7,000
$9,000
$11,000
$13,000
High Research
Very High Research
UNLV
WICHE Average
Fiscal YearWICHE
AverageVery High Research
High Research UNLV
2005 $4,620 $5,210 $3,845 $3,2102006 $5,017 $5,655 $4,181 $3,4762007 $5,259 $5,901 $4,415 $3,7322008 $5,652 $6,393 $4,680 $4,0812009 $6,082 $6,863 $5,057 $4,4932010 $6,728 $7,662 $5,502 $4,9772011 $7,703 $9,069 $5,911 $5,6882012 $8,608 $10,247 $6,458 $6,3042013 $8,983 $10,645 $6,801 $6,5852014 $9,388 $11,093 $7,150 $6,590
Notes: 1) Undergraduate tuition only. 2) WICHE is the Western Interstate Commission for Higher Education. 2) Includes public, four-year, high and very high research institutions.

Average Non-Resident Tuition at WICHE Institutions
63
Financial Information
Fiscal YearWICHE
AverageVery High Research
High Research UNLV
2005 $15,280 $18,075 $11,786 $11,8842006 $16,269 $19,153 $12,482 $12,4932007 $16,761 $19,955 $12,567 $13,6432008 $17,872 $21,272 $13,408 $14,8902009 $19,012 $22,670 $14,211 $15,5882010 $20,373 $24,260 $15,273 $17,3172011 $22,140 $26,618 $16,262 $18,9792012 $23,512 $28,148 $17,427 $19,9022013 $24,246 $28,942 $18,081 $20,4952014 $25,552 $30,409 $19,177 $20,500
$2,000
$7,000
$12,000
$17,000
$22,000
$27,000
$32,000
High Research
Very High Research
UNLV
WICHE Average
Notes: 1) Undergraduate tuition only. 2) WICHE is the Western Interstate Commission for Higher Education. 2) Includes public, four-year, high and very high research institutions.


University of Nevada, Las Vegas
Produced by the O F F I C E O F D E C I S I O N S U P P O R T
An electronic version of this document as well as further informationpertaining to the current legislative session are available at unlv.edu/nvleg