On Measuring Internet Topology & its Applications
25
1 On Measuring Internet Topology & its Applications Area Exam Report March - 2019 Bahador Yeganeh Abstract—Given the importance of the Internet, it is crucial to assess its key characteristics (e.g. performance, stability, and resiliency) through measurement as it expands and evolves over time. Measuring different characteristics of the Internet is challenging mainly due to its scale and heterogeneity. Capturing and characterizing Internet topology offers the critical insight not only for understanding the physical infrastructure of the Internet but also for examining the impact a wide range of more subtle characteristics that depend on the topology such as routing, end- to-end performance, and resiliency to attacks or disruptions. This area exam reviews a large body of recent studies on cap- turing and characterizing various aspects of the Internet topology as well as studies that explore implications of Internet topology on other real-world problems. To this end, we organize the prior studies on Internet topology based on their considered resolution into four groups as follows: (i) AS-level, (ii) router-level, (iii) PoP-level, and (iv) physical-level. For each group of studies, we discuss proper measurement tools and techniques, common datasets, relevant characteristics, related challenges and main findings at that resolution. We also broadly categorize studies on the implications of Internet topology based on whether they focus on performance, resiliency, or network peering relationship aspects of the Internet. We primarily describe how topology information with a particular scope and specific resolution serve as input to study more subtle aspects of the Internet. Finally, we present how the increasing popularity of cloud services in recent years have led to significant changes in Internet topology that motivate further measurement-based studies. I. I NTRODUCTION The Internet since its inception as a network for inter- connecting a handful of academic and military networks has gone through constant evolution throughout the years and has become a large scale distributed network spanning the globe that is intertwined with every aspect of our daily lives. Given its importance, we need to study its health, vulnera- bility, and connectivity. This is only made possible through constant network measurements. Researchers have conducted measurements in order to gain a better understanding of traffic routing through this network, its connectivity structure as well as its performance. Our interest and ability to conduct network measurements can vary in both scopes with respect to the number or size of networks under study as well as the resolution with regards to focusing on networks as a single unit or paying attention to finer network elements such as routers. The topology of the Internet is a key enabler for studying routing of traffic in addition to gaining a better understanding of Internet performance and resiliency. Capturing Internet topology is challenging due to many factors namely, (i) scale: the vast scale of the Internet as a network spanning the globe limits our abilities to fully capture its structure, (ii) visibility: our view of the Internet is constrained to the perspective that we are able to glean from the limited number of vantage points we are able to look at it, (iii) dynamic: the Internet as an ever- evolving entity is under constant structural change added to this the existence of redundant routes, backup links, and load- balanced paths limits our ability to fully capture the current state of the Internet’s topology, and (iv) tools: researchers have relied on tools which were originally designed for troubleshooting purposes the protocol stack of Internet lacks any inherent methods for identifying topology. Despite these challenges, for the past couple of decades, the network measurement community have collected data, devised tools, and expanded their test beds to infer new information and conduct measurements at different scale and resolutions. The obtained insight from these studies has informed network designers, engineers, ISPs, and application developers to ad- dress issues on the performance, resiliency, and scalability of the Internet. This area exam explores a collection of prior studies for various aspects of Internet measurement to gain insight into the topology of the Internet as well as its implications in designing applications. For Internet measurement, we focus on recent studies regarding the simulation and characterization of Internet topology. Furthermore, we organize these studies based on the resolution of the uncovered topology with an emphasis on the utilized datasets and employed methodolo- gies. On the second part, we focus on various implications of Internet topology on the design and performance of appli- cations. These studies are organized in accordance with the implication of topology on performance or resiliency of the Internet. Furthermore we emphasis on how various resolutions of Internet topology allow researchers to conduct different studies. The collection of these studies present a handful of open and interesting problems regarding the future of Internet topology with the advent of cloud providers and their centrality within today’s Internet. The rest of the document is organized as follows. First, in Section II we present a primer on the Internet and introduce the reader with a few taxonomies that are frequently used within this document. Second, an overview of most common datasets, platforms, and tools which are used for topology discovery is given in Section III. Third, the review for recent studies on Internet topology discovery is presented in Section IV. Forth, Section V covers the recent studies which utilize Internet topologies to study the performance and resiliency of the Internet. Lastly, we explore a few open problems and possible venues for further research in Section VI. II. BACKGROUND The Internet is a globally federated network composed of many networks each of which has complete autonomy over the
Transcript of On Measuring Internet Topology & its Applications

1
On Measuring Internet Topology & its ApplicationsArea Exam Report
March - 2019Bahador Yeganeh
Abstract—Given the importance of the Internet, it is crucialto assess its key characteristics (e.g. performance, stability, andresiliency) through measurement as it expands and evolvesover time. Measuring different characteristics of the Internet ischallenging mainly due to its scale and heterogeneity. Capturingand characterizing Internet topology offers the critical insight notonly for understanding the physical infrastructure of the Internetbut also for examining the impact a wide range of more subtlecharacteristics that depend on the topology such as routing, end-to-end performance, and resiliency to attacks or disruptions.
This area exam reviews a large body of recent studies on cap-turing and characterizing various aspects of the Internet topologyas well as studies that explore implications of Internet topologyon other real-world problems. To this end, we organize the priorstudies on Internet topology based on their considered resolutioninto four groups as follows: (i) AS-level, (ii) router-level, (iii)PoP-level, and (iv) physical-level. For each group of studies,we discuss proper measurement tools and techniques, commondatasets, relevant characteristics, related challenges and mainfindings at that resolution. We also broadly categorize studieson the implications of Internet topology based on whether theyfocus on performance, resiliency, or network peering relationshipaspects of the Internet. We primarily describe how topologyinformation with a particular scope and specific resolution serveas input to study more subtle aspects of the Internet. Finally, wepresent how the increasing popularity of cloud services in recentyears have led to significant changes in Internet topology thatmotivate further measurement-based studies.
I. INTRODUCTION
The Internet since its inception as a network for inter-connecting a handful of academic and military networks hasgone through constant evolution throughout the years andhas become a large scale distributed network spanning theglobe that is intertwined with every aspect of our daily lives.Given its importance, we need to study its health, vulnera-bility, and connectivity. This is only made possible throughconstant network measurements. Researchers have conductedmeasurements in order to gain a better understanding of trafficrouting through this network, its connectivity structure aswell as its performance. Our interest and ability to conductnetwork measurements can vary in both scopes with respectto the number or size of networks under study as well as theresolution with regards to focusing on networks as a single unitor paying attention to finer network elements such as routers.
The topology of the Internet is a key enabler for studyingrouting of traffic in addition to gaining a better understandingof Internet performance and resiliency. Capturing Internettopology is challenging due to many factors namely, (i) scale:the vast scale of the Internet as a network spanning the globelimits our abilities to fully capture its structure, (ii) visibility:our view of the Internet is constrained to the perspective thatwe are able to glean from the limited number of vantage points
we are able to look at it, (iii) dynamic: the Internet as an ever-evolving entity is under constant structural change added tothis the existence of redundant routes, backup links, and load-balanced paths limits our ability to fully capture the currentstate of the Internet’s topology, and (iv) tools: researchershave relied on tools which were originally designed fortroubleshooting purposes the protocol stack of Internet lacksany inherent methods for identifying topology.
Despite these challenges, for the past couple of decades, thenetwork measurement community have collected data, devisedtools, and expanded their test beds to infer new informationand conduct measurements at different scale and resolutions.The obtained insight from these studies has informed networkdesigners, engineers, ISPs, and application developers to ad-dress issues on the performance, resiliency, and scalability ofthe Internet.
This area exam explores a collection of prior studies forvarious aspects of Internet measurement to gain insight intothe topology of the Internet as well as its implications indesigning applications. For Internet measurement, we focuson recent studies regarding the simulation and characterizationof Internet topology. Furthermore, we organize these studiesbased on the resolution of the uncovered topology with anemphasis on the utilized datasets and employed methodolo-gies. On the second part, we focus on various implicationsof Internet topology on the design and performance of appli-cations. These studies are organized in accordance with theimplication of topology on performance or resiliency of theInternet. Furthermore we emphasis on how various resolutionsof Internet topology allow researchers to conduct differentstudies. The collection of these studies present a handful ofopen and interesting problems regarding the future of Internettopology with the advent of cloud providers and their centralitywithin today’s Internet.
The rest of the document is organized as follows. First, inSection II we present a primer on the Internet and introducethe reader with a few taxonomies that are frequently usedwithin this document. Second, an overview of most commondatasets, platforms, and tools which are used for topologydiscovery is given in Section III. Third, the review for recentstudies on Internet topology discovery is presented in SectionIV. Forth, Section V covers the recent studies which utilizeInternet topologies to study the performance and resiliencyof the Internet. Lastly, we explore a few open problems andpossible venues for further research in Section VI.
II. BACKGROUND
The Internet is a globally federated network composed ofmany networks each of which has complete autonomy over the

2
structure and operation of its own network. These autonomoussystems or networks (AS) can be considered as the buildingblocks of the Internet. Each AS represents a virtual entity andcan be composed of a vast network infrastructure composedof networking equipment like routers and switches as well astransit mediums such as Ethernet and fiber optic cables. TheseASes can serve various purposes such as providing transit orconnectivity for other networks, generating or offering contentsuch as video streams, or merely represent the network ofan enterprise. Each of the connectivity provider ASes can becategorized into multiple tiers based on their size and howthey are interconnected with other ASes. These tiers createa natural hierarchy of connectivity that is broadly composedof 3 tiers namely, (i) Tier-1: an AS that can reach all othernetworks without the need to pay for its traffic exchanges,(ii) Tier-2: an AS which can have some transit-free relationswith other ASes while still needing to pay for transit forreachability to some portion of the Internet, and (iii) Tier-3: anAS that solely purchases transit for connectivity to the Internet.While each network has full control over its own internalnetwork and can deliver data from one internal node to another,transmitting data from one AS to another requires awarenessof a path that can reach the destination AS. This problem issolved by having each AS advertise its own address space toneighboring ASes through the border gateway protocol (BGP).Upon receiving a BGP announcement, each AS would prependits own AS number (ASN) to the AS-path attribute of thisannouncement and advertise this message to its own neighbors.This procedure allows ASes to learn about other networksand the set of AS-paths or routes that they can be reachedthrough. ASes can interconnect with each by linking theirborder routers at one or multiple physical locations. Theseborder routers are responsible for advertising their prefixesin addition to performing the actual routing of traffic withinthe Internet. The border routers of ASes are placed withincolocation facilities (colo) that offer space, power, security, andnetworking equipment to the tenants ASes. Each AS can havea physical presence in multiple metro areas. The collection oftheir routers within each of these metro areas are referred to asthe points of presence (PoP) for these ASes. Figure 1 presentsa high level abstraction of the aforementioned concepts. Thefigure consists of 3 ASes namely, ASA, ASB , and ASC inred, blue, and green accordingly. The internal structure ASesis abstracted out presenting only the border routers of each AS.ASA and ASB have two PoPs one in LA and another in NYwhile ASC is only present in NY. ASA and ASB establish aprivate interconnection with each other through their LA PoPwithin colo1 while they peer with each other as well as ASC
in their NY PoP in colo2 through an IXPs switching fabric.
III. TOOLS & DATASETS
This section provides an overview of various tools anddatasets that have been commonly used by the measurementcommunity for discovering Internet topology. We aim tofamiliarize the reader with these tools and datasets as theyare continuously used within the literature by researchers.Researchers have utilized a wide range of tools for the
IXP
PoPLA
PoPLA
PoPNY
PoPNYASB
ASA
ASCcolo1 colo2
Fig. 1. Abstract representation for topology of ASA, ASB , and ASC
in red, blue, and green accordingly. ASA and ASB establish a privateinterconnection inside colo1 at their LA PoP while peering with each other aswell as ASC inside colo2 at their NY PoP facilitated by an IXP’s switchingfabric.
discovery of topologies; they range from generic networktroubleshooting tools such as traceroute or paris-traceroute totools developed by the Internet measurement community suchas Sibyl or MIDAR. Furthermore, researchers have benefitedfrom many measurement platforms such as RIPE Atlas orPlanetLab which enable them to perform their measurementsfrom a diverse set of ASes and geographic locations.In addition to the aforementioned toolsets researchers havebenefited from various datasets within their work. Thesedatasets are collected by a few well-known projects in theInternet measurement community such as Routeviews [1],CAIDA’s Ark [2], and CAIDA’s AS relationships datasets orstem from other sources such as IP to geolocation datasets orinformation readily available on colocation facilities or IXPoperators websites.The remainder of this section is organized within two subsec-tions. First, §III-A would provide an overview of the mostcommonly used tools and platforms for Internet topologydiscovery. Second, §III-B would give a brief overview of thedatasets that appear in the literature presented within §IV and§V.
A. Measurement Tools & PlatformsBroadly speaking the tools used for Internet topology dis-
covery can be categorized within three groups namely, (i)path discovery, (ii) alias resolution, and (iii) interface namedecoding.
1) Path Discovery: Although originally developed for trou-bleshooting purposes, traceroute [3] has become one of theprominent tools used within the Internet measurement com-munity. traceroute displays the set of intermediate routerinterfaces that are traversed towards a specific destination inthe forward path. This is made possible by sending packetstowards the destination with incremental TTL values, eachrouter along the path would decrease the TTL value beforeforwarding the packet. If a router encounters a packet with aTTL value of 0 the packet would be dropped, and a notification

3
message with its source address would be sent back to the orig-inator of the packet. This, in turn, allows the originator of thesepackets to identify the source address of router interfaces alongthe forward path. Deployment of load-balancing mechanicsby routers which rely on packet header fields can lead toinaccurate and incomplete paths to be reported by traceroute.Figure 2 illustrates an example of incorrect inferences bytraceroute in the presence of load-balanced paths. Node a isa load-balancer and multiplexes packets between the top andbottom paths. In this example, the TTL = 2 probe originatedfrom the source traverses the top path and expires at node bwhile the TTL = 3 probe goes through the bottom path andterminates at node e. These successive probes cause tracerouteto incorrectly infer a non-existent link between nodes b ande. To address this problem, Augustin et al. [4] developedparis-traceroute which relies on packet header contents toenforce load-balancers to pick a single route for all probesof a single traceroute session. Furthermore, paris-tracerouteuses a stochastic probing algorithm in order to enumerate allpossible interfaces and links at each hop.Given the scale of the Internet and its geographic span relyingon a single vantage point (VP) to conduct topology discoverystudies would likely lead to incomplete or inaccurate infer-ences. Researchers have relied on various active measurementplatforms which either host a pre-defined set of tools, e.g.Dasu, Bismark, Dimes, Periscope, and RIPE Atlas [5], [6],[7], [8], [9] or provide full-access control, e.g. PlanetLab,CAIDA Archipelago, and GENI [10], [11], [12] to the userto conduct their measurements from a diverse set of networksand geographic locations. For example, RIPE Atlas [5] iscomposed of many small measurement devices (10k at thetime of this survey) that are voluntarily hosted within manynetworks on a global scale. Hosting RIPE Atlas nodes wouldgive credit to the hosting entity which later on could beused to conduct latency (ping) and reachability (tracerouteand paris-traceroute) measurements. Periscope [7] is anotherplatform that provides a unified interface for probing around1.7k publicly available looking glasses (LGs) which providea web interface to conduct basic network commands (ping,traceroute, and bgp on routers hosted in roughly 0.3k ASes.Periscope VPs are located at core ASes while RIPE Atlasprobes are hosted in a mix of core and edge networks. Dasu[8] on the other hand mainly consists of VPs at edge networksand more specifically broadband users relying on ISPs to haveInternet connectivity. Dasu consists of a plugin for the VuzeBitTorrent client that is able to conduct network measurementfrom the computers of users who have installed their plugin ontheir Vuze client. The authors of Dasu incentivize its adoptionby reporting broadband network characteristics to its users.Cunha et al. [13] developed a route oracle platform namedSibyl which allowed users to define the path requirements fortheir measurement through an expressive input language basedon symbolic regular-expressions after which Sibyl would se-lect the source (LG) and destination pair that has the highestlikelihood of satisfying the users path requirements based onits internal model.Lastly, considering the large number of Internet hosts andnetworks, researchers have developed a series of tools that
Fig. 2. Illustration of inferring and incorrect link (b − e) by traceroute dueto load balanced paths. Physical links and traversed paths are shown withblack and red lines accrodingly. The TTL = 2 probe traverses the top pathand expires at node b while the TTL = 3 probe traverses the bottom pathand expires at node e. This succession of probes causes traceroute to infer anon-existent link (b− e).
allow them to conduct large scale measurements in parallel.The methodology of paris-traceroute has been incorporatedin scamper [14], an extensible packet prober that implementsvarious common network measurement functionalities suchas traceroute, ping, and alias resolution into a single tool.scamper is able to conduct measurements in parallel withoutexceeding a predefined probing rate. While scamper is able torun measurements in parallel, each measurement is conductedsequentially, this in turn could hinder its rate or induceoverhead to the probing device in order to maintain the stateof each measurement. yarrp [15], [16] is a high-rate IPv4and IPv6 capable, Internet-scale probing tool inspired by thestate-less design principles of ZMap [17] and masscan [18].yarrp randomly permutates the IP and TTL space and encodesthe state information of each probe within the IP and TCPheader fields (which are included in the ICMP response) and istherefore able to conduct traceroute probes in parallel withoutincrementally increasing the TTL value.
2) Alias Resolution: Paths which are obtained via the toolsoutlined in §III-A1 all specify the router interfaces that areencountered along the forward path. It is possible to observemultiple interfaces of a single router within different traceroutepaths. The association of these interfaces to a single physicalrouter is not clear from these outputs. Alias resolution toolshave been developed to solve this issue. These tools would ac-cept a set of interface addresses as an input and would providea collection of interface sets, each of which corresponds to asingle router. Alias resolution tools can broadly be categorizedinto two groups namely, (i) probing [19], [20], [21], [22], [23]and (ii) inference [24], [25], [26], [27] based techniques. Theformer would require a VP which would probe the interfacesin question to identify sets of interfaces which belong to thesame router. Probe based techniques mostly rely on the IP IDfield which is used for reassembling fragmented packets at thenetwork layer. These techniques assume that routers rely ona single central incremental counter which assigns these IDvalues regardless of the interface. Given this assumption, Ally[19] probed IPs with UDP packets having high port numbers(most likely not in use) to induce an ICMP port unreachableresponse. Ally will infer IP addresses to be aliases if successiveprobes have incremental ID values within a short distance.Radargun [21] tries to address the probing complexity of Ally(O(n2)) by iteratively probing IPs and inferring aliases basedon the velocity of IP ID increments for each IP. MIDAR [23]

4
presents a precise methodology for probing large scale poolof IP addresses by eliminating unlikely IP aliases using avelocity test. Furthermore, aliases are inferred by comparingthe monotonicity of IP ID time series for multiple targetIP addresses. MIDAR utilizes ICMP, TCP, and UDP probesto increase the likelihood of receiving responses from eachrouter/interface. Palmtree [22] probes /30 or /31 mates oftarget IPs using a TTL value inferred to expire at the router inquestion to induce an ICMP TTL EXPIRED response fromanother interface of the router. Assuming no path changeshave happened between measuring the routers hop distanceand the time the ICMP TTL EXPIRED message has beengenerated, the source address of the ICMP TTL EXPIREDmessage should reside on the same router of the target IP andtherefore are inferred to be aliases.Inference based techniques accept a series of traceroute out-puts and rely on a set of constraints and assumptions regardingthe setting and environment which these routers are deployedto make inferences about interfaces that are most likely partof the same router. Spring et al. suggest a common successorheuristic to attribute IP addresses on the prior hop to thesame router. This heuristic assumes that no layer-2 devicesare present between the two routers in question. Gunes et al.Analytical Alias Resolution (AAR) [25] infers aliases usingsymmetric traceroute pairs by pairing interface addresses usingthe common address sharing convention of utilizing a /30or /31 prefix for interfaces on both ends of a physical link.This method requires the routes between both end-pairs to besymmetrical. DisCarte [26] relies on the route record optionto capture the forward and reverse interfaces for the first ninehops of a traceroute. Limited support and various route recordimplementations by routers in addition to the high complexityof the inference algorithm limits its applicability to wide/largescenarios.
3) Interface Name Decoding: Reverse DNS (RDNS) en-tries for observed interface addresses can be the source ofinformation for Internet topology researchers. Port type, portspeed, geolocation, interconnecting AS, and IXP name are ex-amples of information which can be decoded from RDNS en-tries of router interfaces. These information sets are embeddedby network operators within RDNS entries for ease of manage-ment in accordance to a (mostly) structured convention. Forexample, ae-4.amazon.atlnga05.us.bb.gin.ntt.net is an RNDSentry for a router interface residing on the border router ofNTT (ntt.net) within Atlanta GA (atlnga) interconnecting withAmazon. Embedding this information is completely optional,and the structure of this information varies from one AS toanother. Several tools have been developed to parse and extractthe embedded information within RDNS entries [19], [28],[29], [30]. Spring et al. extracted DNS encoded information forthe ISPs under study in their Rocketfuel project [19]. As partof this process, they relied on the city code names compiled in[31] to search for domain names which encode geoinformationin their name. PathAudit [28] is an extension to traceroutewhich report encoded information within observed router hops.In addition to geo information, PathAudit reports on interfacetype, port speed, and manufacturing vendor of the router.The authors of PathAudit extract common encodings (tags)
from device configuration parameters, operator observations,and common naming conventions. Using this set of tags,RDNS entries from CAIDA’s Ark project [2] are parsed tomatch against one or multiple of these tags. A clusteringalgorithm is employed to identify similar naming structureswithin domains of a common top level domain TLD. Thesecommon structures are translated into parsing rules which canmatch against other RDNS entries. DDeC [32] is a web servicewhich decodes embedded information within RDNS entries byunifying the rulesets obtained by both UNDNS [19] and DRoP[29] projects.
B. Datasets
Internet topology studies have been made possible throughvarious data sources regarding BGP routes, IXP information,colo facility listings, AS attributes, and IP to geolocationmapping. The following sub-section provides a short overviewof data sources most commonly used by the Internet topologycommunity.
1) BGP Feeds & Route Policies: University of Oregon’sRouteViews and RIPE Routing Information Service (RIS)[1], [33] are projects originally conceived to provide real-time information about the global routing system from thestandpoint of several route feed collectors. These route col-lectors periodically report the set of BGP feeds that theyreceive back to a server where the information is madepublicly accessible. The data from these collectors have beenutilized by researchers to map prefixes to their origin-AS orto infer AS relationships based on the set of observed AS-paths from all the route collectors. Routeviews and RIPE RISprovide a window into the global routing system from highertier networks. Packet Clearing House (PCH) [34] maintainsmore than 100 route collectors which are placed within IXPsaround the globe and provides a complementary view to theglobal routing system presented by Routeviews and RIPE RIS.Lastly, Regional Internet Registries (RIRs) maintain databasesregarding route policies of ASes for each of the prefixes thatare delegated to them using the Route Policy SpecificationLanguage (RPSL). Historically, RPSL entries are not welladopted and typically are not maintained/updated by ASes.The entries are heavily concentrated within RIPE and ARINregions but nonetheless have been leveraged by researchers toinfer or validate AS relationships [35], [36].
2) Colocation Facility Information: Colocation facilities(colo for short) are data-centers which provide space, power,cooling, security, and network equipment for other ASes tohost their servers and also establish interconnections with otherASes that have a presence within the colo. PeeringDB andPCH [37], [38] maintain information regarding the list of colofacilities and their physical location as well as tenant ASeswithin each colo. Furthermore, some colo facility operatorsprovide a list of tenant members as well as the list of transitnetworks that are available for peering within their facilitiesfor marketing purposes on their website. This informationhas been mainly leveraged by researchers to define a set ofconstraints regarding the points of presence (PoP) for ASes.

5
3) IXP Information: IXPs are central hubs providing richconnectivity opportunities to the participating ASes. Theirimpact and importance regarding the topology of the Internethave been highlighted within many works [39], [40], [41],[42]. IXPs provide a switching fabric within one or many colofacilities where each participating AS connects their borderrouter to this switch to establish bi-lateral peering with othermember ASes or establishes a one to many (multi-lateral)peering with the route server that is maintained by the IXPoperator. IXP members share a common subnet owned by theIXP operator. Information regarding the location, participatingmembers, and prefixes of IXPs is readily available throughPeeringDB, PCH, and the IXP operators website [37], [38].
4) IP Geolocation: The physical location of IP addressesisn’t known. Additionally, IP addresses could correspond tomobile end-hosts or can be repurposed by the owner AS andtherefore have a new geolocation. Several free and commercialdatabases have been made throughout the years that attemptto map IP addresses to physical locations. These datasets canvary in their coverage as well as the resolution of mapped ad-dresses (country, state, city, and geo-coordinates). Maxmind’sGeoIP2 [43], IP2Location databases [44], and NetAcuity [45]are among the most widely used IP geolocating datasetsused by the Internet measurement community. Majority ofthese datasets have been designed to geolocate end-host IPaddresses. Gharaibeh et al. [46] compare the accuracy of thesedatasets for geolocating router interfaces and while NetAcuityhas relatively higher accuracy than Maxmind and IP2Locationdatasets, relying on RTT validated geocoding of RDNS entriesis more reliable for geolocating router and core addresses.
IV. CAPTURING NETWORK TOPOLOGY
This section provides an overview of Internet measurementstudies which attempt to capture the Internet’s topology usingvarious methodologies motivated by different end goals.Capturing Internet topology has been the focus of manypieces of research over the past decade, while each studyhas made strides of incremental improvements to present amore complete and accurate picture of Internet topology, theproblem remains widely open and the subject of many recentstudies.Internet topology discovery has been motivated by a myriadof applications ranging from protocol design, performancemeasurement in terms of inter-AS congestion, estimatingresiliency towards natural disasters and service or networkinterruptions, security implications of DDoS attacks and muchmore. A motivating example would be the Netflix Verizondispute where the subpar performance of Netflix videos forVerizon customers lead to lengthy accusations from bothparties [47]. The lack of proper methodologies to captureinter-AS congestion by independent entities at the timefurther elongated the dispute. Within Section V we provide acomplete overview of works which rely on some aspect ofInternet topology to drive their research and provide insightregarding the performance or resiliency of the Internet.Capturing Internet topology is hard due to many contributingfactors, the following is a summary of them:
• The Internet is by nature a decentralized entity composedof a network of networks, each of the constituent net-works lacks any incentive to share their topology publiclyand often can have financial gains by obscuring thisinformation.
• Topology discovery studies are often based on “hackish”techniques that rely on toolsets which were designedfor completely different purposes. The designers of theTCP/IP protocol stack did not envision the problem oftopology discovery within their design most likely due tothe centralized nature of the Internet in its inception. Thede facto tool for topology discovery has been traceroutewhich is designed for troubleshooting and displayingpaths between a host and a specific target address.
• Capturing inter-AS links within Internet topology be-comes even more challenging due to lack of standardiza-tion for proper ways to establish these links. More specif-ically, the shared address between two border routerscould originate from either of the participating networks.Although networks typically rely on common good prac-tices such as using addresses from the upstream provider,the lack of any oversight or requirement within RFCstandards does not guarantee its proper execution withinthe Internet.
• A certain set of RFCs regarding how routers shouldhandle TTL expired messages has resulted in incorrectinferences of the networks which are establishing inter-AS interconnections. For example, responses generatedby third-party interfaces on border routers could lead tothe inference of an inter-AS link between networks whichnecessarily are not interconnected with each other.
Topology discovery studies can be organized according tomany of their features; in particular, the granularity of theobtained topology seems to be the most natural fit. Each of thestudies in this section based on the utilized dataset, or devisedmethodology results in topologies which capture the state ofthe Internet at different granularities, namely physical-level,router-level, PoP-level, and AS-level. The aforementionedresolutions of topology have a direct mapping to the abstractlayers of the TCP/IP stack, e.g. physical-level corresponds tothe first layer (physical), router-level can be mapped to thetransport layer, and PoP-level as well as AS-level topologiesare related to application layer at the top of the TCP/IP stack.These abstractions allow one to capture different features ofinterest without the need for dealing with the complexitiesof lower layers. For instance, the interplay of routing andthe business relationships between different ASes can becaptured through an AS-level topology without the need tounderstand how and where these inter-AS relationships arebeing established.In the following subsections, we will provide an overviewof the most recent as well as prominent works that havecaptured Internet topology at various granularities. We presentall studies in accordance to their chronological order startingwith works related to AS-level topologies as the most abstractrepresentation of Internet topology within Section §IV-A, AS-level topologies are the oldest form of Internet topology but

6
have retained their applicability for various forms of analysesthroughout the years. Later we’ll present router-level andphysical-level topologies within Section §IV-B and §IV-Daccordingly.
A. AS-Level Topology
The Internet is composed of various networks or ASesoperating autonomously within their domain that interconnectwith each other at various locations. This high-level abstractionof the Internet’s structure is captured by graphs representingAS-level topologies where each node is an AS and edgespresent an interconnection between two ASes. These graphslay-out virtual entities (ASes) that are interconnecting witheach other and abstract out details such as the number andlocation where these inter-AS links are established. For ex-ample, two large Tier-1 networks such as Level3 and AT&Tcan establish many inter-AS links through their border routersat various metro areas. These details are abstracted out, andall of these inter-AS links are represented by a single edgewithin the AS-level topology. The majority of studies rely oncontrol plane data that is obtained by active measurements ofretrieving router dumps through available looking glasses orpassive measurements that capture BGP feeds, RPSL entriesand BGP community attributes. Path measurements capturedthrough active or passive traceroute probes have been an addi-tional source of information for obtaining AS-level topologies.The obtained traceroute paths have been mapped to theircorresponding AS path by translating each hop’s address toits corresponding AS. Capturing AS-level topology has beenchallenging mainly due to limited visibility into the globalrouting system, more specifically the limited set of BGP feedsthat each route collector is able to observe. This limitedvisibility is known as the topology incompleteness problemwithin the community. Researchers have attempted to addressthis issue by either modeling Internet topology by combingthe limited ground truth information with a set of constraintsor by presenting novel methodologies that merge various datasources in order to obtain a comprehensive view of Internettopology. The later efforts lead to research’s that highlightedthe importance of IXPs as central hubs of rich connectivity.Within the remainder of this Section we organize works intothe following three groups: (i) graph generative and modeling,(ii) topology incompleteness, and (iii) IXP’s internal operationand peerings.
1) Graph Generation & Modeling: Graph generationtechniques attempt to simulate network topologies by relyingon a set of constraints such as the maximum number ofphysical ports on a router. These constraints coupled withthe limited ground truth information regarding the structureof networks are used to model and generate topologies. Theoutput of these models can be used in other studies whichinvestigate the effects of topology on network performanceand resiliency of networks towards attacks or failures causedby natural disasters.Li et al. [48] argue that graph generating models rely onreplicating too abstract measures such as degree distributionwhich are not able to express the complexities/realities of
Internet topology. Authors aim to model ASes/ISPs as thebuilding blocks of the Internet at the granularity of routers,where nodes represent routers and links are Layer2 physicallinks which connect them together. Furthermore, the authorsargue that technological constraints on routers switchingfabric dictate the amount of bandwidth-links we can havewithin this topology. Furthermore, due to economical reasonsaccess providers aggregate their traffic over a few links aspossible since the cost of laying physical links could surpassthat of the switching/routing infrastructure. This, in turn, leadsto lower degree core and high degree edge elements. Theauthors create five graphs with the same degree distributionbut based on different heuristics/models and compare theperformance of these models using a single router model.Interestingly graphs that are less likely to be produced usingstatistical measures have the highest performance.Gregori et al. [49] conduct a structural interpretation of theInternet connectivity graph with an AS granularity. Theyreport on the structural properties of this graph using k-coredecomposition techniques. Furthermore, they report whateffects IXPs have on the AS-level topology.The data for this study is compiled from various datasets,namely CAIDA’s Ark, DIMES, and Internet TopologyCollection from IRL which is a combination of BGP updatesfrom Routeviews, RIPE RIS, and Abilene. The first twodatasets consist of traceroute data and are converted to AS-level topologies by mapping each hop to its correspondingASN. A list of IXPs was obtained using from PCH,PeeringDB, Euro-IX, and bgp4.as. The list of IXP memberswas compiled either from the IXP websites or by utilizingthe show ip bgp summary command from IXPs which hostan LG.Using the obtained AS-level graph resulted from combingvarious data sources the authors report on variouscharacteristics of the graph namely: degree, average neighbordegree, clustering coefficient, betweenness centrality, andk-core decomposition. A k-core subgraph has a minimumdegree of k for every node and is the largest subgraph whichhas this property. The authors present stats regarding thepenetration of IXPs in different continents with Europe havingthe largest share (47%) and North America (19%) at secondposition. Furthermore using k-core decomposition, the authorsidentify a densely connected core and a loosely connectedperiphery which consists of the majority of nodes. Theauthors also look at the fraction of nodes in the core whichare IXP participants and find that IXPs play a fundamentalrole in the formation of these cores.
2) Topology Incompleteness: Given the limited visibilityof each of the prior works, researchers have relied on adiverse set of data sources and devised new methodologiesfor inferring additional peerings to address the incompletenessof Internet topology. These works have lead to highlighting theimportance of IXPs as a means of providing the opportunityfor establishing many interconnections with IXP members anda major source for identifying missing peering links. Peeringswithin IXPs and their rich connectivity fabric between manyedge networks caused topological changes to the structure of

7
the Internet deviating from the historical hierarchical structureand as a consequence creating a more flat Internet structurereferred to as Internet flattening within the literature.He et al. [50] address AS-level topology incompletenessby presenting tools and methodologies which identify andvalidate missing links. BGP snapshots from various (34in total) Routeviews, RIPE RIS, and public route serversare collected to create a baseline AS-level topology graph.The business relationship of each AS edge is identified byusing the PTE algorithm [51]. The authors find that themajority of AS links are of a c2p type, while most of theadditional links which are found by additional collectorsare p2p links. Furthermore, by parsing IRR datasets usingNemecis [52] to infer additional AS links. A list of IXPparticipants is compiled by gathering IXP prefixes fromPCH and performing DNS lookups and parsing the resultingdomain name to infer the participating ASN. Furthermore,the authors infer inter-AS links within IXPs by relying ontraceroute measurements which cross IXP addresses andutilize a majority voting scheme to infer the participantsASN reliably. By Combing all these datasets and proposedmethodologies, the authors find about 300% additional linkscompared to prior studies, most of which is found to beestablished through IXPs.Augustin et al. [39] attempt to expand on prior works fordiscovering IXP peering relationships by providing a morecomprehensive view of this ecosystem. They rely on variousdata sources to gather information on IXPs as much aspossible, their data-sources are: (i) IXP databases such asPCH and PeeringDB, (ii) IXP websites which typically listtheir tenants as well as the prefixes which are employed bythem, (iii) RIRs may include BGP policy entries specificallythe import and export entries that expose peering relationships,(iv) DNS names of IXP addresses which include informationabout the peer, (v) BGP dumps from LGs, Routeviews,and RIPE’s RIS can include next hop neighbors whichare part of an IXP prefix. The authors conduct targetedtraceroute measurements with the intention of revealingpeering relationships between members of each IXP. To limitthe number of conducted probes, the authors either selecta vantage point within one of the member ASes or if notavailable they rely on the AS relationship datasets to discovera - at most 2 hops away - neighbor for each member whichhas a VP. Using the selected VPs, they conduct traceroutestowards alive addresses (or random address if such an addresswas not discovered) in the target network. Inference ofpeerings based on traceroutes is done using a majority votingscheme similar to [50]. The authors augment their collecteddataset with the data plane measurements of CAIDA’s Skitter,DIMES, and traceroutes measured from about 250 PlanetLabnodes. The resultant dataset is able to identify peerings within223 (out of 278) IXPs which consisted of about 100% (40%)more IXPs (peerings) compared to the work of He et al. [50].Ager et al. [53] rely on sFlow records from one of largestEuropean/global IXPs as another source of information forinferring peering relationships between IXP tenants andprovide insight on three fronts: (i) they outline the richconnectivity which is happening over the IXP fabric and
contrast that with known private peerings which are exposedthrough general topology measurement studies, (ii) presentthe business dynamics between participants of the IXPand providing explanation for their incentives to establishpeering relationships with others, and (iii) provide the trafficmatrix between peers of the IXP as a microcosm of Internettraffic. Among the set of analyses that have been conductedwithin the paper one could point to: (i) comparison ofpeering visibility from Routeviews, RIPE, LGs, and the IXPsperspective, (ii) manual label for AS types as well as thenumber of established peerings per member, (iii) breakdownof traffic into various protocols based on port numbers aswell as the share of each traffic type among various AS types,and (iv) traffic asymmetry, ratio of used/served prefixes andgeo-distance between end-points.Khan et al. [54] utilize LG servers to provide a complementaryview to Routeviews and RIPE RIR of the AS-level Internettopology. A list of 1.2k LGs (420 were operational at thetime of the study) has been built by considering varioussources including PeeringDB, traceroute.org, traceroute.net.ru,bgp4.as, bgp4.net, and virusnet. AS-level topologies fromIRL, CAIDA’s Ark, iPlane, and IRR’s are used to compare thecompleteness of the identified AS-links. For the duration ofa month show ip bgp summary is issued twice a week andBGP neighbor ip advertised is issued once a week towardsall LGs which support the command. The first commandoutputs each neighbor’s address and its associated ASN whilethe second command outputs the routing table of the router,consisting of reachable prefixes, next hop IP as well as theAS path towards the given prefix. AS-level connectivity graphis constructed by parsing the output of the prior commands.Using this new data source enables the authors to identify anadditional 11k AS-links and about 700 new ASes.Kloti et al. [55] perform a cross-comparison of three publicIXP datasets, namely PeeringDB [37], Euro-IX [56], andPCH [38] to study several attributes of IXPs such aslocation, facilities, and participants. Aside from the threeaforementioned public IXP datasets, for validation purposesBGP feeds collected by PCH route collectors as well asdata gathered from 40 IXP websites was used through thestudy. The three datasets lack common identifiers for IXPsacross datasets, for this reason in a first pass IXPs are linkedtogether through an automated process by relying on namesand geo information, in the second pass linked IXPs aremanually checked for correctness. The authors present oneof the largest IXP information datasets at the time as a sideeffect of their study.Geo coverage of each dataset is examined where the authorsfind relatively close coverage by each dataset except forNorth America region where PCH has the highest coverage.Facility location for IXPs is compared across datasets andis found that PCH lacks this information and in generalfacility information for IXPs is limited for other datasets.Complementarity of datasets is presented using both Jaccardand overlap index. It is found that PeeringDB and Euro-IXhave the largest overlap within Europe and larger IXPs tendto have the greatest similarity across all pairs of datasets.
8
Route Server
ASa
ASc
ASdASb
IXP
BLP
MLP
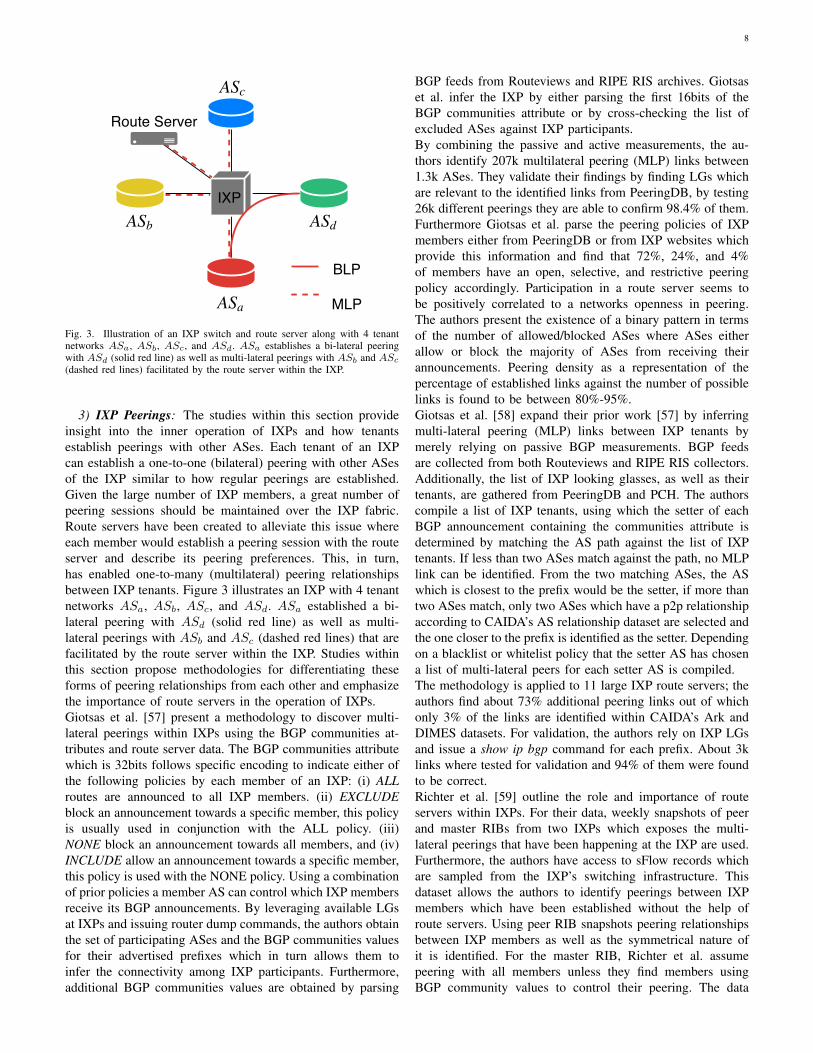
Fig. 3. Illustration of an IXP switch and route server along with 4 tenantnetworks ASa, ASb, ASc, and ASd. ASa establishes a bi-lateral peeringwith ASd (solid red line) as well as multi-lateral peerings with ASb and ASc
(dashed red lines) facilitated by the route server within the IXP.
3) IXP Peerings: The studies within this section provideinsight into the inner operation of IXPs and how tenantsestablish peerings with other ASes. Each tenant of an IXPcan establish a one-to-one (bilateral) peering with other ASesof the IXP similar to how regular peerings are established.Given the large number of IXP members, a great number ofpeering sessions should be maintained over the IXP fabric.Route servers have been created to alleviate this issue whereeach member would establish a peering session with the routeserver and describe its peering preferences. This, in turn,has enabled one-to-many (multilateral) peering relationshipsbetween IXP tenants. Figure 3 illustrates an IXP with 4 tenantnetworks ASa, ASb, ASc, and ASd. ASa established a bi-lateral peering with ASd (solid red line) as well as multi-lateral peerings with ASb and ASc (dashed red lines) that arefacilitated by the route server within the IXP. Studies withinthis section propose methodologies for differentiating theseforms of peering relationships from each other and emphasizethe importance of route servers in the operation of IXPs.Giotsas et al. [57] present a methodology to discover multi-lateral peerings within IXPs using the BGP communities at-tributes and route server data. The BGP communities attributewhich is 32bits follows specific encoding to indicate either ofthe following policies by each member of an IXP: (i) ALLroutes are announced to all IXP members. (ii) EXCLUDEblock an announcement towards a specific member, this policyis usually used in conjunction with the ALL policy. (iii)NONE block an announcement towards all members, and (iv)INCLUDE allow an announcement towards a specific member,this policy is used with the NONE policy. Using a combinationof prior policies a member AS can control which IXP membersreceive its BGP announcements. By leveraging available LGsat IXPs and issuing router dump commands, the authors obtainthe set of participating ASes and the BGP communities valuesfor their advertised prefixes which in turn allows them toinfer the connectivity among IXP participants. Furthermore,additional BGP communities values are obtained by parsing
BGP feeds from Routeviews and RIPE RIS archives. Giotsaset al. infer the IXP by either parsing the first 16bits of theBGP communities attribute or by cross-checking the list ofexcluded ASes against IXP participants.By combining the passive and active measurements, the au-thors identify 207k multilateral peering (MLP) links between1.3k ASes. They validate their findings by finding LGs whichare relevant to the identified links from PeeringDB, by testing26k different peerings they are able to confirm 98.4% of them.Furthermore Giotsas et al. parse the peering policies of IXPmembers either from PeeringDB or from IXP websites whichprovide this information and find that 72%, 24%, and 4%of members have an open, selective, and restrictive peeringpolicy accordingly. Participation in a route server seems tobe positively correlated to a networks openness in peering.The authors present the existence of a binary pattern in termsof the number of allowed/blocked ASes where ASes eitherallow or block the majority of ASes from receiving theirannouncements. Peering density as a representation of thepercentage of established links against the number of possiblelinks is found to be between 80%-95%.Giotsas et al. [58] expand their prior work [57] by inferringmulti-lateral peering (MLP) links between IXP tenants bymerely relying on passive BGP measurements. BGP feedsare collected from both Routeviews and RIPE RIS collectors.Additionally, the list of IXP looking glasses, as well as theirtenants, are gathered from PeeringDB and PCH. The authorscompile a list of IXP tenants, using which the setter of eachBGP announcement containing the communities attribute isdetermined by matching the AS path against the list of IXPtenants. If less than two ASes match against the path, no MLPlink can be identified. From the two matching ASes, the ASwhich is closest to the prefix would be the setter, if more thantwo ASes match, only two ASes which have a p2p relationshipaccording to CAIDA’s AS relationship dataset are selected andthe one closer to the prefix is identified as the setter. Dependingon a blacklist or whitelist policy that the setter AS has chosena list of multi-lateral peers for each setter AS is compiled.The methodology is applied to 11 large IXP route servers; theauthors find about 73% additional peering links out of whichonly 3% of the links are identified within CAIDA’s Ark andDIMES datasets. For validation, the authors rely on IXP LGsand issue a show ip bgp command for each prefix. About 3klinks where tested for validation and 94% of them were foundto be correct.Richter et al. [59] outline the role and importance of routeservers within IXPs. For their data, weekly snapshots of peerand master RIBs from two IXPs which exposes the multi-lateral peerings that have been happening at the IXP are used.Furthermore, the authors have access to sFlow records whichare sampled from the IXP’s switching infrastructure. Thisdataset allows the authors to identify peerings between IXPmembers which have been established without the help ofroute servers. Using peer RIB snapshots peering relationshipsbetween IXP members as well as the symmetrical nature ofit is identified. For the master RIB, Richter et al. assumepeering with all members unless they find members usingBGP community values to control their peering. The data

9
plane sFlow measurements would correspond to a peeringrelationship if BGP traffic is exchanged between two membersof the IXP. The proclivity of multi-lateral peering over bi-lateral peering is measured and found that ASes favor multi-lateral peerings with a ratio of 4:1 and 8:1 in the large andmedium IXPs accordingly. Furthermore, traffic volumes trans-mitted over multi-lateral and bi-lateral peerings are measuredand found that ASes tend to send more traffic over bi-laterallinks with a ratio of 2:1 and 1:1 for the large and mediumIXPs accordingly. It is found that ASes have binary behavior ofeither advertising all or none of their prefixes through the routeserver. Additionally, when ASes establish hybrid (multi andbi-lateral) peerings, they do not advertise further prefixes overtheir bi-lateral links. Majority of additional peerings happenover multi-lateral fabric while traffic ratios between multi(bi)-lateral peerings remain fairly consistent over the period ofstudy.Summary: This subsection provided an overview of researchesconcerned with AS-level topology. The majority of studieswere concerned with the incompleteness of Internet topologygraphs. These efforts lead to highlighting the importance ofIXPs as central hubs of connectivity. Furthermore, varioussources of information such as looking glasses, router col-lectors within IXPs, targeted traceroutes, RPSL entries, andtraffic traces of IXPs were gleaned together to provide amore comprehensive view of inter-AS relationships within theInternet. Lastly the importance of route servers to the inneroperation of IXPs and how they enable multi-lateral peeringrelationships was brought into attention.
B. Router-Level Topology
Although AS-level topologies provide a preliminary viewinto the structure and peering relations of ASes, they merelyrepresent virtual relationships and do not reflect details such asthe number and location where these peerings are established.ASes establish interconnections with each other by placingtheir border routers within colos where other ASes are alsopresent. Within these colos ASes can establish one to onepeerings through private interconnections or rely on an IXPsswitching fabric to establish public peerings with the IXPparticipants. Furthermore, some ASes extend their presenceinto remote colos to establish additional peerings with otherASes by relying on layer2 connectivity providers. Capturingthese details can become important for accurately attributinginter-AS congestion to specific links/routers or for pin-pointinglinks/routers that are responsible for causing outages or disrup-tions within the connectivity of a physical region or network.Studies within this section aim to present methodologies toinfer router-level topologies using data plane measurementsin the form of traceroute. These methods would address theaforementioned shortcomings of AS-level topologies by map-ping the physical entities (border routers) which are used to es-tablish peering relations and therefore can account for multiplepeering links between each AS. Furthermore, given that routersare physical entities, researchers are able to pinpoint theseborder routers to geo locations using various data sources andnewly devised methodologies. Creating router-level topologies
x
x
x′
y
y y′
z
z
x
x
x′
y
y y′
z
z
a
Fig. 4. Illustration of address sharing for establishing an inter-AS link betweenborder routers. Although the traceroute paths (dashed lines) are identical theinferred ownership of router interfaces and the placement of the inter-AS linkdiffers for these two possibilities.
of the Internet can be challenging due to many reasons. First,given the span of the Internet as well as the interplay ofbusiness relationships and routing dynamics, traceroute asthe de-facto tool for capturing router-level topologies is onlycapable of recording a minute fraction of all possible paths.Routing dynamics caused by changes in each ASes routepreference as well as the existence of load-balancers furthercomplicate this task. Second, correctly inferring which set ofASes have established an inter-AS link through traceroute isnot trivial due to non-standardized practices for establishinginterconnections between border routers as well as severalRFCs regarding the operation of routers that cause tracerouteto depict paths that do not correspond to the forward path.Lastly, given the disassociation of the physical layer fromthe transport layer establishing the geolocation for the set ofidentified routers is not trivial. Within Section III we presenteda series of platforms which try to address the first problem.The following studies summarize recent works which try toaddress the latter two problems.
1) Peering Inference: As briefly mentioned earlier, in-ferring inter-AS peering relationships using traceroute pathsis not trivial. To highlight this issue, consider the sampletopology within Figure 4 presenting the border routers of AS1
and AS2 color coded as orange and blue accordingly. Thisfigure shows the two possibilities for address sharing on theinter-AS link. The observed traceroute path traversing theseborder routers is also presented at the top of each figurewith dashed lines. Within the top figure AS2 is providingthe address space for the inter-AS link (y′ − z) while AS1
provides the address space for the inter-AS link (x′−y) for thebottom figure. As we can see both of the traceroute paths areidentical to each other while the ownership of router interfacesand the placement of the inter-AS link differs for these twopossibilities. To further complicate the matter, a border routercan respond with an interface (a in the top figure using addressspace owned by AS3 color coded with red), not on the forwardpath of the traceroute leading to incorrect inference of an inter-AS link between AS1 and AS3. Lastly, the border routers ofsome ASes are configured to not respond to traceroute probeswhich restrict the chances of inferring inter-AS peerings withthose ASes. The studies within this section try to addressthese difficulties by using a set of heuristics which are appliedto a set of traceroutes that allow them to account for these

10
difficulties.Spring et al. [19] done the seminal work of mapping networksof large ISPs and inferring their interconnections throughtraceroute probes. They make three contributions namely, (i)conducting selective traceroute probes to reduce the overalloverhead of running measurements, (ii) provide an alias reso-lution technique to group IP address into their correspondingrouter, and (iii) parse DNS information to extract PoP/GEOinformation. Their selective probing method is composed oftwo main heuristics: (i) directed probing, which utilizes Route-views data and the advertised paths to probe prefixes whichare likely to cross the target network, (ii) path reduction, thatavoids conducting traceroutes which would lead to redundantpaths, i.e., similar ingress or egress points. Additionally, analias resolution technique named Ally is devised to groupinterfaces from a single network into routers. Lastly, a series ofDNS parsing rules are crafted to extract geoinformation fromrouter interface RDNS entries. The extracted geo informationallows the authors to identify the PoPs of each AS. Lookingglasses listed on traceroute.org are used to run Rocketfuel’smethodology to map the network of 10 ISPs including AT&T,Sprint, and Verio. The obtained maps were validated throughprivate correspondence with network operators and by compar-ing the set of identified BGP neighbors with those obtainablethrough BGP feeds.Nomikos et al. [60] develop an augmented version of tracer-oute (traIXroute) which annotates the output path and reportswhether (and at which exact hop) an IXP has been crossedalong the path. The tool can operate with either tracerouteor scamper as a backend. As input, traIXroute requires IXPmembership and a list of their corresponding prefixes fromPeeringDB and PCH as well as Routeviews’ prefix to origin-AS mapping datasets. traIXroute annotates the hops of theobserved path with the origin AS and tags hops which arepart of an IXP prefix and also provides the mapping betweenan IXP address and the members ASN if such a mappingexists. Using a sliding window of size three the hops of thepath are examined to find (i) hops which are part of an IXPprefix, (ii) hops which have an IXP to ASN mapping, and(iii) whether the adjacent ASes are IXP members or not. Theauthors account for a total of 16 possible combinations andpresent their assessment regarding the location of the IXP linkfor 8 cases that were most frequent. About 75% of observedpaths matched rules which rely on IXP to ASN mapping data.The validity of this data source is looked into by using BGPdumps from routers that PCH operates within multiple IXPs.A list of IXP address to ASN mappings was compiled byusing the next hop address and first AS within the AS pathfrom these router dumps. The authors find that 92% (93%) ofthe IXP to ASN mappings reported by PeeringDB (PCH) areaccurate according to the BGP dumps. Finally, the prevalenceof IXPs along Internet paths are measured by parsing a CAIDAArk snapshot. About 20% of paths are reported to cross IXPs,the IXP hop on average is located on the 6th hop at the middleof the path, and only a single IXP is observed along each routewhich is in accordance with valley-free routing.Luckie et al. [61] develop bdrmap, a method to identifyinter-domain links of a target network at the granularity of
individual routers by conducting targeted traceroutes. As aninput to their method, they utilize originated prefixes fromRouteviews and RIPE RIS, RIR delegation files, list of IXPprefixes from PeeringDB and PCH, and CAIDA’s AS-to-ORGmapping dataset. Target prefixes are constructed from the BGPdatasets by splitting overlapping prefixes into disjoint subnets,the first address within each prefix is targeted using paris-traceroute, neighbors border addresses are added to a stoplist to avoid further probing within the customer’s network.IP addresses are grouped together to form a router topologyby performing alias resolution using Ally and Mercator. Byutilizing the prefixscan tool, they try to eliminate third-partyresponses for cases where interfaces are responsive to aliasresolution. Inferences to identify inter-AS links are done byiteratively going through a set of 8 heuristics which aredesigned to minimize inference errors caused by addresssharing, third-party response, and networks blocking tracerouteprobes. Luckie et al. deploy their tool within 10 networks andreceive ground truth results from 4 network operators; theirmethod is able to identify 96-99% of inter-AS links for thesenetworks correctly. Furthermore, the authors compare theirfindings against BGP inferred relationships and find that theyare able to observe between 92% - 97% of BGP links. Usinga large US access network as an example, the authors studythe resiliency of prefix reachability in terms of the number ofexit routers and find that only 2% of prefixes exit through thesame router while a great majority of prefixes had about 5-15exit routers. Finally, the authors look at the marginal utilityof using additional VPs for identifying all inter-AS links andfind that results could vary depending on the target networkand the geographic distribution of the VPs.Marder et al. [62] devise a tool named MAP-IT for identifyinginter-AS links by utilizing data-plane measurements in theform of traceroutes. The algorithm developed in this methodrequires as input the set of traceroute measurements whichwere conducted in addition to prefix origin-AS from BGPdata as well as a list of IXP prefixes and CAIDA’s AS toORG mapping dataset. For each interface a neighbor set (Ns)composed of addresses appearing on prior (Nb) and next (Nf )hops of traceroute is created. Each interface is split into twohalves, the forward and backward halves. Direct inferencesare made regarding the ownership of each interface half bycounting the majority ASN based on the current IP-to-ASmapping dataset. At the end of each round, if a direct inferencehas been made for an interface half, the other side will beupdated with an indirect inference. Furthermore, within eachiteration of the algorithm using the current IP-to-AS mapping,MAP-IT visits interface halves with direct inferences to checkwhether the connected AS still holds the majority, if not theinference is reduced to indirect, after visiting all interfacehalves any indirect inference without an associated directinference is removed. MAP-IT would update the IP to ASmapping dataset based on the current inferences and wouldcontinue this process until no further inferences are made. Forverification Marder et al. use Internet2’s network topology aswell as a manually compiled dataset composed of DNS namesfor Level3 and TeleSonera interfaces. The authors investigatethe effect of the hyper parameter f which controls the majority

11
voting outcome for direct inferences and empirically find thata value of 0.5 yields the best result. Using f=0.5 MAP-IT has arecall of 82% - 100% and a precision of 85% - 100% for eachnetwork. The authors also look into the incremental utility ofeach iteration of MAP-IT, interestingly the majority ( 80%) ofinferences can be made in the first round which is equivalentto making inferences based on a simple IP2AS mapping. Thealgorithm converges quickly after its 2nd and 3rd iterations.Marder et al. [63] combine the best practices of bdrmap [61]and MAP-IT [62] into bdrmapIT, a tool for identifying the bor-der routers that improves MAP-IT’s coverage without loosingbdrmap’s accuracy at identifying border routers of a singleASN. The two techniques are mainly made compatible withthe introduction of “Origin AS Sets” which annotates eachlink between routers with the set of origin ASes from the priorhop. bdrmapIT relies on a two-step iterative process. Duringthe first step, the owner of routers are inferred by countingthe routers majority subsequent interfaces votes. Exceptionsin terms of the casted vote for IXP interfaces, reallocatedprefixes, and multi-homed routers are made to account forthese cases correctly. During the second step, interfaces areannotated with an ASN using either the origin AS (if routerannotation matches that of the interface) or the majority voteof prior connected routers (if router annotation differs fromthe interface). The iterative process is repeated until no furtherchanges are made to the connectivity graph. The methodologyis evaluated using bdrmap’s ground truth dataset, as well asthe ITDK dataset by removing the probes from a ground truthVP. The authors find that bdrmapIT improves the coverageof MAP-IT by up to 30% while maintaining the accuracy ofbdrmap.
2) Geo Locating Routers & Remote Peering: HistoricallyASes would have established their peering relations with otherASes local to their PoPs and would have relied on theirupstream providers for connectivity to the remainder of theInternet. IXPs enabled ASes to establish peerings that bothimproved their performance due to shorter paths and reducedtheir overall transit costs by offload upstream traffic on p2plinks instead of c2p links. With the proliferation of IXPs andtheir aforementioned benefits, ASes began to expand theirpresence not only within local IXPs but also remote onesas well. ASes would rely on layer2 connectivity providers toexpand their virtual PoPs within remote physical areas. Layer3measurements are agnostic to these dynamics and are not ableto distinguish local vs. remote peering relations from eachother. Researchers have tried to solve this issue by pinpointingborder routers of ASes to physical locations. The association ofrouters to geolocations is not trivial, researchers have relied ona collection of complementary information such as geocodedembeddings within reverse DNS names or by constrainingthe set of possible locations through colo listings offered byPeeringDB and similar datasets. In the following, we presenta series of recent studies which tackle this unique issue.Castro et al. [41] present a methodology for identifying remotepeerings, where two networks interconnect with each othervia a layer-2 connectivity provider. Furthermore, they deriveanalytical conditions for the economic viability of remotepeering versus relying on transit providers. Levering Peer-
ingDB, PCH, and information available on IXP websites alist of IXP’s as well as their tenants, prefixes and interfaceto member mapping is obtained. For this study, IXPs whichhave at least one LG or RIPE NCC probe (amounting to atotal of 22) are selected. By issuing temporally spaced probestowards all of the identified interfaces within IXP prefixesand filtering interfaces which either do not respond frequentlyor do not match an expected maximum TTL value of 255or 64 a minimum RTT value for each interface is obtained.By examining the distribution of minimum RTT for eachinterface, a conservative threshold of 10ms is selected toconsider an interface as remote. A total of 4.5k interfacescorresponding to 1.9k ASes in 22 IXPs are probed in thestudy. The authors find that 91% of IXPs have remote peeringwhile 285 ASes have a remote interface. Findings includingRTT measures as well as remote labels for IXP members wereconfirmed for TorIX by the staff. One month of Netflow datacaptured at the border routers of RedIRIS (Spain’s researchand education network) is used to examine the amount ofinbound and outbound traffic between RedIRIS and its transitproviders, using which an upper bound for traffic which can beoffloaded is estimated. Furthermore, the authors create a listof potential peers (2.2k) which are reachable through Euro-IX,these potential peers are also categorized into different groupsbased on their peering policy which is listed on PeeringDB.Considering all of the 2.2k networks RedIRIS can offload27% (33%) of its inbound (outbound) traffic by remotelypeering with these ASes. Through their analytical modeling,the authors find that remote peering is viable for networks withglobal traffic as well as networks which have higher ratios oftraffic-independent cost for direct peering compared to remotepeering such as networks within Africa.Giotsas et al. [64] attempt to obtain a peering interconnectionmap at the granularity of colo facilities. Authors gather ASto facility mapping information from PeeringDB as well asmanually parsing this information for a subset of networksfrom their websites. IXP lists and members were compiledby combining data from PeeringDB, PCH, and IXP websites.For data-plane measurements, the authors utilize traceroutedata from RIPE Atlas, iPlane, CAIDA’s Ark, and a seriesof targeted traceroutes conducted from looking glasses. Theauthors annotate traceroute hops with their corresponding ASNand consider the segment which has a change in ASN asthe inter-AS link. Using the colo-facility listing obtained inthe prior step the authors produce a list of candid facilitiesfor each inter-AS link which can result in three cases: (i)a single facility is found, (ii) multiple facilities match thecriteria, or (iii) no candid facility is found. For the lattertwo cases, the author’s further constraint the search spaceby either benefiting from alias resolution results (two aliasinterfaces should reside in the same facility) or by conductingfurther targeted probes which are aimed at ASNs that havea common facility with the owner AS of the interface inquestion. The methodology is applied to five content providers(Google, Yahoo, Akamai, Limelight, and Cloudflare) and fivetransit networks (NTT, Cogent, DT, Level3, and Telia). Theauthors present the effect of each round of their constrainedfacility search (CFS) algorithm’s iteration (max iteration count

12
of 100), the majority of pinned interfaces are identified upto the 40th iteration with RIPE probes providing a betteropportunity for resolving new interfaces. The authors find thatDNS-based pinning methods are able to identify only 32%of their findings. The authors also cross-validate their findingsusing direct feedback from network admins, BGP communitiesattribute, DNS records, and IXP websites with 90% of theinterfaces being pinned correctly and for the remainder, thepinning accuracy was correct at a metro granularity.Nomikos et al. [42] present a methodology for identify-ing remote peers within IXPs, furthermore they apply theirmethodology to 30 large IXPs and characterize differentaspects of the remote peering ecosystem. They define an IXPmember as a remote peer if it is not physically connected tothe IXPs fabric or reaches the IXP through a reseller. Thedevelopment of the methodology and the heuristics used bythe authors are motivated by a validation dataset which theyobtain through directly contacting several IXP operators. Acollection of 5 heuristics are used in order to infer whether anIXP member is peering locally or remotely these heuristics inorder of importance are: (i) the port capacity of a customer, (ii)latency measurements from VPs within IXPs towards customerinterfaces, (iii) colocation locations within an RTT radius,(iv) multi-IXP router inferences by parsing traceroutes frompublicly available datasets and corroborating the location ofthese IXPs and whether the AS in question is local to any ofthem, and (v) identifying private peerings (by parsing publictraceroute measurements) between the target AS and one ormore local IXP members is used as a last resort to inferwhether a network is local or remote to a given IXP. Themethodology is applied to 30 large IXPs, and the authors findthat a combination of RTT and colo listings to be the mosteffective heuristics in inferring remote peers. Overall 28% ofinterfaces are inferred to be peering remotely and for 90% ofIXPs. The size of local and remote ASes in terms of customercone is observed to be similar while hybrid ASes tend tohave larger network sizes. The growth of remote peering isinvestigated over a 14 month period, and the authors find thatthe number of remote peers grew twice as fast as the numberof local peers.Motamedi et al. [65] propose a methodology for inferringand geolocating interconnections at a colo level. The authorsobtain a list of colo facility members from PeeringDB and coloprovider webpages. A series of traceroutes towards the addressspace of prior steps ASes are conducted using available mea-surement platforms such as looking glasses and RIPE Atlasnodes in the geo proximity of the targeted colo. tracerotuepaths are translated to a router-level connectivity graph usingalias resolution and a set of heuristics based on topologyconstraints. The authors argue that a router-level topologycoupled with the prevalence of observations allows them toaccount for traceroute anomalies and they are able to infer thecorrect ASes involved in each peering. To geolocate routers,an initial set of anchor interfaces with a known location iscreated by parsing reverse DNS entries for the observed routerinterfaces. This information is propagated/expanded throughthe router-level graph by a Belief Propagation algorithm thatuses a set of co-presence rules based-on membership in the
same alias set and latency difference between neighboringinterfaces.
Summary: while traceroutes have been historically uti-lized as a source of information to infer inter-AS links, themethodologies did not correctly account for the complexitiesof inferring BGP peerings from layer-3 probes. The com-mon practice of simply mapping interface addresses alongthe path to their origin-AS based on BGP data does notaccount for the visibility of BGP collectors, address sharingfor establishing inter-AS links, third-party responses of TTLexpired messages by routers, and unresponsive routers orfirewalled networks along the traceroute path. The presentedmethodologies within this section attempt to account for thesedifficulties by corroborating domain knowledge for commonnetworking practices and relying on a collection of traceroutepaths and their corresponding router view (obtained by usingalias resolution techniques) to make accurate inferences of theentities which are establishing inter-AS links. Furthermore,pin-pointing routers to physical locations was the key enablerfor highlighting remote peerings that are simply not visiblefrom an AS-level topology.
C. PoP-Level Topology
PoP-level topologies present a middle ground between AS-level and router-level topologies. A PoP-level graph presentsthe points of presence for one or many networks. Thesetopologies inherently have geo information at the granularityof metro areas embedded within. They have been historicallyat the center of focus as many ASes disclose their topologies ata PoP level granularity and do not require detailed informationregarding each individual router and merely represent a bundleof routers within each PoP as a single node. They have losttheir traction to router-level topologies that are able to capturethe dynamics of these topologies in addition to providingfiner details of information. Regardless of this, due to theimportance of some ASes and their centrality in the operationof today’s Internet, several studies [66], [67], [68] outliningthe internal operation of these ASes within each PoP haveemerged. These studies offer insight into the challenges theseASes face for peering and serving the vast majority of theInternet as well as the solutions that they have devised.Cunha et al. [13] develop Sibyl, a system which providesan expressive interface that allows the user to specify therequirements for the path of a traceroute, given the set ofrequirements Sibyl would utilize all available vantage pointsand rely on historical data to conduct a traceroute from agiven vantage point towards a specific destination that is mostlikely to satisfy the users constraints. Furthermore, given thateach vantage point has limited probing resources and thatconcurrent requests can be made, Sibyl would pick source-destination pairs which optimize for resource utilization. Sibylcombines PlanetLab, RIPE Atlas, traceroute servers accessiblethrough looking glasses, DIMES, and Dasu measurement plat-forms to maximize its coverage. Symbolic regular expressionsare used for the query interface where the user can expresspath properties such as the set of traversed ASes, cities, andPoPs. The likelihood of each source-destination pair matching

13
the required path properties is calculated using a supervisedmachine learning technique (RuleFit) which is trained basedon prior measurements and is continuously updated basedon new measurements. Resource utilization optimization isaddressed by using a greedy algorithm, Sibyl chooses to issuetraceroutes that fit the required budget and that have the largestmarginal expected utility based on the output of the trainedmodel.Schlinker et al. [67] outline Facebook’s edge fabric withintheir PoPs by utilizing an SDN based system that alters BGPlocal-pref attributes to utilize alternative paths towards specificprefixes better. The work is motivated by BGP’s shortcomingsnamely, lack of awareness of link capacities and incapabilityto optimize path selections based on various performancemetrics. More specifically BGP makes its forwarding decisionsusing a combination of AS-path length and the local-perf met-ric. Facebook establishes BGP connections with other ASesthrough various means namely, private interconnections, publicpeerings through IXPs, and peerings through router serverswithin IXPs. The authors report that the majority of theirinterconnections are established through public peerings whilethe bulk of traffic is transmitted over the private links. Thelater reflects Facebook’s preference to select private peeringsover public peerings while peerings established through routeservers have the lowest priority. Furthermore, the authorsobserve that for all PoPs except one, all prefixes have atleast two routes towards each destination prefix. The proposedsolution isolates the traffic engineering per PoP to simplify thedesign, the centralized SDN controller within each PoP gathersrouter RIB tables through a BMP collector. Furthermore,traffic statistics are gathered through sampled sFlow or IPFIXrecords. Finally, interface information is periodically pulled bySNMP. The collector emulates BGP’s best path selection andprojects interface utilization. For overloaded interfaces prefixeswith alternative routes are selected, an alternative route isselected based on a set of preferences. The output of this stepgenerates a set of route overrides which are enforced by settinga high local-pref value for them. The authors report that theirdeployed system detours traffic from 18% of interfaces. Themedian of detour time is 22 minutes and about 10% of detourslast as long as 6 hours. The detoured routes resulted in 45% ofthe prefixes achieving a median latency improvement of 20mswhile 2% of prefixes improved their latency by 100ms.Yap et al. [66] discuss the details of Espresso, an application-aware routing system for Google’s peering edge routing infras-tructure. Similar to the work of Schlinker et at. [67] Espressois motivated by the need for a more efficient (both technicallyand economically) edge peering fabric that can account fortraffic engineering constraints. Unlike the work of Schlinkeret al. [67] Espresso maintains two layers of control plane onewhich is localized to each PoP while the other is a globalcentralized controller that allows Google to perform furthertraffic optimizations. Espresso relies on commodity MPLSswitches for peering purposes, traffic between the switchesand servers are encapsulated in IP-GRE and MPLS headers.IP-GRE header encodes the correct switch, and the MPLSheader determines the peering port. The global controller (GC)maintains an egress map that associates each client prefix and
PoP tuple to an edge router/switch and egress port. User trafficcharacteristics such as throughput, RTT, and re-transmits arereported at a /24 granularity to the global controller. Linkutilization, drops, and port speeds are also reported back tothe global controller. A greedy algorithm is used by the GCto assign traffic to a candid router port combination. Thegreedy algorithm starts by making its decisions using trafficpriority metrics and orders its available options based on BGPpolicies, user traffic metrics, and the cost of serving on aspecific link. Espresso has been incrementally deployed withinGoogle and at the time of the study was responsible for servingabout 22% of traffic. Espresso is able to maintain higher linkutilization while maintaining low packet drop rates even forfully utilized links (95% less than 2.5%). The authors reportthat the congestion reaction feature of the GC results in highergoodput and mean time between re-buffers for video traffic.Wohlfart et al. [68] present an in-depth study of the connectiv-ity fabric of Akamai at its edge towards its peers. The authorsaccount 3.3k end-user facing (EUF) server deployments withvarying size and capabilities which are categorized into fourmain groups. Two of these groups have Akamai border routersand therefore establish explicit peerings with peers and delivercontent directly to them while the other two groups are hostedwithin another ASes network and are responsible for deliveringcontent implicitly to other peers. Customers are redirectedto the correct EUF server through DNS, the mapping isestablished by considering various inputs including BGP feedscollected by Akamai routers, user performance metrics, andlink cost information. To analyze Akamai’s peering fabric,the authors rely on proprietary BGP snapshots obtained fromAkamai routers and consist of 3.65M AS paths and about1.85M IPv4 and IPv6 prefixes within 61k ASes (ViewA). Asa point of comparison, a combination of daily BGP feedsfrom Routeviews, RIPE RIS, and PCH consisting of 21.1MAS paths and 900k prefixes within 59k ASes is used (ViewP).While at an AS level both datasets seem to have a relativelysimilar view, ViewA (ViewP) observes 1M (0.1M) prefixes themajority of which are prefixes longer than /25. Only 15% ofAS paths within ViewP are observed by ViewA which suggeststhat a large number of AS paths within ViewP are irrelevantfor the operation of Akamai. Wohlfart et al. report 6.1k uniqueexplicit peerings between Akamai and its neighbors by count-ing the unique number of next-hop ASN from the AkamaiBGP router dumps. About 6k of these peerings happen throughIXPs while the remainder are established through PNIs. Incomparison, only 450 peerings between Akamai and otherASes are observed through ViewP. Using AS paths withinViewP the authors report about 28k implicit peers whichare within one AS hop from Akamai’s network. Lastly, theperformance of users sessions are looked into by utilizing EUFserver logs containing the clients IP address, throughput, and asmoothed RTT value. The performance statistics are presentedfor two case studies (i) serving a single ISP and (ii) servingcustomers within 6 distinct metros. Overall 90% of traffic iscoming from about 1% of paths and PNIs are responsible fordelivering the bulk of traffic and PNIs and cache servers withineyeball ASes achieve the best performance regarding RTT.Nur et al. [69] study the Internet AS-level topology using a
14
multigraph representation where AS pairs can have multipleedges between each other. Traceroute measurements fromCAIDA’s Ark and iPlane projects are collected for this study.For IP to AS mapping Routeviews’ BGP feed is utilized. Nexthop addresses for BGP announcements are extracted fromRouteviews as well as RIPE RIS. For mapping IP addressesto their corresponding geo-location various data sources havebeen employed namely, (i) UNDNS for DNS parsing, (ii) DB-IP, (iii) Maxmind GeoLite2 City, and (iv) IP2Location DB5Lite.Each ASes border interface is identified by tracking ASNchanges along the hops of each traceroute. Each cross borderinterface X-BI is geolocated to the city in which it resides byapplying one of the following methods in order of precedence:(i) relying on UNDNS for extracting geoinformation fromreverse DNS names, (ii) majority vote along three (DB-IP,Maxmind, and IP2Location) IP to GEO location datasets, (iii)sandwich method where an unresolved IP between two IPs inthe same geolocation is mapped to the same location, (iv) RTTbased geo locating which relies on the geolocation of prior ornext hops of an unresolved address that have a RTT differencesmaller than 3 ms for mapping them to the same location,and (v) if all of the prior methods fail Maxmind’s output isused for mapping the geolocation of the X-BI. The set ofinter-AS links resulting from parsing traceroutes is augmentedby benefiting from BGP data. If an AS relationship existsbetween two ASes but is missing from the current AS-levelgraph and all identified X-BIs corresponding to these ASesare geolocated to a single city, a link will be added to the AS-level topology graph under the assumption that this is the onlypossible location for establishing an interconnection betweenthese two ASes.The inferred PoP nodes in the AS graph are validated formajor research networks as well as several commercial ISPs.The overlap of identified PoPs is measured for networks whichhave publicly available PoP-level maps. The maps align withthe set of identified cities by X-AS with deviations in termsof number of PoPs per city. This is a limitation of X-AS asit is only able to identify one PoP per city. Identified AS-links are compared against CAIDA’s AS relationships dataset,the percentage of discrepancy for AS links of each AS ismeasured. For 78% of ASes, the maps agree with each othercompletely, and the average link agreement is about 85% forall ASes. Various properties of the resulting graph are analyzedin the paper, the authors find that the number of X-BI nodesper AS, X-BI nodes degree, and AS degree all follow a powerlaw distribution.
Summary: PoP-level topologies can offer a middle groundbetween router-level and AS-level topologies offering an un-derstanding of inter-AS peering relationships while also beingable to distinguish instances of these peerings happening atvarious geo-locations/PoPs. Additionally, we reviewed studiesthat elaborate on the faced challenges as well as the devisedsolutions for content provider (Google, Facebook) and CDN(Akamai) networks which are central to the operation oftoday’s Internet.
D. Physical-Level Topology
This subsection is motivated by the works of Knight et al.[70] and Durairajan et al. [71], [72], [73] which presentedthe groundwork for having a comprehensive physical map ofthe Internet consisting of edges corresponding to fiber opticcables providing connectivity between metro areas and PoPsas nodes within these topologies. A sample of this topology forCenturyLink’s fiber-optic backbone network within the conti-nental US is presented in Figure 5. Physical maps were mostlyneglected by the Internet topology community mainly due totwo reasons: (i) the scarcity of well-formatted informationand (ii) the complete disassociation of physical layers fromprobes conducted within higher layers of the TCP/IP stack.The following set of papers try to address the former issue bygathering various sources of information and compiling theminto a unified format.
Knight et al. [70] present the Internet topology Zoo whichis a collection of physical maps of various networks withinthe Internet. The authors rely on ground truth data publiclyprovided by the network operators on their websites. Thesemaps are presented in various formats such as static imagesor flash objects. The authors transcribe all maps using yEd (agraph editor and diagraming program) into a unified graphspecification format (GML) and annotate nodes and linkswith any additional information such as link speed, link type,longitude, and latitudes that is provided by these maps. Eachmap and its corresponding network is classified as a backbone,testbed, customer, transit, access or internet exchange basedon the properties of their network. For example, backbonenetworks should connect at least two cities together whileaccess networks should provide edge access to individuals.A total of 232 networks are transcribed by the authors. About50% of networks are found to have more than 21 PoPs andeach of these PoPs have an average degree of about 3. Lastlysimilar to [49] the core density of networks is examined bymeasuring the 2-core size of networks. A wide degree of 2-core sizes ranging from 0 (tree-like networks) to 1 (denselyconnected core with hanging edges) are found within thedataset.Durairajan et al. [71] create a map of the physical Internetconsisting of nodes representing colocation facilities and data-centers, links representing conduits between these nodes andadditional metadata related to these entities. The authors relyon publicly available network maps (images, Flash objects,Google Maps overlays) provided by ASes. The methodologyfor transcribing images consists of 5 steps: (i) capturinghigh-resolution sub-images, (ii) patching sub-images into acomposite image, (iii) extracting a link image using colormasking techniques, (iv) importing link image into ArcGISusing geographic reference points, and (v) using link vector-ization in ArcGIS to convert links into vectors. Given thateach map has a different geo resolution, different scores areattributed to nodes with lat/lon or street level, city, and statehaving a corresponding score of 1.0, 0.75, 0.5. All maps haveat least city level resolution with about 20% of nodes havinglat/lon or street level accuracy.Durairajan et al. [72] work is motivated by two research

15
Fig. 5. Fiber optic backbone map for CenturyLink’s network in continental US. Each node represents a PoP for CenturyLink while links between these PoPsare representative of the fiber optic conduits connecting these PoPs together. Image courtesy of CenturyLink.
questions: (i) how do physical layer and network layer mapscompare with each other? and (ii) how can probing tech-niques be improved to reveal a larger portion of physicalinfrastructure? For physical topologies, the authors rely onmaps which are available from the Internet Atlas project.From this repository the maps for 7 Tier-1 networks and 71non-Tier-1 networks which are present in North America aregathered, these ASes collectively consist of 2.6k PoPs and3.6k links. For network layer topologies, traceroutes from theCAIDA Ark project during the September 2011 to Match2013 period are used. Additionally DNS names for routerinterfaces are gathered from the IPv4 Routed /24 DNS NamesDataset which includes the domain names for IP addressesobserved in the CAIDA Ark traceroutes. Traceroute hops areannotated with their corresponding geo information (extractedwith DDeC) as well as the AS number which is collected fromTeamCymru’s service. Effects of vantage point selection onnode identification are studied by employing public tracerouteservers. Different modalities depending on the AS ownershipof the traceroute server and the target address are considered([V Pin, tin], [V Pin, tout], [V Pout, tin]). Their methodology(POPsicle) chooses VPs based on geo proximity towards theselected targets and along the pool of destinations, thosewhich have a square VP to destination distance greater thanthe sum of squares of the distance between target VP anddestination are selected to create a measurement cone. Forthis study 50 networks that have a comprehensive set of geo-information for their physical map are considered. Out of these50 networks, 21 of them do not have any geo information
embedded in their DNS names. Furthermore, 16 ASes werenot observed in the Ark traces. This results in 13 ASes out ofthe original 50 which have both traces and geo-informationin the network layer map. POPsicle was deployed in anIXP (Equinix Chicago) to identify the PoPs of 10 tenants.Except for two networks, POPsicle was able to identify allknown PoPs of these networks. Furthermore, POPsicle wasevaluated by targeting 13 ISPs through Atlas probes whichwere deployed in IXPs, for all of these ISPs POPsicle wasable to match or outperform Ark and Rocketfuel. Furthermorefor 8 of these ISPs POPsicle found all or the majority of PoPspresent in Atlas maps.Durairajan et al. [73] obtain the long-haul fiber network withinthe US and study its characteristics and limitations. For theconstruction of the long-haul fiber map, Durairajan et al. relyon the Internet Atlas project [71] as a starting point andconfirm the geo-location or sharing of conduits through legaldocuments which outline laying/utilization of infrastructure.The methodology consists of four steps: (i) using InternetAtlas maps for tier-1 ASes that have geo-coded information, abasic map is constructed, (ii) the geolocation of nodes andlinks for the map is confirmed through any form of legaldocument which can be obtained, (iii) the map is augmentedwith additional maps from large transit ASes which lackany geo-coded information, (iv) the augmented map is onceagain confirmed through any legal document that would eitherconfirm the geolocation of a node/link or would indicateconduit sharing with links that have geo-coded information.The long-haul fiber map seems to be physically aligned with

16
roadway and railway routes, the authors use the polygonoverlap feature of ArcGIS to compare the overlap of thesemaps and find that most often long-hauls run along roadways.The authors also assess shared conduit risks, for this purposethey construct a conduit sharing matrix were rows are ASesand columns are conduits the value within each row indicatesthe number of ASes which are utilizing that conduit. Out of542 identified conduits about 90% of them are shared by atleast one other AS. Using the risk matrix the hamming distancefor each AS pair is measured to identify ASes which havesimilar risk profiles. Using traceroute data from Edgescapeand parsing geoinformation in domain names the authors inferwhich conduits were utilized by each traceroute and utilize thefrequency of traceroutes as a proxy measure of traffic volume.Finally a series of risk mitigation analysis are conductednamely: (i) the possibility of increasing network robustness byutilizing available conduits or by peering with other networksis investigated for each AS (ii) increasing network robustnessthrough the addition of additional k links is measured for eachnetwork, and lastly (iii) possibility for improving latency isinvestigated by comparing avg latencies against right of way(ROW), line of sight (LOS), and best path delays.
Summary: the papers within this sub-section provided anoverview of groundbreaking works that reveal physical-leveltopologies of the Internet. The researchers gathered variouspublicly available maps of ASes as well as legal docu-ments pertaining to the physical location of these networksto create a unified, well-formatted repository for all thesemaps. Furthermore, the applicability of these maps towardsthe improvement of targeted probing methodologies and thepossibility of improving and provisioning the infrastructureof each network is investigated. Although the interplay ofrouting on top of these physical topologies is unknown andremains as an open problem, these physical topologies providecomplementary insight into the operation of the Internet andallow researchers to provision or design physical infrastruc-ture supporting lower latency Internet access or to measurethe resiliency of networks towards natural disasters.
V. IMPLICATIONS & APPLICATIONS OF NETWORKTOPOLOGY
This section will provide an overview of the studies whichrely on Internet topology to provide additional insight regard-ing the performance, resiliency, and various characteristics ofthe Internet. The studies which are outlined in this section lookinto various properties of the Internet including but not limitedto: path length both in terms of router and AS hops, latency,throughput, packet loss, redundancy, and content proximity.In a more broad sense, we can categories these studies intothree main groups: (i) studying performance characteristics ofthe Internet, (ii) studying resiliency of the Internet, and (iii)classifying the type of inter-AS relationships between ASes.Depending on the objective of the study one or more ofthe aforementioned properties of the Internet could be thesubject which these studies focus on. Each of these studieswould require different resolutions of Internet topology. Asoutlined in Section IV obtaining a one to one mapping between
different resolutions is not always possible. For example, eachAS link can correspond to multiple router level links whileeach router level link can correspond to multiple physicallinks. For this reason, each study would rely on a topology mapwhich better captures the problems objectives. As an example,studying the resiliency of a transit ASes backbone to naturaldisasters should rely on a physical map while performingthe same analyses using an AS-level topology could leadto erroneous conclusions given the disassociation of ASesto physical locations. While on the other hand studying thereachability and visibility of an AS through the Internet wouldrequire an AS-level topology and conducting the same studyusing a fiber map would be inappropriate as the interplay ofthe global routing system on top of this physical map is notknown. The remainder of this section would be organized intothree sub-sections presenting the set of studies which focus onthe (i) Internet performance, (ii) Internet resiliency, and (iii)AS relationship classification. Furthermore, each sub-sectionwould further divide the studies based on the granularity ofthe topology which is employed.
A. Performance
Raw performance metrics such as latency and throughputcan be conducted using end-to-end measurements withoutany attention to the underlying topology. While these mea-surements can be insightful on their own, gaining a furtherunderstanding of the root cause of subpar performance oftenrequires knowledge of the underlying topology. For example,high latency values reported through end-to-end measurementscan be a side effect of many factors including but not limitedto congestion, a non-optimal route, an overloaded server, andapplication level latencies. Many of these underlying causescan only be identified by a correct understanding of the under-lying topology. Congestion can happen on various links alongthe forward and reverse path, identifying the faulty congestedlink or more specifically the inter-AS link requires a correctmapping for the traversed topology. Expanding infrastructureto address congestion or subpar latency detected through end-to-end measurements is possible through an understanding ofthe correct topology as well as the interplay of routing on topof this topology. In the following Section, we will presentstudies that have relied on router, AS, and physical leveltopologies to provide insight into various network performancerelated issues.
1) AS-Level Topology: Studies in this section rely on BGPfeeds as well as traceroute probes that have been translatedto AS paths to study performance characteristics such asincreased latency and path lengths due to insufficient networkinfrastructure within Africa [74], [75], path stability and thelatency penalties due to AS path changes [76], IXPs centralityin Internet connectivity as a means for reducing path distancestowards popular content [77], and estimating traffic load oninter-AS links through the popularity of traversed paths [78].Chatzis et al. [77] demonstrate the centrality of a large Euro-pean IXP in the Internet’s traffic by relying on sampled sFlowtraces captured by the IXP operator. Peering relationshipsare identified by observing BGP as well as regular traffic

17
being exchanged between tenant members. The authors limittheir focus to web traffic as it constitutes the bulk of trafficwhich is observed over the IXP’s fabric. Endhost IP addressesare mapped to the country which they reside in by usingMaxmind’s IP to GEO dataset. The authors observe trafficfrom nearly every country (242 out of 250). While tenant ASesgenerated the bulk of traffic, about 33% of traffic originatedfrom ASes which were one or more hops away from theIXP. The authors find that recurrent IP addresses generateabout 60% of server traffic. Finally, the authors highlight theheterogeneity of AS traffic by identifying servers from otherASes which are hosted within another AS. Heterogeneousservers are identified by applying a clustering algorithm on topof the SOA records of all observed IP addresses. Lastly, theshare of heterogeneous traffic on inter-AS links is presentedfor Akamai and Cloudflare. It is found that about 11% (54%)of traffic (servers) are originated (located) within 3rd-partynetworks.Sanchez et al. [78] attempt to characterize and measure inter-domain traffic by utilizing traceroutes as a proxy measure.Traceroute probes towards random IP addresses from the OnoBitTorrent extension are gathered over two separate months.Ground truth data regarding traffic volume is obtained fromtwo sources: (i) sampled sFlows from a large European IXPand (ii) link utilization for the customers of a large ISPpresenting the 95th percentile of utilization using SNMP.AS-link traversing paths (ALTP) are constructed by mappingeach hop of traceroutes to their corresponding ASN. For eachALTP-set a relative measure of link frequency is definedwhich represents the cardinality of the link to the sum ofcardinalities of all links in that set. This measure is usedas a proxy for traffic volume. The authors measure differentnetwork syntax metrics namely: connectivity, control value,global choice, and integration for the ALTP-sets which havecommon links with their ground truth traffic data. r2 ismeasured for regression analysis of the correlation betweennetwork syntax metrics and traffic volume. ALTP-frequencyshows the strongest correlation with r2 values between 0.71- 0.97 while the remainder of metrics also show strong andvery-strong correlations. The authors utilize the regressionmodel to predict traffic volume using ALTP-frequency as aproxy measure. Furthermore Sanchez et al. demonstrate thatthe same inferences cannot be made from a simple AS-level connectivity graph which is derived from BGP streams.Finally, the authors apply the same methodology to CAIDA’sArk dataset and find similar results regarding the correlationof network syntax metrics and traffic volume.Gupta et al. [74] study circuitous routes in Africa and theirdegrading effect on latency. Circuitous routes are betweentwo endpoints within Africa that traverse a path outside ofAfrica, i.e. the traversed route should have ideally remainedwithin Africa but due to sub-par connectivity has detouredto a country outside of Africa. Two major datasets are usedfor the study, (i) BGP routing tables from Routeviews, PCH,and Hurricane Electric, and (ii) periodic (every 30 minutes)traceroute measurements from BISmark home routers towardsMLab servers, IXP participants, and Google cache serversdeployed across Africa. Traceroute hops are annotated with
their AS owner and inter-AS links are identified with theobservation of ASN changes along the path. Circuitous routesare identified by relying on high latency values for the givenpath. Latency penalty is measured as the ratio of path latencyto the best case latency between the source node and a node inthe same destination city. The authors find two main reasonsfor paths with high latency penalty values namely, (i) ASesalong the path are not physically present at a local IXP, or (ii)the ASes are present at a geographically closeby IXP but donot peer with each other due to business preferences.Fanou et al. [75] study Internet topology and its characteristicswithin Africa. By expanding RIPE’s Atlas infrastructure withinAfrican countries, the authors leverage this platform to conducttraceroute campaigns with the intention of uncovering as manyas possible AS paths. To this end, periodic traceroutes wereran between all Atlas nodes within Africa. These probes wouldtarget both IPv4 and IPv6 addresses if available. Traceroutehops were mapped to their corresponding country by lever-aging six public datasets, namely OpenIPMap, MaxMind,Team Cymru, AFRINIC DB, Whois, and reverse DNS lookup.Upon disagreement between datasets, RIPE probes withinthe returned countries were employed to measure latencytowards the IP addresses in question, the country with thelowest latency was selected as the host country. Interfaceaddresses are mapped to their corresponding ASN by utilizingTeam Cymru’s IP to AS service [79], using the augmentedtraceroute path the AS path between the source and destinationis inferred. Using temporal data the preference of AS pairs toutilize the same path is studied, 73% (82%) of IPv4 (IPv6)paths utilize a path with a frequency higher than 90%. Pathlength for AS pairs within west and south Africa are studied,with southern countries having a slightly shorter average pathof 4 compare to 5. AS path for pairs of addresses whichreside within the same country in each region is also measuredwhere it’s found that southern countries have a much shorterpath compared to pairs of addresses which are in the samewestern Africa countries (average of 3 compared to 5). AS-centrality (percentage of paths which AS appears in and is notthe source or destination) is measured to study transit roles ofASes. Impact of intercontinental transit on end-to-end delay ismeasured by identifying the IP path which has the minimumRTT. It is found that intercontinental paths typically exhibithigher RTT values while a small fraction of these routes stillhave relatively low RTT values (< 100ms) and are attributedto inaccuracies in IP to geolocation mapping datasets.Green et al. [76] leverage inter-AS path stability as a measurefor conducting Internet tomography and anomaly detection.Path stability is analyzed by the stability of a primary path.The primary path of router r towards prefix p is defined asthe most prevalent preferred path by r during the windowtime-frame of W. Relying on 3 months of BGP feeds fromRIPE RIS’ LINX collector it is demonstrated that 85% (90%)of IPv4 (IPv6) primary paths are in use for at least half ofthe time. Any deviation from the primary path are defined aspseudo-events which are further categorized into two groups:(i) transient events where a router explores additional pathsbefore reconverging to the primary path, and (ii) structuralevents where a router consistently switches to a new primary
18
path. For each pseudo-event, the duration and set of newpaths that were explored are recorded. About 13% of transientpseudo-events are found to be longer than an hour while12% of structural pseudo-events last less than 7 days. Thenumber of explored paths and the recurrence of each path ismeasured for pseudo-events. It is found that MRAI timers androute flap damping are efficient at regulating BGP dynamics.However, these transient events could be recurrent and requiremore complex mechanisms in order to be accounted for. Foranomaly detection about 2.3k AS-level outages and hijackevents reported by BGPmon during the same period of thestudy are used as ground truth. About 84% of outages aredetected as pseudo-events in the same time window whileabout 14% of events the detection time was about one hour ear-lier than what BGPmon reported. For hijacks, the announcedprefix is looked-up amongst pseudo-events if no match isfound less specific prefixes are used as a point of comparisonwith BGPmon. For about 82% of hijacking events, a matchingpseudo-event was found, and the remainder of events aretagged as explicit disagreements.
2) Router-Level Topology: With the rise of peering dis-putes highlighted by claims of throttling for Netflix’s trafficaccess to unbiased measurements reflecting the underlyingcause of subpar performance seems necessary more thanbefore. Doing so would require a topology map which cap-tures inter-AS links. The granularity of these links shouldbe at the router level since two ASes could establish manyinterconnections with each other, each of which could exhibitdifferent characteristics in terms of congestion. As outlinedin Section IV various methodologies have been presented thatenable researchers to infer the placement of inter-AS linksfrom data plane measurements in the form of traceroutes.A correct assessment of the placement of inter-AS links isnecessary to avoid attributing intra-AS congestion to inter-AS congestion, furthermore incorrectly identifying the ASeswhich are part of the inter-AS link could lead to attributingcongestion to incorrect entities.Dhamdhere et al. [80] rely on prior techniques [61] to inferboth ends of an interconnect link and by conducting timeseries latency probes (TSLP) try to detect windows of timewhere the latency time series deviates from its usual pro-file. Observing asymmetric congestion for both ends of alink is attributed to inter-AS congestion. The authors deploy86 vantage points within 47 ASes on a global scale. Byconducting similar TSLP measurements towards the set ofidentified inter-AS links over the span of 21 months startingat March 2016, the authors study congestion patterns betweenvarious networks and their upstream transit providers as wellthe interconnections they establish with content providers.Additionally, the authors conduct throughput measurementsusing the Network Diagnostic Tool (NDT) [81] as well asSamKnows [82] throughput measurements of Youtube serversand investigate the correlation of inter-AS congestion andthroughput.Chandrasekaran et al. [83] utilize a large content deliverynetworks infrastructure to assess the performance of the In-ternet’s core. The authors rely on about 600 servers span-ning 70 countries and conduct pairwise path measurements
in both forward and reverse directions between the servers.Furthermore, AS paths are measured by translating router hopinterfaces to their corresponding AS owner, additionally inter-AS segments are inferred by relying on a series of heuristicsdeveloped by the authors based on domain knowledge andcommon networking practices. Latency characteristics of theobserved paths are measured by conducting periodic pingprobes between the server pairs. Consistency and prevalenceof AS paths for each server pair are measured for a 16 monthperiod. It is found that about 80% of paths are dominant forat least half of the measurement period. Furthermore, about80% of paths experience 20 or fewer route changes duringthe 16 month measurement period. The authors measure RTTinflation in comparison to optimal AS paths and find that sub-optimal paths are often short-lived although a small number(10%) of paths experience RTT inflation for about 30% of themeasurement period. Effects of congestion on RTT inflationare measured by initially selecting the set of server pairswhich experience RTT inflation using ping probe measure-ments while the first segment that experiences congestion ispinpointed by relying on traceroute measurements which aretemporally aligned with the ping measurements. The authorsreport that most inter and intra-AS links experience about 20to 30 ms of added RTT due to congestion.Chiu et al. [84] assess path lengths and other properties forpaths between popular content providers and their clients.A collection of 4 datasets were used throughout the studynamely: (i) iPlane traceroutes from PlanetLab nodes towards154k BGP prefixes, (ii) aggregated query counts per /24 prefix(3.8M) towards a large CDN, (iii) traceroute measurementstowards 3.8M + 154k prefixes from Google’s Compute Engine(GCE), Amazon Elastic Cloud, and IBM’s Softlayer VMs, and(iv) traceroutes from RIPE Atlas probes towards cloud VMsand a number of popular websites. Using traceroute measure-ments from various platforms and converting the obtained IPhop path to its corresponding AS-level path the authors assessthe network distance between popular content providers andclient prefixes. iPlane traceroutes are used as a baseline forcomparison, only 2% of these paths are one hop away fromtheir destination this value increases to 40% (60%) for pathsbetween GCE and iPlane (end user prefixes). This indicatesthat Google peers directly with the majority of networks whichhost its clients. Using the CDN logs as a proxy measurefor traffic volume the authors find that Google peers withthe majority of ASes which carry large volumes of traffic.Furthermore Chiu et al. find that the path from clients towardsgoogle.com due to off-net hosted cache servers is much shorterwhere 73% of queries come from ASes that either peer withGoogle or have an off-net server in their network or theirupstream provider. A similar analysis for Amazon’s EC2 andIBM’s Softlayer was performed each having 30% and 40%one hop paths accordingly.Kotronis et al. [85] study the possibility of improving latencyperformance through the employment of relay nodes withincolocation facilities. This work tries to (i) identify the bestlocations/colos to place relay nodes and (ii) quantify thelatency improvements that are attainable for end pairs. Theauthors select a set of ASes per each country which covers at

19
least 10% of the countries population by using APNIC’s IPv6measurement campaign dataset [86]. RIPE Atlas nodes withinthese AS country pairs are selected which are running the latestfirmware, are connected and pingable, and have had stableconnectivity during the last 30 days. Colo relays are selectedby relying on the set of pinned router interfaces from Giotsas etal. [64] work. Due to the age of the dataset, a series of validitytests including conformity with PeeringDB data, pingability,consistent ASN owner, and RTT-based geolocation test withPeriscope LGs have been conducted over the dataset to filterout stale information. A set of PlanetLab relays and RIPEAtlas relays are also considered as reference points in additionto the set of colo relays. The measurement framework consistsof 30 minute rounds between April 20th - May 17th 2017.Within each round, ping probes are sent between the selectedend pairs to measure direct latency. Furthermore, the relaypaths latency is estimated by measuring the latency betweenthe <src, relay> and <dst, relay> pairs. The authors observedimprove latency for 83% of cases with a median of 12-14msbetween different relay types. Colo relays having the largestimprovement. The number of required relays for improvedlatency is measured, the authors find that colo relays havethe highest efficiency where 10 relays account for 58% ofimproved cases while the same number of improved casesfor RIPE relays would require more than 100 relays. Lastly,the authors list the top 10 colo facilities which host the 20most effective colo relays, 4 of these color are in the top 10PeeringDB colos in terms of the number of colocated ASesand all host at least 2 or more IXPs within them.Fontugne et al. [87] introduce a statistical model for measuringand pin-pointing delay and forwarding anomalies from tracer-oute measurements. Given the prevalence of route asymmetryon the Internet, measuring the delay of two adjacent hops is nottrivial. This issue is tackled by the key insight that differentialdelay between two adjacent hops is composed of two inde-pendent components. Changes in link latency can be detectedby having a diverse set of traceroute paths that traverse theunder study link and observing latency values disrupting thenormal distribution for latency median. Forwarding patternsfor each hop are established by measuring a vector account-ing for the number of times a next hop address has beenobserved. Pearson product-moment correlation coefficient isused as a measure to detect deviations or anomalies withinthe forwarding pattern of a hop. RIPE Atlas’ built-in andanchoring traceroute probes for an eight-month period in 2015are used for the study. The authors highlight the applicabilityof their proposed methodology by providing insight into threehistorical events namely, DDoS attacks on DNS root servers,Telekom Malaysia’s BGP route leak, and Amsterdam IXPoutage.
3) Physical-Level Topology: Measuring characteristics ofphysical infrastructure using data plan measurements is verychallenging due to the disassociation of routing from thephysical layer. Despite these challenges, we overview twostudies within this section that investigate the effects of sub-optimal fiber infrastructure on latency between two end-points[88] and attempt to measure and pinpoint the causes ofobserving subpar latency within fiber optic cables [89].
Singala et al. [88] outline the underlying causes of sub-par latency within the Internet. The authors rely on about400 Planet Lab nodes to periodically fetch the front pageof popular websites, geolocate the webserver’s location andmeasure the optimal latency based on speed of light (c-latency)constraints. Interestingly the authors find that the median oflatency inflation is about 34 times greater than c-latency.Furthermore, the authors breakdown the webpage fetch timeinto its constituent components namely, DNS resolution, TCPhandshake, and TCP transfer. Router path latency is calculatedby conducting traceroutes towards the servers and lastly,minimum latency towards the web server is measured byconducting periodic ping probe. It is found that the medianof router paths experience about 2.3x latency inflation. Theauthors hypothesize that latencies within the physical layer aredue to sub-optimal fiber paths between routers. The validityof this hypothesis is demonstrated by measuring the pairwisedistance between all nodes of Internet2 and GEANT networktopologies and also computing road distance using GoogleMaps API. It is found that fiber links are typically 1.5-2xlonger than road distances. While this inflation is smallerin comparison to webpage fetching component’s latency theeffects of fiber link inflation are evident within higher layersdue to the stacked nature of networking layers.Bozkurt et al. [89] present a detailed analysis of the causesfor sub-par latency within fiber networks. The authors relyon Durairajan et al. [72] InterTubes dataset to estimate fiberlengths based on their conduits in the dataset. Using theinfrastructure of a CDN, server clusters which are within a25km radius of conduit endpoints were selected, and latencyprobes between pairs of servers at both ends of the conduitwere conducted every 3 hours for the length of 2 days. Theconduit length is estimated using the speed of light withinfiber optic cables (f-latency), and the authors find that only11% of the links have RTTs within 25% of the f-latency fortheir corresponding conduit. Bozkurt et al. enumerate variousfactors which can contribute to the inflated latency that theyobserved within their measurements namely, (i) refractionindex for different fiber optic cables varies, (ii) slack loopswithin conduits to account for fiber cuts, (iii) latency withinoptoelectrical and optical amplifier equipment, (iv) extra fiberspools to compensate for chromatic dispersion, (v) publicationof mock routes by network operators to hide competitivedetails, and (vi) added fiber to increase latency for pricedifferentiation. Using published latency measurements fromAT&T and CenturyLink RTT inflation in comparison to f-latency from InterTubes dataset is measured to have a medianof 1.5x (2x) for AT&T and CenturyLink’s networks. Theaccuracy of InterTubes dataset is verified for Zayo’s network.Zayo published detailed fiber routes on their website. Theauthors find great conformity for the majority of fiber conduitlengths while for 12% of links the length difference is morethan 100km.
B. Resiliency
Studying the resiliency of Internet infrastructure has beenthe subject of many types of research over the past decade.

20
While many of these studies have reported postmortems re-garding natural disasters and their effects on Internet connec-tivity, others have focused on simulating what-if scenarios toexamine the resiliency of the Internet towards various typesof disruptions. Within these studies, researchers have utilizedInternet topologies which were contemporary to their time.The resolution of these topologies would vary in accordancewith the stated problem. For example, the resiliency of longhaul fiber infrastructure to rising sea levels due to globalwarming is measured by relying on physical topology maps[90] while the effects of router outages on BGP paths and ASreachability is studied using a combination of router and ASlevel topologies within Luckie et al. work [91]. The remainderof this section is organized according to the resolution of theunderlying topology which is used by these studies.
1) AS-Level Topology: Katz-Bassett et al. [92] proposeLIFEGUARD as a system for recovering from outages byrerouting traffic. Outages are categorized into two groupsof forward and reverse path outages. Outages are detectedand pinpointed by conducting periodic ping and traceroutemeasurements towards the routers along the path. A historicallist of responsive routers for each destination is maintained.Prolonged unresponsive ping probes are attributed to outages.For forward path outages, the authors suggest the use ofalternative upstream providers which traverse AS-paths thatdo not overlap with the unresponsive router. For reverse pathoutages, the authors propose a BGP poisoning solution wherethe origin AS would announce a path towards its own prefixwhich includes the faulty AS within the advertised path. This,in turn, causes the faulty AS to withdraw the advertisement(to avoid a loop) of the prefix and therefore cause alternativeroutes to be explored in the reverse path. A less-specificsentinel prefix is advertised by LIFEGUARD to detect therecovery of the previous path.Luckie et al. [91] correlate BGP outage events to inferredrouter outages by relying on time-series of IPID values ob-tained through active measurements. This work is motivated bythe fact that certain routers rely on central incremental countersfor the generated IPID values, given this assumption onewould expect to observe increasing IPID values for a singlerouter. Any disruption in this pattern can be linked to a routerreboot. IPID values for IPv4 packets are susceptible to counterrollover since they are only 16 bits wide. The authors rely onIPID values obtained by inducing fragmentation within IPv6packets. The authors rely on a hit list of IPv6 router addresseswhich is obtained from intermediate hops of CAIDA’s Arktraceroute measurements. By analyzing the time series of IPIDvalues, an outage window is defined for each router. Routeroutages are correlated with their corresponding BGP controlplane events by looking at BGP feeds and finding withdrawaland announcement messages occurring during the same timeframe. It is found that for about 50% of router/prefix pairsat least 1-2 peers withdrew the prefix and nearly all peerswithdrew their prefix announcement for about 10% of therouter/prefix pairs. Luckie et al. find that about half of theASes which had outages were completely unrouted during theoutage period and had single points of failure.Unlike Luckie et al. approach which relied on empirical data
to assess the resiliency of Internet, Lad et al. [93] investigateboth the impact and resiliency of various ASes to prefixhijacking attacks by simulating different attacks using AS-level topologies obtained through BGP streams. Impact ofprefix hijacking is measured as the fraction of ASes whichbelieve the false advertisement by a malicious AS. Similarly,the resiliency of an AS against prefix hijacks is measuredas the number of ASes which believe the true prefix originannouncement. Surprisingly it is found that 50% of stub andtransit ASes are more resilient than Tier-1 ASes this is mainlyattributed to valley-free route preferences.Fontugne et al. [94] look into structural properties, morespecifically AS centrality, of AS-level IPv4 and IPv6 topologygraphs. AS-level topologies are constructed using BGP feedsof Routeviews, RIPE RIS, and BGPmon monitors. The authorsillustrate the sampling bias of betweenness centrality (BC)measure by sub-sampling the set of available monitors andmeasuring the variation of BC for each sample. AS hegemonyis used as an alternative metric for measuring the centralityof ASes which accounts for monitor biases by eliminatingmonitors too close or far from the AS in question andaveraging the BC score across all valid monitors. Additionally,BC is normalized to account for the size of advertised prefixes.The AS hegemony score is measured for the AS-level graphsstarting from 2004 till 2017. The authors find a great decreasein the hegemony score throughout the years supporting Internetflattening reports. Despite these observations, the hegemonyscore for ASes with the largest scores have remained consistentthroughout the years pointing to the importance of largetransit ASes in the operation of the Internet. AS hegemonyfor Akamai and Google is measured, the authors report littleto no dependence for these content providers to any specificupstream provider.
2) Router-Level Topology: Palmer et al. [95] rely on topol-ogy graphs gathered by SCAN and Lucent projects consistingof 285k (430k) nodes (links) to simulate the effects of linkand node failures within the Internet connectivity graph. Thenumber of reachable pairs is used as a proxy measure toassess the impact of link or node failures. It is found thatthe number of reachable nodes does not vary significantly upto the removal of 50k links failures while this value drops toabout 10k for node removals.Kang et al. [96], [97] propose the Crossfire denial of serviceattack that targets links which are critical for Internet con-nectivity of ASes, cities, regions, or countries. The authorsrely on a series of traceroute measurements towards addresseswithin the target entity and construct topological maps fromvarious VPs towards these targets. The attacker would chooselinks that are “close” to the target (3-4 router hops) andappear with a high frequency within all paths. The attackercould cut these entities from the Internet by utilizing a bot-net to launch coordinated low rate requests towards variousdestinations in the target entity. Furthermore, the attacker canavoid detection by the target by targeting addresses which arein close proximity of the target entity, e.g. sending probestowards addresses within the same city where an AS resideswithin. The pervasiveness and applicability of the Crossfireattack is investigated by relying on 250 PlanetLab [10] nodes
21
to conduct traceroutes towards 1k web servers located within15 target countries and cities. Links are ranked according totheir occurrence within traceroutes and for all target citiesand countries, the authors observe a very skewed power-lawdistribution. This observation is attributed to cost minimizationwithin Internet routing (shortest path for intra-domain andhot-potato for inter-domain routing). Bottleneck links aremeasured to be on average about 7.9 (1.84) router (AS) hopsaway from the target.Giotsas et al. [98] develop Kepler a system that is able to detectpeering outages. Kepler relies on BGP communities values thathave geocoded embeddings. Although BGP community valuesare not standardized, they have been utilized by ASes for trafficengineering, traffic blackholing, and network troubleshooting.Certain ASes use the lower 16bits of the BGP communitiesattribute as a unique identifier for each of their border routers.These encodings are typically documented on RIR webpages.The authors compile a dictionary of BGP community valuesand their corresponding physical location (colo or IXP) byparsing RIR entries. Furthermore, a baseline of stable BGPpaths is established by monitoring BGP feeds and removingtransient announcements. Lastly, the tenants of colo facilitiesand available IXPs and their members is compiled fromPeeringDB, DataCenterMap, and individual ASes websites.Deviations in stable BGP paths such as explicit withdrawalor change in BGP community values are considered as outagesignals.
3) Physical-Level Topology: Schulman et al. [99] inves-tigate outages within the last mile of Internet connectivitywhich are caused by severe weather conditions. The authorsdesign a tool called ThunderPing which relies on weatheralerts from the US National Weather Service to conductconnectivity probes prior, during, and after a severe weathercondition towards the residential users of the affected regions.A list of residential IP addresses is compiled by parsing thereverse DNS entry for 3 IP addresses within each /24 prefix.If any of the addresses have a known residential ISP suchas Comcast or Verizon within their name the remainder ofaddresses within that block are analyzed as well. IP addressesare mapped to their corresponding geolocation by relying onMaxmind’s IP to GEO dataset. Upon the emergence of aweather alert ThunderPing would ping residential IP addresseswithin the affected region for 6 hours before, during, andafter the forecasted event using 10 geographically distributedPlanetLab nodes. A sliding window containing 3 pings isused to determine the state of a host. A host respondingwith more than half of the pings is considered to be UP,not responding to any pings is considered to be DOWN, andhost responding to less than half of the pings is in a HOSEDstate. The authors find that failure rates are more than doubleduring thunderstorms compared to other weather conditions.Furthermore, the median for the duration of DOWN timesis almost an order of magnitude larger (104 seconds) duringthunderstorms compared to clear weather conditions.Erikson et al. [100] present a framework (RiskRoute) formeasuring the risks associated with various Internet routes.RiskRoute has two main objectives namely, (i) computingbackup routes and (ii) to measure new paths for network
provisioning. The authors introduce the bit-risk miles measurewhich quantifies the geographic distance that is traveled bytraffic in addition to the outage risk along the path both inhistorical and immediate terms. Furthermore bit-risk miles isscaled to account for the impact of an outage by consid-ering the population that is in the proximity of an outage.The likelihood of historical outage for a specific location isestimated using a Gaussian kernel which relies on observeddisaster events at all locations. For two PoPs, RiskRouteaims to calculate the path which minimizes the bit-risk milemeasure. For intra-domain routes, this is simply calculated asthe path which minimizes the bit-risk mile measure amongall possible paths which connect the two PoPs. For inter-domain routing the authors estimate BGP decisions usinggeographic proximity and rely on shortest path routes. Usingthe RiskRoute framework, improvements in the robustness ofnetworks is analyzed by finding an edge which would resultin the largest increase in bit-risk measure among all possiblepaths. It is found that Sprint and Teliasonera networks observethe greatest improvement in robustness while Level3’s robust-ness remains fairly consistent mostly due to rich connectivitywithin its network.Durairajan et al. [90] assess the impact of rising sea levelson the Internet infrastructure within the US. The authors alignthe data from the sea level rise inundation dataset from theNational Oceanic and Atmospheric Administration (NOAA)with long-haul fiber maps from the Internet Atlas project [71]using the overlap feature of ArcGIS. The amount of affectedfibers as well as the number of PoPs, colos, and IXPs that willbe at risk due to the rising sea levels is measured. The authorsfind that New York, Seattle, and Miami are among the citieswith the highest amount of vulnerable infrastructure.
C. AS Relationship Inference
ASes form inter-AS connections motivated by differentbusiness relationships. These relationships can be in the formof a transit AS providing connectivity to a smaller networkas a customer (c2p) by charging them based on the providedbandwidth or as a settlement-free connection between bothpeers (p2p) where both peers exchange equal amounts oftraffic through their inter-AS link. These inter-AS connectionsare identical from topologies obtained from control or dataplan measurements. The studies within this section overviewa series of methodologies developed based on these businessrelationships in conjunction with the valley free routing princi-ple to distinguish these peering relationships from each other.
1) AS-Level: Luckie et al. [101] develop an algorithm forinferring the business relationships between ASes by solelyrelying on BGP data. Relationships are categorized as acustomer to provider (c2p) relationship were a customer ASpays a provider AS for its connectivity to the Internet ora peer to peer (p2p) relationship were two ASes provideconnectivity to each other and often transmit equal amountsof traffic through their inter-AS link(s). Inference of theserelationships are based on BGP data using three assumptions:(i) there is a clique of large transit providers at the top of theInternet hierarchy, (ii) customers enter a transit agreement to

22
be globally reachable, and (iii) we shouldn’t have a cycle incustomer to provider (c2p) relationships. The authors validatea subset (43k) of their inferences, which is the largest by thetime of publication, and finally they provide a new solutionfor inferring customer cones of ASes. For their analyses, theauthors rely on various data sources namely BGP paths fromRouteviews and RIPE’s RIS, any path containing origin ASeswhich do not contain valid ASNs (based on RIRs) is excludedfrom the dataset. For validation Luckie et al. use three datasources: validation data reported by network operators to theirwebsite, routing policies reported to RIRs in export and importfields, and finally they use the communities attribute of BGPannouncements based on the work of Giotsas et al. [102].The authors define two metrics node degree and transit degreewhich can be measured from the AS relationship graph.Giotsas et al. [36] modify CAIDA’s IPv4 relationship inferencealgorithm [101] and adapt it to IPv6 networks with the inten-tion of addressing the lack of a fully-connected transit-freeclique within IPv6 networks. BGP dumps from Routeviewsand RIPE RIS which announce reachability towards IPv6 pre-fixes are used throughout this study. For validation of inferredrelationships three sources are used: BGP communities, RPSLwhich is a route policy specification language that is availablein WHOIS datasets and is mandated for IXPs within EU byRIPE, and local preference (LocPref) which is used to indicateroute preference by an AS where ASes assign higher valuesto customers and lower values to providers to minimize transitcost. Data is sanitized by removing paths with artifacts suchas loops or invalid ASNs. The remainder of the algorithm isidentical to [101] with modifications to two steps: i) inferringthe IPv6 clique and ii) removing c2p inferences made betweenstub and clique ASes. In addition to considering the transitdegree and reachability, peering policy of ASes is also takeninto account for identifying cliques. Peering policy is extractedfrom PeeringDB, a restrictive policy is assumed for ASes whodo not report this value. ASes with selective or restrictivepolicies are selected as seeds to the clique algorithm. For anAS to be part of the clique, it should provide BGP feeds toRouteviews or RIPE RIS and announce routes to at least 90%of IPv6 prefixes available in BGP. The accuracy of inferencesis validated using the three validation sources which wheredescribed, a consistent accuracy of at least 96% was observedfor p2c and p2p relationships for the duration of the study.The fraction of congruent relationships where the relationshiptype is identical for IPv4 and IPv6 networks is measured. Theauthors find that this fraction increases from 85% in 2006 to95% in 2014.
2) PoP-Level: Giotsas et al. [35] provide a methodologyfor extending traditional AS relationship models to includetwo complex relationships namely: hybrid and partial transitrelationships. Hybrid relations indicate different peeringrelations at different locations. Partial transit relationsrestrict the scope of a customers relation by not exportingall provider paths to the customer. AS path, prefixes, andcommunities strings are gathered from Routeviews and RIPERIS datasets. CAIDA’s Ark traceroutes in addition to aseries of targeted traceroutes launched from various lookingglasses are employed to confirm the existence of various
AS relationships. Finally, geoinformation for AS-links aregathered from BGP community information, PeeringDB’sreverse DNS scan of IXP prefixes, DNS parsing of hostnamesby CAIDA’s DRoP service, and NetAcuity’s IP geolocationdataset is used as a fallback when other methods do notreturn a result. Each AS relationship is labeled into oneof the following export policies: i) full transit (FT) wherethe provider exports prefixes from its provider, ii) partialtransit (PT) where prefixes of peers and customers are onlyexported, and iii) peering (P) where prefixes of customersare only exported. Each identified relationship defaults topeering unless counter facts are found through traceroutemeasurements which indicate PT or FT relationships. Out of90k p2c relationships 4k of them are classified as complexwith 1k and 3k being hybrid and partial-transit accordingly.For validation (i) direct feedback from network operators,(ii) parsed BGP community values, and (iii) RPSL objectsare used. Overall 19% (7%) of hybrid (partial-transit)relationships were confirmed.
VI. OPEN PROBLEMS
We presented an overview of recent and seminal worksregarding the topology of the Internet. Capturing the topologyhas many inherent difficulties added to that it is under a con-stant evolution which makes the problem even more challeng-ing. Throughout the year’s researchers have proposed solutionsto capture a comprehensive and high-resolution representationof the Internet’s topology enabling us to have a fuller andbetter understanding of the Internet’s structure. The Internethas come a long way since its inception days where it wasmainly used for sharing scientific research, exchanging email,or hosting static web pages. The ever-increasing demand forlive content such as streaming videos and rendering videogames on clusters of servers instead of a local console hasdriven content providers to create structural shifts within In-ternet’s topology where they make best efforts to decrease theirdistance towards their customers. These efforts have lead to atopological change referred to as the flattening of the Internetwhere the edge of the Internet is experiencing rapid growth inconnectivity consequently leading to less traffic traversing theclassical hierarchical structure of the Internet. Furthermore, theadvent of cloud providers and the virtualization of hardwarehas enabled many small companies to host their servicesand deliver their content to their users without the overheadsof maintaining a global infrastructure. Fueled by increasingdemands for higher and more consistent performance, manycloud providers are offering direct peering opportunities in-tended solely for connecting customer networks to their cloudinfrastructure. Conventionally a network would rely on theInternet to route its traffic towards any cloud provider incontrast these cloud interconnections bypass any intermediatenetwork and enable the customer to exchange traffic directlywith the cloud provider. This in turn alleviates the uncertaintiesof routing and enables cloud providers to offer higher QoSguarantees. Given the competitive offerings within the cloudmarket enterprises can be tempted to rely on different services

23
offered by each cloud provider or in extreme cases completelymigrate their service from one provider to another. These de-mands have lead to colo facility operators and many other 3rdparty cloud connectivity partners to offer connectivity fabrics(SDN enabled switches) which are connected to multiple cloudproviders. A customer can obtain connectivity with one ormultiple of these partnered cloud providers through a singleswitch port. Furthermore, due to the programmability of theseswitches, the customers can modify link speed and whomthey are interconnected with through an exposed interface.Due to their inherent nature, these interconnections remaininvisible from any Internet topology measurement platforms.Additionally, the existence of layer-2 devices between twopeering routers invalidates presumptions of recent Internettopology capturing tools [62], [63]. Given the popularity ofcloud providers and their increasing demand within today’sInternet, presenting new methodologies which can accuratelycapture these interconnections and quantify their share inoffloading traffic from the conventional Internet infrastructurewould enable researchers to have a better understanding ofInternet’s topology.
VII. CONCLUSION
The Internet is a critical component of our everyday livesfrom performing trivial tasks such as sending instant messagesto friends, watching and streaming videos to banking andoperation of power grids and defense operations. The Internetis an interplay of many elements such as physical infras-tructure, topology, routing, and applications with each other.Dissecting each elements effect is essential for having a correctunderstanding of the effects for each of these components.Topology is central to the Internet and its effect is reflected inevery aspect of it. Measuring entirety of topology is a difficulttask given the scope and scale of the problem at hand coarserand smaller topologies have been employed. Throughout theyears many hurdles in topology discovery have been addressedand the community has shifted its attention to inferring inter-AS links between border routers as an abstraction of Internettopology that is feasible to obtain and features sufficientinformation to address common issues within this domain.Although great strides have been the discovered topologies arelimited to the visible portion of the Internet and the interplayof routing on top of physical topologies remains as open andinteresting problems that need to be addressed in the future.
REFERENCES
[1] University of Oregon, “University of oregon route views project,” http://www.routeviews.org/routeviews/, 2018.
[2] CAIDA, “Archipelago (Ark) measurement infrastructure,” http://www.caida.org/projects/ark/, 2018.
[3] V. Jacobson, “traceroute,” ftp://ftp.ee.lbl.gov/traceroute.tar.gz, 1989.[4] B. Augustin, T. Friedman, and R. Teixeira, “Multipath tracing with
paris traceroute,” in End-to-End Monitoring Techniques and Services.IEEE, 2007.
[5] RIPE NCC, “RIPE Atlas,” 2016.[6] Y. Shavitt and E. Shir, “Dimes: Let the internet measure itself,”
SIGCOMM CCR, 2005.[7] V. Giotsas, A. Dhamdhere, and K. C. Claffy, “Periscope: Unifying
looking glass querying,” in PAM. Springer, 2016.
[8] M. A. Sanchez, J. S. Otto, Z. S. Bischof, D. R. Choffnes, F. E.Bustamante, B. Krishnamurthy, and W. Willinger, “Dasu: Pushingexperiments to the internet’s edge.” in NSDI, 2013.
[9] S. Sundaresan, S. Burnett, N. Feamster, and W. De Donato, “Bismark:A testbed for deploying measurements and applications in broadbandaccess networks.” in USENIX Annual Technical Conference, 2014.
[10] B. Chun, D. Culler, T. Roscoe, A. Bavier, L. Peterson, M. Wawrzoniak,and M. Bowman, “Planetlab: an overlay testbed for broad-coverageservices,” SIGCOMM CCR, 2003.
[11] M. Berman, J. S. Chase, L. Landweber, A. Nakao, M. Ott, D. Ray-chaudhuri, R. Ricci, and I. Seskar, “Geni: A federated testbed forinnovative network experiments,” Computer Networks, 2014.
[12] Y. Hyun, “Archipelago measurement infrastructure,” in CAIDA-WIDEWorkshop, 2006.
[13] I. Cunha, P. Marchetta, M. Calder, Y.-C. Chiu, B. V. Machado,A. Pescape, V. Giotsas, H. V. Madhyastha, and E. Katz-Bassett, “Sibyl:a practical internet route oracle,” NSDI, 2016.
[14] M. Luckie, “Scamper: a scalable and extensible packet prober for activemeasurement of the internet,” in IMC. ACM, 2010.
[15] R. Beverly, “Yarrp’ing the internet: Randomized high-speed activetopology discovery,” in IMC. ACM, 2016.
[16] R. Beverly, R. Durairajan, D. Plonka, and J. P. Rohrer, “In the ip ofthe beholder: Strategies for active ipv6 topology discovery,” in IMC.ACM, 2018.
[17] Z. Durumeric, E. Wustrow, and J. A. Halderman, “Zmap: Fast internet-wide scanning and its security applications.” in USENIX SecuritySymposium, 2013.
[18] R. Graham, P. Mcmillan, and D. Tentler, “Mass scanning the internet:Tips, tricks, results,” in Def Con 22, 2014.
[19] N. Spring, R. Mahajan, and D. Wetherall, “Measuring isp topologieswith rocketfuel,” SIGCOMM CCR, 2002.
[20] R. Govindan and H. Tangmunarunkit, “Heuristics for internet mapdiscovery,” in INFOCOM. IEEE, 2000.
[21] A. Bender, R. Sherwood, and N. Spring, “Fixing ally’s growing painswith velocity modeling,” in IMC. ACM, 2008.
[22] M. E. Tozal and K. Sarac, “Palmtree: An ip alias resolution algorithmwith linear probing complexity,” Computer Communications, 2011.
[23] K. Keys, Y. Hyun, M. Luckie, and K. Claffy, “Internet-scale ipv4 aliasresolution with midar,” TON, 2013.
[24] N. Spring, M. Dontcheva, M. Rodrig, and D. Wetherall, “How toresolve ip aliases,” Citeseer, Tech. Rep., 2004.
[25] M. H. Gunes and K. Sarac, “Analytical ip alias resolution,” in Inter-national Conference on Communications. IEEE, 2006.
[26] R. Sherwood, A. Bender, and N. Spring, “Discarte: a disjunctiveinternet cartographer,” SIGCOMM CCR, 2008.
[27] M. H. Gunes and K. Sarac, “Resolving ip aliases in building traceroute-based internet maps,” TON, 2009.
[28] J. Chabarek and P. Barford, “What’s in a name?: decoding routerinterface names,” in HotPlanet. ACM, 2013.
[29] B. Huffaker, M. Fomenkov et al., “Drop: Dns-based router positioning,”SIGCOMM CCR, 2014.
[30] Q. Scheitle, O. Gasser, P. Sattler, and G. Carle, “Hloc: Hints-basedgeolocation leveraging multiple measurement frameworks,” in NetworkTraffic Measurement and Analysis Conference. IEEE, 2017.
[31] V. N. Padmanabhan and L. Subramanian, “An investigation of geo-graphic mapping techniques for internet hosts,” in SIGCOMM CCR.ACM, 2001.
[32] CAIDA, “Ddec - dns decoder,” http://ddec.caida.org/, 2018.[33] RIPE, “Routing information service (ris),” https://www.ripe.net/
analyse/internet-measurements/routing-information-service-ris, 2018.[34] Packet Clearing House, “Mrt routing updates,” https://www.pch.net/
resources/Raw Routing Data/, 2018.[35] V. Giotsas, M. Luckie, and B. Huffaker, “Inferring Complex AS
Relationships,” IMC, 2014.[36] V. Giotsas, M. Luckie, B. Huffaker, and K. Claffy, “Ipv6 as relation-
ships, cliques, and congruence,” in PAM. Springer, 2015.[37] “Peeringdb,” https://peeringdb.com/.[38] “Packet clearing house (pch) - data,” https://www.pch.net/resources/
data.php.[39] B. Augustin, B. Krishnamurthy, and W. Willinger, “Ixps: mapped?” in
SIGCOMM. ACM, 2009.[40] G. Comarela, E. Terzi, and M. Crovella, “Detecting unusually-routed
ases: Methods and applications,” in IMC. ACM, 2016.[41] I. Castro, J. C. Cardona, S. Gorinsky, and P. Francois, “Remote Peering:
More Peering without Internet Flattening,” CoNEXT, 2014.

24
[42] G. Nomikos, V. Kotronis, P. Sermpezis, P. Gigis, L. Manassakis,C. Dietzel, S. Konstantaras, X. Dimitropoulos, and V. Giotsas, “O peer,where art thou?: Uncovering remote peering interconnections at ixps,”in IMC. ACM, 2018.
[43] MaxMind, “GeoIP2 databases,” https://www.maxmind.com/en/geoip2-databases, 2018.
[44] IP2Location, “IP address geolocaiton,” https://www.ip2location.com/database/ip2location, 2018.
[45] NetAcuity, “Industry-standard geolocation,” https://www.digitalelement.com/solutions/, 2018.
[46] M. Gharaibeh, A. Shah, B. Huffaker, H. Zhang, R. Ensafi, and C. Pa-padopoulos, “A look at router geolocation in public and commercialdatabases,” in IMC. ACM, 2017.
[47] J. Engebretson, “Verizon-netflix dispute: Is netflix usingdirect connections or not?” https://www.telecompetitor.com/verizon-netflix-dispute-netflix-using-direct-connections/, 2014.
[48] L. Li, D. Alderson, W. Willinger, and J. Doyle, “A first-principlesapproach to understanding the internet’s router-level topology,” inSIGCOMM CCR. ACM, 2004.
[49] E. Gregori, A. Improta, L. Lenzini, and C. Orsini, “The impact ofixps on the as-level topology structure of the internet,” ComputerCommunications, 2011.
[50] Y. He, G. Siganos, M. Faloutsos, and S. Krishnamurthy, “Lord ofthe links: a framework for discovering missing links in the internettopology,” TON, 2009.
[51] J. Xia and L. Gao, “On the evaluation of as relationship inferences [in-ternet reachability/traffic flow applications],” in GLOBECOM. IEEE,2004.
[52] G. Siganos and M. Faloutsos, “Analyzing BGP policies: Methodologyand tool,” in INFOCOM. IEEE, 2004.
[53] B. Ager, N. Chatzis, A. Feldmann, N. Sarrar, S. Uhlig, and W. Will-inger, “Anatomy of a large european ixp,” SIGCOMM CCR, 2012.
[54] A. Khan, H.-c. Kim, and Y. Choi, “AS-level Topology Collectionthrough Looking Glass Servers,” IMC, 2013.
[55] R. Kloti, B. Ager, V. Kotronis, G. Nomikos, and X. Dimitropoulos, “Acomparative look into public ixp datasets,” SIGCOMM CCR, 2016.
[56] “European internet exchange association,” https://www.euro-ix.net/.[57] V. Giotsas, S. Zhou, and M. Luckie, “Inferring Multilateral Peering,”
CoNEXT, 2013.[58] V. Giotsas and S. Zhou, “Improving the discovery of ixp peering links
through passive bgp measurements,” in INFOCOM. IEEE, 2013.[59] P. Richter, G. Smaragdakis, A. Feldmann, N. Chatzis, J. Boettger, and
W. Willinger, “Peering at peerings: On the role of ixp route servers,”in IMC. ACM, 2014.
[60] G. Nomikos and X. Dimitropoulos, “traixroute: Detecting ixps intraceroute paths,” in PAM. Springer, 2016.
[61] M. Luckie, A. Dhamdhere, B. Huffaker, D. Clark et al., “Bdrmap:Inference of borders between ip networks,” in IMC. ACM, 2016.
[62] A. Marder and J. M. Smith, “Map-it: Multipass accurate passiveinferences from traceroute,” in IMC. ACM, 2016.
[63] A. Marder, M. Luckie, A. Dhamdhere, B. Huffaker, J. M. Smith et al.,“Pushing the boundaries with bdrmapit: Mapping router ownership atinternet scale,” in IMC. ACM, 2018.
[64] V. Giotsas, G. Smaragdakis, B. Huffaker, and M. Luckie, “MappingPeering Interconnections to a Facility,” CoNEXT, 2015.
[65] R. Motamedi, B. Yeganeh, B. Chandrasekaran, R. Rejaie, B. Maggs,and W. Willinger, “On Mapping the Interconnections in Today’sInternet,” under review for TON, 2019.
[66] K.-K. Yap, M. Motiwala, J. Rahe, S. Padgett, M. Holliman, G. Baldus,M. Hines, T. Kim, A. Narayanan, A. Jain et al., “Taking the edge offwith espresso: Scale, reliability and programmability for global internetpeering,” in SIGCOMM. ACM, 2017.
[67] B. Schlinker, H. Kim, T. Cui, E. Katz-Bassett, H. V. Madhyastha,I. Cunha, J. Quinn, S. Hasan, P. Lapukhov, and H. Zeng, “Engineeringegress with edge fabric: Steering oceans of content to the world,” inSIGCOMM. ACM, 2017.
[68] F. Wohlfart, N. Chatzis, C. Dabanoglu, G. Carle, and W. Willinger,“Leveraging interconnections for performance: the serving infrastruc-ture of a large cdn,” in SIGCOM. ACM, 2018.
[69] A. Y. Nur and M. E. Tozal, “Cross-as (x-as) internet topology map-ping,” Computer Networks, 2018.
[70] S. Knight, H. X. Nguyen, N. Falkner, R. Bowden, and M. Roughan,“The internet topology zoo,” IEEE Journal on Selected Areas inCommunications, 2011.
[71] R. Durairajan, S. Ghosh, X. Tang, P. Barford, and B. Eriksson, “Internetatlas: a geographic database of the internet,” in HotPlanet. ACM,2013.
[72] R. Durairajan, J. Sommers, and P. Barford, “Layer 1-informed internettopology measurement,” in IMC. ACM, 2014.
[73] R. Durairajan, P. Barford, J. Sommers, and W. Willinger, “InterTubes:A Study of the US Long-haul Fiber-optic Infrastructure,” SIGCOMM,2015.
[74] A. Gupta, M. Calder, N. Feamster, M. Chetty, E. Calandro, andE. Katz-Bassett, “Peering at the Internet’s Frontier: A First Look atISP Interconnectivity in Africa,” PAM, 2014.
[75] R. Fanou, P. Francois, and E. Aben, “On the diversity of interdomainrouting in africa,” in PAM. Springer, 2015.
[76] T. Green, A. Lambert, C. Pelsser, and D. Rossi, “Leveraging inter-domain stability for bgp dynamics analysis,” in PAM. Springer, 2018.
[77] N. Chatzis, G. Smaragdakis, J. Bottger, T. Krenc, and A. Feldmann,“On the benefits of using a large ixp as an internet vantage point,” inIMC. ACM, 2013.
[78] M. A. Sanchez, F. E. Bustamante, B. Krishnamurthy, W. Willinger,G. Smaragdakis, and J. Erman, “Inter-domain traffic estimation for theoutsider,” in IMC. ACM, 2014.
[79] TeamCymru, “IP to ASN mapping,” https://www.team-cymru.com/IP-ASN-mapping.html, 2008.
[80] A. Dhamdhere, D. D. Clark, A. Gamero-Garrido, M. Luckie, R. K.Mok, G. Akiwate, K. Gogia, V. Bajpai, A. C. Snoeren, and K. Claffy,“Inferring persistent interdomain congestion,” in SIGCOMM. ACM,2018.
[81] M-Lab, “NDT (Network Diagnostic Tool),” https://www.measurementlab.net/tests/ndt/, 2018.
[82] SamKnows, “The internet measurement standard,” https://www.samknows.com/, 2018.
[83] B. Chandrasekaran, G. Smaragdakis, A. W. Berger, M. J. Luckie, andK.-C. Ng, “A server-to-server view of the internet,” in CoNEXT, 2015.
[84] Y.-C. Chiu, B. Schlinker, A. B. Radhakrishnan, E. Katz-Bassett, andR. Govindan, “Are we one hop away from a better internet?” in IMC.ACM, 2015.
[85] V. Kotronis, G. Nomikos, L. Manassakis, D. Mavrommatis, andX. Dimitropoulos, “Shortcuts through colocation facilities,” in IMC.ACM, 2017.
[86] APNIC, “Measuring IPv6,” https://labs.apnic.net/measureipv6/, 2018.[87] R. Fontugne, C. Pelsser, E. Aben, and R. Bush, “Pinpointing delay
and forwarding anomalies using large-scale traceroute measurements,”in IMC. ACM, 2017.
[88] A. Singla, B. Chandrasekaran, P. Godfrey, and B. Maggs, “The internetat the speed of light,” in HotNet. ACM, 2014.
[89] I. N. Bozkurt, W. Aqeel, D. Bhattacherjee, B. Chandrasekaran, P. B.Godfrey, G. Laughlin, B. M. Maggs, and A. Singla, “Dissecting latencyin the internet’s fiber infrastructure,” arXiv preprint arXiv:1811.10737,2018.
[90] R. Durairajan, C. Barford, and P. Barford, “Lights out: Climatechange risk to internet infrastructure,” in Proceedings of the AppliedNetworking Research Workshop. ACM, 2018.
[91] M. Luckie and R. Beverly, “The impact of router outages on the as-level internet,” in SIGCOMM. ACM, 2017.
[92] E. Katz-Bassett, C. Scott, D. R. Choffnes, I. Cunha, V. Valancius,N. Feamster, H. V. Madhyastha, T. Anderson, and A. Krishnamurthy,“Lifeguard: Practical repair of persistent route failures,” in SIGCOMM.ACM, 2012.
[93] M. Lad, R. Oliveira, B. Zhang, and L. Zhang, “Understanding resiliencyof internet topology against prefix hijack attacks,” in InternationalConference on Dependable Systems and Networks. IEEE, 2007.
[94] R. Fontugne, A. Shah, and E. Aben, “The (thin) bridges of asconnectivity: Measuring dependency using as hegemony,” in PAM.Springer, 2018.
[95] C. R. Palmer, G. Siganos, M. Faloutsos, C. Faloutsos, and P. Gibbons,“The connectivity and fault-tolerance of the internet topology,” inProceedings of the Workshop on Network-Related Data Management(NRDM), 2001.
[96] M. S. Kang, S. B. Lee, and V. D. Gligor, “The crossfire attack,”Symposium on Security and Privacy, 2013.
[97] M. S. Kang and V. D. Gligor, “Routing bottlenecks in the internet:Causes, exploits, and countermeasures,” in Computer and Communi-cations Security. ACM, 2014.
[98] V. Giotsas, C. Dietzel, G. Smaragdakis, A. Feldmann, A. Berger, andE. Aben, “Detecting peering infrastructure outages in the wild,” inSIGCOMM. ACM, 2017.
[99] A. Schulman and N. Spring, “Pingin’in the rain,” in IMC. ACM,2011.
[100] B. Eriksson, R. Durairajan, and P. Barford, “RiskRoute: A Frameworkfor Mitigating Network Outage Threats,” CoNEXT, 2013.

25
[101] M. Luckie, B. Huffaker, A. Dhamdhere, and V. Giotsas, “AS Relation-ships, Customer Cones, and Validation,” IMC, 2013.
[102] V. Giotsas and S. Zhou, “Valley-free violation in internet rout-ing—analysis based on bgp community data,” in International Con-ference on Communications. IEEE, 2012.