Internet Topology Research Redux - Welcome | acm...
59
W. Willinger, M. Roughan, “Internet Topology Research Redux”, in H. Haddadi, O. Bonaventure (Eds.), Recent Advances in Networking , (2013), pp. xx-yy. Licensed under a CC-BY-SA Creative Commons license. Internet Topology Research Redux Walter Willinger Matthew Roughan 1 Introduction Internet topology research is concerned with the study of the various types of connectivity structures that are enabled by the layered architecture of the Internet. More than a decade of Internet topology research has produced a number of high-profile "discoveries" that continue to fascinate the scientific community, even though (or, especially because) they have been simultaneously touted by different segments of that community as either seminal, controversial, seriously flawed, or simply wrong. Among these highly-popularized discoveries are the observed power-law relationships of the Internet topology, the network’s scale-free nature, and its extreme vulnerability to attacks that target the highly-connected nodes in its core (i.e., the Achilles’ heel of the Internet). The purpose of this chapter is to bring order to the current state of Internet topology research and separate “the wheat from the chaff”. In particular, by relying on carefully vetted data and readily available domain knowledge, we re-examine the reported discoveries and expose them to higher standards with respect to statistical inference and model validation. In the process, we reveal the superficial nature of many of these discoveries and provide alternative solutions that reflect networking reality and do not collapse under scrutiny with high-quality data or when examined in detail by domain experts. 1.1 The many facets of Internet connectivity Internet topology research is concerned with the study of the various types of connectivity structures that are enabled by the layered architecture of the Internet. These structures include the inherently physical components of the Internet’s infrastructure (e.g., routers and switches and the fiber cables connecting them) as well as a wealth of more logical topologies that can be defined and studied at the higher layers of the Internet’s TCP/IP protocol stack (e.g., IP-level graph, AS-level network, Web-graph, P2P networks, Online Social Networks or OSNs). As early as the ARPANET, researchers were drawing maps of the network representing its connectiv- ity [25]. The earliest date to 1969. In those days, the entire network was simply enough to draw on the back of an envelope 1 , and accurate maps could be drawn because every piece of equipment was expensive, installation was a major task, and only a few people worked on the network. As the network grew, its complexity also grew, until the point where no one person could draw such a map. At that point, automated strategies started to arise for measuring the topology. The earliest Internet topology studies date back to the time of the NSFNET and focused mainly on the network’s physical infrastructure consisting of routers, switches and the physical links connecting them (e.g., see [23, 119]). The decommissioning of the NSFNET around 1995 led to a transition of the Internet from a largely monolithic network structure (i.e., NSFNET) to a genuinely diverse "network of networks." Also known 1 For instance see http://personalpages.manchester.ac.uk/staff/m.dodge/cybergeography/atlas/ roberts_arpanet_large.gif
Transcript of Internet Topology Research Redux - Welcome | acm...

W. Willinger, M. Roughan, “Internet Topology Research Redux”, in H. Haddadi, O. Bonaventure (Eds.), Recent Advancesin Networking, (2013), pp. xx-yy. Licensed under a CC-BY-SA Creative Commons license.
Internet Topology Research Redux
Walter Willinger Matthew Roughan
1 Introduction
Internet topology research is concerned with the study of the various types of connectivity structuresthat are enabled by the layered architecture of the Internet. More than a decade of Internet topologyresearch has produced a number of high-profile "discoveries" that continue to fascinate the scientificcommunity, even though (or, especially because) they have been simultaneously touted by differentsegments of that community as either seminal, controversial, seriously flawed, or simply wrong. Amongthese highly-popularized discoveries are the observed power-law relationships of the Internet topology,the network’s scale-free nature, and its extreme vulnerability to attacks that target the highly-connectednodes in its core (i.e., the Achilles’ heel of the Internet).
The purpose of this chapter is to bring order to the current state of Internet topology research andseparate “the wheat from the chaff”. In particular, by relying on carefully vetted data and readily availabledomain knowledge, we re-examine the reported discoveries and expose them to higher standards withrespect to statistical inference and model validation. In the process, we reveal the superficial nature ofmany of these discoveries and provide alternative solutions that reflect networking reality and do notcollapse under scrutiny with high-quality data or when examined in detail by domain experts.
1.1 The many facets of Internet connectivity
Internet topology research is concerned with the study of the various types of connectivity structures thatare enabled by the layered architecture of the Internet. These structures include the inherently physicalcomponents of the Internet’s infrastructure (e.g., routers and switches and the fiber cables connectingthem) as well as a wealth of more logical topologies that can be defined and studied at the higher layersof the Internet’s TCP/IP protocol stack (e.g., IP-level graph, AS-level network, Web-graph, P2P networks,Online Social Networks or OSNs).
As early as the ARPANET, researchers were drawing maps of the network representing its connectiv-ity [25]. The earliest date to 1969. In those days, the entire network was simply enough to draw on the backof an envelope1, and accurate maps could be drawn because every piece of equipment was expensive,installation was a major task, and only a few people worked on the network.
As the network grew, its complexity also grew, until the point where no one person could draw such amap. At that point, automated strategies started to arise for measuring the topology. The earliest Internettopology studies date back to the time of the NSFNET and focused mainly on the network’s physicalinfrastructure consisting of routers, switches and the physical links connecting them (e.g., see [23, 119]).The decommissioning of the NSFNET around 1995 led to a transition of the Internet from a largelymonolithic network structure (i.e., NSFNET) to a genuinely diverse "network of networks." Also known
1For instance see http://personalpages.manchester.ac.uk/staff/m.dodge/cybergeography/atlas/roberts_arpanet_large.gif
as Autonomous Systems (ASes), together these individual networks form what we now call the "publicInternet" and are owned by a diverse set of organizations and companies that includes large and smallInternet Service Providers (ISPs), transit providers, network service providers, Fortune 500 companies andsmall businesses, academic and research organizations, content providers, Content Distribution Networks(CDNs), Web hosting companies, and cloud providers.
With this transition came an increasing fascination of the research community with a largely economics-driven connectivity structure commonly referred to as the Internet’s AS-graph; that is, the logical Internettopology where nodes represent individual ASes and edges reflect observed relationships among theASes (e.g., customer-provider, peer-peer, or sibling-sibling relationship). It is important to note that theAS-graph says little about how two ASes connect with one another at the physical level; in particular,it says nothing about if or how they exchange actual traffic. Nevertheless, starting shortly after 1995,this fascination with the AS-graph has resulted in thousands of research publications covering a rangeof aspects related to measuring, modeling, and analyzing the AS-level topology of the Internet and itsevolution over time [60, 135].
At the application layer, the emergence of the World Wide Web (WWW) in the late 1990 as a killerapplication generated general interest in exploring the Web-graph, where nodes represent web pages andedges denote hyperlinks [18]. While this overlay network or logical connectivity structure says nothingabout how the servers hosting the web pages are connected at the physical or AS level, its scale anddynamics differ drastically from its physical-based or economics-driven underlays – a typical Web-graphhas billions of nodes and even more edges and is highly dynamic; a large ISP’s router-level topologyconsists of some thousands of routers, and today’s AS-level Internet is made up of some 30,000-40,000actively routed ASes and an order of magnitude more links.
Other applications that give rise to their own "overlay" or logical connectivity structure and haveattracted some attention among researchers include email and various P2P systems such as Gnutella,Kad, eDonkey, and BitTorrent. More recently, the enormous popularity of Online Social Networks (OSNs)has resulted in a staggering number of research papers dealing with all different aspects of measuring,modeling, analyzing, and designing OSNs. Data from large-scale crawls or, in rare circumstances, OSN-provided data have been used to examine snapshots of many real-world OSNs or OSN-type systems, wherethe snapshots are generally simple graphs with nodes representing individual users and edges denotingsome implicit or explicit friendship relationship among the users.
1.2 Many interested parties with different objectives
The above-mentioned list of possible connectivity structures that exist in today’s Internet is by no meanscomplete, but illustrates how these structures arise naturally within the Internet’s layered architecture. Italso highlights the many different meanings of the term “Internet topology,” and sensible use of this termrequires explicitly specifying which facet of Internet connectivity is considered because the differences arecritical.
The list also reflects the different motivations that different researchers have for studying Internet-related graphs or networks. For example, engineers are mainly concerned with the physical facets ofInternet connectivity, where technological issues generally dominate over economic and social aspects.However, the more economics-minded researchers are particularly interested in the Internet’s AS-levelstructure where business considerations and market forces mix with technological innovation and societalconsiderations and shape the very structure and evolution of this logical topology. Moreover, socialscientists see in the application-level connectivity structures that result from large-scale crawls of thevarious OSNs new and exciting opportunities for studying different aspects of human behavior and

technology-enabled inter-personal communication at previously unheard of scale.In addition, mathematicians are interested in the different connectivity structures mainly because
of their many novel features and properties that tend to require new and creative modeling and analysismethodologies. From the perspective of many computer scientists, the challenges posed by many ofthese intricate connectivity structures are algorithmic in nature and arise from trying to solve specificproblems involving a particular topological structure. For yet another motivation, many physicists turnednetwork scientists see the Internet as one of many examples of large-scale complex networks that awaitsthe discovery of universal properties that do not depend on system-specific details and advance ourunderstanding of these complex networks irrespective of the domain in which they arose in the first place.
1.3 More than a decade of Internet topology research
When trying to assess the large body of literature in the area of Internet topology research that hasaccumulated since about 1995 and has experienced enormous growth especially during the last 10+ years,the picture that emerges is at best murky.
On the one hand, there are high-volume datasets of detailed network measurements that have beencollected by domain experts. These datasets have been made publicly available so other researchers canuse them. As a result, Internet topology research has become a prime example of a measurement-drivenresearch effort, where third-party studies of the available datasets abound and have contributed to ageneral excitement about the topic area, mainly because many of the inferred connectivity structures havebeen reported to exhibit surprising properties (e.g., power-law relationships for inferred quantities such asnode degree [49]). In turn, these surprising discoveries have led network scientists and mathematiciansalike to develop new network models that are provably consistent with some of this highly-publicizedempirical evidence. Partly due to their simplicity and partly due to their strong predictive power, thesenewly proposed network models have become very popular within the larger scientific community [5, 11,12]. For example, they have resulted in claims about the Internet that have made their way into standardtextbooks on complex networks, where they are also used to support the view that a bottom-up approachdominated by domain-specific details and knowledge is largely doomed when trying to match the insightand understanding that a top-down approach centered around a general quest for "universality" promisesto provide [10, 45, 113, 123].
On the other hand, there is a body of work within the networking research literature that arguesessentially just the opposite and presents the necessary evidence in support of a inherently engineering-oriented approach filled with domain-specific details and knowledge [7, 93, 156]. In contrast to beingmeasurement-driven, this approach is first and foremost concerned with notions such as a network’spurpose or functionality, the hard technological constraints that the different devices used to build anetwork’s physical infrastructure have to obey, or the sources of uncertainty in a network’s "environment"with respect to which the built network should be robust. As for the measurements that have been keyto the top-down approach, the reliance on domain knowledge reveals the data’s sub-par quality andhighlights how errors of various forms occur and can add up to produce results and claims that createexcitement among non-experts but quickly collapse when scrutinized or examined by domain experts.While there exist currently no textbooks that document these failures of applying detail- and domainknowledge-agnostic perspective to the Internet, there is an increasing number of papers in the publishednetworking research literature that detail the various mis-steps and show why findings and claims thatlook at first glance impressive and conclusive to a science-minded reader turn out to be simply wrong orcompletely meaningless when examined closely by domain experts [6, 85, 156].
In short, a survey of the existing literature on Internet topology research leaves one with the distinct

impression that “too many cooks spoil the broth.” We hope that in the not-too-distant future, thisimpression will be replaced by “many hand make light work”, and we see this chapter as a first step towardsachieving this goal.
1.4 Themes
In writing this chapter there are a number of themes that emerge, and it is our intention to highlightthem to bring out in the open the main differences between a detail-oriented engineering approach toInternet topology modeling versus an approach that has become a hallmark of network science and aimsat abstracting away as many details as possible to uncover “universal” laws that govern the behavior oflarge-scale complex networks irrespective of the domains that specify those networks in the first place.
Theme 1: When studying highly-engineered systems such as the Internet, “details” in the form of proto-cols, architecture, functionality, and purpose matter.
Theme 2: When analyzing Internet measurements, examining the “hygiene” of the available measure-ments (i.e., an in-depth recounting of the potential pitfalls associated with producing the measure-ments in question) is critical.
Theme 3: When validating proposed topology models, it is necessary to treat network modeling as anexercise in reverse-engineering and not as an exercise in model-fitting.
Theme 4: When modeling highly-engineered systems such as the Internet, beware of M.L. Mencken’squote “For every complex problem there is an answer that is clear, simple, and wrong.”
2 Primer
We start first by defining some common ideas, motives, and problems within the scope of network topologymodelling.
2.1 A Graph Primer
In this context topology usually refers to the structure of the graph representation of a network. That is, thecommon notion used to describe network topology is the mathematical graph. A graph G is defined by aset of nodes N (often called vertices) and edges (or links) E ⊂N ×N , so we usually write G = (N ,E ).Here, we shall denote the number of nodes N = |N |, and the number of edges E = |E |.
Nodes are usually associated with some logical of physical structure in a network: a router, switch, PoP,or AS. Edges are associated with the appropriate type of logical or physical link between these nodes.
A graph describes connectivity between logical resources such as routers, or IP address, but simpleconnectivity is rarely as useful as when additional information such as names, capacity or distance areattached to these abstract objects. Such can easily be included in these descriptions by creating labellingfunctions of the node or edge sets, in the form: f : N →R or f : E →R in the case of real-valued labels. Wecould similarly defined labelling functions with text labels, or integer or vector values, and so on. However,it is naive to treat labels as an “add-on” as they carry semantics that can be important in the network. Forinstance, when we define link distances (be these geographic or semantic), that can change the notion ofdistance in the network as a whole.

We can also define functions of groupings of nodes or edges, though in this case it is not as conceptuallyobvious why we might. However, an exemplary case is that of “on-net” where we might define a functionthat classifies pairs of nodes as on the same subnet or not. Thus, such functions can ascribe meaning togroupings of nodes.
Many of the Internet graphs have symmetric links (that is, if i → j is a link, then j → i is also a link)and so these networks are undirected, but we also need sometimes to represent asymmetric links, and doso with a directed graph or digraph, and we call the links in such a digraph arcs.
In the study of network topology we might come across the more generalized graph concepts of themulti-graph and hyper-graph.
• hypergraph: links connect more than two nodes
– e.g., where you have a connective medium (rather than a wire), for instance in a wirelessnetwork.
• multigraph or pseudograph: has multiple parallel links between two nodes
– e.g., it is easy to have two links between two routers.
We’ll exclude these cases unless explicitly stated, but it is worth noting that each of these do apply toparticular aspects of the Internet.
We say two nodes are connected if a path exists between them, and that a graph is connected if all pairsof nodes are connected. A graph is k−node connected if the graph remains connected after the removalof any set of k −1 or fewer nodes (and corresponding links) and k−edge connected if the graph remainsconnected after the removal of any k −1 edges.
For an undirected graph G , define the neighborhood of node i by
Ni ={
j | (i , j ) ∈ E},
i.e., the set of adjacent nodes to i , and we define the degree of the node to be the number of elements inthe neighborhood to be
ki = |Ni |.In a directed graph, we define two concepts: the in-degree (the number of links connecting to the link)and the out-degree (the number of links originating from it).
in-degree(i ) = ∣∣{( j , i )|( j , i ) ∈ E }∣∣ ,
out-degree(i ) = ∣∣{(i , j )|(i , j ) ∈ E }∣∣ .
We often consider statistics of the degree distribution pk (which gives the probability that a node hasdegree k), the average node degree being the most obvious such. It can be easily calculated from the sumof degrees, which has the interesting property ∑
i∈Nki = 2|E |,
generally referred to the Handshake lemma.The node-degree distribution provides a common characterization of a graph (though by no means
a complete characterization). It is noteworthy, however, that although this distribution is frequentlydiscussed, the concept is somewhat ill-defined. It can be directly measured for a real network, in which

case pk is the probability that a randomly selected node from the measured graph has degree k. However,it is often used in the context of a set of simulated graphs, where it is used to mean the probability thata node in the ensemble of networks has degree k with this probability. The difference is subtle, but it isworth keeping track of such discrepancies.
There are many other graph metrics. For instance, the distance2 between two connected nodes inan unweighted graphs is generally defined to be the number of edges in the shortest path connectingthem. We can then examine quantities such as the average distance, and the diameter of the network (themaximum distance).
And there are many other metrics: assortativity, clustering coefficient, centrality, and so on. Theyare all attempts to capture the nature of a graph in a small set of measures, and as such provide simpler,seemingly more intuitive ways to consider graphs. For other discussions of these, and comparisons in thecontext of Internet topologies see [68, 79]. We must be wary though, as it should be clear that the potentialfor problems is immediate. No small set of numbers can truly represent graphs. For instance, consider theHamiltonian cycle3 problem. The problem of determining if a network has such a path is well known tobe NP-complete, and as such no small set of statistics of the graph will provide a characterization that issufficient to consider this problem. Thus, these simple statistics must miss important properties of thenetwork.
It may be useful to the reader to consider some of the tools that are available for working with graphs.They have different sets of feature, but perhaps the most important is whether they are used in conjunctionwith a programming language and which one, so we have listed a (no doubt incomplete) set below withsome very basic information.
• MatlabBGL http://www.stanford.edu/~dgleich/programs/matlab_bgl/
– Graph libraries for Matlab,
– using Boost Graph Library (BGL)http://www.boost.org/doc/libs/1_42_0/libs/graph/doc/index.html
• igraph http://igraph.sourceforge.net/
– Libraries for working with graphs in R or Python
• GraphVis http://www.graphviz.org/
– Toolkit for visualization of graphs
• NetworkX http://networkx.lanl.gov/
– Python toolkit for working with graphs
• GDToolkit http://www.dia.uniroma3.it/~gdt/gdt4/index.php
– OO C++ library for handling and drawing graphs
• JUNG http://jung.sourceforge.net/
– Java universal network/graph framework
• IGen http://informatique.umons.ac.be/networks/igen/
– A toolkit for generating IP network topologies based on network design heuristics.2The graph distance has a long history. In mathematics, perhaps the best known example is the Erdos number, which is the
distance of a author from Erdos in the co-authorship graph. In popular culture there is an equivalent: the Bacon number, or thedistance between actors in the graph of co-appearances.
3A Hamiltonian cycle is a path (on the graph) that visits each node exactly once, and then returns to the start point.

2.2 Motivations for network topology investigations
Underlying the whole research area is often an only vague notion of why we study topology. The motivesfor such studies are in fact quite diverse, and the implications are important. Topology studies motivatedby network managers with operational imperatives have profoundly different requirements to those of thescientific research community. Broadly speaking, we can divide the motivations as follows:
• Scientific: Despite the fact that computer networks are designed (rather than grown as organicnetworks), little is known about their generic properties. Such knowledge would be useful (apartfrom satisfying simple curiosity) because there are many future protocols (for instance multicastprotocols), and network-engineering algorithms (for instance see [54]) whose design could benefitfrom an understanding of typical networks, rather than the typically very small, and unrealistic testexamples often employed.
• Adversarial: Some network operators (though not all [84]) believe that commercial rivals might gainadvantage through obtaining proprietary information about their network design. Similarly, thereis a general belief that such information might facilitate an attack on the network. For instance,knowledge of a competitor’s customers might be used by an adversary to target Denial of Service(DoS) attacks. One possible motivation for topology discovery is for just such an adversary to gaininformation to target attacks.
• Managerial: It is often assumed that a network operator has a “database of record” that containsall the important information about their network. While this may be true in some cases, it ismore often the case that such databases are hard to keep up-to-date and consistent with other datasources. This is actually a common problem in database management [37]. Such databases mustbe maintained by humans, and as soon as they grow large, and complex (particularly when theyare dynamic), it becomes exceedingly difficult to eradicate all human errors. In addition, when thenetwork undergoes change, particularly unplanned changes (failures), the database is unlikely to beaccurate. Hence, for management of complex, dynamic networks, another source of data about thenetwork is needed. It should be no surprise that obtaining this data from the network itself is thebest solution for ensuring up-to-date, accurate records.
• Informational: This is a fairly general category of motivations, but differs from pure scientificcuriosity in the immediacy of its application. For instance, customers of network operators oftendesire information about the networks to which they currently subscribe (in order to debug services,or obtain quality of service measurements), and also about networks to which they might subscribe(to help make choices about who could provide them with the most effective service). Often, acustomer may not entirely trust its provider, or potential provider, and wish to verify informationthemselves. Hence, there is a need for such customers to be able to discover the networks to whichthey might subscribe, or where they should place services.
Each of these motivations imposes different requirements on our study in terms of accuracy, immediacy,and the types of measurements available. High degrees of accuracy are needed for network management;and certainly the measurements used scientifically have rarely been very accurate (though this is asignificant problem with that research).

2.3 Type of network
The other core aspect we should consider is the type of topology to be examined, as it can have a drasticaffect on both observations and behavior of the network. Two obvious dimensions are
Physical vs virtual: Physical networks are built from hardware: routers and cables (copper or optical fiberfor the Internet), transformers and cables for electricity, or cities and roads for the road network.Virtual networks may have physical nodes, but virtual edges (as in a social network), or virtual nodesand edges (as in online social networks, or the WWW).
The main difference is that there are usually large costs in building, or adding to a physical network.Virtual networks, on the other hand, have much smaller costs (an HTML link costs almost nothing tocreate). Costs have a profound affect on network designs, as we shall later see, but also on dynamicbehavior. If it is easier to change a network, it can change more quickly.
The other major issue for a physical network is that it is often bound by physical constraints, andthis also profoundly affect their design.
Figure 1 illustrates the differences, and also makes the point that it isn’t really a binary difference.Networks lie on a spectrum.
Neural network
Physical networks Virtual networks
Internet (layer 1-3)L1 - physicalL2 - linksL3 - network
WWWemailpeer-2-peeronline social network facebook linked in
Science CitationsInternet
Social interactionsInternet (layer 7)
L4 - end-to-end connectionsAutonomous Systems
Characterised by Characterised byreal costs => optimizationphysical constraintscomparative stability
dynamic behaviourhigh variability
Figure 1: Physical vs virtual networks.
Transport vs Information flows: A more subtle differentiator is between what the network carries. Somenetworks physically transport some type of material (cars, water, ...) whereas the flows in othernetworks are (almost) pure information (the Internet, ...).
The importance of this distinction for networks may be less immediately obvious, but it certainlydoes have implications. When physical transport is involved in a network, the constraints on thatnetwork are likely to be even more stringent, and the ability to change the network even morelimited. Costs for changing the road network, for instance, are usually higher than changing theequivalent proportion of a IP network.
Within this chapter, we are primarily interested in the “Internet”, and that includes both physical (OSIlayer 1-3) networks, and virtual networks (MPLS, WWW, online social networks, etc.). However, all of the

Cars/buses/pedestrians
Transport networks Information networks
Distributionwaterelectricity
WWWemailetc.
Social interactionsInternet
Characterised by Characterised bytransport of physical objects transport of information
Figure 2: Transport vs information flows.
networks considered here are information transportation networks.There are other dimensions on which networks could be classified. For instance, by the nature of the
transport. Does it come in discrete chunks (e.g., cars, packets, or the post) or continuously (e.g., water orelectricity)? Is the transport connection oriented (e.g., the telephone network) or packet oriented (e.g., theInternet)?
And there are other general issues we need to deal with:
• Physical networks are embedded in geography, but logical networks often aren’t, and yet the sameterminology is often applied to each.
• Connectivity often changes over time, with the time-scale varying depending on the type of network.
• The Internet is often said to be a “network of networks”. It is often hard to consider one network inisolation, they have relationships, but the situations is even more complicated than often imagined.
peers Networks may be connected to peers, i.e., similar networks that may be competing or co-operating (or both in some cases), e.g., two ISPs operating in the same region.
parents Networks may have a parent-child relationship in the sense that one network controls theother, e.g., the SS7 network with respect to traditional telephone network.
layers A single network may have multiple layers, each of which can be represented by a differentgraph, e.g., the physical- vs the network-layers in the Internet.
external There is substantial interaction between notionally separated networks, e.g., the powergrid and the Internet, both because the Internet uses electricity, but also because spikes inelectricity demand could potentially be caused by network flash crowds (certainly TV programshave a very important impact on electricity usage).
That brings us naturally to the particular object of discussion here – the Internet (and its topology).The term “Internet” means (many) different things to (many) different people. Even within the networkingcommunity, the term is often used ambiguously, leading to misunderstandings and confusion and creatingroadblocks for a genuinely scientific treatment of an engineered system that has revolutionized the waywe live.
While mathematics in the form of graph theory has been equally culpable in adopting the use of thisvague nomenclature, the “new science of networks” has popularized it to the point where phrases like

“topology of the Internet” or “Internet graph” have entered the mainstream science literature, even thoughthey are essentially meaningless without precisely-stated definitions. For one, “Internet topology” couldrefer to the connectivity structures encountered in any of layers in the protocol stack, or at various levelsof aggregation. Common examples are
1. Router-level (layer 3): An often sought topology is the router level. Somewhat ambiguously, thismay also be called the network level, or IP level, but “network” is a heavily overloaded term here,and the IP level can also be ambiguous. For instance, IP level could refer to the way IP addressesare connected, that is it could refer to the interfaces of one router as separate nodes [19], but that israrely what is useful for network operations or research. We could also add at layer 3, in addition tointerface-level topology described above, the subnet-level topology [19, 67, 81, 148, 149], describingthe interconnectivity of logical subnets (often described by an IP-level prefix), but here we focus onthe more commonly considered router level.
The router-level graph shows a range of interesting implementation details of a network. This typeof information is critical for network management applications, as much of Internet managementrests at the IP layer, and it is of great importance for network adversaries. For instance, developingtools to measure network traffic requires an understanding of the router-layer topology, in order tomatch traffic to links. Similarly traffic engineering, and reliability analyses are carried out at thislevel. One complication of this layer is that we sometimes wish to obtain the topology extendingout to end-hosts, which are not technically routers, but we shall include these in our definition ofrouter-layer topology, unless otherwise specified.
2. Switch-level (layer 2): A single IP layer logical link may hide several layer-2 devices (hubs andswitches). The increasing prevalence of Ethernet, and the ability to provide redundancy at rea-sonable cost, has led to a proliferation of such devices, and most Local Area Networks (LANs) arebased around such. Hence, very many networks which have trivial, or simple IP layer topologieshave complex and interesting layer-2 topologies. Multi-Protocol Label Switching (MPLS) furthercomplicates the situation by creating logical layer-2 networks without physical devices, often in theform of cliques. Measurements often see only one layer, creating misunderstandings of a network’strue resilience and more general graph properties. For instance, layer-2 devices can connect largenumbers of routers, making them appear to have higher degree at layer-3 [104] (for more detaileddiscussion see §3.2.3).
3. Physical-level (layer 1): Below the link layer (layer 2), lies the physical layer. Again, many physicaldevices may underly a single logical link. Discovery of this layer is of critical importance in networkmanagement tasks associated with reliability. In particular, the concept of Shared Risk Link Groups(SRLG) requires knowledge of which links are carried on which fibers (using Wavelength DivisionMultiplexing), in which conduits. If a backhoe digs up a single conduit, it will cause a bundle offibers to fail, and so connections that are in the same SRLG will all fail simultaneously. Clearlyredundant links need to be in different SRLG, and discovery of the physical topology is important toensure that this is the case.
4. PoP-level: A Point-of-Presence (PoP) is a loosely defined grouping of devices, often defined by ametropolitan area. PoP level topologies are quite useful, essentially because these graphs describethe logical structure of the network as the designer intended, rather than its particular implementa-tion in terms of individual routers. Such topologies are ideal for understanding tradeoffs betweenconnectivity and redundancy, and also provide the most essential information to competitors or

customers (about where a network is based, or who has the best access network in a region). Networkmaps are often drawn at this level because it is an easy level for humans to comprehend.
5. Application layer: There has been significant interest in logical topologies of the application layer,e.g., for the Web (using HTTP, and HTML), and the P2P applications.
6. AS-level: AS topologies have generated much interest in the scientific literature [5, 13, 161], be-cause they appear to show interesting properties (such as power-laws) in common with otherun-engineered networks such as biological networks. Also, much data on AS topologies is publiclyavailable. While of interest in the scientific literature, this data’s use is confused by many myths andmisunderstandings [135]. The data may provide mild competitive benefits, in allowing operators todetermine who peers with who, but the measured data often comes without attributes that wouldmake the data truly useful in this regard. Finally, it is hard to see how such data could be used inan attack, although much publicized reports such as [161] suggest, incorrectly (see [93]), that theobserved structure of the AS graph may lead to an “Achilles heel” of the Internet.
The number of possible topologies we might wish to discover highlights the complexity of this problem,and why discovery is so valuable for network management. In this chapter we will consider the router-level topology in detail, and then discuss some of the similarities and differences with respect to AS- andPoP-level topologies.
In addition to understanding the Internet network as a simple graph, there are many other featuresof the graph that one would also wish to know, for instance, its routing, link capacities, and geographiclocations. We describe such qualities as graph attributes, and find that most can either be attributed toedges of the graph, for instance
• link capacities,
• link length,
• routing weights (e.g., for shortest-path routing),
• link utilizations,
• link performance (for example, bit-error-rate, delay, loss, jitter, reordering, buffer utilization),
• link status (up/down), and
• a link’s lower layer properties (e.g., number of physical hops),
or to the nodes of the graph
• geographic location,
• type of node, e.g., brand of router, or version of software,
• performance measures (e.g., CPU utilization), and
• node status (up/down).
We could further divide this list into intrinsic network properties, such as node location, or link capac-ity (things that cannot change easily), and extrinsic properties, such as performance, or traffic relatedproperties, which can change dramatically despite there being no change in the underlying network.

3 Router-level topology
3.1 A look back
Since the early days of the ARPANET, networking researchers have been interested in drawing the typeof networks they designed [71]. An early map of the ARPANET is reproduced in Figure 3 and shows thenetwork’s logical connectivity structures in April 1971, when the network as a whole consisted of some 15nodes and a node was little more than one or two state-of-the-art computers connected via an InterfaceMessage Processor or IMP (the modern equivalent would be a router). In this context, logical structurerefers to a detailed drawing of the connectivity among those nodes and of node-specific details (e.g., typeof machine), by and large ignoring geography. In contrast, geographic structure refers to a map of the USthat includes the actual locations of the network’s physical nodes and shows the physical connectivityamong those nodes. Such accurate maps could be drawn because at that time, each piece of equipmentwas expensive and needed to be accounted for, only a few groups with a small number of researchers wereinvolved in the design and installation of the network, and the network changed relatively slowly.
Figure 3: The ARPANET in 1971 (reprinted from [25]; ©1990 ACM, Inc. Included here by permission.)
The network quickly grew in size and complexity. For instance, Figure 4 shows the geographic coun-terpart from 1984 of the ARPANET map depicted in Figure 3. Manually accounting for the increasingnumber of components quickly became prohibitive and motivated the adoption of automatic strategies forobtaining some of the available connectivity as well as traffic information. A prime example for effectivelyvisualizing this collected information is reproduced from [55] and shown in Figure 5, which depicts a 3Drendering of the (US portion of the) NSFNET around 1991, annotated with traffic-related information. Atthat time, the NSFNET backbone consisted of some 14 nodes that were interconnected with T1 links asshown and, in turn, connected to a number of different campus networks (e.g., collections of intercon-nected LANs). However, even though the internal structure of the backbone nodes was well-known (i.e.,each node was composed of nine IBM RTs linked by two token rings with an Ethernet interface to attached

Figure 4: The early ARPANET (reprinted from [25]; ©1990 ACM, Inc. Included here by permission.)
networks), nobody had any longer access to the internals of all the different campus networks and as aresult, drawing the 1991 NSFNET equivalent of the ARPANET’s logical connectivity structure (Figure 3)was no longer possible.
With the decommissioning of the NSFNET in 1995 and the rise of the "public Internet", the researchers’ability to obtain detailed connectivity and component information about the internals of the differentnetworks that formed the emerging "network of networks" further diminished and generated renewed in-terest in the development of abstract, yet informed, models for router-topology evaluation and generation.For example, the Waxman model [155], a variation of the classical Erdös-Rényi random graph model [47]was the first popular topology generator commonly-used for network simulation studies at the routerlevel. However, it was largely abandoned in the late 1990s in favor of models that attempted to explicitlyaccount for non-random structure as part of the network design. The arguments that favored structureover randomness were largely empirical in nature and reflected the fact that the inspection of real-worldrouter-level ISP networks showed clear signs of non-random structures in the form of the presence ofbackbones, the appearance of hierarchical designs, and the importance of locality. These arguments alsofavored the notion that a topology generator should reflect the design principles in common use; e.g., toachieve some desired performance objectives, the physical networks must satisfy certain connectivity andredundancy requirements, properties which are generally not guaranteed in random network topologies.These principles were, for example, advanced in [23, 164, 165] and were ultimately integrated into thepopular Georgia Tech Internetwork Topology Models (GT-ITM) [65].
These more structure-oriented router topology generators were viewed as the state-of-the-art untilaround 2000 when, in turn, they were largely abandoned in favor of a new class of random graph modelswhose trademark was the ability to reproduce the newly discovered power-law relationship in the observedconnectivity (i.e., node degree) of router-level graphs of the Internet. This discovery was originally reported

Figure 5: A visualization of the NSFNET circa 1991 (by Donna Cox and Robert Patterson, National Center for Supercom-puting Applications, University of Illinois at Urbana-Champaign. See also http://en.wikipedia.org/wiki/File:NSFNET-traffic-visualization-1991.jpg).

in the seminal paper by Faloutsos et al. [49], who used a router-level graph constructed from data that wascollected a few years earlier by Pansiot and Grad [119] for the purpose of obtaining some experimentaldata on the actual shape of multicast trees in the Internet. The Boston university Representative InternetTopology gEnerator (BRITE) [103] became a popular representative of this new class of models, in partalso because it combined the more structure-oriented perspective of the GT-ITM generator with the newfocus that emphasized the ability to reproduce certain metrics or statistics of measured router topologies(e.g., node degree distribution).
One of the hallmarks of networks that have power-law degree distributions and that are generatedaccording to any of a number of different probabilistic mechanisms (e.g., preferential attachment [13],random graphs with a given expected degree sequence [30], power-law random graphs [3]) is that they canbe shown to have a few centrally located and highly connected hubs through which essentially most trafficmust flow. When using these models to represent the router-level topology of the Internet, the presenceof these highly connected central nodes has been touted the Internet’s “Achilles-heel” because networkconnectivity is highly vulnerable to attacks that target the high-degree hub nodes [5]. It has been similarlyargued that these high-degree hubs are a primary reason for the epidemic spread of computer wormsand viruses [112, 122]. Importantly, the presence of highly connected central nodes in a network havinga power-law degree distribution is the essence of the so-called scale-free network models. They havebeen a highly popular theme in the study of complex networks, particularly among researchers inspiredby statistical physics [4], and have fuelled the rise of a new scientific discipline that has become knownas “Network Science" [12]. In the process, they have also seen wide-spread use among Internet topologyresearchers.
However, as the general fascination with and popularity of network science in general and scale freenetwork modeling in particular grew, so did the arguments that were voiced by Internet researchers andquestioned the appropriateness and relevance of the scale-free modeling approach for studying highly-engineered systems such as the Internet’s router topology. In fact, at around 2010, when the numberof publications in the area of network science reached a new height, the number of papers that werepublished in the networking research literature and applied scale-free network models to describe orstudy router-level topologies of the Internet was close to zero. This begs the question “What happened?”,and the answer provided in the next section is really a classic lesson in how errors of various forms occurand can add up to produce results and claims that create excitement among non-networking researchers,but quickly collapse when scrutinized with real data or examined by domain experts.
3.2 Know your measurements
Between 1990 and 2000, Internet topology research underwent a drastic change from being a data-starveddiscipline to becoming a prime example of a largely measurement-driven research activity. As describedearlier, even though the development of abstract, yet informed, models for network topology evaluationand generation has always been a give and take between theoreticians and empiricists, for router topologymodeling, the essential role that measurements have started to play came into full focus in a sequence ofthree seminal papers that appeared between 1998-2000.
3.2.1 Three seminal papers on router topology modeling
The key papers that turned router topology modeling into a full-fledged measurement-driven researchactivity cover the whole spectrum of modeling activities, from measurement experiments to modelconstruction and validation to graph-theoretical network analysis, and are listed below:

(i) “On routes and multicast trees in the Internet” by J.-J. Pansiot and D. Grad (1998) [119] described theoriginal measurement experiment that was performed in mid-1995 and produced data on actualroutes taken by packets in the Internet. This data was subsequently used to construct a router graphof the Internet.
(ii) “On power-law relationships of the Internet topology” by M. Faloutsos et al. (1999) [49] reported(among other observations) on the observed power-law relationship in the connectivity of therouter-level topology of the Internet measured by Pansiot and Grad [119].
(iii) “Error and attack tolerance of complex networks” by R. Albert et al. (2000) [5] proposed a scale-freenetwork model to describe the router topology of the Internet and argued for its validity on thebasis of the latest findings by Faloutsos et al. [49]. It touted the new model’s exemplary predictivepower by reporting on the discovery of a fundamental weakness of the Internet (a property that wasbecame known as the Internet’s "Achilles’ heel") that went apparently unnoticed by the engineersand researchers who have designed, deployed, and studied this large-scale, critical infrastructure,but followed directly from the newly proposed scale-free modeling approach.
Node Degree (d)Nod
e R
ank:
R(d
) = P
(D>d
) x #
node
s
(a) (b)
101
101
102
100
Fig1
Figure 6: A toy example of a scale-free network of the preferential attachment type (b) generated to match a power-lawtype node degree distribution (a). (First published in Notices of the American Mathematical Society, Volume 56, No.3(May 2009): 586-599 [156]. Included here by permission.)
At first glance, the combination of these three papers appears to show network modeling at its best –firmly based on experimental data, following modeling practices steeped in tradition, and discoveringsurprisingly and previously unknown properties of the modeled network. An example of a toy networkresulting from taking the findings from these seminal papers at face value is shown in Figure 6. However,one of the beauties of studying man-made systems such as the Internet is that – because of their highly-engineered architectures, a thorough understanding of its component technologies, and the availability ofextensive (but not necessarily very accurate) measurement capabilities – they provide a unique setting inwhich most claims about their properties, structure, and functionality can be unambiguously resolved,though perhaps not without substantial efforts. In the remainder of this section, we will illustrate how inthe context of the Internet’s router topology, applying readily available domain knowledge in the form oforiginal design principles, existing technological constraints, and available measurement methodologiesreveals a drastically different picture from that painted in these three seminal papers. In fact, we will

expose the specious nature of scale-free network models that may appeal to more mathematically inclinedresearchers because of their simplicity or generality, but besides having no bearing on the Internet’s routertopology are also resulting in wrong claims about the Internet as a whole.
3.2.2 A first sanity check: Using publicly available information
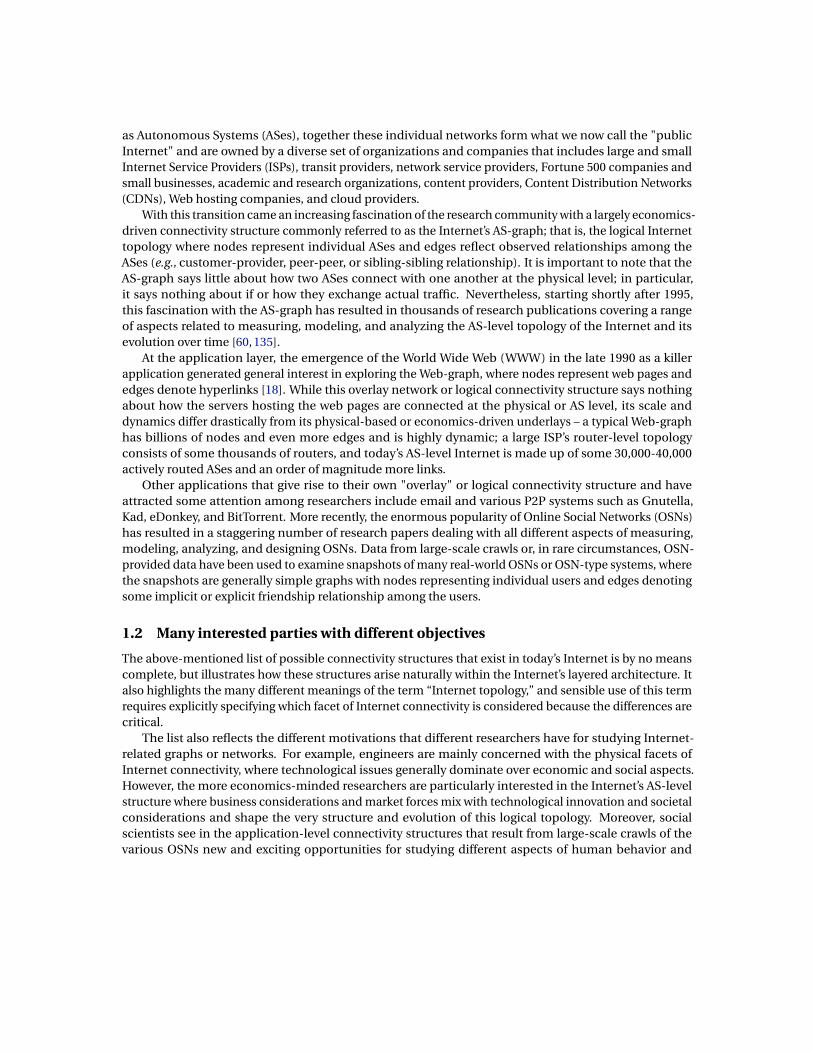
A first indication of apparent inconsistencies between the proposed scale-free models for the Internet’srouter topology and the actual Internet comes from the inspection of the router topologies of actualnetworks that make the details of their network internals publicly available. For example, networks such asInternet2 [77] or GÉANT [57] show no evidence that there exist any centrally located and highly connected“hubs” through which essentially most traffic must flow. Instead, what they typically show is the presenceof a more or less pronounced “backbone” network that is fed by tree-like access networks, with additionalconnections at various places to provide a degree of redundancy and robustness to components failures4.
This design pattern is fully consistent with even just a cursory reading of the most recent productcatalogs or white papers published by the main router vendors [32,33,80]. For one, the most expensive andfastest or highest-capacity pieces of equipment are explicitly marketed as backbone routers. Moreover,due to inherent technological limitations in how many packets or bytes a router can handle in a giventime interval, even the latest models of backbone routers can support only a small number of veryhigh-bandwidth connections, typically to connect to other backbone routers. At the same time, a widerange of cheaper, slower or lower-capacity products are offered by the different router vendors and aretargeted primarily at to support network access. On the access side, a typical router will have manylower-bandwidth connections for the purpose of aggregating customer traffic from the network’s edge andsubsequently forwarding that traffic towards the backbone. In short, even the latest models advertised bytoday’s router vendors are limited by existing technologies, and even for the top-of-the-line backbonerouters, it is technologically infeasible to have hundreds or thousands of high-bandwidth connections.At the same time, while technically feasible, deploying some of the most expensive equipment andconfiguring it to support hundreds or thousands of low-bandwidth connections would be considered anoverall bad engineering decision (e.g., excessively costly, highly inefficient, and causing serious bottlenecksin the network).
However, the root cause for these outward signs of a clear mismatch between the modeled and actualrouter topology of the Internet goes deeper and lies in the original design philosophy of the Internet. Asdetailed in [34], while the top level goal for the original DARPA Internet architecture was “to develop aneffective technique for multiplexed utilization of existing interconnected networks", the requirement that“Internet communication must continue despite loss of networks or gateways" topped the list of secondlevel goals. To survive in the face of components failing off, the architecture was to mask completelyany transient failure, and to achieve this goal, state information which describes an existing connectionmust be protected. To this end, the architecture adopted the “fate-sharing" model that gathers thisstate information at the endpoints of connections, at the entities that are utilizing the service of thenetwork. Under this model, it is acceptable to lose the state information associated with an entity if, atthe same time, the entity itself is lost; that is, there exists no longer any physical path over which any sortof communication with that entity can be achieved (i.e., total partition). Ironically, these original designprinciples outlined in [34] favor precisely the opposite of what the scale-free modeling approach yields –no centrally located and highly connected “hubs” because their removal makes partitioning the networkeasy.
4This is not a universal phenomena. For instance [84] notes that some networks do exhibit hub-like structure, but it is the lack ofuniversality that is important here, as exhibited by these and other counter examples.

3.2.3 An in-depth look at traceroute:Examining a popular measurement technique
While the above-mentioned empirical, technological, and architectural arguments cast some seriousdoubts on the scale-free network modeling approach for the router topology of the Internet, they saynothing about the measurements that form the basis of this approach and has given it a sense of legit-imacy among scientists in general and networking researchers in particular. To appreciate the full rolethat measurements play in this discussion, it is informative to revisit the original paper by Pansiot andGrad [119] that describes the measurement experiment, discusses the measurement technique used, andprovides a detailed account of the quality of the data that form the basis of the scale-free approach towardsmodeling the Internet’s router topology.
In essence, [119] describes the first (at that time) large-scale traceroute campaign performed forthe main purpose of constructing a router graph of the Internet from actual Internet routes. Althoughtraceroute-based, the authors of [119] quickly point out that their purpose of using the traceroute tool(i.e., obtaining actual Internet routes to construct a router graph) differed from what V. Jacobson [78]had in mind when he originally designed the tool (i.e., tracing a route from a source to a destination fordiagnostic purposes). As a result, a number of serious issues arise that highlight why using the traceroutetechnique for the purpose of constructing a router graph is little more than an "engineering hack" and cancertainly not be called a well-understood "measurement methodology."
IP alias resolution problem: One serious problem explained in detail in [119] with using traceroute-based data for constructing router graphs is that the traceroute tool only returns the IP addresses ofthe interface cards of the routers that the probe packets encountered on their route from the source totheir destination. However, most routers have many interface cards, and despite many years of researchefforts that have produced a series of increasingly sophisticated heuristics [15, 67, 140], the networkingcommunity still lacks rigorous and accurate methods for resolving the IP alias resolution problem; that is,determining whether two different interface IP addresses belong to or can be mapped to the same router.While the essence of this problem is illustrated in Figure 7, the impact it can have when trying to map arouter topology of an actual network is shown in Figure 8.
1 2 1 2
(a) (b)
Fig2
Figure 7: The IP alias resolution problem. Paraphrasing Fig. 4 of [144], traceroute does not list routers (boxes) alongpaths but IP addresses of input interfaces (circles), and alias resolution refers to the correct mapping of interfaces torouters to reveal the actual topology. In the case where interfaces 1 and 2 are aliases, (b) depicts the actual topology while(a) yields an “inflated” topology with more routers and links. (First published in Notices of the American MathematicalSociety, Volume 56, No.3 (May 2009): 586-599 [156]. Included here by permission.)

Actual vs Inferred Node Degrees
0
5
10
15
20
25
0 1 2 3 4 5 6 7 8 9 10 11 12 13 14 15 16 17Node Degree
Cou
nt
actualinferred
actual
inferred
Figure 8: The IP alias resolution problem in practice. Shown is a comparison between the Abilene/Internet2 topologyinferred by Rocketfuel (left) and the actual topology (top right). Rectangles represent routers with interior ovals denotinginterfaces. The histograms of the corresponding node degrees are shown in the bottom right plot. (Reprinted from [141];©2008 ACM. Inc. Included here by permission.)

Lesson 1: Due to the absence of accurate and rigorous methods for solving the IP alias resolutionproblem, the actual values of the connectivity of each router (i.e., node degrees) inferred from traceroutemeasurements cannot be taken at face value.
Opaque Layer-2 clouds: Another serious issue with using generic traceroute-based measurementsfor construction router graphs is also discussed at length in [119] and illustrated in Figure 9. Beingstrictly limited to IP or layer-3, the problem with traceroute is that it is incapable of tracing throughopaque layer-2 clouds that feature circuit technologies such as Asynchronous Transfer Mode (ATM) orMultiprotocol Label Switching (MPLS). These technologies have the explicit and intended purpose ofhiding the network’s physical infrastructure from IP, so from the perspective of traceroute, a network thatruns these technologies will appear to provide direct connectivity between routers that are separated bylocal, regional, national, or even global physical network infrastructures. An example of using tracerouteto map a network that uses MPLS is depicted in Figure 9 and shows an essentially completely connectedgraph at Layer 3 with multiple high-degree nodes, even though the physical router topology is very sparse.Similarly, if traceroute encounters an ATM cloud, it falsely “discovers” a high-degree node that is really alogical entity – often an entire network potentially spanning many hosts or great distances – rather than aphysical node of the Internet’s router-level topology. Donnet et al. [44] found that at least 30% of the pathsthey tested traversed an MPLS tunnel.
Recent extensions of the ICMP protocol, using traceroute to trace through opaque MPLS clouds havebecome technically feasible [16], but operators often configure their routers to hide the MPLS tunnels byturning off this option [142]. Even then it may be possible to detect the MPLS tunnels [44], but the inferencetechniques are not a guarantee, and are quite particular to MPLS, which is not the only technique forcreating tunnels, so there may still be some opaque networks to deal with. More to the point, even wheresuch inferences are possible, most data sets do not contain this type of analysis, and most subsequentanalyses of the data have ignored the issue.
Lesson 2: Due to an inability of the generic traceroute technique to trace through opaque Layer-2 clouds,or understand the connectivity created by Layer-2 devices [104], the inferred high-degree nodes (i.e., routerswith a large number of connections) are typically fictitious, an artifact of an imperfect measurement tool.
Limited vantage points: We have commented earlier that since a router is fundamentally limitedin terms of the number of packets it can process in any time interval, there is an inherent tradeoff inrouter configuration: it can support either a few high-throughput connections or many low-throughputconnections. Thus, for any given router technology, a high-connectivity router in the core reflects a poordesign decision – it will either have poor performance due to its slow connections or be prohibitivelyexpensive relative to other options. Conversely, a good design choice is to deploy cheap high-degree routernear the edge of the network and rely on the very technology that supports easy multiplexing of a largenumber of relatively low-bandwidth links. Unfortunately, neither the original traceroute-based study ofPansiot and Grad [119] nor any of the larger-scale campaigns that were subsequently performed by variousnetwork research groups have the ability to detect those actual high-degree nodes. The simple reasonis that these campaigns lack access to a sufficient number of vantage points (i.e., sources for launchingtraceroute probes and targets) in any local end-system to reveal these actual high connectivity patterns atthe network’s edge.
Lesson 3: If there were high-degree nodes in the network, existing router technology relegates them tothe edge of the network where no generic traceroute-based measurement campaigns is able to detect thembecause of a lack of vantage points nearby.
There are other issues with large-scale traceroute campaigns that impact the quality of the resultingmeasurements and have received some attention in the literature. For example, the use of traceroute hasbeen shown to make experimental data susceptible to a type of measurement bias in which some nodes

(a)
(b)
Fig4
Figure 9: How traceroute detects fictitious high-degree nodes in the network core. (a) The actual connectivity of anopaque layer-2 cloud, i.e., a router-level network running a technology such as ATM or MPLS (left) and the connectivityinferred by traceroute probes entering the network at the marked router (right). (b) The Rocketfuel-inferred backbonetopology of AS3356 (Level3), a Tier-1 Internet service provider and leader in the deployment of MPLS. (Figure (b)reprinted from [144]; ©2002 ACM, Inc. Included here by permission.)

of the network are oversampled, while others are undersampled. However, while this feature has receivedconsiderable attention [1, 91], in the presence of systematic errors due to an inability to perform accurateIP alias resolution or trace through opaque Layer-2 clouds, this work is largely of theoretical interest andof little practical relevance for modeling the Internet’s router topology.
3.2.4 Just the facts: power-law scaling and router-level topologies
When applying lessons 1-3 to the main findings reported in the seminal papers discussed in §3.2.1 we arefaced with the following facts:
Fact 1: A very typical but largely ignored fact about Internet-related measurements in general and tracer-oute measurements in particular is that what we can measure in an Internet-like environmentis generally not the same as what we really want to measure (or what we think we actually mea-sure). This is mainly because as a decentralized and distributed system, the Internet lacks a centralauthority and does not support third-party measurements.
Fact 2: A particularly ironic fact about traceroute is that the high-degree nodes it detects in the networkcore are necessarily fictitious and represent entire opaque layer-2 clouds, and if there are actualhigh-degree nodes in the network, existing technology relegates them to the edge of the networkwhere no generic traceroute-based measurement experiment will ever detect them.
Fact 3: In particular, due to the inherent inability of traceroute to (i) reveal unambiguously the actualconnectivity (i.e., node degree) of any router, and (ii) correctly identify even the mere absenceor presence of high-degree nodes (let alone their actual values), statistical statements such asthose made in [49] claiming that the Internet’s router connectivity is well described by a power-lawdistribution (or, for that case, any other type of distribution) cannot be justified with any reasonabledegree of statistical confidence.
Fact 4: Since historical traceroute-based measurements cannot be taken at face value when (mis)usingthem for inferring router topologies and the inference results obtained from such data cannot betrusted, the claims that have been made about the (router-level) Internet in [5] are without substanceand collapse under careful scrutiny.
In short, after almost 15 years of examining the idiosyncrasies of the traceroute tool, there existsoverwhelming evidence that the sort of generic and raw traceroute measurements that have been used todate to infer the Internet’s router topology are seriously flawed to the point of being essentially of no usefor performing scientifically sound inferences. Yet, the myth that started with [49]; i.e., the router topologyof the Internet exhibits power-law degree distributions persists and continues to be especially popularwith researchers that typically work in the field of network science and show in general little interest indomain-specific "details" such as traceroute’s idiosyncrasies.
At the same time, it is worthwhile pointing out that most of the above-mentioned flaws and shortcom-ings of traceroute-based measurements are neither new nor controversial with networking researchers. Infact, when discussing the use of the traceroute tool as part of their original measurement experiment, theauthors of [119] described many of the issues discussed in this section in great detail and commented onthe possible implications that these inherently traceroute-related issues can have for constructing routergraphs of the Internet. In this sense, [119] is an early example of an exemplary measurement paper, butunfortunately, it has been largely ignored and essentially forgotten. For one, [49], which critically relies onthe data described in [119] for their power law claim for the Internet’s router topology, fails to recognize the

relevance of these issues and does not even comment on them. Moreover, the majority of papers that haveappeared in this area after the publication of [49] typically cite only [49] and don’t even mention [119].
Traceroute-based measurements are not the only approach for obtaining router-level topologies, justthe most commonly presented in the research literature. Network operators can obtain measurements oftheir own networks using much more accurate methods: for instance, from configuration files [52], orusing route monitors [137], but those techniques require privileged access to the network, and so haven’tbeen used widely for research. More recently, the mrinfo tool [109] has been used to measure topologiesusing IGMP (the Internet Group Management Protocol) [105, 120]. IGMP has the advantage that routersthat respond provide much more complete information on their interfaces than those responding totraceroutes (so aliasing is less an issue), but there are still coverage problems created by lack of support, ordeliberate filtering or rate limiting of responses to the protocol [102].
3.3 Network modeling: An exercise in reverse-engineering
The conclusion from the previous section that the available traceroute measurements are of insufficientquality to infer any statistical quantity of the data (including node degree distribution) with sufficientstatistical confidence is a show-stopper for traditional network modeling. Indeed, given that the datacannot be trusted, relying on statistics of unknown accuracy (e.g., by and large arbitrary node degrees)makes model selection precarious, and model validation in the sense of checking if the selected modeldescribes the data “well" is an oxymoron – providing a “good” fit for statistical quantities of unknownaccuracy is meaningless.
As such, the scale-free approach to modeling the Internet’s router topology advanced in [5] is anexample of what can go wrong if serious flaws of the underlying data are ignored and the availablemeasurements are taken at face value. It should therefore come as no surprise that the resulting modelingframework and ensuing claims quickly collapse when scrutinized with readily available domain knowledgeor vetted against alternative and solid sources of information. However, the lessons learned from this ill-fated approach to router topology modeling rises the question: What are viable alternative approaches tomodeling the Internet’s router topology that are by and large independent of the available but problematictraceroute measurements?
3.3.1 Router topology modeling as a constrained optimization problem
Having dismissed traceroute-based data as a source for informing our approach to modeling the Internet’srouter topology, we turn to readily available domain knowledge as critical alternate information source. Tothis end, we focus on the specific problem of modeling the physical infrastructure of a regional, national,or global Internet Service Provider (ISP).
The first key ingredient of this “first-principles” approach is the realization that ISPs design theirphysical infrastructures for a purpose; that is, their decisions are driven by possibly ISP-specific objectivesand reflect trade-offs between what is feasible and what is desirable. While in general it may be difficultif not impossible to define or capture the precise meaning of a particular ISP’s purpose for designing itsnetwork, an objective that expresses a desire to provide connectivity to the rest of the Internet for its endusers and an ability to carry an expected traffic demand efficiently and effectively, subject to prevailingeconomic and technological constraints, is unlikely to be far from the “true” purpose.
The second ingredient concerns the trade-offs an ISP has to made between what is feasible (in termsof available products sold by the different router vendors) and what is desirable (in terms of cost, per-formance, ease-of-management or other criteria for the built-out router topology). In particular, router

technology constraints are a significant force shaping network connectivity at the router-level and, inturn, router topology design. Due to hard physical limits, even the most expensive and highest-capacityrouter models available on the market in any given year operate within a “feasible region" and corre-sponding "efficiency frontier" of possible bandwidth-degree combinations; that is, they can be configuredto either have only a few high-bandwidth connections and perform at their capacity or have many low-bandwidth connections and tolerate a performance hit due to the overhead that results from the increasedconnectivity.
Similarly, economic considerations also affect network connectivity and router topology design. Forexample, the cost of installing and operating physical links in a network can often dominate the cost ofthe overall router infrastructure. In essence, this observation creates enormous practical incentives todesign the physical plant of an ISP so as to keep the number of links small and avoid whenever possiblelong-haul connections due to their high cost. These incentives to share costs via multiplexing impact andare impacted by available router technologies and argue for a design principle for an ISP’s router topologythat favors aggregating traffic at all levels of network hierarchy, from its periphery all the way to its core.
The third and final key ingredient of the proposed first-principle alternative to router topology model-ing is concerned with the role that randomness plays in this approach. Recall that the traditional approachis typically graph theory-based where randomness is explicit and appears in the form of a series of cointosses (using potentially bias coins as in the case of scale-free networks of the preferential attachment type)that determine whether or not two nodes (i.e., routers) are connected by a physical link, irrespective of thetype of routers involved or link considered. In stark contrast, in our approach, randomness enters in a verydifferent and less explicit manner, namely in terms of the uncertainty that exists about the “environment”(i.e., the traffic demand that the network is expected to carry). Moreover, irrespective of the model chosenfor quantifying this uncertainty, the resulting network design is expected to exhibit strong robustnessproperties with respect to changes in this environment.
When combining all three ingredients to formulate an ISP’s router topology design problem, themathematical modeling language that naturally reflects the objectives of an ISP, its need to adhere toexisting technology constraints and respect economic considerations, and its desire to operate effectivelyand efficiently in light of the uncertainly in the environment is constrained optimization. Thus, we havechanged network modeling from an exercise in model fitting into an exercise in reverse-engineering andseek a solution to a constrained optimization problem formulation that captures by and large what the ISPcan afford to build, operate, and manage (i.e., economic considerations), satisfies the hard constraints thattechnology imposes on the network’s physical entities (i.e., routers and links), and is robust to changes inthe expected traffic that is supposed to handle
3.3.2 Heuristically optimal router topologies
In the process of formulating the design of an ISP’s router topology as a constrained optimization problem,we alluded to a synergy that exists between the technological and economic design issues with respect tothe network core and the network edge. The all-important objective to multiplex traffic is supported by thetypes of routers available on the market. In turn, the use of these products re-enforces traffic aggregationeverywhere in the network. Thus, the trade-offs that an ISP has to make between what is technologicallyfeasible versus economically sensible can be expected to yield router topologies where individual linkcapacities tend to increase while the degree of connectivity tends to decrease as one moves from thenetwork edge to its core.
This consistent picture with regard to the forces that by and large govern the built-out and provisioningof an ISP’s router topology and include aspects such as equipment constraints, link costs, and bandwidth

demands suggests that the following type of topology is a reasonably “good” design for a single ISP’sphysical plant: (i) Construct a core as a loose mesh of expensive, high-capacity, low-connectivity routerswhich carry heavily aggregated traffic over high-bandwidth links. (ii) Support this mesh-like core withhierarchical tree-like structures at the edge of the network for the purpose of aggregating traffic fromend users via cheaper, lower-capacity, high-connectivity routers. (iii) Augment the resulting structurewith additional connections at various selectively-chosen places to provide a degree of redundancy androbustness to component failures. The result is a topology that has a more or less pronounced backbone,which is fed by tree-like access networks, with additional links added for redundancy and resilience. Werefer to this design as heuristically optimal to reflect its consistency with real design considerations andcall the resulting "solutions" heuristically optimal topologies, or HOT for short. Note that such HOT modelshave been discussed earlier in the context of highly organized/optimized tolerances/tradeoffs [24, 48].
An important aspect of the proposed HOT models is that even though we have formulated the design ofan ISP’s router topology as a constrained optimization problem that could in principle be solved optimally,we are typically not concerned with a network design that is “optimal” in a strictly mathematical senseand is also likely to be NP-hard. Instead, our interest is in solutions that are “heuristically optimal” inthe sense that they result in “good” performance. The main reason for not pursuing optimal solutionsmore aggressively is the imprecise nature of essentially all ingredients of the constrained optimizationproblem of interest. For one, it is unrealistic to expect that an ISP’s true objective for building out andprovisioning its physical infrastructure can be fully expressed in mathematical terms as an objectivefunction. Furthermore, a bewildering number of different types of routers and connections make itpractically impossible to account for the nuances of the relevant feasible regions or efficiency frontiers.Finally, any stochastic model for describing the expected traffic demand is an approximation of realityor at best based on imprecise forecasts. Given this approximate nature of the underlying constrainedoptimization problem, we seek solutions that captures by and large what the ISP can afford to build,operate, and manage (i.e., economic considerations), satisfy some of the more critical hard constraintsthat technology imposes on the network’s physical entities (i.e., routers and links), and exhibit strongrobustness properties with fluctuations in the expected traffic demands (i.e., insensitivity to changes inthe uncertain environment).
3.3.3 A toy example of a HOT router topology
To illustrate the proposed HOT approach, we use a toy example that is rich enough to highlight the keyingredients of the outlined first-principles methodology and demonstrate its relevance for router topologymodeling as compared to the popular model-fitting approach. It’s toy nature is mainly due to a number ofsimplifying assumptions we make that facilitate the problem formulation. For one, by simply equatingthroughput with revenues, we select as our objective function the maximum throughput that the networkcan achieve for a given traffic demand and use it as a metric for quantifying the performance of oursolutions. Second, considering an arbitrary distribution of end-user traffic demand Bi , we assume agravity model for the unknown traffic demand; that is, assuming shortest-path routing, the demands aregiven by the traffic matrix element xi , j =αBi B j between routers i and j for some constant α. Lastly, weconsider only one type of router and its associated technologically feasible region; that is, (router degree,router capacity)-pairs that are achievable with the considered router type, and implicitly avoid long-haulconnections due to their high cost.
The resulting constrained optimization problem can be written in the form
maxρ
∑xi , j such that AX ≤C , (1)

where X is the vector obtained by stacking all the demands xi , j ; A is the routing matrix obtained by usingstandard shortest path routing and defined by Ak,l = 1 or 0, depending on whether or not demand l passesthrough router k; and C is the vector consisting of the router degree-bandwidths constraints imposed bythe technologically feasible region of the router at hand.
Bi
Bj
xij
jiij BBx ∝
kBxts
BBx
ijrkjikij
ji jijiij
∀≤
=
∑
∑ ∑
∈
,..
maxmax
:,
, ,α
α
(a) (b)
Fig5
maxα
∑i , j
xi j = maxα
α∑i , j
Bi B j
s.t .∑
i , j :k∈ri j
xi j ≤ Ck , ∀k
(a) Optimisation.
Bi
Bj
xij
jiij BBx ∝
kBxts
BBx
ijrkjikij
ji jijiij
∀≤
=
∑
∑ ∑
∈
,..
maxmax
:,
, ,α
α
(a) (b)
Fig5
(b) Result.
Figure 10: Generating networks using constrained optimization. (a) Engineers view network structure as the solution toa design problem that measures performance in terms of the ability to satisfy traffic demand while adhering to nodeand arc capacity constraints. (b) A network resulting from heuristically optimized tradeoffs (HOT). This network hasvery different structural and behavioral properties, even when it has the same number of nodes, links, and degreedistribution as a scale free network shown in Figure 9. (First published in Notices of the American Mathematical Society,Volume 56, No.3 (May 2009): 586-599 [156]. Included here by permission.)
While all the simplifying assumptions can easily be relaxed to allow for more realistic objectivefunctions, more heterogeneity in the constraints, or more accurate descriptions of the uncertainty in theenvironment, Figure 10 illustrates the key characteristics inherent in a heuristically optimal solution ofsuch a problem. First, the cost-effective handling of end user demands avoids long-haul connections (dueto their high cost) and is achieved through traffic aggregation starting at the edge of the network via the useof high-degree routers that support the multiplexing of many low-bandwidth connections. Second, thisaggregated traffic is then sent toward the backbone that consists of the fastest or highest-capacity routers(i.e., having a small number of very high-bandwidth connections) and that forms the network’s mesh-likecore. The result is a network of the form described earlier: a more or less explicit backbone representingthe network core and tree-like access networks surrounding this core, with additional connections asbackup in case of failures or congestion.
The realism of this reverse-engineering approach to router topology modeling is demonstrated inFigure 11 which shows the router topologies of two actual networks – CENIC (circa 2004) and Abeline(circa 2003).
3.3.4 On the (ir)relevance of node degree distributions
The above description of our engineering-based first-principles approach to router topology modelingshows that node degree distributions in general and power low-type node degree distributions in particular
Cisco 750X
Cisco 12008
Cisco 12410
dc1
dc2
dc3
hpr
dc1dc3
hpr
dc2
dc1
dc1 dc2
hpr
hpr
SACOAK
SVL
LAX
SDG
SLOdc1
FRGdc1
FREdc1
BAKdc1
TUSdc1
SOLdc1
CORdc1
hprdc1
dc2
dc3
hpr
OC-3 (155 Mb/s)OC-12 (622 Mb/s)GE (1 Gb/s)OC-48 (2.5 Gb/s)10GE (10 Gb/s)
CENIC Backbone (as of January 2004)
SOX
SFGP/AMPATH
U. Florida
U. So. Florida
Miss StateGigaPoP
WiscREN
SURFNet
Rutgers U.
MANLAN
NorthernCrossroads
Mid-AtlanticCrossroads
Drexel U.
U. Delaware
PSC
NCNI/MCNC
MAGPI
UMD NGIX
DARPABossNet
GEANT
Seattle
Sunnyvale
Los Angeles
Houston
Denver
KansasCity Indian-
apolis
Atlanta
Wash D.C.
Chicago
New York
OARNET
Northern LightsIndiana GigaPoP
MeritU. Louisville
NYSERNet
U. Memphis
Great Plains
OneNetArizona St.
U. Arizona
Qwest Labs
UNM
OregonGigaPoP
Front RangeGigaPoP
Texas Tech
Tulane U.
North TexasGigaPoP
TexasGigaPoP
LaNet
UT Austin
CENIC
UniNet
WIDE
AMES NGIX
OC-3 (155 Mb/s)OC-12 (622 Mb/s)GE (1 Gb/s)OC-48 (2.5 Gb/s)OC-192/10GE (10 Gb/s)
Abilene BackbonePhysical Connectivity(as of December 16, 2003)
PacificNorthwestGigaPoP
U. Hawaii
PacificWave
ESnet
TransPAC/APAN
Iowa St.
Florida A&MUT-SWMed Ctr.
NCSA
MREN
SINet
WPI
StarLight
IntermountainGigaPoP
AbileneLos Angeles
AbileneSunnyvale
Figure 4: CENIC and Abilene networks. (Left): CENIC backbone. The CENIC backbone is comprised of two backbone networks inparallel—a high performance (HPR) network supporting the University of California system and other universities, and the digitalCalifornia (DC) network supporting K-12 educational initiatives and local governments. Connectivity within each POP is providedby Layer-2 technologies, and connectivity to the network edge is not shown. (Right): Abilene network. Each node represents arouter, and each link represents a physical connection between Abilene and another network. End user networks are representedin white, while peer networks (other backbones and exchange points) are represented in gray. Each router has only a few highbandwidth connections, however each physical connection can support many virtual connections that give the appearance of greaterconnectivity to higher levels of the Internet protocol stack. ESnet and GEANT are other backbone networks.
ample, nearly half of all users of the Internet in North Americastill have dial-up connections (generally 56kbps), only about 20%have broadband access (256kbps-6Mbps), and there is only a smallnumber of users with large (10Gbps) bandwidth requirements [5].Again, the cost effective handling of such diverse end user trafficrequires that aggregation take place as close to the edge as possi-ble and is explicitly supported by a common feature that these edgetechnologies have, namely a special ability to support high connec-tivity in order to aggregate end user traffic before sending it towardsthe core. Based on variability in population density, it is not onlyplausible but somewhat expected that there exist a wide variabilityin the network node connectivity.
Thus, a closer look at the technological and economic designissues in the network core and at the network edge provides a con-sistent story with regard to the forces (e.g., market demands, linkcosts, and equipment constraints) that appear to govern the build-out and provisioning of the ISPs’ core networks. The tradeoffs thatan ISP has to make between what is technologically feasible versuseconomically sensible can be expected to yield router-level connec-tivity maps where individual link capacities tend to increase whilethe degree of connectivity tends to decrease as one moves from thenetwork edge to its core. To a first approximation, core routerstend to be fast (have high capacity), but have only a few high-speed connections; and edge routers are typically slower overall,but have many low-speed connections. Put differently, long-haullinks within the core tend to be relatively few in numbers but theircapacity is typically high.
3.3 Heuristically Optimal Networks
The simple technological and economic considerations listed abovesuggest that a reasonably “good” design for a single ISP’s net-work is one in which the core is constructed as a loose mesh ofhigh speed, low connectivity routers which carry heavily aggre-gated traffic over high bandwidth links. Accordingly, this mesh-like core is supported by a hierarchical tree-like structure at theedges whose purpose is to aggregate traffic through high connec-tivity. We will refer to this design asheuristically optimalto reflectits consistency with real design considerations.
As evidence that this heuristic design shares similar qualitativefeatures with the real Internet, we consider the real router-level con-nectivity of the Internet as it exists for the educational networks ofAbilene and CENIC (Figure 4). The Abilene Network is the In-ternet backbone network for higher education, and it is part of theInternet2 initiative [1]. It is comprised of high-speed connectionsbetween core routers located in 11 U.S. cities and carries approxi-mately 1% of all traffic in North America5. The Abilene backboneis a sparsely connected mesh, with connectivity to regional and lo-cal customers provided by some minimal amount of redundancy.Abilene is built using Juniper T640 routers, which are configuredto have anywhere from five connections (in Los Angeles) to twelveconnections (in New York). Abilene maintains peering connections
5Of the approximate 80,000 - 140,000 terabytes per month of traf-fic in 2002 [35], Abilene carried approximately 11,000 terabytes oftotal traffic for the year [27]. Here, “carried” traffic refers to traf-fic that traversed an Abilene router. Since Abilene does not peerwith commercial ISPs, packets that traverse an Abilene router areunlikely to have traversed any portion of the commercial Internet.
Figure 11: CENIC and Abilene networks. (Left): CENIC backbone. The CENIC backbone is comprised of two backbonenetworks in parallel – a high performance (HPR) network supporting the University of California system and otheruniversities, and the digital California (DC) network supporting K-12 educational initiatives and local governments.Connectivity within each POP is provided by Layer-2 technologies, and connectivity to the network edge is not shown.(Right): Abilene network. Each node represents a router, and each link represents a physical connection betweenAbilene and another network. End user networks are represented in white, while peer networks (other backbones andexchange points) are represented in gray. Each router has only a few high bandwidth connections, however each physicalconnection can support many virtual connections that give the appearance of greater connectivity to higher levels ofthe Internet protocol stack. ESnet and GÉANT are other backbone networks. (Reprinted from [93]; ©2004 ACM, Inc.Included here by permission.)

are clearly a non-issue and play no role whatsoever in our formulation of an ISP router topology designas a constrained optimization problem. Thus, we achieved our goal of developing a network modelingapproach that does not rely in any way on the type of measurements that have informed previous networkmodeling approaches but have been shown earlier to be of insufficient quality to be trusted to form thebasis of any scientifically rigorous modeling pursuit.
However, even if the available traceroute measurements could be trusted and taken at face value, thepopular approach to network modeling that views it as an exercise in model fitting is by itself seriouslyflawed, unless it is accompanied by a rigorous validation effort. For example, assuming that the data can betrusted so that a statistic like an inferred node degree distribution is indeed solid and reliable. In this case,who is to say that a proposed model’s ability to match this or any other commonly considered statisticsof the data argues for its validity, which is in essence the argument advanced by traditional approachesthat treat network modeling as an exercise in model fitting? It is well known in the mathematics literaturethat there can be many different graph realizations for any particular node degree sequence and thereare often significant structural differences between graphs having the same degree sequence. Thus, twomodels that match the data equally well with respect to some statistics can still be radically different interms of other properties, their structures, or their functionality. A clear sign of the rather precariouscurrent state of network-related modeling that is rooted in the almost exclusive focus on model fitting isthat the same underlying data set can give rise to very different, but apparently equally “good” models,which in turn can give rise to completely opposite scientific claims and theories concerning one and thesame observed phenomenon. Clearly, network modeling and especially model validation ought to meanmore than being able to match the data if we want to be confident that the results that we derive from ourmodels are relevant in practice.
To illustrate these points, Figure 12 depicts five representative toy networks, constructed explicitlyto have one and the same node degree distribution. This distribution is shown in plot (a) and happensto be the one of our HOT router topology example in Figure 10. While plots (b) and (c) show two scale-free networks constructed according to the preferential attachment method and general random graphmethod, respectively, plots (d)-(f) are three different HOT examples, including our earlier example inFigure 10 (plot (e)) and a sub-optimal or poorly-engineered HOT topology in (f). While the differencesamong these five topologies with identical node degree distributions are already apparent when comparingtheir connectivity structures, they can be further highlighted by considering both a performance-relatedand a connectivity-only topology metric. In particular, the performance-related metric Perf(g) for a givennetwork g is defined as Perf(g) = maxα
∑xi , j s.t. R X ≤C and represents the maximum throughput with
gravity flows of the network g . In contrast, the connectivity-only topology metric S(g) is the networklikelihood of g defined as S(g) =∑
(i , j )∈E(g )ωiω j /smax where ωi denotes the degree of node i , E(g ) is theset of all edges in g , and smax is a normalization constant. For a justification of using the S(g ) metric todifferentiate between random networks having one and the same node degree sequence, we refer to [92].
While computing for each of the five networks their Perf(g)-value is straightforward, evaluating theirnetwork performance requires further care so as to ensure that the different network have the same total“cost", where cost is measured in number of routers. When simultaneously plotting network performanceversus network likelihood for all five networks models in Figure 13, a striking contrast is observed. Thewell-engineered HOT networks (d) and (e) have high performance and low likelihood while the randomdegree-based networks (b) and (c) have high likelihood but low performance. To contrast, network(f) has both low performance and low likelihood and is proof that networks can be designed to havepoor performance. The main reason for the degree-based models to have such poor performance isexactly the presence of the highly connected “hubs” that create low-bandwidth bottlenecks. The two HOTmodels’ mesh-like cores, like real ISP router topologies, aggregate traffic and disperse it across multiple

100
101
100
101
102
degree
rank
Figure 6: Five networks having the same node degree distribution. (a) Common node degree distribution (degree versus rank onlog-log scale); (b) Network resulting from preferential attachment; (c) Network resulting from the GRG method; (d) Heuristicallyoptimal topology; (e) Abilene-inspired topology; (f) Sub-optimally designed topology.
(a) (b) (c)
(d) (e) (f)
100
101
102
103
106
107
108
109
1010
Cumulative Users
Use
r B
andw
idth
(bp
s)
GRGPAHOTAbilenesuboptimal
100
101
10−2
10−1
100
101
102
Degree
Ach
ieve
d B
W (
Gbp
s)
100
101
10−2
10−1
100
101
102
Degree
Ach
ieve
d B
W (
Gbp
s)
100
101
10−2
10−1
100
101
102
Degree
Ach
ieve
d B
W (
Gbp
s)
100
101
10−2
10−1
100
101
102
Degree
Ach
ieve
d B
W (
Gbp
s)
100
101
10−2
10−1
100
101
102
Degree
Ach
ieve
d B
W (
Gbp
s)
Figure 7: (a) Distribution of end user bandwidths; (b) Router utilization for PA network; (c) Router utilization for GRG network;(d) Router utilization for HOT topology; (e) Router utilization for Abilene-inspired topology; (f) Router utilization for sub-optimalnetwork design. The colorscale of a router on each plot differentiates its bandwidth which is consistent with the routers in Figure 6.
(a) (b) (c)
(d) (e) (f)
Figure 12: Five networks having the same node degree distribution. (a) Common node degree distribution (degree versusrank on log-log scale); (b) Network resulting from preferential attachment; (c) Network resulting from the GRG method;(d) Heuristically optimal topology; (e) Abilene-inspired topology; (f) Sub-optimally designed topology. (Reprintedfrom [93]; ©2004 ACM, Inc. Included here by permission.)

high-bandwidth routers.
0 0.2 0.4 0.6 0.8 1
1010
1011
1012 HOT
l(g)=0.05 perf=1.13×10¹²
PA l(g)=0.46 perf=1.19×10¹⁰
Lmax
l(g)=1 perf=1.08×10¹⁰
Per
fom
ance
(bp
s)
Relative Likelihood
sub−optimal l(g)=0.07 perf=1.86×10¹⁰
GRG l(g)=0.65 perf=1.64×10¹⁰
Abilene−inspired l(g)=0.03 perf=3.95×10¹¹
Figure 8: Performance vs. Likelihood for each topology, plusother networks having the same node degree distribution ob-tained by pairwise random rewiring of links.
the real Internet, aggregates traffic and disperses it across multi-ple high-bandwidth routers. We calculate the distribution of enduser bandwidths and router utilization when each network achievesits best performance. Figure 7 (a) shows that the HOT networkcan support users with a wide range of bandwidth requirements,however the PA and GRG models cannot. Figure 7(d) shows thatrouters achieve high utilization in the HOT network, whereas, whenthe high degree “hubs” saturate in the PA and GRG networks, allthe other routers are left under-utilized (Figure 7(b)(c)). The net-works generated by these two degree-based probabilistic methodsare essentially the same in terms of their performance.
Performance vs. Likelihood.A striking contrast is observed bysimultaneously plotting performance versus likelihood for all fivemodels in Figure 8. The HOT network has high performance andlow likelihood while the PA and GRG networks have high like-lihood but low performance. The interpretation of this picture isthat a careful design process explicitly incorporating technologi-cal constraints can yield high-performance topologies, but theseare extremely rare from a probabilistic graph point of view. Incontrast, equivalent power-law degree distribution networks con-structed by generic degree-based probabilistic constructions resultin more likely, but poor-performing topologies. The “most likely”Lmax network (also plotted in Figure 8) has poor performance.
This viewpoint is augmented if one considers the process of pair-wise random degree-preserving rewiring as a means to explore thespace of graphs having the same overall degree distribution. In Fig-ure 8, each point represents a different network obtained by randomrewiring. Despite the fact that all of these graphs have the sameoverall degree distribution, we observe that a large number of thesenetworks have relatively high likelihood and low performance. Allof these graphs, including the PA and GRG networks, are consistentwith the so-called “scale-free” models in the sense that they con-tain highly connected central hubs. The fact that there are very fewhigh performance graphs in this space is an indication that it wouldbe “hard” to find a relatively good design using random rewiring.We also notice that low likelihood itself does not guarantee a highperformance network, as the network in Figure 6(f) shows that itis possible to identify probabilistically rare and poorly performingnetworks. However, based on current evidence, it does appear to bethe case that it is impossible using existing technology to constructa network that is both high performance and high likelihood.
5.2 A Second ExampleFigure 6 shows that graphs having the same node degree distri-
bution can be very different in their structure, particularly when itcomes to the engineering details. What is also true is that the samecore network design can support many different end-user band-width distributions and that by and large, the variability in end-userbandwidth demands determines the variability of the node degreesin the resulting network. To illustrate, consider the simple examplepresented in Figure 9, where the same network core supports differ-ent types of variability in end user bandwidths at the edge (and thusyields different overall node degree distributions). The network inFigure 9(a) provides uniformly high bandwidth to end users; thenetwork in Figure 9(b) supports end user bandwidth demands thatare highly variable; and the network in Figure 9(c) provides uni-formly low bandwidth to end users. Thus, from an engineering per-spective, not only is there not necessarily any implied relationshipbetween a network degree distribution and its core structure, thereis also no implied relationship between a network’s core structureand its overall degree distribution.
6. DISCUSSIONThe examples discussed in this paper provide new insight into
the space of all possible graphs that are of a certain size and are con-strained by common macroscopic statistics, such as a given (powerlaw) node degree distribution. On the one hand, when viewed interms of the (relative) likelihood metric, we observe a dense regionthat avoids the extreme ends of the likelihood axis and is popu-lated by graphs resulting from random generation processes, suchas PA and GRG. Although it is possible to point out details thatare specific to each of these “generic” or “likely” configurations,when viewed under the lens provided by the majority of the cur-rently considered macroscopic statistics, they all look very similarand are difficult to discern. Their network cores contain high con-nectivity hubs that provide a relatively easy way to generate thedesired power law degree distribution. Given this insight, it is notsurprising that theorists who consider probabilistic methods to gen-erate graphs with power-law node degree distributions and rely onstatistical descriptions of global graph properties “discover” struc-tures that are hallmarks of the degree-based models.
However, the story changes drastically when we consider net-work performance as a second dimension and represent the graphsas points in the likelihood-performance plane. The “generic” or“likely” graphs that make up much of the total configuration spacehave such bad performance as to make it completely unrealistic thatthey could reasonably represent a highly engineered system like anISP or the Internet as a whole. In contrast, we observe that evensimple heuristically designed and optimized models that reconcilethe tradeoffs between link costs, router constraints, and user trafficdemand result in configurations that have high performance and ef-ficiency. At the same time, these designs are highly “non-generic”and “extremely unlikely” to be obtained by any random graph gen-eration method. However, they are also “fragile” in the sense thateven a small amount of random rewiring destroys their highly de-signed features and results in poor performance and loss in effi-ciency. Clearly, this is not surprising—one should not expect tobe able to randomly rewire the Internet’s router-level connectivitygraph and maintain a high performance network!
One important feature of network design that has not been ad-dressed here isrobustnessof the network to the failure of nodes orlinks. Although previous discussions of robustness have featuredprominently in the literature [4, 42], we have chosen to focus onthe story related to performance and likelihood, which we believe
Figure 13: Performance vs. likelihood for each of the topologies in Figure 12, plus other networks (grey dots) having thesame node degree distribution obtained by pairwise random rewiring of links. (Reprinted from [93]; ©2004 ACM, Inc.Included here by permission.)
The interpretation of this picture is that a careful design process explicitly incorporating technologicalconstraints can yield high-performance topologies, but these are extremely rare from a probabilisticgraph point of view. In contrast, equivalent scale-free networks constructed by generic degree-basedprobabilistic constructions result in more likely, but poorly-performing topologies. Consistent withthis, the “most likely” network (included in Figure 13) has also sub-par performance. This picture canbe further enhanced when considering alternative performance measures such as the distribution ofend user bandwidths and router utilization. As detailed in [93], the heuristically optimal networks (d)and (e) achieve high utilization in their core routers and support a wide range of end-user bandwidthrequirements. In contrast, the random degree-based networks (b) and (c) saturate only their “hub” nodesand leave all other routers severely underutilized, thus providing uniformly low bandwidth and poorperformance to their end-users. A main lesson from this comparison of five different networks withidentical node degree distributions for network modeling is that functionality (e.g., performance) trumpsstructure (e.g., connectivity). That is, connectivity-only metrics are weak discriminators among all graphof a given size with the same node degree distribution, and it requires appropriate performance-relatedmetrics to separate "the wheat from the chaff."
We explained earlier that on the basis of currently available traceroute measurements, claims ofpower-law relationships have no substance as far as the Internet’s router topology is concerned. How-ever, by examining available router technologies and models, we have also shown that it is certainlyconceivable that the actual node degrees of deployed routers in an actual ISP can span a range of 2-3

orders of magnitude; that is, the corresponding node degree distribution exhibits high variability, withoutnecessarily conforming to a power law-type distribution. At the same time, Figure 12 illustrates thatirrespective of the type of node degree distribution, graphs with identical node degree distributions canbe very different in their structure and differ even more drastically in terms of their functionality (e.g.,performance). What is also true is that the same core network design can support many different end-userbandwidth distributions and that by and large, the variability in end-user bandwidth demands determinesthe variability of the node degrees in the resulting network. To illustrate, consider the simple examplepresented in Figure 14, where the same network core supports different types of variability in end userbandwidths at the edge (and thus yields different overall node degree distributions). The network inFigure 14(a) provides uniformly high bandwidth to end users; the network in Figure 14(b) supports enduser bandwidth demands that are highly variable; and the network in Figure 14(c) provides uniformlylow bandwidth to end users. Thus, from an engineering perspective, not only is there not necessarily anyimplied relationship between a network node degree distribution and its core structure, there is also noimplied relationship between a network’s core structure and its overall degree distribution.
Thus, the proposed engineering-based first-principles approach to modeling the Internet router topol-ogy demystifies power law-type node degree distributions altogether by identifying its root cause in theform of high variability in end-user bandwidth demands. In view of such a simple physical explanation ofthe origins of node degree variability in the Internet’s router-level topology, Strogatz’ question, paraphras-ing Shakespeare’s Macbeth, “... power-law scaling, full of sound and fury, signifying nothing?” [145] has aresounding affirmative answer.
3.4 A look ahead
Late in the last century, when router-level topology modeling started to turn into a measurement-drivenresearch activity, the conventional wisdom was to start with traceroute-based measurements, use them toinfer router-level connectivity, and argue for the validity of a proposed model if it faithfully reproducescertain statistics of the inferred connectivity structure (e.g., node degree distribution). However, the lastdecade of Internet topology research has shown that this traditional and widely-used approach to router-
100 101 102100
101
102
Node Degree
No
de
Ran
k
10 0 10 1 10 2 10 3105
106
107
108
109
1010
Cumulative Users
Use
r B
and
wid
th (
bp
s)
100 101 102100
101
102
Node Degree
No
de
Ran
k
10 0 101 102 103105
106
107
108
109
1010
Use
r B
and
wid
th (
bp
s)
Cumulative Users10 0 10 1 10 2100
101
102
No
de
Ran
k
Node Degree100 101 102 103 104 105105
106
107
108
109
1010
Use
r B
and
wid
th (
bp
s)
Cumulative Users
Figure 9: Distribution of node degree and end-user bandwidths for several topologies having the same core structure: (a) uniformlyhigh bandwidth end users, (b) highly variable bandwidth end users, (c) uniformly low bandwidth end users.
(a) (b) (c)
is both simpler and more revealing. While there is nothing aboutour first-principles approach that precludes the incorporation of ro-bustness, doing so would require carefully addressing the network-specific issues related to the design of the Internet. For example,robustness should be defined in terms of impact on network per-formance, it should be consistent with the various economic andtechnological constraints at work, and it should explicitly includethe network-specific features that yield robustness in the real Inter-net (e.g., component redundancy and feedback control in IP rout-ing). Simplistic graph theoretic notions of connected clusters [4]or resilience [42], while perhaps interesting, are inadequate in ad-dressing the features that matter for the real network.
These findings seem to suggest that the proposed first-principlesapproach together with its implications is so immediate, especiallyfrom a networking perspective, that it is not worth documenting.But why then is the networking literature on generating, validat-ing, and understanding network designs dominated by generativemodels that favor randomness over design and “discover” struc-tures that should be fully expected to arise from these probabilisticmodels in the first place, requiring no special explanation? We be-lieve the answer to this question lies in the absence of a concretemethodological approach for understanding and evaluating struc-tures like the Internet’s router-level topology. Building on [12, 48],this work presents such an approach and illustrates it with alternatemodels that represent a clear paradigm shift in terms of identifyingand explaining the cause-effect relationships present in large-scale,engineered graph structures.
Another criticism that can be leveled against the approach pre-sented in this paper is the almost exclusive use of toy models andonly a very limited reliance on actual router-level graphs (e.g., basedon, say, Mercator-, Skitter-, or Rocketfuel-derived data). However,as illustrated, our toy models are sufficiently rich to bring out someof the key aspects of our first-principles approach. Despite theircartoon nature, they support a very clear message, namely that ef-forts to develop better degree-based network generators are suspect,mainly because of their inherent inability to populate the upper-left corner in the likelihood-performance plane, where Internet-likerouter-level models have to reside in order to achieve an acceptablelevel of performance. At the same time, the considered toy modelsare sufficiently simple to visually depict their “non-generic” de-sign, enable a direct comparison with their random counterparts,and explain the all-important tradeoff between likelihood and per-formance. While experimenting with actual router-level graphs willbe an important aspect of future work, inferring accurate router-level graphs and annotating them with actual link and node capaci-
ties defines a research topic in itself, despite the significant progressthat has recently been made in this area by projects such as Rock-etfuel, Skitter, or Mercator.
Any work on Internet topology generation and evaluation runsthe danger of being viewed as incomplete and/or too preliminary ifit does not deliver the “ultimate” product, i.e., a topology generator.In this respect, our work is not different, but for a good reason. Asa methodology paper, it opens up a new line of research in identify-ing causal forces that are either currently at work in shaping large-scale network properties or could play a critical role in determiningthe lay-out of future networks. This aspect of the work requiresclose collaboration with and feedback from network engineers, forwhom the whole approach seems obvious. At the same time, thepaper outlines an approach that is largely orthogonal to the existingliterature and can only benefit from constructive feedback from theresearch community. In either case, we hope it forms the basis fora fruitful dialogue between networking researchers and practition-ers, after which the development of a radically different topologygenerator looms as an important open research problem.
Finally, we do not claim that the results obtained for the router-level topology of (parts of) the Internet pertain to logical or vir-tual networks defined on top of the physical infrastructure at higherlayers of the protocol stack where physical constraints tend to playless of a role, or no role at all (e.g., AS graph, Web graph, P2Pnetworks). Nor do we suggest that they apply directly to networksconstructed from fundamentally different technologies (e.g., sen-sor networks). However, even for these cases, we believe thatmethodologies that explicitly account for relevant technological,economic, or other key aspects can provide similar insight intowhat matters when designing, understanding, or evaluating the cor-responding topologies.
AcknowledgmentsReiko Tanaka assisted in the preparation of an early version of thiswork. We are indebted to Matt Roughan, Ramesh Govindan, andSteven Low for detailed discussions of router-level topologies andtraffic modeling, Stanislav Shalunov for data on the Abilene net-work, and Heather Sherman for help with the CENIC backbone.
7. REFERENCES[1] Abilene Network. Detailed information about the objectives,
organization, and development of the Abilene network areavailable from http://www.internet2.edu/abilene.
[2] W. Aiello, F. Chung, and L. Lu. A Random Graph Model forMassive Graphs.Proc. STOC 2000.
Figure 14: Distribution of node degree and end-user bandwidths for several topologies having the same core structure:(a) uniformly high bandwidth end users, (b) highly variable bandwidth end users, (c) uniformly low bandwidth endusers. (Reprinted from [93]; ©2004 ACM, Inc. Included here by permission.)
topology modeling is flawed in more than one way, and we have collected and presented this graduallyaccumulating evidence in this section – the underlying measurements are highly ambiguous (§3.2), theinferred connectivity structures are erroneous (§3.3), and the resulting models are infeasible and/or donot make sense from an engineering perspective because they are either too costly, have extremely poorperformance, or cannot be built with from existing technology in the first place.
This section also describes and reports on an alternative design-based approach to router-leveltopology modeling and generation that has come into focus during the last 5-10 years and represents aclean break with tradition. The most visible sign of this break is the emergence of constrained optimizationas new modeling language, essentially replacing the traditional language of random graph theory. Whilethe latter treats nodes and links as largely generic objects and focuses almost exclusively on structuralaspects such as connectivity, the former supports a much richer treatment of topologies – nodes andlinks are components with their own structure, constraints, and functionality, and their assembly into atopology that is supposed to achieve a certain overall objective and should do so efficiently and effectivelywithin the given constraints on the individual components or the system as a whole is the essence of theconstrained optimization-based network design approach. In essence, this approach echoes what wasarticulated some 15 years ago in [23, 42, 165], but it goes beyond this prior work in terms of empiricalevidence, problem formulation, and solution approach. As a result, the described design-based approachhas by and large put an end to graph theory-based router topology modeling for the Internet.
At the same time, the design-based approach that has been developed and reported in bits and piecesin the existing literature and is presented in this section for the benefit of the reader in one piece has alsofar-reaching implications for Internet topology research in general and router-level topology modeling,analysis, and generation in particular. For one, it shows the largely superficial nature of router-leveltopology generators that are based on graph-theoretic models. As appealing as they may be to a userbecause of their simplicity (after all, all a user has to specify is in general the size of the graph), they are byand large of no use for any real application where details like traffic, routing, capacities, or functionalitymatter.
Second, while the design-based approach yields realistic router-level topology models that are inher-ently generative in nature, it puts at the same time an end to the popular request for a largely genericblack-box-type topology generator. Users in real need for synthetic router-level maps have to recognizethat this need doesn’t come for free. Instead, it comes with the responsibility to provide detailed inputin terms of expected customers – their geographic dispersion, and the traffic matrix (see [150] for moredetails) – design objectives and constraints, etc. In addition, the level of detail required of a generatedISP router-level topology (e.g., POP-, router-, interface card-level) depends critically on and cannot beseparated from the purpose for which these generated maps will be used. Again, this puts a considerableburden on the user of a synthetically generated map and tests her understanding of the relevant issues toa degree unheard of in Internet topology modeling in the past.
Third, the explicit focus of the design-based approach on ISPs as crucial decision makers rendersthe commonly-expressed desire for synthetic router-level maps of the global Internet largely pointless.The Internet is a network of networks, with the sovereign entities being the autonomous systems (ASes).A subset of these ASes that are in the business of providing network service to other ASes or Internetaccess to end users are owning and operating their networks that together make up much of the physicalinfrastructure of the global Internet. As a result, a key first step in understanding the structure andtemporal evolution of the Internet at the different physical and logical layers is to study the physicalinfrastructures of the service and access providers’ networks and how they react in response to changes inthe environment, technology, economy, etc.
Finally, once we have a more-or-less complete picture of the router-level topology for the individual

ISPs, we can start interconnecting them at common locations, thereby bringing ISP router-level andAS-level topology under one umbrella. In the process, it will be critical to collapse the detailed router-leveltopologies into their corresponding PoP-level maps which are essentially the geographic maps mentionedin the context of the ARPANET in §3.1 and serve as glue between the detailed router-level topologies andan appropriately defined and constructed AS-level topology of the Internet. For a faithful and realisticmodeling of this combined router-, POP-, and AS-level structure of the Internet, it will be important toaccount for the rich structure that exists in support of network interconnections in practice. This structureincludes features such as third-party colocation facilities that house the PoPs of multiple ASes in oneand the same physical building. It also includes components of the Internet’s infrastructure such asInternet eXchange Points (IXPs). This existing structure is inherently non-random but is a reflection ofthe incentives that exist, on the one hand, for network and access providers to build, manage, and evolvetheir physical infrastructures and, on the other hand, for content providers, CDNs, and cloud providers toestablish peering relationships with interested parties. Importantly, neither such structures nor incentivesprecludes an application of the described constrained optimization-based approach to network design;they merely require being creative with respect to formulating a proper objective function, identifying thenature of the most critical constraints, and being able to pinpoint the main sources of uncertainty in theenvironment.
3.5 NotesThe primary sources for the material presented in this section are:
[93] L. Li, D. Alderson, J.C. Doyle and W. Willinger. A first principles approach to understanding theInternet’s router-level topology, Proc. ACM SIGCOMM’04, ACM Computer Communication Review34(4), 2004.
[46] J. C. Doyle, D. L. Alderson, L. Li, S. Low, M. Roughan, S. Shalunov, R. Tanaka, and W. Willinger. The"robust yet fragile" nature of the Internet, PNAS 102(41), 2005.
[156] W. Willinger, D. Alderson, and J.C. Doyle. Mathematics and the Internet: A Source of EnormousConfusion and Great Potential, Notices of the AMS 56(5), 2009.
An excellent short treatment of the discussion in § 3.3 about network modeling as an exercise inreverse-engineering vs. as an exercise in model fitting can be found in Chapter 10 of the recent book
[29] M. Chiang. Networked Life: 20 Questions and Answers. Cambridge University Press, 2012.
For additional and more in-depth reading materials we point to
[7] Alderson, D., Li, L., Willinger, W., and Doyle, J.C. Understanding Internet Topology: Principles,Models, and Validation, IEEE/ACM Transactions on Networking 13(6): 1205-1218, 2005.
[85] B. Krishnamurthy and W. Willinger. What are our standards for validation of measurement-basednetworking research? Computer Communications 34, 2011.
For some "food for thought" regarding topics such as power law distributions and scale-free networks,and network science, we recommend
[157] W. Willinger, D. Alderson, J.C. Doyle, and L. Li. More “normal” than normal: Scaling distributionsand complex systems. In: R.G. Ingalls, M.D. Rossetti, J.S. Smith, and B.A. Peters (Editors). IEEE. Proc.of the 2004 Winter Simulation Conference, Piscataway, NJ, 2004.

[106] M. Mitzenmacher. A Brief History of Generative Models for Power Law and Lognormal Distributions,Internet Mathematics 1(2):226-251, 2004.
[82] E. Fox Keller. Revisiting “scale-free” networks, BioEssays 27(1)):1060-1068, 2005.
[11] A.-L. Barabasi. Scale-free Networks: A Decade and Beyond, Science 325, 2009.
[12] A.-L. Barabasi. The network takeover, Nature Physics 8, pp. 14-16, 2012.
[107] M. Mitzenmacher. Editorial: The Future of Power Law Research. Internet Mathematics, vol. 2. no. 4,pp. 525-534, 2006.
4 AS-level topology
When trying to establish a precise meaning or interpretation of the use of “Internet topology,” in muchof the existing literature, we find that the phrase has often been taken to mean a virtual construct orgraph created by the Border Gateway Protocol (BGP) routing protocol. Commonly referred to as theinter-domain or Autonomous-System (AS) topology — named after the logical blocks (ASes) that are usedin BGP to designate the origin and path of routing announcements — it is this particular connectivitystructure that we focus on in this section, though we will see that the notion of the AS-topology is moreslippery than commonly imagined. In particular, we will discuss some of the main issues that arise in thecontext of studying the Internet’s AS topology (ranging from proper definitions and interpretations of thisconstruct to measurements) and focus less on modeling-related aspects as they are still in their infancy,especially when compared to the advances in router-topology modeling described in §3.
4.1 A look back
As far as we know, the first researchers to use BGP-based measurements in the form of route monitor datafor topology-related work were Govindan and Reddy [60], who introduced the notion of the inter-domaintopology defined as “the graph of domains and the inter-domain peering relationships.” However, althoughthey were quite specific in regard to being interested in routing, the concept was reused when Faloutsos etal. [49] coined the term “Internet topology”, a paper that is more widely cited (at least outside of thenetwork research literature) than [60]. The paper [49] is responsible for advancing the alluring notion thatthe inter-domain topology of the Internet is a well-defined object and can be accurately obtained andreconstructed from the available BGP route monitor data. As we shall see, this is not at all the case, and ithas fed into a large subsequent scientific literature, already discussed earlier, e.g., [13, 161].
The problems lie in the very definitions of the AS-topology and the measurements that have beenused to study this topology (we return to the measurements in §4.2 below). In terms of definitions, inthe context of the AS-level Internet, it is tempting to simply equate a node with an AS, but this begs thequestion what an AS really is. The term refers formally to the AS number (ASN) allocated by IANA (InternetAssigned Numbers Authority) or the Regional Internet Registries (RIRs). An ASN is tendered to enablerouting using BGP. This is not equivalent to the popular view that associates an AS with a set of routersthat appear to the outside as if they formed a single coherent system with a 1:1 mapping between it andsome administering company.
For instance, an organization may often own a router which has at least one interface IP addressbelonging to another organization. In fact, many point-to-point IP links occur across a “/30” subnet.When the link joins two networks, this subnet must be allocated from the IP blocks of one or the other

connecting network, and so most such connections result in IP addresses from neighboring ASes appearinglocally.
Another problem arises from the fact that although an AS is often considered to correspond to a singletechnical administrative domain, i.e., a network run by one organization, it is common practice for asingle organization to manage multiple ASes, each with their own ASN [22]. For instance, Verizon Business(formerly known as UUNET) uses ASNs 701, 702, 703 to separate its E-BGP network into three geographicregions, but runs a single IGP instance throughout its whole network. In terms of defining nodes of agraph, these three networks are all under the same operational administrative control, and hence shouldbe viewed as a single node. On the other hand, as far as ASNs are concerned, they are different and shouldbe treated as three separate nodes. The situation is actually more complex since corporations like VerizonBusiness own some 200+ ASNs [22] (not all are actually used, though). In many of these cases, a clearboundary between these multiple ASes may not really exist, thus blurring the definition of the meaning ofa node in an AS graph. Similar problems can arise when a single AS is managed by multiple administrativeauthorities which consist of individuals from different corporations. For example, AS 2914 is run partiallyby NTT/America and partially by NTT/Asia.
All this presumes that an AS is a uniform, contiguous entity, but that is not necessarily true [110, 111].An AS may very well announce different sets of prefixes at different exit points of its network, or use BGPto balance traffic across overloaded links (other reasons for heterogeneous configurations are reportedin [21]). Figure 15 illustrates the problem. The AS-graph simplifies, in some cases grossly, the verycomplicated structure of the entities involved, which are often heterogeneous, and not necessarily evencontiguous either geographically or logically.
For all these reasons, it should be clear that modeling an AS as a single atomic node without internal(or external) structure is overly simplistic for most practical problems. Moreover, these issues cannotsimply be addressed by moving towards graph representations that can account for some internal nodestructure (such as in [110]), mainly because BGP is unlikely to reveal sufficient information to infer theinternal structure for the purpose of faithful modeling.
Moreover, the AS-graph treats ASes as nodes, with connecting edges, but the real situation is muchmore complex. ASes are complex networks in their own right, and are connected sometimes by multipleedges (Mérindol et al. [105] found that over half of the ASes they studied were connected by multiple links),and sometimes through Internet eXchange Points (IXPs) that connect multiple ASes. In fact, the traditionalapproach of modeling the AS-level Internet as a simple connected di-graph is an abstraction incapable ofcapturing important facets of the rich semantics of real-world inter-AS relationships, including differentinterconnections for different policies and/or different interconnection points [110,111]. The implicationsof such abstractions need to be recognized before attributing network-specific meaning to findings derivedfrom the resulting models.
4.2 Know your measurements
In studying the AS-level Internet, there are some critical differences compared to looking at the router-levelInternet:
• No-one “owns” the AS structure. There isn’t anyone with the type of privileged view that a networkoperator has of its own network. There are tens of thousands of ASes, and so we can’t reasonablyexpect to consult all of them to collate a picture either.
• ASes are not “nodes”. They are complex in their own right, so viewing the AS-level Internet as anAS-graph is a big abstraction of reality.

(a) A simple section of the “AS-graph”.
IXP
(b) A possible picture of the router-level connectivity.
Figure 15: An illustration of the obfuscation of the AS-graph (in the vein of [61]). The graph may appear simple, buthides heterogeneous, non-atomic, dis-contiguous entities and interconnects. At the minimum, this should illustrate thedangers of talking about the “Internet” graph.
• Routing between ASes is very different from routing within ASes and highlights the differencebetween graph representations that reflect “reachability" vs. “connectivity" information.
These differences create interesting problems and opportunities for measurements, some with paral-lels to the router-level measurement problems and others without any such parallels.
4.2.1 Data-plane vs. control-plane measurements
As discussed in §3.2, despite all its deficiencies, traceroute has been the method-of-choice for obtainingrouter-level measurements. As a prime example of an active measurement tool that is confined to thedata plane (i.e., probe packets take the same paths as generic data packets), traceroute has also been usedto obtain information about the AS topology but has additional problems in this domain.
Apart from the already problematic issues (e.g., load-balancing, aliasing, missing data), IP addressesalong traceroute paths must now be mapped to ASes. This mapping is even harder than the mappingto routers, not just because the data for doing so is inaccurate or incomplete (e.g., IP to organizationallocations may not work because an organization does not directly correspond to an AS), but also becausethe border of an AS is not well-defined in terms of IP addresses. It is common for a link between twoASes to come from a subnet allocated by one of the ASes, resulting in an interface in the other networkwith an address that is not its own [100, 101]. The problem is further complicated by variations such asanycast or Multiple Origin ASes [167], which provide yet another set of counter-examples to a straight-forward mapping between AS and address space. Some work has concentrated on trying to improve

the mapping [120], and these represent technical advances, but it is important to understand that thefundamental difficultly lies in the fact that the boundaries of the “business” are not equivalent to the ASboundaries.
The other major alternative to obtaining information about the AS topology is to collect control planedata in the form of directly measured routing information. The primary example of such control planedata are BGP-derived measurements. BGP is a path-vector routing protocol, and as such each nodetransmits to its neighbors information about the best path that it knows to a destination. Each node thentakes the information it has received about best paths, and computes its own best path, which it transmitsto its neighbors. A route monitor receives this information as would any router, and from the transmittedpath information, can infer links between ASes. The two best known projects that rely on BGP routemonitors, Oregon RouteViews [118], and RIPE (Réseaux IP Européens)’s Routing Information Service [131]both use this approach, and each connects to a few dozen different ASes.
However, by its very design, BGP is an information-hiding rather than an information-revealing routingprotocol. In addition, by its very design, BGP is all about reachability and not connectivity. Using it formapping the Internet inter-domain topology is a “hack”, and so it should come as no surprise that it hasits own set of problems, including the following:
• The AS-path information in the announcements is primarily included for loop detection and doesnot have to correspond to reality. It is easy (and not uncommon) to insert additional ASes into a pathfor various purposes, e.g., traffic engineering or measurement [21, 35], and moreover, the AS-pathdoes not have to represent the data path.
• Path-vector protocols do not transmit information on every path in the network. For instance,backup paths may never appear in any routing announcements (unless there is a failure), and somay not be seen by a route monitor.
• Path-vector protocols only transmit “best” paths, and so there is a large loss of visibility from anyone viewpoint. It is sometimes argued that a large number of viewpoints would alleviate this, butthe viewpoint locations are highly biased towards larger networks, and this known “vantage pointproblem" severely biases the possible views of the network [134].
The BGP measurement data being provided by RIPE and RouteViews was originally intended to helpdebug networks, not for mapping. While this data collections have been invaluable for that intendedoriginal purpose, it is unsurprising that it is inadequate when used for a rather different purpose suchas mapping the AS Internet. However, when this aspect is carefully taken into account, good work canbe done but requires a critical evaluation of the data. Problems arise primarily when this data is useduncritically. Other useful sources of AS-level measurements such as looking glass servers and routeregistries suffer from similar problems [69, 96], and do so for similar reasons: they weren’t intended todraw a map of the AS Internet.
4.2.2 Attribute discovery
The AS topology may be interesting to scientists in itself, but to be useful to network engineers, therouting policies that accompany it should also be known. It has been common to approximate the rangeof policies between ASes by a simple set of three relationships: (a) customer-provider, (b) peer-peer,and (c) siblings. This reduction was at least in part motivated by Huston [72, 73] and has been used invarious places [146, 153, 159]. While many relationships fall into these three categories, there are frequentexceptions [75, 110, 126], for instance, in the form of partial transit in a particular region [115, 163].

Forgetting for the moment the simplification in assuming all policies fit this model and the sim-plifications the AS-graph itself makes, the relationships can be represented in the graph by providingsimple labels for each edge. Typically, the next step after inferring network topology is to infer policiesbetween ASes. The most common approach to this problem is to assume the universality of the peer-peer,customer-provider, sibling-sibling model, and to infer the policies by finding an allocation of policiesconsistent with the observed routing [14, 41, 56, 153, 159].
Once relationships are established, a seemingly reasonable next step is to estimate the hierarchicalstructure as in [146]. However, the effect of large numbers of (biased) missing links has not really beenconsidered in these algorithms. In fact, the tier structure of the Internet seems to be largely an illusion.Recent work has shown that there is little value in the model at present [58, 88]; but, in contrast to theclaims of these papers, there is no strong evidence that the situation has actually changed or that the tiermodel was ever a good model (except maybe in the early stage of the “public" Internet in the latter 20thcentury) particularly in light of the problems in the data.
Alternatively, we can infer a generic set of policies consistent with routing observations using a moredetailed set of routing measurements [98, 110] and estimate performance by comparing predicted routesto real routes (held back from the inference process).
4.2.3 The “missing link" problem: Extent and impact
Perhaps the most obvious problem that results from relying on BGP measurement data to map the AS-level Internet is that there are many missing links in the resulting AS-graph. To illustrate the extent ofthis problem, years of concentrated research efforts that relied on a combination of improved inferencemethods and additional data sources [9,27,28,39,41,69,70,110,117,134,136,166] have produced a pictureof the Internet’s AS topology that — as of 2011 — consisted of some 35,000-40,000 ASes (nodes) and about115,000-135,000 edges (AS links), with about 80,000-90,000 of them being of the customer-provider typeand 35,000-45,000 of the peer-peer type.
More recently, this supposedly up-to-date and most complete view of the AS-level Internet changeddrastically thanks to [2] that relied on ground truth data from one of the largest IXPs in Europe (andworldwide) that had at the time of this study almost 400 member ASes. The main finding of this recentstudy is that in this single location, the number of actively used AS links of the peer-peer type was morethe 50,000 — larger than the number of all AS links of the peer-peer type in the entire Internet known asof 2011. Moreover, being extremely conservative when extrapolating from this IXP to the Internet as awhole, [2] shows that there are easily more than 200,000 AS links of the peer-peer type in the entire Internet,more than twice the number of all AS links of the customer-provider type Internet-wide. Importantly, themain reason for this abundance of AS links of the peer-peer type at IXPs is well understood — many IXPs,especially the larger ones, offer as free service to their member ASes the use of their route server. Thisservice greatly facilitates the establishment of peer-peer links between the members of an IXP and hasbecome enormously popular with members that have an “open" (as compared to restrictive or selective)peering policy. Especially for the larger IXPs, such networks typically constitute the vast majority of IXPmember ASes. Figure 16 provides an illustration of the connectivity through this IXP and shows that amajority of its member ASes have an open peering policy (some 300+ members) and establish AS links ofthe peer-peer type with one another.
In short, for many years, researchers have worked with AS-graphs that are typically complete interms of nodes, but easily miss more than half the edges. Importantly, these graphs have generally a2:1 ratio of customer-provider type vs. peer-peer type links when a 1:3 ratio is much more likely toreflect Internet reality. Clearly, for gaining any economic-based understanding of the AS Internet, getting
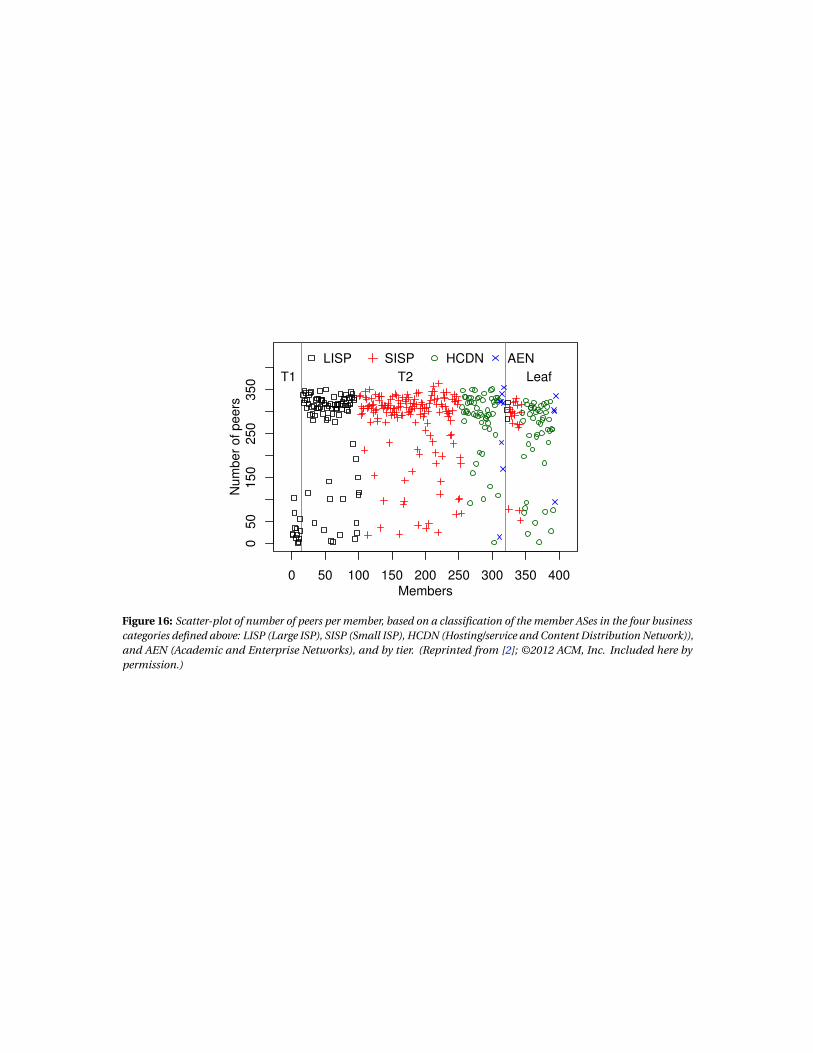
A
c.
ne
t.
A
cce
ss
C
on
ne
ct.
C
on
ten
t
H
ost
S
erv
ice
Tra
nsit
C
DN
E
nt.
ne
t.
Mo
nito
r
Pe
rce
nta
ge
of
me
mb
ers
0
10
20
30
40
50
60
70
(a) AS classification by business types.
0 50 100 150 200 250 300 350 400
05
01
50
25
03
50
Members
Nu
mb
er
of
pe
ers
T1 T2 Leaf
LISP SISP HCDN AEN
(b) Scatter-plot of num. of peers per member.
0 20 40 60 80 100
0.0
0.2
0.4
0.6
0.8
1.0
Percentage of HTTP/HTTPS traffic (bytes)
CD
F o
f m
em
be
rs
Total
LISP
SISP
HCDN
AEN
(c) Fractions of web-traffic across members.
Figure 4: Diversity in members: business type, number of peerings, and application mix exemplified by web-traffic.
AEN. Based on this classification, we find that in the LISP group,the member ASes with a small number of peerings are the tier-1ISPs and those ISPs with a selective peering policy. In the HCDNgroup, the networks with a few peerings include some of the largeplayers, but also small hosting providers (e.g., for banks or onlinegames). The picture is less clear for the SISP group. In general, theobserved large number of member ASes that have a large numberof peers at this IXP is testimony for the ease with which memberASes can peer at this (and other) IXP. In fact, the findings of a recentsurvey [50] provide compelling reasons – some 99 % of the surveyedpeerings were a result of “handshake” agreements (with symmetricterms) rather than formal contracts, and an apparent prevalence ofmulti-lateral peering agreements; that is, the exchange of customerroutes within groups of more than two parties.
4.3 TrafficThe contributions to the IXP’s overall traffic by the individual
member ASes is highly skewed, with the top 30 % of member ASescontributing close to 90 % of the overall IXP traffic. Examiningin more detail the traffic volume that each member AS contributesto the IXP’s overall traffic, we first investigate what role the trafficexchange ratio plays in establishing P-P links. To this end, weconsider the traffic asymmetry across all peerings between any twomember ASes and show in Figure 5(a) the empirical cumulativeprobability distribution of this asymmetry. For improved readabilitywe only show the part of the curve for ratios up to 100:1 (75 % of allpeerings). The figure reveals a high variability in terms of exchangedtraffic between the two member ASes of a peering. Indeed, only27 % of the links have a traffic ratio of up to 3:1 (see support lines),where a 3:1 ratio is often stated as a typical requirement in commonformal peering agreements [35]. Moreover, for 8 % of the peeringsthe ratio exceeds 100:1, and for another 17 % we observe traffic inonly one direction. Figure 5(a) also depicts the empirical cumulativeprobability distribution for the P-P links at this IXP involving onlytier-1 ISPs and shows that these peerings are less asymmetric, withmore than 33 % of them having a ratio below 3:1.
Figure 5(b) shows the traffic asymmetry of the member ASes(i.e., the ratio of outgoing bytes vs. incoming bytes of a givenmember AS). The traffic of 52 % of the member ASes is more orless symmetric and within the range of 1:3 to 3:1. However, asignificant number of member ASes fall in the 3:20 to 20:3 range5.In agreement with expectations, HCDNs have more outgoing than
5To illustrate, if we had a member AS that would only delivercontent using 1,500 byte-sized packets, the ratio could be as badas 1:58, assuming on average one ACK of 52 bytes for every twodata packets of 1,500 bytes and no overhead for the TCP connectionestablishment.
incoming traffic, while the opposite is true for LISPs and SISPs.However, there are various exceptions to this rule, and we findHCDNs with significantly more incoming than outgoing traffic andLISPs and SISPs where the opposite holds true. Note that despitethe significant diversity in the ratio of incoming and outgoing traffic,more than half of the member ASes that send most of the traffic alsoreceive most of the traffic. Indeed, there is a 50 % overlap amongthe top 50 member ASes according to bytes sent and the top 50member ASes according to bytes received.
We can also examine how similar or dissimilar the overall ap-plication mix (see Section 2) is across all the IXP member ASes.For example, when computing for each member AS the fractionof HTTP/HTTPS traffic relative to the total number of bytes sentand received, we find in Figure 4(c) that this application mix differssignificantly across the member ASes and follows almost a uniformdistribution, indicating that without additional information, it wouldbe difficult to predict which percentage of a member AS’s trafficis HTTP. However, as soon as we include for example informationabout the member AS’s business type, we observe that as expected,hosting providers and CDNs tend to send a larger fraction of HTTPtraffic. However, rather unexpectedly, we also see more than 10 %of the hosting providers and CDNs with only marginal fractions ofHTTP traffic. Closer inspection shows that these member ASes areprimarily service providers that do not provide web content.
4.4 PrefixesWe next consider the prefix exchange ratio. For this purpose,
we say that a prefix is served by a member AS if the member ASreceives traffic for that prefix. Vice verse, we say that a prefix isused by a member AS if output traffic of its access router is destinedtoward that prefix. Figure 5(c) depicts a scatter-plot of the ratio ofthe number of prefixes used vs. the number of prefixes served byeach member AS and provides clear evidence that the vast majorityof the member ASes of our IXP use more than 10-times the numberof prefixes they serve. Specifically, we see that hosting providersand CDNs have a tendency to serve a smaller number of prefixesbut to use some two orders of magnitude more prefixes. Focusingon the ISPs, we can identify two groups. The first, larger group,serves a diverse but limited set of prefixes, from a few tens to afew thousands. The second, smaller group, serves and uses a largenumber of prefixes, some tens of thousands. Members that servesuch large numbers of prefixes are likely acting as transit networksfor other member ASes. However, we again observe exceptions tothese general observations in almost all categories.
4.5 Geographical aspectsConventional wisdom about IXPs states that ASes join regional
169
Figure 16: Scatter-plot of number of peers per member, based on a classification of the member ASes in the four businesscategories defined above: LISP (Large ISP), SISP (Small ISP), HCDN (Hosting/service and Content Distribution Network)),and AEN (Academic and Enterprise Networks), and by tier. (Reprinted from [2]; ©2012 ACM, Inc. Included here bypermission.)

that ratio approximately correct is paramount because it is directly impacting how money flows in theInternet — while in a customer-provider relationship, the former pays the latter for bandwidth, peer-peerrelationships are typically settlement-free (i.e., no money is exchanged between the involved parties).
Besides their immediate economic impact, the above missing edges cause also significant problemsin inferring the AS graph. For instance, it is a requirement that a network be multi-homed to obtain anASN. This means the AS needs to intent to connect to at least two upstream providers. In this sense a“single-homed stub-AS” does not exist. Without any doubt, there are exceptions to this rule. However, thesecond link is often a backup link which is invisible to BGP outside of the immediate connection, becauseof BGP’s information hiding5. Thus, it may appear as if a large number of ASes are single-homed stubs.
In [117], the authors separate the missing links into hidden and invisible. Whereas the latter arelinks that are missing from the data for structural reasons (i.e., it is not just a question of quantity (i.e.,numbers of monitors) but quality (i.e., location of monitor)), the hidden links may be found with enoughmeasurements (over time, or multiple viewpoints). In [134] the authors extend that by dividing links into anumber of classes based on their observability.
The “missing link" problem in the AS context is much more serious than if those links were “missing atrandom”. In particular, the bias in the type of links that are missing [134] is critical when calculating somemetrics on the graph, such as distances, precisely because such links are often designed to cut down onthe number of ASes traffic must traverse. The missing data is also crucial for understanding reliability: forinstance, papers such as [5] that argue that high-degree nodes create vulnerabilities in the Internet ignorethe backup links that are invisible in these dataset, but obviously crucial when studying the resilience ofthe network.
4.3 The Internet’s AS-level topologies
Despite the limitations of measurements, there is a considerable amount known about the AS-leveltopology of the Internet, and we talk here about the issues in defining and modelling that topology. Wehave seen that the definition of an AS is fraught with problems. Assuming for the time being that theconcept of an AS is well defined so that it makes sense to equate each AS with a node in a graph, then whatis the set of links? Unfortunately, the question of which ASes are “adjacent” also has no simple answer, anddefining the meaning of a “link” between two ASes requires further consideration.
Does a link mean the ASes have a business relationship, physical connectivity, connecting BGP session,or that they share traffic? All the above are reasonable definitions, and none are equivalent. A commondefinition is that two ASes are said to be connected (at a particular time), if they can exchange routing data(and presumably IP traffic) without the help of an intermediary AS that provides transit. However, thissays little about the true business relationships that are sometimes discussed as a matter of course whenthe AS-graph is considered. Moreover, this abstraction looses considerable information. In reality thereare multiple topologies we want to model, each with its own meaning, structure, potential applications,and inference problems.
• Business relationship graph: in its simplest form this graph simply indicates (by an edge) that abusiness relationship exists between the corporations that own two ASNs. Edges could be usefullylabelled by the type of business relationship, and we list a small subset of the possible relationshipsin Table 1.
• Physical link-level graph: this graph indicates whether two ASNs have a physical (layer 1) connection,and how many such connections they have. The multiple nature of such connections leads this
5Note that complex BGP policies may play a role in this as well [36, 63].

Graph Edge Annotation Graph Typebusiness relationship subsidiary, partner, customer,... directed graphphysical link-level link capacity multi- hyper-graphconnectivity graph - multigraphBGP routing graph - undirected graphpolicy graph BGP policies directed multigraphtraffic graph traffic volumes directed graph
Table 1: Example elements of the set of AS graphs.
to being a multigraph, as it is very common for two ASes to be connected by multiple links and indifferent geographic locations [94, 114, 143]. The idea is clearly illustrated by Figure 1 in [94], whichshows a “pancake” diagram of the North American Internet backbone. Perhaps the reason thiscritical aspect of the topology is typically ignored is that it is very hard to measure—BGP monitordata is in general blind to this facet of the topology. In addition, this graph should really be ahypergraph. A single “edge” can connect multiple ASes, for example through an IXP [9, 75, 160]. Onemight argue that they are joined by a switch/router, each using point-to-point links, but in at leastsome cases, that switch has no place in a AS graph (i.e., it has no ASN). The graph’s edges could beusefully annotated with link capacity and potentially other features such as geographic location.
• Connectivity graph: this graph indicates that layer-2 connectivity exists between two ASNs. In manycases the layer-2 connectivity between ASNs would be congruent with the layer-1 connectivity, butwith recent advances in network virtualization this may not hold for long [154].
• BGP routing graph: the edges in this graph indicate pairs of ASes that have an active BGP sessionexchanging routing information (i.e., a BGP session that is in the ‘established’ state [130]).
• Policy graph: the edges in this graph are the same as those in the BGP routing graph, but includedirected policy annotations [62]. We define this separately from the BGP routing graph because itmay require a multigraph to allow for policy differences between different regions.
• Traffic graph: it is the same as the BGP routing graph, but the edges are annotated with the amountof traffic exchanged between the corresponding ASes.
This is hardly a complete set of possibilities, but already we can see the potential complexity here.Nevertheless, it appears unusual for studies to even define precisely what graph they examine (exceptionsbeing papers such as [60, 117] where the BGP routing graph is explicitly considered). In Table 1, we listsome of the possible graphs, and their basic properties. There is no clean 1:1 mapping between “network”and “organization” and “AS” [22, 75], and so it is highly non-trivial to map between these graphs, and theyare certainly not equivalent.
4.4 A look ahead
Given our list of problems described here, one might be tempted to think that the AS-graph and routingdata in general are useless until these datasets are drastically improved. However, apart from theiroperational utility, RouteViews and RIPE RIS have provided the essential ingredients for many importantstudies that match those services’ goals [116]. A number of these studies have improved the Internet

significantly, and in the majority of such successful papers there is no need to exploit the “graph” view of thenetwork. Examples include: (a) The discovery of slow convergence and persistence oscillation in routingprotocols [64, 86, 87, 89, 90, 151, 152]. (b) Understanding of the impacts (positive and negative) of route flapdampening [97, 124]. (c) Determining how much address space and how many ASNs are being activelyused [74]. (d) Looking for routing “Bogons” often related to Internet address hijacking [17, 40, 50, 128, 147].(e) Debugging network problems [20, 53, 133].
On the measurement side, there have also been many advancements towards improving our view ofAS topology. For instance:
1. As BGP routing changes, often multiple potential paths are explored and these paths (which areunlikely to actually be used as a final choice) can show some of the alternative routes available inthe network [166], and thus a more complete topology.
2. Missing edges can be found using additional datasets, e.g., RIRs and looking glasses [27, 69, 70, 166],or IXP data [9, 69, 70, 136], though care must be exercised with any additional dataset.
3. A routing beacon [21, 89, 99] is just a router that advertises and withdraws certain prefixes on aregular schedule. Examination of the observed announcements and withdrawals by various routemonitors then allows estimates of protocol behavior such as convergence time.
4. Route poisoning prevents announcement from reaching certain parts of the Internet. As withbeacons, it allows one to examine the behavior of BGP in a more controlled manner. This isperhaps the only way to see (some) backup paths, or to understand whether an ISP uses defaultrouting [21, 35].
5. There are also attempts to not just estimate the topology but derive some quality measure for theresultant AS-graph [76, 134, 158].
There is often an unfortunate side-effect to some of these types of measurement in form of a Heisenberg-like uncertainty principle. That is, it is not clear whether observed changes are due to the micro-phenomenon of path exploration or macro-phenomena of link changes, new entrants, etc. The longer wemake observations, the more complete they may seem, but we then do not know whether all of those linksexisted at the same time. Such uncertainty principles appear to be present in a number of Internet mea-surement contexts [132] where we trade off “accuracy” of the measurements against “time localization”. Inany case, this approach does not overcome the structural bias mentioned earlier.
At the same time, the above-mentioned and other advances on the measurement side suggest thatthe missing link problem may be improved, providing “more complete” AS graphs. However, there is aprofound need (illustrated by the above) for better data accuracy measurements, and better response todata quality issues from subsequent users of the data. Obvious ways to improve are to conduct sensitivityanalysis (of results) to missing or incorrect input data.
In addition, it is to be hoped that more controlled experiments are conducted (i.e., experiments thathave a “control” sample against which the experimental data can be compared) in order to preciselyderive which factors of interest affect which variables. Controls allow one to discriminate alternativeexplanations for results, and prevent the affects of one confounding factor drowning out the affects ofothers (see [21,99]). This is basic tenet of the scientific method, but seems to have been ignored in this areaof research. Most studies have been “observational”, and while there is a valid role for such experiments,for instance in epidemiology, they are intrinsically harder to interpret.
Lastly, another aspect of this richer set of AS topologies is that it should be obvious by now thateconomic or commercial objectives by and large determine and shape the structure and evolution of

their real-world counterparts, and that these constructs are once again naturally expressed throughoptimization rather than random graph models, though in this case the optimization problems may comefrom game theory or economics rather than mathematical programming.
4.5 Notes
The primary sources for the material presented in this section are
[135] M. Roughan, W. Willinger, O. Maennel, D. Perouli, and R. Bush. 10 Lessons from 10 Years of Mea-suring and Modeling the Internet’s Autonomous Systems, in: IEEE Journal on Selected Areas inCommunications 29(9):1810-1821, 2011.
[2] B. Ager, N. Chatzis, A. Feldmann, N. Sarrar, S. Uhlig, and W. Willinger. Anatomy of a large EuropeanIXP, in: Proc. ACM SIGCOMM’12, ACM Computer Communication Review 42(4), 2012.
and they contain lengthier discussions of many of the issues touched upon here.For additional and more in-depth reading materials (in addition to the references indicated through-
out) we point to
[26] H. Chang. Modeling the Internet’s Inter-Domain Topology and Traffic Demand Based on InternetBusiness Characterization, PhD Thesis, University of Michigan, 2006.
[43] B.Donnet and T. Friedman, Internet Topology Discovery: A Survey, IEEE Communications Surveys& Tutorials, 9(4), pp.56-69, 2007.
[38] A. Dhamdhere. Understanding the Evolution of the AS-level Internet Ecosystem, PhD Thesis,Georgia Institute of Technology, 2008.
[68] H. Haddadi, M. Rio, G. Iannaccone, A. Moore and R. Mortier, Network topologies: inference, model-ing and generation, IEEE Communications Surveys, 10(2), 2008.
[39] A. Dhamdhere and C. Dovrolis. Twelve Years in the Evolution of the Internet Ecosystem, in:IEEE/ACM Transactions on Networking 19(5), 2011.
5 PoP-level topology
When designing or reconfiguring the physical infrastructure of an ISP, network operators are often guidedby a design principle that emphasizes hierarchy [31,59,108]. There are two main reasons for implementinghierarchical network designs: scalability and simplicity. Compared to non-hierarchical designs, hierarchi-cal networks can often be built at scale, mainly because hierarchy makes a network easier to visualize — akey feature towards making it easier to manage. The situation is analogous to modularity in programminglanguages — ideally it allows consideration of network components in isolation.
A common form of hierarchy in IP networks is based on the concept of the PoP (or Point of Presence).A PoP is a loosely defined term. Some providers may use the term to mean a physical building (housing agroup of routers, switches and other devices), whereas others mean a metropolitan area where service isprovided. However it is defined, though, it is a useful construct because it describes the logical structureof the network as the designer intended, rather than its particular implementation in terms of individualrouters. Moreover, irrespective of the meaning, PoPs have an explicit geography (e.g., street address or

city/metropolitan area). This then leads to our third major category of “Internet topology” — the PoP-leveltopology.
PoP-level topologies are ideal for understanding tradeoffs between connectivity and redundancy, andalso provide the most essential information to competitors or customers (about where a network is based,or who has the best access network in a region). Additional reasons why the PoP-level view of networks isinteresting include
• Network maps are often drawn at this level because it is an easy level for humans to comprehend.
• Network optimization is often conducted at this level because the problem size is generally reason-able (e.g., dozens of PoPs as compared to potentially hundreds of routers) and because inter-PoPlinks are much more expensive than intra-PoP links.
• The internal design of PoPs is almost completely determined by simple templates [31, 59, 108].
• Networks change less frequently at the PoP level than at the router level [138]; and
• The PoP level is the more interesting level for many activities because it is less dependent on thedetails of protocol implementations, router vendor and model, and other technological details.
Figure 17: PoP-level network topologies taken from www.topology-zoo.org.
The last point is subtle but important for modelling. For instance, when using a network as partof a simulation, one would like to have a network that is invariant to the method being tested. If anetwork designer might change his/her network in response to a new protocol, say a routing or trafficengineering algorithm, then the test will be ambiguous if it uses existing networks as models. PoP-levelnetworks are less sensitive to these details than router-level networks, because routers impose physicaland technological constraints that are almost completely dependent on the details of the router vendor,model and even the version of software running on the router.
Two examples of PoP-level topologies are depicted in Figure 17, showing the structure of two of thelargest research networks (Abilene, and GÉANT) in the world.

5.1 A look back
The study of PoP-level topologies has a briefer history than the major alternatives. Although the concepthas existed for almost as long as networks, the work on modelling and measurement has typically focussedon routers (or their equivalent) though it is noteworthy that in simple networks (with one router per PoP)the two are the same.
The first steps were taken when real data-networks were observed and it was noted that they hadstructure in the form of hierarchy that was not well represented in simple random graphs. This obser-vation led to the development of structural topology generators [165], based on the idea that a topologygenerator should reflect the obvious hierarchical structures visible in real networks (e.g., the Georgia TechInternetwork Topology Models (GT-ITM) [66] generator). However, this model was not specifically aimedat modelling the PoP-level. PoPs have been used in more advanced structural topology generators suchas IGen [127]. IGen explicitly treats network design as an optimization, rather than following simplestochastic rules, in order to mimic the manner in which real networks are designed. IGen uses this notonly for topology but also to create some of the other important details of the network, such as the linkmetrics or iBGP configurations.
The Rocketfuel project [144] sought to measure (using traceroute with all the problems describedearlier) individual ISPs, and as part of this, presented data and maps at the PoP level. The idea wasextended by the iPlane project [95], and by DIMES [139]. However, the flaws in traceroute make this dataand the ensuing maps suspect from the start. However, [144] raised the bar with respect to validating theobtained PoP-level maps by trying to solicit feedback from the operators in charge of the mapped ISPs.
More recently, the concept of a PoP has been explicitly used to help guide measurement approaches,in the hope to overcome some of the limitations of traceroute [51, 138, 162]. However, in the absence ofstrong validation and given traceroute’s many problems, it is likely that most of the known issues still existin these approaches.
Alternatively, Knight et al. [84] have collected a set of over 200 maps published by ISPs themselves, andtranscribed these into an open set of data available from www.topology-zoo.org. Much of this datais at the PoP-level, indicating the importance of this level of network representation to ISPs. For a similarbut complementary effort, see [8].
5.2 Know your measurements
The problems in measuring PoPs are essentially the same as in any traceroute-based survey, though it isthought (or perhaps just hoped) that mapping IP addresses to PoPs is more straight-forward than mappingIPs to either routers or to ASes. To the best of our knowledge, no rigorous testing of this hypothesis hasbeen conducted to date, but there are some indications (e.g., see [84]) that the PoP-level maps provided bytraceroute are no better than their router- or AS-level counter-parts.
The topology-zoo data [84], on the other hand, is provided by ISPs themselves and should in principlebe much more accurate. However, this dataset must also be treated carefully (as should all data) becauseof potential transcription errors, or mistakes or approximations in the maps provided by the ISPs. Whilesuch errors are much less frequent than those encountered in measured networks, an added concern withrespect to ISP-provided maps is stale data because there is little incentive to provide up-to-date maps.
As mentioned earlier, another important component of many PoP-level topologies is the geographicelement. Such topologies are much easier to visualize geographically [83], and so a frequent interest isgeolocation of the PoPs. While this is not a chapter on geolocation, it suffices to say that many researchpapers have been written on the problems of accurately mapping IP addresses to their geolocation (e.g.,see [125]). Moreover, while the routers and switches of a PoP are typically located in a single location,
city, or metropolitan area, the “eyeballs” (i.e., end users) connected to the PoP will be spread over somearea [129]. However, if the researcher is willing to diligently mine various data sources, there is hope of atleast being able to geolocate PoPs as they house potentially hundreds or thousands of IP addresses andreside in locations with known physical addresses (e.g., carrier hotels) [8].
5.3 The nature of the PoP-level graph
There is a common meme in network modelling that the design of a US ISP backbone network involvessimply selecting the NFL cities, and then joining them up with a few lines on a map. While the real processof network design is rarely so trite, the picture above isn’t entirely unfair.
Most notably, PoPs are usually selected based on commercial criteria (e.g., the desirability and sizeof the potential customer base in an area). So network engineers get little choice over the locations thatthey are connecting. They could be the NFL cities in the US, or the larger cities of another country, orthe capitals of countries on a continent, and so on. Once the PoP locations have been selected, theyneed to be connected in some redundant fashion to ensure some degree of robustness to node or linkfailures. Historically, connecting these PoPs may have been done in a mostly ad hoc manner; see for in-stance http://personalpages.manchester.ac.uk/staff/m.dodge/cybergeography/atlas/roberts_arpanet_large.gif.
However, since the burst of the Internet bubble (circa 2000), capital investment has become harderto obtain, and network operators and engineers had to justify such investment more carefully. At thispoint, network capacity started to be more carefully planned, not always using formal mathematicaloptimization, but certainly using traffic measurements to ensure less wasted capacity. Much of thisplanning and optimization is performed at the PoP-level simply because the router-level is much morecomplicated (in size, and complexity of constraints), and because inter- and intra-PoP link costs vary by alarge margin.
We have discussed network design by constrained optimization extensively in §3 (see also referencessuch as [93]), and so here we shall only consider the main differences for PoP-level design (apart fromthose already listed above).
Perhaps the most important difference is that the physical and engineering constraints on a routerdo not directly apply for a PoP. At least in theory, a PoP can use as many routers as needed to providesufficient number of ports for any arbitrary node degree and sufficient throughput per port. Naturally, theconstraints in this case will arise in the form of costs, and optimization-based formulations of the PoP-levelnetwork design problem will feature budget constraints to reflect this aspect. As budget constraints canvary greatly among different companies, when we look at actual PoP-level ISP backbone networks, we see awide variety of designs ranging from the meshy designs with high-degree nodes only at the edge predictedby the HOT model, to hub and spoke like networks [84]. In fact, the sheer variety of network designs weobserve in reality suggest that while some network operators seem to aim at optimizing performance(given some lenient cost constraints), others appear to be willing to sacrifice performance in order tokeep costs low. Moreover, network operators in different countries can encounter very different link costsdepending on the local geographic and commercial environment.
A critical but rarely discussed property of the PoP-level topology is that it provides the “glue" betweenthe more physical router-level topology on the one hand and the more logical AS-level topology on theother hand. Functioning as an “intermediary" between these two topologies highlights the importantaspect of the PoP-level topology that its granularity is “just right" for many networking problems ofpractical interest — not too coarse as to ignore important context (e.g., the case with various AS topologies)but also not too fine as to be overwhelmed with unnecessary details (e.g., the case with various physical

topologies). We next discuss this property in more detail.
5.3.1 From PoP-level to router-level connectivity
Given a PoP-level network, there is an additional interesting question: “Can we map this network down tothe router level?” The GT-ITM model addressed this through random generation of its subnetworks, butin practice the design process of network engineers in this case is a text-book application of repeatingpatterns [31, 59, 108] and hence anything but random.
The main reason for following this design process is that network designers often apply “cookiecutter” methods to design networks as a whole or the internals of PoPs, though that term unnecessarilytrivializes the importance of repeated patterns. Repetition makes network operations vastly simpler:the management of two PoPs requires the same skills. Equipment can be bulk purchased, debugging iseasier, and adding new PoPs is simpler. Finally, networks based on templated design lead to simple designmethodologies. For instance, the inter-PoP level network topology can be optimized relatively simply, asdetails such as redundancy will be supplied by the provision of pairs of redundant routers in each PoP,with redundant links between them. Design often refers to the graph topology of router interconnections,but templated design can extend to other details, such as physical configuration within racks, connectionswith external networks, or additional servers such as Domain Name Service or Network ManagementSystems.
This type of design can be mathematically described using graph-products, though for more details,we invite the reader to consult [121].
5.3.2 From PoP-level to AS-level connectivity: The pancake-view of the Internet
Until now we have only really discussed the PoP-level topology of a single network. However, there isconsiderable interest in how these networks interconnect.
The most prominent and commonly-accepted view of the Internet is as a “network of networks” or ASesin the AS-graph representation discussed in §4. A much neglected and rarely-mentioned representation isthe “pancake view” where we consider each network to be a layer and where the different layers (networks)are stacked on top of one another to form a pancake-like structure [94]. To show where the differentnetworks inter-connect, we add links across layers; intra-network connectivity is shown as links withineach layer. For a set of “peer” networks, one advantage of this pancake view is that these networksoften cover similar geographic areas and inter-connect in multiple locations, but at a limited set of cities(determined either by where private interconnects are seen as commercially viable, or where IXPs areavailable). Importantly, depending on the types of networks, many of them host their PoPs in one and thesame commercial colocation facilities whose street addresses are generally known6. As such, the pancakeview allows one to visualize not only this connectivity inside and between such providers but also thegeography of their PoP-level topologies.
However, as far as we are aware, there has been no significant work studying this pancake view togetherwith the different inter-connections, other than noting that it exists. The dearth of studies and modelsperhaps stems from the problems in obtaining the measurements necessary for constructing this view(see the discussions in §4), but it is perhaps one of the most interesting areas for future Internet topologyresearch.
6One problem in establishing such a view lies in the limitations of current IP geolocation services [125].

5.4 A look ahead
We have focused in this section and the earlier sections mostly on traditional ISPs or network serviceproviders which operate networks that have more or less pronounced backbones and cover geographicareas ranging from individual countries to entire geographic regions to the entire globe. However, thereare many other networks that are not ISPs and consist of PoPs without their own physical infrastructuresto connect them (e.g., content providers, CDNs, Web-hosting companies). The PoPs of these networksare typically located in commercial colocation facilities or data centers that are operated by third-partycompanies for the explicit purpose of interconnecting such infrastructureless networks among one anotheror with ISPs or network service providers.
The importance of the role of such dedicated Internet infrastructure in the form of colocation facilitiesis best illustrated with a concrete example. As of December 2012, Equinix www.equinix.com, one ofthe leading companies in global interconnection and data centers, owned and operated in 14 countries in5 continents some 30 colocation facilities. In these 30+ colocation facilities that are located in the majorcities around the world, more than 4,000 networks connected directly to their customers and partners.
Another largely under-researched topic concerns the fact that in this chapter, we treated router-, PoP-,and AS-level topologies as static objects, when in reality, they evolve over time. In particular, it is rarelythe case that a network operator designs a new network from scratch. Network design typically has toinclude as important aspects awareness and knowledge of the existing network that the operator intendsto change due to, for example, drastic changes in the traffic demand that the original network design canno longer handle efficiently.
In view of these an other added challenges, the PoP-level view promises to be one of the more usefuland interesting direction for future Internet topology research. In particular, measurements and models atthis level have considerable scope for the future, and extensions of HOT-like optimization models mayprovide much more realistic synthetic networks than are currently available. At the same time, work oninterconnection of networks at this level also provides considerable scope, but will require significantadvances in our ability to measure and model the flow of traffic across the different networks as it is thetraffic that ultimately determines much of the structure and evolution of the different topologies that wediscussed in this chapter.
5.5 Notes
The primary source for the material presented in this section (and a much lengthier discussion of many ofthe issues) is
[84] S.Knight, H.Nguyen, N.Falkner, R.Bowden, M.Roughan, The Internet topology zoo. IEEE Journal onSelected Areas in Communications (JSAC) 29, 9, 1765-1775, October 2011.
For additional and more in-depth reading materials (in addition to the references indicated throughout)we point to
[139] Y.Shavitt and N.Zilberman, Geographical Internet PoP-level maps. In Proceedings of the 4th interna-tional conference on Traffic Monitoring and Analysis (Berlin, Heidelberg), TMA’12, Springer-Verlag,pp. 121-124, 2012.
[121] E.Parsonage, H.Nguyen, R.Bowden, K.Knight, N.Falkner, M.Roughan, Generalized graph productsfor network design and analysis. In 19th IEEE International Conference on Network Protocols (ICNP)(Vancouver, CA), October 2011.

[138] Y.Shavitt and N.Zilberman, A structural approach for PoP geo-location. In IEEE Infocom 2010.
[162] K.Yoshida, Y.Kikuchi, M.Yamamoto, Y.Fujii, K.Nagami, I.Nakagawa and H.Esaki, Inferring PoP-levelISP topology through end-to-end delay measurement. In PAM, pp. 35-44, 2009.
6 Conclusion
This chapter has aimed at clarifying the state of the art in Internet topology measurement and modelling,and correcting a number of clear and present flaws in reasoning. As we outlined in the introduction, wecan see a number of themes recurring at multiple levels of hierarchy in topology modelling:
Theme 1: When studying highly-engineered systems such as the Internet, “details” in the form of proto-cols, architecture, functionality, and purpose matter.
Theme 2: When analyzing Internet measurements, examining the “hygiene” of the available measure-ments (i.e., an in-depth recounting of the potential pitfalls associated with producing the measure-ments in question) is critical.
Theme 3: When validating proposed topology models, it is necessary to treat network modeling as anexercise in reverse-engineering and not as an exercise in model-fitting.
Theme 4: When modeling highly-engineered systems such as the Internet, beware of M.L. Mencken’squote “For every complex problem there is an answer that is clear, simple, and wrong.”
We have not tried to survey the entire literature in this area, and we apologize to those whose workhas not appeared here, but there are other extant surveys mentioned at the relevant points throughoutthis chapter, for specific components of the work. We also have not tried to critique every model, butrather tried to provide general guidance about modelling. It is intended that the readers could themselvescritique existing and new models based on the ideas presented here.
In addition, we do not claim to have covered every type of topology associated with the Internet.Specifically, we have avoided topologies at the applications layer, for instance those associated withthe WWW or online social networks. We made this choice simply because these topologies are (despitebeing “Internet” topologies) profoundly different from the topologies we have included. They are almostpurely virtual whereas all of the networks considered here have a physical component, which leads tothe arguments for optimization as their underlying construction. An important open problem in thiscontext is the role that societal-related factors play over more economic- or technology-based drivers inthe formation and evolution of these virtual topologies.
Finally, in each section, we have aimed at illuminating some of the current problems and identifyinghopefully fruitful directions for future research in this area.
References
[1] ACHLIOPTAS, D., CLAUSET, A., KEMPE, D., AND MOORE, C. On the bias of traceroute sampling:or, power-law degree distributions in regular graphs. In ACM Symposium on Theory of Computing(STOC) (2005), ACM, pp. 694–703.
[2] AGER, B., CHATZIS, N., FELDMANN, A., SARRAR, N., UHLIG, S., AND WILLINGER, W. Anatomy of alarge European IXP. In ACM SIGCOMM (2012).

[3] AIELLO, W., CHUNG, F., AND LU, L. A random graph model for massive graphs. In ACM Symposiumon Theory of Computing (STOC) (2000), ACM, pp. 171–180.
[4] ALBERT, R., AND BARABÁSI, A.-L. Statistical mechanics of complex networks. Reviews of ModernPhysics 74 (2002), 47–97.
[5] ALBERT, R., H.JEONG, AND BARABÁSI, A.-L. Error and attack tolerance of complex networks. Nature406 (2000), 378–382.
[6] ALDERSON, D., AND DOYLE., J. Contrasting views of complexity and their implications for network-centric infrastructures. IEEE Transactions on Systems, Man, and Cybernetics – Part A 40, 4 (2010).
[7] ALDERSON, D., LI, L., WILLINGER, W., AND DOYLE, J. C. Understanding Internet topology: princi-ples, models, and validation. IEEE/ACM Transactions on Networking 13 (December 2005), 1205–1218.
[8] Internet Atlas. http://atlas.wail.wisc.edu/about-us.jsp.
[9] AUGUSTIN, B., KRISHNAMURTHY, B., AND WILLINGER, W. IXPs: Mapped? In ACM SIGCOMMInternet Measurement Conference (IMC) (2009), pp. 336–349.
[10] BARABÁSI, A.-L. Linked: How Everything Is Connected to Everything Else and What it Means forBusiness, Science, and Everyday Life. Perseus Publishing, Cambridge, MA, 2002.
[11] BARABÁSI, A.-L. Scale-free networks: A decade and beyond. Science 325 (2009), 412–413.
[12] BARABÁSI, A.-L. The network takeover. Nature Physics 8 (2012), 14–16.
[13] BARABÁSI, A.-L., AND ALBERT, R. Emergence of scaling in random networks. Science 286 (1999).
[14] BATTISTA, G., PATRIGNANI, M., AND PIZZONIA, M. Computing the types of the relationships betweenautonomous systems. In IEEE INFOCOM (2003).
[15] BENDER, A., SHERWOOD, R., AND SPRING, N. Fixing Ally’s growing pains with velocity modeling. InACM SIGCOMM Internet Measurement Conference (IMC) (2008).
[16] BONICA, R., GAN, D., TAPPAN, D., AND PIGNATARO, C. ICMP extensions for multiprotocol labelswitching. IETF, Network Working Group, Request for Comments: 4950, August 2007.
[17] BOOTHE, P., HIEBERT, J., AND BUSH, R. How prevalent is prefix hijacking on the Internet? NANOG36 (February 2006).
[18] BRODER, A., KUMAR, R., MAGHOUL, F., RAGHAVAN, P., RAJAGOPALAN, S., STATA, R., TOMKINS, A.,AND WIENER, J. Graph structure in the web. Computer Networks 33, 1-6 (June 2000), 309–320.
[19] BROIDO, A., AND CLAFFY, K. Internet topology: connectivity of IP graphs. In SPIE InternationalSymposium on Convergence of IT and Communication (August 2001), pp. 172–187.
[20] BUSH, R., HIEBERT, J., MAENNEL, O., ROUGHAN, M., AND UHLIG, S. Testing the reachability of(new) address space. In ACM SIGCOMM workshop on Internet network management (INM’07)(2007), pp. 236–241.

[21] BUSH, R., MAENNEL, O., ROUGHAN, M., AND UHLIG, S. Internet optometry: assessing the brokenglasses in Internet reachability. In ACM SIGCOMM Internet Measurement Conference (IMC) (2009),pp. 242–253.
[22] CAI, X., HEIDEMANN, J., KRISHNAMURTHY, B., AND WILLINGER, W. Towards an AS-to-organizationmap. In ACM SIGCOMM Internet Measurement Conference (IMC) (2010).
[23] CALVERT, K., DOAR, M., AND ZEGURA, E. Modeling Internet topology. IEEE CommunicationsMagazine 35, 6 (June 1997), 160–163.
[24] CARLSON, J., AND DOYLE, J. Complexity and robustness. Proceedings of the National Academy ofSciences of the USA (PNAS) 99, Suppl. 1 (2002), 2538–2545.
[25] CERF, V., AND KAHN, B. Selected ARPANET maps. ACM SIGCOMM Computer CommunicationsReview (CCR) 20 (1990), 81–110.
[26] CHANG, H. Modeling Internet’s Inter-Domain Topology and Traffic Demand Based on InternetBusiness Characterization. PhD thesis, University of Michigan, 2006.
[27] CHANG, H., GOVINDAN, R., JAMIN, S., SHENKER, S. J., AND WILLINGER, W. Towards capturingrepresentative AS-level Internet topologies. Computer Networks 44, 6 (2004), 737–755.
[28] CHEN, K., CHOFFNES, D., POTHARAJU, R., CHEN, Y., BUSTAMANTE, F., PAI, D., AND ZHAO, Y. Wherethe sidewalks ends: Extending the Internet AS graph using traceroutes from P2P users. In ACMSIGCOMM CoNEXT (2009).
[29] CHIANG, M. Networked Life: 20 Questions and Answers. Cambridge University Press, 2012.
[30] CHUNG, F., AND LU, L. The average distance in a random graph with given expected degrees.Internet Mathematics 1, 1 (2004), 91–113.
[31] ISP network design, Cisco Systems. ISOC ISP/IXP Workshop, 2005.
[32] Building cost effective and scalable CORE networks using an elastic architecture. Cisco whitepaper, 2013. http://www.cisco.com/en/US/prod/collateral/routers/ps5763/white_paper_c11-727983.pdf.
[33] Converged transport architecture: Improving scale and efficiency in service provider. Cisco whitepaper, 2013. http://www.cisco.com/en/US/prod/collateral/routers/ps5763/white_paper_c11-728242.pdf.
[34] CLARKE, D. The design principles of the DARPA Internet protocols. ACM SIGCOMM ComputerCommunications Review (CCR) 25, 1 (January 1995).
[35] COLITTI, L. Internet Topology Discovery Using Active Probing. PhD thesis, University di Roma Tre,2006.
[36] BGP cost community, Cisco Systems, 2005. http://www.cisco.com/en/US/docs/ios/12_0s/feature/guide/s_bgpcc.html.
[37] DASU, T., AND JOHNSON, T. Exploratory Data Mining and Data Cleaning. Wiley, New York, 2003.

[38] DHAMDHERE, A. Understanding the Evolution of the AS-level Internet Ecosystem. PhD thesis, GeorgiaInstitute of Technology, 2008.
[39] DHAMDHERE, A., AND DOVROLIS, C. Twelve years in the evolution of the Internet ecosystem.IEEE/ACM Transactions on Networking 19, 5 (2011), 1420–1433.
[40] DIAZ, J. GIZMODO: China’s Internet hijacking uncovered, 2010. http://gizmodo.com/5692217/chinas-secret-internet-hijacking-uncovered.
[41] DIMITROPOULOS, X., KRIOUKOV, D., FOMENKOV, M., HUFFAKER, B., HYUN, Y., KC CLAFFY, AND
RILEY, G. AS relationships: Inference and validation. ACM SIGCOMM Computer CommunicationsReview (CCR) 37, 1 (2007), 29–40.
[42] DOAR, M. B., AND NEXION, A. A better model for generating test networks. In IEEE GLOBECOM(1996), pp. 86–93.
[43] DONNET, B., AND FRIEDMAN, T. Internet topology discovery: A survey. IEEE CommunicationsSurveys & Tutorials 9 (2007), 56–69.
[44] DONNET, B., LUCKIE, M., MÉRINDOL, P., AND PANSIOT, J.-J. Revealing MPLS tunnels obscuredfrom traceroute. ACM SIGCOMM Computer Communications Review (CCR) (April 2012). http://www.sigcomm.org/ccr/papers/2012/April/2185376.2185388.
[45] DOROGOVTSEV, S., AND MENDES, J. Evolution of Networks: From Biological Nets to the Internet andWWW. Oxford University Press, 2003.
[46] DOYLE, J. C., ALDERSON, D. L., LI, L., LOW, S., ROUGHAN, M., SHALUNOV, S., TANAKA, R., AND
WILLINGER, W. The “robust yet fragile” nature of the Internet. Proceedings of the National Academyof Sciences of the USA (PNAS) 102, 41 (October 2005), 14497–502.
[47] ERDÖS, P., AND RÉNYI, A. On the evolution of random graphs. Publications of the MathematicalInstitute of the Hungarian Academy of Sciences 5 (1960), 17–61.
[48] FABRIKANT, A., KOUTSOUPIAS, E., AND PAPADIMITRIOU, C. Heuristically optimized trade-offs: Anew paradigm for power laws in the internet. In Automata, Languages and Programming, vol. 2380of Lecture Notes in Computer Science. Springer Berlin / Heidelberg, 2002, pp. 781–781.
[49] FALOUTSOS, M., FALOUTSOS, P., AND FALOUTSOS, C. On power-law relationships of the Internettopology. In ACM SIGCOMM (1999), pp. 251–262.
[50] FEAMSTER, N., JUNG, J., AND BALAKRISHNAN, H. An empirical study of bogon route advertisements.ACM SIGCOMM Computer Communications Review (CCR) 35, 1 (2005), 63–70.
[51] FELDMAN, D., AND SHAVITT, Y. Automatic large scale generation of Internet PoP level maps. In IEEEGLOBECOM (2008), pp. 2426–2431.
[52] FELDMANN, A., GREENBERG, A., LUND, C., REINGOLD, N., AND REXFORD, J. Netscope: Trafficengineering for IP networks. IEEE Network Magazine (March/April 2000), 11–19.
[53] FELDMANN, A., MAENNEL, O., MAO, Z. M., BERGER, A., AND MAGGS, B. Locating Internet routinginstabilities. In ACM SIGCOMM (2004).

[54] FORTZ, B., AND THORUP, M. Internet traffic engineering by optimizing OSPF weights. In IEEEINFOCOM (2000), pp. 519–528.
[55] FRAZER, K. Merit’s history, the NSFNET backbone project 1987-1995, Merit Network, Inc. http://www.livinginternet.com/doc/merit.edu/phenom.html.
[56] GAO, L. On Inferring Autonomous System Relationships in the Internet. Global TelecommunicationsInternet Mini-Conference (2000).
[57] GÉANT. http://www.geant.net/Network/The_Network/Pages/Network-Topology.aspx.
[58] GILL, P., ARLITT, M., LI, Z., AND MAHANTI, A. The flattening Internet topology: Natu-ral evolution, unsightly barnacles or contrived collapse? In Passive and Active Measure-ment Conference (PAM) (2008), pp. 1–10. http://www.springerlink.com/content/1255p8g3k6766242/fulltext.pdf.
[59] GILL, V. Analysis of design decisions in a 10G backbone. www.nanog.org/meetings/nanog34/presentations/gill.pdf.
[60] GOVINDAN, R., AND REDDY, A. An analysis of Internet inter-domain topology and route stability. InIEEE INFOCOM (1997), pp. 850–857.
[61] GRIFFIN, T. G. Understanding the Border Gateway Protocol (BGP). ICNP Tutorial, http://www.cl.cam.ac.uk/~tgg22/talks/, 2002.
[62] GRIFFIN, T. G. The stratified shortest-paths problem (invited paper). In International Conference onCommunications Systems & Networks (COMSNETS) (January 2010).
[63] GRIFFIN, T. G., AND HUSTON, G. BGP wedgies. RFC 4264, 2005.
[64] GRIFFIN, T. G., AND WILFONG, G. An analysis of the MED oscillation problem in BGP. In IEEEInternational Conference on Network Protocols (ICNP) (2002).
[65] GT-ITM: Georgia Tech Internetwork Topology Models. http://www.cc.gatech.edu/projects/gtitm/.
[66] Modeling topology of large internetworks, 2000. http://www.cc.gatech.edu/projects/gtitm/.
[67] GUNES, M., AND SARAC, K. Resolving IP aliases in building traceroute-based Internet maps.IEEE/ACM Transactions on Networking 17, 6 (2009), 1738–1751.
[68] HADDADI, H., RIO, M., IANNACCONE, G., MOORE, A., AND MORTIER, R. Network topologies:inference, modeling and generation. IEEE Communications Surveys 10, 2 (2008).
[69] HE, Y., SIGANOS, G., FALOUTSOS, M., AND KRISHNAMURTHY, S. V. A systematic framework forunearthing the missing links: Measurements and impact. In USENIX Symposium on NetworkedSystems Design and Implementation (NSDI) (April 2007).
[70] HE, Y., SIGANOS, G., FALOUTSOS, M., AND KRISHNAMURTHY, S. V. Lord of the links: A frameworkfor discovering missing links in the Internet topology. IEEE/ACM Transactions on Networking 17, 2(2009), 391–404.

[71] HEART, F., MCKENZIE, A., MCQUILLIAN, J., AND WALDEN, D. ARPANET completion report.Tech. rep., Bolt, Beranek and Newman, Burlington, MA, 1978. http://www.cs.utexas.edu/users/chris/DIGITAL_ARCHIVE/ARPANET/DARPA4799.pdf.
[72] HUSTON, G. Peering and settlements - part I. The Internet Protocol Journal 2, 1 (March 1999).
[73] HUSTON, G. Peering and settlements - part II. The Internet Protocol Journal 2, 2 (June 1999).
[74] HUSTON, G. IPv4 address report, 2007. http://www.potaroo.net/tools/ipv4/index.html.
[75] HYUN, Y., BROIDO, A., AND K.C. CLAFFY. Traceroute and BGP AS path incongruities. Tech. rep.,UCSD CAIDA, 2003. http://www.caida.org/publications/papers/2003/ASP/.
[76] Internet AS-level topology construction & analysis. http://topology.neclab.eu/.
[77] Internet 2. http://www.internet2.edu/pubs/networkmap-connectors-participants.pdf.
[78] JACOBSON, V. Traceroute. ftp://ftp.ee.lbl.gov/traceroute.tar.gz, 1989-04.
[79] JAMAKOVIC, A., AND UHLIG, S. On the relationships between topological metrics in real-worldnetworks. Networks and Heterogeneous Media 3, 2 (June 2008), 345–359.
[80] Evolving backbone networks using with an MPLS supercore. Juniper Networks white paper, 2013.http://www.juniper.net/us/en/local/pdf/whitepapers/2000392-en.pdf.
[81] KARDES, H., OZ, T., AND GUNES, M. H. Cheleby: A subnet-level Internet topology mapping system.In International Conference on Communications Systems & Networks (COMSNETS) (2012).
[82] KELLER, E. F. Revisiting “scale-free” networks. BioEssays 27, 1 (2005), 1060–1068.
[83] KNIGHT, S., FALKNER, N., NGUYEN, H., TUNE, P., AND ROUGHAN, M. I can see for miles: Re-visualizing the Internet. IEEE Network 26, 6 (2012), 26–32.
[84] KNIGHT, S., NGUYEN, H., FALKNER, N., BOWDEN, R., AND ROUGHAN, M. The Internet topology zoo.IEEE Journal on Selected Areas in Communications (JSAC) 29, 9 (October 2011), 1765–1775.
[85] KRISHNAMURTHY, B., AND WILLINGER, W. What are our standards for validation of measurement-based networking research? ACM SIGMETRICS Performance Evaluation Review 36 (2008), 64–69.
[86] LABOVITZ, C., AHUJA, A., BOSE, A., AND JAHANIAN, F. Delayed Internet routing convergence. InACM SIGCOMM (2000).
[87] LABOVITZ, C., AHUJA, A., AND JAHANIAN, F. Experimental study of Internet stability and wide-areanetwork failures. In International Symposium on Fault-Tolerant Computing (FTCS) (1999).
[88] LABOVITZ, C., IEKEL-JOHNSON, S., MCPHERSON, D., OBERHEIDE, J., AND JAHANIAN, F. Internetinter-domain traffic. In ACM SIGCOMM (2010), pp. 75–86.
[89] LABOVITZ, C., MALAN, R., AND JAHANIAN, F. Internet routing stability. In ACM SIGCOMM (1997).

[90] LABOVITZ, C., MALAN, R., AND JAHANIAN, F. Origins of Internet routing instability. In IEEEINFOCOM (1999).
[91] LAKHINA, A., BYERS, J., CROVELLA, M., AND XIE, P. Sampling biases in IP topology measurements.In IEEE INFOCOM (April 2003).
[92] LI, L., ALDERSON, D., DOYLE, J., AND WILLINGER, W. Towards a theory of scale-free graphs:Definitions, properties, and implications. Internet Mathematics 2, 4 (2005), 431–523.
[93] LI, L., ALDERSON, D., WILLINGER, W., AND DOYLE, J. A first-principles approach to understandingthe Internet’s router-level topology. In ACM SIGCOMM (2004), pp. 3–14.
[94] LILJENSTAM, M., LIU, J., AND NICOL, D. Development of an Internet backbone topology forlarge-scale network simulations. In Winter Simulation Conference (2003).
[95] MADHYASTHA, H. V., ISDAL, T., PIATEK, M., DIXON, C., ANDERSON, T., KRISHNAMURTHY, A., AND
VENKATARAMANI, A. iPlane: An information plane for distributed services. In USENIX Symposiumon Operating Systems Design and Implementation (OSDI) (November 2006).
[96] MAHADEVAN, P., KRIOUKOV, D., FOMENKOV, M., DIMITROPOULOS, X., CLAFFY, K. C., AND VAHDAT,A. The Internet AS-level topology: three data sources and one definitive metric. ACM SIGCOMMComputer Communications Review (CCR) 36 (January 2006), 17–26.
[97] MAO, Z., GOVINDAN, R., VARGHESE, G., AND KATZ, R. Route flap dampening exacerbates Internetrouting convergence. In ACM SIGCOMM (2002).
[98] MAO, Z., QIU, L., WANG, J., AND ZHANG, Y. On AS-level path inference. In ACM SIGMETRICS(2005).
[99] MAO, Z. M., BUSH, R., GRIFFIN, T. G., AND ROUGHAN, M. BGP beacons. In ACM SIGCOMM InternetMeasurement Conference (IMC) (October 2003).
[100] MAO, Z. M., REXFORD, J., WANG, J., AND KATZ, R. Towards an accurate AS-level traceroute tool. InACM SIGCOMM (August 2003).
[101] MARCHETTA, P., DE DONATO, W., AND PESCAPE, A. Detecting third-party addresses in traceroutetraces with IP timestamp option. In Passive and Active Measurement Conference (PAM) (2013).
[102] MARCHETTA, P., MERINDOL, P., DONNET, B., PESCAPE, A., AND PANSIOT, J. Quantifying andmitigating IGMP filtering in topology discovery. In IEEE GLOBECOM (2012), pp. 1871–1876.
[103] MEDINA, A., LAKHINA, A., MATTA, I., AND BYERS, J. BRITE: an approach to universal topologygeneration. In Ninth International Symposium on Modeling, Analysis and Simulation of Computerand Telecommunication Systems (2001), pp. 346–353.
[104] MÉRINDOL, P., DONNET, B., BONAVENTURE, O., AND PANSIOT, J.-J. On the impact of layer-2 on nodedegree distribution. In ACM SIGCOMM Internet Measurement Conference (IMC) (2010), pp. 179–191.
[105] MÉRINDOL, P., VAN DEN SCHRIECK, V., DONNET, B., BONAVENTURE, O., AND PANSIOT, J.-J. Quanti-fying ASes multiconnectivity using multicast information. In ACM SIGCOMM Internet MeasurementConference (IMC) (2009), pp. 370–376.

[106] MITZENMACHER, M. A brief history of generative models for power law and lognormal distributions.Internet Mathematics 1 (2001), 226–251.
[107] MITZENMACHER, M. Editorial: The future of power law research. Internet Mathematics 2, 4 (2006),525–534.
[108] MORRIS, M. Network design templates. www.networkworld.com/community/blog/network-design-templates, July 2007.
[109] The MRINFO and MERLIN project. http://svnet.u-strasbg.fr/mrinfo/index.html.
[110] MÜHLBAUER, W., FELDMANN, A., MAENNEL, O., ROUGHAN, M., AND UHLIG, S. Building an AS-topology model that captures route diversity. In ACM SIGCOMM (2006).
[111] MÜHLBAUER, W., UHLIG, S., FU, B., MEULLE, M., AND MAENNEL, O. In search for an appropriategranularity to model routing policies. In ACM SIGCOMM (2007).
[112] N. BERGER, C. BORGS, J. T. C., AND SABERI, A. On the spread of viruses on the Internet. In 16thACM-SIAM Symposium on Discrete Algorithm (SODA) (2005), pp. 301–310.
[113] NEWMAN, M. Networks: An Introduction. Oxford University Press, 2010.
[114] NORTON, W. B. A study of 28 peering policies. http://drpeering.net/white-papers/Peering-Policies/A-Study-of-28-Peering-Policies.html.
[115] NORTON, W. B. Internet service providers and peering, 2010. http://drpeering.net/white-papers/Internet-Service-Providers-And-Peering.html.
[116] OF THE ROUTING INFORMATION SERVICE, G. http://www.ripe.net/ripe/docs/ripe-200.
[117] OLIVEIRA, R., PEI, D., WILLINGER, W., ZHANG, B., AND ZHANG, L. The (in)completeness of theobserved Internet AS-level structure. IEEE/ACM Transactions on Networking 18, 1 (2010), 109–122.
[118] University of Oregon Route Views Archive Project. www.routeviews.org.
[119] PANSIOT, J.-J., AND GRAD, D. On routes and multicast trees in the internet. ACM SIGCOMMComputer Communications Review (CCR) 28, 1 (1998), 41–50.
[120] PANSIOT, J.-J., MÉRINDOL, P., DONNET, B., AND BONAVENTURE, O. Extracting intra-domain topologyfrom mrinfo probing. In Passive and Active Measurement Conference (PAM) (2010), pp. 81–90.
[121] PARSONAGEQUE, E., NGUYEN, H. X., BOWDEN, R., KNIGHT, S., FALKNER, N. J., AND ROUGHAN, M.Generalized graph products for network design and analysis. In IEEE International Conference onNetwork Protocols (ICNP) (October 2011).
[122] PASTOR-SATORRAS, R., AND VESPIGNANI, A. Epidemic spreading in scale-free networks. PhysicalReview Letters 86, 14 (2001), 3200–3203.
[123] PASTOR-SATORRAS, R., AND VESPIGNANI, A. Evolution and Structure of the Internet: A StatisticalPhysics Approach. Cambridge University Press, 2004.

[124] PELSSER, C., MAENNEL, O., MOHAPATRA, P., BUSH, R., AND PATEL, K. Route flap damping madeuseful. In Passive and Active Measurement Conference (PAM) (2011).
[125] POESE, I., UHLIG, S., KAAFAR, M. A., DONNET, B., AND GUEYE, B. IP geolocation databases:unreliable? ACM SIGCOMM Computer Communications Review (CCR) 41, 2 (April 2011), 53–56.
[126] QIU, S. Y., MCDANIEL, P. D., AND MONROSE, F. Toward valley-free inter-domain routing. In IEEEInternational Conference on Communications (2007).
[127] QUOITIN, B., VAN DEN SCHRIECK, V., FRANÃGOIS, P., AND BONAVENTURE, O. IGen: generationof router-level internet topologies through network design heuristics. In International TeletrafficCongress (2009), pp. 1–8.
[128] RAMACHANDRAN, A., AND FEAMSTER, N. Understanding the network-level behavior of spammers.In ACM SIGCOMM (2006), pp. 291–302.
[129] RASTI, A. H., MAGHAREI, N., REJAIE, R., AND WILLINGER, W. Eyeball ASes: From geography toconnectivity. In ACM SIGCOMM Internet Measurement Conference (IMC) (2010).
[130] REKHTER, Y., AND LI, T. A border gateway protocol (BGP-4). RFC 4271, January 2006.
[131] Ripe NCC: routing information service. http://www.ripe.net/projects/ris/.
[132] ROUGHAN, M. Fundamental bounds on the accuracy of network performance measurements. InACM SIGMETRICS (June 2005), pp. 253–264.
[133] ROUGHAN, M., GRIFFIN, T., MAO, M., GREENBERG, A., AND FREEMAN, B. IP forwarding anomaliesand improving their detection using multiple data sources. In ACM SIGCOMM Workshop on NetworkTroubleshooting (September 2004), pp. 307–312.
[134] ROUGHAN, M., TUKE, J., AND MAENNEL, O. Bigfoot, Sasquatch, the Yeti and other missing links:what we don’t know about the AS graph. In ACM SIGCOMM Internet Measurement Conference (IMC)(October 2008).
[135] ROUGHAN, M., WILLINGER, W., MAENNEL, O., PEROULI, D., AND BUSH, R. 10 lessons from 10 yearsof measuring and modeling the Internet’s autonomous systems. IEEE Journal on Selected Areas inCommunications (JSAC) 29 (2011), 1810–1821.
[136] SANCHEZ, M., OTTO, J., BISCHOF, Z., CHOFFNES, D., BUSTAMANTE, F., KRISHNAMURTHY, B., AND
WILLINGER, W. Dasu: Pushing experiments to the Internet’s edge. In 10th USENIX NSDI (2013).
[137] SHAIKH, A., AND GREENBERG, A. Experience in black-box OSPF measurement. In ACM SIGCOMMInternet Measurement Conference (IMC) (2001), pp. 113–125.
[138] SHAVITT, Y., AND ZILBERMAN, N. A structural approach for PoP geo-location. In IEEE INFOCOM(2010).
[139] SHAVITT, Y., AND ZILBERMAN, N. Geographical Internet PoP-level maps. In 4th internationalconference on Traffic Monitoring and Analysis (2012), TMA’12, pp. 121–124.
[140] SHERRY, J., KATZ-BASSETT, E., PIMENOVA, M., MADHYASTHA, H., ANDERSON, T., AND KRISH-NAMURTHY, A. Resolving IP aliases with prespecified timestamps. In ACM SIGCOMM InternetMeasurement Conference (IMC) (2010).

[141] SHERWOOD, R., BENDER, A., AND SPRING, N. DisCarte: a disjunctive Internet cartographer. In ACMSIGCOMM (August 2008).
[142] SOMMERS, J., ERIKSSON, B., AND BARFORD, P. On the prevalence and characteristics of MPLSdeployments in the open internet. In ACM SIGCOMM Internet Measurement Conference (IMC)(2011).
[143] SPRING, N., MAHAJAN, R., AND ANDERSON, T. Quantifying the causes of path inflation. In ACMSIGCOMM (2003).
[144] SPRING, N., MAHAJAN, R., AND WETHERALL, D. Measuring ISP topologies with Rocketfuel. In ACMSIGCOMM (August 2002).
[145] STROGATZ, S. Romanesque networks. Nature 433 (2005).
[146] SUBRAMANIAN, L., AGARWAL, S., REXFORD, J., AND KATZ, R. Characterizing the Internet hierarchyfrom multiple vantage points. In IEEE INFOCOM (2002), vol. 2, pp. 618–627.
[147] The Team Cymru bogon reference page. http://www.cymru.com/Bogons/.
[148] TOZAL, M. E., AND SARAC, K. TraceNET: an Internet topology data collector. In ACM SIGCOMMInternet Measurement Conference (IMC) (2010), pp. 356–368.
[149] TOZAL, M. E., AND SARAC, K. Estimating network layer subnet characteristics via statistical sampling.In 11th international IFIP TC 6 conference on Networking – Volume Part I (2012), IFIP’12, pp. 274–288.
[150] TUNE, P., AND ROUGHAN, M. SIGCOMM eBook on Recent Advances in Networking, vol. 1. ACM,2013, ch. Internet Traffic Matrices: A Primer.
[151] VARADHAN, K., GOVINDAN, R., AND ESTRIN, D. Persistent route oscillations in inter-domain routing.Tech. rep., 96-631, USC/ISI, 1996.
[152] VARADHAN, K., GOVINDAN, R., AND ESTRIN, D. Persistent route oscillations in inter-domain routing.Computer Networks (March 2000).
[153] WANG, F., AND GAO, L. On inferring and characterizing Internet routing policies. In ACM SIGCOMMInternet Measurement Conference (IMC) (October 2003).
[154] WANG, Y., KELLER, E., BISKEBORN, B., VAN DER MERWE, J., AND REXFORD, J. Virtual routers onthe move: live router migration as a network-management primitive. In ACM SIGCOMM (2008),pp. 231–242.
[155] WAXMAN, B. M. Routing of multipoint connections. IEEE Journal on Selected Areas in Communica-tions (JSAC) 6, 9 (December 1988), 1617–1622.
[156] WILLINGER, W., ALDERSON, D., AND DOYLE, J. Mathematics and the Internet: A source of enormousconfusion and great potential. Notices of the AMS 56, 5 (2009), 586–599. http://www.ams.org/notices/200905/rtx090500586p.pdf.
[157] WILLINGER, W., ALDERSON, D., DOYLE, J. C., AND LI, L. More "normal" than normal: scalingdistributions and complex systems. In 36th cWinter simulation Conference (2004), pp. 130–141.

[158] WINTER, R. Modeling the Internet routing topology with a known degree of accuracy – in less than24h. In ACM/IEEE/SCS Workshop on Principles of Advanced and Distributed Simulation (PADS)(2009).
[159] XIA, J., AND GAO, L. On the evaluation of AS relationship inferences. In Globecom (2004).
[160] XU, K., DUAN, Z., ZHANG, Z.-L., AND CHANDRASHEKAR, J. On properties of Internet exchangepoints and their impact on AS topology and relationship. LNCS 3042 (2004), 284–295. http://www.springerlink.com/content/umu88q1eewk0e8yy/fulltext.pdf.
[161] YOOK, S.-H., H.JEONG, AND BARABÁSI, A.-L. Modeling the Internet’s large-scale topology. Proceed-ings of the National Academy of Sciences of the USA (PNAS), 99 (2002), 13382–13386.
[162] YOSHIDA, K., KIKUCHI, Y., YAMAMOTO, M., FUJII, Y., NAGAMI, K., NAKAGAWA, I., AND ESAKI, H.Inferring PoP-level ISP topology through end-to-end delay measurement. In Passive and ActiveMeasurement Conference (PAM) (2009), pp. 35–44.
[163] YOSHINOBU, M. What makes our policy messy, 2010. http://www.attn.jp/maz/p/c/bgpworkshop200904/bgpworkshop-policy.pdf.
[164] ZEGURA, E., CALVERT, K., AND BHATTACHARJEE, S. How to model an internetwork. In IEEEINFOCOM (1996), vol. 2, pp. 594–602.
[165] ZEGURA, E. W., CALVERT, K. L., AND DONAHOO, M. J. A quantitative comparison of graph-basedmodels for Internet topology. IEEE/ACM Transactions on Networking 5 (December 1997), 770–783.
[166] ZHANG, B., LIU, R., MASSEY, D., AND ZHANG, L. Collecting the Internet AS-level topology. ACMSIGCOMM Computer Communications Review (CCR) (January 2005).
[167] ZHAO, X., PEI, D., WANG, L., MASSEY, D., MANKIN, A., WU, S. F., AND ZHANG, L. An analysis of BGPmultiple origin AS (MOAS) conflicts. In ACM SIGCOMM Internet Measurement Workshop (IMW)(2001), pp. 31–35.