On intergenerational mobility in Italy
28
On intergenerational mobility in Italy What a difficult future Virtual Presentation Symposium Programme 3-rd International Symposium Shaping Europe 2020: socio – economic challenges Bucharest, 15th – 16th November 2013 Federica Roccisano Catholic University of Milan
-
Upload
lana-mccall -
Category
Documents
-
view
37 -
download
0
description
On intergenerational mobility in Italy. Virtual Presentation Symposium Programme 3-rd International Symposium Shaping Europe 2020: socio – economic challenges Bucharest, 15th – 16th November 2013 Federica Roccisano Catholic University of Milan. What a difficult future. Summary. - PowerPoint PPT Presentation
Transcript of On intergenerational mobility in Italy

On intergenerational mobility in ItalyWhat a difficult future
Virtual Presentation Symposium Programme3-rd International Symposium
Shaping Europe 2020: socio – economic challengesBucharest, 15th – 16th November 2013
Federica RoccisanoCatholic University of Milan

Summary• Introduction• From intergenerational transmission of poverty• …To intergenerational mobility
• Taxonomy• Methodology
• Case study
18/1
0/20
13
2

Introduction
Today the Developed Countries, like the members of the European Union, are heavily prejudiced by numerous factors, like the population aging or the slow birth rates. In this paper we will analyse an important problem linked to this situation: the redistribution of income (intergenerational mobility). Our area of study is one of the most problematic countries in Europe: Italy. To examine the evolution of intergenerational mobility in this Country, we will use data from the Survey of Household Income and Wealth (SHIW). For the analysis on the intergenerational transmission of poverty we’ll use data from the Intergenerational Module of the EU SILC 2005 Module on Intergenerational transmission of poverty and the EU-SILC 2011 Module on Intergenerational Transmission of Disadvantage.
18/1
0/20
13
3

From Intergenerational transmission of poverty…
The trend of intergenerational equity has changed following the evolution of the society during the first half of the 20th Century: before of the two world wars the grandparents of those born in 1940s shared many of the same experiences with their children; while for whom born in 1960 changes in work, employment and politics have produced a lot of benefits.The worst situation regards people born in 1980 and 1990 when workers began to leave their job in increasing numbers and at earlier ages: poverty rates amongst the elder declined while younger households and opportunities rose.
18/1
0/20
13
4

The intergenerational bargain
The intergenerational transmission of poverty is from poor parents to poor children when the living condition, the endowments and the investments on education of parents are not able to get better the socio economic status of their son. That is the so called generational bargain: “the basic idea of the inter-generational bargain is a simple one: in all ‘communities’, from family to globe, there are relationships for the transfer of resources between generations and these relationships carry with them often un-codified ‘rights’ and obligations”. Unfortunately it does not depend just on individual motivations (altruistic or solidaristic), but it is also subject to the Welfare System, the economic conjuncture and the functioning of the societal structures and institutions, all of which can drive inequality and what is transferred to next generation.
18/1
0/20
13
5
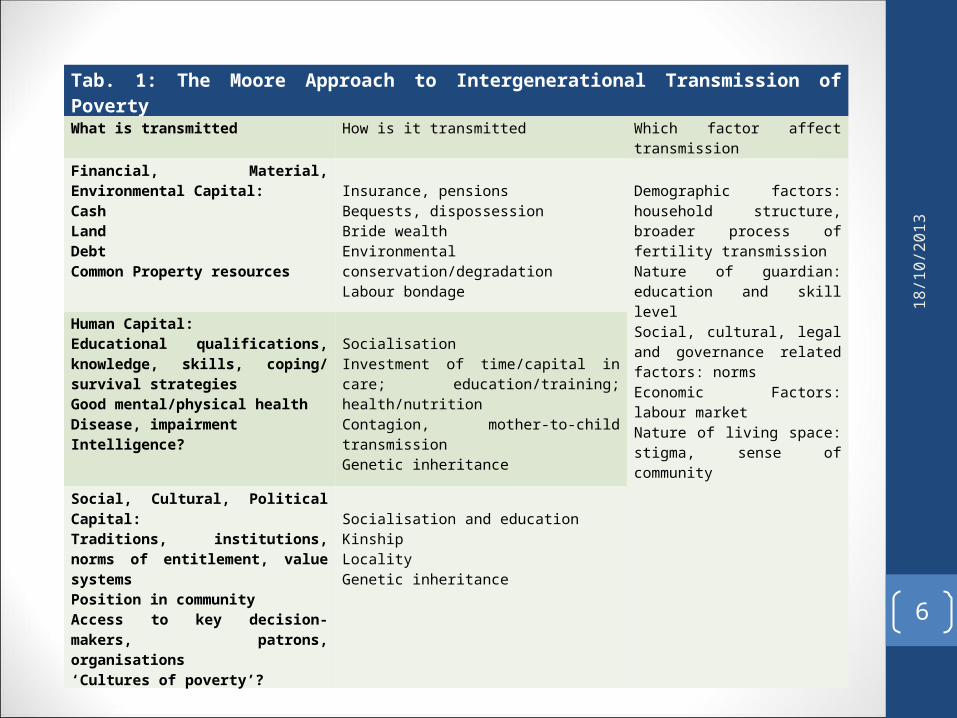
Tab. 1: The Moore Approach to Intergenerational Transmission of Poverty
What is transmitted How is it transmitted Which factor affect transmission
Financial, Material, Environmental Capital:CashLandDebtCommon Property resources
Insurance, pensionsBequests, dispossessionBride wealthEnvironmental conservation/degradationLabour bondage
Demographic factors: household structure, broader process of fertility transmissionNature of guardian: education and skill levelSocial, cultural, legal and governance related factors: normsEconomic Factors: labour marketNature of living space: stigma, sense of community
Human Capital:Educational qualifications, knowledge, skills, coping/ survival strategiesGood mental/physical healthDisease, impairmentIntelligence?
SocialisationInvestment of time/capital in care; education/training; health/nutritionContagion, mother-to-child transmissionGenetic inheritance
Social, Cultural, Political Capital:Traditions, institutions, norms of entitlement, value systemsPosition in communityAccess to key decision-makers, patrons, organisations‘Cultures of poverty’?
Socialisation and educationKinshipLocalityGenetic inheritance
18/1
0/20
13
6
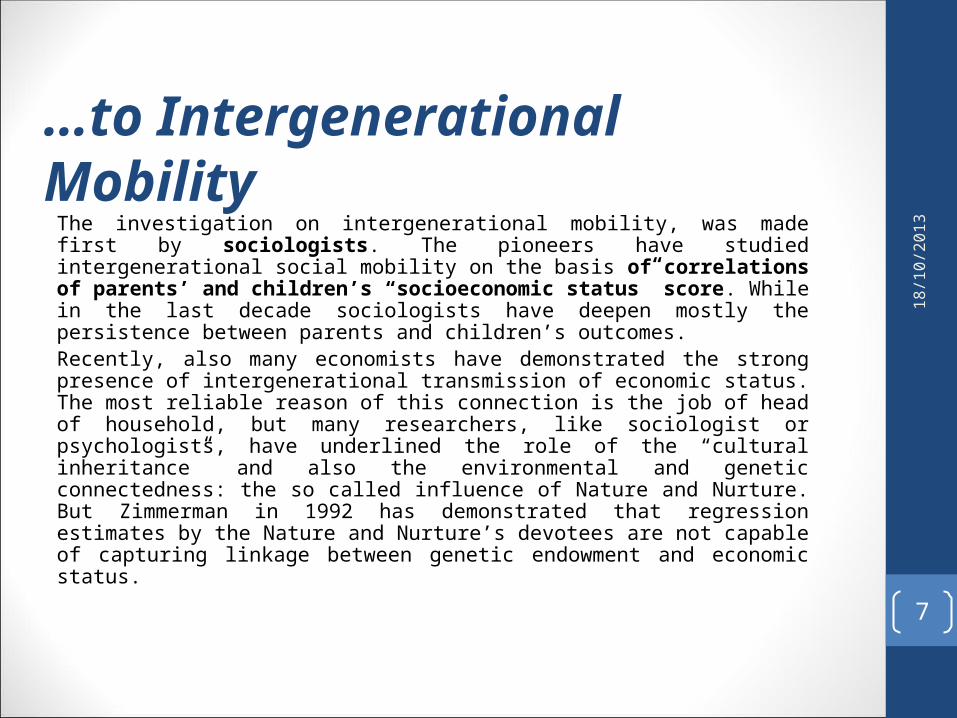
…to Intergenerational Mobility The investigation on intergenerational mobility, was made first by sociologists. The pioneers have studied intergenerational social mobility on the basis of correlations of parents’ and children’s “socioeconomic status” score. While in the last decade sociologists have deepen mostly the persistence between parents and children’s outcomes. Recently, also many economists have demonstrated the strong presence of intergenerational transmission of economic status. The most reliable reason of this connection is the job of head of household, but many researchers, like sociologist or psychologists, have underlined the role of the “cultural inheritance” and also the environmental and genetic connectedness: the so called influence of Nature and Nurture. But Zimmerman in 1992 has demonstrated that regression estimates by the Nature and Nurture’s devotees are not capable of capturing linkage between genetic endowment and economic status.
18/1
0/20
13
7

Authors Country and data set Measures of income Sample size Age of sons Estimate of β Comments
Solon (1992) USPSID
1) Annual Earnings2) Hourly Wage3) Family income
348 fathers-son pairs 25-33 1) TA: 0.411) IV: 0.53 2) IV: 0.45 3) IV: 0.53
S. showed that the TA-technique provide a downwards biased estimate and the IV technique an upwards bias.
Zimmerman (1992) USNLS
1) Wage + salaries2) Hourly Wage3) Duncan Index of status
876 fathers-son pairs, but fewer in most estimations
29-39 1) TA: 0.541) MM: 0.41 2) TA: 0.392) MM: 0.38 3) TA: 0.33
The presented estimate are elasticities, which are close to the correlationsthat are reported in the paper.Z. also presented IV estimates that are close to those obtained by TA and MM techniques.
Dearden et al.(1996
Britain, NationalChild DevelopmentSurvey
Weekly wages 1565 pairs of fathersand sons
31 IV: 0.59TSIV: 0.39
The presented estimates are elasticities.
Corak & Heisz(1999)
Canada , registerdata
1. Annual earnings2. Annual market income
≈ 350 000 pairs offathers and sons
28–31 1) TA: 0.132) 0.19
The estimates are elasticities.Non-linearities implying greater mobility at the lower end of the distribution were found.
Jäntti & Österbacka(1995)
Finland, registerdata
Annual earnings 22 324 pairs of fathersand sons
Average age:34.8
TA: 0,20
Björklund &jäntti(1997)
Sweden, Level ofLiving Surveys United States,PSID
1. Annual earnings2. Market income (incl.income of capital) Annual earnings
400 sons, 500 fathers About the same asSolon
29–38 28–36
1) TSIV: 0.232) TSIV: 0.29 TSIV: 0.33
The Swedish data set lacks information on fathers’ age which is not controlled for in the estimations of neither the Swedish nor the US ρ.Adding such controls for the USraises the correlations by around0.05. The method and data set differslightly from the one used by Solon,but is the same for both countries.
8

9

Author Country and dataset Measure of income Sample Size Age of sons Estimate of β Methodology Comments
Piraino(2006)
ItalySHIW
Income from labour 612 fathers-son pairs 231fathers-son pairs
30-45 TS2SLS: 0,50PI: 0,37 CR: 0.35
1) Classical equation about income mobility by SolonTS2SLS EstimatorPredicted IncomeCo-residing 2) Transition Matrix by income classes
Matters of family background and educational attainents!
Mocetti S.(2007)
ItalySHIW
Earnings 4900 fathers3200 sons
30-50 1): 0.502): 0,61
1) Classical equation about income mobility by SolonTS2SLS Estimator 2) Quintile regression can provide a more complete statistical analysis of the intergenerational relationship across the distribution of sons’ income.2SQR Estimator
The degree of intergenerational income mobility in Italy is lower than that observed in other developed countries.Education obviously plays a crucial role in explaining social outcomes and in accounting for long term mobility. School decisions are affected by family background. Parental education and socioeconomic status appear to be the main determinants of educational choice, and this reinforces intergenerational immobility.About the occupational immobility: in some cases, it is linked to the existence of entry barriers limiting access to certain professions, or to the intergenerational handing-down of control of the family …firm. In other cases, it is the natural outcome of educational stratification.
Nolan (2012)
EUEUSILC
1. Financial Distress2. Income Poverty3. Deprivation
“The EU-SILC Intergenerational Module appears to offer an unprecedented opportunity to conduct a comparative analysis of the relationship between current poverty and social exclusion outcomes and parental characteristics and childhood economic circumstances. However, as our analysis reveals, serious problems relating to the scale of missing values and major reservations about the comparability of key variables means that the results of any such analysis must be treated with considerable caution.”
10

18/1
0/20
13
11
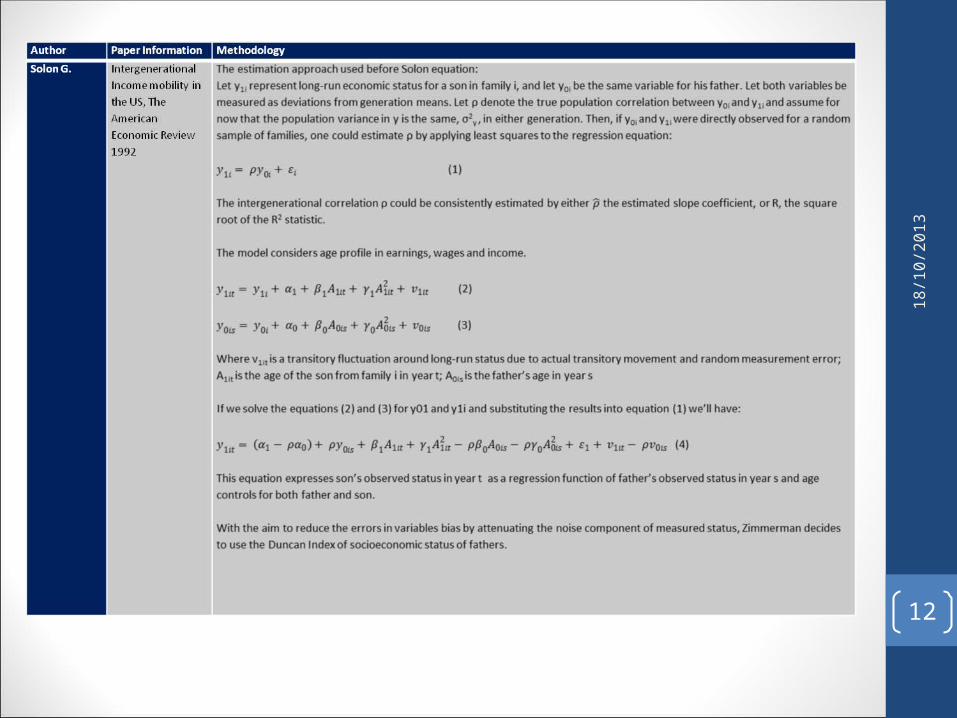
About methodology: three milestones
18/1
0/20
13
12
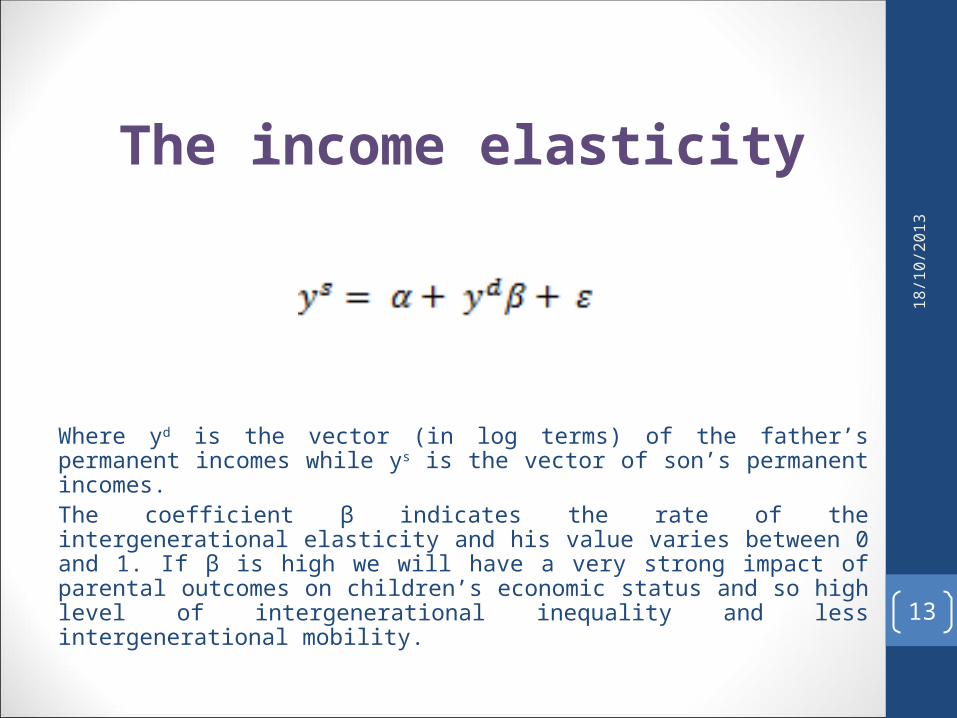
The income elasticity
18/1
0/20
13
13
Where yd is the vector (in log terms) of the father’s permanent incomes while ys is the vector of son’s permanent incomes.The coefficient β indicates the rate of the intergenerational elasticity and his value varies between 0 and 1. If β is high we will have a very strong impact of parental outcomes on children’s economic status and so high level of intergenerational inequality and less intergenerational mobility.

The intergenerational correlation
A recent alternative to the elasticity β is the intergenerational correlation (ρ) or the correlation between the log earnings of the two individuals (father and son) that is equals to the elasticity only if the standard deviation σ of log earnings is the same for both generations: 18
/10/
2013
14

About the preferable value of the intergenerational mobility
At the beginning researchers like Becker and Tomes, studying the condition of United States, expected that the better value of the intergenerational elasticity should be 0,2 or less. But after some years Solon and Zimmerman showed how it is possible to talk about a mobile society also if the value of β is bigger: considering the average of income over some years (from 4 to 10) it is possible to have a better estimation of permanent income capacity and the value of intergenerational elasticity could be also 0,4. More recent studies, founded another time on the US condition, argue that the most preferable value of β is around 0,6.
18/1
0/20
13
15

International Comparable Estimates of Intergenerational Mobility
Country Dataset Sons Born Sons Earnings Measure Measure of Parental Status Value of β
Britain British Cohort Study 1970 2000 (Age 30) Parental Income Average 1980-86 0.271
US Panel Study of Income Dynamics 1954-70 Age 30 Parental income when son were 10-16 (average)
0.289
West Germany Socio-Economic Panel 1960-73 2000 Parental Income 1984-88 (average) 0.171
Canada Intergenerational Income Data (from tax register)
1967-70 1998 Parental Income when son aged 16 0.143
Norway Register Data 1958 1992 and 1999 (average) Father’s earnings 1974 0.139
Denmark Register Data 1958-60 1998 and 2000 Father’s earnings 1980 0.143
Sweden Register Data 1962 1996 and 1999 Father’s earnings 1975 0.143
Finland Quinquennial Census 1958-60 1995 and 2000 (average) Father’s earnings 1975 0.147
18/1
0/20
13
16

CASE STUDY
The situation of Italy
18/1
0/20
13
17

«Poor young»The actual situation of Italy is really difficult because of the global financial crisis, the high level of public debt and unemployment and the low level of GDP growth rate. As we can said in the previous page all the institutions (state, market and community) concur to determine the intergenerational transmission of poverty.
18/1
0/20
13
18
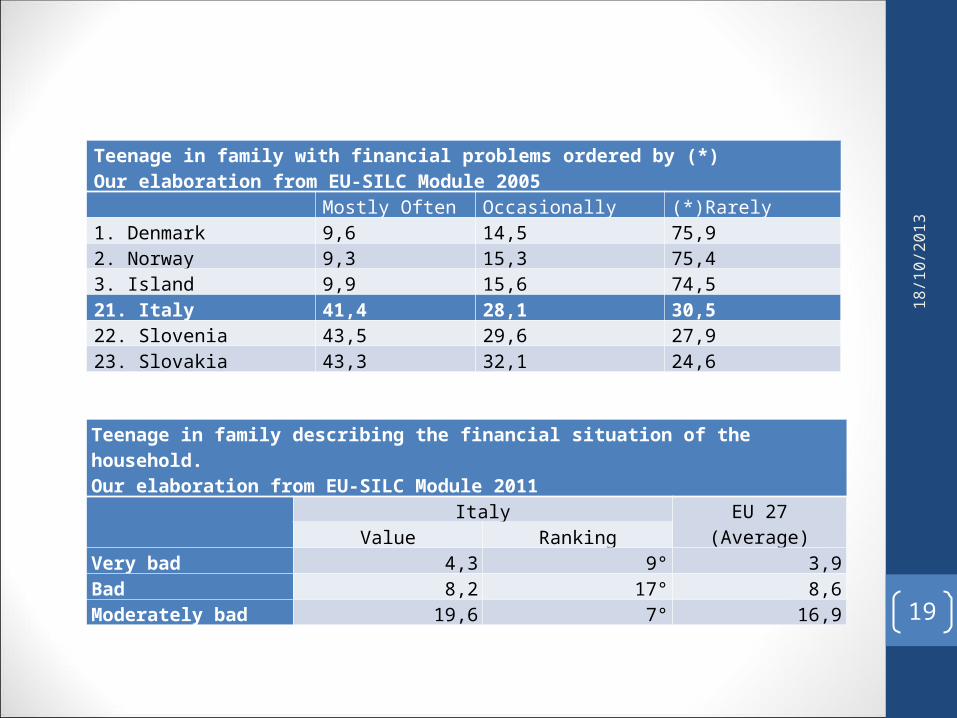
Teenage in family with financial problems ordered by (*) Our elaboration from EU-SILC Module 2005
Mostly Often Occasionally (*)Rarely1. Denmark 9,6 14,5 75,92. Norway 9,3 15,3 75,43. Island 9,9 15,6 74,521. Italy 41,4 28,1 30,522. Slovenia 43,5 29,6 27,923. Slovakia 43,3 32,1 24,6
Teenage in family describing the financial situation of the household. Our elaboration from EU-SILC Module 2011
Italy EU 27 (Average)
Value RankingVery bad 4,3 9° 3,9Bad 8,2 17° 8,6Moderately bad 19,6 7° 16,9
18/1
0/20
13
19
Intergenerational Mobility: the model
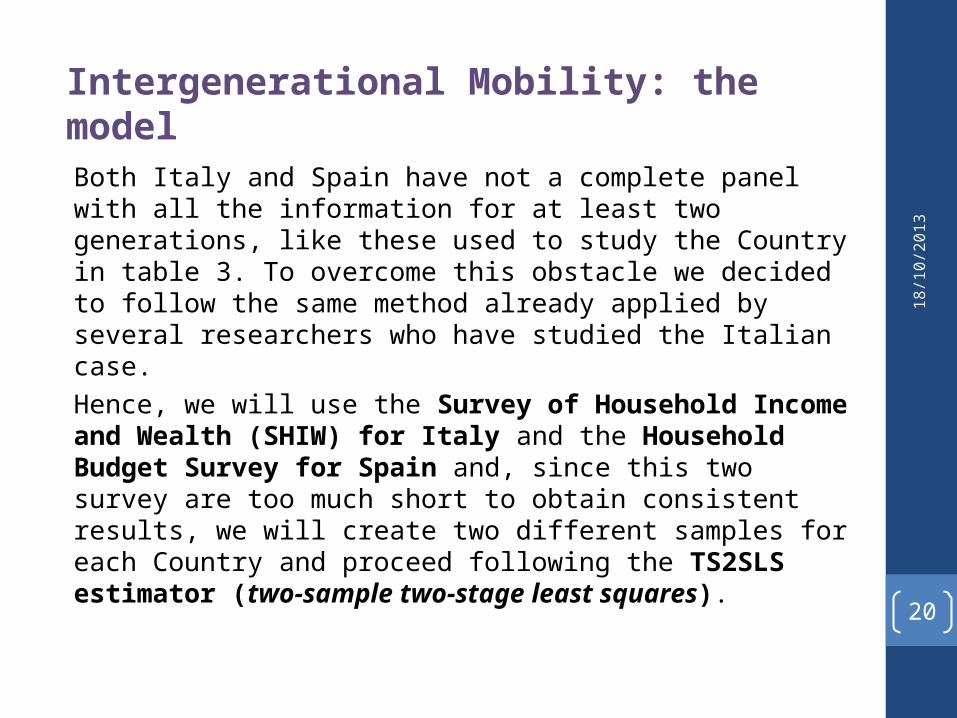
Both Italy and Spain have not a complete panel with all the information for at least two generations, like these used to study the Country in table 3. To overcome this obstacle we decided to follow the same method already applied by several researchers who have studied the Italian case. Hence, we will use the Survey of Household Income and Wealth (SHIW) for Italy and the Household Budget Survey for Spain and, since this two survey are too much short to obtain consistent results, we will create two different samples for each Country and proceed following the TS2SLS estimator (two-sample two-stage least squares).
18/1
0/20
13
20

We have to construct a first sample with the information on our pseudo – fathers: income, study level, occupation, geographical area. On this first sample we run a regression:
18/1
0/20
13
21
It’s important to underline that we don’t consider gender information because in our model we’ll not consider the income of the breadwinner but just the income of fathers.
Time-invariant determinants (geographical area, study level, occupation, income) Time-variant determinants (age)
Time-invariant and ususal disturbance
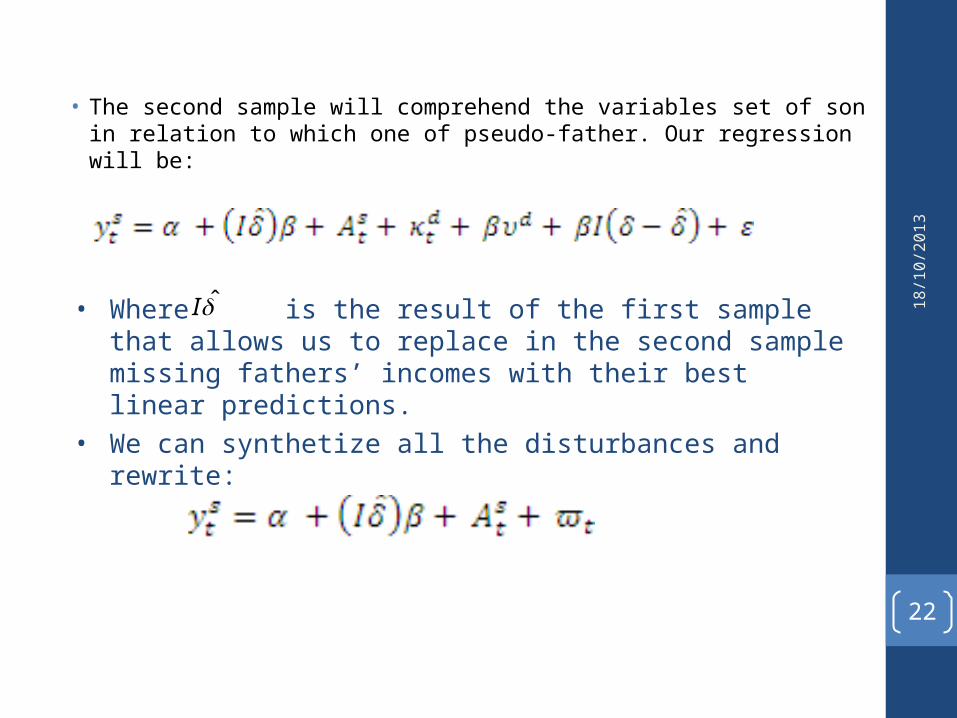
• The second sample will comprehend the variables set of son in relation to which one of pseudo-father. Our regression will be:
18/1
0/20
13
22
• Where is the result of the first sample that allows us to replace in the second sample missing fathers’ incomes with their best linear predictions.
• We can synthetize all the disturbances and rewrite:
I

Descriptive statistics for selected fathers and sons
Pseudo-Fathers(years 1984-
1986)
Sons’ report of fathers
characteristics(years 2008-2010)
Num 3.224 786Mean Age 41,99 41,22
Mean LogWage
9,78 --
Mean Study 3,11 2,54
Mean worksec
3,98 2,79
Mean Workqual
2,65 3,15
Study :1= no school 2= elementary school 3=lower secondary school 4= high school 5=bachelor 6=specializationWork Sec:1= agriculture 2= industry 3= P.A. 4= commerce, handcraft, servicesWork Qual:1= factory worker 2=employee 3=teacher 4=official 5=executive 6= freelancer 7=entrepreneur 8=self-employee 9=unoccupied
18/1
0/20
13
23

The Italian case
18/1
0/20
13
24
First-stage regression of pseudo-fathers income on five variables
N=3203
R2=0.1989
Variables coefficient Robust st. error t
Study 0.106 0.061 1.75
YearStudy 0.025 0.014 1.72
WorkSect -0.030 0.004 -7.30
WorkQual 0.034 0.004 8.31
Cons 9.387 0.068 138.55
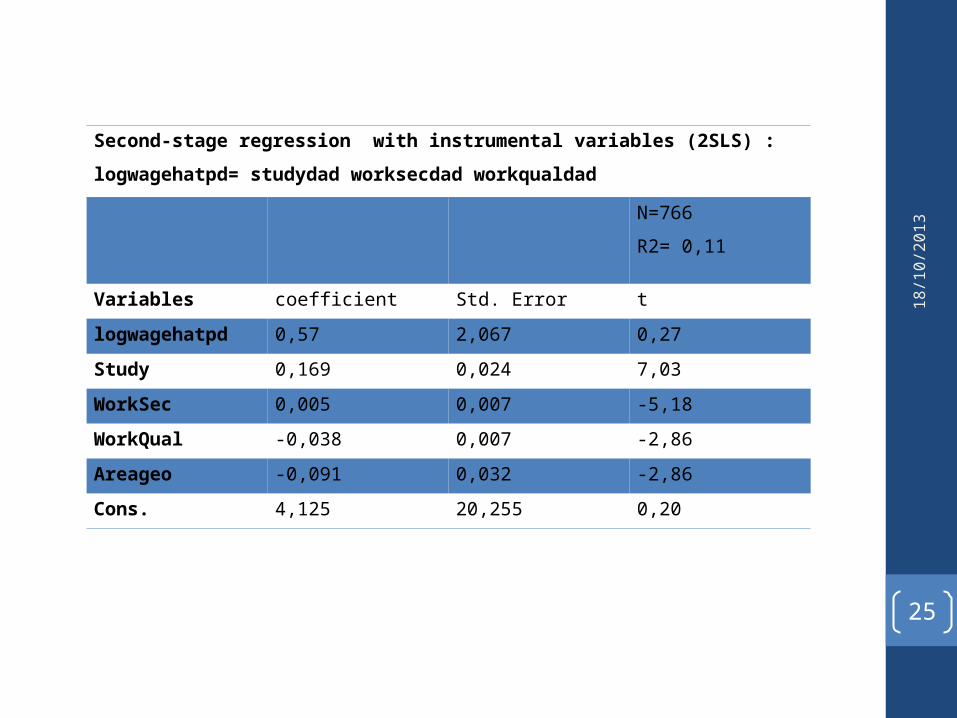
Second-stage regression with instrumental variables (2SLS) :
logwagehatpd= studydad worksecdad workqualdad
N=766
R2= 0,11
Variables coefficient Std. Error t
logwagehatpd 0,57 2,067 0,27
Study 0,169 0,024 7,03
WorkSec 0,005 0,007 -5,18
WorkQual -0,038 0,007 -2,86
Areageo -0,091 0,032 -2,86
Cons. 4,125 20,255 0,20
18/1
0/20
13
25
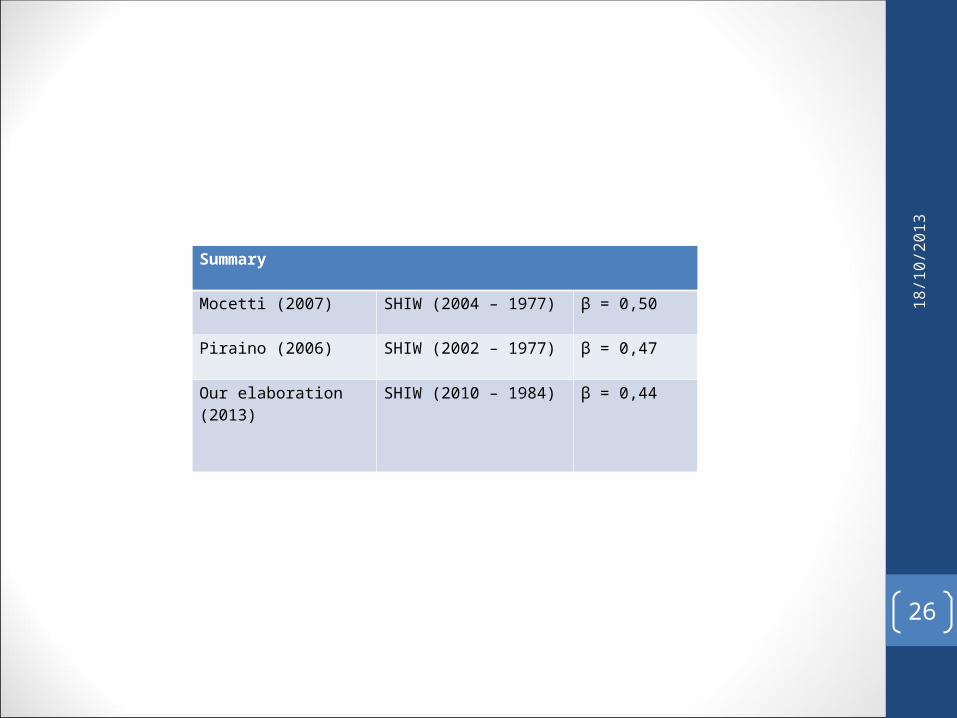
Summary
Mocetti (2007) SHIW (2004 – 1977) β = 0,50
Piraino (2006) SHIW (2002 – 1977) β = 0,47
Our elaboration (2013) SHIW (2010 – 1984) β = 0,44
18/1
0/20
13
26

Concluding RemarksIn this paper we try to describe the situation of young people in Italy, considering in the firsts paragraphs the intergenerational transmission of poverty, and so the perception of teenage about the financial situation of their family, while in the core of the paper we deepen the intergenerational mobility.What emerge is that to analyze the Italian situation is not easy because of the lack of data and the difficulty to work on a survey that includes information from two generations of the same family, like we have in the British Cohort Study or the Panel Study of Income Dynamics of US. These differences make difficult also to compare the intergenerational mobility rate of Italy with which one of other Countries.Anyway we have try to minimize the disparity and to have much more complete description of the Italian case we have compared our results with which one of Mocetti and Piraino that in the last years have made a similar analysis of Italian case. From this comparison we can say is that Italy is a not mobile society and that occur to intervene to prevent the pauperization of young people.
18/1
0/20
13
27

Thank you for your attention Thank you for your attention
18/1
0/20
13
28