
On-Board Transit Survey Presentation to TCC Dec. 13, 2002 Heather Alhadeff, AICP 404.463.3275...
36
On-Board Transit Survey Presentation to TCC Dec. 13, 2002 Heather Alhadeff, AICP 404.463.3275 [email protected] om
-
Upload
daniel-casey -
Category
Documents
-
view
215 -
download
0
Transcript of On-Board Transit Survey Presentation to TCC Dec. 13, 2002 Heather Alhadeff, AICP 404.463.3275...

Purpose
• Conduct survey that is significant for its focus on regional travel patterns
• Results will be used to update data inputs for ARC’s regional travel demand model

Background• MARTA, CCT, Clayton, and Gwinnett
County transit systems were surveyed between 10/13/01 and 12/09/01.
• For a “true” picture of ridership characteristics, Clayton and Gwinnett were re-surveyed in February 2002 – Allowing them to “mature” over a three to
four month period after service initiation.

Report Includes
• Data collection: origin and destination, demographics, access and egress modes, and public transit use.
• Review of Existing Transit Operations.
• A database interface was created between ArcView and Access to allow the end user to create tables and maps by selecting specific criteria such as route, time-of-day, weekday/weekend.

Sampling Methods (buses)• For efficiency, the sampling methodology
is based on three principles, stratification, variability, and trip clustering.
• 1st stage: Sample of weekday (and some weekend) revenue bus trips – roughly an 80%/20% split among weekday and weekend trips, which matches the actual service split for MARTA overall.
• 2nd: Survey of passengers boarding the sampled bus trips.

Survey Questionnaire

Surveys by System
• Overall response rate was 33%
• The response rate by system was: – 46% for MARTA Rail
– 29% for MARTA Bus
– 62% for Clayton
– 38% for CCT
System Weekday Weekend Total
MARTA 17,643 4,360 22,003
MARTA Rail 6,316 1,154 7,470
CLAYTON 372 67 439
CCT 1,075 141 1,216
GCT 116 0 116
25,522 5,722 31,244 Total
82% 18% 100%


Trip Origin
• Region-wide, 48% of trips began at home– MARTA Rail (53%)
– MARTA bus (44%)
– CCT (53%)
– Gwinnett and Clayton (64%)
• 30% began their sampled trip from work.

Trip Origin (cont’d)
0%
5%
10%
15%
20%
25%
30%
35%
40%
45%
50%
55%
60%
65%
% o
f R
eg
ion
al T
rip
Ori
gin
s
Work Home Shopping Restaurant Doctors
office\Hospital
Grade\High\Vocational
school
College Social\Church or
Other Personal
Trip Origin
MARTA Bus
MARTA Rail
CCT
Gwinnett/Clayton


Trip Purpose
• Weekday: MARTA one-in five & CCT, Gwinnett/Clayton one-in-ten passengers made a discretionary trip.
• Weekend: twenty-five percent more riders use transit for discretionary (43%) trips

DestinationsWeekday:
– MARTA:• Work and home share similar
percentages (36%)
– Gwinnett/Clayton• Home (17%) Work (63%)
– CCT • Home (29%) Work (47%)
Weekend Overall: – Home 27% (exception CCT 9%)
– Work 26% (exception CCT 40%)

Trip Destinations (cont’d)
0
10,000
20,000
30,000
40,000
50,000
60,000
70,000
80,000
90,000
100,000
MARTA Bus 52,867 57,794 8,489 1,203 5,788 5,772 5,184 16,662
MARTA Rail 38,617 32,738 3,470 658 1,771 2,419 4,663 14,155
CCT 4,349 2,703 309 75 188 148 519 894
Gwinnett/Clayton 222 61 14 3 7 7 9 29
Total 96,055 93,296 12,282 1,939 7,754 8,346 10,375 31,740
Work HomeShoppin
gRestaura
nt
Doctors office\Ho
spital
Grade\High\Vocat
ional College
Social\Church or Other


All Transit and Auto Trips by Time of Day
0%
2%
4%
6%
8%
10%
12%
14%
16%
1 2 3 4 5 6 7 8 9 10 11 12 13 14 15 16 17 18 19 20 21 22 23 24
Transit Trips
Auto Trips

Transit Trip Duration
1% 1% 3% 4% 3%
7%
16%
20%
26%
11%
7%
1%
0%
5%
10%
15%
20%
25%
30%
Reported Minutes

Methods of Transit AccessDuring the week and weekend ~60% accessed public
transitby walking & 20% transferred from another bus or train.
Bus access is dominated by walk mode.
• MARTA rail:– 31% of weekday & 17% of weekend drove a car and parked
• CCT:– 23 % of weekday & 10% of weekend began using private transit,
such as taxi or shuttle/vanpool service.
• Gwinnett and Clayton:– 33% of weekday & 70% of weekend walked
– 42% accessed public transit from a automobile (kiss n’ ride, taxi, etc.)

0%
10%
20%
30%
40%
50%
60%
70%
Walked Bicycle Rode with someone
who parked
Shuttle\Vanpool Taxi Drov e a car and
parked
Transferred from bus Was dropped off by
someone
Transferred from
MARTA rail
Access Mode
MARTA Bus MARTA Rail CCT Gwinnett/Clayton Total
How did you GET TO where you boarded this bus or train?


Egress mode
• Region-wide, weekday/end ridership are similar. 63% walked after the conclusion of their one-way transit trip
• Second most popular method of egress:– Over 31% of Gwinnett/Clayton transferred to another
bus/rail
– “Drive a car” is the second most frequent method of egress for weekday MARTA rail users (3rd for weekend)
– MARTA bus users- “Transfer to Marta rail” or bus (tied 13%)
– Remaining systems- “Transfer to a bus” CCT (15%), MARTA rail (14%), and MARTA bus (12%) Gwinnett and Clayton (21%)

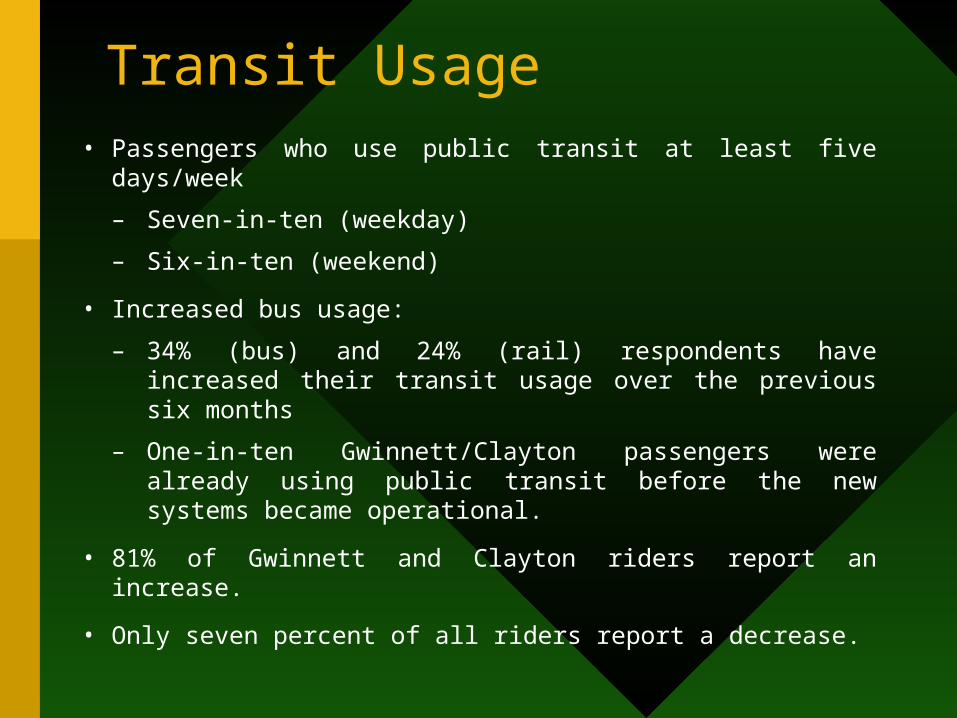
Transit Usage• Passengers who use public transit at least five
days/week
– Seven-in-ten (weekday)
– Six-in-ten (weekend)
• Increased bus usage:
– 34% (bus) and 24% (rail) respondents have increased their transit usage over the previous six months
– One-in-ten Gwinnett/Clayton passengers were already using public transit before the new systems became operational.
• 81% of Gwinnett and Clayton riders report an increase.
• Only seven percent of all riders report a decrease.

Think of your use of public transit over the past six months. Which of the
following applies to you?
0
20,000
40,000
60,000
80,000
100,000
120,000
Change in Transit Usage
MARTA Bus 81,979 41,555 8,855 4,807 35,013 24,618
MARTA Rail 20,240 34,379 4,113 2,861 17,287 30,058
CCT 5,331 1,520 699 279 2,345 990
Gwinnett/Clayton 281 90 13 23 37 15
Total 107,831 77,544 13,680 7,970 54,682 55,681
Now using
buses more
Now using
rail more
Now using
buses less
Now using
rail less
Hasn't
changed my
bus use
Haven't
changed my
rail use

• Did not have a vehicle:– All: weekday (42%) & weekend (47%)
– MARTA rail: weekday (25%) & weekend (38%)
– MARTA bus: weekday (52%) & weekend (55%)
– Gwinnett/Clayton: weekday (31%) & weekend (38%)
How many vehicles are in Running Condition
& Available to Your Household?

If bus or rail service was not available, how would you MAKE
THIS TRIP?
• No transit available:– The majority would either drive weekday (31%)
or catch a ride with someone weekend (30%)
– “Weekday (20%) & 22% of weekend respondents would not have made the sampled trip if public transit service were not available.
• Of those who would not make the trip:– Region-wide, 72% would not take a work or home trip
– Weekday (38%) & Weekend (22%) would not go to work

Alternative Method of Travel by Income
Income Drive Walk Ride w/ Someone Taxi Bicycle Would Not
Go
0-20k 10% 14% 27% 12% 2% 28%
20k-40k 21% 8% 29% 13% 2% 22%
40k-60k 37% 7% 24% 9% 1% 17%
60k-80k 45% 5% 19% 7% 1% 12%
>80k 59% 3% 15% 7% 2% 8%
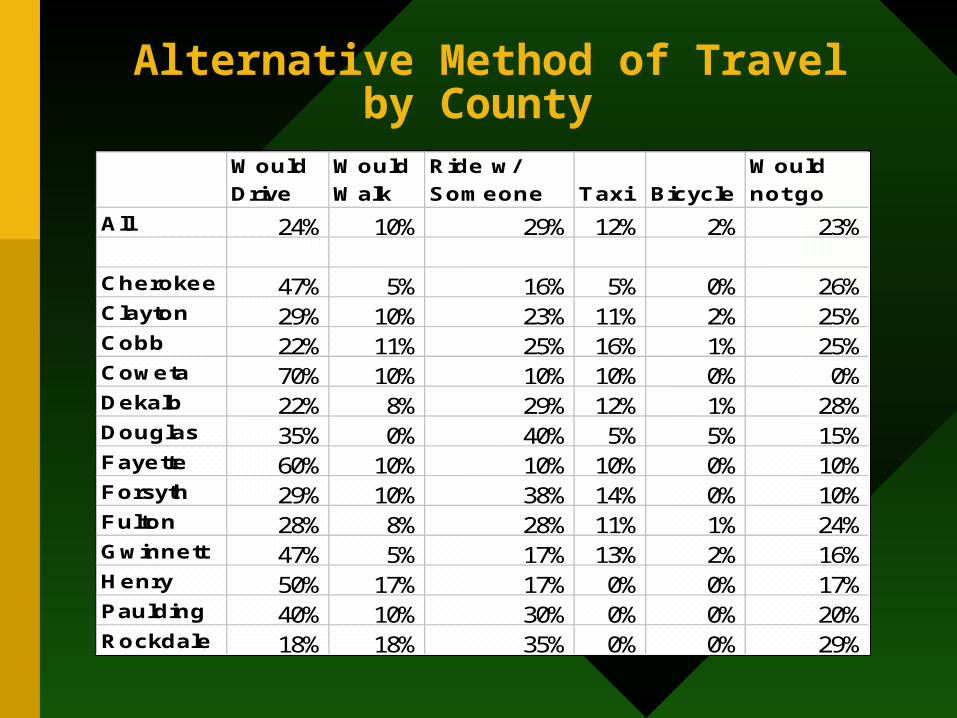
Alternative Method of Travel by County
Would Drive
Would Walk
Ride w/ Someone Taxi Bicycle
Would not go
All 24% 10% 29% 12% 2% 23%
Cherokee 47% 5% 16% 5% 0% 26%Clayton 29% 10% 23% 11% 2% 25%Cobb 22% 11% 25% 16% 1% 25%Coweta 70% 10% 10% 10% 0% 0%Dekalb 22% 8% 29% 12% 1% 28%Douglas 35% 0% 40% 5% 5% 15%Fayette 60% 10% 10% 10% 0% 10%Forsyth 29% 10% 38% 14% 0% 10%Fulton 28% 8% 28% 11% 1% 24%Gwinnett 47% 5% 17% 13% 2% 16%Henry 50% 17% 17% 0% 0% 17%Paulding 40% 10% 30% 0% 0% 20%Rockdale 18% 18% 35% 0% 0% 29%

Demographics• Both weekday and weekend (~70%) respondents are
African-American. Weekday (19%) and weekend (15%) respondents are White.
• Gender is split almost 50/50 (slightly more males on weekend).
• Age 25-39 was the most frequent response.
• Weekend respondents are slightly younger than weekday respondents with 31% weekend and 26% weekday respondents between the ages of 16 and 24.
• Nearly one-in-three weekday and weekend passengers have at least three other persons in their household.

Income
• Weekend & weekday over 55% have an annual household income of less than $30,000.
• Weekday (20%) weekend (15%) have an income of $60,000 or more.
• More affluent passengers use the MARTA rail and Gwinnett/Clayton systems.

Household Size and Income
56%
25%12%
6%
0%
20%
40%
60%
80%
100%
Low Mid High-Mid High
Household Size by Income
•Household Size•
•Household Income•
•1• •2• •3• •4+•
•Total•
•13,140• •18,058• •13,350• •19,395• •63,943• •Low •
•($0 to $29,999)• •62%• •56%• •53%• •55%• •56%•
•6,723• •8,959• •6,055• •9,701• •31,438• •Mid•
•($30,000 to $59,999)• •32%• •28%• •24%• •28%• •28%•
•1,238• •3,827• •3,515• •3,858• •12,438• •High•-•Mid•
•($60,•000 to $99,999)• •6%• •12%• •14%• •11%• •11%•
•49• •1,447• •2,302• •2,171• •5,969• •High•
•($100,000 or more)• •0%• •4%• •9%• •6%• •5%•
•21,150• •32,291• •25,222• •35,125• •113,788•
•Total•
•100%• •100%• •100%• •100%• •100%•
•

Trip Chain by Income
Less Than $20,000 $20,000-$40,000 $40,000-$60,000 $60,000-$80,000 Greater Than $80,000
1 Walk-Bus-Walk
(1615) Walk-Bus-Walk
(1270) Walk-Bus-Walk
(435) Walk-Bus-Walk
(161) SOV-Rail-Walk
(169)
2 Rail-Bus-Walk
(644) Rail-Bus-Walk
(611) Rail-Bus-Walk
(187) SOV-Rail-Walk
(85) Walk-Bus-Walk
(124)
3 Walk-Bus-Rail
(594) Walk-Bus-Rail
(489) Walk-Bus-Rail
(183) Rail-Bus-Walk
(84) Walk-Rail-Walk
(77)
4 Walk-Bus-Bus
(483) Walk-Bus-Bus
(359) Walk-Bus-Bus
(118) Walk-Bus-Rail
(61) Rail-Bus-Walk
(70)
5 Bus-Bus-Walk
(360) Bus-Bus-Walk
(288) SOV-Rail-Walk
(98) Walk-Bus-Bus
(51) SOV-Bus-Walk
(65)
Observations 5629 4688 1801 867 1062
Payment Method
• 50% used a pass to pay for their trip.
• Weekday: (31%) respondents used a Monthly TransCard, 28% used Weekly TransCard.
• A higher percentage of weekend respondents used a Weekly TransCard (31%) than a Monthly TransCard (23%).

Conclusions
• During the week, public transit in the Atlanta region is mainly used for non-discretionary trips.
• 42% of all weekday respondents (52% of MARTA bus) do not have a vehicle
• During the week and weekend, nearly 60% access public transit by walking.
• More than 70% weekday passengers use public transit for their trip at least five days per week (mainly for work purposes).
Incentive Winners• Grand Prize (One Year of Monthly Passes -$630 Value)
– George Williams of College Park
• Second Prize (6 Months of Monthly Passes -$315 Value)
– Earnest Coer of Atlanta
• Third Prize (1 Monthly Pass to 5 Winners -52.50 Value)
– Jenea Welch of Atlanta
– Julian Brown of Atlanta
– Yvonne Riggins of Tucker
– Remaining Winners Did Not Want to Be Announced

Thanks For Your Time!
• Any general ?’s