Olympia in Hamburg: managing plastic marine debris
11
Urban Material Cycles – Plastic Marine Debris – Heather Troutman 1 HafenCity Universität Hamburg M. Sc. Resource Efficiency in Architecture and Planning (REAP) Urban Material Cycles Summer Semester 2015 Final Report Projecting plastic marine debris inputs from hosting the 2024 Olympic games in the harbor of Hamburg, Germany Submitted to: Professor Dr. Kerstin Kuchta On: Wednesday, September 30 th , 2015 Contributing Authors Troutman, Heather : 6028601 Abstract Hosting visitors from all over the world obligates Hamburg, and all of Germany, to share her vast knowledge base on sustainable environmental management. This study projects that at least 158 tonnes of plastic debris could enter the river Elbe during the proposed 2024 Hamburg Olympic Games and potentially drift to the North Sea if progressive actions are not taken to – first – avoid plastic waste generation at the games, and – second – to recover all plastics waste that is generated.
-
Upload
heather-troutman -
Category
Sports
-
view
330 -
download
1
Transcript of Olympia in Hamburg: managing plastic marine debris

Urban Material Cycles – Plastic Marine Debris – Heather Troutman 1
HafenCity Universität Hamburg
M. Sc. Resource Efficiency in Architecture and Planning (REAP) Urban Material Cycles Summer Semester 2015
Final Report Projecting plastic marine debris inputs from hosting the 2024
Olympic games in the harbor of Hamburg, Germany
Submitted to: Professor Dr. Kerstin Kuchta On: Wednesday, September 30th, 2015
Contributing Authors Troutman, Heather : 6028601
Abstract
Hosting visitors from all over the world obligates Hamburg, and all of Germany, to share her vast knowledge base on sustainable environmental management. This study projects that at least 158 tonnes of plastic debris could enter the river Elbe during the proposed 2024 Hamburg Olympic Games and potentially drift to the North Sea if progressive actions are not taken to – first – avoid plastic waste generation at the games, and – second – to recover all plastics waste that is generated.

Urban Material Cycles – Plastic Marine Debris – Heather Troutman 2
Table of Contents
1. Introduction…………………..………………………………………………………………………….03 2. Quantifying Plastic Waste Litter………………………………………………………………..04 3. Hamburg as a Harbor City……………………..…………………………………………………..05 4. Best Practices to Avoid Plastic Litter……..…………………………………………………..06 4.1. Sydney Games……………………………………………………………………………………..06 4.2. London Games…………………………………………………………………………………….06 4.3. Recommendations of the Author……………………………………………………...…07 5. Conclusion…………………………………………………………………………………………………09
Figures, Tables and Graphs
Figure 1: Growth in plastic production 1950-‐2012……………….………………………03 Figure 2: Worldwide annual plastic consumption…………………………………………03 Figure 3: EU27 plastic consumption by product category………..……………………03 Figure 4: The River Elbe……………..…………………………………………………………………05 Figure 5: Ebbe und Flut der Elbe……………………………………………………………………05 Figure 6: Variability of the River Elbe……………………………………………………………05 Figure 7: Public Water Stations…………………………………………..…………………………07 Figure 8: Event Souvenir Cup……...…………………………………………………………………07 Figure 9: Universiallly Intuitative Signage……………….……………………………………08 Figure 10 Ambiguous Signage ………………………………………………………………………08
Urban Material Cycles – Plastic Marine Debris – Heather Troutman 3
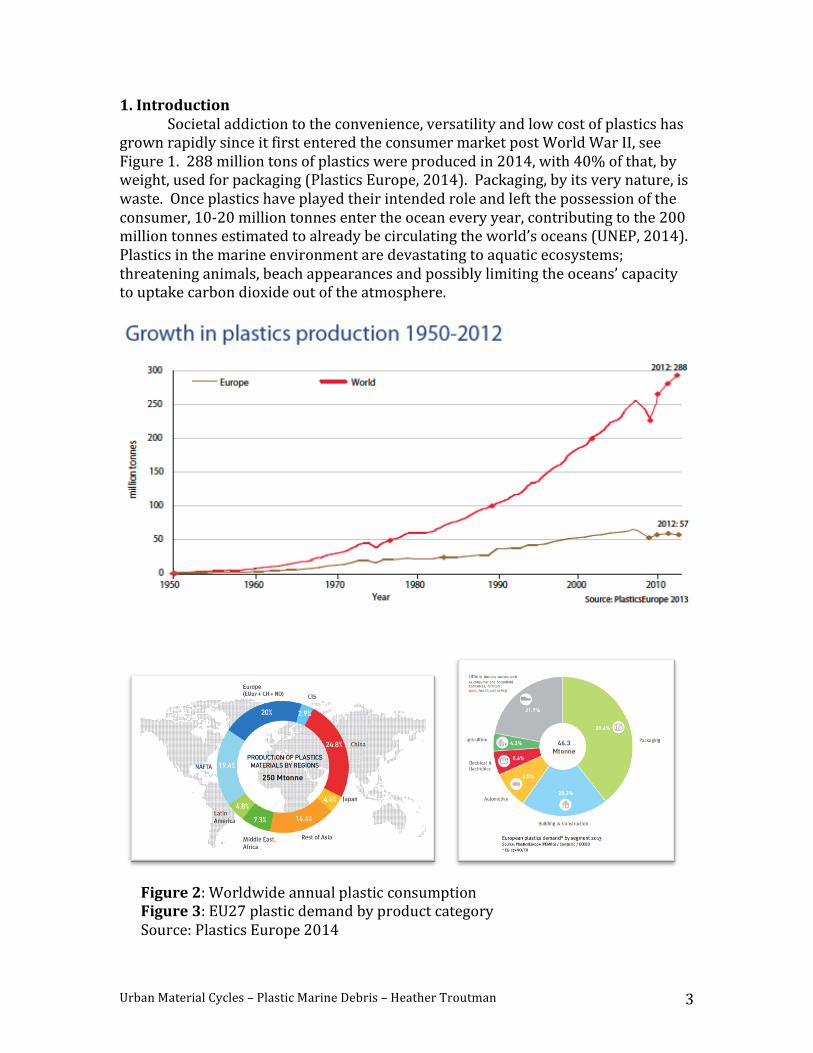
1. Introduction Societal addiction to the convenience, versatility and low cost of plastics has grown rapidly since it first entered the consumer market post World War II, see Figure 1. 288 million tons of plastics were produced in 2014, with 40% of that, by weight, used for packaging (Plastics Europe, 2014). Packaging, by its very nature, is waste. Once plastics have played their intended role and left the possession of the consumer, 10-‐20 million tonnes enter the ocean every year, contributing to the 200 million tonnes estimated to already be circulating the world’s oceans (UNEP, 2014). Plastics in the marine environment are devastating to aquatic ecosystems; threatening animals, beach appearances and possibly limiting the oceans’ capacity to uptake carbon dioxide out of the atmosphere.
Figure 2: Worldwide annual plastic consumption Figure 3: EU27 plastic demand by product category Source: Plastics Europe 2014

Urban Material Cycles – Plastic Marine Debris – Heather Troutman 4
2. Quantifying Plastic Litter If Hamburg is to host the 2024 Olympic Games there exists some potential for plastics produced and consumed at the games to end up in the North Sea, despite the best efforts of the city of Hamburg to prevent this occurrence. There appears to be some phenomenon associated with tourism that removes the individual from the sense of responsibility one has at home, making littering a more common practice. Aggravating this, such events usually supply more single-‐use items – which are most often made of plastics – in their supply chain as the magnitude of consumption causes strain in collecting and sanitizing non-‐disposable items that are used at other, non-‐event times. So the chain of events goes: there are millions of people littering more than they normally would, consuming more disposable items than they normally would, at a site that carries directly into the North Sea. London made great effort to minimize the amount of waste produced at the 2012 Olympic Games through a suite of best practices that are discussed in Section 4.2. Still, the Commission for a Sustainable London 2012 (2013) reports that 8,000 tonnes of waste were produced servicing the 19.4 million attendees to the 2012 Olympic and Paralympic Games over a four-‐week period. Assuming that Hamburg will also make her greatest effort to avoid waste production at the games, this study assumes that the 2024 Hamburg Olympic Games will also produce 8,000 tonnes of waste. In the absence of data on the quantity of waste from the 2012 London Olympic Games that ended in the aquatic environment, this study has modified data from the 34th American Cup (2013) sailboat race in San Francisco, California, USA. Like Hamburg, San Francisco has a state of the art waste management infrastructure and special events expertise. The city maintains collection containers for recyclables, organics and residual waste conveniently all over the spectator area. Once all American Cup related events had completed and associated tourism was considered completed, the city organized a beach sweep of the entire Bay, from the shore into the shallow areas of the water. The 34th American Cup authorities (2013) report collecting 18,000 lbs, or 8.16 tonnes, of beach litter. This value has been normalized to account for 1 million attendees to the 34th American Cup to the 19.4 million expected attendees to the 2024 Hamburg Olympic Games for an anticipated 200 tonnes of beach litter. The Öko-‐Institue (2006) conducted a beach litter survey of the German North Sea and reported that 78% of all litter was plastic. While this value does not reflect commodity distributions from Olympic Game vendors, it has been adopted for this study as an acceptable estimation of what the litter distribution could be in the absence of plastic litter mitigation management practices. Accordingly, if Hamburg does her very best to minimize waste produced from the2024 Olympic Games, but does not have specific strategies to prevent plastic litter from entering the marine environment, then it can be expected that at least 158 tonnes of plastic will enter the river Elbe.

Urban Material Cycles – Plastic Marine Debris – Heather Troutman 5
3. Hamburg as a Harbor City
Hamburg is located on the River Elbe 110 km from the
North Sea, see Figure 4. The tide moves inland twice a day, in the morning and in the evening, first bringing sea water up the River Elbe and then, afterwards, discharging the contaminants associated with human development, especially the Hamburg harbor, into the North Sea as the tide recedes. The flood period of the River Elbe is two-‐and a quarter-‐hours shorter with a stronger current than the ebb period, see Figures 5 and 6. This causes more sedimentation to be carried up river than down. Further, as the second largest port in Europe, the world’s largest container ships continuously move up and down the River Elbe between the North Sea and Hamburg. This causes strong currents to push through the water, especially at the surface where plastic litter floats in the highest frequency, outwards towards the banks of the river. Collectively, these two happenings should prevent the majority of potential plastic litter resulting form the city of
Hamburg to actually make it to the North Sea as it will likely be deposited along the river banks both upstream and downstream of Hamburg.
Despite this uniquely fortunate situation,
Hamburg should employ deliberate waste mitigation and management practices to avoid the creation of plastic litter. The following section discusses best practices used at other Olympic Games.
Figure 4: The River Elbe Source: Hamburg Port Authority, 2015
Figure 5: Ebbe und Flut der Elbe Figure 6: Variability of the River Elbe Source: Hamburg Port Authority, 2015

Urban Material Cycles – Plastic Marine Debris – Heather Troutman 6
4. Best Practices to Avoid Plastic Litter The best way to avoid plastic litter is to take every possible precaution that plastic waste is not generated, especially non-‐recyclable plastic items. 4.1 Sydney Games Sydney, Australia had a robust and innovative waste management plan that deserves close consideration by any city that is selected to host the Olympic Games. Particularly concerning plastic litter, Sydney had three best practices: (1) creating unique waste management plans for 14 well defined areas and activities, (2) requiring that all employees associated with the Games and Game vendors complete a waste management training, and (3) requiring every vendor to accept particular terms related to the types of materials they vended, signage and waste management. These contracts were possibly the single most important tactic because they eliminated the most offensive materials, single-‐use items and composite products (SOCOG, 1998; Hellyer, 1999). 4.2 London Games The 2012 London Olympic Games admittedly borrowed the Sydney “Zero Waste Games” decision support model and enhanced it with strategies to address failures observed post-‐Sydney games (WRAP, 2012). The most notable improvement was an extensive dialogue for producer partnerships. Rather than delegating full responsibility to each individual retailer, the Commission for a Sustainable London 2012 (CSL2012) placed requirements on manufacturers desiring to distribute consumer products at the games. In phase, vendors at event areas were required to have proof of certification that the items vended at their enterprise met the material conditions outlined by CSL2012, who published the criteria list in 2010 in “No time to waste: A review of Waste and Resource Management across the London 2012 programme.” This provided industry sufficient time to develop sustainable packaging solutions in adherence with the principles defined by CSL2012. Such a policy can ensure high accuracy of eliminating problematic materials, such as thin-‐plastic films, low-‐grade materials and composites from being distributed at the Games, which is a tremendous success. It also stimulates innovation in the manufacturing setting, which can have positive downstream effects globally. Despite this opportunity, such an arrangement puts greater strain on small and medium enterprise (SME) manufacturers that are likely unable to compete with multi-‐billion, international manufacturers, such as Coca-‐Cola. This dilemma could potentially be partially amended by offering some form of incentive, possibly location related, to retailers vending locally (nationally) manufactured products or products sourced from SME.

Urban Material Cycles – Plastic Marine Debris – Heather Troutman 7
4.3 Recommendations of the Author FREE public water bottle filling stations Clean drinking water is a basic human need. A simple measure to obviate the need to manage plastic bottles discarded by 19.4 million Olympic Game attendees – predictably 1-‐2 liters of bottled water per person per day – is to provide free, water filling stations, such as the one shown in Figure 7. Such a scheme would likely receive resistance from bottled water retailers.
Mandatory cup for all beverages served A concept close in nature to Germany’s Weihnachtsmarkt Glühwein tradition, Olympic Game food and beverage service companies should be required to use one type of event glass for all beverages served. Such a beverage glass should be ornamental (see Figure 8) and expensive, to discourage attendees from losing, breaking or discarding of the cup. To purchase a beverage in any Game area, attendees would first be required to purchase the Event Cup at a suggested price of €20-‐50/cup. At any time attendees can return the cup for a complete refund, or exchange a dirty cup for a new, clean cup filled with the beverage of their choice. This arrangement ensures that sanitation standards are upheld but also that the item has sufficient value to not be considered waste, but preferably a commodity. Intuitive signage at waste bins All activities that involve the attraction of people from all over the world mandate that planners and designers collaborate to create “universal” communication that transcends language and culture, see Figure 9. Waste is managed incredibly differently in the millions of communities around the world.
Figure 7: Public Water Stations Source: CFCC, 2014
Figure 8: Event Souvenir Cup Source: ebay, 2015

Urban Material Cycles – Plastic Marine Debris – Heather Troutman 8
One method to ensure that all of the international visitors in Hamburg for the Olympic Games are empowered to properly dispose of their wastes is by creating signage that is impossible to misunderstand. Best-‐case scenario for waste management requires the segregation of waste into three streams at the point of collection: recyclables, compostable and non-‐value materials. As simple as this may seem, many products are easily dissembled composites of the various streams. Also, the “recyclability” of a product relates to the infrastructural and economic situation in the place where the item is collected. Resultantly, a product that is “recyclable” in one city may not be in another. Understanding this, it is shortsighted to simply label bins “recyclables” or “compost,” see Figure 10. The author is of the opinion that high efficiency rates can be achieved if waste receptacles are labeled with images of specific products that attendees are likely to have at the games, especially the products that are vended at the games.
Commodity value on plastic films It is seldom that one will find a discarded plastic, glass or aluminum beverage containers littering the streets or landscape of Hamburg. This is achieved by a robust community of pickers that constantly groom the city of Hamburg for bottles of all kind. Many inhabitants of Hamburg, and hundreds of other cities globally, support themselves and often their families from revenue generated by redeeming collected beverage containers at automatic deposit machines conveniently located in most groceries for a profit of 8-‐25 cent per container. Scavengers, without hesitation, sort through waste bins to ensure that no valuable commodities are taken to the incinerator.
Unfortunately, plastic films – the most common type of plastic marine debris observed – has no post-‐consumer commodity value and is therefore only collected by landowners and city personnel in the event that it has been littered. Plastic films are admittedly complicated to recycle because they require higher transportation fees (and associated emissions) as they have extremely low density and because a substantial portion of the material is lost in the recycling process, burning off as
Figure 9: Universiallly Intuitative Signage Figure 10 Ambiguous Signage Source: WRAP, 2012

Urban Material Cycles – Plastic Marine Debris – Heather Troutman 9
emission. One finds comfort in knowing that plastic films discarded with standard, comingled garbage is incinerated with the heat being used for energy production. Still, the question if this approach to plastics handling consistent with the EU’s Circular Economy aspirations should be closely considered. The better question is should this material be allowed for transient purposes, especially packaging.
If plastic films were given a commodity value, by weight, then it is certain that a large community of scavengers would emerge to keep the areas around the Olympic Games events clean from these materials. There are certainly concerns to be considered of fair wages and manipulative policies that prohibit profitable perpetuation of certain ethnic and economic classes, such as is it fair for the city of Hamburg to pay inhabitants that are perceived to be low-‐income and jobless fees for collecting plastic wastes from the landscape at a rate that is under the minimum wage that is defined by law, and without also providing health benefits, which are also required by law? These are important questions that can and should be seriously discussed. Still, the success of the container pfland in Hamburg speaks testament that a similar system for plastic films could also perform successfully well. 5. Conclusion
Hosting visitors from all over the world obligates Hamburg, and all of Germany, to share her vast knowledge base on sustainable environmental management. This study projects that at least 158 tonnes of plastic debris could enter the river Elbe during the proposed 2024 Olympic Games Hamburg and potentially drift to the North Sea if progressive actions are not taken to – first – avoid plastic waste generation at the games, and – second – to recover all plastics waste that is generated. Even with her very best effort to achieve zero waste, the enormous rush of tourism and related frenzied consumption associated with the Olympic Games will result in massive volumes of waste generation. The best strategy to ensure that the 2024 Hamburg Olympic Games do not litter the natural and especially marine environment is to make proactive waste management priorities governing the materials permissibly vended at the games. All non-‐valuable, non-‐recoverable materials such as thin-‐film plastics and composites should be banned from retail at all vendors associated with the Games.

Urban Material Cycles – Plastic Marine Debris – Heather Troutman 10
References America’s Cup (2013) 34th America’s Cup Earns Highest Level Clean Regattas
Certification <http://www.americascup.com/en/34th-‐americas-‐cup/18544_34th-‐americas-‐cup-‐earns-‐highest-‐level-‐clean-‐regattas-‐certification.html>
CFCC – Cape Fear Community College (2014) “Water Bottle Filling Station: Success
Story” Sustainability Committee. < https://cfcc.edu/blogs/sustainability committee/2014/10/31/water-‐bottle-‐filling-‐station-‐success-‐story/> Commission for a Sustainable London 2012 (2010) No time to waste: A review of
Waste and Resource Management across the London 2012 programme Commission for a Sustainable London 2012 (2013) Making a Difference: Post-‐Games
Report Freinkel, Susan (2011) Plastic: A Toxic Love Story. Houghton Mifflin Harcourt,
Boston Hamburg Port Authority (2015) “Tidal River Development: The Elbe River Estuary”
<http://tide-‐project.eu/downloads/0_Elbe_Factsheet.pdf Hellyer, Jaqui (1999) “Making Olympic History” Waste 360.
< http://waste360.com/mag/waste_making_olympic_history > International Olympic Committee (2012) “Factsheet: London 2012 Facts and
Figures”<http://www.olympic.org/Documents/Reference_documents_Facts heets/London_2012_Facts_and_Figures-‐eng.pdf>
ISO 20121: Event Sustainability Management System <http://www.iso20121.org/> Jambeck, Jenna R.; et al (2015) “Plastic waste inputs from land into the ocean”
Science. Vol. 347 -‐ Issue 6223 London 2012 (2015) “Olympic Information” <http://www.london-‐2012.co.uk/link/> London Legacy Development Cooperation (2014) Environmental Sustainability
Report 2014 LWRB -‐ London Waste and Recycling Board (2015) Resource London
http://www.lwarb.gov.uk/what-‐we-‐do/london-‐waste-‐authority-‐support/the-‐resource-‐london-‐programme
The National Archives “Records of the London 2012 Organizing Committee of the

Urban Material Cycles – Plastic Marine Debris – Heather Troutman 11
Olympic and Paralympic Games (LOCOG) http://discovery.nationalarchives.gov.uk/details/r/C13273031
Official Website of the Olympic Movement (2015) London 2012
http://www.olympic.org/london-‐2012-‐summer-‐olympics Olympic Delivery Authority (2014) Final Repot <http://www.london
2012.co.uk/link/> Oregon Beachcomber Blog (2013, Jan. 21) “Becoming Better Marine Stewards” (Jan.
21, 2013) <http://www.oregonbeachcomber.com/2013/01/aloha-‐today-‐i-‐have-‐couple-‐of-‐updates.html>
Plastics Europe (2014) “Plastics – the facts 2014/2015: An analysis of European
plastics production, demand and waste data.” Rio2016 (2013) “Sustainability Management Plan: Rio 2016 Olympic and
Paralympic Games <http://www.rio2016.com/sites/default/files/ Plano_Gestao_Sustentabilidade_EN.pdf>
Rochman, Chelsea M.; et al (2013) “Classify plastic waste as hazardous” Nature. Vol.
494 p. 169-‐171 SOCOG – Sydney Organizing Committee for the Olympic Games (1998) “Sydney
2000 Olympic Games Integrated Waste Management Solution” UNEP -‐ United Nations Environmental Programme (2014) [1] “Ch.8 Plastic Debris in
the Ocean.” Year Book 2014: Emerging Issues. UNEP (2014) [2] Valuing Plastic: The Business Case for Measuring, Managing, and
Disclosing Plastic Use in the Consumer Goods Industry Waste Resources and Action Programme [WRAP] (2012) London 2012 Legacy
Transfer Report: Event Waste Management