Orbital Debris ModelingOrbital Debris Modeling Debris ModelingOrbital Debris Modeling J.-C. Liou,...
43
National Aeronautics and Space Administration Orbital Debris Modeling Orbital Debris Modeling J.-C. Liou, PhD NASA Orbital Debris Program Office NASA Orbital Debris Program Office Johnson Space Center, Houston, Texas Canadian Space Agency St Hubert, Quebec, Canada, 28 March 2012 https://ntrs.nasa.gov/search.jsp?R=20120003286 2018-06-08T00:42:44+00:00Z
Transcript of Orbital Debris ModelingOrbital Debris Modeling Debris ModelingOrbital Debris Modeling J.-C. Liou,...
National Aeronautics and Space Administration
Orbital Debris ModelingOrbital Debris Modeling
J.-C. Liou, PhDNASA Orbital Debris Program OfficeNASA Orbital Debris Program Office
Johnson Space Center, Houston, Texas
Canadian Space Agency St Hubert, Quebec, Canada, 28 March 2012
https://ntrs.nasa.gov/search.jsp?R=20120003286 2018-06-08T00:42:44+00:00Z
National Aeronautics and Space Administration
OutlineOutline
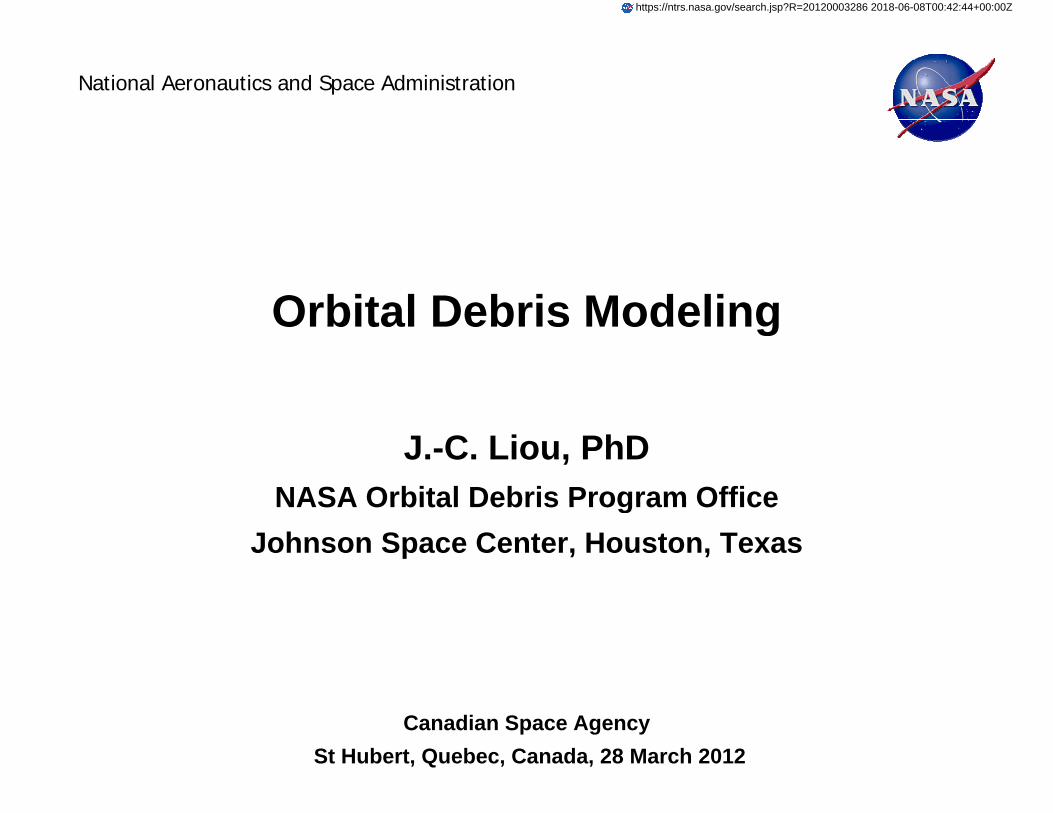
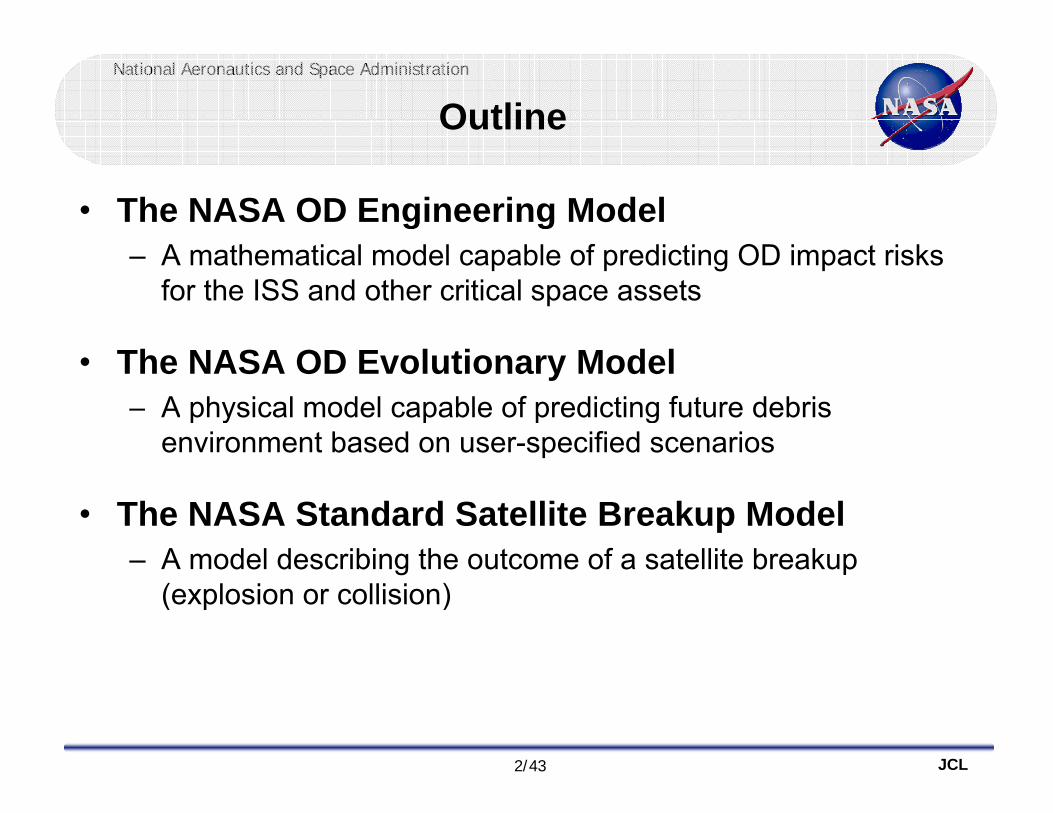
• The NASA OD Engineering ModelThe NASA OD Engineering Model– A mathematical model capable of predicting OD impact risks
for the ISS and other critical space assets
• The NASA OD Evolutionary ModelA physical model capable of predicting future debris– A physical model capable of predicting future debris environment based on user-specified scenarios
Th NASA St d d S t llit B k M d l• The NASA Standard Satellite Breakup Model– A model describing the outcome of a satellite breakup
(explosion or collision)(explosion or collision)
2/43 JCL
National Aeronautics and Space Administration
Orbital Debris Engineering Models
3/43 JCL

National Aeronautics and Space Administration
What Is an Engineering Model?What Is an Engineering Model?
• An OD engineering model is a mathematical tool– Designed to describe the current and near-future OD flux in the
environmentC t d i il f ft d i / t t li bl– Created primarily for spacecraft designers/operators to reliably assess spacecraft risk due to OD impacts
– Has been used to estimate sensor flux for radar/telescope pobservers
• There is a need to update the mode on a regular basis– New data
B tt t h i– Better techniques– Changes in the environment– Need for expanded capabilities
4/43 JCL
Need for expanded capabilities

National Aeronautics and Space Administration
History of the NASA OD Engineering ModelsHistory of the NASA OD Engineering Models
• Pre-1990 – used a simple flux curve based mostly on model results
1994 S St ti F d d l d ORDEM96• 1994 Space Station Freedom model and ORDEM96 –obtained Haystack radar data for debris in the 1 cm to 10 cm regimeto 10 cm regime– Used simple equations to describe debris populations in 6
inclination and 2 eccentricity groups
• ORDEM2000 – used new techniques and improved computer capabilities to describe the LEOcomputer capabilities to describe the LEO environment– Populations were derived from data and then processed to
5/43 JCL
opu a o s e e de ed o da a a d e p ocessed ogenerate the model environment

National Aeronautics and Space Administration
ORDEM2000 Debris EnvironmentORDEM2000 Debris Environmentz
φφ
r sin φ dθ
20º
Vz (km/s)
y
r
r + dr
dr
rdφ
10º
6 7 8 9 102% 1.2%
Vy (km/s)11y
θ
x• The LEO environment is described by a finite element model (5° × 5° × 50 km)
6/43 JCL
The LEO environment is described by a finite element model (5 5 50 km) with spatial density and velocity distributions of debris of 6 different sizes

National Aeronautics and Space Administration
ORDEM2000 Graphical User Interface (GUI)ORDEM2000 Graphical User Interface (GUI)
7/43 JCL

National Aeronautics and Space Administration
Highlights of the New Model – ORDEM 3 0Highlights of the New Model – ORDEM 3.0
• Expand data sources in time, altitude, and particle size– Altitude: 100 to 40,000 km (LEO through GEO)– LEO-GTO: Use SSN catalog, Haystack, HAX, Goldstone, STS windows/radiators to
develop OD populationsGEO: use the MODEST GEO survey data to develop ≥10 cm populations– GEO: use the MODEST GEO survey data to develop ≥10 cm populations
• Utilize higher fidelity supporting environmental models– LEGEND replaces EVOLVE 4.0– Material density breakdown included– NaK droplet and degradation/ejecta product models added
• Use Bayesian statistics to derive debris populations from data– Model uncertainties are included in the output
• Maintain two analysis modes: spacecraft and telescope/radar– Debris fluxes through ‘igloo’ in pitch yaw impact velocity elements (in spacecraft mode)Debris fluxes through igloo in pitch, yaw, impact velocity elements (in spacecraft mode)
and through cylinder in range elements (in telescope/radar mode)
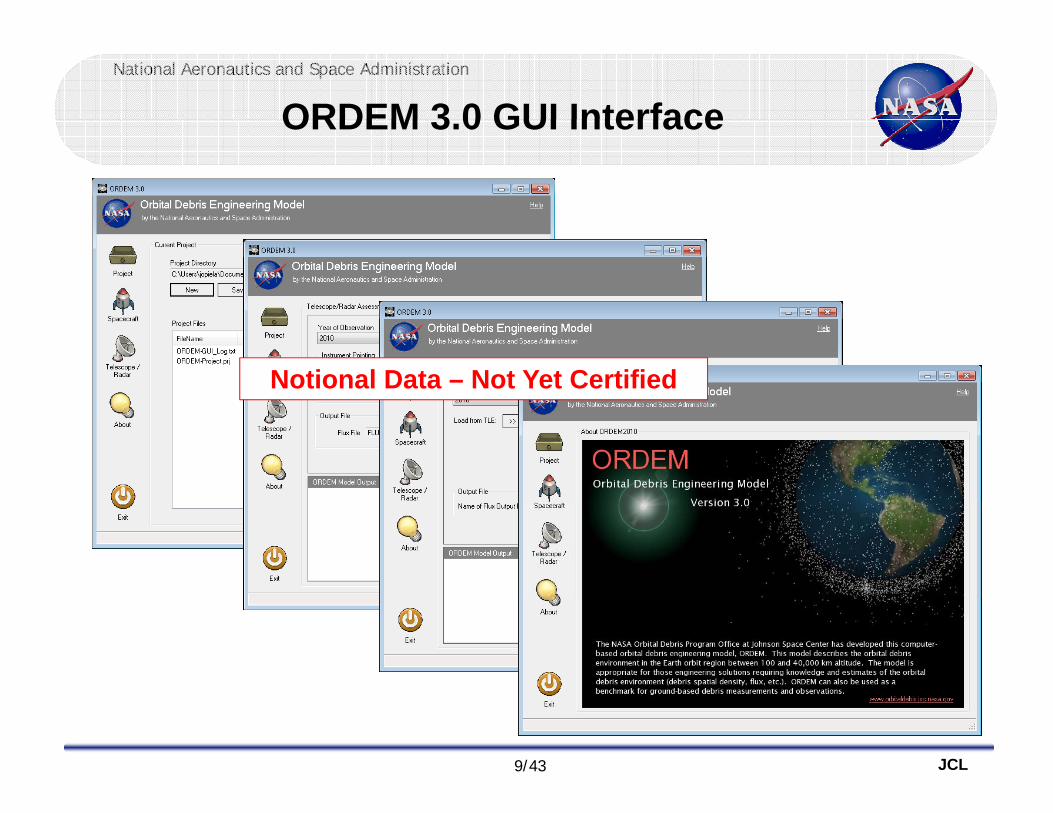
• Update Graphical User Interface (GUI)
8/43 JCL
National Aeronautics and Space Administration
ORDEM 3 0 GUI InterfaceORDEM 3.0 GUI Interface
Notional Data – Not Yet Certified
9/43 JCL
National Aeronautics and Space Administration
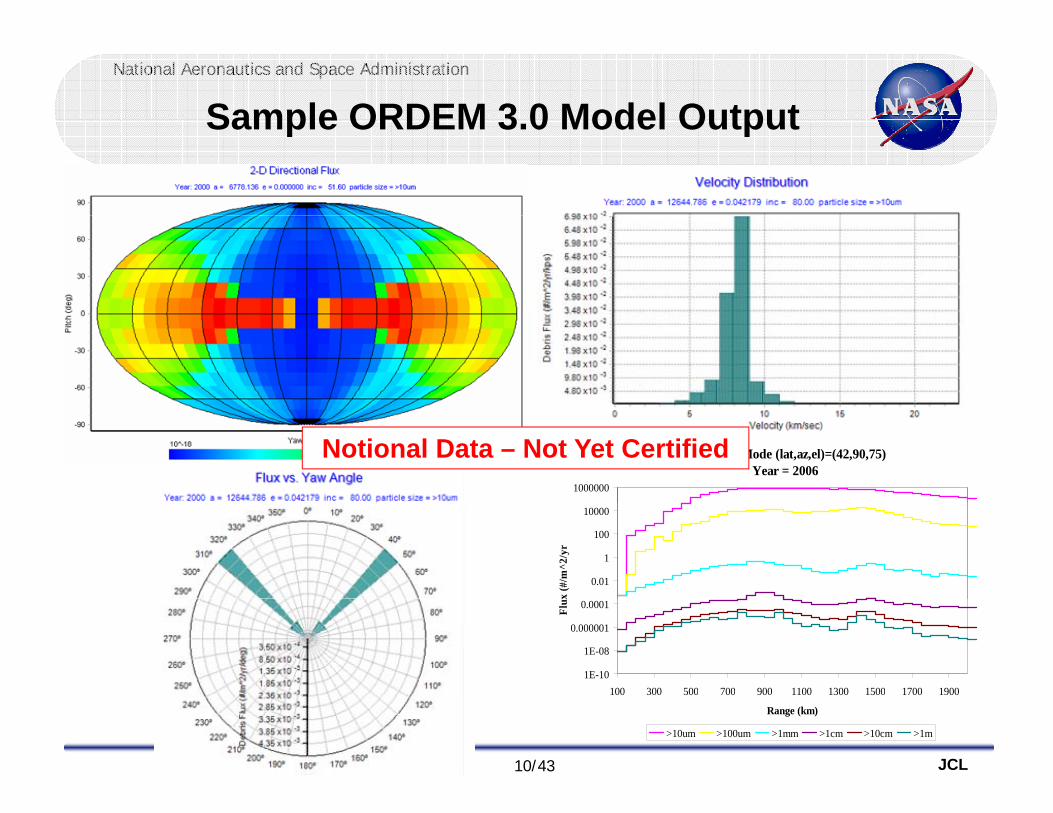
Sample ORDEM 3 0 Model OutputSample ORDEM 3.0 Model Output
Telescope Mode (lat,az,el)=(42,90,75)Year = 2006
1000000
Notional Data – Not Yet Certified
0.01
1
100
10000
x (#
/m^2
/yr
1E-10
1E-08
0.000001
0.0001
100 300 500 700 900 1100 1300 1500 1700 1900
Flux
10/43 JCL
100 300 500 700 900 1100 1300 1500 1700 1900
Range (km)
>10um >100um >1mm >1cm >10cm >1m

National Aeronautics and Space Administration
ORDEM2000 versus ORDEM 3 0ORDEM2000 versus ORDEM 3.0
Parameter ORDEM2000 ORDEM 3 0Parameter ORDEM2000 ORDEM 3.0Spacecraft and Telescope/Radar analysis modes
Yes Yes
Time range 1991 to 2030 2010 to 2035
Altitude range with minimum debris size 200 to 2000 km (>10 μm) 100 to 2000 km(>10 μm)2000 to 33,000 (>1 cm)33,000 to 40,000 km (>10 cm)
Model population breakdown No Intacts and mission related debrisFragments RORSAT NaK coolant dropletsDegradation/ejecta
Material density breakdown No Low-density(<2 g/cm3) : fragmentsy y( g ) gMedium-density(2-6 g/cm3): fragments, degrad/ejectaHigh-density(>6 g/cm3): fragments, degrad/ejecta RORSAT NaK coolant droplets (0.9 g/cm3)
Model cumulative size thresholds 10 μm, 100 μm, 1 mm, 10 μm, 31.6 μm, 100 μm, 316 μm, 1 mm, 3.16 mm,Model cumulative size thresholds 10 μm, 100 μm, 1 mm,1 cm , 10 cm, 1 m
10 μm, 31.6 μm, 100 μm, 316 μm, 1 mm, 3.16 mm, 1 cm, 3.16 cm, 10 cm, 31.6 cm, 1 m
Population uncertainties No Yes
File size 16 MB 1.4 GB
11/43 JCL
Run time Seconds Minutes to hours

National Aeronautics and Space Administration
Status of ORDEM 3 0Status of ORDEM 3.0
• Model in final validation and verification process
• Official release is scheduled for later this year– Will be available for download from the NASA Orbital Debris
Program Office website
12/43 JCL

National Aeronautics and Space Administration
NASA Orbital Debris Evolutionary Model
13/43 JCL

National Aeronautics and Space Administration
LEGEND Overview (1/2)LEGEND Overview (1/2)
• LEGEND, A LEO-to-GEO environment debris model– Is a high fidelity, three-dimensional numerical simulation model
for long-term orbital debris evolutionary studiesR l th i di i l LEO l d l– Replaces the previous one-dimensional, LEO only model, EVOLVE
– Includes intacts (rocket bodies and spacecraft), mission-related ( p ),debris (rings, caps, etc.), and explosion/collision fragments
– Handles objects individually– Is capable of simulating objects down to 1 mm in size, but the
focus has been on ≥10 cm objects– Covers altitudes up to 40 000 kmCovers altitudes up to 40,000 km– Can project the environment several hundred years into the
future
14/43 JCL

National Aeronautics and Space Administration
LEGEND Overview (2/2)LEGEND Overview (2/2)
• LEGEND, an orbital debris evolutionary model– Uses a deterministic approach to mimic the historical debris
environment based on recorded launches and breakupsU M t C l h d i ti i i– Uses a Monte Carlo approach and an innovative, pair-wise collision probability evaluation algorithm to simulate future collision activities
– Analyzes future debris environment based on user-specified launch traffics, postmission disposal, and active debris removal optionsoptions
– Ten peer-reviewed journal papers have been published about LEGEND and its applications since 2004
15/43 JCL

National Aeronautics and Space Administration
Peer-Reviewed Journal Publications(LEGEND and LEGEND Applications)
1. Liou, J.-C. et al., LEGEND – A three-dimensional LEO-to-GEO debris evolutionary model. Adv. Space Res. 34, 5, 981-986, 2004.
2. Liou, J.-C. and Johnson, N.L., A LEO satellite postmission disposal study using LEGEND, Acta Astronautica 57, 324-329, 2005.
3. Liou, J.-C., Collision activities in the future orbital debris environment, Adv. Space R 38 9 2102 2106 2006Res. 38, 9, 2102-2106, 2006.
4. Liou, J.-C. and Johnson, N.L., Risks in space from orbiting debris, Science 311, 340-341, 2006.
5 Liou J -C A statistic analysis of the future debris environment Acta Astronautica5. Liou, J. C., A statistic analysis of the future debris environment, Acta Astronautica62, 264-271, 2008.
6. Liou, J.-C. and Johnson, N.L., Instability of the present LEO satellite population, Adv. Space Res. 41, 1046-1053, 2008.
7. Liou, J.-C. and Johnson, N.L., Characterization of the cataloged Fengyun-1C fragments and their long-term effect on the LEO environment, Adv. Space Res. 43, 1407-1415, 2009.
8 Liou J -C and Johnson N L A sensitivity study of the effectiveness of active debris8. Liou, J.-C. and Johnson, N.L., A sensitivity study of the effectiveness of active debris removal in LEO, Acta Astronautica 64, 236-243, 2009.
9. Liou, J.-C. et al., Controlling the growth of future LEO debris populations with active debris removal, Acta Astronautica 66, 648-653, 2010.
16/43 JCL
10. Liou, J.-C., An active debris removal parametric study for LEO environment remediation, Adv. Space Res. 47, 1865-1876, 2011.

National Aeronautics and Space Administration
Development HistoryDevelopment History
• History– 2003: Completed the historical component– 2005: Developed the “Cube” collision probability evaluation
l ithalgorithm– 2006: Completed the future projection component– 2006: Added the postmission disposal mitigation options2006: Added the postmission disposal mitigation options– 2007: Added the new capabilities to evaluate and identify
individual objects for removal– 2008: Added additional options and output information for
debris removal• Future Improvements• Future Improvements
– Increase the computational speed of the two orbit propagators– Validate model predictions for sub-10 cm populations
17/43 JCL
Validate model predictions for sub 10 cm populations

National Aeronautics and Space Administration
The LEGEND CodeThe LEGEND Code
• LEGEND is written in Fortran– Includes ~18,000 lines of Fortran code
• LEGEND runs on Unix/Linux-based workstations• LEGEND runs on Unix/Linux-based workstations– Typical runtime: ~days to weeks
• LEGEND is only available to a few well-trained Orbital Debris Program Office scientists
18/43 JCL

National Aeronautics and Space Administration
LEGEND Architecture (1/2)LEGEND Architecture (1/2)Set up constants,
parameters, arrays
19571957
Read in traffic data
Read in breakup events
Add in NaK, SRM, etc Existing objects
L100L300 L200L500 L400
Generate breakup clouds
dataevents etc.
Ncum, A/M, Ax, ΔV distributions
Ncum, A/M, Ax,ΔV distributions Maneuvers
if necessary
Generate element arrays
Generate element arrays
Generate element arrays
y
ti+1 = ti + Δt
Propagate to
the end of the year
• Atmosphere model• Solar activity model• Radiation pressure• Solar-lunar, ⊕’s perturbations• ⊕’s shadow
no
• Element arrays, etc.• Debris distributions (1-D, 2-D, 3-D)
output
2011?
19/43 JCL
stopyes
(Liou et al., 2004)

National Aeronautics and Space Administration
LEGEND Architecture (2/2)LEGEND Architecture (2/2)From the end of
historical simulation
20122012
Existing intacts
Read in traffic data Existing fragmentsA selected historical
traffic cycle i i i
L200L100L400
Generate breakup fragments
breakupyes
breakupyes
traffic cycle Postmission disposalor removal
Constellations, special satellites, etc. breakup
yesL500L600
Generate element arrays
ti+1 = ti + Δt (5 days)
Generate element arrays
nono
no
Propagate to
the end of the time step
• Atmosphere model• Solar activity model• Radiation pressure• Solar-lunar, ⊕’s perturbations• ⊕’s shadow
no
• Debris distributions (1-D, 2-D, 3-D)• Element arrays, etc.
End-of-year output
2212
20/43 JCL
stopyes

National Aeronautics and Space Administration
LEGEND Supporting Models (1/4)LEGEND Supporting Models (1/4)
• DBS database: a comprehensive record of historical launches and breakup events– Time, type, orbit, physical properties (mass, area), etc.– The database is updated annually
• Space Surveillance Network (SSN) catalogsD il d f th hi t i l th f th ≥10– Daily records of the historical growth of the ≥10 cm debris population
– Basis of empirical area-to-mass ratio (A/M) distributions ofBasis of empirical area to mass ratio (A/M) distributions of large breakup fragments
– New files are downloaded from “Space Track” website daily• Future launch traffic model
– Typically a repeat of the last 8-year cycle, as commonly adopted by the international debris modeling community
21/43 JCL
adopted by the international debris modeling community

National Aeronautics and Space Administration
LEGEND Supporting Models (2/4)LEGEND Supporting Models (2/4)
• Atmospheric drag model– Jacchia atmospheric density model (1977)– Drag perturbation equations based on King-Hele (1987)
• Solar flux (at 10.7 cm wavelength) model consisting of three components
Hi t i l d il d il bl f th N ti l O i d– Historical daily records available from the National Oceanic and Atmospheric Administration (NOAA) Space Weather Prediction Center (SWPC)
– Short-term projection provided by NOAA/SWPC – currently through 2019L t j ti i t f 13th d i d– Long-term projection is a repeat of a 13th-order sine and cosine functional fit to Solar Cycles 18 to 23 (1944 – 2010)
• Similar to projections developed for long-term debris evolutionary
22/43 JCL
models by other space agencies (ASI, UKSA, etc.)

National Aeronautics and Space Administration
LEGEND Supporting Models (3/4)LEGEND Supporting Models (3/4)
• GEOprop orbital propagator– Propagates objects near geosynchronous (GEO) region– Perturbations include solar and lunar gravitational forces,
l di ti d E th’ it fi ld l (J Jsolar radiation pressure, and Earth’s gravity-field zonal (J2, J3, and J4) and tesserral (J2,2, J3,1, J3,3, J4,2, and J4,4) harmonics
• Prop3D orbit propagator– Propagates orbits of objects in LEO and GTO regions
P t b ti i l d t h i d l d l– Perturbations include atmospheric drag, solar and lunar gravitational forces, solar radiation pressure, and Earth’s gravity-field zonal harmonics J2, J3, and J42 3 4
• Both propagators compare well with similar tools used by other space agencies
23/43 JCL
used by other space agencies

National Aeronautics and Space Administration
LEGEND Supporting Models (4/4)LEGEND Supporting Models (4/4)
• NASA Standard Satellite Breakup Model– Describes the outcome of an explosion or collision
• Fragment size, A/M, and ΔV distributionsB d ll b d bit l i l– Based on seven, well-observed on-orbit explosions, several ground-based impact experiments, and one on-orbit collision
24/43 JCL

National Aeronautics and Space Administration
LEGEND ApplicationsLEGEND Applications
• LEGEND is the tool the NASA Orbital Debris Program Office uses to – Provide debris environment projection for the next 200 years
B d ifi d i (l h t ffi t i i• Based on user-specified scenarios (launch traffics, postmission disposal, active debris removal options, etc)
– Evaluate the instability of the current debris environment– Assess the growth of the future debris populations– Characterize the effectiveness of the NASA, U.S., and
international debris mitigation measuresinternational debris mitigation measures– Quantify the benefits of active debris removal (ADR)
25/43 JCL

National Aeronautics and Space Administration
Sample LEGEND OutputSample LEGEND Output
24000LEO Environment Projection (averages of 100 LEGEND MC runs)
20000
22000 Reg Launches + 90% PMD
Reg Launches + 90% PMD + ADR2020/02
R L h 90% PMD ADR2020/05
14000
16000
18000
ects (>10
cm) Reg Launches + 90% PMD + ADR2020/05
10000
12000
14000
Num
ber of O
bje
6000
8000
Effective N
0
2000
4000
26/43 JCL
1950 1970 1990 2010 2030 2050 2070 2090 2110 2130 2150 2170 2190 2210
Year

National Aeronautics and Space Administration
NASA Standard Satellite Breakup Model
27/43 JCL

National Aeronautics and Space Administration
What Is a Satellite Breakup Model?What Is a Satellite Breakup Model?
• A satellite breakup model describes the outcome of a satellite breakup (explosion or collision)– Fragment size, area-to-mass ratio (A/M), and ΔV distributions
• The key to provide good short- and long-term debris impact risk assessments for critical space assets is pact s assess e ts o c t ca space assets sthe ability to reliably predict the outcome of a satellite breakup
• There are two options to develop the modelTheoretical– Theoretical
– Empirical
28/43 JCL

National Aeronautics and Space Administration
NASA Breakup Model for ExplosionsNASA Breakup Model for Explosions
• Based on the fragment distribution of 7 well-observed on-orbit R/B explosions
• Fragments are described by a single power law distributiondistribution
• Explosions are classified into 6 different groups with different scaling factors (sf) assigned to their fragmentdifferent scaling factors (sf) assigned to their fragment distribution
N = sf × 6 × L -1.6Ncum = sf × 6 × Lc
Ncum: number of fragments ≥ Lc,cum g c,Lc: characteristic length in (m)
29/43 JCL

National Aeronautics and Space Administration
Size Distribution of Explosion FragmentsSize Distribution of Explosion Fragments1000
LANDSAT 1 R/B
LANDSAT 2 R/B
LANDSAT 3 R/B
Ni b 6 R/B
100
Num
ber
Nimbus 6 R/B
Nimbus 4 R/B (Agena D)
OPS 7613 R/B (Agena D)
Long March 4 R/B
mul
ativ
e N Long March 4 R/B
NASA: Ncum=6 Lc^-1.6
10
Cu
10 01 0 1 1 10
30/43 JCL
0.01 0.1 1 10
Characteristic Size (m)

National Aeronautics and Space Administration
NASA Breakup Model for CollisionsNASA Breakup Model for Collisions
• Based on ground-based impact experiments and one well observed on-orbit collision (P78/SOLWIND)
• A catastrophic collision occurs when the ratio of impact energy to target mass exceeds 40 J/genergy to target mass exceeds 40 J/g
• Fragments are described by a single power law distributiondistribution
Ncum = 0.1 × (Mtot)0.75 × Lc-1.71
cum ( tot) c
Ncum: number of fragments ≥ Lc
L h t i ti l th i ( )Lc: characteristic length in (m),Mtot = mtar+mproj (catastrophic) or
Mtot = mproj+mproj×V2/(km/sec)2 (non-catastrophic)
31/43 JCL
tot proj proj ( ) ( p )

National Aeronautics and Space Administration
Mass Distribution of Collision FragmentsMass Distribution of Collision Fragments1.E+07
P78
1.E+06
ss >
m
PSI 1
PSI 2
SOCIT
1.E+04
1.E+05
s w
ith M
as SOC
Bess 1
Bess 2
NASA BU Model
1.E+03
Frag
men
ts NASA BU Model
1.E+02
umbe
r of F
1.E+00
1.E+01Nu
32/43 JCL
1.E-10 1.E-09 1.E-08 1.E-07 1.E-06 1.E-05 1.E-04 1.E-03 1.E-02 1.E-01 1.E+00 1.E+01 1.E+02 1.E+03
Mass (kg)

National Aeronautics and Space Administration
Improving the NASA Breakup ModelImproving the NASA Breakup Model
• The NASA satellite breakup model has been adopted by major international space agencies for various OD environment studies]
• As new materials and new construction techniques are developed for modern satellites, there is a need p ,to conduct additional ground-based tests and use the data to further enhance the collision model
33/43 JCL

National Aeronautics and Space Administration
Cosmos 2251 FragmentsCosmos 2251 Fragments
0.25A/M Distribution of Cosmos 2251 Fragments
0.2
NASA Breakup Model Prediction
SATCAT Data (17 September 2010)
0.15
ormalized
)
Cosmos 2251(900 kg)
0.1
Num
ber (N
0.05
Th A/M di t ib ti f th C 2251 f t t h ll ith th NASA
0
‐3 ‐2.5 ‐2 ‐1.5 ‐1 ‐0.5 0 0.5 1 1.5 2
Log10(A/M m2/kg)
34/43 JCL
• The A/M distribution of the Cosmos 2251 fragments matches well with the NASA model prediction

National Aeronautics and Space Administration
Iridium 33 Fragments (1/2)Iridium 33 Fragments (1/2)
120A/M Distribution of Iridium 33 Fragments
100
NASA Breakup Model Prediction
SATCAT Data (17 September 2010)
Iridium 33(560 kg)
60
80
mbe
r
40
60
Num
20
• The A/M distribution of the Iridium 33 fragments appears to be systematically higher than
0
‐3 ‐2.5 ‐2 ‐1.5 ‐1 ‐0.5 0 0.5 1 1.5 2
Log10(A/M m2/kg)
35/43 JCL
g pp y y gthe NASA model prediction
• Lightweight composite materials were extensively used in the construction of the vehicle

National Aeronautics and Space Administration
Iridium 33 Fragments (2/2)Iridium 33 Fragments (2/2)
120A/M Distribution of Iridium 33 Fragments
100
NASA Breakup Model Prediction
SATCAT Data, A/M/3 (17 September 2010)
60
80
mbe
r
40
60
Num
20
Th A/M di t ib ti f th I idi 33 f t i i t l f t f 3 hi h
0
‐3 ‐2.5 ‐2 ‐1.5 ‐1 ‐0.5 0 0.5 1 1.5 2
Log10(A/M m2/kg)
36/43 JCL
• The A/M distribution of the Iridium 33 fragments is approximately a factor of 3 higher than the NASA model prediction

National Aeronautics and Space Administration
7 Micro Satellite Impact Tests (2005-2008)7 Micro Satellite Impact Tests (2005-2008)
• The project is a collaboration between NASA ODPO
Size M (g) Mp (g) / Vimp EMR Impact
and the Kyushu University in Japan
(cm) Mt (g) pDp (cm)
p(km/s) (J/g) Angle
0501H 15 740 4.03 / 1.4 4.44 53.7 ⊥
0502L 15 740 39.2 / 3.0 1.45 55.7 ⊥
0701L 20 1300 39.2 / 3.0 1.66 41.5 ⊥
0702L 20 1283 39.2 / 3.0 1.66 42.0 //
0703L 20 1285 39.2 / 3.0 1.72 45.1 ⊥0703L 20 1285 39.2 / 3.0 1.72 45.1 ⊥
0801F 20 1515 39.2 / 3.0 1.74 39.2 ⊥
0801R 20 1525 39 3 / 3 0 1 78 40 8 ⊥
37/43 JCL
0801R 20 1525 39.3 / 3.0 1.78 40.8 ⊥

National Aeronautics and Space Administration
Micro SatellitesMicro Satellites
• Target satellites– Cube-shaped, with 6 Carbon Fiber Reinforced Plastic (CFRP) outer walls and
3 Glass Fiber Reinforced Plastic (GFRP) boards inside• Direction of CFRP fiber: (0°, 90°)• Thickness of the front and back CFRP walls: 2 mmThickness of the front and back CFRP walls: 2 mm• Thickness of other CFRP and GFRP walls: 1 mm
– Components: lithium-ion batteries, transmitter, solar cells, power circuit board, communication circuit board, on board computer, antenna
38/43 JCL

National Aeronautics and Space Administration
Ground-based Impact ExperimentsGround-based Impact Experiments
39/43 JCL

National Aeronautics and Space Administration
Impact FragmentationImpact Fragmentation
• Target: Micro satellite covered with Multi-Layer Insulation (MLI) a solar panel on one side– Objective: characterize satellite, MLI, and solar panel
f tfragments
40/43 JCL

National Aeronautics and Space Administration
Sample Measurement DataSample Measurement Data
No Characteristic Label Shape x[m] y[m] z[m] M[kg]1 CFRP+Aluminum Medium Plate Square 0 28284 0 28284 0 03031 2 014E 011 CFRP+Aluminum Medium Plate_Square 0.28284 0.28284 0.03031 2.014E-012 CFRP+Aluminum Medium Plate_Square 0.28284 0.28284 0.02186 8.873E-023 CFRP Low Plate_Square 0.28284 0.28284 0.00167 6.263E-024 CFRP+Aluminum Medium Plate_Square 0.28284 0.28284 0.06762 7.567E-025 GFRP+Metal Medium Plate_Square 0.28230 0.19110 0.08777 5.075E-026 CFRP+Aluninum+Metal Medium Cube Complex Oblong 0.34520 0.14032 0.05755 6.910E-02_ p _ g7 CFRP Low Plate_Square 0.14846 0.13875 0.02689 2.192E-028 CFRP Low Plate_Square 0.14953 0.14678 0.01391 1.668E-029 CFRP Low Plate_Oblong 0.20080 0.02619 0.00406 1.234E-03
10 Aluminum Medium Cube_Complex_Oblong 0.15790 0.03335 0.02576 1.464E-02
41/43 JCL

National Aeronautics and Space Administration
Upcoming Ground-based Impact TestUpcoming Ground-based Impact Test
• A collaboration of NASA ODPO, AF/SMC, and
SOCIT Proposed Test
University of Florida
SOCIT Proposed Test
Target dimensions 46 cm (dia) × 30 cm (ht) 50 cm
Target mass 34.5 kg 50 kg
MLI and solar panel No Yes
Projectile material Al sphere Al sphere
Projectile dimensions/mass 4.7 cm diameter, 150 g 5 cm diameter, 176 gdimensions/mass , g , g
Impact speed 6.075 km/sec 7 km/sec
Impact Energy to Target 78 J/ 86 J/
42/43 JCL
p gy gMass ratio (EMR) 78 J/g 86 J/g

National Aeronautics and Space Administration
Q ti ?Questions?
43/43 JCL