oil pipeline markets and operations - AgEcon...
18
1 OIL PIPELINE MARKETS AND OPERATIONS By Bradley Hull, PhD. Department of Management, Marketing, and Logistics John Carroll University 20700 North Park Blvd. University Heights, OH 44118 216-397-4182 [email protected] December 15, 2004 ABSTRACT Despite a considerable literature regarding other modes of transportation, little is written about oil pipelines. This is remarkable since oil pipelines move 17% of all intercity ton miles, but also understandable since they have a low public profile and with near total automation, have few employees. This article attempts to bridge the gap by comparing pipeline operations and those of the other modes, showing striking similarities along with a few significant differences. It also portrays pipeline markets and their changing trends. In recent years, they have served an industry that is experiencing rapidly shifting geographical markets, proliferation of new products, and outsourcing of transportation by shippers. The pipeline industry has responded to these challenges with increased competitive entry, numerous capital construction projects, and a high reliance on technology. These issues, along with the regulatory constraints and responses are portrayed. INTRODUCTION Imagine the ideal freight transportation system of the future: merchandise would flow to market through an extensive system of underground conduits, leaving the nation’s highways safer and less busy as a result. From a few highly automated control rooms scattered around the nation, operators would receive merchandise from manufacturers and guide it safely along the most economical corridors available using the latest technologies. The physical activities of loading, transporting, and unloading would be fully automated and performed remotely from the control rooms. With advanced monitoring and scheduling technology, in-transit damage to the merchandise would be minimal and traffic accidents would be virtually nonexistent. The few people operating the control rooms would be primarily mechanical or civil engineers and information technology specialists. With no visible presence to the general public, few employees, and virtually no accidents, such a transportation system would have such a low profile that the general public would be unaware of its existence. Such a system would “run silent, run deep,” as stated in the title of the well-known 1958 Clark Gable movie.
Transcript of oil pipeline markets and operations - AgEcon...
1
OIL PIPELINE MARKETS AND OPERATIONS
By Bradley Hull, PhD. Department of Management, Marketing, and Logistics
John Carroll University 20700 North Park Blvd.
University Heights, OH 44118 216-397-4182
[email protected] December 15, 2004
ABSTRACT Despite a considerable literature regarding other modes of transportation, little is written about oil pipelines. This is remarkable since oil pipelines move 17% of all intercity ton miles, but also understandable since they have a low public profile and with near total automation, have few employees. This article attempts to bridge the gap by comparing pipeline operations and those of the other modes, showing striking similarities along with a few significant differences. It also portrays pipeline markets and their changing trends. In recent years, they have served an industry that is experiencing rapidly shifting geographical markets, proliferation of new products, and outsourcing of transportation by shippers. The pipeline industry has responded to these challenges with increased competitive entry, numerous capital construction projects, and a high reliance on technology. These issues, along with the regulatory constraints and responses are portrayed. INTRODUCTION Imagine the ideal freight transportation system of the future: merchandise would flow to market through an extensive system of underground conduits, leaving the nation’s highways safer and less busy as a result. From a few highly automated control rooms scattered around the nation, operators would receive merchandise from manufacturers and guide it safely along the most economical corridors available using the latest technologies. The physical activities of loading, transporting, and unloading would be fully automated and performed remotely from the control rooms. With advanced monitoring and scheduling technology, in-transit damage to the merchandise would be minimal and traffic accidents would be virtually nonexistent. The few people operating the control rooms would be primarily mechanical or civil engineers and information technology specialists. With no visible presence to the general public, few employees, and virtually no accidents, such a transportation system would have such a low profile that the general public would be unaware of its existence. Such a system would “run silent, run deep,” as stated in the title of the well-known 1958 Clark Gable movie.
2
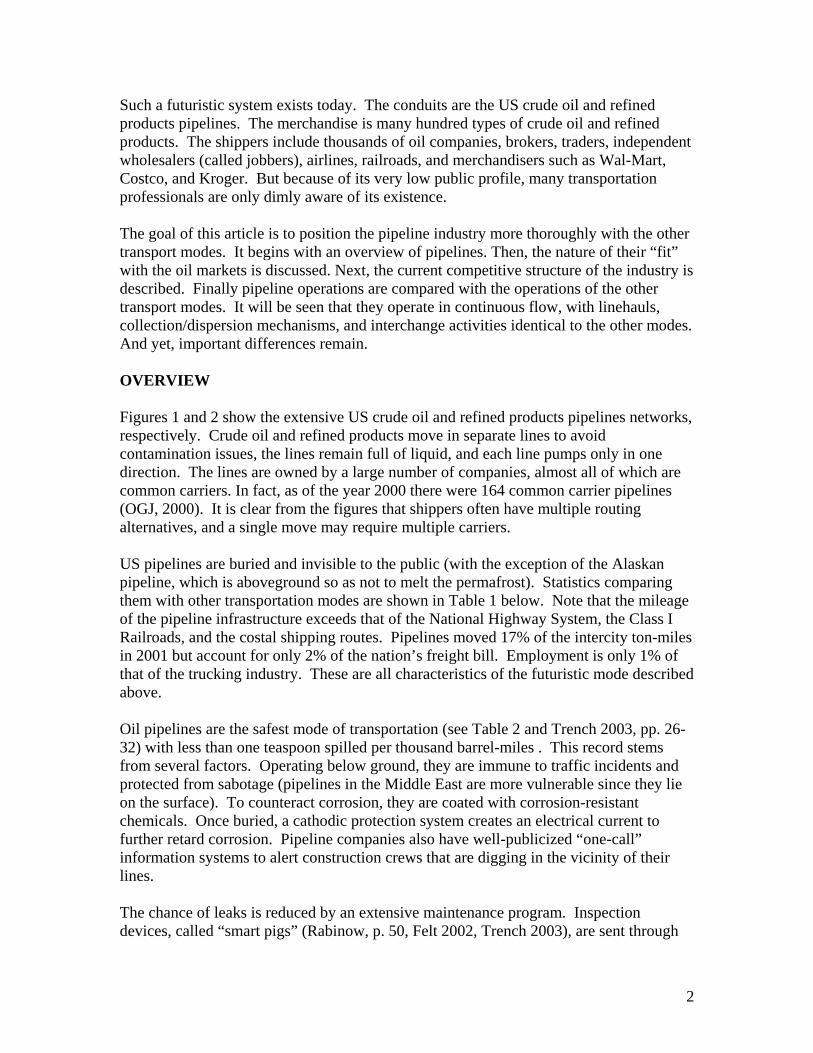
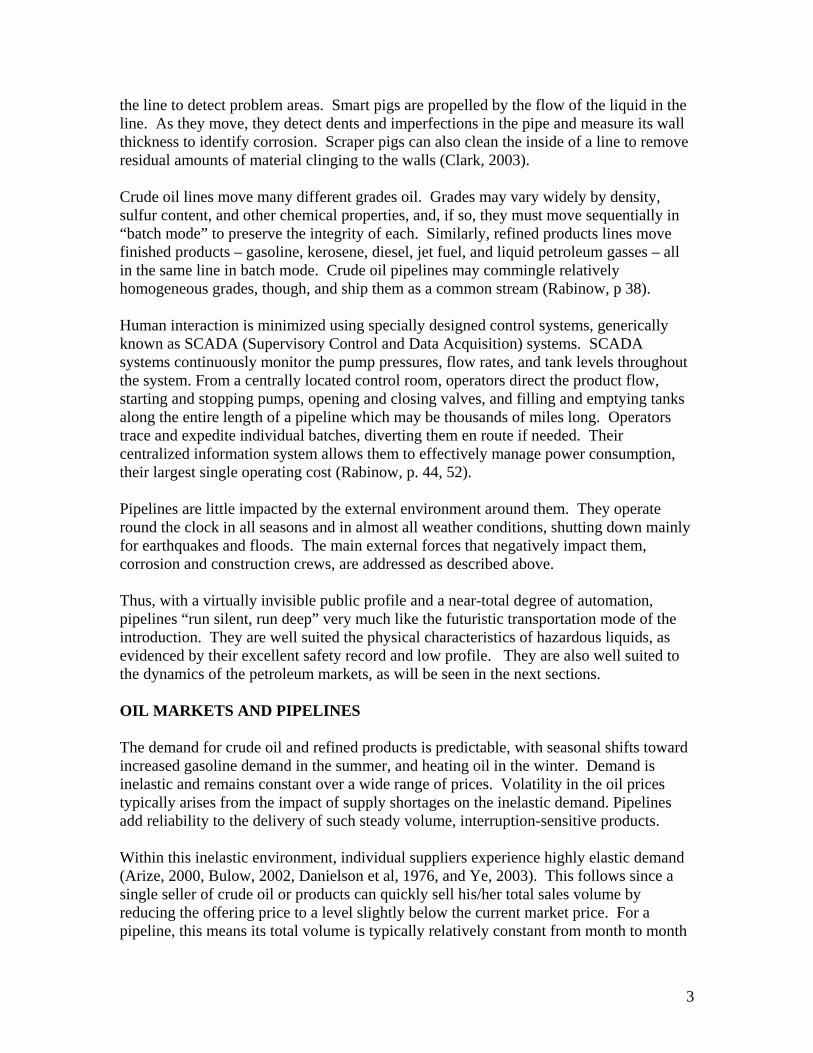
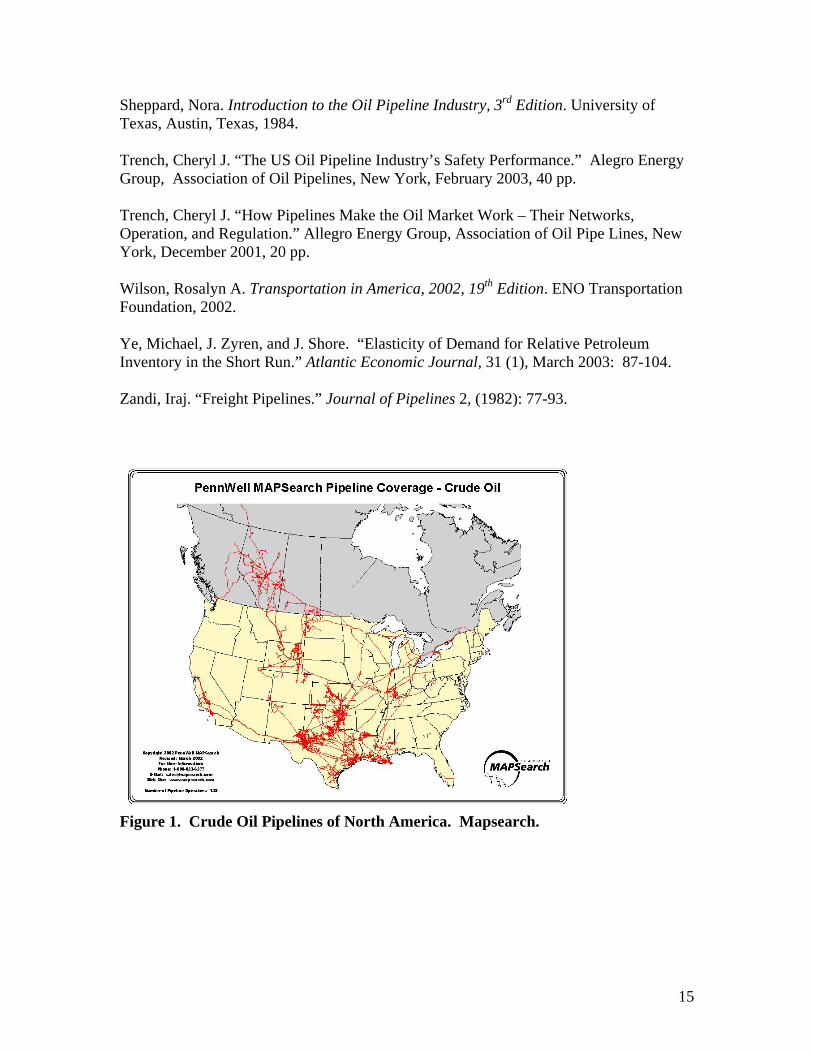
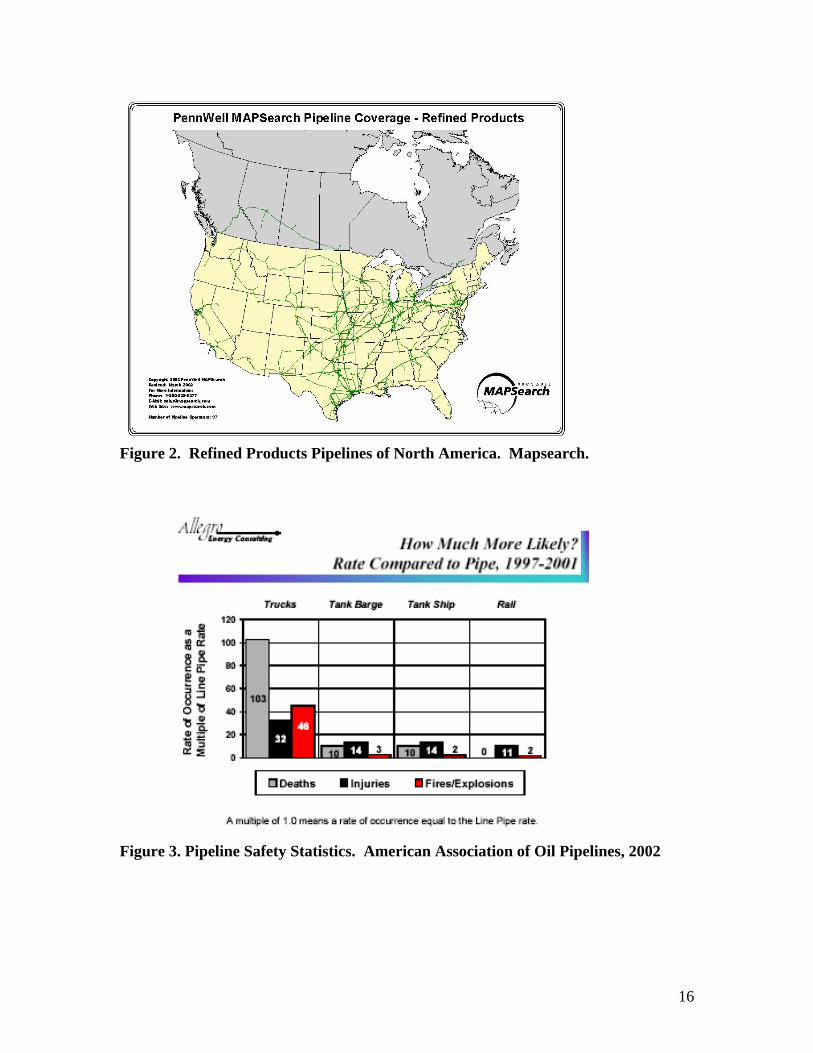
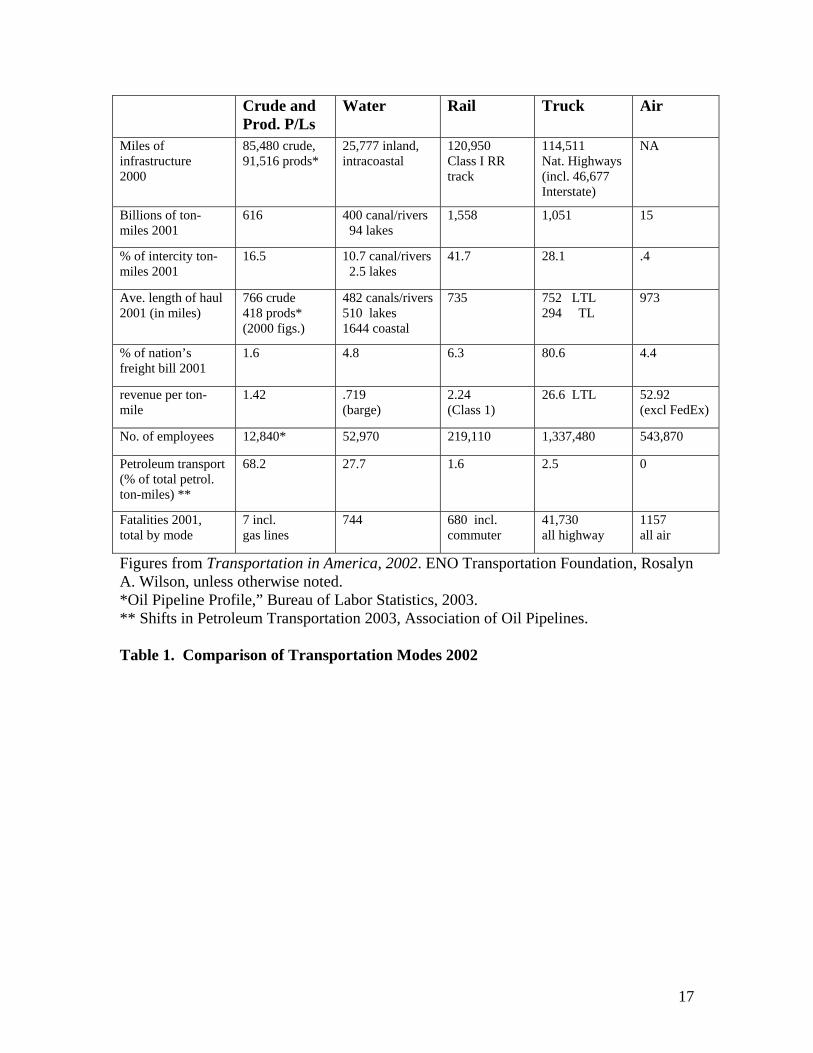
Such a futuristic system exists today. The conduits are the US crude oil and refined products pipelines. The merchandise is many hundred types of crude oil and refined products. The shippers include thousands of oil companies, brokers, traders, independent wholesalers (called jobbers), airlines, railroads, and merchandisers such as Wal-Mart, Costco, and Kroger. But because of its very low public profile, many transportation professionals are only dimly aware of its existence. The goal of this article is to position the pipeline industry more thoroughly with the other transport modes. It begins with an overview of pipelines. Then, the nature of their “fit” with the oil markets is discussed. Next, the current competitive structure of the industry is described. Finally pipeline operations are compared with the operations of the other transport modes. It will be seen that they operate in continuous flow, with linehauls, collection/dispersion mechanisms, and interchange activities identical to the other modes. And yet, important differences remain. OVERVIEW Figures 1 and 2 show the extensive US crude oil and refined products pipelines networks, respectively. Crude oil and refined products move in separate lines to avoid contamination issues, the lines remain full of liquid, and each line pumps only in one direction. The lines are owned by a large number of companies, almost all of which are common carriers. In fact, as of the year 2000 there were 164 common carrier pipelines (OGJ, 2000). It is clear from the figures that shippers often have multiple routing alternatives, and a single move may require multiple carriers. US pipelines are buried and invisible to the public (with the exception of the Alaskan pipeline, which is aboveground so as not to melt the permafrost). Statistics comparing them with other transportation modes are shown in Table 1 below. Note that the mileage of the pipeline infrastructure exceeds that of the National Highway System, the Class I Railroads, and the costal shipping routes. Pipelines moved 17% of the intercity ton-miles in 2001 but account for only 2% of the nation’s freight bill. Employment is only 1% of that of the trucking industry. These are all characteristics of the futuristic mode described above. Oil pipelines are the safest mode of transportation (see Table 2 and Trench 2003, pp. 26-32) with less than one teaspoon spilled per thousand barrel-miles . This record stems from several factors. Operating below ground, they are immune to traffic incidents and protected from sabotage (pipelines in the Middle East are more vulnerable since they lie on the surface). To counteract corrosion, they are coated with corrosion-resistant chemicals. Once buried, a cathodic protection system creates an electrical current to further retard corrosion. Pipeline companies also have well-publicized “one-call” information systems to alert construction crews that are digging in the vicinity of their lines. The chance of leaks is reduced by an extensive maintenance program. Inspection devices, called “smart pigs” (Rabinow, p. 50, Felt 2002, Trench 2003), are sent through
3
the line to detect problem areas. Smart pigs are propelled by the flow of the liquid in the line. As they move, they detect dents and imperfections in the pipe and measure its wall thickness to identify corrosion. Scraper pigs can also clean the inside of a line to remove residual amounts of material clinging to the walls (Clark, 2003). Crude oil lines move many different grades oil. Grades may vary widely by density, sulfur content, and other chemical properties, and, if so, they must move sequentially in “batch mode” to preserve the integrity of each. Similarly, refined products lines move finished products – gasoline, kerosene, diesel, jet fuel, and liquid petroleum gasses – all in the same line in batch mode. Crude oil pipelines may commingle relatively homogeneous grades, though, and ship them as a common stream (Rabinow, p 38). Human interaction is minimized using specially designed control systems, generically known as SCADA (Supervisory Control and Data Acquisition) systems. SCADA systems continuously monitor the pump pressures, flow rates, and tank levels throughout the system. From a centrally located control room, operators direct the product flow, starting and stopping pumps, opening and closing valves, and filling and emptying tanks along the entire length of a pipeline which may be thousands of miles long. Operators trace and expedite individual batches, diverting them en route if needed. Their centralized information system allows them to effectively manage power consumption, their largest single operating cost (Rabinow, p. 44, 52). Pipelines are little impacted by the external environment around them. They operate round the clock in all seasons and in almost all weather conditions, shutting down mainly for earthquakes and floods. The main external forces that negatively impact them, corrosion and construction crews, are addressed as described above. Thus, with a virtually invisible public profile and a near-total degree of automation, pipelines “run silent, run deep” very much like the futuristic transportation mode of the introduction. They are well suited the physical characteristics of hazardous liquids, as evidenced by their excellent safety record and low profile. They are also well suited to the dynamics of the petroleum markets, as will be seen in the next sections. OIL MARKETS AND PIPELINES The demand for crude oil and refined products is predictable, with seasonal shifts toward increased gasoline demand in the summer, and heating oil in the winter. Demand is inelastic and remains constant over a wide range of prices. Volatility in the oil prices typically arises from the impact of supply shortages on the inelastic demand. Pipelines add reliability to the delivery of such steady volume, interruption-sensitive products. Within this inelastic environment, individual suppliers experience highly elastic demand (Arize, 2000, Bulow, 2002, Danielson et al, 1976, and Ye, 2003). This follows since a single seller of crude oil or products can quickly sell his/her total sales volume by reducing the offering price to a level slightly below the current market price. For a pipeline, this means its total volume is typically relatively constant from month to month
4
(inelastic overall demand) even though its individual shippers and their individual volumes can vary widely (elastic shipper demands). The common carrier and regulated nature of the pipeline industry accommodates this high elasticity by ensuring that all shippers are treated fairly. Responsiveness to Market Shifts Over time domestic demand has steadily increased and undergone geographic shifts. As demand shifts, so does the quantity tendered to the pipeline. Pipelines respond in several ways (Rabinow, p 36). In the short term, a pipeline can increase its capacity by injecting drag reducing agent (DRA) into the product to reduce the friction of movement, or they might defer scheduled maintenance, risks permitting. Longer term it can construct additional pump stations along the line to increase pressure until the line reaches its hydraulic capacity. Cookenboo (1955) showed that this phenomenon can be approximated by a Cobb-Douglass production function. Also, a pipeline company can “loop” a capacity constrained line by laying an additional pipe in the same trench, or can construct a new line following a new route. New construction, however, has drawbacks due to the high cost of new construction, permitting difficulties, and environmental concerns. If, on the other hand, the quantity tendered to a pipeline diminishes, the line can pump less each day or close some of its pump stations. If the quantity is minimal, the line may be shut down and purged with nitrogen. Once filled with nitrogen gas it can remain dormant for an extended period of time. Finally, a pipeline can change service between crude oil, refined products and natural gas and/or its direction of flow can be reversed. This process entails cleaning the pipe, redesigning and relocating pump stations, and establishing connections to the new customers, all of which can be quite costly. Thus, with their ability to expand and contract operations as described above, and their large infrastructure, the industry as a whole can be quite flexible in responding to market shifts. See Burke (1973) for an excellent historical discussion of the development of the pipeline infrastructure. The next section shows that this responsiveness has been extensively used throughout the past decade. Responsiveness During the Past Decade During the past decade, several trends have significantly impacted the logistics of crude oil and refined products (FTC 2004, Chapters 1, 6, and 8). First, domestic production in Texas and Oklahoma significantly declined. Second, many small mid-continent refineries that depended on that production went out of business. And third, the US demand for refined products increased overall, as the US population shifted to the Southeast. In response, the US increased crude oil imports from Canada by pipeline, developed offshore oil fields in the Gulf of Mexico, and increased tanker deliveries from foreign sources.
5
In the pipeline industry, several mid-continent crude lines were shut down due to a lack of crude oil, a new line from Canada was constructed (Express Pipeline), existing lines from Canada were expanded (Enbridge Pipeline), multiple sub-sea lines were constructed to bring Gulf of Mexico oil ashore, and crude oil lines from the Gulf Coast to the mid-continent were expanded (Exxon/Mobil). Additionally, refined products pipelines from the Gulf Coast to the mid-continent were expanded to replace the lost refining capacity. This was done by expanding existing lines (Explorer, Teppco, Colonial, and Plantation Pipelines), converting some crude oil lines to products service (Seaway, Longhorn, and Orion Pipelines) and by converting a natural gas line to refined products service (Centennial Pipeline). Finally, new refined products lines to service the Salt Lake City market are underway. The past decade has also resulted in a proliferation of refined products, as specific geographic regions (cities, states, or counties) require specific gasoline and fuel oil streams to minimize emissions (Trench, 2001, p.14-15, Rabinow p. 19, and American Petroleum Institute, 2001) using limitations on vapor pressure and sulfur content. The major refined products lines currently may move 100-120 distinct products, compared with 10-20 in the 1960s. Product proliferation creates significantly increased scheduling and tankage availability problems, but these problems have been addressed with the aid of high degree of automation afforded by SCADA systems. In the face of these market changes, the pipeline industry has been highly responsive as seen above. But tempering that responsiveness historically have been concerns of excessive market power, since pipelines dominate the petroleum industry transportation. These concerns are discussed below. COMPETITION AND REGULATION Pipelines have high fixed costs. The construction cost of large diameter (16”) line can exceed $1,000,000 per mile (OGJ, 2004), which can be extremely costly for long distances. Using the formulas rπ2 and 2rπ it would be expected that the costs of the steel used in the line (related to the circumference) would increase linearly with the radius, while the capacity (related to the area) would increase with the radius squared. Thus, oil companies tend to jointly construct and operate pipelines due to the economies of scale. Such economics can pose a significant entry barrier for small volume shippers, for unlike national highways, pipelines receive no government funding. Thus, a high capacity pipeline, owned by one or a few companies may have considerable market power. It can attempt to exercise this power through pricing policies or by requiring a minimum batch size, either of which can be onerous to a small shipper. Concerns of market concentration and unfair treatment of small shippers have resulted in regulation by the Federal Energy Regulatory Commission (FERC) from a pricing perspective, and the Federal Trade Commission (FTC) from a merger perspective. These concerns have lingered in an era where the other modes of transportation have been deregulated. See Coburn (1988) for an excellent description of the history of pipeline
6
regulation. The current responsive environment, however, shows little evidence of high concentration, for the reasons listed in the subsections below: Herfindahl Index The Merger Guidelines of the Federal Trade Commission employ the Herfindahl Index (HHI) to measure market concentration (FTC, 2004, Chapter 2). HHI is calculated as the sum of the squares of the market shares of all the competitors. HHI<1000 is considered “unconcentrated”, 1000<HHI<1800 is “moderately concentrated”, and 1800<HHI is “highly concentrated.” In 2001, the HHI for crude oil pipelines was 1225 and for refined products lines it was 698. A potential reason for the higher crude oil figure is that refineries often have ownership in the lines which serve their refineries, while refined products lines serve a broader marketplace. But neither figure is excessive, and Coleman, et al. (2001) has shown a limited impact of pipeline tariffs on the prices of refined products. FERC Regulation FERC typically limits rate increases to the Producer Price Index less 1%. Pipelines can also petition for cost of service treatment, or may negotiate rates if all shippers agree. However, in geographic regions with four or more competitors, FERC has approved market determined rates (Coleman and Rabinow pp. 9 and 46-48). In fact, FERC has not rejected requests for market based rates by refined products, in essence “deregulating” prices for some lines. For crude oil lines, rates remain indexed, indicating tighter control. Fitzsimmons (1998) performed a regression analysis on pipeline rates and concluded that “FERC regulation was found to be associated with a reduction in average rates paid by shippers. In this regard, the performance of the oil pipeline industry compared favorably to the performance of industries that experienced substantial deregulation.” Competitive Entry In the past decade or so, tax advantages have promoted the development of non-oil company pipelines through limited liability companies (LLC) and master limited partnerships (MLP). These companies include Express Pipeline, Longhorn, Kinder-Morgan, and Plains All American Pipeline. These companies offer competitive rates and as a result many oil companies have outsourced significant percentages to their business to them. The increased competitive entry relates inversely to market power. Outsourcing and Non-Oil Company Ownership In the past, large integrated oil companies preferentially awarded their oil movements to their own pipeline subsidiaries. However, more recently they have reorganized their operating divisions as profit centers instead of cost centers, allowing their pipeline
7
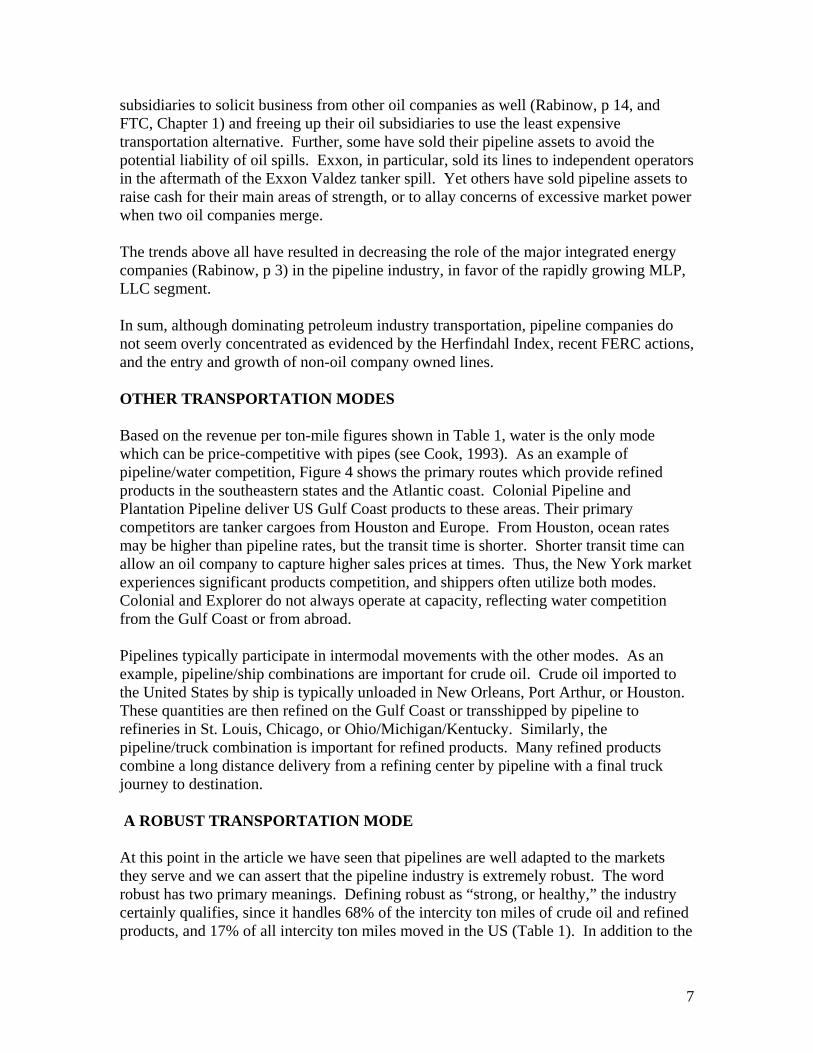
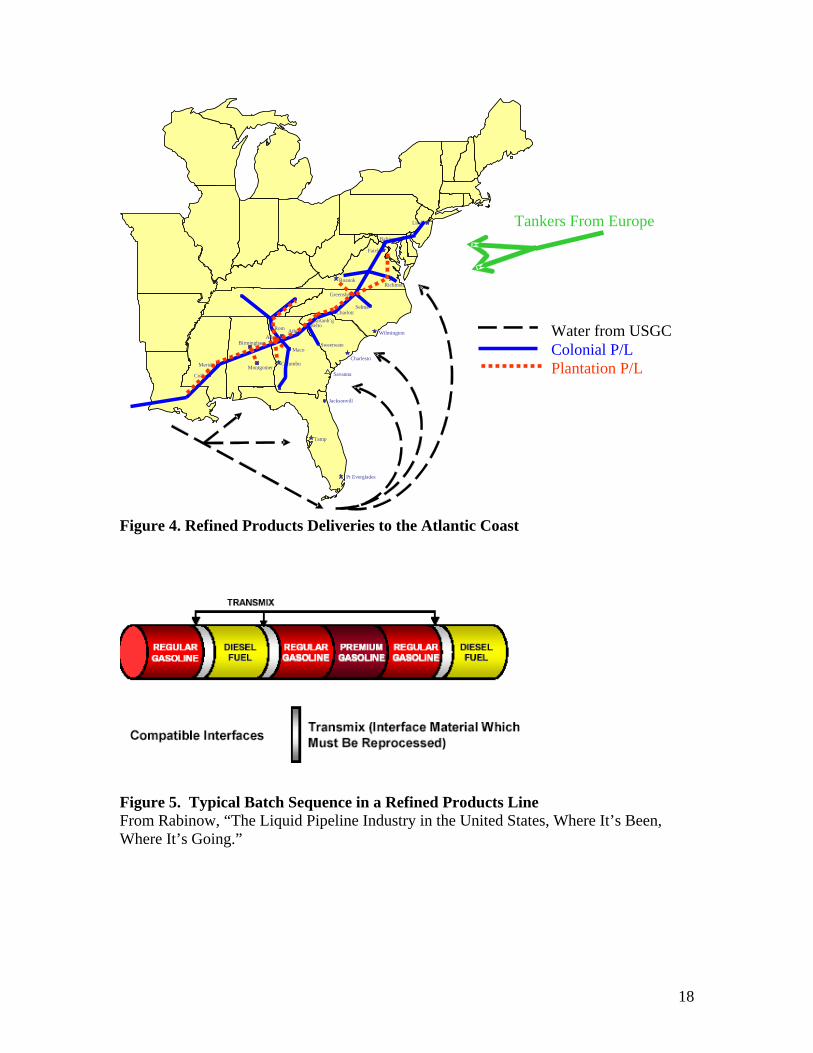
subsidiaries to solicit business from other oil companies as well (Rabinow, p 14, and FTC, Chapter 1) and freeing up their oil subsidiaries to use the least expensive transportation alternative. Further, some have sold their pipeline assets to avoid the potential liability of oil spills. Exxon, in particular, sold its lines to independent operators in the aftermath of the Exxon Valdez tanker spill. Yet others have sold pipeline assets to raise cash for their main areas of strength, or to allay concerns of excessive market power when two oil companies merge. The trends above all have resulted in decreasing the role of the major integrated energy companies (Rabinow, p 3) in the pipeline industry, in favor of the rapidly growing MLP, LLC segment. In sum, although dominating petroleum industry transportation, pipeline companies do not seem overly concentrated as evidenced by the Herfindahl Index, recent FERC actions, and the entry and growth of non-oil company owned lines. OTHER TRANSPORTATION MODES Based on the revenue per ton-mile figures shown in Table 1, water is the only mode which can be price-competitive with pipes (see Cook, 1993). As an example of pipeline/water competition, Figure 4 shows the primary routes which provide refined products in the southeastern states and the Atlantic coast. Colonial Pipeline and Plantation Pipeline deliver US Gulf Coast products to these areas. Their primary competitors are tanker cargoes from Houston and Europe. From Houston, ocean rates may be higher than pipeline rates, but the transit time is shorter. Shorter transit time can allow an oil company to capture higher sales prices at times. Thus, the New York market experiences significant products competition, and shippers often utilize both modes. Colonial and Explorer do not always operate at capacity, reflecting water competition from the Gulf Coast or from abroad. Pipelines typically participate in intermodal movements with the other modes. As an example, pipeline/ship combinations are important for crude oil. Crude oil imported to the United States by ship is typically unloaded in New Orleans, Port Arthur, or Houston. These quantities are then refined on the Gulf Coast or transshipped by pipeline to refineries in St. Louis, Chicago, or Ohio/Michigan/Kentucky. Similarly, the pipeline/truck combination is important for refined products. Many refined products combine a long distance delivery from a refining center by pipeline with a final truck journey to destination. A ROBUST TRANSPORTATION MODE At this point in the article we have seen that pipelines are well adapted to the markets they serve and we can assert that the pipeline industry is extremely robust. The word robust has two primary meanings. Defining robust as “strong, or healthy,” the industry certainly qualifies, since it handles 68% of the intercity ton miles of crude oil and refined products, and 17% of all intercity ton miles moved in the US (Table 1). In addition to the
8
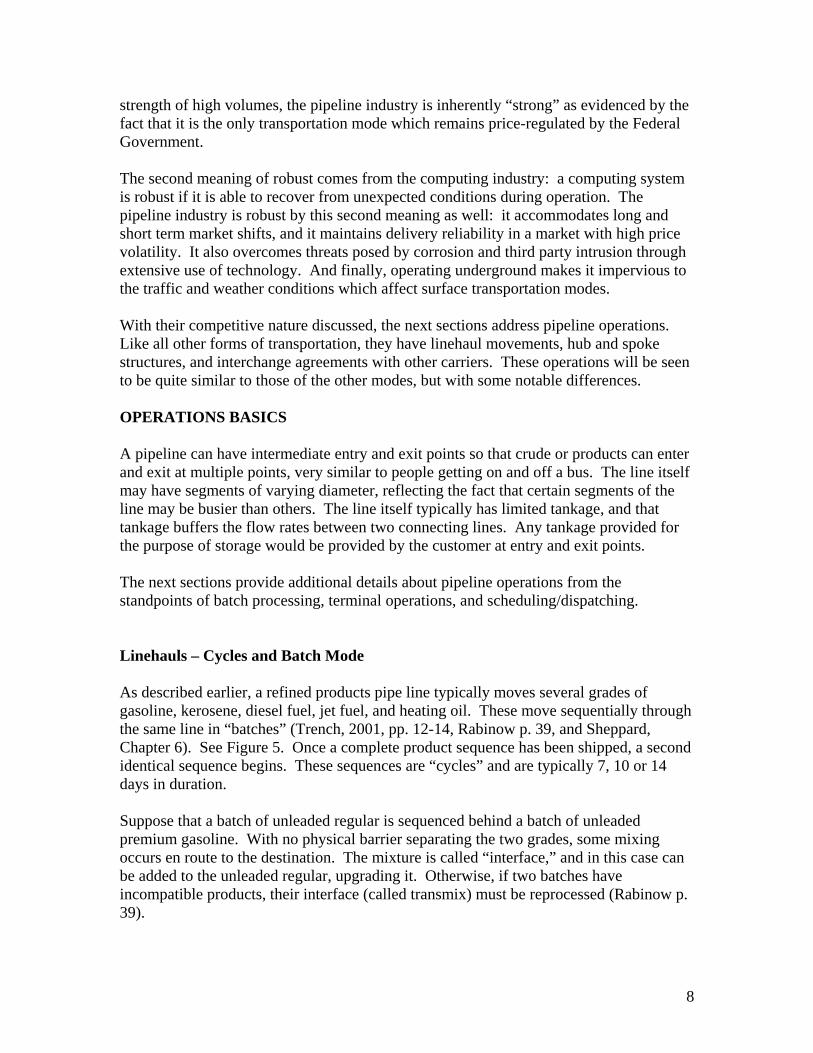
strength of high volumes, the pipeline industry is inherently “strong” as evidenced by the fact that it is the only transportation mode which remains price-regulated by the Federal Government. The second meaning of robust comes from the computing industry: a computing system is robust if it is able to recover from unexpected conditions during operation. The pipeline industry is robust by this second meaning as well: it accommodates long and short term market shifts, and it maintains delivery reliability in a market with high price volatility. It also overcomes threats posed by corrosion and third party intrusion through extensive use of technology. And finally, operating underground makes it impervious to the traffic and weather conditions which affect surface transportation modes. With their competitive nature discussed, the next sections address pipeline operations. Like all other forms of transportation, they have linehaul movements, hub and spoke structures, and interchange agreements with other carriers. These operations will be seen to be quite similar to those of the other modes, but with some notable differences. OPERATIONS BASICS A pipeline can have intermediate entry and exit points so that crude or products can enter and exit at multiple points, very similar to people getting on and off a bus. The line itself may have segments of varying diameter, reflecting the fact that certain segments of the line may be busier than others. The line itself typically has limited tankage, and that tankage buffers the flow rates between two connecting lines. Any tankage provided for the purpose of storage would be provided by the customer at entry and exit points. The next sections provide additional details about pipeline operations from the standpoints of batch processing, terminal operations, and scheduling/dispatching. Linehauls – Cycles and Batch Mode As described earlier, a refined products pipe line typically moves several grades of gasoline, kerosene, diesel fuel, jet fuel, and heating oil. These move sequentially through the same line in “batches” (Trench, 2001, pp. 12-14, Rabinow p. 39, and Sheppard, Chapter 6). See Figure 5. Once a complete product sequence has been shipped, a second identical sequence begins. These sequences are “cycles” and are typically 7, 10 or 14 days in duration. Suppose that a batch of unleaded regular is sequenced behind a batch of unleaded premium gasoline. With no physical barrier separating the two grades, some mixing occurs en route to the destination. The mixture is called “interface,” and in this case can be added to the unleaded regular, upgrading it. Otherwise, if two batches have incompatible products, their interface (called transmix) must be reprocessed (Rabinow p. 39).

9
When a batch arrives at a terminal, it is placed in a tank or rerouted (“tightlined”) directly into another pipe line. Suppose that a batch is being tightlined into pipeline “A”, and a second batch is to be placed in an empty tank “B.” When the second batch begins to arrive, the valve to “B” must be opened and the valve to “A” must be closed simultaneously, so that the entire line flow switches to tank “B.” Simultaneously opening “B” and closing “A” is called “making a cut.” It is clear that the cut must occur precisely as the new batch begins to arrive. If it is too early, some of the first batch will incorrectly go into the tank, and if it is too late, some of the second batch will incorrectly flow into pipe line “A.” A terminal needs advance notice so it is prepared to cut the flow. Advance notice is given by several methods simultaneously. First, notice is given by the automated control system (SCADA) (Rabinow p. 41), which estimates batch arrival times from meter readings. Second, the specific gravity of the batch is continuously monitored at the terminal. When a specific gravity change is noted, the operator knows that one batch is ending and the second batch is beginning. Finally, refined products are often “color coded” with dye, so that the operator can visually observe the transition. Transmix can be cut out and stored in a small holding tank until transportation back to the refinery for reprocessing can be arranged by truck or by alternate pipe line. The quantity to be reprocessed is minimized by sequencing batches in order of their gravity. Interface generation is further reduced by keeping the flow rate at a velocity referred to as “turbulent flow”, which retards mixing. Terminal Operations Pipeline terminals are distribution hubs where a pipeline collects or disperses its products and where interchange with other pipeline carriers occurs. Terminals have limited tankage, and this tankage is used to facilitate operations rather than being employed for long term storage. As example, Capline, a crude oil pipeline in New Orleans, provides tankage sufficient to unload the crude oil tankers arriving at its docks, but does not allow shippers to store oil in them for more than a few days. Also, refined products pipeline terminals may provide tankage to accumulate a batch of each of the products they ship, but no more. Shippers desiring longer term storage provide their own along with a connection to the terminal. An inbound stream of refined product may be “tightlined” into an outgoing line. If the outgoing line is of smaller diameter or operating at a slower rate than the incoming, the product may flow through a tank to buffer the pressure differential. This technique in the trucking business is called “cross-docking.” Similarly a single flow into a terminal may be “split-streamed” so that it flows into two or more smaller diameter lines simultaneously. Truck loading does not occur at pipeline terminals. Instead gasoline tank trucks are loaded from storage tanks at “marketing terminals” which are fed from the pipeline
10
terminals. Thus, a common carrier pipeline terminal typically connects to the marketing terminals of its main shippers, or to public storage terminals. Interchanges between two common carrier pipelines also occur at a terminal belonging to one of them. Products are tightlined from one to the other when possible to minimize the need for tankage. The interchange activity is simpler with pipelines than with railroads or trucking companies, though, since no equipment is exchanged for later return. Only the crude oil or product is interchanged. The key to efficient terminal operations is coordination among the incoming and outgoing carriers, since the terminal has limited storage. Whenever possible the incoming and outgoing pipelines synchronize their operations so that they use cycles of common length and follow the same shipping sequence. A lack of coordination can easily shut down a line until the specific problem is resolved. Scheduling/Dispatching A pipe line scheduler develops a monthly plan, along with a detailed hourly schedule of the month’s activities (Sheppard, Chapter 4). A scheduler is often an order taker and customer service representative as well. Customers contact the scheduler with their “nominations” (quantities to be shipped) for the next month, and the scheduler informs the customer about the status of his nominations. Typically, movements in one month must be nominated by the 25th of the previous month. As example, a pipe line might require that orders for November movements be placed by October 25. During the last days of October, the schedulers then plan the November shipping sequence. During November, they will update the schedule as actual pipe line conditions change. Pipe line dispatchers execute the schedule by starting and stopping pumps, physically making the liftings and completing the deliveries -- all from the control room. Dispatchers continually monitor each batch and ensure that physical connections to tankage or other pipelines or tanks are available when the batches arrive. They can trace and divert batches. As the reader will note, the scheduling and dispatching activities are quite similar to those found in the other transportation modes. But sequencing is perhaps more critical in the pipe line industry than in others. If a customer can not receive his shipment, the entire line may have to be stopped until the problem is solved. Stopping the line, in turn, halts all other customer shipments. If customer nominations exceed pumping capacity, schedulers must decide which nominations to reduce. This process is called “apportionment” and the apportionment rules must be defined in the company’s published tariff. As one such rule, a pipe line may reduce all current nominations proportionately. As an alternate rule, a pipe line may guarantee each shipper a quantity equal to his/her historical average shipments. Any remaining unused capacity is divided proportionately based on the current month’s nominations.
11
These rules are designed to guarantee fair treatment for all shippers in apportionment situations. Shippers whose nominations have been apportioned can re-nominate to other pipe lines. OPERATIONAL COMPARISON WITH OTHER MODES The sections above show that pipelines operate on the same principles as the other primary modes. Their terminals are similar to LTL terminals, railroad classification yards, barge fleeting areas, or airline hubs: linehaul movements and locally gathered material is received from one or more arriving pipelines, and is distributed locally or transshipped on outgoing pipelines. Interconnections are made with other pipeline carriers at these terminals as well, and terminal tankage is available only for transshipment purposes (consolidation and breakbulk). Any tanks for storage purposes are customer owned. Scheduling and dispatching are common to all modes as well. For pipelines this involves sequencing batches in delivery cycles. Sequencing batches is identical to scheduling transportation equipment on pickup and delivery routes. The primary difference is that any error, say a customer who cannot receive a batch in transit to him can stop the entire line and all deliveries behind it until the problem is resolved. This can be a more significant problem than other transportation modes which may have multiple other delivery options and vehicles to accommodate the delayed shipments. A somewhat unique feature of the pipeline industry is the absence of demurrage charges. Once a customer nominates to a pipeline and the nomination has been accepted, the shipper must make the product available at the origin at the scheduled time, and have tanks available to receive it at their destination, also at the scheduled time. If they do not comply with the schedule, there is rarely a charge by the pipeline company for loss of productive time on its equipment or inconvenience to the other shippers, unlike all other modes. This feature may have originated from the original shipper-owner nature of pipelines, but is still prevalent today. Also, interchange activities between pipelines require only the transfer of crude oil or products, and not the equipment exchanges which are required by the trucking or rail industries. A final comparison with other modes is that pipelines are likely the slowest with speeds of 3 to 8 mph (Trench, 2001, p. 12) and least costly form of transportation. Their low cost stems from many factors: there are no backhauls (since lines are unidirectional), there is no container which needs to move with the cargo (since only the product moves), and there is little product loss or damage (tight controls limit the amount of interface, leakage, and evaporation).
12
Despite being the slowest and least expensive, pipelines have the same cost versus customer service tradeoffs as all other modes. If a customer receives refined products from a pipeline which operates on a 14 day cycle, it must provide tankage to receive a batch which will cover demands for 14 days (plus safety stock). If the same customer receives products from a pipeline with a 7 day cycle, he/she only needs half as much tankage, but the interface generated will be twice as much. A 7 day cycle improves customer service, since it frees up tankage for a customer and likely permits a reduction of customer safety stock, but it comes at increased operating costs to reprocess the interface generated by twice as many batches of half the size. In summary, pipelines utilize the same transportation concepts and experience the same issues as the other modes, even though they are the least cost and slowest of them all. SUMMARY AND CONCLUSIONS The widespread view is that pipelines provide transportation linearly from “A to B.” That is, products are injected at location A and travel to location B, where they are removed. This view is pervasive through phrases such as “the distribution pipeline,” “the pharmaceuticals pipeline,” “the publishing pipeline,” and so forth. Such a misconception stems from their low public profile. Due to the invisibility, reliability, and safety record of pipelines, the general public is simply unaware of the complexity of their operations. The goal of this article has been to highlight the pipeline industry and position it more thoroughly with the other transport modes. It has done this by examining pipeline economics, regulation, and operations. From an economic view, crude oil and refined products have limited seasonality and inelastic demand. In recent years, petroleum markets have exhibited growth with significant geographical shifts and a proliferation of new products. The pipeline industry has met these challenges operationally and technologically. At the same time the competitive nature of the industry has altered as new non-oil company pipelines have entered. From a regulatory view, there is little indication of a high concentration of market power from the arguments above and the trend toward increased entry. And operationally, pipelines bear close similarity to the other transport modes. They are common carriers that collect and disperse batches of crude oil or refined products. They have hubs, interline with other carriers, and face the familiar tradeoffs between customer service and logistics costs. Scheduling and dispatching are parallel to those of other modes. However, their operating differences include a high reliance on technology (due to the synchronization demanded by sequential batch movements) and an absence of the concept of demurrage. Also they move relatively steady quantities due to the inelastic demand for crude oil and refined products. Individual shipper quantities may vary from
13
month to month and prices may be volatile, but the total quantity is high volume with limited variability. As described in the Introduction, pipelines are a futuristic mode of transportation, based on their extremely high degree of automation and otherwise low profile. Currently they dominate the ton-miles moved by the petroleum industry and move 17% of all the intercity ton miles of all products in the United States. As such, they deserve a greater awareness and significantly further study. Beyond the petroleum industry, pipelines move natural gas, anhydrous ammonia, carbon dioxide, and bulk chemicals. Also coal, iron ore, and copper are moved by slurry pipeline (i.e., as small particles in an aqueous solution). There is a growing literature and interest surrounding slurry, pneumatic, and capsule pipelines (Marrero, 2004, Zandi, 1982, and Round. 2003). REFERENCES American Petroleum Institute and Association of Oil Pipelines. Maintaining Flexibility in Refined Products Pipelines 2001. www.aopl.org/news/2001/ FTCMaintainingFlexibilityletter.pdf Arize, A.C. “US Petroleum Consumption Behavior and Oil Price Uncertainty: Tests of Co Integration and Parameter Instability.” Atlantic Economic Journal, 28 (4), Dec 2000: 463-478. Association of Oil Pipelines. Shifts in Petroleum Transportation 2003. http://www.aopl.org/pubs/2003/Shift%20Report%20Letter%20and%20Table.pdf Bulow, Jeremy, and C. Shapiro. “The British Petroleum/ARCO Merger: Alaskan Crude Oil.” J. E. Kwoka, Jr. and L. J. White, eds. The Antitrust Revolution: Economics, Competition, and Policy, 4th Edition. Oxford University Press, Oxford (2003): 22 pp. Bureau of Transportation Statistics. Oil Pipeline Profile 2003. http://products.bts.gov/publications/national_transportation_statistics/2003/html/table_oil_pipeline_profile.html Burke J. L. “Oil Pipelines’ Place in the Transportation Industry.” M. T. Farris and P. T. McElhiney eds. Modern Transportation, Selected Readings, 2nd Edition. Houghton Mifflin Company, Boston (1973): 200-224. Clark, Brian. “Pigging Today is a Mature Sophisticated Science at Last.” Pipeline and Gas Journal, August 2003: 44-48. Coburn, Leonard L. “Petroleum Pipeline Deregulation: Alternative Solutions.” Journal of the Transportation Research Forum: 185-189.
14
Coburn, Leonard L. “Eighty Years of U.S. Petroleum Pipeline Regulation.” Journal of Transportation History, 9 (2), (1988): 149-170. Coleman, Mary, G. Schink, and J. Langenfeld James, “Oil Pipelines’ Effect on Refined Products Prices.” Federal Trade Commission, August 2, 2001. http://www.ftc.gov/bc/gasconf/comments/colemanmary.htm Cook, Peter D. “Coastal Shipping vs. Pipeline for Petroleum Product Transport in the Cameroon.” Journal of the Transportation Research Forum, (1993): 191-199. Cookenboo, Leslie. Crude Oil Pipelines and Competition in the Oil Industry. Harvard University Press, Cambridge, Mass., 1955. Danielson, Albert L, and C. D. DeLorme. “Elasticity of Demand for Crude Oil in the United States 1929-41 and 1948-1973.” Review of Business and Economic Research, 11 (2), Winter 1975/76. Felt, Tim. “Testimony Before the Committee on Science, US House of Representatives.” March 13, 2002. Fitzsimmons, Edward L. “Oil Pipeline Industry Rates During Regulatory Reform.” Transportation Journal, Fall 1998: 29-37. Federal Trade Commission, Bureau of Economics. The Petroleum Industry: Mergers, Structural Change, and Antitrust Enforcement. August 2004, 280 pp. www.ftc.gov/os/2004/08/040813mergersinpetrolberpt.pdf Harrold, David. “SCADA System Improves Petroleum Distribution Efficiency.” Control Engineering, May 2001: 16-18. Marrero, T. R. “Freight Pipelines: A Survey.” Proceedings of the 16th International Conference on Hydro Transport, Santiago, Chile, April 2004: 645-658. http://www.bhrgroup.co.uk/confsite/ht04prog.htm Oil and Gas Journal. September 4, 2000: 82-84. Oil & Gas Journal. “Worldwide Pipeline Construction Update.” April 26, 2004. http://downloads.pennnet.com/pnet/surveys/ogj/040426wwpipe.pdf Rabinow, Richard A. “The Liquid Pipeline Industry in the United States, Where It’s Been, Where It’s Going,” Association of Oil Pipelines, April 2004. Round, F. F. Freight Pipelines: A Selection of Papers Presented at the 7th International Symposium on Freight Pipelines, Elsevier, Amsterdam, 2003
15
Sheppard, Nora. Introduction to the Oil Pipeline Industry, 3rd Edition. University of Texas, Austin, Texas, 1984. Trench, Cheryl J. “The US Oil Pipeline Industry’s Safety Performance.” Alegro Energy Group, Association of Oil Pipelines, New York, February 2003, 40 pp. Trench, Cheryl J. “How Pipelines Make the Oil Market Work – Their Networks, Operation, and Regulation.” Allegro Energy Group, Association of Oil Pipe Lines, New York, December 2001, 20 pp. Wilson, Rosalyn A. Transportation in America, 2002, 19th Edition. ENO Transportation Foundation, 2002. Ye, Michael, J. Zyren, and J. Shore. “Elasticity of Demand for Relative Petroleum Inventory in the Short Run.” Atlantic Economic Journal, 31 (1), March 2003: 87-104. Zandi, Iraj. “Freight Pipelines.” Journal of Pipelines 2, (1982): 77-93.
Figure 1. Crude Oil Pipelines of North America. Mapsearch.
16
Figure 2. Refined Products Pipelines of North America. Mapsearch.
Figure 3. Pipeline Safety Statistics. American Association of Oil Pipelines, 2002
17
Crude and Prod. P/Ls
Water Rail Truck Air
Miles of infrastructure 2000
85,480 crude, 91,516 prods*
25,777 inland, intracoastal
120,950 Class I RR track
114,511 Nat. Highways (incl. 46,677 Interstate)
NA
Billions of ton-miles 2001
616 400 canal/rivers 94 lakes
1,558 1,051 15
% of intercity ton-miles 2001
16.5 10.7 canal/rivers 2.5 lakes
41.7 28.1 .4
Ave. length of haul 2001 (in miles)
766 crude 418 prods* (2000 figs.)
482 canals/rivers 510 lakes 1644 coastal
735 752 LTL 294 TL
973
% of nation’s freight bill 2001
1.6 4.8 6.3 80.6 4.4
revenue per ton-mile
1.42 .719 (barge)
2.24 (Class 1)
26.6 LTL 52.92 (excl FedEx)
No. of employees 12,840* 52,970 219,110 1,337,480 543,870
Petroleum transport (% of total petrol. ton-miles) **
68.2 27.7 1.6 2.5 0
Fatalities 2001, total by mode
7 incl. gas lines
744 680 incl. commuter
41,730 all highway
1157 all air
Figures from Transportation in America, 2002. ENO Transportation Foundation, Rosalyn A. Wilson, unless otherwise noted. *Oil Pipeline Profile,” Bureau of Labor Statistics, 2003. ** Shifts in Petroleum Transportation 2003, Association of Oil Pipelines. Table 1. Comparison of Transportation Modes 2002
18
Figure 4. Refined Products Deliveries to the Atlantic Coast
Figure 5. Typical Batch Sequence in a Refined Products Line From Rabinow, “The Liquid Pipeline Industry in the United States, Where It’s Been, Where It’s Going.”
Richmon
Selma
Sweetwate
Jacksonvill
Montgomer
AthenBeltoSpartanb’g
Charlott
Birmingham
Collin
Meridia
Atlant
Greensbor
Rom
Maco
Columbu
Fairfax
Tamp
Pt Everglades
Roanok
Savanna
Baltimore
Charlesto
Linden
Wilmington
Tankers From Europe
Water from USGCColonial P/L Plantation P/L