Offshore Petroleum Platforms: Functional Significance for Larval ...
122
Transcript of Offshore Petroleum Platforms: Functional Significance for Larval ...
OCS StudyMMS 2002-077
Coastal Marine Institute
Offshore Petroleum Platforms: FunctionalSignificance for Larval Fish Across Longitudinaland Latitudinal Gradients
Authors
Richard F. ShawDavid C. LindquistMark C. BenfieldTalat FarooqiJohn T. Plunket
DECEMBER 2002
Prepared under MMS Contract14-35-0001-30660-19961byCoastal Fisheries InstituteLouisiana State UniversityBaton Rouge, LA 70803
Published by
U.S. Department of the Interior Cooperative AgreementMinerals Management Service Coastal Marine InstituteGulf of Mexico OCS Region Louisiana State University
iii
DISCLAIMER
This report was prepared under contract between the Minerals Management Service (MMS) andthe Coastal Fisheries Institute (CFI), Louisiana State University (LSU). This report has beentechnically reviewed by the MMS and it has been approved for publication. Approval does notsignify that the contents necessarily reflect the views and policies of LSU or the MMS, nor doesmention of trades names or commercial products constitute endorsement or recommendation foruse. It is, however, exempt from review and compliance with the MMS editorial standard.
REPORT AVAILABILITY
Extra copies of the report may be obtained from the Public Information Office (Mail Stop 5034)at the following address:
U.S. Department of the InteriorMinerals Management ServiceGulf of Mexico OCS RegionPublic Information Office (MS 5034)1201 Elmwood BoulevardNew Orleans, Louisiana 70123-2394
Telephone: (504) 736-2519 or1-800-200-GULF
CITATION
Suggested Citation:
Shaw, R.F., D.C. Lindquist, M.C. Benfield, T. Farooqi and J.T. Plunket. 2001. OffshorePetroleum Platforms: Functional Significance for Larval Fish Across Longitudinal andLatitudinal Gradients. Prepared by the Coastal Fisheries Institute, Louisiana StateUniversity. U.S. Department of the Interior, Minerals Management Service, Gulf ofMexico OCS Region, New Orleans, LA. OCS Study MMS 2002-077. 107 pp.
v
ACKNOWLEDGMENTS
We gratefully acknowledge funding by the Minerals Management Service-Louisiana StateUniversity-Coastal Marine Institute (Contract Number 30660-19961, OSR Number 10483). Wethank Jason Box, Danny Cline, Landon Franklin, Robin Hargroder, Sean Keenan, Brian Milan,Rishi Ramtahal, Paul Rogers, and Christopher Whatley for their assistance in the field andlaboratory. We are indebted to James Ditty, Joseph Cope and Frank Hernandez, Jr. for theirefforts during our previous platform research, and during the initial stages of this study. Wegratefully acknowledge the assistance of Drs. Ann Scarborough-Bull, Charles Wilson and DavidStanley. We would also like to thank the Santa Fe-Snyder Oil Corporation and Murphy Oil foraccess to their offshore oil and gas platforms and logistical support, and the crews of Santa Fe-Snyder’s MP 259A and Murphy Oil’s VK 203 for their assistance and hospitality.
vii
EXECUTIVE SUMMARY
The introduction and proliferation of offshore oil and gas platforms in the northern Gulfof Mexico (Gulf) has undoubtedly affected the marine ecosystem. There are approximately4,000 platforms in the federal waters of the Gulf. Because a mud/silt/sand bottom with littlerelief or hard-substrate dominates the northern Gulf, especially west of the Mississippi RiverDelta (Delta), any additional hard-substrate provided by platforms could prove significant.Although platforms provide an estimated 11.7 km2 (or 0.4%) of the total “reef” habitat in thenorthern Gulf, platform significance may be enhanced by the vertical relief of their substrate,which extends from the bottom through the photic zone to the surface. Because fish populationsare usually limited by available energy, recruitment, or habitat, it is important to determine ifplatforms: 1) serve as new or additional spawning habitat; 2) provide critical habitat for early lifehistory stages; or 3) influence energy flow through the ecosystem by aggregating prey.
Some researchers believe that certain reef fish species may be experiencing nurseryhabitat limitation, i.e., the availability of shelter at the time of settlement is the limiting factor forreef fish populations. Therefore, an underlying rationale for artificial reef deployment is thatthey provide critical habitat for settling reef fishes, and, subsequently, improve recruitment andadult production. Despite research efforts, however, biologists still disagree over the paradigmof whether artificial reefs contribute significantly to new fish production or simply attract andconcentrate individuals from surrounding habitats. Because the north-central Gulf has little reefhabitat, it is likely that the contribution of artificial reefs (e.g., platforms) has enhanced reef fishpopulations, although the net impact of this augmentation is unknown.
Few baseline, ecological ichthyoplankton studies within the Gulf’s offshore oil and gasfields have been published, and, therefore, the role that platforms may play as essential fishhabitat has not been adequately addressed. This study focused on three objectives designed toevaluate the ecological significance of platforms to the early life history stages of fishes. Thefirst objective was to characterize the larval and juvenile fish assemblages at two platforms eastof the Delta. Data from these collections were analyzed with data collected previously fromthree platforms west of the Delta to determine whether there were differences in the larval andjuvenile fish assemblages at platforms by depth (across-shelf) and by east/west of the Delta(along-shelf), as seen for adult populations. The second objective was to assess how platformsaffect the local distribution and abundance of larval and juvenile fishes, and, therefore, whetherplatforms have a nursery/refugia function for fishes. The third objective was to provide muchneeded ecological information on the early life history stages of reef fishes, e.g., seasonality,lunar periodicity, horizontal distribution, and relative abundance.
Larval and juvenile fishes were sampled at two platforms east of the Delta. Santa Fe-Snyder’s Main Pass (MP) 259, which stands in 120 m of water on the outer shelf (29°19’32” N,88°01’12” W), was sampled over two-night periods, twice monthly (i.e., new and full moonphases) during May-September 1999. Murphy Oil’s Viosca Knoll (VK) 203, which stands in 35m of water at mid-shelf (29°46’53” N, 88°19’59” W), was also sampled over two-night periods,twice monthly during May-October 2000. These platforms were selected to complement andsupplement previous sampling efforts at platforms west of the Delta [i.e., the inner shelf platformSouth Timbalier (ST) 54, the mid-shelf platform Grand Isle (GI) 94, and the outer shelf platform
viii
Green Canyon (GC) 18]. Larval and juvenile fishes were collected within the platform structureusing passive plankton nets and light traps fished at the surface, and off-platform (about 20 mdown-current of the platform) using light traps. Data collected from MP 259 and VK 203 wereanalyzed with data from the three platforms west of the Delta.
Patterns of larval and juvenile fish abundance and diversity were primarily influenced byacross-shelf gradients of increasing water depth. Larval fish total densities from plankton netswere highest for the inner shelf platform ST 54, and decreased with increasing depth. Light traptotal CPUEs were highest for the mid-shelf platforms VK 203 and GI 94, and were generally lowat the outer shelf platforms. Diversity and taxonomic richness were both generally greatest at themid-shelf platforms. This higher diversity and abundance of postlarval and juvenile fishes at themid-shelf platforms may be attributed to an overlap in species distributions between coastal andoceanic/tropical taxa. Furthermore, the platforms at intermediate depth may have higherdiversity because they reside in areas of highest platform concentration, i.e., more potential up-current sources of larvae.
The species composition of the non-clupeiform larval and juvenile fish assemblages atplatforms also seemed to be structured by depth. Cluster analysis found three generalassemblages: an inner shelf assemblage (ST 54), a mid-shelf assemblage (GI 94 and VK 203)and an outer shelf assemblage (GC 18 and MP 259). High densities of sciaenids, synodontidsand other coastal taxa characterized the inner shelf assemblage. The mid-shelf assemblage wascharacterized by blenniids, synodontids, and Bregmaceros cantori. The mid-shelf platforms alsohad the highest abundance and diversity of reef fishes, particularly blenniids, lutjanids, andpomacentrids. The outer shelf assemblage was primarily composed of oceanic pelagic taxa, suchas carangids and scombrids, and mesopelagic taxa. Because they generally agree with thosefound for adult populations, the assemblages observed at platforms probably reflect adultspawning behavior. The only differences observed in the larval and juvenile fish assemblagesacross longitudinal gradients (i.e., east or west of the Delta) were differences in the abundance ofcertain taxa. The higher abundances of these taxa collected at platforms east or west of the Deltamay be attributed to the dominant hydrographic conditions and the availability of habitat in thenortheastern and northwestern Gulf.
The waters within platforms had higher abundance and diversity of postlarval andjuvenile fishes than waters immediately down-current of the platform. Clupeiforms (clupeidsand engraulids) and synodontids were consistently collected in higher abundance within theplatform than off-platform. Taxa collected primarily in waters down-current of the platformsincluded scombrids and possibly carangids. These taxa are highly predatory and, therefore, maybe utilizing the concentrations of zooplankton and ichthyoplankton that are attracted to the lightfield of platforms. Reef fish were occasionally found in higher abundance within-platform, yetpomacentrids and the blenniid Hypsoblennius invemar were often found in higher abundance off-platform. These specimens, though, were collected at settlement-size and may representindividuals settling to the platform. The few differences observed between the “background”continental shelf (SEAMAP) collections and platform abundances of reef taxa were confoundedby the large disparity in sampling effort between SEAMAP and platform samples. In general,blenniids and pomacentrids were more abundant in platform plankton nets and light traps, whileserranids and lutjanids were more abundant in SEAMAP bongo nets and neuston nets.
ix
The larval and juvenile reef fishes collected at platforms exhibited distinct temporalpatterns of abundance. Most of the reef taxa were collected during months when surface watertemperatures were at their highest, i.e., June-August. The exceptions were the serranidsubfamilies Anthinae and Serraninae, which were predominantly collected during the late springand early fall, respectively. There were strong differences in the numbers and developmentalstages collected between new and full moons. Many preflexion reef larvae (larval stages beforethe onset of caudal fin development) were collected in higher numbers on new moons, butpreflexion holocentrids, labrids and some blenniids were collected predominantly on full moons.Postflexion reef larvae, however, were almost exclusively collected on new moons, which wasconsistent with peak periods of settlement for many reef fishes. Coefficients of variation,calculated from the mean plankton net and light trap catches per sampling night and samplingtrip, indicated pulses in the catches of several dominant taxa at platforms. Light trap-collectedblenniids and pomacentrids, in particular, were primarily found in very discrete pulses containingthe majority of settlement-size fishes collected at platforms. The occurrence of these pulsesduring darker periods of the lunar month (i.e., first quarter and new moons) further suggests thatthey were settlement-related. Settlement pulses, comprising the majority of a given year class,have been observed for many species of reef fish.
Examination of the length frequency and developmental stages of reef taxa collected atplatforms provided indirect evidence of the potential spawning and nursery/recruitment habitatprovided by platforms. Recently-hatched and preflexion blenniid, holocentrids, labrid, lutjanid,scarid, and serranid larvae were collected at every platform, indicating near by (recent)spawning. Although it is possible that these larvae were spawned at natural reefs, thepreponderance of platforms within the transport envelope of these larvae, and the generalabsence of natural hard bottoms off central Louisiana, make platforms the most probable source.Blenniids and pomacentrids were the most abundant settlement-size reef taxa. Settlement-sizelarvae of other reef taxa were relatively rare, as compared with blenniids and pomacentrids, andwere represented mostly by lutjanids, particularly at the mid-shelf platforms. The relativeabundance of settlement-size reef larvae at platforms may be influenced by two disparatespawning strategies exhibited by reef fishes: broadcast spawning of pelagic eggs or benthicspawning of demersal adhesive eggs. Pelagic spawners, e.g., serranids and labrids, generallyhave larvae with longer larval durations that are more susceptible to predation and advectiveloss. Meanwhile, benthic spawners, e.g., blenniids and pomacentrids, generally have larvae withshorter larval durations and limited dispersal, and, thus, may be able to remain in areas wheresuitable settlement habitat is more available.
Environmental conditions influenced the abundance of larval and juvenile fishescollected at both MP 259 and VK 203. Seasonal variations in temperature influenced theabundances of several taxa at the outer shelf platform MP 259. Several taxa were also associatedwith different water masses that occurred at MP 259. There was less environmental variability atthe mid-shelf platform VK 203, and consequently microzooplankton biomass was the mostinfluential environmental variable for larval and juvenile fish abundances. Catch efficiency ofthe gear was also affected by the prevailing environmental conditions. Light trap efficiency wasimpaired by high water current conditions with CPUEs <10 fish/10 min at current speeds greaterthan 30 cm s-1. At these current speeds, the catch was predominantly preflexion larvae (medianlength <10 mm) that were passively entrained by the gear. Larger postlarvae and juveniles were
x
seemingly relatively unavailable to light traps at the highest current speeds, probably due to theirinability to maneuver to and enter the light trap at these current speeds.
This study represents an important step towards understanding the ecological significanceof oil and gas platforms to the early life history stages of fishes. Platforms represent hard-substrate (i.e., “vertical benthos”) imposed on the pelagic environment. However, the mostcommon postlarval and juvenile fishes collected at platforms represented species that are pelagicas adults, e.g., clupeiforms, carangids and scombrids, and the presettlement stages of soft-bottomtaxa, e.g., synodontids. Populations of these taxa may benefit from increased foragingopportunities provided by concentrations of prey that may be found in the waters aroundplatforms. Platforms may also provide nursery/recruitment habitat for certain reef taxa, i.e.,blenniids and pomacentrids. Because artificial reefs most likely benefit species that are habitat-limited, platforms should enhance the production of typical shallow water reef taxa (e.g.,blenniids and pomacentrids) by providing additional spawning habitat and, to a much lesserextent, nursery/recruitment habitat.
xi
TABLE OF CONTENTSPAGE
Acknowledgments ............................................................................................................. vExecutive Summary ........................................................................................................... viiList of Figures .................................................................................................................... xiiiList of Tables ..................................................................................................................... xvii
Introduction ....................................................................................................................... 1
Materials and Methods ...................................................................................................... 3
Study Areas ................................................................................................................... 3 Sampling Procedures .................................................................................................... 5 Data Analyses …........................................................................................................... 7
Results ............................................................................................................................... 9
Environmental Characterization of Sampling Sites ...................................................... 9 Characterization of Fish Catches at MP 259 and VK 203 ............................................ 12 Across- and Along-Shelf Characterization of Larval and Juvenile Fish Assemblages 12 Within- vs. Off-Platform Patterns in Light Trap Catches ............................................ 33 Comparisons of Within-, and 20 m and 50 m Off-Platform Light Trap Catches ......... 40 Comparisons of SEAMAP vs. Platform Collections .................................................... 46 Seasonal Patterns of Plankton Net and Light Trap Catches ......................................... 53 Lunar Periodicity .......................................................................................................... 53 Among Trip and Night Variability in Plankton Net and Light Trap Catches .............. 59 Within-Night Variability in Plankton Net and Light Trap Catches .............................. 65 Length-Frequency and Developmental Stages of Reef Taxa ....................................... 65 Environmental Variables and Larval and Juvenile Fish Abundances .......................... 79 Relationships between Water Current Speed and Light Trap CPUE ........................... 79
Discussion .......................................................................................................................... 87
Across- and Along-Shelf Larval and Juvenile Fish Assemblages ................................ 87 Within- and Off-Platform Distribution of Larval and Juvenile Fishes ......................... 89 Seasonal Patterns of Larval and Juvenile Fish Abundance at Platforms ...................... 91 Lunar Periodicity .......................................................................................................... 92 Temporal Variability of Plankton Net and Light Trap Catches ................................... 92 Length-Frequency and Developmental Stages of Reef Taxa ....................................... 94 Environmental Variables and Larval and Juvenile Fish Abundances .......................... 95 Effects of Water Current Speed on Light Trap Catches ............................................... 96
Conclusions ....................................................................................................................... 96
Literature Cited .................................................................................................................. 99
xiii
LIST OF FIGURES
Figure PAGE
1. Location of oil and gas platforms sampled in the northern Gulf of Mexico ........ 4
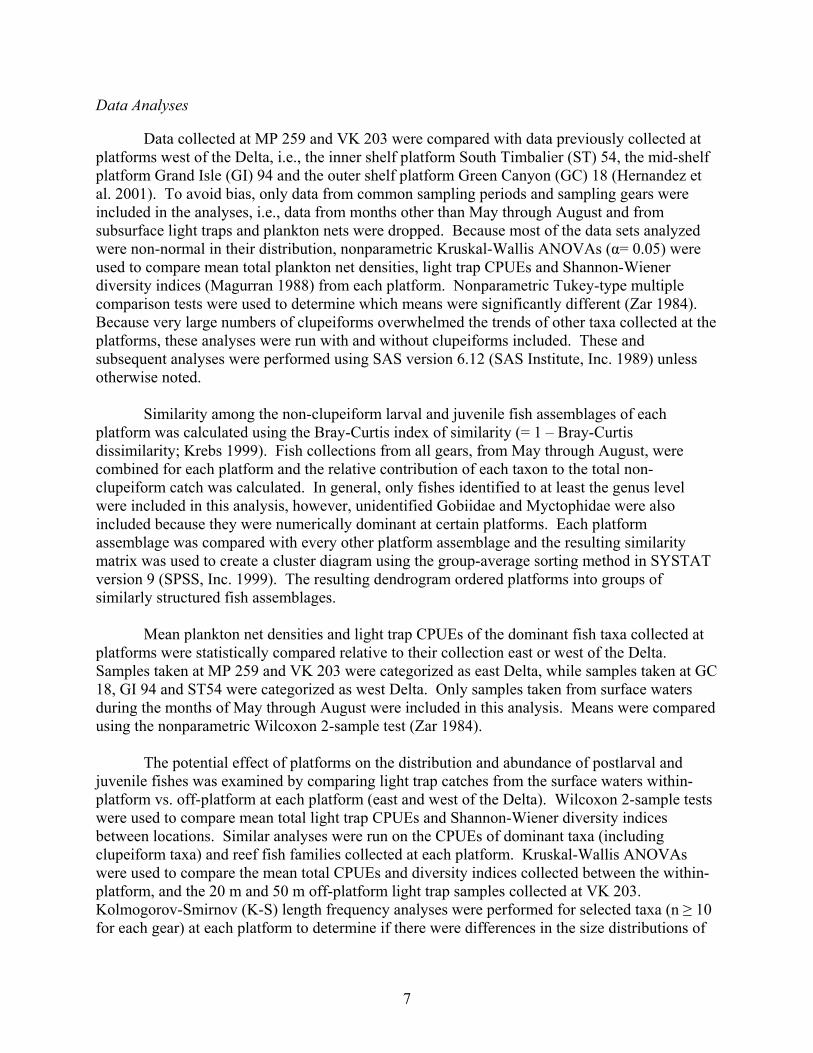
2. Mean surface temperatures, surface salinities, surface turbidities, andmicrozooplankton biomass (with standard errors) for each sampling trip at theouter shelf platform, MP 259 (depth = 120m) ...................................................... 10
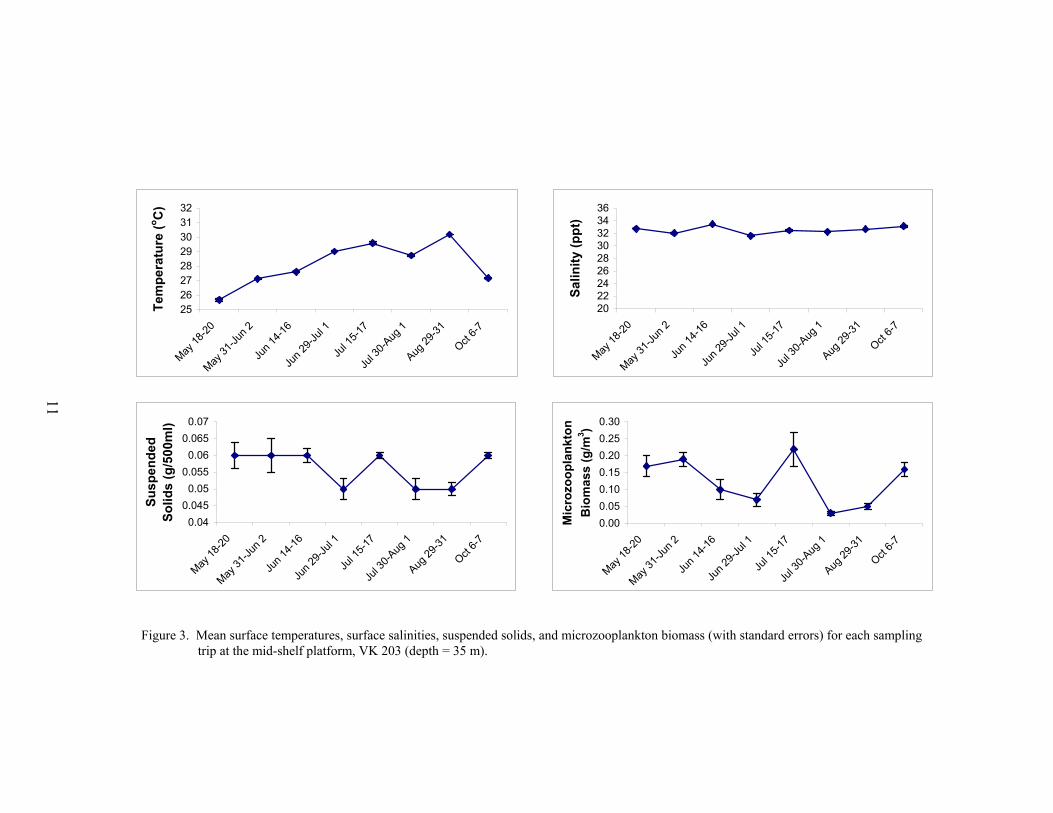
3. Mean surface temperatures, surface salinities, suspended solids, andmicrozooplankton biomass (with standard errors) for each sampling trip at themid-shelf platform, VK 203 (depth = 35m) .......................................................... 11
4. Mean total densities of fishes from plankton nets (with standard errors) at eachplatform for data a) with clupeiforms and b) without clupeiforms ...................... 25
5. Mean total CPUEs of fishes from light traps (with standard errors) at eachplatform for data a) with clupeiforms and b) without clupeiforms ....................... 26
6. Cluster diagram of the overall larval and juvenile fish assemblages, withclupeiforms excluded, collected from all gears combined at each platform ........ 29
7. Mean CPUEs (with standard errors) from within- and off-platform light traps ateach platform for data a) with clupeiforms and b) without clupeiforms .............. 32
8. Significantly different size distributions of engraulids collected by off-platform(OL) and within-platform (SL) light traps ............................................................ 36
9. Significantly different size distributions of synodontids collected by off-platform (OL) and within-platform (SL) light traps ............................................. 37
10. Significantly different size distributions of scombrids collected by off-platform(OL) and within-platform (SL) light traps ............................................................ 38
11. Significantly different size distributions of Hypsoblennius invemar collected byoff-platform (OL) and within-platform (SL) light traps. Also presented are sizedistributions of H. invemar from the inner shelf platform, ST 54 ........................ 39
12. Mean total CPUEs (with standard errors) by sampling date from light trapsdeployed at three distances relative to the mid-shelf platform VK 203: withinthe platform, 20 m down-current from the platform, and 50 m down-currentfrom the platform .................................................................................................. 41
xiv
Figure PAGE
13. Size distributions of Hypsoblennius invemar collected at VK 203 using lighttraps deployed at three distances relative to the platform: within the platform,20 m down-current from platform, and 50 m down-current from platform ......... 45
14. Significantly different size distributions of Serranidae collected at platformsusing passively-fished surface and subsurface plankton nets, and at selectednearby SEAMAP sampling stations using oblique bongo net tows ..................... 49
15. Significantly different size distributions of Lutjanidae collected at platformsusing passively-fished surface and subsurface plankton nets, and at selectednearby SEAMAP sampling stations using oblique bongo net tows ..................... 50
16. Mean plankton net densities (with standard errors) by sampling trip at the outershelf platform MP 259 (1999) for data a) with clupeiforms and b) withoutclupeiforms included ............................................................................................. 54
17. Mean light trap CPUEs (with standard errors) by sampling trip at the outer shelfplatform MP 259 (1999) for data a) with clupeiforms and b) withoutclupeiforms included ............................................................................................. 55
18. Mean plankton net densities (with standard errors) by sampling trip at the mid-shelf platform VK 203 (2000) for data a) with clupeiforms and b) withoutclupeiforms included ............................................................................................. 56
19. Mean light trap CPUEs (with standard errors) by sampling trip at the mid-shelfplatform VK 203 (2000) for data a) with clupeiforms and b) withoutclupeiforms included ............................................................................................. 57
20. Mean plankton net densities and light trap CPUEs (with standard errors) forlunar phases sampled at MP 259 and VK 203 for data with clupeiforms (shadedbars) and without clupeiforms included (open bars) ............................................ 58
21. Mean plankton net densities and light trap CPUEs (with standard errors) bysampling night for fish taxa collected at GI 94 ..................................................... 62
22. Mean light trap CPUEs (with standard errors) by sampling night for fish taxacollected at VK 203 .............................................................................................. 64
23. Mean plankton net densities and light trap CPUEs (with standard errors) bynumber of hours after sunset that collections were taken in surface waters ateach platform, for data with and without clupeiforms included ........................... 66
24. Size distributions of blenniids collected at each platform .................................... 68
xv
Figure PAGE
25. Size distributions of lutjanids collected at each platform ..................................... 70
26. Size distributions of serranids collected at each platform .................................... 72
27. Size distributions of holocentrids collected at each platform ............................... 74
28. Size distributions of pomacentrids collected at each platform ............................. 75
29. Size distributions of labrids collected at MP 259 and scarids collected at GC 18. 77
30. Scatter plots of water current speed versus mean CPUE from light traps atMP 259 and VK 203 combined, for data a) with clupeiforms and b) withoutclupeiforms included ............................................................................................. 84
31. Size distributions of fishes, with clupeiforms included, collected in light trapsfrom MP 259 and VK 203 combined at different water current speeds ............... 85
32. Size distributions of fishes, without clupeiforms included, collected in lighttraps from MP 259 and VK 203 combined at different water current speeds ...... 86
xvii
LIST OF TABLES
Table PAGE
1. Number of samples collected by date and gear for both platforms east of theMississippi River Delta ......................................................................................... 6
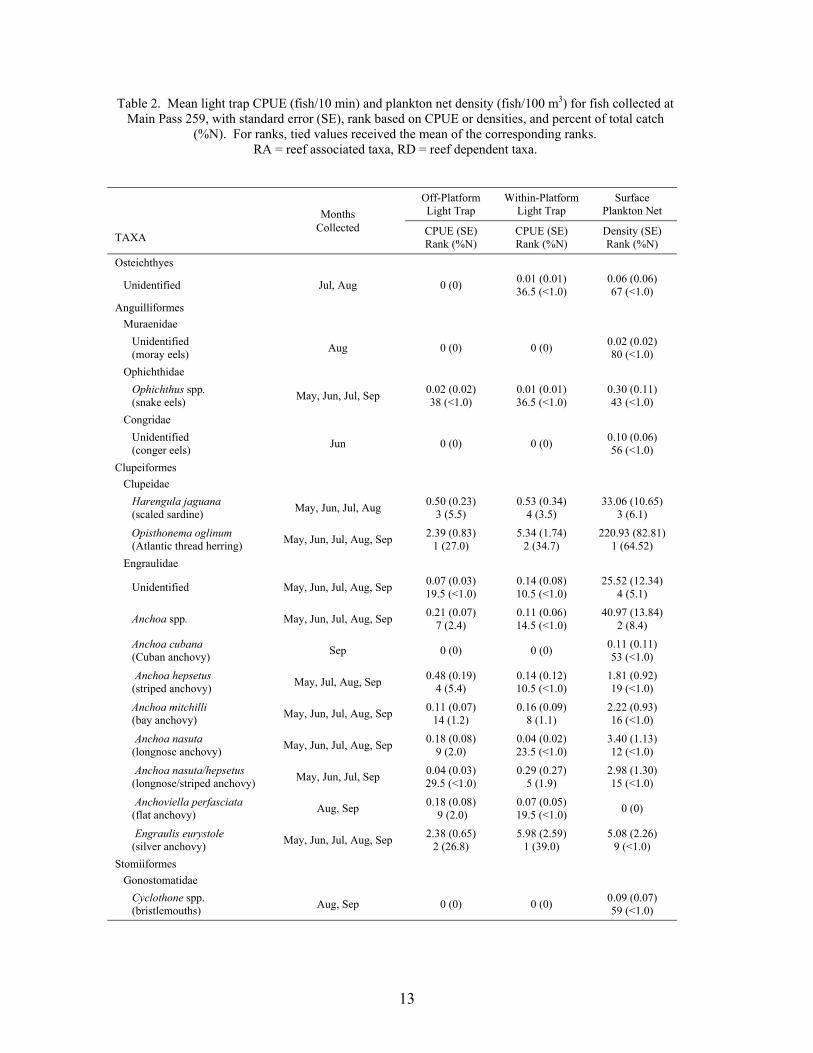
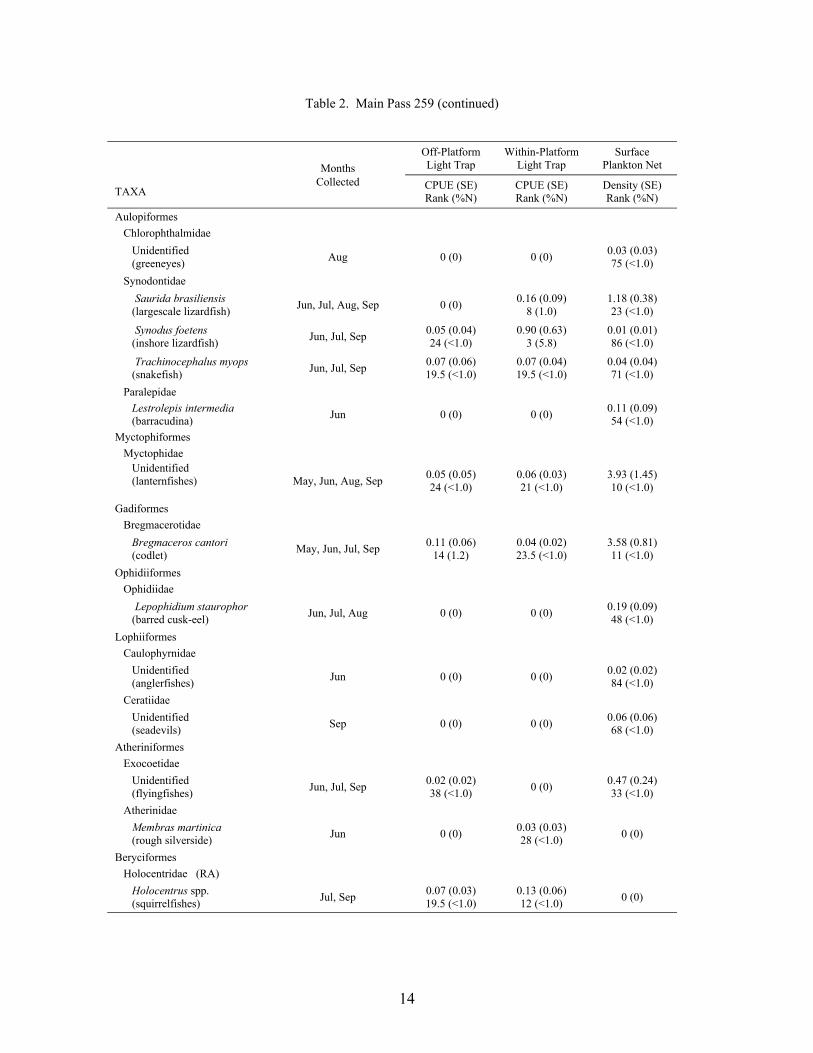
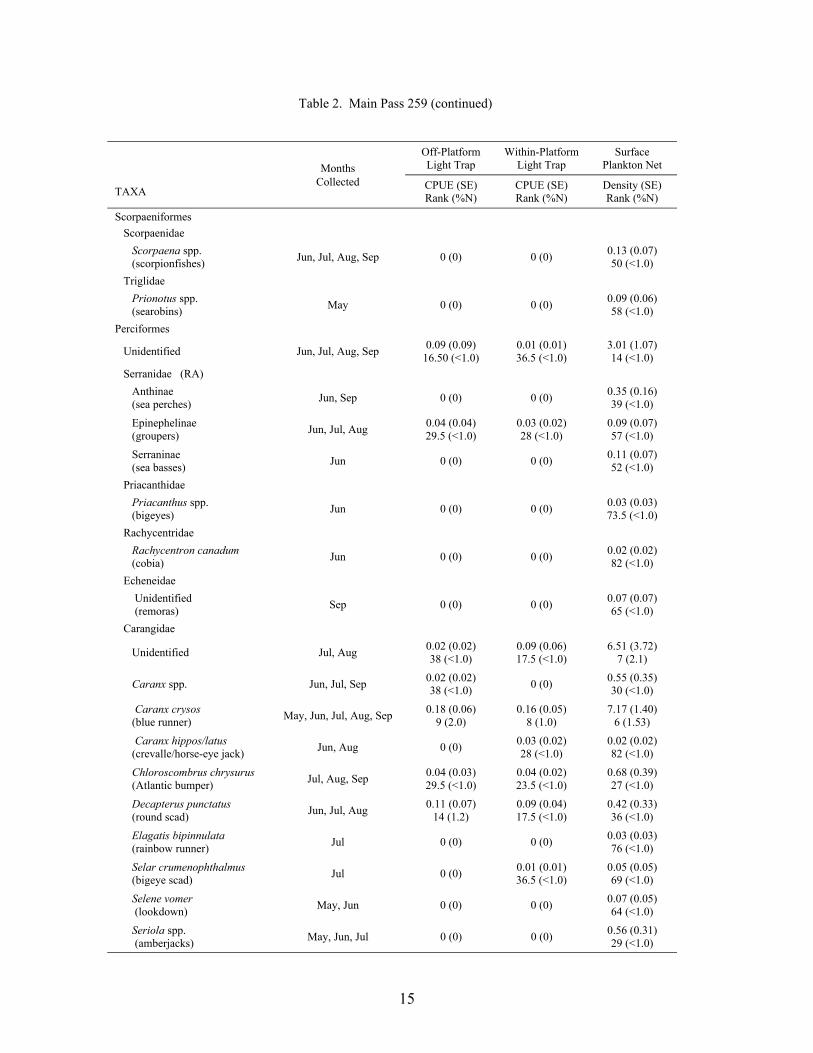
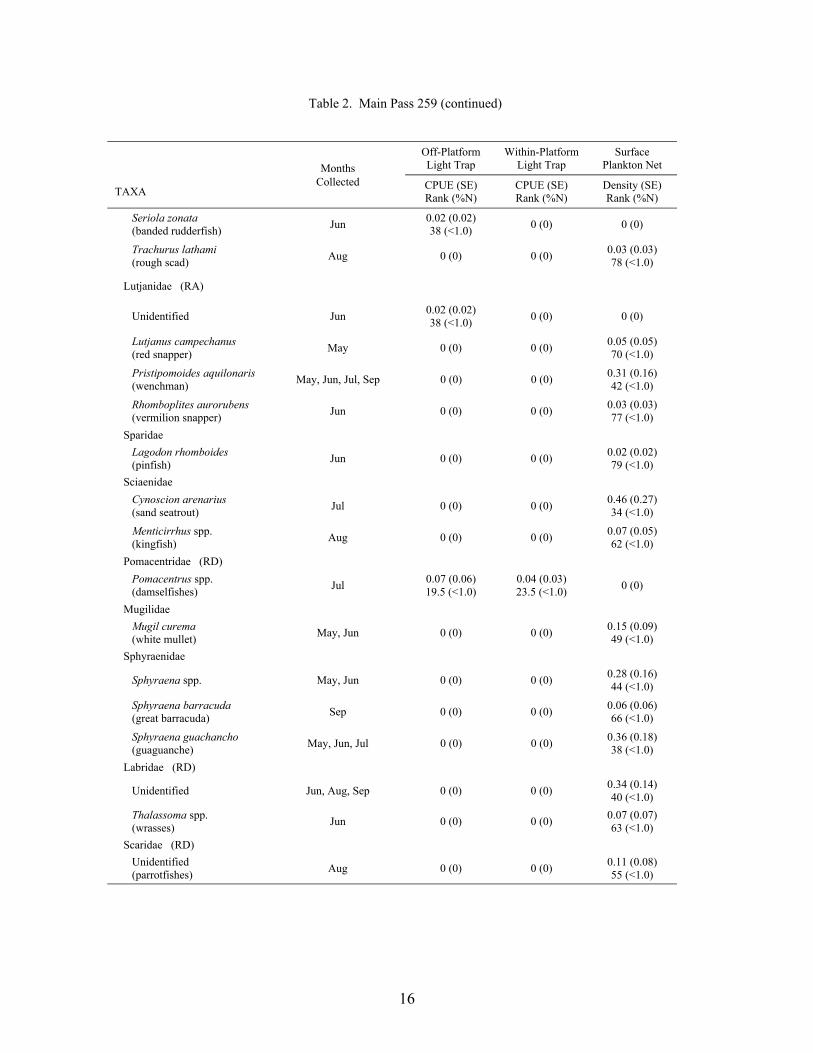
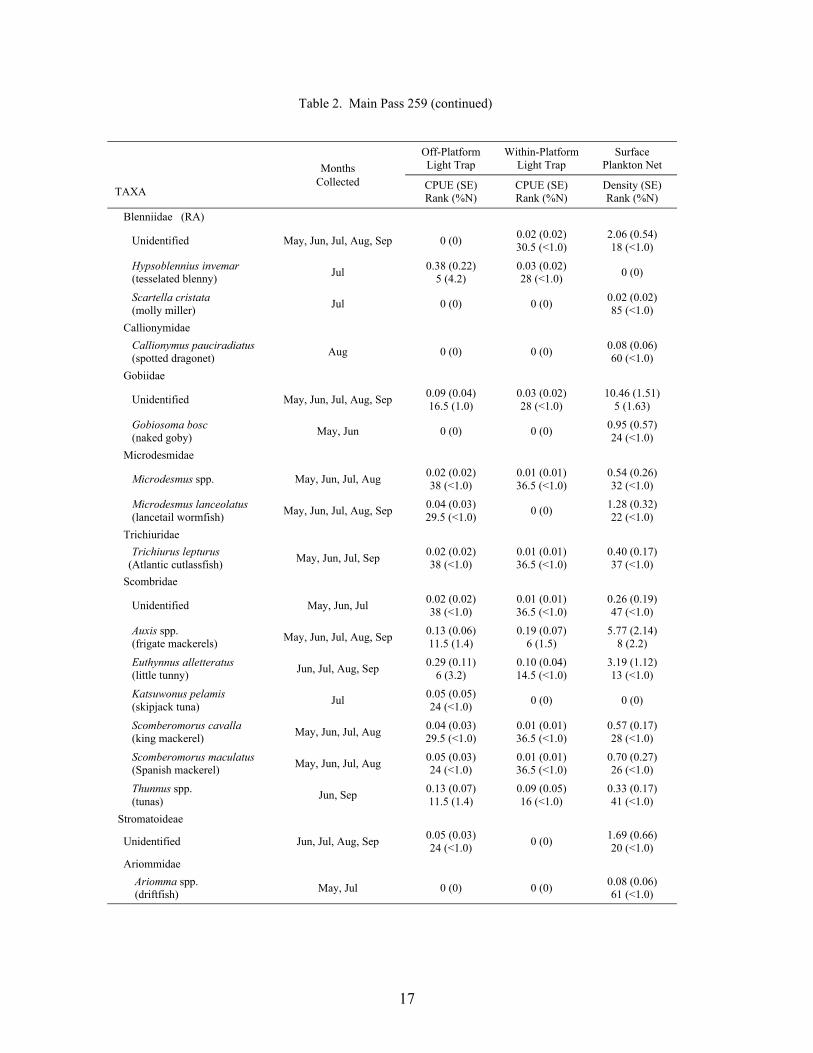
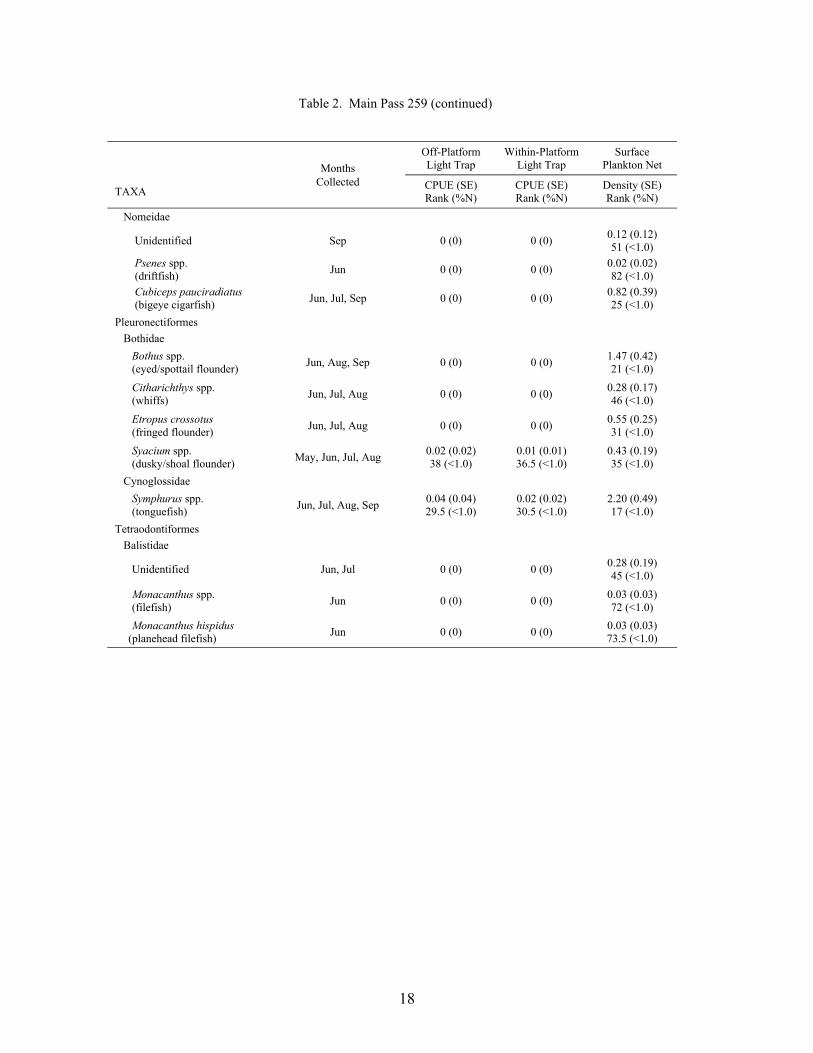
2. Mean light trap CPUE (fish/10 min) and plankton net density (fish/100 m3) forfish collected at Main Pass 259, with standard error (SE), rank based on CPUEsor densities, and percent of total catch (%N) ........................................................ 13
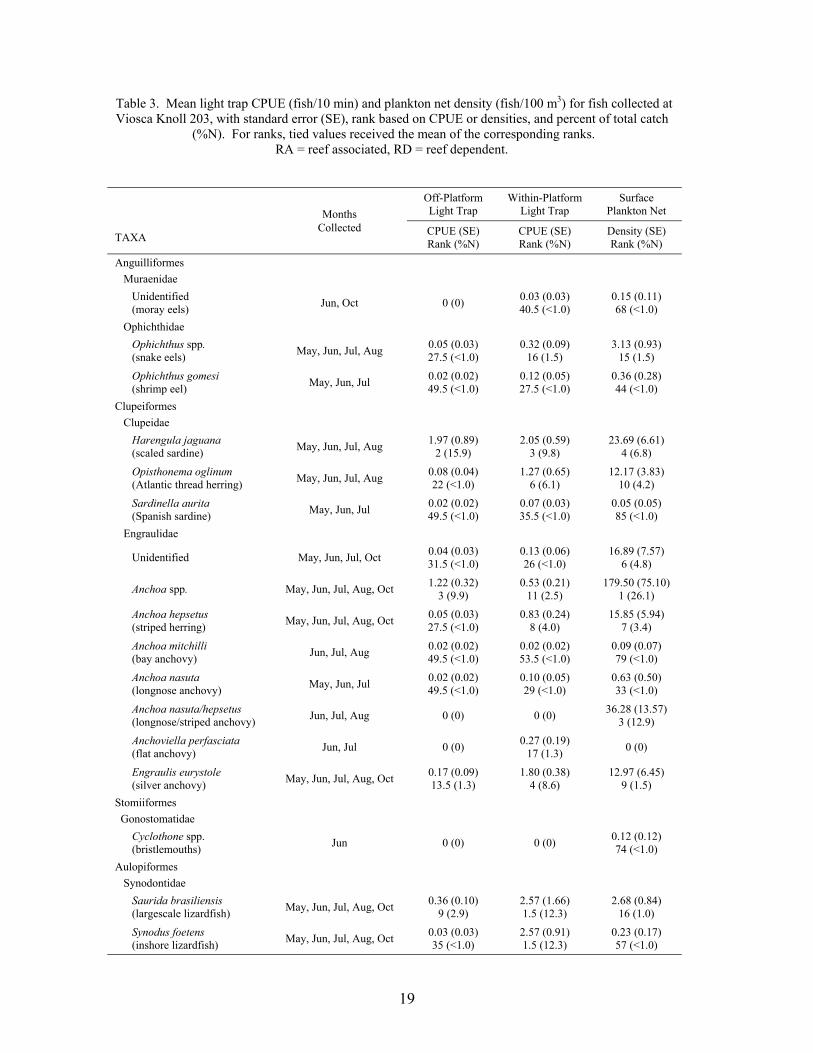
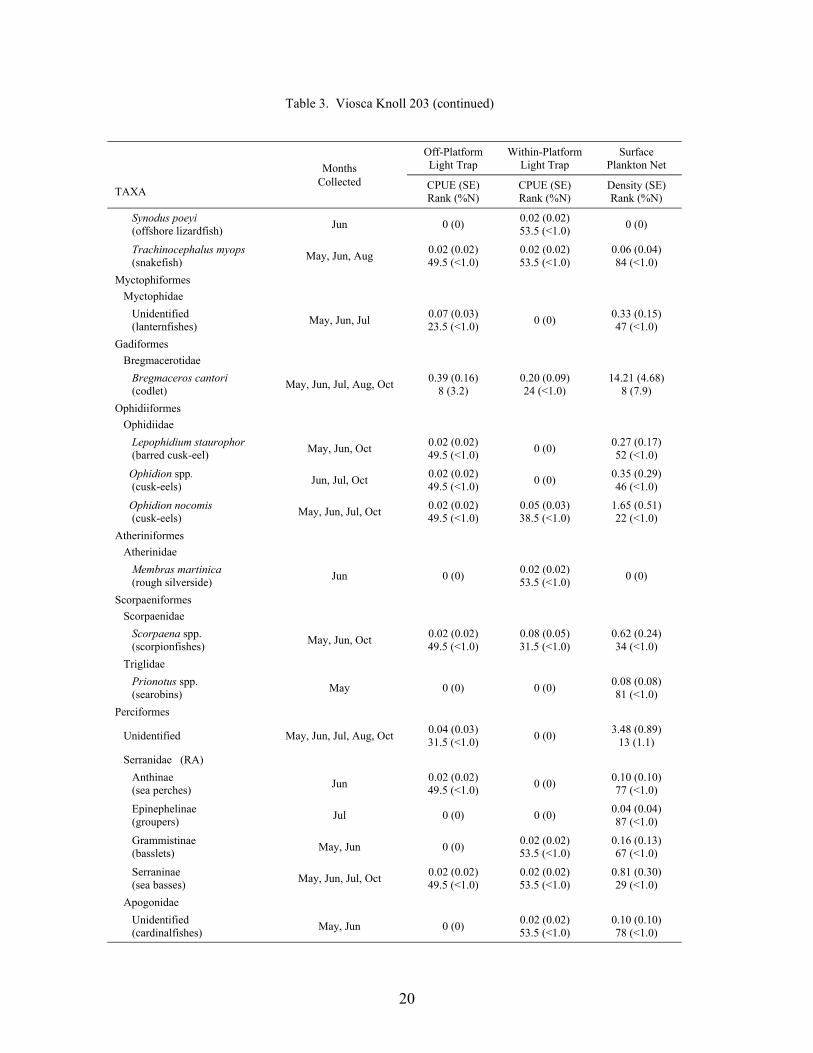
3. Mean light trap CPUE (fish/10 min) and plankton net density (fish/100 m3) forfish collected at Viosca Knoll 203, with standard error (SE), rank based onCPUE or densities, and percent of the total catch (%N) ....................................... 19
4. Taxonomic richness and mean Shannon-Weiner Diversity (with standarderrors) for the larval and juvenile fish assemblages collected at each platform ... 28
5. Relative abundance (% of total catch from plankton nets and light trapscombined) of the ten most abundant non-clupeiform taxa, and reef taxa thatcomprised >0.5%, at each platform ...................................................................... 30
6. Mean densities and CPUEs (with standard errors) for taxa more abundant atplatforms either east or west of the Mississippi River Delta in both planktonnets and light traps ................................................................................................ 31
7. Taxonomic richness and mean Shannon-Weiner Diversity (with standarderrors) for the larval and juvenile fish assemblages collected by within- (SL)and off-platform (OL) light traps at each platform ............................................... 34
8. Mean CPUEs (with standard errors) of clupeiforms from within- and off-platform light traps at each platform ..................................................................... 34
9. Mean CPUEs of the dominant taxa, and reef fish families, from within- and off-platform light traps at each platform ..................................................................... 35
10. Mean CPUE (fish/10 min) for fish collected using light traps at three distancesrelative to the mid-shelf platform VK 203, with standard error (SE), rank, andpercent of total catch (%N) ................................................................................... 42
11. Mean abundance (fish/m2), with standard deviation (SD), for reef fish collectedat selected nearby SEAMAP ichthyoplankton sampling stations (oblique, 60-cm bongo tows) and at three oil and gas platforms (passively-fished, 60-cmplankton nets, surface and subsurface) across the continental shelf west of theDelta ...............................................................................................................….. 47
xviii
Table PAGE
12. Mean abundance (fish/100 m3), with standard deviation (SD), for reef fishcollected at selected nearby SEAMAP ichthyoplankton sampling stations(oblique, 60-cm bongo tows) and at two oil and gas platforms (passively-fished, 60-cm surface plankton nets) across the continental shelf east of theDelta ...............................................................................................................…... 48
13. Mean number (fish/sample), with standard deviation (SD), for reef fishcollected at selected nearby SEAMAP ichthyoplankton sampling stations(neuston tows) and at three oil and gas platforms (light traps, within- and off-platform) across the continental shelf west of the Delta ....................................... 51
14. Mean number (fish/sample), with standard deviation (SD), for reef fishcollected at selected nearby SEAMAP ichthyoplankton sampling stations(neuston tows) and at two oil and gas platforms (light traps, within- and off-platform) across the continental shelf east of the Delta ........................................ 52
15. Total numbers of pre- and postflexion reef larvae collected on new and fullmoons at all platforms combined (except GC 18 where sampling only occurredon new moons ....................................................................................................... 60
16. Coefficients of variation of the mean densities and CPUEs by sampling trip andsampling night for the ten most abundant taxa taken by plankton nets and lighttraps, and reef families collected at the mid-shelf platform GI 94 ................. 61
17. Coefficients of variation of the mean densities and CPUEs by sampling trip andsampling night for the ten most abundant taxa taken by plankton nets and lighttraps, and reef families collected at the mid-shelf platform VK 203 .................... 63
18. Results of the canonical correlation analysis on log-transformed plankton netdensities (15 most abundant taxa, and reef fish families) and environmentalvariables for MP 259 ............................................................................................. 80
19. Results of the canonical correlation analysis on log-transformed light trapCPUEs (15 most abundant taxa) and environmental variables for MP 259 ......... 81
20. Results of the canonical correlation analysis on log-transformed plankton netdensities (15 most abundant taxa, and reef fish families) and environmentalvariables for VK 203 ............................................................................................. 82
21. Results of the canonical correlation analysis on log-transformed light trapCPUEs (15 most abundant taxa, and reef fish families) and environmentalvariables for VK 203 ............................................................................................. 83
1
Introduction
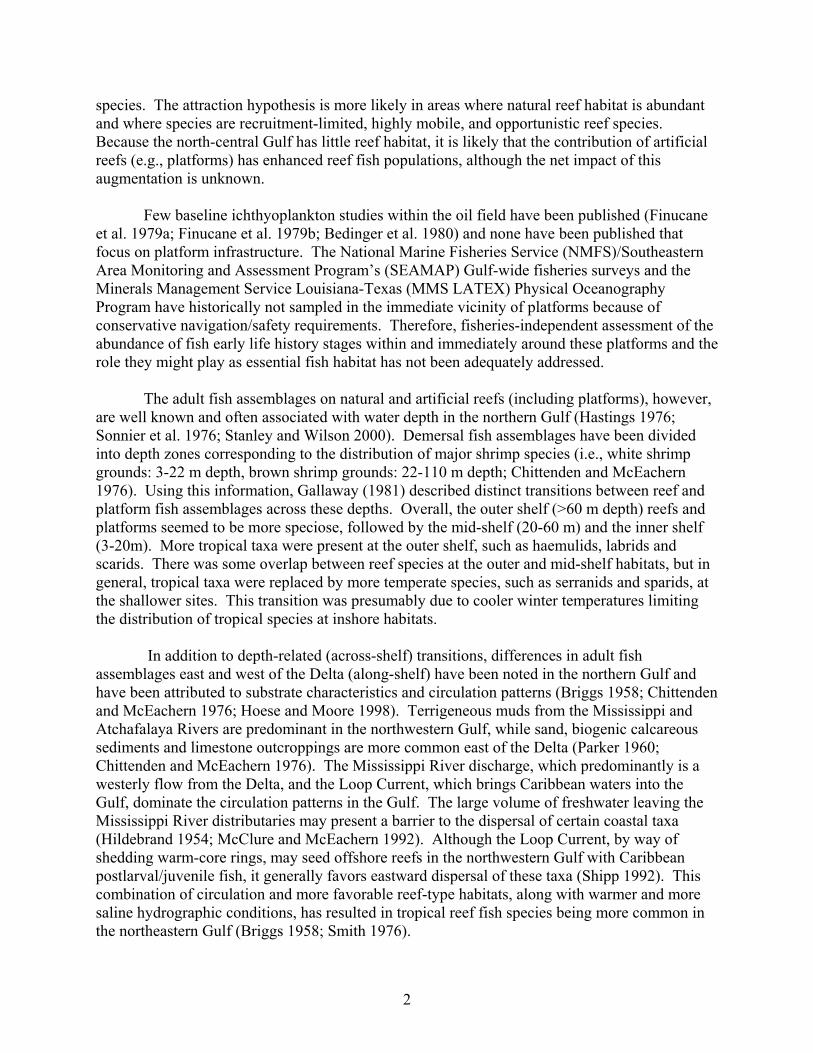
The introduction and proliferation of offshore oil and gas platforms (hereafter referred toas platforms) in the northern Gulf of Mexico (Gulf) has undoubtedly affected the marineecosystem. There are approximately 4,000 platforms in the federal waters of the Gulf (Stanleyand Wilson 2000). Because a mud/silt/sand bottom with little relief or hard-substrate dominatesthe northern Gulf, especially west of the Mississippi River Delta (Delta), any additional hard-substrate provided by platforms could prove significant. Although platforms provide anestimated 11.7 km2 (or 0.4%) of the total “reef” habitat in the northern Gulf (Gallaway 1999),platform significance may be enhanced by the vertical relief of their substrate, which extendsfrom the bottom through the photic zone to the surface. Because fish populations are usuallylimited by available energy, recruitment, or habitat, it is important to determine if platforms: 1)serve as new or additional spawning habitat; 2) provide critical habitat for early life historystages; or 3) influence energy flow through the ecosystem by aggregating prey.
Platforms can enhance fisheries by providing attachment substrate for habitat-limitedsessile invertebrates, thereby creating food and habitat for reef-dependent species that aretrophically dependent on these invertebrates (Gallaway 1981; Bohnsack and Sutherland 1985;Bohnsack 1991). In addition, platforms may offer refugia for species that are trophicallyindependent of the biofouling community, but are ecologically important resident, seasonal, ortransient members of the fish community (Gallaway and Martin 1980). Less well known,however, is whether platforms provide additional spawning habitat for fishes. Direct evidence ofspawning by resident fishes is difficult to obtain because of the patchiness of eggs and yolk-saclarvae, the likelihood of significant and variable advection to and away from platforms bypassive pelagic forms, and the inaccessibility of demersal/adhesive eggs. However, at least onespecies, the sergeant-major damselfish Abudefduf saxatilis, has been observed guarding nests onplatform structure (Scarborough-Bull and Kendall 1994). Spawning has also been observed onother types of artificial reefs (Pickering and Whitmarsh 1997). Therefore, it is likely thatreproduction does occur at platforms, particularly for demersal spawners such as blenniids andpomacentrids (Bohnsack 1989; Pickering and Whitmarsh 1997).
Because larval supply can often exceed the numbers able to settle on a reef, someresearchers believe that larval supply and mortality during the planktonic stage may limit adultreef fish populations (Sale 1980; Victor 1983). However, others believe that some species offish may be experiencing nursery habitat limitation, i.e., the availability of shelter at the time ofsettlement is the limiting factor (Ursin 1982; Shulman 1985; Hixon and Beets 1989). In theabsence of suitable shelter, the time of settlement for postlarval fishes is often characterized byhigh predation rates by resident populations. An underlying rationale for artificial reefdeployment is that they provide critical habitat for early life history stages and, subsequently,improve recruitment and adult production (Bohnsack 1989; Bohnsack et al. 1994).
Despite the potential for increased reef fish recruitment, biologists still disagree over theparadigm of whether artificial reefs contribute significantly to new fish production or simplyattract and concentrate individuals from surrounding habitats, thereby making them potentiallymore vulnerable to harvest (Pickering and Whitmarsh 1997; Bortone 1998). Bohnsack (1989)theorized that reef effects fell along a continuum between attraction and production. Speciesmost likely to benefit from increased productivity are habitat-limited, territorial, obligatory reef
2
species. The attraction hypothesis is more likely in areas where natural reef habitat is abundantand where species are recruitment-limited, highly mobile, and opportunistic reef species.Because the north-central Gulf has little reef habitat, it is likely that the contribution of artificialreefs (e.g., platforms) has enhanced reef fish populations, although the net impact of thisaugmentation is unknown.
Few baseline ichthyoplankton studies within the oil field have been published (Finucaneet al. 1979a; Finucane et al. 1979b; Bedinger et al. 1980) and none have been published thatfocus on platform infrastructure. The National Marine Fisheries Service (NMFS)/SoutheasternArea Monitoring and Assessment Program’s (SEAMAP) Gulf-wide fisheries surveys and theMinerals Management Service Louisiana-Texas (MMS LATEX) Physical OceanographyProgram have historically not sampled in the immediate vicinity of platforms because ofconservative navigation/safety requirements. Therefore, fisheries-independent assessment of theabundance of fish early life history stages within and immediately around these platforms and therole they might play as essential fish habitat has not been adequately addressed.
The adult fish assemblages on natural and artificial reefs (including platforms), however,are well known and often associated with water depth in the northern Gulf (Hastings 1976;Sonnier et al. 1976; Stanley and Wilson 2000). Demersal fish assemblages have been dividedinto depth zones corresponding to the distribution of major shrimp species (i.e., white shrimpgrounds: 3-22 m depth, brown shrimp grounds: 22-110 m depth; Chittenden and McEachern1976). Using this information, Gallaway (1981) described distinct transitions between reef andplatform fish assemblages across these depths. Overall, the outer shelf (>60 m depth) reefs andplatforms seemed to be more speciose, followed by the mid-shelf (20-60 m) and the inner shelf(3-20m). More tropical taxa were present at the outer shelf, such as haemulids, labrids andscarids. There was some overlap between reef species at the outer and mid-shelf habitats, but ingeneral, tropical taxa were replaced by more temperate species, such as serranids and sparids, atthe shallower sites. This transition was presumably due to cooler winter temperatures limitingthe distribution of tropical species at inshore habitats.
In addition to depth-related (across-shelf) transitions, differences in adult fishassemblages east and west of the Delta (along-shelf) have been noted in the northern Gulf andhave been attributed to substrate characteristics and circulation patterns (Briggs 1958; Chittendenand McEachern 1976; Hoese and Moore 1998). Terrigeneous muds from the Mississippi andAtchafalaya Rivers are predominant in the northwestern Gulf, while sand, biogenic calcareoussediments and limestone outcroppings are more common east of the Delta (Parker 1960;Chittenden and McEachern 1976). The Mississippi River discharge, which predominantly is awesterly flow from the Delta, and the Loop Current, which brings Caribbean waters into theGulf, dominate the circulation patterns in the Gulf. The large volume of freshwater leaving theMississippi River distributaries may present a barrier to the dispersal of certain coastal taxa(Hildebrand 1954; McClure and McEachern 1992). Although the Loop Current, by way ofshedding warm-core rings, may seed offshore reefs in the northwestern Gulf with Caribbeanpostlarval/juvenile fish, it generally favors eastward dispersal of these taxa (Shipp 1992). Thiscombination of circulation and more favorable reef-type habitats, along with warmer and moresaline hydrographic conditions, has resulted in tropical reef fish species being more common inthe northeastern Gulf (Briggs 1958; Smith 1976).
3
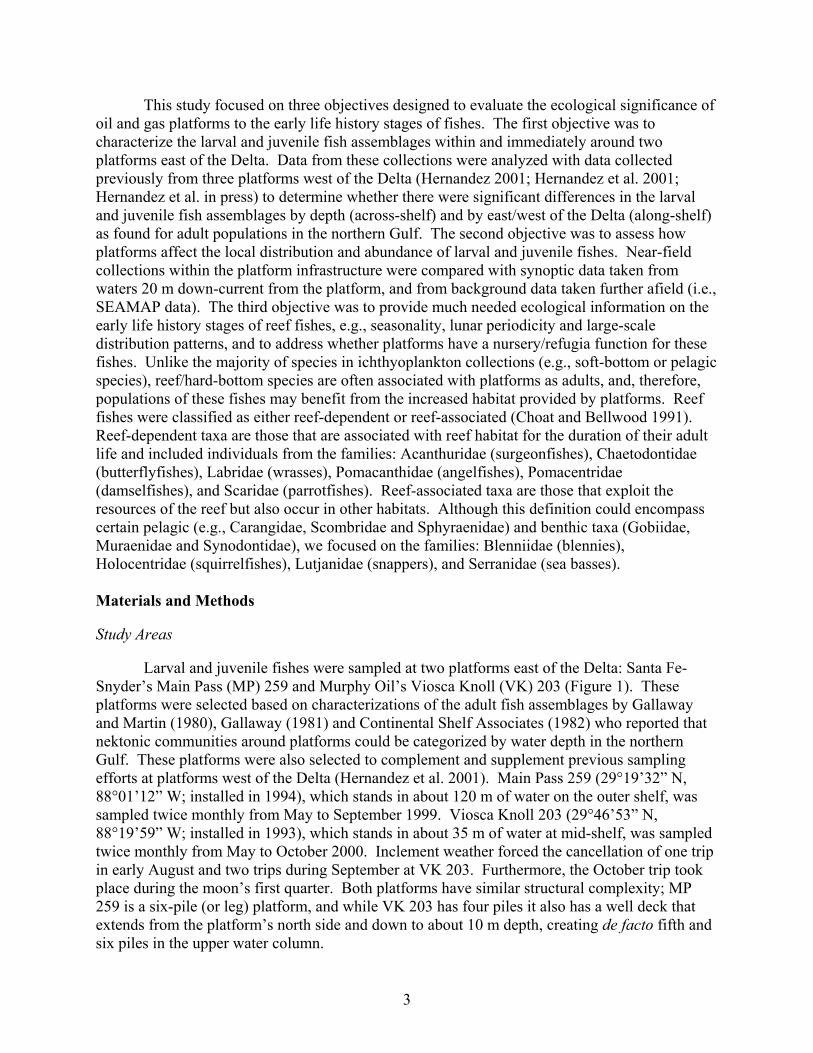
This study focused on three objectives designed to evaluate the ecological significance ofoil and gas platforms to the early life history stages of fishes. The first objective was tocharacterize the larval and juvenile fish assemblages within and immediately around twoplatforms east of the Delta. Data from these collections were analyzed with data collectedpreviously from three platforms west of the Delta (Hernandez 2001; Hernandez et al. 2001;Hernandez et al. in press) to determine whether there were significant differences in the larvaland juvenile fish assemblages by depth (across-shelf) and by east/west of the Delta (along-shelf)as found for adult populations in the northern Gulf. The second objective was to assess howplatforms affect the local distribution and abundance of larval and juvenile fishes. Near-fieldcollections within the platform infrastructure were compared with synoptic data taken fromwaters 20 m down-current from the platform, and from background data taken further afield (i.e.,SEAMAP data). The third objective was to provide much needed ecological information on theearly life history stages of reef fishes, e.g., seasonality, lunar periodicity and large-scaledistribution patterns, and to address whether platforms have a nursery/refugia function for thesefishes. Unlike the majority of species in ichthyoplankton collections (e.g., soft-bottom or pelagicspecies), reef/hard-bottom species are often associated with platforms as adults, and, therefore,populations of these fishes may benefit from the increased habitat provided by platforms. Reeffishes were classified as either reef-dependent or reef-associated (Choat and Bellwood 1991).Reef-dependent taxa are those that are associated with reef habitat for the duration of their adultlife and included individuals from the families: Acanthuridae (surgeonfishes), Chaetodontidae(butterflyfishes), Labridae (wrasses), Pomacanthidae (angelfishes), Pomacentridae(damselfishes), and Scaridae (parrotfishes). Reef-associated taxa are those that exploit theresources of the reef but also occur in other habitats. Although this definition could encompasscertain pelagic (e.g., Carangidae, Scombridae and Sphyraenidae) and benthic taxa (Gobiidae,Muraenidae and Synodontidae), we focused on the families: Blenniidae (blennies),Holocentridae (squirrelfishes), Lutjanidae (snappers), and Serranidae (sea basses).
Materials and Methods
Study Areas
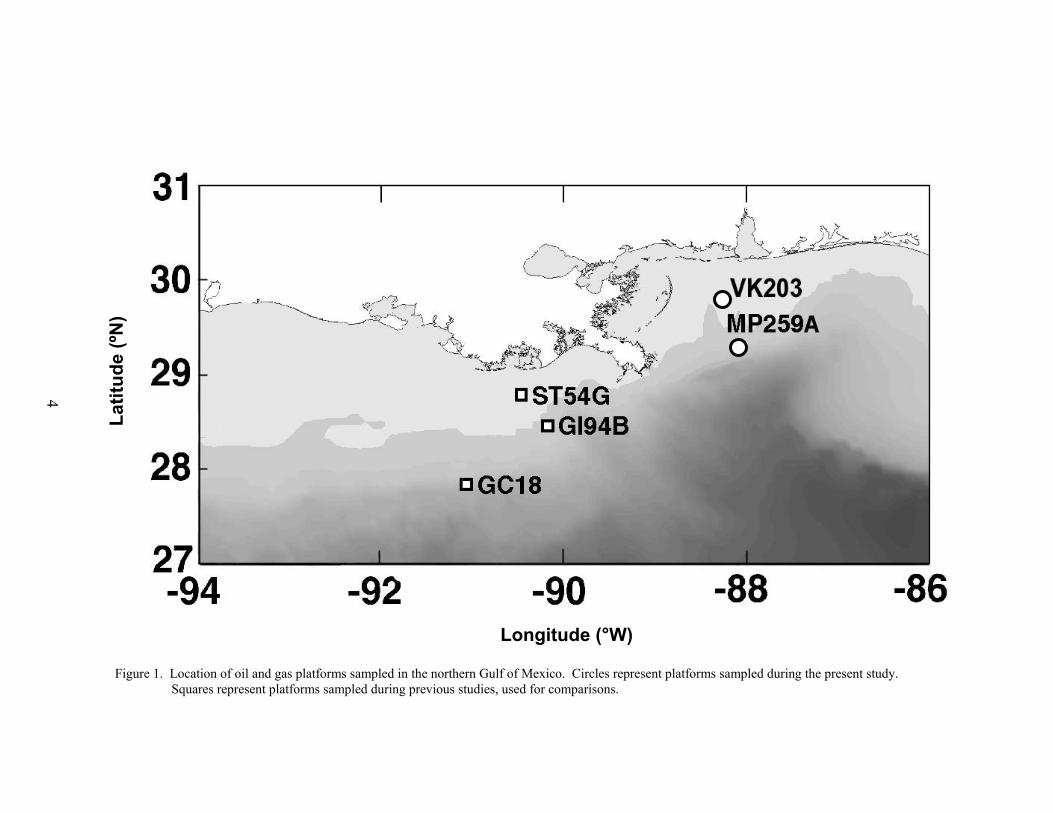
Larval and juvenile fishes were sampled at two platforms east of the Delta: Santa Fe-Snyder’s Main Pass (MP) 259 and Murphy Oil’s Viosca Knoll (VK) 203 (Figure 1). Theseplatforms were selected based on characterizations of the adult fish assemblages by Gallawayand Martin (1980), Gallaway (1981) and Continental Shelf Associates (1982) who reported thatnektonic communities around platforms could be categorized by water depth in the northernGulf. These platforms were also selected to complement and supplement previous samplingefforts at platforms west of the Delta (Hernandez et al. 2001). Main Pass 259 (29°19’32” N,88°01’12” W; installed in 1994), which stands in about 120 m of water on the outer shelf, wassampled twice monthly from May to September 1999. Viosca Knoll 203 (29°46’53” N,88°19’59” W; installed in 1993), which stands in about 35 m of water at mid-shelf, was sampledtwice monthly from May to October 2000. Inclement weather forced the cancellation of one tripin early August and two trips during September at VK 203. Furthermore, the October trip tookplace during the moon’s first quarter. Both platforms have similar structural complexity; MP259 is a six-pile (or leg) platform, and while VK 203 has four piles it also has a well deck thatextends from the platform’s north side and down to about 10 m depth, creating de facto fifth andsix piles in the upper water column.
4
Longitude (°W)
Lat
itu
de
(ºN
)
Figure 1. Location of oil and gas platforms sampled in the northern Gulf of Mexico. Circles represent platforms sampled during the present study. Squares represent platforms sampled during previous studies, used for comparisons.
5
Sampling Procedures
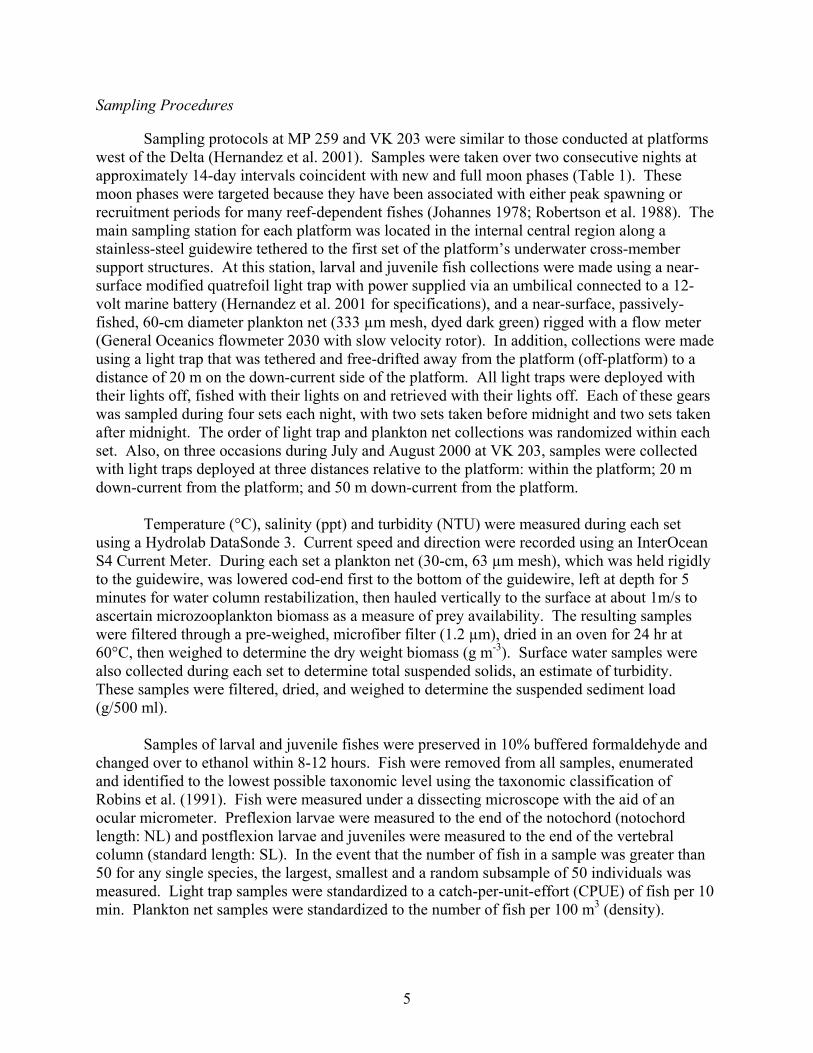
Sampling protocols at MP 259 and VK 203 were similar to those conducted at platformswest of the Delta (Hernandez et al. 2001). Samples were taken over two consecutive nights atapproximately 14-day intervals coincident with new and full moon phases (Table 1). Thesemoon phases were targeted because they have been associated with either peak spawning orrecruitment periods for many reef-dependent fishes (Johannes 1978; Robertson et al. 1988). Themain sampling station for each platform was located in the internal central region along astainless-steel guidewire tethered to the first set of the platform’s underwater cross-membersupport structures. At this station, larval and juvenile fish collections were made using a near-surface modified quatrefoil light trap with power supplied via an umbilical connected to a 12-volt marine battery (Hernandez et al. 2001 for specifications), and a near-surface, passively-fished, 60-cm diameter plankton net (333 µm mesh, dyed dark green) rigged with a flow meter(General Oceanics flowmeter 2030 with slow velocity rotor). In addition, collections were madeusing a light trap that was tethered and free-drifted away from the platform (off-platform) to adistance of 20 m on the down-current side of the platform. All light traps were deployed withtheir lights off, fished with their lights on and retrieved with their lights off. Each of these gearswas sampled during four sets each night, with two sets taken before midnight and two sets takenafter midnight. The order of light trap and plankton net collections was randomized within eachset. Also, on three occasions during July and August 2000 at VK 203, samples were collectedwith light traps deployed at three distances relative to the platform: within the platform; 20 mdown-current from the platform; and 50 m down-current from the platform.
Temperature (°C), salinity (ppt) and turbidity (NTU) were measured during each setusing a Hydrolab DataSonde 3. Current speed and direction were recorded using an InterOceanS4 Current Meter. During each set a plankton net (30-cm, 63 µm mesh), which was held rigidlyto the guidewire, was lowered cod-end first to the bottom of the guidewire, left at depth for 5minutes for water column restabilization, then hauled vertically to the surface at about 1m/s toascertain microzooplankton biomass as a measure of prey availability. The resulting sampleswere filtered through a pre-weighed, microfiber filter (1.2 µm), dried in an oven for 24 hr at60°C, then weighed to determine the dry weight biomass (g m-3). Surface water samples werealso collected during each set to determine total suspended solids, an estimate of turbidity.These samples were filtered, dried, and weighed to determine the suspended sediment load(g/500 ml).
Samples of larval and juvenile fishes were preserved in 10% buffered formaldehyde andchanged over to ethanol within 8-12 hours. Fish were removed from all samples, enumeratedand identified to the lowest possible taxonomic level using the taxonomic classification ofRobins et al. (1991). Fish were measured under a dissecting microscope with the aid of anocular micrometer. Preflexion larvae were measured to the end of the notochord (notochordlength: NL) and postflexion larvae and juveniles were measured to the end of the vertebralcolumn (standard length: SL). In the event that the number of fish in a sample was greater than50 for any single species, the largest, smallest and a random subsample of 50 individuals wasmeasured. Light trap samples were standardized to a catch-per-unit-effort (CPUE) of fish per 10min. Plankton net samples were standardized to the number of fish per 100 m3 (density).
6
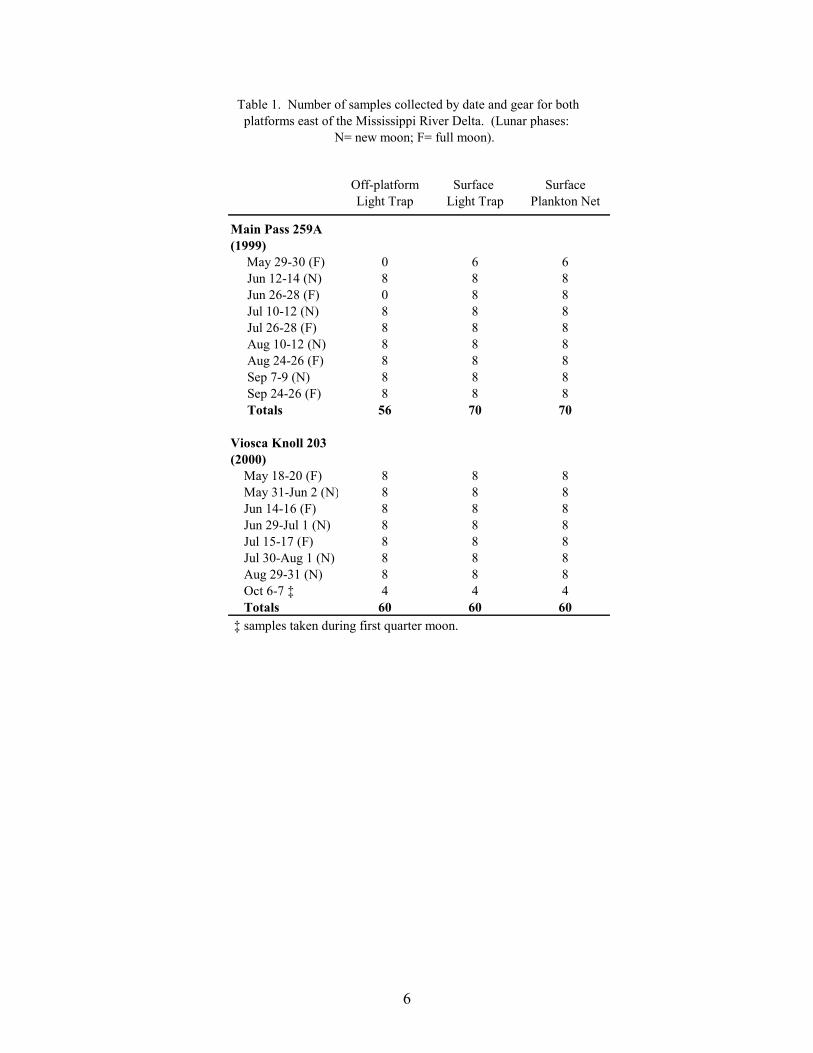
Table 1. Number of samples collected by date and gear for both platforms east of the Mississippi River Delta. (Lunar phases:
N= new moon; F= full moon).
Off-platform Surface SurfaceLight Trap Light Trap Plankton Net
Main Pass 259A(1999) May 29-30 (F) 0 6 6 Jun 12-14 (N) 8 8 8 Jun 26-28 (F) 0 8 8 Jul 10-12 (N) 8 8 8 Jul 26-28 (F) 8 8 8 Aug 10-12 (N) 8 8 8 Aug 24-26 (F) 8 8 8 Sep 7-9 (N) 8 8 8 Sep 24-26 (F) 8 8 8 Totals 56 70 70
Viosca Knoll 203(2000) May 18-20 (F) 8 8 8 May 31-Jun 2 (N) 8 8 8 Jun 14-16 (F) 8 8 8 Jun 29-Jul 1 (N) 8 8 8 Jul 15-17 (F) 8 8 8 Jul 30-Aug 1 (N) 8 8 8 Aug 29-31 (N) 8 8 8 Oct 6-7 ‡ 4 4 4 Totals 60 60 60 ‡ samples taken during first quarter moon.
7
Data Analyses
Data collected at MP 259 and VK 203 were compared with data previously collected atplatforms west of the Delta, i.e., the inner shelf platform South Timbalier (ST) 54, the mid-shelfplatform Grand Isle (GI) 94 and the outer shelf platform Green Canyon (GC) 18 (Hernandez etal. 2001). To avoid bias, only data from common sampling periods and sampling gears wereincluded in the analyses, i.e., data from months other than May through August and fromsubsurface light traps and plankton nets were dropped. Because most of the data sets analyzedwere non-normal in their distribution, nonparametric Kruskal-Wallis ANOVAs (α= 0.05) wereused to compare mean total plankton net densities, light trap CPUEs and Shannon-Wienerdiversity indices (Magurran 1988) from each platform. Nonparametric Tukey-type multiplecomparison tests were used to determine which means were significantly different (Zar 1984).Because very large numbers of clupeiforms overwhelmed the trends of other taxa collected at theplatforms, these analyses were run with and without clupeiforms included. These andsubsequent analyses were performed using SAS version 6.12 (SAS Institute, Inc. 1989) unlessotherwise noted.
Similarity among the non-clupeiform larval and juvenile fish assemblages of eachplatform was calculated using the Bray-Curtis index of similarity (= 1 – Bray-Curtisdissimilarity; Krebs 1999). Fish collections from all gears, from May through August, werecombined for each platform and the relative contribution of each taxon to the total non-clupeiform catch was calculated. In general, only fishes identified to at least the genus levelwere included in this analysis, however, unidentified Gobiidae and Myctophidae were alsoincluded because they were numerically dominant at certain platforms. Each platformassemblage was compared with every other platform assemblage and the resulting similaritymatrix was used to create a cluster diagram using the group-average sorting method in SYSTATversion 9 (SPSS, Inc. 1999). The resulting dendrogram ordered platforms into groups ofsimilarly structured fish assemblages.
Mean plankton net densities and light trap CPUEs of the dominant fish taxa collected atplatforms were statistically compared relative to their collection east or west of the Delta.Samples taken at MP 259 and VK 203 were categorized as east Delta, while samples taken at GC18, GI 94 and ST54 were categorized as west Delta. Only samples taken from surface watersduring the months of May through August were included in this analysis. Means were comparedusing the nonparametric Wilcoxon 2-sample test (Zar 1984).
The potential effect of platforms on the distribution and abundance of postlarval andjuvenile fishes was examined by comparing light trap catches from the surface waters within-platform vs. off-platform at each platform (east and west of the Delta). Wilcoxon 2-sample testswere used to compare mean total light trap CPUEs and Shannon-Wiener diversity indicesbetween locations. Similar analyses were run on the CPUEs of dominant taxa (includingclupeiform taxa) and reef fish families collected at each platform. Kruskal-Wallis ANOVAswere used to compare the mean total CPUEs and diversity indices collected between the within-platform, and the 20 m and 50 m off-platform light trap samples collected at VK 203.Kolmogorov-Smirnov (K-S) length frequency analyses were performed for selected taxa (n ≥ 10for each gear) at each platform to determine if there were differences in the size distributions of
8
these taxa collected within- vs. off-platform. All K-S tests were performed using SYSTATversion 9 (SPSS, Inc. 1999).
Platform-collected reef fish larval abundances were compared to open-water or“background” abundances from nearby SEAMAP surveys. Data were selected from SEAMAPsampling stations, from data sets for the years 1995-1997 (the most recent available data sets),that were relatively close in both proximity (location on shelf) and water depth to each platform,and during the same months as platform collections (i.e., April-August). Oblique bongo net (60-cm diameter; 333 µm mesh) and neuston net (1 x 2 m mouth; 948 µm mesh) samples werecollected at these stations using standard SEAMAP protocols (SEAMAP 2000). Becauseabundances from bongo nets were expressed as fish per 10 m2, abundances from paired passiveplankton nets (surface and subsurface) at platforms were standardized using the equation:
[(N1 + N2)/(V1 + V2)] x D x 10 where: N1 = number of fish in surface sample N2 = number of fish in subsurface sample V1 = volume of water filtered by surface net V2 = volume of water filtered by subsurface net D = total depth sampled.
Because subsurface plankton nets were not used at platforms east of the Delta, flowmeterreadings from the oblique bongo tows were used to calculate densities of fish per 100 m3. Meanabundances from bongo tows were then compared with mean abundances from plankton nets atplatforms for reef fish families. Similarly, the mean number of reef fish taxa collected inSEAMAP neuston net samples was compared with the mean number collected in light trapsamples (within- and off-platform combined) for each platform. No statistical comparisons wereattempted due to differences in sampling effort and protocols between SEAMAP and platformdata. However, reef fish size distributions were compared between bongo nets and planktonnets, and neuston nets and light traps, using K-S tests (<10 individuals for each gear).
The frequency of reef fishes collected during new vs. full moons was compared, from allplatforms combined (except GC 18 where sampling occurred only on new moons), using chi-square goodness of fit tests (α = 0.01; Zar 1984). To distinguish between possible spawning andsettlement events, separate analyses were performed for the total numbers of preflexion andpostflexion fish collected on new and full moons at platforms. Published data were used to makethe distinction between these developmental stages. Because the total number of samples(plankton nets and light traps combined) taken on new moons was higher than on full moons (n=714 and 527, respectively), the expected frequencies for each chi-square analysis were similarlydisproportional (58:42, new: full).
Several studies have noted that spawning and recruitment often occur in pulses of shortduration (Robertson et al. 1988; Doherty 1991). To identify taxa that exhibited pulses atplatforms, coefficients of variation (CVs; standardized to 100%) were calculated from the meandensities and CPUEs among trips and among nights within a sampling season for the ten mostabundant non-clupeiforms in plankton nets and light traps, and for abundant families of reef fish.These analyses were performed for data from GI 94 and VK 203, because these platforms hadthe highest numbers of reef fish collected. Plots of the nightly mean density and CPUE for taxa
9
were used, in combination with the coefficients of variation, to further illustrate the variability incatch, i.e., the taxa with the highest CVs should exhibit the most discrete pulse.
Temporal variability in larval and juvenile fish abundance was also analyzed withinnights. Mean total plankton net densities and light trap CPUEs were calculated for each hourthat sampling occurred after sunset at each platform. These means were compared using theKruskal-Wallis ANOVA and Tukey’s tests. Similar tests were performed on the hourly meandensities and CPUEs of the most abundant non-clupeiform fish taxa and reef fish families.
Canonical correlations were used to determine relationships between larval and juvenilefish abundance and environmental variables at MP 259 and VK 203. Log-transformed(log10(x+1)) plankton net densities and light trap CPUEs of the top 15 non-clupeiform taxa, andreef fish families, were analyzed along with temperature, salinity, microzooplankton biomass andmeasurements of turbidity. The importance of an environmental variable was based on themagnitude of its correlation with the environmental variate, with the sign of the correlationindicating if the variable was directly or inversely related with the variate. A taxa wasconsidered to be related to the variate if the absolute value of the correlation was greater than0.387 (i.e., the variate predicted ≥15% of the species’ variation within the model).
The effect of current speed on light trap catches was assessed by plotting the mean totallight trap CPUE against current speed (cm s-1), as measured by the S4 Current Meter. Becausethere was no obvious difference in the relationship of light trap CPUE vs. current speeddepending on the location of the light trap (within- vs. off-platform), the mean light trap CPUEper set (from both light traps combined) was plotted against the mean current speed during thatset. These means were calculated from MP 259 and VK 203 and the results from both platformswere combined. The size distributions of fishes collected at different current levels, from bothMP 259 and VK 203 combined, were analyzed using K-S tests.
Results
Environmental Characterization of Sampling Sites
Environmental conditions were variable at the outer shelf platform MP 259 (Figure 2).Mean surface temperatures increased over the season from 27.8 °C in May to a peak of 31.5 °Cduring late August, and then decreased to a low of 27.7 °C during late September. Althoughsurface salinities ranged from 29-34 ppt during most of the sampling season, minimums wereseen in May and late August (26.7 and 23.5 ppt, respectively). Mean surface turbidities rangedfrom 0.2 to 2.5 NTU, while microzooplankton biomass ranged from 0.2 to 1.4 g m-3. Peaks inmean turbidity and microzooplankton biomass coincided with the lower salinities observedduring May and late August, which suggests the presence offshore of river plume water.
In contrast, most environmental variables were relatively stable at the mid-shelf platformVK 203 (Figure 3). Mean surface temperatures showed a similar seasonal pattern as at MP 259,with low temperatures during May (25.7 °C) and high temperatures during late August (30.2 °C).However, mean surface salinities showed very little variation, ranging from 31.6 to 33.5 ppt.Mean surface turbidity measurements from the Hydrolab were near zero at all times, except for
202224262830323436
May 29
-30Ju
n 12-1
4Ju
n 26-2
8Ju
l 10-1
2Ju
l 26-2
8Aug
10-12
Aug 24
-26Sep
7-9
Sep 24
-26
Sal
init
y (p
pt)
2526272829303132
May 29
-30Ju
n 12-1
4Ju
n 26-2
8Ju
l 10-1
2Ju
l 26-2
8Aug
10-12
Aug 24
-26Sep
7-9
Sep 24
-26
Tem
per
atu
re (
oC
)
00.5
11.5
22.5
3
May 29
-30Ju
n 12-1
4Ju
n 26-2
8Ju
l 10-1
2Ju
l 26-2
8Aug
10-12
Aug 24
-26Sep
7-9
Sep 24
-26
Tu
rbid
ity
(NT
U)
0.000.200.400.600.801.001.201.401.601.80
May 29
-30Ju
n 12-1
4Ju
n 26-2
8Ju
l 10-1
2Ju
l 26-2
8Aug
10-12
Aug 24
-26Sep
7-9
Sep 24
-26
Mic
rozo
op
lan
kto
n
Bio
mas
s (g
/m3 )
Figure 2. Mean surface temperatures, surface salinities, surface turbidities, and microzooplankton biomass (with standard errors) for each sampling trip at the outer shelf platform, MP 259 (depth = 120 m).
10
202224262830323436
May 18
-20May
31-Ju
n 2Ju
n 14-1
6Ju
n 29-J
ul 1
Jul 1
5-17
Jul 3
0-Aug
1Aug
29-31
Oct 6-7
Sal
init
y (p
pt)
2526272829303132
May 18
-20May
31-Ju
n 2Ju
n 14-1
6Ju
n 29-J
ul 1
Jul 1
5-17
Jul 3
0-Aug
1Aug
29-31
Oct 6-7
Tem
per
atu
re (
oC
)
0.040.0450.05
0.0550.06
0.0650.07
May 18
-20May
31-Ju
n 2Ju
n 14-1
6Ju
n 29-J
ul 1
Jul 1
5-17
Jul 3
0-Aug
1Aug
29-31
Oct 6-7
Su
spen
ded
S
olid
s (g
/500
ml)
0.000.050.100.150.200.250.30
May 18
-20May
31-Ju
n 2Ju
n 14-1
6Ju
n 29-J
ul 1
Jul 1
5-17
Jul 3
0-Aug
1Aug
29-31
Oct 6-7
Mic
rozo
op
lan
kto
n
Bio
mas
s (g
/m3 )
Figure 3. Mean surface temperatures, surface salinities, suspended solids, and microzooplankton biomass (with standard errors) for each sampling trip at the mid-shelf platform, VK 203 (depth = 35 m).
11
12
the nights of July 15-16 (mean turbidity = 1.8 NTU ± 0.05 SE) and October 6-7 (mean = 8.4 ±0.13). Mean surface suspended solid concentrations were relatively stable, only ranging between0.05-0.06 g/500 ml. Mean microzooplankton biomass was lower than at MP 259 and rangedfrom 0.03 to 0.2 g m-3. Both the suspended solids and microzooplankton biomass curves showedsimilar patterns with lower values between June and August interrupted by a peak on July 15-17.
Characterization of Fish Catches at MP 259 and VK 203
A total of 16,439 fish, from 43 families and 69 taxa (identified to at least the genus level),was collected at the outer shelf platform MP 259 between May and September 1999 (Table 2).Of this total, 14,856 fish were collected in plankton nets and 1,583 in light traps. Plankton netcollections represented 41 families and 62 taxa, with 23 families and 33 taxa being unique to thisgear type. Meanwhile, light traps collected 21 families and 36 taxa, of which 3 families and 7taxa were unique to light traps. Mean Shannon-Wiener diversity indices were significantlyhigher for plankton net collections (mean = 1.39 ± 0.07) than light trap collections (mean = 0.82± 0.05; Wilcoxon Z = 5.77, p<0.0001). Clupeiform fishes, primarily Anchoa spp., Engrauliseurystole and Opisthonema oglinum, dominated the catch for both plankton nets (85.6% of thetotal catch) and light traps (80.3%). Caranx crysos, Auxis spp., and unidentified gobiids andmyctophids were the dominant non-clupeiforms in plankton nets, while Caranx crysos,Hypsoblennius invemar, Synodus foetens and Euthynnus alletteratus were common in light traps.
At the mid-shelf platform VK 203, a total of 6,196 fish was collected between May andOctober 2000, representing 38 families and 83 taxa (identified to at least the genus level; Table3). Plankton nets collected 4,190 fish, while light traps collected 2,006 fish. Plankton netscollected individuals from 33 families and 68 taxa, with 7 families and 15 taxa unique to nets.Light traps collected 31 families and 68 taxa, with 5 families and 15 taxa collected only by lighttraps. Mean Shannon-Wiener diversity indices were not significantly different (light trap mean =1.26 ± 0.05 vs. plankton net mean = 1.13 ± 0.08). Clupeiforms were not as dominant at VK 203as at MP 259, comprising only 60.0% of the total plankton net catch and 31.9% of the total lighttrap catch. Bregmaceros cantori, Cynoscion arenarius, Micropogonias undulatus, andunidentified gobiids were among the dominant non-clupeiform taxa collected in plankton nets,while Saurida brasiliensis, Synodus foetens, Decapterus punctatus, Hypsoblennius invemar, andEuthynnus alletteratus were common in light trap collections.
Across- and Along-Shelf Characterization of Larval and Juvenile Fish Assemblages
Mean densities of larval fishes from surface plankton nets were highest at the inner shelfplatform and decreased with increasing water depth (Figure 4). With clupeiforms included,mean densities were significantly different between platforms (Kruskal-Wallis χ2 = 38.26,p<0.0001), with highest densities at the inner shelf (ST 54 = 5001.1 fish 100m-3 ± 2467.9) andlowest at the outer shelf (GC 18 = 180.1 ± 52.0; Figure 4a). When clupeiforms were excludedfrom the analysis, mean densities were significantly different (χ2 = 33.66, p<0.0001) and thesame across-shelf pattern was observed, although no significant differences were found betweenthe inner shelf platform ST 54, and the two platforms east of the Delta, VK 203 and MP 259.
13
Table 2. Mean light trap CPUE (fish/10 min) and plankton net density (fish/100 m3) for fish collected at Main Pass 259, with standard error (SE), rank based on CPUE or densities, and percent of total catch (%N). For ranks, tied values received the mean of the corresponding ranks. RA = reef associated taxa, RD = reef dependent taxa.
MonthsOff-PlatformLight Trap
Within-PlatformLight Trap
SurfacePlankton Net
TAXACollected CPUE (SE)
Rank (%N)CPUE (SE)Rank (%N)
Density (SE)Rank (%N)
Osteichthyes
Unidentified Jul, Aug 0 (0) 0.01 (0.01)36.5 (<1.0)
0.06 (0.06)67 (<1.0)
Anguilliformes Muraenidae Unidentified (moray eels) Aug 0 (0) 0 (0) 0.02 (0.02)
80 (<1.0) Ophichthidae Ophichthus spp. (snake eels) May, Jun, Jul, Sep 0.02 (0.02)
38 (<1.0)0.01 (0.01)36.5 (<1.0)
0.30 (0.11)43 (<1.0)
Congridae Unidentified (conger eels) Jun 0 (0) 0 (0) 0.10 (0.06)
56 (<1.0)Clupeiformes Clupeidae Harengula jaguana (scaled sardine) May, Jun, Jul, Aug 0.50 (0.23)
3 (5.5)0.53 (0.34)
4 (3.5)33.06 (10.65)
3 (6.1)
Opisthonema oglinum (Atlantic thread herring) May, Jun, Jul, Aug, Sep 2.39 (0.83)
1 (27.0)5.34 (1.74)
2 (34.7)220.93 (82.81)
1 (64.52) Engraulidae
Unidentified May, Jun, Jul, Aug, Sep 0.07 (0.03)19.5 (<1.0)
0.14 (0.08)10.5 (<1.0)
25.52 (12.34)4 (5.1)
Anchoa spp. May, Jun, Jul, Aug, Sep 0.21 (0.07)7 (2.4)
0.11 (0.06)14.5 (<1.0)
40.97 (13.84)2 (8.4)
Anchoa cubana (Cuban anchovy) Sep 0 (0) 0 (0) 0.11 (0.11)
53 (<1.0) Anchoa hepsetus (striped anchovy) May, Jul, Aug, Sep 0.48 (0.19)
4 (5.4)0.14 (0.12)10.5 (<1.0)
1.81 (0.92)19 (<1.0)
Anchoa mitchilli (bay anchovy) May, Jun, Jul, Aug, Sep 0.11 (0.07)
14 (1.2)0.16 (0.09)
8 (1.1)2.22 (0.93)16 (<1.0)
Anchoa nasuta (longnose anchovy) May, Jun, Jul, Aug, Sep 0.18 (0.08)
9 (2.0)0.04 (0.02)23.5 (<1.0)
3.40 (1.13)12 (<1.0)
Anchoa nasuta/hepsetus (longnose/striped anchovy) May, Jun, Jul, Sep 0.04 (0.03)
29.5 (<1.0)0.29 (0.27)
5 (1.9)2.98 (1.30)15 (<1.0)
Anchoviella perfasciata (flat anchovy) Aug, Sep 0.18 (0.08)
9 (2.0)0.07 (0.05)19.5 (<1.0) 0 (0)
Engraulis eurystole (silver anchovy) May, Jun, Jul, Aug, Sep 2.38 (0.65)
2 (26.8)5.98 (2.59)
1 (39.0)5.08 (2.26)
9 (<1.0)Stomiiformes Gonostomatidae Cyclothone spp. (bristlemouths) Aug, Sep 0 (0) 0 (0) 0.09 (0.07)
59 (<1.0)
14
Table 2. Main Pass 259 (continued)
MonthsOff-PlatformLight Trap
Within-PlatformLight Trap
SurfacePlankton Net
TAXACollected CPUE (SE)
Rank (%N)CPUE (SE)Rank (%N)
Density (SE)Rank (%N)
Aulopiformes Chlorophthalmidae Unidentified (greeneyes) Aug 0 (0) 0 (0) 0.03 (0.03)
75 (<1.0) Synodontidae Saurida brasiliensis (largescale lizardfish) Jun, Jul, Aug, Sep 0 (0) 0.16 (0.09)
8 (1.0)1.18 (0.38)23 (<1.0)
Synodus foetens (inshore lizardfish) Jun, Jul, Sep 0.05 (0.04)
24 (<1.0)0.90 (0.63)
3 (5.8)0.01 (0.01)86 (<1.0)
Trachinocephalus myops (snakefish) Jun, Jul, Sep 0.07 (0.06)
19.5 (<1.0)0.07 (0.04)19.5 (<1.0)
0.04 (0.04)71 (<1.0)
Paralepidae Lestrolepis intermedia (barracudina) Jun 0 (0) 0 (0) 0.11 (0.09)
54 (<1.0)Myctophiformes Myctophidae Unidentified (lanternfishes) May, Jun, Aug, Sep 0.05 (0.05)
24 (<1.0)0.06 (0.03)21 (<1.0)
3.93 (1.45)10 (<1.0)
Gadiformes Bregmacerotidae Bregmaceros cantori (codlet) May, Jun, Jul, Sep 0.11 (0.06)
14 (1.2)0.04 (0.02)23.5 (<1.0)
3.58 (0.81)11 (<1.0)
Ophidiiformes Ophidiidae Lepophidium staurophor (barred cusk-eel) Jun, Jul, Aug 0 (0) 0 (0) 0.19 (0.09)
48 (<1.0)Lophiiformes Caulophyrnidae Unidentified (anglerfishes) Jun 0 (0) 0 (0) 0.02 (0.02)
84 (<1.0) Ceratiidae Unidentified (seadevils) Sep 0 (0) 0 (0) 0.06 (0.06)
68 (<1.0)Atheriniformes Exocoetidae Unidentified (flyingfishes) Jun, Jul, Sep 0.02 (0.02)
38 (<1.0) 0 (0) 0.47 (0.24)33 (<1.0)
Atherinidae Membras martinica (rough silverside) Jun 0 (0) 0.03 (0.03)
28 (<1.0) 0 (0)
Beryciformes Holocentridae (RA) Holocentrus spp. (squirrelfishes) Jul, Sep 0.07 (0.03)
19.5 (<1.0)0.13 (0.06)12 (<1.0) 0 (0)
15
Table 2. Main Pass 259 (continued)
MonthsOff-PlatformLight Trap
Within-PlatformLight Trap
SurfacePlankton Net
TAXACollected CPUE (SE)
Rank (%N)CPUE (SE)Rank (%N)
Density (SE)Rank (%N)
Scorpaeniformes Scorpaenidae Scorpaena spp. (scorpionfishes) Jun, Jul, Aug, Sep 0 (0) 0 (0) 0.13 (0.07)
50 (<1.0) Triglidae Prionotus spp. (searobins) May 0 (0) 0 (0) 0.09 (0.06)
58 (<1.0)Perciformes
Unidentified Jun, Jul, Aug, Sep 0.09 (0.09)16.50 (<1.0)
0.01 (0.01)36.5 (<1.0)
3.01 (1.07)14 (<1.0)
Serranidae (RA) Anthinae (sea perches) Jun, Sep 0 (0) 0 (0) 0.35 (0.16)
39 (<1.0)
Epinephelinae (groupers) Jun, Jul, Aug 0.04 (0.04)
29.5 (<1.0)0.03 (0.02)28 (<1.0)
0.09 (0.07)57 (<1.0)
Serraninae (sea basses) Jun 0 (0) 0 (0) 0.11 (0.07)
52 (<1.0) Priacanthidae Priacanthus spp. (bigeyes) Jun 0 (0) 0 (0) 0.03 (0.03)
73.5 (<1.0) Rachycentridae Rachycentron canadum (cobia) Jun 0 (0) 0 (0) 0.02 (0.02)
82 (<1.0) Echeneidae Unidentified (remoras) Sep 0 (0) 0 (0) 0.07 (0.07)
65 (<1.0) Carangidae
Unidentified Jul, Aug 0.02 (0.02)38 (<1.0)
0.09 (0.06)17.5 (<1.0)
6.51 (3.72)7 (2.1)
Caranx spp. Jun, Jul, Sep 0.02 (0.02)38 (<1.0) 0 (0) 0.55 (0.35)
30 (<1.0)
Caranx crysos (blue runner) May, Jun, Jul, Aug, Sep 0.18 (0.06)
9 (2.0)0.16 (0.05)
8 (1.0)7.17 (1.40)
6 (1.53)
Caranx hippos/latus (crevalle/horse-eye jack) Jun, Aug 0 (0) 0.03 (0.02)
28 (<1.0)0.02 (0.02)82 (<1.0)
Chloroscombrus chrysurus (Atlantic bumper) Jul, Aug, Sep 0.04 (0.03)
29.5 (<1.0)0.04 (0.02)23.5 (<1.0)
0.68 (0.39)27 (<1.0)
Decapterus punctatus (round scad) Jun, Jul, Aug 0.11 (0.07)
14 (1.2)0.09 (0.04)17.5 (<1.0)
0.42 (0.33)36 (<1.0)
Elagatis bipinnulata (rainbow runner) Jul 0 (0) 0 (0) 0.03 (0.03)
76 (<1.0)
Selar crumenophthalmus (bigeye scad) Jul 0 (0) 0.01 (0.01)
36.5 (<1.0)0.05 (0.05)69 (<1.0)
Selene vomer (lookdown) May, Jun 0 (0) 0 (0) 0.07 (0.05)
64 (<1.0)
Seriola spp. (amberjacks) May, Jun, Jul 0 (0) 0 (0) 0.56 (0.31)
29 (<1.0)
16
Table 2. Main Pass 259 (continued)
MonthsOff-PlatformLight Trap
Within-PlatformLight Trap
SurfacePlankton Net
TAXACollected CPUE (SE)
Rank (%N)CPUE (SE)Rank (%N)
Density (SE)Rank (%N)
Seriola zonata (banded rudderfish) Jun 0.02 (0.02)
38 (<1.0) 0 (0) 0 (0)
Trachurus lathami (rough scad) Aug 0 (0) 0 (0) 0.03 (0.03)
78 (<1.0)
Lutjanidae (RA)
Unidentified Jun 0.02 (0.02)38 (<1.0) 0 (0) 0 (0)
Lutjanus campechanus (red snapper) May 0 (0) 0 (0) 0.05 (0.05)
70 (<1.0)
Pristipomoides aquilonaris (wenchman) May, Jun, Jul, Sep 0 (0) 0 (0) 0.31 (0.16)
42 (<1.0)
Rhomboplites aurorubens (vermilion snapper) Jun 0 (0) 0 (0) 0.03 (0.03)
77 (<1.0) Sparidae Lagodon rhomboides (pinfish) Jun 0 (0) 0 (0) 0.02 (0.02)
79 (<1.0) Sciaenidae Cynoscion arenarius (sand seatrout) Jul 0 (0) 0 (0) 0.46 (0.27)
34 (<1.0)
Menticirrhus spp. (kingfish) Aug 0 (0) 0 (0) 0.07 (0.05)
62 (<1.0) Pomacentridae (RD) Pomacentrus spp. (damselfishes) Jul 0.07 (0.06)
19.5 (<1.0)0.04 (0.03)23.5 (<1.0) 0 (0)
Mugilidae Mugil curema (white mullet) May, Jun 0 (0) 0 (0) 0.15 (0.09)
49 (<1.0) Sphyraenidae
Sphyraena spp. May, Jun 0 (0) 0 (0) 0.28 (0.16)44 (<1.0)
Sphyraena barracuda (great barracuda) Sep 0 (0) 0 (0) 0.06 (0.06)
66 (<1.0)
Sphyraena guachancho (guaguanche) May, Jun, Jul 0 (0) 0 (0) 0.36 (0.18)
38 (<1.0) Labridae (RD)
Unidentified Jun, Aug, Sep 0 (0) 0 (0) 0.34 (0.14)40 (<1.0)
Thalassoma spp. (wrasses) Jun 0 (0) 0 (0) 0.07 (0.07)
63 (<1.0) Scaridae (RD) Unidentified (parrotfishes) Aug 0 (0) 0 (0) 0.11 (0.08)
55 (<1.0)
17
Table 2. Main Pass 259 (continued)
MonthsOff-PlatformLight Trap
Within-PlatformLight Trap
SurfacePlankton Net
TAXACollected CPUE (SE)
Rank (%N)CPUE (SE)Rank (%N)
Density (SE)Rank (%N)
Blenniidae (RA)
Unidentified May, Jun, Jul, Aug, Sep 0 (0) 0.02 (0.02)30.5 (<1.0)
2.06 (0.54)18 (<1.0)
Hypsoblennius invemar (tesselated blenny) Jul 0.38 (0.22)
5 (4.2)0.03 (0.02)28 (<1.0) 0 (0)
Scartella cristata (molly miller) Jul 0 (0) 0 (0) 0.02 (0.02)
85 (<1.0) Callionymidae Callionymus pauciradiatus (spotted dragonet) Aug 0 (0) 0 (0) 0.08 (0.06)
60 (<1.0) Gobiidae
Unidentified May, Jun, Jul, Aug, Sep 0.09 (0.04)16.5 (1.0)
0.03 (0.02)28 (<1.0)
10.46 (1.51)5 (1.63)
Gobiosoma bosc (naked goby) May, Jun 0 (0) 0 (0) 0.95 (0.57)
24 (<1.0) Microdesmidae
Microdesmus spp. May, Jun, Jul, Aug 0.02 (0.02)38 (<1.0)
0.01 (0.01)36.5 (<1.0)
0.54 (0.26)32 (<1.0)
Microdesmus lanceolatus (lancetail wormfish) May, Jun, Jul, Aug, Sep 0.04 (0.03)
29.5 (<1.0) 0 (0) 1.28 (0.32)22 (<1.0)
Trichiuridae Trichiurus lepturus (Atlantic cutlassfish) May, Jun, Jul, Sep 0.02 (0.02)
38 (<1.0)0.01 (0.01)36.5 (<1.0)
0.40 (0.17)37 (<1.0)
Scombridae
Unidentified May, Jun, Jul 0.02 (0.02)38 (<1.0)
0.01 (0.01)36.5 (<1.0)
0.26 (0.19)47 (<1.0)
Auxis spp. (frigate mackerels) May, Jun, Jul, Aug, Sep 0.13 (0.06)
11.5 (1.4)0.19 (0.07)
6 (1.5)5.77 (2.14)
8 (2.2)
Euthynnus alletteratus (little tunny) Jun, Jul, Aug, Sep 0.29 (0.11)
6 (3.2)0.10 (0.04)14.5 (<1.0)
3.19 (1.12)13 (<1.0)
Katsuwonus pelamis (skipjack tuna) Jul 0.05 (0.05)
24 (<1.0) 0 (0) 0 (0)
Scomberomorus cavalla (king mackerel) May, Jun, Jul, Aug 0.04 (0.03)
29.5 (<1.0)0.01 (0.01)36.5 (<1.0)
0.57 (0.17)28 (<1.0)
Scomberomorus maculatus (Spanish mackerel) May, Jun, Jul, Aug 0.05 (0.03)
24 (<1.0)0.01 (0.01)36.5 (<1.0)
0.70 (0.27)26 (<1.0)
Thunnus spp. (tunas) Jun, Sep 0.13 (0.07)
11.5 (1.4)0.09 (0.05)16 (<1.0)
0.33 (0.17)41 (<1.0)
Stromatoideae
Unidentified Jun, Jul, Aug, Sep 0.05 (0.03)24 (<1.0) 0 (0) 1.69 (0.66)
20 (<1.0) Ariommidae Ariomma spp. (driftfish) May, Jul 0 (0) 0 (0) 0.08 (0.06)
61 (<1.0)
18
Table 2. Main Pass 259 (continued)
MonthsOff-PlatformLight Trap
Within-PlatformLight Trap
SurfacePlankton Net
TAXACollected CPUE (SE)
Rank (%N)CPUE (SE)Rank (%N)
Density (SE)Rank (%N)
Nomeidae
Unidentified Sep 0 (0) 0 (0) 0.12 (0.12)51 (<1.0)
Psenes spp. (driftfish) Jun 0 (0) 0 (0) 0.02 (0.02)
82 (<1.0) Cubiceps pauciradiatus (bigeye cigarfish) Jun, Jul, Sep 0 (0) 0 (0) 0.82 (0.39)
25 (<1.0)Pleuronectiformes Bothidae Bothus spp. (eyed/spottail flounder) Jun, Aug, Sep 0 (0) 0 (0) 1.47 (0.42)
21 (<1.0)
Citharichthys spp. (whiffs) Jun, Jul, Aug 0 (0) 0 (0) 0.28 (0.17)
46 (<1.0)
Etropus crossotus (fringed flounder) Jun, Jul, Aug 0 (0) 0 (0) 0.55 (0.25)
31 (<1.0)
Syacium spp. (dusky/shoal flounder) May, Jun, Jul, Aug 0.02 (0.02)
38 (<1.0)0.01 (0.01)36.5 (<1.0)
0.43 (0.19)35 (<1.0)
Cynoglossidae Symphurus spp. (tonguefish) Jun, Jul, Aug, Sep 0.04 (0.04)
29.5 (<1.0)0.02 (0.02)30.5 (<1.0)
2.20 (0.49)17 (<1.0)
Tetraodontiformes Balistidae
Unidentified Jun, Jul 0 (0) 0 (0) 0.28 (0.19)45 (<1.0)
Monacanthus spp. (filefish) Jun 0 (0) 0 (0) 0.03 (0.03)
72 (<1.0) Monacanthus hispidus (planehead filefish) Jun 0 (0) 0 (0) 0.03 (0.03)
73.5 (<1.0)
19
Table 3. Mean light trap CPUE (fish/10 min) and plankton net density (fish/100 m3) for fish collected at Viosca Knoll 203, with standard error (SE), rank based on CPUE or densities, and percent of total catch (%N). For ranks, tied values received the mean of the corresponding ranks. RA = reef associated, RD = reef dependent.
MonthsOff-PlatformLight Trap
Within-PlatformLight Trap
SurfacePlankton Net
TAXACollected CPUE (SE)
Rank (%N)CPUE (SE)Rank (%N)
Density (SE)Rank (%N)
Anguilliformes Muraenidae Unidentified (moray eels) Jun, Oct 0 (0) 0.03 (0.03)
40.5 (<1.0)0.15 (0.11)68 (<1.0)
Ophichthidae Ophichthus spp. (snake eels) May, Jun, Jul, Aug 0.05 (0.03)
27.5 (<1.0)0.32 (0.09)
16 (1.5)3.13 (0.93)
15 (1.5)
Ophichthus gomesi (shrimp eel) May, Jun, Jul 0.02 (0.02)
49.5 (<1.0)0.12 (0.05)27.5 (<1.0)
0.36 (0.28)44 (<1.0)
Clupeiformes Clupeidae Harengula jaguana (scaled sardine) May, Jun, Jul, Aug 1.97 (0.89)
2 (15.9)2.05 (0.59)
3 (9.8)23.69 (6.61)
4 (6.8)
Opisthonema oglinum (Atlantic thread herring) May, Jun, Jul, Aug 0.08 (0.04)
22 (<1.0)1.27 (0.65)
6 (6.1)12.17 (3.83)
10 (4.2) Sardinella aurita (Spanish sardine) May, Jun, Jul 0.02 (0.02)
49.5 (<1.0)0.07 (0.03)35.5 (<1.0)
0.05 (0.05)85 (<1.0)
Engraulidae
Unidentified May, Jun, Jul, Oct 0.04 (0.03)31.5 (<1.0)
0.13 (0.06)26 (<1.0)
16.89 (7.57)6 (4.8)
Anchoa spp. May, Jun, Jul, Aug, Oct 1.22 (0.32)3 (9.9)
0.53 (0.21)11 (2.5)
179.50 (75.10)1 (26.1)
Anchoa hepsetus (striped herring) May, Jun, Jul, Aug, Oct 0.05 (0.03)
27.5 (<1.0)0.83 (0.24)
8 (4.0)15.85 (5.94)
7 (3.4)
Anchoa mitchilli (bay anchovy) Jun, Jul, Aug 0.02 (0.02)
49.5 (<1.0)0.02 (0.02)53.5 (<1.0)
0.09 (0.07)79 (<1.0)
Anchoa nasuta (longnose anchovy) May, Jun, Jul 0.02 (0.02)
49.5 (<1.0)0.10 (0.05)29 (<1.0)
0.63 (0.50)33 (<1.0)
Anchoa nasuta/hepsetus (longnose/striped anchovy) Jun, Jul, Aug 0 (0) 0 (0) 36.28 (13.57)
3 (12.9) Anchoviella perfasciata (flat anchovy) Jun, Jul 0 (0) 0.27 (0.19)
17 (1.3) 0 (0)
Engraulis eurystole (silver anchovy) May, Jun, Jul, Aug, Oct 0.17 (0.09)
13.5 (1.3)1.80 (0.38)
4 (8.6)12.97 (6.45)
9 (1.5)Stomiiformes Gonostomatidae Cyclothone spp. (bristlemouths) Jun 0 (0) 0 (0) 0.12 (0.12)
74 (<1.0)Aulopiformes Synodontidae Saurida brasiliensis (largescale lizardfish) May, Jun, Jul, Aug, Oct 0.36 (0.10)
9 (2.9)2.57 (1.66)1.5 (12.3)
2.68 (0.84)16 (1.0)
Synodus foetens (inshore lizardfish) May, Jun, Jul, Aug, Oct 0.03 (0.03)
35 (<1.0)2.57 (0.91)1.5 (12.3)
0.23 (0.17)57 (<1.0)
20
Table 3. Viosca Knoll 203 (continued)
MonthsOff-PlatformLight Trap
Within-PlatformLight Trap
SurfacePlankton Net
TAXACollected CPUE (SE)
Rank (%N)CPUE (SE)Rank (%N)
Density (SE)Rank (%N)
Synodus poeyi (offshore lizardfish) Jun 0 (0) 0.02 (0.02)
53.5 (<1.0) 0 (0)
Trachinocephalus myops (snakefish) May, Jun, Aug 0.02 (0.02)
49.5 (<1.0)0.02 (0.02)53.5 (<1.0)
0.06 (0.04)84 (<1.0)
Myctophiformes Myctophidae Unidentified (lanternfishes) May, Jun, Jul 0.07 (0.03)
23.5 (<1.0) 0 (0) 0.33 (0.15)47 (<1.0)
Gadiformes Bregmacerotidae Bregmaceros cantori (codlet) May, Jun, Jul, Aug, Oct 0.39 (0.16)
8 (3.2)0.20 (0.09)24 (<1.0)
14.21 (4.68)8 (7.9)
Ophidiiformes Ophidiidae Lepophidium staurophor (barred cusk-eel) May, Jun, Oct 0.02 (0.02)
49.5 (<1.0) 0 (0) 0.27 (0.17)52 (<1.0)
Ophidion spp. (cusk-eels) Jun, Jul, Oct 0.02 (0.02)
49.5 (<1.0) 0 (0) 0.35 (0.29)46 (<1.0)
Ophidion nocomis (cusk-eels) May, Jun, Jul, Oct 0.02 (0.02)
49.5 (<1.0)0.05 (0.03)38.5 (<1.0)
1.65 (0.51)22 (<1.0)
Atheriniformes Atherinidae Membras martinica (rough silverside) Jun 0 (0) 0.02 (0.02)
53.5 (<1.0) 0 (0)
Scorpaeniformes Scorpaenidae Scorpaena spp. (scorpionfishes) May, Jun, Oct 0.02 (0.02)
49.5 (<1.0)0.08 (0.05)31.5 (<1.0)
0.62 (0.24)34 (<1.0)
Triglidae Prionotus spp. (searobins) May 0 (0) 0 (0) 0.08 (0.08)
81 (<1.0)Perciformes
Unidentified May, Jun, Jul, Aug, Oct 0.04 (0.03)31.5 (<1.0) 0 (0) 3.48 (0.89)
13 (1.1) Serranidae (RA) Anthinae (sea perches) Jun 0.02 (0.02)
49.5 (<1.0) 0 (0) 0.10 (0.10)77 (<1.0)
Epinephelinae (groupers) Jul 0 (0) 0 (0) 0.04 (0.04)
87 (<1.0)
Grammistinae (basslets) May, Jun 0 (0) 0.02 (0.02)
53.5 (<1.0)0.16 (0.13)67 (<1.0)
Serraninae (sea basses) May, Jun, Jul, Oct 0.02 (0.02)
49.5 (<1.0)0.02 (0.02)53.5 (<1.0)
0.81 (0.30)29 (<1.0)
Apogonidae Unidentified (cardinalfishes) May, Jun 0 (0) 0.02 (0.02)
53.5 (<1.0)0.10 (0.10)78 (<1.0)
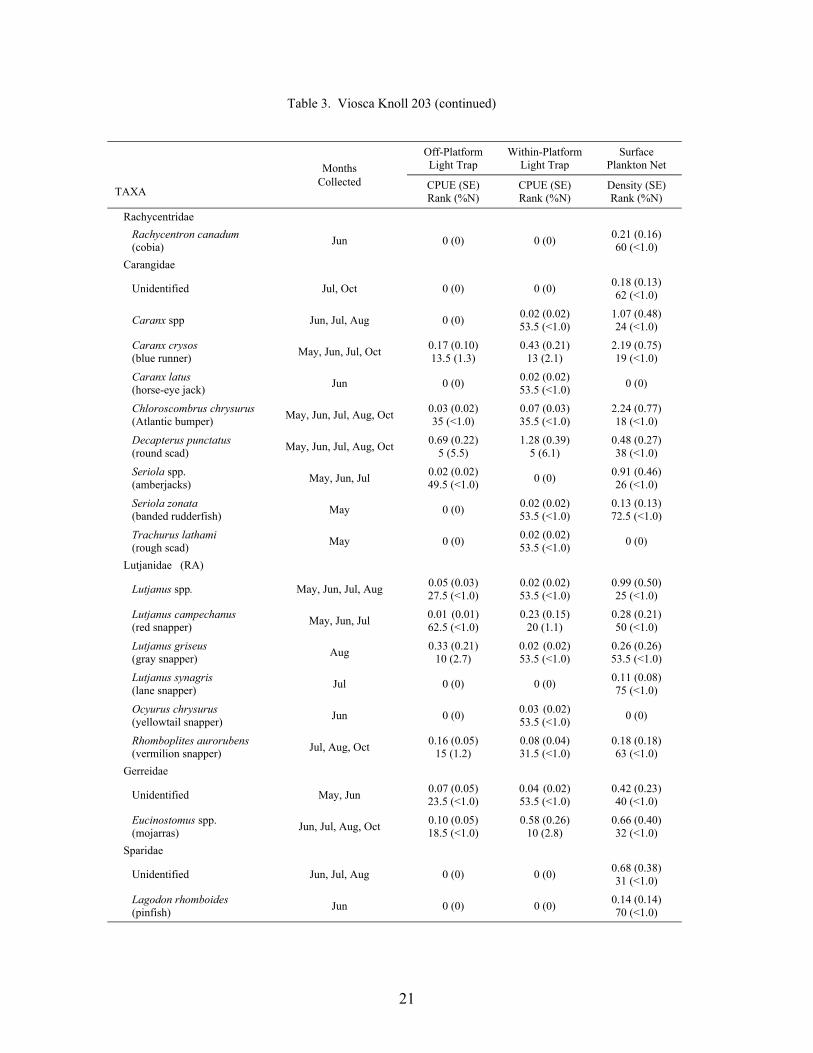
21
Table 3. Viosca Knoll 203 (continued)
MonthsOff-PlatformLight Trap
Within-PlatformLight Trap
SurfacePlankton Net
TAXACollected CPUE (SE)
Rank (%N)CPUE (SE)Rank (%N)
Density (SE)Rank (%N)
Rachycentridae Rachycentron canadum (cobia) Jun 0 (0) 0 (0) 0.21 (0.16)
60 (<1.0) Carangidae
Unidentified Jul, Oct 0 (0) 0 (0) 0.18 (0.13)62 (<1.0)
Caranx spp Jun, Jul, Aug 0 (0) 0.02 (0.02)53.5 (<1.0)
1.07 (0.48)24 (<1.0)
Caranx crysos (blue runner) May, Jun, Jul, Oct 0.17 (0.10)
13.5 (1.3)0.43 (0.21)
13 (2.1)2.19 (0.75)19 (<1.0)
Caranx latus (horse-eye jack) Jun 0 (0) 0.02 (0.02)
53.5 (<1.0) 0 (0)
Chloroscombrus chrysurus (Atlantic bumper) May, Jun, Jul, Aug, Oct 0.03 (0.02)
35 (<1.0)0.07 (0.03)35.5 (<1.0)
2.24 (0.77)18 (<1.0)
Decapterus punctatus (round scad) May, Jun, Jul, Aug, Oct 0.69 (0.22)
5 (5.5)1.28 (0.39)
5 (6.1)0.48 (0.27)38 (<1.0)
Seriola spp. (amberjacks) May, Jun, Jul 0.02 (0.02)
49.5 (<1.0) 0 (0) 0.91 (0.46)26 (<1.0)
Seriola zonata (banded rudderfish) May 0 (0) 0.02 (0.02)
53.5 (<1.0)0.13 (0.13)72.5 (<1.0)
Trachurus lathami (rough scad) May 0 (0) 0.02 (0.02)
53.5 (<1.0) 0 (0)
Lutjanidae (RA)
Lutjanus spp. May, Jun, Jul, Aug 0.05 (0.03)27.5 (<1.0)
0.02 (0.02)53.5 (<1.0)
0.99 (0.50)25 (<1.0)
Lutjanus campechanus (red snapper) May, Jun, Jul 0.01 (0.01)
62.5 (<1.0)0.23 (0.15)
20 (1.1)0.28 (0.21)50 (<1.0)
Lutjanus griseus (gray snapper) Aug 0.33 (0.21)
10 (2.7)0.02 (0.02)53.5 (<1.0)
0.26 (0.26)53.5 (<1.0)
Lutjanus synagris (lane snapper) Jul 0 (0) 0 (0) 0.11 (0.08)
75 (<1.0)
Ocyurus chrysurus (yellowtail snapper) Jun 0 (0) 0.03 (0.02)
53.5 (<1.0) 0 (0)
Rhomboplites aurorubens (vermilion snapper) Jul, Aug, Oct 0.16 (0.05)
15 (1.2)0.08 (0.04)31.5 (<1.0)
0.18 (0.18)63 (<1.0)
Gerreidae
Unidentified May, Jun 0.07 (0.05)23.5 (<1.0)
0.04 (0.02)53.5 (<1.0)
0.42 (0.23)40 (<1.0)
Eucinostomus spp. (mojarras) Jun, Jul, Aug, Oct 0.10 (0.05)
18.5 (<1.0)0.58 (0.26)
10 (2.8)0.66 (0.40)32 (<1.0)
Sparidae
Unidentified Jun, Jul, Aug 0 (0) 0 (0) 0.68 (0.38)31 (<1.0)
Lagodon rhomboides (pinfish) Jun 0 (0) 0 (0) 0.14 (0.14)
70 (<1.0)
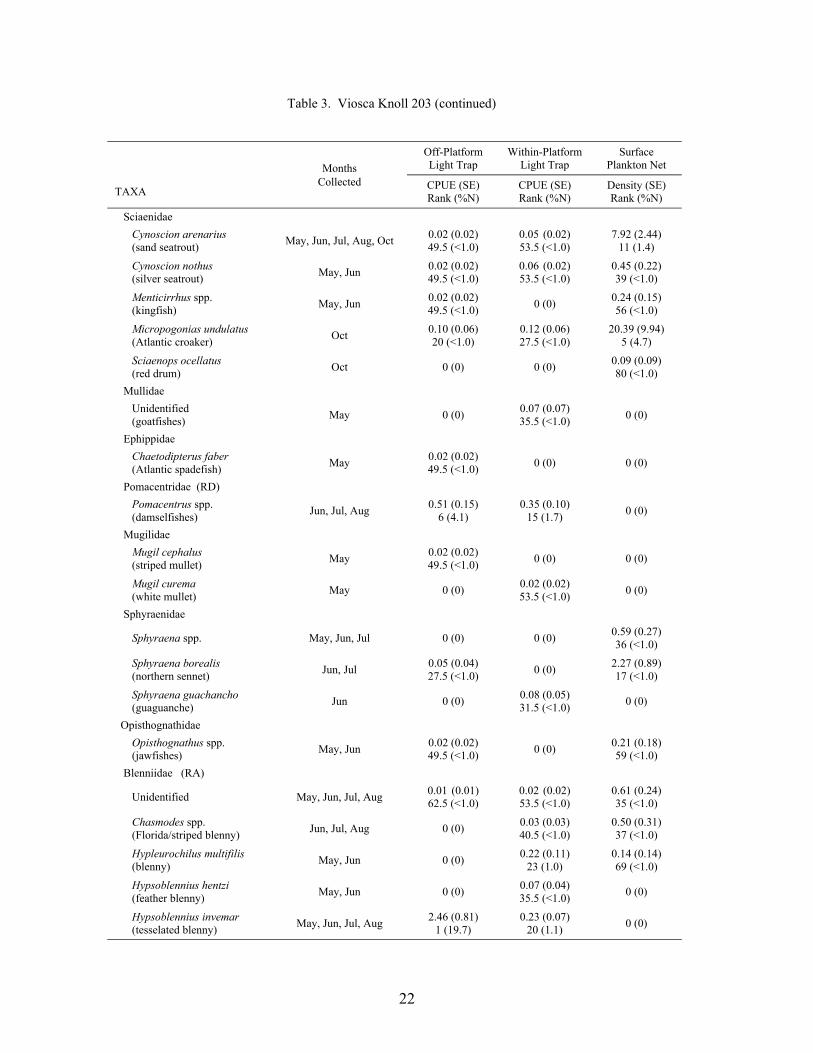
22
Table 3. Viosca Knoll 203 (continued)
MonthsOff-PlatformLight Trap
Within-PlatformLight Trap
SurfacePlankton Net
TAXACollected CPUE (SE)
Rank (%N)CPUE (SE)Rank (%N)
Density (SE)Rank (%N)
Sciaenidae Cynoscion arenarius (sand seatrout) May, Jun, Jul, Aug, Oct 0.02 (0.02)
49.5 (<1.0)0.05 (0.02)53.5 (<1.0)
7.92 (2.44)11 (1.4)
Cynoscion nothus (silver seatrout) May, Jun 0.02 (0.02)
49.5 (<1.0)0.06 (0.02)53.5 (<1.0)
0.45 (0.22)39 (<1.0)
Menticirrhus spp. (kingfish) May, Jun 0.02 (0.02)
49.5 (<1.0) 0 (0) 0.24 (0.15)56 (<1.0)
Micropogonias undulatus (Atlantic croaker) Oct 0.10 (0.06)
20 (<1.0)0.12 (0.06)27.5 (<1.0)
20.39 (9.94)5 (4.7)
Sciaenops ocellatus (red drum) Oct 0 (0) 0 (0) 0.09 (0.09)
80 (<1.0) Mullidae Unidentified (goatfishes) May 0 (0) 0.07 (0.07)
35.5 (<1.0) 0 (0)
Ephippidae Chaetodipterus faber (Atlantic spadefish) May 0.02 (0.02)
49.5 (<1.0) 0 (0) 0 (0)
Pomacentridae (RD) Pomacentrus spp. (damselfishes) Jun, Jul, Aug 0.51 (0.15)
6 (4.1)0.35 (0.10)
15 (1.7) 0 (0)
Mugilidae Mugil cephalus (striped mullet) May 0.02 (0.02)
49.5 (<1.0) 0 (0) 0 (0)
Mugil curema (white mullet) May 0 (0) 0.02 (0.02)
53.5 (<1.0) 0 (0)
Sphyraenidae
Sphyraena spp. May, Jun, Jul 0 (0) 0 (0) 0.59 (0.27)36 (<1.0)
Sphyraena borealis (northern sennet) Jun, Jul 0.05 (0.04)
27.5 (<1.0) 0 (0) 2.27 (0.89)17 (<1.0)
Sphyraena guachancho (guaguanche) Jun 0 (0) 0.08 (0.05)
31.5 (<1.0) 0 (0)
Opisthognathidae Opisthognathus spp. (jawfishes) May, Jun 0.02 (0.02)
49.5 (<1.0) 0 (0) 0.21 (0.18)59 (<1.0)
Blenniidae (RA)
Unidentified May, Jun, Jul, Aug 0.01 (0.01)62.5 (<1.0)
0.02 (0.02)53.5 (<1.0)
0.61 (0.24)35 (<1.0)
Chasmodes spp. (Florida/striped blenny) Jun, Jul, Aug 0 (0) 0.03 (0.03)
40.5 (<1.0)0.50 (0.31)37 (<1.0)
Hypleurochilus multifilis (blenny) May, Jun 0 (0) 0.22 (0.11)
23 (1.0)0.14 (0.14)69 (<1.0)
Hypsoblennius hentzi (feather blenny) May, Jun 0 (0) 0.07 (0.04)
35.5 (<1.0) 0 (0)
Hypsoblennius invemar (tesselated blenny) May, Jun, Jul, Aug 2.46 (0.81)
1 (19.7)0.23 (0.07)
20 (1.1) 0 (0)
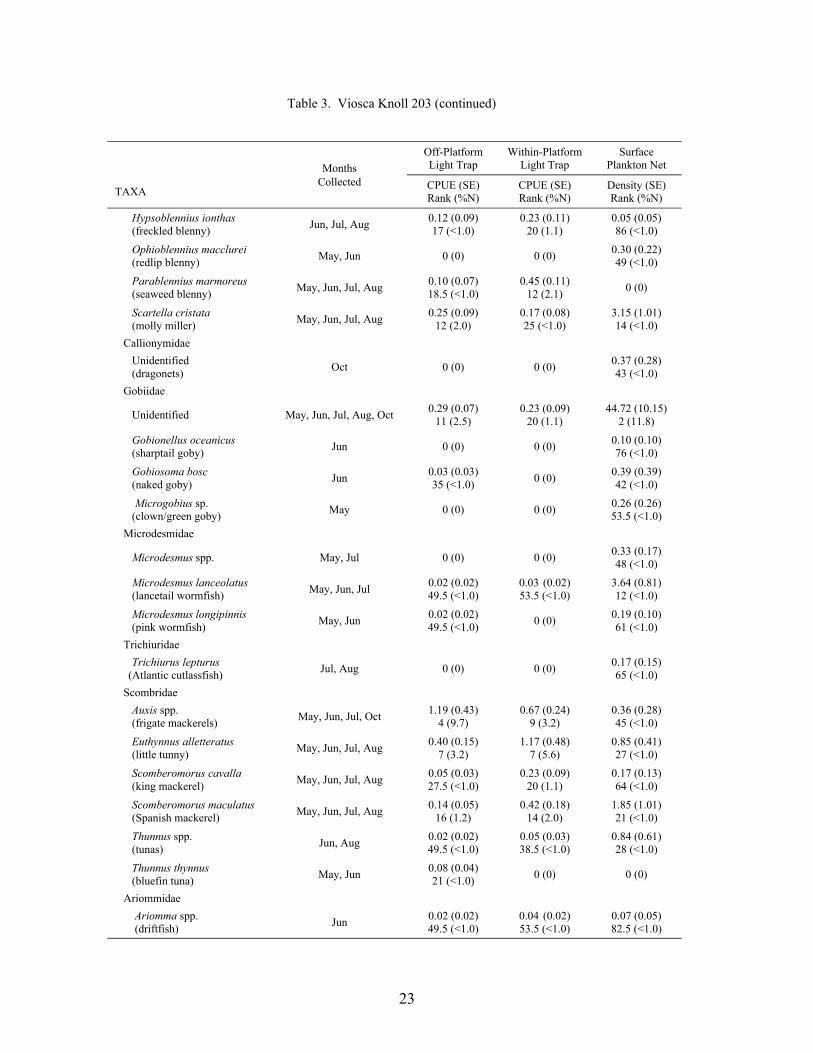
23
Table 3. Viosca Knoll 203 (continued)
MonthsOff-PlatformLight Trap
Within-PlatformLight Trap
SurfacePlankton Net
TAXACollected CPUE (SE)
Rank (%N)CPUE (SE)Rank (%N)
Density (SE)Rank (%N)
Hypsoblennius ionthas (freckled blenny) Jun, Jul, Aug 0.12 (0.09)
17 (<1.0)0.23 (0.11)
20 (1.1)0.05 (0.05)86 (<1.0)
Ophioblennius macclurei (redlip blenny) May, Jun 0 (0) 0 (0) 0.30 (0.22)
49 (<1.0)
Parablennius marmoreus (seaweed blenny) May, Jun, Jul, Aug 0.10 (0.07)
18.5 (<1.0)0.45 (0.11)
12 (2.1) 0 (0)
Scartella cristata (molly miller) May, Jun, Jul, Aug 0.25 (0.09)
12 (2.0)0.17 (0.08)25 (<1.0)
3.15 (1.01)14 (<1.0)
Callionymidae Unidentified (dragonets) Oct 0 (0) 0 (0) 0.37 (0.28)
43 (<1.0) Gobiidae
Unidentified May, Jun, Jul, Aug, Oct 0.29 (0.07)11 (2.5)
0.23 (0.09)20 (1.1)
44.72 (10.15)2 (11.8)
Gobionellus oceanicus (sharptail goby) Jun 0 (0) 0 (0) 0.10 (0.10)
76 (<1.0)
Gobiosoma bosc (naked goby) Jun 0.03 (0.03)
35 (<1.0) 0 (0) 0.39 (0.39)42 (<1.0)
Microgobius sp. (clown/green goby) May 0 (0) 0 (0) 0.26 (0.26)
53.5 (<1.0) Microdesmidae
Microdesmus spp. May, Jul 0 (0) 0 (0) 0.33 (0.17)48 (<1.0)
Microdesmus lanceolatus (lancetail wormfish) May, Jun, Jul 0.02 (0.02)
49.5 (<1.0)0.03 (0.02)53.5 (<1.0)
3.64 (0.81)12 (<1.0)
Microdesmus longipinnis (pink wormfish) May, Jun 0.02 (0.02)
49.5 (<1.0) 0 (0) 0.19 (0.10)61 (<1.0)
Trichiuridae Trichiurus lepturus (Atlantic cutlassfish) Jul, Aug 0 (0) 0 (0) 0.17 (0.15)
65 (<1.0) Scombridae Auxis spp. (frigate mackerels) May, Jun, Jul, Oct 1.19 (0.43)
4 (9.7)0.67 (0.24)
9 (3.2)0.36 (0.28)45 (<1.0)
Euthynnus alletteratus (little tunny) May, Jun, Jul, Aug 0.40 (0.15)
7 (3.2)1.17 (0.48)
7 (5.6)0.85 (0.41)27 (<1.0)
Scomberomorus cavalla (king mackerel) May, Jun, Jul, Aug 0.05 (0.03)
27.5 (<1.0)0.23 (0.09)
20 (1.1)0.17 (0.13)64 (<1.0)
Scomberomorus maculatus (Spanish mackerel) May, Jun, Jul, Aug 0.14 (0.05)
16 (1.2)0.42 (0.18)
14 (2.0)1.85 (1.01)21 (<1.0)
Thunnus spp. (tunas) Jun, Aug 0.02 (0.02)
49.5 (<1.0)0.05 (0.03)38.5 (<1.0)
0.84 (0.61)28 (<1.0)
Thunnus thynnus (bluefin tuna) May, Jun 0.08 (0.04)
21 (<1.0) 0 (0) 0 (0)
Ariommidae Ariomma spp. (driftfish) Jun 0.02 (0.02)
49.5 (<1.0)0.04 (0.02)53.5 (<1.0)
0.07 (0.05)82.5 (<1.0)
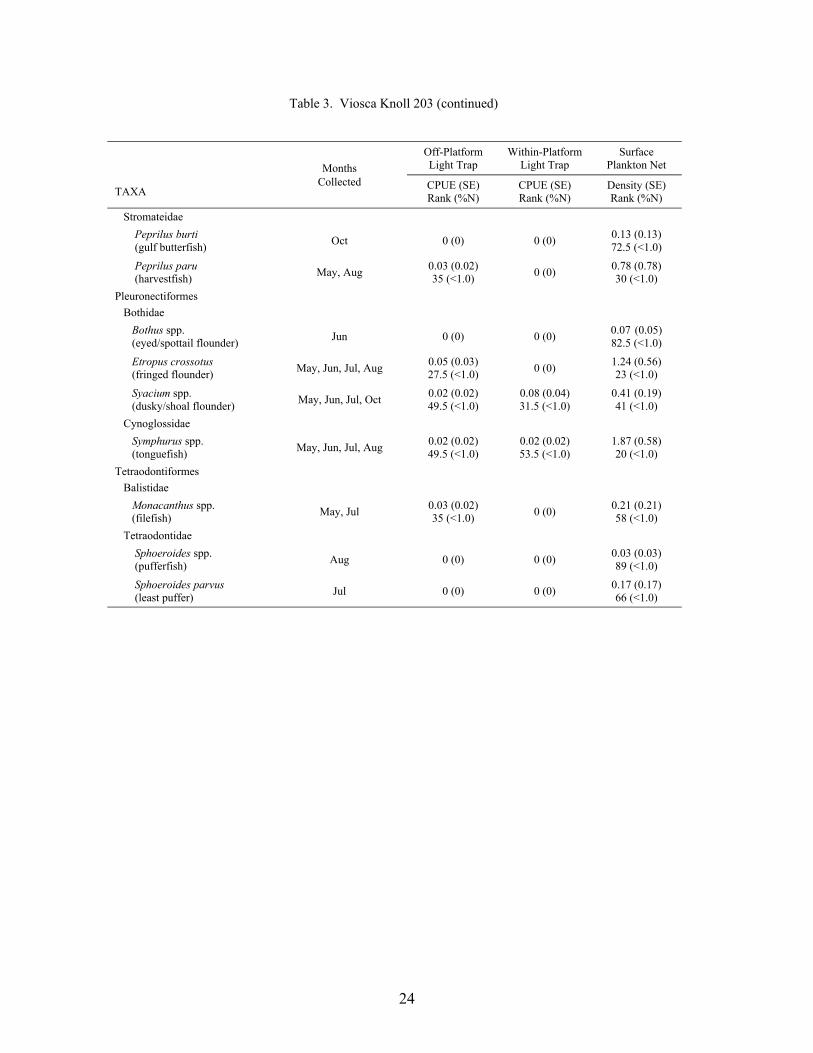
24
Table 3. Viosca Knoll 203 (continued)
MonthsOff-PlatformLight Trap
Within-PlatformLight Trap
SurfacePlankton Net
TAXACollected CPUE (SE)
Rank (%N)CPUE (SE)Rank (%N)
Density (SE)Rank (%N)
Stromateidae Peprilus burti (gulf butterfish) Oct 0 (0) 0 (0) 0.13 (0.13)
72.5 (<1.0)
Peprilus paru (harvestfish) May, Aug 0.03 (0.02)
35 (<1.0) 0 (0) 0.78 (0.78)30 (<1.0)
Pleuronectiformes Bothidae Bothus spp. (eyed/spottail flounder) Jun 0 (0) 0 (0) 0.07 (0.05)
82.5 (<1.0)
Etropus crossotus (fringed flounder) May, Jun, Jul, Aug 0.05 (0.03)
27.5 (<1.0) 0 (0) 1.24 (0.56)23 (<1.0)
Syacium spp. (dusky/shoal flounder) May, Jun, Jul, Oct 0.02 (0.02)
49.5 (<1.0)0.08 (0.04)31.5 (<1.0)
0.41 (0.19)41 (<1.0)
Cynoglossidae Symphurus spp. (tonguefish) May, Jun, Jul, Aug 0.02 (0.02)
49.5 (<1.0)0.02 (0.02)53.5 (<1.0)
1.87 (0.58)20 (<1.0)
Tetraodontiformes Balistidae Monacanthus spp. (filefish) May, Jul 0.03 (0.02)
35 (<1.0) 0 (0) 0.21 (0.21)58 (<1.0)
Tetraodontidae Sphoeroides spp. (pufferfish) Aug 0 (0) 0 (0) 0.03 (0.03)
89 (<1.0)
Sphoeroides parvus (least puffer) Jul 0 (0) 0 (0) 0.17 (0.17)
66 (<1.0)
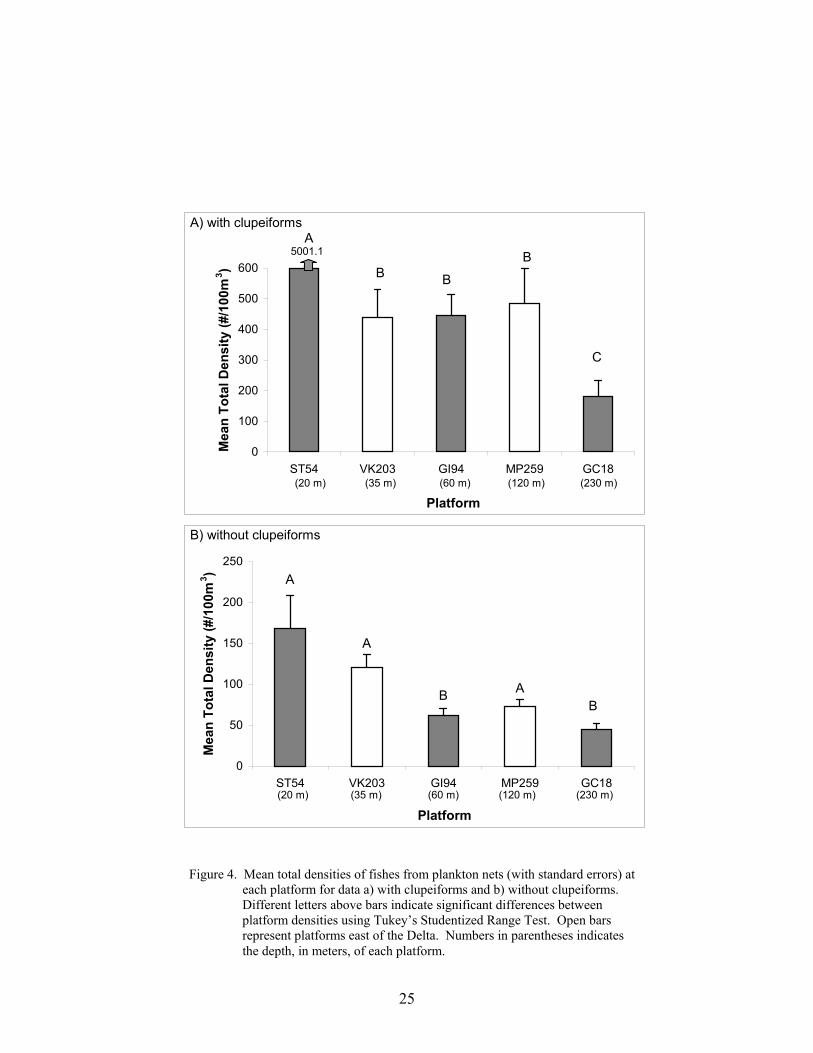
25
Figure 4. Mean total densities of fishes from plankton nets (with standard errors) at each platform for data a) with clupeiforms and b) without clupeiforms. Different letters above bars indicate significant differences between platform densities using Tukey’s Studentized Range Test. Open bars represent platforms east of the Delta. Numbers in parentheses indicates the depth, in meters, of each platform.
0
100
200
300
400
500
600
ST54 VK203 GI94 MP259 GC18
Platform
Mea
n T
ota
l Den
sity
(#/
100m
3)
5001.1 B
B
0
50
100
150
200
250
ST54 VK203 GI94 MP259 GC18
Platform
Mea
n T
ota
l Den
sity
(#/
100m
3)
A
A
B
(20 m) (120 m)(60 m)(35 m) (230 m)
A) with clupeiforms
B) without clupeiforms
A
B
C
A
B
(20 m) (230 m)(120 m)(60 m)(35 m)
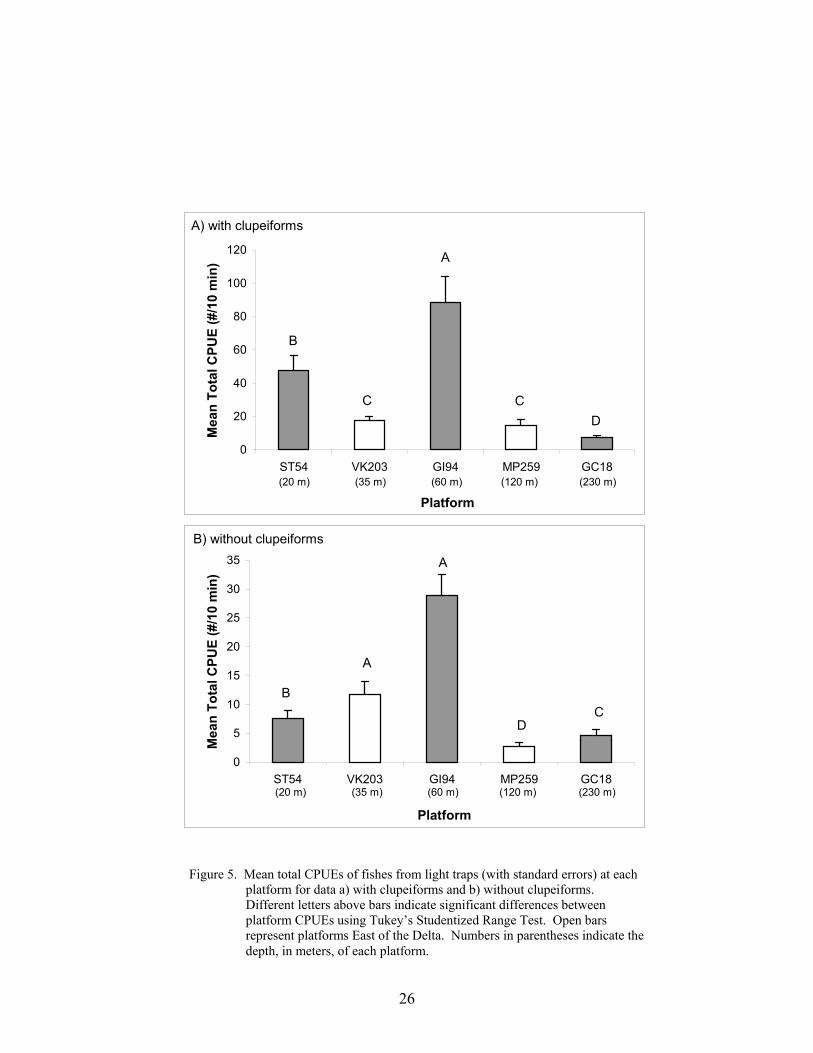
26
Figure 5. Mean total CPUEs of fishes from light traps (with standard errors) at each platform for data a) with clupeiforms and b) without clupeiforms. Different letters above bars indicate significant differences between platform CPUEs using Tukey’s Studentized Range Test. Open bars represent platforms East of the Delta. Numbers in parentheses indicate the depth, in meters, of each platform.
0
20
40
60
80
100
120
ST54 VK203 GI94 MP259 GC18
Platform
Mea
n T
ota
l CP
UE
(#/
10 m
in)
C
(20 m) (230 m)(120 m)(60 m)(35 m)
0
5
10
15
20
25
30
35
ST54 VK203 GI94 MP259 GC18
Platform
Mea
n T
ota
l CP
UE
(#/
10 m
in)
A
A
BC
D
(20 m) (230 m)(120 m)(60 m)(35 m)
A) with clupeiforms
B) without clupeiforms
A
B
CD
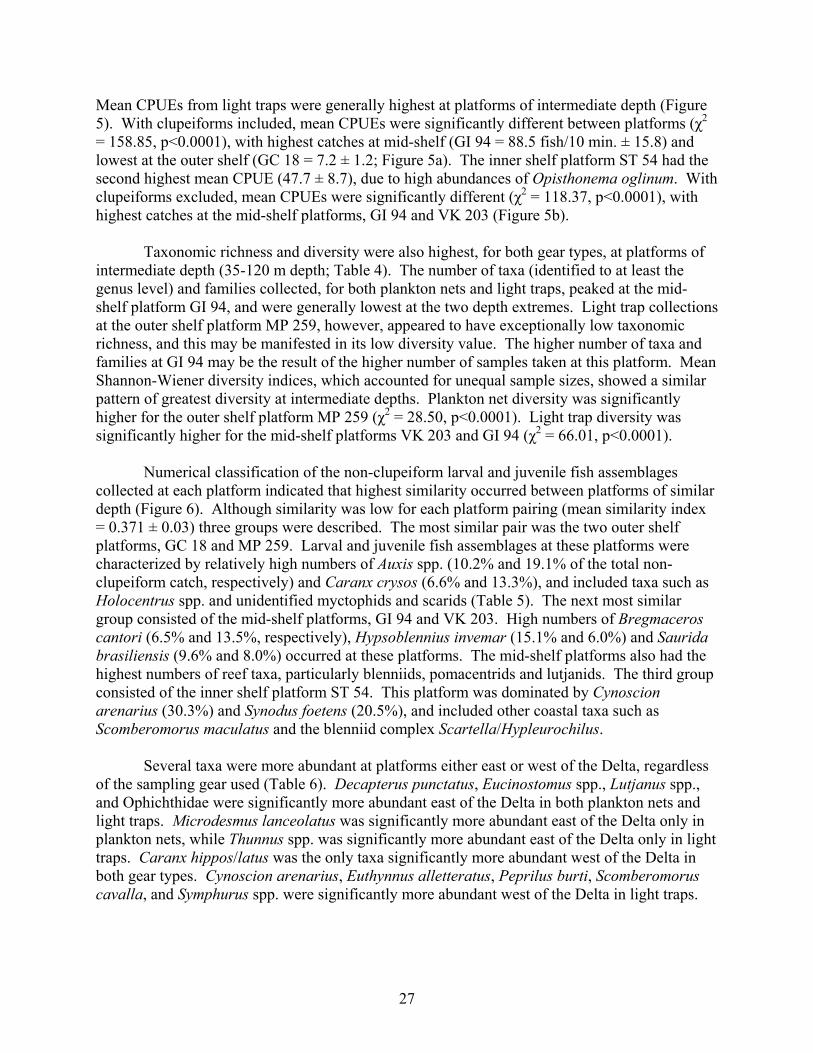
27
Mean CPUEs from light traps were generally highest at platforms of intermediate depth (Figure5). With clupeiforms included, mean CPUEs were significantly different between platforms (χ2
= 158.85, p<0.0001), with highest catches at mid-shelf (GI 94 = 88.5 fish/10 min. ± 15.8) andlowest at the outer shelf (GC 18 = 7.2 ± 1.2; Figure 5a). The inner shelf platform ST 54 had thesecond highest mean CPUE (47.7 ± 8.7), due to high abundances of Opisthonema oglinum. Withclupeiforms excluded, mean CPUEs were significantly different (χ2 = 118.37, p<0.0001), withhighest catches at the mid-shelf platforms, GI 94 and VK 203 (Figure 5b).
Taxonomic richness and diversity were also highest, for both gear types, at platforms ofintermediate depth (35-120 m depth; Table 4). The number of taxa (identified to at least thegenus level) and families collected, for both plankton nets and light traps, peaked at the mid-shelf platform GI 94, and were generally lowest at the two depth extremes. Light trap collectionsat the outer shelf platform MP 259, however, appeared to have exceptionally low taxonomicrichness, and this may be manifested in its low diversity value. The higher number of taxa andfamilies at GI 94 may be the result of the higher number of samples taken at this platform. MeanShannon-Wiener diversity indices, which accounted for unequal sample sizes, showed a similarpattern of greatest diversity at intermediate depths. Plankton net diversity was significantlyhigher for the outer shelf platform MP 259 (χ2 = 28.50, p<0.0001). Light trap diversity wassignificantly higher for the mid-shelf platforms VK 203 and GI 94 (χ2 = 66.01, p<0.0001).
Numerical classification of the non-clupeiform larval and juvenile fish assemblagescollected at each platform indicated that highest similarity occurred between platforms of similardepth (Figure 6). Although similarity was low for each platform pairing (mean similarity index= 0.371 ± 0.03) three groups were described. The most similar pair was the two outer shelfplatforms, GC 18 and MP 259. Larval and juvenile fish assemblages at these platforms werecharacterized by relatively high numbers of Auxis spp. (10.2% and 19.1% of the total non-clupeiform catch, respectively) and Caranx crysos (6.6% and 13.3%), and included taxa such asHolocentrus spp. and unidentified myctophids and scarids (Table 5). The next most similargroup consisted of the mid-shelf platforms, GI 94 and VK 203. High numbers of Bregmaceroscantori (6.5% and 13.5%, respectively), Hypsoblennius invemar (15.1% and 6.0%) and Sauridabrasiliensis (9.6% and 8.0%) occurred at these platforms. The mid-shelf platforms also had thehighest numbers of reef taxa, particularly blenniids, pomacentrids and lutjanids. The third groupconsisted of the inner shelf platform ST 54. This platform was dominated by Cynoscionarenarius (30.3%) and Synodus foetens (20.5%), and included other coastal taxa such asScomberomorus maculatus and the blenniid complex Scartella/Hypleurochilus.
Several taxa were more abundant at platforms either east or west of the Delta, regardlessof the sampling gear used (Table 6). Decapterus punctatus, Eucinostomus spp., Lutjanus spp.,and Ophichthidae were significantly more abundant east of the Delta in both plankton nets andlight traps. Microdesmus lanceolatus was significantly more abundant east of the Delta only inplankton nets, while Thunnus spp. was significantly more abundant east of the Delta only in lighttraps. Caranx hippos/latus was the only taxa significantly more abundant west of the Delta inboth gear types. Cynoscion arenarius, Euthynnus alletteratus, Peprilus burti, Scomberomoruscavalla, and Symphurus spp. were significantly more abundant west of the Delta in light traps.
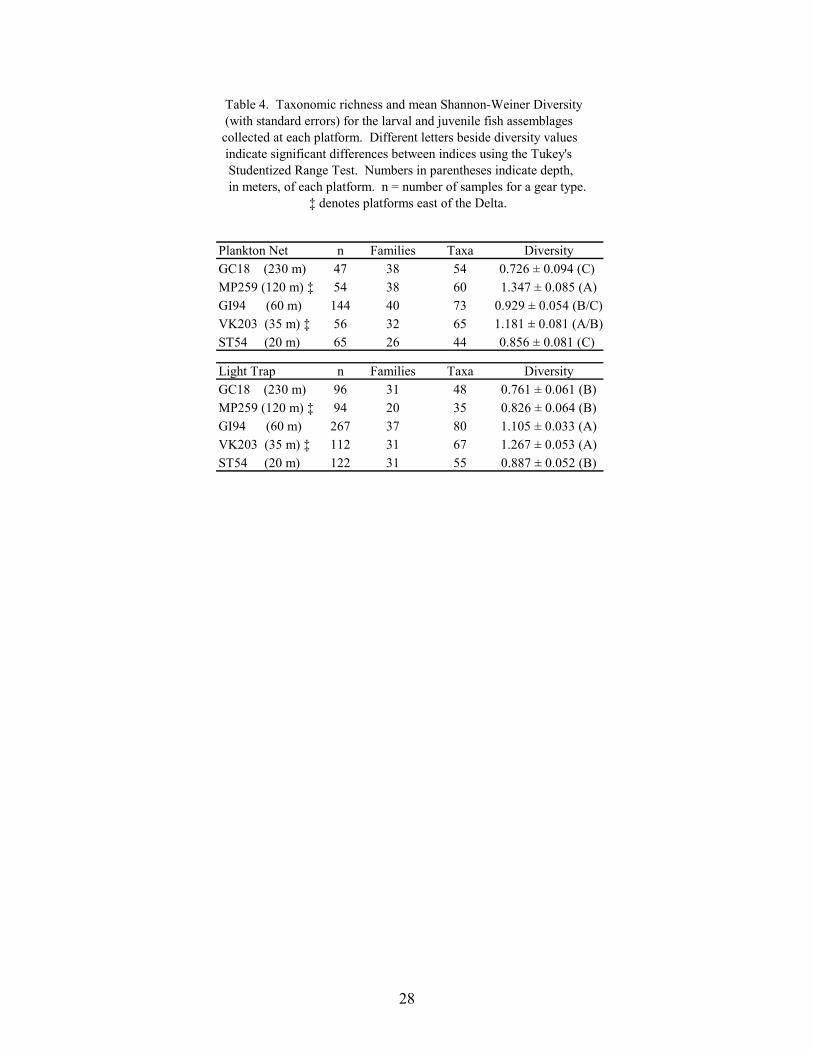
28
Table 4. Taxonomic richness and mean Shannon-Weiner Diversity (with standard errors) for the larval and juvenile fish assemblages collected at each platform. Different letters beside diversity values indicate significant differences between indices using the Tukey's Studentized Range Test. Numbers in parentheses indicate depth, in meters, of each platform. n = number of samples for a gear type. ‡ denotes platforms east of the Delta.
Plankton Net n Families Taxa DiversityGC18 (230 m) 47 38 54 0.726 ± 0.094 (C) MP259 (120 m) ‡ 54 38 60 1.347 ± 0.085 (A)GI94 (60 m) 144 40 73 0.929 ± 0.054 (B/C)VK203 (35 m) ‡ 56 32 65 1.181 ± 0.081 (A/B)ST54 (20 m) 65 26 44 0.856 ± 0.081 (C)
Light Trap n Families Taxa DiversityGC18 (230 m) 96 31 48 0.761 ± 0.061 (B)MP259 (120 m) ‡ 94 20 35 0.826 ± 0.064 (B)GI94 (60 m) 267 37 80 1.105 ± 0.033 (A)VK203 (35 m) ‡ 112 31 67 1.267 ± 0.053 (A)ST54 (20 m) 122 31 55 0.887 ± 0.052 (B)
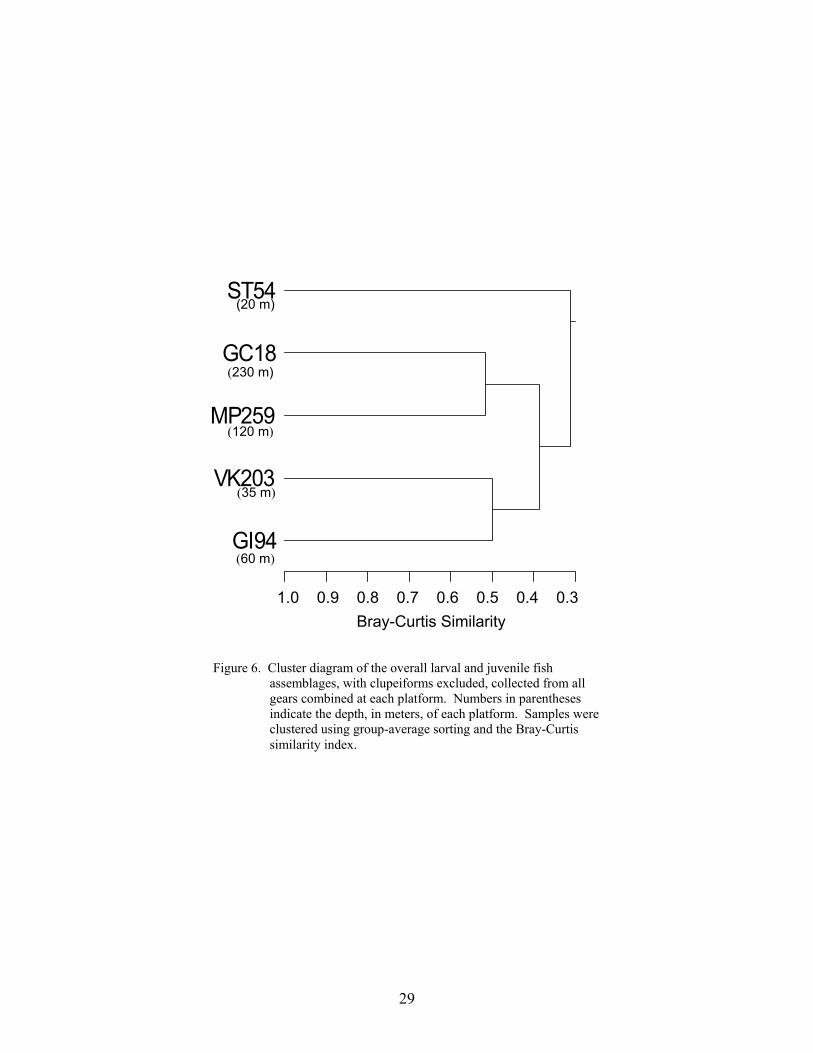
29
(20 m)
(230 m)
(120 m)
(35 m)
(60 m)
Figure 6. Cluster diagram of the overall larval and juvenile fish assemblages, with clupeiforms excluded, collected from all gears combined at each platform. Numbers in parentheses indicate the depth, in meters, of each platform. Samples were clustered using group-average sorting and the Bray-Curtis similarity index.
Bray-Curtis Similarity
MP259
ST54
GI94
GC18
VK203
1.0 0.80.9 0.30.40.50.60.7
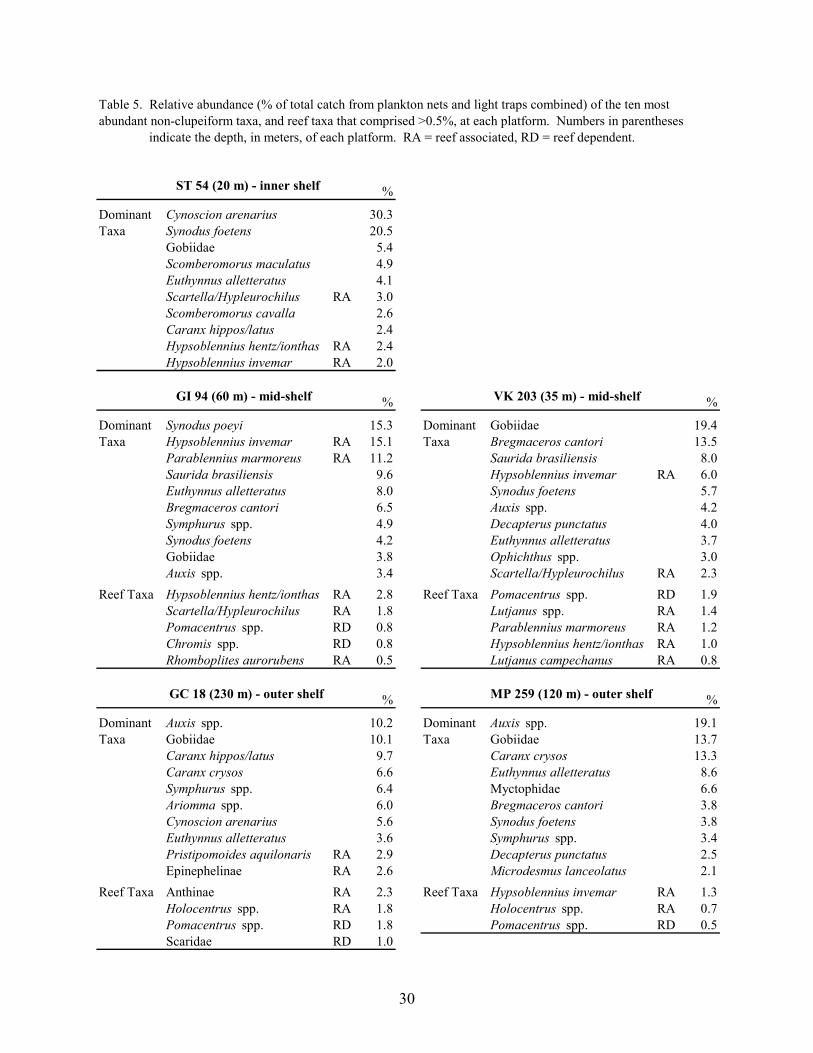
30
Table 5. Relative abundance (% of total catch from plankton nets and light traps combined) of the ten most abundant non-clupeiform taxa, and reef taxa that comprised >0.5%, at each platform. Numbers in parentheses indicate the depth, in meters, of each platform. RA = reef associated, RD = reef dependent.
ST 54 (20 m) - inner shelf %
Dominant Cynoscion arenarius 30.3Taxa Synodus foetens 20.5
Gobiidae 5.4Scomberomorus maculatus 4.9Euthynnus alletteratus 4.1Scartella/Hypleurochilus RA 3.0Scomberomorus cavalla 2.6Caranx hippos/latus 2.4Hypsoblennius hentz/ionthas RA 2.4Hypsoblennius invemar RA 2.0
GI 94 (60 m) - mid-shelf % VK 203 (35 m) - mid-shelf %
Dominant Synodus poeyi 15.3 Dominant Gobiidae 19.4Taxa Hypsoblennius invemar RA 15.1 Taxa Bregmaceros cantori 13.5
Parablennius marmoreus RA 11.2 Saurida brasiliensis 8.0Saurida brasiliensis 9.6 Hypsoblennius invemar RA 6.0Euthynnus alletteratus 8.0 Synodus foetens 5.7Bregmaceros cantori 6.5 Auxis spp. 4.2Symphurus spp. 4.9 Decapterus punctatus 4.0Synodus foetens 4.2 Euthynnus alletteratus 3.7Gobiidae 3.8 Ophichthus spp. 3.0Auxis spp. 3.4 Scartella/Hypleurochilus RA 2.3
Reef Taxa Hypsoblennius hentz/ionthas RA 2.8 Reef Taxa Pomacentrus spp. RD 1.9Scartella/Hypleurochilus RA 1.8 Lutjanus spp. RA 1.4Pomacentrus spp. RD 0.8 Parablennius marmoreus RA 1.2Chromis spp. RD 0.8 Hypsoblennius hentz/ionthas RA 1.0Rhomboplites aurorubens RA 0.5 Lutjanus campechanus RA 0.8
GC 18 (230 m) - outer shelf % MP 259 (120 m) - outer shelf %
Dominant Auxis spp. 10.2 Dominant Auxis spp. 19.1Taxa Gobiidae 10.1 Taxa Gobiidae 13.7
Caranx hippos/latus 9.7 Caranx crysos 13.3Caranx crysos 6.6 Euthynnus alletteratus 8.6Symphurus spp. 6.4 Myctophidae 6.6Ariomma spp. 6.0 Bregmaceros cantori 3.8Cynoscion arenarius 5.6 Synodus foetens 3.8Euthynnus alletteratus 3.6 Symphurus spp. 3.4Pristipomoides aquilonaris RA 2.9 Decapterus punctatus 2.5Epinephelinae RA 2.6 Microdesmus lanceolatus 2.1
Reef Taxa Anthinae RA 2.3 Reef Taxa Hypsoblennius invemar RA 1.3Holocentrus spp. RA 1.8 Holocentrus spp. RA 0.7Pomacentrus spp. RD 1.8 Pomacentrus spp. RD 0.5Scaridae RD 1.0
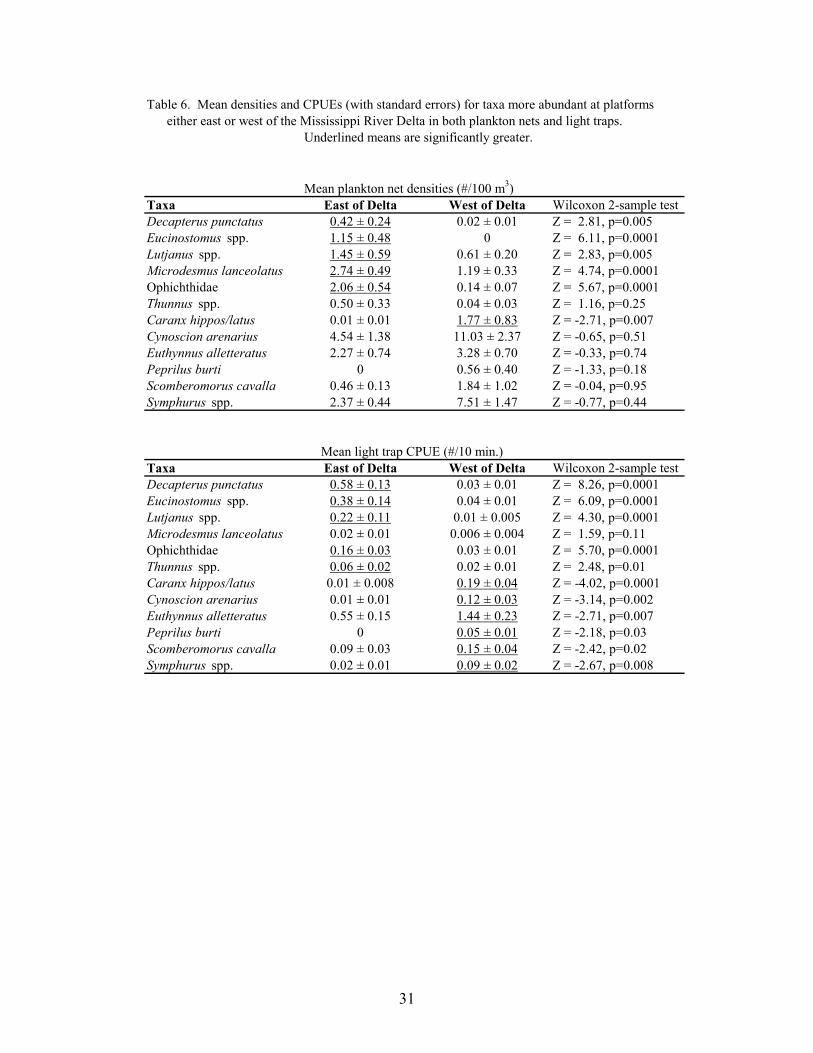
31
Table 6. Mean densities and CPUEs (with standard errors) for taxa more abundant at platforms either east or west of the Mississippi River Delta in both plankton nets and light traps. Underlined means are significantly greater.
Mean plankton net densities (#/100 m3)Taxa East of Delta West of Delta Wilcoxon 2-sample testDecapterus punctatus 0.42 ± 0.24 0.02 ± 0.01 Z = 2.81, p=0.005Eucinostomus spp. 1.15 ± 0.48 0 Z = 6.11, p=0.0001Lutjanus spp. 1.45 ± 0.59 0.61 ± 0.20 Z = 2.83, p=0.005Microdesmus lanceolatus 2.74 ± 0.49 1.19 ± 0.33 Z = 4.74, p=0.0001Ophichthidae 2.06 ± 0.54 0.14 ± 0.07 Z = 5.67, p=0.0001Thunnus spp. 0.50 ± 0.33 0.04 ± 0.03 Z = 1.16, p=0.25Caranx hippos/latus 0.01 ± 0.01 1.77 ± 0.83 Z = -2.71, p=0.007Cynoscion arenarius 4.54 ± 1.38 11.03 ± 2.37 Z = -0.65, p=0.51Euthynnus alletteratus 2.27 ± 0.74 3.28 ± 0.70 Z = -0.33, p=0.74Peprilus burti 0 0.56 ± 0.40 Z = -1.33, p=0.18Scomberomorus cavalla 0.46 ± 0.13 1.84 ± 1.02 Z = -0.04, p=0.95Symphurus spp. 2.37 ± 0.44 7.51 ± 1.47 Z = -0.77, p=0.44
Mean light trap CPUE (#/10 min.)Taxa East of Delta West of Delta Wilcoxon 2-sample testDecapterus punctatus 0.58 ± 0.13 0.03 ± 0.01 Z = 8.26, p=0.0001Eucinostomus spp. 0.38 ± 0.14 0.04 ± 0.01 Z = 6.09, p=0.0001Lutjanus spp. 0.22 ± 0.11 0.01 ± 0.005 Z = 4.30, p=0.0001Microdesmus lanceolatus 0.02 ± 0.01 0.006 ± 0.004 Z = 1.59, p=0.11Ophichthidae 0.16 ± 0.03 0.03 ± 0.01 Z = 5.70, p=0.0001Thunnus spp. 0.06 ± 0.02 0.02 ± 0.01 Z = 2.48, p=0.01Caranx hippos/latus 0.01 ± 0.008 0.19 ± 0.04 Z = -4.02, p=0.0001Cynoscion arenarius 0.01 ± 0.01 0.12 ± 0.03 Z = -3.14, p=0.002Euthynnus alletteratus 0.55 ± 0.15 1.44 ± 0.23 Z = -2.71, p=0.007Peprilus burti 0 0.05 ± 0.01 Z = -2.18, p=0.03Scomberomorus cavalla 0.09 ± 0.03 0.15 ± 0.04 Z = -2.42, p=0.02Symphurus spp. 0.02 ± 0.01 0.09 ± 0.02 Z = -2.67, p=0.008
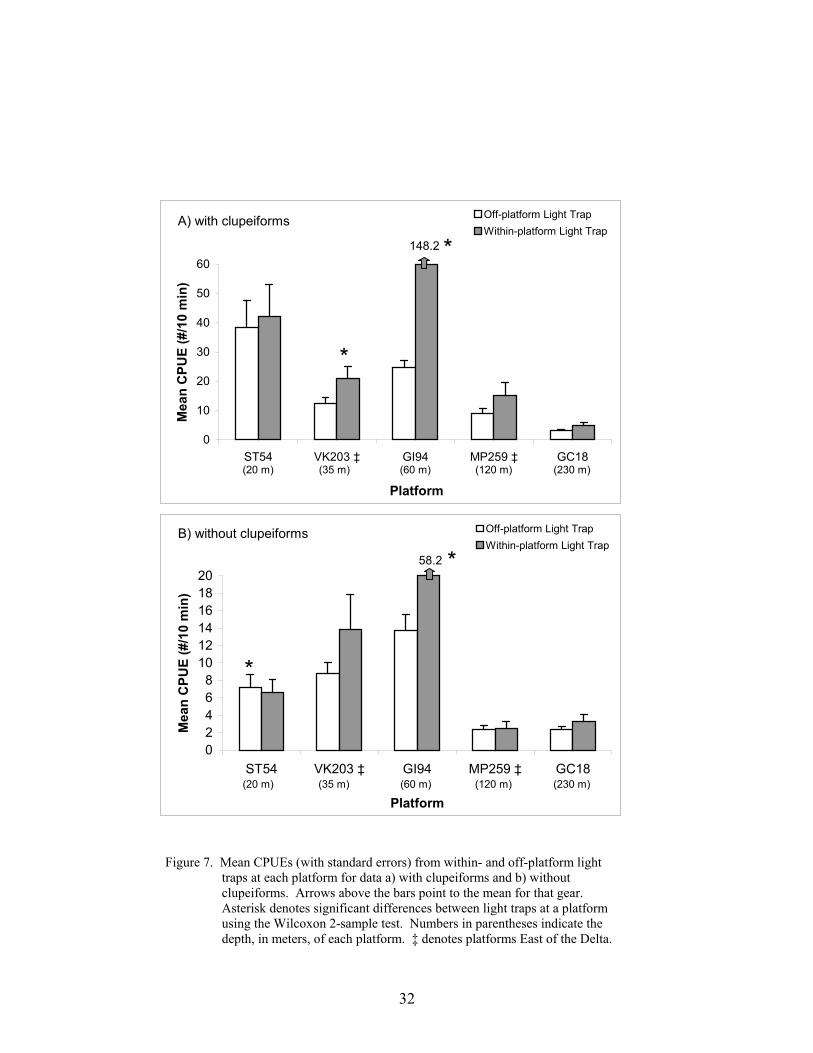
32
Figure 7. Mean CPUEs (with standard errors) from within- and off-platform light traps at each platform for data a) with clupeiforms and b) without clupeiforms. Arrows above the bars point to the mean for that gear. Asterisk denotes significant differences between light traps at a platform using the Wilcoxon 2-sample test. Numbers in parentheses indicate the depth, in meters, of each platform. ‡ denotes platforms East of the Delta.
0
10
20
30
40
50
60
ST54 VK203 ‡ GI94 MP259 ‡ GC18
Platform
Mea
n C
PU
E (
#/10
min
)
Off-platform Light TrapWithin-platform Light Trap
148.2
*
*A) with clupeiforms
(20 m) (230 m)(120 m)(60 m)(35 m)
02468
101214161820
ST54 VK203 ‡ GI94 MP259 ‡ GC18
Platform
Mea
n C
PU
E (
#/10
min
)
Off-platform Light TrapWithin-platform Light Trap
*
58.2
B) without clupeiforms
*
(20 m) (230 m)(120 m)(60 m)(35 m)
33
Within- vs. Off-Platform Patterns in Light Trap Catches
Light traps fished within the platform structure generally had higher mean CPUEs thanlight traps fished down-current from the platform (Figure 7). With clupeiforms included, VK203 (Z = -1.97, p<0.05) and GI 94 (Z = 8.58, p<0.0001) had significantly higher total catch rateswithin-platform. When clupeiforms were removed from these analyses, mean total CPUEsremained higher for within-platform light traps, with GI 94’s significantly higher (Z = 5.74,p<0.0001). The exception was ST 54, where off-platform catch rates were significantly higher(Z = 2.31, p<0.02).
Comparisons of taxonomic richness and diversity between within- and off-platform lighttrap collections showed no clear patterns among platforms (Table 7). Within-platform light trapscollected more families and taxa (identified to at least the genus level) than off-platform lighttraps at GC 18 and GI 94. However, slightly higher numbers of families and taxa were identifiedfrom off-platform collections at ST 54, VK 203 and MP 259 (number of taxa at MP 259 wereequal). Mean Shannon-Wiener diversity indices were greater for within-platform light trapcollections at GC 18 and GI 94, and significantly greater at VK 203 (Z = 4.05, p<0.0001). Off-platform light trap collections had greater diversity indices at ST 54 and MP 259.
Higher measures of similarity between the within- and off-platform fish assemblagescoincided with relatively greater abundances of clupeiforms off-platform at ST 54 and MP 259.The fish assemblages collected by within- and off-platform light traps were most similar at ST54 and MP 259 (Bray-Curtis similarity = 0.76 and 0.72, respectively) than at the other platforms(GC 18 = 0.49, GI 94 = 0.47, VK 203 = 0.47). Furthermore, only at ST 54 and MP 259 weremean off-platform CPUEs of clupeiforms not significantly lower than within-platform CPUEs(Table 8).
Fishes from the families Clupeidae (Harengula jaguana and Opisthonema oglinum),Engraulidae (Anchoa mitchilli, A. nasuta/hepsetus and Engraulis eurystole), Synodontidae(Saurida brasiliensis and Synodus foetens), and Blenniidae (Hypsoblennius hentz/ionthas andScartella/Hypleurochilus) were found, with a few exceptions, to have higher mean CPUEs inwithin-platform light trap samples at each platform (Table 9). Conversely, Scombridae(Euthynnus alletteratus, Scomberomorus cavalla and S. maculatus) were more abundant off-platform at each platform, except at VK 203 where CPUEs for these species were higher within-platform. Pomacentrus spp. and Hypsoblennius invemar also seemed to have higher meanCPUEs off-platform, with the exception of GC 18 and GI 94, respectively. Mean CPUEs forCaranx hippos/latus were significantly higher in off-platform light traps at ST 54 and GC 18. Ofthe most abundant reef fish families, only Lutjanidae and Serranidae at GI 94 showed significantdifferences between mean light trap CPUEs, with both taxa being more abundant within-platform. Otherwise, reef fish CPUEs were low (<0.13 fish/10 min.) at each platform, exceptVK 203 where lutjanid CPUEs for within- and off-platform light traps were 0.35 and 0.55fish/10 min., respectively.
Several species of engraulids showed significantly different size distributions betweenwithin- and off-platform light trap collections at platforms (Figure 8). Most Anchoa mitchillicollected within-platform at GI 94 were between 13 and 16 mm, while those collected off-platform were mainly 16 to 19 mm in length. Much larger Engraulis eurystole were collected in
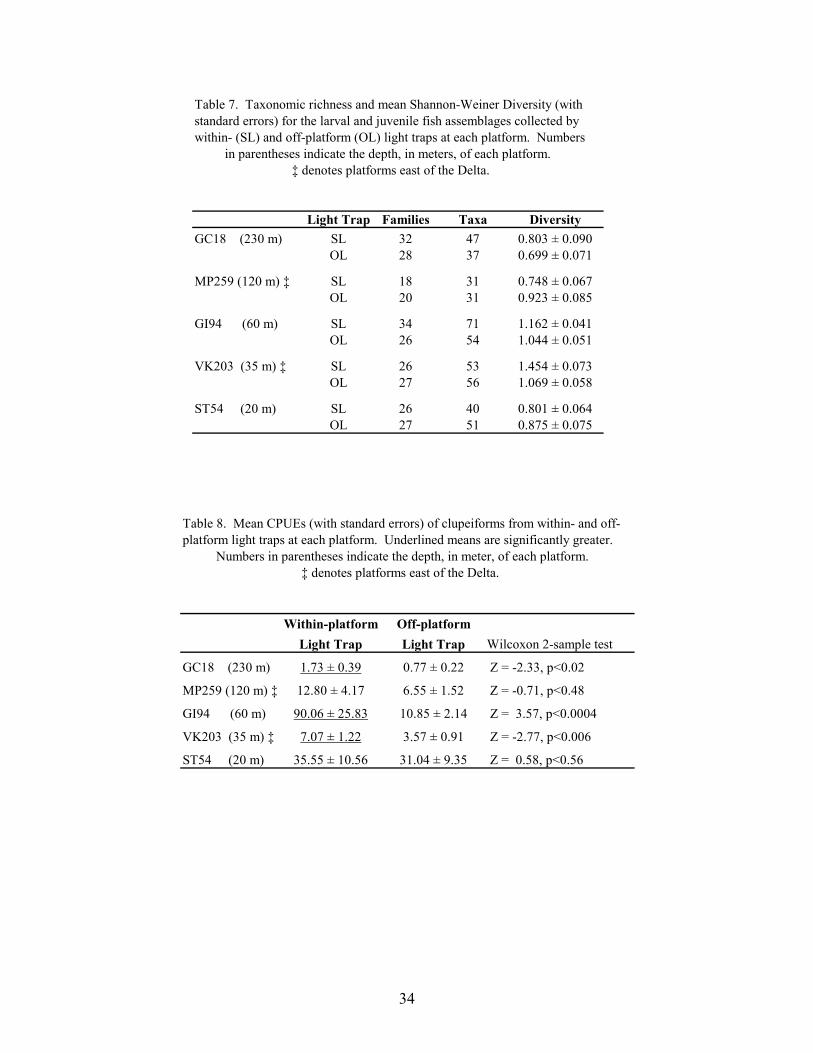
34
Table 8. Mean CPUEs (with standard errors) of clupeiforms from within- and off-platform light traps at each platform. Underlined means are significantly greater. Numbers in parentheses indicate the depth, in meter, of each platform.
‡ denotes platforms east of the Delta.
Within-platform Off-platformLight Trap Light Trap Wilcoxon 2-sample test
GC18 (230 m) 1.73 ± 0.39 0.77 ± 0.22 Z = -2.33, p<0.02
MP259 (120 m) ‡ 12.80 ± 4.17 6.55 ± 1.52 Z = -0.71, p<0.48
GI94 (60 m) 90.06 ± 25.83 10.85 ± 2.14 Z = 3.57, p<0.0004
VK203 (35 m) ‡ 7.07 ± 1.22 3.57 ± 0.91 Z = -2.77, p<0.006
ST54 (20 m) 35.55 ± 10.56 31.04 ± 9.35 Z = 0.58, p<0.56
Table 7. Taxonomic richness and mean Shannon-Weiner Diversity (withstandard errors) for the larval and juvenile fish assemblages collected by within- (SL) and off-platform (OL) light traps at each platform. Numbers in parentheses indicate the depth, in meters, of each platform. ‡ denotes platforms east of the Delta.
Light Trap Families Taxa DiversityGC18 (230 m) SL 32 47 0.803 ± 0.090
OL 28 37 0.699 ± 0.071
MP259 (120 m) ‡ SL 18 31 0.748 ± 0.067OL 20 31 0.923 ± 0.085
GI94 (60 m) SL 34 71 1.162 ± 0.041OL 26 54 1.044 ± 0.051
VK203 (35 m) ‡ SL 26 53 1.454 ± 0.073OL 27 56 1.069 ± 0.058
ST54 (20 m) SL 26 40 0.801 ± 0.064OL 27 51 0.875 ± 0.075
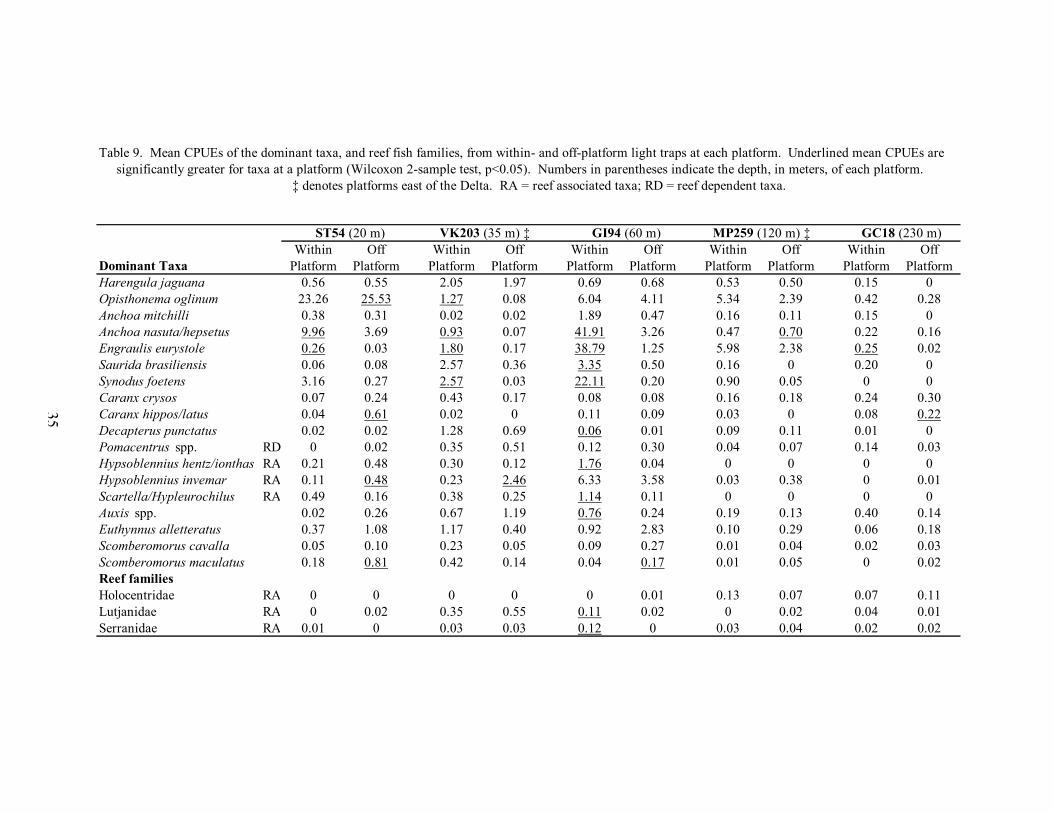
35
Table 9. Mean CPUEs of the dominant taxa, and reef fish families, from within- and off-platform light traps at each platform. Underlined mean CPUEs are significantly greater for taxa at a platform (Wilcoxon 2-sample test, p<0.05). Numbers in parentheses indicate the depth, in meters, of each platform. ‡ denotes platforms east of the Delta. RA = reef associated taxa; RD = reef dependent taxa.
ST54 (20 m) VK203 (35 m) ‡ GI94 (60 m) MP259 (120 m) ‡ GC18 (230 m)Within Off Within Off Within Off Within Off Within Off
Dominant Taxa Platform Platform Platform Platform Platform Platform Platform Platform Platform PlatformHarengula jaguana 0.56 0.55 2.05 1.97 0.69 0.68 0.53 0.50 0.15 0Opisthonema oglinum 23.26 25.53 1.27 0.08 6.04 4.11 5.34 2.39 0.42 0.28Anchoa mitchilli 0.38 0.31 0.02 0.02 1.89 0.47 0.16 0.11 0.15 0Anchoa nasuta/hepsetus 9.96 3.69 0.93 0.07 41.91 3.26 0.47 0.70 0.22 0.16Engraulis eurystole 0.26 0.03 1.80 0.17 38.79 1.25 5.98 2.38 0.25 0.02Saurida brasiliensis 0.06 0.08 2.57 0.36 3.35 0.50 0.16 0 0.20 0Synodus foetens 3.16 0.27 2.57 0.03 22.11 0.20 0.90 0.05 0 0Caranx crysos 0.07 0.24 0.43 0.17 0.08 0.08 0.16 0.18 0.24 0.30Caranx hippos/latus 0.04 0.61 0.02 0 0.11 0.09 0.03 0 0.08 0.22Decapterus punctatus 0.02 0.02 1.28 0.69 0.06 0.01 0.09 0.11 0.01 0Pomacentrus spp. RD 0 0.02 0.35 0.51 0.12 0.30 0.04 0.07 0.14 0.03Hypsoblennius hentz/ionthas RA 0.21 0.48 0.30 0.12 1.76 0.04 0 0 0 0Hypsoblennius invemar RA 0.11 0.48 0.23 2.46 6.33 3.58 0.03 0.38 0 0.01Scartella/Hypleurochilus RA 0.49 0.16 0.38 0.25 1.14 0.11 0 0 0 0Auxis spp. 0.02 0.26 0.67 1.19 0.76 0.24 0.19 0.13 0.40 0.14Euthynnus alletteratus 0.37 1.08 1.17 0.40 0.92 2.83 0.10 0.29 0.06 0.18Scomberomorus cavalla 0.05 0.10 0.23 0.05 0.09 0.27 0.01 0.04 0.02 0.03Scomberomorus maculatus 0.18 0.81 0.42 0.14 0.04 0.17 0.01 0.05 0 0.02Reef familiesHolocentridae RA 0 0 0 0 0 0.01 0.13 0.07 0.07 0.11Lutjanidae RA 0 0.02 0.35 0.55 0.11 0.02 0 0.02 0.04 0.01Serranidae RA 0.01 0 0.03 0.03 0.12 0 0.03 0.04 0.02 0.02
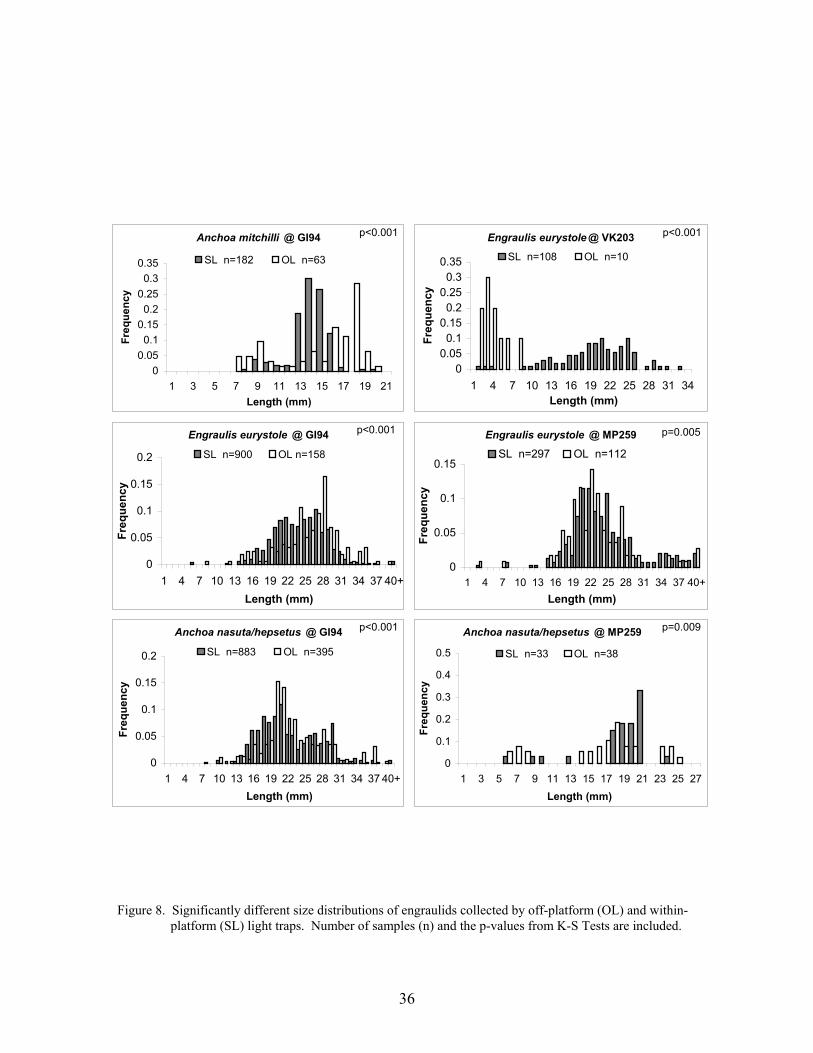
36
Figure 8. Significantly different size distributions of engraulids collected by off-platform (OL) and within- platform (SL) light traps. Number of samples (n) and the p-values from K-S Tests are included.
Engraulis eurystole @ VK203
00.050.1
0.150.2
0.250.3
0.35
1 4 7 10 13 16 19 22 25 28 31 34Length (mm)
Fre
qu
ency
SL n=108 OL n=10
p<0.001Anchoa mitchilli @ GI94
00.050.1
0.150.2
0.250.3
0.35
1 3 5 7 9 11 13 15 17 19 21Length (mm)
Fre
qu
ency
SL n=182 OL n=63
p<0.001
Anchoa nasuta/hepsetus @ GI94
0
0.05
0.1
0.15
0.2
1 4 7 10 13 16 19 22 25 28 31 34 37 40+Length (mm)
Fre
qu
ency
SL n=883 OL n=395
p<0.001
Engraulis eurystole @ GI94
0
0.05
0.1
0.15
0.2
1 4 7 10 13 16 19 22 25 28 31 34 37 40+Length (mm)
Fre
qu
ency
SL n=900 OL n=158
p<0.001
Anchoa nasuta/hepsetus @ MP259
0
0.1
0.2
0.3
0.4
0.5
1 3 5 7 9 11 13 15 17 19 21 23 25 27Length (mm)
Fre
qu
ency
SL n=33 OL n=38
p=0.009
Engraulis eurystole @ MP259
0
0.05
0.1
0.15
1 4 7 10 13 16 19 22 25 28 31 34 37 40+Length (mm)
Fre
qu
ency
SL n=297 OL n=112
p=0.005
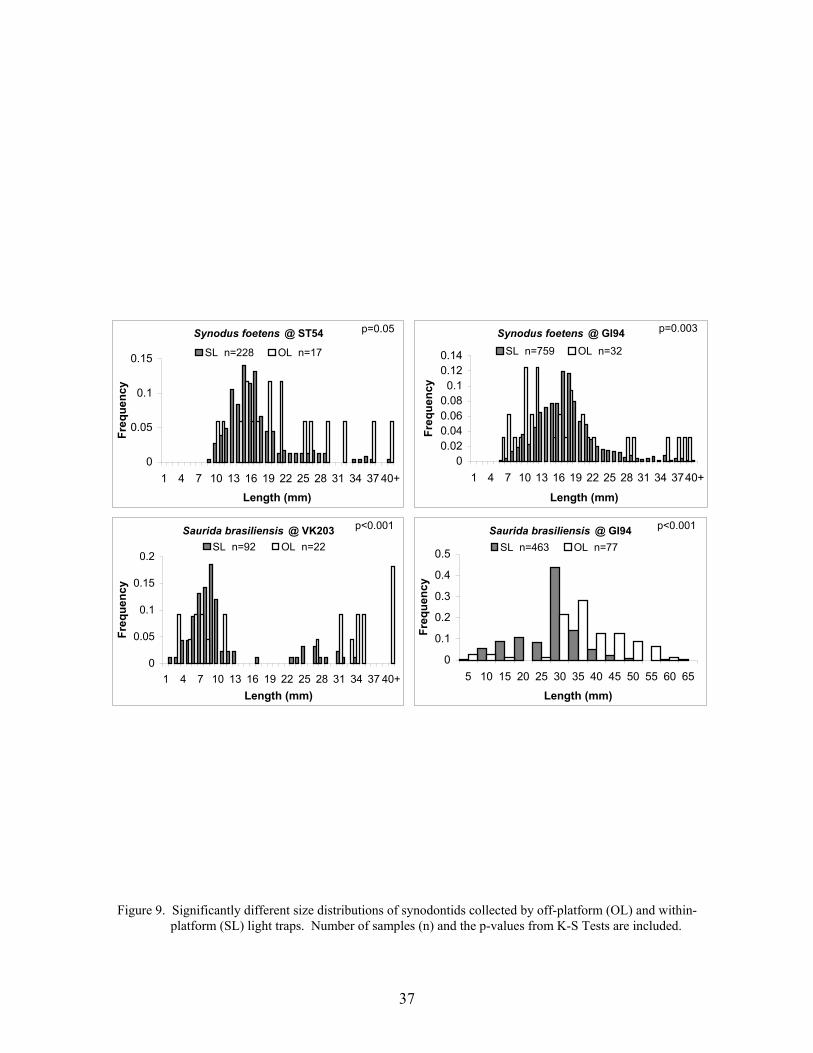
37
Figure 9. Significantly different size distributions of synodontids collected by off-platform (OL) and within- platform (SL) light traps. Number of samples (n) and the p-values from K-S Tests are included.
Synodus foetens @ ST54
0
0.05
0.1
0.15
1 4 7 10 13 16 19 22 25 28 31 34 37 40+Length (mm)
Fre
qu
ency
SL n=228 OL n=17
p=0.05
Saurida brasiliensis @ VK203
0
0.05
0.1
0.15
0.2
1 4 7 10 13 16 19 22 25 28 31 34 37 40+Length (mm)
Fre
qu
ency
SL n=92 OL n=22
p<0.001 Saurida brasiliensis @ GI94
0
0.1
0.2
0.3
0.4
0.5
5 10 15 20 25 30 35 40 45 50 55 60 65Length (mm)
Fre
qu
ency
SL n=463 OL n=77
p<0.001
Synodus foetens @ GI94
00.020.040.060.080.1
0.120.14
1 4 7 10 13 16 19 22 25 28 31 34 3740+
Length (mm)
Fre
qu
ency
SL n=759 OL n=32
p=0.003
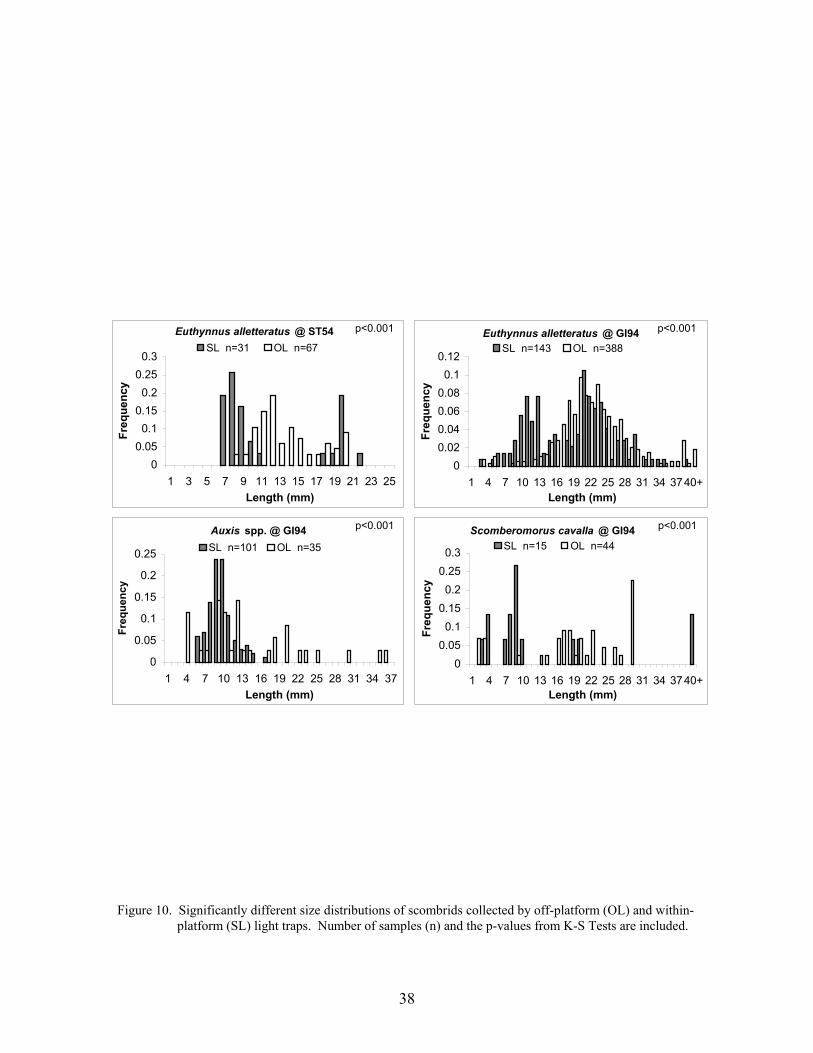
38
Figure 10. Significantly different size distributions of scombrids collected by off-platform (OL) and within- platform (SL) light traps. Number of samples (n) and the p-values from K-S Tests are included.
Euthynnus alletteratus @ ST54
00.050.1
0.150.2
0.250.3
1 3 5 7 9 11 13 15 17 19 21 23 25Length (mm)
Fre
qu
ency
SL n=31 OL n=67
p<0.001
Auxis spp. @ GI94
0
0.05
0.1
0.15
0.2
0.25
1 4 7 10 13 16 19 22 25 28 31 34 37Length (mm)
Fre
qu
ency
SL n=101 OL n=35
p<0.001
Euthynnus alletteratus @ GI94
00.020.040.060.080.1
0.12
1 4 7 10 13 16 19 22 25 28 31 34 3740+Length (mm)
Fre
qu
ency
SL n=143 OL n=388
p<0.001
Scomberomorus cavalla @ GI94
00.050.1
0.150.2
0.250.3
1 4 7 10 13 16 19 22 25 28 31 34 3740+Length (mm)
Fre
qu
ency
SL n=15 OL n=44
p<0.001
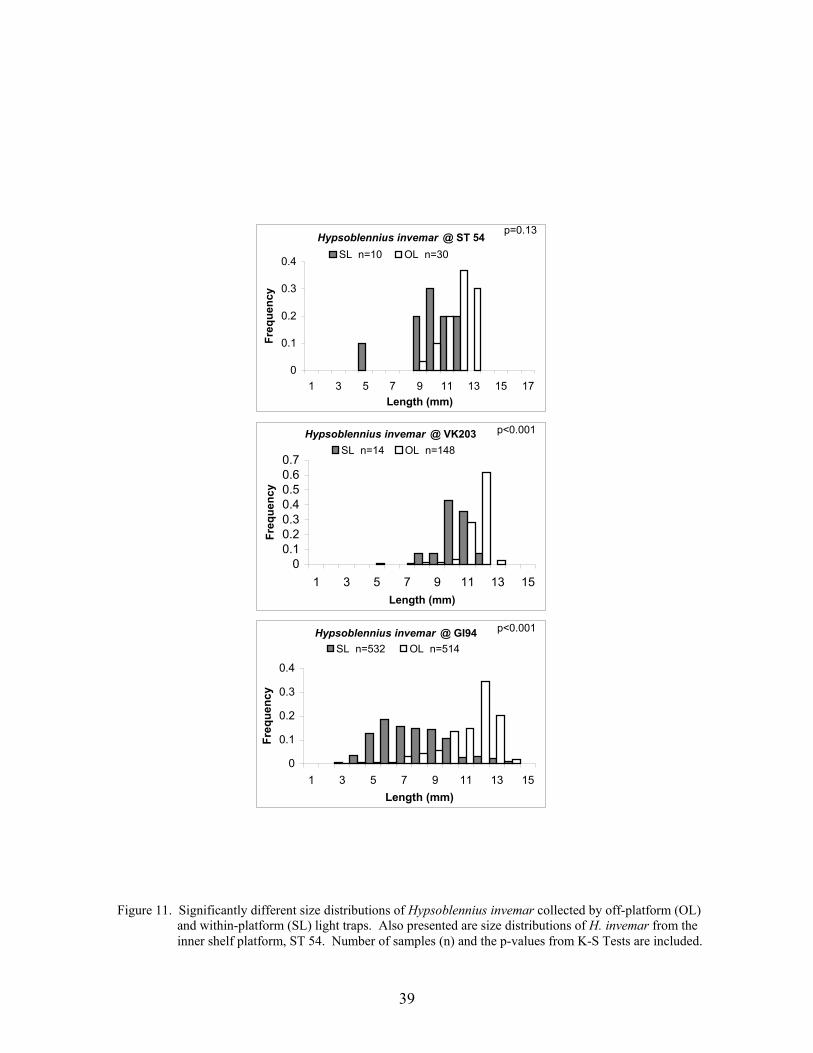
39
p=0.13Hypsoblennius invemar @ ST 54
0
0.1
0.2
0.3
0.4
1 3 5 7 9 11 13 15 17Length (mm)
Fre
qu
ency
SL n=10 OL n=30
p=0.13
Hypsoblennius invemar @ VK203
00.10.20.30.40.50.60.7
1 3 5 7 9 11 13 15Length (mm)
Fre
qu
ency
SL n=14 OL n=148
p<0.001
Hypsoblennius invemar @ GI94
0
0.1
0.2
0.3
0.4
1 3 5 7 9 11 13 15Length (mm)
Fre
qu
ency
SL n=532 OL n=514
p<0.001
Figure 11. Significantly different size distributions of Hypsoblennius invemar collected by off-platform (OL) and within-platform (SL) light traps. Also presented are size distributions of H. invemar from the inner shelf platform, ST 54. Number of samples (n) and the p-values from K-S Tests are included.
40
within-platform light traps at VK 203, while off-platform light traps only collected fish ≤ 8 mm.Although the size distributions of E. eurystole at GI 94 and MP 259 overlapped considerably, themedian length was slightly larger off-platform than within-platform (27 vs. 24 mm at GI 94, 23vs. 22 at MP 259). Median lengths of Anchoa nasuta/hepsetus were larger off-platform at GI 94(22 vs. 21 mm), while at MP 259 the median length was larger within-platform (20 vs. 18 mm).
Significantly different size distributions were also found for synodontids in comparisonsof within- and off-platform light trap collections (Figure 9). Synodus foetens collected off-platform at ST 54 and GI 94 had a greater frequency of larger individuals (>28 mm) than within-platform collections; however, caution should be exercised considering the disproportionatelylarger numbers taken within-platform at both locations. Larger individuals of Sauridabrasiliensis were also more frequent in off-platform collections at VK 203 and GI 94.
Size distributions of scombrids in off-platform light trap collections generallyencompassed larger size classes than within-platform light traps (Figure 10). Euthynnusalletteratus collected in within-platform light traps at ST 54 and GI 94 were generally taken intwo modes, including a mode around 7 to 13 mm that was absent in off-platform light traps. Sizedistributions of Auxis spp. and Scomberomorus cavalla collected off-platform at GI 94 hadgreater frequencies of larger individuals (>15 mm) than within-platform collections.
Larger Hypsoblennius invemar were found in off-platform light traps, as compared withwithin-platform light traps (Figure 11). The size distributions of H. invemar in off-platformcollections had a median length of 12 mm at each platform, while in within-platform collectionsthe median was 10 mm, except at GI 94 where the median length was 7 mm for within-platformcollections.
Few reef taxa were collected in sufficient numbers to compare size distributions betweenwithin- and off-platform light traps. No statistically significant size differences were found forthe blenniids Hypsoblennius hentz/ionthas and Scartella/Hypleurochilus at ST 54, VK 203 or GI94, as was also the situation for Pomacentrus spp. at VK 203 and GI 94. Although they were notcollected in sufficient numbers to analyze statistically, the median lengths of Holocentrus spp.were larger within-platform at MP 259 (13 vs. 10 mm) and GC 18 (31 vs. 22.5 mm). All otherreef taxa were collected at similar sizes between within- and off-platform light traps.
Comparisons of Within-, and 20 m and 50 m Off-Platform Light Trap Catches
On three occasions at VK 203, samples were collected using light traps deployed at threedistances relative to the platform: within the platform; 20 m down-current from the platform; and50 m down-current from the platform. Total mean CPUEs were highest for the 50 m off-platform (19.00 ± 6.66) and 20 m off-platform light traps (17.10 ± 5.36), as compared with thewithin-platform light trap (13.20 ± 2.25). The higher catch rates off-platform were mostly theresult of high CPUEs during the July 29 sampling effort, when large numbers of the blenniidHypsoblennius invemar were collected (Figure 12). When this species was removed from thedata, total mean CPUEs were significantly higher for the within-platform light trap (12.40 ±2.23), as compared with the 20 m off-platform (6.40 ± 0.85) and 50 m off-platform light traps(6.20 ± 1.36; Kruskal-Wallis χ2 = 7.29, p<0.03).
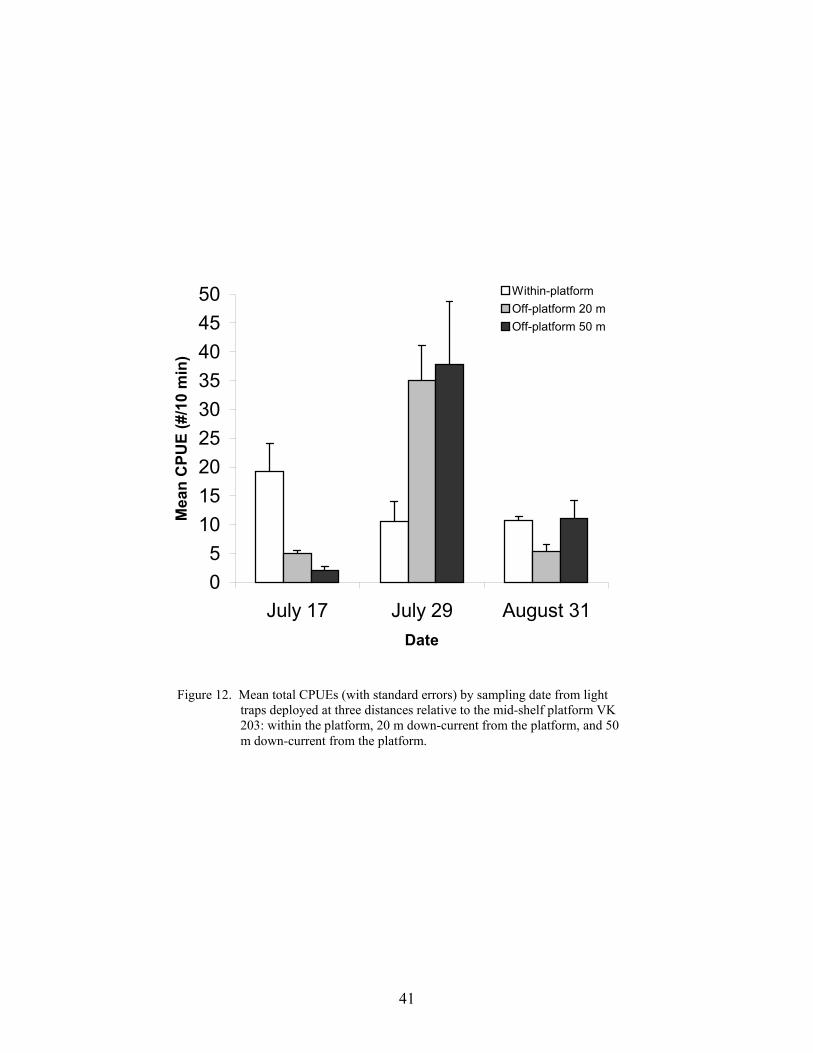
41
Figure 12. Mean total CPUEs (with standard errors) by sampling date from light traps deployed at three distances relative to the mid-shelf platform VK 203: within the platform, 20 m down-current from the platform, and 50 m down-current from the platform.
05
101520253035404550
July 17 July 29 August 31Date
Mea
n C
PU
E (
#/10
min
)
Within-platformOff-platform 20 mOff-platform 50 m
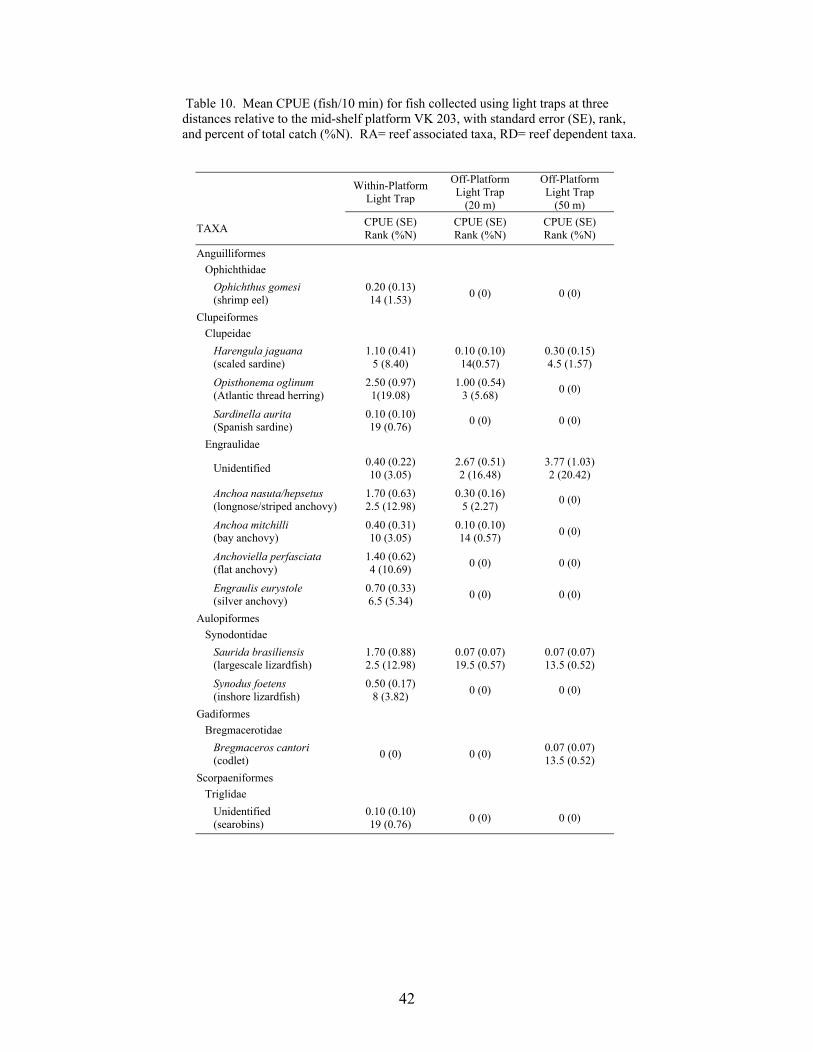
42
Table 10. Mean CPUE (fish/10 min) for fish collected using light traps at three distances relative to the mid-shelf platform VK 203, with standard error (SE), rank, and percent of total catch (%N). RA= reef associated taxa, RD= reef dependent taxa.
Within-PlatformLight Trap
Off-PlatformLight Trap
(20 m)
Off-PlatformLight Trap
(50 m)
TAXA CPUE (SE)Rank (%N)
CPUE (SE)Rank (%N)
CPUE (SE)Rank (%N)
Anguilliformes Ophichthidae Ophichthus gomesi (shrimp eel)
0.20 (0.13)14 (1.53) 0 (0) 0 (0)
Clupeiformes Clupeidae Harengula jaguana (scaled sardine)
1.10 (0.41)5 (8.40)
0.10 (0.10)14(0.57)
0.30 (0.15)4.5 (1.57)
Opisthonema oglinum (Atlantic thread herring)
2.50 (0.97)1(19.08)
1.00 (0.54)3 (5.68) 0 (0)
Sardinella aurita (Spanish sardine)
0.10 (0.10)19 (0.76) 0 (0) 0 (0)
Engraulidae
Unidentified 0.40 (0.22)10 (3.05)
2.67 (0.51)2 (16.48)
3.77 (1.03)2 (20.42)
Anchoa nasuta/hepsetus (longnose/striped anchovy)
1.70 (0.63)2.5 (12.98)
0.30 (0.16)5 (2.27) 0 (0)
Anchoa mitchilli (bay anchovy)
0.40 (0.31)10 (3.05)
0.10 (0.10)14 (0.57) 0 (0)
Anchoviella perfasciata (flat anchovy)
1.40 (0.62)4 (10.69) 0 (0) 0 (0)
Engraulis eurystole (silver anchovy)
0.70 (0.33)6.5 (5.34) 0 (0) 0 (0)
Aulopiformes Synodontidae Saurida brasiliensis (largescale lizardfish)
1.70 (0.88)2.5 (12.98)
0.07 (0.07)19.5 (0.57)
0.07 (0.07)13.5 (0.52)
Synodus foetens (inshore lizardfish)
0.50 (0.17)8 (3.82) 0 (0) 0 (0)
Gadiformes Bregmacerotidae Bregmaceros cantori (codlet) 0 (0) 0 (0) 0.07 (0.07)
13.5 (0.52)Scorpaeniformes Triglidae Unidentified (searobins)
0.10 (0.10)19 (0.76) 0 (0) 0 (0)
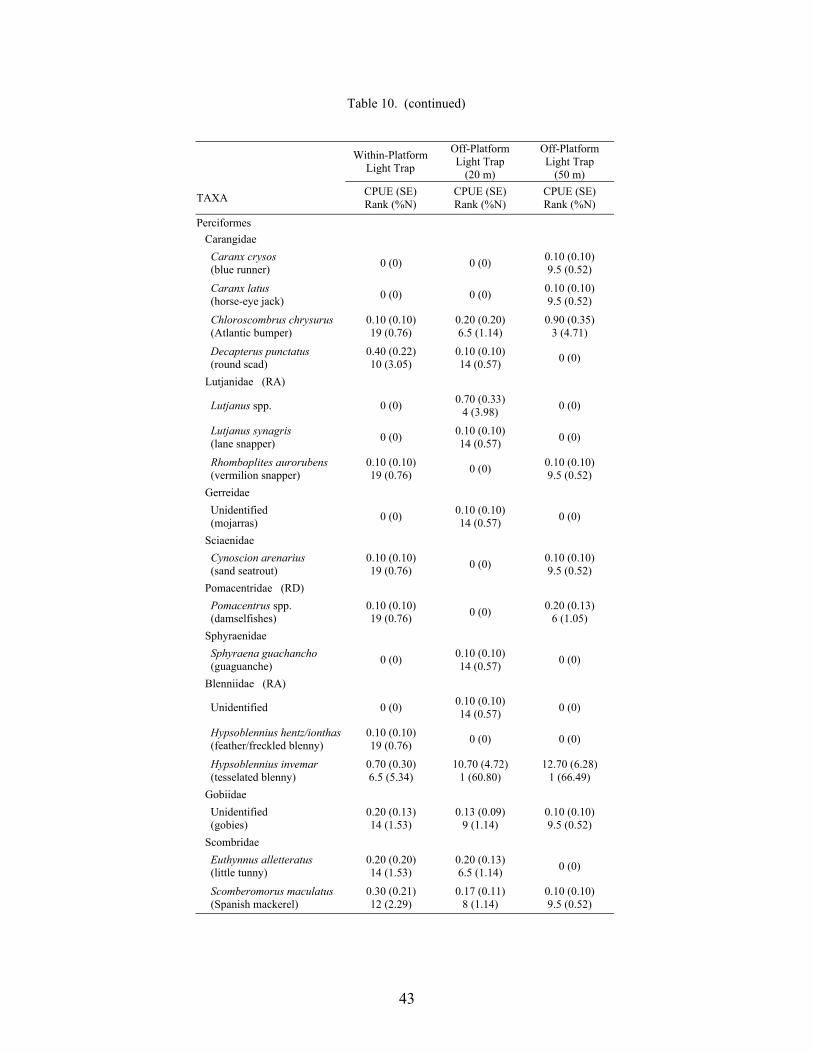
43
Table 10. (continued)
Within-PlatformLight Trap
Off-PlatformLight Trap
(20 m)
Off-PlatformLight Trap
(50 m)
TAXA CPUE (SE)Rank (%N)
CPUE (SE)Rank (%N)
CPUE (SE)Rank (%N)
Perciformes Carangidae Caranx crysos (blue runner) 0 (0) 0 (0) 0.10 (0.10)
9.5 (0.52)
Caranx latus (horse-eye jack) 0 (0) 0 (0) 0.10 (0.10)
9.5 (0.52)
Chloroscombrus chrysurus (Atlantic bumper)
0.10 (0.10)19 (0.76)
0.20 (0.20)6.5 (1.14)
0.90 (0.35)3 (4.71)
Decapterus punctatus (round scad)
0.40 (0.22)10 (3.05)
0.10 (0.10)14 (0.57) 0 (0)
Lutjanidae (RA)
Lutjanus spp. 0 (0) 0.70 (0.33)4 (3.98) 0 (0)
Lutjanus synagris (lane snapper) 0 (0) 0.10 (0.10)
14 (0.57) 0 (0)
Rhomboplites aurorubens (vermilion snapper)
0.10 (0.10)19 (0.76) 0 (0) 0.10 (0.10)
9.5 (0.52) Gerreidae Unidentified (mojarras) 0 (0) 0.10 (0.10)
14 (0.57) 0 (0)
Sciaenidae Cynoscion arenarius (sand seatrout)
0.10 (0.10)19 (0.76) 0 (0) 0.10 (0.10)
9.5 (0.52) Pomacentridae (RD) Pomacentrus spp. (damselfishes)
0.10 (0.10)19 (0.76) 0 (0) 0.20 (0.13)
6 (1.05) Sphyraenidae Sphyraena guachancho (guaguanche) 0 (0) 0.10 (0.10)
14 (0.57) 0 (0)
Blenniidae (RA)
Unidentified 0 (0) 0.10 (0.10)14 (0.57) 0 (0)
Hypsoblennius hentz/ionthas (feather/freckled blenny)
0.10 (0.10)19 (0.76) 0 (0) 0 (0)
Hypsoblennius invemar (tesselated blenny)
0.70 (0.30)6.5 (5.34)
10.70 (4.72)1 (60.80)
12.70 (6.28)1 (66.49)
Gobiidae Unidentified (gobies)
0.20 (0.13)14 (1.53)
0.13 (0.09)9 (1.14)
0.10 (0.10)9.5 (0.52)
Scombridae Euthynnus alletteratus (little tunny)
0.20 (0.20)14 (1.53)
0.20 (0.13)6.5 (1.14) 0 (0)
Scomberomorus maculatus (Spanish mackerel)
0.30 (0.21)12 (2.29)
0.17 (0.11)8 (1.14)
0.10 (0.10)9.5 (0.52)
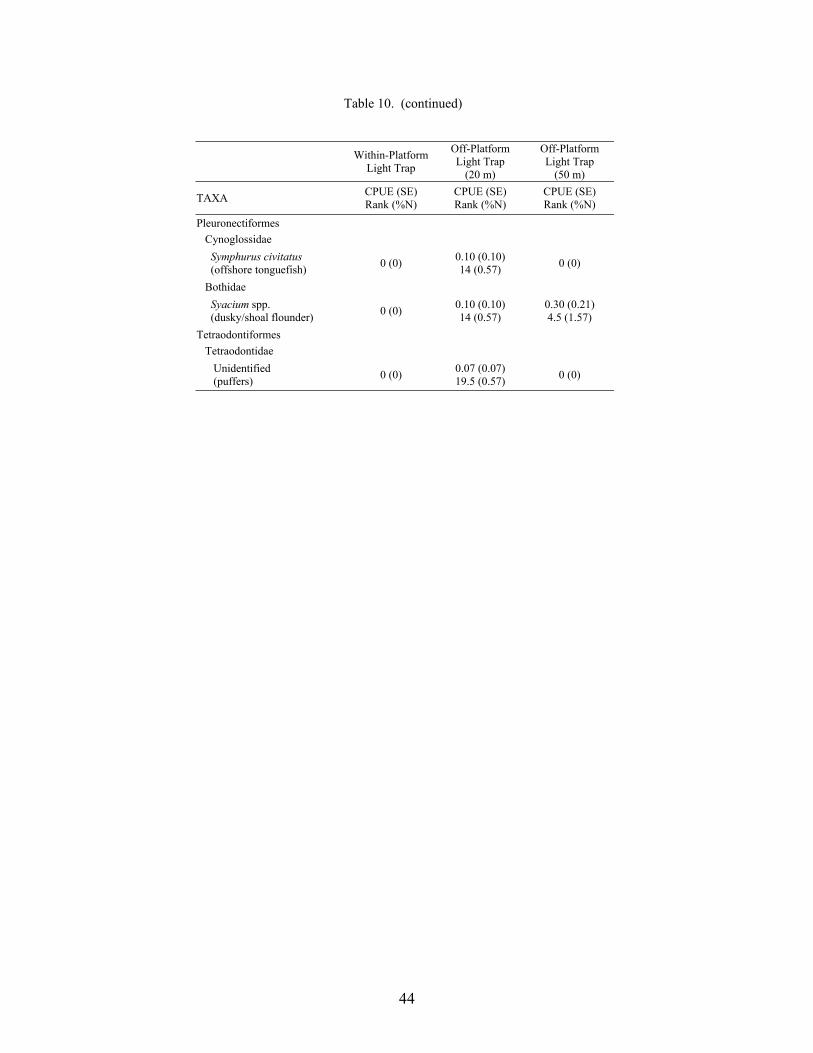
44
Table 10. (continued)
Within-PlatformLight Trap
Off-PlatformLight Trap
(20 m)
Off-PlatformLight Trap
(50 m)
TAXA CPUE (SE)Rank (%N)
CPUE (SE)Rank (%N)
CPUE (SE)Rank (%N)
Pleuronectiformes Cynoglossidae Symphurus civitatus (offshore tonguefish) 0 (0) 0.10 (0.10)
14 (0.57) 0 (0)
Bothidae Syacium spp. (dusky/shoal flounder) 0 (0) 0.10 (0.10)
14 (0.57)0.30 (0.21)4.5 (1.57)
Tetraodontiformes Tetraodontidae Unidentified (puffers) 0 (0) 0.07 (0.07)
19.5 (0.57) 0 (0)
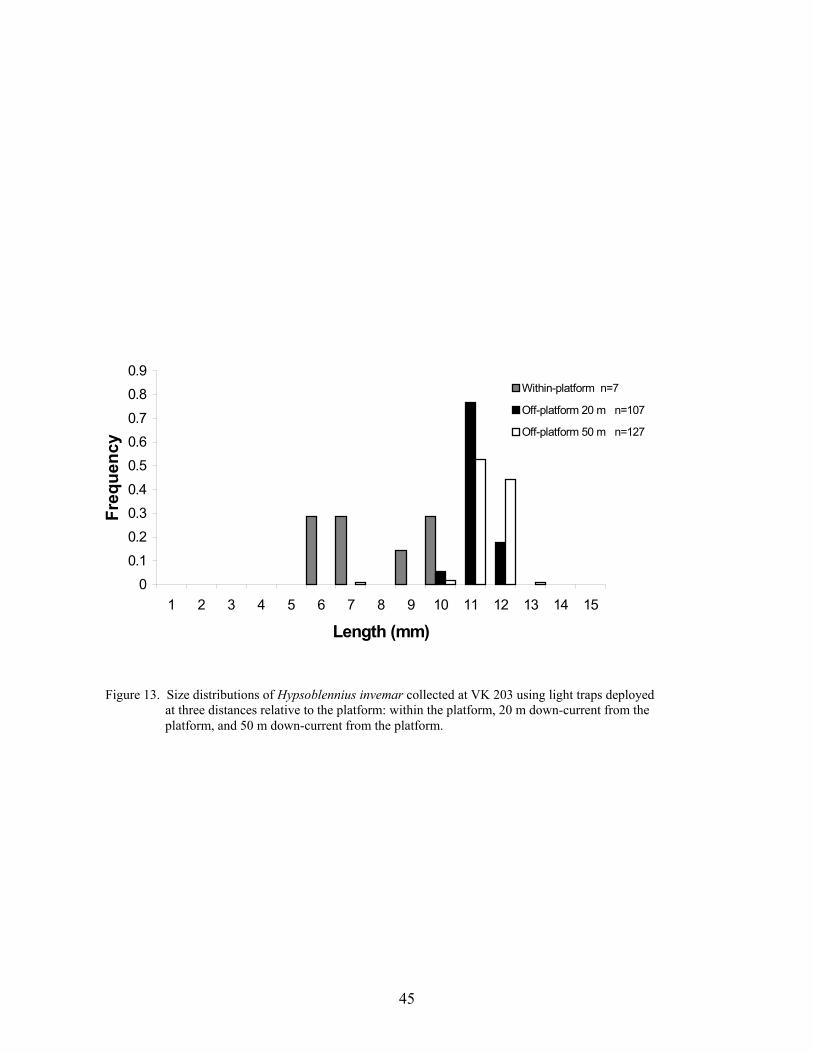
45
Figure 13. Size distributions of Hypsoblennius invemar collected at VK 203 using light traps deployed at three distances relative to the platform: within the platform, 20 m down-current from the platform, and 50 m down-current from the platform.
00.10.20.30.40.50.60.70.80.9
1 2 3 4 5 6 7 8 9 10 11 12 13 14 15
Length (mm)
Fre
qu
ency
Within-platform n=7
Off-platform 20 m n=107
Off-platform 50 m n=127
46
A total of 498 fishes, from 18 families, was collected from 30 light trap samples (10 for eachlight trap distance; Table 10). Within-platform light traps collected a total of 19 taxa (identifiedto at least the genus level), while the 20 m off-platform collected 15 taxa and the 50 m off-platform collected 12 taxa. Mean Shannon-Wiener diversity indices were significantly higherfor the within-platform light trap (1.49 ± 0.14) than the 20 m off-platform (0.67 ± 0.08) or the 50m off-platform (0.56 ± 0.20; χ2 = 12.75, p<0.002). The within-platform catch waspredominantly composed of clupeiforms (63.4% of the total catch) and synodontids (16.8%),while Hypsoblennius invemar, Decapterus punctatus and Scomberomorus cavalla were minorcomponents of the catch. The 20 m and 50 m off-platform catches were dominated by H.invemar (60.8% and 66.5%, respectively), although preflexion engraulids, Lutjanus spp. andChloroscombrus chrysurus were also abundant.
Because of the low number of samples, few taxa were found in sufficient numbers tocompare size distributions across the three light trap distances. Kolmogorov-Smirnov tests of thesizes of Hypsoblennius invemar found each size distribution significantly different from eachother (P<0.0005; Figure 13). Sizes of H. invemar within-platform were between 6 and 10 mm,while in both 20 m and 50 m off-platform light traps the sizes were predominantly 11 to 12 mm.Anchoa nasuta/hepsetus were larger in within-platform (median = 16 mm) than the 20 m off-platform light trap collections (6 mm). Although sample size was low, the sizes of Euthynnusalletteratus collected in the 20 m off-platform light trap were >40 mm in length, while within-platform individuals collected were 9 and 11 mm. The sizes of other taxa were generally similaracross light trap distances.
Comparisons of SEAMAP vs. Platform Collections
Reef-dependent taxa were relatively rare, as compared with reef-associated taxa, in bothplatform plankton nets and SEAMAP bongo nets west of the Delta (Table 11). On the outershelf, reef-dependent families Pomacentridae, Labridae, Acanthuridae, and Scaridae werepresent only in SEAMAP collections, while chaetodontids were only found in platformcollections. In contrast, reef-dependent taxa were only found in platform collections at mid-shelf(i.e., Chaetodontidae, Pomacentridae and Labridae) and inner shelf (i.e., Scaridae), albeit in lowdensities. Reef-associated taxa were taken in larger densities in platform collections at all shelflocations with the exception of serranids, which had higher densities in SEAMAP collections.East of the Delta, labrids and scarids were the predominant reef-dependent taxa collected, andwere more common in SEAMAP bongo net collections (Table 12). Of the reef-associated taxa,lutjanids and serranids were found in higher densities in SEAMAP collections, while blenniidshad higher densities in platform collections.
Significantly different size distributions were found for serranids between SEAMAPbongo net and platform plankton net collections, with slightly smaller median lengths inSEAMAP collections (2 mm vs. 3; Figure 14). Lutjanids also displayed significantly differentsize distributions, having once again slightly smaller median lengths in SEAMAP collections (2mm vs. 4; Figure 15). Statistical comparisons between ST 54, GI 94 and their respectiveSEAMAP samples were not possible for serranids and lutjanids due to limited numberscollected. No significant differences were found between the size distributions of labridscollected at MP 259 and nearby SEAMAP stations, as both distributions ranged from 1 to 6 mm.
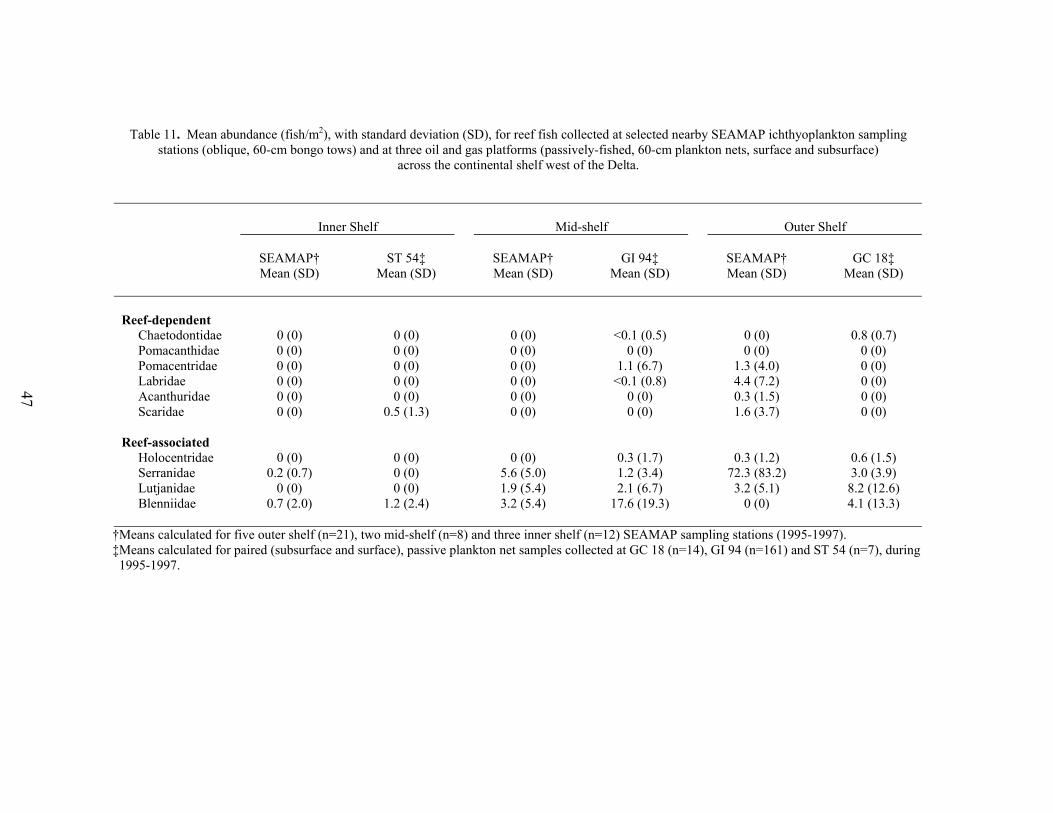
Table 11. Mean abundance (fish/m2), with standard deviation (SD), for reef fish collected at selected nearby SEAMAP ichthyoplankton samplingstations (oblique, 60-cm bongo tows) and at three oil and gas platforms (passively-fished, 60-cm plankton nets, surface and subsurface)
across the continental shelf west of the Delta.
Inner Shelf Mid-shelf Outer Shelf
SEAMAP† ST 54‡ SEAMAP† GI 94‡ SEAMAP† GC 18‡Mean (SD) Mean (SD) Mean (SD) Mean (SD) Mean (SD) Mean (SD)
Reef-dependent Chaetodontidae 0 (0) 0 (0) 0 (0) <0.1 (0.5) 0 (0) 0.8 (0.7) Pomacanthidae 0 (0) 0 (0) 0 (0) 0 (0) 0 (0) 0 (0) Pomacentridae 0 (0) 0 (0) 0 (0) 1.1 (6.7) 1.3 (4.0) 0 (0) Labridae 0 (0) 0 (0) 0 (0) <0.1 (0.8) 4.4 (7.2) 0 (0) Acanthuridae 0 (0) 0 (0) 0 (0) 0 (0) 0.3 (1.5) 0 (0) Scaridae 0 (0) 0.5 (1.3) 0 (0) 0 (0) 1.6 (3.7) 0 (0)
Reef-associated Holocentridae 0 (0) 0 (0) 0 (0) 0.3 (1.7) 0.3 (1.2) 0.6 (1.5) Serranidae 0.2 (0.7) 0 (0) 5.6 (5.0) 1.2 (3.4) 72.3 (83.2) 3.0 (3.9) Lutjanidae 0 (0) 0 (0) 1.9 (5.4) 2.1 (6.7) 3.2 (5.1) 8.2 (12.6) Blenniidae 0.7 (2.0) 1.2 (2.4) 3.2 (5.4) 17.6 (19.3) 0 (0) 4.1 (13.3)
†Means calculated for five outer shelf (n=21), two mid-shelf (n=8) and three inner shelf (n=12) SEAMAP sampling stations (1995-1997). ‡Means calculated for paired (subsurface and surface), passive plankton net samples collected at GC 18 (n=14), GI 94 (n=161) and ST 54 (n=7), during 1995-1997.
47
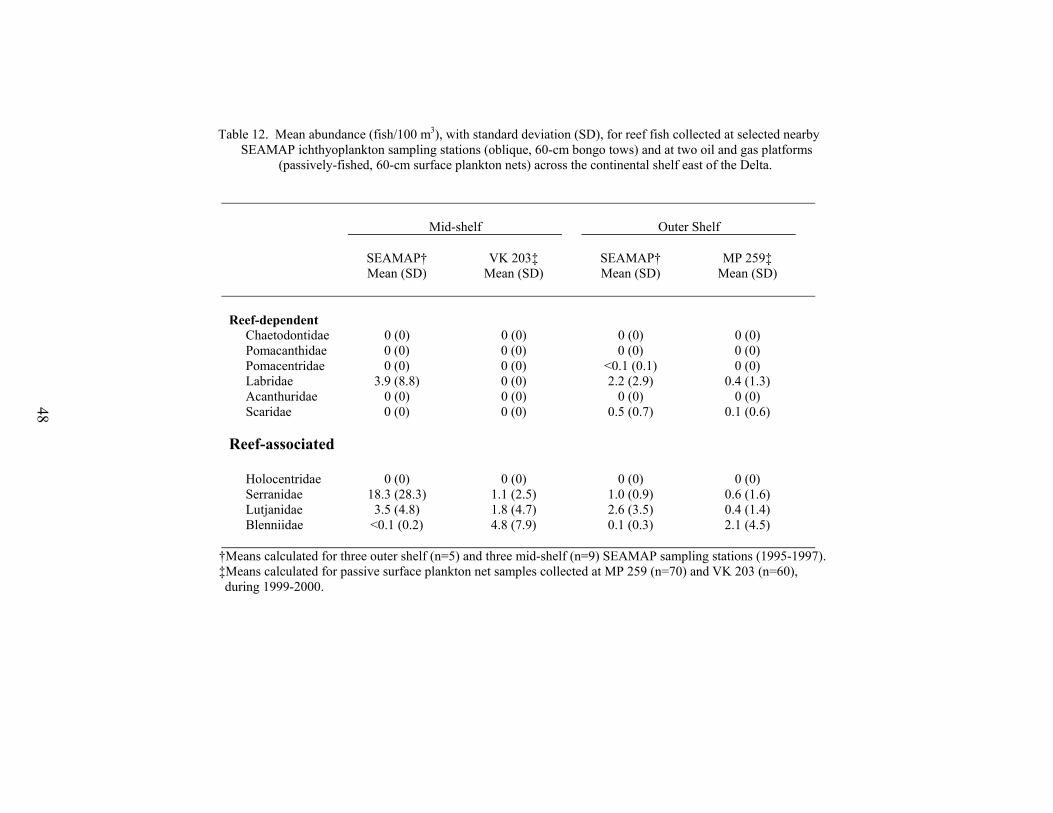
Table 12. Mean abundance (fish/100 m3), with standard deviation (SD), for reef fish collected at selected nearbySEAMAP ichthyoplankton sampling stations (oblique, 60-cm bongo tows) and at two oil and gas platforms
(passively-fished, 60-cm surface plankton nets) across the continental shelf east of the Delta.
Mid-shelf Outer Shelf
SEAMAP† VK 203‡ SEAMAP† MP 259‡Mean (SD) Mean (SD) Mean (SD) Mean (SD)
Reef-dependent Chaetodontidae 0 (0) 0 (0) 0 (0) 0 (0) Pomacanthidae 0 (0) 0 (0) 0 (0) 0 (0) Pomacentridae 0 (0) 0 (0) <0.1 (0.1) 0 (0) Labridae 3.9 (8.8) 0 (0) 2.2 (2.9) 0.4 (1.3) Acanthuridae 0 (0) 0 (0) 0 (0) 0 (0) Scaridae 0 (0) 0 (0) 0.5 (0.7) 0.1 (0.6)
Reef-associated
Holocentridae 0 (0) 0 (0) 0 (0) 0 (0) Serranidae 18.3 (28.3) 1.1 (2.5) 1.0 (0.9) 0.6 (1.6) Lutjanidae 3.5 (4.8) 1.8 (4.7) 2.6 (3.5) 0.4 (1.4) Blenniidae <0.1 (0.2) 4.8 (7.9) 0.1 (0.3) 2.1 (4.5)
†Means calculated for three outer shelf (n=5) and three mid-shelf (n=9) SEAMAP sampling stations (1995-1997). ‡Means calculated for passive surface plankton net samples collected at MP 259 (n=70) and VK 203 (n=60),
during 1999-2000.
48
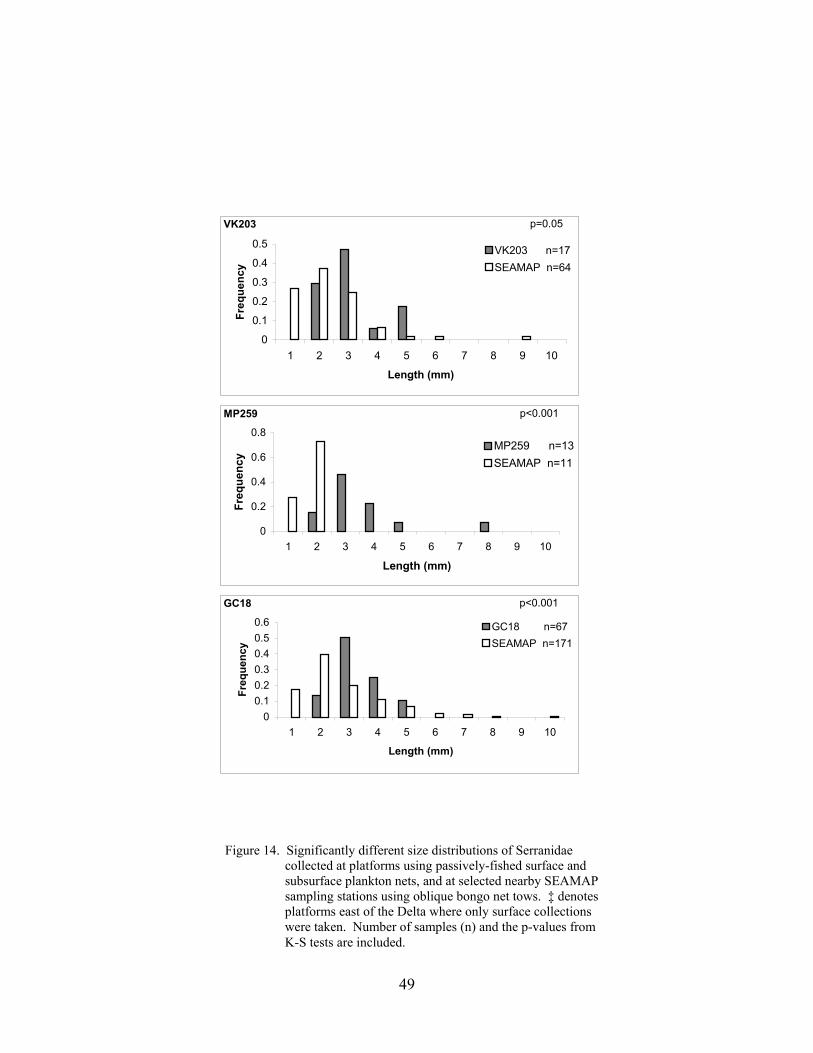
49
Figure 14. Significantly different size distributions of Serranidae collected at platforms using passively-fished surface and subsurface plankton nets, and at selected nearby SEAMAP sampling stations using oblique bongo net tows. ‡ denotes platforms east of the Delta where only surface collections were taken. Number of samples (n) and the p-values from K-S tests are included.
0
0.1
0.2
0.3
0.4
0.5
1 2 3 4 5 6 7 8 9 10
Length (mm)
Fre
qu
ency
VK203 n=17SEAMAP n=64
VK203 p=0.05
0
0.2
0.4
0.6
0.8
1 2 3 4 5 6 7 8 9 10
Length (mm)
Fre
qu
ency
MP259 n=13SEAMAP n=11
MP259 p<0.001
00.10.20.30.40.50.6
1 2 3 4 5 6 7 8 9 10
Length (mm)
Fre
qu
ency
GC18 n=67SEAMAP n=171
GC18 p<0.001
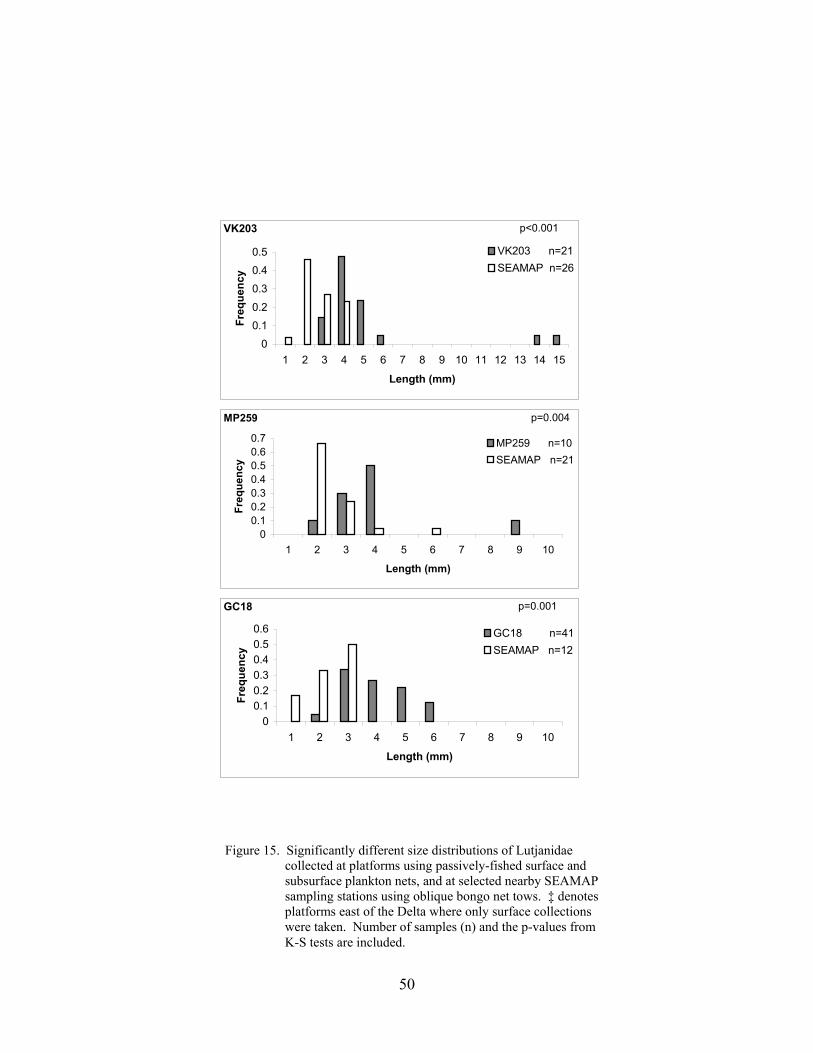
50
Figure 15. Significantly different size distributions of Lutjanidae collected at platforms using passively-fished surface and subsurface plankton nets, and at selected nearby SEAMAP sampling stations using oblique bongo net tows. ‡ denotes platforms east of the Delta where only surface collections were taken. Number of samples (n) and the p-values from K-S tests are included.
00.10.20.30.40.5
1 2 3 4 5 6 7 8 9 10 11 12 13 14 15
Length (mm)
Fre
qu
ency
VK203 n=21SEAMAP n=26
p<0.001VK203
00.10.20.30.40.50.60.7
1 2 3 4 5 6 7 8 9 10
Length (mm)
Fre
qu
ency
MP259 n=10SEAMAP n=21
p=0.004MP259
00.10.20.30.40.50.6
1 2 3 4 5 6 7 8 9 10
Length (mm)
Fre
qu
ency
GC18 n=41SEAMAP n=12
GC18 p=0.001
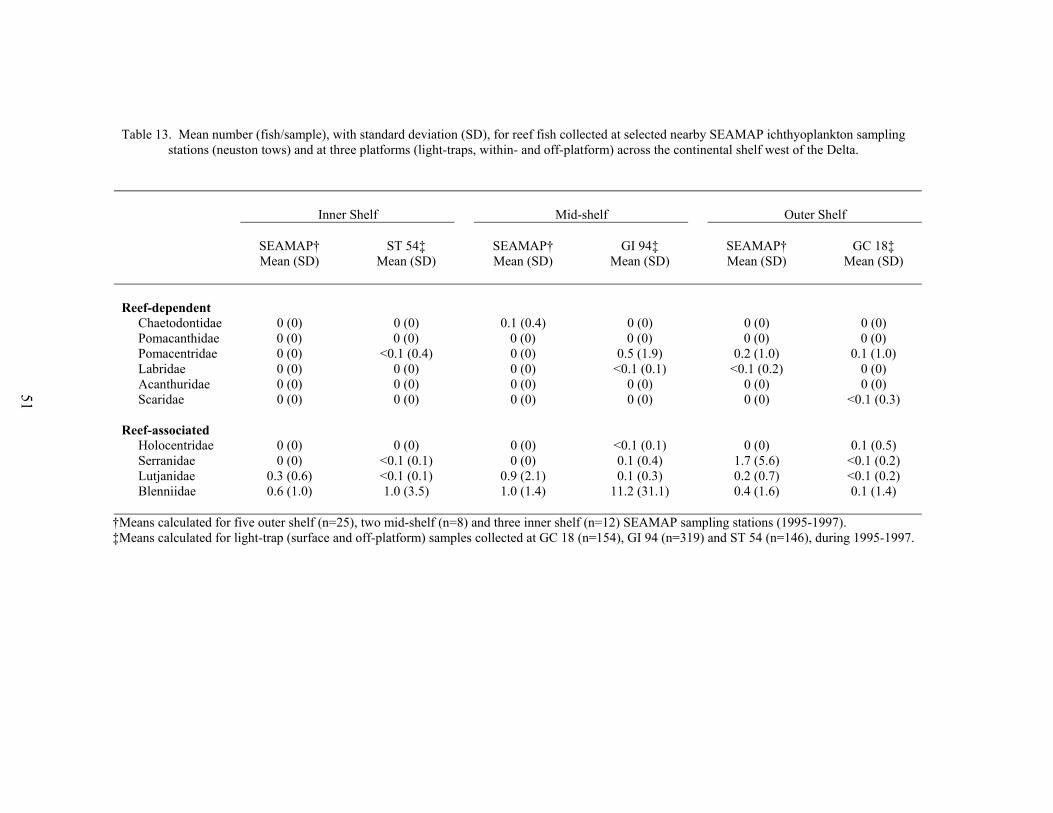
Table 13. Mean number (fish/sample), with standard deviation (SD), for reef fish collected at selected nearby SEAMAP ichthyoplankton sampling stations (neuston tows) and at three platforms (light-traps, within- and off-platform) across the continental shelf west of the Delta.
Inner Shelf Mid-shelf Outer Shelf
SEAMAP† ST 54‡ SEAMAP† GI 94‡ SEAMAP† GC 18‡Mean (SD) Mean (SD) Mean (SD) Mean (SD) Mean (SD) Mean (SD)
Reef-dependent Chaetodontidae 0 (0) 0 (0) 0.1 (0.4) 0 (0) 0 (0) 0 (0) Pomacanthidae 0 (0) 0 (0) 0 (0) 0 (0) 0 (0) 0 (0) Pomacentridae 0 (0) <0.1 (0.4) 0 (0) 0.5 (1.9) 0.2 (1.0) 0.1 (1.0) Labridae 0 (0) 0 (0) 0 (0) <0.1 (0.1) <0.1 (0.2) 0 (0) Acanthuridae 0 (0) 0 (0) 0 (0) 0 (0) 0 (0) 0 (0) Scaridae 0 (0) 0 (0) 0 (0) 0 (0) 0 (0) <0.1 (0.3)
Reef-associated Holocentridae 0 (0) 0 (0) 0 (0) <0.1 (0.1) 0 (0) 0.1 (0.5) Serranidae 0 (0) <0.1 (0.1) 0 (0) 0.1 (0.4) 1.7 (5.6) <0.1 (0.2) Lutjanidae 0.3 (0.6) <0.1 (0.1) 0.9 (2.1) 0.1 (0.3) 0.2 (0.7) <0.1 (0.2) Blenniidae 0.6 (1.0) 1.0 (3.5) 1.0 (1.4) 11.2 (31.1) 0.4 (1.6) 0.1 (1.4)
†Means calculated for five outer shelf (n=25), two mid-shelf (n=8) and three inner shelf (n=12) SEAMAP sampling stations (1995-1997). ‡Means calculated for light-trap (surface and off-platform) samples collected at GC 18 (n=154), GI 94 (n=319) and ST 54 (n=146), during 1995-1997.
51
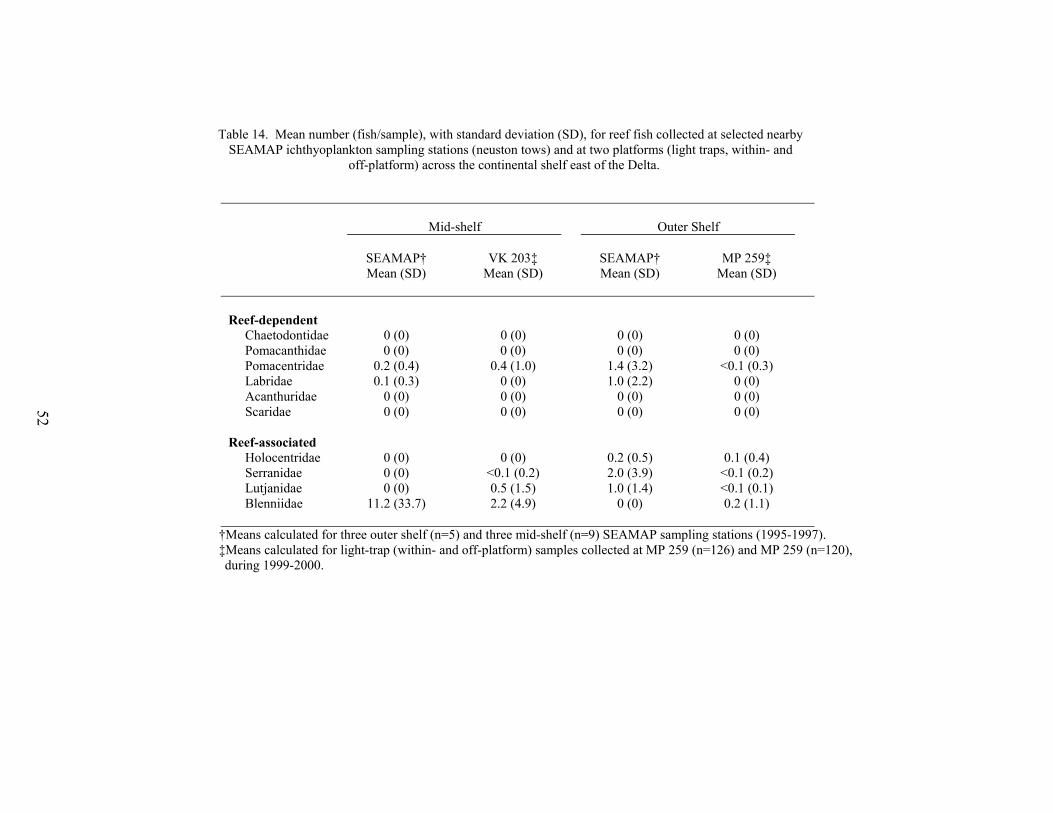
Table 14. Mean number (fish/sample), with standard deviation (SD), for reef fish collected at selected nearby SEAMAP ichthyoplankton sampling stations (neuston tows) and at two platforms (light traps, within- and off-platform) across the continental shelf east of the Delta.
Mid-shelf Outer Shelf
SEAMAP† VK 203‡ SEAMAP† MP 259‡Mean (SD) Mean (SD) Mean (SD) Mean (SD)
Reef-dependent Chaetodontidae 0 (0) 0 (0) 0 (0) 0 (0) Pomacanthidae 0 (0) 0 (0) 0 (0) 0 (0) Pomacentridae 0.2 (0.4) 0.4 (1.0) 1.4 (3.2) <0.1 (0.3) Labridae 0.1 (0.3) 0 (0) 1.0 (2.2) 0 (0) Acanthuridae 0 (0) 0 (0) 0 (0) 0 (0) Scaridae 0 (0) 0 (0) 0 (0) 0 (0)
Reef-associated Holocentridae 0 (0) 0 (0) 0.2 (0.5) 0.1 (0.4) Serranidae 0 (0) <0.1 (0.2) 2.0 (3.9) <0.1 (0.2) Lutjanidae 0 (0) 0.5 (1.5) 1.0 (1.4) <0.1 (0.1) Blenniidae 11.2 (33.7) 2.2 (4.9) 0 (0) 0.2 (1.1)
†Means calculated for three outer shelf (n=5) and three mid-shelf (n=9) SEAMAP sampling stations (1995-1997). ‡Means calculated for light-trap (within- and off-platform) samples collected at MP 259 (n=126) and MP 259 (n=120),
during 1999-2000.
52
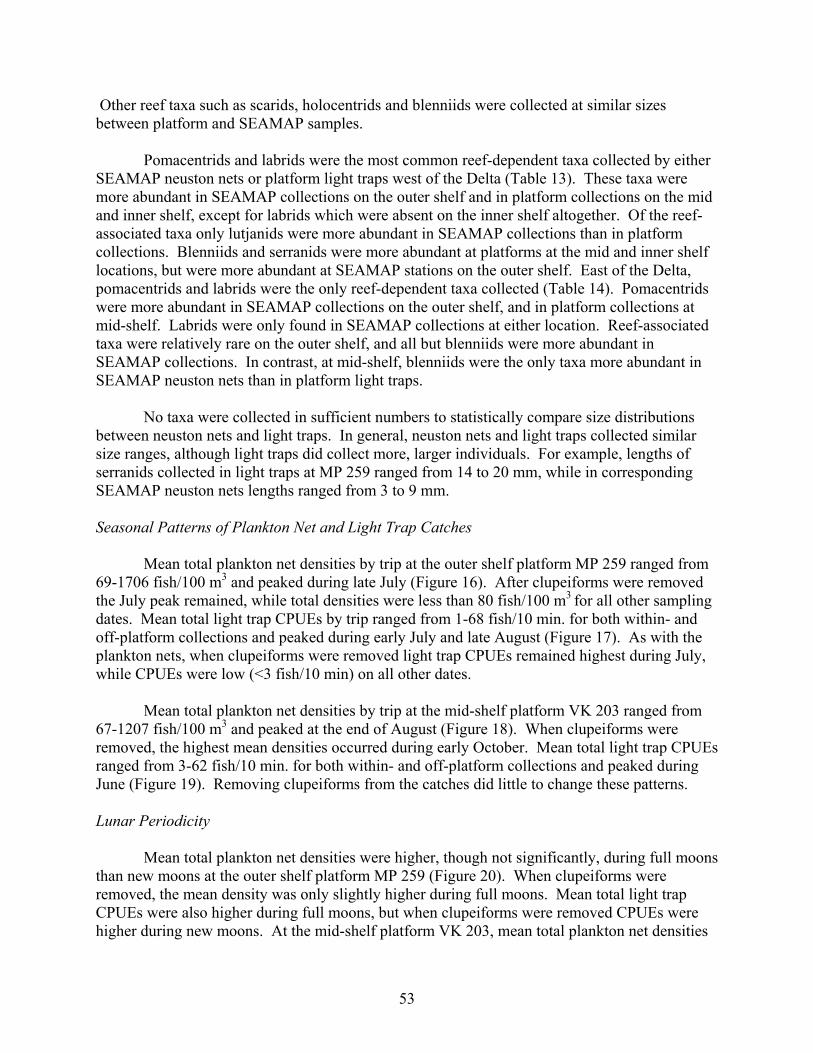
53
Other reef taxa such as scarids, holocentrids and blenniids were collected at similar sizesbetween platform and SEAMAP samples.
Pomacentrids and labrids were the most common reef-dependent taxa collected by eitherSEAMAP neuston nets or platform light traps west of the Delta (Table 13). These taxa weremore abundant in SEAMAP collections on the outer shelf and in platform collections on the midand inner shelf, except for labrids which were absent on the inner shelf altogether. Of the reef-associated taxa only lutjanids were more abundant in SEAMAP collections than in platformcollections. Blenniids and serranids were more abundant at platforms at the mid and inner shelflocations, but were more abundant at SEAMAP stations on the outer shelf. East of the Delta,pomacentrids and labrids were the only reef-dependent taxa collected (Table 14). Pomacentridswere more abundant in SEAMAP collections on the outer shelf, and in platform collections atmid-shelf. Labrids were only found in SEAMAP collections at either location. Reef-associatedtaxa were relatively rare on the outer shelf, and all but blenniids were more abundant inSEAMAP collections. In contrast, at mid-shelf, blenniids were the only taxa more abundant inSEAMAP neuston nets than in platform light traps.
No taxa were collected in sufficient numbers to statistically compare size distributionsbetween neuston nets and light traps. In general, neuston nets and light traps collected similarsize ranges, although light traps did collect more, larger individuals. For example, lengths ofserranids collected in light traps at MP 259 ranged from 14 to 20 mm, while in correspondingSEAMAP neuston nets lengths ranged from 3 to 9 mm.
Seasonal Patterns of Plankton Net and Light Trap Catches
Mean total plankton net densities by trip at the outer shelf platform MP 259 ranged from69-1706 fish/100 m3 and peaked during late July (Figure 16). After clupeiforms were removedthe July peak remained, while total densities were less than 80 fish/100 m3 for all other samplingdates. Mean total light trap CPUEs by trip ranged from 1-68 fish/10 min. for both within- andoff-platform collections and peaked during early July and late August (Figure 17). As with theplankton nets, when clupeiforms were removed light trap CPUEs remained highest during July,while CPUEs were low (<3 fish/10 min) on all other dates.
Mean total plankton net densities by trip at the mid-shelf platform VK 203 ranged from67-1207 fish/100 m3 and peaked at the end of August (Figure 18). When clupeiforms wereremoved, the highest mean densities occurred during early October. Mean total light trap CPUEsranged from 3-62 fish/10 min. for both within- and off-platform collections and peaked duringJune (Figure 19). Removing clupeiforms from the catches did little to change these patterns.
Lunar Periodicity
Mean total plankton net densities were higher, though not significantly, during full moonsthan new moons at the outer shelf platform MP 259 (Figure 20). When clupeiforms wereremoved, the mean density was only slightly higher during full moons. Mean total light trapCPUEs were also higher during full moons, but when clupeiforms were removed CPUEs werehigher during new moons. At the mid-shelf platform VK 203, mean total plankton net densities
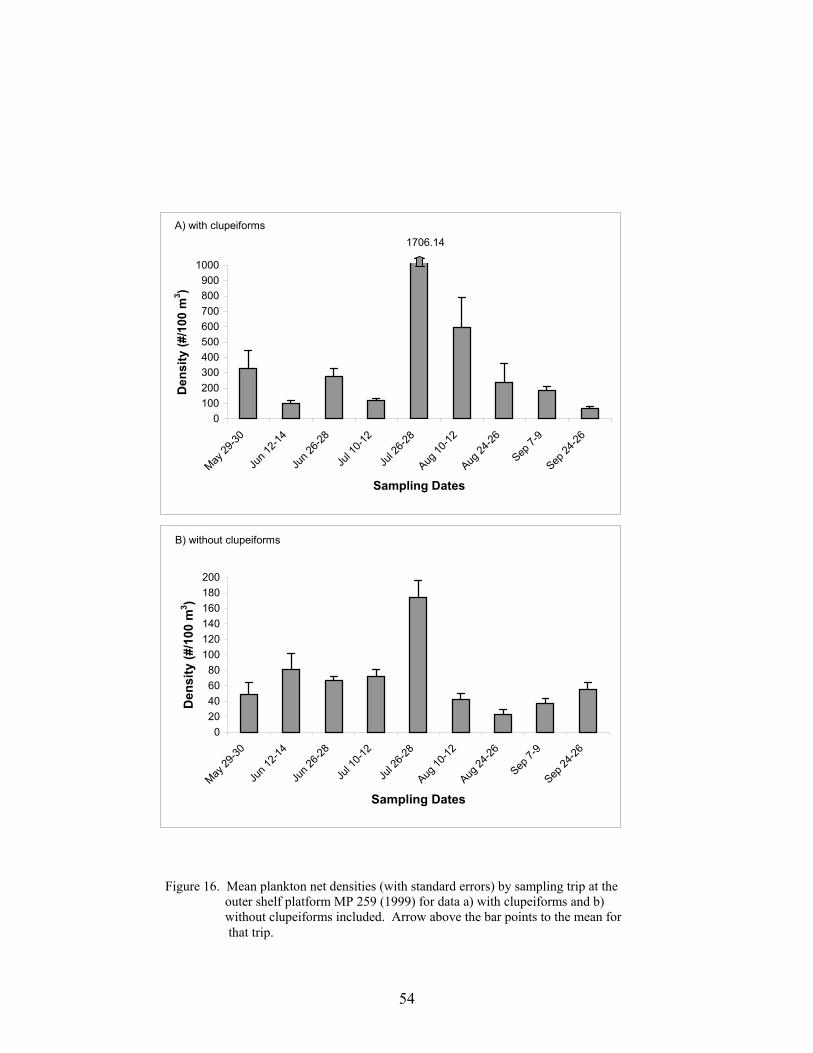
54
Figure 16. Mean plankton net densities (with standard errors) by sampling trip at the outer shelf platform MP 259 (1999) for data a) with clupeiforms and b) without clupeiforms included. Arrow above the bar points to the mean for that trip.
A) with clupeiforms
0100200300400500600700800900
1000
May 29
-30
Jun 1
2-14
Jun 2
6-28
Jul 1
0-12
Jul 2
6-28
Aug 10
-12
Aug 24
-26
Sep 7-
9
Sep 24
-26
Sampling Dates
Den
sity
(#/
100
m3 )
B) without clupeiforms
020406080
100120140160180200
May 29
-30
Jun 1
2-14
Jun 2
6-28
Jul 1
0-12
Jul 2
6-28
Aug 10
-12
Aug 24
-26
Sep 7-
9
Sep 24
-26
Sampling Dates
Den
sity
(#/
100
m3 )
1706.14
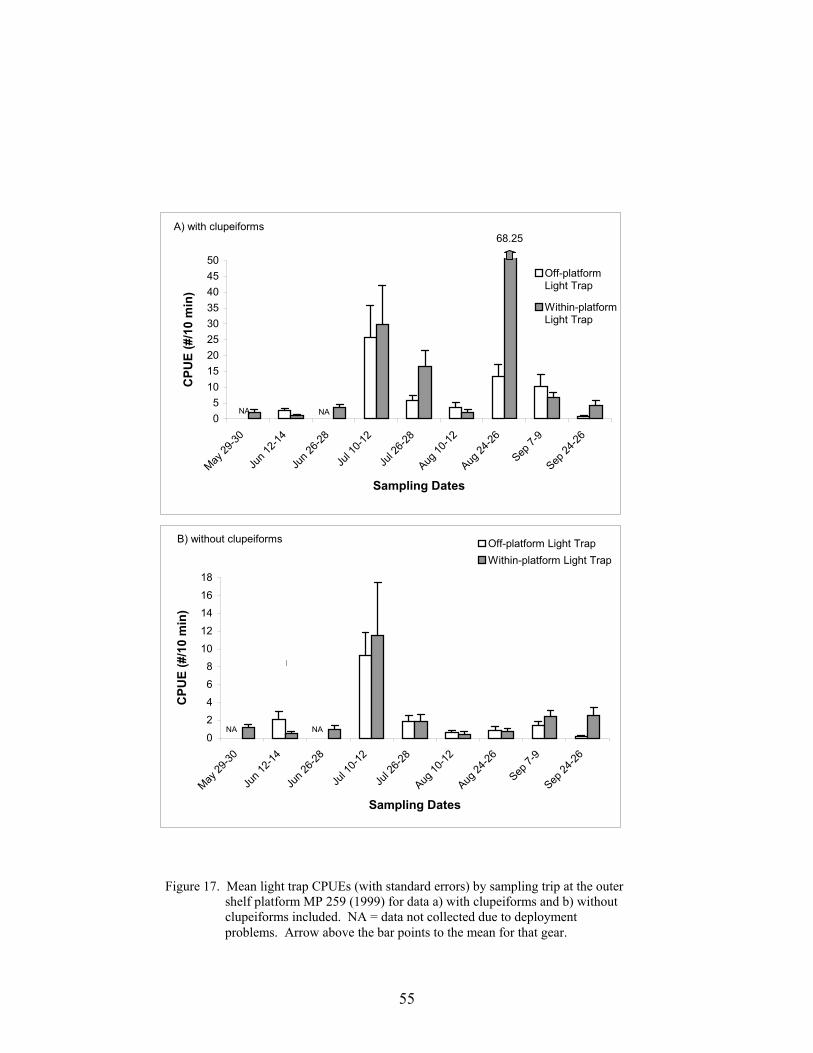
55
Figure 17. Mean light trap CPUEs (with standard errors) by sampling trip at the outer shelf platform MP 259 (1999) for data a) with clupeiforms and b) without clupeiforms included. NA = data not collected due to deployment problems. Arrow above the bar points to the mean for that gear.
A) with clupeiforms
05
101520253035404550
May 29
-30
Jun 1
2-14
Jun 2
6-28
Jul 1
0-12
Jul 2
6-28
Aug 10
-12
Aug 24
-26
Sep 7-
9
Sep 24
-26
Sampling Dates
CP
UE
(#/
10 m
in)
Off-platformLight Trap
Within-platformLight Trap
68.25
B) without clupeiforms
02468
1012141618
May 29
-30
Jun 1
2-14
Jun 2
6-28
Jul 1
0-12
Jul 2
6-28
Aug 10
-12
Aug 24
-26
Sep 7-
9
Sep 24
-26
Sampling Dates
CP
UE
(#/
10 m
in)
Off-platform Light TrapWithin-platform Light Trap
NANA
N
NA NA
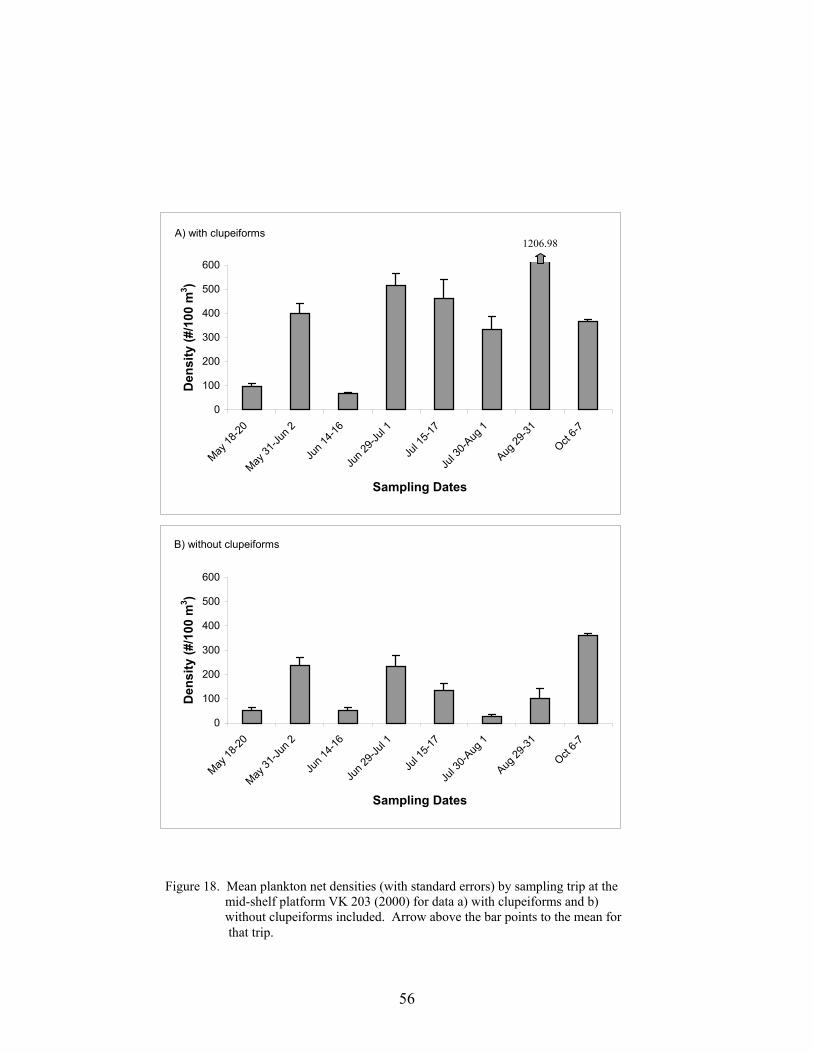
56
A) with clupeiforms
0
100
200
300
400
500
600
May 18
-20
May 31
-Jun 2
Jun 1
4-16
Jun 2
9-Jul
1
Jul 1
5-17
Jul 3
0-Aug
1
Aug 29
-31
Oct 6-7
Sampling Dates
Den
sity
(#/
100
m3 )
1206.98
B) without clupeiforms
0
100
200
300
400
500
600
May 18
-20
May 31
-Jun 2
Jun 1
4-16
Jun 2
9-Jul
1
Jul 1
5-17
Jul 3
0-Aug
1
Aug 29
-31
Oct 6-7
Sampling Dates
Den
sity
(#/
100
m3 )
Figure 18. Mean plankton net densities (with standard errors) by sampling trip at the mid-shelf platform VK 203 (2000) for data a) with clupeiforms and b) without clupeiforms included. Arrow above the bar points to the mean for that trip.
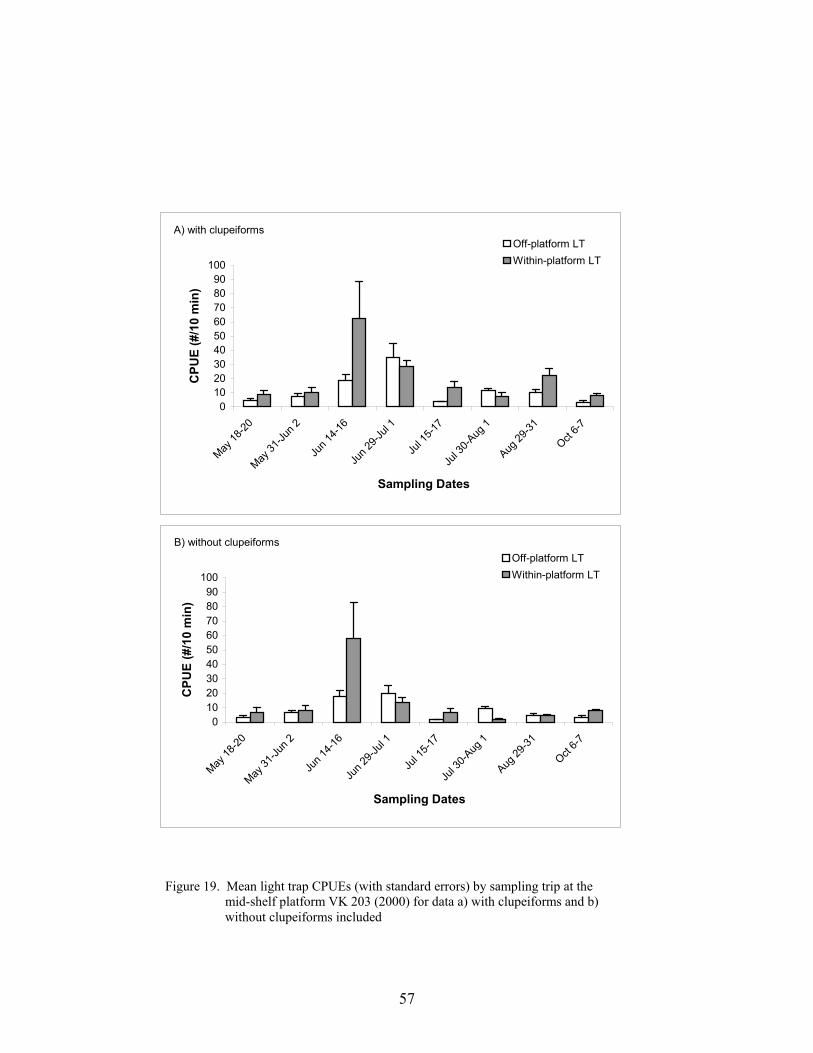
57
Figure 19. Mean light trap CPUEs (with standard errors) by sampling trip at the mid-shelf platform VK 203 (2000) for data a) with clupeiforms and b) without clupeiforms included
A) with clupeiforms
0102030405060708090
100
May 18
-20
May 31
-Jun 2
Jun 1
4-16
Jun 2
9-Jul
1
Jul 1
5-17
Jul 3
0-Aug
1
Aug 29
-31
Oct 6-7
Sampling Dates
CP
UE
(#/
10 m
in)
Off-platform LTWithin-platform LT
B) without clupeiforms
0102030405060708090
100
May 18
-20
May 31
-Jun 2
Jun 1
4-16
Jun 2
9-Jul
1
Jul 1
5-17
Jul 3
0-Aug
1
Aug 29
-31
Oct 6-7
Sampling Dates
CP
UE
(#/
10 m
in)
Off-platform LTWithin-platform LT
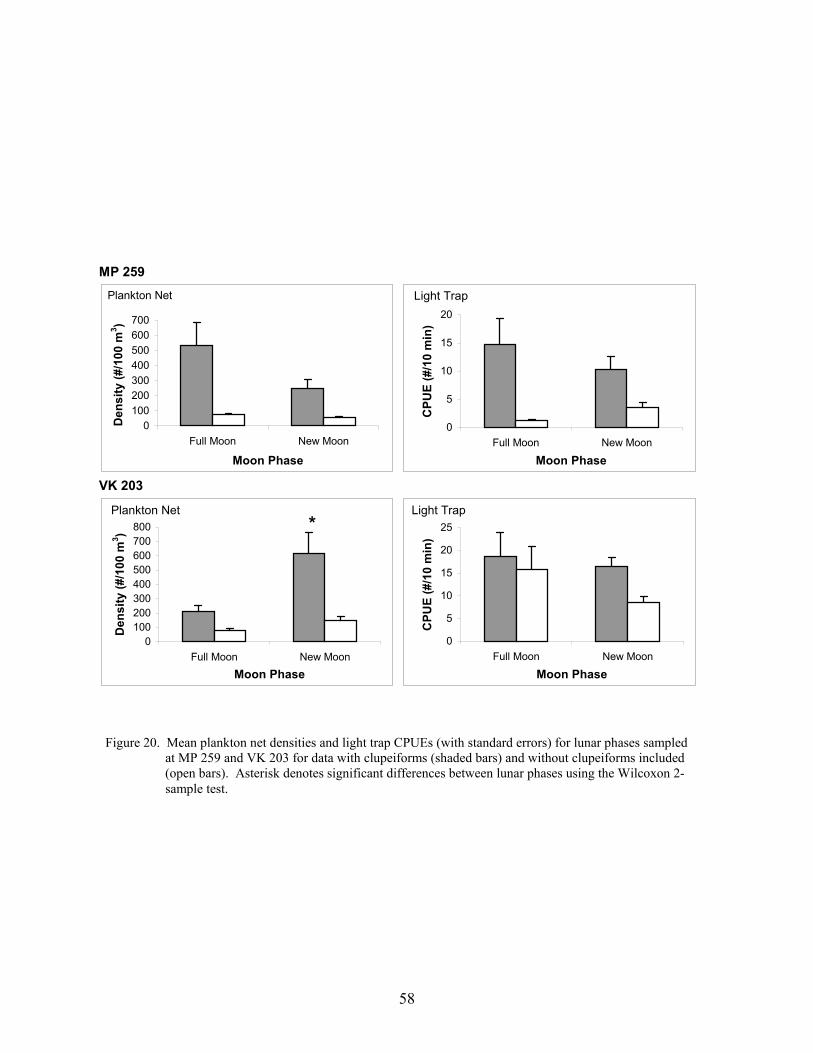
58
Figure 20. Mean plankton net densities and light trap CPUEs (with standard errors) for lunar phases sampled at MP 259 and VK 203 for data with clupeiforms (shaded bars) and without clupeiforms included (open bars). Asterisk denotes significant differences between lunar phases using the Wilcoxon 2- sample test.
MP 259
VK 203
Plankton Net
0100200300400500600700
Full Moon New Moon
Moon Phase
Den
sity
(#/
100
m3)
Light Trap
0
5
10
15
20
Full Moon New Moon
Moon Phase
CP
UE
(#/
10 m
in)
Plankton Net
0100200300400500600700800
Full Moon New MoonMoon Phase
Den
sity
(#/
100
m3)
Light Trap
0
5
10
15
20
25
Full Moon New Moon
Moon Phase
CP
UE
(#/
10 m
in)
*
59
were significantly higher during new moons than full moons (Wilcoxon Z = -2.46, p<0.02;Figure 20). When clupeiforms were removed, mean densities were still higher during newmoons, though not significantly. Mean total light trap CPUEs were relatively equal between fulland new moons, however, catch rates were slightly higher during full moons. When clupeiformswere excluded, this difference was somewhat larger.
Preflexion reef fish larvae were found in higher frequencies during either new or fullmoons, depending on the taxa, while postflexion larvae were collected almost exclusively duringnew moons (Table 15). Preflexion unidentified blenniids and Hypsoblennius hentz/ionthas hadsignificantly higher frequencies collected during full moons. Preflexion holocentrids and labridswere also collected more frequently during full moons. In contrast, preflexion lutjanids,serranids, and other blenniids such as Hypsoblennius invemar and Scartella/Hypleurochilus weretaken more frequently during new moons, while the pomacentrid Chromis spp. was onlycollected on new moons. Postflexion blenniids (H. hentz/ionthas, H. invemar, Parablenniusmarmoreus, and Scartella/Hypleurochilus), lutjanids (Lutjanus spp. and Rhomboplitesaurorubens), pomacentrids (Chromis spp. and Pomacentrus spp.), and holocentrids werecollected in significantly higher frequencies during new moons. Other postflexion taxa, such aslabrids, scarids, epinephelines and serranines, were generally low in number, but were stillcollected in higher frequencies during new moons. Lutjanus campechanus was the onlypostflexion taxon that was collected in significantly higher frequencies during full moons.
Among Trip and Night Variability in Plankton Net and Light Trap Catches
Variability among the mean plankton net and light trap catches per night was consistentlygreater than among the mean plankton net and light trap catches per trip for each taxon at themid-shelf platform GI 94 (Table 16). The taxa with the highest coefficients of variation (CVs)exhibited discrete pulses, spanning one to two nights, in their nightly mean densities or CPUEs.These pulses accounted for a high percentage of the total number of a taxon collected by a gear.For example, Auxis spp. and Cynoscion arenarius had among the highest CVs (both trip andnight) and exhibited large pulses that accounted for 68% and 52%, respectively, of their totalnumbers collected by plankton nets (Figure 21). In contrast, plankton net-collected Serranidaeand Bregmaceros cantori did not exhibit as discrete a pulse, were generally more commonthroughout the sampling season, and consequently had lower CVs. Light trap-collectedHypsoblennius invemar and Pomacentridae had high CVs and exhibited noticeable pulses overone to two nights that accounted for 43% and 65%, respectively, of their total catches. Sauridabrasiliensis and Lutjanidae had relatively low CVs and though peak catches were observed theywere not as distinct.
Coefficients of variation (CVs) for taxa collected at the mid-shelf platform VK 203 weregenerally lower than at GI 94, and displayed smaller differences between CVs among nights andamong trips (Table 17). However, variability among nights remained slightly higher than thevariability among trips in nearly all situations, and in the few exceptions the CVs were nearlyequal. Despite this, distinct pulses were still evident. Large single pulses were observed for bothSaurida brasiliensis (73% of the total catch) and Synodus foetens (65%) collected in light traps.As at GI 94, light trap-collected Hypsoblennius invemar at VK 203 exhibited a discrete pulse innightly mean CPUEs spanning one night, however, a second smaller pulse occurred two trips
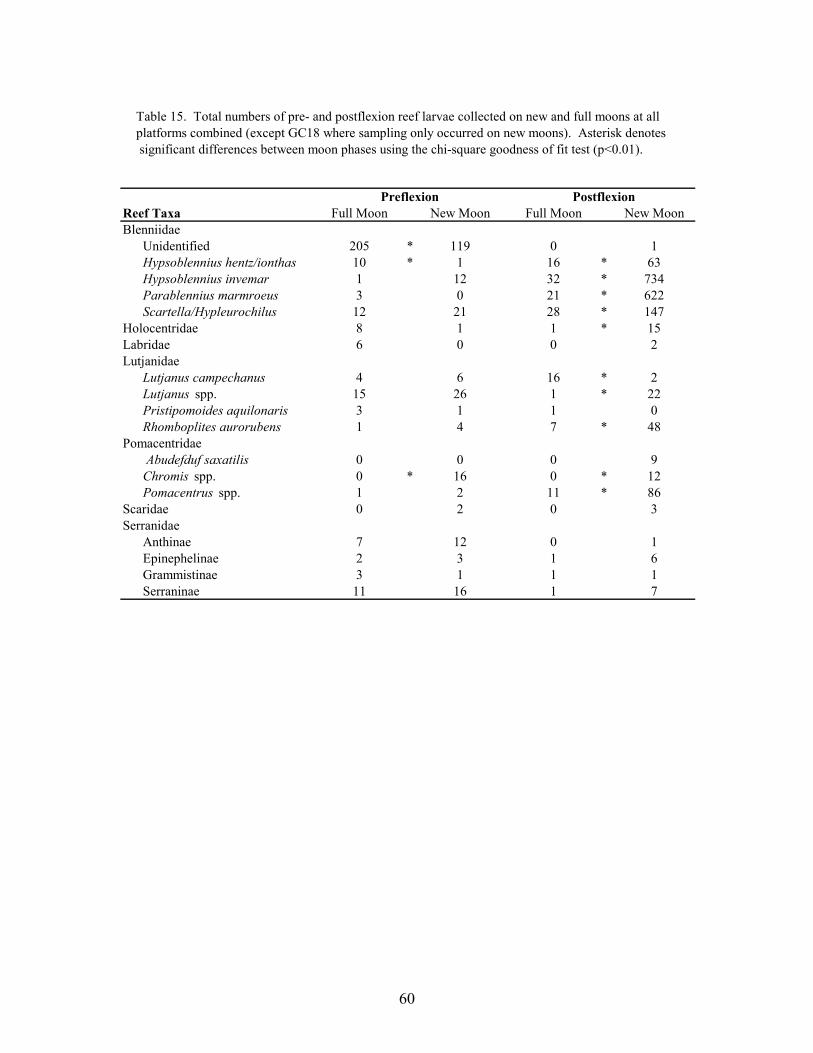
60
Table 15. Total numbers of pre- and postflexion reef larvae collected on new and full moons at all platforms combined (except GC18 where sampling only occurred on new moons). Asterisk denotes significant differences between moon phases using the chi-square goodness of fit test (p<0.01).
Preflexion PostflexionReef Taxa Full Moon New Moon Full Moon New MoonBlenniidae Unidentified 205 * 119 0 1 Hypsoblennius hentz/ionthas 10 * 1 16 * 63 Hypsoblennius invemar 1 12 32 * 734 Parablennius marmroeus 3 0 21 * 622 Scartella/Hypleurochilus 12 21 28 * 147Holocentridae 8 1 1 * 15Labridae 6 0 0 2Lutjanidae Lutjanus campechanus 4 6 16 * 2 Lutjanus spp. 15 26 1 * 22 Pristipomoides aquilonaris 3 1 1 0 Rhomboplites aurorubens 1 4 7 * 48Pomacentridae Abudefduf saxatilis 0 0 0 9 Chromis spp. 0 * 16 0 * 12 Pomacentrus spp. 1 2 11 * 86Scaridae 0 2 0 3Serranidae Anthinae 7 12 0 1 Epinephelinae 2 3 1 6 Grammistinae 3 1 1 1 Serraninae 11 16 1 7
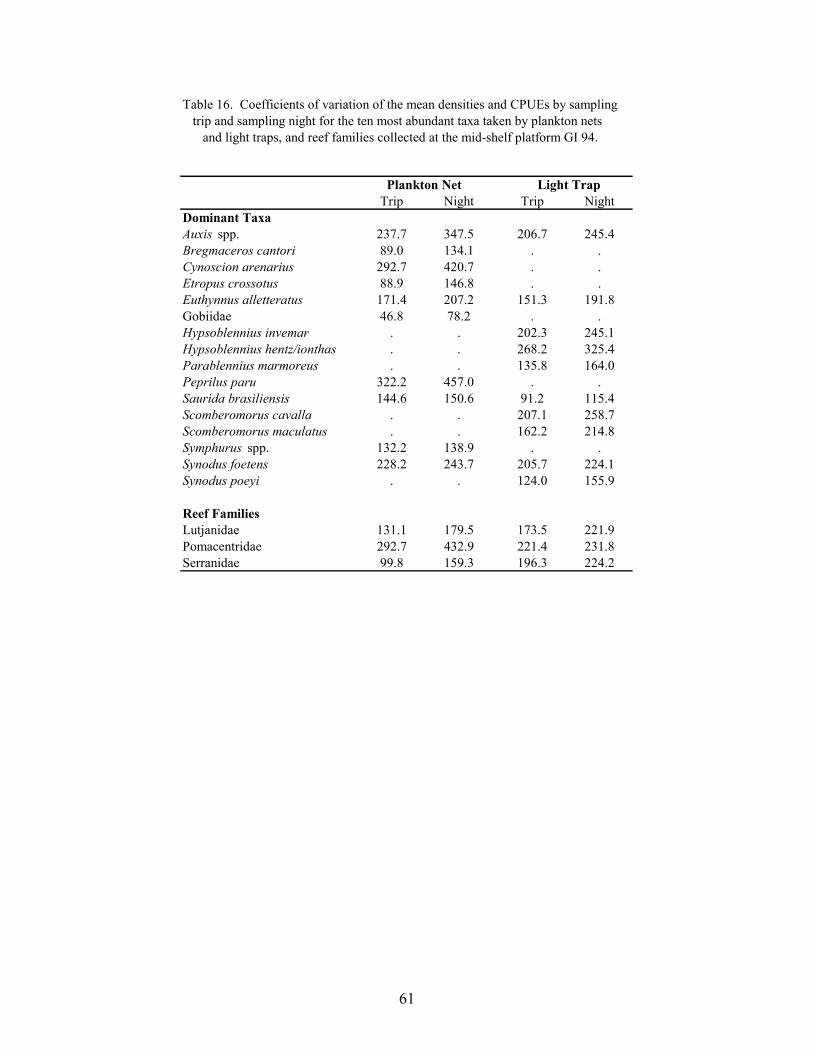
61
Table 16. Coefficients of variation of the mean densities and CPUEs by sampling trip and sampling night for the ten most abundant taxa taken by plankton nets and light traps, and reef families collected at the mid-shelf platform GI 94.
Plankton Net Light TrapTrip Night Trip Night
Dominant TaxaAuxis spp. 237.7 347.5 206.7 245.4Bregmaceros cantori 89.0 134.1 . .Cynoscion arenarius 292.7 420.7 . .Etropus crossotus 88.9 146.8 . .Euthynnus alletteratus 171.4 207.2 151.3 191.8Gobiidae 46.8 78.2 . .Hypsoblennius invemar . . 202.3 245.1Hypsoblennius hentz/ionthas . . 268.2 325.4Parablennius marmoreus . . 135.8 164.0Peprilus paru 322.2 457.0 . .Saurida brasiliensis 144.6 150.6 91.2 115.4Scomberomorus cavalla . . 207.1 258.7Scomberomorus maculatus . . 162.2 214.8Symphurus spp. 132.2 138.9 . .Synodus foetens 228.2 243.7 205.7 224.1Synodus poeyi . . 124.0 155.9
Reef FamiliesLutjanidae 131.1 179.5 173.5 221.9Pomacentridae 292.7 432.9 221.4 231.8Serranidae 99.8 159.3 196.3 224.2
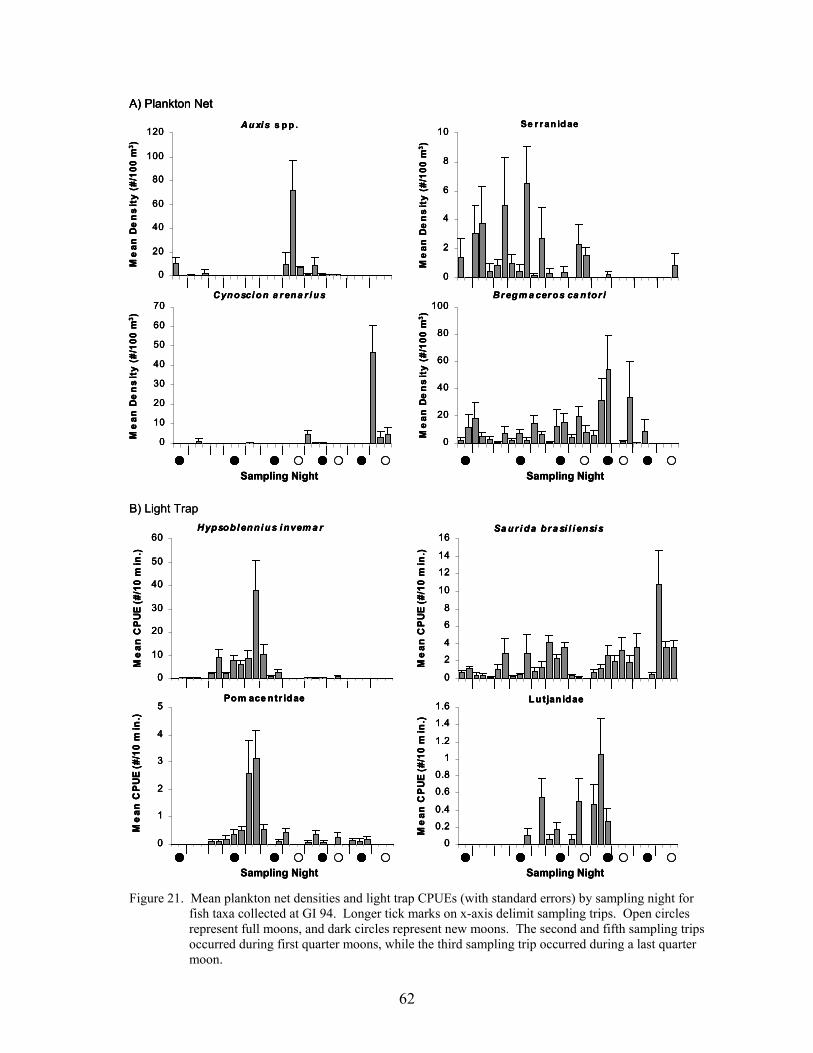
62
Figure 21. Mean plankton net densities and light trap CPUEs (with standard errors) by sampling night for fish taxa collected at GI 94. Longer tick marks on x-axis delimit sampling trips. Open circles represent full moons, and dark circles represent new moons. The second and fifth sampling trips occurred during first quarter moons, while the third sampling trip occurred during a last quarter moon.
B) Light Trap
Se r r an id ae
0
2
4
6
8
10
Me
an
De
ns
ity
(#
/10
0 m
3)
Auxis s p p .
0
20
40
60
80
100
120M
ea
n D
en
sit
y (
#/1
00
m3)
Br egm a ceros ca ntor i
0
20
40
60
80
100
Me
an
De
ns
ity
(#
/10
0 m
3)
Cynosci on a rena r i us
0
10
20
30
40
50
60
70
Me
an
De
ns
ity
(#
/10
0 m
3)
Sampling Night Sampling Night
A) Plankton Net
Hypsoblennius invem a r
0
10
20
30
40
50
60
Me
an
CP
UE
(#
/10
min
.)
Pom ace ntr idae
0
1
2
3
4
5
Me
an
CP
UE
(#
/10
min
.)
Lu tjanidae
0
0.2
0.4
0.6
0.8
1
1.2
1.4
1.6
Me
an
CP
UE
(#
/10
min
.)
Sa ur ida bra si l i ensis
0
2
4
6
8
10
12
14
16
Me
an
CP
UE
(#
/10
min
.)
Sampling Night Sampling Night
B) Light Trap
Se r r an id ae
0
2
4
6
8
10
Me
an
De
ns
ity
(#
/10
0 m
3)
Auxis s p p .
0
20
40
60
80
100
120M
ea
n D
en
sit
y (
#/1
00
m3)
Br egm a ceros ca ntor i
0
20
40
60
80
100
Me
an
De
ns
ity
(#
/10
0 m
3)
Cynosci on a rena r i us
0
10
20
30
40
50
60
70
Me
an
De
ns
ity
(#
/10
0 m
3)
Sampling Night Sampling Night
A) Plankton NetSe r r an id ae
0
2
4
6
8
10
Me
an
De
ns
ity
(#
/10
0 m
3)
Auxis s p p .
0
20
40
60
80
100
120M
ea
n D
en
sit
y (
#/1
00
m3)
Br egm a ceros ca ntor i
0
20
40
60
80
100
Me
an
De
ns
ity
(#
/10
0 m
3)
Cynosci on a rena r i us
0
10
20
30
40
50
60
70
Me
an
De
ns
ity
(#
/10
0 m
3)
Sampling Night Sampling Night
A) Plankton Net
Hypsoblennius invem a r
0
10
20
30
40
50
60
Me
an
CP
UE
(#
/10
min
.)
Pom ace ntr idae
0
1
2
3
4
5
Me
an
CP
UE
(#
/10
min
.)
Lu tjanidae
0
0.2
0.4
0.6
0.8
1
1.2
1.4
1.6
Me
an
CP
UE
(#
/10
min
.)
Sa ur ida bra si l i ensis
0
2
4
6
8
10
12
14
16
Me
an
CP
UE
(#
/10
min
.)
Sampling Night Sampling Night
Hypsoblennius invem a r
0
10
20
30
40
50
60
Me
an
CP
UE
(#
/10
min
.)
Pom ace ntr idae
0
1
2
3
4
5
Me
an
CP
UE
(#
/10
min
.)
Lu tjanidae
0
0.2
0.4
0.6
0.8
1
1.2
1.4
1.6
Me
an
CP
UE
(#
/10
min
.)
Sa ur ida bra si l i ensis
0
2
4
6
8
10
12
14
16
Me
an
CP
UE
(#
/10
min
.)
Sampling Night Sampling Night
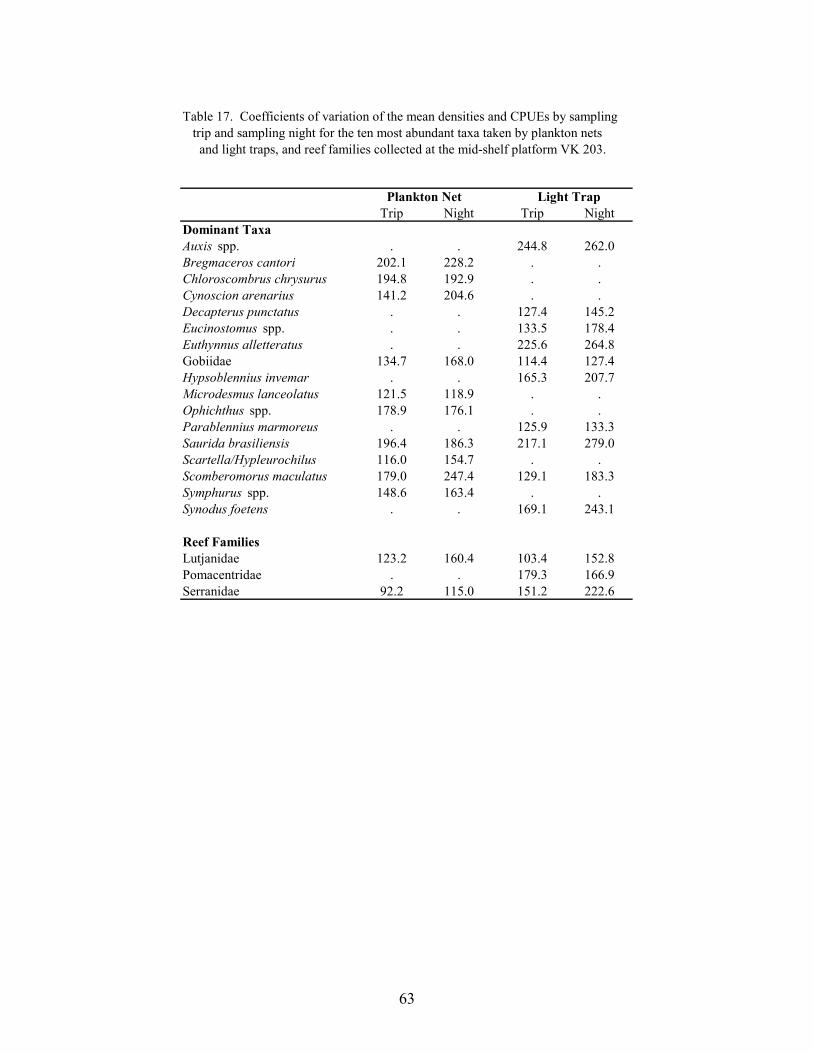
63
Table 17. Coefficients of variation of the mean densities and CPUEs by sampling trip and sampling night for the ten most abundant taxa taken by plankton nets and light traps, and reef families collected at the mid-shelf platform VK 203.
Plankton Net Light TrapTrip Night Trip Night
Dominant TaxaAuxis spp. . . 244.8 262.0Bregmaceros cantori 202.1 228.2 . .Chloroscombrus chrysurus 194.8 192.9 . .Cynoscion arenarius 141.2 204.6 . .Decapterus punctatus . . 127.4 145.2Eucinostomus spp. . . 133.5 178.4Euthynnus alletteratus . . 225.6 264.8Gobiidae 134.7 168.0 114.4 127.4Hypsoblennius invemar . . 165.3 207.7Microdesmus lanceolatus 121.5 118.9 . .Ophichthus spp. 178.9 176.1 . .Parablennius marmoreus . . 125.9 133.3Saurida brasiliensis 196.4 186.3 217.1 279.0Scartella/Hypleurochilus 116.0 154.7 . .Scomberomorus maculatus 179.0 247.4 129.1 183.3Symphurus spp. 148.6 163.4 . .Synodus foetens . . 169.1 243.1
Reef FamiliesLutjanidae 123.2 160.4 103.4 152.8Pomacentridae . . 179.3 166.9Serranidae 92.2 115.0 151.2 222.6
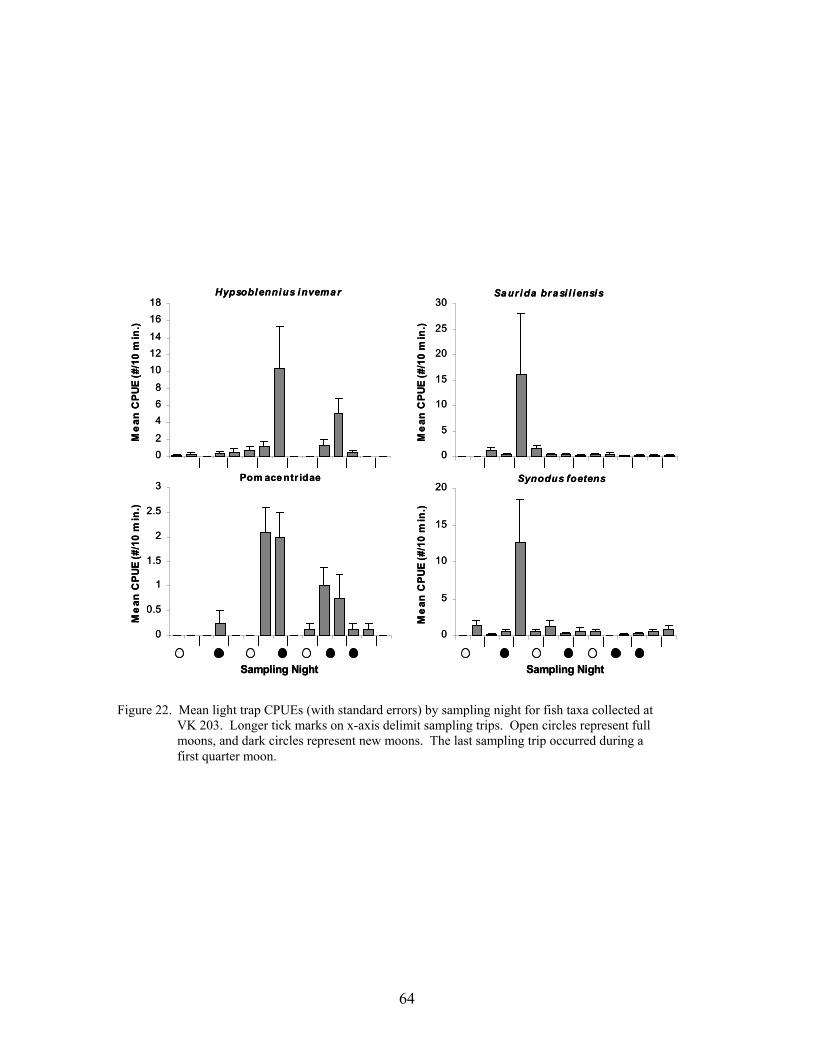
64
Hypsoblennius invemar
02
468
101214
1618
Me
an
CP
UE
(#
/10
min
.)
Pom ace ntr idae
0
0.5
1
1.5
2
2.5
3
Me
an
CP
UE
(#
/10
min
.)
Saurida brasi l iensis
0
5
10
15
20
25
30
Me
an
CP
UE
(#
/10
min
.)
Synodus foetens
0
5
10
15
20
Me
an
CP
UE
(#
/10
min
.)
Sampling Night Sampling Night
Hypsoblennius invemar
02
468
101214
1618
Me
an
CP
UE
(#
/10
min
.)
Pom ace ntr idae
0
0.5
1
1.5
2
2.5
3
Me
an
CP
UE
(#
/10
min
.)
Saurida brasi l iensis
0
5
10
15
20
25
30
Me
an
CP
UE
(#
/10
min
.)
Synodus foetens
0
5
10
15
20
Me
an
CP
UE
(#
/10
min
.)
Sampling Night Sampling Night
Figure 22. Mean light trap CPUEs (with standard errors) by sampling night for fish taxa collected at VK 203. Longer tick marks on x-axis delimit sampling trips. Open circles represent full moons, and dark circles represent new moons. The last sampling trip occurred during a first quarter moon.
65
later (two pulses combined = 88% of the total catch; Figure 22). Although it was the only taxacollected by light traps to have a CV higher among trips than among nights, Pomacentridae atVK 203 still exhibited two discrete pulses (combined = 90% of the total catch).
Pulses were also observed to coincide among taxa, particularly in light trap collections.At GI 94, the pulses of Hypsoblennius invemar and Pomacentridae (which itself consisted ofboth Pomacentrus spp. and Chromis spp.) both occurred over the same one to two night spanduring the fifth sampling trip (Figure 21). Similarly, at VK 203 H. invemar and Pomacentridaehad pulses that coincided during both the fourth and sixth sampling trips, which both occurredduring new moon phases (Figure 22). Furthermore, pulses of the synodontids Sauridabrasiliensis and Synodus foetens coincided during the third sampling trip. A similar multi-taxapulse occurred during the fourth sampling trip at MP 259, when 100% of the H. invemar andPomacentridae catch, and greater than 95% of the Holocentrus spp. and Synodus foetens totalcatch was taken.
Within-Night Variability in Plankton Net and Light Trap Catches
Mean total plankton net and light trap catches by within-night time of capture (averagedacross all sampling trips at each platform) were considerably variable, and no consistent patternswere observed among platforms (Figure 23). Peaks in mean plankton net densities ranged fromfour hours after sunset at ST 54 to ten hours at GI 94. The within-night variability in planktonnet densities mostly reflected episodic catches of clupeiform larvae. When clupeiforms wereremoved, variability was reduced and the mean densities were surprisingly uniform throughoutthe night at each platform, with the exception of GC 18 where non-clupeiform densities peakedduring the middle of the night. There were no significant differences in mean densities by hourssampled after sunset at any of the platforms. Light trap catches at ST 54 and MP 259 peakedabout 3-4 hours after sunset and gradually declined thereafter, while at other platforms CPUEspeaked later in the night (VK 203: 5-6 hours; GI 94 and GC 18: 8 hours). As in plankton nets,the within-night variability in light trap CPUEs was largely attributable to clupeiforms. Therewere no significant differences in mean CPUEs by hour after sunset, except at GC 18 (χ2 =45.68, p<0.0001, with clupeiforms; χ2 = 41.50, p<0.0001, without clupeiforms). Attempts weremade to estimate the within-night variability of the dominant taxa and reef families, however,mean densities and CPUEs were extremely variable and no notable patterns were observed.
Length-Frequency and Developmental Stages of Reef Taxa
Blenniids were the most abundant reef-associated taxa collected at platforms, and wererepresented by a wide range of sizes and developmental stages. At the inner shelf platformST 54, most of blenniids were postflexion and settlement size Hypsoblennius invemar, H.hentz/ionthas and Scartella/Hypleurochilus between 9 and 13 mm (Figure 24). A large numberof recently-hatched and preflexion unidentified blenniids were also collected. The most commonblenniids collected at the mid-shelf platform VK 203 were postflexion/settlement size H.invemar 10 to 12 mm in length. A wide range of Scartella/Hypleurochilus, from recently-hatched to settlement size, were also collected at VK 203. Blenniids were most numerous at GI94 and were dominated by H. invemar and Parablennius marmoreus, representing preflexionlarvae of 4 to 5 mm up to postflexion/settlement larvae of 23 mm. Flexion and postflexion H.
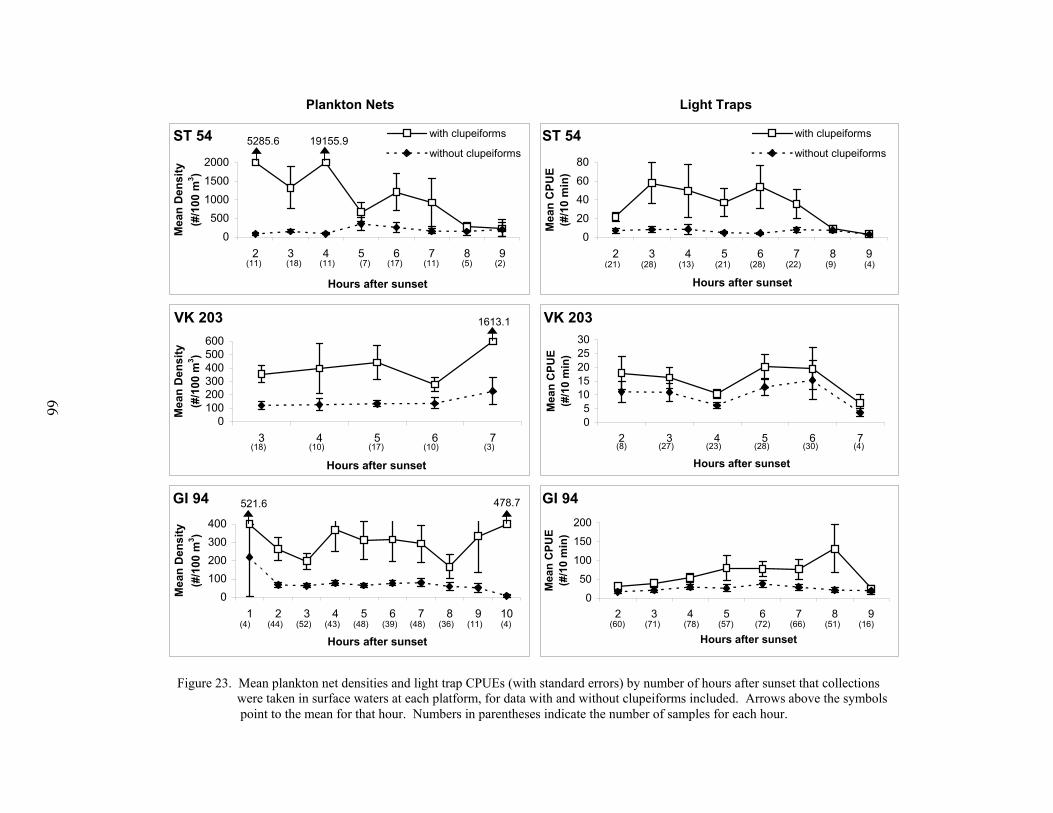
66
Plankton Nets Light Traps
VK 203
0100200300400500600
3 4 5 6 7
Hours after sunset
Mea
n D
ensi
ty
(#/1
00 m
3 )
(18) (10) (17) (10) (3)
ST 54
0500
100015002000
2 3 4 5 6 7 8 9
Hours after sunset
Mea
n D
ensi
ty
(#/1
00 m
3 )
with clupeiforms
without clupeiforms
(11) (18) (11) (7) (17) (11) (5) (2)
GI 94
0100200300400
1 2 3 4 5 6 7 8 9 10
Hours after sunset
Mea
n D
ensi
ty
(#/1
00 m
3 )
(4) (44) (52) (43) (48) (39) (48) (36) (11) (4)
ST 54
020406080
2 3 4 5 6 7 8 9
Hours after sunset
Mea
n C
PU
E
(#/1
0 m
in)
with clupeiforms
without clupeiforms
(21) (28) (13) (21) (28) (22) (9) (4)
19155.9
1613.1 VK 203
05
1015202530
2 3 4 5 6 7
Hours after sunset
Mea
n C
PU
E(#
/10
min
)
(8) (27) (23) (28) (30) (4)
GI 94
0
50
100
150
200
2 3 4 5 6 7 8 9
Hours after sunset
Mea
n C
PU
E(#
/10
min
)
(57)(78)(71)(60) (72) (66) (51) (16)
5285.6
521.6 478.7
Figure 23. Mean plankton net densities and light trap CPUEs (with standard errors) by number of hours after sunset that collections were taken in surface waters at each platform, for data with and without clupeiforms included. Arrows above the symbols point to the mean for that hour. Numbers in parentheses indicate the number of samples for each hour.
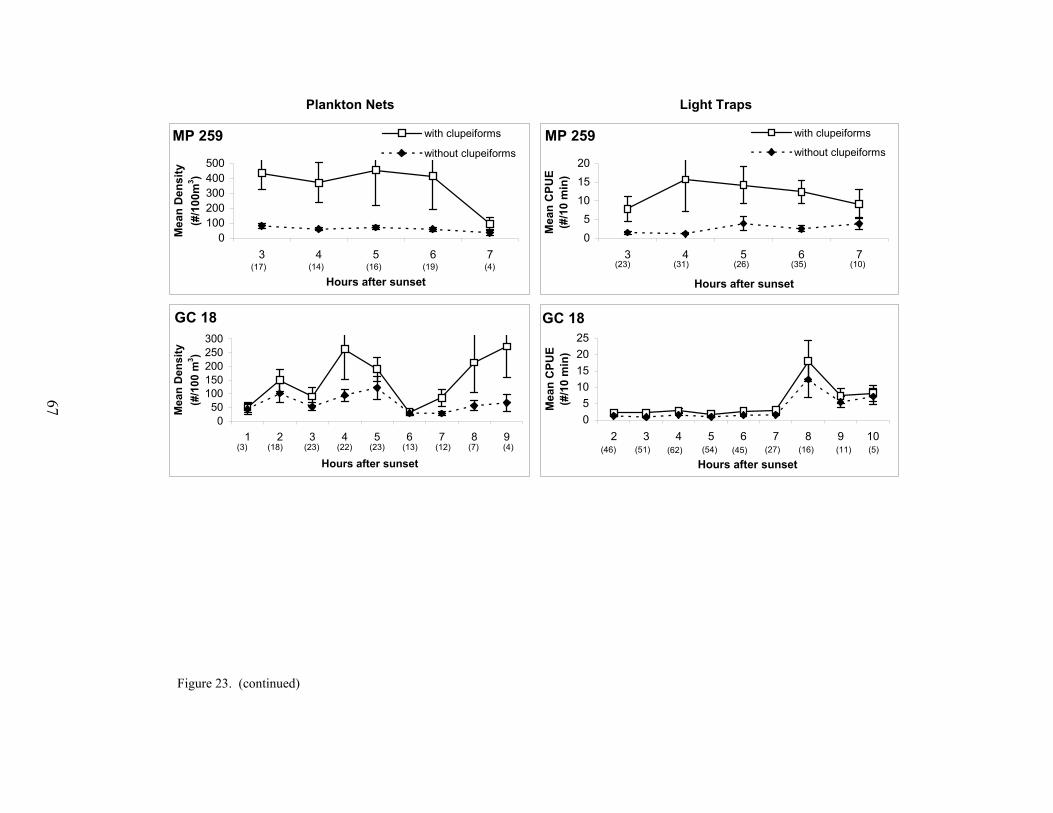
67
Figure 23. (continued)
Plankton Nets Light Traps
MP 259
0100200300400500
3 4 5 6 7
Hours after sunset
Mea
n D
ensi
ty
(#/1
00m
3 )
with clupeiforms
without clupeiforms
(17) (14) (16) (19) (4)
GC 18
050
100150200250300
1 2 3 4 5 6 7 8 9
Hours after sunset
Mea
n D
ensi
ty
(#/1
00 m
3)
(3) (18) (23) (22) (23) (13) (12) (7) (4)
MP 259
05
101520
3 4 5 6 7
Hours after sunset
Mea
n C
PU
E
(#/1
0 m
in)
with clupeiforms
without clupeiforms
(23) (31) (26) (35) (10)
GC 18
05
10152025
2 3 4 5 6 7 8 9 10
Hours after sunset
Mea
n C
PU
E(#
/10
min
)
(46) (51) (62) (54) (45) (27) (16) (11) (5)
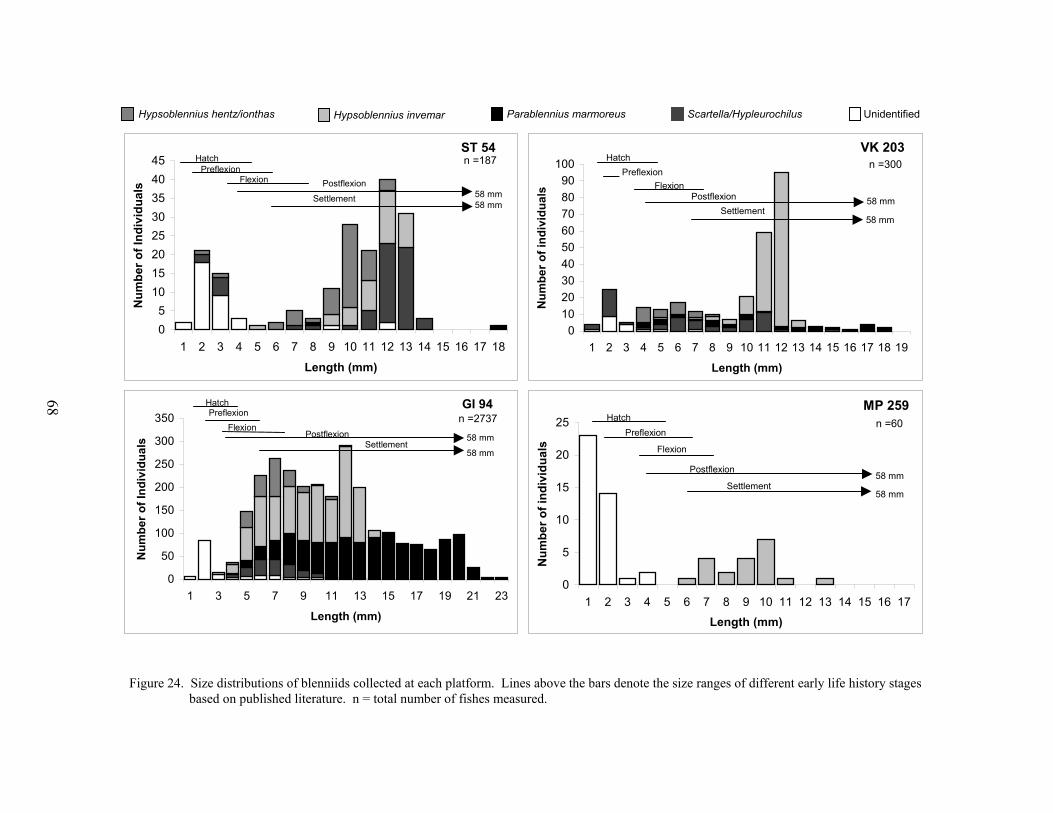
Figure 24. Size distributions of blenniids collected at each platform. Lines above the bars denote the size ranges of different early life history stages based on published literature. n = total number of fishes measured.
68
ST 54
05
1015202530354045
1 2 3 4 5 6 7 8 9 10 11 12 13 14 15 16 17 18
Length (mm)
Nu
mb
er o
f In
div
idu
als
HatchPreflexion
Flexion PostflexionSettlement
58 mm58 mm
n =187VK 203
0102030405060708090
100
1 2 3 4 5 6 7 8 9 10 11 12 13 14 15 16 17 18 19
Length (mm)
Nu
mb
er o
f in
div
idu
als
58 mm
PreflexionHatch
FlexionPostflexion
Settlement58 mm
n =300
GI 94
0
50
100
150
200
250
300
350
1 3 5 7 9 11 13 15 17 19 21 23
Length (mm)
Nu
mb
er o
f In
div
idu
als
HatchPreflexion
FlexionPostflexion
Settlement58 mm
58 mm
n =2737MP 259
0
5
10
15
20
25
1 2 3 4 5 6 7 8 9 10 11 12 13 14 15 16 17Length (mm)
Nu
mb
er o
f in
div
idu
als
58 mm
58 mm
HatchPreflexion
Flexion
Postflexion
Settlement
n =60
Hypsoblennius hentz/ionthas Hypsoblennius invemar Parablennius marmoreus Scartella/Hypleurochilus Unidentified
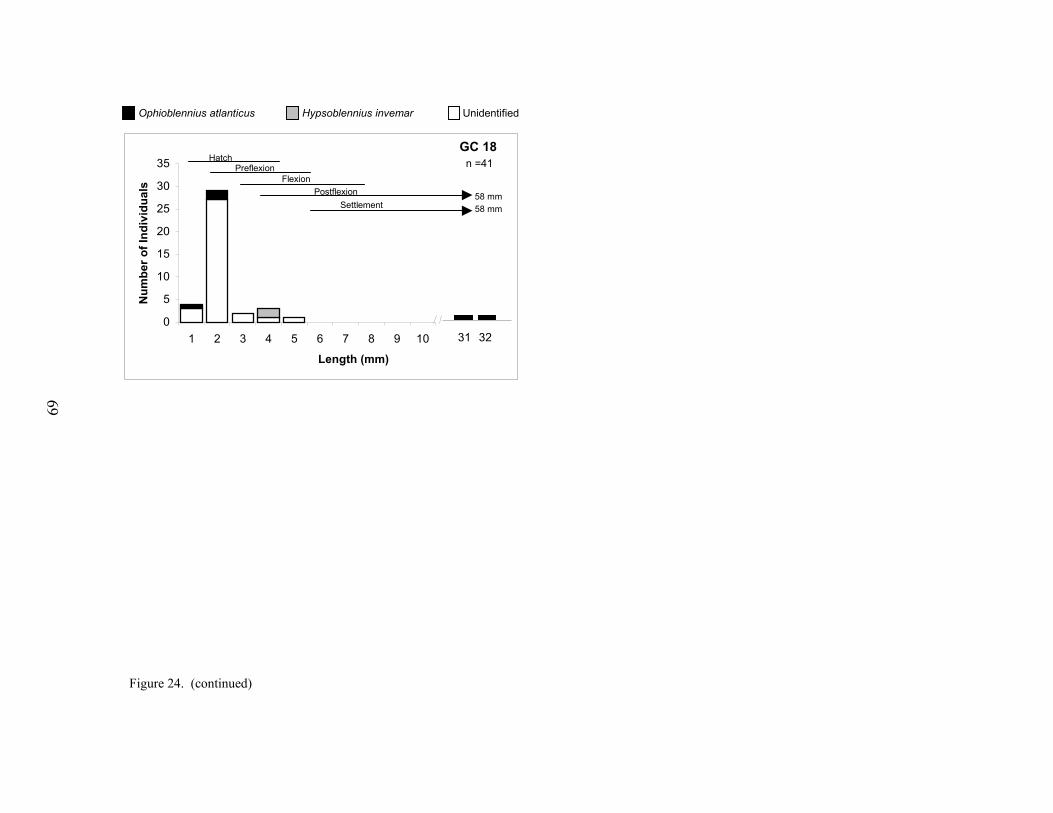
Figure 24. (continued)
69
GC 18
0
5
10
15
20
25
30
35
1 2 3 4 5 6 7 8 9 10
Length (mm)
Nu
mb
er o
f In
div
idu
als
HatchPreflexion
FlexionPostflexion
Settlement58 mm58 mm
31 32
n =41
Ophioblennius atlanticus Hypsoblennius invemar Unidentified
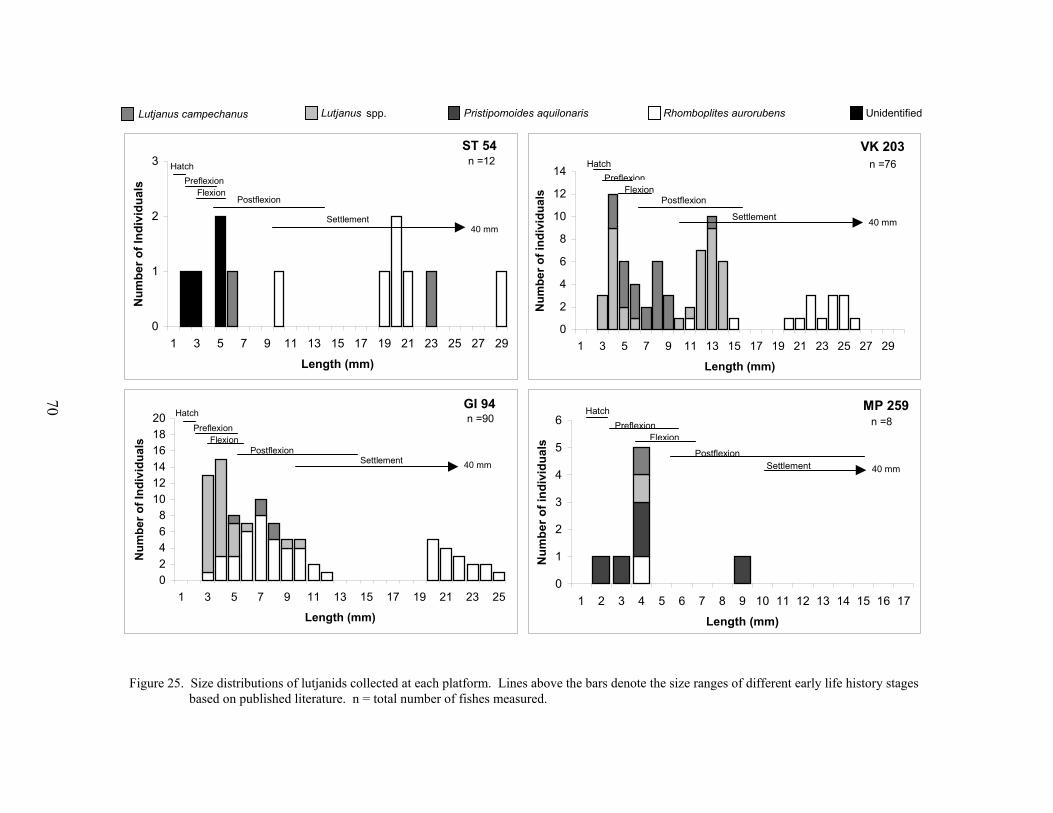
Figure 25. Size distributions of lutjanids collected at each platform. Lines above the bars denote the size ranges of different early life history stages based on published literature. n = total number of fishes measured.
70
ST 54
0
1
2
3
1 3 5 7 9 11 13 15 17 19 21 23 25 27 29
Length (mm)
Nu
mb
er o
f In
div
idu
als
HatchPreflexion
FlexionPostflexion
Settlement40 mm
n =12
GI 94
02468
101214161820
1 3 5 7 9 11 13 15 17 19 21 23 25
Length (mm)
Nu
mb
er o
f In
div
idu
als
HatchPreflexion
FlexionPostflexion
Settlement 40 mm
n =90MP 259
0
1
2
3
4
5
6
1 2 3 4 5 6 7 8 9 10 11 12 13 14 15 16 17
Length (mm)
Nu
mb
er o
f in
div
idu
als
HatchPreflexion
Flexion
PostflexionSettlement
n =8
40 mm
VK 203
0
2
4
6
8
10
12
14
1 3 5 7 9 11 13 15 17 19 21 23 25 27 29
Length (mm)
Nu
mb
er o
f in
div
idu
als
HatchPreflexion
FlexionPostflexion
Settlement
n =76
40 mm
Lutjanus campechanus Lutjanus spp. UnidentifiedRhomboplites aurorubensPristipomoides aquilonaris
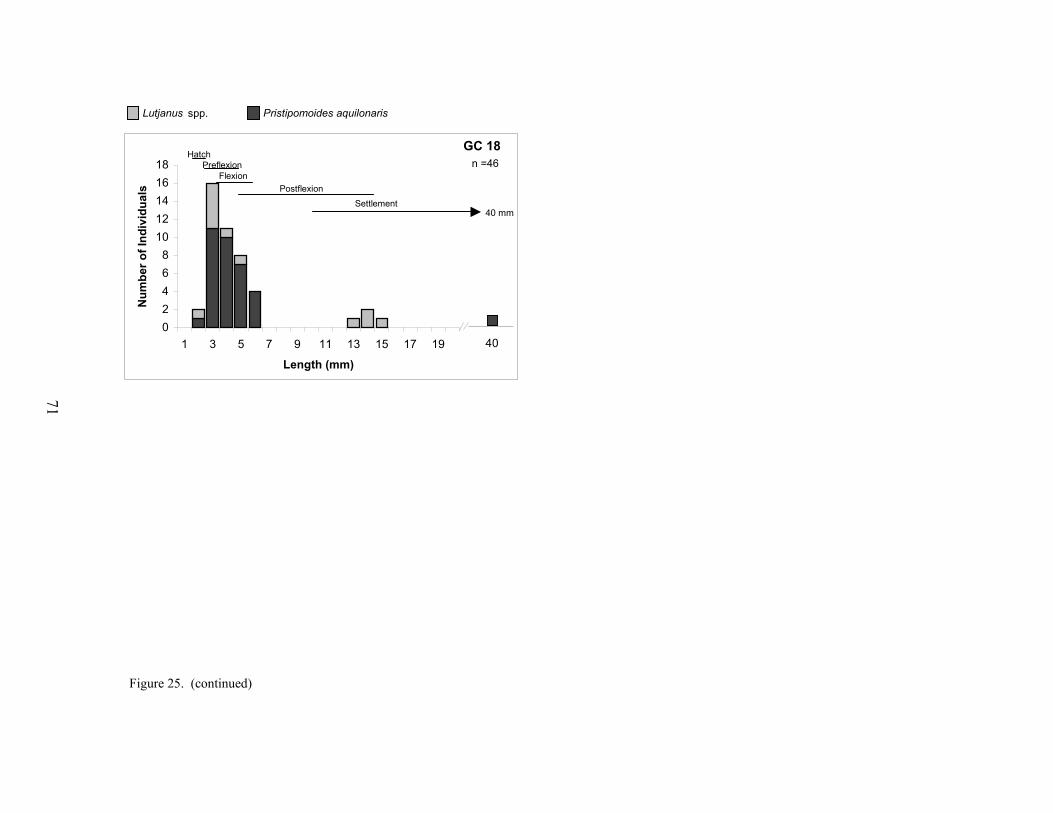
Figure 25. (continued)
71
GC 18
02468
1012141618
1 3 5 7 9 11 13 15 17 19
Length (mm)
Nu
mb
er o
f In
div
idu
als
40
HatchPreflexion
FlexionPostflexion
Settlement
n =46
40 mm
Lutjanus spp. Pristipomoides aquilonaris
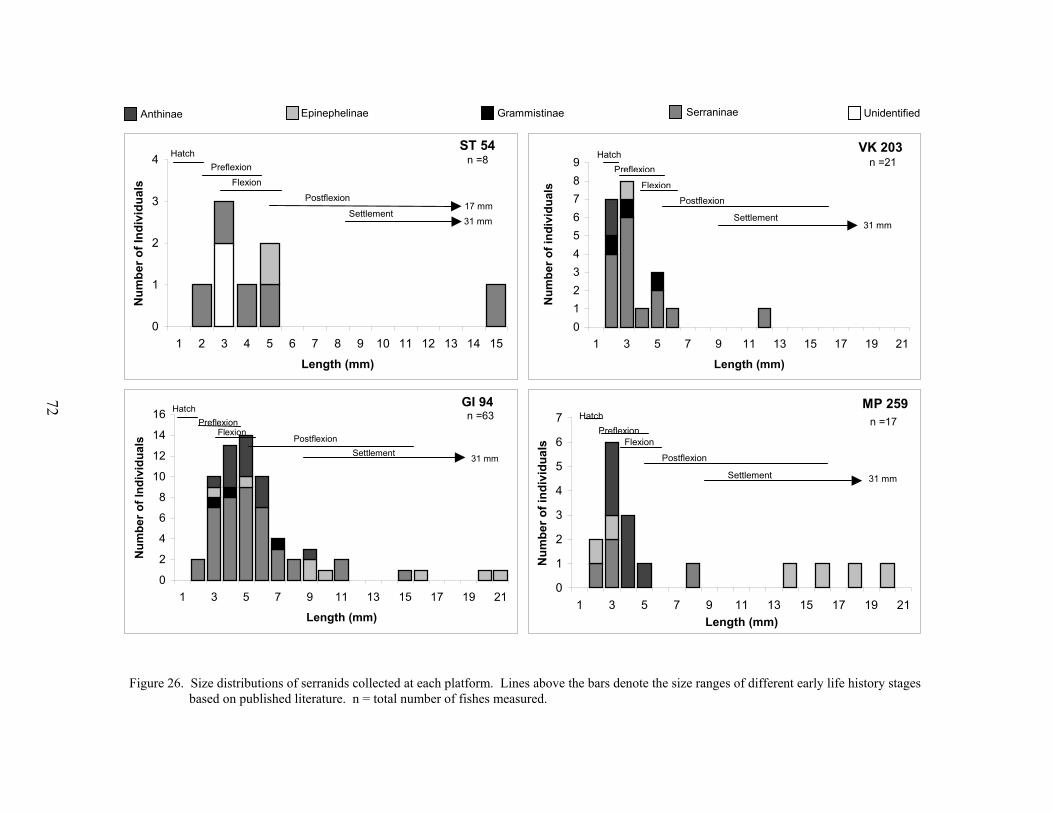
Figure 26. Size distributions of serranids collected at each platform. Lines above the bars denote the size ranges of different early life history stages based on published literature. n = total number of fishes measured.
72
ST 54
0
1
2
3
4
1 2 3 4 5 6 7 8 9 10 11 12 13 14 15
Length (mm)
Nu
mb
er o
f In
div
idu
als
HatchPreflexion
FlexionPostflexion
Settlement31 mm17 mm
n =8VK 203
0123456789
1 3 5 7 9 11 13 15 17 19 21
Length (mm)
Nu
mb
er o
f in
div
idu
als
HatchPreflexion
FlexionPostflexion
Settlement
n =21
31 mm
GI 94
0
2
4
6
8
10
12
14
16
1 3 5 7 9 11 13 15 17 19 21
Length (mm)
Nu
mb
er o
f In
div
idu
als
HatchPreflexion
FlexionPostflexion
Settlement 31 mm
n =63MP 259
0
1
2
3
4
5
6
7
1 3 5 7 9 11 13 15 17 19 21Length (mm)
Nu
mb
er o
f in
div
idu
als
HatchPreflexion
Flexion
Postflexion
Settlement
n =17
31 mm
EpinephelinaeAnthinae Grammistinae Serraninae Unidentified
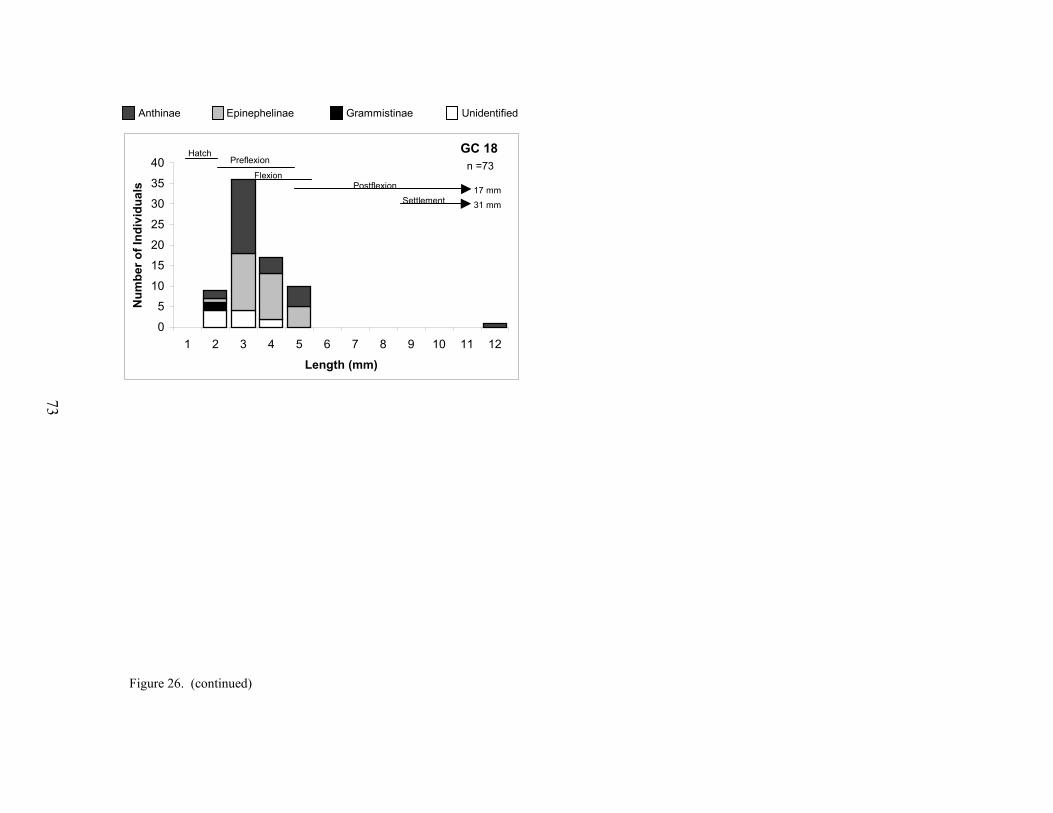
Figure 26. (continued)
73
GC 18
0
5
10
15
20
25
30
35
40
1 2 3 4 5 6 7 8 9 10 11 12
Length (mm)
Nu
mb
er o
f In
div
idu
als
HatchPreflexion
FlexionPostflexion
Settlement17 mm31 mm
n =73
Anthinae Epinephelinae Grammistinae Unidentified
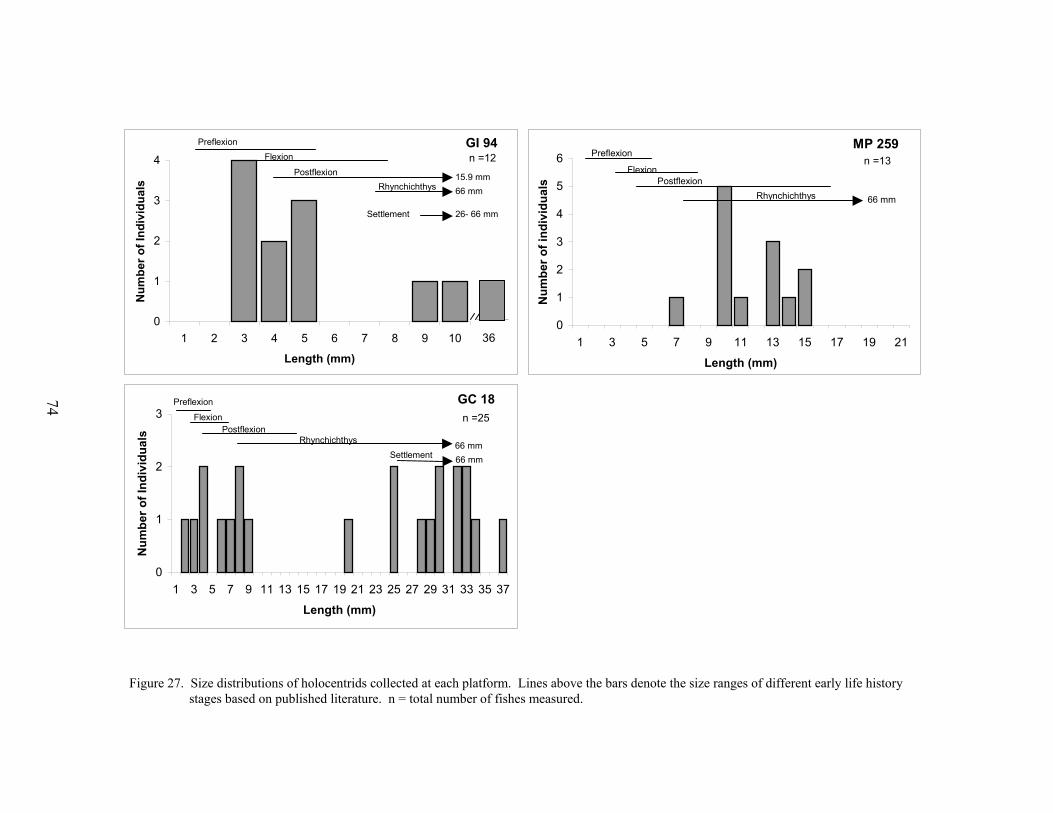
74
Figure 27. Size distributions of holocentrids collected at each platform. Lines above the bars denote the size ranges of different early life history stages based on published literature. n = total number of fishes measured.
GI 94
0
1
2
3
4
1 2 3 4 5 6 7 8 9 10
Length (mm)
Nu
mb
er o
f In
div
idu
als
PreflexionFlexion
PostflexionRhynchichthys
Settlement
15.9 mm66 mm
26- 66 mm
36
n =12MP 259
0
1
2
3
4
5
6
1 3 5 7 9 11 13 15 17 19 21
Length (mm)
Nu
mb
er o
f in
div
idu
als
Preflexion
FlexionPostflexion
n =13
Rhynchichthys 66 mm
GC 18
0
1
2
3
1 3 5 7 9 11 13 15 17 19 21 23 25 27 29 31 33 35 37
Length (mm)
Nu
mb
er o
f In
div
idu
als
Preflexion
FlexionPostflexion
Rhynchichthys 66 mmSettlement 66 mm
n =25
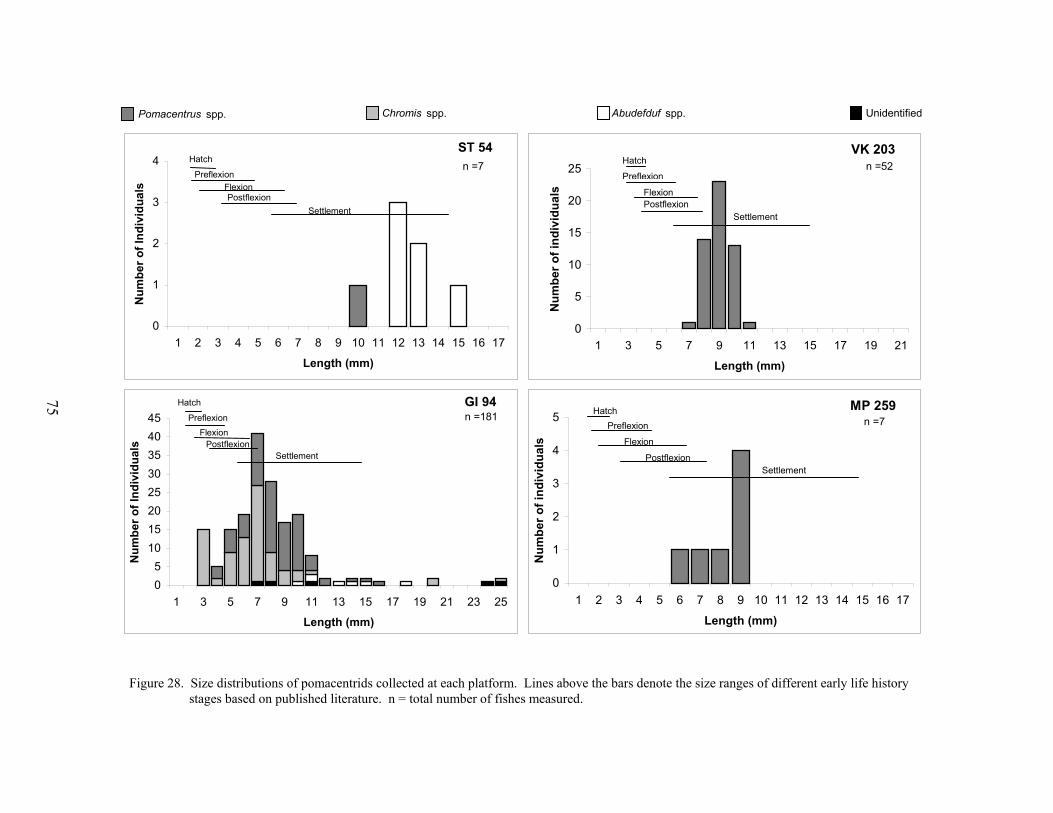
75
Figure 28. Size distributions of pomacentrids collected at each platform. Lines above the bars denote the size ranges of different early life history stages based on published literature. n = total number of fishes measured.
VK 203
0
5
10
15
20
25
1 3 5 7 9 11 13 15 17 19 21
Length (mm)
Nu
mb
er o
f in
div
idu
als
Hatch
Preflexion
FlexionPostflexion
Settlement
n =52
GI 94
05
1015202530354045
1 3 5 7 9 11 13 15 17 19 21 23 25
Length (mm)
Nu
mb
er o
f In
div
idu
als
Hatch
PreflexionFlexion
PostflexionSettlement
n =181MP 259
0
1
2
3
4
5
1 2 3 4 5 6 7 8 9 10 11 12 13 14 15 16 17
Length (mm)
Nu
mb
er o
f in
div
idu
als
HatchPreflexion
Flexion
PostflexionSettlement
n =7
ST 54
0
1
2
3
4
1 2 3 4 5 6 7 8 9 10 11 12 13 14 15 16 17
Length (mm)
Nu
mb
er o
f In
div
idu
als
Hatch
PreflexionFlexionPostflexion
Settlement
n =7
Pomacentrus spp. Chromis spp. Abudefduf spp. Unidentified
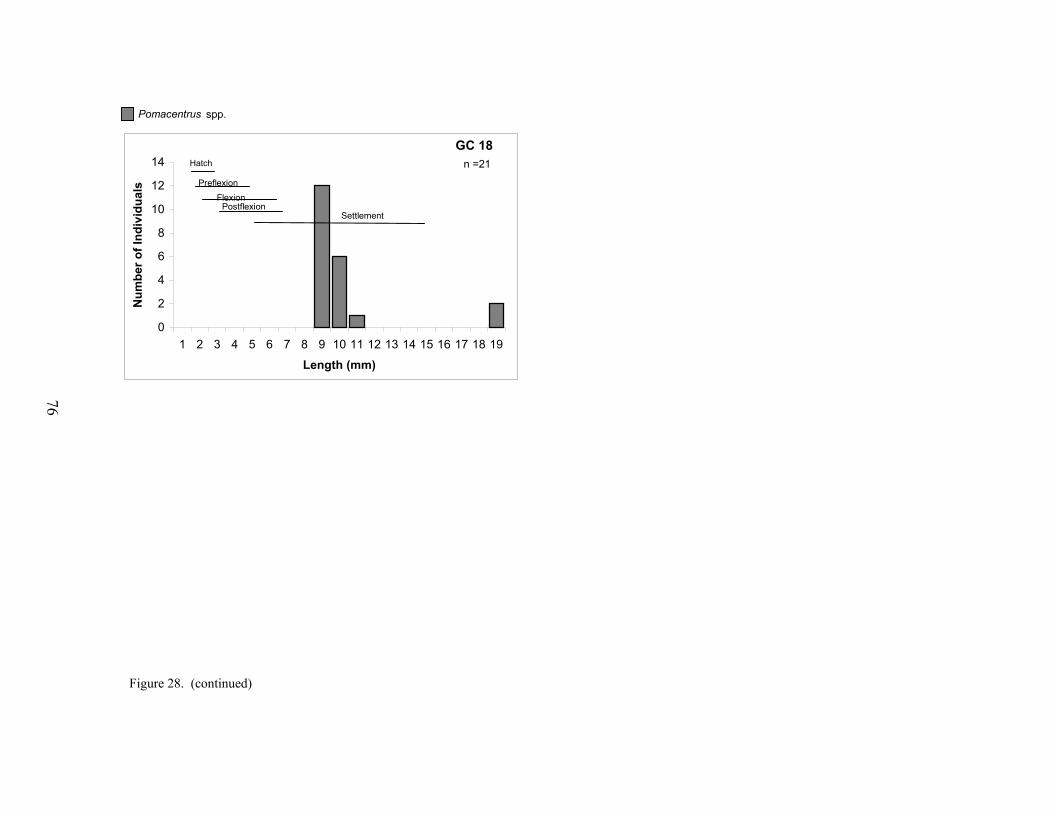
Figure 28. (continued)
76
GC 18
0
2
4
6
8
10
12
14
1 2 3 4 5 6 7 8 9 10 11 12 13 14 15 16 17 18 19
Length (mm)
Nu
mb
er o
f In
div
idu
als
Hatch
PreflexionFlexion
PostflexionSettlement
n =21
Pomacentrus spp.
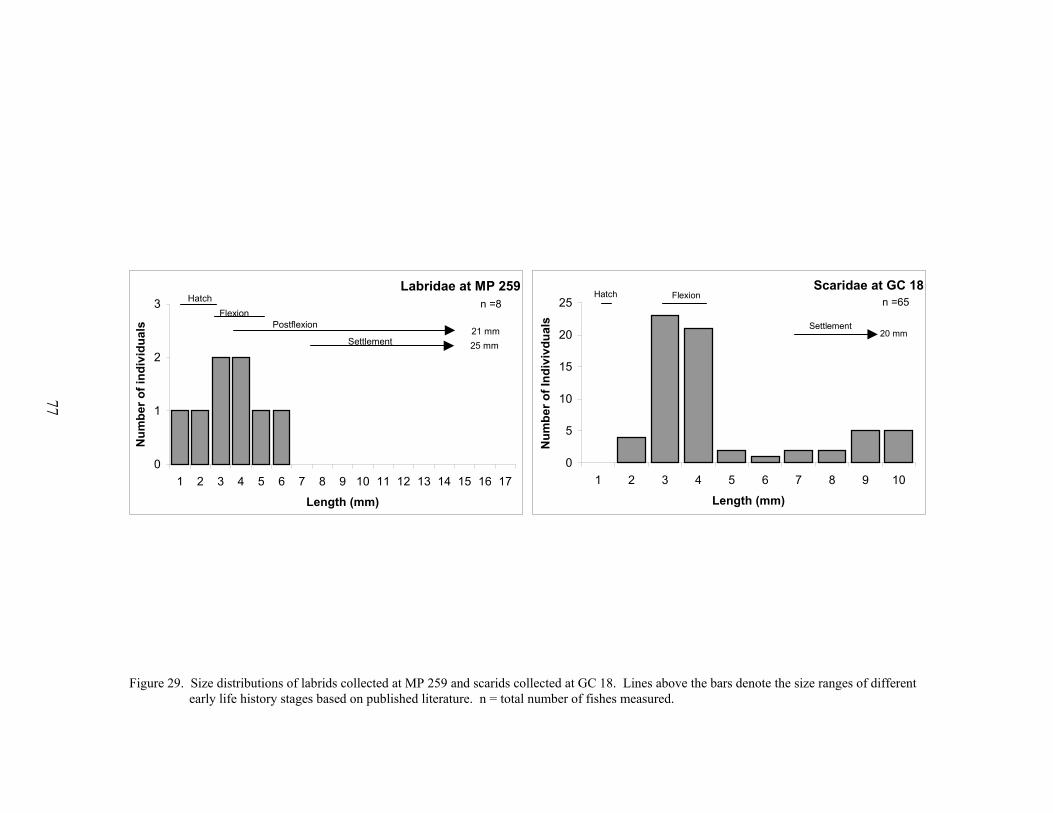
Figure 29. Size distributions of labrids collected at MP 259 and scarids collected at GC 18. Lines above the bars denote the size ranges of different early life history stages based on published literature. n = total number of fishes measured.
77
Scaridae at GC 18
0
5
10
15
20
25
1 2 3 4 5 6 7 8 9 10
Length (mm)
Nu
mb
er o
f In
div
ivd
ual
s
Hatch Flexion
Settlement20 mm
n =65Labridae at MP 259
0
1
2
3
1 2 3 4 5 6 7 8 9 10 11 12 13 14 15 16 17
Length (mm)
Nu
mb
er o
f in
div
idu
als
HatchFlexion
Postflexion
Settlement
n =8
21 mm25 mm
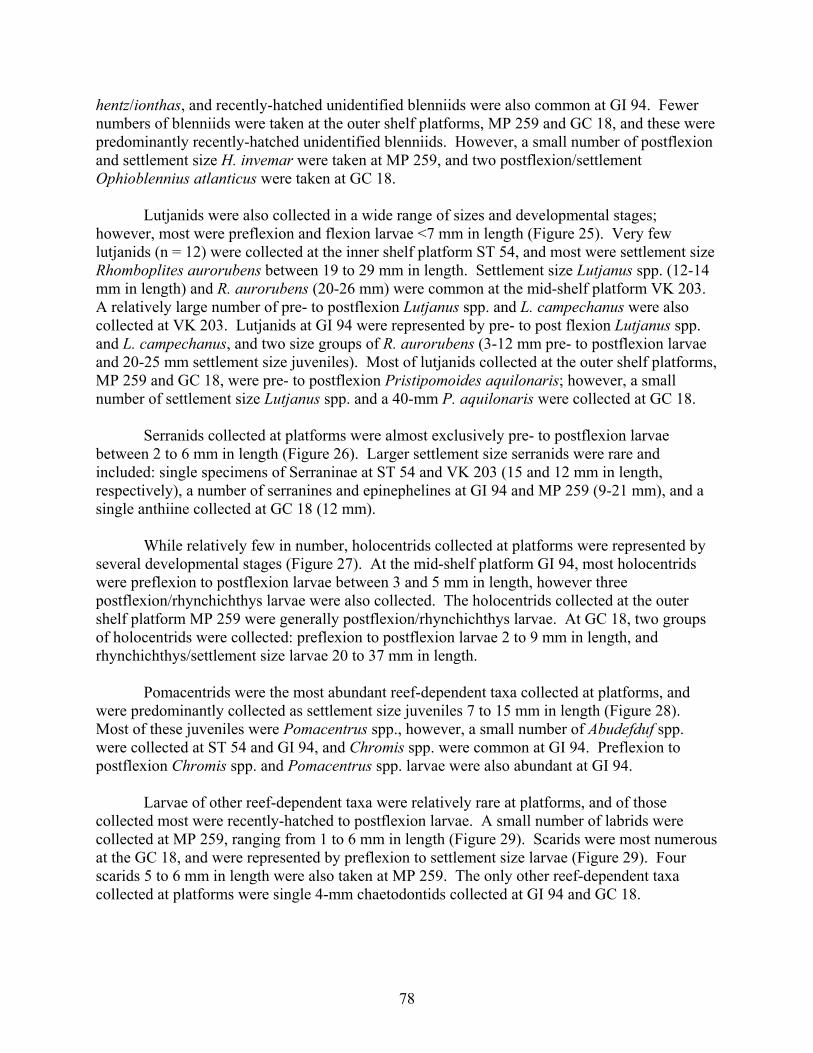
78
hentz/ionthas, and recently-hatched unidentified blenniids were also common at GI 94. Fewernumbers of blenniids were taken at the outer shelf platforms, MP 259 and GC 18, and these werepredominantly recently-hatched unidentified blenniids. However, a small number of postflexionand settlement size H. invemar were taken at MP 259, and two postflexion/settlementOphioblennius atlanticus were taken at GC 18.
Lutjanids were also collected in a wide range of sizes and developmental stages;however, most were preflexion and flexion larvae <7 mm in length (Figure 25). Very fewlutjanids (n = 12) were collected at the inner shelf platform ST 54, and most were settlement sizeRhomboplites aurorubens between 19 to 29 mm in length. Settlement size Lutjanus spp. (12-14mm in length) and R. aurorubens (20-26 mm) were common at the mid-shelf platform VK 203.A relatively large number of pre- to postflexion Lutjanus spp. and L. campechanus were alsocollected at VK 203. Lutjanids at GI 94 were represented by pre- to post flexion Lutjanus spp.and L. campechanus, and two size groups of R. aurorubens (3-12 mm pre- to postflexion larvaeand 20-25 mm settlement size juveniles). Most of lutjanids collected at the outer shelf platforms,MP 259 and GC 18, were pre- to postflexion Pristipomoides aquilonaris; however, a smallnumber of settlement size Lutjanus spp. and a 40-mm P. aquilonaris were collected at GC 18.
Serranids collected at platforms were almost exclusively pre- to postflexion larvaebetween 2 to 6 mm in length (Figure 26). Larger settlement size serranids were rare andincluded: single specimens of Serraninae at ST 54 and VK 203 (15 and 12 mm in length,respectively), a number of serranines and epinephelines at GI 94 and MP 259 (9-21 mm), and asingle anthiine collected at GC 18 (12 mm).
While relatively few in number, holocentrids collected at platforms were represented byseveral developmental stages (Figure 27). At the mid-shelf platform GI 94, most holocentridswere preflexion to postflexion larvae between 3 and 5 mm in length, however threepostflexion/rhynchichthys larvae were also collected. The holocentrids collected at the outershelf platform MP 259 were generally postflexion/rhynchichthys larvae. At GC 18, two groupsof holocentrids were collected: preflexion to postflexion larvae 2 to 9 mm in length, andrhynchichthys/settlement size larvae 20 to 37 mm in length.
Pomacentrids were the most abundant reef-dependent taxa collected at platforms, andwere predominantly collected as settlement size juveniles 7 to 15 mm in length (Figure 28).Most of these juveniles were Pomacentrus spp., however, a small number of Abudefduf spp.were collected at ST 54 and GI 94, and Chromis spp. were common at GI 94. Preflexion topostflexion Chromis spp. and Pomacentrus spp. larvae were also abundant at GI 94.
Larvae of other reef-dependent taxa were relatively rare at platforms, and of thosecollected most were recently-hatched to postflexion larvae. A small number of labrids werecollected at MP 259, ranging from 1 to 6 mm in length (Figure 29). Scarids were most numerousat the GC 18, and were represented by preflexion to settlement size larvae (Figure 29). Fourscarids 5 to 6 mm in length were also taken at MP 259. The only other reef-dependent taxacollected at platforms were single 4-mm chaetodontids collected at GI 94 and GC 18.
79
Environmental Variables and Larval and Juvenile Fish Abundances
Salinity, temperature, turbidity, and microzooplankton biomass all were influential indescribing trends in the abundances of the top 15 dominant taxa and reef fish families at theouter shelf platform MP 259. For plankton net collections, densities of Auxis spp., Euthynnusalletteratus and Symphurus spp. were positively associated with the first environmentalcanonical variate, which was primarily influenced by temperature (Table 18). Bregmaceroscantori and Myctophidae were negatively associated with the first environmental variate.Densities of Scomberomorus maculatus were positively associated with the secondenvironmental variate, which was positively influenced by turbidity and microzooplanktonbiomass. Myctophidae and Serranidae densities were positively associated with the thirdenvironmental variate, which was positively correlated with salinity and negatively correlatedwith temperature and turbidity. Within light trap collections, Decapterus punctatus, Holocentrusspp., Hypsoblennius invemar, Pomacentrus spp., and Synodus foetens were positively associatedwith the first environmental variate, which was positively correlated with salinity and negativelycorrelated with turbidity and microzooplankton biomass (Table 19). Chloroscombrus chrysuruswas negatively associated with the second environmental variate, which was positivelycorrelated with salinity and negatively correlated with temperature.
Salinity and microzooplankton biomass were the most influential environmental variablesin describing trends in larval and juvenile fish abundance at the mid-shelf platform VK 203. Inplankton net collections, densities of Microdesmus lanceolatus and Sphyraena borealis werenegatively correlated with the first environmental canonical variate, which was positivelyinfluenced by salinity and microzooplankton biomass (Table 20). Etropus crossotus andSerranidae were positively associated and Scartella/Hypleurochilus was negatively associatedwith the second environmental, which was positively correlated with microzooplankton biomassand negatively correlated with temperature. Bregmaceros cantori, E. crossotus, Sauridabrasiliensis, Scomberomorus maculatus, and Symphurus spp. were positively associated with thethird environmental variate, which was positively correlated with suspended solids andmicrozooplankton biomass, and negatively correlated with salinity. For light trap collections,Auxis spp., Caranx crysos and Euthynnus alletteratus were positively associated, andHypsoblennius invemar and Pomacentrus spp. were negatively associated with the firstenvironmental variate, which was positively correlated with salinity (Table 21). Scomberomorusmaculatus was positively associated, and H. invemar, Pomacentrus spp. and Lutjanidae werenegatively associated with the second environmental variate, which was positively correlatedwith microzooplankton biomass.
Relationship Between Water Current Speed and Light Trap CPUE
Mean light trap CPUEs, from MP 259 and VK 203 combined, decreased with increasingwater current speed (Figure 30). Highest mean light trap catches (>20 fish/10 min.) were atcurrent speeds less than 30 cm s-1, with or without clupeiforms included. CPUEs at currentspeeds above 30 cm s-1 were consistently less than 10 fish/10 min., although this observation issomewhat limited by the low number of samples at these current speeds.
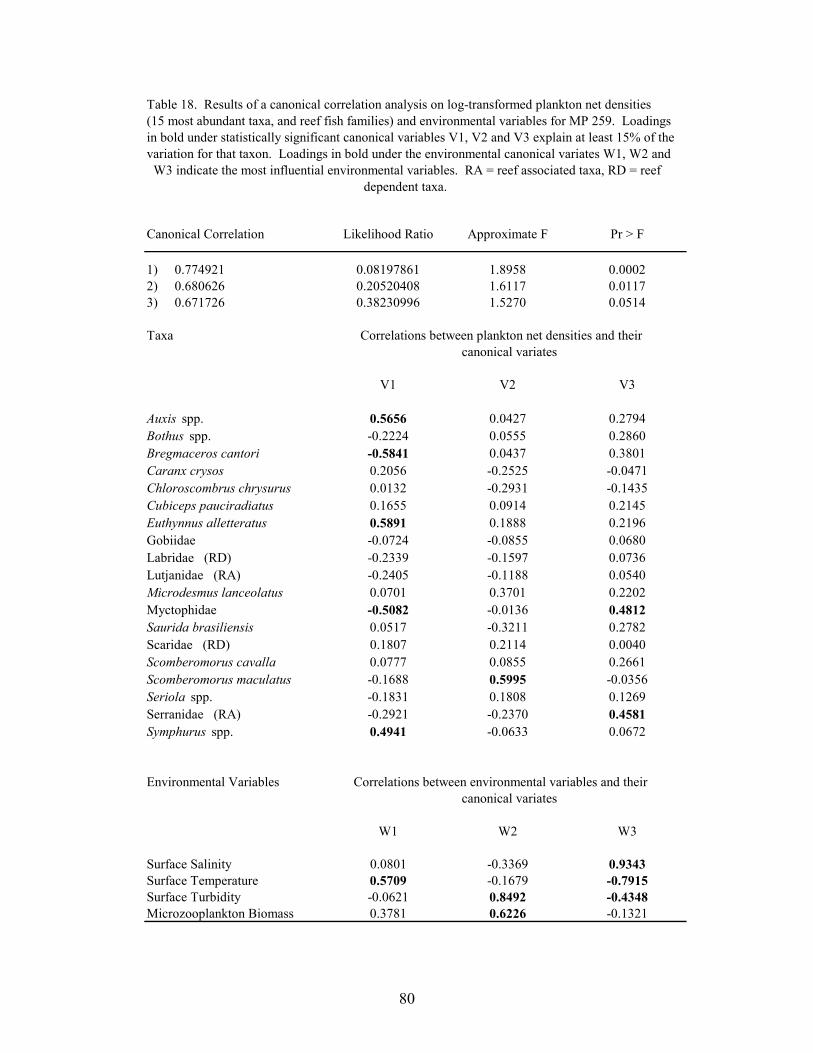
80
Table 18. Results of a canonical correlation analysis on log-transformed plankton net densities(15 most abundant taxa, and reef fish families) and environmental variables for MP 259. Loadings in bold under statistically significant canonical variables V1, V2 and V3 explain at least 15% of thevariation for that taxon. Loadings in bold under the environmental canonical variates W1, W2 and W3 indicate the most influential environmental variables. RA = reef associated taxa, RD = reef
dependent taxa.
Canonical Correlation Likelihood Ratio Approximate F Pr > F
1) 0.774921 0.08197861 1.8958 0.00022) 0.680626 0.20520408 1.6117 0.01173) 0.671726 0.38230996 1.5270 0.0514
Taxa Correlations between plankton net densities and their canonical variates
V1 V2 V3
Auxis spp. 0.5656 0.0427 0.2794Bothus spp. -0.2224 0.0555 0.2860Bregmaceros cantori -0.5841 0.0437 0.3801Caranx crysos 0.2056 -0.2525 -0.0471Chloroscombrus chrysurus 0.0132 -0.2931 -0.1435Cubiceps pauciradiatus 0.1655 0.0914 0.2145Euthynnus alletteratus 0.5891 0.1888 0.2196Gobiidae -0.0724 -0.0855 0.0680Labridae (RD) -0.2339 -0.1597 0.0736Lutjanidae (RA) -0.2405 -0.1188 0.0540Microdesmus lanceolatus 0.0701 0.3701 0.2202Myctophidae -0.5082 -0.0136 0.4812Saurida brasiliensis 0.0517 -0.3211 0.2782Scaridae (RD) 0.1807 0.2114 0.0040Scomberomorus cavalla 0.0777 0.0855 0.2661Scomberomorus maculatus -0.1688 0.5995 -0.0356Seriola spp. -0.1831 0.1808 0.1269Serranidae (RA) -0.2921 -0.2370 0.4581Symphurus spp. 0.4941 -0.0633 0.0672
Environmental Variables Correlations between environmental variables and their canonical variates
W1 W2 W3
Surface Salinity 0.0801 -0.3369 0.9343Surface Temperature 0.5709 -0.1679 -0.7915Surface Turbidity -0.0621 0.8492 -0.4348Microzooplankton Biomass 0.3781 0.6226 -0.1321
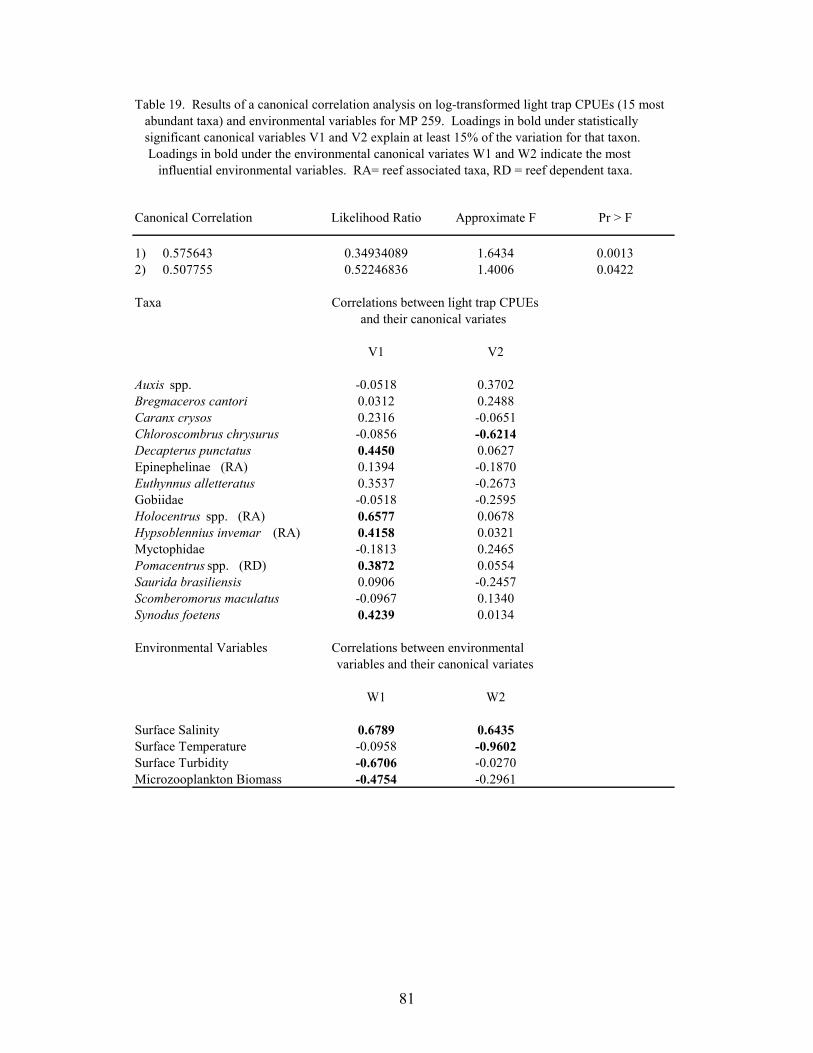
81
Table 19. Results of a canonical correlation analysis on log-transformed light trap CPUEs (15 most abundant taxa) and environmental variables for MP 259. Loadings in bold under statistically significant canonical variables V1 and V2 explain at least 15% of the variation for that taxon. Loadings in bold under the environmental canonical variates W1 and W2 indicate the most influential environmental variables. RA= reef associated taxa, RD = reef dependent taxa.
Canonical Correlation Likelihood Ratio Approximate F Pr > F
1) 0.575643 0.34934089 1.6434 0.00132) 0.507755 0.52246836 1.4006 0.0422
Taxa Correlations between light trap CPUEs and their canonical variates
V1 V2
Auxis spp. -0.0518 0.3702Bregmaceros cantori 0.0312 0.2488Caranx crysos 0.2316 -0.0651Chloroscombrus chrysurus -0.0856 -0.6214Decapterus punctatus 0.4450 0.0627Epinephelinae (RA) 0.1394 -0.1870Euthynnus alletteratus 0.3537 -0.2673Gobiidae -0.0518 -0.2595Holocentrus spp. (RA) 0.6577 0.0678Hypsoblennius invemar (RA) 0.4158 0.0321Myctophidae -0.1813 0.2465Pomacentrus spp. (RD) 0.3872 0.0554Saurida brasiliensis 0.0906 -0.2457Scomberomorus maculatus -0.0967 0.1340Synodus foetens 0.4239 0.0134
Environmental Variables Correlations between environmental variables and their canonical variates
W1 W2
Surface Salinity 0.6789 0.6435Surface Temperature -0.0958 -0.9602Surface Turbidity -0.6706 -0.0270Microzooplankton Biomass -0.4754 -0.2961
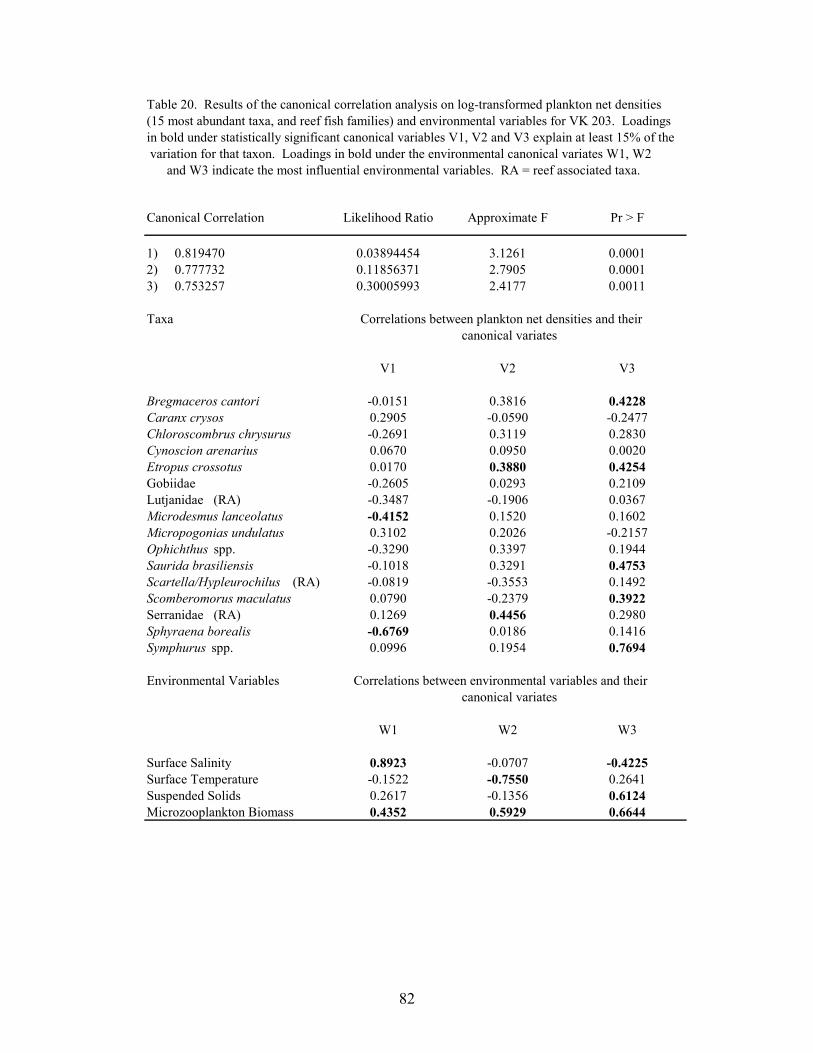
82
Table 20. Results of the canonical correlation analysis on log-transformed plankton net densities(15 most abundant taxa, and reef fish families) and environmental variables for VK 203. Loadings in bold under statistically significant canonical variables V1, V2 and V3 explain at least 15% of the variation for that taxon. Loadings in bold under the environmental canonical variates W1, W2 and W3 indicate the most influential environmental variables. RA = reef associated taxa.
Canonical Correlation Likelihood Ratio Approximate F Pr > F
1) 0.819470 0.03894454 3.1261 0.00012) 0.777732 0.11856371 2.7905 0.00013) 0.753257 0.30005993 2.4177 0.0011
Taxa Correlations between plankton net densities and their canonical variates
V1 V2 V3
Bregmaceros cantori -0.0151 0.3816 0.4228Caranx crysos 0.2905 -0.0590 -0.2477Chloroscombrus chrysurus -0.2691 0.3119 0.2830Cynoscion arenarius 0.0670 0.0950 0.0020Etropus crossotus 0.0170 0.3880 0.4254Gobiidae -0.2605 0.0293 0.2109Lutjanidae (RA) -0.3487 -0.1906 0.0367Microdesmus lanceolatus -0.4152 0.1520 0.1602Micropogonias undulatus 0.3102 0.2026 -0.2157Ophichthus spp. -0.3290 0.3397 0.1944Saurida brasiliensis -0.1018 0.3291 0.4753Scartella/Hypleurochilus (RA) -0.0819 -0.3553 0.1492Scomberomorus maculatus 0.0790 -0.2379 0.3922Serranidae (RA) 0.1269 0.4456 0.2980Sphyraena borealis -0.6769 0.0186 0.1416Symphurus spp. 0.0996 0.1954 0.7694
Environmental Variables Correlations between environmental variables and their canonical variates
W1 W2 W3
Surface Salinity 0.8923 -0.0707 -0.4225Surface Temperature -0.1522 -0.7550 0.2641Suspended Solids 0.2617 -0.1356 0.6124Microzooplankton Biomass 0.4352 0.5929 0.6644
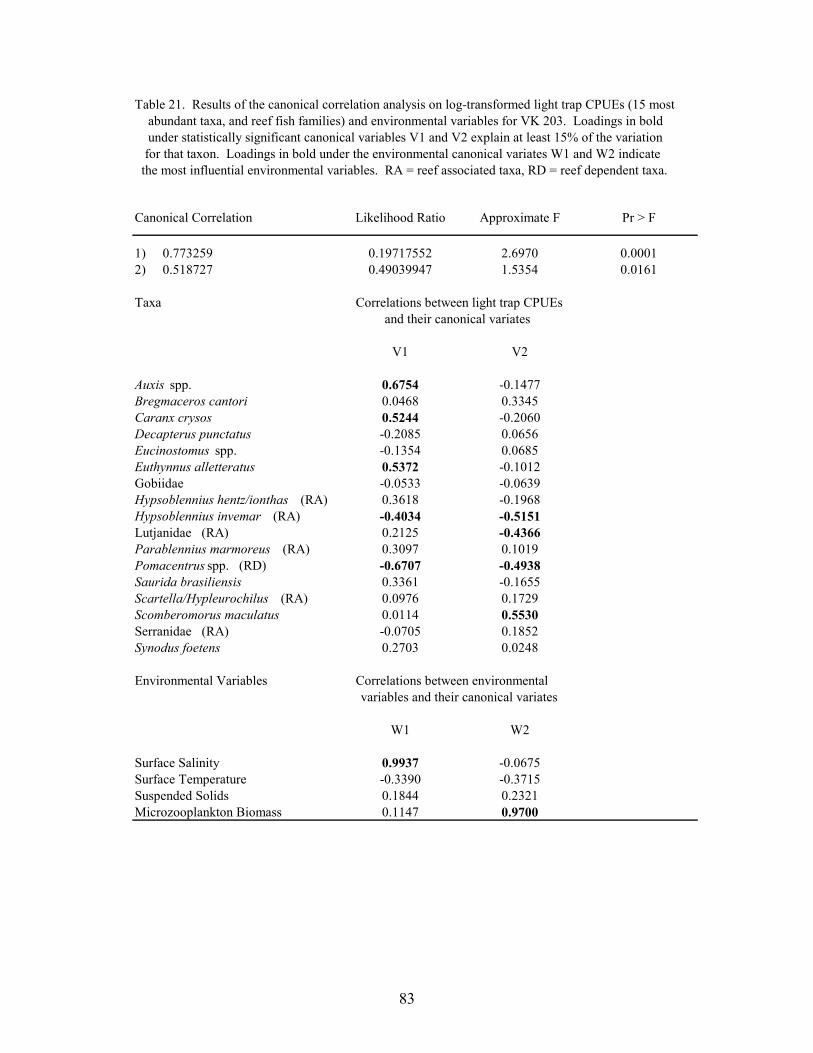
83
Table 21. Results of the canonical correlation analysis on log-transformed light trap CPUEs (15 most abundant taxa, and reef fish families) and environmental variables for VK 203. Loadings in bold under statistically significant canonical variables V1 and V2 explain at least 15% of the variation for that taxon. Loadings in bold under the environmental canonical variates W1 and W2 indicate the most influential environmental variables. RA = reef associated taxa, RD = reef dependent taxa.
Canonical Correlation Likelihood Ratio Approximate F Pr > F
1) 0.773259 0.19717552 2.6970 0.00012) 0.518727 0.49039947 1.5354 0.0161
Taxa Correlations between light trap CPUEs and their canonical variates
V1 V2
Auxis spp. 0.6754 -0.1477Bregmaceros cantori 0.0468 0.3345Caranx crysos 0.5244 -0.2060Decapterus punctatus -0.2085 0.0656Eucinostomus spp. -0.1354 0.0685Euthynnus alletteratus 0.5372 -0.1012Gobiidae -0.0533 -0.0639Hypsoblennius hentz/ionthas (RA) 0.3618 -0.1968Hypsoblennius invemar (RA) -0.4034 -0.5151Lutjanidae (RA) 0.2125 -0.4366Parablennius marmoreus (RA) 0.3097 0.1019Pomacentrus spp. (RD) -0.6707 -0.4938Saurida brasiliensis 0.3361 -0.1655Scartella/Hypleurochilus (RA) 0.0976 0.1729Scomberomorus maculatus 0.0114 0.5530Serranidae (RA) -0.0705 0.1852Synodus foetens 0.2703 0.0248
Environmental Variables Correlations between environmental variables and their canonical variates
W1 W2
Surface Salinity 0.9937 -0.0675Surface Temperature -0.3390 -0.3715Suspended Solids 0.1844 0.2321Microzooplankton Biomass 0.1147 0.9700
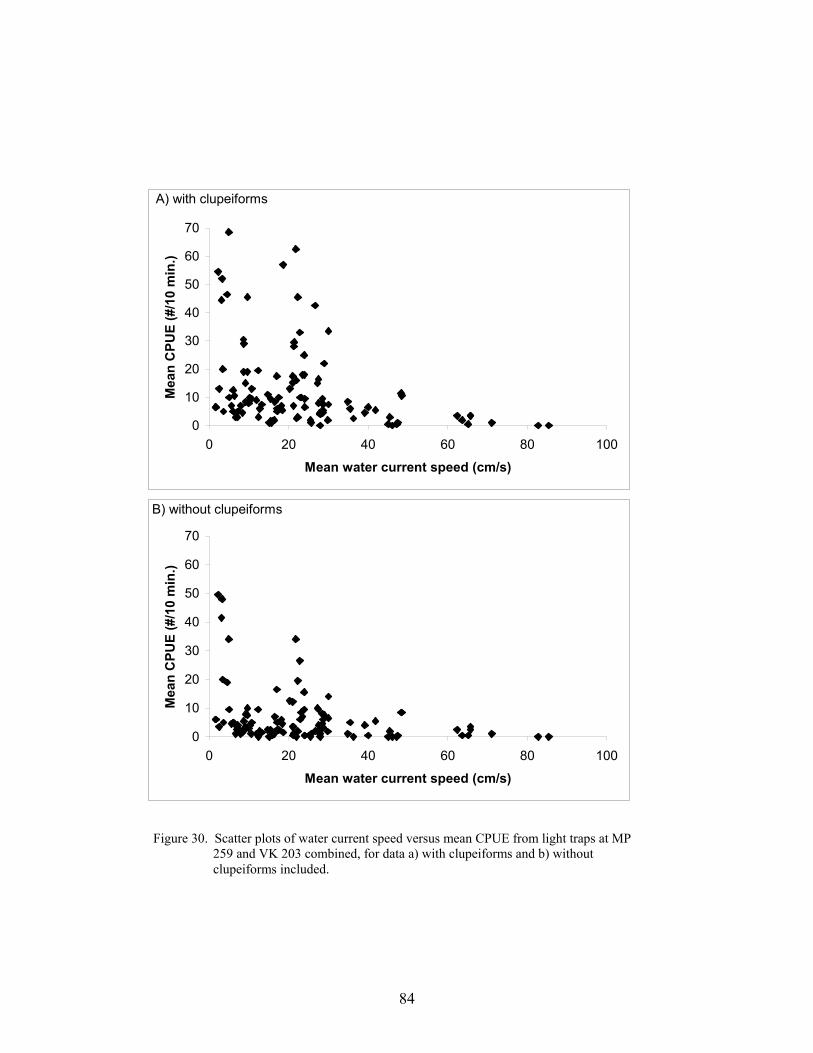
84
Figure 30. Scatter plots of water current speed versus mean CPUE from light traps at MP 259 and VK 203 combined, for data a) with clupeiforms and b) without clupeiforms included.
0
10
20
30
40
50
60
70
0 20 40 60 80 100
Mean water current speed (cm/s)
Mea
n C
PU
E (
#/10
min
.)
0
10
20
30
40
50
60
70
0 20 40 60 80 100
Mean water current speed (cm/s)
Mea
n C
PU
E (
#/10
min
.)
B) without clupeiforms
A) with clupeiforms
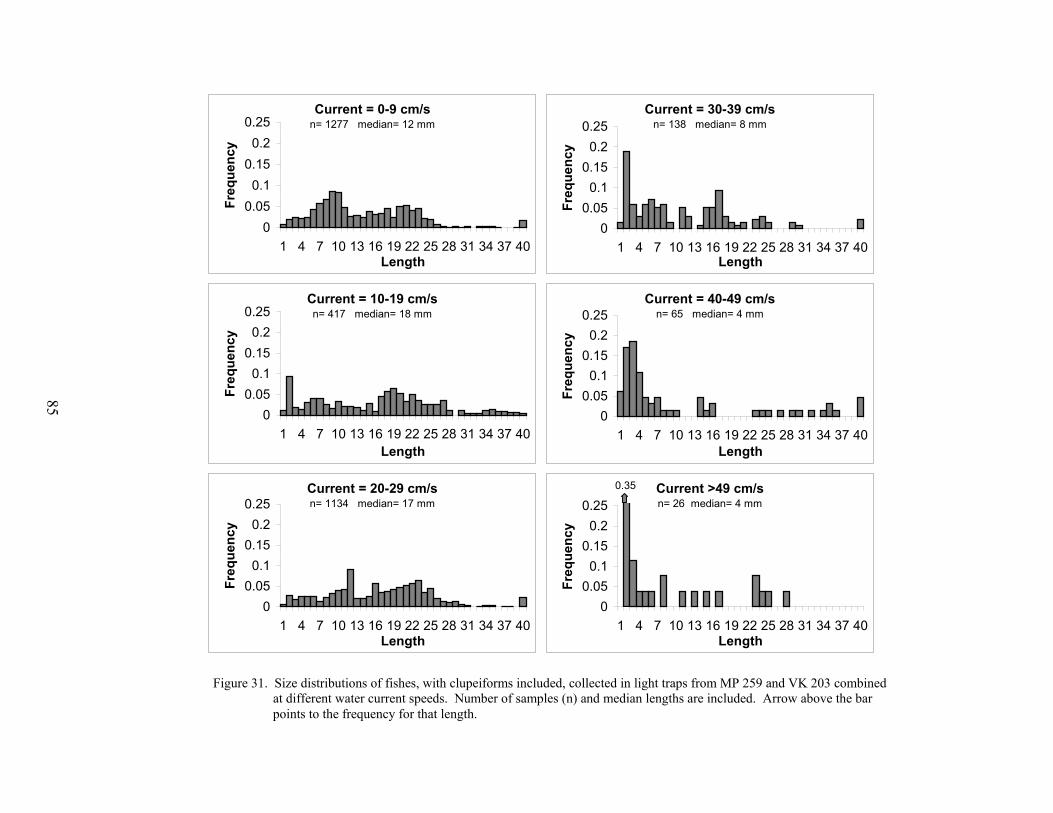
Figure 31. Size distributions of fishes, with clupeiforms included, collected in light traps from MP 259 and VK 203 combined at different water current speeds. Number of samples (n) and median lengths are included. Arrow above the bar points to the frequency for that length.
85
Current = 0-9 cm/sn= 1277 median= 12 mm
00.050.1
0.150.2
0.25
1 4 7 10 13 16 19 22 25 28 31 34 37 40Length
Fre
qu
ency
Current = 10-19 cm/sn= 417 median= 18 mm
00.050.1
0.150.2
0.25
1 4 7 10 13 16 19 22 25 28 31 34 37 40Length
Fre
qu
ency
Current = 20-29 cm/sn= 1134 median= 17 mm
00.050.1
0.150.2
0.25
1 4 7 10 13 16 19 22 25 28 31 34 37 40Length
Fre
qu
ency
Current = 30-39 cm/sn= 138 median= 8 mm
00.050.1
0.150.2
0.25
1 4 7 10 13 16 19 22 25 28 31 34 37 40Length
Fre
qu
ency
Current = 40-49 cm/sn= 65 median= 4 mm
00.050.1
0.150.2
0.25
1 4 7 10 13 16 19 22 25 28 31 34 37 40Length
Fre
qu
ency
Current >49 cm/sn= 26 median= 4 mm
00.050.1
0.150.2
0.25
1 4 7 10 13 16 19 22 25 28 31 34 37 40Length
Fre
qu
ency
0.35
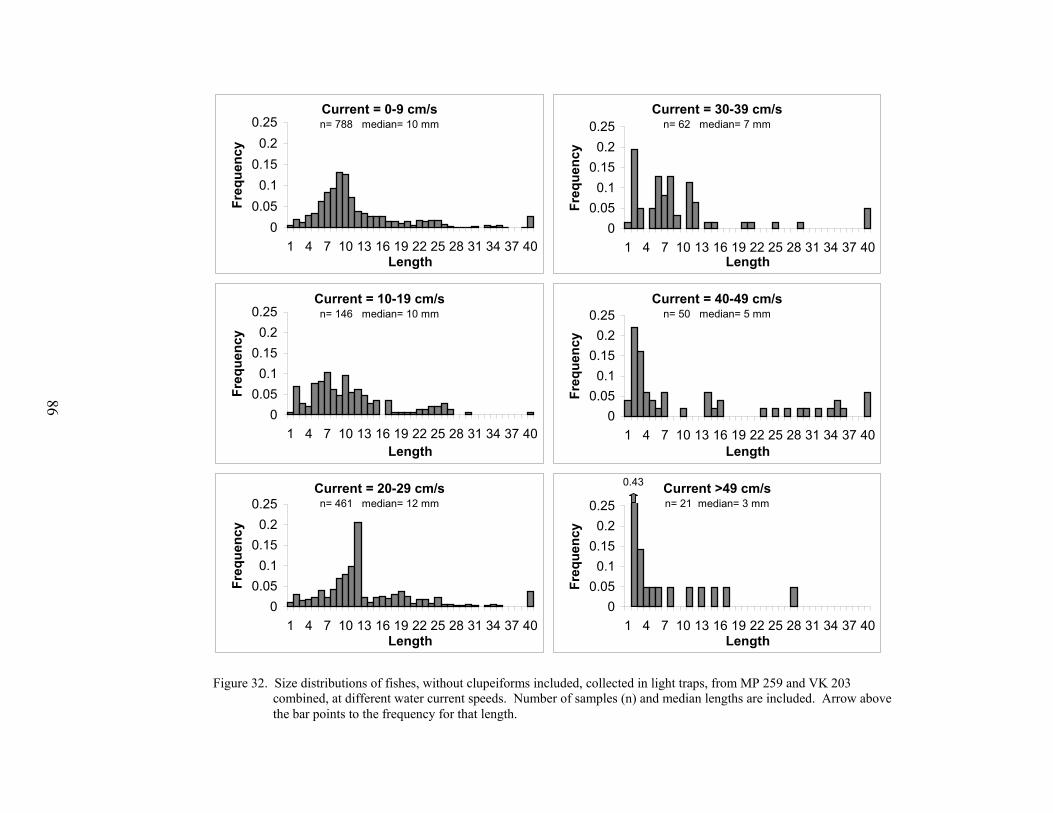
Figure 32. Size distributions of fishes, without clupeiforms included, collected in light traps, from MP 259 and VK 203 combined, at different water current speeds. Number of samples (n) and median lengths are included. Arrow above the bar points to the frequency for that length.
86
Current = 0-9 cm/sn= 788 median= 10 mm
00.050.1
0.150.2
0.25
1 4 7 10 13 16 19 22 25 28 31 34 37 40Length
Fre
qu
ency
Current = 10-19 cm/sn= 146 median= 10 mm
00.050.1
0.150.2
0.25
1 4 7 10 13 16 19 22 25 28 31 34 37 40Length
Fre
qu
ency
Current = 20-29 cm/sn= 461 median= 12 mm
00.050.1
0.150.2
0.25
1 4 7 10 13 16 19 22 25 28 31 34 37 40Length
Fre
qu
ency
Current = 30-39 cm/sn= 62 median= 7 mm
00.050.1
0.150.2
0.25
1 4 7 10 13 16 19 22 25 28 31 34 37 40Length
Fre
qu
ency
Current = 40-49 cm/sn= 50 median= 5 mm
00.050.1
0.150.2
0.25
1 4 7 10 13 16 19 22 25 28 31 34 37 40Length
Fre
qu
ency
Current >49 cm/sn= 21 median= 3 mm
00.050.1
0.150.2
0.25
1 4 7 10 13 16 19 22 25 28 31 34 37 40Length
Fre
qu
ency
0.43
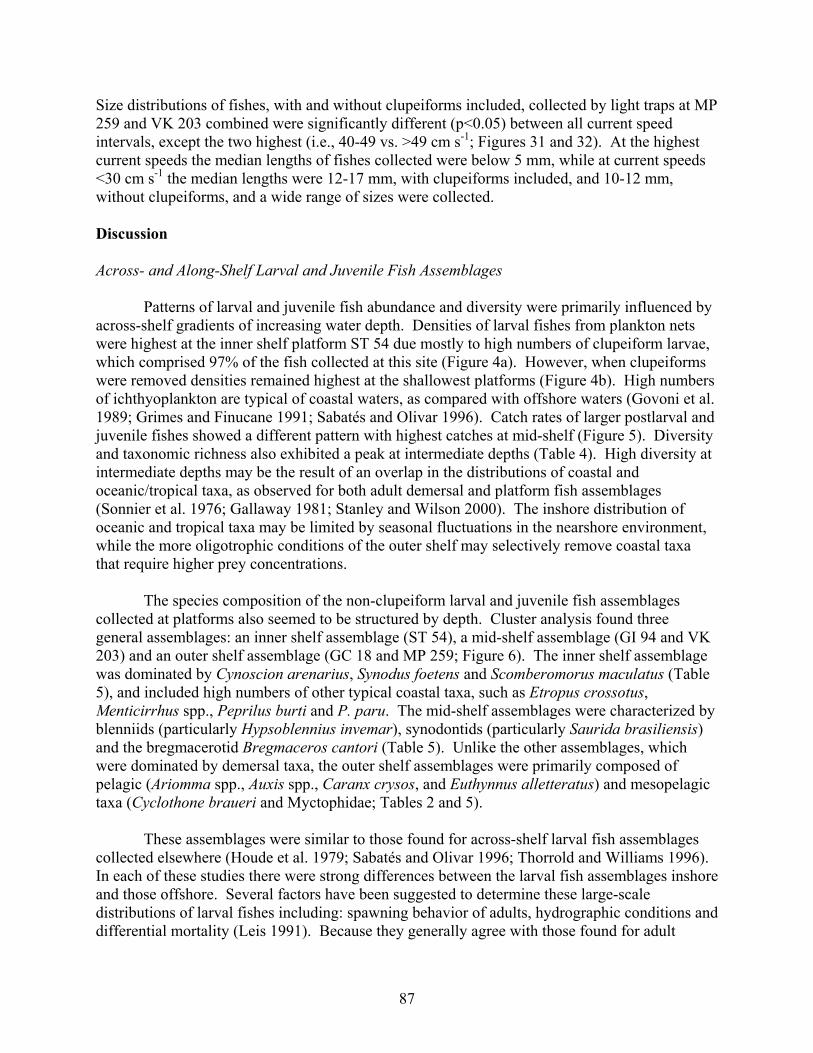
87
Size distributions of fishes, with and without clupeiforms included, collected by light traps at MP259 and VK 203 combined were significantly different (p<0.05) between all current speedintervals, except the two highest (i.e., 40-49 vs. >49 cm s-1; Figures 31 and 32). At the highestcurrent speeds the median lengths of fishes collected were below 5 mm, while at current speeds<30 cm s-1 the median lengths were 12-17 mm, with clupeiforms included, and 10-12 mm,without clupeiforms, and a wide range of sizes were collected.
Discussion
Across- and Along-Shelf Larval and Juvenile Fish Assemblages
Patterns of larval and juvenile fish abundance and diversity were primarily influenced byacross-shelf gradients of increasing water depth. Densities of larval fishes from plankton netswere highest at the inner shelf platform ST 54 due mostly to high numbers of clupeiform larvae,which comprised 97% of the fish collected at this site (Figure 4a). However, when clupeiformswere removed densities remained highest at the shallowest platforms (Figure 4b). High numbersof ichthyoplankton are typical of coastal waters, as compared with offshore waters (Govoni et al.1989; Grimes and Finucane 1991; Sabatés and Olivar 1996). Catch rates of larger postlarval andjuvenile fishes showed a different pattern with highest catches at mid-shelf (Figure 5). Diversityand taxonomic richness also exhibited a peak at intermediate depths (Table 4). High diversity atintermediate depths may be the result of an overlap in the distributions of coastal andoceanic/tropical taxa, as observed for both adult demersal and platform fish assemblages(Sonnier et al. 1976; Gallaway 1981; Stanley and Wilson 2000). The inshore distribution ofoceanic and tropical taxa may be limited by seasonal fluctuations in the nearshore environment,while the more oligotrophic conditions of the outer shelf may selectively remove coastal taxathat require higher prey concentrations.
The species composition of the non-clupeiform larval and juvenile fish assemblagescollected at platforms also seemed to be structured by depth. Cluster analysis found threegeneral assemblages: an inner shelf assemblage (ST 54), a mid-shelf assemblage (GI 94 and VK203) and an outer shelf assemblage (GC 18 and MP 259; Figure 6). The inner shelf assemblagewas dominated by Cynoscion arenarius, Synodus foetens and Scomberomorus maculatus (Table5), and included high numbers of other typical coastal taxa, such as Etropus crossotus,Menticirrhus spp., Peprilus burti and P. paru. The mid-shelf assemblages were characterized byblenniids (particularly Hypsoblennius invemar), synodontids (particularly Saurida brasiliensis)and the bregmacerotid Bregmaceros cantori (Table 5). Unlike the other assemblages, whichwere dominated by demersal taxa, the outer shelf assemblages were primarily composed ofpelagic (Ariomma spp., Auxis spp., Caranx crysos, and Euthynnus alletteratus) and mesopelagictaxa (Cyclothone braueri and Myctophidae; Tables 2 and 5).
These assemblages were similar to those found for across-shelf larval fish assemblagescollected elsewhere (Houde et al. 1979; Sabatés and Olivar 1996; Thorrold and Williams 1996).In each of these studies there were strong differences between the larval fish assemblages inshoreand those offshore. Several factors have been suggested to determine these large-scaledistributions of larval fishes including: spawning behavior of adults, hydrographic conditions anddifferential mortality (Leis 1991). Because they generally agree with those found for adult
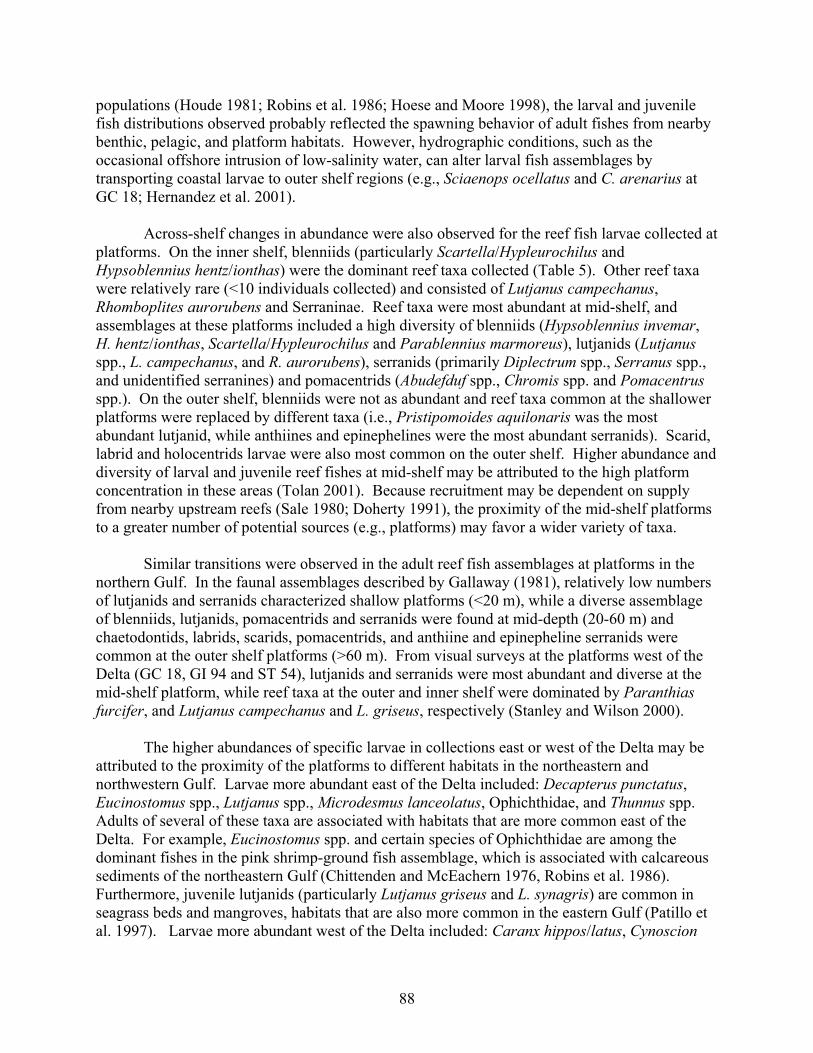
88
populations (Houde 1981; Robins et al. 1986; Hoese and Moore 1998), the larval and juvenilefish distributions observed probably reflected the spawning behavior of adult fishes from nearbybenthic, pelagic, and platform habitats. However, hydrographic conditions, such as theoccasional offshore intrusion of low-salinity water, can alter larval fish assemblages bytransporting coastal larvae to outer shelf regions (e.g., Sciaenops ocellatus and C. arenarius atGC 18; Hernandez et al. 2001).
Across-shelf changes in abundance were also observed for the reef fish larvae collected atplatforms. On the inner shelf, blenniids (particularly Scartella/Hypleurochilus andHypsoblennius hentz/ionthas) were the dominant reef taxa collected (Table 5). Other reef taxawere relatively rare (<10 individuals collected) and consisted of Lutjanus campechanus,Rhomboplites aurorubens and Serraninae. Reef taxa were most abundant at mid-shelf, andassemblages at these platforms included a high diversity of blenniids (Hypsoblennius invemar,H. hentz/ionthas, Scartella/Hypleurochilus and Parablennius marmoreus), lutjanids (Lutjanusspp., L. campechanus, and R. aurorubens), serranids (primarily Diplectrum spp., Serranus spp.,and unidentified serranines) and pomacentrids (Abudefduf spp., Chromis spp. and Pomacentrusspp.). On the outer shelf, blenniids were not as abundant and reef taxa common at the shallowerplatforms were replaced by different taxa (i.e., Pristipomoides aquilonaris was the mostabundant lutjanid, while anthiines and epinephelines were the most abundant serranids). Scarid,labrid and holocentrids larvae were also most common on the outer shelf. Higher abundance anddiversity of larval and juvenile reef fishes at mid-shelf may be attributed to the high platformconcentration in these areas (Tolan 2001). Because recruitment may be dependent on supplyfrom nearby upstream reefs (Sale 1980; Doherty 1991), the proximity of the mid-shelf platformsto a greater number of potential sources (e.g., platforms) may favor a wider variety of taxa.
Similar transitions were observed in the adult reef fish assemblages at platforms in thenorthern Gulf. In the faunal assemblages described by Gallaway (1981), relatively low numbersof lutjanids and serranids characterized shallow platforms (<20 m), while a diverse assemblageof blenniids, lutjanids, pomacentrids and serranids were found at mid-depth (20-60 m) andchaetodontids, labrids, scarids, pomacentrids, and anthiine and epinepheline serranids werecommon at the outer shelf platforms (>60 m). From visual surveys at the platforms west of theDelta (GC 18, GI 94 and ST 54), lutjanids and serranids were most abundant and diverse at themid-shelf platform, while reef taxa at the outer and inner shelf were dominated by Paranthiasfurcifer, and Lutjanus campechanus and L. griseus, respectively (Stanley and Wilson 2000).
The higher abundances of specific larvae in collections east or west of the Delta may beattributed to the proximity of the platforms to different habitats in the northeastern andnorthwestern Gulf. Larvae more abundant east of the Delta included: Decapterus punctatus,Eucinostomus spp., Lutjanus spp., Microdesmus lanceolatus, Ophichthidae, and Thunnus spp.Adults of several of these taxa are associated with habitats that are more common east of theDelta. For example, Eucinostomus spp. and certain species of Ophichthidae are among thedominant fishes in the pink shrimp-ground fish assemblage, which is associated with calcareoussediments of the northeastern Gulf (Chittenden and McEachern 1976, Robins et al. 1986).Furthermore, juvenile lutjanids (particularly Lutjanus griseus and L. synagris) are common inseagrass beds and mangroves, habitats that are also more common in the eastern Gulf (Patillo etal. 1997). Larvae more abundant west of the Delta included: Caranx hippos/latus, Cynoscion
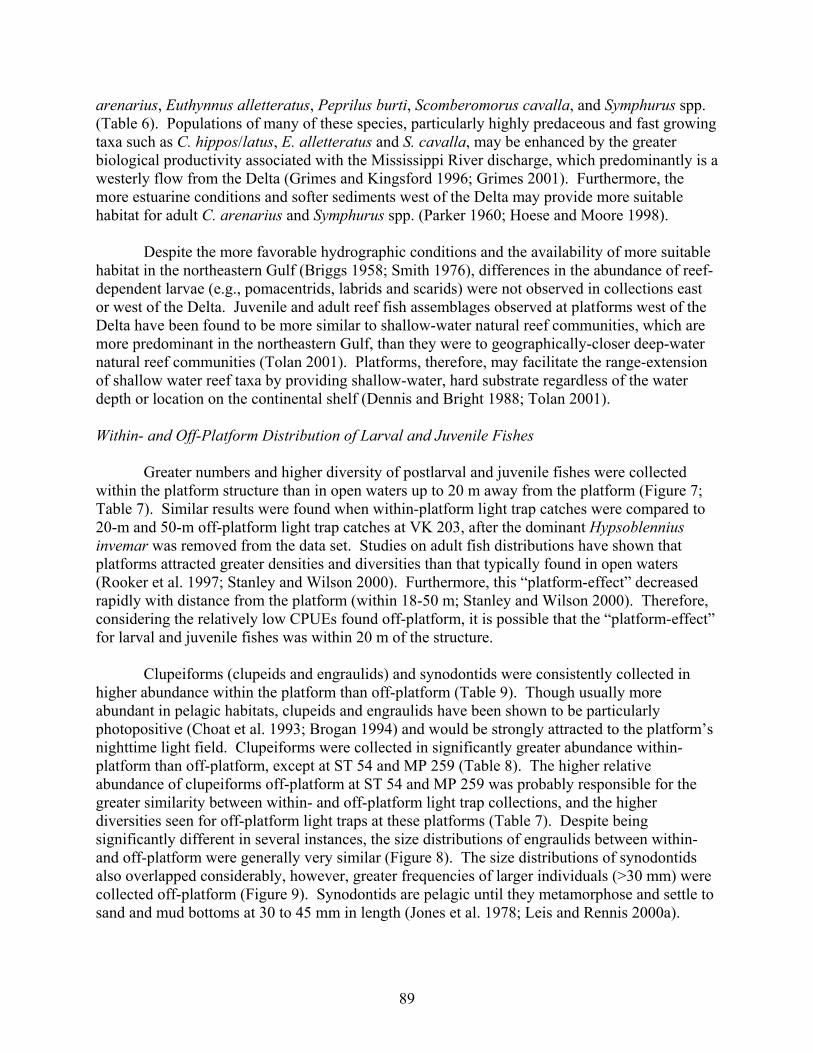
89
arenarius, Euthynnus alletteratus, Peprilus burti, Scomberomorus cavalla, and Symphurus spp.(Table 6). Populations of many of these species, particularly highly predaceous and fast growingtaxa such as C. hippos/latus, E. alletteratus and S. cavalla, may be enhanced by the greaterbiological productivity associated with the Mississippi River discharge, which predominantly is awesterly flow from the Delta (Grimes and Kingsford 1996; Grimes 2001). Furthermore, themore estuarine conditions and softer sediments west of the Delta may provide more suitablehabitat for adult C. arenarius and Symphurus spp. (Parker 1960; Hoese and Moore 1998).
Despite the more favorable hydrographic conditions and the availability of more suitablehabitat in the northeastern Gulf (Briggs 1958; Smith 1976), differences in the abundance of reef-dependent larvae (e.g., pomacentrids, labrids and scarids) were not observed in collections eastor west of the Delta. Juvenile and adult reef fish assemblages observed at platforms west of theDelta have been found to be more similar to shallow-water natural reef communities, which aremore predominant in the northeastern Gulf, than they were to geographically-closer deep-waternatural reef communities (Tolan 2001). Platforms, therefore, may facilitate the range-extensionof shallow water reef taxa by providing shallow-water, hard substrate regardless of the waterdepth or location on the continental shelf (Dennis and Bright 1988; Tolan 2001).
Within- and Off-Platform Distribution of Larval and Juvenile Fishes
Greater numbers and higher diversity of postlarval and juvenile fishes were collectedwithin the platform structure than in open waters up to 20 m away from the platform (Figure 7;Table 7). Similar results were found when within-platform light trap catches were compared to20-m and 50-m off-platform light trap catches at VK 203, after the dominant Hypsoblenniusinvemar was removed from the data set. Studies on adult fish distributions have shown thatplatforms attracted greater densities and diversities than that typically found in open waters(Rooker et al. 1997; Stanley and Wilson 2000). Furthermore, this “platform-effect” decreasedrapidly with distance from the platform (within 18-50 m; Stanley and Wilson 2000). Therefore,considering the relatively low CPUEs found off-platform, it is possible that the “platform-effect”for larval and juvenile fishes was within 20 m of the structure.
Clupeiforms (clupeids and engraulids) and synodontids were consistently collected inhigher abundance within the platform than off-platform (Table 9). Though usually moreabundant in pelagic habitats, clupeids and engraulids have been shown to be particularlyphotopositive (Choat et al. 1993; Brogan 1994) and would be strongly attracted to the platform’snighttime light field. Clupeiforms were collected in significantly greater abundance within-platform than off-platform, except at ST 54 and MP 259 (Table 8). The higher relativeabundance of clupeiforms off-platform at ST 54 and MP 259 was probably responsible for thegreater similarity between within- and off-platform light trap collections, and the higherdiversities seen for off-platform light traps at these platforms (Table 7). Despite beingsignificantly different in several instances, the size distributions of engraulids between within-and off-platform were generally very similar (Figure 8). The size distributions of synodontidsalso overlapped considerably, however, greater frequencies of larger individuals (>30 mm) werecollected off-platform (Figure 9). Synodontids are pelagic until they metamorphose and settle tosand and mud bottoms at 30 to 45 mm in length (Jones et al. 1978; Leis and Rennis 2000a).
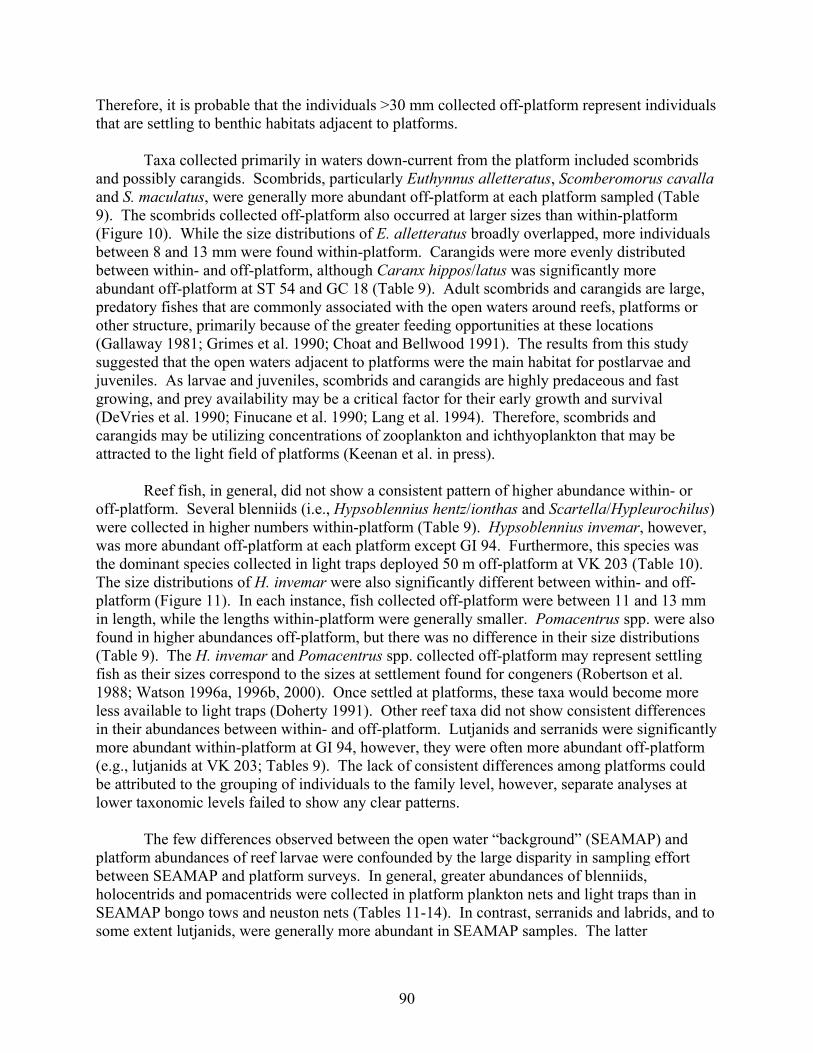
90
Therefore, it is probable that the individuals >30 mm collected off-platform represent individualsthat are settling to benthic habitats adjacent to platforms.
Taxa collected primarily in waters down-current from the platform included scombridsand possibly carangids. Scombrids, particularly Euthynnus alletteratus, Scomberomorus cavallaand S. maculatus, were generally more abundant off-platform at each platform sampled (Table9). The scombrids collected off-platform also occurred at larger sizes than within-platform(Figure 10). While the size distributions of E. alletteratus broadly overlapped, more individualsbetween 8 and 13 mm were found within-platform. Carangids were more evenly distributedbetween within- and off-platform, although Caranx hippos/latus was significantly moreabundant off-platform at ST 54 and GC 18 (Table 9). Adult scombrids and carangids are large,predatory fishes that are commonly associated with the open waters around reefs, platforms orother structure, primarily because of the greater feeding opportunities at these locations(Gallaway 1981; Grimes et al. 1990; Choat and Bellwood 1991). The results from this studysuggested that the open waters adjacent to platforms were the main habitat for postlarvae andjuveniles. As larvae and juveniles, scombrids and carangids are highly predaceous and fastgrowing, and prey availability may be a critical factor for their early growth and survival(DeVries et al. 1990; Finucane et al. 1990; Lang et al. 1994). Therefore, scombrids andcarangids may be utilizing concentrations of zooplankton and ichthyoplankton that may beattracted to the light field of platforms (Keenan et al. in press).
Reef fish, in general, did not show a consistent pattern of higher abundance within- oroff-platform. Several blenniids (i.e., Hypsoblennius hentz/ionthas and Scartella/Hypleurochilus)were collected in higher numbers within-platform (Table 9). Hypsoblennius invemar, however,was more abundant off-platform at each platform except GI 94. Furthermore, this species wasthe dominant species collected in light traps deployed 50 m off-platform at VK 203 (Table 10).The size distributions of H. invemar were also significantly different between within- and off-platform (Figure 11). In each instance, fish collected off-platform were between 11 and 13 mmin length, while the lengths within-platform were generally smaller. Pomacentrus spp. were alsofound in higher abundances off-platform, but there was no difference in their size distributions(Table 9). The H. invemar and Pomacentrus spp. collected off-platform may represent settlingfish as their sizes correspond to the sizes at settlement found for congeners (Robertson et al.1988; Watson 1996a, 1996b, 2000). Once settled at platforms, these taxa would become moreless available to light traps (Doherty 1991). Other reef taxa did not show consistent differencesin their abundances between within- and off-platform. Lutjanids and serranids were significantlymore abundant within-platform at GI 94, however, they were often more abundant off-platform(e.g., lutjanids at VK 203; Tables 9). The lack of consistent differences among platforms couldbe attributed to the grouping of individuals to the family level, however, separate analyses atlower taxonomic levels failed to show any clear patterns.
The few differences observed between the open water “background” (SEAMAP) andplatform abundances of reef larvae were confounded by the large disparity in sampling effortbetween SEAMAP and platform surveys. In general, greater abundances of blenniids,holocentrids and pomacentrids were collected in platform plankton nets and light traps than inSEAMAP bongo tows and neuston nets (Tables 11-14). In contrast, serranids and labrids, and tosome extent lutjanids, were generally more abundant in SEAMAP samples. The latter
91
differences may be attributed to the larger volumes of water filtered per SEAMAP sample, whichwould increase the probability of encountering patches of reef fish larvae. For example, themean volume of water filtered by plankton nets at GC 18 was 39.2 m3 (± 30.1, SD), while bongonets at nearby SEAMAP stations filtered 259.2 m3. Although estimates were unavailable,actively-towed neuston nets also probably sampled a greater volume of water than light traps.However, the larger number of samples taken at a platform may have counteracted the greatermean volume of water sampled at SEAMAP stations (e.g., 161 plankton net samples at GI 94 vs.8 bongo net tows at SEAMAP stations; Table 11).
SEAMAP and platform samples were similar in that reef larvae, and especially reef-dependent larvae, were relatively rare. This rarity has been attributed to high mortality duringthe pelagic larval phase (near 100%; Leis 1991). Some researchers, however, have found thatcertain reef taxa, such as scarids, labrids, and acanthurids, occurred in greatest abundance inoffshore waters up to 100 km from their natal reefs (Leis and Miller 1976; Victor 1987; Boehlertand Mundy 1993). While this may help explain the rarity of reef taxa at platform locations, itdoesn’t explain their low relative abundance in ichthyoplankton surveys in the open waters of theeastern Gulf and Caribbean (Richards 1984; Richards et al. 1993; Limouzy-Paris et al. 1994).
Lengths of larval reef fish collected by SEAMAP bongo nets were slightly smaller thanthose collected by platform plankton nets. Size distributions of serranids collected by bongo netshad a median length of 2 mm, while serranids collected by plankton nets had a median length of3 mm (Figure 14). Similarly, the median length of lutjanids collected by bongo nets was 2 mm,compared to 4 mm for plankton net-collected lutjanids (Figure 15). These observed differencesmay be attributed to differences in the gears utilized to collect these larvae. Larvae werecollected during SEAMAP surveys in a 333 µm mesh bongo net towed obliquely through thewater column from near bottom (or to 200 m at the deeper stations) to the surface. Because thebongo nets were actively towed, larger larvae may have been able to avoid the net because of thepressure wave created (Choat et al. 1993). In contrast, the passively-fished, 333 µm meshplankton net used at platforms may have encountered fewer avoidance problems.
Seasonal Patterns of Larval and Juvenile Fish Abundance at Platforms
The seasonality observed in larval and juvenile fish catches at the mid-shelf (VK 203)and outer-shelf (MP 259) platforms was similar to that observed from other studies in thenorthern Gulf. Peak plankton net densities and light trap CPUEs occurred during June-August atboth platforms (Figures 16-19). Much of these higher catches were due to large abundances ofclupeiforms, which have peak spawning during the spring and summer months (Finucane et al.1979b; Houde et al. 1979; Ditty et al. 1988). High non-clupeiform catches during these months,at both VK 203 and MP 259, were attributed to other late spring and summer spawners such asAuxis spp., Caranx crysos and Euthynnus alletteratus (Ditty et al. 1988). A similar trend wasobserved during year-round sampling conducted at the outer shelf platform GC 18, although asecondary peak occurred during November due to high numbers of the fall-winter spawningMugil cephalus (Hernandez 2001). High ichthyoplankton densities were also observed duringthe fall at VK 203 due to high numbers of the fall-winter spawning Micropogonias undulatus(Figure 18). Sciaenops ocellatus and Peprilus burti were also collected only during October atVK 203 (Table 3).
92
Most of the reef larvae collected at MP 259 and VK 203 were also generally found duringthe months of June-August (Tables 2 and 3). This was also the case during year-round samplingat GC 18 (Hernandez 2001), quarterly sampling at platforms in the northern Gulf (Tolan 2001),and other studies from the eastern and western Gulf (Finucane et al. 1979b; Houde et al. 1979;Ditty et al. 1988). However, anthiines were most abundant during September at MP 259, whileserranines were most abundant during May at VK 203. These results were consistent with theseasonality reported for Anthinae and Serraninae larvae from other surveys of the Gulf (i.e.,Anthinae in fall, Serraninae in spring; Houde 1982; McGowan 1985). Lunar Periodicity
There was little difference in the total plankton net or light trap catches between full andnew moons at MP 259 and VK 203, except for the total plankton net densities at VK 203, whichwere significantly higher on full moons (Figure 20). Without clupeiforms, new and full moonplankton net densities and light trap CPUEs were relatively similar to each other at bothplatforms. Other studies involving light-aggregation devices have found lower catches on fullmoons than on new moons, presumably due to the competitive interaction of lunar vs. lightedgear illumination (Gregory and Powles 1985; Rooker et al. 1996). It is possible that theplatform’s nighttime light field may have overridden any lunar effect that may have otherwisebeen present. Furthermore, differences in the total catch by lunar phase do not take into accountthe lunar-related behavior of individual taxa.
In a closer examination of reef taxa collected at platforms, there were strong differencesin the numbers and developmental stages collected between new and full moons. Preflexionholocentrids and labrids were almost exclusively collected on full moons (Table 15). PreflexionHypsoblennius hentz/ionthas and unidentified blenniids were found in significantly highernumbers on new moons, although these taxonomic groupings probably include many, if not all,of the species of blenniids collected at platforms. In contrast, preflexion H. invemar,Scartella/Hypleurochilus and many lutjanids, pomacentrids and serranids were collected inhigher frequencies on new moons. Of the postflexion larvae, most blenniids, holocentrids,lutjanids, and pomacentrids were found in significantly higher numbers on new moons. Lutjanuscampechanus were the only postflexion larvae found in higher numbers during full moons. Thepredominance of postflexion larvae collected on new moons was not surprising, because mostwere collected at, or near, settlement size; and numerous studies have documented higher rates ofsettlement during new moons (Victor 1986; Sponaugle and Cowen 1994; Rooker et al. 1996).Blenniids and pomacentrids, in particular, have settlement cycles that are associated with thedarker periods of the lunar month, presumably to avoid visual predation (Robertson et al. 1988).Many reef taxa also exhibit lunar spawning cycles, which are often synchronized to maximizethe amount of potential settlers available during the most favorable lunar phases (Robertson1991). The relative lack of significant differences between lunar phases for preflexion larvae, ascompared with postflexion larvae, was probably related to the effects of dispersal obscuringevidence of lunar spawning cycles (Doherty and Williams 1988; Meekan et al. 1993).
Temporal Variability of Plankton Net and Light Trap Catches
Coefficients of variation (CVs), calculated from the mean plankton net and light trapcatches per sampling night and sampling trip, described pulses (or discrete peaks) in the catches
93
of several dominant taxa and reef families at GI 94 and VK 203. Coefficients of variationsamong sampling nights were generally higher than, or approximately equal to, the CVs amongsampling trips for nearly every taxa, indicating that mean catches on a nightly time-scale weremore variable than mean catches by trip (Tables 16 and 17). However, the relative magnitude ofboth among night and among trip CVs was more informative in describing taxa with pulses. Forexample, plankton net-collected Bregmaceros cantori had CVs among the lowest at GI 94 anddid not exhibit a discrete pulse (Figure 21). In contrast, light trap-collected Hypsoblenniusinvemar had CVs among the highest at both GI 94 and VK 203 and exhibited a large pulse, ortwo pulses at VK 203, in their nightly catch (Figures 21 and 22). This was also the case for lighttrap-collected Pomacentridae at both GI 94 and VK 203, even though among trip CVs werehigher than among night CVs for this taxa at VK 203.
The pulses observed for Hypsoblennius invemar and Pomacentridae at both GI 94 andVK 203 probably represented settlement pulses. Most H. invemar and Pomacentridae collectedduring these pulses, at both platforms, were between 10-13 mm and 8-11 mm respectively,corresponding to the sizes at settlement reported for congeners (Robertson et al. 1988; Watson1996a, 1996b, 2000). The occurrence of these pulses during darker periods of the lunar month(i.e., first quarter moon at GI 94 and new moons at VK 203) further suggests that they weresettlement-related. Several studies have shown that reef fish year-classes were formed fromsettlement pulses lasting 1-3 nights (Robertson et al. 1988; Doherty 1991). One settlement pulsewas found to contribute >40% of the year-class of a pomacentrid on the Great Barrier Reef(Pitcher 1988). While it is highly probable that the pulses observed at platforms representsettling fish, it is unknown how much, if at all, these pulses contribute to resident populations.
Another feature of these pulses was that they often coincided for different species andeven different families. This was particularly noticeable for Hypsoblennius invemar andPomacentridae, which simultaneously exhibited pulses in light trap samples at both GI 94 andVK 203 (Figures 21 and 22). A similar pulse at MP 259 comprised most of the holocentrids,pomacentrids, synodontids, and H. invemar collected at this platform. Multitaxa pulses havealso been documented during other studies. For example, a recruitment pulse observed on theGreat Barrier Reef was composed of three species of pomacentrids (Williams 1983). Also nearthe Great Barrier Reef, most pomacentrids, lethrinids and mullids collected by light traps duringa survey were taken at the same station during the same 3-night period (Thorrold and Williams1996). Such pulses have been attributed to the lunar entrainment of settlement cycles (Doherty1991). However, the synodontids, holocentrids and H. invemar collected during the multitaxapulse at MP 259 were not at settlement size. It is possible that these taxa were entrained within acommon water mass that led to a presettlement aggregation of larvae composed of severalspecies (Sweatman 1988; Kingsford and Choat 1989).
Much of the within-night variability in total plankton net and light trap catches could beattributed to variability in catches of clupeiforms. Mean densities and CPUEs by hour aftersunset were extremely variable with peaks occurring throughout the night at any specificplatform (Figure 23). Without clupeiforms, densities and CPUEs were surprisingly equalthroughout the night, except at VK 203 and GC 18 where clupeiforms were not as abundant(Figure 24; Table 8). There was no obvious evidence of nocturnal vertical migration by larvalfish. Many taxa of larval fish undertake vertical migrations up into the neuston at dusk, followed
94
by a return to depth at dawn (Kendall and Naplin 1981; Leis 1986, 1991). Such movements mayhave been missed during this study due to the absence of samples at either dusk or dawn.Furthermore, analyses of the total ichthyoplankton catches (with or without clupeiforms) mayhave masked the behavior of individual taxa. Separate analyses of the within-night catches ofdominant taxa and reef taxa, however, were also inconclusive, with high degrees of variabilitythroughout the night across the different platforms.
Length-Frequency and Developmental Stages of Reef Taxa
One of the proposed fisheries benefits of platforms is that they may provide newspawning habitat. Although not directly observed, recent and nearby spawning by reef fish wasinferred by the collection of recently-hatched or very small larvae at platforms. Many recently-hatched and preflexion blenniid, lutjanid and serranid larvae were collected at every platform,indicating local spawning events (Figures 24-26). In addition, relatively small preflexionholocentrids and pomacentrids were collected at the mid-shelf platform GI 94, and preflexionholocentrids, labrids and scarids were collected at the outer shelf platforms, MP 259 and GC 18(Figures 27-29). Although the presence of these young larvae is indicative of local spawning, itis not known whether this spawning occurred at platforms or nearby natural reefs. Seasonaltransport envelopes, created from satellite altimetry data and otolith-derived pelagic transportdurations, have been created for serranid larvae collected at three mid- and outer shelf platforms(Tolan 2001). Within these envelopes, other oil and gas platforms were numerically dominantover natural reefs, statistically making platforms the most probable source of the larvae.
Another proposed fishery benefit of platforms is that they may provide newnursery/settlement habitat or refugia. Again using the length frequency of reef fish collected atplatforms, the presence of settlement-size larvae could provide indirect evidence for a potentialnursery habitat function. Of the potential settlers, blenniids were the most abundant settlement-size reef larvae, and pomacentrids were the most common settlement-size reef-dependent larvaecollected at platforms (Figures 24 and 28). Considering that blenniids and pomacentrids wereoften collected in discrete pulses during the darker lunar phases (new and first quarter; Figures21 and 22), as reported for other settling fish from these families, it is highly likely that thesetaxa were settling on platforms. Furthermore, efforts to collect new settlers in settlement trapswere attempted at MP 259 and VK 203 (unpublished data). Although catches were low,blenniids and pomacentrids were the most common taxa and were collected at size rangesbeginning where sizes from light traps ended (i.e., ≥14 mm).
Settlement-size larvae of other reef taxa were relatively rare, as compared with blenniidsand pomacentrids, and were represented mostly by lutjanids at the mid-shelf platforms (Figure25). The relatively low numbers of settlement-size lutjanids and serranids was not surprisingbecause many of these taxa have been shown to settle out in alternative, more coastal nurseryhabitats, such as sea grass beds, mangroves, or low relief hard substrate (Lindeman 1989; Beetsand Hixon 1994; Szedlmayer and Conti 1998). However, juvenile Lutjanus spp. have also beencollected west of the Delta in association with rock jetties (Hernandez 2001). Although largerpostflexion, rhynchichthys-stage holocentrids were collected at MP 259 and GC 18 (Figure 27),these individuals probably represented presettlement stages as holocentrids have extended larvaldurations (pelagic specimens up to 48 mm; Leis and Rennis 2000b)
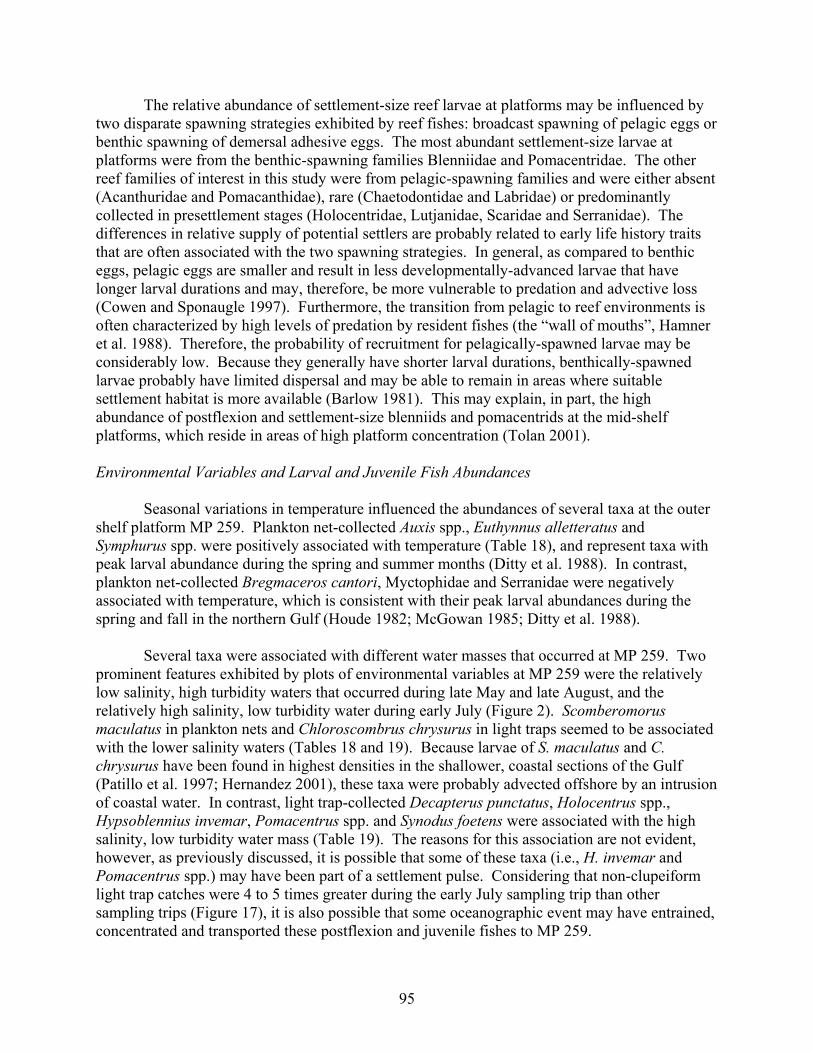
95
The relative abundance of settlement-size reef larvae at platforms may be influenced bytwo disparate spawning strategies exhibited by reef fishes: broadcast spawning of pelagic eggs orbenthic spawning of demersal adhesive eggs. The most abundant settlement-size larvae atplatforms were from the benthic-spawning families Blenniidae and Pomacentridae. The otherreef families of interest in this study were from pelagic-spawning families and were either absent(Acanthuridae and Pomacanthidae), rare (Chaetodontidae and Labridae) or predominantlycollected in presettlement stages (Holocentridae, Lutjanidae, Scaridae and Serranidae). Thedifferences in relative supply of potential settlers are probably related to early life history traitsthat are often associated with the two spawning strategies. In general, as compared to benthiceggs, pelagic eggs are smaller and result in less developmentally-advanced larvae that havelonger larval durations and may, therefore, be more vulnerable to predation and advective loss(Cowen and Sponaugle 1997). Furthermore, the transition from pelagic to reef environments isoften characterized by high levels of predation by resident fishes (the “wall of mouths”, Hamneret al. 1988). Therefore, the probability of recruitment for pelagically-spawned larvae may beconsiderably low. Because they generally have shorter larval durations, benthically-spawnedlarvae probably have limited dispersal and may be able to remain in areas where suitablesettlement habitat is more available (Barlow 1981). This may explain, in part, the highabundance of postflexion and settlement-size blenniids and pomacentrids at the mid-shelfplatforms, which reside in areas of high platform concentration (Tolan 2001).
Environmental Variables and Larval and Juvenile Fish Abundances
Seasonal variations in temperature influenced the abundances of several taxa at the outershelf platform MP 259. Plankton net-collected Auxis spp., Euthynnus alletteratus andSymphurus spp. were positively associated with temperature (Table 18), and represent taxa withpeak larval abundance during the spring and summer months (Ditty et al. 1988). In contrast,plankton net-collected Bregmaceros cantori, Myctophidae and Serranidae were negativelyassociated with temperature, which is consistent with their peak larval abundances during thespring and fall in the northern Gulf (Houde 1982; McGowan 1985; Ditty et al. 1988).
Several taxa were associated with different water masses that occurred at MP 259. Twoprominent features exhibited by plots of environmental variables at MP 259 were the relativelylow salinity, high turbidity waters that occurred during late May and late August, and therelatively high salinity, low turbidity water during early July (Figure 2). Scomberomorusmaculatus in plankton nets and Chloroscombrus chrysurus in light traps seemed to be associatedwith the lower salinity waters (Tables 18 and 19). Because larvae of S. maculatus and C.chrysurus have been found in highest densities in the shallower, coastal sections of the Gulf(Patillo et al. 1997; Hernandez 2001), these taxa were probably advected offshore by an intrusionof coastal water. In contrast, light trap-collected Decapterus punctatus, Holocentrus spp.,Hypsoblennius invemar, Pomacentrus spp. and Synodus foetens were associated with the highsalinity, low turbidity water mass (Table 19). The reasons for this association are not evident,however, as previously discussed, it is possible that some of these taxa (i.e., H. invemar andPomacentrus spp.) may have been part of a settlement pulse. Considering that non-clupeiformlight trap catches were 4 to 5 times greater during the early July sampling trip than othersampling trips (Figure 17), it is also possible that some oceanographic event may have entrained,concentrated and transported these postflexion and juvenile fishes to MP 259.
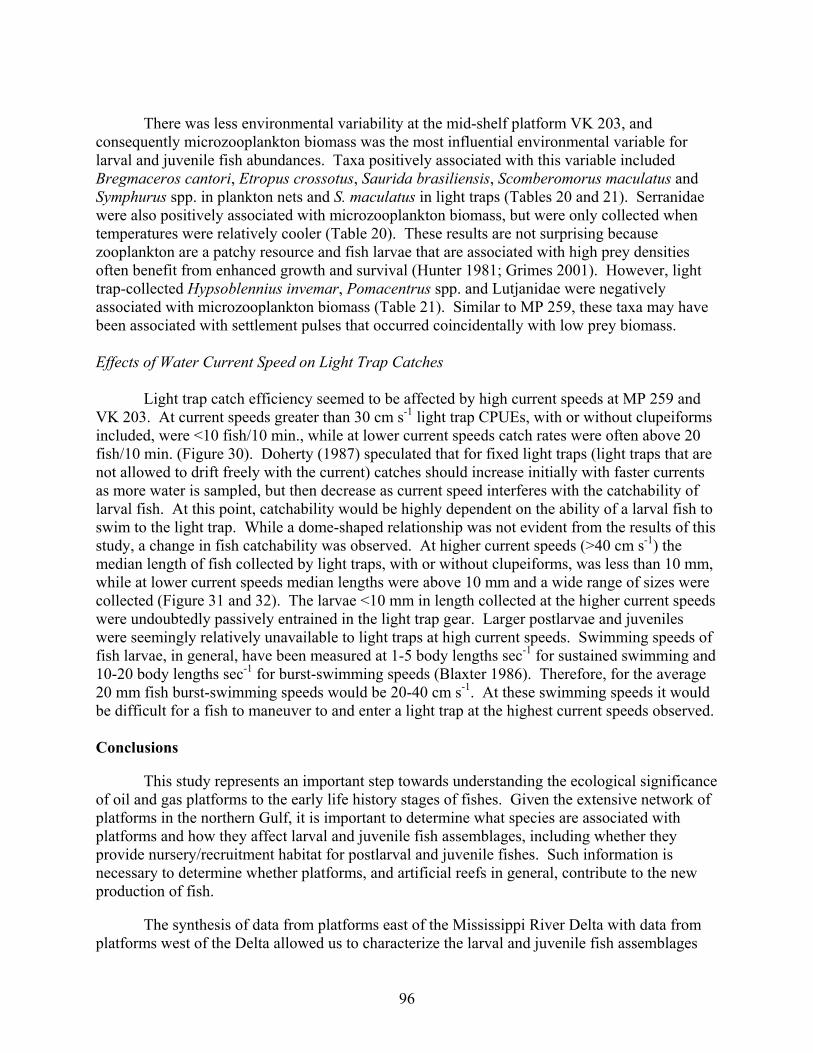
96
There was less environmental variability at the mid-shelf platform VK 203, andconsequently microzooplankton biomass was the most influential environmental variable forlarval and juvenile fish abundances. Taxa positively associated with this variable includedBregmaceros cantori, Etropus crossotus, Saurida brasiliensis, Scomberomorus maculatus andSymphurus spp. in plankton nets and S. maculatus in light traps (Tables 20 and 21). Serranidaewere also positively associated with microzooplankton biomass, but were only collected whentemperatures were relatively cooler (Table 20). These results are not surprising becausezooplankton are a patchy resource and fish larvae that are associated with high prey densitiesoften benefit from enhanced growth and survival (Hunter 1981; Grimes 2001). However, lighttrap-collected Hypsoblennius invemar, Pomacentrus spp. and Lutjanidae were negativelyassociated with microzooplankton biomass (Table 21). Similar to MP 259, these taxa may havebeen associated with settlement pulses that occurred coincidentally with low prey biomass.
Effects of Water Current Speed on Light Trap Catches
Light trap catch efficiency seemed to be affected by high current speeds at MP 259 andVK 203. At current speeds greater than 30 cm s-1 light trap CPUEs, with or without clupeiformsincluded, were <10 fish/10 min., while at lower current speeds catch rates were often above 20fish/10 min. (Figure 30). Doherty (1987) speculated that for fixed light traps (light traps that arenot allowed to drift freely with the current) catches should increase initially with faster currentsas more water is sampled, but then decrease as current speed interferes with the catchability oflarval fish. At this point, catchability would be highly dependent on the ability of a larval fish toswim to the light trap. While a dome-shaped relationship was not evident from the results of thisstudy, a change in fish catchability was observed. At higher current speeds (>40 cm s-1) themedian length of fish collected by light traps, with or without clupeiforms, was less than 10 mm,while at lower current speeds median lengths were above 10 mm and a wide range of sizes werecollected (Figure 31 and 32). The larvae <10 mm in length collected at the higher current speedswere undoubtedly passively entrained in the light trap gear. Larger postlarvae and juvenileswere seemingly relatively unavailable to light traps at high current speeds. Swimming speeds offish larvae, in general, have been measured at 1-5 body lengths sec-1 for sustained swimming and10-20 body lengths sec-1 for burst-swimming speeds (Blaxter 1986). Therefore, for the average20 mm fish burst-swimming speeds would be 20-40 cm s-1. At these swimming speeds it wouldbe difficult for a fish to maneuver to and enter a light trap at the highest current speeds observed.
Conclusions
This study represents an important step towards understanding the ecological significanceof oil and gas platforms to the early life history stages of fishes. Given the extensive network ofplatforms in the northern Gulf, it is important to determine what species are associated withplatforms and how they affect larval and juvenile fish assemblages, including whether theyprovide nursery/recruitment habitat for postlarval and juvenile fishes. Such information isnecessary to determine whether platforms, and artificial reefs in general, contribute to the newproduction of fish.
The synthesis of data from platforms east of the Mississippi River Delta with data fromplatforms west of the Delta allowed us to characterize the larval and juvenile fish assemblages
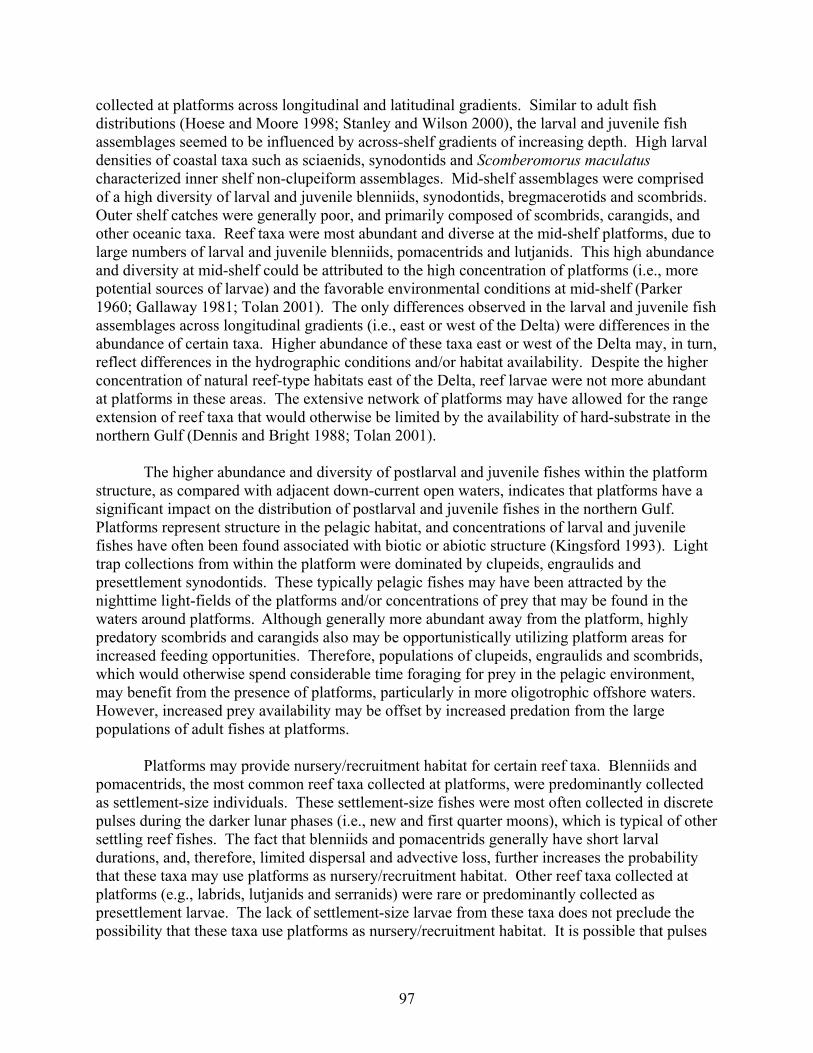
97
collected at platforms across longitudinal and latitudinal gradients. Similar to adult fishdistributions (Hoese and Moore 1998; Stanley and Wilson 2000), the larval and juvenile fishassemblages seemed to be influenced by across-shelf gradients of increasing depth. High larvaldensities of coastal taxa such as sciaenids, synodontids and Scomberomorus maculatuscharacterized inner shelf non-clupeiform assemblages. Mid-shelf assemblages were comprisedof a high diversity of larval and juvenile blenniids, synodontids, bregmacerotids and scombrids.Outer shelf catches were generally poor, and primarily composed of scombrids, carangids, andother oceanic taxa. Reef taxa were most abundant and diverse at the mid-shelf platforms, due tolarge numbers of larval and juvenile blenniids, pomacentrids and lutjanids. This high abundanceand diversity at mid-shelf could be attributed to the high concentration of platforms (i.e., morepotential sources of larvae) and the favorable environmental conditions at mid-shelf (Parker1960; Gallaway 1981; Tolan 2001). The only differences observed in the larval and juvenile fishassemblages across longitudinal gradients (i.e., east or west of the Delta) were differences in theabundance of certain taxa. Higher abundance of these taxa east or west of the Delta may, in turn,reflect differences in the hydrographic conditions and/or habitat availability. Despite the higherconcentration of natural reef-type habitats east of the Delta, reef larvae were not more abundantat platforms in these areas. The extensive network of platforms may have allowed for the rangeextension of reef taxa that would otherwise be limited by the availability of hard-substrate in thenorthern Gulf (Dennis and Bright 1988; Tolan 2001).
The higher abundance and diversity of postlarval and juvenile fishes within the platformstructure, as compared with adjacent down-current open waters, indicates that platforms have asignificant impact on the distribution of postlarval and juvenile fishes in the northern Gulf.Platforms represent structure in the pelagic habitat, and concentrations of larval and juvenilefishes have often been found associated with biotic or abiotic structure (Kingsford 1993). Lighttrap collections from within the platform were dominated by clupeids, engraulids andpresettlement synodontids. These typically pelagic fishes may have been attracted by thenighttime light-fields of the platforms and/or concentrations of prey that may be found in thewaters around platforms. Although generally more abundant away from the platform, highlypredatory scombrids and carangids also may be opportunistically utilizing platform areas forincreased feeding opportunities. Therefore, populations of clupeids, engraulids and scombrids,which would otherwise spend considerable time foraging for prey in the pelagic environment,may benefit from the presence of platforms, particularly in more oligotrophic offshore waters.However, increased prey availability may be offset by increased predation from the largepopulations of adult fishes at platforms.
Platforms may provide nursery/recruitment habitat for certain reef taxa. Blenniids andpomacentrids, the most common reef taxa collected at platforms, were predominantly collectedas settlement-size individuals. These settlement-size fishes were most often collected in discretepulses during the darker lunar phases (i.e., new and first quarter moons), which is typical of othersettling reef fishes. The fact that blenniids and pomacentrids generally have short larvaldurations, and, therefore, limited dispersal and advective loss, further increases the probabilitythat these taxa may use platforms as nursery/recruitment habitat. Other reef taxa collected atplatforms (e.g., labrids, lutjanids and serranids) were rare or predominantly collected aspresettlement larvae. The lack of settlement-size larvae from these taxa does not preclude thepossibility that these taxa use platforms as nursery/recruitment habitat. It is possible that pulses

98
of settling reef larvae could have been missed, or larvae may have settled to benthic habitats atthe base of the platform, areas that were beyond the reach of the sampling gear utilized. Duringthis study, the areas sampled at platforms represented shallow water hard-substrate, habitat thatis obviously limited on the continental shelf of the northern Gulf. Because artificial reefs mostlikely benefit species that are habitat-limited (Bohnsack 1989), platforms should, therefore,enhance the production of typical shallow water reef taxa (e.g., blenniids and pomacentrids).

99
LITERATURE CITED
Barlow, G.W. 1981. Patterns of parental investment, dispersal and size among coral-reef fishes.Environmental Biology of Fishes 6: 65-85.
Bedinger, C.A., J.W. Cooper, A. Kwok, R.E. Childers, and K.T. Kimball. 1980. Ecologicalinvestigations of petroleum production platforms in the central Gulf of Mexico. Volume1: Pollutant fate and effects studies. Draft final report submitted to the Bureau of LandManagement, Contract AA551-CT8-17.
Beets, J. and M.A. Hixon. 1994. Distribution, persistence, and growth of groupers (Pisces:Serranidae) on artificial and natural patch reefs in the Virgin Islands. Bulletin of MarineScience 55: 470-483.
Blaxter, J.H.S. 1986. Development of sense organs and behaviour of teleost larvae with specialreference to feeding and predator avoidance. Transactions of the American FisheriesSociety 115: 98-114.
Boehlert, G.W. and B.C. Mundy. 1993. Ichthyoplankton assemblages at seamounts and oceanicislands. Bulletin of Marine Science 53: 336-361.
Bohnsack, J.A. 1989. Are high densities of fishes at artificial reefs the result of habitatlimitations or behavioral preference? Bulletin of Marine Science 44: 632-645.
Bohnsack, J.A. 1991. Habitat structure and the design of artificial reefs. In: Bell, S.S., E.D.McCoy and H.R. Mushinsky, eds. Habitat Structure: The Physical Structure of Objectsin Space. London: Chapman Hall.
Bohnsack, J.A. and D.L. Sutherland. 1985. Artificial reef research: a review withrecommendations for future priorities. Bulletin of Marine Science 37:11-19.
Bohnsack, J.A., D.E. Harper, D.B. McClellan and M. Hulsbeck. 1994. Effects of reef size oncolonization and assemblage structure of fishes at artificial reefs off southeastern Florida,U.S.A. Bulletin of Marine Science 55: 796-823.
Bortone, S.A. 1998. Resolving the attraction-production dilemma in artificial reef research:Some yeas and nays. Fisheries 23: 6-10.
Briggs, J.C. 1958. A list of Florida fishes and their distribution. Bulletin of the Florida StateMuseum Biological Sciences 2(8): 223-318.
Brogan, M.W. 1994. Two methods of sampling fish larvae over reefs: a comparison from theGulf of California. Marine Biology 118: 33-44.

100
Chittenden, M.E. and J.D. McEachran. 1976. Composition, ecology, and dynamics of demersalfish communities on the northwestern Gulf of Mexico continental shelf, with a similarsynopsis for the entire gulf. TAMU-SG-76-2008. College Station: Texas A&MUniversity.
Choat, J.H. and D.R. Bellwood. 1991. Reef fishes: their history and evolution. In Sale, P.F., ed.The ecology of fishes on coral reefs. San Diego: Academic Press.
Choat, J.H, P.J. Doherty, B.A. Kerrigan, and J.M. Leis. 1993. A comparison of towed nets,purse seine, and light-aggregation devices for sampling larvae and pelagic juveniles ofcoral reef fishes. Fishery Bulletin 91: 195-209.
Continental Shelf Associates. 1982. Study of the effect of oil and gas activities on reef fishpopulations in the Gulf of Mexico OCS area. U.S. Department of the Interior, MineralsManagement Service, Gulf of Mexico OCS Region, New Orleans, LA. MMS ContractNo. AA551-CT-9-36.
Cowen, R.K. and S. Sponaugle. 1997. Relationships between early life history traits andrecruitment among coral reef fishes. In: R.C. Chambers and E.A. Trippel, eds. Early lifehistory and recruitment in fish populations. Chapman and Hall, New York.
Dennis, G.D. and T.J. Bright. 1988. Reef fish assemblages on hard banks in the northwesternGulf of Mexico. Bulletin of Marine Science 43(2): 280-307.
DeVries, D.A., C.B. Grimes, K.C. Lang, and D.B. White. 1990. Age and growth of king andSpanish mackerel larvae and juveniles from the Gulf of Mexico and U.S. south Atlantic.Environmental Biology of Fishes 29: 135-143.
Ditty, J.G., G.G. Zieske, and R.F. Shaw. 1988. Seasonality and depth distribution of larvalfishes in the northern Gulf of Mexico above latitude 26°00' N. Fishery Bulletin 86: 811-823.
Doherty, P.J. 1987. Light-traps: selective but useful devices for quantifying the distribution andabundances of larval fishes. Bulletin of Marine Science 41: 423-431.
Doherty, P.J. 1991. Spatial and temporal patterns in recruitment. In Sale, P.F., ed. The ecologyof fishes on coral reefs. San Diego: Academic Press.
Doherty, P.J. and D. McB. Williams. 1988. The replenishment of coral reef fish populations.Oceanography and Marine Biology Annual Reviews 26: 487-551.
Finucane, J.H., L.A. Collins, and L.E. Barger. 1979a. Determine the effects of discharges onseasonal abundance, distribution, and composition of ichthyoplankton in the oil field. In:Jackson, W.B., ed. Environmental Assessment of an active oil field in the NorthwesternGulf of Mexico, 1977-1978. NOAA Report to EPA, Contract Number EPA-IAG-D%-E693-EO, NMFS Southeast Fisheries Center, Galveston.
101
Finucane, J.H., L.A. Collins, L.E. Barger, and J.D. McEachran. 1979b.Ichthyoplankton/mackerel eggs and larvae. In: Jackson, W.B., ed. Environmental Studiesof the South Texas Outer Continental Shelf 1976. Contract Number AA550-TA7-3.NOAA Final Report to BLM, NMFS Southeast Fisheries Center, Galveston.
Finucane, J.H., C.B. Grimes, and S.P. Naughton. 1990. Diets of young king and Spanishmackerel off the southeast United States. Northeast Gulf Science 11: 145-153.
Gallaway, B.J. 1981. An ecosystem analysis of oil and gas development on the Texas-Louisianacontinental shelf. FWS/OBS-81/27. U.S. Fish & Wildlife Service, Office of BiologicalServices, Washington, D.C.
Gallaway, B.J. 1999. Delineation of essential habitat for juvenile red snapper in thenorthwestern Gulf of Mexico. Transactions of the American Fisheries Society. 128:713-726.
Gallaway, B.J. and L.R. Martin. 1980. Volume III-Effects of gas and oil field structures andeffluents on pelagic and reef fishes, demersal fishes and macrocrustaceans. In Jackson,W.B. and E.P. Wilkens, eds. Environmental assessment of Buccaneer Gas and Oil Fieldin the northwestern Gulf of Mexico, 1978-1979. NOAA Technical Memorandum,NMFS-SEFC-37.
Govoni, J.J., D.E. Hoss, and D.R. Colby. 1989. The spatial distribution of larval fishes aboutthe Mississippi River plume. Limnology and Oceanography. 34: 178-187.
Gregory, R.S. and P.M. Powles. 1985. Chronology, distribution, and sizes of larval fishsampled by light traps in macrophytic Chemung lake. Canadian Journal of Zoology 63:2569-2577.
Grimes, C.B. 2001. Fishery production and the Mississippi River discharge. Fisheries 26: 17-26.
Grimes, C. B. and J.H. Finucane. 1991. Spatial distribution and abundance of larval andjuvenile fish, chlorophyll and macrozooplankton around the Mississippi River dischargeplume, and the role of the plume in fish recruitment. Marine Ecology Progress Series.75: 109-119.
Grimes, C.B. and M.J. Kingsford. 1996. How do riverine plumes of different sizes influencefish larvae: do they enhance recruitment? Marine and Freshwater Research 47: 191-208.
Grimes, C.B., J.H. Finucane, L.A. Collins, and D.A. DeVries. 1990. Young king mackerel inthe Gulf of Mexico, a summary of the distribution and occurrence of larvae and juveniles,and spawning dates for Mexican juveniles. Bulletin of Marine Science 46(3): 640-654.
Hamner, W.M., M.S. Jones, J.H. Carleton, J.R. Hauri and D. McB. Williams. 1988.Zooplankton, planktivorous fish, and water currents on a windward reef face: GreatBarrier Reef, Australia. Bulletin of Marine Science 42: 459-479.
102
Hastings, R.W. 1976. Observations on the fish fauna associated with offshore platforms in thenortheastern Gulf of Mexico. Fishery Bulletin 74: 387-402.
Hernandez, F.J., Jr. 2001. The across-shelf distribution of larval, postlarval and juvenile fishescollected at oil and gas platforms and a coastal jetty off Louisiana west of the MississippiRiver Delta. Ph.D. Dissertation. Louisiana State University, Baton Rouge.
Hernandez, F.J., Jr., R.F. Shaw, J.C. Cope, J.G. Ditty, M.C. Benfield and T. Farooqi. 2001.Across-shelf larval, postlarval, and juvenile fish communities collected at offshore oiland gas platforms and a coastal rock jetty west of the Mississippi River Delta. Preparedby the Coastal Fisheries Institute, Louisiana State University, U.S. Department of theInterior, Minerals Management Service, Gulf of Mexico OCS Region, New Orleans, LA.OCS Study MMS 2001-077. 144pp.
Hernandez, F.J., Jr., R.F. Shaw, J.S. Cope, J.G. Ditty, T. Farooqi and M.C. Benfield. In Press.The across-shelf larval, postlarval, and juvenile fish assemblages collected at offshore oiland gas platforms west of the Mississippi River Delta. American Fisheries SocietySpecial Symposium Series.
Hildebrand, H.H. 1954. A study of the fauna of the brown shrimp (Penaeus aztecus Ives)grounds in the western Gulf of Mexico. Publications of the Institute of Marine Science.3: 233-366.
Hixon, M.A. and J.P. Beets. 1989. Shelter characteristics and Caribbean fish assemblages: experiments with artificial reefs. Bulletin of Marine Science 44: 666-680.
Hoese, H.D. and R.H. Moore. 1998. Fishes of the Gulf of Mexico: Texas, Louisiana, andAdjacent Waters. College Station: Texas A&M University Press. 422 pp.
Houde, E.D. 1981. Distribution and abundance of four types of codlet (Pisces:Bregmacerotidae) larvae from the eastern Gulf of Mexico. Biological Oceanography 1:81-104.
Houde, E.D. 1982. Kinds, distributions and abundances of sea bass larvae (Pisces: Serranidae)from the eastern Gulf of Mexico. Bulletin of Marine Science 32(2): 511-522.
Houde, E.D., J.C. Leak, C.E. Dowd, S.A. Berkeley, and W.J. Richards. 1979. Ichthyoplanktonabundance and diversity in the eastern Gulf of Mexico. Report to the Bureau of LandManagement. Contract AA550-CT7-28. NTIS PB-299839.
Hunter, J.R. 1981. Feeding ecology and predation of marine fish larvae. In: R. Lasker, ed.Marine Fish Larvae: Morphology, Ecology and Relation to Fisheries. University ofWashington Press, Seattle, Washington.
Johannes, R.E. 1978. Reproductive strategies of coastal marine fishes in the tropics.Environmental Biology of Fishes 3: 65-84.
103
Jones, P.W., F.D. Martin, and J.D. Hardy, Jr. 1978. Development of fishes of the Mid-AtlanticBight: an atlas of egg, larval and juvenile stages. Volume 1: Acipenseridae throughIctaluridae. Center for Environmental and Estuarine Studies of the University ofMaryland. Prepared for U.S. Fish and Wildlife Service. Biological Services Program.FWS/OBS-78/12. 366 pp.
Keenan, S.F., M.C. Benfield, and R.F. Shaw. In Press. Zooplanktivory by blue runner Caranxcrysos: a potential energetic subsidy to Gulf of Mexico fish populations at petroleumplatforms. American Fisheries Society Special Symposium Series.
Kendall, A.W., Jr. and N.A. Naplin. 1981. Diel-depth distribution of summer ichthyoplanktonin the Middle Atlantic Bight. Fishery Bulletin 79(4): 705-726.
Kingsford, M.J. and J.H. Choat. 1989. Horizontal distribution patterns of presettlement reeffish: Are they influenced by the proximity of reefs. Marine Biology 101: 285-297.
Kingsford, M.J. 1993. Biotic and abiotic structure in the pelagic environment: importance tosmall fish. Bulletin of Marine Science 53: 393-415.
Krebs, C. J. 1999. Ecological Methodology, second edition. Addison-Wesley EducationalPublishers Incorporated. Reading, Massachusetts.
Lang, K.L., C.B. Grimes, and R.F. Shaw. 1994. Variations in the age and growth of yellowfintuna larvae, Thunnus albacares, collected about the Mississippi River plume.Environmental Biology of Fishes 39: 259-270.
Leis, J.M. 1986. Vertical and horizontal distribution of fish larvae near coral reefs at LizardIsland, Great Barrier Reef. Marine Biology. 90: 505-516.
Leis, J.M. 1991. Vertical distribution of fish larvae in the Great Barrier Reef Lagoon, Australia.Marine Biology 109: 157-166.
Leis, J.M. and J.M. Miller. 1976. Offshore distributional patterns of Hawaiian fish larvae.Marine Biology 36: 359-367.
Leis, J.M. and D.S. Rennis. 2000a. Synodontidae. In: J.M. Leis and B.M. Carson-Ewart, eds.The larvae of Indo-Pacific coastal fishes: an identification guide to marine fish larvae.Fauna Malesiana Handbooks. Boston, MA: Brill Publishing. 850 pp.
Leis, J.M. and D.S. Rennis. 2000b. Holocentridae. In: J.M. Leis and B.M. Carson-Ewart, eds.The larvae of Indo-Pacific coastal fishes: an identification guide to marine fish larvae.Fauna Malesiana Handbooks. Boston, MA: Brill Publishing. 850 pp.
Limouzy-Paris, C., M.F. McGowan, W.J. Richards, J.P. Umaran and S.S. Cha. 1994. Diversityof fish larvae in the Florida Keys: Results from SEFCAR. Bulletin of Marine Science54(3): 857-870.
104
Lindeman, K.C. 1989. Coastal construction, larval settlement and early juvenile habitat use ingrunts, snappers and other coastal fishes of southeast Florida. Bulletin of Marine Science44: 1068.
Magurran, A.E. 1988. Ecological Diversity and Its Measurement. Princeton: PrincetonUniversity Press.
McGowan, M.F. 1985. Ichthyoplankton of the Flower Garden Banks, northwest Gulf ofMexico. Ph.D. Dissertation. University of Miami, Miami, Florida.
Meekan, M.G., M.J. Milicich, and P.J. Doherty. 1993. Larval production drives temporalpatterns of larval supply and recruitment of a coral reef damselfish. Marine EcologyProgress Series 93: 217-225.
McClure, M.R. and J.D. McEachern. 1992. Hybridization between Prionotus alatus andPrionotus paralatus in the northern Gulf of Mexico. Copeia 4: 1039-46.
Parker, R.H. 1960. Ecology and distributional pattern of marine invertebrates, northern Gulf ofMexico. In: Shepard, F.P., F.B. Phleger and T.H. van Andel, eds. Recent Sediments,Northwest Gulf of Mexico. American Association of Petroleum Geologists.
Patillo, M.E., T.E. Czapla, D.M. Nelson, and M.E. Monaco. 1997. Distribution and abundanceof fishes and invertebrates in Gulf of Mexico estuaries, Volume II: Species life historysummaries. ELMR Report Number 11, NOAA/NOS Strategic EnvironmentalAssessments Division, Silver Spring.
Pickering, H. and D. Whitmarsh. 1997. Artificial reefs and fisheries exploitation: a review ofthe 'attraction versus production' debate, the influence of design and its significance forpolicy. Fisheries Research 31: 39-59.
Pitcher, C.R. 1988. Spatial variation in the temporal pattern of recruitment of a coral reefdamselfish. Proceedings of the International Coral Reef Symposium, 6th 2: 811-816.
Richards, W.J. 1984. Kinds and abundances of fish larvae in the Caribbean Sea and adjacentareas. NOAA Technical Report NMFS SSRF-776.
Richards, W.J., M.F. McGowan, T. Leming, J.T. Lamkin, and S. Kelley. 1993. Larval fishassemblages at the Loop Current boundary in the Gulf of Mexico. Bulletin of MarineScience 53(2): 475-537.
Robertson, D.R. 1991. The role of adult biology in the timing of spawning of tropical reeffishes. In: Sale, P.F., ed. The Ecology of Fishes on Coral Reefs. San Diego: AcademicPress.
Robertson, D.R., D.G. Green, and B.C. Victor. 1988. Temporal coupling of production andrecruitment of larvae of a Caribbean reef fish. Ecology 69: 370-381.

105
Robins, C.R., G.C. Ray, and J. Douglass. 1986. A Field Guide to the Atlantic Coast Fishes ofNorth America. Houghton Mifflin Company, Boston, MA. 354 pp.
Robins, C.R., R.M. Bailey, C.E. Bond, J.R. Brooker, E.A. Lachner, R.N. Lea, and W.B. Scott.1991. Common and scientific names of fishes from the United States and Canada.American Fisheries Society Special Publication 20. American Fisheries Society,Bethesda, MD.
Rooker, J.R., G. D. Dennis, and D. Goulet. 1996. Sampling larval fishes with a nightlight lift-net in tropical inshore waters. Fisheries Research 26: 1-15.
Rooker, J.R., Q.R. Dokken, C.V. Pattengill, and G.J. Holt. 1997. Fish assemblages on artificialand natural reefs in the Flower Garden Banks National Marine Sanctuary. Coral Reefs16: 83-92.
Sabatés, A. and M. Pilar Olivar. 1996. Variation of larval fish distributions associated withvariability in the location of a shelf-slope front. Marine Ecology Progress Series 135: 11-20.
Sale, P.F. 1980. The ecology of fishes on coral reefs. Oceanography and Marine Biology 18:367-421.
SAS Institute, Inc. 1989. SAS/STAT Users Guide, Version 6. Cary: SAS Institute, Inc.
Scarborough-Bull, A. and J.J. Kendall, Jr. 1994. An indication of the process: offshoreplatforms as artificial reefs in the Gulf of Mexico. Bulletin of Marine Science 55: 1086-1098.
SEAMAP (Southeast Area Monitoring and Assessment Program). 2000. Environmental andbiological atlas of the Gulf of Mexico 1998. Number 75. Gulf States Marine FisheriesCommission, Ocean Springs.
Shipp, R.L. 1992. Biogeography of Alabama’s marine fishes. In: Boschung, H.T., Jr., ed.Catalog of freshwater and marine fishes of Alabama. Alabama Museum of NaturalHistory Number 14: 7-9.
Shulman, M.J. 1985. Recruitment of coral reef fishes: effects of distribution of predators andshelter. Ecology 66: 1056-1066.
Smith, G.B. 1976. Ecology and distribution of eastern Gulf of Mexico reef fishes. FloridaMarine Research Publications 19. 78 pp.
Sonnier, F., J. Teerling and H.D. Hoese. 1976. Observation on the offshore reef and platformfish fauna of Louisiana. Copeia 1976: 105-111.

106
Sponaugle, S. and R.K. Cowen. 1994. Larval durations and recruitment patterns of twoCaribbean gobies (Gobiidae): contrasting early life histories in demersal spawners.Marine Biology 120: 133-143.
SPSS, Inc. 1999. SYSTAT 9: Getting started. Chicago: SPSS, Inc.
Stanley, D.R. and C.A. Wilson. 2000. Seasonal and spatial variation in the biomass and sizefrequency distribution of fish associated with oil and gas platforms in the northern Gulfof Mexico. OCS Study MMS 2000-005. U.S. Department of the Interior, MineralsManagement Service, Gulf of Mexico OCS Region, New Orleans.
Sweatman, H.P.A. 1988. Field evidence that settling coral reef fish larvae detect resident fishesusing dissolved chemical cues. Journal of Experimental Marine Biology and Ecology124: 163-174.
Szedlmayer, S.T. and J. Conti. 1998. Nursery habitats, growth rates, and seasonality of age-0red snapper, Lutjanus campechanus, in the northeast Gulf of Mexico. Fishery Bulletin97: 626-635.
Thorrold, S.R. and D. McB. Williams. 1996. Meso-scale distribution patterns of larval andpelagic juvenile fishes in the central Great Barrier Reef Lagoon. Marine EcologyProgress Series. 145: 17-31.
Tolan, J.M. 2001. Patterns of reef fish larval supply to petroleum platforms in the northern Gulfof Mexico. Ph.D. dissertation. Louisiana State University, Baton Rouge.
Ursin, R. 1982. Stability and variability in the marine ecosystem. Dana Report 2: 51-67.
Victor, B.C. 1983. Recruitment and population dynamics of a coral reef fish. Science 219: 419-420.
Victor, B.C. 1986. Larval settlement and juvenile mortality in a recruitment-limited coral reeffish population. Ecological Monographs 56: 145-160.
Victor, B.C. 1987. Growth, dispersal, and identification of planktonic labrid and pomacentridreef-fish larvae in the eastern Pacific Ocean. Marine Biology 95: 145-152.
Watson, W. 1996a. Blenniidae: combtooth blennies. In: H.G. Moser, ed. The early life historystages of fishes in the California Current region. CalCOFI Atlas No. 33. Lawrence,Kansas: Allen Press, Inc.
Watson, W. 1996b. Pomacentridae: damselfishes. In: H.G. Moser, ed. The early life historystages of fishes in the California Current region. CalCOFI Atlas No. 33. Lawrence,Kansas: Allen Press, Inc.

107
Watson, W. 2000. Blenniidae. In: J.M. Leis and B.M. Carson-Ewart (eds). The larvae of Indo-Pacific coastal fishes: an identification guide to marine fish larvae. Fauna MalesianaHandbooks. Boston, MA: Brill Publishing. 850 pp.
Williams, D. McB. 1983. Daily, monthly, and yearly variability in recruitment of a guild ofcoral reef fishes. Marine Ecology Progress Series 10: 231-237.
Zar, J.H. 1984. Biostatistical Analysis. Englewood Cliffs, New Jersey: Prentice Hall. 718 pp.