Office of School Improvement School Improvement. 2 Mid-year Report.
70
Office of Office of School Improvement School Improvement
-
Upload
frederick-francis -
Category
Documents
-
view
216 -
download
0
Transcript of Office of School Improvement School Improvement. 2 Mid-year Report.

Office of Office of School ImprovementSchool Improvement

2
Mid-yearReport
3
Get Ready!!
I’ve got READING! Who has
Mathematics?
Did EESAC
see this?
• Make sure that you have a quorum at this EESAC meeting.
• Post minutes to reflect that the EESAC reviewed both the data and narrative reports.
• Make sure that you have a quorum at this EESAC meeting.
• Post minutes to reflect that the EESAC reviewed both the data and narrative reports.

4
2010-2011 Mid-Year Narrative Report
All DA schools (298) must submit a Mid-Year Data Report and a Mid-Year Narrative Report for: • reading in grades K-2 (FAIR) - NEW; • reading in grades 3-10;• mathematics in grades 3-8 and 10th; • Algebra I (9th grade); and • writing and science for those grade levels tested. • Geometry is optional. This data is required and must be reported as it appears on the District generated data sheet for all students in grades 3-10 for reading, mathematics, and writing. In science, the data is only required for the category “all students” in the grade levels tested. Report for subgroups in reading, mathematics, and writing who did not make AYP during the prior school year.
5
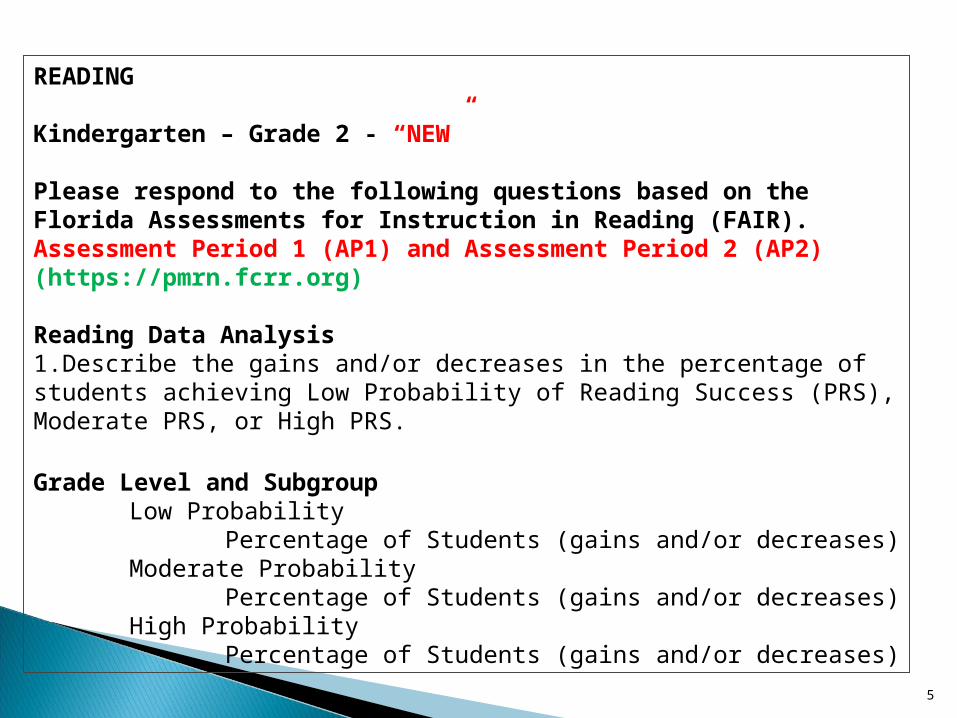
READING Kindergarten – Grade 2 - “NEW” Please respond to the following questions based on the Florida Assessments for Instruction in Reading (FAIR). Assessment Period 1 (AP1) and Assessment Period 2 (AP2) (https://pmrn.fcrr.org) Reading Data Analysis1.Describe the gains and/or decreases in the percentage of students achieving Low Probability of Reading Success (PRS), Moderate PRS, or High PRS.
Grade Level and SubgroupLow Probability
Percentage of Students (gains and/or decreases)Moderate Probability
Percentage of Students (gains and/or decreases)High Probability
Percentage of Students (gains and/or decreases)
6
7

8
9

10
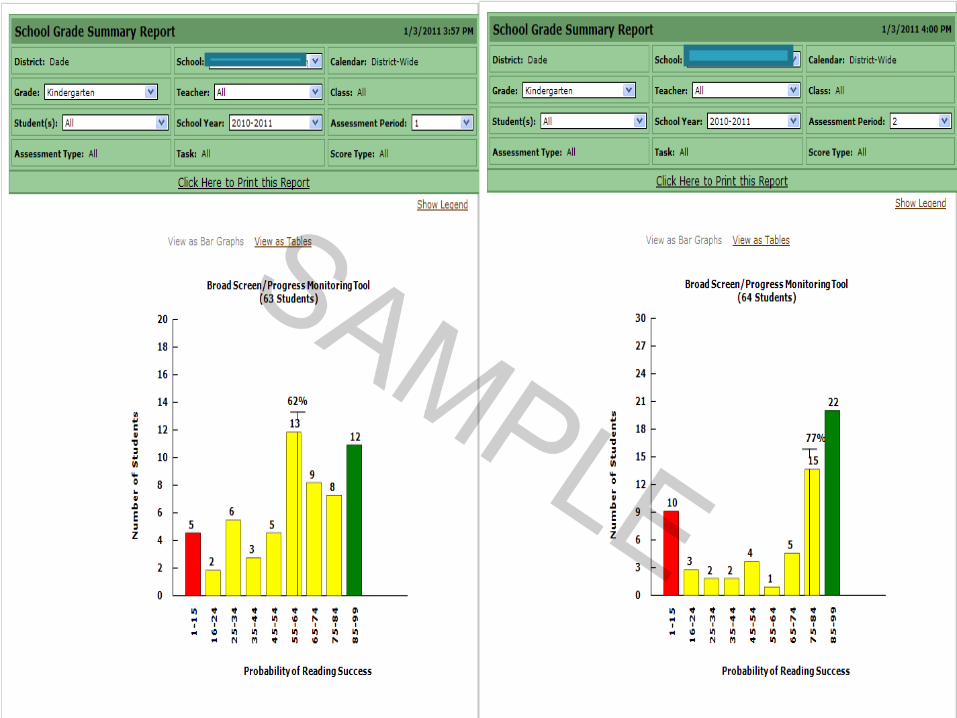
Data gathered from FAIR, Probability of Reading Success (PRS) reports, indicate growth in Reading by all grade levels from the Assessment Period 1 (AP1) to Assessment Period 2 (AP2). After analyzing the data for the total number of students in the “Population” category, it is evident that there has been an increase in the percentage of students achieving High Probability (HP) and Moderate Probability (MP), and a decrease in the percentage of students achieving Low Probability (LP). •In kindergarten there was a gain of 10 in the percentage of students achieving HP, an increase of 15 in the percentage of students achieving MP, and a decrease of 5 in the percentage of students achieving LP. •In first grade there was a gain of 12 in the percentage of students achieving HP, an increase of 18 in the percentage of students achieving MP, and a decrease of 7 in the percentage of students achieving LP.•In second grade there was a gain of 15 in the percentage of students achieving HP, an increase of 8 in the percentage of students achieving MP, and a decrease of 9 in the percentage of students achieving LP. •The ELL (2010 FCAT designation of non-AYP for the school) subgroup showed increases of 3 in the percentage of students achieving HP and 5 in the percentage of students achieving MP, and a decrease of 16 in the percentage of students achieving LP.

11
2. Describe the specific strategies or school improvement activities that have contributed to INCREASES in the percentage of students achieving a High PRS. Please be specific for each grade level and/or category (subgroup).Should be written in past tense. If there have been no increases, include a sentence for each grade level and/or category (subgroup) stating so, and the instructional focus will be addressed in subsequent responses.
Emphasis on strategies preferably include strategies from the 2010-2011 School Improvement Plan (SIP), but may be any strategy, including PD, implemented prior to February 11, 2011.
•Specific Strategies that contributed to increases in Students Achieving High PRS report by:
• Specific Grade level • Subgroup(s)

12
Data gathered from PMRN reports indicate:• Kindergarten students demonstrated a gain of 10 in the percentage of
students achieving High PRS (HP), this is due to the implementation of a rotation schedule for small group instruction during the reading instructional block. Concepts of Print, Phonological Awareness and Phonics instruction was provided and reinforced in these small groups by the classroom teachers and a paraprofessional.
• Students in first grade demonstrated an increase of 12 in the percentage of students achieving HP, this is due to a schedule of intervention times created in teacher schedules to facilitate the implementation of tutoring utilizing Voyager Passport while increasing the utilization of SuccessMaker, Accelerated Reader and Riverdeep.
• Second grade students demonstrated a gain of 15 in the percentage of students achieving HP. In addition to the implementation of tutoring using Voyager Passport, second grade students were provided rigorous word study strategies for deriving word meanings from affixes, root words, synonyms and antonyms, and graphic organizers were used to identify text features, organize information and to interpret meaning from text.
• The English Language Learner (ELL) subgroup also achieved a gain of 3 in the percentage of students scoring HP by utilizing computerized tutoring programs such as SuccessMaker, Ticket to Read and Riverdeep (Destino Lectura K-1) to enhance their reading curriculum.
TABLES MAY NOT BE INCLUDED; THEY WON’T UPLOAD.

13
3. Describe the changes to instruction, strategies, and/or school improvement activities that will be made to ensure students achieving Moderate PRS receive additional instruction at varying levels of intensity, and students achieving Low PRS receive intensive intervention to accelerate reading growth. Should be written in future tense.
Emphasis on strategies preferably in addition to strategies from the 2010-2011 School Improvement Plan (SIP), but may be any strategy, including PD, that will be implemented after February 11, 2011.
• Students Achieving Moderate PRS Varying Levels of Intensity
• Specific Strategies, Instruction and/or School Improvement Activity (change in intensity)
• Specific Grade level and/or Subgroup(s)
• Students Achieving Low PRS Intensive Intervention • Specific Strategies, Instruction and/or School
Improvement Activity (intense intervention)• Specific Grade level and/or Subgroups

14
Students in Kindergarten through Second grade achieving Moderate PRS will receive an additional 10 minutes of push-in, small group instruction. During this time, students will be grouped according to their needs as identified by the Targeted Diagnostic Inventory and Broad Diagnostic Inventory. Individualized instruction will be provided based on specific needs.
Students receiving a Low PRS will receive instruction targeting student’s specific deficiencies during the 30 minutes of intensive pull-out, individualized instruction based on their needs as identified by the Broad Diagnostic Inventory and the Targeted Diagnostic Inventory. Additionally, these students will be presented to the Response to Intervention (RtI) team for further recommendations.
Students in the SWD group will be provided with extended teacher directed instruction through Voyager Passport pull-out program. These students will also be provided with the use of Riverdeep, and Ticket to Read after school in an effort to boost achievement in areas identified as in need of improvement.

15
Emphasis on progress up to February 11, 2011, and will be continued.
Students receiving PRS of less than 85%:
Describe progress from Assessment Period 1 (AP1) to Assessment Period 2 (AP2)
Broad Diagnostic Inventory (BDI) – Compare using School Status Report the Listening Comprehension or Reading Comprehension for each of the tested grade levels.
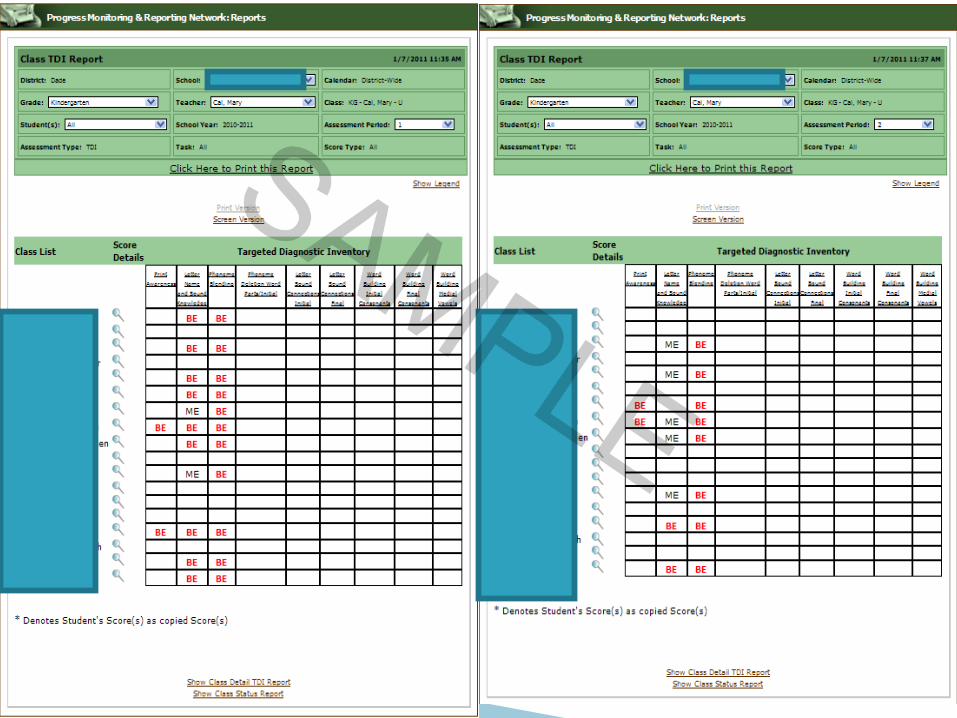
Tasks and Targeted Diagnostic Inventory Tasks (TDI) – Compare the percentage of students who scored ME (Meets Expectation) and BE (Below Expectation) in the TDI.
4. For students receiving a PRS of less than 85%, please describe the progress that is being made with Broad Diagnostic Inventory (BDI) Tasks and Targeted Diagnostic Inventory (TDI) Tasks.

16
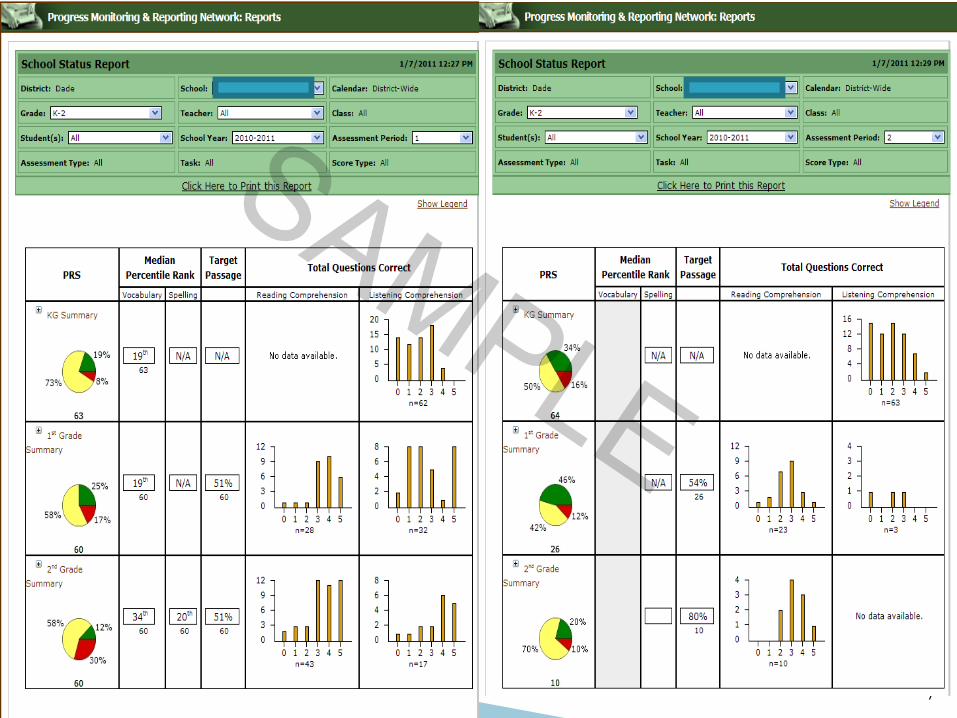
Using the Broad Diagnostic Inventory (BDI) School Status Report, the percent of students receiving a PRS of less than 85% decreased as follows:
Kindergarten - the percent of students receiving a PRS of less than 85% in Listening Comprehension or Vocabulary decreased from 76% in AP1 to 13% in AP2.
First Grade - the percent of students receiving a PRS of less than 85% in Listening Comprehension or Reading Comprehension decreased from 68% in AP1 to 46% in AP2.
Second Grade - the percent of students receiving a PRS of less than 85% in Listening Comprehension or Reading Comprehension decreased from 57% in AP1 to 32% in AP2.
Using the Tasks and Targeted Diagnostic Inventory Tasks (TDI), the percent of students required to take the TDI decreased as follows:
Kindergarten - the percent of students who scored ME increased from 5% to 25%.
First Grade - the percent of students who scored ME increased from 46% to 55%.
Second Grade - the percent of students who scored ME increased from 48% to 78%.
17
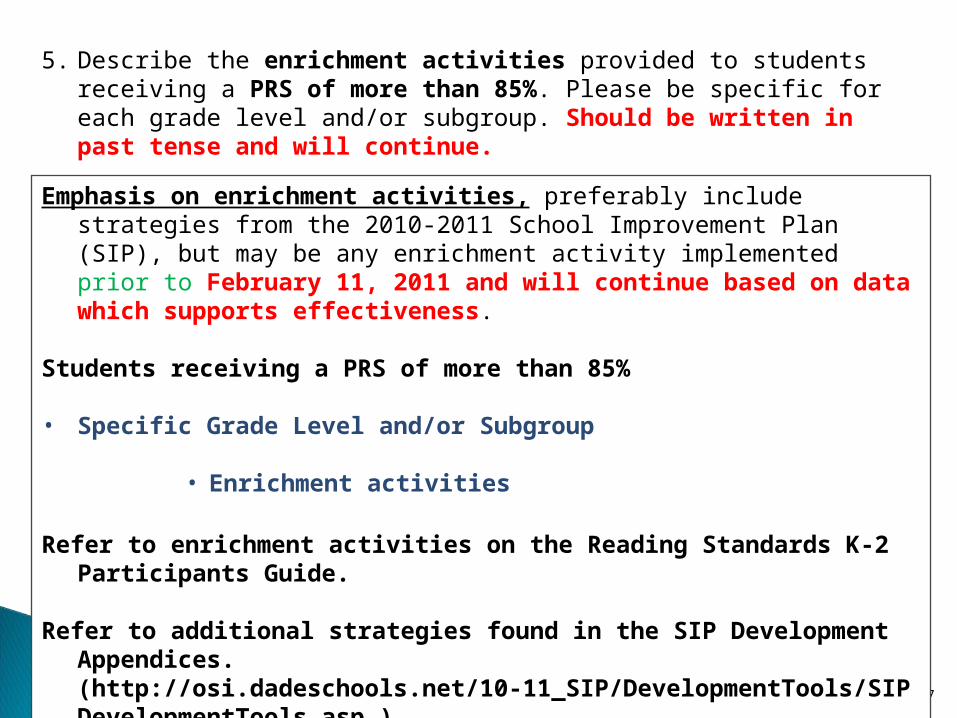
Emphasis on enrichment activities, preferably include strategies from the 2010-2011 School Improvement Plan (SIP), but may be any enrichment activity implemented prior to February 11, 2011 and will continue based on data which supports effectiveness.
Students receiving a PRS of more than 85%
• Specific Grade Level and/or Subgroup
• Enrichment activities
Refer to enrichment activities on the Reading Standards K-2 Participants Guide.
Refer to additional strategies found in the SIP Development Appendices. (http://osi.dadeschools.net/10-11_SIP/DevelopmentTools/SIPDevelopmentTools.asp )
5. Describe the enrichment activities provided to students receiving a PRS of more than 85%. Please be specific for each grade level and/or subgroup. Should be written in past tense and will continue.

18
Students receiving a PRS of more than 85% were and will continue to be provided the following enrichment activities:
Kindergarten students received small group instruction through the implementation of a rotation schedule during the reading block. In these small groups students received differentiated instruction based on their needs. They also received instruction from technology programs such as Ticket to Read, Riverdeep, and Waterford Early Reading Program.
First and Second grade students received enrichment and acceleration through project based learning, and an increased use of programs such as Quick Reads, Riverdeep, Time for Kids, Reading Plus, and Accelerated Reader. Additionally, students receiving a PRS of more than 85% were encouraged to create books, write poetry and reading selections should be inclusive of a wide variety of reading types, including substantive poetry that uses imagery.

19
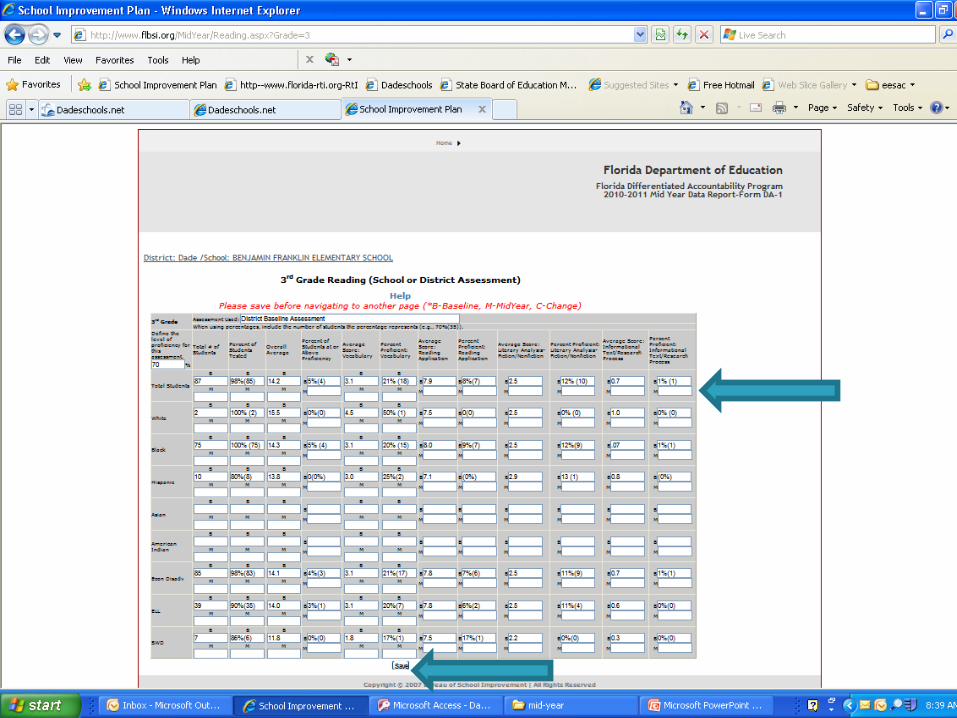
Grade 3 – 10 Please respond using comparisons between the District Baseline and Winter Interim Assessment (Administered January 2011). Responses may be written in a narrative or bulleted format.
Reading Data Analysis 1. Describe the gains and/or decreases in student achievement percentage points that have occurred between the Baseline and District Winter Interim Assessments. Include specific information about the grade levels or subgroups in which improvements or declines have occurred. (DATA based responses)
• Describe gains in Student Achievement Percentage Points• Grade level• Subgroup(s)• Percentage points of increase
• Describe decreases in Student Achievement Percentage Points• Grade level• Subgroup(s)• Percentage points of decrease
Use the wording “percent proficient” when referencing reporting categories data.
.

20
When comparing the Baseline Assessment to the District Winter Interim Assessment, data indicates that there has been an increase in student achievement percentage points in grades 3-5.
In the third grade, students increased 48 percentage points on the District Winter Interim Assessment when compared to the Baseline Benchmark Assessment. Within the four categories, the lowest percent proficient was in Informational Text/Research Process in which there was a decrease of 1 percentage point.
In the fourth grade, students gained 32 percentage points in reading on the District Winter Interim Assessment since the Baseline Benchmark Assessment. Areas of concern are Vocabulary and Informational Text/Research Process categories.
In the fifth grade, students gained 37 percentage points in reading on the District Winter Interim Assessment since the Baseline Benchmark Assessment was administered.
The Students With Disabilities subgroup demonstrated a 17 percentage point decrease on the District Winter Interim Assessment when compared to the Baseline Assessment.

21
2. Describe the specific strategies or school improvement activities that have contributed to increases in student achievement percentage points between the Baseline and District Winter Interim Assessment. Please be specific for each grade level and/or subgroup. Should be in the past tense.
Emphasis on strategies preferably include strategies from the 2010-2011 School Improvement Plan (SIP), but may be any strategy, including PD, implemented prior to February 11, 2011.
• Specific Strategies or School Improvement Activities that contributed to increases in Student Achievement Percentage Points (grade level or subgroup)
• Specific Grade level • Subgroup(s)
Use the wording “percent proficient” when referencing reporting categories data.

22
Specific strategies and school improvement activities that have contributed to the increase in the percentage of students achieving mastery in reading begin with the school-wide implementation of the Response to Intervention (RtI). •After each major assessment, teachers in grades 3 through 5 were provided with Edusoft reports which delineated the progress of each grade and AYP subgroup. Teachers then used the school site data protocols to review the assessments with students and hold “Data Chats.” In each class student groups were re-organized according to the deficiencies revealed by the data before specific benchmarks are addressed. If the need for extra reinforcement was evident, the student was recommended for the various tutorial opportunities available before and after school and on Saturdays. •Another strategy that has proven to be effective is the use of online applications such as Riverdeep, Reading Plus and FCAT Explorer where students in grades 3 through 5 have already completed more than 26,000 reading problems. •The promotion of reading is another strategy that has been quite helpful in raising reading scores. The utilization of programs such as Accelerated Reader and STAR Assessments, along with school-wide activities such as Family Literacy Night and Vocabulary Day have all been instrumental in increasing students’ interest in reading.
In the third grade, teachers used content area and informational text such as Time for Kids along with charts and graphs to address the deficiencies in Category 4: Informational Text/Research Process. Fourth grade teachers utilized informational text and content area vocabulary along with SuccessMaker to target deficiencies in Vocabulary and Category 4: Informational Text/Research Process. All Fifth grade classes utilized the content based materials to increase student mastery.
23
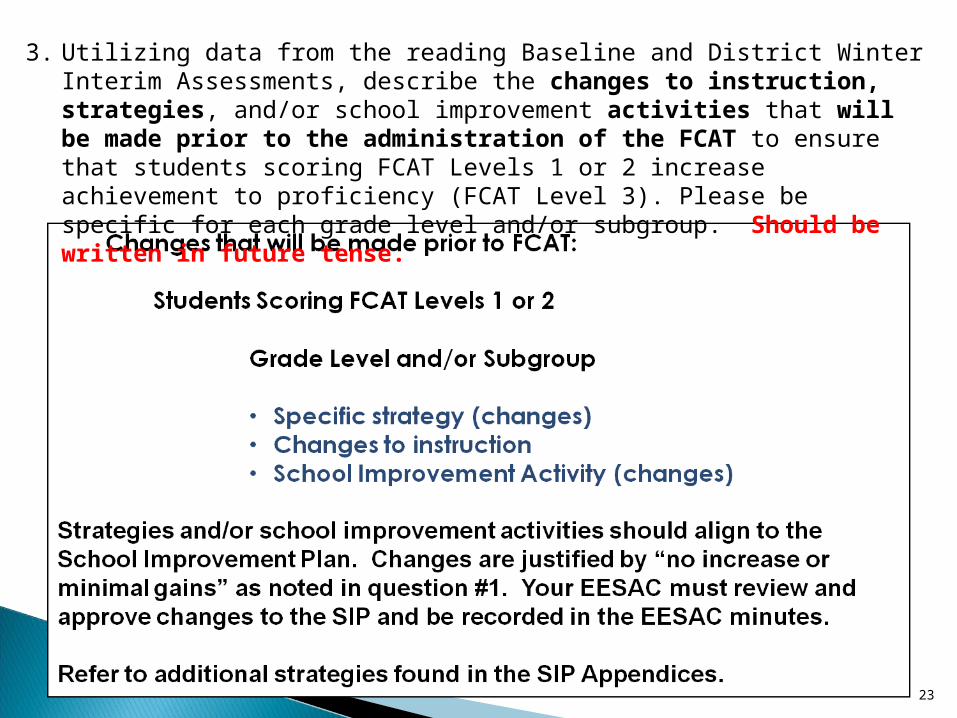
3. Utilizing data from the reading Baseline and District Winter Interim Assessments, describe the changes to instruction, strategies, and/or school improvement activities that will be made prior to the administration of the FCAT to ensure that students scoring FCAT Levels 1 or 2 increase achievement to proficiency (FCAT Level 3). Please be specific for each grade level and/or subgroup. Should be written in future tense.
24
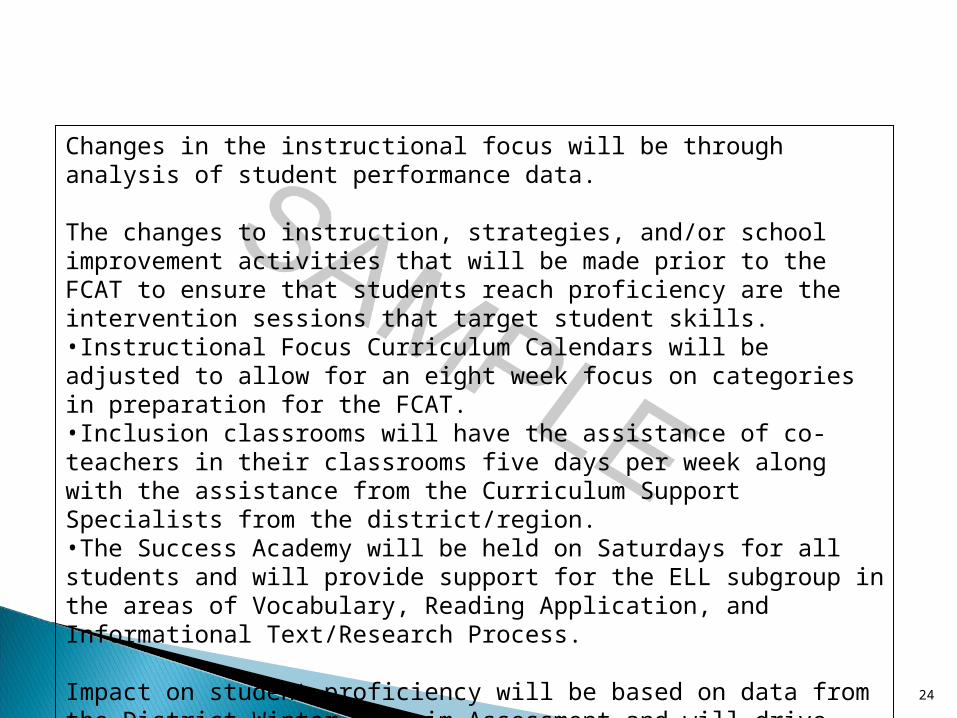
Changes in the instructional focus will be through analysis of student performance data.
The changes to instruction, strategies, and/or school improvement activities that will be made prior to the FCAT to ensure that students reach proficiency are the intervention sessions that target student skills. •Instructional Focus Curriculum Calendars will be adjusted to allow for an eight week focus on categories in preparation for the FCAT. •Inclusion classrooms will have the assistance of co-teachers in their classrooms five days per week along with the assistance from the Curriculum Support Specialists from the district/region. •The Success Academy will be held on Saturdays for all students and will provide support for the ELL subgroup in the areas of Vocabulary, Reading Application, and Informational Text/Research Process.
Impact on student proficiency will be based on data from the District Winter Interim Assessment and will drive instructional decisions.
25
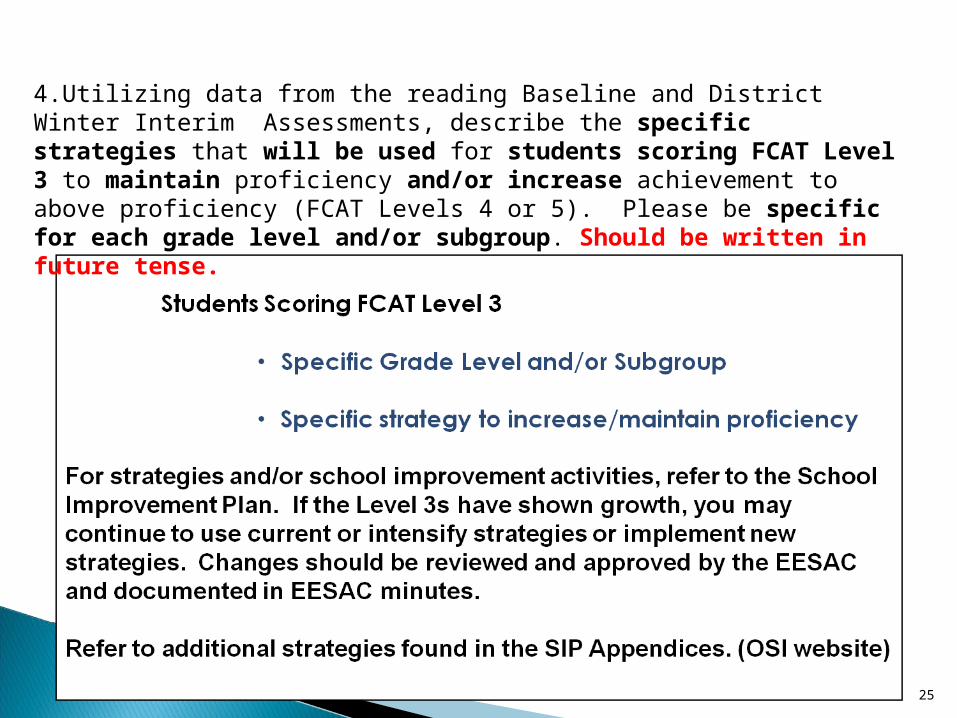
4.Utilizing data from the reading Baseline and District Winter Interim Assessments, describe the specific strategies that will be used for students scoring FCAT Level 3 to maintain proficiency and/or increase achievement to above proficiency (FCAT Levels 4 or 5). Please be specific for each grade level and/or subgroup. Should be written in future tense.

26
Students who scored Level 3 during the 2010 FCAT will be monitored using data from the Edusoft reports. This data will be analyzed by comparing growth from the Baseline to the District Winter Interim Assessments. •Specific strategies such as before/after school tutorials as well as Wednesday and Success Academies will be implemented for those students who fail to progress or show minimal progress. •Using District Winter Interim Assessment data to guide instruction, these sessions will focus on the re-teaching of non-mastered benchmarks. There will also be an increase in the amount of support for Voyager Intervention groups as a means of creating a smaller teacher to pupil ratio. Teachers will utilize Edusoft data in their Professional Learning Communities to adjust instruction in order to meet students’ needs. Additional software programs such as SuccessMaker, FCAT Explorer, and Riverdeep will be utilized to reinforce the strategies that are being taught. Additionally, the following specific strategies aligned to the data will be implemented for the students who showed growth from Baseline to District Winter Interim Assessments:
• Students in fourth grade will receive emphasis on descriptive, idiomatic and figurative language as this will assist them in reading as well as writing, and
• Students in fifth grade will emphasize Validity & Reliability, as this is a new area to be tested this year.

27

Students who scored Level 4 and 5 during the 2010 FCAT will be closely monitored by gathering data from the Edusoft reports. This data will be analyzed to monitor their growth when comparing the Baseline to the District Winter Interim Assessments.
Project-based learning and enrichment strategies will be implemented with students maintaining proficiency. Based on Webb’s Levels of Complexity, Moderate and High Complexity level questions as well as the Socratic Method will be frequently used with these students.
Additionally, these students will use the Houghton/Mifflin (HM) “Challenge” novels Leveled Readers in order to provide them with exposure to above grade level materials.
The following strategies will be implemented at specific grade levels: Students in fourth grade will utilize the Elements of Reading Vocabulary as
a means to provide above grade level vocabulary instruction. Students in fifth grade will be exposed to poetry and a wide variety of
literature through the implementation of Literature Circles.
28
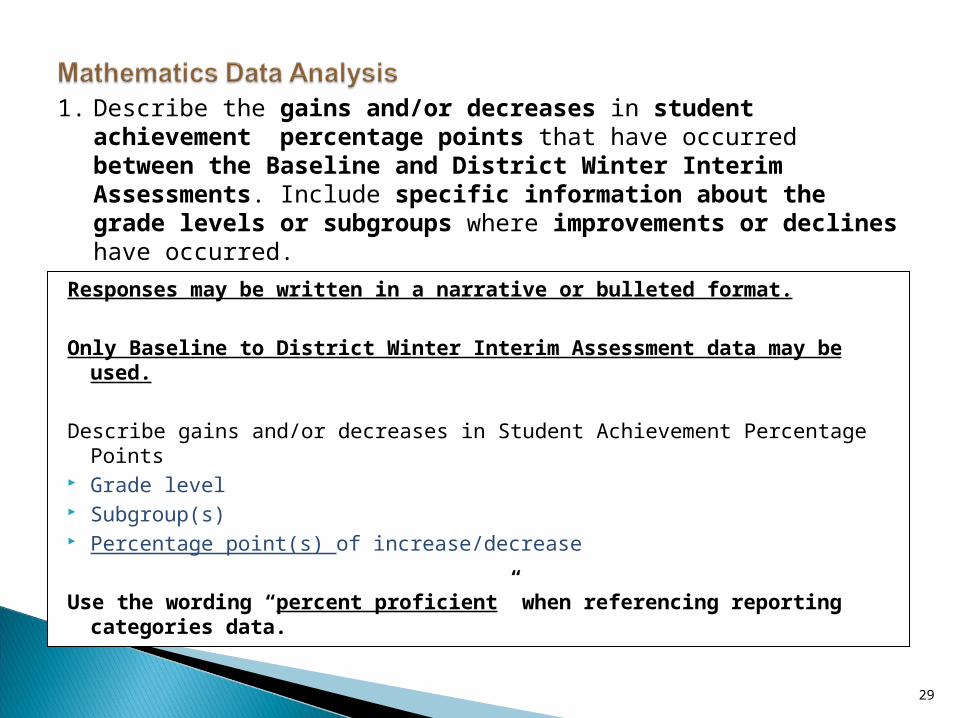
Responses may be written in a narrative or bulleted format.
Only Baseline to District Winter Interim Assessment data may be used.
Describe gains and/or decreases in Student Achievement Percentage Points Grade level Subgroup(s) Percentage point(s) of increase/decrease
Use the wording “percent proficient” when referencing reporting categories data.
29
1. Describe the gains and/or decreases in student achievement percentage points that have occurred between the Baseline and District Winter Interim Assessments. Include specific information about the grade levels or subgroups where improvements or declines have occurred.
30
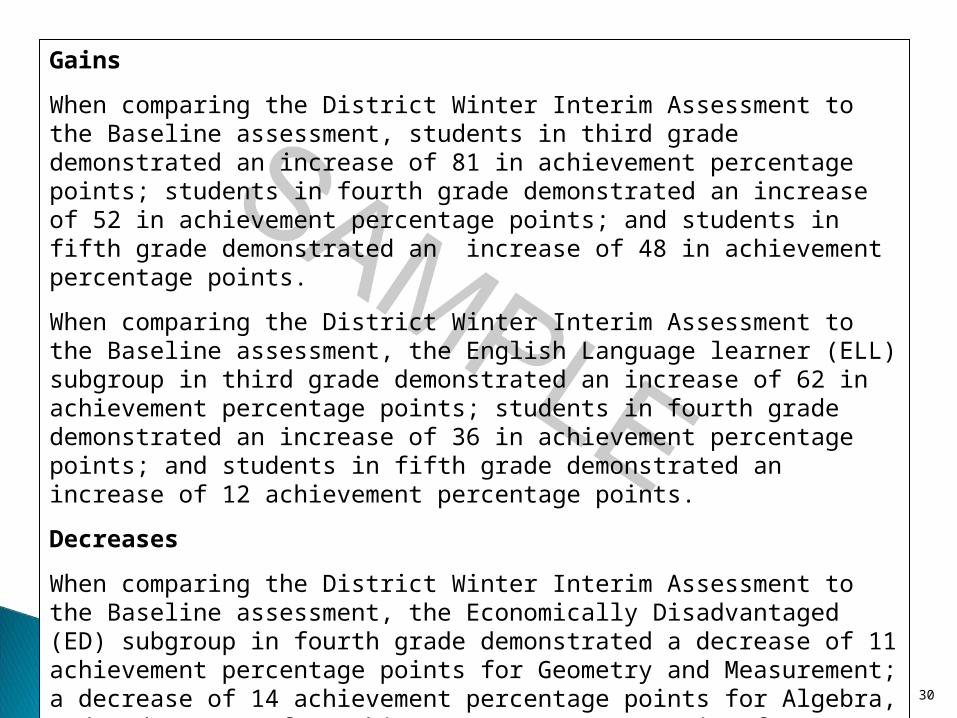
Gains
When comparing the District Winter Interim Assessment to the Baseline assessment, students in third grade demonstrated an increase of 81 in achievement percentage points; students in fourth grade demonstrated an increase of 52 in achievement percentage points; and students in fifth grade demonstrated an increase of 48 in achievement percentage points.
When comparing the District Winter Interim Assessment to the Baseline assessment, the English Language learner (ELL) subgroup in third grade demonstrated an increase of 62 in achievement percentage points; students in fourth grade demonstrated an increase of 36 in achievement percentage points; and students in fifth grade demonstrated an increase of 12 achievement percentage points.
Decreases
When comparing the District Winter Interim Assessment to the Baseline assessment, the Economically Disadvantaged (ED) subgroup in fourth grade demonstrated a decrease of 11 achievement percentage points for Geometry and Measurement; a decrease of 14 achievement percentage points for Algebra, and a decrease of 1 achievement percentage point for Data Analysis.

31
2. Describe the specific strategies or school improvement activities that have contributed to increases in student achievement percentage points between the baseline and District Winter Interim Assessments. Please be specific for each grade level and/or subgroup.
Should be written in past tense. If there have been no increases, include a sentence for each grade level and/or subgroup stating so, and the instructional focus will be addressed in subsequent responses.
Emphasis on strategies, preferably from the 2010-2011 School Improvement Plan (SIP), but may be any strategy, including PD, implemented before February 11, 2011.
Specific Strategies or School Improvement Activities that contributed to increases in Student Achievement Percentage Points by:•Specific Grade level •Subgroup(s)
Use the wording “percent proficient” when referencing reporting categories data.

32
Specific strategies and school improvement activities that contributed to the increase in the percentage of students achieving proficiency in mathematics begin with the school-wide implementation of the Florida Continuous Improvement Model (FCIM) and Response to Intervention (RtI). •After each major assessment, teachers in third through fifth grades are provided with custom group reports from Edusoft delineating the progress of each AYP subgroup. Teachers then review the assessments with students and hold “Data Chats”. In each class student groups are reorganized according to deficiencies revealed by the data before specific benchmarks are addressed. If the need for extra reinforcement is evident, the student is recommended for the various tutorial opportunities available before and after school and on Saturdays. •Another strategy that has proven to be effective is the use of online applications such as Voyager Math, SuccessMaker, Gizmos and Math Explorer. Tied directly with the success students are experiencing in mathematics is the enrollment of the lowest 25% students in intervention classes as well as identified students participating in enrichment. •We have also been providing math tutorials for the ELL subgroup in grades 3-5 after school.

33
3. Utilizing data from the mathematics Baseline and District Winter Interim Assessments, describe the changes to instruction, strategies, and/or school improvement activities that will be made prior to the administration of the FCAT to ensure that students scoring FCAT Levels 1 or 2 increase achievement to proficiency (FCAT Level 3). Please be specific for each grade level and/or subgroup. Should be written in future tense to reflect changes after February 11, 2011.

34
Although students in fifth grade did not show any decreases in total achievement percentage points, students demonstrated a decrease in achievement percentage points in Geometry and Measurement. We will enhance visual and kinesthetic models and representations with which students can work.
Students in fourth grade demonstrated a decrease in achievement percentage points for Geometry and Measurement and Base Ten and Fractions. In order to address these reporting categories, professional development will be offered to the teachers and we will increase the frequency and duration of the use of Gizmos.
ELL students in fourth grade demonstrated a decrease in achievement percentage points for Geometry and Measurement and Base Ten and Fractions. In order to address these reporting categories, we will increase the frequency and duration of the use of Gizmos. In addition, we will target these areas within the after-school care ELL mathematics tutorial program.

35
4. Utilizing data from the mathematics Baseline and District Winter Interim Assessments, describe the specific strategies that will be used for students scoring FCAT Level 3 to maintain proficiency and/or increase achievement to above proficient (FCAT Levels 4 or 5). Please be specific for each grade level and/or subgroup.
36
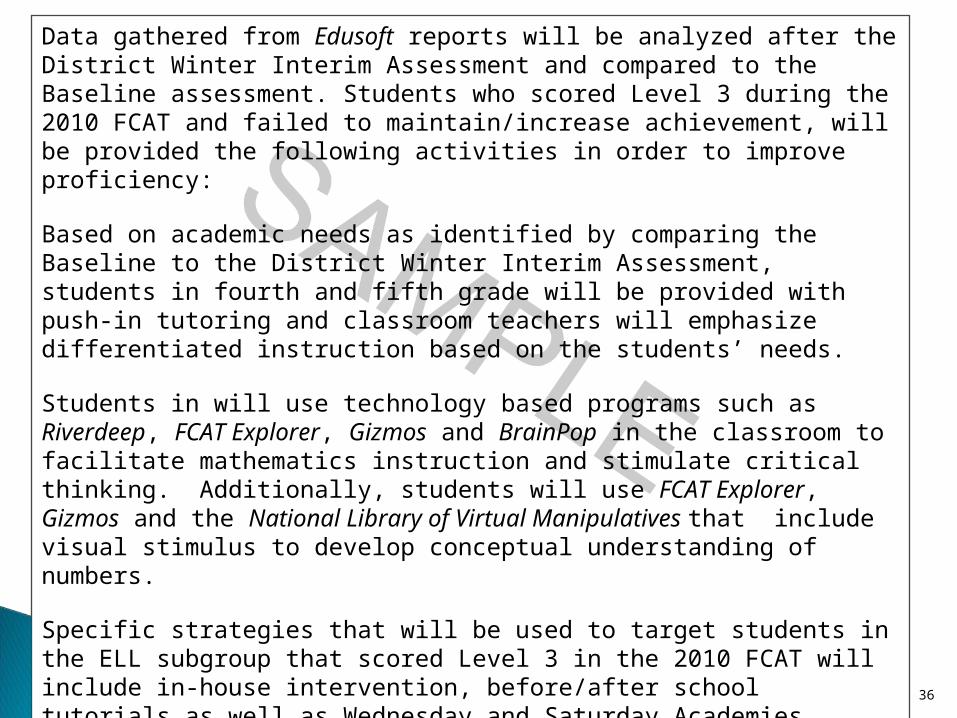
Data gathered from Edusoft reports will be analyzed after the District Winter Interim Assessment and compared to the Baseline assessment. Students who scored Level 3 during the 2010 FCAT and failed to maintain/increase achievement, will be provided the following activities in order to improve proficiency:
Based on academic needs as identified by comparing the Baseline to the District Winter Interim Assessment, students in fourth and fifth grade will be provided with push-in tutoring and classroom teachers will emphasize differentiated instruction based on the students’ needs.
Students in will use technology based programs such as Riverdeep, FCAT Explorer, Gizmos and BrainPop in the classroom to facilitate mathematics instruction and stimulate critical thinking. Additionally, students will use FCAT Explorer, Gizmos and the National Library of Virtual Manipulatives that include visual stimulus to develop conceptual understanding of numbers.
Specific strategies that will be used to target students in the ELL subgroup that scored Level 3 in the 2010 FCAT will include in-house intervention, before/after school tutorials as well as Wednesday and Saturday Academies utilizing graphic organizers, audio/visuals and cooperative learning. Using District Winter Interim Assessment data to guide instruction, the school tutorial sessions are strictly for the re-teaching of non-proficient benchmarks.

37
5. Utilizing data from the mathematics Baseline and District Winter Interim Assessments, describe the activities designed for students scoring FCAT Levels 4 or 5 to maintain above level proficiency and provide enrichment. Please be specific for each grade level and/or subgroup.

38
Following the District Winter Interim Assessment, data gathered from Edusoft reports will be analyzed and compared to the Baseline Assessment. Students who scored Level 4 and 5 during the 2010 FCAT and failed to maintain/increase proficiency, will be provided with the following activities in order to maintain proficiency:
Differentiated Instruction will be provided to these students based on areas that they have failed to maintain and/or increase proficiency.
Teachers will use open-ended questioning techniques that encourage student inquiry, encouraged students to pose their own questions in order to evaluate the information presented, and make informed decisions about the information. These students will also be given opportunities to develop exploration and inquiry activities to maintain or increase an understanding of skills through hands-on experiences with grade level appropriate real life problems. Additionally, they will be engaged in student leveled, enrichment materials in technology such as Gizmos, Riverdeep or the National Library of Virtual Manipulatives that include visual stimulus to develop conceptual understanding of numbers.
Students in fourth and fifth grades participated in the Math Bowl during the month of November and students in third grade participated in the Math Bowl in January. We will continue in-house competition among classrooms in order to maintain proficiency.
Particular attention will be provided to SWD students who scored Level 4 and 5 during the 2010 FCAT. Following an analysis of the Baseline and District Winter Interim Assessment, students who failed to maintain proficiency will receive push-in instruction from the SWD teacher.
39
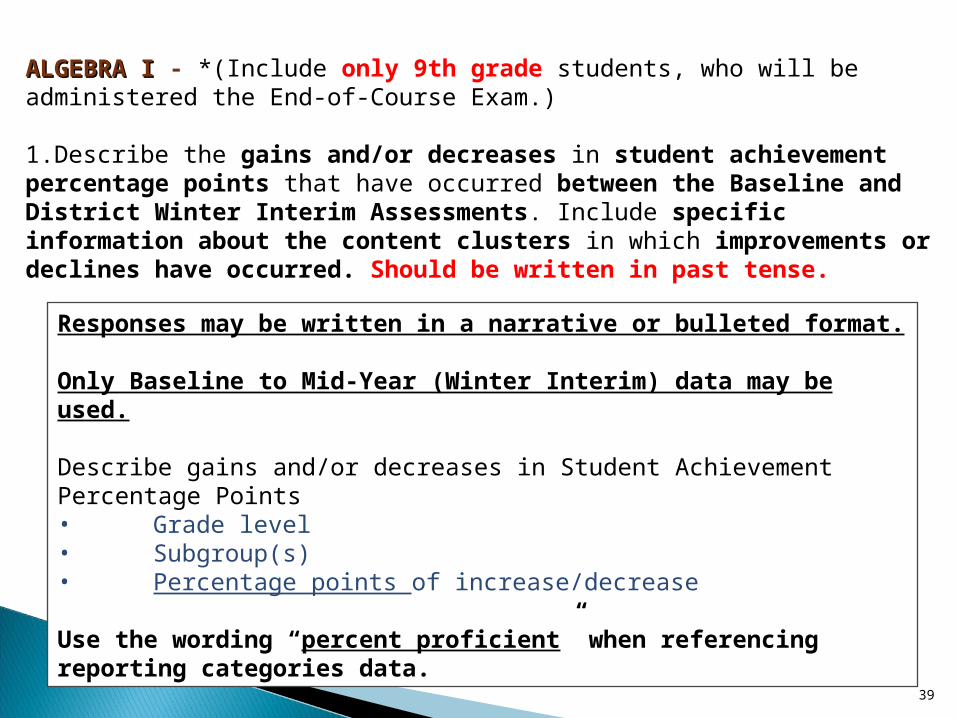
ALGEBRA I ALGEBRA I - *(Include only 9th grade students, who will be administered the End-of-Course Exam.)
1.Describe the gains and/or decreases in student achievement percentage points that have occurred between the Baseline and District Winter Interim Assessments. Include specific information about the content clusters in which improvements or declines have occurred. Should be written in past tense.
Responses may be written in a narrative or bulleted format.
Only Baseline to Mid-Year (Winter Interim) data may be used.
Describe gains and/or decreases in Student Achievement Percentage Points• Grade level• Subgroup(s)• Percentage points of increase/decrease
Use the wording “percent proficient” when referencing reporting categories data.
40
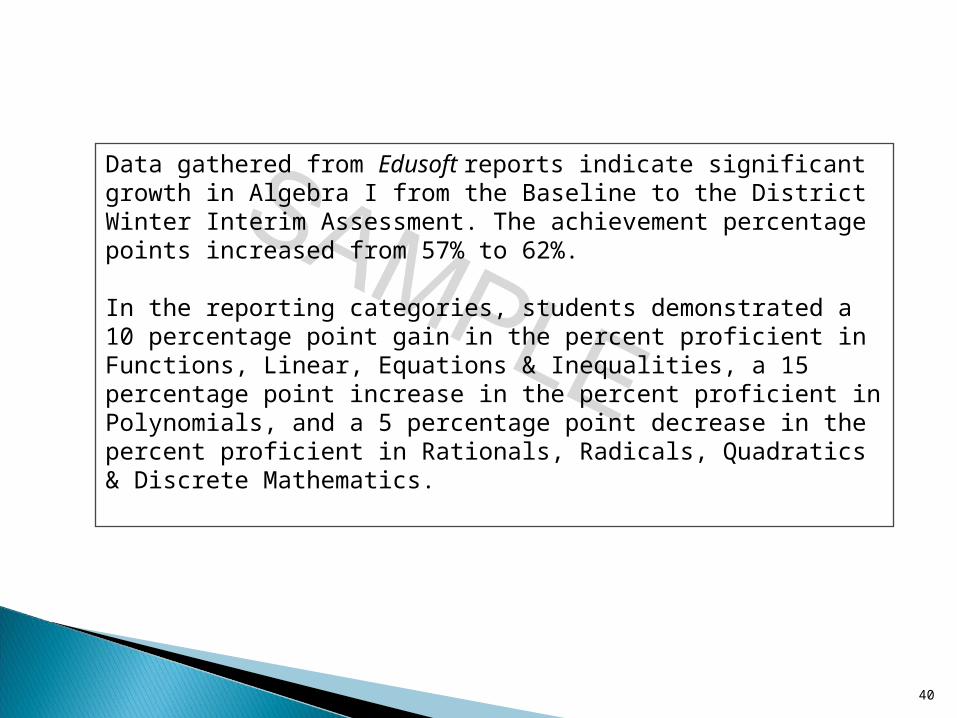
Data gathered from Edusoft reports indicate significant growth in Algebra I from the Baseline to the District Winter Interim Assessment. The achievement percentage points increased from 57% to 62%.
In the reporting categories, students demonstrated a 10 percentage point gain in the percent proficient in Functions, Linear, Equations & Inequalities, a 15 percentage point increase in the percent proficient in Polynomials, and a 5 percentage point decrease in the percent proficient in Rationals, Radicals, Quadratics & Discrete Mathematics.

41
2. Utilizing data from the Baseline and District Winter Interim Assessments, describe changes to instruction, strategies, and/or school improvement activities that will be made prior to the administration of the Algebra EOC to ensure that students achieve proficiency. Should be written in future tense.

42
There was a 5 percentage point increase in the number of students at or above proficiency; however, there was a 5 percentage point decrease in the percent proficient in the Rationals, Radicals, Quadratics & Discrete Mathematics cluster.
Data gathered from the Baseline and District Winter Interim Assessments was analyzed and an item analysis took place. Based on the results of the data, the following strategies will be implemented:
•Professional Development will be provided by the math coach addressing the benchmarks covered by this cluster.•Students will be grouped according to their needs, and push-in, small group instruction will be provided by the interventionist. •Students who demonstrate exceptional difficulties will be referred to the Response to Intervention (RtI) team.

43
Writing Data AnalysisWriting Data Analysis
1.Describe the gains and/or decreases in student achievement percentage points that have occurred between the Baseline and District Winter Interim Assessments. Include specific information about the grade levels or subgroups in which improvements or declines have occurred.
Responses may be written in a narrative or bulleted format.
Schools will only generate data for tested grade levels (4th, 8th, and 10th grades).
Describe gains/decreases in Student Achievement Percentage Points in each of the two prompts.• Grade level • Subgroup(s)• Percentage points of increase/decrease
44
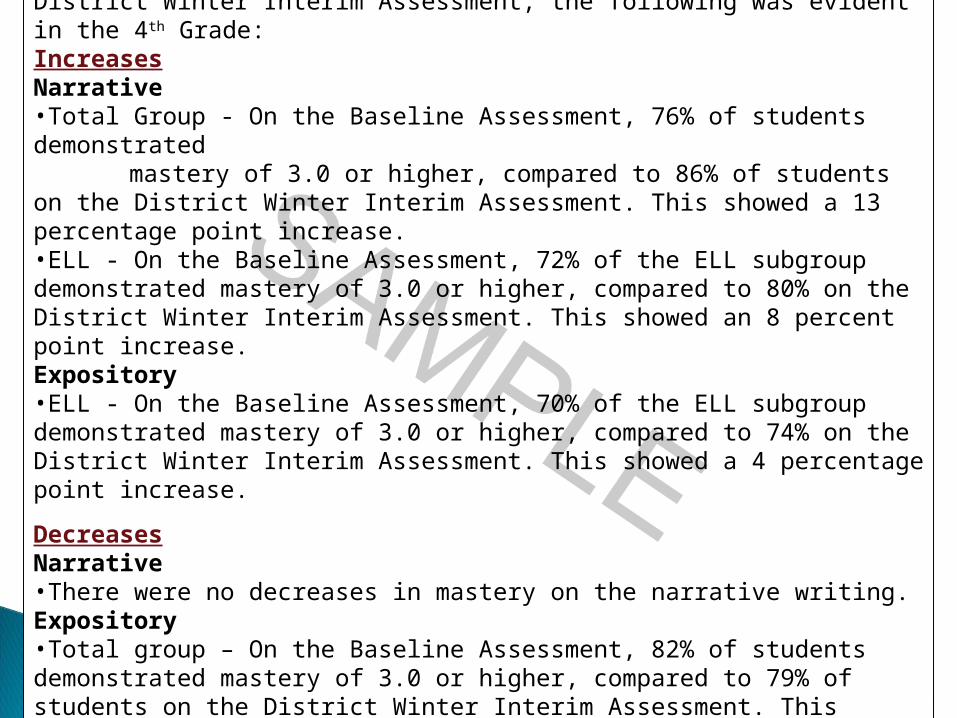
Based on the comparison between the Baseline Assessment and District Winter Interim Assessment, the following was evident in the 4th Grade:Increases Narrative •Total Group - On the Baseline Assessment, 76% of students demonstrated
mastery of 3.0 or higher, compared to 86% of students on the District Winter Interim Assessment. This showed a 13 percentage point increase.•ELL - On the Baseline Assessment, 72% of the ELL subgroup demonstrated mastery of 3.0 or higher, compared to 80% on the District Winter Interim Assessment. This showed an 8 percent point increase. Expository•ELL - On the Baseline Assessment, 70% of the ELL subgroup demonstrated mastery of 3.0 or higher, compared to 74% on the District Winter Interim Assessment. This showed a 4 percentage point increase.
Decreases Narrative•There were no decreases in mastery on the narrative writing. Expository•Total group – On the Baseline Assessment, 82% of students demonstrated mastery of 3.0 or higher, compared to 79% of students on the District Winter Interim Assessment. This showed a 3 percentage point decrease.

45
2. Describe the specific strategies or school improvement activities that have contributed to increases in student achievement percentage points between the Baseline and District Winter Interim Assessments. Please be specific for each grade level and/or subgroup. Should be written in past tense.
Emphasis on strategies, preferably from the 2010-2011School Improvement Plan (SIP), but may be any strategy, including PD.
Specific Strategies/School Improvement Activities which contributed to increases in Student Achievement Percentage Points • Specific Grade level • Subgroup(s)
Specific strategies and school improvement activities that have contributed to the increase in the percentage of students achieving mastery in writing include:•The establishment of a Wednesday Writing Academy for intervention and the formation of the Journalism Club for enrichment;•The school has implemented the District’s Key to Effective Writing program. Teachers continue to use anchor papers and the 6-point rubric as instruments of instruction in the classroom; •Spanish teachers have also begun to teach the writing process through the Spanish curriculum; and •The ongoing professional development of teachers through programs, such as the “Writing Institute”, has contributed to the rise in students’ writing scores.
46
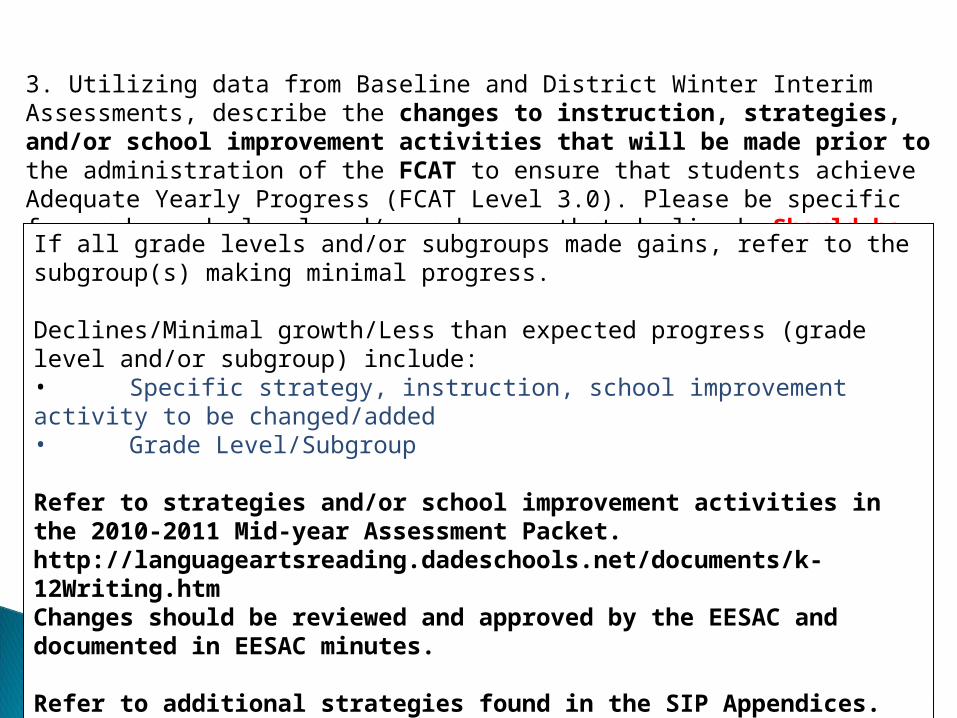
3. Utilizing data from Baseline and District Winter Interim Assessments, describe the changes to instruction, strategies, and/or school improvement activities that will be made prior to the administration of the FCAT to ensure that students achieve Adequate Yearly Progress (FCAT Level 3.0). Please be specific for each grade level and/or subgroup that declined. Should be written in future tense.
If all grade levels and/or subgroups made gains, refer to the subgroup(s) making minimal progress.
Declines/Minimal growth/Less than expected progress (grade level and/or subgroup) include: • Specific strategy, instruction, school improvement activity to be changed/added • Grade Level/Subgroup
Refer to strategies and/or school improvement activities in the 2010-2011 Mid-year Assessment Packet. http://languageartsreading.dadeschools.net/documents/k-12Writing.htm Changes should be reviewed and approved by the EESAC and documented in EESAC minutes.
Refer to additional strategies found in the SIP Appendices.
47
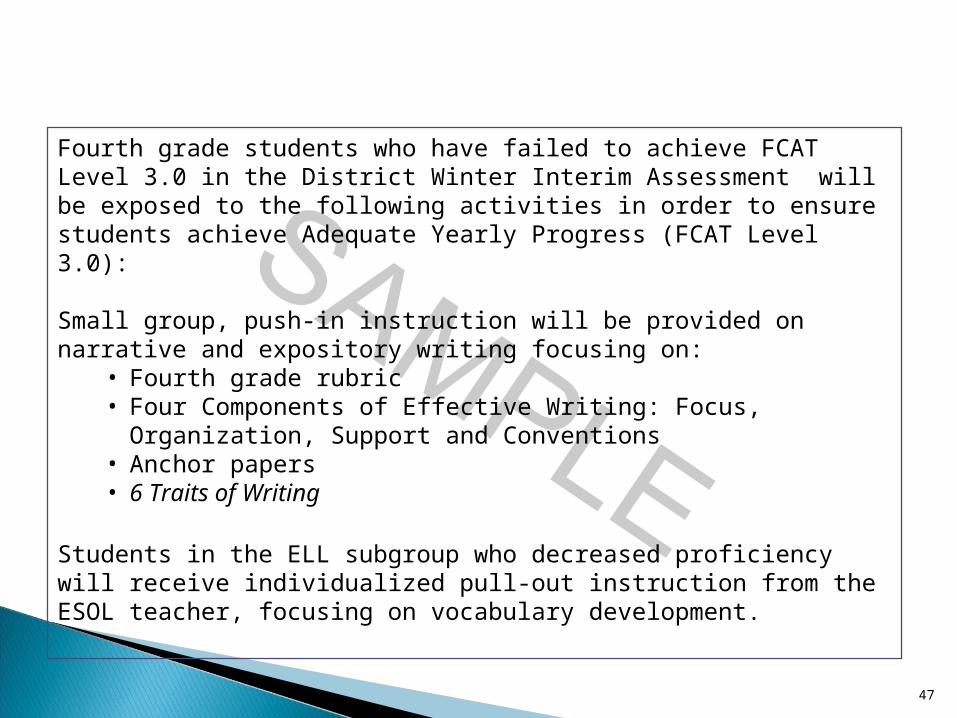
Fourth grade students who have failed to achieve FCAT Level 3.0 in the District Winter Interim Assessment will be exposed to the following activities in order to ensure students achieve Adequate Yearly Progress (FCAT Level 3.0):
Small group, push-in instruction will be provided on narrative and expository writing focusing on:
• Fourth grade rubric• Four Components of Effective Writing: Focus, Organization, Support
and Conventions• Anchor papers• 6 Traits of Writing
Students in the ELL subgroup who decreased proficiency will receive individualized pull-out instruction from the ESOL teacher, focusing on vocabulary development.
48
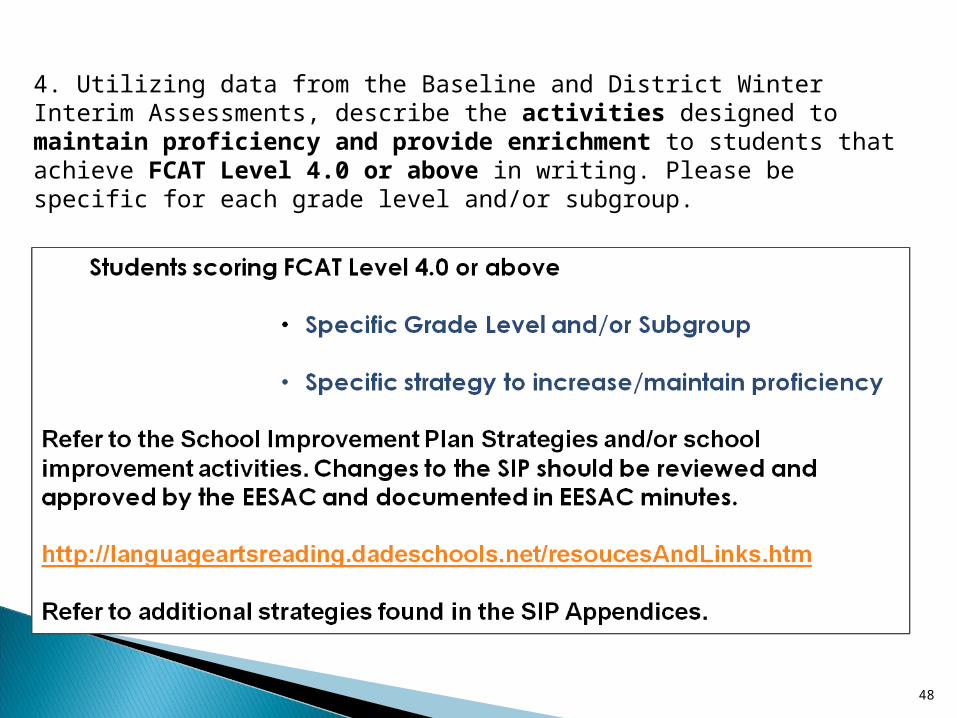
4. Utilizing data from the Baseline and District Winter Interim Assessments, describe the activities designed to maintain proficiency and provide enrichment to students that achieve FCAT Level 4.0 or above in writing. Please be specific for each grade level and/or subgroup.
49
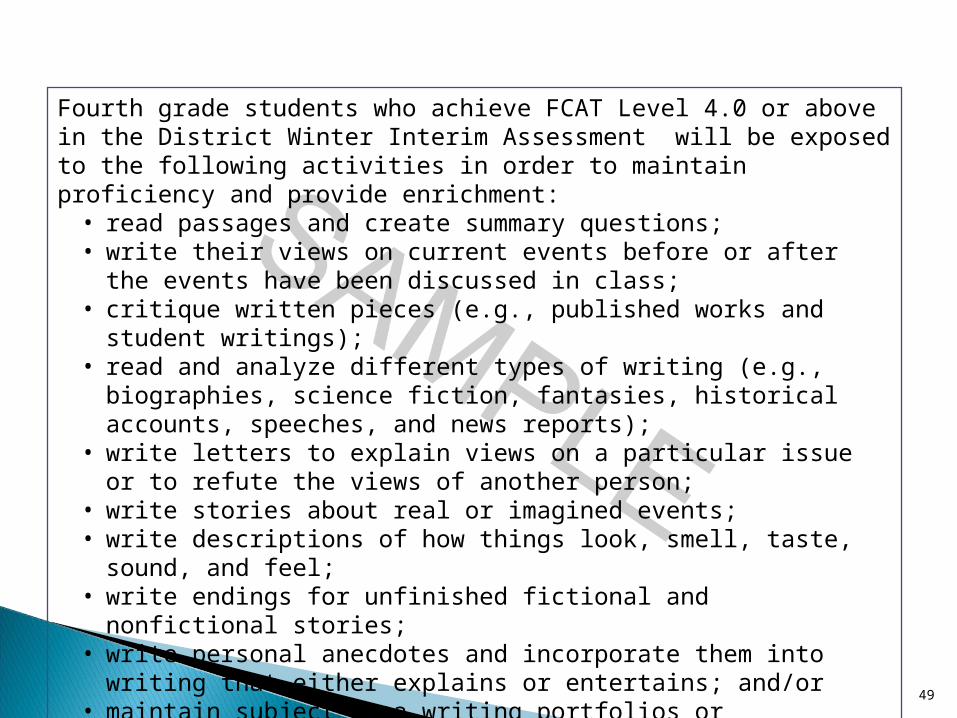
Fourth grade students who achieve FCAT Level 4.0 or above in the District Winter Interim Assessment will be exposed to the following activities in order to maintain proficiency and provide enrichment:
• read passages and create summary questions; • write their views on current events before or after the events have been
discussed in class;• critique written pieces (e.g., published works and student writings);• read and analyze different types of writing (e.g., biographies, science
fiction, fantasies, historical accounts, speeches, and news reports);• write letters to explain views on a particular issue or to refute the views of
another person; • write stories about real or imagined events; • write descriptions of how things look, smell, taste, sound, and feel;• write endings for unfinished fictional and nonfictional stories;• write personal anecdotes and incorporate them into writing that either
explains or entertains; and/or• maintain subject-area writing portfolios or participate in a long-term writing
project such as publishing a book.

50
Science Data AnalysisScience Data Analysis
1. Describe the gains and/or decreases in student achievement percentage
points that have occurred between the Baseline and District Winter Interim Assessments in each tested grade level. Include specific information about the grade levels (Per FLBSI, Do not report on Subgroups.) where improvements or declines have occurred.
Schools will only generate data for tested grade levels (5th, 8th and 11th grades).
Responses may be written in a narrative or bulleted format.
Only Baseline to District Winter Interim Assessment data may be used.
Describe gains and/or decreases in student Average Scores.•Grade level (tested grade levels only)•Report by content clusters

51
Students in Grade 5 showed an increase in the overall Percent Proficient moving from 30% (30 students) on the District Baseline Assessment to 62% (63 students) on the District Winter Interim Assessment.
The content cluster of Physical and Chemical Science increased from 11.3 to 16.2 on the Average Score when comparing the Baseline to the Winter Interim Assessments.
The content cluster of Earth and Space Science increased from 4.7 to 11.2 on the Average Score when comparing the Baseline to the Winter Interim Assessments.
The content cluster of Life and Environmental Science increased from 6.9 to 15.8 on the Average Score when comparing the Baseline to the Winter Interim Assessments.
The content cluster of Scientific Thinking increased from 1.9 to 11.9 on the Average Score when comparing the Baseline to the Winter Interim Assessments.

52
2. Describe the specific strategies or school improvement activities that have contributed to increases in student achievement percentage points between the Baseline and District Winter Interim Assessments in each tested grade level. Please be specific for each grade level. Write in the past tense and will continue.
Emphasis on strategies, preferably from the 2010-2011 School Improvement Plan (SIP), but may be any strategy, including PD, implemented before February 11, 2011.
Increases in Student Achievement Percentage Points• Specific Strategies/School Improvement Activities• Specific FCAT Tested Grade level only
You may compare clusters tested on the Winter Interim Assessment to the Baseline Assessment.
53
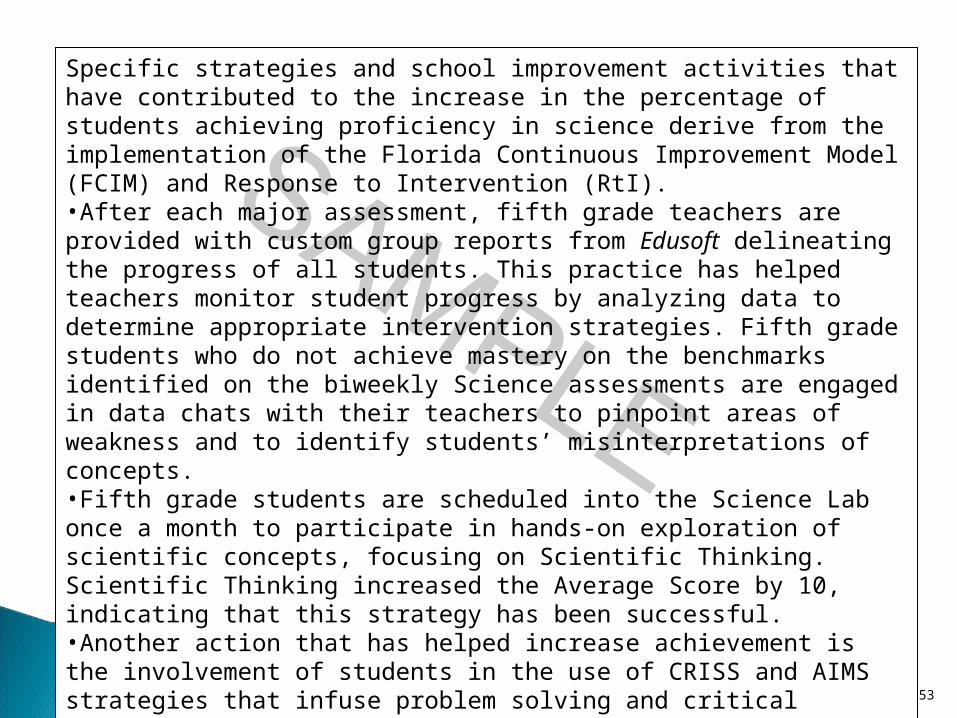
Specific strategies and school improvement activities that have contributed to the increase in the percentage of students achieving proficiency in science derive from the implementation of the Florida Continuous Improvement Model (FCIM) and Response to Intervention (RtI). •After each major assessment, fifth grade teachers are provided with custom group reports from Edusoft delineating the progress of all students. This practice has helped teachers monitor student progress by analyzing data to determine appropriate intervention strategies. Fifth grade students who do not achieve mastery on the benchmarks identified on the biweekly Science assessments are engaged in data chats with their teachers to pinpoint areas of weakness and to identify students’ misinterpretations of concepts. •Fifth grade students are scheduled into the Science Lab once a month to participate in hands-on exploration of scientific concepts, focusing on Scientific Thinking. Scientific Thinking increased the Average Score by 10, indicating that this strategy has been successful. •Another action that has helped increase achievement is the involvement of students in the use of CRISS and AIMS strategies that infuse problem solving and critical reading and thinking skills into the curriculum.

54
3. Utilizing data from the Baseline and District Winter Interim Assessments, describe the changes to instruction, strategies, and/or school improvement activities that will be made prior to the administration of the FCAT to ensure that students achieve proficiency (FCAT Level 3) in each tested grade level. Please be specific for each grade level that declined. Should be written in future tense as of February 11, 2011.
For strategies and/or school improvement activities, refer to the M-DCPS Learning Village. (https://village.dadeschools.net/PageLib/default.aspx )
Refer to additional strategies found in the SIP Appendices.
If all grade levels made gains, refer to clusters showing minimal progress to address this question.
Declines/Minimal growth/Less than expected progress (grade level or strand) include: •Specific strategy, instruction and/or school improvement activity to be changed/added •Grade Level (required tested grade levels only)•Specific Cluster (Average Score)

55
Changes in the instructional focus will come about through analysis of student performance data. Data from the District Winter Interim Assessment will be used to monitor and determine the effectiveness of instruction thus far and to drive decisions on what the instructional focus will be in the weeks leading to the FCAT.
Students will be tutored before and after school in small groups using Gizmos as a demonstration tool. Students will be given visual representations of concepts and will discuss what they see during paired or small group activities and with the teacher in order to identify misconceptions and areas of weakness.

56
4. Utilizing data from the Baseline and District Winter Interim Assessments, describe the activities designed to maintain proficiency and provide enrichment to students that are above proficiency (FCAT Level 4 or 5) in science. Please be specific for each grade level.

57
The following activities will be implemented with students who scored FCAT Level 4 or 5 in mathematics on the fourth grade 2010 FCAT Assessment to help them maintain proficiency and provide enrichment in Science:
• Create Professional Learning Communities for science teachers in order to ensure a culture of collaboration.
• Disaggregate and analyze qualitative and quantitative student’s data in order to monitor progress and address needs.
• Provide opportunity for students create a video in which they act out the benchmark of the week.
• Elicit, engage and challenge thinking by asking students to clarify and justify issues; encouraging elaboration during discussions.
• Afford students with the opportunity to demonstrate their understanding of the learned concept by transferring it successfully to other situations through solving a scenario or by doing a demonstration project.
• Provide individual exploration, peer instruction and whole class discussion using laboratory equipments, hands-on activities and technology-based activities.
• Involve students in critical thinking, process skills, and product development by posing authentic problems to solve.
• Assess using performance tasks, essays, portfolios, video presentation, and demonstrations.

Extended Learning Programs
Aligning Professional
Development
58

59
ACTIVITY FREQUENCY (e.g., # of times
per week, month, etc.)
DURATION (e.g., # of minutes,
hours, etc.)
TOTAL # OF LEVEL 1, 2 and 3 STUDENTS IN
THE SCHOOL
% OF LEVEL 1, 2 AND 3 STUDENTS
PATICIPATING
Responses should focus on the following
Reading, Math, Writing, or Science
Times per weekHow many minutes per session
Separate counts for Reading and Math. Use Reading # of L 1, 2 & 3s for Writing Activities. Use Math # of L 1, 2 & 3s for Science Activities
Divide the Average # by the Total # to calculate the %. Remember that this is to document Level 1, 2 & 3 students only.
SAMPLES
Reading-Voyager
3 times per week 30 min. per session200 (Level 1, 2 & 3 in Reading)
25% (50)
Math-Early Bird Tutoring
2 times per week 45 min. per session100 (Level 1, 2 & 3 in Math)
25% (25)
Reading/Writing – Push-in
3 times per week 30 min. per session200 (Level 1, 2 & 3 in Reading)
25% (50)

60
FAIR data was used to progress monitor students attending Voyager tutoring three times per week. Data gathered from Probability of Reading Success reports indicate growth in Reading by all grade levels from Assessment Period 1 to Assessment Period 2 as follows:
•3rd grade students increased by 10 percentage points the number of students achieving HP, 15 percentage points the number of students achieving MP, and decreased by 5 percentage points the number of students achieving LP.•4th grade students increased by 12 percentage points the number of students achieving HP, 18 percentage points the number of students achieving MP, and decreased by 7 percentage points the number of students achieving LP. •5th grade students increased by 15 percentage points the number of students achieving HP, 8 percentage points the number of students achieving MP, and decreased by 9 percentage points the number of students achieving LP. •ELL students increased by 5 percentage points the number of students achieving HP, 8 percentage points the number of students achieving MP, and decreased by 10 percentage point the number of students achieving LP.
61
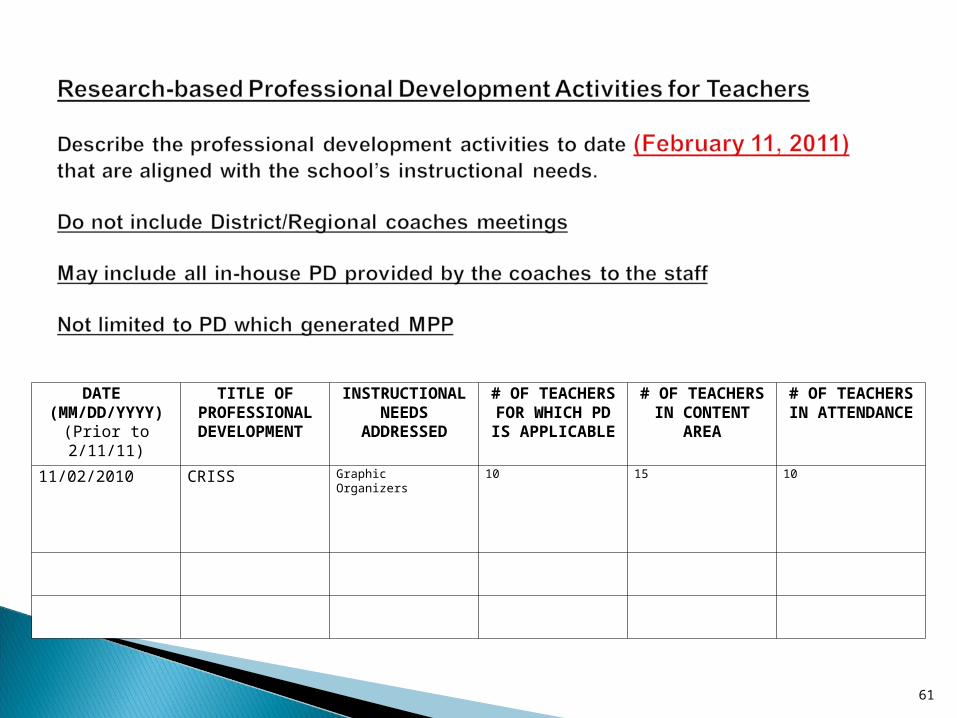
DATE (MM/DD/YYYY)(Prior to 2/11/11)
TITLE OF PROFESSIONAL DEVELOPMENT
INSTRUCTIONAL NEEDS
ADDRESSED
# OF TEACHERS FOR WHICH PD IS APPLICABLE
# OF TEACHERS IN CONTENT
AREA
# OF TEACHERS IN ATTENDANCE
11/02/2010 CRISS Graphic Organizers 10 15 10

62
Based on the results of the Winter Interim Assessment, teachers will be provided professional development on the areas of Reading and Mathematics.
•Based on our data, third grade students continue to encounter difficulty in Geometry and Measurement, and fourth grade students in the areas of Geometry and Measurement and Algebra. During the week of February 28-March 4, the math coach will train teachers grade 3-5 during their planning block on effective use of Gizmos to teach these reporting categories.
•Based on our data, students in all grade levels continue to encounter difficulty in Informational Text/Research Process and Reading Application. On February 22-25, a District representative will train teachers on grades 3-5 on the use of CRISS strategies in order to infuse reading strategies throughout the curriculum. During the week of February 28 - March 4, the reading coach will monitor the implementation of these strategies by the classroom teachers and model them when necessary.

SIPs and data documents, including Appendices, are available at: http://osi.dadeschools.net
February 11, 2011 – All Edusoft scanning must be completed. NO EXTENSIONS! SCAN AS YOU GO!!!
February 17, 2011 – Mid-Year Data Reports will be available at: http://osi.dadeschools.net
February 18, 2011 – Mid-Year data must be posted to: http://www.flbsi.org
February 25, 2011 – Schools must upload the Mid-Year Narrative to: http://www.flbsi.org
63

64
Login = 13 & WL #

65
Click here to enter Mid-year
data

66
67
68
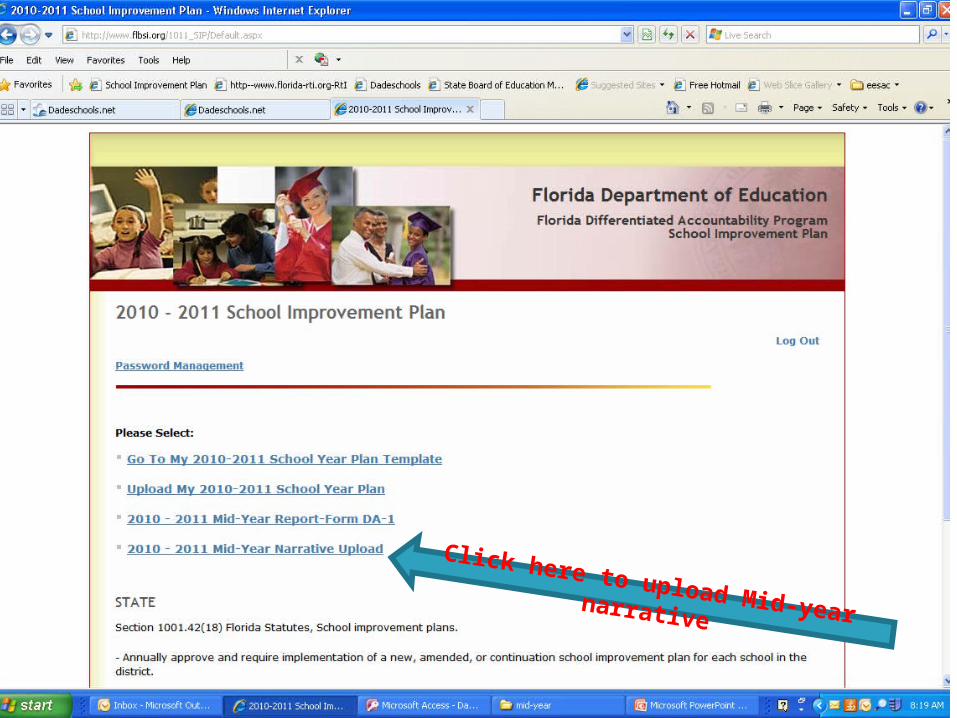
Click here to upload Mid-year narrative

69
• This is a direct upload.• Click the Browse button.• Select your Mid-year Narrative template
from your computer.• Click upload.• Confirm that the template is uploaded.
There should be a statement next to the Upload button to “Click to View”.
• This is a direct upload.• Click the Browse button.• Select your Mid-year Narrative template
from your computer.• Click upload.• Confirm that the template is uploaded.
There should be a statement next to the Upload button to “Click to View”.

Ms. Dolores de la Guardia – [email protected]
Ms. Sherian Demetrius – [email protected]
Ms. Caryl D. GrantMs. Caryl D. Grant305-995-1880305-995-1880
Ms. Linda G. Fife Ms. Linda G. Fife 305-995-2692305-995-2692