2012-2013 Mid-Year School Improvement Plan Training (Non-DA Secondary Schools) Office of School...
63
2012-2013 Mid-Year School Improvement Plan Training (Non-DA Secondary Schools) Office of School Improvement
-
Upload
stella-hudgins -
Category
Documents
-
view
213 -
download
0
Transcript of 2012-2013 Mid-Year School Improvement Plan Training (Non-DA Secondary Schools) Office of School...

2012-2013Mid-Year
School Improvement Plan Training
(Non-DA Secondary Schools)
Office of School Improvement

TRAINING OBJECTIVES
To provide schools with tools, using the Florida Continuous Improvement Model, to analyze student progress and make adjustments in instructional focus;
To assist schools in using Mid-year Data (from the Winter Interim Assessment) to identify instructional areas of concern;
To assist in the development the Mid-Year Narrative Report by aligning SIP strategies to students’ needs; and
To provide timelines for the Winter Interim Assessment administration and the posting of the Mid-Year Data and Mid-Year Narrative Reports to the FLBSI. 2

3
All “A” and “B” schools which had subgroups who did not meet their Annual Measurable Objective (AMO) during the prior school year must submit Mid-Year Data and complete the Mid-Year Narrative Report for those identified subgroups in Reading and/or Mathematics areas as applicable.
• Reading in grades 6-10;• Mathematics in grades 6-8; • Algebra I and Geometry; and• Extended Learning
Data are required and must be reported as they appear on the District generated data sheet for all students in grades 6-10 for reading and mathematics (including Algebra I and Geometry).

Completing the Report……………..
4

Locating the Mid-Year Narrative Form
5
http://osi.dadeschools.net

Getting Started

Identifying Subgroups…….
7
http://osi.dadeschools.net

To identify the subgroups which your school must report on, click here.

Select your school
School Level
School Level
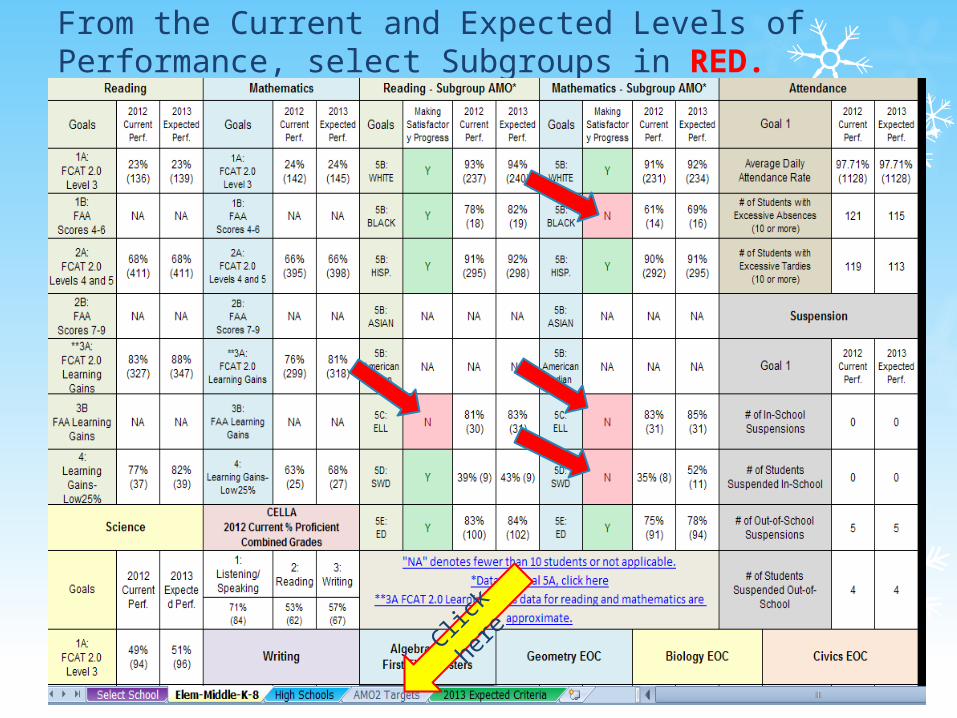
From the Current and Expected Levels of Performance, select Subgroups in RED.
Click
here

81%(30)

Locating Your Data
12
http://osi.dadeschools.net
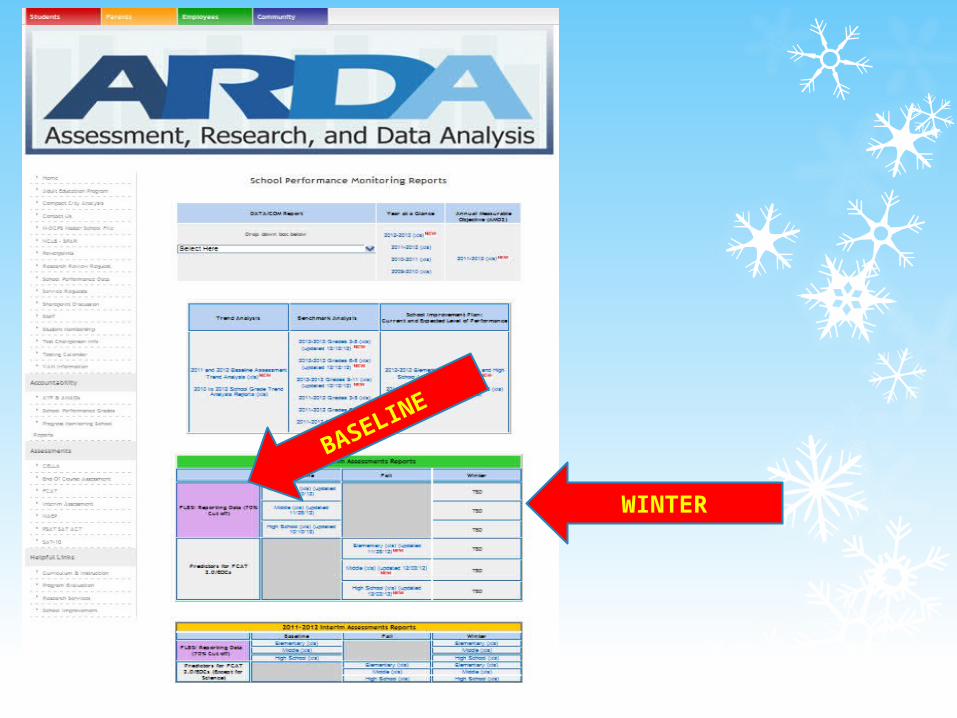
WINTER
BASELINE

Click your
school levelClick your
school level

Describe gains/decreases in Student Achievement Percentage Points by looking at “% Proficient.”
• Grade level• Subgroup(s)• Percentage points of
increase/decrease
Reading – Grade 6

Winter IA DATA SheetWinter Interim Assessment

READING
17


19
.
Reading Data Analysis – All schools will use the first question (S/DA) in formulating a response.
1. Describe the gains and/or decreases in student achievement percentage points that have occurred between the baseline and mid-year assessments. Include specific information about the grade levels or subgroups in which improvements or declines have occurred.
Please respond using comparisons between the District Baseline and Winter Interim Assessment (Administered January 7 – February 5, 2013). Responses may be written in a narrative or bulleted format.
Grade 6– 10

20
SAMPLE
According to the Reading 2012 FCAT 2.0 the ED subgroup did not make satisfactory progress towards their AMOs.
For the ED subgroup in grades six there was an increase of 5 student achievement percentage points when comparing the District Winter Interim Assessment to the Baseline Assessment. In seventh grade there was an increase of 4 student achievement percentage points.
For the ED subgroup in eighth grade, there was an decrease of 9 student achievement percentage points for the ED subgroup when comparing the District Winter Interim Assessment to the Baseline Assessment. Areas of concern are Vocabulary and Informational Text/Research Process categories.
SAMPLE

21
2. Describe the specific strategies or school improvement activities that have contributed to increases in student achievement percentage points between the baseline and mid-year assessment. Please be specific for each grade level and/or subgroup. Should be in the past tense.
Emphasis on strategies preferably include strategies from the 2012-2013 School Improvement Plan (SIP), but may be any strategy, including PD, implemented prior to January 17, 2013.
Specific Strategies or School Improvement Activities that contributed to increases in Student Achievement Percentage Points (grade level or subgroup)
• Specific Grade level • Subgroup(s)
Use the wording “student achievement percentage points” when comparing Baseline to Mid-year (District Winter IA) data.

22
Specific strategies and school improvement activities that have contributed to the increase in student achievement percentage points between the baseline and mid-year assessment in reading begin with the school-wide implementation of the Multi-Tiered Support System/Response to Intervention (MTSS/RtI) and Florida Continuous Improvement Model (FCIM).
• After each major assessment, teachers in grades 6 through 8 were provided with Edusoft reports which delineated the progress of each grade and subgroup. Teachers then used the school site data protocols to review the assessments with students and hold “Data Chats.” If the need for extra reinforcement was evident, the student was recommended for the various tutorial opportunities available before and after school and on Saturdays using the Inside Practice books.
• Another strategy that has proven to be effective is the use of online applications to emphasize reading across the curriculum such as Riverdeep, Reading Plus and FCAT Explorer for students in grades 6 through 8.
• The promotion of reading is another strategy that has been quite helpful in raising reading scores. The utilization of programs such as Accelerated Reader and STAR Assessments, along with school-wide activities such as Vocabulary Day have all been instrumental in increasing students’ interest in reading.
SAMPLE

23
Changes that will be made prior to FCAT:
Students Scoring FCAT Levels 1 or 2
Grade Level and/or Subgroup
Specific strategy (changes) Changes to instruction School Improvement Activity (changes)
• Strategies and/or school improvement activities should align to the School Improvement Plan.
• Changes are justified by “no increase or minimal gains” as noted in question #1.
• Your EESAC must review and approve changes to the SIP and be recorded in the EESAC minutes.
Refer to the “2012-2013 SIP Appendices” for additional strategies.
3. Utilizing data from the reading baseline and mid-year assessments, describe the changes to instruction, strategies, and/or school improvement activities that will be made prior to the administration of the FCAT 2.0 to ensure that students scoring FCAT 2.0 Levels 1 or 2 increase achievement to making satisfactory progress (FCAT 2.0 Level 3). Please be specific for each grade level and/or subgroup. Should be written in future tense.

24
Changes in the instructional focus will be through analysis of student performance data.
The changes to instruction, strategies, and/or school improvement activities, focusing on students who scored Level 1 and 2 on the 2012 FCAT 2.0, will be made prior to the 2013 FCAT 2.0 in order to ensure that students show satisfactory progress. Intervention sessions will target student needs. • Instructional planning will be adjusted to allow for an extended focus
on strands in preparation for the Common Core Curriculum. • Individual student data reports will provide information to be used in
planning and implementing appropriate interventions.• Saturday School will be held for all students and will provide specific
support for the ELL subgroup in the areas of Vocabulary, Reading Application, and Informational Text/Research Process.
Student progress towards their AMO will be based on data from the District Winter Interim Assessment and will drive instructional decisions.
SAMPLE

25
Students Scoring FCAT Level 3
Specific Grade Level and/or Subgroup Specific strategy to increase/maintain satisfactory
progress
• For strategies and/or school improvement activities, refer to the School Improvement Plan.
• If students scoring Level 3 have shown growth, you may continue to use or intensify current strategies.
• If there were decreases, implement new strategies. • Changes should be reviewed and approved by the EESAC
and documented in EESAC minutes.
Refer to the “2012-2013 SIP Appendices” for additional strategies.
4. Utilizing data from the reading baseline and mid-year assessments, describe the specific strategies that will be used for students scoring FCAT 2.0 Level 3 to maintain satisfactory progress and/or increase achievement to above satisfactory progress (FCAT 2.0 Levels 4 or 5). Please be specific for each grade level and/or subgroup. Should be written in future tense.
26
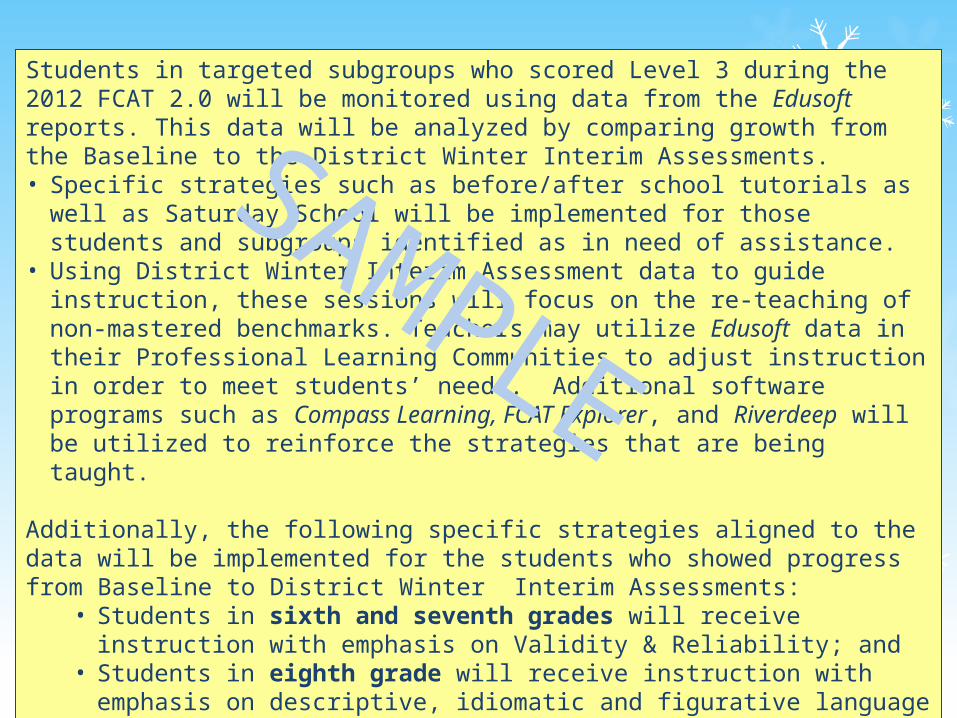
Students in targeted subgroups who scored Level 3 during the 2012 FCAT 2.0 will be monitored using data from the Edusoft reports. This data will be analyzed by comparing growth from the Baseline to the District Winter Interim Assessments. • Specific strategies such as before/after school tutorials as well as Saturday School
will be implemented for those students and subgroups identified as in need of assistance.
• Using District Winter Interim Assessment data to guide instruction, these sessions will focus on the re-teaching of non-mastered benchmarks. Teachers may utilize Edusoft data in their Professional Learning Communities to adjust instruction in order to meet students’ needs. Additional software programs such as Compass Learning, FCAT Explorer, and Riverdeep will be utilized to reinforce the strategies that are being taught.
Additionally, the following specific strategies aligned to the data will be implemented for the students who showed progress from Baseline to District Winter Interim Assessments:
• Students in sixth and seventh grades will receive instruction with emphasis on Validity & Reliability; and
• Students in eighth grade will receive instruction with emphasis on descriptive, idiomatic and figurative language in order to assist them in both reading and writing.
SAMPLE
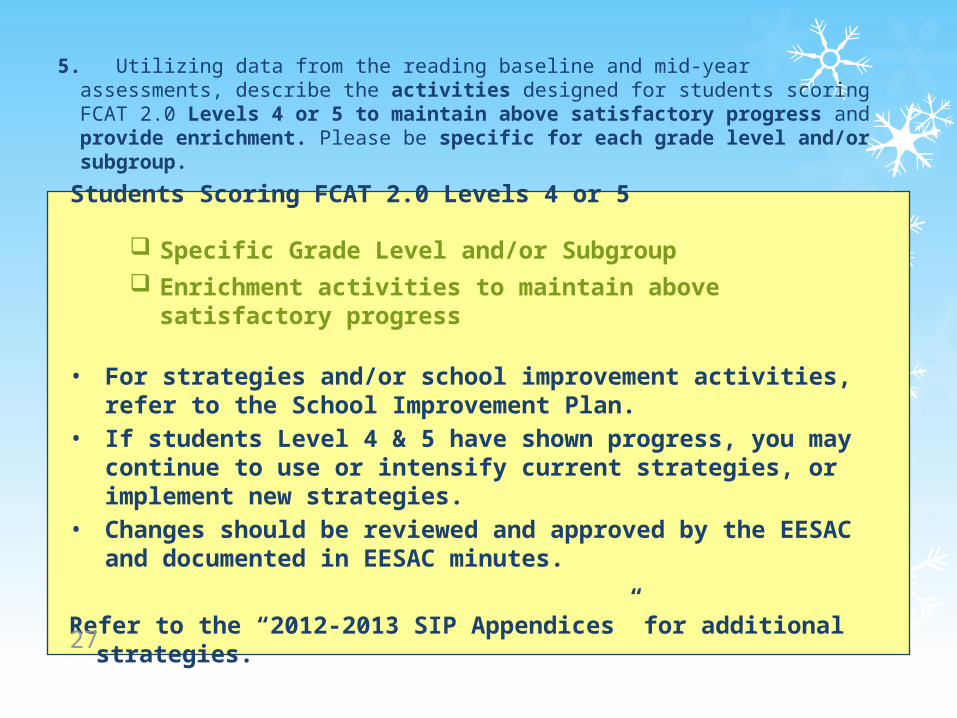
5. Utilizing data from the reading baseline and mid-year assessments, describe the activities designed for students scoring FCAT 2.0 Levels 4 or 5 to maintain above satisfactory progress and provide enrichment. Please be specific for each grade level and/or subgroup.
Students Scoring FCAT 2.0 Levels 4 or 5
Specific Grade Level and/or Subgroup Enrichment activities to maintain above satisfactory
progress
• For strategies and/or school improvement activities, refer to the School Improvement Plan.
• If students Level 4 & 5 have shown progress, you may continue to use or intensify current strategies, or implement new strategies.
• Changes should be reviewed and approved by the EESAC and documented in EESAC minutes.
Refer to the “2012-2013 SIP Appendices” for additional strategies.27

Students in targeted subgroups who scored Levels 4 and 5 during the 2012 FCAT 2.0 will be closely monitored by gathering data from the Edusoft reports. This data will be analyzed to monitor their progress when comparing the Baseline to the District Winter Interim Assessments.
Project-based learning and enrichment strategies will be implemented with students. Based on Webb’s Levels of Complexity, Moderate and High Complexity level questions as well as the Socratic Method will be frequently used with these students.
Additionally, these students will use the Readers’ Theater: William Shakespeare kit in order to provide them with above grade level materials.
The following strategies will be implemented at specific grade levels for identified subgroups: • Students in sixth and seventh grades will concentrate on vocabulary across
the curriculum as a means to enrich vocabulary instruction.• Students in eighth grade will create original poems, lyrics, and stories to
share at a literary café in February.28
SAMPLE

Reading – Hands (Paws) on

MATHEMATICS
30
Click icon to add picture

Mathematics Data Analysis – Middle Schools only
High schools will not complete this section. Move to the Algebra I and Geometry response.Responses may be written in a narrative or bulleted format.
Only Baseline to District Winter Interim Assessment data may be used.
Describe gains and/or decreases in the Percent of Students Making Satisfactory Progress by:
Grade level Subgroup(s) Percentage point(s) of increase/decrease
Use the wording “student achievement percentage points” when comparing Baseline to Mid-year (District Winter IA) data.
1. Describe the gains and/or decreases in student achievement percentage points that have occurred between the baseline and mid-year assessments. Include specific information about the grade levels or subgroups where improvements or declines have occurred.

32
According to the Mathematics 2012 FCAT 2.0 the ED and ELL subgroups did not make satisfactory progress towards their AMOs.
Sixth grade - Students in the English Language Learner (ELL) subgroup in sixth grade demonstrated an increase of 12 student achievement percentage points, and students in the Economically Disadvantaged (ED) subgroup demonstrated an increase of 7 student achievement percentage points when comparing the District Winter Interim Assessment to the Baseline Assessment.
Seventh grade - Students in the English Language Learner (ELL) subgroup in seventh grade demonstrated an increase of 16 student achievement percentage points when comparing the District Winter Assessment to the Baseline Assessment. However, the Economically Disadvantaged (ED) subgroup in seventh grade demonstrated a decrease of 14 percentage points for Ratios/Proportional relationships and, a decrease of 1 percentage point in overall satisfactory progress for Number: Base Ten.
Eighth grade - ELL students in eighth grade demonstrated an increase of 12 percentage points, and students in the ED subgroup demonstrated an increase of 4 student percentage points when comparing the District Winter Interim Assessment to the Baseline Assessment.
SAMPLE

33
2. Describe the specific strategies or school improvement activities that have contributed to increases in student achievement percentage points between the baseline and mid-year assessments. Please be specific for each grade level and/or subgroup.
Should be written in past tense. If there have been no increases, include a sentence for each grade level and/or subgroup stating so, and the instructional focus will be addressed in subsequent responses.
Emphasis on strategies, preferably from the 2012-2013 School Improvement Plan (SIP), but may be any strategy, including PD, implemented before January 17, 2013.
Specific Strategies or School Improvement Activities that contributed to increases in the Percent of Students Making Satisfactory Progress by:
Specific Grade level Subgroup(s)
Use the wording “making satisfactory progress” when comparing Baseline to Mid-year (District Winter IA) data.

34
Specific strategies and school improvement activities that have contributed to the increase in student achievement percentage points between the baseline and mid-year assessment in mathematics include the school-wide implementation of the Multi-Tiered Support System/Response to Intervention (MTSS/RtI) and Florida Continuous Improvement Model (FCIM). • After each major assessment, teachers in sixth through eighth grades
are provided with custom group reports from Edusoft delineating the progress of each subgroup. Teachers then review the assessments with students and hold “Data Chats”. In each class student groups are reorganized according to deficiencies revealed by the data before specific benchmarks are addressed. If the need for extra reinforcement is evident, the student is recommended for the various tutorial opportunities available before and after school and on Saturdays.
• Another strategy that has proven to be effective is the use of online applications such as Gizmos, Math Explorer and National Library of Virtual Manipulatives.
• We have also been providing math tutorials for the ELL and ED subgroups in grades 6-8 after school.
SAMPLE

35
3. Utilizing data from the mathematics baseline and mid-year assessments, describe the changes to instruction, strategies, and/or school improvement activities that will be made prior to the administration of the FCAT 2.0 to ensure that students scoring FCAT 2.0 Levels 1 or 2 increase achievement to making satisfactory progress (FCAT 2.0 Level 3). Please be specific for each grade level and/or subgroup. Should be written in future tense to reflect changes after January 22, 2013.
Changes that will be made prior to FCAT:
Students Scoring FCAT Levels 1 or 2
Grade Level and/or Subgroups
Specific strategy (changes) Changes to instruction School improvement Activities (changes)
• For strategies and/or school improvement activities, refer to the School Improvement Plan.
• Changes should be reviewed and approved by the EESAC and documented in EESAC minutes.
Refer to the “2012-2013 SIP” Appendices for additional strategies.
36
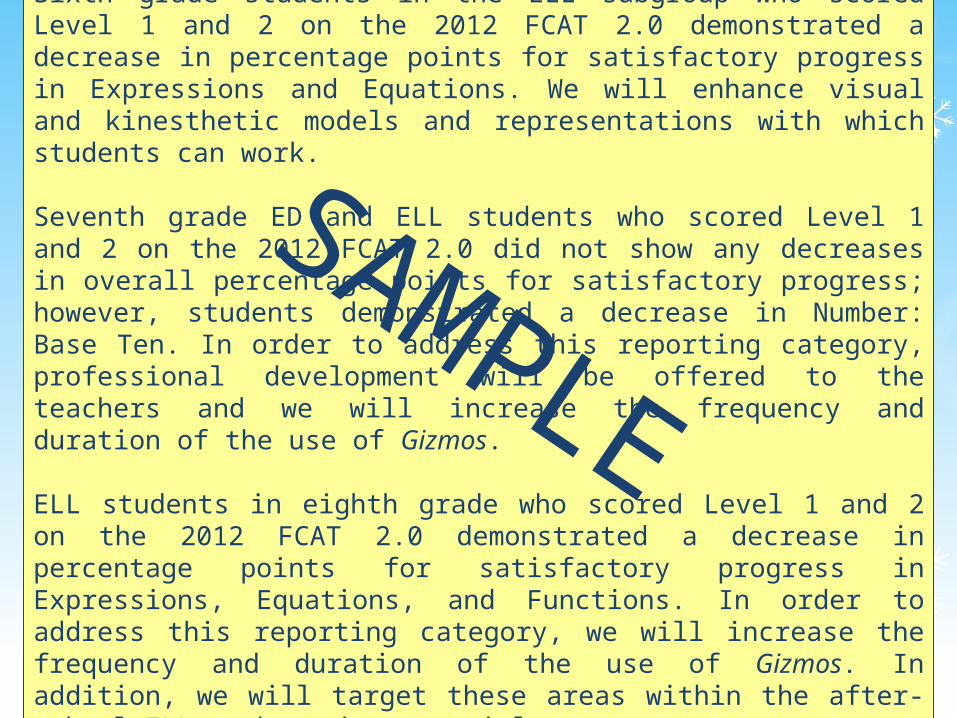
Sixth grade students in the ELL subgroup who scored Level 1 and 2 on the 2012 FCAT 2.0 demonstrated a decrease in percentage points for satisfactory progress in Expressions and Equations. We will enhance visual and kinesthetic models and representations with which students can work.
Seventh grade ED and ELL students who scored Level 1 and 2 on the 2012 FCAT 2.0 did not show any decreases in overall percentage points for satisfactory progress; however, students demonstrated a decrease in Number: Base Ten. In order to address this reporting category, professional development will be offered to the teachers and we will increase the frequency and duration of the use of Gizmos.
ELL students in eighth grade who scored Level 1 and 2 on the 2012 FCAT 2.0 demonstrated a decrease in percentage points for satisfactory progress in Expressions, Equations, and Functions. In order to address this reporting category, we will increase the frequency and duration of the use of Gizmos. In addition, we will target these areas within the after-school ELL mathematics tutorial program.
SAMPLE

37
4. Utilizing data from the mathematics baseline and mid-year assessments, describe the specific strategies that will be used for students scoring FCAT 2.0 Level 3 to maintain satisfactory progress and/or increase achievement to above satisfactory progress (FCAT 2.0 Levels 4 or 5). Please be specific for each grade level and/or subgroup.
Students Scoring FCAT Level 3
Specific Grade Level and/or Subgroups Specific strategy to increase/maintain satisfactory
progress
• For strategies and/or school improvement activities, refer to the School Improvement Plan.
• If students who scored Level 3 have shown growth, you may continue to use or intensify current strategies, or implement new strategies.
• Changes should be reviewed and approved by the EESAC and documented in EESAC minutes.
Refer to the “2012-2013 SIP Appendices” for additional strategies.

38
Data gathered from Edusoft reports will be analyzed after the District Winter Interim Assessment and compared to the Baseline assessment. Students in identified subgroups who scored Level 3 during the 2012 FCAT 2.0 and have not maintained or increased achievement to above satisfactory progress, will be provided the following activities:
• Based on academic needs as identified by comparing the Baseline to the District Winter Interim Assessment, students in sixth and seventh grade will be provided with push-in tutoring and classroom teachers will emphasize differentiated instruction based on the students’ needs.
• Students in grade eight will use technology based programs such as Riverdeep, FCAT Explorer and Gizmos in the classroom to support mathematics instruction and stimulate critical thinking. Additionally, students will use FCAT Explorer, Gizmos and the National Library of Virtual Manipulatives that include visual stimulus to develop conceptual understanding of numbers.
• Specific strategies that will be used to target students in the ELL subgroup that scored Level 3 in the 2012 FCAT 2.0 will include in-house intervention, before/after school tutorials as well as Saturday School utilizing graphic organizers, audio/visuals and cooperative learning. Using District Winter Interim Assessment data to guide instruction, the school tutorial sessions are strictly for the re-teaching and emphasis of areas of concern.
SAMPLE

39
5. Utilizing data from the mathematics baseline and mid-year assessments, describe the activities designed for students scoring FCAT 2.0 Levels 4 or 5 to maintain above satisfactory progress and enrichment. Please be specific for each grade level and/or subgroup.
Students Scoring FCAT Levels 4 or 5
Specific Grade Level and/or Subgroup Enrichment activities to maintain above
satisfactory progress
• For strategies and/or school improvement activities, refer to the School Improvement Plan.
• If students who scored Level 4 & 5s have shown growth, you may continue to use or intensify current strategies, or implement new strategies.
• Changes should be reviewed and approved by the EESAC and documented in EESAC minutes.
Refer to the 2012-2013 SIP Appendices for additional strategies.
40
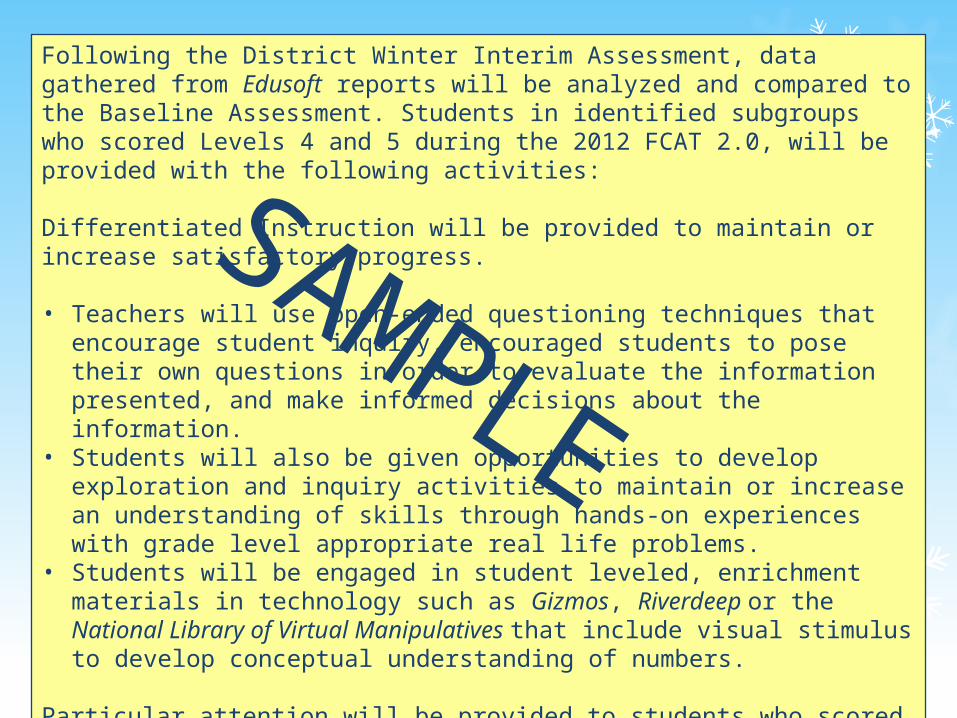
Following the District Winter Interim Assessment, data gathered from Edusoft reports will be analyzed and compared to the Baseline Assessment. Students in identified subgroups who scored Levels 4 and 5 during the 2012 FCAT 2.0, will be provided with the following activities:
Differentiated Instruction will be provided to maintain or increase satisfactory progress.
• Teachers will use open-ended questioning techniques that encourage student inquiry, encouraged students to pose their own questions in order to evaluate the information presented, and make informed decisions about the information.
• Students will also be given opportunities to develop exploration and inquiry activities to maintain or increase an understanding of skills through hands-on experiences with grade level appropriate real life problems.
• Students will be engaged in student leveled, enrichment materials in technology such as Gizmos, Riverdeep or the National Library of Virtual Manipulatives that include visual stimulus to develop conceptual understanding of numbers.
Particular attention will be provided to students who scored Levels 4 or 5 during the 2012 FCAT 2.0. Following an analysis of the Baseline and District Winter Interim Assessment, students who have not maintained satisfactory progress will receive push-in instruction.
SAMPLE

41
ALGEBRA I & Geometry*(Include ALL students, who will be administered the End-of-Course Exam.) – Middle and Senior High Schools
1. Describe the gains and/or decreases in student achievement percentage points that have occurred between the baseline and mid-year assessments. Include specific information about the reporting categories in which improvements or declines have occurred.
Responses may be written in a narrative or bulleted format.
Only Baseline to Mid-Year (Winter Interim) data may be used.
Describe gains and/or decreases in Student Achievement Percentage Points
• Subgroup(s) • Percentage points of increase/decrease
Use the wording making satisfactory progress when comparing Baseline to Mid-year (District Winter IA) data.
Should be written in past tense.
42
Data gathered from Edusoft reports indicate growth in Algebra I from the Baseline to the District Winter Interim Assessment with an overall increase in student achievement percentage points from 35 to 39.
In the reporting categories, students demonstrated a 10 percentage point gain in the number of students making satisfactory progress in Functions, Linear, Equations & Inequalities, a 15 percentage point increase in the number of students making satisfactory progress in Polynomials, and a 5 percentage point decrease in the number of students making satisfactory progress in Rationals, Radicals, Quadratics & Discrete Mathematics.
SAMPLE

43
2. Utilizing data from the baseline and mid-year assessments, describe changes to instruction, strategies, and/or school improvement activities that will be made prior to the administration of the Algebra EOC to ensure that students achieve satisfactory progress. Should be written in future tense.
Based on comparing Baseline and District Winter Interim Assessments, changes that will be made after January 22, 2013 to impact the Algebra EOC:
• Specific strategy (changes)• Changes to instruction• School improvement Activities (changes)
Refer to strategies and/or school improvement activities in the Math Matters Home - http://math.dadeschools.net/mathMatters/default.html and NCTM Illuminations: http://illuminations.nctm.org
Refer to the “2012-2013 SIP Appendices” for additional strategies.

44
http://math.dadeschools.net
45
There was a 5 percentage point increase in the number of ELL students making satisfactory progress; however, there was a 5 percentage point decrease in the percent making satisfactory progress in the Rationals, Radicals, Quadratics & Discrete Mathematics reporting category.
Data gathered from the Baseline and District Winter Interim Assessments was analyzed and an item analysis took place. Based on the results of the data, the following strategies will be implemented:
• Students will be grouped according to their needs, and push-in, small group instruction will be provided by the interventionist.
• Computer labs will be available to students before and after school and during lunch to access Carnegie Learning.
• Students who demonstrate exceptional difficulties will be referred to the Multi-Tiered System of Supports/Response to Intervention (MTSS/RtI) team.
SAMPLE
Mathematics HANDS-ON
46

Completing the Mid-Year Report
Extended Learning
Programs
Aligning Professional
Development47

Extended Learning Programs for StudentsDescribe the activities (e.g. after school, pull-outs, etc) that have taken place to date. Add additional rows if necessary.* When using percentages, include the number of students the percentage represents (e.g., 70% [35]).
48
ACTIVITY FREQUENCY (e.g., # of times
per week, month, etc.)
DURATION (e.g., # of minutes,
hours, etc.)
TOTAL # OF LEVEL 1, 2 and 3 STUDENTS IN
THE SCHOOL
% OF LEVEL 1, 2 AND 3 STUDENTS
PARTICIPATING
Responses should focus on the following
Reading, Math Times per weekHow many minutes per session
Separate counts for Reading and Math.
Divide the Average # by the Total # to calculate the %. Remember that this is to document Level 1, 2 & 3 students only.
SAMPLES
Reading-Voyager
3 times per week 30 min. per session200 (Level 1, 2 & 3 in Reading)
25% (50)
Math-Early Bird Tutoring
2 times per week 45 min. per session100 (Level 1, 2 & 3 in Math)
25% (25)
Reading – Push-in
3 times per week 30 min. per session200 (Level 1, 2 & 3 in Reading)
25% (50)
SAMPLE
Other than using the baseline and mid-year data, how will you progress monitor students in extended learning programs and how will you use this data to determine how students are responding to the extended learning program? (Please refer to specific data points).
49
FAIR data was used to progress monitor students attending Voyager tutoring three times per week. Data gathered from Probability of Reading Success reports indicate growth in Reading by all grade levels from Assessment Period 1 to Assessment Period 2 as follows:
• 6th grade – ELL and ED students increased by 10 percentage points the number of students achieving HP, 15 percentage points the number of students achieving MP, and decreased by 5 percentage points the number of students achieving LP.
• 7th grade – ELL and ED students increased by 12 percentage points the number of students achieving HP, 18 percentage points the number of students achieving MP, and decreased by 7 percentage points the number of students achieving LP.
• 8th grade – ELL and ED students increased by 15 percentage points the number of students achieving HP, 8 percentage points the number of students achieving MP, and decreased by 9 percentage points the number of students achieving LP.
SAMPLE
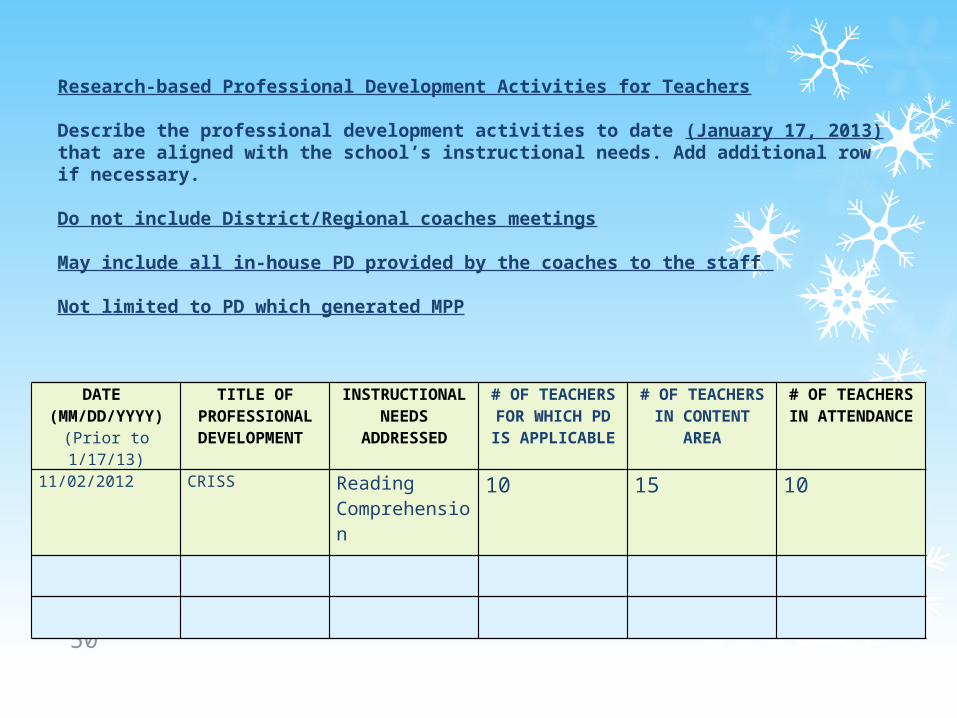
Research-based Professional Development Activities for Teachers
Describe the professional development activities to date (January 17, 2013) that are aligned with the school’s instructional needs. Add additional row if necessary. Do not include District/Regional coaches meetings May include all in-house PD provided by the coaches to the staff
Not limited to PD which generated MPP
50
DATE (MM/DD/YYYY)(Prior to 1/17/13)
TITLE OF PROFESSIONAL DEVELOPMENT
INSTRUCTIONAL NEEDS
ADDRESSED
# OF TEACHERS FOR WHICH PD IS APPLICABLE
# OF TEACHERS IN CONTENT
AREA
# OF TEACHERS IN ATTENDANCE
11/02/2012 CRISS Reading Comprehension
10 15 10
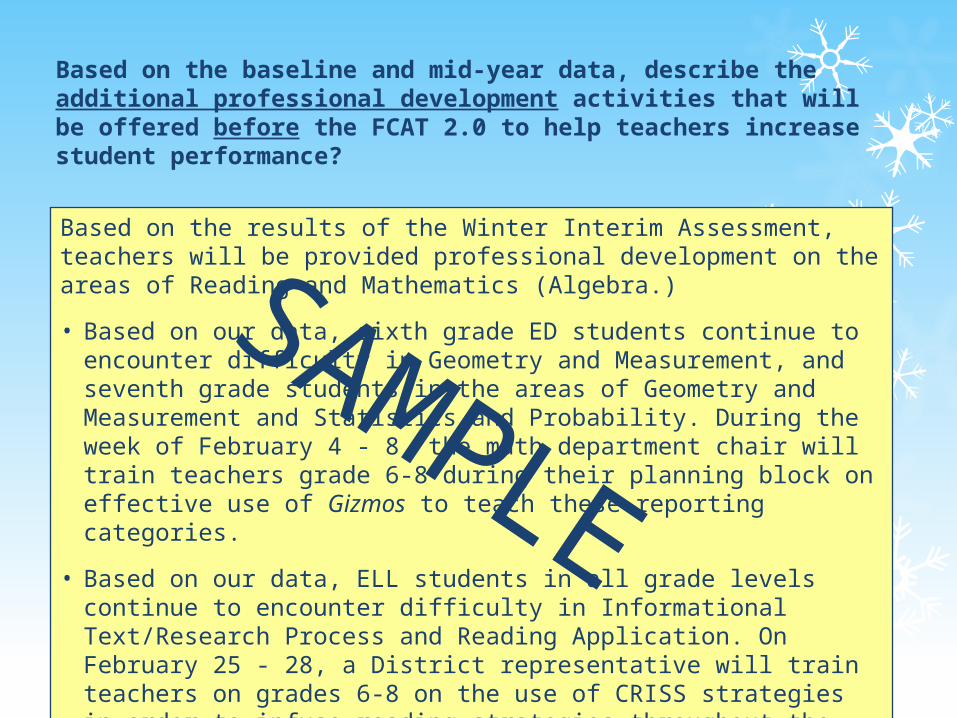
Based on the baseline and mid-year data, describe the additional professional development activities that will be offered before the FCAT 2.0 to help teachers increase student performance?
51
Based on the results of the Winter Interim Assessment, teachers will be provided professional development on the areas of Reading and Mathematics (Algebra.)
• Based on our data, sixth grade ED students continue to encounter difficulty in Geometry and Measurement, and seventh grade students in the areas of Geometry and Measurement and Statistics and Probability. During the week of February 4 - 8, the math department chair will train teachers grade 6-8 during their planning block on effective use of Gizmos to teach these reporting categories.
• Based on our data, ELL students in all grade levels continue to encounter difficulty in Informational Text/Research Process and Reading Application. On February 25 - 28, a District representative will train teachers on grades 6-8 on the use of CRISS strategies in order to infuse reading strategies throughout the curriculum.
SAMPLE

Post Your Mid-Year Data(WINTER IA DATA ONLY!!)
52
http://osi.dadeschools.net

Click your
school levelClick your
school level

Winter IA DATA SheetWinter Interim Assessment
Print a Mid-year data sheet for
each grade level.

56
Login = 13 & WL #
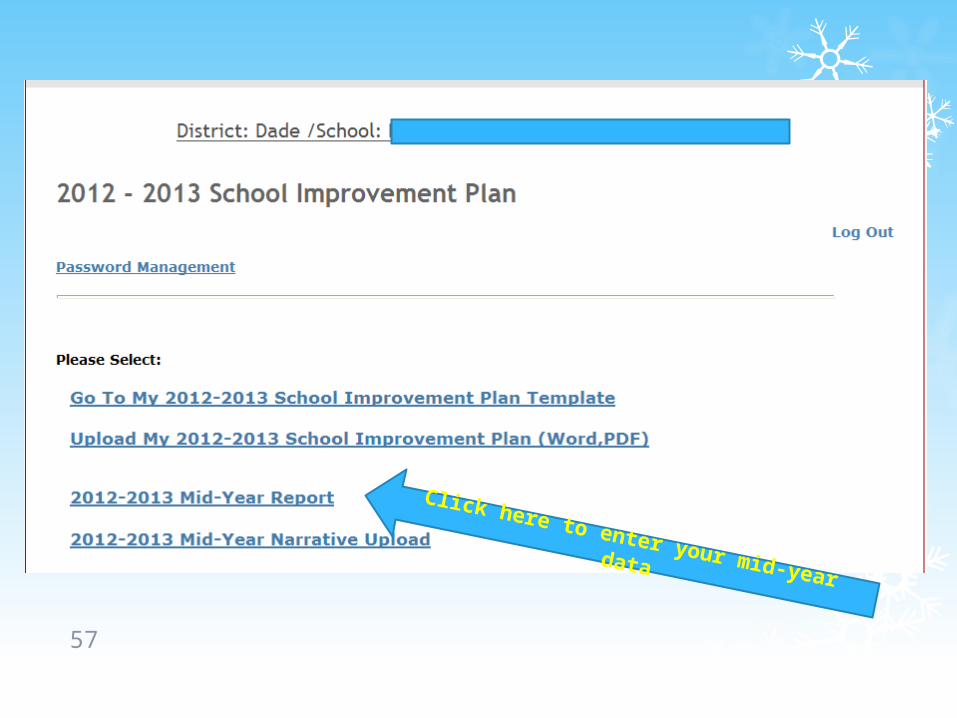
57
Click here to enter your mid-year data

58
Grade 6Grade 7Grade 8
59
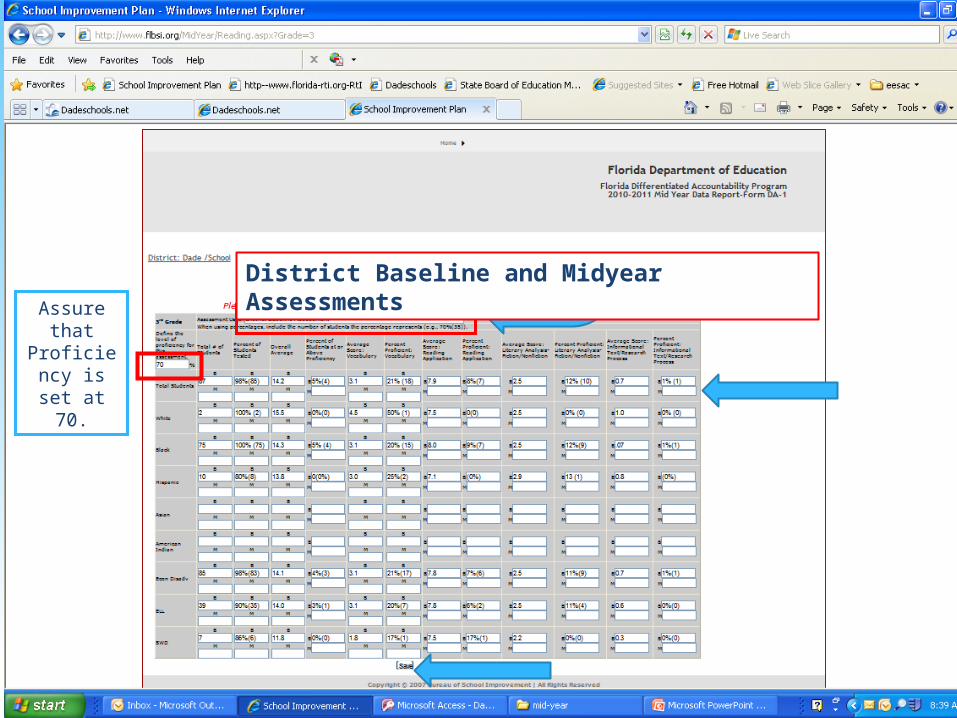
District Baseline and Midyear AssessmentsAssure
that Proficiency
is set at 70.

60
Click here to upload Mid-year narrative

61
• This is a direct upload.• Click the Browse button.• Select your Mid-year Narrative template
from your computer.• Click upload.• Confirm that the template is uploaded.
There should be a statement next to the Upload button to “Click to View”.
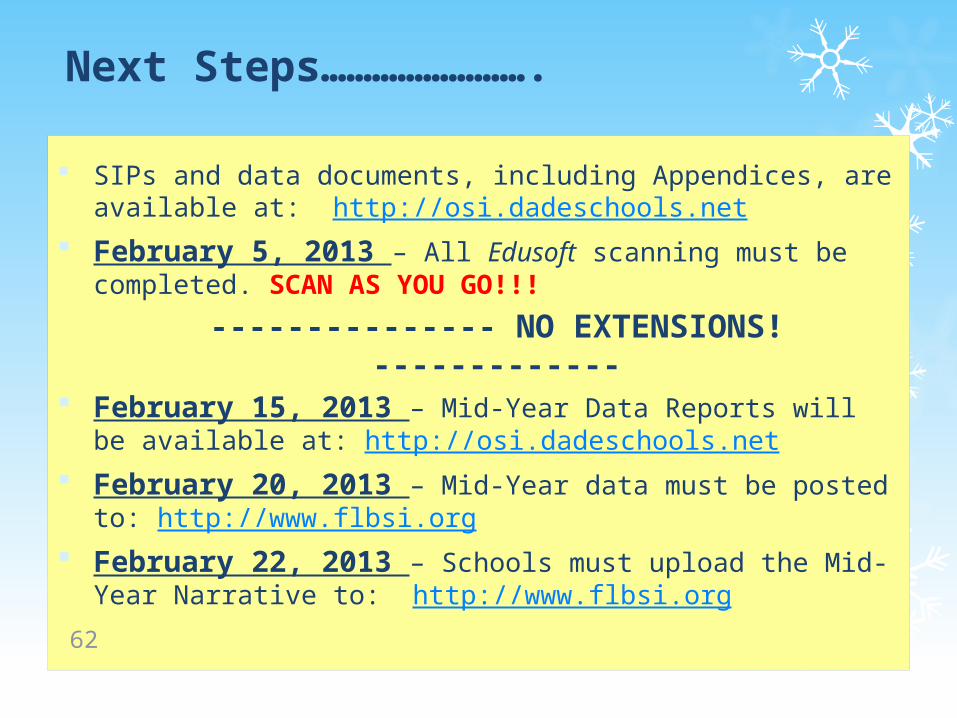
Next Steps…………………….
SIPs and data documents, including Appendices, are available at: http://osi.dadeschools.net
February 5, 2013 – All Edusoft scanning must be completed. SCAN AS YOU GO!!!
--------------- NO EXTENSIONS! ------------- February 15, 2013 – Mid-Year Data Reports will be available
at: http://osi.dadeschools.net February 20, 2013 – Mid-Year data must be posted to:
http://www.flbsi.org February 22, 2013 – Schools must upload the Mid-Year
Narrative to: http://www.flbsi.org
62

Ms. Linda Fife
305-995-2692
Ms. Dolores de la Guardia
Dr. Sherian Demetrius
305-995-7046
Ms. Pamela Wentworth
305-995-1520