OF RADIO-FREQUENCY IRRADIATION ON THE · PDF fileinvestigation of the use of radio-frequency...
59
AD TECHNICAL REPORT / CO) FD-33 SEFFECTS OF RADIO-FREQUENCY IRRADIATION S ON THE ENZYMES OF BEEF MUSCLE TISSUE CL EEA, R I N G H 0 U S E . FDERAL SCIENT1'•I-•IFOX•i Hardco-p-y - -r-f ic. . . ... SS. NELSON '='--MELPAR, Inc. Falls Church, VirginiL, BEST AVAILABLE COPY Contract No. DA 19-129-AMC-262(N) December 1965 -, - U. S. Army Materiel Command L'. S. ARMY NATICK LABORATORIES Natick, Massachusetts
Transcript of OF RADIO-FREQUENCY IRRADIATION ON THE · PDF fileinvestigation of the use of radio-frequency...

AD
TECHNICAL REPORT /CO) FD-33
SEFFECTS OF RADIO-FREQUENCY IRRADIATIONS ON THE ENZYMES OF BEEF MUSCLE TISSUE
CL EEA, R I N G H 0 U S E .
FDERAL SCIENT1'•I-•IFOX•i
Hardco-p-y - -r-f ic. . . ...
SS. NELSON
'='--MELPAR, Inc.
Falls Church, VirginiL,
BEST AVAILABLE COPY
Contract No. DA 19-129-AMC-262(N)
December 1965 -, -
U. S. Army Materiel Command
L'. S. ARMY NATICK LABORATORIESNatick, Massachusetts

AD
TE::CHMiCAL REPORT
F1 D
I ISZ7 OF R-i'-DIC-F&ErZCUlENCY IRRADIATION(.HE"£Z CF' BEFMUSCLE TI"' UF-
y>- D~. Deember, 19t"J
U2.A-,Yr.: ME,:eri-1 Cormman,'lU .ARMY ITAT.CK LAOROPU
"0.~
:, S. 4

FOREWORD
Preservation of meat foods by ionizing radiation sucessfully'stefilizes the products and presents microbial spoilage during pro-longed storage. Treatment required to produce sterility, however,is inadequate to inactivate the natural proteolytic enzymes of themeat. As a result, radiation sterilized raw meat foods deteriorate4uring storage by proteolytic action, becoming; progressively moresender and finally mushy. At the same time a bitter flavor charac-teristic nf free amino acids develops. At present the only effectivemethod for inactivating the natural proteases of meat is a heat treat-ment equivalent to cooking to medium rare. If radiation sterilizedraw meat foods are to be provided for military feeding, some meansother than heat are required for proteolytic enzyme inactivation.
The work covered by this report, performed by Melpar, Inc.under Contract No. DA 19-129-AMC-262(N), represents a preliminaryinvestigation of the use of radio-frequency irradiation to inactivatethe natural proteolytic enzymes of beef muscle tissue. The investi-gator was S. Nelson.
The U. S. Army Natick Laboratories Project Officer was A.S.Henick of Food Chemistry Branch, and the Alternate Project Officerwas E. Wierbicki of Irradiated Food Products Branch, both of FoodDivision.
EDWARD S. JOSEPHSON, Ph.D.Associate Director for Food RadiationFood Division
APPROVED:
FERDINAND P. MEHRLICH, Ph.D.Director, Food Division
DALE H. SIELING, Ph.D.Scientific Director
W. W. VAUGHANBrigadier General, USACommanding
ii

TABLE OF CONTENTS
Page
1. INTRODUCTION 5
2. EXPERIMENTAL PROCEDURE 7
2.1 Preparation and Handling of the Enzyme 7
2.1.1 Isolation and Purification ofProteolytic Activity from BeefTissue 7
2.1.2 Assay Procedures 122.1.3 Optimum pH for Enzymatic
Hydrolyses 192.1.4 Effect of Temperature on
Enzymatic Activity 202.1.5 Lyophilization of Enzyme 25
2.2 RF Radiation Experiments 25
2.2.1 Radio-Frequency RadiationApparatus 25
2.2.2 R-F Radiation Studies 28
3. RESULTS 36
4. DISCUSSION 49
5. SUMMARY AND CONCLUSIONS 52
6. REFERENCES 53
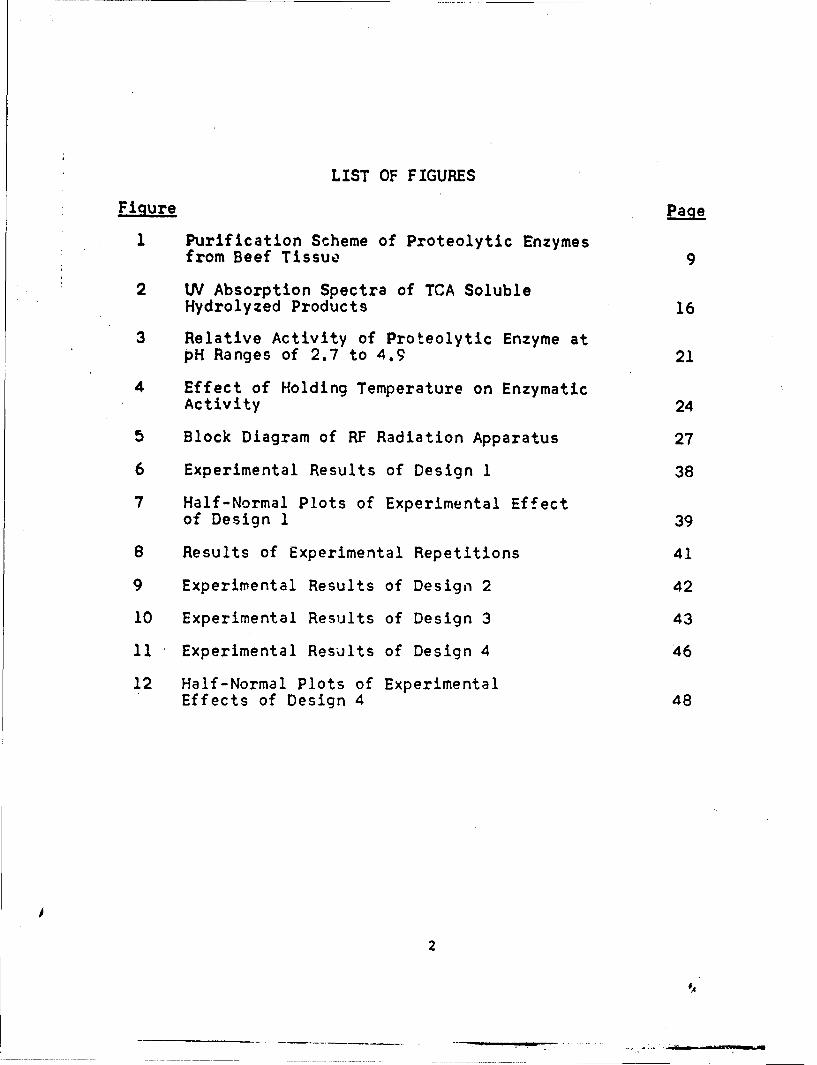
LIST OF FIGURES
Figure Page
1 Purification Scheme of Proteolytic Enzymesfrom Beef Tissue 9
2 UV Absorption Spectra of TCA SolubleHydrolyzed Products 16
3 Relative Activity of Proteolytic Enzyme atpH Ranges of 2.7 to 4.9 21
4 Effect of Holding Temperature on EnzymaticActivity 24
5 Block Diagram of RF Radiation Apparatus 27
6 Experimental Results of Design 1 38
7 Half-Normal Plots of Experimental Effectof Design 1 39
8 Results of Experimental Repetitions 41
9 Experimental Results of Design 2 42
10 Experimental Results of Design 3 43
11 Experimental Results of Design 4 46
12 Half-Normal Plots of ExperimentalEffects of Design 4 48
2

LIST OF TABLES
Table Page
1 Comparison of Specific Activities ofRabbit and Beef Muscle Tissue 17
2 Effect of Holding Temperature on EnzymaticActivity 23
3 Lyophilization of Enzyme 26
4 Experimental Variables and Design #1 31
5 Experimental Variables and Design #2 32
6 Experimental Variables and Design #3 33
7 Experimental Variables and Design #4 34
8 Exnerimental Results, -nd Yates An;•]ysisof Design #3 4A
9 Yates Analysis of Experimental DataDesign 44 47

ABSTRACT
The report covers the work conducted during the period
13 April 1964 to 13 April 1965. The objective of this program
is to study the conditions necessary to inactivate the natural
proteolytic enzymes of beef muscle tissue by radio-frequency
energy.
Preliminary experiments using purified proteolytic enzymes
isolated from beef liver tissue were conducted to determine the
effects of various r-f parameters. From 4 design studies, it
could not be conclusively determined as to what the levels of
the main factors and the interaction factors necessary for
maximum inactivation are. It has bpen shown however that a
set condition about 40% inactivation of the proteolytic
enzymes can be effected.
R-f radiation experiments on ground beef tissue gave
inconclusive results. Chief problem area lies in the fact that
the extraction and purification process does not yield consistent
results.
4

1. INTRODUCTION
This is the final report on Contract No. DA 19-129-AMC-262(N)
with the U.S. Army Natick Laboratories, Natick, Massachusetts.
The objective of this study is to inactivate the natural
proteolytic enzymes of beef muscle tissue by radio-frequency
energy. The successful inactivation of proteolytic activity, in
conjunction with the sterilizing effects of high-energy ionizing
radiation, will provide a means for the non-refrigerated preser-
vation of animal tissues over extended periods of time.
The literature has been reviewed, and a method for the
extraction, isolation, and purification of the natural proteolytic
enzyme of beef liver and muscle tissues was selected and is
described in some detail. The protocol for the preparation
of the proteolytic enzymes has been reduced to a reliable
routine, but, in the initial stages of this work, some
difficulties were encountered. Specifically, the effects of
slight variations in pH during the isolation procedure are
profound, and these were found to make the difference between
a highly active preparation and a preparation with no activity
whatsoever.
A number of methods and/or variation of the methods used
for measuring the activity of the proteolytic enzyme are
described in this report. The assay methods have all been
tried and it was finally determined that the most reliable
5

method was based on the proteolytic hydrolyses of a urea
denatured hemoglobin solution, buffered at pH 4.2 with a O.IM
acetate buffer. Enzymatic activity is indicated by the
increase in optical absorbance of aliquots of the reaction
mixture. Optical measurements are made at 280 mu wavelength, in
the near ultraviolet region. The slope of the linear curve
relating increase in absorbance with time is taken as the
measure of the amount of enzymatic activity.
Becau e the activity Of the enzymes is determined by the
slopes of the curve relating absorbance with time, it is
necessary to determine this slope with considerable precision.
Individual assays are therefore being conducted in duplicates,
and each slope is determined on the basis of the 6-7 aliquots
withdrawn from the reaction mixture over a period of either 25
or 60 minutes.
A detailed description of the schematic of the apparatus
used for the radio-frequency radiation experiments is incorporated
in this report along with the descriptions of the methods
employed for the measuring of the radio-frequency parameters,
such as the power, voltages, and the frequency of the radiation.
The preliminary experiments on the program enzymes dealt
primarily with the studies on the purified proteolytic enzymes
obtained from beef liver tissues. In attempt to ebtain some
concrete information as to what levels of various r-f
6

parameters are most suitable for the inactivation of the
enzymes, a factorial design involving a systematic arrangement
of the values of the variables was devised. Such a design
which encompasses as many as five factors affords knowledge of
the main effects and the interaction of these effects. Thus 4
designs with as many as 16 runs/design were set up. The
parameters studied were frequency, temperature, voltage, power,
duty cycle, and the irradiation time. Other parameters which
might have an effect on the system were kept constant within
the design.
Of the 4 designs completed, we were unable to determine
what the effects of the various parameters were and how they
were affectinq the denaturation process. However, at specified
set of conditions iraccivation of the enzyme was demonstiated.
2. EXPERImENTAL PROCEDURE
2.1 Preparation and Handling of the Enzyme
2.1.1 Isolation and Purification of Proteolytic Activity from
Beef Tissue
Perhaps the earliest description of an isolated cathepsin
or proteolytic enzyme from beef tissue was that of Bills in
1938.1 His enzyme exhibited a pH optimura of approximately 4.1,
and it was thun differentiated from the activity of pepsin (pH
optimum approximately ?)2,3 and trypsin or chymotrypsin (pH
optimum approximately 8).A,5
7

In 1950, Snoke and Neurath described in detail the isolation
and purification of proteolytic enzymes from striated rabbit
muscle. 6 When assayed using a urea denatured hemoglobin sub-
strate, buffered with O.1M acetate, their enzyme exhibited a pH
optimum at approximately 4.0. The enzyme was activated by
ferrous ions, and to a lesser extent by magnesium and manganese.
Zinc, calcium, cobalt, and cysteine had no clear influence on
activity.
The Snoke and Neurath procedure has been used for the
preparation of enzyme in this study, and is described here in
detail. A schematic flow chart of the isolation and purification
procedure is presented in figure 1.
Fresh beef tissue was obtained at a slaughter house and
transported to the laboratory in an ice chest. The tissue was
then divided into pieces weighing approximately 200 gms and
quick frozen with liquid nitrogen. The frozen beef tissue was
stored in a deep fz-eze at -15"C until ready for use, at which
time it was chopped into cubes approximately 1/2 inch on a
side while still frozen.
It was found that the enzymatic activity is apparently
somewhat sensitive to heat during the early stages of purifica-
tion; in any event, the heat generated in a large, one-quart
Waring Blendor by the action of the blades was enough .o darken
the meat homogenate; no activity was obtained from such prepara-
tions. A smaller Osterizer blendor 'ir of 1/2-pint capacity
was used in subsequent experiments with better results. 8

R9982
BLEND I PART 1EP ÷•.VOLýS" 2% KCI
CA TCENTRIFUGE, " 0C
DISCARD PPT SUPERNATENTS ".ADJ. p"TO 5.b
* *HEATTO 350 FOR 10 MIN
CENTRIFLGE, 00,
I • - ,.4J .SUPERNATENT . * {ISCARD PPTMAKE 1I IN NoQAc Cl3 aADJ. PH TO 4.0 3 a .
CENTRIFUGE, O°C "
S i . 4• • . 'DISCARD PPT SUPERNATtNT " •D ADJ.pFt T 6.0 e
-.DIALYZE OVERNI(YHT 0% KCI .9
S* I S
•-X "AJpH TO 5.8 •... ;"•"I 9
I I.COGL TOr~O - 100C 6
CENThR`FUGK E .100 C
SUPEkNATENT DISCARD FPTACJ, PH 'TO 7ýý
CENTRIFUGE,.. 100 C D
DISCARD SUPERNATENT R O T .'P.•TS... DISSOLVE I110.02 M CITRATE
ADJUST TO pH 6.0• . DIALYZE OVERNIGHT, 2% KCI
Figure 1B
* • 9. 4I
F'igure 1. Purification Scheme of Proelt Lnypelron• Beef Tissue
* 5
° 9

The 1/2-pint Jars conveniently hold 50 gms of partially
frozen beef tissue, plus 100 ml 2% KCI chilled to 40C. The
mixture is allowed to blend for no more than 45 seconds. The
pink homogenate is then allowed to set at 40C in a zefrigerator
overnight.
The following morning, the homogenate should still be bright
pink in color, and quite fluid unless the original beef tissue
contained considerable amounts of tendon. In the latter case,
a heavy gelatinous mass is obtained which must be reblended. The
extract is transferred to 250 ml polypropylene certrifuge
bottles and centrifuged for I hour at 5000 rpm and an internal
head temperature of approximately 00 C. (We are currently using
an IEC refrigerated centrifuge, Model HR-1, equipped with Model
858 head for this purpose.) In a typical preparation, starting
with 150 gms beef muscle and 300 ml 2% KC1, the volume of the
crude supernatant extract following this first centrifugation
amrounted to approximately 350 ml.
The lightly colored, opalescent supernatant is adjusted
to pH 5.0 using 1 N HC1, and then heated to 35 0C in a 400C
water bath with constant agitation. After the solution reaches
a temperature of 35CC, it is allowed to set for 10 minutes,
and is then recentrifuged as before. The precipitate is a light
brown material. Total volume of the supernatant is approximately
97% of that which was heated. The temperature has been reduced
to approximately 00C during centrifugation.
10

Sufficient 10% sodium trichloroacetate at pH 4.0 is then
added to give a final solution which is 1% in NaTCA, and the pH
of the whole solution is adjusted to 4.0 with 1 N H01. The
material is centrifuged a third time at the same temperature
and speed, and the precipitate discarded.
The pH of the supernatant is now adjusted to 6.0 with 1N NaOH.
The liquid is placed in a dialysis tube approximately 3/4 inch
in diameter and dialyzed at 40C overnight against 4-5 changes
of 2% KC1.
This first dialyses step presumably removes the sodium
trichloroacetate.
The morning of the third day the solution is removed from
the dialyses tubing and I.OM zinc acetate is added to give a
final solution which is 0.02M is ZnOAc. The pH is adjusted to
5.8 with I N HCl, and the enzyme is returned to 250 ml
centrifuge tubes. These are placed in an ice salt bath, and
previously chilled ethanol is added slowly as the temperature of
the entire solution is chilled to -100C.
The solution is then centrifuged for 1/2 hour aSL 5000 rpm,
and a head temperature of -100C. A brown pasty precipitate is
obtained Ahich is normally discarded. The pH is raised with
i N NaOH to 7.5, and the solution is centrifuged a final time,
still maintaining a temperature of -100 C.
The second zinc precipit-te from the ethanolic solution
contains the bulk of the enzymatic activity. It has a bright
11

pink appearance, much like that of the original beef-KC1 hcno-
genate; if the activity is high, it will normally be soluble
in approximately 2 volumes of 0.02M citrate buffer, pH 6.0.
The citrate buffer solution of the eizyme is again
dialyzed over night against 2% KCI to remove traces of zinc.
Some 5-6 changes of KCl solution are normally utilized, and the
solution is tested with Dithizone reagent to check removal of
zinc.
For every 100 gms of beef tissue one normally obtains
approximately 15-20 ml of final enzyme solution containing
approximately 3-5 mg protein per ml.
The isolation of proteolytic enzyme from beef liver tissue
was done according to the same procedure described for beef
muscle tissue.
2.1.2 Assay Procedures
The assay procedure described by Snoke and Neurath 6 is
a modification of that described by Anson. 7 More recent
descriptions of the same procedures are described by Bergmeyer.
Because there are a few minor variations among all of these
comparable methods, and because the reasons for some of the
adaptations do not seem to have been fully explained in the
literature, the complete assay system and procedure are
described here.
A method dep:?nrd on the hydrolysis of a urea denatured
hemoglobin solution. The hydrolysis is performed at 351C
12

in the presence of 0.033M acetate buffer at a pH of 4.0. A pH
of 4.0 is near the lower limit of the range for acetate
bufferes, and a citrate buffer solution would seem to be a much
more logical choice. However, citrate would undoubtedly
sequester the ferrous ions which are added as an activator and,
for this reason, an acetate system is about the only readily
available buffer system which can be utilized.
Hemoglobin was prepared according to the me iod of Anson,7
but it did not prove significantly superior to commercial
preparations on the market today. Ten grams of hemoglobin were
dissolved in 250 ml distilled water contained in a 500 ml
volumetric flask. Some 40 ml 1.0 N NaOH and 180 gms urea were
added. The urea dissolved with some difficulty over a period
of about 30 minutes with constant stirring. Approximately 50
ml of additional distilled water was added to bring the solution
to a total volume of approximately 400 ml. The solution of
the urea is an endothermic reaction, and the solution needs to
be brought to room temperature with a warm-water bath. The
solution was then allowed to set for I hour to permit denaturation
of the hemoglobin by the urea.
Sufficient sodium acetate was added (6.8 gms/500 ml) to
give a final concentration of O.lM acetate. The pH was
adjusted to 4.0 and the solution was diluted to its final
volume of 500 ml. Aliquots of the buffered, denatured hemo-
globin solution were frozen until ready for use.
13

Individual assays were conducted by placing 5.0 ml of
hemoglobin substrate and 5 ml 0.IM acetate buffer pH 4.2 in a
13 x 150 mm culture tube incubated in a water thermostat at 356C.
Sufficient distilled water was added to give a final volume,
after the addition of enzyme and ferrous ion activator of 15 ml.
Normally, the amount of enzyme used was 1.0,ml, together with
0.3 ml of 0.5M ferrous ammonium sulfate solution; the amount
of water added was, therefore, 3.7 ml. The water and hemoglobin
solutions were allowed to equilibrate for at least 1 hour.
Ferrous ammonium sulfate was then added (0.3 ml of 0.SM
solution), giving a final ferrous ion concentration of O.OIM.
A suitable interval timer is started as soon as the
enzyme is added and mixed with the substrate, and two ml aliquots
are withdrawn at intervals and quickly mixed with 5 ml of 5%
trichloroacetic acid to stop the enzymatic reaction. The
tubes are allowed to set at least one-half hour. They are then
centrifuged or filtered to give the clear TCA soluble
hydrolyses products. Our experience has indicated that clarifica-
tion by centrifugation gives more consistent results and is,
therefore, preferred over filtration. Perhaps a variable
portion of the hydrolyses products are adsorbed onto the filter
papers.
There are several alternatives for determining the extent
of hydrolyses. One of these is the determination of tyrosine
with the phenol reagent of Folin and Ciocalteu. 9 Anson's
14

modification of this method allows the use of a standard curve.
The blue color produced may be reaction of the tyrosine and
phenol reagent and read conveniently on any instrument in the
visual region at 580, 690, or 750 mu.
Another alternative is simply to determine the optical
density of the clarified TCA solutions at 280 mu in the near UV.
Figure 2 is a UV absorption spectrum of the hemoglobin hydrolyses
products which was obtained on a Beckman DK 2 UV recording
spectrophotoneter. This is a dual-beam instrument, and the
curve was obtained with a 0-time sample in the reference beam
and a 30-minute sample in the response beam. The curve is,
therefore, a true representation of the UV absorption response
due to hydrolyses. It is seen from the curve that 280 mu
absorption is a valid measure of the extent of hydrolyses.
For routine assay work, the use of the Beckman DU instru-
ment has proven somewhat more convenient. The absorbance of
the solutions is determined after setting the instrument to 0
absorbance, using a distilled water blank. The 0-time samples
have an absorbance of about 0.350 under these conditions, but
this is of little consequence because the important feature is
the change in absorbance with time.
Snoke and Neurath 6 expressed activity in terms of an
arbitrarily defined "Specific Activity" which they defined as
"increase in optical density per hour per mg of muscle protein
nitrogen in I cc of reaction mixture.' Table 1 compares the
15

R9983
___________inID
-on
2 Z
wwýo
wXW
z -j
ZUJ>
I- 3-
0w
in4Fn
U.,
0 0 0 0 040 w Iw 3
Figue 2 U.. AsortionSpetraof CA olube Hdroyze Prduc
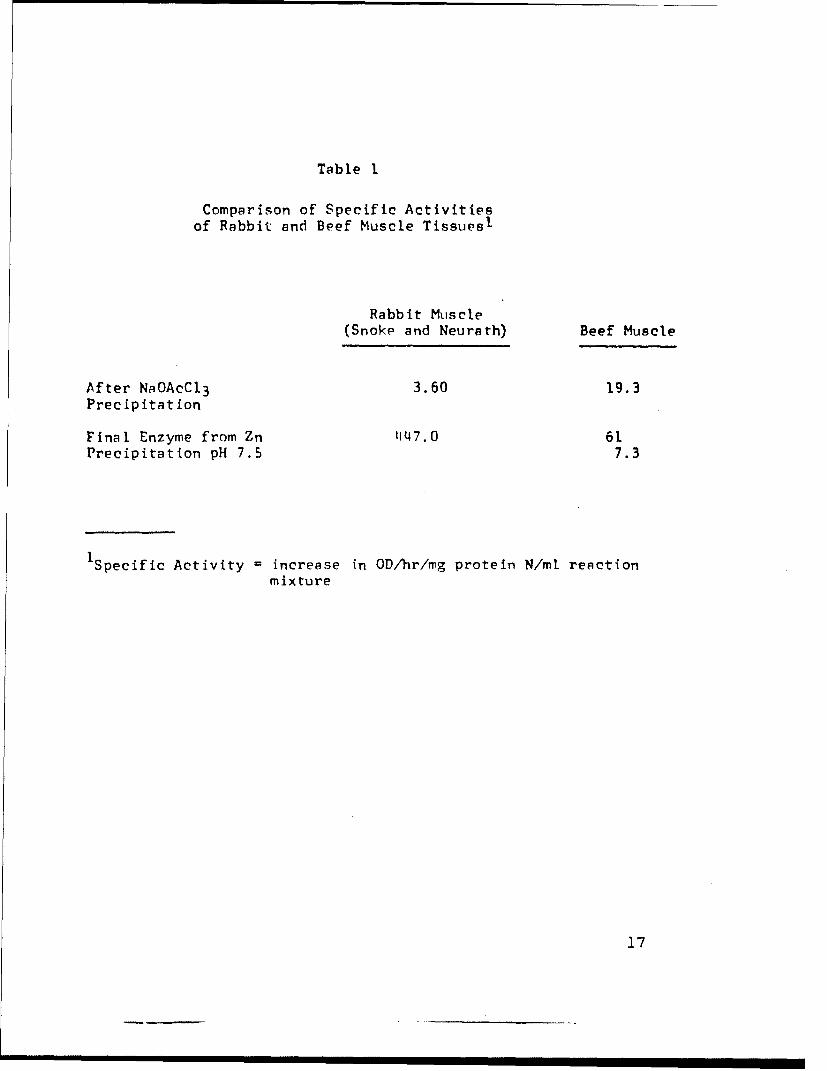
Table I
Comparison of Specific Activitiesof Rabbit and Beef Muscle Tissuesl
Rabbit Muscle(Snoke and Neurath) Beef Muscle
After NaOAcC1 3 3.60 19.3Precipitation
Final Enzyme from Zn 1I147.0 61Precipitation pH 7.5 7.3
1Specific Activity increase in OD/hr/mg protein N/ml reactionmixture
17
specific activities of some beef muscle enzymes with the specific
activities.of the rabbit muscle enzymes as published in the
original paper.
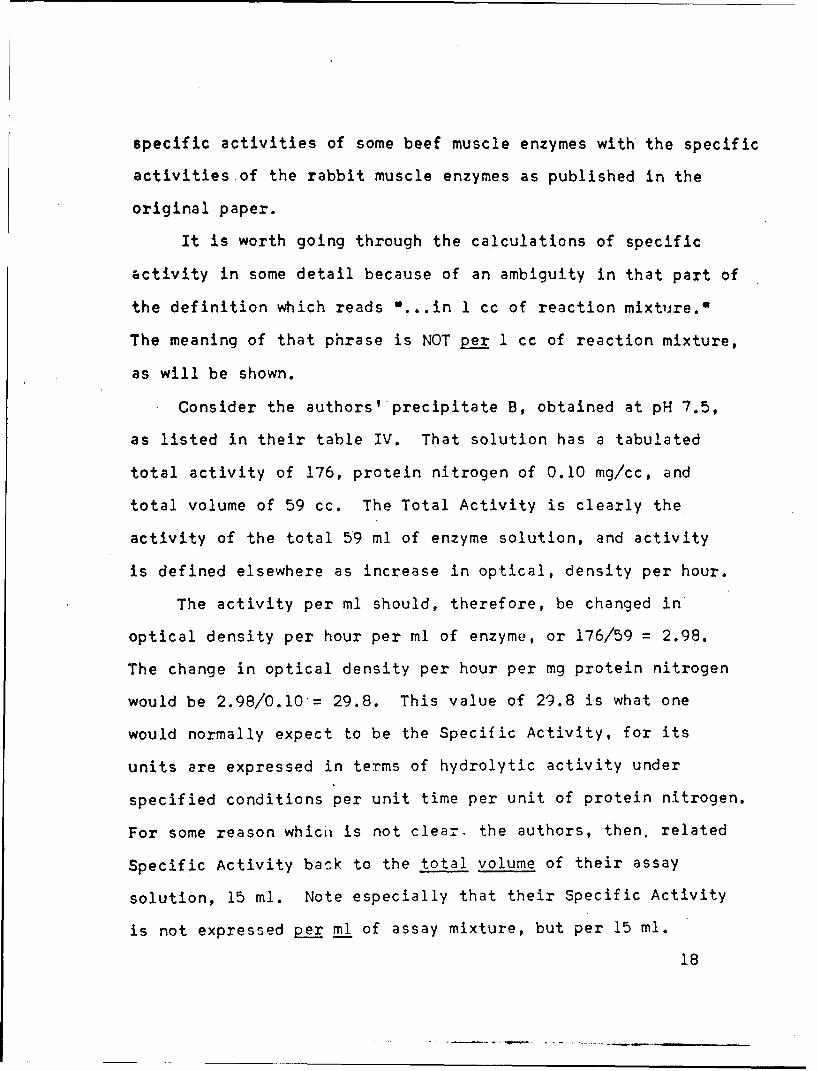
It is worth going through the calculations of specific
activity in some detail because of an ambiguity in that part of
the definition which reads 0...in 1 cc of reaction mixture.=
The meaning of that phrase is NOT per 1 cc of reaction mixture,
as will be shown.
Consider the authors'precipitate B, obtained at pH 7.5,
as listed in their table IV. That solution has a tabulated
total activity of 176, protein nitrogen of 0.10 mg/cc, and
total volume of 59 cc. The Total Activity is clearly the
activity of the total 59 ml of enzyme solution, and activity
is defined elsewhere as increase in optical, density per hour.
The activity per ml should, therefore, be changed in
optical density per hour per ml of enzyme, or 176/59 = 2.98.
The change in optical density per hour per mg protein nitrogen
would be 2.98/0.10= 29.8. This value of 29.8 is what one
would normally expect to be the Specific Activity, for its
units are expressed in terms of hydrolytic activity under
specified conditions per unit time per unit of protein nitrogen.
For some reason whicii is not clear. the authors, then, related
Specific Activity bask to the total volume of their assay
solution, 15 ml. Note especially that their Specific Activity
is not expressed per ml of assay mixture, but per 15 ml.
18

Multiplying the 29, 8 x 15 = 447 gives the tabulated Specific
Activity. The original convention has been retained during
this work, if for no r-eason other than to make comparisons
of specific activity easier.
Protein nitrogen was determined with a Coleman nitrogen
analyzer. This instrument is designed to work well with samples
containing 0.1-0.5 mg nitrogen;-hence, the protein nitrogen
determinations do not require the volume of enzyme solution
which would otherwise have to be sacrificed for this purpose.
The instrumental method is verified periodically, using samples
of chromatographically pure amino acids obtained commercially.
In summary, the assay solution consisted of a total
volume of 15 ml containing 1 ml of enzyme, 5 ml of acetate
buffer, 5 ml of hemoglobin solution, 0.2 ml ferrous ammonium
sulfate and 3.7 ml distilled water. The supernatant was
read directly in a Beckman DU spectrophotometer at 380 mu.
2.1.3 Optimum pH for Enzymatic Hydrolyses
The variation of the rate of enzymatic hydrolysis with
changes in pH was investigated to help assure that the
enzymatic activity was not due to activity of the more common
pepsin and trypsin.
Portions of the buffered substxýte were adjusted to a
series of five different pH values. The initial intention was
to select values around the stated optimum pH of 4.0, and vary
these by a constant fourfold change in the hydrogen ion
19

concentration. The values of pH which were chosen were 2.8,
3.4, 4.0, 4.6, and 5.2. Duplicate assays were run at each pH
level.
A check of the actual pH of the reaction mixture during
the assay indicated that the target values were missed somewhat,
presumably because of the effect of the ferrous ammonium sulfate
which was mentioned earlier. The actual electrometric values
of pH, obtained on the same instrument which had been u ed just
a short time before to standa.rdize the substrates, shoeId
values of 2.7, 3.2, 3.8, 4.3, and 4.9.
From the absorbance readings obtained at 380 mu during
the assay, the slopes of the lines of best fit were calculated,
and these, in turn, were used to calculate relative activity
of the enzymatic reaction at the various actual values of the
pH of the reaction mixture. The results are indicated by the
curve of figure 3. An optimum pH between 3.8 and 4.3 is
indicated.
No additional effort was made to pinpoint the best possible
pH because it is clearly difficult to control, and probably not
critical for the purposes of this program.
2.1.4 Effect of Temperature on Enzymatic Activity
The effect of incubating the enzymc solution at several
temperatures on the rate at which it was able to hydrolyze the
hemoglobin substrate was investigated. It should be noted that
this is not the qame thing as a determination of the optimum
20

19984
I00
75
I..--
U
-J 50
25
2.7 3.2 3.8 4.3 • .4.9
pH
00
Figure 3. Relative Activities of Proteolytic Enzyme at pH Range 2.7 to 4.9
21
-a----

temperature for the hydrolyses reaction, nor does it indicate
anything about the rate at which the enzyme deteriorates at
any fixed temperature. It has been our experience that the
purified enzyme deteriorates quite rapidly if stored as a
solution, and becomes inactive in some four or five days. This
may be due to the natural proteolytic activity of the material,
which causes it to chew itself into inactive pieces.
Aliquots of an active enzyme preparation were incubated for
24 hours at temperatures of O°C, 230C, 400C, and 600C. Assays
were then run according to the standard procedure described
above. The absorbance readings obtained are given in Table 2.
The slopes of the lines of best fit were then calculated
according to a conventional least squares method, and the rate
of hydrolysis per hour calculated by multiplying those slopes
(change in optical density per minute) by 60 minutes. The
unit activities were then utilized to calculate the specific
activities.
In figure 4, the specific activity is plotted as a function
of the incubation temperature. There is apparently little
difference in activity between O0C and 200C, but the activity
drops off quickly at higher temperatures. It is quite interesting,
however, that even after 24 hours at 60 0C appreciable amounts
of activity remain.
One of the main purposes of this particular study was to
be certain that all of the enzymatic activity would not be
22
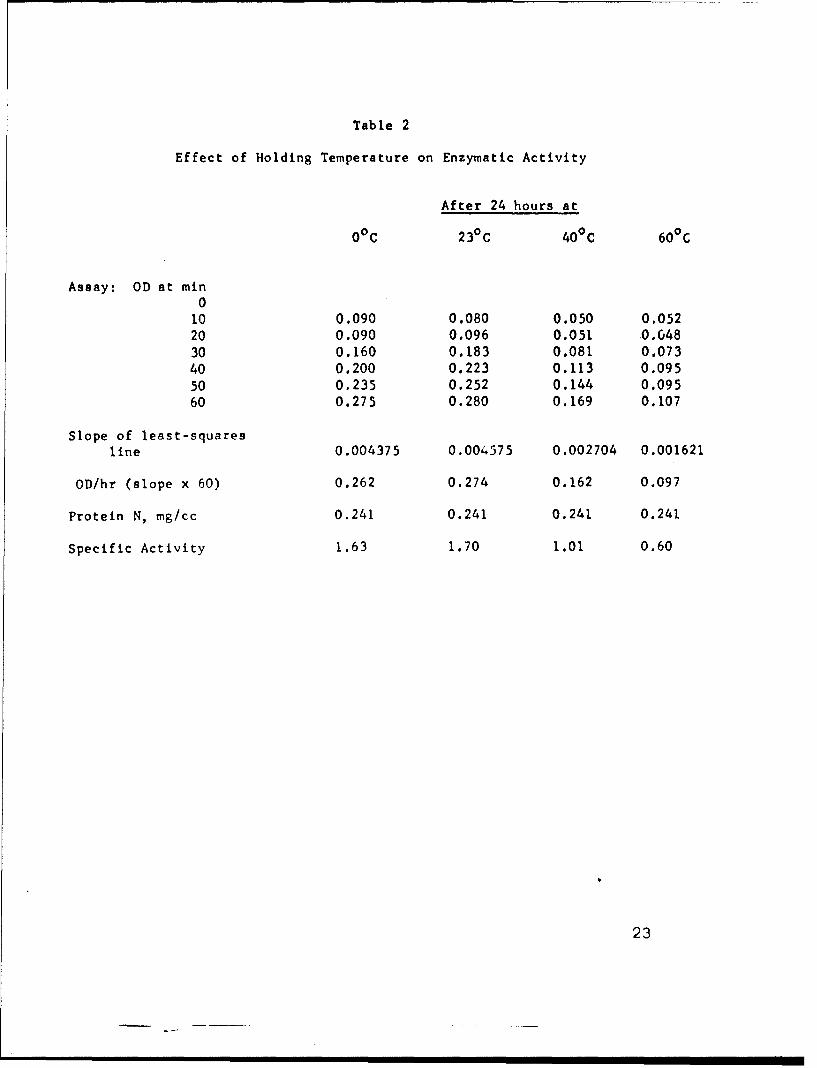
Table 2
Effect of Holding Temperature on Enzymatic Activity
After 24 hours at
00 C 23°C 400 C 60 0 C
Assay: OD at min0
10 0.090 0.080 0.050 0.05220 0.090 0.096 0.051 0.648
30 0.160 0.183 0.081 0.07340 0.200 0.223 0.113 0.09550 0.235 0.252 0.144 0.09560 0.275 0.280 0.169 0.107
Slope of least-squares
line 0.004375 0.004575 0.002704 0.001621
OD/hr (slope x 60) 0.262 0.274 0.162 0.097
Protein N, mg/cc 0.241 0.241 0.241 0.241
Specific Activity 1.63 1.70 1.01 0.60
23

R9985
2
U
UU.-
0 20 40 60 80T, 0 C
Figure 4. Effect of Holding Temperature on Enzymatic Activity
S- 24

destroyed during the 24-hour, radio-frequency irradiation by
temperature effects alone.
2.1.5 Lyophilization of Enzyme
In general, the stability of the enzyme is so poor that
it has not been possible to prepare sufficient material at one
time for more than a single r-f experiment. The r-f cells
hold approximately 15 ml of enzyme solution each and, with
adequate controls, a single experiment consumes all of the
preparation at one time. The desirability of being able to
salvage as much activity as possible is obvious.
Experiments were, therefore, performed to determine how
much of the activity was lost by the process of freeze drying
or lyophilizing the enzyme.
Duplicate 5 ml aliquots of an active preparation were
placed in identical 50 ml rb flasks and shell frozen with
liquid nitrogen. One of the flasks was maintained at -1O0 C,
while the other was connected to a commercibl lyophilization
apparatus and dried overnight. The dried material was then
reconstituted with 5 ml of distilled water; the control was
allowed to thaw. Assays were run on both samples. The results
are shown in Table 3.
In is obvious that the enzyme can be lyophilized with
little or no loss of activity.
2.2 RF Radiation Exoeriments
2.2.1 Radio-Frequency Radiation Apparatus
A block diagram of the r-f irradiation system is shown
in figure 5. It consists of aTextronic Industries

Table 3
Lyophilization of Enzyme
Control Aliquot Lyophilized Aliquot
OD, 0 min10 min 0.034 0.03520 min 0.080 0.07730 min 0.105 0.09840 min 0.127 0.12150 min 0.136 0.13560 min 0.174 0.153
Equation, line of best fit,y a a + bx
slope, b 0.00276 0.00251intercept, a 0.0109 0.0131
26

R9986
SWEEP Is- 2ndGENERATOR AMPLIFIER AMPLIFE
SGALGENERATOR OSCILLOSCOPE
ip
Figure 5r. B~lock Diagram of RF Radiation Apparatus
27

sweep generator of variable frequency and sweep width. Its
output is fed through two Hewlett-Packard wide-band amplifiers
(Model 460 A and B). The amplified sweep is then used as the
VFO input to a Viking Challenger short-wave transmitter, and
the resultant r-f is fed through a Bendix, Model 2633, r-f power
and VSWR meter. The irradiation is coupled to the sample cell
by an E.F. Johnson variable inductor (Series 229). A Hewlett-
Packard s'.gnal generator (Model 608A) is used with an oscillo-
scope to monitor the transmitter frequency.
In )peration, the sweep generator frequency and width are
first adjusted to give the desired r-f range, e.g., 13.0-13.2
mc. The variable inductor is then adjusted for maximum net
power, i.e., forward power less reflected power, as read on
the Bendix Power Meter. The net power, frequency and temperature
are periodically checked during the irradiation time.
2.2.2 R-F Radiation Studies
During the initial period of the program the source of
enzymes chosen was the frozen beef muscle tissue. It was found
that a large quantity of frozen beef muscle tissue was required
in order to isolate sufficient quantities of enzymes. Since
the isolation and the purification process was an extremely
tedious and time consuming process, beef liver tissue was
selected as the source for the experimental material. Beef
liver tissue is known to be rich in the proteolytic enzymes
and was found to be much more satisfactory for the required
studies. 2r,

The enzyme preparations were made in batch quantities that
were large enough for at least 20 experiments. The preparations
were divided into aliquots which were then stored in the
freezer. In this way uniformity of sample was assured
for an entire set of experiments.
In carrying out the r-f irradiation experiments, enzyme
solution of a quantity sufficient to completely immerse the
electrodes is Aitroduced into two identical cells; one cell served
as a control for comparison with the experimental cell. Both
cells are then placed in a constant temperature water bath.
While both are maintained at a constant temperature, the
experimental cell is irradiated with r-f energy. At the
completion of the irradiation period, both cells are removed
from the water bath, and their contents are immediately
assayed for enzyme activity.
The cells employed in these studies were fabricated from
epoxy boards with the r-f electrodes placed behind a non-
conducting coating of epoxy resin. Three type of cells with
varying configuration were used in these experiments. These
cells and their dimensions are:
Plate PlateCell Dimension; Distance Volume
Cells A 2" x 5" 0.2 cm 5 cc
Cells B 2" x 5" 0.4 cm 8 cc
Cells C 3" x 10" 0.7 cm 250 cc
29

Cells A and B were used for the experiments on the purified
proteolytic enzymes whereas cells C were used for the experi-
ments on the ground beef muscle tissue.
The program was developed around four statistically designed
experiments, each with at least 8 runs. Design #1 was devised
to study five general factors affecting the results of r-f
irradiation. The five factors were: (1) irradiation time, (2)
target frequency, (3) voltage, (4) temperature, and (5) duty
cycle. This design is shown in Table 4.
As will be seer in Section 3, the results of design #1
was that the significant factor was the irradiation time and
the interaction between the irradiation time with voltage.
Consequently design #2 was devised to study these factors.
The irradiation time was shortened to 1/4 hours and the power
level was substituted for the duty cycle. Also lower levels
were designated for both the frequency and the temperature values.
(See Table 5.)
In design #3 only three variables were studied, the
frequency of the r-f radiation, the voltage and the power. The
irradiation time and the temperature were kept constant at
values of 1/2 hour and 16.5 0 C respectively. (See Table 6.)
Design #4 consisted of 16 experiments along with 4 simulated
r-f experiments, was set up to study the effect of voltage and
duty cycle on the inactivation process. (See Table 7.) These
factors were studied at three levels for the duty cycle and 4
30

LM Nf C'J Af LA~ f- C.' r~j 0 Im m) ---t P-4
-4 -4F- W
LLf) ýj 0- . Li -f) P4 L I n -1 u-4 ir n i) uJ n l -I LnL
Ln Ln 000000000o000000 C C C C C C C C
-W .. dto 0 C C -40 in if) Ln In if) I) In I)) In In i) U-1 Lu Lfl L) if)
0
U,~ q I ,c 4a ýýt ýa ;c
.00
> alF. L n L n U n UlL r
-4 (pa pa -- ý 4-j NJ u pc: pr ) - ,z
>3

Table 5
Experimental Variables and Design of Design #2(Cell A)
Factor Symbol Factor Values
A Irradiation time (hours) 1/4 1/2
B Target Frequency (mc) 7.0 11.85
C Temperature (or) 12.0 16.5
Voltage (volts) 25 100
Power (watts) 0.1 1.0
Experiment A B C D ENo. Irradiation Target Temp. Voltage Power
Time - Hrs. Frequency - mc °C
1 1/4 7.0 12.0 25 0.1
2 1/2 7.0 16.5 25 1.0
3 1/4 11.85 16.5 25 1.0
4 1/2 11.85 12.0 25 0.1
5 1/4 7.0 12.0 100 1.0
6 1/2 7.0 16.5 100 0.1
7 1/4 11.85 16.5 100 0.1
8 1/2 11.85 12.0 100 1.0
32

Table 6
Experimental Variables and Design of Design #3(Cell B)
Factor Symbol Factor Values
A Irradiation time (hours) 1/2
B Target Frequency (mc) 11.9 13.5
C Temperature (°C) 16.5
D Voltagc ý'-;olts) 60 100
E Power (watts 0.5 1.0
Experiment A B C D ENo. Irradiation Target Temp. Voltage Power
Time - Mrs. Frequency-mc °C
1 1/2 11.9 16.5 60 0.5
2 1/2 13.5 16.5 60 0.5
3 1/2 11.9 16.5. 100 0.5
4 1/2 13.5 16.5 100 0.5
5 1/2 11.9 16.5 60 1.0
6 1/2 13.5 16.5 60 1.0
7 1/2 11.9 16.5 100 1.0
8 1/2 13.5 16.5 100 1.0
33

Table 7
Experimental Variables, Design and Results of Design #4(Cell B)
Variables Levels
0 1 2 3
Duty Cycle 0.5 .15 .25Voltage (volts) 50 100 150 200
Sequence No. Experiment No. Duty Cycle Voltage Result
4 1 0 0 101.6
10 2 1 0 107.1
21 3 2 0 99.0
12 4 1 0 92.0
2 5 0 1 103.6
13 6 1 1 116.2
17 7 2 1 118.5
15 8 1 1 107.5
18 9 0 2 103.1
19 10 1 2 113.3
7 11 2 2 91.2
20 12 1 2 108.8
8 13 0 3 96.2
5 14 1 3 90.2
3 15 2 3 97.7
6 16 1 3 92.1
34
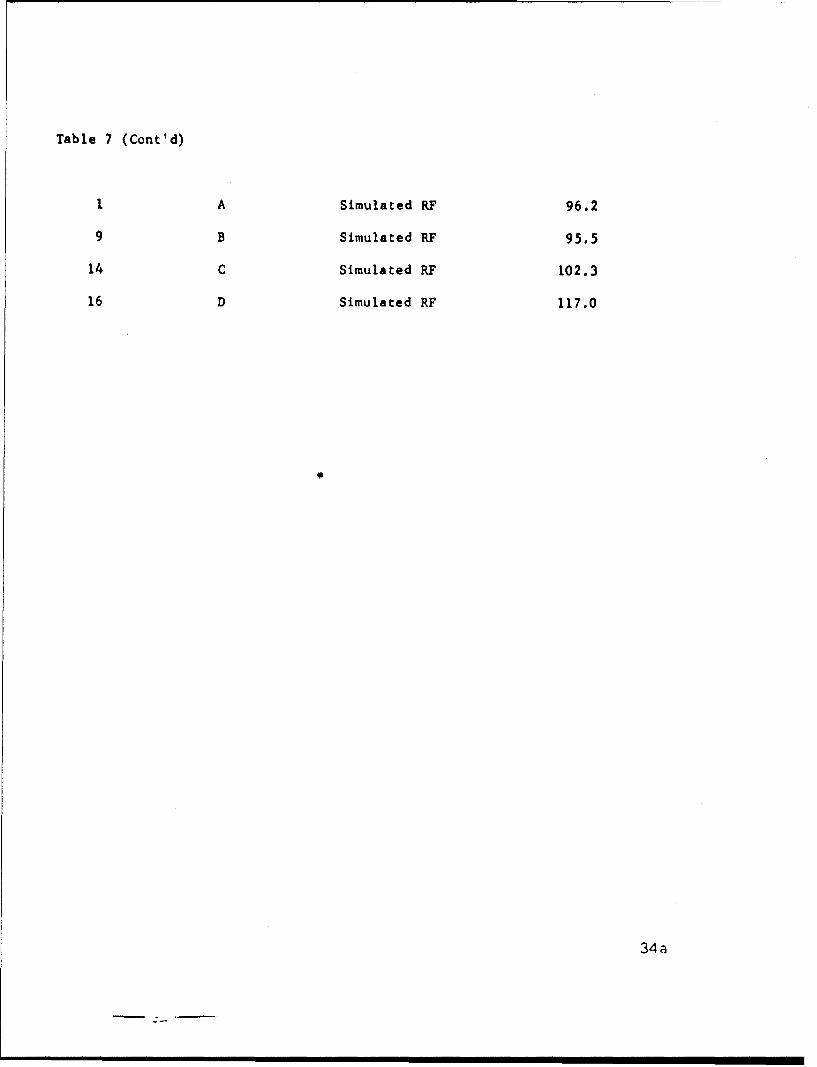
Table 7 (Cont'd)
1 A Simulated RF 96.2
9 B Simulated RF 95.5
14 C Simulated RF 102.3
16 D Simulated RF 117.0
34a

levels for the voltages. The frequency of the r-f radiation was
kept at a constant value of 13.5 mc. The power level was
kept at 5 watts and the temperature at a constant value of
16.5 0 C.
R-f irradiation of beef muscle tissue were conducted in
similar manner as the r-f irradiation experiments of the purified
proteolytic enzymes. However~because of the use of ground beef
tissue, some deviation from the procedure is expected and is
given.
The beef tissue obtained directly from the slaughter house
was kept frozen at -20*C when not in use. About 80 gms of beef
muscle tissue, mixed with 80 cc of 2% KC1 was blended with a
blendor for 10 secondb. The sample was placed in an epoxy cell
8 x 10 x 9/32 (0.7 cm) inches and subjected to r-f energy. A
similar sample also placed in a cell but with the absence of
r-f energy served as the control sample. Following the
irradiation reriod, both the r-f sample and 'he control samples
were subjected to the extraction procedure for the isolation
and purification of enzymes as given in the previous section.
The extracted enzymes from both the r-f sample and the control
samples were subjected to analysis using the urea-denatured
hemoglobin method.
During this period three "simulated r-f" experiments on
the ground tissue were conducted to determine the effects of
the cell on the enzyme and to determine the effectiveness and
35

accuracy of the extraction method on two similar samples taken
from a common aliquot.
Two r-f irradiation experiments were conducted at the
following conditions: temperature, 16.50C; frequency, 13.5 :0.3
mc; voltage, 50 volts; duty cycle, 0.1; and watts, 5.0 watts.
3. RESULTS
The results of the experiments of the 4 designs are present,
in graphic form with all the runs of a design given in a single
figure. The inactivation of the enzyme expressed in percent was
determined by comparison of the absorbance of the control and
the r-f sample after 25 minutes of reaction time. The experi-
mental results of the factorial design were arranged in standard11
order according to Davies and were analyzed by the Yates
algorithm method. In the calculations of the Yates analysis
the "Mean SquareO values represent the variation of an effect
shown as "Effect Estimated" from the expected effect. When the
mean square is small (approaching zero) there is no difference
between the levels of the referenced variables. Conversely, a
large difference between the levels will be reflected by a
large mean square. In some cases an additional method is used
to determine whether any one factor is significant. The method
employed to determine factor significance is the half-normal
plot method. The half-normal plots are plots of the ranked
absolute values of the effects of a 2 x ( factor at 2 levels)
experiments on a special grid. If none of the factors or
36

interaction factors studied has a significant effect on the
system, the values will be normally distributable and assume
a straight line when plotted on a special probability grid.
Factor significance is shown by a large deviation of its
effect from the plotted line. The graphical co-ordinates of
the effects are determined by the following relation:
Prob. = (i-1/2)/2; i = 1, 2, 3.... etc.
where n is the number of effects estimated. The smallest
absolute value corresponds to the probability i = 1, etc.
The results of the experiments in design #1 are given in
Figure 6. The analysis of the experimental data were limited
because of the inaccuracy of extrapolating from the analytical
results a response for t ;e in the mathematical analyses and
because of a large eyperimental error. However, the analysis
of data by use of the half-normal plots shows that one factor
and possibly two other factors seem to affect the results.
(See Figure 7.) The one single factor which in itself has an
effect on the system is the irradiation time. The shorter
irradiation periods cr approximately 1/2 hour yielded the
greatest enzyme inactivation. However, the differences observed
amonc( the various experiments at a 1/2 hour radiation indicate
quite clearly that other factors may contribute to the effect.
Inspection of the half-normal plots of this design indicate
probable interaction factors of the irradiation time-voltages
and the irradiation time-duty cycle effect.
37

-- --- ...... ..I+- .. .!.. ... . ..... "S. ...........
--. . -. -- ----- lp .
+,.+.++ .. .. • a ", ... . ... .' - , . .- No,•'
+ . + .: ...t .. . . . 4+- . ! - ... .~ -- ... . .- . .. . . .. ..: . .-I "
4v.
__~~~~a - .'-~'
___'- ' \+~- - -___
* *I - -" + . . . . . .4..... . ... . .+ .. +- , ... . . --- : "
- - , , II V '
4- - - .+ - - - -:.'.-C *,. + .. . ,+ .. + . .... . * _ _.__ __._ _ _
..
i.
, !,
.. .. . ., 1+ .. ... ' . . . :
4;u -\ ; Quý ;Ik38..', --
- + 4 ''-1 a, ,
+ - M -,'• • = | p, ,,,- - ., .'
"4- ;u L- , ..-;v' + -+ , " . .,, +' ++
i : .. . . . . . i3 8

E2362
99 6 _
98
_ 96nn• ,: •*(IRRADIATION TIME)
o 90a. *(IRRADIATION TIME X VOLTAGE)
80 (IRRADIATION TIME X DUTY CYCLE)80
40 ___
20
0 _ _
EFFECT
Figure 7. Half-Normal Plots of Experimental Effect of Design 1
39

Of the 16 runs in experimental design #1, only run #3 gave
a significant decrease in enzyme activity under the irradiation
conditions. The conditions of this experiment were 13.5 mc,
16.5 0 C, 50 volts, 0.1 duty cycle, and 1/2 hour irradiation
time. These conditions resulted in a 45% decrease in enzyme
activity. Replicates of this run under identical conditions
except for the use of a different batch of enzymes gave
comparable results with decrease in enzyme activity of about
35 and 43%. These results are shown in Figure 8.
Design 12 was set up to study the effect of shorter
irradiation times, reduced voltage levels, and lower frequency
conditions with power rating substituted for the duty cycle.
The results of these experiments show inactivation of the
enzymes at 11.85 mc only. (See Figure 9.) Irradiation of
the enzymes at 7.0 mc did not seem to effect the enzyme
activity. Statistical analysis failed to indicate the main
facet and the interaction factors.
Design 43 was set up primarily to study the role of
voltage-power relationships. Inactivation of the enzyme was
obtained in all runs. The remaining activity observed in runs
1, 3, and 4 were 77, 65, and 78% respectively, of the initial
activity. (See Figure? 10.) The results of the other five runs ma'
not be considered significant since the observed inactivation
falls approximately within the assumed error of 10%. The Yates
al~crithm analyses for this design is given in Table 8.
40

E1430
0.200EXPERIMENTAL CONDITIONS:
1 '2 HR. IRRADIATION TIME 0---CONTROL13.5 MEGACYCLES16.5 0C U - R F50 VOLTS0.1 DUTY CYCLE
0.100 -
z 0
D
zS0.100
0.000
od
0.100
0.200 L
0.00 5 10 15 20 25MINUTES
1Fiu 8. ut I-> c 8. z1111wiut'l Hrp('titi ins
41

........ .... . ... . . . . -.
..
........... . . ........I A'
. . .. ........ . . . . .. .. .. ... . . .
Ilk
%04 10-
S. .... _. .. +_........... •......... ........................ ................
I :_ _ fl
2................... ...........
,o p. •- £,n
... ... ..
+ m+++++42

.............. . . . . . . . . . . . . . .
. .o.
z t'
-. .4.

Table 8
Experimental Results and Yates Algorithm Analysis
ExperimentNo. Frequency Voltage Power Result
1 11.9 60 0.5 77.0
2 13.5 60 0.5 95.9
3 11.9 100 0.5 64.8
4 13.5 100 0.5 77.7
5 11.9 60 1.0 84.8
6 13.5 60 1.0 90.6
7 11.9 100 1.0 88.4
8 13.5 100 1.0 86.9
EffectResult (1) (2) (3) Mean Square Estimated
77.0 172.9 315.4 666.1
95.9 142.5 350.7 36.1 162.9 A
64.8 175.4 31.8 -30.5 116.3 B
77.7 175.3 4.3 -13.3 22.1 AB
84.8 18.9 -30.4 35.3 155.8 C
90.6 12.9 -0.1 -27.5 94.5 AC
88.4 5.8 -6.0 30.3 114.8 BC
86.9 -1.5 -7.3 -1.3 0.2 ABC
44

The analysis gives an estimate of the error variance as 57.9 and
an estimate of standard deviation of 7.6. Based on the F Test,
a test comparing v3riances, a mean square value greater than
446 is necessary for factor significance. Since none of the
factors has a mean square value approaching 446, it can be
concluded that none of the factors studied appear to have any
effect on the system at the levels studied.
Design #4 was set up to study the effect of the voltage and
the duty cycle on the inactivation process. The frequency
temperature and the power were kept at a constant level. The
experimental results are given in Figure 11. The Yates
analyses of the factor significance is given in Table 9.
Analyses of the data by half-normal plots shows that the main
factors do not seem to affect the results, but however a
quadratic effect of the voltage is noted. (See Figure 12).
Results on the r-f irradiation of ground beef muscle
tissue were in general rather discouraging. First of all,
since the beef tissue contained much less proteolytic enzyme,
large samples were required for the irradiation experiments.
This necessitated the construction of a larger sample cell
which had completely different r-f characteristics as compared
to the smaller cells used in the purified proteo~ytic enzymes
experiments. With the use of the larger cells, a maximum of
only 5 watts and 50 volts could be obtained because of the
larger plate area and plate distance. Secondly, the
45

4k-4.% GI
I i A . Il
I - , . .do
~ - ____ _ __46

d3)
HbH
r ~0.0
43 0 C gCl)
0 : o V0 :1 C) od
I H C: ,q H6 0 bb
4. 4 0 ' (0 m H 4' A10 4' 8 00
Q) 0 C-- b- 4 %0 0 (N : H 4'-4C)~C. P0) 0 i X
0 ' 1' 13( 0 CC
0 0 (-I CN '. ON m t
o _Z 00 "o*r4cb- o e
"-4-
II) 43 \.'0 'NJ XA :) r-4 O r- H~ - :I C I
CQ Cl) *ý *; *ý * *4 0 ý r4 \ f
0 ~ -- an - I I ~ Il Il cof\ x
4H't -: I H r I Ar- - ~
Hr r4'r (ýN N, V*\ r, r 0 -
0- O. * - " A * o * o Ir- r4. r-4 r-I~c ,-I
(\j r- O . . . r- H I . N .
41) H-4.3
C.) C)C 0 NOC H 0\cN 0 ''q (:P (0 c', r-I r
x- .. A ON H H - - ~4 r-4 #NJ H r-4 1
ci) o -I I
0 - \D0aN r-4(N r- H r
Cl)~~ ~ PN-4'ON H~ Hn t-H t -N\ NO tr (Jf\ON..zt4 H r- -4J H H H, (O
I I47

E2364
/10
96 96
.< 0 (QUADRATIC VOLTAGE)
c~90 ____ Ole_
60 0
40
20
0 2468i 21 61EFFECT
Figure 12. Hafi mlPlots of Experimental Effects of Design 4

simulated r-f experiments indicates that a large error is
involved in the extraction and the assay process. This large
deviation of the activity of extracted enzyme from two samples
obtained from an aliquot made analysis of the irradiation
experiments extremely difficult.
4. DISCUSSION
The results of the study are ambiguous in a sense, since
they do not point clearly to optimum conditions for inactivating
proteolytic enzymes in beef. On the other hand, it is perfectly
clear that under certain conditions, there is unquestionable
inactivation of the enzymes.
The object of seeking conditions for inactivation of
proteolytic enzymes is to provide a means of preventing pro-
teolysis in beef that has been sterilized by ionizing radiation
for preservation purposes. It is therefore obviously necessary
that such enzyme inactivation be accomplished without cooking
the meat. This constraint opens the entire question of
thermal vs. non-thermal effects of radio-frequency energy on
biological macromolecules. Much work has been done on the
study of non-thermal effects of r-f on biological materials.
Based on this work, it has been contended that r-f at specific
frequencies is absorbed by specific moleculai species much
in the way that ultraviolet, visible, and infrared electro-
magnetic energy are absorbed by specific atoms, molecules, and
chemical groups or bonds. However, a simple theoretical
49

consideration of the magnitudes of energy that are involved leads
immediately to the hypothesis that r-f is not specifically
absorbed while the higher frequency regions of the spectrum
(e.g., ultraviolet to infrared) are absorbed.
The experimental results obtained in this program, and the
reported frequency specific inactivation of cholinesterase,
alpha-amylase, and chymotrypsin seem to be at variance with the
theoretical considerations cited above. In order to consider
this variance from theoretically predicted behavior, it is
necessary to disregard any arbitrary distinction between thermal
and non-thermal effects. Thus, if a single molecule couples
with the alternating electro-magnetic field and begins to
vibrate at a frequency influenced by the imposed field, one
cannot define the temperature rise since temperature is defined
statistically. On the other hand, if iO 2 3 molecules couple with
the alternating field, the temperature rise can be measured.
The questions of frequency specificity and the thermal or
non-thermal nature of the effects of r-f are not academic
problems but are directly related to the practical application
of enzyme inactivation in radiation-sterilized beef. Whatever
the mechanism of inactivation is, there is ample evidence that
the phenomenon is real. The possibility of a frequency specific
inactivation is especially important in this program. Since
beef consists of structural proteins as well as proteins with
enzyme activity, the inactivation of the proteolytic enzymes
50

under conditions which will also seriously denature the structural
proteins will lead to cooked beef (such general conditions may
also cook other components such as fats, water, etc.) It is
therefore worth returning to an examination of reports of
specific enzyme inactivations under specific conditions.
It has been demonstrated that field configuration of an r-f
irradiation system is a most important factor in any apparent
specificity. Thus, a change in cell geometry, distance between
electrodes, dielectric constant, temperature, etc. may result
in a shift of frequency at which inactivation is observed, or
in a loss of inactivation. It is thus reasonable to continue
the study from the point of view of defining the conditions
resulting in the inactivation of proteolytic enzymes in the
presence of other biological materials.
The direction that such a study might take may be based
on considerations of relaxation time, and polarity. Thus, it
is well established that water absorbs maximally in the micro-
wave region at 2450 mc. It is reasonable to expect that this
type of absorption may occur at other frequencies with
materials of different molecular weight and of different dipole
moment. A study of this kind might be most fruitful if it were
conducted on isolated enzyme systems in the presence if
selected materials such as other proteins, fats, carbohydrates,
and water. The results so obtained might then lend themselves
to extrapolation on to complex systems such as beef.
51

5. SUMMAFR AND CONCLUSIONS
A study was carried out to measure the effect of r-f
irradiation on the activity of proteolytic enzymes in beef.
The enzymes were studied both as isolated systems and in
ground beef. The assay procedure was based on a measurement of
the hydrolysis of urea denatured hemoglobin. The results of the
study indicated that under certain conditions enzyme inactivation
of 45% was obtained. These conditions are as follows: 13.5 mc,
16.5 0 C, 50 volts, 0.1 duty cycle, 1/2 hour radiation time.
Based on the results of the study a recommendation is made
that the study be continued from the point of view of
inactivating proteolytic enzymes in the presence of other
biological materials under controlled conditions.
52

6. REFERE!,-ES
1. A. K. Balls, Ice and Cold Storage, 41, 143 (1938).
2. E. L. Smith, J. B. Sumner, and K. Myrback, The Enzymes.Academic Press, New York, 1951.
3. R. M. Herriott, Methods in Enzymology. Academic Press,New York, 1955.
4. J. H. Northrop, M. Kunitz, and R. M. Herriott,Crystalline Enzymes. Columbia Univ. Press, New York, 1948.
5. M. Laskowski, Ibid.
6. J. E. Snoke, and Hans Neurath, J.B.C. 187, 127 (1950).
7. M. L. Anson, J. Gen. Physiol. 23, 695 (1940).
8. H. U. Bergmeyer, Methods of Enzymatic Analyses~. AcademicPress, New York, 1963.
9. 0. Folin and Ciocalteu, J.B.C. 73, 627 (1929).
10. M. L. Anson, J. Ger'. Phyý,iol. 22, 79 (1939).
11. Davies, O.L. Desion and tnalysis of IndustrialExperiments Table M, 2nd ed., Haf .nei Publishingi Co. (1960).
12. Addelman, C. and 0. Kempthorne, ASTIA Document#AN 2721, 250.
53

Urnclassi f iedSecurity Classification
DOCUMENT CONTROL DATA - R&D(Security classification of title., body of abstract and indexing annotatton must be entered when the overall report is classified)
I ORIGINATING ACT'IVI'rY (Corporete author) 2a Rr'POAT SECURITY CLASSIFICATION
Melpar, Inc. Unclassified
Falls Church, Virginia 2b GROUP
3 nEPORT TITLE
EFFECTS OF RADIO-FPRECUENCY IRRADIATION ON THE ENZYI-ES OF BEEF MUSCLE TISSUE
4 DESCRIPTIVE NOYES (Typo of report and inclusive dates)
FINAL: 13 April 1964 - 13 April 1965S AUTHOR(S) (Last name. frst name. initial)
S. relson
6 REPORT DATE 7a TOTAL NO OF PAGES 7b NO OF REFS
December 1565 66 12Sa CONTRACT OR GRANT NO 9a. ORIGINATOR'S REPORT NUMBER(S)
DA-19-129-AMC-262 (N)b PROJEC1 NO. FD- 33
IK025601A033C 9b OTHER REPORT NO(S) (Any other numbers that may be eassitgned
this report)
d
10 AVAILABILITY LIMITATION NOTICES
Distribution of this document is unli,-aited.Release to CFSTI is authorized.
II SUPPLEMENTARY NOTES 12 SPONSORING MILITARY ACTIVITYFood Chemistry
Branch, Food Division, U. S. Army NatickLaboratories, Natick, Massachusetts 01762
13 ABSTRACT
The report covers the work conducted during the period 13 April 1964'to13 April 1965. The objective of this program is to study the conditionsnecessary to inacLivate the natural proteolytic enzymes of beef muscle tissueby radio-frequency energy.
Preliminary experiments using purified proteolytic enzymes isolated frombeef liver tissue were conducted to determine the effects of various r-f parameterFrom 4 design studies, it could not be conclusively determined as to what thelevels of the main factors and the interaction factors necessary for maximuminactivation are. It has been s.hown however that a Fet condition about 40%inactivation of the proteolytic enzymes cati be effected.
R-f radiation experiments on ground beef tissue gave inconclusive results.Chief problem area lies in the fact that the extraction and purification processdoes not yield consistent results.
FORM
DD IJAN84 1473 UnclassifiedSecurity Classification

Unc la.ai fledSecurity Clhssfic.iion
14. LINK A LINK 8 LINK CKEY WORDS .. . .
POLE * ROLE W' ROLE WT
Enzyme inactivation 8Beef 9,4 9 5L~ver 9 9 5Muscle tissues 9 9Radiofrequency 10Radiation 10EnelrgZy 10Storage stability 4Measurement 8Proteolysis 9Extraction 8Isolation aPurification 8Enzymes 9Proteolytic I
INSTIMJ CT IONS
1. ORIGINATING ACTIVITY: Enter the name and address 10. AVAILABILITY/LIMITATION NOTICES: Enter any lim-of the contractor, subcontractor, grantee, Department of Dc- itations on further dissemination of the report, other than thosefense activity or other organization (corporate author) issuing imposed by security classification, using standard statementsthe report. such as:
2a. REPORT SECURITY CLASSIFICATION: Enter the over- (1) "Qualified requesters may obtain copies; of thisall security classification of the report. Indicate whether"Restricted Data" is included. Marking is to be in accord- report from DDC."ance with appropriate security regulations. (2) "Foreign announcement and dissemiration of this
2b. GROUP: Automatic downtgrading is specified in DoD Di- report by DDC is not authorized."
rective 5200. 10 and Armed F..;i,- V.t,i . .:aruai. L:n::tcx (3) S. G .'Lra..en agencic:; -,ay obtain copies ofthe group number. Also, when applicable, show that optional this report directly from DDC. Other qualified DDCmarkings have been used for Group 3 and Group 4 as au:hor- users shall rcquest throughized.
3. REPORT TITLE: Enter the complete report title in all (4) "U. S. military agencies may obtain copies of thiscapital letters. Titles in all cases shculd be unclassified. report directly fronm DDC. Other qualified usersU a meaningful title cannot be selected without classifica- shall request throughtiun, show title classification in all capitals in parenthesisimmediately following the title. ."
4. DESCRIPTIVE NOTES: If appropriate, enter the type of (5) "All distribution of this report is controlled. Qual-report, e.g., interim, progress, summary, aunual, or final. ified DDC users shall request throughGive the inclusive dates when a specific reporting period iscovered.
5. AUTHOR(S): Enter the name(s) of author(s) as shown on If the report has been furnished to the Office of Technical5. ATHO(S):Entr te nae~s of uthr~s as how on Services, Department of Commerce, bor sale to the public, indi.or in the report. Enter last name, first name, middle initial. cate this fact and entr the price, if known.
If military, show rank and branch of service. The name of
the principal author is an absolute minimum requirement. 11. SUPPLEMENTARY NOTES: Use for additional explana-
6. REPORT DATE- Enter the date of the report as day, tury ntes.
month, year; or month, year. If more than one date appears 12. SPONSORING MILITARY ACTIVITY: Enter tbe name ofon the report, use date of publication, the departmental project office or laboratory sponsoring (pay-
7a. TOTAL NUMBER OF PAGES: The total page count ing for) the research and development. Include address.
should follow normal pagination procedures, i.e., enter the 13. A13SIRAC*I: Enter an abstract giving a brief and factualnumber of pages containing information. summary of the document indicative of the report, even though
it may also app:-ar elsewhere in the body of the technical -e-7b. NUMPER OF REFERENCES, Enter the total number of port. If additional space isi required, a cot tinuation sheetreferences cited in the report, shall be attached.
8a. CONTRACT OR GRANT NUMBER: - If appropriate, enter It is highly desirabLe that the abstract of classified re-the applicable number of the contract or grant under which ports he unclassified. Each paraptraph of the abstract shallthe report was written. end with an indication of the military security classification
8b, 8ý, & 8d. PROJECT NUMBER: Enter the appropriate of the information in the paragraph, represented as (TS), (S).
military department identification, such as project number, (C), or (U).
subproject number, system numbers, task numbc,, etc. There, is no limitation on the length of the abstract. How-
9a. ORIGINATOR'S REPORT NUMBER(S): Enter the offi- ever, the suggested lenWth is from 150 to 225 words.
cial report number by which the document will be identified 14. KEY %ORDS: Key . ords are technically meaningful termsand controlled by the originating activity. This number must or short phrases that characterize a report and may be used asbe unique to this report. index entries for cataloging the report. Key words must be
9b. OTHER REPORT NUMBER(S): If the report has been %electerH so that no security classification is required. Iden-
assigned any other report numbers (either by the ortainator Fier,, such as equipment model des.gnation, trade rn,.me, iili-
or by the sponsor), also enter this number(s). tary project code name, geographic location, may be used askey words but will be foilowt-d ir , an indication of techt icalcontext. The assignment of hnks, rules, and weikhtt is,)pttonal.
Unclassified