of - UPCommonsupcommons.upc.edu/bitstream/handle/2099.1/20735/Galvez.pdfBusiness Process...
129
Master in Computing Master of Science Thesis Business Process Reengineering based on Measures Jordi Gálvez Escañuela Advisor: Xavier Franch Gutiérrez Co‐Advisor: Josepa Ribes Puig 09/09/2013
Transcript of of - UPCommonsupcommons.upc.edu/bitstream/handle/2099.1/20735/Galvez.pdfBusiness Process...

Master in Computing
Master of Science Thesis
Business Process Reengineering
based on Measures
Jordi Gálvez Escañuela
Advisor: Xavier Franch Gutiérrez Co‐Advisor: Josepa Ribes Puig
09/09/2013

2

3
TABLE OF CONTENTS
List of Figures ................................................................................................................................ 5
List of Tables .................................................................................................................................. 8
Abstract ......................................................................................................................................... 9
Master Thesis background and objectives .................................................................................. 11
PART I : SYSTEMATIC REVIEW ..................................................................................................... 13
1 Introduction .......................................................................................................................... 13
2 Planning the review .............................................................................................................. 15
2.1 The need for a review ................................................................................................... 15
2.2 Development of a review protocol ............................................................................... 16
3 Conducting the review ......................................................................................................... 20
3.1 Conducting the search................................................................................................... 20
3.2 Selection of primary studies .......................................................................................... 20
3.3 Data extraction and data synthesis ............................................................................... 21
4 Systematic review results analysis ....................................................................................... 22
4.1 Non domain based metrics ........................................................................................... 22
4.2 Domain specific metrics ................................................................................................ 34
4.3 Methodologies and GQM .............................................................................................. 40
4.4 Simulation ..................................................................................................................... 58
5 Conclusions ........................................................................................................................... 63
5.1 Answers to the research questions ............................................................................... 66
PART II : METHODOLOGICAL REENGINEERING OF A CASE STUDY .............................................. 68
6. The Cancer Registry case study ........................................................................................... 68
7. Selection of Methodology ................................................................................................... 71
7.1 Population of works ...................................................................................................... 71
7.2 Evaluation procedure .................................................................................................... 71
7.3 Evaluation results .......................................................................................................... 72

4
8. Application of the PRiM method for reengineering the process ........................................ 74
8.1 Description of current process ...................................................................................... 74
8.2 I* Modelling ................................................................................................................... 83
8.3 Reengineering the process ............................................................................................ 95
8.4 Generation of alternatives ............................................................................................ 95
8.5 Evaluating alternatives ................................................................................................ 104
9. Study of Viability of Simulation for evaluating i* models ................................................. 114
9.1 The simulation process ................................................................................................ 114
9.2 Validation of I* models with simulation ..................................................................... 117
9.3 Comparison with structural metrics ............................................................................ 120
10. Conclusions and future work .......................................................................................... 121
Glossary ..................................................................................................................................... 123
Abreviatures .............................................................................................................................. 125
References ................................................................................................................................. 126

5
LIST OF FIGURES
Figure 1: Yaung linkage matrix .................................................................................................... 23
Figure 2: Balasubramanian Structural metrics ............................................................................ 27
Figure 3: Oczelik performance measures .................................................................................... 29
Figure 4: Cheng customer queue ................................................................................................ 30
Figure 5: Mohanty BPR model..................................................................................................... 36
Figure 6: Mohanty cost value matrix .......................................................................................... 36
Figure 7: Khan reception summary chart .................................................................................... 38
Figure 8: Khan customer services summary chart ...................................................................... 38
Figure 9: Niessink success factors ............................................................................................... 41
Figure 10: Niessink measurement process levels ....................................................................... 41
Figure 11: Kueng process modeling cycle ................................................................................... 43
Figure 12: Kueng goals ................................................................................................................ 44
Figure 13: Kueng goals ................................................................................................................ 44
Figure 14: Nissen design process ................................................................................................ 45
Figure 15: Goel BPR ..................................................................................................................... 47
Figure 16: Goel business process integration issues ................................................................... 48
Figure 17: Grau PRiM methodology phases ................................................................................ 49
Figure 18: Franch metrics ............................................................................................................ 51
Figure 19: Franch patterns catalog ............................................................................................. 51
Figure 20: Aversano goals characteristics ................................................................................... 53
Figure 21: Aversano metrics example ......................................................................................... 54
Figure 22: Ramos results summary ............................................................................................. 56
Figure 23: Oinas goal purpose ..................................................................................................... 57
Figure 24: Oinas goal indicators .................................................................................................. 57
Figure 25: Greasely arrest cost .................................................................................................... 61
Figure 26: Greasely cost increment ............................................................................................ 61

6
Figure 27: i* models elements .................................................................................................... 84
Figure 28: DIS 1 ........................................................................................................................... 85
Figure 29: DIS 2 ........................................................................................................................... 85
Figure 30: DIS 3 ........................................................................................................................... 86
Figure 31: DIS 4 ........................................................................................................................... 87
Figure 32: DIS 5 ........................................................................................................................... 87
Figure 33: DIS 6 ........................................................................................................................... 88
Figure 34: DIS 7 ........................................................................................................................... 88
Figure 35: DIS 8 ........................................................................................................................... 89
Figure 36: DIS 9 ........................................................................................................................... 90
Figure 37: DIS 10 ......................................................................................................................... 90
Figure 38: DIS 11 ......................................................................................................................... 91
Figure 39: DIS 12 ......................................................................................................................... 92
Figure 40: intentional DIS 1 ......................................................................................................... 93
Figure 41: intentional DIS 2 ......................................................................................................... 93
Figure 42: intentional DIS 3 ......................................................................................................... 94
Figure 43: intentional DIS 4 ......................................................................................................... 94
Figure 44: alternative DIS 1 ......................................................................................................... 97
Figure 45: alternative DIS 2 ......................................................................................................... 98
Figure 46: alternative DIS 3 ......................................................................................................... 99
Figure 47: alternative DIS 4 ......................................................................................................... 99
Figure 48: alternative DIS 5 ....................................................................................................... 100
Figure 49: alternative DIS 6 ....................................................................................................... 100
Figure 50: alternative DIS 7 ....................................................................................................... 101
Figure 51: alternative DIS 8 ....................................................................................................... 102
Figure 52: alternative DIS 9 ....................................................................................................... 102
Figure 53: alternative DIS 10 ..................................................................................................... 103

7
Figure 54: alternative DIS 11 ..................................................................................................... 104
Figure 55: Beta distribution example ........................................................................................ 116
Figure 56: simulation designs compared .................................................................................. 118

8
LIST OF TABLES
Table 1: Data extraction template .............................................................................................. 19
Table 2: Searches results ............................................................................................................. 20
Table 3: Specific metrics summary .............................................................................................. 63
Table 4: specific domain metrics summary ................................................................................. 64
Table 5: methodologies summary ............................................................................................... 65
Table 6: simulation summary ...................................................................................................... 66
Table 7: methodologies scores summary ................................................................................... 73
Table 8: actors main goals ........................................................................................................... 83
Table 9: CR goals analysis .......................................................................................................... 105
Table 10: Goal 1 questions ........................................................................................................ 105
Table 11: Goal 2 questions ........................................................................................................ 106
Table 12: Goal 3 questions ........................................................................................................ 106
Table 13: CR metrics type .......................................................................................................... 110
Table 14: structural metrics model comparison ....................................................................... 112

9
ABSTRACT
Business Process Reengineering (BPR) allows organizations to change their processes in order
to improve their activities according to their own objectives. Measurement is needed to
evaluate the reengineering process.
The Cancer Registry of the Catalan Institute of Oncology (ICO) needs a redesign of some
processes. So a systematic review is carried to define the state of the art on the use of metrics
in BPR. As a result of the review, the PRiM methodology is selected as the most appropriate for
measuring the redesign of the Cancer Registry, which then is modeled using the i* paradigm.
Both the “as‐is” model and the “to‐be” model are presented, and metrics are defined to see if
the redesign adapts to the expected goals.

10

11
MASTER THESIS BACKGROUND AND OBJECTIVES
Business Process Reengineering (BPR) is the activity of changing the business process of an
organization. BPR is aimed to help organizations fundamentally rethink how they do their work
in order to dramatically improve customer service, cut operational costs, and become world‐
class competitors [1].
BPR is basically rethinking and radically redesigning an organization's existing resources and
processes. BPR is an approach for redesigning the way work is done to better support the
organization's goals and reduce costs. Reengineering starts with a high‐level assessment of the
organization's mission, strategic goals, and customer needs. Basic questions are asked, such as:
Does our mission need to be redefined?
Are our strategic goals aligned with our mission?
Who are our customers?
An organization may find that it is operating on questionable assumptions, particularly in
terms of the wants and needs of its customers. Only after the organization rethinks what it
should be doing, does it go on to decide how best to do it [1].
In order to properly conduct this activity, it is needed to detect which are the weaknesses of
the current processes and how they can be corrected. Some proposals exist that answer to
these questions through the identification of a suite of business‐oriented measures that allow
accurate assessment of process accuracy and eventually provide the basis to compare new
candidate processes with the current ones.
The first objective of this Master Thesis is to perform a systematic review of the state of the art
of how business processes are measured and evaluated, and identify which metrics are used,
in which way, and which methods are used to implement these metrics into the activity of
redesigning the process of an organization. Reviewed articles are grouped into similar themes
in order to provide a better presentation of the obtained knowledge.
The second objective is to use the knowledge provided by the systematic review on a case
study. The framework of this case study is the Cancer Registry of the Catalan Institute of
Oncology (ICO) [2], where my current work is being developed. In this case study, the
organization needs to redesign some of its processes in order to better achieve its goals, and
to provide better results in a more efficient way. Based on the results of the systematic review,
the application of the PRiM methodology [3] is decided, as it is the most suitable solution for
the studied problem.
As a result of the work presented, it arise the question of the use of simulation into a
methodology such as PRiM. So in the final chapter of this Master Thesis a brief exploration is
performed on how simulation can be used to obtain an estimation of the values of the metrics
defined in the case study. The whole simulation process was not performed, as it would be a
time consuming task and is out of the scope of this Master Thesis.

12
This document is structured as follows: chapter 1 presents the systematic review. Chapter 2
explains how the review was planned, while chapter 3 explain how it was performed. Chapter
4 presents the results obtained in each reviewed article, and chapter 5 presents the
conclusions of the review. Chapter 6 presents the Cancer Registry case study. In chapter 7,
methodologies from the systematic review are evaluated, and PRiM is selected as the most
appropriate one for the case study. In chapter 8, the PRiM method is applied to the Cancer
Registry, where both the “as‐is” and the “to‐be” processes are modeled, and structural metrics
are defined for model evaluation. On chapter 9, the use of simulation on obtaining estimated
values for the metrics is discussed. Finally, on Chapter 10 conclusions are presented.

13
PART I : SYSTEMATIC REVIEW
1 INTRODUCTION
The first task in this Master Thesis was to study the state of the art of measurement in
Business Process Reengineering. This knowledge allows to identify the main strengths of
measuring processes in an organization, so it can lead to a redesign of those processes that
assures the compliment of the organization’s objectives in a more efficient way. Also, by
identifying weak points in the current established measures can suggest that further
investigation and research activities can be done in some specific areas.
In order to do this study, a systematic review was performed, through searching for literature
with various public accessible searching database engines like IEEExplore, ACM or Science
Direct. A systematic review allows gathering available knowledge and experience in a topic
area, so it can be reused. This is done in a way that assures that the review is fair, so every
result is counted, even those that don’t support the main hypothesis of the researcher. For this
review, a methodology must be determined, so research works can be selected in an accurate
and objective way, and obtained results are valid, reliable and have scientific value.
The methodology used for the systematic review is based on guidelines proposed by
Kitchenham [4]. Although it is based on guidelines for medical researchers, it has been adapted
for being useful for software engineering researchers, as it is not as heavily based on empirical
results as in medical research.
A systematic review has a number of key features that makes it different from a conventional
literature review, which are:
A protocol is defined for the review that specifies some important points that have to
be addressed, the most important being the research questions and the methodology
used for the review.
A search strategy defines on which engines the literature will be searched, and also
which options are used, like searching on journals or conferences or on which fields
the keywords have to appear.
Each search is documented, so anyone can replicate it and obtain the same results.
This documentation also assures that searches are complete and well done.
Each primary study is included or excluded based on explicit criteria.
All the information that has to be obtained from each primary study is specified on the
review. Also, each study is evaluated using specified quality criteria.
The definition of a review protocol is a key feature of a systematic review, because it specifies
the methodology used for conducting the review, allowing to reduce the possible researcher
bias (that is, to avoid that some studies may be selected due to researcher expectations). The

14
review process consists of different activities, which can be sequential but also include
iteration, that can be divided into three groups:
1. Planning the review: Identification of the need for a review and development of the
review protocol.
2. Conducting the review: includes the identification of the research, selection of primary
studies, a quality assessment study, data extraction and monitoring, and finally, data
synthesis.
3. Reporting the review, which is a single task.
All the activities of the review process are discussed on the following sections.

15
2 PLANNING THE REVIEW
2.1 THE NEED FOR A REVIEW
The main motivation for conducting a systematic review is the need for the researcher to have
summarized all the information that is available on the research topic. Also, this information
has to be gathered in a thorough and unbiased manner, so conclusions and future research
can be stated.
So before planning the review, the researcher must see if there is a need of doing it, by
identifying and reviewing any already existing systematic review on the topic. Although
Kitchenham [4] doesn’t specify a procedure for searching existing systematic reviews, we
followed the method proposed in Palomares’ Master Thesis [5], where systematic reviews and
states of the art were searched on electronic databases using a specific search string. The
databases used for this search were:
IEEExplore [6]
ACM [7]
Springer [8]
Science Direct [9]
We were searching for reviews covering the use of metrics (or measures) in the reengineering
of business process (or models). So the search string must include the following keywords:
Metric or metrics or measure or measures. So: (metric* or measure*)
Business process, processes, model or models. So: business and (process* or model*)
Any form of reengineering. So: reengine*
Review or state of the art
We consider that the search of these keywords must be done on the title of the papers, so
noise can be reduced on the results. The appearance of “review” and “state of the art” in the
title should give them relevance because the nature of these works.
Finally, the search string is used as follows:
Business and reengine* and (metric* or measure*) and (process* or model*) and
(review or “state of the art”) in (Title)
This search didn’t produce any result on any of the four queries done on the specified
databases. We assumed that no systematic review or state of the art on metrics on business
process reengineering has been published at the time of the search, therefore the need for
this systematic review is stated.

16
2.2 DEVELOPMENT OF A REVIEW PROTOCOL
A review protocol specifies the methods that will be used to undertake a specific systematic
review. By doing this, the possible researcher bias is reduced, for example as the selection of
individual studies is not driven by researcher expectations.
The review protocol includes a series of elements, all the points of the review and also
additional information about planning it. These are:
A rationale for the survey and the questions that the research is intended to answer.
The strategy that should be used for primary studies. That includes identifying search
terms and resources (databases, journals and conferences).
A definition of which criteria will be used for study selection, that is, which studies
should be selected or excluded for the review. Also it is decided how many assessors
will evaluate each study, and how differences between assessors will be treated.
A data extraction strategy, that defines how to obtain the information required from
each study, and validation if required.
Synthesis strategy for the data extracted from studies.
Project timetable that defines the review plan.
2.2.1 THE RESEARCH QUESTIONS
The intention of the systematic review is to answer the questions that have been developed
that identify and/or scope future research activities. The objective of this work is to study
metrics of business processes, and its application on reengineering these processes.
So, the research questions on this systematic review are:
Which metrics are used to asses that required goals are accomplished on the process
model?
How metrics can help to identify errors on a process model?
How can this metrics give directions to a possible redesign of a model?
How this metrics are used to compare a given model to an alternative redesigned one?
2.2.2 THE SEARCH STRATEGY
The searching for works was done using popular databases available on internet. These
databases cover a broad number of sources, such as journals and conferences.

17
Some different options were considered, but we decided to discard Google Scholar because it
covers a wide range of different topics, so a lot of noise (non‐related works) was obtained in
the results of the search.
Finally, the selected databases to perform the systematic review were:
IEEE Xplore [6]: is a database produced by IEEE which includes the full publications of
IEEE (Institute of Electric and Electronic Engineers) and IET (Institution of Engineering
and Technology). It contains journals and proceedings from both institutions since
1988.
ACM [7]: It has complete access to the publications of ACM (Association for Computing
Machinery), for both journals and proceedings.
Springer [8]: is a database of journals and books published by Springer‐Verlag and
other editors, such as Kluwer. It includes 500 multidisciplinary journals, and also 1800
monographs of the collection Lecture Notes in Computer Science (LNCS), all of them
specialized in computer science.
Science Direct [9]: it has a complete access to the publications of Elsevier editorial,
which includes journals and proceedings, with the advantage of open contents,
accessible without need of subscription.
As in the search for systematic review and states of the art, we decided searching for works
that use metrics for evaluating some kind of business process reengineering. Synonyms have
been considered, because metrics can also be referred as measures, and processes can be
referred as models or modeling, although the term “Business Process Reengineering” is often
used as some kind of standard term in the literature.
The search has been done in title, abstract and/or keywords, because these are the places
where those terms are more likely to have relevance. We excluded searching in full text to
avoid a huge amount of noise in the results.
Then, the search strings was as follows:
Business and reengine* and (metric* or measure*) and (process* or model*) in (Title,
Abstract or Keywords)
This is the strategy used for searching primary studies and the extraction of data:
1. A query is performed in the selected databases using the search string, and then
obtained results are exported to the Mendeley Desktop reference manager [10].
2. The reference manager is used to delete duplicate and non‐relevant works.
3. A first selection of papers is done by reading the title. There are papers that are clearly
not related to the topic that appear in the results by coincidence, so these are not
considered.
4. In doubtful cases, a second selection is refined by reading the abstract.
5. Relevant papers related to the scope of the systematic review are selected by an
overview of the full text.
18
6. Only the papers selected on the previous step are read in depth. During this read of
the full text, a first set of data is extracted from the papers which are oriented to
answer the research questions. This data is used to fill a template that is used to state
the main characteristics of each paper, that later is used as a guide so further
classification and data extraction is made more easily.
7. A first assessment of the selected papers is made based on a personal view of their
relevance.
8. Additional works are added to the selection, based on references found on papers
reviewed on previous steps.
2.2.3 STUDY SELECTION CRITERIA
A specific selection criteria is used on steps 3 to 6, to identify primary studies directly related
to answer to the specified research questions. This criteria is specified before the selection
actually begins, so bias related to researcher expectations is reduced. These are the criteria
established:
The selection of papers based on their title made in step 3 is a first filter to separate
papers that are not directly related to business process reengineering. That are papers
related to a completely different topic, that appear in the query results by coincidence.
The second selection by abstract made in step 4, covers papers that are related to
business process reengineering, but metrics are not a part of the study.
The overview of the full text in step 5, and the in depth read in step 6, remove papers
where metrics, although being mentioned or present in the study, don’t take a
significant part of it, or offer poor results.
2.2.4 DATA EXTRACTION TEMPLATE
A template is made that specifies the required information that has to be retrieved from each
selected paper. This is aimed to gather all relevant data that appears in the studies, so they can
later be easily classified. The template is specified in Table 1.

19
Table 1: Data extraction template
Topic Description
Domain General purpose or specific domain proposal
Current process Is the current process evaluated and/or search of errors and flaws is done?
Goal oriented The reengineering is done explicitly considering goals of the organization?
Alternatives design Are they generated in a specific proposed way?
Design directions Directions on how the redesign must be done to address an specific issue (flaw correction or specific improvement)
Alternatives comparison
Generated alternative designs are compared between them and with the current process?
Type of metrics Quantitative or qualitative
Case study Is the proposal applied to a case study and was it successful?
Implemented toolkit Is the proposal implemented in a software that can be used as a tool in other cases?
2.2.5 PROJECT TIMETABLE
There is no timetable for this work apart from deadlines imposed by the Master Thesis itself,
so this part of the protocol is skipped.

20
3 CONDUCTING THE REVIEW
The following section explains how the review was conducted: the search for works in the
different databases, the selection of primary studies and the data extraction.
3.1 CONDUCTING THE SEARCH
This section covers the first two steps of the review protocol: using the search string in the
databases search engines several results were obtained, that were gathered using Mendeley
Desktop reference manager [10], where duplicates and non‐relevant works were deleted.
All four databases search engines had different ways of performing the queries, in the way
“ands”, “ors” and wildcards were introduced. Specifically, ACM and Springer ways of
implementing queries didn’t allow performing the search in a single query, so two queries had
to be performed separately and then results combined.
Found references were imported to Mendeley Desktop reference manager. Duplicates and an
article not written in English were deleted. The results of the searches were as follows:
Table 2: Searches results
Engine Number of relevant references
Duplicates Deleted by language
ACM 215 0 0
IEEE Xplore 96 2 0
Science Direct 26 1 0
Springer 12 1 1
Total 349 4 1
3.2 SELECTION OF PRIMARY STUDIES
This stage covers the identification of which studies would be included in the review, based on
the selection criteria specified before. At the beginning of this stage we had 349 references.
First, 208 articles were discarded by its title, so 141 were left to read the abstract. By revising
the abstract, another 85 articles were rejected, so the full text review was done in a total of 56
articles. Of these, we were not able to find the full text of 11 references, so the full text was
read for 45 of them. After reading these, 16 were rejected because the use of metrics was not
relevant, or they did not have relation with the questions intended to be answer in this review.

21
Step 8 was done in parallel, and 2 additional articles were added, so a total of 31 articles finally
were included in the systematic review, and the results are presented below.
3.3 DATA EXTRACTION AND DATA SYNTHESIS
During the review of the full text of the articles, the pattern proposed on table 1 was filled for
every article. The analysis of the works and the data extracted for each one is presented in the
following section.

22
4 SYSTEMATIC REVIEW RESULTS ANALYSIS
Given the established criteria and protocols defined in the previous sections, the selected
articles represent different approaches to the use of metrics in Business Process
Reengineering. We found that according to the intention of the measurement, four main
groups of proposals can be identified.
The first and second group include proposals of defined specific metrics, that are directly
applicable to solve a certain problem. The first group is comprised of metrics that can be
applied into several domains, and the second of metrics that are oriented to be applied just in
a specific domain.
The third group do not propose specific metrics, but a methodology to define and implement
different customized metrics that can vary according to the problem, situation or domain that
are required to be applied. This can include another subgroup which includes works that use a
specific methodology called GQM (Goal Question Metric), which seems to be specially
appropriated to solve problems driven by the organization’s needs (goals).
The fourth group includes works that use simulation techniques to evaluate the behavior of a
system or the design alternatives that are proposed for a system.
4.1 NON DOMAIN BASED METRICS
Non domain metrics are defined metrics that are usually used to measure characteristics of
processes that appear commonly in different kinds of organizations. They are not dependent
of an specific domain, so they can be used as general purpose metrics.
Yaung et al [11]
Domain General purpose
Current process Evaluate tasks
Goal oriented No (down‐top approach)
Alternatives design No
Design directions Identify tasks that need redesign
Alternatives comparison
‐‐
Type of metrics Quantitative
Case study ‐‐
Implemented toolkit ‐‐

23
Yaung [11] proposes a set of metrics based on the linkages between many tasks that are
currently developed in an organization. These metrics help to assess linkage validity,
connectivity and reachability, in the phases of task analysis and processes redesign, so they
are metrics used to evaluate the current tasks of the process that the organization want to
redesign. It is a proposal that can be applied to any kind of organization, but it only focus on
the relations between tasks.
Two approaches to a process reengineering are identified:
The top‐down approach, where processes are derived from the goals stated by the
leaders of the organization.
The down‐top approach, where identified current tasks are improved. This approach is
better suited for organizations that have many already implemented tasks that must
be redesigned to achieve better performance.
The metrics presented by Yaung are designed to aid at the two phases of the down‐top
approach, that are task analysis and process design.
Task analysis includes evaluating the current implemented tasks, decide which ones require a
redesign and which ones are non‐productive tasks that can be eliminated. The first step is to
identify all tasks assigned to members of the organization. Then these tasks are included in the
linkage analysis, that gathers information about the dependencies (linkages) between the
identified tasks. This information is stored in a linkage matrix (Figure 1), where each tasks is
represented in a row and a column, and an additional row/column is added for representing
the environment of the organization. Finally, the dependencies between tasks (or between a
task and the environment) are the values in the matrix, which can represent no link between
tasks and validated and non‐validated links.
Figure 1: Yaung linkage matrix
Then several metrics are defined to evaluate the task analysis. The task validity metric defines
the ratio of validated links to reported links, measuring the fraction of the linkage validation
that remains to be done to achieve a valid linkage model. The overall validity metric measures
the same as the task validity metric for the whole model, instead of a single task. A variation of

24
these metrics is the weighted validity metrics, which add a weight to the links, so the most
important can have greater importance in the analysis.
The connectivity analysis aims to identify which tasks will require most attention during the
reengineering process. Supplier connectivity (number of immediate supplier tasks), customer
connectivity (number of immediate customer tasks) and total connectivity metrics (sum of
both) are defined. A task with a total connectivity of 0 is supposed to be isolated from the
organization and the environment, so is a candidate to be eliminated. On the other hand, if
the sum is high, the task might be a bottleneck and is a candidate to be redesigned.
Additionally, average connectivity is calculated for all the organization, so tasks with customer
connectivity significantly larger than average connectivity also might be bottlenecks.
The reachability metrics aim to do the same as in connectivity analysis, but not limited to
adjacent task, instead it analyzes connections between tasks separated by a number of
intermediate steps.
The second part of the bottom‐up approach is the process design, consisting of grouping the
task into linked sequences that will become the processes of the organization. Some metrics
can be defined to evaluate this grouping: the cohesion metric is the ratio of number of links in
a process to the number of possible links. The coupling metric is the ratio of the task of a
process to the tasks of another process. A high cohesion value is desirable because tasks are
tightly related to the process. Yaung proposes that processes with low cohesion can be
splitted, and processes with high coupling can be combined.
So, the bottom line of the approach is that metrics based on task linkages can help to identify
which tasks are candidates to be redesigned and why, and which ones can be eliminated. The
weak point is its limited scope, where relations between tasks is the only aspect of the
organization that is taken into account.
Altinkemer et al [12]
Domain General purpose
Current process Not evaluated
Goal oriented Only sales goal
Alternatives design Only when implemented
Design directions No
Alternatives comparison
No
Type of metrics Quantitative
Case study ‐‐
Implemented toolkit ‐‐
The proposal of Altinkemer [12] presents some metrics to evaluate the effect of a redesign to
the productivity of the organization, so it only focus on some specific parts of an organization
model that is oriented to sales. It is based on a previous analysis of some implementations of

25
Business Process Reengineering (BPR) on actual organizations, on which the primary reasons
for companies to make a process change are cost cutting and customer satisfaction.
The main assumption that the authors make is that a change in a process of an organization
through BPR will result in productivity gains measured by sales per employee. So the measures
proposed are used to evaluate the impact of the redesign on the financial performance of the
organization. The selected measures are total assets, return on sales, revenue growth, sales by
employee and sales to assets. The weak point of this approach is that it only evaluates changes
once they are implemented, so it is unable to predict if the impact of the redesign will be
positive or not before the actual change. It is also unable to compare different alternatives and
then choose the most appropriate for the goals of the organization.
Arteta et al [13]
Domain General purpose
Current process Evaluate complexity
Goal oriented No
Alternatives design No
Design directions Identify easy of change
Alternatives comparison
Compare alternatives and current design
Type of metrics Quantitative
Case study ‐‐
Implemented toolkit Petri Net model of the system
In the work of Arteta [13] agility is defined as the capacity of an organization to adapt to
changes, and complexity is used as a surrogate for measuring it, based on the hypothesis that
less complex systems are able to react to changes in a quicker and easier way. To measure the
complexity of the processes of the organization, a model that uses Petri Nets is presented. The
ability to adapt to change can make the implementation of BPR projects more efficient.
Complexity is addressed to deal with the problem of measuring the capacity of react to future
change that is undefined, so without having to predict what that change will be. To link
complexity with agility, it is needed to measure the complexity of a business process and the
“easy of change”, that is, going from one state of the system to another. Then the
reengineered process can be compared to the current one, and to see if the complexity has
decreased.
A business process is defined as a series of activities, linked together by information of
material flows, where each activity is completed by an actor. A Petri Net (P, T, I, O) is used to
model the system, where P are the places, T the transitions, I the input arcs and O the output
arcs. As the Petri Net represents the resources in the process and their connections, it can be
used to measure the complexity of the process by deriving the state probabilities for the
system.

26
Agility can be an indication of how worth is a new design. By comparing the “as‐is” system with
the redesigned one, agility shows how costly can be the change to the new system, even if
there are some alternatives, which is the most appropriate. The flaw of this measure is that it
doesn’t take into account the current system, that is, it doesn’t shows its weak points, nor
which parts must be redesigned or how.
Balasubramanian et al [14]
Domain General purpose
Current process Evaluated and errors detected
Goal oriented Performance goals
Alternatives design ‐‐
Design directions ‐‐
Alternatives comp. Compared between them and with current
Type of metrics Quantitative
Case study ‐‐
Implemented toolkit Set of metrics
The proposal of Balasubramanian [14] includes a set of metrics (Figure 2) that can be used to
evaluate the performance of various redesigns, which can be compared, before implementing
them. This metrics are defined according to goals oriented to performance, so they can be
used in a variety of systems.
Here the organization goals are divided in two groups: functional goals, which are the purpose
of the organization, and performance goals, which measure how well the functional goals are
achieved. These performance goals are usually evaluated using some process metrics: cycle
time, costs, throughput and reliability, which are dependent of the input and the design of the
process. Then, the different variations in a process design can be measured by structural
metrics, which are variables that measure the characteristics and capabilities of the process.
The article proposes a set of metrics to evaluate process design, based on previous research
and practical experience.
Each metric is described in detail on the article. The first three ones, Branching automation
factor, Communication automation factor and Activity automation factor, are designed to
measure the level of automation of the system, and how it benefits from this automation (or
suffers by a lack of). The next three ones, Role integration factor, Process visibility factor and
Person dependency factor, measure how the different roles, stakeholders or people are
integrated into the system, and how this affect in a positive or negative way. Finally, Activity
parallelism factor and Transition delay risk factor measure how well (or bad) the workflow of
the system is performing.

27
Figure 2: Balasubramanian Structural metrics
The advantage of these set of metrics is that they can be used to evaluate the processes at
their design stage. If different alternatives are designed, then they can be compared between
them, so the design that is most adequate to the functional and performance goals stated by
the organization can be implemented. Also, another advantage is the application of these
metrics to the current implemented processes, so they can reveal already implemented design
errors.
Kreimeyer et al [15]
Domain General purpose
Current process Evaluated and flaws detected
Goal oriented No
Alternatives design Address weak spots
Design directions Complexity
Alternatives comp. No
Type of metrics Quantitative
Case study ‐‐
Implemented toolkit ‐‐
28
In the work of Kreimeyer [15] structural metrics are defined to measure the complexity of a
system, as a mean to identify weak spots in it, so it can be redesigned. That is because
complexity increments the difficulty to identify those weak spots. In a less complex system,
these can be easily identified and corrected.
To measure complexity, the metrics have to look into how are the dependencies between the
different entities of the system. For this purpose, the Multiple‐Domain Matrix (MDM)
[16]model is used, which represents the process in terms of entities and their relationships.
The proposed metrics are the following:
McCabe’s Cyclomatic Number (MCC): it is the number of linearly independent paths
through a process, that is a measure of binary decisions.
Control Flow Complexity (CFC): counts the number of states that a process can be, that
is how many paths the process can take into the different binary decisions.
Activity/Passivity: counts the number of incident edges into a node, so it reflects how
“active” is that element.
This metrics can be calculated directly from the MDM, and give indications of how complex the
system is. This can be useful to identify those weak spots in the current system, and give
indications to which changes are necessary to make. However, they are not intended to
evaluate different design alternatives, nor compare them to the current process and choose
the best alternative. It has the advantage that many kind of processes can be modeled with
MDM, and therefore the proposed metrics can be used in a variety of domains.
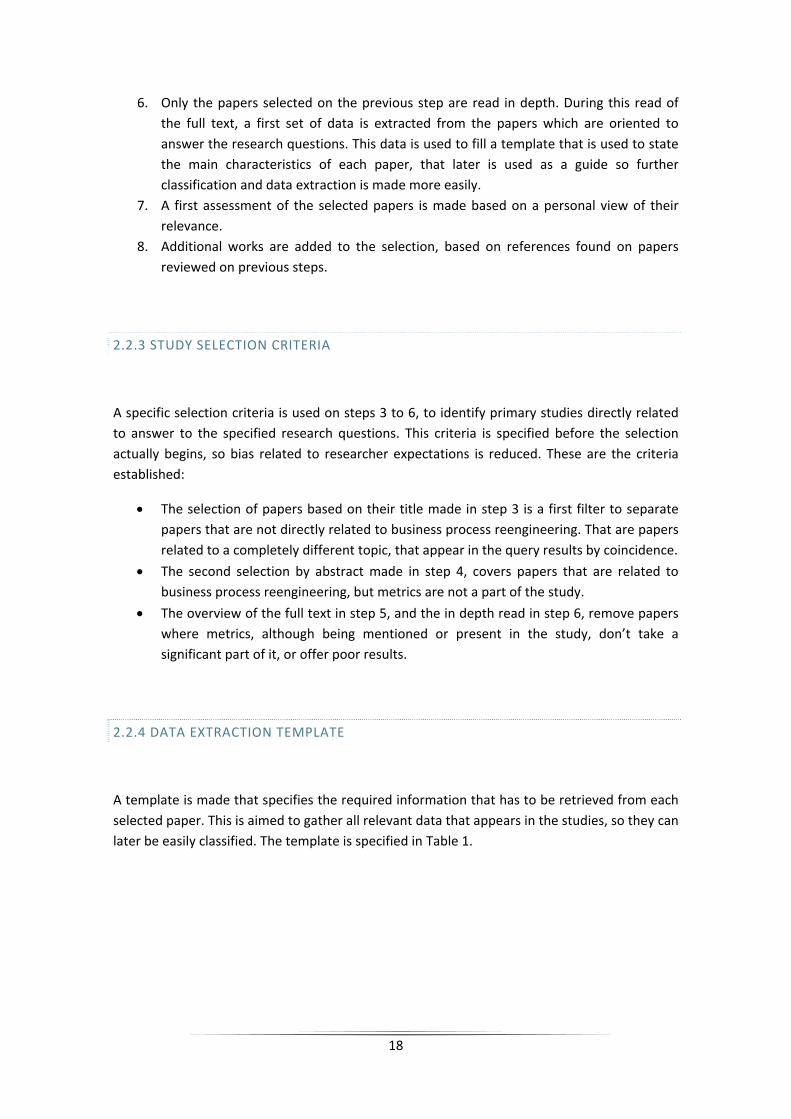
Ozcelik [17]
Domain General purpose
Current process Performance evaluated
Goal oriented No
Alternatives design ‐‐
Design directions ‐‐
Alternatives comp. No
Type of metrics Quantitative
Case study ‐‐
Implemented toolkit ‐‐
The work of Ozcelik [17] proposes three metrics: labor productivity, return on assets and
return on equity, which are used to measure the performance of a redesigned process after its
implementation. These metrics are used to evaluate a series of 93 BPR projects implemented
by some companies between 1984 and 2004, and are constructed as shown in Figure 3.

29
Figure 3: Oczelik performance measures
This study aims to demonstrate that performance is decreased during the implementation of
the BPR, and then it improves after the completion of the project. As a side effect, the
proposed metrics can be used to evaluate the performance of a given system. The weak point
of the metrics, is that they can only be calculated on an implemented system. This can be used
to assess the successfulness or failure of a redesign, but only once it is implemented. So, it
cannot be used to compare different alternatives before they are implemented. Also, although
the metrics are not based on a specific domain, they only are meaningful for processes where
goals are based on sales.
Lam et al [18]
Domain General purpose
Current process Evaluated and flaws detected
Goal oriented No
Alternatives design ‐‐
Design directions ‐‐
Alternatives comp. No
Type of metrics Quantitative
Case study ‐‐
Implemented toolkit ‐‐
In the article by Lam [18] an activity model is used to measure the performance of an
organization. Using adjacent matrixes, it allows to identify activities that are inefficient, so they
can be redesigned.
The idea is to analyze the routing of activities of a given business process flow using an
adjacent boolean matrix, which defines the activities of the process and how they link
together. There are six types of activities that interact between entities: Start, Serial
interaction, Merge interaction, Split interaction, Merge and split interaction, and End. For a
given process, that starts with the activity Start and finish with the activity End, there are a
certain number of possible flows in between, which are represented in the matrix and can be
analyzed. In particular, activity looping must be avoided because it is considered to be
inefficient and ineffective. An activity cycle matrix is defined to identify these cases.
Although this approach is useful to compare some design alternatives (the different flows in
the matrix), it has limitations, because only one type of flaw can be detected (activity looping).
On the other hand, it can be applied to a wide scope of business processes.

30
Cheng et al [19]
Domain General purpose
Current process Evaluated
Goal oriented No
Alternatives design ‐‐
Design directions ‐‐
Alternatives comp. Between them and with current process
Type of metrics Quantitative
Case study ‐‐
Implemented toolkit ‐‐
A more useful approach is presented by Cheng [19]. In order to evaluate efficiency and
effectiveness, process operation time and customer satisfaction are analyzed. Efficiency is
evaluated by the amount of resources in relation to the results, and effectiveness is the degree
to which a goal is achieved with resources applied. A reduction in process operation time
makes the project more efficient. An increment in customer satisfaction indicates more
effectiveness. To calculate them, a model is developed, then process value and value
improvement indicators are proposed, so results before and after reengineering can be
compared.
Process operation time is quantified using queuing theory, it focuses on the steady state of a
system with distribution functions of processes, then probabilistic models for the system can
be formed. The main idea is that customers join a queue and wait for a service (Figure 4).
Figure 4: Cheng customer queue
An operation process can be seen like a queuing sequence, where work and documents wait to
be executed. A time queuing GI/G/1 model is used to evaluate process operation time.
To evaluate customer satisfaction, company policy and customer concerns are transformed
into process targets, and then a target attainability matrix is proposed to examine if these
objectives are achieved. The evaluation of customer satisfaction is an indicator for measuring
process effectiveness.

31
Although this method is proposed with construction management processes in mind, it is
easily exportable to BPR in other domains. It has the main advantage of being able to compare
the performance of the current implemented process with the redesigned alternative.
Brito et al [20]
Domain General purpose
Current process Evaluate and identify flaws
Goal oriented No
Alternatives design BPMN modeling
Design directions ‐‐
Alternatives comp. Current with redesigned
Type of metrics Quantitative
Case study ‐‐
Implemented toolkit ‐‐
The work of Brito [20] presents a series of metrics and formalizes them in Object Constraint
Language (OCL). They are aimed to compare the current process model (specifically IT Service
Management processes) with a new redesigned one (the “to‐be” model) before it is
implemented, this is called “gap analysis”.
First, the current “as‐is” model needs to be formalized, so its analysis can determine why the
model does not achieve its objectives of cost, quality, speed and service. The modeling is done
by using BPMN notation. So, the purpose of the redesign of the model is to propose and
evaluate different alternatives that satisfy the given objectives. The quantification of the
differences between the current model and the proposed alternatives is done by the proposed
metrics, and measure the “gap” between the “as‐is” and the “to‐be” model. This includes to
measure the model complexity, as it is a predictor for the failure of models.
The description of the BPMN metamodel is proposed in the article. It has the advantage of
being unambiguous in describing the process model. A case study is presented and
instantiated using the proposed metamodel.
The proposed metrics are used to measure the complexity of software, so they allow to predict
error rates, detect design flaws, asses modularity, support refactoring decisions and estimate
maintenance costs. The metrics are instantiated from the BPMN model using OCL language,
and are specified in the article. They include:
Size metrics: the number of activities in the model is used as a simple metric for the
model size.
Coefficient of network complexity: it is the number of arcs divided by number of
nodes, and measures the complexity of a network.
Henry and Kafura metric: measures the modularization of a model.
Control flow complexity: measures the number of linearly‐independent paths through
a program.

32
Nesting depth: it measures how much deep the nesting structure can go, as it is a bad
practice if it goes too deep.
The metrics can be calculated for the “as‐is” model and all the “to‐be” model alternatives, and
can be used as explanatory variables in a regression analysis.
The metrics proposed in this article, can be used in a wide variety of systems, although it is
obviously oriented to software processes. It allows to identify the weak points of the system,
and compare it to different alternatives, and to choose the one that better fits to the goals of
the organization.
Altinkemer et al [21]
Domain General purpose
Current process No
Goal oriented No
Alternatives design ‐‐
Design directions ‐‐
Alternatives comp. Compare alternative design and current process
Type of metrics Quantitative
Case study Yes, mixed results
Implemented toolkit ‐‐
Altinkemer [21] presents five case studies to propose a series of metrics to evaluate the effects
of BPR, measuring the productivity and performance of the new implemented models. The
hypotheses of the article are that productivity and performance decreases in the initiation
phase of the BPR project, but then increase after that initial period.
The variables that are to be measured are:
Labor productivity: is measured by total sales divided by number of employees.
Financial firm performance: is measured by return on assets (ROA) and return on
equity (ROE).
Operational performance: is measured through inventory turnover, which is the cost
of goods sold divided by the total cost of inventory.
Stock market valuation: is measured using a simplified version of Tobin’s q that relates
the market value of a firm to its assets.
Firm output (value added): is measured by sales minus materials.
These variables are used to compare the already implemented new model against the old one.
So they have the obvious disadvantages that cannot evaluate the new model before it is
implemented, and cannot address weak points in the old model or compare different design
alternatives. Also, these measures may lack an ability to capture future success of the firm,
which is a key point due to the hypotheses of performance drop during the initiation of the
BPR project.

33
Applied to the case studies, mixed evidence is found supporting the hypothesis of performance
drop during initiation year, but evidence suggest confirmation for the hypothesis of
performance rising again after that first year.
Pidun et al [22]
Domain General purpose
Current process Evaluated
Goal oriented Yes, functional and soft goals
Alternatives design Process success factors
Design directions ‐‐
Alternatives comp. ‐‐
Type of metrics Quantitative and qualitative
Case study ‐‐
Implemented toolkit ‐‐
An interesting original approach can be found in Pidun [22] as it does not limit the study to
quantitative metrics (key performance indicators or KPI), but expand them with more
qualitative measurement by augmenting their visibility.
The motivation is that often numeric metrics (KPI) left behind some success factors that are
not measurable, as soft goals, but are relevant for the performance of the system, for example
human resources or public relations. So, qualitative information increases the knowledge of
the processes to be redesigned.
The article proposes the main reasons to use KPIs, particularly for production processes:
Processes in industrial manufacturing are usually systematized and automated.
Results of these processes are usually related to money income.
Changes to indicators impact the operating result.
The qualitative measurement of the process success is included in what the article calls
Process Success Factors, and can be seen as measurement of the soft goals of a process:
conditions written in free text that define a process success when they are fulfilled, and they
can be quantified with a numeric quasi‐value.
The Process Metrics are proposed to evaluate process effectiveness by means of the process
featuring a certain outcome. These are parameters that describe in a qualitative way how well
the entire process, or one of its parts, is achieving its goals.
The qualitative measurement is valid for a wide scope of domain problems, and can be used to
evaluate current processes and a variety of alternative redesign, although it doesn’t help to
propose these alternatives.

34
4.2 DOMAIN SPECIFIC METRICS
Usually, metrics can be defined to a particular problem, a case study, or some specific
processes related to a single domain. The advantage of these domain specific metrics is that
they work particularly well for the given problem, and adjust to the specific goals that the
organization has. The weak point is that they are not usually exportable for a general purpose
use, although sometimes they can be applied to similar problems and goals.
Mills et al [23]
Domain Software
Current process Evaluated
Goal oriented No
Alternatives design ‐‐
Design directions Metrics used as guide to design
Alternatives comp. ‐‐
Type of metrics Quantitative
Case study ‐‐
Implemented toolkit ‐‐
Mills [23] approach focuses on software development, the set of metrics proposed are
developed to evaluate the software development life cycle, that is, what the software can
offer and the effort that is necessary to obtain it. An analysis of the history of software metrics
in software engineering is also made.
Three entities are distinguished to be measured: the software product, the process and the
project, and the intended use of the metrics defines which characteristics of these entities are
going to be measured. The proposal is that these measures are quantitative, and defines the
values use for each measure as scales of measurement (for example nominal, ordinal, interval,
ratio...).
So, different metrics are defined for the three above mentioned entities:
Product metrics: the final product is important for its visibility: source/object code,
requirements, design and documentation.
o The first characteristic to be measured is its size, which determines the cost
and effort required to develop the product. One of the most used metrics for
measuring the size of the product is the number of lines of code, but its weak
point is that it is only measurable after the product is finished. So the Function
Point metric is proposed, which can be calculated at early stages of the
project, and is defined as the sum of some weighted characteristics, such as
number of inputs, outputs, files and inquiries associated to the software.
o The complexity also defines the cost and effort required in development. One
of the most used metrics is cyclomatic complexity metric, which measures the

35
number of independent paths through a flow graph. It gives an idea of the
logical complexity of the program, and can give directions to where testing
must be directed, and which parts of the software may be too complex and
are worth redesigning.
o Software quality defines the usefulness of the product, specifically the absence
of errors. So, the count of known errors is a direct measure of software
quality.
Project metrics: the main characteristics to be measured are total cost, effort and time
required to develop the project. This allows to estimate these measures for a future
project based on the ones measured in a similar developed one. The weak point is that
accuracy for predicted values is limited by the accuracy of the current measured ones,
so a recalibration may be required to provide reliable results.
Process metrics: they define the way that software projects are developed, and what
methodologies and techniques are used. The Capability Maturity Model (CMM)
[24]provides key process areas (KPAs) as characteristics for the process, which can be
measured assigning a “maturity level” from 1 (lowest) to 5 (highest). This measures the
ability to provide quality software reliably. The more KPAs are addressed, then the
maturity level of the project is increased.
So the bottom line of the work is that the given metrics can be used in guiding testing efforts,
as design criteria, as predictors of cost/effort of development and maintenance, and as quality
measures.
Mohanty et al [25]
Domain Material management
Current process Flaws identified
Goal oriented Yes
Alternatives design ‐‐
Design directions ‐‐
Alternatives comp. Compared between them and with current process
Type of metrics Quantitative
Case study Yes, successful
Implemented toolkit ‐‐
The Mohanty study [25] is the typical domain based metrics based on a case study (a materials
management function of a cement manufacturing plant in India). In particular, it focuses on
the management (procurement and inventory) of the materials used in the plant, because it is
a key aspect for competitiveness. The BPR project performed on the case study aims to the
materials cost as the critical success factor. But also, it contains some elements such as the
cost‐value matrix that can be used in other similar reengineering efforts.
The first part of the article is a proposition for a model for BPR implementation (Figure 5)

36
Figure 5: Mohanty BPR model
Organizational development (OD) is a mean to adapt the organization to the new changes, by
team formation and learning support to the team members, so OD can be used as a tool to
achieve the reengineering process.
For the case study, the motivation for reengineering is given by the high costs in the materials
department, including monetary cost in inventory and time involved in procuring items. Some
metrics are used to identify the problem: the level of inventory and lead times of store items
and spare, which both were significantly high on the case study. Note that these metrics are
used since materials costs is the critical success factor in this case, and so they are selected
because are the ones that better serves to the goals of the organization, and cannot be
extended to another organization with different goals. In this case, the goals are cut down
costs, improve service, cut down lead time, etc.
The next step is the identification of processes to be reengineered, according to established
goals. A cost‐value matrix is defined for this purpose, which indicates the action to carry based
on the relation between cost and value of each process (Figure 6)
Figure 6: Mohanty cost value matrix
This matrix is not only applicable to this case study, but it can be exported to any process
redesign that implies a goal of cost reductions.

37
After the new processes redesign is described, the evaluation phase is proposed, where
specific metrics are used, so the performance of the new design can be compared to the old
one. A process can be divided into value adding and non‐value adding activities, so the
redesign consists in eliminating those non‐adding value activities. In the case study, the
metrics that reflect value added activities are such as reduction in lead‐time, reduction in
inventory and better customer service. As before, the metrics are specific for the domain of
the case study, so in different processes with different goals, other metrics should be defined.
Khan et al [26]
Domain Air cargo handling process
Current process ‐‐
Goal oriented ‐‐
Alternatives design ‐‐
Design directions Simplify
Alternatives comp. Compare redesigned process with current one
Type of metrics Quantitative
Case study Yes
Implemented toolkit ‐‐
The Khan study [26] is another example of domain specific metrics defined from a case study,
in this case an air cargo handling process. The metrics are aimed to measure the performance
of the redesigned process, with respect to quality and speed of the service, and compare it to
the current process.
The basic principle that the author proposes for reengineering is that a process improvement
must be based on eliminate or minimize waste. The improvements that the air cargo handling
process needs are freight service performances, such as speed, quality, service and cost (note
as these can be related to the goals of the organization). So, metrics are needed to identify
waste, that is, non‐value adding activities inside the process.
Minimizing waste is used then to shorten cycle time, or combining some process activities, so
time and the number of steps acts as a metric for the different activities that the process
includes. These can be calculated for the process before and after the redesign, and then can
be compared (Figures 7 and 8).
So, the bottom‐line of the work is redesigning based on simplifying the process. Because the
organization goal is to reduce waste, metrics are constructed according to this goal and the
process to be redesigned. Although they are constructed thinking exclusively on the domain
that they are applied, it is possible to use time and number of steps in similar processes that
involves several activities and where the main goal of the redesign is to reduce cycle time.
They also have the advantage that the values for the “before” and the “after” processes can be
compared so improvement can be observed.

38
Figure 7: Khan reception summary chart
Figure 8: Khan customer services summary chart
Marinescu [27]
Domain Object Oriented Software
Current process Flaws identified
Goal oriented No
Alternatives design ‐‐
Design directions Address design flaws
Alternatives comp. ‐‐
Type of metrics Quantitative
Case study Yes
Implemented toolkit ‐‐
The work of Marinescu [27] uses metrics to detect weak points (design flaws) in object‐
oriented software. For each specific problem, an adequate metric must be defined to identify
flaws so the goals of the reengineering can be achieved. The article also presents a case study
consisting of two typical problems in OO design: data classes and god classes.
The problem here is that design flaw must be known before the metrics can measure if it
affects the designed system, so the method proposed by the author can be applicable only for
previously known problems, it is unable to detect unknown flaws in the design. Once the flaw
39
to be detected is chosen, a quantitative analysis is done by describing how that flaw affects the
entities and the relationships between them, then metrics can be defined to measure the
characteristics of the structure that suffers the flaw. Finally the metrics give direction to which
parts of the design of a specific system are flawed, so they can be reengineered. The method
for detect the flaws includes the following template:
Motivation: the impact of the design flaw that must be corrected.
Strategy: how to detect entities that have the characteristics of the flaw.
Metrics: definition of the metric, interpretation model and outliers specification.
Measurements: results of measuring entities with the defined metrics.
Findings: analysis of the detected entities.
The case study defines some metrics for the two above mentioned typical design flaws:
Data classes: these are classes which their lack of methods indicates that they are not
following the object oriented conception, which affects maintainability, testability and
understandability of the system. For detecting these classes, the following metrics are
defined:
o Weight of a class: number of non‐accessor methods in a class divided by the
total number of the interface. A lower value indicates the class is suspect to be
a data class.
o Number of public attributes: non‐inherited attributes that belong to the
interface of a class. Classes with this kind of attributes are not following
encapsulation.
o Number of accessor methods: non‐inherited accessor methods declared in the
interface of a class. High values indicates that the functionality of the class is
misplaced in other classes.
God classes: these are classes which perform most of the work in the system, having
negative impact on reusability and understandability. As with data classes, metrics are
defined to detect these problem in a system:
o Access of foreign data: number of access of a class to other classes. Classes
with high values are suspects of being a god class.
o Weighted method count: sum of statically complexity of all methods in a class.
High value indicates complex classes, suspects of being a god class.
o Tight class cohesion: relative number of directly connected methods. Lower
values indicates non‐communicative classes, also suspects of god classes.
It can be seen that the metrics defined in the case study are directly oriented to the specific
design flaws that are going to be detected in a system. If other flaws are going to be detected,
new metrics are to be defined. It is necessary that the designer not only has knowledge of the
flaw he wants to detect, but also has to know its characteristics and how it affects the model,
so correct and appropriate metrics are defined to successfully detect the flaw. Although the
method proposed by the author can be used in several scenarios, these limitations need to be
taken into account.

40
4.3 METHODOLOGIES AND GQM
Methodologies are aimed at generating a set of metrics that best suit a given problem. Instead
of defining the specific metrics from scratch, a well‐defined methodology can be applied to
obtain the metrics that best serves to the organization purpose, normally in an automated
way, which has some advantages: the method is consistent and replicable, it is less time and
cost consuming, it is usually general purpose and non‐dependent of the domain, and it is
easier to document.
In particular, the Goal‐Question‐Metric (GQM) paradigm is wide used for identifying metrics
that are based in the objectives of the processes that an organization want to evaluate.
Niessink et al [28]
Domain General purpose
Current process Evaluated
Goal oriented ‐‐
Alternatives design Capability Maturity Model
Design directions Metrics improvement
Alternatives comp. ‐‐
Type of metrics Quantitative or qualitative
Case study Yes, areas of improvement identified
Implemented toolkit ‐‐
Niessink’s proposal [28] presents a method for evaluating the measurement capacity of an
organization, and how the metrics can be improved. The article includes four case studies, with
mixed results of success and failure of different implemented measurement programs, and
then a Capability Maturity Model (CMM) to evaluate and improve the implementation of
measurement programs in organizations.
The improvement method is based on some success factors that have been proposed (Figure
9). But, methods proposed in the literature do not give indications on how to implement the
measurement processes, so the Measurement Capability Maturity Model (M‐CMM) is
proposed, with two goals: evaluate how well the measurement process of the organization are
doing, and to indicate how can measurement process be improved. To achieve this, the M‐
CMM classifies the measurement process into five levels, according to some characteristics of
the organization (Figure 10).

41
Figure 9: Niessink success factors
Measurement capability is defined as “the extent to which an organization is able to take
relevant measures of its products, processes and resources in a cost effective way resulting in
information needed to reach its business goals”. So, the higher level an organization scores in
M‐CMM, indicates a higher measurement capability. The article defines the characteristics of
each level as follows:
1. Initial: the organization has no defined measurement processes, few measures are
gathered, measurement that takes place is solely the result of actions of individuals.
2. Repeatable: basic measurement processes are in place to establish measurement
goals, specify measures and measurement protocols, collect and analyze the measures
and provide feedback to software engineers and management. The necessary
measurement discipline is present to consistently obtain measures.
3. Defined: The measurement process is documented, standardized, and integrated in
the standard software process of the organization. All projects use a tailored version of
the organization’s standard measurement process.
4. Managed: The measurement process is quantitatively understood. The costs in terms
of effort and money are known. Measurement processes are efficient.
5. Optimizing: Measurements are constantly monitored with respect to their
effectiveness and changed where necessary. Measurement goals are set in
anticipation of changes in the organization or its environment.
Figure 10: Niessink measurement process levels

42
To reach a level, an organization has to achieve the key process areas defined for each level:
1. Initial: No key process areas.
2. Repeatable: Measurement design, measurement collection, measure analysis and
measure feedback.
3. Defined: Organization measurement focus, organization measurement design,
organization measurement database and training program.
4. Managed: Measurement cost management and technology selection.
5. Optimizing: Measurement change management.
The model is applied to the case studies, revealing the areas of improvement of each one. It
asses organizations by giving them a score, which explains the success of failure of their
measurement systems.
Kueng et al [29]
Domain General purpose
Current process Evaluated
Goal oriented Yes
Alternatives design Method defined
Design directions Goal oriented
Alternatives comp. Compared between them and with current process
Type of metrics ‐‐
Case study ‐‐
Implemented toolkit ‐‐
The work of Kueng [29] shows that process models need to be designed with the final
objective of reaching the goals of the organization, in contrast of evaluating the models at the
implementation level. That gives two main advantages, first errors in design come at an earlier
stage, when they are easier to correct, and second it is easier to consider non‐IT aspects at
their proper stage. In short, designing with goals in mind leads to better implemented
processes. The article presents a methodology for designing processes with functional goals in
mind, and a way to evaluate the different design alternatives.
The methodology is defined as four steps that are repeated in cycle, and it has to define:
The goals of the organization.
The activities that need to be done to reach the goals, and the produced output.
The dependencies between different activities.
The roles (humans or machines) that are assigned to the activities.
Figure 11 shows the four steps involved in process modeling.

43
Figure 11: Kueng process modeling cycle
Steps are defined as follows:
1. Goal modeling: goals need to be captured and represented, and then decomposed in a
way that needed activities to accomplish the goal can be identified. Also, a
measurement criteria needs to be defined, to assure that goals have been fulfilled.
2. Activity modeling: Business process should include activities that have a value for the
costumer, so they make a contribution to the organization functional goals. They are
derived from goals, and they are measured to assure that goals are fulfilled and they
adhere to proposed restrictions. An input/output table is defined to show
dependencies between activities and customers.
3. Role modeling: Required roles are defined, both human actors or machines, and then
they are linked with activities.
4. Object modeling: It is oriented to the final implementation of processes. It has to
define which classes should the model include, how is their life‐cycle, and how do
objects interact between them.
The measurement of the model is defined for evaluation, to ensure that the model is able to
accomplish the proposed goals. In the article, goals are divided into two different points of
view: the manager and the process performer. The meaning of goals are presented in two
tables (Figure 12 and 13).

44
Figure 12: Kueng goals
That serves as a guide to measure how “good” a process is. Metrics can be constructed to
evaluate if a designed process accomplishes the specified goals. Depending on the
organization, different points of view can be defined, each with its own goals to be measured.
Figure 13: Kueng goals
The advantage of this approach is its ability to measure the processes at design level, before
they are implemented. This can lead to a comparison of different alternatives, and then to
choose the one that give better results according to the established goals. Also, applied to
current implemented processes, it is able to show weak points that need to be redesigned, or

45
errors at conceptual level. The limits of this methodology are that it only gives a partial
approximation to the quality of a process, while it does not take into account non‐functional
(or soft) goals.
Nissen [30]
Domain General purpose
Current process Evaluated
Goal oriented No
Alternatives design Modeling
Design directions Diagnose process pathologies
Alternatives comp. Compared between them and with current process
Type of metrics Quantitative
Case study ‐‐
Implemented toolkit Knowledge based system
Nissen [30] proposes and implements a metrics system that allows to compare different design
alternatives, and mixes it with simulation to evaluate a case study. The motivation is to
propose a knowledge‐based system to “redesign” the process redesign itself, which is defined
in Figure 14.
Figure 14: Nissen design process
The methodological part consists in how metrics are defined and then used to automate the
activities involved in redesigning a business process. The results are different alternative
designs, which can be compared using simulation. The steps defined in the above figure are
described as follow:
Identify process for redesign: relevant processes need to be selected. The
identification criteria includes dysfunction, importance and redesign feasibility. The
process must be repeatable and its working activities must be well described.

46
Develop process model: it can be done with appropriate redesign tools, often
including graphical modeling, which serves as starting point for measurement‐driven
inference.
Measure process configuration: for process measurement, the author chooses two
implemented systems, SHOPIE [31] and MYCIN [32]. Process measurement could
include statistics (length, breath, depth...), artificial intelligence (problem size,
parallelism, cycles...), information systems (support, automation, communication...)
and others. Measurements are used as a base to evaluate the graphical model.
Diagnose process pathologies: Measurement in the previous step is used to identify
process pathologies, which are formalized using a taxonomy.
Match redesign transformations: The measurement and diagnostic information is
used to match appropriate transformations, so a taxonomy of redesign
transformation is introduced:
Finally, applying one or more redesign transformation produces various design
alternatives. Simulation testing is proposed as a way to compare the relative
performance associated with each alternative, and different implemented tools can
be used.
The advantage of this methodology is the ability to construct a set of metrics that adapt to the
processes that mostly need a redesign in the organization, so the resulting design alternatives
are likely to address the specific performance issues that can be identified. They can be tested
and evaluated by simulation before they are implemented. A knowledge‐based system is
implemented using this methodology, and applied in the case study, which offers positive
results (it is fully presented in the appendixes of the article).
Goel et al [33]
Domain Legacy software
Current process Evaluated Six Sigma methodology
Goal oriented Yes
Alternatives design ‐‐
Design directions Statistical analysis
Alternatives comparison
Performance
Type of metrics Quantitative
Case study Yes
Implemented toolkit ‐‐
In the work by Goel [33] an established metrics‐based methodology Six Sigma [34] is used in a
case study BPR project that involves a company that acquires a smaller one and has to
integrate its business processes.
Six Sigma methodology uses a statistical analysis to measure and improve business processes.
Processes have associated a series of metrics, when an instance of one of these metrics fall

47
outside a specified range, it is consider an error. Then, the Six Sigma quality is obtained when
errors are reduced to less than 3.4 per one million instances.
Six Sigma includes a tool (DFSS) to help redesign. The process consist of five steps:
1. Creating metrics.
2. Weighing metrics.
3. Identifying the baseline.
4. Rating different options.
5. Selecting processes.
The second tool included is DMAIC which is used to measure the performance of the existing
processes. With these two tools, BPR is done in multiple steps, detailed in Figure 15.
Figure 15: Goel BPR
In the measurement part, the metrics are defined according to the goals of the reengineering
project. In the analysis phase, the errors and problems are measured using statistical methods
and tools.
In the case study, methodology is used to successfully identify problems that arise with the
integration of business processes, as shown in table 16.
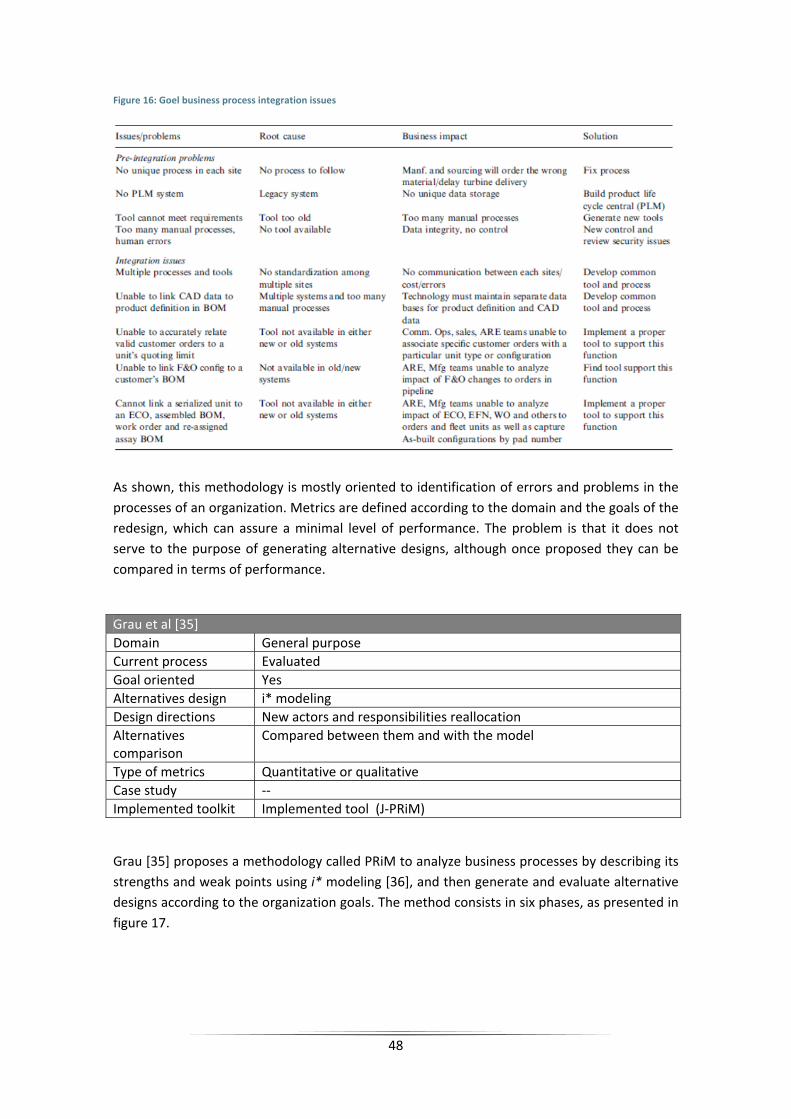
48
Figure 16: Goel business process integration issues
As shown, this methodology is mostly oriented to identification of errors and problems in the
processes of an organization. Metrics are defined according to the domain and the goals of the
redesign, which can assure a minimal level of performance. The problem is that it does not
serve to the purpose of generating alternative designs, although once proposed they can be
compared in terms of performance.
Grau et al [35]
Domain General purpose
Current process Evaluated
Goal oriented Yes
Alternatives design i* modeling
Design directions New actors and responsibilities reallocation
Alternatives comparison
Compared between them and with the model
Type of metrics Quantitative or qualitative
Case study ‐‐
Implemented toolkit Implemented tool (J‐PRiM)
Grau [35] proposes a methodology called PRiM to analyze business processes by describing its
strengths and weak points using i* modeling [36], and then generate and evaluate alternative
designs according to the organization goals. The method consists in six phases, as presented in
figure 17.

49
Figure 17: Grau PRiM methodology phases
In the first phase, Human Activity Models (HAM) are used to describe the activities taken to
achieve the goals of the actors involved in the process. For documenting the current process, a
template is used to structure the obtained information, and a notation is proposed, called
Detailed Interaction Script (DIS), which includes goals, actors, triggering events and pre and
post conditions.
In the second phase, the information gathered during the first step is used to build the i*
model of the current process. First the actors of the process and their goals are identified.
Then the operational model is built, by translating the information of the DIS to the i* model
by following a series of rules which involve translating activities to tasks, decomposing tasks
into actions, modeling the actions that produce, provide or consume resources, modeling
reflexive actions and alternative course of actions, and modeling preconditions, post
conditions and triggering events. The intentional model complements the operational model,
specifying the goals and soft goals of the process. Finally, the i* model consistency is checked
by applying a specified set of checks, that ensures correspondence between HAM and DIS and
between DIS and the i* model.
The third phase is the actual reengineering of the process, so new issues and improvements
are introduced to the model, that is with the inclusion, modification or deletion of goals and
soft goals. If this implies the creation of new activities, then a new DIS is created and the i*
model is modified in the same way as it was constructed in the second phase. For removing
activities, they cannot affect other activities, which in that case need also to be removed.
In the fourth phase, different design alternatives are generated by adding new actors and
reallocating responsibilities between them. New actors can be added if new roles are designed
in order to achieve some specific goals. The reallocation of responsibilities implies assigning
goals to different actors.
The fifth phase is the evaluation of the proposed alternatives, by considering properties
considered of interest for the process, which are evaluated by structural metrics over actors
and dependencies of the model. The metrics based on actors include, for a given metric that

50
measures a property of the model, a function to assign a weight to every actor for that
property and a function that corrects this weight considering the actor dependencies. The
metrics based on dependencies are similar, with a function that assigns a weight to every
dependum, and two correction factor for that weight, according to what kind of actor the
depender and the dependee are. The usual properties that are evaluated by this metrics are
the kind of ease of communication, process agility or accuracy. Then these properties are
evaluated for every alternative design that was proposed in the fourth phase, so the best
solution can be chosen.
The last phase is define the new system specification, by translating the selected i* model into
UML. The authors also propose an implemented tool, J‐PRiM, that is able to assist in every
phase of the proposed method.
As shown, this is a complete method that comprises all necessary steps involved in a
reengineering project, which are the evaluation of the current process, identification of
improvable parts, and the generation and evaluation of alternative designs. It is also a general
methodology that is applicable in several kinds of domains, and it also has an implemented
software tool.
Franch et al [37]
Domain General purpose
Current process Evaluated
Goal oriented Yes
Alternatives design Use of patterns for metrics construction
Design directions ‐‐
Alternatives comparison
Compared between them and with current process
Type of metrics Quantitative or qualitative
Case study ‐‐
Implemented toolkit ‐‐
The work over i* goal oriented models is continued by Franch [37] by proposing the use of
patterns for designing appropriated metrics, and implemented using OCL language so they can
be reusable for several models.
The definition of patterns includes the following structure:
Name, context, problem, solution related patterns and example of use.
Involved classes and types.
Assumptions, which include knowledge about the pattern.
Required knowledge, including domain information.
Form, a definition in OCL language that describes the patter.
An example is given for metrics that sums values associated to models or actors (Figure 18)

51
Figure 18: Franch metrics
Patterns are then organized into a catalog, which eases their definition and reutilization. The
overview of this catalog is presented in Figure 19:
Figure 19: Franch patterns catalog
Patterns are a good methodology for the construction of metrics, because they work with the
support of a i* model, so metrics can be designed with the purpose of evaluate the goals of the
organization that are present in the model. As patterns are classified into a catalog, it is easier

52
to choose the most appropriate one for a given design. As a general methodology, it can be
applied on several domains, and metrics can be used to evaluate both the current model and
the design alternatives.
The last part of the methodological articles focus on the GQM (Goal‐Question‐Metric)
paradigm, which was introduced by Basili and Weiss [38] [39] and is based on defining goals
(conceptual level) and refining them into questions (operational level), and then define metrics
(quantitative level) that provide the information to answer that questions. With this answers
then it can be stated if the goals have been attained. It has the advantage that constructed
metrics address directly to the main objectives of the organization, as goals lead the metrics
design.
Aversano et al [40] and [41]
Domain General purpose
Current process Evaluated
Goal oriented Yes
Alternatives design GQM
Design directions Critiquing tables for identify improvement areas
Alternatives comparison
Compared between them and with current process
Type of metrics Quantitative or qualitative
Case study Yes, improvements identified
Implemented toolkit ‐‐
The methodological approach of Aversano [40] uses GQM to propose metrics for evaluating a
software system and propose design alternatives, and critiquing tables are used to identify
actions to be taken for improvement. Critiques have a problem description as input, and then
return comments on a solution for the problem, or an improvement for an already suggested
solution.
The methodology consists in four parts:
Requirements definition: Identification of the goals to be achieved by improving the
system.
Software system assessment: apply the measurement framework defined by GQM and
apply the proposed metrics to evaluate the system.
Identification of evolution approach: use critiquing tables to identify the areas of
improvement.
Software system evolution: implementation of the selected evolution.
The measurement framework uses metrics identified by GQM to collect all the data needed for
the application of the critiquing tables. In the article, for the evaluation of a software system,
two goals have been identified: evaluate the business value and the technical value of the
system, that is its value depending of the type of users. Characteristics are defined for each
goals, and serve as starting point to identify questions and metrics (Figure 20).

53
Figure 20: Aversano goals characteristics
Several metrics then can be proposed. In the article just a pair of examples had been shown in
Figure 21.
Once all the data coming from measured metrics is gathered, then critiquing tables are
constructed on a table with attributes as rows and critiques as columns. Depending on the
value of the different attributes, different critiques can be made for each one, if it is
considered not to be into a valid reference threshold.
The article also provides a case study of different systems, where some improvements have
been identified by applying the methodology.

54
Figure 21: Aversano metrics example
Aversano continued developing this approach [41] and developed a full methodology called
JEPS which integrates measurement, decision‐making and critiquing tables for the evaluation
and development of software systems, and implemented it by a software named WebEv+. It is
an environment implemented for supporting the management of the measurement
framework, the execution of the assessment activities and the use of critiquing tables.
Ramos et al [42]
Domain Outsourced software systems maintenance
Current process Evaluated
Goal oriented Yes
Alternatives design GQM
Design directions Automated data collection
Alternatives comparison
Compared between them and with current process
Type of metrics Quantitative
Case study Yes, successful
Implemented toolkit ‐‐
As an example of application of GQM, a case study is presented by Ramos [42] where GQM is
used to define a framework of metrics to help evaluate the complexity of a software system,
based on the goal of maintenance by an outsourced company.
The process of applying GQM is divided in four phases: the planning phase is to choose the
improvement area and objectives. The definition phase is where goals, questions and metrics

55
are defined. The data collection phase is where information is gathered to answer the
questions. Finally, the interpretation phase is where information is used to determine if the
goals are attained.
In the case study, in the planning phase the purpose of the study is defined as to allow the
outsourced maintainer to measure the complexity of a legacy software system. In the
identification phase, goals are defined using the following template:
What to analyze?
To which purpose?
With respect to?
From which viewpoints?
In what context?
So two goals are defined:
1. To analyze the system documentation, for the purpose of assessing, with respect to
completeness and consistency, from the viewpoints of analyst and programmers, in
the context of the outsourced maintainer.
2. To analyze the system source code, for the purpose of assessing, with respect to the
complexity to understand and modifying it, from the viewpoint of analysts and
programmers, in the context of the outsourced maintainer.
For each goal, several questions and metrics are identified. For example, for the goal of
analyzing the documentation, one of the question is “to what extent is the system
documented?”. Then four metrics are defined to answer that question:
1. Percentage of documented elements from the context diagram.
2. Percentage of documented elements from the DFD level zero diagram.
3. Percentage of documented elements from the physical data model.
4. Number of documented requirements .
Metrics can be obtained from automated data collection, and then summarized on a table. In
the article, data are gathered from five systems from different companies, and for example,
figure 22 summarizes the results for the analyzing the documentation goal.
As seen, this leads to results that are directly comparable between them, what in a case of
reengineering a process can result in a comparison of different design alternatives with the
current system if automated access to data is available.

56
Figure 22: Ramos results summary
Oinas [43]
Domain Nokia processes
Current process Evaluated
Goal oriented Yes
Alternatives design GQM
Design directions Automated data collection
Alternatives comparison
‐‐
Type of metrics Quantitative
Case study Yes, successful
Implemented toolkit ‐‐
In another example, Oinas [43] used GQM in a real case study, where high level goals are
translated to measurement goals, so metrics can be constructed with the purpose of improve
the Fault Management Process and the Delivery Process of the Fixed Switching unit of Nokia.
GQM is used to formalize measurement goals. For each goal, it specifies its purpose, object of
interest and perspective (Figure 23). Then indicators are defined and related to the previous
identified goals (Figure 24)

57
Figure 23: Oinas goal purpose
These indicators were successful to evaluate the state of the processes in the case study,
thanks to the availability of automated data collection that can be used in the computation of
the indicators.
Figure 24: Oinas goal indicators

58
4.4 SIMULATION
Simulation techniques are proposed to evaluate different design alternatives, often comparing
them with the current design, so the most appropriate can be chosen. Simulation allow to test
the results at a design stage, so the reengineered process do not need to be implemented to
know an estimation of its actual performance.
Levas et al [44]
Domain General purpose
Current process Evaluated
Goal oriented ‐‐
Alternatives design Modeling
Design directions Simulation for performance indicators
Alternatives comparison
Compared between them
Type of metrics ‐‐
Case study ‐‐
Implemented toolkit ‐‐
Levas [44] discussed the role of simulation in BPR, and established the importance of modeling
the processes and obtaining key quantitative performance indicators with simulation tools,
with the goal of comparing different models and obtain the most appropriate solution.
MacArthur et al [45]
Domain General purpose
Current process Evaluated
Goal oriented ‐‐
Alternatives design Modeling
Design directions Simulation for performance indicators and continuous improvement
Alternatives comparison
Compared between them and with current process
Type of metrics Quantitative
Case study ‐‐
Implemented toolkit ‐‐
The work by MacArthur [45] emphasizes three main aspects of measurement regarding to
BPR, oriented to the justification of the need of a redesign and the selection of the most
appropriate alternative:
Data collection, as a mean to gather information for simulation modeling.

59
Simulation of the designed components.
Integration of the simulation results for a continuous improvement of the systems.
The motivation for using simulation modeling is the need to measure the quality of the
provided products and services. Although it is not implicit in the article, this can be related to
the established goals of the organization. So simulation modeling is used to evaluate
alternative redesigns, measure business process performance and quality (process costs and
cycle times) before they are implemented.
For the simulation modeling, the organization processes are viewed as a set of modules that
interact with each other in a supply‐delivery way. The process modules are both organized into
a horizontal (process flow) and a vertical (hierarchical decomposition) dimensions, so it
requires a tree structure of statistics and reports, that need to be provided by the simulation
software. Data needed to construct the simulation model is then gathered from the various
modules of the organization, observing the processes, interviewing the users, reviewing files,
etc.
Simulation can then provide a continuous improvement of the processes, by establishing a
baseline of performance that can be compared later with the performance of different
improvements introduced in the processes, so deviations from the baseline can be identified
and tracked to the source of a possible problem.
Swami [46]
Domain General purpose
Current process Evaluated
Goal oriented ‐‐
Alternatives design Modeling
Design directions Simulation for key performance metrics
Alternatives comparison
Compared between them and with current process
Type of metrics Quantitative
Case study Yes, validated process flow and new alternatives
Implemented toolkit ‐‐
In the proposal by Swami [46] simulation is used by creating a model of the system to see how
reengineering impacts some defined variables, called key performance metrics, comparing the
current system to different design alternatives. The use of simulation allows to experiment
with the system, understand its responses to changes and choose the better model the
interdependencies between activities.
The approach is defined as identifying key value adding attributes or variables that add value
from the customer’s perspective. Then processes that contribute to those variables are
identified, and are analyzed to identify how they can be improved. Simulation provides a mean
to arrive at the optimal solution that addresses the customer’s needs. The constructed model

60
can be used to a continuous improvement of the processes as the customer requirements can
change.
The article also presents a case study of reengineering the processes of a company, using
simulation models of the current and future states. The future state validated the process
flow. Improvements were identified for some key processes that added greater value to the
costumer. Key metrics as time to satisfy order and on‐hold time managers were used to test
the possible new design alternatives, which offered different solutions to various needs, so the
optimal solution can be chosen.
Aldowaisan et al [47]
Domain General purpose
Current process Evaluated
Goal oriented ‐‐
Alternatives design Observational Analysis
Design directions Simulation
Alternatives comparison
Compared between them
Type of metrics ‐‐
Case study ‐‐
Implemented toolkit ‐‐
Aldowaisan [47] uses Observational Analysis (OA) for developing process design, which
includes eliminating non‐value‐added activities, simplify, combine and automate activities, and
finally evaluate the behavior of alternative design with simulation techniques.
Greasley [48]
Domain General purpose
Current process Evaluated
Goal oriented ‐‐
Alternatives design Balanced Scorecard
Design directions Simulation for performance indicators
Alternatives comparison
Compared between them
Type of metrics Quantitative
Case study Yes, successful
Implemented toolkit Use of ARENA software
Greasley [48] uses two case studies to evaluate a number of tools for redesigning processes,
including simulation to evaluate the current process performance and compare it with the
developed future design.

61
A balanced scorecard is used as a set of performance indicators for the processes. It is
constructed by identifying the critical success factors, and then identifying which are the
relevant processes that affect these factors. The current design of these processes can be then
analyzed by process mapping, a diagram which shows the relations between activities and
identifies entities and roles involved in the process. This diagram is used as the simulation
conceptual model.
In the case studies, simulation is constructed with the ARENA system [49]. The model includes
data collection to construct probability distributions for the critical success factors identified,
for example, in the first case one of them is the cost by arrest in a police station. Historical data
is included in the model (in the example, the arrests over a year), so it is possible to test the
model against this historical data. Simulation can be run on several executions, (10 in the case
study) and an average value can be calculated. As an example, the cost by arrest type can be
calculated (Figure 25).
Figure 25: Greasely arrest cost
Simulation also can be applied to the redesigned “to‐be” models, to study the estimated effect
of a change in the processes. For example, in the case study, if more agents are assigned to
control “late drinking”, it can be estimated an increment on the number of “public order”
arrests, so simulation can be used to see the increment in cost due to that change, in function
of the number of agents assigned (Figure 26).
Figure 26: Greasely cost increment
As seen, effects of a redesign in a process can be estimated and measured using simulation,
and see which success factors are affected and in which way. Decisions then can be made

62
easier with this information by comparing the results of the proposed design with the results
of the current system.
Silva et al [50]
Domain General purpose
Current process Evaluated
Goal oriented ‐‐
Alternatives design Modeling
Design directions Simulation for performance indicators
Alternatives comparison
Compared between them and with current process
Type of metrics ‐‐
Case study ‐‐
Implemented toolkit Use of ARENA software
In the same line Silva [50] shows a case study where simulation is used to estimate the value of
three performance measures: throughput, work in progress and utilization of resources in a
manufacturing process, so the new design can be compared with the current one.
Again, ARENA software was used for developing the simulation model. The model for the
current process stated some flaws that needed to be addressed. Then the model was used to
measure the impact of the redesign in the selected performance metrics. As in the previous
article, historical data was introduced into the model, so better probability distributions can be
made for the data.
Validation was done by comparing the predicted performance measures with the known
behavior of the current system in key operations. The results in the case study were
satisfactory and proposed changes were implemented.

63
5 CONCLUSIONS
After conducting the systematic review, the following goals have been accomplished:
A protocol for the systematic review was defined.
The questions for the research topic were defined.
The state of the art of the research topic was stated and described.
The protocol was defined using the directions given by Kitchenham [4]. This protocol reduces
the possible researcher bias, and contains all the strategies defined to search for works and to
extract data from them, including data used to answer the defined research questions.
The examination of selected works, concluded to define some general areas on the way
metrics are used in business process reengineering, including defined metrics, both for general
purpose or specific domains, methodologies proposed for defining metrics, including those
that use goals as a guide, and finally the use of simulation to evaluate systems. These areas
were described in their own section, and works included in each one were described in detail.
The first identified group of 11 works, proposes specific metrics that can be used in a wide
scope of domains. Table 3 summarizes them.
Table 3: Specific metrics summary
Work Evaluation of current process
Detection of flaws
Redesign directions
Comparison of alternatives
Yaung [11] Tasks Yes Yes No
Altinkemer [12] No No Sales oriented Yes
Arteta [13] Complexity No Agility Yes
Balsubr. [14] Performance Yes Goal oriented Yes
Kreimeyer [15] Complexity Yes Reduce complexity
No
Ozcelik [17] Performance No No Yes
Lam [18] Performance Yes No Yes
Cheng [19] Efficiency No No Yes
Brito [20] Complexity Yes No Yes
Altinkemer [21] No No Performance Yes
Pidun [22] Goals achieved No Goal oriented Yes
As seen, the majority (9 works) of proposed metrics are used to evaluate the current
implemented process that needs to be redesigned, although only 5 of these proposals are
intended to identify flaws or errors in them. The topic to be evaluated is normally the
complexity of the system or its performance, as they are important issues to be addressed

64
(performance needs to be increased and complexity reduced), but only 2 works ([14] and [22])
take the goals of the organization into account.
Also the majority of works propose metrics that compare alternative designs, including both
Altinkemer proposals ([12] and [21]) which are the other 2 papers that do not evaluate the
current process. As seen in the table, increase of performance and reduction of complexity are
the main objectives of these design alternatives, with the 2 mentioned works that are goal
oriented.
Only 5 of the works propose specific means to identify flaws in the current process. These
means are intended to identify weak spots that make a reduction of performance or make the
system more complex.
Four works are included that propose metrics that are only meaningful in the proposed
domain (Table 4).
Table 4: specific domain metrics summary
Work Domain Evaluation of current process
Detection of flaws
Redesign directions
Comparison of
alternatives
Mills [23] Software Yes No Metrics oriented
No
Mohanty[25] Material management
Yes Yes No Yes
Khan [26] Air cargo No No Simplify Yes
Marinescu [27]
Software Yes Yes Address flaws No
The solutions proposed are very dependent on the problem presented in the domain, so none
of them is goal oriented (if we consider that solving that specific problem is not one of the
goals of the organization). As before, the majority of works (3 out of 4) evaluate the current
process, although only 2 of them identify design flaws. But for the redesign issue and
comparison of alternatives, the group of works is a mixed bag. The 2 works of the software
domain address different solutions for giving redesign directions, Mills proposes that redesign
is made using the metrics results as a guide, while Marinescu proposes addressing the
identified flaws as a mean for the redesign.
Nine works propose the use of a methodology to generate metrics according to the needs of
the redesign. These include 3 works that use the GQM paradigm as a methodology (Table 5).
As seen, specifying a methodology is a more complete approach than just proposing a set of
metrics. All of the works present methods that allows to evaluate the current process, and
almost everyone compare it with different alternatives. Of these, 5 works are explicit goal

65
oriented methodologies: Kueng, Grau and the three GQM proposals. Only 3 works propose
some kind of flaw detection method, but here the key point is to construct the redesign with
the organization goals in mind, so the correction of possible flaws can be made if they are
addressed as explicit objectives of the reengineering.
Table 5: methodologies summary
Work Methodology Evaluation of current process
Detection of flaws
Redesign directions
Comparison of
alternatives
Niessink [28] M‐CMM Yes No Measurement capability
No
Kueng [29] Modeling Yes No Goal oriented Yes
Nissen [30] Modeling Yes Yes Pathologies Yes
Goel [33] Six Sigma Yes Yes Statistical analysis
Yes
Grau [35] Modeling Yes No Goal oriented Yes
Franch [37] Modeling Yes No Metrics construction
Yes
Aversano [40][41]
GQM Yes Yes Critiquing tables, goal oriented
Yes
Ramos [42] GQM Yes No Data collection,
goal oriented
Yes
Oinas [43] GQM Yes No Data collection,
goal oriented
Yes
Proposed methodologies are of different nature, apart from GQM, another 4 works (Kueng,
Nissen, Grau and Franch) propose some kind of modeling as a general approach. This allow to
model different processes independently from the domain or the kind of system. That model is
then used to evaluate both the “as‐is” process and compare it to the different “to‐be”
alternatives, allowing to choose the most appropriate design that best fit the defined goals.
Finally, 6 works propose the use of simulation to evaluate processes (Table 6). The works are
very straightforward, as they all use simulation to evaluate the different design alternatives,
and compare them with the current design. They change in the way the current process is
evaluated, as 3 of them use some kind of modeling (Levas, MacArthur and Swami) to define
what needs to be assessed, and other two use performance indicators. Performance is also
stated as the measure to evaluate when the simulation is executed in 4 of the works.
As seen, simulation is not intended to detect flaws of the current designs, but to obtain an
approximation of how well will the new design perform before it is implemented, and to
choose the most appropriate alternative.

66
Table 6: simulation summary
Work Evaluation of current process
Detection of flaws
Redesign directions
Comparison of alternatives
Levas [44] Modeling ‐‐ Simulation Yes
MacArthur [45] Modeling ‐‐ Simulation for performance
Yes
Swami [46] Modeling ‐‐ Simulation for performance
Yes
Aldowaisan [47] Observational analysis
‐‐ Simulation Yes
Greasley [48] Performance indicators
‐‐ Simulation for performance
Yes
Silva [50] Performance indicators
‐‐ Simulation for performance
Yes
5.1 ANSWERS TO THE RESEARCH QUESTIONS
This systematic review was intended to answer the following proposed questions:
1. Which metrics are used to asses that required goals are accomplished on the process
model?
2. How metrics can help to identify errors on a process model?
3. How can this metrics give directions to a possible redesign of a model?
4. How this metrics are used to compare a given model to an alternative redesigned one?
The first question is answered with the group classification made in the systematic review.
There are specific metrics proposed for general purpose and for specific domains, then the
methodologies proposed to create the metrics that best apply to an given problem, and finally
simulation to evaluate the performance of variables of a design.
The addressing of design flaws or errors is only present at some of the examined works.
Sometimes specific methods are specified to identify them, but it depends on the proposed
metrics (for the first group of works) or the method used (in the methodological group of
works. The works in the simulation group do not define any way to identify design flaws.
The works presenting a methodology are the ones that best address the question of directions
on redesigning a model, as they mostly are goal oriented. In fact, every work that use metrics
as a mean to achieve the goals of the organization give some indication on how the redesign
has to be addressed.

67
Finally, the use of modeling and simulation is the most appropriate way to compare design
alternatives, as they are constructed in the same way and have the same indicators on “how
well” a system is performing.

68
PART II : METHODOLOGICAL REENGINEERING OF A CASE STUDY
The second part of this master thesis deals with the problem of reengineering a case study in a
methodological way. As seen in the systematic review, there are several methods to evaluate a
current process of an organization and the different proposed redesign alternatives. A
methodological approach seems to be the most appropriate for our case study, since it can be
goal oriented and can give indication on how the process must be redesigned. Also, the use of
simulation to evaluate alternative designs could give an accurate view of how well the process
is being reengineered, and the decision of choosing the most appropriate design can be made
more accurately.
The following sections are organized as follow: Section 6 describes the case study in detail. In
section 7 the selection of the most appropriate methodology is discussed. Section 8 describes
the application of the selected methodology to model the current process and generate design
alternatives. Section 9 deals with the possible inclusion of simulation as an evaluation system
into the methodology. Section 10 presents the conclusions and future work.
6. THE CANCER REGISTRY CASE STUDY
The Catalan Institute of Oncology (ICO) records a Cancer Registry (CR) of all tumor cases that
attend the hospital since 1990 [2]. Each year a process is launched to incorporate new cases to
the registry database and update the existing prevalent ones. This process has been changing
through the years, but nowadays it mixes some actions automated by a software system with
some actions performed manually by human actors [51]. Since the goal of the organization is
to give more accurate results in less time, the process reengineering is aimed to reduce the
percentage of manual work, which will reduce the number of possible errors produced and the
time required to end the whole process.
The Cancer Registry has several information sources, coming from electronic databases:
1. The hospital discharge records, which registers all the information based on the
diagnoses and treatments done to any patient that stayed or was visited at the
hospital.
2. The pathology records, which registers the information of diagnoses done to the
biological samples analyzed at the laboratory.
3. The lymphoma registry, an specialized database that registers the cases of lymphomas
diagnosed and/or treated at the hospital.
4. The patient admissions records, which registers the demographic information of
patients.
5. The CR database itself, which give information about prevalent tumors.

69
Only information sources 1 to 3 can give information about new tumors, while source 4 give
complementary information about them and source 5 help to identify if a tumor was already
previously registered.
Data from hospital discharge records and pathology records is processed by a software called
Asedat, developed by the CR team [51]. This software analyzes the given information and
summarizes it into a tumor file, for about 80% of the cases that attended the hospital during
the time period being elaborated. The rest of the cases must be solved manually by an expert.
Then, a validation of the cases is done automatically applying the rules proposed by the
International Agency for Research on Cancer (IARC) [52] and cases detected with possible
errors are reviewed by the expert. Additional cases coming from the lymphoma registry are
also solved and introduced manually.
After cases are solved, demographic information about the patient is added from admissions
records. Additional information about comorbidity (using Charlson index [53][54]) and
treatments is gathered from the hospital discharge records, also with an automated process
with Asedat software. Finally, all gathered information is used to manually elaborate several
statistics about the results of the registry, which is presented in a published report.
Although there are some automated tasks during the whole process, a lot of others are done
manually:
Information from various databases is incorporated by demanding it to the database
owner, which provides the information in some different formats that must be unified
into the CR database.
Selection of data is made by executing queries to the database that must be initiated
manually. There’s no event that trigger their execution.
There is an non‐negligible amount of cases that must be solved and reviewed
manually, which is time consuming and prone to errors, in fact an estimation of about
10% of these cases including some kind of error has been made [51].
The process of obtaining information about treatments is still at a very experimental
early stage, so the demanded information can change, or the necessity of new results
can arise.
The elaboration of statistics has still a very fair amount of manual work, which includes
preparation of data into a specific format, execution of queries to obtain results, and
formatting the results into a publishable report format. Additionally, new queries can
be demanded during the report elaboration process, as new epidemiological
hypothesis arise, so these queries must be manually designed and implemented.
So, the main goals behind the motivation of reengineering this system are:
Reduce the amount of manual work. This will have several benefits, which are the
reduction of errors and time necessary to obtain the results and present the report.
Also, it has de benefit that human staff can dedicate this saved time to other duties.

70
Increase the flexibility of the system. The necessity of new results can arise at any
time, as some epidemiological hypothesis are presented by examining already
obtained results. This new results are usually a variation of previous ones, so instead of
implementing new queries manually, the system can have the possibility of doing it
automatically by having the flexibility of specify new queries as variations of old ones
(for example by changing some parameters).

71
7. SELECTION OF METHODOLOGY
We evaluated the group of methodological works that were presented during the systematic
review, using an evaluation procedure based on the one proposed by Decreus [55]. The
procedure consists on identifying a series of properties that we consider that the selected
methodology must accomplish, and assign a score for each property for each evaluated work.
7.1 POPULATION OF WORKS
The first step consisted on a previous selection of works to be evaluated. From the section 4.2
of the systematic review that correspond to methodological works, we first selected those that
propose a full methodology that covers all the procedure of process reengineering, so they
seem to best fit the case study problem:
Kueng [29] defines means to accomplish goals, and metrics for evaluation.
Nissen [30] models processes, use metrics for identifying weaknesses and uses
simulation for evaluation.
Grau [35] models processes and proposes a systematic reengineering method, with
metrics for evaluation.
Aversano [40] [41] uses GQM and critiquing tables for process evaluation and
alternative design proposals.
7.2 EVALUATION PROCEDURE
First we define the properties of the methodologies that we desire to evaluate. These
properties must assure that the selected methodology is the most complete and covers all the
aspects of a methodological redesign of the process in the case study. Following the method of
Decreus, each property is evaluated in the range of 0% (worst case), 25% (low), 50% (medium),
75% (high) and 100% (best case). The properties can be weighted to give some more
importance, but we decided that each one can score a maximum of 1 point.
Domain of application: evaluates the range of domains that the methodology is applicable.
Goal orientation: evaluates if the methodology will deal with the goals of the organization,
both functional and non‐functional (soft) goals.
Process modeling: evaluates if the methodology uses a formal approach for model the process
and present it in a formal, clear and unambiguous way.
72
Evaluation method: how the methodology will qualify the current process and the proposed
alternatives: fixed metrics (less flexibility), method for defining metrics or simulation (more
flexibility).
Identification of weaknesses: evaluates if the methodology has a mechanism for identifying
weak points in the current process.
Systematic reengineering: how the methodology will deal with the generation of alternative
designs. A systematic method will result in less errors, more appropriate designs and the
possibility of generate the alternatives in an automated way.
Implemented toolkit: evaluates if the methodology can be applied with a toolkit already
implemented by the authors.
7.3 EVALUATION RESULTS
Domain of application: all works are general purpose oriented, but Aversano methodology is
explicitly designed for application on software systems, so it scores at 50% while the rest of
works score 100%.
Goal orientation: Nissen work is not goal oriented, instead it proposes the use of inclusion
criteria for identifying relevant processes to be redesigned, so a score of 0% is given. Kueng
methodology includes goal orientation, but excludes non‐functional (soft) goals, so it has a
score of 50%. Both Grau and Aversano works includes a full goal orientation, which consider
functional and non‐functional goals, so they score at 100%.
Process modeling: Aversano work does not specify a modeling system for the processes, so it
scores at 0%. Kueng proposes modeling activities and roles, and the dependencies between
them, but not the rest of aspects of the model, so the score is 50%. Nissen proposes the use of
modeling tools, but do not give a full specification of proposed models, so it scores at 75%.
Grau proposes the use of i*framework for fully modeling the processes, so it scores at 100%.
Evaluation method: all works propose the construction of metrics for evaluating current
process and alternative designs, so they all score at 100%.
Identification of weaknesses: Aversano uses critiquing tables for fully identifying weak points
in the process, so it scores at 100%. Nissen proposes diagnose of process pathologies,
formalized with a taxonomy, so it also scores at 100%. Kueng relies on metrics to identify
design errors, so it scores at 25% and Grau do not define an explicit method, so it score at 0%.
Systematic reengineering: Only Grau proposes a full systematic construction of alternatives
applying defined steps that can be automatized, so it scores at 100%. Nissen proposes a
taxonomy of redesign transformation, so it scores at 75%. Kueng proposes the definition of

73
means to achieve goals, so it scores at 25%, and Aversano the use of critiquing tables to
identify areas of improvement, so it also scores at 25%.
Implemented toolkit: Grau and Aversano have an implemented toolkit for applying the
methodology, so they score at 100%, while Kueng and Nissen do not have this toolkit and
score at 0%. Table 7 summarizes the scores.
Table 7: methodologies scores summary
Method Domain of app.
Goal orient.
Process model.
Eval. Method
Id. Weak.
Syst. Reeng.
Impl. Toolkit
Final score
Kueng 100% 50% 50% 100% 25% 25% 0% 3,5
Nissen 100% 0% 75% 100% 100% 75% 0% 4,5
Grau 100% 100% 100% 100% 0% 100% 100% 6
Aversano 50% 100% 0% 100% 100% 25% 100% 4,75
We decided to follow Grau proposal (PRiM method) as it is the methodology with the higher
score in the evaluation. Also, in the same Decreus study [55] PRiM is defined as follows: “PRiM
is a perfect example of how a method description should look like, as it excels in clear method
description, rules, guidelines, checks, metrics and validation”. Finally, an additional value of
PRiM is that it is a method developed in our same research department at Catalonian
Polytechnic University [3].
The application of the PRiM method includes a study of the viability of including simulation
into the process, as a mean to evaluate process designs, and compare its performance with
structural metrics.

74
8. APPLICATION OF THE PRIM METHOD FOR REENGINEERING THE PROCESS
As seen in the systematic review, the PRiM method is comprised of six phases in which current
process is described and modeled, then reengineered and alternatives are proposed and then
evaluated, to finally propose a new process. Through this section, these different steps are
applied to the case study.
8.1 DESCRIPTION OF CURRENT PROCESS
The first phase of PRiM consists in describing the current process, in a social and technical
level. For this, Human Activity Models (HAM) are used, which are structured descriptions of
the behavior that an actor or group of actors (both human and software systems) undertake in
order to achieve their goals.
For the Cancer Registry case study, the following actors were identified:
The hospital information technology (IT) department.
Information system technicians (IT) from the CR department.
The database including all the information of theCR.
“Asedat” software [51], which is a proprietary software system of the CR.
Specialized physicians and technicians (Experts) from the CR department.
SAP, which is a hospital system, a software that provide access to all patient
documents.
Lymphomas registry, which is a unit from the Hematology department specialized in
registering lymphomas cases.
A series of web services available from the hospital information technology
department.
Statisticians from the CR department.
A general purpose statistical software.
Public readers: a role including any actor interested in the published report.
After analyzing the whole process of elaborating a year of the Registry with the stakeholders,
the following 15 HAM were identified:
HAM 1: Getting Hospital Discharge Records and Pathology Records
The CR IT actor gets the hospital discharge records and pathology records in plain text files
from the hospital IT department. The format of the files is standardized, and then they are
incorporated into the CR database, where they are merged with previous data.

75
HAM 2: Identification of patients
The CR IT actor launches an automated query identifies the patients that attended the hospital
for a cancer case during the period of time that the CR is being elaborated, by examining the
diagnosis codes present in the hospital discharge and pathology records.
HAM 3: Selection of patient data
For identified patients, another query is launched that gathers all their information from
hospital discharge and pathology records databases, being all kind of diagnosis and
procedures, so a codified medical history of each patient is obtained.
HAM 4: Processing patient data
“Asedat” software process collected patient data and returns information about detected
tumors for about 80% of cases, including about 1% of result errors. The rest of cases are
marked as they need manual resolution by the Expert actor.
HAM 5: Manual resolution of cases
Difficult cases marked in the previous step are solved manually by an expert, by checking
selected patient data. If this data is not enough to solve the case, then additional data can be
retrieved from the hospital SAP main database, where all the information of the patient is
available, which can include written reports, diagnose images, etc.
HAM 6: Validation of results
“Asedat” software identifies possible errors in results, and they are then checked manually by
the Expert. Also patients with multiple tumors are reviewed.
HAM 7: Incorporation of Lymphomas Registry
The Lymphomas Registry database is provided by the Hematological Service of the hospital.
Cases are manually reviewed and introduced on the results database of the time period being
elaborated.
HAM 8: Incorporation of patient admissions data
For newly identified tumors, patient admission demographic data is gathered from the hospital
main database by an automated process, in which a web service provides the demanded data.
The IT actor downloads the data and introduces them on the results database of the time
period being elaborated.
HAM 9: Introduction of results in the CR database
Final validated results are merged with the CR database of previous time periods by an
automated process in “Asedat” software. New cases are introduced and prevalent cases are
checked against CR database, incorporating new updated information if needed.

76
HAM 10: Identification of comorbidity
An automatic process at “Asedat” software is launched that identifies comorbidity for patients
diagnosed on the time period being analyzed.
HAM 11: Identification of treatments
An automatic process at “Asedat” software is launched that identifies treatments performed
to patients based on codes of hospital discharge records. For each type of tumor, different
categories of treatments are defined by the Expert actor. An automated query assigns a
category for each identified treatment.
HAM 12: General statistics
An automated process at “Asedat” software gets the basic statistics for the study period, and
return them in a plain text file.
HAM 13: Specific statistics
The Expert actor asks for specific statistics on demand, based on the results in the CR database
and the identified comorbidity and treatments data. The IT actor launches specific queries on
the database and gathers demanded data, which is transferred to the Expert actor.
HAM 14: Statistical analysis of treatments
The IT actor prepares the identified data of treatments for selected type of tumors into a
specific format, which is given to the Statistician actor. The Statistician actor transform data
into a statistical model and performs a deeper analysis with a general purpose statistical
software. The results of the analysis are transferred to the Expert actor.
HAM 15: Report generation
The Expert actor receives data from general and specific statistics, and from statistical analysis
of treatments, and rewrites them into a publishable report format that can be read later by
public readers.
In order for modeling the system with i*, this information must be structured in an unified
way. So, an intermediate template is defined, called Detailed Interaction Script (DIS), where it
is specified all the information about goals, actors, preconditions, triggering events and
postconditions, directly obtained from HAMs. For each action defined, it is stated its
description, the actor who initiates it, and resources consumed, produced and provided.
The following are the DIS identified for the Cancer Registry case study:

77
DIS 1: Getting hospital discharge records and pathology records
Source: HAM 1: Getting hospital discharge records and pathology records
Actors: CR IT, hospital IT department
Precond:
Trigger:
Action Initiator
Action Consumed resources
Produced resources
Action Addressee
Provided Resources
Actions 1 hospital IT dep
Provide hospital discharge records
Hospital discharge records
CR IT Time period to obtain data
2 hospital IT dep
Provide pathology records
Pathology records
CR IT Time period to obtain data
3 CR IT Merge data Hospital discharge records, Pathology records
CR database
Postcond: Hospital discharge records and Pathology records are merged with CR database
DIS 2: Selection of patient data
Source: HAM 2: Identification of patients
HAM 3: Selection of patient data
Precond: CR database data is up to date
Trigger:
Action Initiator
Action Consumed resources
Produced resources
Action Addressee
Provided Resources
Actions 1 CR IT Execute patient identification query
List of identified patients
CR database
2 CR IT Execute patient data gathering query
List of identified patients
Patient data
CR database
Postcond: Patient data is selected and gathered

78
DIS 3: Resolution of cases
Source: HAM 4: Processing patient data
HAM 5: Manual resolution of cases
Precond: Patient data is selected and gathered
Trigger:
Action Initiator
Action Consumed resources
Produced resources
Action Addressee
Provided Resources
Actions 1 CR IT Execute data processing
Patient data
Automated solved cases, Cases marked to be reviewed
Asedat Software
Time period of resolution, CR database historic data
2 Expert Review marked cases
Cases marked to be reviewed
Manual solved cases
CR database
Patient data, Time period of resolution
Alternative courses:
2a Expert Review doubtful cases with SAP
Doubtful cases to be reviewed
Manual solved cases
SAP CR database historic data
Postcond: All cases are solved
DIS 4: Validation of results
Source: HAM 6: Validation of results
Precond: All cases are solved
Trigger:
Action Initiator
Action Consumed resources
Produced resources
Action Addressee
Provided Resources
Actions 1 CR IT Identify errors Automated solved cases, Manual solved cases
List of errors
Asedat Software
CR database historic data
2 Expert Review identified errors
List of errors
Reviewed cases
CR database
Postcond: Errors solved

79
DIS 5: Incorporation of Lymphomas registry
Source: HAM 7: Incorporation of Lymphomas registry
Precond:
Trigger:
Action Initiator
Action Consumed resources
Produced resources
Action Addressee
Provided Resources
Action 1 Lymphomas registry
Provide Lymphomas registry data
Lymphomas registry data
CR IT Time period of resolution
2 CR IT Provide data to the Expert
Expert Lymphomas registry data
3 Expert Resolution of Lymphoma cases
Lymphomas registry data
Solved lymphoma cases
CR IT
4 CR IT Introduction of solved cases in the database
Solved lymphoma cases
CR database
Postcond: Solved cases are uploaded to database
DIS 6: Incorporation of patient admissions data
Source: HAM 8: Incorporation of patient admissions data
Precond: All cases are solved, errors solved, Lymphomas cases are solved
Trigger:
Action Initiator
Action Consumed resources
Produced resources
Action Addressee
Provided Resources
Action 1 CR IT Execute automated process
Patient admissions data
WebServices system
List of patient identificators
2 CR IT Incorporation of obtained data
Patient admissions data
CR database
Postcond: Patient admissions data is incorpored in the database

80
DIS 7: Introduction of results in CR Database
Source: HAM 9: Introduction of results in CR Database
Precond: All cases are solved, errors solved, Lymphomas cases are solved, Admissions data incorporated
Trigger:
Action Initiator
Action Consumed resources
Produced resources
Action Addressee
Provided Resources
Action 1 CR IT Execute automated process
Automated solved cases, Manual solved cases, Reviewed cases, Solved lymphoma cases
Updated CR database
Asedat Software
CR database historic data
Postcond: CR database is updated
DIS 8: Identification of Comorbidity and Treatments
Source: HAM 10: Identification of comorbidity
HAM 11: Identification of treatments
Precond: CR database is updated
Trigger:
Action Initiator
Action Consumed resources
Produced resources
Action Addressee
Provided Resources
Action 1 CR IT Identify comorbidity
Comorbidity results
Asedat software
CR database
2 CR IT Identify treatments
Treatments results
Asedat software
CR database
3 Expert Provide treatments categories
List of categories
CR IT
4 CR IT Classify treatments
Treatments results, List of categories
Classified treatments
CR database
Postcond: Comorbidity obtained and treatments classified

81
DIS 9: General statistics
Source: HAM 12: General statistics
Precond: CR database is updated
Trigger:
Action Initiator
Action Consumed resources
Produced resources
Action Addressee
Provided Resources
Action 1 CR IT Obtain general statistics file
General statistics file
Asedat software
CR database
2 CR IT Deliver general statistics file
General statistics file
Expert
Postcond: General statistics are delivered
DIS 10: Specific statistics
Source: HAM 13: Specific statistics
Precond: CR database is updated, comorbidity obtained and treatments classified
Trigger:
Action Initiator
Action Consumed resources
Produced resources
Action Addressee
Provided Resources
Action 1 Expert Specify desired statistics
Desired statistics
CR IT
2 CR IT Deliver specific tumor statistics
Specific tumor statistics
Expert Desired statistics
3 CR IT Deliver specific comorbidity statistics
Comorbidity results
Specific comorbidity statistics
Expert Desired statistics
4 CR IT Deliver specific treatments statistics
Classified treatments
Specific treatments statistics
Expert Desired statistics
Alternative courses:
1a Expert New statistics are demanded
Desired statistics
CR IT
2a CR IT Deliver specified statistics
Specified statistics
Expert Desired statistics
Postcond: Desired statistics are delivered

82
DIS 11: Statistical analysis of treatments
Source: HAM 14: Statistical analysis of treatments
Precond: CR database is updated and treatments classified
Trigger:
Action Initiator
Action Consumed resources
Produced resources
Action Addressee
Provided Resources
Action 1 CR IT Provide treatments data
Classified treatments
Treatments data
CR Statistic
CR database, Specified format
2 CR Statistic
Make statistical model
Treatments data
Statistical Model
Statistical Software
Model specification
3 Statistical software
Perform statistical analysis
Statistical Model
Statistical analysis results
CR Statistic
4 CR Statistic
Provide statistical analysis results
Statistical analysis results
Expert
Postcond: Statistical analysis results delivered
DIS 12: Report generation
Source: HAM 15: Report generation
Precond: General statistics, specific statistics, and statistical analysis of treatments are delivered
Trigger:
Action Initiator
Action Consumed resources
Produced resources
Action Addressee
Provided Resources
Action 1 Expert Merge and rewrite results
General statistics, Specific statistics, Statistical analysis results
Rewritten results
2 Expert Write methodology
Written methodology
3 Expert Generate report
Rewritten results, Written methodology
Published report
Public readers
Postcond: Report is published

83
8.2 I* MODELLING
The second phase of the PRiM method is to translate the described current process and model
it using the i* framework [36]. Two types of goals are differentiated: descriptive goals, which
are identified with analyses of the current process and modeled with the Operational model
(comprised of tasks, resources and some goals), and prescriptive goals, which are provided by
strategic management and are modeled with the Intentional model (that adds goals and soft
goals to the Operational model).
The first step is to identify the stakeholders involved in the process, which will be modeled as
actors, and their main goals (Table 8).
Table 8: actors main goals
Actor Main goal
Expert To have a publishable report with CR results
CR IT To provide data for the report
CR Statistician To provide data for the report
Software system To support automated functions for the CR
Data providers To provide data for the elaboration of the CR
Public readers To be informed about the CR results
The Software system actor congregates all the software parts that are present in the whole
process, which are described in the previous section. So the following actors are part of the
Software system actor: the CR database, Asedat software, SAP, the web services system and
the statistical software.
The Data providers actor congregates external parts of the CR that provide raw data for the
elaboration of the CR, which are the hospital IT department and the Lymphomas registry.
The Operational model is built in the second step. It represents the way that the main goals of
the defined actors are achieved. In order to be prescriptive, the operational model is
constructed using both the Strategic Dependency (SD) model and the Strategic Rationale (SR)
model. Actions defined in the DIS can be used to obtain dependencies in the SD model by
applying a series of defined operational rules (see [3] for more details):
Each activity in which an actor is involved, is modeled as a task which is a mean to
obtain its main goal.
These identified tasks are decomposed into tasks corresponding to each action of the
DIS.
Produced, provided and consumed resources are modeled as resource dependencies
between the actors specified in the DIS.

84
Alternative courses are modeled as tasks which are a mean to obtain the task that
causes the alternative course.
Preconditions are modeled as goal dependencies, and postconditions as a task
decomposition goal element.
For reasons of space, the operational model is presented in segments, each one corresponding
to a specific DIS. Figure 27 presents the legend of the elements used in the i* models.
Figure 27: i* models elements
Given the specified DIS in the case study, first the CR IT actor gets the hospital discharge and
pathology records from the data providers. As we can see in its part of the operational model,
the task “Get hospital discharge and pathology records” is a mean to each actor’s objective.
This task is decomposed into action tasks, and the produced, provided and consumed
resources are modeled as dependencies between these tasks. The postcondition “Data is
merged with CR database” is modeled as a task decomposition goal element :

85
Figure 28: DIS 1
The selection of patient data involves the CR IT actor executing two automated queries to the
database to obtain first identified patients and then their data:
Figure 29: DIS 2

86
The resolution of cases first need the CR IT produce the patient data to the software system,
which lead to solved cases and cases marked for review, which will be reviewed by the Expert
actor. In this third DIS, there is an alternative course, where the Expert can review doubtful
cases with SAP (which is a part of the software system), so this task is modeled as a mean to
complete the “Resolution of cases” task:
Figure 30: DIS 3
CR IT To provide data for the report
ExpertTo have a
publishable report with CR results
Software system To support automated
functions for the CR
Resolution of cases
Resolution of cases
Resolution of cases
Execute Data processing
Review marked cases
Review doubts with SAP
Patient data
D
D
Cases marked for review
DD
Solved cases
DD
All cases solved
The validation of cases is performed by the expert after getting an error list, which is obtained
by the CR IT after executing a specified query on the software system:

87
Figure 31: DIS 4
The incorporation of Lymphomas Registry works similarly, the CR IT actor depends upon the
Data provider to obtain the Lymphoma data, which is needed by the Expert to produce the
solved cases resource, which is incorporated into the database by the CR IT to accomplish the
postcondition that is modeled as a task decomposition goal element:
Figure 32: DIS 5
Software system
To support automated functions
for the CR
CR IT To provide data for the report
ExpertTo have a
publishable report with CR results
Data providers To provide data for the
elaboration of the CR
Incorporation of Lymphoma
registry
Incorporation of Lymphoma
registry
Incorporation of Lymphoma
registry
Incorporation of Lymphoma
registry
Time period
Lymphoma data
Provide Lymphoma
registry
D
D
DD
Provide data to Expert
Lymphoma data
Resolve cases
D
D
Solved cases
Introduce solved cases to DB
D
D
Solved cases
D
D
Solved cases introduced to
DB

88
For the patient admission data, the software system depends on a provided list of patients to
produce the admission data, and the CR IT depends on that produced data to incorporate it to
the database, which is the postcondition modeled:
Figure 33: DIS 6
The final results are introduced into the database, the CR IT must provide the historic database
and the solved cases, and the software system produces the final updated database:
Figure 34: DIS 7
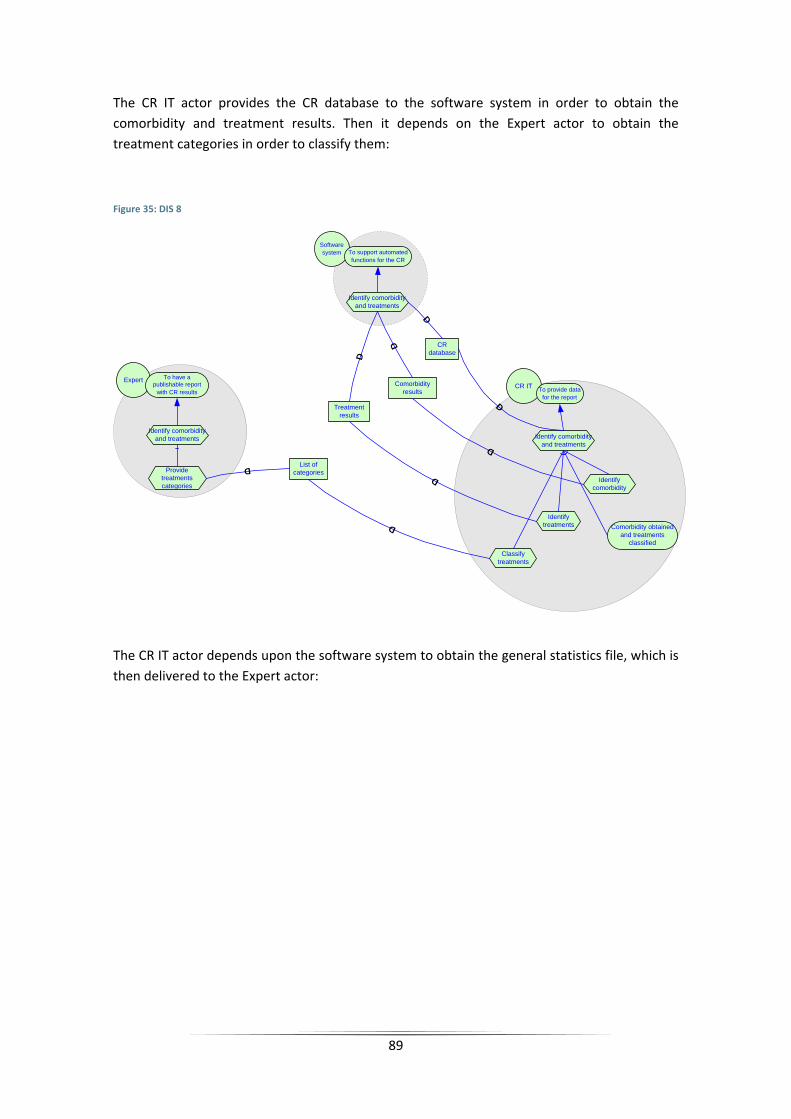
89
The CR IT actor provides the CR database to the software system in order to obtain the
comorbidity and treatment results. Then it depends on the Expert actor to obtain the
treatment categories in order to classify them:
Figure 35: DIS 8
Expert To have a publishable report
with CR resultsCR IT To provide data
for the report
Software system To support automated
functions for the CR
Identify comorbidity and treatments
Identify comorbidity and treatments
Identify comorbidity and treatments
Identify treatments
Classify treatments
Comorbidity obtained and treatments
classified
Identify comorbidity
Provide treatments categories
Comorbidity results
D
D
Treatment results
D
D
CR database
D
D
List of categories
D
D
The CR IT actor depends upon the software system to obtain the general statistics file, which is
then delivered to the Expert actor:

90
Figure 36: DIS 9
The CR IT actor depends upon the Expert actor to get the desired specific statistics, then
deliver the specific tumor, comorbidity and treatments statistics. As an alternative course, the
Expert can demand new statistics, and depends upon the CR IT actor to get them:
Figure 37: DIS 10
Expert To have a publishable report
with CR results
CR IT To provide data for the report
Get specific statistics
Get specific statistics
Specify desired statistics
New statistics are demanded
Deliver specific tumor statistics
Deliver specific comorbidity
statistics
Deliver specific treatment statistics
Deliver specified statistics
Desired statistics delivered
Desired statistics
Tumor statistics
Comorbidity statistics
Treatment statistics
Specified statistics
D
D
D
DD
DD
DDD
For statistical analysis of treatments, first the Statistician must provide the CR IT actor with the
format in which treatment data will be provided, in order to make the statistical model. The
software system depends upon this model to perform the statistical analysis. The results are

91
provided to the Expert actor by the statistician, so the goal “Results delivered” is
accomplished:
Figure 38: DIS 11
Finally, the public readers depend upon the Expert to obtain the published report:

92
Figure 39: DIS 12
Expert To have a publishable report
with CR results
Public readers To be informed about
CR results
Report generation
Report generation
Merge and write results
Write methodology
Generate report
Published report
D
D
Report is published
As seen, the Operational Model covers the modeling of the main goals of the actors present in
the model. Additionally, it is complemented by the Intentional Model, which covers the way
that these goals are included into the more wider scope of the goals of the organization. The
Intentional Model is constructed based on the organization strategic needs, so it is composed
of goals and soft goals that are added to the Operational Model. As a goal oriented model, it
can be constructed using established guidelines proposed by Requirements Engineering
methods. In the PRiM method, the following guidelines are proposed:
Analysis of the activities intentionality: new strategic goals are obtained by identifying
the state that is achieved by the execution of an activity and the actor who is
responsible of achieving it.
Decomposition of the intentional goals and soft goals: new goals are obtained by
analyzing the goals presented in the Operational Model. By interviewing the
stakeholders, issues related to the goals can be identified, such as the why, what, how,
who and where.
Quality attributed analysis of the dependencies intentionality: By using a catalogue of
quality attributes, new questions can be arisen according to how critical the attribute
is for the analyzed element of the process.
Analysis of contributions and conflicts, that can be identified between the intentional
elements present in the model.
Thus, the case study operational model presented previously was extended applying these
proposed guidelines. As shown, each actor involved in the case study has its own main goal,
and those goals serve to the main purpose of having an updated Cancer Registry which data
then can be used to publish results in the form of a report.

93
The intentionality behind this activity is the use that is done with the results shown in the
report, so the goal “The Results of the Report are used” can be added to the intentional model.
In this case, the actor Public readers is the depender of the goal, while the CR Expert actor is
the dependee. The public reader previous main goal was “to be informed about the results”,
and now we can see that getting the results is a mean to accomplish the new goal, that is use
the results:
Figure 40: intentional DIS 1
This intentional goal can be then decomposed, by answering the question “What has to be
done to achieve the goal?”. That includes goals and soft goals that must be achieve to allow
the results of the report to be used, and then the different goals that are accomplished by
using those results. In order to have the results usable, a new soft goal arise in the form that
results presented in the report should be correct and exhaustive. As a little percentage of error
is assumed, it must be maintained as low as possible.
Figure 41: intentional DIS 2

94
Now the goal of using the results of the report can be decomposed into different applications,
as these results serve to many purposes that can be modeled as new goals. To achieve these
goals, the Public readers depend upon the report to be published:
Monitoring hospital quality indexes.
Characteristics outline of the population attending to the hospital.
Evaluation of clinical procedures.
Creating standardized indicators that serve for comparison with other hospitals.
Planning of hospital resources.
Supporting tool for epidemiological studies.
Figure 42: intentional DIS 3
Quality attributes can be defined to obtain new soft goals. In this case, according to the
current law of Personal data protection, data security and confidentiality must be assured,
which depends upon the CR IT actor to be achieved.
Figure 43: intentional DIS 4

95
8.3 REENGINEERING THE PROCESS
The phase of reengineering the process consists in improving the process, in the form of
introducing, deleting or changing goals and soft goals.
The main concern of reengineering the Cancer Registry process is to optimize it in the way that
less time is consumed in manual work, and better (most accurate) results are obtained. By
analyzing the model with the stakeholders, the best strategy is to delegate responsibilities to
the Software system actor, in order to automatize tasks that are performed manually by a
human actor in the current model, so the following points are addressed:
1. All goals and soft goals are maintained except the CR IT actor main goal “to provide
data for the report”. In order to improve the process this goal must be avoided, data
for the report must be generated by the Software system actor, and the CR IT actor
must control its behavior. So a new goal is added for the CR IT actor, in the form of
“manage the software system”, and a new goal “to generate an automated preview of
the report” is added to the Software system actor.
2. Optimize soft goals are introduced, “results should have less errors” and “results
should be obtained in less time”, in order to compare the behavior of the new system,
which should lead to obtain better results.
These new introduced goals serve as a guide that lead to the generation of alternatives, which
are presented in the next section.
8.4 GENERATION OF ALTERNATIVES
The previously defined i* model serves as a starting point in the generation of new design
alternatives. The newly introduced goals in the reengineering process can lead to the addition
of new actors and the reallocation of responsibilities.
Usually, the addition of a Software system actor is made in design alternatives where some
functions need to be automated. In the Cancer Registry case study, there is already a Software
system actor, so the new alternatives will deal with reallocating responsibilities, that were
previously assigned to human actors (the CR IT actor in particular), and which now will be
assigned to the Software system actor.
In order to reallocate responsibilities, current tasks must be analyzed, and see if an actor must
keep the current dependencies, or they can be assumed by another actor. This lead to the
application of some possible reallocation patterns:

96
1. Goal achievement: the actor is still responsible for achieving the goal, so the
dependencies assigned to the task assigned for the goal remain unchanged.
2. Goal delegation: the goal is delegated to a new actor, so the task that operationalizes
it is now executed by that new actor.
3. Goal operationalization: course of actions that operationalizes a goal can be change or
added.
4. Soft goal operationalization: operationalize some soft goals into task.
The second pattern can be applied to the Cancer Registry case study. The CR IT actor was
previously responsible of achieving the goal “to provide data for the report”, but now we want
that the Software system actor will be the one that generates this data, concretely a preview
of the report that the Expert actor can have and just adjust to be publishable. So the CR IT
actor now has the responsibility of achieving the goal “to manage the software system” so he
can control that the preview is generated correctly.
As an automated process, the Software System actor can achieve the new goal “to generate an
automated preview of the report” in a more efficient way than a human actor, by also
contributing to the soft goals “results should have less errors” and “results should be obtained
in less time”. On the other hand, flexibility could be decreased as it is not able to give new
query results the way a human actor can.
As seen in the modeling of the process, the CR IT actor goal “to provide data for the report”
has several tasks that operationalizes it. They are:
Get hospital discharge and pathology records.
Select patient data.
Resolution of cases.
Validate results.
Incorporation of lymphoma registry.
Introduce admission data.
Introduction of results in the database.
Identify comorbidity and treatments.
Get general statistics.
Get specific statistics.
Statistical analysis of treatments.
These task now must be reassigned to the Software system actor in order to achieve the new
goal “to generate an automated preview of the report”. Some of them were replicated both in
the CR IT actor and the Software System actor in the original model. The reason is that the CR
IT actor uses the Software system to get the task done, as the software system is a merely
support for the task. In the redesigned model, the tasks usually are maintained in the
boundary of the Software system actor, and for each task a new goal appears in the CR IT actor
boundary, where he depends upon the Software system task to be done in order to achieve
this new goal, which is usually in the form of “the task is done”.

97
In this section we explain how the elements of the DIS of the current process are reassigned in
the redesigned model.
Starting with the first DIS, the responsibility of getting the hospital discharge and pathology
records can now be reassigned to the Software system. The CR IT actor can rely that data is
merged automatically to achieve the goal “data is merged with the database”. Now it is the
Software system that depends upon the data providers to obtain the data to be merged.
The CR IT actor no longer needs the resource “merged data”, as his responsibility is now only
to manage the Software system, so that resource is now reassigned to the Software system
actor boundary, in the form of a resource‐task decomposition:
Figure 44: alternative DIS 1
CR IT To provide data for the report
Data providers To provide data for the
elaboration of the CR
Get hospital discharge and
pathology recordsGet hospital
discharge and pathology records
Provide hospital discharge records
Provide pathology records
Merge data
Hospital discharge records
Pathology records
D
D
D
D
Time period to obtain data DD
Data is merged with DB
Software system To support automated
functions for the CR
Get hospital discharge and
pathology records
Merged data
Data is merged with DB
D
D
The “select patient data” task needs the CR IT actor to write specific queries to the database,
and then gather their results. The Software system just limits to provide the demanded data.
So, if the responsibility of doing the task is to be moved to the Software system, then the
dependencies related to this task that are present in the CR IT actor boundary need to be
moved to the Software system actor boundary.

98
That is, the Software system now executes the queries of patient identification and patient
data gathering automatically, and saves the results into the system itself, so the resources
“identified patients” and “patient data” are no longer needed by the CR IT actor. As they
remain into the Software system actor boundary, they are now a resource‐task decomposition
of each relative task.
The CR IT actor now depends upon the realization of the task “select patient data” by the
Software system to achieve his goal “patient data is selected and gathered”:
Figure 45: alternative DIS 2
The “resolution of cases” task is now entirely up to the Software system actor to be
performed. A new goal is added to the CR IT actor, “cases are solved” which depends upon the
software system to be achieved as the task “resolution of cases” is performed. Now the
patient data belongs to the Software system actor boundary as a resource‐task decomposition.
As shown, the interaction between the Expert actor and the Software system remains the
same, the software system continues to depend upon the expert to have all the cases solved,
providing the cases that need manual resolving:

99
Figure 46: alternative DIS 3
DD
D
The “validate results” task is now performed by the Software system actor, by providing
directly the Expert actor with the list of found errors. The Expert actor interacts directly with
the Software system. The CR IT actor depends upon this task for the achievement of the goal
“results are validated”, and now the resources “solved cases “ and “cancer registry historic
database” are moved within the Software system actor boundary:
Figure 47: alternative DIS 4
The “incorporation of Lymphoma registry” is still maintained on the CR IT actor boundary,
because the Data provider still depends upon getting the time period on which data is
obtained. That is due to the fact that the Lymphoma registry data provider is a human actor,
not automated databases as they were the Hospital discharge and Pathology records.
Now the Software system is the one that depends upon Data provider to get the lymphoma
data, and upon the Expert to get the cases solved and introduce them to the database. The CR
IT actor goal “solved cases introduced to the database” now depends on the completion of the
task by the Software system:

100
Figure 48: alternative DIS 5
Software system
To support automated functions
for the CR
CR IT To manage the software system
ExpertTo have a
publishable report with CR results
Data providers To provide data for the
elaboration of the CRIncorporation of Lymphoma
registry
Incorporation of Lymphoma
registry
Incorporation of Lymphoma
registry
Incorporation of Lymphoma
registry
Time period
Lymphoma data
Provide Lymphoma
registry
D
D
D
D
Provide data to Expert
Lymphoma data
Resolve cases
D
D
Solved cases
Introduce solved cases to DB
D
D
Solved cases introduced to
DB
Solved cases introduced to
DB
D
D
Also the task “Introduce admission data” is maintained on the CR IT actor boundary, as it
needs to provide the software system with the “list of patients” resource. Now the task
“introduce obtained data” is up to the software system, and the CR IT goal “data incorporated
to database” depends upon the completion of the task by the Software system, which also has
the “admission data” resource within its boundary:
Figure 49: alternative DIS 6

101
The Software system is also now responsible of the task “introduction of results in the
database”. As it now does not depend on the CR IT actor to get the needed resources, which
are moved into its boundary, it is the CR IT who depends upon the Software system to achieve
the goal “database is updated”:
Figure 50: alternative DIS 7
The task “identify comorbidity and treatments” is now responsibility of the Software system,
so as it was decomposed in three more tasks, “classify treatments”, “identify treatments” and
“identify comorbidity”, these tasks are now moved into the Software system actor boundary.
As it has now all the available resources within its boundary, it doesn’t depend upon the CR IT
actor to obtain them, but still depends upon the Expert actor to obtain the list of categories.
The CR IT actor now depends upon the completion of the “identify comorbidity and treatments
task by the Software system to achieve the goal “comorbidity obtained and treatments
classified”:

102
Figure 51: alternative DIS 8
The general statistics file is now available for the Expert actor directly from the Software
system, which is now the responsible of the task “deliver statistics file”, and the CR IT actor just
depends upon this task being done to achieve the goal “general statistics delivered”:
Figure 52: alternative DIS 9

103
As for the specific statistics, the Expert actor now interacts directly with the Software system,
which is now the responsible of giving the demanded statistics. All the tasks that were
previously within the CR IT actor boundary are now moved to the Software system, and the CR
IT actor now depends upon it to achieve the goal “specific statistics are delivered”:
Figure 53: alternative DIS 10
Expert To have a publishable report
with CR results
Software system To support automated
functions for the CR
Get specific statistics
Get specific statistics
Specify desired statistics
New statistics are demanded
Deliver specific tumor statistics
Deliver specific comorbidity
statistics
Deliver specific treatment statistics
Deliver specified statistics
Desired statistics
Tumor statistics
Comorbidity statistics
Treatment statistics
Specified statistics
D
D
DD
DD
DD
D
CR IT To manage the software system
Specific statistics delivered
Specific statistics delivered
D
D
Also the CR Statistician actor now interacts with the Software system in order to get the task
“statistical analysis of treatments done”. The interaction between the CR statistician actor and
the Expert actor remains the same, so it is not shown in the figure:

104
Figure 54: alternative DIS 11
CR Statistician
Statisticanalysis of treatments
Software system To support automated
functions for the CR
Statisticanalysis of treatments
Provide treatment data
Make statistical model
Perform statistical analysis
Provide analysis
result
Specified format
DD
To provide data for the report
Treatment dataD
D
Statistical model
D
D
Results delivered
8.5 EVALUATING ALTERNATIVES
The evaluation of alternatives proposed by the PRiM method is based on the use of structural
metrics, that is, metrics defined over the characteristics or properties of the structure of a
modeled software, in this case, an i* model. So a list of properties to be evaluated is defined,
which then are measured for each proposed alternative. Finally, results of the metrics are
compared to choose the most convenient design. Usually tradeoffs need to be made, when
there is no unique design that maximizes the score of all defined metrics (there is no “perfect
solution”).
In order to identify the most suitable metrics for our model, the PRiM method suggest a goal
based approach like the GQM paradigm [38] [39]. As seen in the systematic review, goals are
refined into questions, and then metrics are defined in order to answer those questions. In
that way, it can be measured how the different alternatives can serve to the achievement of
the goals of the organization.
In the Cancer Registry case study, goals defined in the model are analyzed in a top‐down
approach, which is shown in table 9.
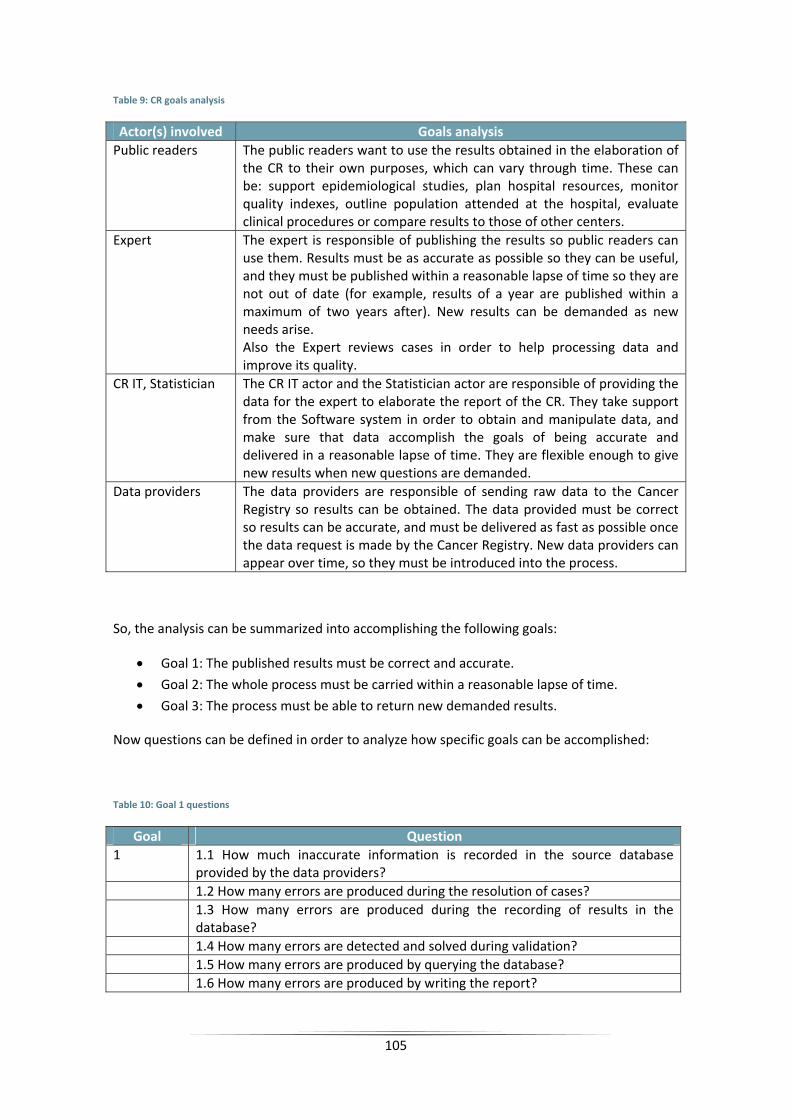
105
Table 9: CR goals analysis
Actor(s) involved Goals analysis
Public readers The public readers want to use the results obtained in the elaboration of the CR to their own purposes, which can vary through time. These can be: support epidemiological studies, plan hospital resources, monitor quality indexes, outline population attended at the hospital, evaluate clinical procedures or compare results to those of other centers.
Expert The expert is responsible of publishing the results so public readers can use them. Results must be as accurate as possible so they can be useful, and they must be published within a reasonable lapse of time so they are not out of date (for example, results of a year are published within a maximum of two years after). New results can be demanded as new needs arise. Also the Expert reviews cases in order to help processing data and improve its quality.
CR IT, Statistician The CR IT actor and the Statistician actor are responsible of providing the data for the expert to elaborate the report of the CR. They take support from the Software system in order to obtain and manipulate data, and make sure that data accomplish the goals of being accurate and delivered in a reasonable lapse of time. They are flexible enough to give new results when new questions are demanded.
Data providers The data providers are responsible of sending raw data to the Cancer Registry so results can be obtained. The data provided must be correct so results can be accurate, and must be delivered as fast as possible once the data request is made by the Cancer Registry. New data providers can appear over time, so they must be introduced into the process.
So, the analysis can be summarized into accomplishing the following goals:
Goal 1: The published results must be correct and accurate.
Goal 2: The whole process must be carried within a reasonable lapse of time.
Goal 3: The process must be able to return new demanded results.
Now questions can be defined in order to analyze how specific goals can be accomplished:
Table 10: Goal 1 questions
Goal Question
1 1.1 How much inaccurate information is recorded in the source database provided by the data providers?
1.2 How many errors are produced during the resolution of cases?
1.3 How many errors are produced during the recording of results in the database?
1.4 How many errors are detected and solved during validation?
1.5 How many errors are produced by querying the database?
1.6 How many errors are produced by writing the report?

106
Table 11: Goal 2 questions
Goal Question
2 2.1 How long do data providers take to send source data?
2.2 How much time is consumed during resolution of cases?
2.3 How much time is consumed during validation of cases?
2.4 How much time is consumed during querying the database?
2.5 How much time is consumed during writing the report?
2.6 How is performance affected if an actor is temporarily unavailable?
Table 12: Goal 3 questions
Goal Question
3 3.1 Which actors can respond to new results demands?
3.2 How much time is needed to answer a new query?
3.3 How is performance affected while a new feature is being implemented?
3.4 Is a new implemented feature affecting accuracy of data?
Finally, metrics can be identified in order to answer the proposed questions:
Q1.1: How much inaccurate information is recorded in the source database provided by the
data providers? This depends on two factors: i) accuracy degree in the source database, and ii)
errors occurring during the trespassing of information from the source database to the Cancer
Registry database. There is nothing the process can do about the first factor, because the
accuracy of the source database is external and not dependent on how the process is
implemented. The second factor depends on how coupled is the Cancer Registry database to
the data source databases, so we can define a “Database coupling” metric to answer this
question.
Metric Description
Database coupling
How many human actors must interact into a transaction between two databases.
Q1.2 How many errors are produced during the resolution of cases? It has been quantified in
[51] that cases solved by the Asedat software (included in the Software system actor) have
fewer errors than those cases solved manually by a human actor. So the “Accuracy” metric is
used to answer this question.
Metric Description
Accuracy Number of errors produced during a task.

107
Q1.3 How many errors are produced during the recording of results in the database? A
comparison of new and older data must be done in order to record the results of the solved
cases into the Cancer Registry database. As such, fewer errors are done if the process is being
automated by a pre‐written query. Again, we can use the “Accuracy” metric defined before.
Q1.4 How many errors are detected and solved during validation? Some errors can be detected
automatically by pre‐written queries based on recommendations by the International Agency
of Research on Cancer (IARC)[52], but some others will need an inspection by the expert to be
detected. Also, the expert is needed to solve all detected errors. We can define the “Recovery”
metric.
Metric Description
Recovery Errors solved during a task.
Q1.5 How many errors are produced by querying the database? Pre‐written queries (the
Software system is querying database to obtain results for the report) are less prone to errors
that those that are executed directly by a human actor. So, the “Database coupling” and
“Accuracy” metrics can be used.
Q1.6 How many errors are produced by writing the report? Text generated automatically by
the software system which includes automatically inserted results has fewer errors than text
written by the Expert actor with manually included results. Again, “Database coupling” and
“Accuracy” metrics can be used.
Q2.1 How long do data providers take to send source data? If an automated process is written
to automatically obtain data in a prefixed date, the source data can be provided earlier than if
it is provided manually by a human actor from the data provider. The new metric “Agility” can
be defined.
Metric Description
Agility Time of response to a data request.
Q2.2 How much time is consumed during resolution of cases? Asedat software is significantly
faster solving cases than a human actor [51]. We can define the “Performance” metric here.
Metric Description
Performance Time consumed to perform a task.

108
Q2.3 How much time is consumed during validation of cases? Prefixed queries are significantly
faster by detecting errors in cases than those detected by a human actor. The resolution of
errors must be done by the expert actor, and the time consumed depends upon the difficulty
of the case, which lead to how much information the expert need to solve the case. This
information can be available as electronic data in a database or in paper. The easiness of
getting this information will affect the time needed to solve cases, being electronic
information easier and faster to obtain if it is well coupled with the Software system, so the
“Database coupling” metric can be used.
Q2.4 How much time is consumed during querying the database? Prefixed queries are faster
than queries written manually by the CR IT actor, because they can be executed in batch, while
manual queries need to be written and executed each time. “Agility” metric can be used.
Q2.5 How much time is consumed during writing the report? Text written automatically by the
Software system adding automated results is significantly faster than text and results written
by the Expert actor. However, some part of the text must be written manually such as the
interpretation of results. “Performance” metric can be used.
Q2.6 How is performance affected if an actor is temporarily unavailable? If the software
system becomes unavailable, the whole process must be interrupted until it is available again,
leading to a significant decrease of performance. Human actors temporarily unavailable can be
replaced by other human actors, or in some cases by the Software system itself, so the
decrease in performance is much less significant. We can define the “Robustness” metric.
Metric Description
Robustness Drop of performance when an actor is temporarily unavailable.
Q3.1 Which actors can respond to new results demands? The CR IT actor can always respond to
a new result demand. The software system is limited to pre‐written queries, or if it has an
implemented feature of flexible querying, it can give new results if some human actor uses this
feature to write a new query. The “Flexibility” metric can be defined.
Metric Description
Flexibility Capacity of an actor to provide new results.
Q3.2 How much time is needed to answer a new query? If the Software system has an
implemented feature of flexible querying, it can give results faster than manually writing the
whole query. Again, “Flexibility” metric can be used here.

109
Q3.3 How is performance affected while a new feature is being implemented? If the Software
system needs to be stopped in order to implement a new feature into it, then performance
can be significantly affected. New manual work for the human actors affect the performance
by taking time that could be used in other duties. “Robustness” metric can be used.
Q3.4 Is a new implemented feature affecting accuracy of data? Implementing a new feature
into the Software system can lead to errors in other parts of the process, which reduce data
accuracy. Changes in the work of a human actor are less prone to arise new errors. We can
define the “Maintainability” metric.
Metric Description
Maintainability How much data accuracy is lowered while implementing new features into the process.
The PRiM methodology defines a guidelines for the definition of structural metrics over i*
models, in order to validate and document them. Metrics are divided into actor‐based and
dependency‐based metrics.
Actor‐based metrics are evaluated with the following form:
∑ ∶ ∈ :
Where P is a given property, M is an i* model and A the actors of the model. Filter is a
discriminator over the type of the actor, and correctionFactor is a discriminator over the
dependencies of that actor.
Dependency‐based metrics are evaluated with the following form:
∑ , , ∈ : ,
‖ ‖
Now filter assigns a weight to every dependum, and correctionFactor corrects the weight
according to the type of the actors of the dependency.
Metrics defined for the Cancer Registry case study are evaluated following the distinction
specified on Table 13.

110
Table 13: CR metrics type
Metric Type
Database coupling Dependency‐based
Accuracy Dependency‐based
Recovery Actor‐based
Agility Dependency‐based
Performance Dependency‐based
Robustness Actor‐based
Flexibility Actor‐based
Maintainability Actor‐based
For the evaluation of metrics, values must be assigned to filters and correction factors. These
values represent the difference between different types of actors, and different types of tasks,
and how they affect to the property of the process that the metric is measuring. Although the
chosen values are a bit arbitrary, they are assigned based on the experience of the different
stakeholders involved into the process. Also, accuracy and performance of the Asedat software
and the human actor discussed in [51] are taken into account.
The “Database coupling” metric measures how two databases are integrated, that is, if any
human actor must interact with them in order to share data and in which degree. The less
human actor that databases depends upon, the more coupled they are.
Metric Database coupling
Filter(u) ‐‐
correctionFactor(a) 1 (a is always a database)
correctionFactor(b) 1 if b is a database 0,5 if b is the CR IT actor 0,2 if b is other human actor
Limit(M) ||D||
The “Accuracy” metric measures how many errors are produced during the performance of a
task, so it depends on which actor carries the task and the type of task.
Metric Accuracy
Filter(u) 0,7 if the task is triggering a query 0,5 if the task is elaboration of results 0,2 if the task involves processing a massive quantity of data
correctionFactor(a) ‐‐
correctionFactor(b) 0,9 if b is the Software system actor 0,5 if b is a human actor
Limit(M) ||D||

111
The “Recovery” metric measures how errors are recovered after reviewing of data. A human
actor is to recover a greater quantity of data than predefined validations performed by the
Software system.
Metric Recovery
Filter(a) 0,8 if a is the Expert actor 0,5 if a is the Software system actor
correctionFactor(a) ‐‐
Limit(a) ||A||
The “Agility” metric measures how responsive are the data providers. If the Software system
actor can obtain data directly in an automated way, the agility will be greater.
Metric Agility
Filter(u) 1 for data resources 0,8 for other resources
correctionFactor(a) 1 (a is the data provider)
correctionFactor(b) 0,9 if b is the Software system actor 0,4 if b is a human actor
Limit(M) ||D||
The “Performance” metric measures how much time is consumed during the realization of a
task, so it depends upon the type of actor who performs it, and the type of the task. As for
now, only “Resolution of cases” type of task is defined.
Metric Performance
Filter(u) 1 if the task is resolution of cases
correctionFactor(a) ‐‐
correctionFactor(b) 1 if b is the Software system actor 0,1 if b is a human actor
Limit(M) ||D||
The “Robustness” metric measures the drop of performance when an actor is temporarily
unavailable, so it depends upon the type of the actor, being less dependent upon human actor
than upon the Software system actor.
Metric Robustness
Filter(a) 0,8 if a is a human actor 0,5 if a is the Software system actor
correctionFactor(a) 0,8 for each dependency with a human actor 0,5 for each dependency with the Software system actor
Limit(a) ||D||

112
The “Flexibility” metric measures how quick a new result can be given, and it depends upon
the type of actor obtaining that result. Also, the Software system actor is more flexible if it has
implemented some sort of querying system
Metric Flexibility
Filter(a) 0,9 if a is a human actor 0,5 if a is the Software system actor
correctionFactor(a) 0,8 if a querying system is implemented 0,3 otherwise
Limit(a) ||A||
Finally, the “Maintainability” metric measures how changes or implementation of new
features can introduce errors in other parts of the process. It depends upon the type of actor,
being the Software system actor more sensible to changes. Also, the more dependencies an
actor has, the probability of new errors is higher.
Metric Maintainability
Filter(a) 0,9 if a is a human actor 0,7 if a is the Software system actor
correctionFactor(a) 0,8 for each dependency of a
Limit(a) ||D||
Metrics now can be measured for the “as‐is” model and the design alternative, and then
models can be compared to see which one better suits the organization goals. For the case
study, each metric is measured for each individual DIS, and then summed together (Table 14)
Table 14: structural metrics model comparison
Structural Metric Involved DIS As‐is model Design alternative
Database coupling 1 and 5 0,5 0,8
Accuracy 1 to 11 0,33 0,46
Recovery 4 0,8 0,8
Agility 1 and 5 0,4 0,9
Performance 3 0,1 0,1
Robustness 1 to 11 0,5 0,37
Flexibility 9 to 11 0,83 0,35
Maintainability 1 to 11 0,66 0,61
Overall score 4,12 4,39
The design alternative focuses on reallocating responsibilities to the Software system actor,
thus this model scores better on properties that benefit automated parts of the process, such
as database coupling, accuracy and agility. On the other hand, the “as‐is” model scores better
on properties that benefit human actors, as robustness, flexibility and maintainability.

113
Recovery and performance are not affected by the proposed design alternative, as it has the
same score as the “as‐is” model, but could change if other design alternatives were proposed,
for example if a flexible querying automated system were introduced, then flexibility would
increase in the design alternative.
As with these type of redesigns, some trade‐offs must be assumed, as usually there is no single
solution that has the best score on every measured property. The overall score can be used as
a guide to decision‐making, but also the organization goals and the goals of the BPR must be
taken into account. In the case study, the design alternative model scores better on desired
key points of the redesign, accuracy and agility, and equals the performance score. As it also
has a better overall score, it seems that the implementation on the model is justified, but at
the cost of losing flexibility, that could be somehow corrected if another design alternative is
proposed which includes a flexible querying system for the Software system actor.
On the systematic review we have seen a series of articles discussing the application of
simulation to evaluate some alternative designs. They are based on the observation of some
properties through time, and then use this data to simulate the behavior of different models of
the process. On the next chapter, the use of simulation is discussed to see its possible benefits
on evaluating i* models and the possibility of its use in the PRiM method.

114
9. STUDY OF VIABILITY OF SIMULATION FOR EVALUATING I* MODELS
As presented in the previous section, the PRiM methodology uses structural metrics to
evaluate the current “as‐is” model and the proposed “to‐be” design alternatives. The metrics
definition must include filters and correction factors that adjust the metrics in function of the
elements that are present in the model (types of actors, types of tasks, etc.). The assignment
of these values in the Cancer Registry case study has been made based upon the experience
based heuristics of the different stakeholders involved in the process, which can be a weak
point because they are somehow a bit arbitrary.
In the systematic review presented in the first part of this master thesis, a series of papers deal
with simulation as a tool for evaluating different models of a process. Simulation has the
advantage that it uses real collected data as “training data” to measure different properties of
the models. The counterpart is that a data collection must be carried in order to be able to
have this training data before the model can be evaluated.
In this section, a brief exploration is made on the use of simulation adapted to the Cancer
Registry case study, and the possibility of complementing the PRiM method with simulation.
An actual simulation is not performed for the case study, as it is time demanding and is out of
the scope of this master thesis.
9.1 THE SIMULATION PROCESS
Simulation is a tool that allows the study of the behavior of a process before it has been
implemented. By creating a simulation model, a process can be evaluated and its response can
be studied in case that some characteristics of the model are modified to adapt better to the
goals of the organization. In that way, the different proposed “to‐be” models can be easily
compared between them and with the “as‐is” model.
The simulation process consists of different stages:
Definition of the system model.
Data collection.
Simulation implementation.
Validation.
Experimentation and interpretation of results.

115
9.1.1 DEFINITION OF THE SYSTEM MODEL
The objective of the simulation during a reengineering process is to study the response of
selected variables on a specified system by giving a statistical estimate of the values of these
variables. This can lead to validate if a determined design of the process is correct and works
as expected even before the system is implemented. A simulation model is constructed, and is
used to obtain the estimation of the values of the selected variables into different conditions.
There are several ways to construct a model that can be simulated, depending on the type of
the system which needs to be examined. This can include i* models and several others.
9.1.2 DATA COLLECTION
In order to simulate the behavior of a given variable, some initial data is needed. This is called
“training data”, and gives the simulation process a starting point to work. So, a previous step is
to collect information in order to establish the training data set. Data collection can be done in
different ways:
Sampling data: Training data can be obtained by sampling actual data from the
currently implemented system. For example, in the Cancer Registry case study, values
for the performance metric can be obtained by examining a sample of the cases solved
both by a human actor and the Software system actor, and then registering the time
taken to solve the cases by both types of actors. Also, the number of errors produced
by both can be stated to take values for the accuracy metric.
Implementing a prototype of the system: sometimes values for a specified metric can
be obtained in the currently implemented system, for example, values for the
performance of a software actor cannot be obtained if the software system has not
been implemented. Then, a solution is to implement a prototype, that gives some sort
of approximation to the values that would be obtained in a real implemented system.
These values are then used as training data for evaluating the metrics.
Training data must consists in a series of different collected data sets. Ideally, each data set
must be collected under different circumstances, so the simulation model can cover the
maximum number of possibilities. For example, in the Cancer Registry case study, if we are
collecting information about the percentage of errors that a human actor makes when solving
cases, we have to take a series of N samples (data sets) of a human actor reviewing M cases.
Each sample must be collected under different situations, for example, examining different
people reviewing cases (because the error percentage can vary from a person to another), or
examining the same person at different times (his own error percentage can vary from one day
to another, or one group of cases can be more difficult to solve than others). If data is
collected from a prototype of the system, then the prototype must be constructed trying to
cover the maximum number of different possible scenarios, for example:

116
Changes in the review cases methodology: for example new classification codes are
added for newly classified diseases.
Changes in the implementation of the software system: for example new rules are
added in the “Asedat” algorithm.
9.1.3 SIMULATION IMPLEMENTATION
Simulation can be performed with a specific software, like WinBugs [56], or a general purpose
statistical software, like R [57]. The simulator uses the given training data to construct a
statistical model that then is used for simulating the response of a random variable (that is, the
metric that is to be evaluated). In general, if the metric is considered continuous we will make
use of different simulation scenarios depending on the domain of the random variable [58].
For example, if we have a continuous variable, due to its shape and scale we will assess if it
could be simulated through a Beta distribution if it takes random values between 0 and 1.
Otherwise, it could be simulated through other unimodal random variables such as
exponential, uniform or Gaussian. In this line, the parameters of the distribution to be
simulated for each random variable will be estimated through the frequency of the obtained
values in the training data. For example, figure 55 shows an example where the measured
error in solving cases is obtained into the interval [0,29 .. 0,32], the obtained values follow a
beta distribution into this interval and it is centered on the average value of the measured
error.
Figure 55: Beta distribution example

117
The software uses the model to simulate a certain number of random values for each of the
selected variables. The number of iterations needed can vary, but it should be high enough to
be statistically significant and low enough to be computationally feasible. All the values
registered for a metric follow a distribution that can be used to estimate the value of the
metric and give a confidence interval.
9.1.4 VALIDATION
The data obtained after the simulation needs to be validated. This assures that the obtained
values are correctly predicting what values the variables will take in the real world. This can be
done with several methods:
Validation by experts, which review the obtained values and qualify them based on
their experience.
By comparing the obtained values with the ones obtained by examining historic data,
usually the information collected for the training data.
By examining how well obtained results predicts future data. This needs to be done
either by comparing them with data obtained from a real world system or a prototype.
9.1.5 EXPERIMENTATION AND INTERPRETATION OF RESULTS
Experimentation consists in generating the desired results, which are estimations of the values
that the defined metrics will take once the system is working in the real world. Based on these
results, the organization can take decisions of which is the more convenient redesign of the
system based on the goals that needs to be fulfilled.
9.2 VALIDATION OF I* MODELS WITH SIMULATION
As seen in the previous section, simulation can be used to predict the values of a series of
selected variables from a specified model. In the case of i* models, simulation can be used to
evaluate the different models (the “as‐is” model) and the design alternatives (the “to‐be”
model). In this case, the evaluated variables are the metrics that are defined with the PRiM
method. As these variables are defined taking into account the goals of organization (for
example, using the GQM method), then simulation can reveal how the different models can
accomplish these goals.
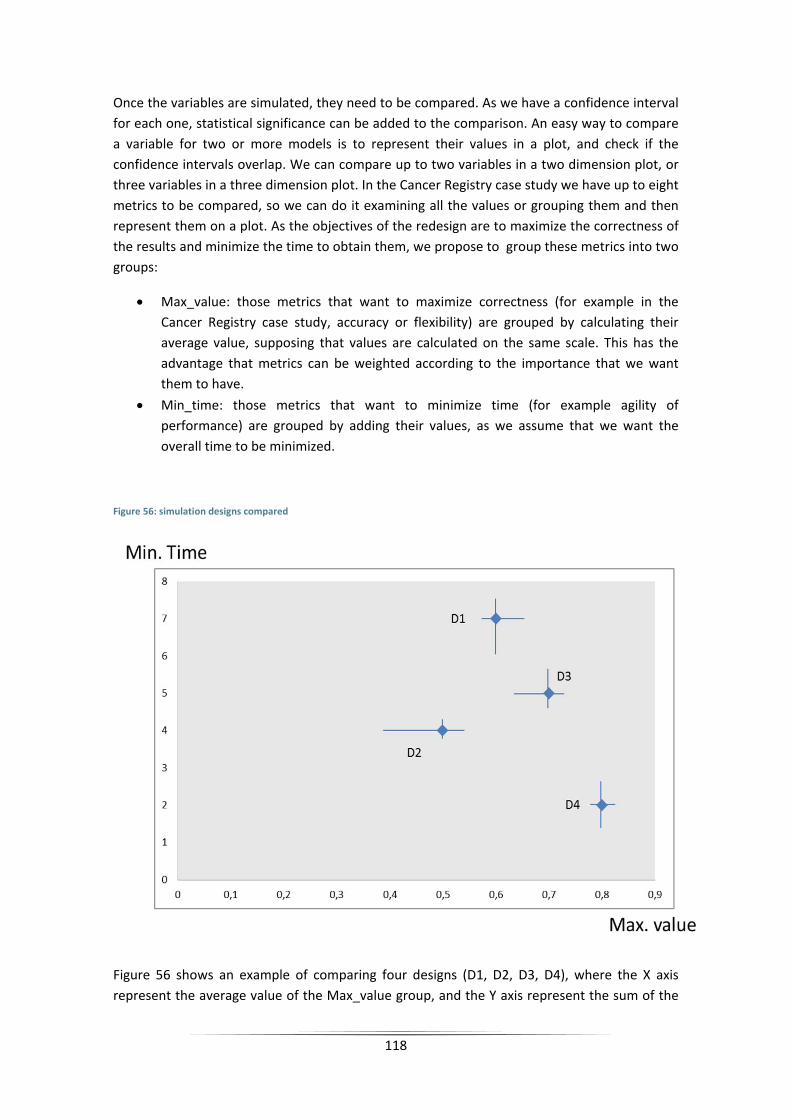
118
Once the variables are simulated, they need to be compared. As we have a confidence interval
for each one, statistical significance can be added to the comparison. An easy way to compare
a variable for two or more models is to represent their values in a plot, and check if the
confidence intervals overlap. We can compare up to two variables in a two dimension plot, or
three variables in a three dimension plot. In the Cancer Registry case study we have up to eight
metrics to be compared, so we can do it examining all the values or grouping them and then
represent them on a plot. As the objectives of the redesign are to maximize the correctness of
the results and minimize the time to obtain them, we propose to group these metrics into two
groups:
Max_value: those metrics that want to maximize correctness (for example in the
Cancer Registry case study, accuracy or flexibility) are grouped by calculating their
average value, supposing that values are calculated on the same scale. This has the
advantage that metrics can be weighted according to the importance that we want
them to have.
Min_time: those metrics that want to minimize time (for example agility of
performance) are grouped by adding their values, as we assume that we want the
overall time to be minimized.
Figure 56: simulation designs compared
Figure 56 shows an example of comparing four designs (D1, D2, D3, D4), where the X axis
represent the average value of the Max_value group, and the Y axis represent the sum of the
119
Min_time group. For each design, the confidence interval is calculated for the value of each
group. In order to choose the best design, this graphic can help to choose the alternative that
has a better balance between Max_value and Min_time. In some cases there would be a clear
winner, but usually trades‐off must be made, because there would be some design that has
better Max_value while other has better Min_time.
In the example, D4 has better Max_value and better Min_time, so it would be the chosen
design. If we would like to compare D2 with D3, D2 has better Min_time, but D3 has better
Max_value, so a trade‐off would be needed. Note that sometimes, the confidence intervals
would overlap, as in the case of Max_value of D1 and D3, so although D3 has a better value, it
is not statistically significant.
The metrics defined in the previous section for the Cancer Registry case study can be
simulated to obtain estimates of their values, and then grouped for comparing them on a plot.
Those metrics are:
Database coupling: its value needs to be maximized, the more coupled the databases
are, it will produce fewer errors.
Accuracy: its value needs to be maximized, to produce fewer errors.
Recovery: its value needs to be maximized, as recovering from detected errors will
produce less errors at the end.
Agility: it is a time value, so it needs to be minimized.
Performance: as agility, it is a time value which needs to be minimized.
Robustness: also it is a time value, because it can be calculated as a drop of
performance, so it needs to be minimized.
Flexibility: we can see its value as a time value that indicates how fast new results can
be obtained, so it needs to be minimized.
Maintainability: its value needs to be maximized, as less errors will be produced when
modifying the system.
As seen, database coupling, accuracy, recovery and maintainability can be grouped by
calculating their average value, that need to be maximized by the model. On the other hand,
agility, performance, robustness and flexibility, being time values, can be grouped by a sum of
their values, that needs to be minimized by the model.
Training data can be easily obtained in the “as‐is” model by sampling, because the system is
already implemented, but for the “to‐be” model, a prototype needs to be developed. With
training data coming from both models, then simulation would be carried. The results would
be represented as in Figure 56, and the best model could be selected.

120
9.3 COMPARISON WITH STRUCTURAL METRICS
As seen in the previous chapters, the way that the PRiM method defines the structural metrics
can need in some cases that arbitrary values are assigned to filters and correction factors. That
is solved using simulation, with the use of data collection either form the real process or from
a prototype. On the downside, this data collection can be difficult in certain process, either
because data sampling is not possible, or because the cost of the implementation of a
prototype is beyond the budget of the reengineering process.
Adding a simulation step into the PRiM method can improve the way that the different design
alternatives are evaluated, especially in projects where metrics were defined using arbitrary
values for filters and correction factors based exclusively on user experience, as in the Cancer
Registry case study. Data collection means that the obtained results are obtained based on the
behavior of the system in the real world. Additionally, when two alternatives seems to be
equally good designs, the use of confidence intervals in the results obtained by simulation can
add a statistical significance to observed differences.
In the Cancer Registry case study, two grouping of metrics are proposed, which can be then
easily compared graphically. But other groupings can be done for different systems, depending
on the goals of the organization and the objectives of the simulation study, so the design can
be tweaked. Thus simulation is an easy way to experiment with different configurations, while
structural metrics always need to be recalculated when the design is changed.
As a future work, further studies can be performed for integrating simulation into the PRiM
method, as well as implementations of simulation in real world case studies such as the Cancer
Registry. By testing different cases, simulation results could be compared with results obtained
by structural metrics and correlation could be studied.

121
10. CONCLUSIONS AND FUTURE WORK
In the first part of this Master Thesis, a systematic review was carried of previously published
works on metrics in business process reengineering. The reviewed articles were divided into
four groups:
Works that propose domain specific metrics, limited to solve a specific problem.
Works that propose general domain metrics, that can be used in a wide number of
problems.
Works that propose a methodology for creating the metrics that best adapt to an
specific problem that needs to be solve. Into this group, a particular methodology is
studied called GQM, which focuses on the goals of the organization as the base to
define metrics.
Works that propose the use of simulation to evaluate processes.
The main conclusion of the systematic review is that the use of methodologies to define
metrics for evaluating processes redesigns is recommended, as they are the most flexible tool
and can be easily adapted to evaluate and select the most appropriate design for a given
problem, in particular by taking into account the goals of the organization.
In the second part, the Cancer Registry case study is presented to test the results found in the
systematic review. Articles that present a methodology were evaluated, and the PRiM method
proposed by Grau et al was selected as the most appropriate for the case study. The Cancer
Registry processes were modeled using the i* framework, and a redesign was presented based
on the goals of the organization. PRiM methodology and GQM were applied to define metrics
that were used to evaluate the “as‐is” model and the “to‐be” model, and differences were
found. A trade‐off was needed as the new design optimizes some desired properties while the
“as‐is” model was better in others.
An issue while defining metrics for the case study, was that the values for correction factors
and filters were assigned based on user experience and were a bit arbitrary. So simulation was
studied as an alternative for evaluating models, as it is based on collected data either from
sampling or from a prototype. The simulation process was presented, and a method for
comparing different designs was proposed by grouping metrics and giving confidence intervals
for their values. The simulation process complements structural metrics, as the values
obtained for metrics are based on collected data. Also, confidence intervals allows to obtain
the statistical significance for the calculated values.
A future line of work represents the integration of the simulation process into the PRiM
methodology. This could expand the possibilities and flexibility of PRiM, because simulation
would complement structural metrics and give results that are based into real world collected
data. Also a simulation tool can be implemented into J‐PRiM, the toolkit that was implemented
to support the methodology.

122
Simulation can be applied into the Cancer Registry case study. Data can be collected from the
“as‐is” model into several ways, including measures of performance and error percentage both
from human actors and software. Also, a prototype can be constructed where the Software
system assumes more responsibilities, and simulation can be performed to study which areas
are improved and how flexibility of the system is affected. Finally, if the results recommend
conducting the reengineering of the system, a project for implementing the new design could
be started.

123
GLOSSARY
ARENA: A simulation software.
As‐is model: the process which is currently implemented in the organization.
Asedat: A software developed by Catalan Institute of Oncology which automates a series of
tasks performed in a Cancer Registry.
Cancer Registry: A database that registers all the cases of cancer detected in a hospital or a
specific population. In the case study, it registers the cases of the Catalan Institute of
Oncology.
Catalan Institute of Oncology: an hospital based institution which treats cancer patients and
perform research on cancer.
Comorbidity: Any disease that happens at the same time with the diagnosis of cancer in the
study period.
Data provider: a human actor, an entity or a software responsible for providing information for
the Cancer Registry.
Expert actor: a human actor with medical or documental background, responsible for review of
cases and report generation in the Cancer Registry.
Goal‐Question‐Metric: a methodology that defines metrics based on questions that arise by
analyzing the goals of an organization.
Hospital Discharge Records: All the information of diagnoses and procedures performed during
a patient stance at the hospital.
I*: a framework for modeling business processes.
International Agency for Research on Cancer (IARC): An international organization that
provides guides and recommendations for Cancer Registries.
IT actor: a human actor with IT background, responsible of the Cancer Registry software and
databases.
Lymphomas Registry: A database that registers the hematological cancers diagnosed and/or
treated at a hospital.
Pathology Records: Information of diagnoses made at the Pathology laboratory to biological
samples.
PRiM: a methodology for process reengineering based on i* models.
R: A statistical software with simulation capabilities.
SAP: A business management software, used in the hospital to manage all the information
regarding to patients.

124
Software system actor: An actor representing the implementation of a software system with
different tasks and responsibilities in the Cancer Registry.
To‐be model: the model of the alternative redesign of the process, which is not still
implemented.
Training data: data collected from an implemented system or a prototype that is used to build
a simulation model.
WebService: an automated script that provides services or data for a web‐based application.
WinBugs: A simulation software.

125
ABREVIATURES
BPMN: Business Process Modeling Notation.
BPR: Business Process Reengineering.
CMM: Capability Maturity Model.
CFC: Control Flow Complexity.
CR: Cancer Registry.
DIS: Detailed Interaction Script.
GQM: Goal Question Metric.
HAM: Human Activity Model.
IARC: International Agency for Research on Cancer.
ICO: Catalan Institute of Oncology.
IT: Information Technology.
KPA: Key Process Area.
KPI: Key Performance Indicator.
MCC: McCabe’s Cyclomatic number.
M‐CMM: Measurement Capability Maturity Model.
MDM: Multiple Domain Matrix.
OA: Observational Analysis.
OCL: Object Constraint Language.
OD: Organization Development.
OO: Object Oriented.
PRiM: Process Reengineering i* method.
ROA: Return On Asset.
ROE: Return On Equity.
SD: Strategic Dependency model.
SR: Strategic Rationale model.
UML: Unified Modeling Language.

126
REFERENCES
[1] “Business Process Reengineering Assessment Guide,” United States General Account Office, no. May 1997.
[2] “Catalan Institute of Oncology Hospitalary Tumor Registry.” [Online]. Available: http://rht.iconcologia.net.
[3] G. Grau, “An i * ‐based Reengineering Framework for Requirements Engineering,” UPC, 2008.
[4] B. Kitchenham, “Procedures for Performing Systematic Reviews,” NICTA Technical Report, no. 0400011T.1, 2004.
[5] C. Palomares, “Master in Computing Master of Science Thesis INCLUDING FUNCTIONAL AND NON ‐ TECHNICAL REQUIREMENTS IN A SOFTWARE REQUIREMENT PATTERNS.”
[6] “IEEE Xplore.” [Online]. Available: http://ieeexplore.ieee.org/Xplore/guesthome.jsp.
[7] “ACM.” [Online]. Available: http://dl.acm.org/.
[8] “Springer.” [Online]. Available: http://www.springerlink.com/?MUD=MP.
[9] “Science Direct.” [Online]. Available: http://www.sciencedirect.com/.
[10] “Mendeley free reference manager and PDF organizer.” [Online]. Available: www.mendely.com.
[11] A. T. Yaung, “Linkage Metrics for Process Reengineerin g,” 1993.
[12] K. Altinkemer, a Chaturvedi, and S. Kondareddy, “Business Process Reengineering and Organizational Performance: An Exploration of Issues,” International Journal of Information Management, vol. 18, no. 6, pp. 381–392, Dec. 1998.
[13] B. M. Arteta and R. E. Giachetti, “A measure of agility as the complexity of the enterprise system,” Robotics and Computer‐Integrated Manufacturing, vol. 20, no. 6, pp. 495–503, Dec. 2004.
[14] S. Balasubramanian and M. Gupta, “Structural metrics for goal based business process design and evaluation,” Business Process Management Journal, vol. 11, no. 6, pp. 680–694, 2005.
[15] M. Kreimeyer, M. Gürtler, and U. Lindemann, “Structural Metrics for Decision Points Within Multiple‐Domain Matrices Representing Design Processes,” in Proceedings of the 2008 IEEE IEEM, 2008, pp. 435–439.
[16] M. Maurer, “Structural Awareness in Complex Product Design,” 2007.

127
[17] Y. Ozcelik, “Do business process reengineering projects payoff? Evidence from the United States,” International Journal of Project Management, vol. 28, no. 1, pp. 7–13, Jan. 2010.
[18] C. Y. Lam, W. H. Ip, and C. W. Lau, “A business process activity model and performance measurement using a time series ARIMA intervention analysis,” Expert Systems with Applications, vol. 36, no. 3, pp. 6986–6994, Apr. 2009.
[19] M.‐Y. Cheng, H.‐C. Tsai, and Y.‐Y. Lai, “Construction management process reengineering performance measurements,” Automation in Construction, vol. 18, no. 2, pp. 183–193, Mar. 2009.
[20] F. Brito e Abreu, R. D. B. V. da Porciuncula, J. M. Freitas, and J. C. Costa, “Definition and Validation of Metrics for ITSM Process Models,” 2010 Seventh International Conference on the Quality of Information and Communications Technology, pp. 79–88, Sep. 2010.
[21] Z. Altinkemer, K; Ozcelik, Y; Ozdemir, “Productivity and Performance Effects of Business Process Reengineering : A Firm‐Level Analysis,” no. September, 2010.
[22] T. Pidun, J. Buder, and C. Felden, “Optimizing Process Performance Visibility through Additional Descriptive Features in Performance Measurement,” 2011 IEEE 15th International Enterprise Distributed Object Computing Conference Workshops, pp. 204–212, Aug. 2011.
[23] E. E. Mills, “Metrics in the software engineering curriculum,” Annals of Software Engineering, vol. 6, pp. 181–200, 1998.
[24] M. C. Paulk, C. V Weber, and M. B. Chrissis, “Capability Maturity Model for Software,” 1993.
[25] R. . Mohanty and S. . Deshmukh, “Reengineering of materials management system: A case study,” International Journal of Production Economics, vol. 70, no. 3, pp. 267–278, Apr. 2001.
[26] M. R. R. Khan, “Business process reengineering of an air cargo handling process,” International Journal of Production Economics, vol. 63, no. 1, pp. 99–108, Jan. 2000.
[27] R. Marinescu, “Detecting Design Flaws via Metrics in Object‐Oriented Systems A Metrics‐Based Approach for Problem Detection,” Proceedings of the 39th International Conference and Exhibition on Technology of Object‐Oriented Languages and Systems (TOOLS39), pp. 173–182, 2001.
[28] F. Niessink, H. Van Vliet, and D. Boelelaan, “Towards Mature Measurement Programs,” 1995.
[29] P. Kueng and P. Kawalek, “Goal‐based business process models: creation and evaluation,” Business Process Management Journal, vol. 3, no. 1, pp. 17–38, 1997.
[30] M. E. Nissen, “Redesigning Reengineering through Measurement‐Driven Inference,” MIS Quarterly, vol. 22, no. 4, p. 509, Dec. 1998.

128
[31] J. Brown, J S; Burton, R R; de Kleer, “Pedagogical, Natural Language and Knowledge Engineering Techniques in SHOPIE I, II and III,” Intelligent Tutoring Systems, 1982.
[32] E. H. Shortlife, Computer‐based Medical Consultations: MYCIN. Elsevier, 1978.
[33] S. Goel and V. Chen, “Integrating the global enterprise using Six Sigma: Business process reengineering at General Electric Wind Energy,” International Journal of Production Economics, vol. 113, no. 2, pp. 914–927, Jun. 2008.
[34] R. Mikel, H; Schroeder, Six Sigma ‐ The breakthrough management strategy revolutionizing the world’s top corporations. New York: Doubleday, 2000.
[35] G. Grau, X. Franch, and N. a. M. Maiden, “PRiM: An i∗‐based process reengineering method for information systems specification,” Information and Software Technology, vol. 50, no. 1–2, pp. 76–100, Jan. 2008.
[36] E. Yu, “Modelling Strategic Relationships for Process Reengineering, PhD. thesis,” Toronto, 1995.
[37] X. Franch and G. Grau, “Towards a Catalogue of Patterns for Defining Metrics over i * Models,” CAiSE 2008, LNCS 5074, pp. 197–212, 2008.
[38] D. M. Basili, V R; Weiss, “A Methodology for Collecting Valid Software Engineering Data,” IEEE Transactions on Software Engineering, vol. 10, no. 6, pp. 728–738, 1984.
[39] H. D. Basili, V R; Caldiera, C; Rombach, “Goal Question Metric Paradigm,” Encyclopedia of Software Engineering, vol. 1, pp. 469–476, 1994.
[40] L. Aversano, R. Esposito, T. Mallardo, and M. Tortorella, “Supporting decisions on the adoption of re‐engineering technologies,” Eighth European Conference on Software Maintenance and Reengineering, 2004. CSMR 2004. Proceedings., pp. 95–104, 2004.
[41] L. Aversano, T. Bodhuin, G. Canfora, and M. Tortorella, “Technology‐driven business evolution,” Journal of Systems and Software, vol. 79, no. 3, pp. 314–338, Mar. 2006.
[42] C. S. Ramos, M. Oliveira, and N. Anquetil, “Legacy Software Evaluation Model for Outsourced Maintainer,” Proceedings of teh Eighth European Conference on Software Maintenance and Reengineering (CSMR), 2004.
[43] A. Oinas, “Defining Goal‐driven Fault Management Metrics in a Real World Environment : A Case‐Study from Nokia Arto Oinas,” 2000.
[44] P. T. W. Levas, A; Boyd, S; Jain, “PANEL DISCUSSION ON THE ROLE OF MODELING PROCESS AND SIMULATION IN BUSINESS,” Proceedings of the 1995 Winter Simulation Conference, 1995.
[45] P. J. MacArthur, R. L. Crosslin, and J. R. Warren, “A strategy for evaluating alternative information system designs for business process reengineering,” International Journal of Information Management, vol. 14, no. 4, pp. 237–251, Aug. 1994.

129
[46] A. Swami, “Building the Business Using Process Simulation,” Proceedings of the 1995 Winter Simulation Conference, 1995.
[47] T. a. Aldowaisan and L. K. Gaafar, “Business process reengineering: an approach for process mapping,” Omega, vol. 27, no. 5, pp. 515–524, Oct. 1999.
[48] A. Greasley, “Effective uses of Business Process Simulation,” Proceedings of the 2000 Winter Simulation Conference, pp. 2004–2009, 2004.
[49] C. D. Pedgen, Introduction to Simulation Using SIMAN. Singapore: McGraw‐Hill, 1995.
[50] L. Silva and P. M. Vilarinho, “Using Simulation for Manufacturing Process Reengineering ‐ A Practical Case Study,” Proceedings of the 2000 Winter Simulation Conference, no. iii, pp. 1322–1328, 2000.
[51] J. Ribes, J. Gálvez, À. Melià, R. Clèries, X. Messeguer, and F. Xavier Bosch, “Automatización de un registro hospitalario de tumores,” Gaceta Sanitaria, vol. 19, no. 3, pp. 221–228, Jun. 2005.
[52] J. Ferlay, C. Burkhard, S. Whelan, and D. M. Parkin, “Check and Conversion Programs for Cancer,” IARC Technical Report, no. 42, 2005.
[53] M. Charlson, P. Pompei, K. Ales, and R. MacKenzie, “A new method of classifying prognostic comorbidity in longitudinal studies: Development and validation,” Journal of Chronic Diseases, vol. 40, no. 5, pp. 373–383, 1987.
[54] J. Librero, S. Peiró, and R. Ordiñana, “Chronic comorbidity and outcomes of hospital care: length of stay, mortality, and readmission at 30 and 365 days.,” Journal of clinical epidemiology, vol. 52, no. 3, pp. 171–9, Mar. 1999.
[55] K. Decreus, M. Snoeck, and G. Poels, “Practical Challenges for Methods Transforming i* Goal Models into Business Process Models,” 2009 17th IEEE International Requirements Engineering Conference, pp. 15–23, Aug. 2009.
[56] “The BUGS Project ‐ WinBUGS.” [Online]. Available: http://www.mrc‐bsu.cam.ac.uk/bugs/winbugs/contents.shtml.
[57] “The R Project for Statistical Computing.” [Online]. Available: http://www.r‐project.org/.
[58] A. Alfons, M. Templ, and P. Filzmoser, “An Object‐Oriented Framework for Statistical Simulation : The R Package simFrame,” Journal of statistical software, vol. 37, no. 3.