OF MAGNETIC MEASUREMENTS & MODELING -...
132
Polish Society of Theoretical and Applied Electrical Engineering Częstochowa Branch XII SYMPOSIUM OF MAGNETIC MEASUREMENTS & MODELING Częstochowa – Siewierz, 17 th – 19 th October 2016 in memory of Professor Kazimierz Zakrzewski (1938 – 2016) ABSTRACTS Under the auspices of Polish Academy of Science Committee of Electrical Engineering Professor Krzysztof Kluszczyński President of Polish Society of Theoretical and Applied Electrical Engineering (PTETiS) Organized in the jubilee year of 55th anniversary of Polish Society of Theoretical and Applied Electrical Engineering 15th anniversary of Polish Society of Theoretical and Applied Electrical Engineering, Częstochowa Branch 50th anniversary of Faculty of Electrical Engineering Częstochowa University of Technology
Transcript of OF MAGNETIC MEASUREMENTS & MODELING -...

- 1 -
Polish Society of Theoretical and Applied Electrical Engineering
Częstochowa Branch
XII SYMPOSIUM
OF MAGNETIC MEASUREMENTS & MODELING
Częstochowa – Siewierz, 17th – 19th October 2016
in memory of Professor Kazimierz Zakrzewski (1938 – 2016)
ABSTRACTS
Under the auspices of
Polish Academy of Science Committee of Electrical Engineering
Professor Krzysztof Kluszczyński President of Polish Society of Theoretical and Applied
Electrical Engineering (PTETiS)
Organized in the jubilee year of
55th anniversary of Polish Society of Theoretical and Applied
Electrical Engineering
15th anniversary of Polish Society of Theoretical and Applied Electrical
Engineering, Częstochowa Branch
50th anniversary of Faculty of Electrical Engineering
Częstochowa University of Technology

- 2 -
XII SYMPOSIUM OF MAGNETIC MEASUREMENTS & MODELING
Częstochowa – Siewierz, 17th – 19th October 2016
ORGANIZED BY:
Polish Society of Theoretical and Applied Electrical
Engineering, Częstochowa Branch
Częstochowa University of Technology
Faculty of Electrical Engineering
Tele & Radio Research Institute, Warsaw
Ariel University, Ariel, Israel
Institute of Materials Science
University of Silesia in Katowice
Stalprodukt S.A., Bochnia
Electrotechnical Institute, Warsaw

- 3 -
XII SYMPOSIUM OF MAGNETIC MEASUREMENTS & MODELING
Częstochowa – Siewierz, 17th – 19th October 2016
SCIENTIFIC COMITTEE
Chairman:
Kazimierz Zakrzewski Łódź University of Technology, Poland
Honorary Chairman:
Jacek R. Przygodzki Retired Professor of Warsaw University of Technology,
Warsaw, Poland
Members:
Jerzy Bajorek Wrocław University of Technology, Poland
Lech Borowik Częstochowa University of Technology, Poland
Adam Bieńkowski Warsaw University of Technology, Poland
Marcos F. de Campos Fluminense Federal University, Brazil
Krzysztof Chwastek Częstochowa University of Technology, Poland
Andrzej Demenko Poznań University of Technology, Poland
Józef Gromek Tele & Radio Research Institute, Poland
Octavio Guzman Universidad Nacional de Colombia, Colombia
Grzegorz Haneczok University of Silesia, Poland
Robert G. Harrison Carleton University, Canada
Andrzej Kapłon Kielce University of Technology, Poland
Andriy Kityk Częstochowa University of Technology, Poland
Ivan Kityk Częstochowa University of Technology, Poland
Krzysztof Kluszczyński Silesian University of Technology, Poland
Marcin Leonowicz Warsaw University of Technology
Aminta Mendoza Universidad Nacional de Colombia, Colombia
Yevgen Melikhov Wolfson Centre for Magnetics, Cardiff University, UK
Waldemar Minkina Częstochowa University of Technology, Poland
Roman Nadolski Kielce University of Technology, Poland
Andrzej Nowakowski Tele & Radio Research Institute, Poland
Ryszard Nowosielski Silesian University of Technology, Poland
Marian Pasko Silesian University of Technology, Poland
Yosef Pinhasi Ariel University, Israel
Andrzej Rusek Częstochowa University of Technology, Poland
Krzysztof Sokalski Częstochowa University of Technology
Jan Szczygłowski Częstochowa University of Technology, Poland
Barbara Ślusarek Tele & Radio Research Institute, Poland
Sławomir Tumański Warsaw University of Technology, Poland

- 4 -
Manuel Vázquez Institute of Material Science of Madrid, Spain
Andrzej Wac-Włodarczyk Lublin University of Technology, Poland
Wiesław Wilczyński Electrotechnical Institute, Warsaw
Jerzy Wysłocki Częstochowa University of Technology, Poland
Asher Yahalom Ariel University, Israel
Sergey E. Zirka Dnepropetrovsk National University, Ukraine
Stan Żurek Megger Ltd., United Kingdom
ORGANIZING COMITTEE
Jan Szczygłowski Head of the Committee
Mariusz Najgebauer Secretary
Adam Jakubas

- 5 -
FRAME PROGRAM OF
XII SYMPOSIUM OF MAGNETIC MEASUREMENTS & MODELING
Częstochowa – Siewierz, 17th – 19th October 2016
Monday 17.10.2016
9.00 – 11.30 Registration of the participants
11.30 – 11:45 Official opening of the Symposium
11.45 – 13.00 Plennary Session I
13.00 – 14.00 Lunch
14.00 – 16.00 Session 1A:
Magnetic Measurements
Session 1B:
Solid State I
16.00 – 16.30 Coffee break
16.30 – 18.30 Session 2A:
Magnetic Modelling
Session 2B:
Solid State II
19.00 – 22.00 Barbeque
Tuesday 18.10.2016
7.30 – 9.00 Breakfast
9.00 – 10.00 Plennary Session II
10.00 – 10.30 Coffee break
10.30 – 13.00 Session 3A:
Non-Destructive Testing
Session 3B:
Solid State III
13.00 – 14.00 Lunch
14.00 – 15.30 Session 4A:
Sensors and Actuators I
Session 4B:
Electric Machines
15.30 – 16.00 Coffee break
16.00 – 17.30 Session 5A:
Sensors and Actuators II
Session 5B:
Magnetic fluids and powders
18.30 – 24.00 Gala dinner with Concert Film music Kilar & Morricone
(Beniamin Czech – violino, Magdalena Czech – cello, Tadeusz Trzaskalik – piano)
Wednesday 19.10.2016
7.30 – 9.00 Breakfast
9.00 – 10.45 Session 6:
Novel solutions
10.45 – 11.15 Coffee break
11.00 – 11.15 Meeting of the SMMM Scientific Committee
11:15 Closing remarks of the Symposium
12.00 – 13.00 Lunch

- 6 -
- 7 -
PROGRAM OF
XII SYMPOSIUM OF MAGNETIC MEASUREMENTS & MODELING
Częstochowa – Siewierz, 17th – 19th October 2016
Monday 17.10.2016
9.00 – 11.30 Registration of the participants
11.30 – 11:45 Official opening of the Symposium
11.45 – 13.00 Plennary Session I
Chairmen: prof. A. Demenko, prof. R. Nadolski
1. Remembrance of Professor Kazimierz Zakrzewski
2. Invited talk: R. Hiergeist, K. Wagner, G. Ross, Characterization of
softmagnetic materials in AC magnetic fields by digital methods
3. Invited talk: R. Szewczyk, Method of moments in Jiles-Atherton model based
magnetostatic modelling of thin layers
13.00 – 14.00 Lunch
14.00 – 16.00 Session 1A: Magnetic Measurements
Chairmen: prof. R. Szewczyk, dr J. Bajorek
1. R. Gozdur, P. Szczurek, A. Majocha, Intercomparison of measurements of
magnetic power losses
2. S. Zurek, Example of vanishing anisotropy at high rotational magnetisation of
grain-oriented electrical steel
3. S. Zurek, Practical implementation of universal digital feedback for
characterisation of soft magnetic materials under controlled AC waveforms
4. W.A. Pluta, Angular and frequency behavior of some properties of electrical
steel sheets
5. M. Przybylski, D. Kapelski, B. Ślusarek, Mechanical properties of soft magnetic
composites at the temperature of liquid nitrogen
14.00 – 16.00 Session 1B: Solid State I
Chairmen: prof. J. Wysłocki, dr P. Gębara
1. K. Kotynia, P. Pawlik, M. Hasiak, M. Pruba, K. Pawlik, Structural and
magnetic studies of the Fe-Co-Zr-Mo-W-B amorphous alloy
2. K. Filipecka, P. Pawlik, A. Kozdraś, J. Filipecki, K. Kotynia, J.J. Wysłocki,
Effect of annealing temperature on phase constitution and magnetic properties
of the nanocrystalline Pr-Fe-B alloy ribbons doped with tungsten
3. R. Nowosielski, M. Kądziołka-Gaweł, P. Gębara, R. Babilas, Magnetic
properties and structure after crystallization of Fe80-xB20Nbx (x=4,6,10) metallic
glasses
4. P. Pawlik, M. Pruba, K. Pawlik, Phase structure and magnetic properties of the
Co-precipitated magnetite nanoparticles
5. M. Hasiak, M. Miglierini, First order reversal curve analysis of annealed Fe-
Co-Si-B-Mo-P metallic glass
16.00 – 16.30 Coffee break

- 8 -
16.30 – 18.30 Session 2A: Magnetic Modelling
Chairmen: prof. A. Kapłon, dr R. Gozdur
1. M. Wołoszyn, M. Chojnicki, M. Nowak, Magnetic signature of land vehicles
2. R.M. Wojciechowski, C. Jędryczka, Description of sources of magnetic field
using edge values of current vector potential
3. M. Najgebauer, Scaling-based modelling of power losses in amorphous and
nanocrystalline alloys
4. R. Jastrzębski, K. Chwastek, I. Biondić, K. Miličević, A comparison of different
estimation methods for hysteresis modelling
5. M. Bereźnicki, P. Jabłoński, J. Szczygłowski, Statistical significance of
coefficients in the Bertotti model
16.30 – 18.30 Session 2B: Solid State II
Chairmen: prof. A. Mendoza, dr K. Pawlik
1. P. Gębara, M. Hasiak, Investigation of critical behavior in Gd75Ge15Si5Ce5
alloy
2. R. Gozdur, M. Lebioda, Magnetic properties and flux distribution in the
LaFeCoSi/FeCoV hybrid structures
3. M. Hasiak, Soft magnetic properties and magnetocaloric effect of irradiated Fe-
Mo-Cu-B alloy
4. M. Kubisztal, I. Herok, M. Karolus, K. Prusik, G. Haneczok, Preparation and
magnetic characteristics of Co1-δZnδFe2O4 ferrite nanopowders
5. K. Prusik, E. Matyja, M. Kubisztal, M. Zubko, A. Chrobak, R. Swadźba,
Magnetic properties and structure and of the Ni-Mn-Co-In with the boron
addition
19.00 – 22.00 Barbeque

- 9 -
PROGRAM OF
XII SYMPOSIUM OF MAGNETIC MEASUREMENTS & MODELING
Częstochowa – Siewierz, 17th – 19th October 2016
Tuesday 18.10.2016
7.30 – 9.00 Breakfast
9.00 – 10.00 Plennary Session II
Chairmen: prof. J. Szczygłowski, prof. B. Ślusarek
1. Invited talk: Y. Melikhov, Phenomenological modelling of hysteresis:
applications and limitations
2. Invited talk: A. Stupakov, How to perform the accurate magnetic measurements
– physical interpretation and practical implementaion
10.00 – 10.30 Coffee break
10.30 – 13.00 Session 3A: Non-Destructive Testing
Chairmen: prof. K. Chwastek, dr A. Stupakov
1. J. Bajorek, Issues of magnetic permeability of austenitic stainless steel
measurements by non-destructive method
2. T. Garstka, Comparison of the results of the barkhausen noise invesitigations
with using various design of sensors
3. D. Jackiewicz, A. Juś, R. Szewczyk, A. Bieńkowski, Two methods of
magnetoelastic effect utilization to evaluate mechanical strain in the truss
structures
4. M. Kachniarz, R. Szewczyk, Study on Rayleigh hysteresis model and its
aplicability in modelling magnetic hysteresis phenomenon in ferromagnetic
materials
5. P. Nowak, M. Nowicki, R. Szewczyk, FEM-based forward eddy current
tomography transformation for automotive industry
6. J. Salach, Recent state of research on compressive and tensile stresses influence
on magnetic properties of amorphous materials
10.30 – 13.00 Session 3B: Solid State III
Chairmen: prof. G. Haneczok, dr M. Hasiak
1. J.F. López, M. Rios, G.A. Mendoza, Effects of doping on the structural
distortion of La0.7Dy0.3Mn1-xZnxO3
2. A. Mendoza, J.F. López, O. Guzmán, Nonequilibrium patterns in spinodal
granular matter
3. P. Kwapuliński, J. Gieraltowski, C. Dolabdjian, Z. Stokłosa, G. Haneczok,
Magnetic properties of Co-Fe-Si-B micro-wires
4. T. Gizynski, W. Kaszuwara, M. Kulczyk, M. Leonowicz, Hydrostatic extrusion
at high temperature
5. K. Pawlik, Effect of heat treatment on the phase transformation and magnetic
properties of the rapidly solidified Pr9Fe58Co13Zr1Nb4B15 alloy ribbons
6. M. Szymański, B. Michalski, M. Leonowicz, Z. Miazga, Complex characteristics
of sintered Nd-Fe-B magnets from scrap HDDs

- 10 -
13.00 – 14.00 Lunch
14.00 – 15.30 Session 4A: Sensors and Actuators I
Chairmen: prof. M. Wołoszyn, prof. A. Nowakowski
1. D. Gaworska-Koniarek, J. Bajorek, W. Wilczynski, Magnetic field strength
sensor
2. D. Stachowiak, A. Demenko, Simulation and investigation of the micro-
displacement actuator with magnetostrictive rod
3. M. Kurzawa, D. Stachowiak, Investigation of thermo-mechanical behavior in
shape memory alloy actuator
4. M. Nowicki, M. Kachniarz, R. Szewczyk, Temperature error of Hall-effect and
magnetoresistive commercial magnetometers
14.00 – 15.30 Session 4B: Electric Machines
Chairmen: prof. K. Kluszczyński, dr M. Najgebauer
1. P. Kowol, K. Kluszczyński, Equivalent-circuit approach to MR multi-disc clutch
designing against the background of magnetic field calculation
2. W. Burlikowski, Ł. Kohlbrenner, Comparison of databases for modelling of
nonlinear current - flux linkage characteristics in electromechanical converters
3. Z. Kowalik, Uncertainty of the magnetic flux linkages measurements performed
with the use of the modified current decay test
4. J. Rolek, G. Utrata, A. Kaplon, An influence of the temperature and magnetic
core saturation on the inductance frequency characteristic of an induction
machine
15.30 – 16.00 Coffee break
16.00 – 17.30 Session 5A: Sensors and Actuators II
Chairmen: prof. Y. Pinhasi, dr D. Stachowiak
1. D. Mazur, R. Smusz, P. Kielan, Analysis of thermal stratified storage tank
2. A. Majocha, R. Gozdur, Wiegand sensor as an effective energy source for
supplying ultra low power electronics
3. P. Jankowski -Mihułowicz, D. Kawalec, M. Węglarski, Using the phased
antenna array to increase geometric size of the interrogation zone in UHF RFID
system
16.00 – 17.30 Session 5B: Magnetic fluids and powders
Chairmen: prof. A. Yahalom, dr R. Wojciechowski
1. Z. Pilch, J. Domin, Conception of the throttle-return valve for the
magnetorheological fluid
2. M. Szczygieł, Z. Pilch, J. Domin, T. Trawiński, K. Kluszczyński, M. Przybylski,
B. Ślusarek, Analysis of the applicability of 3D magnetic filament technology in
electrical and electromechanical devices
3. P. Kielan, Z. Pilch, MR clutch work control in hil loop using a DSP processor
18.30 – 24.00 Gala dinner with Concert Film music Kilar & Morricone
(Beniamin Czech – violino, Magdalena Czech – cello, Tadeusz Trzaskalik – piano)

- 11 -
PROGRAM OF
XII SYMPOSIUM OF MAGNETIC MEASUREMENTS & MODELING
Częstochowa – Siewierz, 17th – 19th October 2016
Wednesday 19.10.2016
7.30 – 9.00 Breakfast
9.00 – 10.45 Session 6: Novel solutions
Chairmen: prof. O. Guzman, dr Y. Melikhov
1. Y. Pinhasi, Radiative power beaming using high power magneto-static free-
electron maser
2. M. Tuval, A. Yahalom, Relativistic engine based on a permanent magnet
3. A. Jakubas, P. Gębara, A. Gnatowski, K. Chwastek, Measurements of
properties of polymer-metallic composites
4. J. Szałatkiewicz, R. Szewczyk, M. Kalinowski, J. Kataja, P. Råback,
J. Ruokolainen, M. Kachniarz, Open source ELMER software based FEM
modelling of waveguides and resonant cavities for microwave heating and
drying devices
5. A. Abramowska, The role of IEEE literature in patented innovation
10.45 – 11.15 Coffee break
11.00 – 11.15 Meeting of the SMMM Scientific Committee
11.15 Closing remarks of the Symposium
12.00 – 13.00 Lunch

- 12 -

- 13 -
ABSTRACTS

- 14 -

- 15 -
THE ROLE OF IEEE LITERATURE IN PATENTED INNOVATION
A. Abramowska
EBSCO Sp. z o.o.
Krakowskie Przedmieście 79, 00-079 Warszawa, Poland
e-mail: [email protected]
IEEE is the world's largest technical professional organization dedicated to advancing
technology for the benefit of humanity. IEEE and its members inspire a global community to
innovate for a better tomorrow through its highly cited publications, conferences, technology
standards, and professional and educational activities. There are more than 420,000 IEEE members
in over 160 countries. IEEE publishes a third of the world‟s technical literature in electrical
engineering, computer science, and electronics and is a leading developer of international standards
that underpin many of today's telecommunications, information technology, and power-generation
products and services. IEEE is the biggest source of scientific prior art to the top patenters.
InnovationQ Plus is the new discovery and analytics platform from the IEEE and IP.com that
combines deep engineering content from the IEEE with IP.com‟s global patent and non-patent
literature.
InnovationQ Plus helps:
Access and identify prior art
Determine patentability
Gain global understanding of patent clearance/freedom to operate
Enable better patent claim & application construction
Identify industry activity and discover opportunities
Assess competitive positioning and threats
Discover partnerships/licensing opportunities
Analyze your IP‟s positioning in the market
Optimize R&D operations
Why InnovationQ Plus?
InnovationQ Plus indexes the full text of IEEE publications alongside a comprehensive global
patent literature database. IEEE publications are critical to the patent process and cited in patents
three times more than any other publisher. The patented semantic engine is uniquely tuned for IP
driving comprehensive and accurate results and analytics This combination provides a single,
integrated solution that enables discovery of key information to confidently make decisions
regarding your IP portfolio.

- 16 -

- 17 -
ISSUES OF MAGNETIC PERMEABILITY OF AUSTENITIC STAINLESS
STEEL MEASUREMENTS BY NON-DESTRUCTIVE METHOD
J. Bajorek
R&J Measurement, Lipowa 48, Borowa, [email protected]
Abstract. The paper presents the impact of engineering processes on the properties of austenitic stainless steel. In
addition, the necessity of measurements of very small changes in magnetic permeability and the way of their
realization on the large objects by non-destructive method with the uncertainty of the type "A" is discussed.
I. INTRODUCTION
Technology of equipment production in many areas such as physics (particle accelerator),
energy industry (generators), shipbuilding (warships), requires the use of materials with high
mechanical strength and very low magnetic permeability μ. The tailoring the appropriate
mechanical and magnetic properties of austenitic stainless steel requires control of the engineering
processes influence on the magnetic properties of the material.
Available publications clearly indicate that magnetic measurements provide an alternative or
supplement to the previously used ultrasonic and penetrative methods.
The measurement of the relative magnetic permeability enables a more complete assessment of
the degree of the material structure degradation and allows more accurately assess the mechanical
and electrical properties of objects under examination.
It also allows assessing the instability of austenite caused by static and dynamic loads in the
operating conditions of machines. Among others its concerns generators caps. They are in fact
exposed to high centrifugal forces and the presence of large, alternating magnetic fields.
Very low required relative permeability (µ≤ 1.05) and high resistivity is necessary because of
limitations of induced eddy currents. Similar requirements provide warships.
Therefore it is necessary to measure the permeability not only for blank material in the
laboratory but also in semi- and final products of machines and equipment of large dimensions.
This requires the implementation of local measurements of magnetic permeability by non-
destructive methods and puts high demands on instrumentation.
In the paper the impact of engineering processes on the properties of austenitic stainless steel is
discussed. The possibility of non-destructive measurement of the magnetic permeability is
presented. In addition, the necessity of measurements of very small changes in magnetic
permeability and the way of their realization on the large objects by non-destructive method with
the uncertainty of the type "A" is discussed.

- 18 -

- 19 -
STATISTICAL SIGNIFICANCE OF COEFFICIENTS
IN THE BERTOTTI MODEL
M. Bereźnicki, P. Jabłoński and J. Szczygłowski
Częstochowa University of Technology, Faculty of Electrical Engineering
al. Armii Krajowej 17, 42-200 Częstochowa, Poland
In the paper two formulas for description of loss in the magnetic material subject to alternating
field re-magnetization are compared. The comparison is carried out for Bertotti‟s and Richter‟s
formulas. On the basis of statistical analysis that relies on the statistical assessment of components
in both formulas, it is shown that Richter‟s formula is simpler and more adequate for the
description in the considered SMM samples.
REFERENCES
[1] Bertotti G., Hysteresis in magnetism, Academic Press, San Diego, 1998
[2] Barranger J., Hysteresis and Eddy-current losses of a tranfoormer lamination vieved as an application
of the Poynting theorem, NASA Technical note, TN D-3114, 1965

- 20 -

- 21 -
COMPARISON OF DATABASES FOR MODELLING OF NONLINEAR
CURRENT - FLUX LINKAGE CHARACTERISTICS IN
ELECTROMECHANICAL CONVERTERS
W. Burlikowski and Ł. Kohlbrenner
Department of Mechatronics, Faculty of Electrical Engineering, Silesian University of Technology,
Akademicka 10A, 44-100 Gliwice, [email protected]
Abstract. In the paper various types of databases for the current-flux linkage characteristic approximation are
presented. In case of Hamiltonian model of the electromechanical converter they are necessary both in simulational
model and in practical implementation of control system. The comparison includes uniform database and non-uniform
one based on triangulation. The exemplary results are shown for case of 3-phase synchronous reluctance motor
without neutral wire (Fig.1). The hybrid type of database, based on sequential linear interpolation (SLI), is proposed.
I. INTRODUCTION
Mathematical models of electromechanical converters employ either Lagrangian or
Hamiltonian form of equations, depending on the choice of state variables [1]. The equation of
electrical circuit of the converter (Fig.1) with flux linkages as state variables, using Hamiltonian
formalism, has the following form:
(1)
while its Lagrangian counterpart can be written as:
(2)
where is the function that defines currents in terms of rotor angular position
and flux linkages ; – supply voltages; –
resistance matrix; - mechanical angular velocity; - dynamic inductance matrix.
Fig.1. Electrical circuit of the synchronous reluctance motor (SynRM)
II. TYPES OF DATABASES
The quantities which are databases in eq.1,2 are , and . In idealized
mathematical description used in these equations they represent continuous functions. However, as

- 22 -
in practice they are obtained either using numerical simulations or measurements, they are discrete
in nature [1][4]. They can be divided into two groups:
a) primary database - presenting flux linkages as function of currents . It is regarded as
primary because it can be directly obtained using numerical modeling (e.g. FEM) or measurement,
b) secondary databases - their form depends on the type of equations. In case of Lagrangian
equations it is dynamic inductance obtained using differentiation of primary database
[5]. In case of Hamiltonian formalism it is obtained using inversion of primary
database based either on simplical approximation or reinterpolation [1][2].
III. PROPERTIES OF THE SECONDARY DATABASES
The main problems which arise in practical application of various types of databases is their
structure and approximation properties. The paper focuses on drawbacks and advantages of various
implementations of current-flux linkage characteristic [1]:
a) uniform - which ensures very fast access to data but suffers because of inaccuracy in highly
saturated regions leading sometimes to loss of stability (LofS.) of simulations (Fig.2a),
b) triangulated - very accurate in highly saturated regions but suffers because of very slow access
to data (Fig.2b).
Authors propose to solve these problems using a hybrid method, based on sequential linear
interpolation (SLI) algorithm connected with local triangulation [2][3].
a) b)
Fig.2. Domains of uniform (a) and triangulated (b) databases representing current-flux linkage characteristic.
REFERENCES
[1] Burlikowski W., Hamiltonian model of electromechanical actuator in natural reference frame, Part
1&2, Archives of Electrical Engineering, vol. 60(3), 2011, pp. 317-348
[2] Agoston M.K., Computer Graphics and Geometric Modeling - Mathematics, Springer, 2005
[3] Chang J.Z., Allenbach J.P., Bouman Ch.A., Sequential linear interpolation of multidimensional
functions. IEEE Transactions on Image Processing, vol. 6, no. 9, September 1997. p. 1231-1245
[4] Kowalik Z., Measurement Results Based Approximation of the Nonlinear Flux-Current Characteristic
of an Electromechanical Actuator, Measurement Automation Monitoring, vol. 02/2016, 2016, pp. 49-54
[5] Herold T. et al., Extension of a d-q model of a permanent magnet excited synchronous machine by
including saturation, cross-coupling and slotting effects, 2011 IEEE International Electric Machines &
Drives Conference (IEMDC), 2011, pp. 1363 – 1367

- 23 -
EFFECT OF ANNEALING TEMPERATURE ON PHASE CONSTITUTION
AND MAGNETIC PROPERTIES OF THE NANOCRYSTALLINE Pr-Fe-B
ALLOY RIBBONS DOPED WITH TUNGSTEN
K. Filipecka1,2
, P. Pawlik1, A. Kozdraś
3, J. Filipecki
2, K. Kotynia
1 and J.J. Wysłocki
1
1 Institute of Physics, Faculty of Production Engineering and Materials Technology, Czestochowa University of
Technology, Armii Krajowej 19, 42-200 Czestochowa, Poland
2 Institute of Physics, Faculty of Mathematics and Natural Science, Jan Dlugosz University, Armii Krajowej 13/15,
42-200 Czestochowa, Poland
3 Department of Physics, Faculty of Production Engineering and Logistics, Opole University of Technology, Ozimska
str. 75, 45-370 Opole, Poland
The rapidly solidified bulk RE-Fe-B (RE = rare earth) magnets are of considerable interest due
to their potential magnetic applications. Interesting properties in this group of alloys were observed
for Pr-Fe-B-type systems, in which Pr2Fe14B phase is responsible for the high coercivity. In order
to improve magnetic properties, many modifications of their chemical composition were worked
out. The increase in the magnetic parameters can be obtained by changing the proportions of the
basic components (Pr, Fe and B) or by doping the base alloy. One of alloying elements, which is
very interesting due to its influence on formation of hard magnetic RE2Fe14B phase and improving
the glass forming ability is tungsten. Furthermore, to obtain optimal magnetic properties,
appropriate processing conditions are crucial issue. Therefore, the aim of the present work was to
investigate the phase constitution and magnetic properties of the rapidly solidified Fe65Pr9B18W8
alloy ribbons in as-cast state and subjected to short time annealing.
The base alloy was prepared by arc-melting of the high purity elements, with addition of pre-
alloy Fe-B of known composition, under Ar protective atmosphere. The ribbon samples were
obtained by melt-spinning technique under low pressure of Ar. The linear speed of the cooper
wheel surface of 25 m/s was used. Subsequently, the ribbons were sealed off in a quartz tube under
low pressure of Ar to maintain purity of atmosphere during heat treatment. In order to change the
magnetic properties and obtain the nanocrystalline microstructure, the samples were annealed at
various temperatures ranging from 923 K to 1023 K for 5 min, and subsequently rapidly cooled in
the water. Crystallization behavior of the as-cast ribbon was studied using differential scanning
calorimeter Netzsch DSC404 at heating rate of 10 K/min. The phase structure analysis was
investigated using Bruker D8 Advance diffractometer with Cu Kα radiation. Mössbauer spectra
were measured using Polon Mössbauer spectrometer with a 57Co:Rh source in conventional
transmission geometry and subsequently analysed using WinNormos for Igor software. Tested
samples were crushed to powder in order to obtain a specimens representative for the entire volume
of the material. Room temperature hysteresis loops were measured by LakeShore 7307 VSM
magnetometer at external magnetic fields up to 2 T.
The DSC studies were used to specify the range of annealing temperatures during heat
treatment. The structural and magnetic studies have shown amorphous structure of ribbons in as-
cast state and their soft magnetic properties. Short-time annealing (for 5 min) at 923 K did not
result in change of phase composition and magnetic properties. Heat treatment of specimens at the
943 K and higher temperatures for 5 min led to nucleation and growth of crystalline phases and
allowed to obtain a nanocrystalline structure. The volume fraction of amorphous phase decreases in
expense of growing grains of crystalline phases. The phase analysis of XRD spectra revealed
presence of the hard magnetic Pr2Fe14B and the paramagnetic Pr1+xFe4B4 phases. Due to the
overlap of diffraction peaks it was difficult to determine presence of particular phases. Therefore,
for explicit phase identification the Mössbauer studies were performed. Analysis of Mössbauer
spectrum for the as-cast sample confirmed its amorphous structure. These studies carried out on
ribbon annealed at 923 K for 5 min have shown presence of component corresponding to

- 24 -
amorphous and paramagnetic crystalline phases. The corresponding volume fractions of constituent
phases were 94 vol. % of the amorphous and 6 vol. % of the Pr1+xFe4B4 phases. Annealing at 983 K
led to significant change of Mössbauer spectrum that suggests a presence a major fraction of
crystalline phases. The quantitative analysis of this spectrum has shown that the annealed ribbon
consists of 45 vol. % of the Pr2Fe14B phase, 40 vol. % of the Pr1+xFe4B4 phase and 15 vol. % of the
disordered component. The wasp-waisted shape of hysteresis loop measured for ribbon annealed at
943 K is typical for alloys, where formation of isolated grains of hard magnetic phase within the
amorphous matrix occurs during heat treatment. With the increase of annealing temperature
hysteresis loops characteristic for hard magnetic materials were measured, which is related to
evolution of microstructure and phase constitution of the samples. Large volume fraction of the
paramagnetic Pr1+xFe4B4 phase resulted in relatively low values of (BH)max. With increasing of
annealing temperature, a slight increase of the coercivity is observed. The maximum value of
coercivity JHc = 974 kA/m was obtained for sample annealed at 1003 K for 5 min. However, the
heat treatment at 983 K for 5 min resulted in the maximum values of remanence Jr = 0.39 T and
maximum energy product (BH)max = 23.3 kJ/m3.

- 25 -
COMPARISON OF THE RESULTS OF THE BARKHAUSEN NOISE
INVESITIGATIONS WITH USING VARIOUS DESIGN OF SENSORS
T. Garstka
Częstochowa University of Technology, Faculty of Production Engineering and Materials Technology
Al. Armii Krajowej 19, 42-200 Częstochowa, Poland, e-mail: [email protected]
Abstract. The paper present results of the Barkhausen noise investigations of the steel samples, conducted with using
three different design of the measurement sensors, at the same reference conditions. The character and scale of the
obtained differences were discussed.
I. INTRODUCTION
Nondestructive methods based on Barkhausen noise measurement are widely used for
ferromagnetic materials testing. It allows to rapid control of properties of manufactured products in
process of metal forming, rolling, welding or heat treatment. Also the automation of control
procedures is easy and measuring equipment is relatively cheap and safely to the staff. The
physical principle of these testing methods relies on well-known effect (discovered by H.
Barkhausen in 1919) of jerky motion of the magnetic domains‟ walls between pinning sites during
magnetization process. It result in discontinuous magnetic flux density changes inside the material,
inducing in a pick-up coil series of electrical pulses, which after conditioning take characteristic
form called magnetic Barkhausen Noise (BN). Course of this phenomenon is determined by a lot of
materials properties as microstructure type, grain size, texture and mechanical stress level [1]. Also
the magnetization conditions as well as measuring set-up parameters have considerable impact on
the results of its measurements. Individual research teams use own measuring set-up and
commercial solutions are cryptic. Especially, due to lack of detailed standards of Barkhausen noise
sensors construction, results received in laboratory investigations as well as industrial applications
with different measuring head may be various. For this reasons, to conduct research on
construction of detection sensor seems to be right to check and recognize differences caused by its
sensitivity and measurement resolutions. This issue was analyzed in [2, 3], but due to various
magnetization conditions, the results cannot be fully compared and clear.
II. EXPERIMENT AND MATERIAL
The magnetic Barkhausen noise measurements were carried out using the stand-alone
measurement equipment for excitation, detection and processing of BN developed at Technical
University of Częstochowa by author [4]. During the investigations, the raw Barkhausen noise
signal and its root mean square value, envelope as well as the magnetization conditions was
recorded. For the tests, different surface detection sensors of BN were examined, as:
- air coil with diameter 10mm, and 300 turn
- ferrite P- core, with cross surface, ca 150 mm2 and 200 turns
- ferrite bar-core, with cross surface, ca 12 mm2 and 200 turns
To maintain stable and repeatable magnetizations conditions, during examination of each
detection sensor, the magnetization yoke with 400 turn of windings was used.
The investigations were performed on the two samples, for two magnetization frequencies.
The first one was laboratory specimen used to tensile stress test, plasticity deformed and the second
was a piece of hot rolled 5 mm steel sheet, prepared with using semi-industrial two high rolling
mills. Both samples were made from the same grade, S235JGR2 of steel although obtained from
different factory batches.

- 26 -
In first case the measurement were done in the same middle point of sample and in second
case, the measurements were done in nine points, organized in matrix 3×3 with 50 mm distance
between them. In both case any additional surface preparation were not applied to the samples,
especially to hot rolled sheet to keep as raw conditions as in real industrial process.
III. RESULTS
Comparison of the exemplary obtained results, allows to state, that observed differences were
quantitative rather than qualitative, as expected. Figure 1 shown the variation of BNRMS with
magnetization current Im in the first sample, measured by three of tested sensors. The course of
each curve is similar but the P-core detection coil has the most sensitivity. The analogical result can
be observed in Figure 2, for envelope plots of BN recorded in one of the selected measurement
point on the investigated steel sheet. Despite of more sensitivity of P-core sensor, the significant
deformation of envelope were not noticed.
Thus, should be developed universal calibration standard and procedure to measurement
sensitivity of Barkhausen sensors, which let to compare results of scientific studies or industrial
measurements.
Fig.1. Variation of BNRMS with Im Fig.2. Plots of BN envelope
IV. ACKNOWLEDGMENTS
This study was carried out under principal research project No. BS/PB-201-301/2013
REFERENCES
[1] Augustyniak B, Magnetomechanical effects and their applications at nondestructive evaluation of
materials, Publisher Gdańsk University of Technology, Gdańsk, 2003.
[2] Grum J., Pecnik B., Calibration of various sensor units by using different parameters of the magnetic
Barkhausen noise, Proceedings of 4th International Conference on Barkhausen Noise and
Micromagnetic Testing, Brescia, Italy, 2003, pp. 211-218
[3] Garstka T, Jagieła K, Dobrakowski R., Influence of the measuring heads' construction on Barkhausen
noise voltage measurements characterizing changes of microstructure, Proceedings of 5th International
Scientific Conference on New Technologies and Achievements in Metallurgy and Materials
Engineering, Częstochowa, Poland, 2004, pp. 260-265
[4] Garstka T., The complex system for residual stress determination based on Barkhausen noise
measurement, Proceedings of 5th International Conference in Barkhausen Noise and Micromagnetic
Testing, Petten, The Netherlands, 2005, pp.219-228

- 27 -
MAGNETIC FIELD STRENGTH SENSOR
D. Gaworska-Koniarek1, J. Bajorek
2 and W. Wilczynski
3
1 Electrotechnical Institute, Division of Electrotechnology
and Materials Science, Curie-Sklodowskiej 55/61, Wroclaw, [email protected] 2 R&J Measurement, Lipowa 48, Borowa, [email protected]
3 Electrotechnical Institute, Pozaryskiego 28, Warsaw, [email protected]
Abstract. The paper presents a new kind of sensor for magnetic field strength measurement in soft materials by direct
method. The sensor consists of induction coil and ferromagnetic electrodes. Its construction makes possible to measure
the magnetic field strength directly at the sample surface. The principle of operation and construction of sensor were
provided. Also, preliminary experimental study of the sensor was presented. The values of strength of magnetic field
measured by the sensor were compared with the values obtained by means of Epstein frame. The obtained results
showed that designed magnetic field strength sensor is adequate to test electrical steel.
I. INTRODUCTION
For assessment of magnetic properties of an object, measurement and appropriate assignment
of basic magnetic quantities are necessary. The quantities include induction and strength of
magnetic field. A way of magnetizing a tested sample should enable determining magnetic
properties of the material not the object. This enforces using uniform distribution of a tangent
component of magnetic field strength in the measurement region of the tested object.
Meeting this requirement is very hard, even in the case of normalised test circuits, despite a
closed magnetic circuit with a uniform and accessible cross-section.
However, in case of measurements of magnetic field strength by direct method, due to the field
strength gradient over the surface of the tested object, the tangential component sensors should be
place as close as possible to the sample. On the other hand, design issues cause that the distance
from the surface of the tested object is equal to a few millimetres, which introduces a significant
field measuring error HT. Because of that, gradient sensors are used and the magnetic field strength
value on the surface of the tested object is determined using the linear extrapolation method. This
method is used both in case of measuring the field strength component with a flat coil [1, 2], as
well as with Hall effect sensors [3, 4]. Serious doubts arise due to averaging measurement of the
field using induction sensors and uncertainty of assessment of their distance from the surface of the
tested object.
In this paper a new kind of sensor for magnetic field strength measurement in soft materials by
direct method has been presented. Its essential property is significant limitation or even complete
elimination of typical shortcomings of methods commonly used for measurement of magnetic field
strength.
II. MAGNETIC FIELD STRENGTH SENSOR
A principle of operation of the sensor is presented in Fig.1. In case of a multilayer coil, the
magnetic flux associated with its winding can be expressed as
, (1)
where: Ac – cross section area of inductive coil, N – number of layers in the coil, n – number of
turns in a single layer of the coil, lc – distance between faces of the coil, μ0 – permittivity of free
space, uμ – difference of magnetic potentials or magnetic voltage between the faces of the coil, lp –
distance between the faces of the inductive coil.

- 28 -
Fig.1. Scheme of sensor operation
It seems that ensuring constant magnetic potentials on both faces of the coil is a necessary
and sufficient condition for the output signal of passive inductive coil to be proportional to the
difference of magnetic potentials or magnetic voltage drop. The fact has been used for designing a
magnetic field strength sensor with ferromagnetic electrodes in which an inductive coil has been
used.
Equipotential faces of the coil were achieved by using rectangular stripes of a ferromagnetic
material with high initial magnetic permeability, closely adjacent to the coil faces. The shorter side
of the stripes was not smaller than the outer diameter of the coil and the longer one served to
transferring magnetic potential from the tested object to the faces of the induction coil.
Assuming that there is no magnetic voltage drop on the air gaps of a sensor circuit and its
electrodes, magnetic voltage in points a and b in Fig. 1 and on the surface of tested object is
transferred without losses on the coil faces, as
, (2)
where: - magnetic voltage between points a and b and on the surface of tested object,
magnetic voltage between the faces of coil of the sensor.
REFERENCES
[1] Nakata T., Kawase Y., Nakano M., Miuira M., Analysis and Improvement of Measuring Method of
Magnetic Fields in Single Sheet Testers, vol. TJMJ-1, 7, 1986, 873–874
[2] Tumanski S., A multi-coil sensor for tangential magnetic field investigations, J. Magn. Magn. Mater.,
vol. 242–245, 2002, 1153–1156
[3] Stupakov O., Wood R., Melikhov Y., Jiles D., Measurement of Electrical Steels With Direct Field
Determination, IEEE Trans. Magn., 46, 2, 2010, 298–301
[4] Perevertov O., Measurement of the surface field on open magnetic samples by the extrapolation
method, Rev. Sci. Instrum., 76, 10, 2005, 104701

- 29 -
INVESTIGATION OF CRITICAL BEHAVIOR IN Gd75Ge15Si5Ce5 ALLOY
P. Gębara1 and M. Hasiak
2
1 Institute of Physics, Częstochowa Universtity of Technology, Armii Krajowej 19, 42-200 Częstochowa, Poland,
[email protected] 2 Department of Mechanics and Materials Science, Wrocław University of Science and Technology, Smoluchowskiego
25, 50-370 Wrocław, Poland, [email protected]
The main goal of present work was to study critical behavior of the as-quenched
Gd75Ge15Si5Ce5 (wt. %) in the vicinity of the critical temperature TC. Sample was prepared by arc-
melting of high purity constituent elements under Ar atmosphere. The magnetization as a function
of magnetic field was measured in temperature range from 150 K to 340 K (with step 5 K). These
data were used to construct the Arrott plots (Fig.1). Positive slope of the Arrott plots suggests
second order phase transition from ferro- to paramagnetic state [1].
Fig.1. The Arrott plots constructed for the as-quenched Gd75Ge15Si5Ce5 alloy using mean field values of critical
exponents
Detailed studies of the phase transformation nature were carried out using free energy relation
expanded into a power series in the vicinity of Curie point. This relation is written in following
way [2]:
, (1)
where: F(M,T) - magnetic free energy, c1(T), c2(T) and c3(T) - Landau coefficients, M -
magnetization, T - temperature, μ0 - magnetic permeability of vacuum, H - magnetic field.
The calculation of Landau coefficients is possible after reconstruction of equation (1) in following
form [2]:
5
3
3
210 )()()( MTcMTcMTcH. (2)
HMMTc
MTc
MTc
TMF 0
634221 ...642
),(
- 30 -
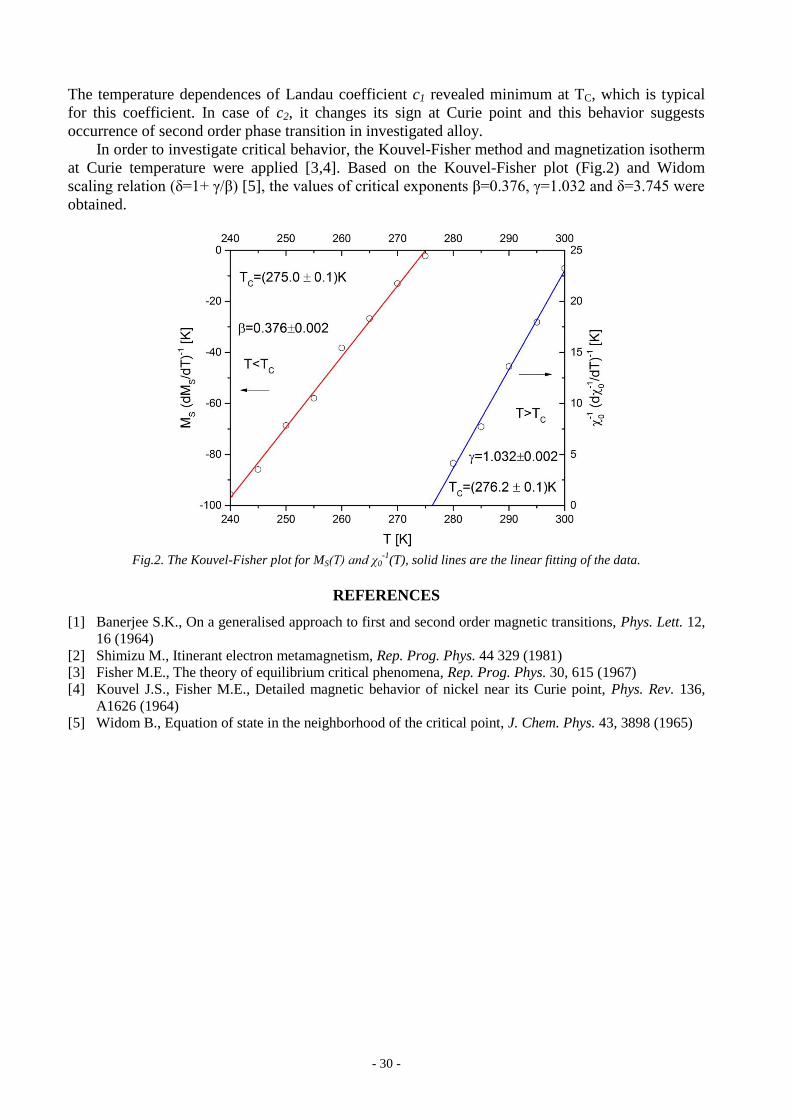
The temperature dependences of Landau coefficient c1 revealed minimum at TC, which is typical
for this coefficient. In case of c2, it changes its sign at Curie point and this behavior suggests
occurrence of second order phase transition in investigated alloy.
In order to investigate critical behavior, the Kouvel-Fisher method and magnetization isotherm
at Curie temperature were applied [3,4]. Based on the Kouvel-Fisher plot (Fig.2) and Widom
scaling relation (δ=1+ γ/β) [5], the values of critical exponents β=0.376, γ=1.032 and δ=3.745 were
obtained.
Fig.2. The Kouvel-Fisher plot for MS(T) and χ0-1
(T), solid lines are the linear fitting of the data.
REFERENCES
[1] Banerjee S.K., On a generalised approach to first and second order magnetic transitions, Phys. Lett. 12,
16 (1964)
[2] Shimizu M., Itinerant electron metamagnetism, Rep. Prog. Phys. 44 329 (1981)
[3] Fisher M.E., The theory of equilibrium critical phenomena, Rep. Prog. Phys. 30, 615 (1967)
[4] Kouvel J.S., Fisher M.E., Detailed magnetic behavior of nickel near its Curie point, Phys. Rev. 136,
A1626 (1964)
[5] Widom B., Equation of state in the neighborhood of the critical point, J. Chem. Phys. 43, 3898 (1965)

- 31 -
CONSOLIDATION OF NANOCRYSTALLINE Nd-Fe-B POWDER OF
HYDROSTATIC EXTRUSION AT HIGH TEMPERATURE
T. Gizynski1, W. Kaszuwara
1, M. Kulczyk
2 and M. Leonowicz
1
1 Warsaw University of Technology, Faculty of Materials Science and Engineering, Woloska 141, 02-507 Warsaw,
Poland; [email protected] 2 Institute of High Pressure Physics, Polish Academy of Sciences, Sokolowska 29/37, 01-142 Warsaw, Poland
Hydrostatic extrusion (HE) is a modern method of shaping materials microstructure and
properties. HE can also be successfully used for consolidation of hard magnetic powders. The
effect of extrusion temperature, within the range of 700 - 800 °C, on the magnetic properties of the
bulk, final product was studied. A commercial MQU-F42 powder, dedicated to hot pressing, was
placed in copper capsules and initially cold compacted up to 60% of the theoretical density.
Subsequently, the billet was heated in an oven to temperatures 700 and 800 °C, respectively and
subjected to hydrostatic extrusion. The extruded product had a form of a copper rod, with the
Nd-Fe-B core, having 96% of theoretical density (true strain 1.85 after extrusion at 800 °C). The
extrusion process led to deterioration of the coercivity, for which coarsening of the Nd2Fe14B
grains was blamed. In order to prove this hypothesis, the starting powder was annealed in a
temperature range of 500-800 °C for various time. The crystallite size, measured after annealing,
by the X-ray diffraction method, showed that with extension of time and elevation of the
temperature the crystallite size increases, however the dominating parameter is the temperature.
Correlation of the crystallite size with temperature indicates that when the crystallites are larger
than 80 nm the magnetic properties dramatically decrease. Additionally, after HE at 800 °C
micrometric size Nd-reach phase appear in the microstructure. The Nd is squeezed from the grain
boundary of the Nd2Fe14B phase leading to non-isolated grains, which also contributes to the
deterioration of the coercivity.

- 32 -

- 33 -
MAGNETIC PROPERTIES AND FLUX DISTRIBUTION IN THE
LaFeCoSi/FeCoV HYBRID STRUCTURES
R. Gozdur1
and M. Lebioda2
1 Lodz University of Technology, Department of Semiconductors and Optoelectronic Devices,
211/215 Wolczanska St., 90-924 Lodz, [email protected] 2 Lodz University of Technology, Institute of Electrical Engineering Systems
18/22 Stefanowskiego St., 90-924 Lodz, [email protected]
Abstract. The present study contains a description of magnetic properties of FeCoV/LaFeCoSi/FeCoV structure. The
hybrid structure consists magnetocaloric LaFeCoSi core laminated with high-induction ferromagnetic layers. Resultant, magnetizing field inside the magnetic structure is gained by fringing field from FeCoV laminations.
Experimental investigations of improved magnetic properties of LaFeCoSi/FeCoV were presented in the paper.
I. INTRODUCTION
The discovery of the giant magnetocaloric effect in 1995 resulted in the growth of interest in
magnetocaloric materials. It stems from the fact that the magnetocaloric effect (MCE) can be used
for heat transfer. Theoretically, the efficiency of cooling system based on MCE is significantly
higher than that of conventional compressor refrigerators. Unfortunately, magnetocaloric cooling in
room temperature requires the usage of expensive materials containing rare earth elements. Apart
from that, strong magnetocaloric effect is activated by the magnetic field with the value over 1T.
The intense development in material engineering has led to the commercial availability of the
magnetocaloric materials, such as Calorivac C and Calorivac H. The magnetic entropy change in
the room temperature approaches the level of 33 kJm-3
K-1
and 89 kJm-3
K-1
respectively. The above
mentioned entropy changes can be registered in the magnetic field of 1.0T [1, 2]. Therefore, the
most significant technological barrier in the design of magnetocaloric cooling systems is the
requirement of strong magnetizing field for the excitation of the MCE [3]. Present-day magnetic
systems are based on hard magnets, Halbach matrices, electromagnets or inductors with
superconducting coils.
This work presents research on the field distribution and magnetic properties of the LaFeCoSi
magnetocaloric material (MCM) with FeCoV laminations (FM). Locally combined field of external
source and fringing field from FeCoV layers boosts the effective field. The magnetic properties and
field distribution have been investigated in a ring type sample asa FM/MCM/FM hybrid structure.
II. HYBRID STRUCTURE
Investigated structure has been made as a toroidal cartridge laminated with ferromagnetic
rings. The cartridge has been filled with sintered LaFeCoSi (Calorivac C 300H) powder with
defined Curie temperature of 300K. The magnetocaloric toroidal sample was laminated with
FeCoV (Vacoflux 50) rings with a thickness of 100µm. The sheets of Vacoflux were annealed in
order to boost magnetic saturation up to 2.4T with estimated maximum MCM/FM permeability
ratio of 1:7. The layout of the ring type tested sample is depicted in the figures 1a-c.

- 34 -
a) b) c)
Fig.1a-c. The diagrams of the FM/MCM/FM hybrid structure
a) b)
Fig.2. Magnetic properties of the FM/MCM/FM hybrid structure
a) Temperature dependencies of magnetic hysteresis loops with frequency 1Hz
b) Influence of temperature on peak magnetic polarization density
The most significant measurements of magnetic properties of FeCoV/ LaFeCoSi /FeCoV
structure were presented in the figures 2a-b. The average magnetic polarization density in the
toroidal structure was measured with pickup coils and Hall sensors. The influence of temperature
on the structure was investigated in the temperature range from 297K to 365K. Achieved peak
polarization density in the ferromagnetic state exceeds 2.2T and stabilizes on the level of 0.4T in
the paramagnetic state of LaFeCoSi. The observed strong depreciation of the ferromagnetic
properties is related to the phase transition in LaFeCoSi because FeCoV has a Curie temperature of
more than 1200K [4].
III. SUMMARY
The work presents magnetic properties of FeCoV/ LaFeCoSi /FeCoV structure. The laminated
FeCoV rings in the structure improve the efficiency of the magnetization and the structure remains
in ferromagnetic state even temperature exceed Curie point in LaFeCoSi. Strong magnetic
coupling between ferromagnetic rings and magnetocaloric core provides opportunities for further
improvement of efficiency of magnetocaloric effect and thermo-magnetic process.
REFERENCES
[1] Bjørk R., Bahl C.R.H., Katter M., Magnetocaloric properties of LaFe13−x−yCoxSiy and
commercial grade Gd, J. Magn. Magn. Mater., vol. 322, no. 24, pp. 2010, 3882–3888
[2] Magnetocaloric materials CALORIVAC, Tech. Note Vacuumschmelze, Edition 2015
[3] Balli M., Sari O., Zamni L., Mahmed C., Forchelet J., Implementation of La(Fe, Co) 13-xSix
materials in magnetic refrigerators: Practical aspects, Mater. Sci. Eng. B Solid-State Mater.
Adv. Technol., vol. 177, no. 8, 2012, 629–634
[4] Gozdur R., Lebioda M., Bernacki Ł., Power losses in LaFexCoySi1.1 intermetallics near the
magnetic phase transition, Acta Phys. Pol. A. 128 (2015), 98 103

- 35 -
INTERCOMPARISON OF MEASUREMENTS OF MAGNETIC POWER
LOSSES
R. Gozdur1, P. Szczurek
2 and A. Majocha
1
1 Lodz University of Technology, Department of Semiconductors and Optoelectronic Devices,
211/215 Wolczanska St., 90-924 Lodz, [email protected], [email protected] 2 Stalprodukt S.A., 69 Wygoda St., 32-700 Bochnia, [email protected]
Abstract. The paper presents recent achievements in the accurate measurements of power losses in soft magnetic
materials. Intercomparison and validation have been developed on the basis of measured power losses in the grain-
oriented SiFe electrical steel in the Epstein frame. The measurements were performed in the laboratories of PTB,
Stalprodukt and Lodz University of Technology.
I. INTRODUCTION
Progress in magnetic materials and components is associated with improved energy efficiency
and growing technological demands. An important part of this process is the development of
methods and instrumentation for accurate measurements of magnetic parameters. In terms of power
losses, the total loss density is a fundamental magnetic parameter measured and used for the
evaluation of quality of electrical steels. The methods of measurement and metrological
recommendations are specified in the IEC standards [1]. In spite of widely discussed disadvantages
[2,3,4], Epstein frame is still an highly approved standard in the industrial and laboratory tests. In
addition, easy recreation of a tested magnetic circuit in the frame and relatively good
reproducibility of tests provide an opportunity of comparison and mutual verification [5-9].
Therefore, for the tests a set of strips was prepared. The measurements were performed in the
following places PTB (Physikalisch-Technische Bundesanstalt), Magnetic Measurement
Laboratory Stalprodukt and Magnetic Laboratory Lodz University of Technology (LUT). Based on
the total loss density data and uncertainty of measurements, the intercomparison and verification of
convergence have been performed.
II. STANDARD SAMPLE AND MEASUREMENT SYSTEMS
For the purpose of interlaboratory measurements a set of 28 strips had been prepared.
Technical parameters of the package are presented in table 1.
Table 1. Technical specification of the tested package
Manufacturer assignment: | 5223400 – 1 – 28
Electrical steel grade: | ET-117 30
Length: | 305.0mm
Width: | 30.0mm
Thickness: | 0.2828 mm
Density: | 7650 kg/m3
Total mass of the strips: | 554.26 g
The package was annealed in order to remove mechanical stresses. Additionally, the sequence
of the packaging has been placed.
The PTB and LUT laboratories employed their own systems with precisely defined range of
uncertainty of measurements of power losses, magnetic field strength and magnetic polarization.
Stalprodukt laboratory used a commercial system Brockhaus 200D.

- 36 -
III. PRESENTATION OF MEASUREMENT SCATTER
Experimental work considered four magnetic polarization densities such as 1.0T, 1.3T, 1.5T
and 1.7T with the frequency of 50Hz. In each case the magnetic field strength, form factor and
demagnetization were controlled.
Fig.1. Comparison of the measurements of the total loss density for the maximum magnetic polarization
a) 1.0T, b) 1.3T, c) 1.5T, d) 1.7T
The scatter of each measurement has not been higher than 6mW/kg and 0.36%. The paper is
going to contain all the measurements and the detailed evaluation of uncertainty.
IV. SUMMARY
Considering the ranges of uncertainties of the measurements, one can state that all the
measurements are in the common range of uncertainty. This approach constitutes validation of used
measurement systems. The tested package can be successfully used for the verification of other
systems and measurements.
REFERENCES
[1] IEC 60404-2:1996 + A1:2008, Magnetic materials - Part 2: Methods of measurement of the magnetic
properties of electrical steel strip and sheet by means of an Epstein frame
[2] Fiorillo F., Characterization and measurement of magnetic materials, Elsevier, Netherlands 2004
[3] Ahlers H., Ludke J., The uncertainties of magnetic properties measurements of electrical sheet steel, J.
Magn. Magn. Mater., vol. 215–216, 2000, pp. 711–713
[4] Antonelli E., Cardelli E., Faba A., Epstein frame: How and when it can be really representative about
the magnetic behavior of laminated magnetic steels, IEEE Trans. Magn., vol. 41, no. 5,
2005, pp. 1516–1519
[5] Cheng Z., Takahashi N., Forghani B., Moses A.J., Anderson P.I., Fan Y., Liu T., Wang X.,
Zhao Z., Liu L., Modeling of magnetic properties of GO electrical steel based on Epstein combination
and loss data weighted processing, IEEE Trans. Magn., vol. 50, no. 1, 2014
[6] De Wulf M., Makaveev D., Houbaert Y., Melkebeek J., Design and calibration aspects of small size
single sheet testers, J. Magn. Magn. Mater., vol. 254–255, 2003, pp. 70–72
[7] Freitag C., Joost C., Leibfried T., Modified Epstein frame for measuring electrical steel under
transformer like conditions, ICHVE 2014 - 2014 Int. Conf. High Volt. Eng. Appl., 2015, pp. 2–5
[8] Manyage M.J. Pillay P., New Epstein frame for core loss measurements at high frequencies and high
flux densities, Conf. Rec. - IAS Annu. Meet. (IEEE Ind. Appl. Soc., vol. 22, no. 3, 2008,
pp. 614–620
[9] Sievert J., The measurement of magnetic properties of electrical sheet steel – survey on methods and
situation of standards, J. Magn. Magn. Mater., vol. 215–216, 2000, pp. 647–651

- 37 -
SOFT MAGNETIC PROPERTIES AND MAGNETOCALORIC EFFECT OF
IRRADIATED Fe-Mo-Cu-B ALLOY
M. Hasiak
Wrocław University of Science and Technology, Department of Mechanics and Materials Science, Smoluchowskiego
25, 50-370 Wrocław, Poland, [email protected]
Abstract. Thermomagnetic characteristics and magnetocaloric properties of the Fe81Mo9Cu1B9 alloy after ion
irradiation by nitrogen ions with the fluencies from 5 × 10¹⁵
N+/cm
2 to 2.5 × 10
17N
+/cm
2are studied.
I. INTRODUCTION
Fe-based soft magnetic materials are very interesting because present unique combination of
magnetic properties [1].The parameters such as low coercivity, high magnetization and nearly zero
magnetostriction lead thatmetallic glasses can be effectively utilized in variety of practical
application [2]. Among others, magnetic shielding, transformer cores or sensors belong to the most
widely employed [1, 3]. Moreover, Fe-based metallic glasses are suggested as candidates for
magnetic cores of accelerator RF-cavities [4].
In this paper, the impact of irradiation with N+ ions upon magnetic parameters as well as
magnetocaloric effect of the Fe81Mo9Cu1B9 alloy alloy is studied.
II. EXPERIMENTAL PROCEDURE
As-quenched57
Fe rich ribbon with a nominal composition of Fe81Mo9Cu1B9 (at. %) about
1 mm wide and 20 m thick was prepared by rapid quenching method on a single Cu water cooled
wheel. All samples of investigated alloy were irradiated using 130 keV nitrogen ions with the
fluencies from 5 × 10¹⁵
N+/cm
2 to 2.5 × 10
17 N
+/cm
2. DC thermomagnetic characteristics recorded
in zero field and field cooled mode were measured by VersaLab system (Quantum Design).
Magnetization as a function of external magnetic field was recorded in a temperature range 50 K -
400 K.Magnetocaloric effect of irradiated materials was studied as magnetic entropy change
according to the Maxwell thermodynamic relation[5] and calculated from set of isothermal
magnetization curves. Moreover, Arrott plots [6] were also constructed from obtained data.
III. RESULTS AND DISCUSSION
Magnetic field dependence of magnetization recorded in the temperature range from 150 K to
330 K together with Arrott plots constructed at constant temperature from these curves according
to formula is presented in Fig. 1. It is seen from Arrott plots that investigated
sample does not show clear transformation from ferromagnetic to paramagnetic state. This
behavior is connected with microstructure and structural changes which occurred during production
of the investigates materials. Fig. 2 shows magnetocaloric effect as magnetic entropy change (-
SM) for the Fe81Mo9Cu1B9 alloy after irradiation with 2.5 × 10¹⁷
ions/cm2. The maximum value of
- SM in the investigated alloy is observed in the temperature from 240-260 K.

- 38 -
Fig. 1. Sets of isothermal magnetization curves in the temperature range 150-330 K (left side) and Arrott plots (right
side) of the Fe81Mo9Cu1B9 alloy after irradiation with 2.5 × 10¹⁷
ions/cm2
Fig.2. Magnetic entropy change versus temperature for the Fe81Mo9Cu1B9 alloy after irradiation with
2.5 × 10¹⁷
N+/cm
2
REFERENCES
[1] McHenry M.E., Willard M.A., Laughlin D.E., Amorphous and nanocrystalline materials for
applications as soft magnets, Progress Mat. Sci. 44 (1999) 291-433, DOI: 10.1016/S0079-
6425(99)00002-X
[2] Willard M. A., Daniil M., Nanocrystalline soft magnetic alloys two decades of progress, Chapter Four,
Handbook of Magnetic Materials, vol.21 (2013), Elsevier B.V., ISSN 1567-2719, DOI:10.1016/B978-
0-444-59593-5.00004-0
[3] Hasiak M., Miglierini M., Łukiewski M., Kaleta J., Microstructure, Magnetic Properties, and
Applications of Co-Rich HITPERM-Type Amorphous Alloys. IEEE Trans. Magn. 48 (2012) 1665-
1668, DOI: 10.1109/TMAG.2011.2172590
[4] Saito K., Hirota J.I., Noda F., FINEMET-core loaded untuned RF cavity, Nuclear Instruments and
Methods in Physics Research Section A: Accelerators, Spectrometers, Detectors and Associated
Equipment402 (1998) 1-13, DOI:10.1016/S0168-9002(97)01062-0
[5] Pecharsky V.K., Gschneidner K.A. Jr, Magnetocaloric effect and magnetic refrigeration, J. Magn.
Magn. Mater. 200 (1999) 44-56, DOI: 10.1016/S0304-8853(99)00397-2
[6] Arrott A., Criterion for Ferromagnetism from Observations of Magnetic Isotherias, Phys. Rev.108
(1957) 1394-1396

- 39 -
FIRST ORDER REVERSAL CURVE ANALYSIS OF ANNEALED
Fe-Co-Si-B-Mo-P METALLIC GLASS
M. Hasiak1 and M. Miglierini
2,3
1Wrocław University of Science and Technology, Department of Mechanics and Materials Science,
Smoluchowskiego 25, 50-370 Wrocław, Poland 2Slovak University of Technology in Bratislava, Faculty of Electrical Engineering and Information Technology,
Institute of Nuclear and Physical Engineering, Ilkovičova 3, 812 19 Bratislava, Slovakia 3Czech Technical University in Prague, Faculty of Nuclear Science and Physical Engineering, Department of Nuclear
Reactors, V Holeńovičkách 2, 180 00 Prague, CzechRepublic
Abstract. The paper presents characterization of magnetic particle interactions in the Fe51Co12Si16B8Mo5P8 metallic
glass after annealing at 798 K for 1 h. The first order reversal curves (FORC) method was utilized to analyze
hysteresis curves which provide more precise estimation of the strength of interactions.
I. INTRODUCTION
Recently, Fe-Si-B-P-Cu soft magnetic material (NANOMET) [1-2] as well as alloys
containing Co atoms [3] are intensively studied. They exhibit interesting soft magnetic
characteristics, i.e. high magnetic saturation, high magnetic permeability, and extremely low
coercivity which are required for magnetic cores. One of the most important parameter in creation
of nanocrystalline structure in Fe-Si-B-P-Cu alloys is the heating rate [4]. The heat treatment with
high heating leads to formation of ultrafine structure whereas the low heating rate produces non-
uniform structure and deterioration of magnetic properties. The aim of this work is to study
magnetic interactions among particles in the Fe51Co12Si16B8Mo5P8 metallic glass after annealing in
a vicinity of the crystallization temperature by using first order reversal curves (FORC) method [5].
II. EXPERIMENTAL PROCEDURE
Amorphous ribbons with a nominal composition of Fe51Co12Si16B8Mo5P8 (at. %) about
0.02 mm thick and about 6 mm wide were prepared using a rapid solidification method on a copper
quenching wheel. Amorphicity and degree of crystallinity of the as-quenched and annealed
materials were examined at room temperature by X-ray diffractometry. Magnetic characteristics
were measured with the help of VersaLab system (Quantum Desing). Magnetization (M) as a
function of external magnetic field (H) and/or temperature was recorded in a wide temperature
range below the Curie point. Hysteresis loops as well as first order reversal curves were measured
as a set of M (H) curves. Evaluation of the obtained results was performed by the VARIFORC
software [6]. All measurements were performed upon as-quenched samples and after their
annealing at 798 K for 1 h.
III. FORC DIAGRAM
Magnetic characterization of one-phase magnets i.e. magnetic interactions in materials with
high value of coercivity is usually performed by investigations of hysteresis loops. A problem
appears when complex magnetic interactions are present in a multi phase material. The first order
reversal curves analysis is one of the methods which can provide information about interaction
field between multiphase magnetic particles/phases such as -Fe/NdFeB, present in magnetic
composite Nd-Fe-B alloys. The information from analysis of the distribution of coercivity can be
used in creation of new hard magnetic materials with high energy density.

- 40 -
Set of first order reversal curves for the annealed Fe51Co12Si16B8Mo5P8metallic glass and the
obtained FORC distribution are presented in Fig. 1. The latter is defined as the second derivative
[5]:
where Ha and Hb are reversal field and magnetization field, respectively, converted according to:
and . It is seen that in the investigated sample measured at
50 K with maximum external magnetic field of 500 Oe only one kind of magnetic interactions
among the particles can be distinguished. Moreover, the value of Hc is almost the same as coercive
field for the Fe51Co12Si16B8Mo5P8 alloy under the same magnetic field. The use of higher magnetic
field leads to visualization of high field magnetic interactions among particles created during heat
treatment.
Fig.1. Set of first order reversal curves (left side) and FORC diagram (right side) for the Fe51Co12Si16B8Mo5P8
metallic glass after annealing at 798 K for 1 h measured at temperature of 50 K with maximum external
magnetic field of 500 Oe.
ACKNOWLEDGEMENTS
Financial support of the grants GACR 14-12449S and VEGA 1/0182/16 is acknowledged.
REFERENCES )
[1] M. Chiba, A. Urata, H. Matsumoto, S. Yoshida, A. Makino, Characteristics of Fe-Si-B-P-Cu
nanocrystalline soft magnetic alloy powders with high Bs, IEEE Transaction on Magnetics, 47 (10)
(2011) 2845-2847
[2] A. Makino, Nanocrystalline soft magnetic Fe-Si_B-P-Cu alloys with high B of 1.8-1.9 T contributable
to energy saving, IEEE Transaction on Magnetics, 48 (4) (2012) 1331-1335
[3] K. Takenaka, A.D. Setyawan, Y. Zhang, P. Sharma, N. Nishiyama, A. Makino, Production of
nanocrystalline (Fe, Co)-Si-B-P-Cu alloy with excellent soft magnetic properties for commercial
applications, Materials Transaction, 56 (3) (2015) 372-376
[4] P.Sharma, X. Zhang, Y. Zhang, A. Makino, Competition driven nanocrystallization in high Bs and low
coreloss Fe-Si-B-P-Cu soft magnetic alloys, 95 (2015) 3-6
[5] Ch.R. Pike, A.P. Roberts, K.L. Verosub, Characterizing interactions in fine magnetic particle systems
using first order reversal curves, J. Appl. Phys., 85 (9) (1999) 6660-6667
[6] R. Egli, VARIFORC: An optimized protocol for calculating non-regular first order reversal curve
(FORC) diagrams, Global and Planetary Change, 110 (2013) 302-320
-400
-200
0
200
400
Hu (
Oe)
4003002001000
Hc (Oe)
400
300
200
100
0
-100
x10
-9

- 41 -
CHARACTERIZATION OF SOFTMAGNETIC MATERIALS IN AC
MAGNETIC FIELDS BY DIGITAL METHODS
R. Hiergeist, K. Wagner and G. Ross
Magnet-Physik Dr. Steingroever GmbH, Emil-Hoffmann-Straße 3, 50996 Köln, Germany,
[email protected], [email protected], [email protected]
Nowadays, for the characterization of soft magnetic materials in AC magnetic fields digital
methods are used. Magnet-Physik offers a family of computer controlled measuring instruments.
These allow the measurement of AC hysteresis loops under various conditions [1].
The models of these instruments are carefully adapted to the different specimen and material
classes of soft-magnetic material. They cover frequency ranges up to 10 kHz, 20 kHz or 500 kHz,
depending on the selected components. For the measurement of grain-oriented and non-grain-
oriented electrical steel, a standard Epstein frame (25 cm) can be used together with a high output
power supply, offering a maximum output power of 1100 VA. Therefore, this instrument allows
measurements following the standards IEC 60404-2 [2], ASTM A343/A343M [3] and ASTM
A889/A889M [4]. The standard Epstein frame is optimized for power line frequencies (50 Hz,
60 Hz) and can be used from 10 Hz up to approximately 200 Hz. For the frequency range from
100 Hz up to 10 kHz a special high frequency Epstein frame according to the standard ASTM
A348/A348M [5] was built.
Besides the application of this apparatus to Epstein samples, all models are able to measure
ring specimen (solid ring cores, sintered cores, tape-wound cores with round or rectangular shape,
sheet stampings (single samples or stacks)) with a primary winding connected to the AC power
amplifier and a secondary winding connected to the pick-up circuit.
For the measurement of ring cores of crystalline Ni-Fe-alloys and compounds, lower rated
versions of the instrument, providing a maximum output power of 50 VA, 100 VA or 200 VA in
the frequency range from 10 Hz up to 10 kHz were made.
The 200 VA models and the high power version feature a digital waveform control to maintain
a sinusoidal secondary induced voltage (or flux density), even at relatively high excitation.
Tape wound cores of amorphous magnetic materials or of nanocrystalline magnetic materials,
as well as rings of soft magnetic ferrites can be measured either with the 200 VA rated instrument
or with a special version with an output rating of 180 VA and the ability to measure even in a
frequency range from 10 Hz up to 500 kHz.
For the characterization of amorphous or nanocrystalline soft magnetic materials in the shape
of thin ribbons or strips [6] a special single strip tester unit (AM-SST) [7] can be used in
connection with a low power system.
The software of the instruments is continuously expanded and updated. A recent version
allows, for instance, – after automated measuring of the hysteresis loops at different magnetization
frequencies – the separation of the magnetic power losses into hysteretic losses, eddy current losses
and anomalous losses within this software and provides therefore fast and sophisticated
measurement reports.
REFERENCES
[1] Steingroever E., Ross G., Magnetic Measuring Techniques, 2008, 68
[2] IEC 60404-2, Methods of Measurement of the Magnetic Properties of Electrical Strip and Sheet by
means of an Epstein Frame, IEC, Geneva, 2009
[3] ASTM A343/A343M, Standard Test Method for Alternating-Current Magnetic Properties of Materials
at Power Frequencies Using Wattmeter-Ammeter-Voltmeter Method and 25-cm Epstein Test Frame,
Annual Book of ASTM, 03.04 Magnetic Properties, 2012, 38-53

- 42 -
[4] ASTM A889/A889M, Standard Test Method for Alternating-Current Magnetic Properties of Materials
at Low Magnetic Flux Density Using the Voltmeter-Ammeter-Wattmeter-Varmeter-Method and 25-cm
Epstein Frame, Annual Book of ASTM, 03.04 Magnetic Properties, 2012, 211-215
[5] ASTM A348/A348M, Standard Test Method for Alternating Current Magnetic Properties of Materials
Using the Wattmeter-Ammeter-Voltmeter Method, 100 to 10000 Hz and 25-cm Epstein Frame, Annual
Book of ASTM, 03.04 Magnetic Properties, 2012, 58-67
[6] Hilzinger R., Rodewald W., Magnetic Materials, Publicis Publishing, ISBN 978-89578-352-4, 2013,
280
[7] Watanabe R., Takahashi Y., Fujiwara K., Ishihara Y., Azuma D., Investigation into measurement
method of Fe-based amorphous strip for IEC standardization and its application to electrical steel sheet,
7th International Conference On Magnetism And Metallurgy, Rome, Italy 2016 (Preprint)

- 43 -
TWO METHODS OF MAGNETOELASTIC EFFECT UTILIZATION TO
EVALUATE MECHANICAL STRAIN IN THE TRUSS STRUCTURES
D. Jackiewicz1, A. Juś
2, R. Szewczyk
1 and A. Bieńkowski
1
1 Institute of Metrology and Biomedical Engineering, Andrzeja Boboli 8, 02-525 Warsaw, Poland,
[email protected], [email protected] 2 Industrial Research Institute for Automation and Measurements PIAP, Aleje Jerozolimskie 202, 02-486 Warsaw,
Poland, [email protected]
Abstract. The article presents the possibility of using the magnetoelastic effects to monitor mechanical strain in
trusses. Test stand enabling loading of the special truss structure was designed, which allowed for installation of
sample members. Study was carried out on two different configurations of the truss. The first configuration consists of
three separate sample members. The magnetoelastic characteristics were measured for each member separately. The
second configuration consists of three measuring members combined in a single magnetic circuit. Measurements of
the hysteresis loops of the sample members was carried out under varying mechanical load, which allowed to obtain
magnetoelastic characteristics. The obtained results confirmed the possibility of using the magnetoelastic effects to
monitor stresses in the truss structures.
I. INTRODUCTION
Truss constructions increasingly require monitoring of the stresses due to the growing security
requirements. Current methods for assessment of stresses, such as a strain gauge or the
magnetostrictive method, have serious limitations. There is therefore a need to develop
methodology for allowing the execution of such measurements. The development of magnetic
measurements allows the use of them in different scientific fields. A phenomenon that can be used
to monitor stresses in the constructions is the magnetoelastic effects [1].
II. EXPERIMENTAL
Fig.1. Schematic diagram of the truss structures: a) first configuration, b) second configuration
The test stand enabling loading of the special truss structure was designed, which allowed for
installation of sample members. The hysteresis loops measurements are done on the
hysteresisgraph. The truss was supported on the bottom edge nodes. The mechanical load was
exerted vertically by the oil hydraulic press on the upper central node of the truss. Measurements
of magnetoelastic characteristics were made for two different configurations of the truss.
In the first configuration (figure 1a) has been used for sample members shown in figure 2a.
The measuring elements are designed to be appropriate for individual windings. In the columns of
sample members uniform stress distribution was assumed. The magnetoelastic characteristics were
measured for each sample member separately.
In the second configuration (figure 1b), the magnetic circuit is closed by means of three
sample members. Used samples (figure 2b) have a reduced cross-sectional area, so as to not
damage the rest of the truss during tests. The magnetoelastic characteristics were measured for
magnetic core enclosed on three elements.
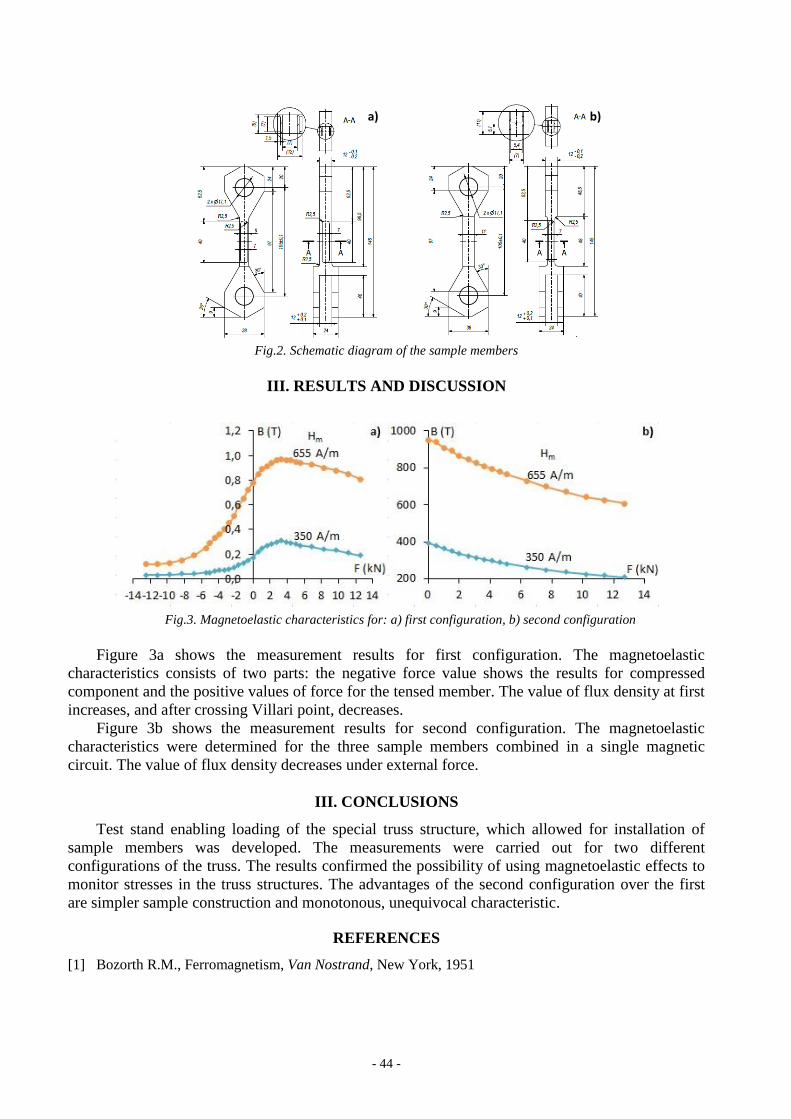
- 44 -
Fig.2. Schematic diagram of the sample members
III. RESULTS AND DISCUSSION
Fig.3. Magnetoelastic characteristics for: a) first configuration, b) second configuration
Figure 3a shows the measurement results for first configuration. The magnetoelastic
characteristics consists of two parts: the negative force value shows the results for compressed
component and the positive values of force for the tensed member. The value of flux density at first
increases, and after crossing Villari point, decreases.
Figure 3b shows the measurement results for second configuration. The magnetoelastic
characteristics were determined for the three sample members combined in a single magnetic
circuit. The value of flux density decreases under external force.
III. CONCLUSIONS
Test stand enabling loading of the special truss structure, which allowed for installation of
sample members was developed. The measurements were carried out for two different
configurations of the truss. The results confirmed the possibility of using magnetoelastic effects to
monitor stresses in the truss structures. The advantages of the second configuration over the first
are simpler sample construction and monotonous, unequivocal characteristic.
REFERENCES
[1] Bozorth R.M., Ferromagnetism, Van Nostrand, New York, 1951
a) b)

- 45 -
MEASUREMENTS OF PROPERTIES OF POLYMER-METALLIC
COMPOSITES
A. Jakubas, P. Gębara, A. Gnatowski and K. Chwastek,
Częstochowa University of Technology, J. H. Dąbrowskiego 69, 42-201 Częstochowa, Poland
[email protected], [email protected], [email protected]
Abstract. In the paper the results of measurements carried out on polymer-metallic composites are presented. The
samples under investigation are made from 99% pure iron powder and suspense polyvinyl chloride PVC-S. Relevant
magnetic and electric properties are determined for samples differing in polyvinyl content.
I. INTRODUCTION
Engineering community has noticed the advantages resulting from the application of powder
metallurgy in the design of electromagnetic converters and electric machines [1-5]. Soft magnetic
composites (SMCs) reveal interesting physical and chemical properties, which may be easily
optimized and fine-tuned to specific applications by an appropriate material processing [1, 3, 6, 7].
Quite a lot of research is devoted to the optimization of circuits made of commercially
available SMC powders [7-9]. In the present paper we focus on the possibility to develop ”home-
made” SMC cores. The paper considers the effect of varying polymer content on the magnetic
properties of self-assembled SMC cores.
II. MEASUREMENTS
Samples have been prepared from iron (99% pure Fe, granulation>150µm) powder and
suspense polyvinyl chloride PVC-S (granulation 15−100µm). Fine structure of both components
allowed us to obtain highly homogeneous mixtures. Polyvinyl chloride used as the binder has good
mechanical properties. Moreover it is resistant against the action of many solvents and is a good
electrical insulator. From the obtained mixtures cylinder-shaped samples were formed using a
hydraulic press with a self-assembled form and a band with a thermocouple for controlling heat
treatment conditions, cf. Fig. 1.
Fig.1. The material under study at different stages of preparation: a) raw Fe powder, b) PVC-S, c) the hydraulic press
with a heating band used during material processing, d) the ready-made core, e) the assembled core with windings
The first stage of research was the determination of optimal PVC content to make up stable
samples, that are able to maintain reasonably good magnetic properties. The tests were started at
20% polymer content, yet for further studies four samples with appropriately higher Fe content

- 46 -
were chosen. The raw materials were mixed using weight proportions. The PVC contents in the
final samples were equal to 0.5, 1.0, 1.5 and 2.0 %, respectively. The cylinder shaped shapes were
next subject to reticulation for 30 minutes at 165C and at pressure 200 MPa. The magnetic
properties were determined using two windings wound around the developed cores and recorded
with a digital oscilloscope.
An exemplary measured dependence of magnetic permeability on polymer content is presented
in Fig. 2. The dependence has been obtained for Bm = 1.0 T and f = 50 Hz. It can be stated that
permeability may be correlated with PVC content. It is decreased as the PVC content is increased.
The observed trend is in accordance with the results reported by other scientists [1,8].
Fig.2. The dependence of relative permeability on polymer content
REFERENCES
[1] Shokrollahi H., Janghorban K., Soft magnetic composite materials (SMCs), J. Mater. Process.
Technol., 2007, vol. 189, pp. 1-12
[2] Cvetkovski G., Petkovska L., Performance Improvement of PM Synchronous Motor by Using Soft
Magnetic Composite Material, IEEE Trans. Magn., 2008, vol. 44, pp. 3812-3815
[3] Actis Grande M., Bidulský R., Cavagnino A., Ferraris L., Ferraris P., Investigations on different
processing conditions on Soft Magnetic Composite material behavior at low frequency, IEEE Trans.
Ind. Appl., 2012, vol. 48, pp. 1335-1342
[4] Wojciechowski R., Jędryczka C., Łukaszewicz P., Kapelski D., Analysis of high speed permanent
magnet motor with powder core material, COMPEL, 2012, vol. 31, pp. 1528-1540
[5] Xiaobei Li, Jing Zhao, Zhen Chen, Application of Soft Magnetic Composite Material in the field of
electrical machines, Appl. Mech. Mater. , 2013, vol. 380-384, pp. 4299-4302
[6] Gilbert I., Bull S., Evans T., Jack A., Stephenson D., de Sa A., Effects of processing upon the
properties of soft magnetic composites for low loss applications, J. Mater. Sci., 2004, vol. 39, pp. 457-
461
[7] Ślusarek B., Szczygłowski J., Chwastek K., Jankowski B., A correlation of magnetic properties
with material density for soft magnetic composite cores, COMPEL, 2015, vol. 34, 637, pp. 1-11
[8] Kollár P., Füzer J., Bureń R., Fáberová M., AC Magnetic Properties of Fe-Based Composite Materials,
IEEE Trans. Magn. , 2010, vol. 46, pp. 467-470
[9] Jankowski B., Ślusarek B., Szczygłowski J., Chwastek K., Modelling hysteresis loops in Fe-based soft
magnetic composites using Takács description, Acta Phys. Pol. A., 2015, vol. 128, pp. 116-119

- 47 -
USING THE PHASED ANTENNA ARRAY TO INCREASE GEOMETRIC
SIZE OF THE INTERROGATION ZONE IN UHF RFID SYSTEM
P. Jankowski -Mihułowicz, D. Kawalec and M. Węglarski
Rzeszow University of Technology, Faculty of Electrical and Computer Engineering,
Department of Electronic and Communications Systems, W. Pola 2, 35-959 Rzeszow,
[email protected], http://pjanko.sd.prz.edu.pl, [email protected],
[email protected], http://wmar.sd.prz.edu.pl
Abstract.The problem to increase geometric size of theinterrogation zone in UHF RFID systems with phased antenna
array is presented in the paper. The perceived issues have been effectively dealt with and the solution has been
proposed on the basic of the elaborated model. Conducted studies have been used to develop the software tool in the
Mathcad environment. The research results are analyzed in details for different system configurations and can be
implemented in practical projects to be developed in cooperation with companies.
I. INTRODUCTION
The typical RFID system consists of a read/write device (RWD), its antenna and at least one
transponder that is intended for marking an object [1]. Communication in this system can be
provided with one or simultaneously with multiple transponders (single or anti-collision system
respectively) that can also be found in static or dynamic state (moving objects).
Fig.1. Anti-collision UHF RFID system with phased antenna array
The main parameter of RFID systems is interrogation zone (IZ) – figure 1. It is defined as the
space within which it is possible to conduct the radio transmission between RWD and transponders
intended for marking objects. The shape and size of the interrogation zone strongly depends on
many factors, e.g. RFID system band (HF/UHF), the transponder type (passive/semi-passive) and
its parameters (e.g. sensitivity), type, orientation and location of the marked object in operation
space. In each of these cases, for the correct exchange of data with a predetermined communication
protocol, a key factor is to provide energy electromagnetic field with RWD antenna to chip
transponders [1, 2].
The IZ should be estimated in any direction of 3D space (ΩID) taking into account the variable
localizations of activated transponder(s). It should be noted that a lot of issues in this regard remain
unresolved at the current stage of the contemporary knowledge.These problems are due to the fact
that many parameters and phenomena describing RFID systems have to be considered in a different
way than it is in the classical theory valid for typical radio communication systems. For this reason,

- 48 -
the authors were paid particular attention to the problem of energy transfer in RFID systems with
phased antenna array.
II. MODEL
The problem to solve is the arrangement of phasedantenna array connected to the one RWD.
The antennas have to be switched while marked objects are being identified in the inside of a cube
of side b (Fig. 2). The process of energy transfer from RWD to RFID transponders is subjected to
the analysis in the study to be carried out. The radiated electromagnetic wave of power densityS is
an energy medium supplying transponders(Fig. 1). The developed solution is the basis for IZ
determination using the Monte Carlo method.
Fig. 2. Problem of objects identification in the UHF RFID systems with RWDplanar phased antenna array
The proposed concept of increase geometric size IZ so it can be described using the features,
which includes the location of the k-th position of the main beam in relation to the n-th
transponders space ΩID:
(1)
where: FR(φk,θ,ϕ) means the radiation pattern of RWD phased antenna array, FTn(θ,ϕ) – the
transponder radiation pattern, whereas φ – the angle of phase shift in the course of feeding the
individual array antenna, PRWD- the power supplied to terminals of the impedance-matched RWD
antenna, PTmin – the minimal power, that ensures proper operation transponder, χn – the polarization
matching factor for given arrangement of radio communication antennas, τn – the coefficient of
power transfer from antenna to the chip.
ACKNOWLEDGMENTS
This work was supported in part by the NCBR under Grant No. PBS1/A3/3/2012. The work
was developed by using the equipment purchased under Grants No. POPW.01.03.00-18-012/09-00
and UDA-RPPK.01.03.00-18-003/10-00.
REFERENCES
[1] Finkenzeller K., RFID Handbook, 3rd Ed., Wiley, 2010
[2] De Vita G., Iannaccone G., Design criteria for the RF section of UHF and microwave passive RFID
transponders, IEEE Trans. Microw. Theory Tech., Vol. 53, No. 9, 2005, pp. 2978-2990

- 49 -
A COMPARISON OF DIFFERENT ESTIMATION METHODS
FOR HYSTERESIS MODELLING
R. Jastrzębski1, K. Chwastek
1, I. Biondić
2 and K. Miličević
2
1 Faculty of Electrical Engineering, Częstochowa University of Technology, ul. A.K. 17, 42-201 Częstochowa, Poland,
e-mail: [email protected] 2Faculty of Electrical Engineering, J. J. Strossmayer University of Osijek, 31000 Osijek, Croatia
Abstract. The paper focuses on the estimation of parameters for a low dimensional hysteresis model. Four artificial
intelligence based methods are compared in terms of their capabilities and robustness.
I. INTRODUCTION
An important stage of hysteresis modeling is the identification of model parameters. For this
purpose different optimization techniques, including those based on artificial intelligence methods
and soft-computing, are applied [1-3]. Improper choice of values for model parameters may result
in excessive prediction errors if other phenomena (e.g. eddy currents) are accounted [4]. On the
other hand different sets of model parameters may yield identified hysteresis loops that are quite
similar in shape [5]. The present paper is aimed at development of a methodology to choose an
optimum procedure to estimate the parameters of a low dimensional hysteresis model, described in
Refs. [6-8].
II. MODEL DESCRIPTION
The description advanced by Jiles and Atherton [9] has attracted a lot attention of the scientific
community in the last thirty years. In the present paper we focus on its modification proposed by
the Brazilian team GRUCAD [6,7], which has addressed a number of problems with the original
description. As pointed out in Ref. [10], in the original Jiles-Atherton model the loop branches are
obtained by introducing offsets along the M-axis. On the contrary, the GRUCAD proposal is based
on introducing offsets along the H-axis from the so-called anhysteretic (truly reversible) curve.
Therefore the latter model yields an improved description of reversible magnetization processes in
the sense of thermodynamics, for example there is no need to introduce artificial “switching off” of
the irreversible magnetization component after sudden field reversals. Another practical advantage
of the GRUCAD description is its formulation directly as B-input model, what is in compliance
with international standards concerning magnetic measurements.
The model equations are:
/1coth/ s0an MBH (1)
0
an11 B
Ha
(2)
HHHSh /1cothHH (3)
tBHH
/dd ofsign theis 1 where,HShH (4)
han HHH (5)
The model parameters are HS,,, Ha and .sM

- 50 -
III. COMPARISON OF DIFFERENT ESTIMATION TECHNIQUES
In order to compare the efficiency of different estimation techniques we propose the following
procedure:
1. estimation of model parameters using a generated loop with a priori preset parameters,
2. the same as in previous point, but an artificially generated noise is added to the values for
the reference point to simulate inevitable measurement errors,
3. estimation of model parameters for a real life sample.
For comparison we choose the following methods: Particle Swarm Optimization, Nonlinear
Simplex + Simulated Annealing, Shuffled Complex Evolution Approach and Genetic Algorithms.
The first three algorithms have been implemented by B. Donckels [11] and the codes have been
tested using chosen benchmark functions in Ref. [12]. The fourth method has been implemented as
a freeware Matlab toolbox by Houck et al. [13].
REFERENCES
[1] Riganti Fulginei F., Salvini A., Softcomputing for the identification of the Jiles-Atherton model
parameters, IEEE Trans. Magn. 41 (2005) 1100-1108
[2] Chwastek K., Szczygłowski J., Estimation methods for the Jiles-Atherton model parameters - a review,
Przegl. Elektrotechn. 12 (2008) 145-148
[3] Naghizadeh R.-A., Vahidi B., Hosseinian S.H., Parameter identification of Jiles-Atherton model using
SFLA, COMPEL 31 (2012) 1293-1309
[4] Steentjes S., Petrun M., Dolinar D., Hameyer K., Effect of parameter identification procedure of the
static hysteresis model on dynamic hysteresis loop shapes, IEEE Trans. Magn. (2016)
doi:10.1109/TMAG.2015.2511800
[5] Lozito G.M., Salvini A., An empirical investigation on the static Jiles-Atherton model identification by
using different set of measurements, Published in: AEIT Annual Conference - From Research to
Industry: The Need for a More Effective Technology Transfer (AEIT), 2014, 18-19 Sept. 2014, Trieste,
Italy, pp. 1-6, doi:10.1109/AEIT.2014.7002045
[6] Koltermann P.I., Righi L.A., Bastos J.P.A., Carlson R., Sadowski N., Batistela N.J., A modified Jiles
method for hysteresis computation including minor loops, Physica B 275 (2000) 233-237
[7] Righi L.A., Sadowski N., Carlson R., Bastos J.P.A., Batistela N.J., A new approach for iron losses
calculation in voltage fed time stepping finite elements, IEEE Trans. Magn. 37 (2001) 3353-3356
[8] Steentjes S., Chwastek K., Petrun M., Dolinar D., Hameyer K., Sensitivity analysis and modeling of
symmetric minor hysteresis loops using the GRUCAD description, IEEE Trans. Magn. 50 (2014) doi:
10.1109/TMAG.2014.2323250
[9] Jiles D.C., Atherton D.L., Theory of ferromagnetic hysteresis, J. Magn. Magn. Mater. 61 (1986) 48-60
[10] Zirka S.E., Moroz Yu.I., Harrison R.G., Chwastek K., On physical aspects of the Jiles-Atherton
hysteresis models, J. Appl. Phys. 112 (2012) 043916 (7 pp.)
[11] Oldenhuis R., 2009. GODLIKE Matlab toolbox. Available from:
https://www.mathworks.com/matlabcentral/fileexchange/24838-godlike-a-robust-single---multi-
objective-optimizer?requestedDomain=www.mathworks.com

- 51 -
STUDY ON RAYLEIGH HYSTERESIS MODEL AND ITS APLICABILITY
IN MODELLING MAGNETIC HYSTERESIS PHENOMENON IN
FERROMAGNETIC MATERIALS
M. Kachniarz and R. Szewczyk
Institute of Metrology and Biomedical Engineering, Warsaw University of Technology, sw. Andrzeja Boboli 8,
02-525 Warsaw, Poland; [email protected]
Abstract. The following paper presents the basis of Rayleigh magnetic hysteresis model and its application for
modeling magnetic characteristics of different ferromagnetic materials. Moreover, the range of magnetizing field
where Rayleigh model can be applied in these materials was investigated based on correlation coefficient between
experimental results and modeling.
I. INTRODUCTION
Modeling magnetic properties of ferromagnetic materials is very important matter in
modern physical science as well as in technical applications of magnetic materials. There are
several approaches to the subject of modeling magnetic hysteresis phenomenon, one of the most
popular being Jiles-Atherton model and Preisach model [1]. However, there is still a need to
developed more simplified models, which would allow to easily simulate magnetic properties of
the materials for technical purposes. One of the possible solutions to this problem is so-called
Rayleigh hysteresis model basing on second order polynomial equations.
II. RYLEIGH HYSTERESIS MODEL
Rayleigh model utilizes parabolic curves and second order polynomials to approximate
hysteresis loop [2]. This model is very simple, but partially considers physical phenomenon
occurring during magnetization process. Model is based on the second order equation describing
initial magnetization curve (known as Rayleigh law of magnetization) [3]:
200)( HHHB Ri (1)
where B is magnetic flux density, H is magnetizing field and μ0 is magnetic permeability of free
space. There are also two material constants: Rayleigh coefficient αR and initial relative magnetic
permeability μi, being coefficients of the equation. In Rayleigh‟s approach hysteresis loop is
described by the system of two second order equations:
)](2
)[()( 220 HHHHHB m
RmRi (2)
where Hm is amplitude of magnetizing field. On the basis of presented equations there is a
possibility to calculate values of basic magnetic parameters of the material like coercive field,
magnetic remanence and power losses in certain volume of the material.
While for high magnetizing field Rayleigh model is not satisfactory because of low correlation
between hysteresis loop and parabolic curves, this model is a very good approximation of
hysteresis loop obtained for low magnetizing fields, lower than saturation coercive field. For such
fields, hysteresis loop exhibits lenticular shape, which could be well approximated with two
intersecting parabolic curves.

- 52 -
III. EXPERIMENTAL RESULTS AND MODELING
One of the investigated materials was 13CrMo4-5 constructional steel characterized by
saturation magnetic flux density Bm = 1.5 T, coercive field Hc = 670 A/m and initial relative
magnetic permeability μ = 250. The material was investigated for the range of magnetizing field
amplitude Hm from 100 A/m to 700 A/m. Experimental results compared with modeling data for
three selected values of Hm are presented in Fig. 1a.
Fig.1. a) Selected hysteresis loops for 13CrMo4-5 steel: red line – measurement data, black line – model
b) Dependence of coreleation coefficient R2 between experimental data and model on the value of magnetizing filed
amplitude
For low magnetizing fields, results of modeling and measurement are consistent, which is
confirmed by high determination coefficient R2 between measurement and modeling results
presented in Fig. 1b. For higher fields, over 400 A/m, model is no longer consistent with
measurement data, because for such fields dependence between magnetic flux density and
magnetizing field starts to lose its initial parabolic character.
IV. CONCLUSION
During performed investigation possibility of application of Rayleigh hysteresis model was
tested for several different ferromagnetic materials, one being 13CrMo4-5 constructional steel.
Obtained results indicate that model is correct for initial range of magnetizing field of values lower
than saturation coercive field Hc for the material. In the case of investigated steel the limit of
magnetizing field, where the model is correct (determination coefficient R2 between measurement
and modeling results is higher than 0.9), is 410 A/m, which is about 0.7 value of the saturation
coercive field Hc = 670 A/m for the material. For higher fields, the nature of dependence between
magnetic flux density and magnetizing field differs too much from its initial parabolic character to
be still described with Rayleigh model.
It should be indicated that Rayleigh model is simple enough to be utilized in technical
applications, especially for modeling parameters of ferromagnetic cores of inductive components in
electronic devices, which are usually working with relatively low magnetizing fields.
REFERENCES
[1] Liorzou, F., Phelps B., Atherton D.L., Macroscopic Models of Magnetization, IEEE Transactions on
Magnetics, vol. 36, no. 2, 2000, 418-428
[2] Jiles D.C., Introduction to Magnetism and Magnetic Materials, CHAPMAN&HALL/CRC, London,
1998
[3] Lord Rayleigh, On the behavior of iron and steel under the operation of feeble magnetic forces,
Philosophical Magazine and Journal of Science, vol. 23, no. 142, 1887, 225-245

- 53 -
MR CLUTCH WORK CONTROL IN HIL LOOP USING A DSP
PROCESSOR
P. Kielan and Z. Pilch
Faculty of Electrical Engineering, Mechatronic Department, Silesian University of Technology,
44100 Gliwice, Poland, [email protected], [email protected]
Abstract. The paper presents concept of the HiL loop building with DSP processor. This system is dedicated for MR
clutch control work. Temperature determined changes electric, magnetic and rheological properties for MR clutch.
These changes have an influence on the value of engaging torque clutch.
I. INTRODUCTION
Varying viscosity fluids (magnetorheological, electrorheological) belong to one of the groups
of smart materials. This type of fluid in magnetic field works in three different mode (flow mode,
compressing mode and clutch mode) [5]. In the present case, we will be interested in the flow-type
clutch mode.
Magnetorheological fluid properties are determined by the shear stress τ [6] as functions of
flux density B – curve in Fig.1.
Fig.1. The shear stress τ as a functions of flux density B curve for MRF-140CG fluid
Other parameters of the liquid MRF-140CG [6]: density 3,54-3,74[g/cm3], working
temperature -40 do 130[OC], flash-point >150[
0C].
According to the Bingham model, which describes the change in the tension of the magnetic
fluid [1]:
dt
γdμBτ
dt
γdτ 0sgn (1)
where: - shear stress in the liquid, 0(B) - limiting shear stress-dependent induction of B, -
dynamic viscosity of a liquid (non-magnetic induction B), - shear deformation of the liquid.
The value of torque transmitted through the clutch depends on the shear stress τ. The full
expression for the torque transmitted by the clutch, take into account the velocity shear in the liquid
takes the form:
dt
dBRRiT tcz 0
3
1
3
23
4 (2)
where: itcz - number of clutch discs, R2, R1 - outer and the inner radius of clutch discs.

- 54 -
In use, the coupling heat is produced. It is the result of mechanical losses. Losses are incurred
by slipping between the clutch discs in the liquid [2], [3]. They are also due to friction in the
bearings [3]. These losses converted into heat increase the temperature of the liquid and all
components of the coupling.
II. CONCEPTION OF THE HIL LOOP
The temperature increase causes the:
increase the resistance of the power supply circuit clutch coil (using a constant voltage
source - decline in current),
decline in the value of current to decrease the magnetic induction in the magnetic circuit
coupling,
decrease the viscosity of the MR fluid [4] which affect the component of stress (or torque)
in a state of slip.
Fig.2. The concept of the HiL loop building with DSP processor
III. SUMMARY
In the paper presented concept of the HiL LOOP with DSP processor. The system adjusts the
parameters of the power coupling in order to maintain a constant torque coupling.
REFERENCES
[1] Claracq J., Sarrazin J., Montfort J.p., Viscoelastic properties of magnetorheological fluids. Rheol Acta
(2004) 43: 38–49 DOI 10.1007/s00397-003-0318-7.
[2] Hou You Fu Tian Zu Zhi Wang Nan Nan, The Steady-state and Transient Temperature Field of a
Magnetorheological Fluid Transmission Device. International Conference on Computer, Mechatronics,
Control and Electronic Engineering (CMCE), pp. 149-153, 2010.
[3] Pilch Z., Analysis of Established Thermal Conditions for Magnetorheological Clutch for Different
Loading Conditions., ISBN-13: Analysis and Simulation of Electrical and Computer Systems. Springer
International Publishing. 2015/1/1. p. 197-213, ISBN-13: 978-3-319-11247-3.
[4] Potoczny M.: Ciśnienie krytyczne i opory ruchu w uszczelnieniach z cieczą magnetoreologiczną.
Rozprawa doktorska. Akademia Górniczo-Hutnicza, Kraków 2012r.
[5] Szeląg W.: Electromagnetic converters with magnetorheological fluid (in polish), Publishing House of
Poznan University of Technology, Poznań, 2010.
[6] Information materials LORD Corporation: www.rheonetic.com

- 55 -
STRUCTURAL AND MAGNETIC STUDIES OF THE Fe-Co-Zr-Mo-W-B
AMORPHOUS ALLOY
K. Kotynia1, P. Pawlik
1, M. Hasiak
2, M. Pruba
1 and K. Pawlik
1
1Institute of Physics, Częstochowa University of Technology, Czestochowa, Poland,
[email protected], [email protected], [email protected], [email protected] 2Department of Mechanics and Materials Science, Wrocław University of Science and Technology, Wrocław, Poland,
Abstract. The paper presents characterization of microstructure by X-ray diffraction, Mӧ ssbauer spectroscopy and
isothermal magnetic entropy changes in the bulk amorphous Fe58Co10Zr10Mo5W2B15 alloy in the as-quenched state.
Ingot samples were obtained by arc-melting under the low pressure of Ar atmosphere. The magnetic measurements at
various temperatures allowed to study the Curie temperature TC, magnetic entropy changes ΔSMand relative cooling
power (RCP). XRD analysis and Mӧ ssbauer spectroscopy revealed fully amorphous structure of the ribbon samples.
Those results indicate its good glass forming ability (GFA).
I. INTRODUCTION
Iron based metallic glasses have attracted great attention of researchers, due to their good
magnetic and mechanical properties as well as possibility of utilizing of the magnetocaloric effect.
There are three main factors alloying to estimate potential of magnetocaloric materials: the
magnetic entropy change ΔSM, the adiabatic temperature change ΔTad and refrigerant
capacity (RC). An ideal magnetic refrigerant has to possess large values of both ΔSMand
ΔTad as well as the and RCP around room temperature at low magnetic field. The
magnetocaloric effect (MCE) is significant mostly at around the phase transition temperature. In
most materials it is the Curie temperature (TC). The search for new magnetocaloric material for
commercial applications has concentrated mainly on tunable TC and reasonable MCE. A promising
iron based alloy with good GFA is Fe58Co10Zr10Mo5W2B15. By changing the Fe and Co ratio it is
possible to modify TC for this type of materials to get its value around room temperature [1].
The Fe-Co-Zr-Mo-W-B sample used in this work was obtained by arc-melting of the mixture
of high purity (99,98 %) constituent elements Fe, Co, Zr, Mo, W with the addition of pre-alloyed
Fe-B. Ingot was re-molten at least seven times to guarantee the homogeneity of the alloy.
The ribbon was prepared by melt-spinning technique at surface velocity of the copper roll of
40 m/s. All the arc-meting and melt-spinning were performed under Ar atmosphere to avoid
oxygenation.
The phase structure was investigated by X-ray diffractometry (XRD) using Bruker D8
Advance with CuK radiation and the LynxEye semiconductor detector. The data were recorded
using the step-scanning method in 2Ɵ range from 30 to 120 degrees. Mӧ ssbauer spectrum was
measured at room temperature using Polon Mӧ ssbauer spectrometer with a 57
Co(Rh) source of the
activity of 50 mCi in transmission geometry. It was subsequently analyzed using WiNormos for
Ingot software.
Magnetic measurements M(H) in the temperature range 225-325 K were performed and the
magnetocaloric effect (MCE) was estinated by calculation of the field dependences of magnetic
entropy change −ΔSM. Its reaches maximum value of 0.495 Jkg-1
K-1
for the maximum change
of external magnetic field of 2 T. The magnetic entropy change −ΔSM was calculated using the
formula:
.

- 56 -
The investigation of the −ΔSMis one of the methods which allows to obtain information about
the magnetic phase transition in these materials.
REFERENCES
[1] Pawlik P., Rola składu chemicznego i procesu wytwarzania w kształtowaniu właściwości
magnetycznych masywnych amorficznych i nanokrystalicznych stopów żelaza, Prace naukowe
Wydziału Inżynierii Procesowej, Materiałowej i Fizyki Stosowanej, Politechnika Częstochowska,
Monografia 12, Częstochowa 2011

- 57 -
UNCERTAINTY OF THE MAGNETIC FLUX LINKAGES
MEASUREMENTS PERFORMED WITH THE USE
OF THE MODIFIED CURRENT DECAY TEST
Z. Kowalik
Department of Mechatronics, Faculty of Electrical Engineering, Silesian University of Technology,
Akademicka 10A, 44-100 Gliwice, [email protected]
Abstract. The paper presents methodology of estimation of the uncertainties of the magnetic flux linkage
measurements, when the flux linkages waves, rather than a single values, are measured and computed. The computed
uncertainties are then used to estimate the quality of the approximation of current-flux characteristic in the
mathematical model of an electrical machine when the approximation is based on measurements results.
I. INTRODUCTION
Mathematical models of electrical machines require the determination of the relation between
currents in the windings of the machine and flux linkages in these windings. In the models that take
into account the nonlinearities of the magnetization curve, the most convenient way to do it is to
approximate the current-flux characteristic, i.e. the vector function, that for a given vector of phase
currents assigns a corresponding vector of flux linkages. Such an approach is used in the
Hamiltonian model of an electrical actuator [1].
In the Hamiltonian model the current-flux characteristic can be approximated using simplicial
approximation [2]. It requires corresponding sets of points in the spaces of flux and currents and
the division (triangulation) of both spaces based on those points. The sets of points can be obtained
for a fixed rotor angular position using a measuring procedure that is a modification of the current
decay test.
In the paper an estimation of uncertainties of the approximation of the current-flux
characteristic, based on sets obtained with the use of measurement results, is presented. First, the
measuring method is briefly described, followed by the estimation of the uncertainties of physical
quantities that are computed using its results. The results of the measurements and computations,
done for the prototype Synchronous Reluctance Machine (SynRM) are presented. In the extended
paper the impact of these uncertainties on the quality of the approximation of the flux-current
characteristic and its influence on the mathematical model of the electrical machine will be
discussed.
II. METHOD OF MEASUREMENT
The measurements of the flux linkages in the windings of the machine are performed with the
fixed angular position of the rotor. For a three-phase machine with phase windings in a wye
configuration, the electrical state of the machine is given by two phase currents values and two
corresponding generalized flux linkage values. The measuring procedure for obtaining these values
consists of setting the specified currents values in the machine windings, followed by short-circuit
of them and registration of the decaying current waves. Corresponding flux linkage waves are
obtained by integration of the current waves multiplied by phase resistances. The result of a single
measurement, done with the use of this method, is a pair of corresponding trajectories, one in the
space of fluxes and one in the space of currents. From this pair of trajectories several points can be
chosen to be included into the sets required by the simplicial approximation. The selection of
points is based on the magnetic field coenergy calculations. The method of measurement and
selection of points building the required sets of points is described in literature [3]. The laboratory
stand that was used during the measurements is described in [4].

- 58 -
III. UNCERTAINTIES OF CURRENT AND FLUX LINKAGES MEASUREMENTS
In the calculation of uncertainties of current measurements standard procedures [5]
uncertainties were used to obtain the uncertainty of every sample of the measured wave. That way
the uncertainty designates the area of the space of currents, where the measured trajectory should
be located. This uncertainty affects the uncertainty of the calculated flux linkages and designates
analogous area in the space of fluxes. The uncertainty of flux linkages are calculated by an
integration of the current uncertainties and thus are bigger for big values of fluxes due to bigger
integration interval. During the calculation great emphasis should also be put on designating the
time, after which the current and flux linkages waves are assumed to be 0. In the paper this time
was the time after which, for the particular pair of trajectories, the calculated coenergy value
diminished to 0.25% of its initial value.
Fig.1. Points chosen to approximate the current-flux characteristic
and an exemplary pair of corresponding trajectories
From the measured trajectories several points were chosen to construct sets
for the approximation of the current-flux characteristic. The chosen points with error bars are
presented in the figure 1, along an exemplary pair of corresponding trajectories in both spaces and
the areas of these spaces determined by the calculated uncertainties. The uncertainties of the flux
and current values in the chosen points are determined similarly. Final average relative
uncertainties of flux linkages values is approximately equal to 15%. The influence of these
uncertainties on the flux-current characteristic approximation quality will be discussed in the
extended paper.
REFERENCES
[1] Burlikowski W., Hamiltonian model of electromechanical actuator in natural reference frame, Part
1&2, Archives of Electrical Engineering, vol. 60(3), 2011, pp. 317-348
[2] Agoston M. K., Computer Graphics and Geometric Modeling - Mathematics, Springer, 2005
[3] Kowalik Z., Measurement Results Based Approximation of the Nonlinear Flux-Current Characteristic
of an Electromechanical Actuator, Measurement Automation Monitoring, vol. 02/2016, 2016, pp. 49-54
[4] Burlikowski W., Kohlbrenner L., The Measurement Test for the Identification of Current – Flux
Linkage Characteristics in Synchronous Reluctance Motors, Measurement Automation Monitoring, vol.
01/2016, 2016, pp. 33-36
[5] Expression of the Uncertainty of Measurement in Calibration, Główny Urząd Miar, Warszawa,
2001

- 59 -
EQUIVALENT-CIRCUIT APPROACH
TO MR MULTI-DISC CLUTCH DESIGNING AGAINST
THE BACKGROUND OF MAGNETIC FIELD CALCULATION
P. Kowol and K. Kluszczyński
Silesian University of Technology, Faculty of Electrical Engineering, Department of Mechatronics,
ul. Akademicka 10A, 44100 Gliwice, Poland,
[email protected], [email protected]
Abstract. In the paper clutches with magnetorheological fluid (MR clutches) are presented and the design methodology
of MR clutch is depicted. Two methods of magnetic calculations (equivalent-circuit and FEM) which are a leading part
of design process are described and compared.
I. INTRODUCTION
Magnetorheological fluids (MR fluids) belong to the group of Smart Materials [3]. The feature
of the MR fluids which can be controlled with the help of external magnetic field (generated by
excitation winding or permanent magnet) is viscosity: the stronger magnetic field, the greater
viscosity. Because of this property MR fluids have found different applications in dampers and
brakes [1]. Very promising application seems to be MR clutches in which process of engaging two
mechanical parts is brought to applying electrical or magnetic signal. As regards the structure of
MR clutches, they can be divided in to two basic types: cylindrical structure or disc structure [1,2].
Disc structure can include one disc (number of discs N=1) or more discs (multi-disc construction
with N>1) [2,5]. The authors focus their attention on multi-disc constructional solution. The
example of 3-disc MR clutch is presented in Fig.1a (because of symmetry there is sufficient to
consider only half of cross-section).
a)
b)
c)
Fig.1. For the MR multi-disc clutch: a) axisymetric cross-section with characteristic points of magnetic circuit
(A, B, C) and geometric parameters, b) equivalent magnetic circuit with characteristic points of magnetic circuit,
c) magnetic field model made in FEM software
II. MAGNETIC CALCULATIONS IN MR CLUTCH DESIGN PROCESS
The design methodology of the MR clutch have to take into account calculations of different
nature: magnetic calculations, mechanical calculations and fluid-dynamic calculations. Of course,
magnetic calculations play leading role because clutching torque TC (developed by the MR clutch)
depends mainly on magnetic field distribution.
The shape of MR clutch is characterized by the following constructional data: R1, R2, R3, R4,
LM, LC, G, d, g marked in Fig.1a. The number of discs N and thickness of single disc d are

- 60 -
concerned as constructional variables. Magnetic calculations are aimed at finding optimal number
of discs N and their thickness d.
III. CALULATIONS OF MAGNETIC FIELD AND CLUTCHING TORQUE
Magnetic calculations can be performed according to two methods: equivalent-circuit
approach (E-C method) [2,5] and field approach (FEM method) [1,2]. As regards E-C method,
calculations (based on algebraic equations) are carried out under the following assumptions: B-H
curve is linear and cross-sectional distribution of magnetic field along the selected parts of a core is
homogenous. Advantages of such an approach are simple algorithm and direct dependencies
between constructional variables and geometrical/material data. As far as FEM field calculation are
concerned, nonlinearity of magnetic circuit is taken into account and knowledge about real
magnetic field distribution allows to find location of the most saturated points of magnetic core (as
a result, the designer can avoid saturation in each part of magnetic circuit).
The clutching torque TC can be determined according to the equation S
dSBrT )(0C on the
basis of magnetic field calculations (value of magnetic flux density B in point C denoted in Fig.1a),
yield stress of the MR fluid τ0 (depending on B) [4] and geometrical clutch data (disc radius r and
facing area of the disc S).
The results of calculations on magnetic field in the MR clutch (magnetic flux density B in
point C) and clutching torque TC for the selected number of discs N and different thickness of the
single disc d are put together in Tab.1. Table 1 enables to compare results of calculations
performed according to the E-C method (B-H curve is linear) and FEM method (B-H curve is
nonlinear). Calculations according to E-C method and FEM method lead to the results differing no
more than 27%. It means that the introductory values of N and d can be determined on the basis of
the simplified E-C algorithm and then (after choosing the optimal variant) additional calculations
employing FEM method have to be carried out again in order to determine exact value of clutching
torque TC. Good compatibility of the both considered method is the reason that the authors decided
to elaborate the design algorithm basing on E-C approach which in their opinion will be very useful
in quick finding range of optimal solutions.
Table 1. Results of calculations of magnetic field B and clutching torque TC for multi-disc MR clutch
Equivalent circuit FEM
N d Θ B TC B TC
mm A T N·m T N·m
2 4 226 0.354 4.47 0.324 3.41
3 3 307 0.342 6.25 0.332 5.23
4 2 323 0.284 5.57 0.306 5.85
5 2 419 0.300 7.85 0.321 8.04
REFERENCES
[1] Jędryczka C., Sujka P., Szeląg W., The influence of magnetic hysteresis on magnetorheological fluid
clutch operation, COMPEL, Vol. 28, No. 3, 2009, pp. 711-721
[2] Karakoc K., Park E.J., Suleman A., Design considerations for an automotive magnetorheological brake,
Mechatronics, Vol. 18, No. 8, 2008, pp. 434–447
[3] Kim K.J., Lee C. W., Koo J.H., Design and modeling of semi-active squeeze film dampers using
magneto-rheological fluids, Smart Materials and Structures, Vol. 17, No. 3, 2008, 12 pp.
[4] Lord Corporation, Product Bulletins: www.lord.com
[5] Shafer A.S., Kermani M.R., On the feasibility and suitability of MR fluid clutches in human-friendly
manipulators, IEEE/ASME Transactions on Mechatronics, Vol. 16 , No. 6, 2011, pp. 1073–1082

- 61 -
PREPARATION AND MAGNETIC CHARACTERISTICS
OF Co1-δZnδFe2O4 FERRITE NANOPOWDERS
M. Kubisztal, I. Herok, M. Karolus, K. Prusik and G. Haneczok
Institute of Materials Science, University of Silesia, ul. 75 Pułku Piechoty 1A, 41-500 Chorzów,
I. INTRODUCTION
Magnetic nanoparticles are of significant interest in fundamental research and find many
industrial applications. One can mention about their high catalytic activity and applications in drug
delivery systems or as contrasts in MRI technology. Especially interesting are magnetic oxide
nanoparticles (MNp) with mixed spinel type structure and chemical composition
(M1-δFe1-δ)A[M1-δ Fe1-δ]
BO4 where M denotes Co, Zn, Mn, Cu etc. and the brackets A and B stand
for tetrahedral and octahedral sites, respectively. In that case unique properties are consequence of
exceptional combination of crystalline structure and nanosized dimensions
of a singular particle [1-5]. Nevertheless, functional characteristics of magnetic oxide nanoparticles
can be controlled by technological parameters applied in process of production. In our work we
have synthesized Co1-δZnδFe2O4 ferrite nanopowder (0 ≤ δ ≤ 1) by applying standard chemical
technique based on co-precipitation of nanoparticles in water solutions at given temperature TR,
flow rate νFR and nanopowder concentration c = Vp/( VR + Vp)·100 % (where Vp and VR denote the
volume of co-precipitated nanopowder and water, respectively), we have used: TR = 50 0C, 70
0C
and 90 0C, νFR = 1 cm
3/min. and 120 cm
3/min. and c = 0.1 % and 0.3 %. The applied technique
allows obtaining ferrite particles with mean particle size (dependently on applied technological
parameters) in nanometer scale. Note that controlling of nanoparticle size is important problem in
nanotechnology as in nanoscale the properties of the final material strongly depend on size.
Magnetic measurements were performed by applying VSM Quantum Design apparatus operating
in temperature range 2 – 400 K and at magnetic field up to 7 T.
II. RESULTS
Fig. 1a presents the relation of magnetization M vs. magnetic field µ0H obtained for
Co1-δZnδFe2O4 ferrite nanopowders. It can be seen that the registered hysteresis characterize high
symmetry with coercive field ranging from 0.05 T to 0.9 T dependently of Zn content. However,
even in high magnetic field (up to 7 T) saturation in magnetization is not reached. Fig. 1b presents
the relation of M7T vs. Zn content δ obtained for ferrite nanopowders synthesized with νFR= 120
cm3/min., c = 0.3 % and at different reaction temperature TR. In that case, for TR = 70
0C and 90
0C
we observe a broad peak with maximum located at δ = 0.2 and with value M7T c.a. 80 emu/g.
However, for TR = 50 0C the maximum is shifted to higher values of δ (i.e. 0.6) and reaches
significantly lower M7T i.e. 60 emu/g. Such result suggests that magnetic characteristics of ferrite
Co1-δZnδFe2O4 nanopowder may be tailored by proper placing of Co2+
, Zn2+
and Fe3+
ions in A and
B sites of the spinel structure, where according to the Néel theory of materials with two magnetic
sublattices the resultant magnetic moment µR of the sample is equal to µB-µA. Fig 1c shows the
squareness of the loop defined as S = Mr/M7T (Mr - magnetic remanence) plotted versus Zn content
δ. Increase in δ results in strong decrease in S, which means that addition of nonmagnetic ions of
zinc influences the magnetization processes related with applied external magnetic field µ0H. Note
that the observed change in S reaches 80 %. Fig. 1d presents the relations of Néel temperature
TN vs. Zn content δ obtained for Co1-δZnδFe2O4 nanopowder synthesized at different TR. Here,
increase in δ results in strong decrease in TN and the observed change is from 780 K (δ = 0) to 465

- 62 -
K (δ = 1). In the case of Co1-δZnδFe2O4 ferrite nanopowder with δ > 0.6 measured TN almost does
not depend on applied reaction temperature TR.
Fig.1. Magnetic characteristics of Co1-δZnδFe2O4 nanopowders a) magnetization M vs. magnetic field µ0H (5 K),
b) magnetization M7T determined in magnetic field µ0H = 7 T (5 K) vs. Zn content δ, c) squareness ratio
S = Mr/M7T (5 K) vs. Zn content δ and d) Néel temperature TN vs. Zn content δ; TR - temperature of chemical reaction,
c - nanopowder concentration in reactant solution.
REFERENCES
[1] Sozeri H., Durmus Z., Baykal A., Structural and magnetic properties of triethylene glycol stabilized
ZnxCo1-xFe2O4 nanoparticles, Materials Research Bulletin, 47, 2012, 2442-2448
[2] Raut A.V., Barkule R.S., Shengule D.R., Jadhav K.M., Synthesis, structural investigation and magnetic
properties of Zn2+
substituted cobalt ferrite nanoparticles prepared by the sol–gel auto-combustion
technique, Journal of Magnetism and Magnetic Materials, 358-359, 2014, 87-92
[3] Raeisi Shahraki R., Ebrahimi M., Seyyed Ebrahimi S.A., Masoudpanah S.M., Structural
characterization and magnetic properties of superparamagnetic zinc ferrite nanoparticles synthesized by
the coprecipitation method, Journal of Magnetism and Magnetic Materials, 324, 2012, 3762-3765
[4] Deraz N.M., Alarifi A., Structural, morphological and magnetic properties of nano-crystalline zinc
substituted cobalt ferrite system, Journal of Analytical and Applied Pyrolysis, 94, 2012, 41-47
[5] Upadhyay R.V., Parmar H., Acharya P., Banerjee A., Progressive freezing of finite cluster in locally
canted spin Co0.3Zn0.7Fe2O4 spinel ferrite system, Solid State Communications, 163, 2013, 50-54

- 63 -
INVESTIGATION OF THERMO-MECHANICAL BEHAVIOR
IN SHAPE MEMORY ALLOY ACTUATOR
M. Kurzawa and D. Stachowiak
Poznan University of Technology, Piotrowo 3a, 60-965 Poznań, Poland,
[email protected], [email protected]
Abstract. In the paper, the thermo-mechanical behavior of shape memory alloy wire actuator has been studied. The
cycle of heating and cooling has been performed under a constant load. The selected results and conclusions have
been presented. The proposal of a concept of the linear actuator using the shape memory alloy wire has been given.
I. INTRODUCTION
The shape memory alloys (SMAs) are functional materials, which can be applied in many
applications like the linear actuators due to their large strain recovery, high stiffness and strength
[1,2]. The SMA materials have the ability to change of their shape in depending on the
transformation temperatures. In this type of materials two crystalline structures can be
distinguished (a) mertensite (M) which is the thermodynamically stable at lower temperature and
(b) austenite (A), which is the parent phase stable for higher temperature. The SMA materials in
the martensite phase have the crystal structure with simply symmetry, such as tetragonal,
rhombohedral, orthorhombic, monoclinic or triclinic depending on the composition of the alloy,
whereas in the austenite phase has a higher symmetry usually based on a cubic lattice [1,2]. SMAs
are characterized by the four temperatures, i.e. the start and finish transformation temperatures: Ms,
Mf (martensite start and finish) and As, Af (austenite start and finish).
The paper deals with the thermo-mechanical behavior of a linear actuator, in which as active
element has been applied the SMA wire from the Nitinol (Ni-Ti). The goals of the paper are the
discussion of the thermo-mechanical properties of Nitinol material and the proposal of a concept of
the linear actuator using the Nitinol wire. The SMA wire is the most commonly applied form for
these actuators because of its ease of use and convenient electrical activation.
II. THE ELABORATED EXPERIMENTAL SETUP
The application of SMA wire as active element of actuator is only possible if the
characterizations under various operating conditions are known. Therefore, the Authors elaborated
the special experimental setup for the investigation of the SMA wire properties. The view and
schematic block diagram of the used experimental setup have been shown in Figure 1. The changes
of wire length have been measured by the Potentiometric Linear Transducer (PLT) displacement
sensor, which has been placed series to SMA wire.
(a)
(b)
Fig.1. The experimental setup: a) view, b) block diagram

- 64 -
III. RESULTS AND CONCLUSIONS
In order to obtain the thermo-mechanical properties and parameters of SMA wire, the
experimental setup has been carried out. The SMA wire of type „Flexinol LT‟ has been considered,
for which the diameter was 0.25 mm and length was 135 mm.
The power supply QPX600DP (80 V, 50 A) was chosen to the linear SMA actuator. It allows
for stabilization of the value of current (I) as well as voltage (U). The Joule-heating of the wire and
its subsequent contraction are produced by current that flows through the wire. Both values of U
and I are measurable in real-time therefore, electrical resistance R = U/I can also be computed in
real-time. Three thermocouples (K type) have been used to measurement the wire temperature.
Figure 2 shows the obtained displacement – temperature hysteresis for the considered material
under constant load. The temperature and displacement of the SMA wire registered during the
heating and cooling cycle have been given in Figure 3. The displacement curve shows that wire is
shortening by 2.35 mm (1.75 %) from initial length of 135 mm. The SMA wire elongation and
shortening are induced both mechanically and thermally.
Fig.2. Displacement - temperature hysteresis at applied
load (Q = 0.1 kg)
Fig.3. The temperature and displacement of the SMA
wire registered during the heating and cooling cycle
Based on the obtained results and the thermo-mechanical properties of the shape memory alloy
the project of thermal circuit switch of SMA wire actuator has been elaborated and built (Fig. 4).
The special control system of the current value as a function of the resistance and temperature of
SMA wire has been designed and elaborated.
The more details about the obtained characteristics and results for the considered SMA
material will be presented in the extended version of the paper.
(a)
(b)
Fig.4. Example of the SMA wire use: a) view of the setup, b) driver diagram
REFERENCES
[1] Lagoudas D.C., Shape Memory Alloys: Modeling and Engineering Applications. Springer, 2008
[2] Barbarino S., Saavedra Flores E.I., Ajaj R.M., Dayyani I. and Friswell M.I., A review on shape
memory alloys with applications to morphing aircraft. Smart Materials and Structures 23, 063001
(19pp), 2014

- 65 -
MAGNETIC PROPERTIES OF Co-Fe-Si-B MICRO-WIRES
P. Kwapuliński1, J. Gieraltowski
2, C. Dolabdjian
3, Z. Stokłosa
1 and G. Haneczok
1
1 University of Silesia, Institute of Materials Science, Chorzów, 75 PułkuPiechoty 1A, [email protected]
2 LDO/IUEM UMR CNRS 6538, UEB, Université de Bretagne Occidentale, Place Copernic, Technopôle
Brest-Iroise, 29280 Plouzané, France. 3 Normandie Univ., France; UCBN, GREYC, CNRS, UMR 6072, F-14032 Caen, France
I. INTRODUCTION
Cobalt based amorphous micro-wires belong to new magnetic materialsshowing agiant
magneto-impedance effect. One of the most promising applications of these materials are magnetic
sensors of very high sensitivity [1-6].In the present paper magnetic properties i.e. magnetization
curves, observation of domain structure (magneto-optic Kerr effect), contact and non-
contactmagneto-impedanceeffects for the Co68.15Fe4.35Si12.55B15micro-wire (diameter of about
100 m) have been examined. The relative changes of material impedance Z(measured at
alternating fieldHac) due to application of external static magnetic field are defined as [4]:
(1)
where is the impedance determined at field and is the impedance determined at
the maximum of the applied fieldHdc. The sensitivity of magneto-impedance effect to the changes
of magnetic field is defined as [5]:
(2)
where is the half width of the maximum plotted vs. .
II. RESULTS AND DISCUSSION
Magneto-impedance measurements were carried out by applying precision RLC meter
(Agilent E4980A). Fig. 1 presents determinedby applying contact (( )C ) and non-
contact (( )NC ) methodplotted versus frequencyf (1 kHz f 2 MHz) of magnetic field and
the applied field Fig. 2 shows the ratio ( )NC/( )Cof magneto-impedance effect.
According to these figures the( )NCeffect in the region 200 A/m is at least 7 times higher
than ( )C. Magneto-impedance sensitivity versus frequency for contact and non-contact
measurements is presented in Fig. 3. Note, in both cases shows a maximum located at about 200
kHz and 300 kHz for non-contact and contact geometry, respectively. At this maximum NCis about
50 times higher than C. These facts suggest that application of non-contact method of
measurements allows improving sensitivity of magneto-impedance sensor especially at relatively
low magnetic fields.
In conclusion, one can state that the examined Co68.15Fe4.35Si12.55B15 micro-wire with diameter
of about 100 m can be used as high sensitive magneto-impedance sensor in non-contact geometry
especially at low magnetic fields.

- 66 -
s
Fig.1 Magneto-impedance effect vs. frequency f and the applied magnetic field ; left - contact measurements
( )C and right - non-contact measurements ( )NC.
0.00
0.05
0.10
0.15
0.20
0 500 1000 1500 20000
2
4
6
8
10 contact
NC,%
/(A
/m)
C,%
/(A
/m)
f, kHz
non-contact
Fig.2 Ratio( )NC/( )C Fig.3 Magneto-impedance sensitivity versus frequency
of non-contact/contactmagneto-impedance effect for contact and non-contact measurements
REFERENCES
[1] Beato-López J.J., de la Cruz Blas C.A., Mitra A., Gómez-Polo C., Electrical model of giant
magnetoimpedance sensors based on continued fractions, Sensors and Actuators A 242 (2016) 73–78
[2] Valenzuela R., Fessant A., Gieraltowski J., Tannous C., Effect of the metal-to-wire ratio on the high-
frequency magnetoimpedance of glass-coated CoFeBSi amorphous microwires , Sensors and Actuators
A 142 (2008) 533–537
[3] Dufay B., Saez S., Dolabdjian C., Yelon A., Menard D., Physical properties and giant
magnetoimpedance sensitivity of rapidly solidified magnetic microwires, Journal of Magnetism and
Magnetic Materials 324 (2012) 2091–2099
[4] Zhukov A., Ipatov M., Zhukova V. in: Handbook of Magnetic Materials, Volume 24, Chapter 2,
Elsevier 2015
[5] Amirabadizadeh A., Lotfollahi Z., Zelati A., Giant magnetoimpedanceeffectofCo68.15 Fe4.35 Si12.5
B15 amorphous wire in the presence of magnetite ferrofluid, Journal of Magnetism and Magnetic
Materials 415 (2016) 102–105

- 67 -
EFFECTS OF DOPING ON THE STRUCTURAL DISTORTION OF
La0.7Dy0.3Mn1-xZnxO3
J.F. López1, M. Rios
1,2 and G.A. Mendoza
1
1 Magnetic materials and nanostructures Group, Faculty of science, National University of Colombia
2 Basic Science Department, ECCI University, Bogotá, Colombia
Abstract. MnO6 octahedra are the basic units in perovskite manganese oxides. This paper presents results on
structural distortions by Zn substitution in La0.7Dy0.3Mn1-xZnxO3 (0 < x < 0.4). The polycrystalline samples were
produced by the solid state reaction method. The octahedral distortion was analyzed by the Rietveld refinement method
to fit the XRD data. As the cell distortion parameters were obtained, the Mn-O bond length on the Mn-O plane and
along the c –axis. Also the Mn-O-Mn angle was obtained along the c-axis and on the plane. In these samples three
simultaneous phases were observed: two orthorhombic Pbnm and Pnma phases as well as a trigonal phase R-3C. The
presence of each phase into the samples depend on the doping.
I. INTRODUCTION
Structural distortions such as octahedral rotation, tilting or deformation have been attributed to
the strong hybridization between 3d orbitals and the O2p orbitals [1]. D. Fuchs et al correlated the
structural distortions to magnetic and electronic properties of perovskite cobaltates. Ten years ago,
S. Tan et al [2] showed that Zn doping on B sites in an ABO3 compound indicate paramagnetic–
ferromagnetic transitions without an insulator–metal transition. Furthermore, they discussed the
origin of the insulating behavior in ferromagnetic (FM) state as consequence of two types of MnO6
octahedra in the same system. In order to correlate the strong hybridization model with the type of
octahedra it requires measurements of local distortions at the Mn site (EPR), and global distortions
like Mn-O-Mn bonds angle and Mn-O bond lengths by XRD analysis.
II. RESULTS
The La0.7Dy0.3Mn1-xZnxO3 polycrystalline samples in the doping range 0 < x < 0,4 were
prepared by solid state reaction method. In this process, stoichiometric amounts of the precursor
reagent La203, Dy03, Mn2O3 ZnO2+OH were homogenized and calcined at 1.237 K for 24 hours. X-
ray powder diffraction patterns were taken at room temperature using a Philips PW1710
diffractometer with cooper target. The Rietveld refinements were performed using the FullProf
software [3]. The observed and calculated diffraction profile obtained from the Rietveld analysis
for the samples with x = 0.2 is shown in the figure 1.a. All the observed peaks were indexed in
three phases: two orthorhombic phases (Pbnm and Pnma) and one trigonal phase (R-3C).
Some results obtained by Rietveld refinement are listed in table 1. For Zn doping, there occurs
the transition from Trigonal R-3C phase to orthorhombic Pbnm phase. The above-mentioned
transition was observed by measuring the fraction of the phases in the samples, i.e. the fraction of
the Orthorhombic Phase Pbnm increases by doping increasing while the other phases decrease by
doping.
The octahedrons contorted by the Zn doping were characterized by the Mn-O1,2-Mn angles.
Table 1 shows an angle reduction, which means a greated contortion of the octahedrons.

- 68 -
(a)
(b)
Fig.1. (a) XDR Rietveld refinement results for sample La0.7Dy0.3Mn0.8Zn0.2O3. The bars down the pattern correspond to
picks for Pbnm, Pnma, and R-3C. The line on the bottom, corresponds to the difference between measured and
calculated pattern. (b) The structure of La0.7Dy0.3Mn0.8Zn0.2O3. The Mn ions are in the octahedral coordination. The O1
atoms are in Mn planes while the O2 atoms are along the c –axes.
The distortion of the octahedra is discussed from the ratio O1-Mn / O2-Mn. In non-distorted
octahedra we expect the ratio to be 1. The distortion it is used to evaluated the Jean –Teller
interaction.
Table 1. The Mn-O1,2-Mn angles and Mn-O bond length in La0,7Dy0,3Mn(1-x)ZnxO3
Zn doping x = 0 x = 0,1 x = 0,2 x = 0,3 x = 0,4
Mn-O1-Mn angle (degree) 159,81 159,35 156,62 156,64 153,89
Mn-O2-Mn angle (degree) 155,12 151,36 148,52 146,52 147,03
O1-Mn length (o
A ) 2,1820 2,1301 2,0529 2,1492 2,1687
O2-Mn length (o
A ) 1,9526 1,9693 2,0263 2,0422 2,0391
Fraction of Trigonal Phase R-3C 0,4208 0,1436 0,2168 0,2219 0,2603
Fraction of Orthorhombic Phase Pbnm 0,2928 0,5618 0,5111 0,4998 0,4781
Fraction of Orthorhombic Phase Pnma 0,2341 0,251 0,2272 0,243 0,1969
REFERENCES
[1] Fuchs D., Merz M., Nagel P., Schneider R., Schuppler S., and von Löhneysen H., Double Exchange via
t2g Orbitals and the Jahn-Teller Effect in Ferromagnetic La0.7Sr0.3CoO3 Probed by Epitaxial Strain,
Physical Review Letters, 111(2013) 157203-1
[2] Shun Tan, Song Yue, Yuheng Zhang, Jahn, Teller distortion induced by Mg/Zn substitution on Mn
sites in the perovskite manganites, Physics Letters A, 319(2003) 530-538
[3] Rodríguez-Carvajal J., Recent advances in magnetic structure determination by neutron powder
diffraction + FullProf, Physica B, 192 (1993)55
[4] Rodríguez-Carvajal J., Recent developments of the program FULLPROF, Commission on powder
diffraction (IUCr), Newsletter, (2001)

- 69 -
WIEGAND SENSOR AS AN EFFECTIVE ENERGY SOURCE FOR
SUPPLYING ULTRA LOW POWER ELECTRONICS
A. Majocha and R. Gozdur
Lodz University of Technology; Department of Semiconductor and Optoelectronics Devices
90-924 Lodz, Wolczanska Str. 211/215, Poland; Tel. +(48) 42 631 25 10; Fax: +(48) 42 636 80 24
e-mail: [email protected], [email protected]
Abstract. The Wiegand sensors are used as position detectors and linear or rotary motion sensors. They are generative
sensors and can therefore be used to supply electronic circuits with ultra low power consumption such as pulse
counters, comparators, operational amplifiers, microcontrollers. The paper presents the results of measurements of the
maximum energy of a single pulse in matching conditions. Based on energy value the maximum power obtainable from
a commercial Wiegand sensor was calculated. The value of this power is approx. 0,6mW and provides proper supply of
an electronic circuit with very low power consumption (e.g. 3V/0,2mA). The results of measurements of the harvested
energy using specialized system are presented in this paper.
I. INTRODUCTION
The development of integrated circuits such as logic, analog circuits, microcontrollers
makes less and less power consumption to power them. These systems are applicable to devices
powered from the battery for several years. Another device is powered with renewable energy
sources such as solar or wind power. They also develop modern systems named energy harvesters
for converting electricity power from kinetic, thermal energy based on electromagnetic,
piezoelectric or thermoelectric phenomena [1, 2]. The Wiegand sensor belongs to the group of
kinetic harvesters [2]. Conversion process can be done by the direct conversion of kinetic energy
into electrical one. The magnetic field in this case is the energy carrier. The type of conversion
depends on the way of inducing the Wiegand effect. Avalanche process of magnetization in the
Wiegand sensors can be excited by bidirectional changes of magnetic field from permanent
magnets or AC/DC current. Commonly applied and developed solutions based on rotated
permanent magnets.
II. EXPERIMENTS
The industrial Wiegand sensor WG112 was used as the object under test. Bi-directional
magnetic field acting on the sensor prepared in two ways. In the first case, the field was generated
by a set of two magnets mounted on the shaft (Fig. 1), or one magnet rotating around the center of
the sensor. In the second case, the field was obtained by the magnetization the sensor by coil fed
from AC generator with adjustable frequency and output current (Fig. 2). The magnetic field and
the electrical signals were measured and recorded by the measuring system consisting of
gaussmeter Lakeshore DSP475 with transverse Hall probe and digital signal analyzer NI-4462.
At the beginning of the tests the impedance matching was determined. The value of energy
harvested from the Wiegand sensor was determined in two cases. The first was to load the sensor
by the resistor providing impedance matching. The second, was to use a specific integrated
harvesting circuit, which produces a voltage of a predetermined value.
During the tests of the excitation by the magnet, gap width, frequency and load (Rload) were
determined. The harvested energy value for a single cycle of excitation was calculated. Because of
the random nature of the avalanche of changes magnetic polarity, the average waveforms of EMF
pulses was used to calculate the energy efficiency.

- 70 -
Fig.1. Diagram and view of experimental setup for investigation the Wiegand sensor
Fig.2. Methods of excitation of the Wiegand sensor
The Wiegand sensor actuated by the alternating magnetic field provides electromotive
force EMF which is the sum of two phenomena. The first phenomena is EMFW due to the Wiegand
effect. The energy of a single pulse is independent of the frequency of the magnetic field. The
second phenomena is the EMFC in the pickup coil of Wiegand sensor due to changes of the
magnetic flux. In this case, the additional energy is directly proportional to the frequency of the
magnetic field. Based on measurements of the energy from the Wiegand sensor the frequency
dependence of the energy from both phenomena was determined.
III. CONCLUSIONS
Typical Wiegand sensors working in energy harvesting mode provide approximately energy of
32nJ per pulse. Energy efficiency‟s peak is achieved in range of RLOAD from 2000 to 5000 Ohms.
Taking rotation frequency into consideration (up to approx. 30kHz), available electrical power
riches the level of 600µW.
REFERENCES
[1] Gilbert J. M., Balouchi F., Comparison of Energy Harvesting Systems for Wireless Sensor Networks,
International Journal of Automation and Computing, 05(4), October 2008, pp. 334-347
[2] Ongaro F., Saggini S., Corradini L., Low-Power Energy Harvester for Wiegand Transducers, IEEE
Proceedings of Applied Power Electronics Conference and Exposition (APEC), 2013 Twenty-Eighth
Annual IEEE , March 2013, pp. 453-459

- 71 -
ANALYSIS OF THERMAL STRATIFIED STORAGE TANK
D. Mazur1, R. Smusz
2 and P. Kielan
3
1 Rzeszów University of Technology, The Faculty of Electrical and Computer Engineering
ul. W. Pola 2, B206, 35-959 Rzeszów, Poland, [email protected] 2 Rzeszów University of Technology, Department of Thermodynamics and Fluid Mechanics,
ul. Powstańców Warszawy 12, 35-959 Rzeszów, Poland, e-mail: [email protected] 3 Faculty of Electrical Engineering, Department of Mechatronics
Bolesława Krzywoustego 2, 44-100 Gliwice, Poland, e-mail: [email protected]
Abstract. The paper presents the temperature stratification system in an accumulation tank. The range of the research
concerns the shape and dimensions of stratification system for an accumulation tank. Thermal stratification is a
process that comprises in maintaining temperature stratification at different levels of accumulation tank that is
reducing to minimum the process of temperature equalization. It results from the fact that thermal stratification in a
tank increases in a significant way the installation efficiency and improves the process of energy storing.
I. INTRODUCTION
Providing vertical stratification of temperature in a tank is extremely important from the
perspective of process energy effectiveness of the process of utilising waste energy. It is connected
with proper location of inlet and outlet ports, sizes, shape, the method of distributing hot water
within a tank, as well as the placement of elements that potentially interfere with temperature
stratification, such as heat exchangers, booster heaters etc. It requires proper configuration of
stratification system elements so as to reduce mixing of cold and hot water in a tank. The
application of stratification system enables „direct‟ transfer of heated water to upper parts of a tank,
without mixing with cold water, which increases effectiveness of the heat recovery system.
Fig. 1 presents three cases of the accumulation of the same value of thermal energy, but with
different levels of stratification. The first case corresponds to the highest level of temperature
stratification and is the most beneficial one. It is determined by the fact, that the share of the zone
of the highest and homogenous temperatures in an accumulation tank is the greatest. Together with
the increase of mixing level the zone of thermocline expands until full mixing of the coefficient.
Fig.1. Different levels/layers of temperature stratification by the same amount of the accumulated thermal energy
Providing vertical stratification of temperature in a tank is important and its quality is
connected with sizes, shape of a tank, method of distributing hot water in a tank, as well as the
arrangement of elements that may potentially interfere with temperature stratification. It requires
proper configuration of stratification system elements so as to reduce mixing of cold and hot water
in a tank. Heat, mass and momentum exchange are the basic instrumental processes that influence
the processes taking place inside an accumulative tank.
Hot zone
Cold zone
Thermoclin
e
Hot zone
Cold zone
Thermoclin
e
Homogenous
temperature
in a tank.
Full mixing

- 72 -
The main factors destabilizing thermal stratification are:
forced convection inside a tank, caused by supplying cold water and reception of warm water
by the external hydraulic system. The streams of supplying and received water while filling the
tank induce mixing of water in a tank;
free convection which is a result of the density difference between cold and warm zones in an
accumulative tank;
heat conductance between levels of water with different temperatures.
Fig.2. 3D visualization of an accumulation tank
Fig. 3. 3D visualization of an accumulation tank with
stratification system
II. RESULTS
In the analysed issue we concentrated on defining level-distribution of heat in a tank during
heat recovery system coil operation and its interaction with other elements, as well as defining
proper geometrical dimensions/sizes of stratification system in order to minimize the process of
cold and hot water mixing. In the first variant calculations were made for an operating coil of waste
heat recovery system without stratification unit. In the second variant the influence of different
geometric variants was analysed, and stratification unit of the temperature stratification in an
accumulation tank.
Numerical simulations were made by using COMSOL Multiphysics commercial software. For
the model with stratification system, 1774510 finite elements were applied (152951 three-node
triangular elements, 245000 four-node square elements and 53690 and 1888 boundary and apex
elements) [3].
REFERENCES
[1] Seok-Ki Choi, Tae-Ho Lee, Yeong-Il Kim, Dohee Hahn, Numerical analysis of thermal stratification in
the upper plenum of the monju fast reactor, Nuclear Engineering and Technology, 2013, vol. 45, issue
2, p. 191–202
[2] He Zhang, Fenglei Niu, Yu Yu, Shuming Zhang, Han Wang, Zhi Gang, Modeling and experimental
studies on mixing and stratification during natural convection in containments, Annals of Nuclear
Energy, 2015, vol. 85, pp. 317–325
[3] Hua Li, W. Villanueva, P. Kudinov, Approach and Development of Effective Models for Simulation of
Thermal Stratification and Mixing Induced by Steam Injection into a Large Pool of Water, Science and
Technology of Nuclear Installations, 2014
Inlet of the
heating
element
Bottom coil
Waste heat
recovery system
coil
Outlet of the heating
element
Upper coil
Stratification system

- 73 -
PHENOMENOLOGICAL MODELLING OF HYSTERESIS:
APPLICATIONS AND LIMITATIONS
Y. Melikhov1,2
1 Institute of Physics, Polish Academy of Sciences, Al. Lotnikow 32/46, 02-668 Warsaw, Poland
2 Wolfson Centre for Magnetics, School of Engineering, Cardiff University, Cardiff, CF24 3AA, U.K.
[email protected] , [email protected]
Abstract. Hysteretic behavior observed in magnetization under changing magnetic field in ferromagnetic materials is
the simplest example of hysteresis. Phenomenological models to describe such behavior have been known and used for
years but, in order to be physically sound, these models must originate from energetic considerations. The most famous
examples of such models are the Jiles-Atherton model and the Preisach model and, with the theory available behind
those models, extension to more complicated cases of hysteresis can be achieved. This paper reviews recent extensions
of these models together with examples of their applications to describe: (1) temperature effects (observed in
magnetoelastic cation substituted cobalt ferrite compound), (2) two-magnetic-phase materials behavior (observed in
CGO electrical steel under compressive stresses), (3) hysteresis in systems exhibiting magnetic-structural first order
phase transition (observed in magnetocaloric Gd5(SixGe1-x)4), and (4) hysteresis of magnetotransport properties
(observed in half-metallic ferromagnets).
I. INTRODUCTION
Hysteretic behavior observed in magnetization under changing magnetic field in ferromagnetic
materials is the simplest example of hysteresis. Successful phenomenological models must
originate from energetic considerations and the most famous examples of such models are the Jiles-
Atherton model [1] and the Preisach model [2]. This paper presents recent extensions of these
models to describe more complicated cases of hysteresis.
II. EXTENSIONS AND EXAMPLES
A. Hysteresis with temperature effects and Hysteresis of two-magnetic-phase systems
The Jiles-Atherton model [1] is based on the assumption that the total magnetization, M, of a
ferromagnetic material can be expressed as the sum of contributions of irreversible, Mirr, (i.e. due
to lossy processes such as domain wall pinning) and reversible, Mrev, (due to lossless processes
such as domain wall bowing) magnetisation components. Five parameters of the Jiles-Atherton
model are assumed to be constant: spontaneous magnetisation, MS, pinning factor, k, domain
density, a, domain coupling, α, and reversibility factor, c.
If variation of the parameters of the Jiles-Atherton model, for example, with temperature is
allowed the temperature effects in hysteretic behavior [3] can be described (see Fig. 1(a)).
Variation of the parameters with external field and change from one set of parameters into the other
set at some specific exchange/coupling magnetic field could lead to description of hysteretic
behavior exhibiting behavior of two-magnetic-phase systems [4] (see Fig. 1(b)).
B. Hysteresis in systems exhibiting magnetic-structural first order phase transition
First order phase transitions may occur in several magnetic systems, with two structural phases
having different magnetic properties each and a structural transition between them. In order to
model such systems magnetization is represented by the volumetric amounts of ferromagnetic
(described by extended Jiles-Atherton theory) and paramagnetic (described by the Curie-Weiss
law) in respective phases [5]. Accompanied with an identification procedure to extract material
parameters from experimental data, the model successfully describes hysteresis in systems
exhibiting magneto-structural first order phase transition (see Fig. 1(c)).

- 74 -
C. Hysteresis of magnetotransport properties
The Preisach model assumes that a system is represented by a set of bistable units (called
hysterons), allowing each unit to be in only one of the two possible states m=±Δm (i.e.,
magnetization "up" or "down"), with an energy barrier between the states [2]. The Gibbs energy
determines the stability of the unit with the free energy of the unit and the coupling of the unit to
the external magnetic field k(m;H). Magnetization of the system is then calculated by double
integral over the known probability of the bistable units.
Taking ordinary magnetic hysteron as a base and having physical understanding of the
magnetotransport properties in half-metallic ferromagnets, one can easily introduce a conductivity
hysteron between two neighboring magnetic hysterons [6]. Considering the system as three-
dimensional random resistor network where the intrinsic thermodynamic percolation effects are not
only due to magnetic field variation but also due to temperature changes as well, we can connect
Preisach magnetic distribution function with Preisach conductivity distribution function, and
successfully model M (H,T) and R(H,T) (see Fig. 1(d)).
(a) (b)
(c) (d)
Fig.1. Measured and modelled (a) major hysteresis loops at different temperatures for Co1.4Ge0.4Fe1.2O4 with Curie
temperature TC≈550 K [3]; (b) magnetization curves of CGO electrical steel under 9 MPa compressive stress showing
two-magnetic-phase behavior [4]. Inset shows dependence of Boltzmann parameters on applied stress;
(c) magnetization curves showing the induced magnetic-structural (MS) first order phase transition (FOPT) in
Gd5Si2Ge2 [5]; (d) major hysteresis curves of magnetization and resistance as a function of applied field at certain
temperature observed in half-metallic ferromagnets [6]
REFERENCES
[1] Bertotti G., Hysteresis in Magnetism, Academic Press, 1998
[2] Jiles D.C., Atherton D.L., Theory of ferromagnetic hysteresis, Journal of Magnetism and Magnetic
Materials, 61, 1986, pp. 48-60
[3] Raghunathan A. et al., Modeling the Temperature Dependence of Hysteresis Based on Jiles–Atherton
Theory, IEEE Transactions on Magnetics, 45, 2009, pp. 3954-3957
[4] Raghunathan A. et al., Application of Jiles-Atherton Model to Stress Induced Magnetic Two-Phase
Hysteresis, IEEE Transactions on Magnetics, 49, 2013, pp. 3187-3190
[5] Melikhov Y. et al., Phenomenological modelling of first order phase transitions in magnetic systems,
Journal of Applied Physics, 115, 2014, 183902
[6] Krivoruchko V.N. et al., Relationship between hysteretic behavior of magnetization and
magnetoresistance in half-metallic ferromagnets, Physical Review B, 77, 2008, 180406(R)

- 75 -
NONEQUILIBRIUM PATTERNS IN SPINODAL GRANULAR MATTER
A. Mendoza1, 2
, J.F. López1, 2
and O. Guzmán2
1 Physics Department, National University of Colombia, Colombia
2 Magnetic materials and nanostructures Group, Faculty of science, National University of Colombia
Abstract. This study is focused on metastabile systems where the Ginzburg-Landau Ansatz turn out to be useful. The
model begins with a functional suitable to describe first order phase transitions [1]. The order parameter is the
concentration of one of the two species. The bifurcation is discussed for the equations obtained by minimization of the
functional. The study is restricted to the one-dimensional stationary case.
)
I. INTRODUCTION
A molten binary alloy when quenched shows a sudden appearance of a fine grained structure
which is known as spinodal decomposition. The decomposition is characterized by two phases, one
rich in one component and the other rich in the other component.
Spinodal decomposition is a non-equilibrium segregation process that when interrupted before
the end lead to a continuous quasiperiodic distribution of solute in a matrix. To this spinodal
granular matter belong the magnetic granular alloys studied in reference [1]. The authors from this
reference show a spinodal decomposition in Cu-Co ribbons which are composed of a periodic
distribution of Co within Cu. They observed lamellar profiles associated with giant magneto-
resistance although in the profiles no well-defined interfaces are formed. The observed distribution
of Co concentrations over the sample has been analyzed by a simulation based on Cahn –Hilliard
equations [2].
In higher space dimensions, the complexity of the equations obtained from the functional
makes the treatment of the bifurcation problem difficult. Thus, here the bifurcation problem for the
family of equations derived from the Gizburg-Landau functional is discussed in one dimension.
II. TECHNICAL INSTRUCTIONS
The starting point of the model is the functional:
42222
4
1
2
1
42
1 ArconstrdE o
o (1)
Which represent a double expansion in powers of
and (
).
represent a n-component order
parameter. By minimization of the functional
E and taking into account the structure of the
coefficient A one can obtain a family of equations for the order parameter:
0
F (2)
0)(
F (3)
is the eigenvalue associated to the interaction of the system.
The first equation is known as the Allen-Cahn equation, and the second ones is the Cahn –
Hilliard equation. Properties of the bifurcating branches in the first equation such as monotonicity,
asymptotic behavior of these branches as , or in which the stationary solutions are solution
of the second one, can helps us to study the patterns formation in the Cahn-Hilliard equation. The
one dimensional analysis may be brings us near to results in two and three dimensions [3].
- 76 -
REFERENCES
[1] Hohenberg P.C., Krekhov A.P., An introduction to the Ginzburg–Landau theory of phase transitions
and nonequilibrium patterns, Physics Reports, 572, (2015) pp. 1-42
[2] Miranda M.G.M., da Rosa A.T., Hinrichs R., Golla-Schindler U., Antunes A.B., Martínez G., Estévez-
Rams E., Baibich M.N., Spinodal decomposition and giant magnetoresistance, Physica B, 384 (2006)
pp.175-178
[3] Binder K., Materials science and technology in Phase transformations in materials, vol 5, Wiley-VCH
Verlag GmbH, Weinheim, Germany, 1991
[4] Chaffee N., Infante E.F., A bifurcation problem for a nonlinear partial differential equation of
parabolic type, Applicable anal 4 (1974/75) pp. 17-37

- 77 -
SCALING-BASED MODELLING OF POWER LOSSES IN AMORPHOUS
AND NANOCRYSTALLINE ALLOYS
M. Najgebauer
Częstochowa University of Technology, Faculty of Electrical Engineering
al. Armii Krajowej 17, 42-200 Częstochowa, Poland, [email protected]
Abstract. The paper presents the scaling-based approach to modelling of power losses in Fe-based amorphous and
nanocrystalline magnetic alloys. The modelling results are satisfactory due to relatively low discrepancies between
measured and modelled losses curves.
I. INTRODUCTION
Power losses in soft magnetic materials are generated by hysteresis phenomenon and eddy
currents, flowing in different scales as in whole material bulk, around moving domain walls or
micro-currents related to Barkhausen jumps. Some authors propose to consider all types of power
losses separately, while others suggest that these should be considered as total.
Modelling of power losses is still an interesting issue both for scientists and researchers. There
are many approaches to modelling of power losses. The most popular model has been proposed by
Bertotti [1-2]. It is composed of three power law components of frequency and magnetic induction,
related to hysteresis, classical and excess losses. This model also assumes that power losses are
scale-invariant phenomena. On the other hand, some authors proposed simpler models composed
of two or even one losses component.
Referring to multi-scale aspects of power losses, Sokalski et al. has proposed a new approach
to the losses analysis, which was based on the Widom scaling procedure [3-4]. It leads to a two-
component description of power losses, given in new coordinates – scaled losses and scaled
frequency. However this model has some limitations, because exponents of the scaled frequency
can be only integers. Recently, a modified approach to scaling analysis of power losses was
postulated, in which scaling exponents can be fractional numbers [5]. The fractional scaling gave
the power law describing scaled power losses in the following form:
x
BfpBP mmtot , (1)
where: mtot BP – scaled losses, mBf – scaled frequency, , and p – scaling parameters,
x – fractional exponent. The expression (1) provided promising results of power losses modelling
for 3% Si-Fe grain-oriented steel [5] and magnetocaloric alloys [6]. In the present study, the
expression (1) is examined in modelling of power losses in Fe-based alloys with amorphous and
nanocrystalline internal structures.
II. MATERIALS AND MEASUREMENTS
In the study, samples of commercially produced Fe-based amorphous and nanocrystalline
alloys are analyzed. The amorphous sample is made of Metglas and the nanocrystalline is made of
Finemet. Both samples have cylindrical shapes with dimensions (outer radius, inner radius and
height) 27.2 x 13.5 x 10.5 mm and 12.5 x 8.0 x 10.0 mm, respectively for amorphous and
nanocrystalline ones.
Power losses of these samples were measured using the computer-aided measurement system
MAG-RJJ-2.0, according to the IEC international standard and with the B-type uncertainties lower
than 1.5%. The measurement ranges were: 50 to 400Hz for frequency and 0.1 to 1.2T for magnetic
induction. The measurements provided a set of power losses curves for each sample. [

- 78 -
III. RESULTS
In the proposed approach to modelling of power losses, the expression (1) is used after it
rescaling to the form that describes power losses directly:
xx BpfP mtot. (2)
The model parameters are estimated from the set of losses measurements, using the least squares
method. The parameter values should be estimated in such a way that allows collapsing all
measured losses curves onto the single one. Therefore, the parameter values are universal in the
whole measured range. Selected results of the power losses modelling for the Fe-based amorphous
alloy are presented in Figure 1. Maximum percentage error of the scaling-based losses modelling
does not exceed 8%, what is a satisfactory result.
Fig.1. Scaling-based modelling of power losses for Metglas 2605TCA amorphous alloy:
solid line – modelled losses, circles – measurements.
IV. CONCLUSIONS
In the present study, the scaling-based approach to power losses modelling is examined for Fe-
based amorphous and nanocrystalline alloys. Measured curves of power losses are collapsed onto a
single curve, what allows estimating the model parameters. The obtained data collapses reveal also
scaling behaviour of power losses in amorphous and nanocrystalline alloys. Results of the scaling-
based modelling of power losses are satisfactory due to relatively low discrepancies between
measured and modelled losses curves.
REFERENCES
[1] Bertotti G., A general statistical approach to the problem of eddy current, Journal of Magnetism and
Magnetic Materials, vol. 41, pp. 253-260, 1984
[2] Bertotti G., General properties of power losses in soft ferromagnetic materials, IEEE Transaction on
Magnetics, vol. 24, no. 1, pp. 621-630, Jan 1988
[3] Sokalski K., Szczyglowski J., Najgebauer M., Wilczynski W., Losses scaling in soft magnetic
materials, COMPEL, vol. 26, 2007, pp. 640-649
[4] Najgebauer M., Scaling theory and its chosen applications in electromagnetism, Przegląd
Elektrotechiczny, vol. 84, issue 12, 2008, pp. 213-216
[5] Najgebauer M., Application of fractional scaling in modelling of magnetic power losses, Acta Physica
Polonica A, vol. 128, 2015, pp. 107-110
[6] Gozdur R., Najgebauer M., Measurements and scaling analysis of power losses in La-containing alloys,
Journal of Electrical Engineering, vol. 66, no. 7/s, 2015, pp. 37-40

- 79 -
FEM-BASED FORWARD EDDY CURRENT TOMOGRAPHY
TRANSFORMATION FOR AUTOMOTIVE INDUSTRY
P. Nowak1, M. Nowicki
2 and R. Szewczyk
1
1 Institute of Metrology and Biomedical Engineering, Warsaw University of Technology, sw. Andrzeja Boboli 8,
02-525 Warsaw, Poland; [email protected], [email protected] 2 Industrial Research Institute for Automation and Measurements, al. Jerozolimskie 202, 02-486 Warsaw, Poland;
Abstract. The paper presents utilization of open-source finite element method (FEM) software for modelling of
measurement process on Eddy current tomography setup. Methodology of measurements is presented as well as
software for forward tomography transformation. Developed software was based entirely on the open-source
programs, which results with high possibility of method implementation in industry. Obtained modelling result
presented high compatibility with measurement results, which confirmed correctness of the method.
I. INTRODUCTION
Eddy currents are commonly used for non-destructive tests of elements in production process,
mainly for the selection of the elements. Reference objects (validated with other measurement
method) are measured and their signature response is obtained. Then tested objects are measured
and their response is compared with reference objects response. Thus selection of defective objects
can be made.
On the other hand, this method does not provide information about the defect size and location
and cannot be used for correction of production process. This gap is supplemented by the usage of
eddy current tomography [1][2]. This method has typical advantages of eddy current testing (ease
of use, simple hardware, no need of safety requirements) as well as possibility of determination of
defects size and location as in other tomography methods.
In order to obtain data about the defects in the object, inverse tomography transformation has
to be done. Due to significant nonlinearity of eddy current phenomena, it is typically done by
FEM-based forward transformation and optimization of modelled objects shape. This paper
presents methodology of the forward tomography transformation, which ensures proper
reconstruction of measurement process and can be applied to advanced objects shapes, such as
motor valve presented in Fig. 1.
Fig.1. Analyzed object – motor valve placed in measurement holder
II. MEASUREMENT METHODOLOGY
Tested object is moved linearly between two coils – exciting and measuring. Exciting coil is
powered by alternate current and causes induction of eddy currents in the object, which influence
the field measured by second coil. Complete eddy-current tomography measurements are based on
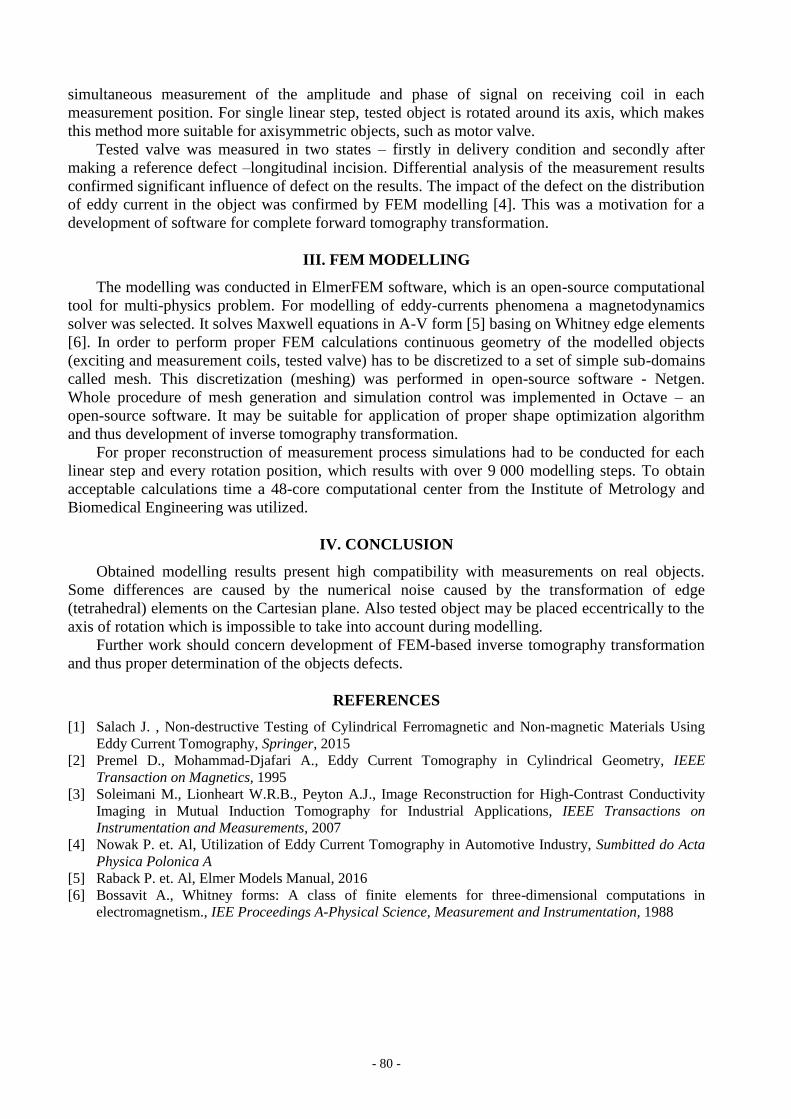
- 80 -
simultaneous measurement of the amplitude and phase of signal on receiving coil in each
measurement position. For single linear step, tested object is rotated around its axis, which makes
this method more suitable for axisymmetric objects, such as motor valve.
Tested valve was measured in two states – firstly in delivery condition and secondly after
making a reference defect –longitudinal incision. Differential analysis of the measurement results
confirmed significant influence of defect on the results. The impact of the defect on the distribution
of eddy current in the object was confirmed by FEM modelling [4]. This was a motivation for a
development of software for complete forward tomography transformation.
III. FEM MODELLING
The modelling was conducted in ElmerFEM software, which is an open-source computational
tool for multi-physics problem. For modelling of eddy-currents phenomena a magnetodynamics
solver was selected. It solves Maxwell equations in A-V form [5] basing on Whitney edge elements
[6]. In order to perform proper FEM calculations continuous geometry of the modelled objects
(exciting and measurement coils, tested valve) has to be discretized to a set of simple sub-domains
called mesh. This discretization (meshing) was performed in open-source software - Netgen.
Whole procedure of mesh generation and simulation control was implemented in Octave – an
open-source software. It may be suitable for application of proper shape optimization algorithm
and thus development of inverse tomography transformation.
For proper reconstruction of measurement process simulations had to be conducted for each
linear step and every rotation position, which results with over 9 000 modelling steps. To obtain
acceptable calculations time a 48-core computational center from the Institute of Metrology and
Biomedical Engineering was utilized.
IV. CONCLUSION
Obtained modelling results present high compatibility with measurements on real objects.
Some differences are caused by the numerical noise caused by the transformation of edge
(tetrahedral) elements on the Cartesian plane. Also tested object may be placed eccentrically to the
axis of rotation which is impossible to take into account during modelling.
Further work should concern development of FEM-based inverse tomography transformation
and thus proper determination of the objects defects.
REFERENCES
[1] Salach J. , Non-destructive Testing of Cylindrical Ferromagnetic and Non-magnetic Materials Using
Eddy Current Tomography, Springer, 2015
[2] Premel D., Mohammad-Djafari A., Eddy Current Tomography in Cylindrical Geometry, IEEE
Transaction on Magnetics, 1995
[3] Soleimani M., Lionheart W.R.B., Peyton A.J., Image Reconstruction for High-Contrast Conductivity
Imaging in Mutual Induction Tomography for Industrial Applications, IEEE Transactions on
Instrumentation and Measurements, 2007
[4] Nowak P. et. Al, Utilization of Eddy Current Tomography in Automotive Industry, Sumbitted do Acta
Physica Polonica A
[5] Raback P. et. Al, Elmer Models Manual, 2016
[6] Bossavit A., Whitney forms: A class of finite elements for three-dimensional computations in
electromagnetism., IEE Proceedings A-Physical Science, Measurement and Instrumentation, 1988

- 81 -
TEMPERATURE ERROR OF HALL-EFFECT AND MAGNETORESISTIVE
COMMERCIAL MAGNETOMETERS
M. Nowicki1, M. Kachniarz
2 and R. Szewczyk
1
1 Institute of Metrology and Biomedical Engineering, Warsaw University of Technology, sw. Andrzeja Boboli 8,
02-525 Warsaw, Poland; [email protected], [email protected] 2 Industrial Research Institute for Automation and Measurements, al. Jerozolimskie 202, 02-486 Warsaw, Poland;
Abstract. The paper presents special measurement system for investigation of the temperature influence on the
indication of commercially available sensors of magnetic field. Utilizing the developed system, several
magnetoresistive and Hall-effect sensors were investigated within the temperature range from -30°C to 70°C. The
obtained results indicate that sensitivity of most of the investigated sensors is unaffected, except the basic
magnetoresistive device. However, Hall-effect sensors exhibit considerable temperature drift, regardless of
manufacturer.
I. INTRODUCTION
Additional error induced by the influence of temperature is a very important problem in almost
all kind of measurements performed in modern science and industry. Also measurements of
magnetic field, widely utilized in many industrial processes, are influenced by the temperature. In
this paper, we present the investigation of additional, temperature induced error of various
commercially available magnetometers, based on both magnetoresistive effect [1] and Hall effect
[2]. Obtained results indicates that for some temperature range, investigated commercial
magnetometers are resistant to the influence of the temperature. But for the extremely low or high
temperatures, additional error of the measurement is clearly observable.
II. MEASUREMENT STAND
For this research, special test stand was designed and build, consisting of precision Helmholtz
coils used as a magnetic field standard, and 0.01°C precise PolyScience Cryostat. The developed
test stand is presented in Fig. 1. The Helmholtz coils were powered from precise laboratory power
supply in constant current mode. The current was measured on precise standard 1 Ω resistor with
Tonghui TH1961 voltmeter.
Fig.1. Developed measurement stand for investigation the temperature influence on the magnetometers

- 82 -
The test stand allowed measuring the magnetometers response in the ±100 µT magnetic field
range, in -30° to 70°C temperature range, which is ±50°C from the nominal 20°C operating
temperature.
III. EXPERIMENTAL RESULTS
In the paper, the temperature dependence characteristics of four different magnetometers are
presented. There were two triaxial magnetoresistive magnetometers, one triaxial Hall-effect sensor
and one one-axis Hall-effect sensor investigated. Basing on the measurement results, linear fitting
was performed, and temperature dependence of offset and sensitivity was determined. It was found,
that for most magnetometers, except the basic magnetoresistive one, the sensitivity was unaffected
by the temperature in the investigated 20°C±50°C range. On the other hand, the offset was
negligible for the magnetoresistive sensors, but significant for the Hall-effect sensors, regardless of
the manufacturer. In the Fig. 2 the temperature dependence of sensitivity S is presented, relative to
the „nominal‟ 20°C measurement results S20, for magnetoresistive sensor Honeywell HMC 5883L.
Fig.2. Temperature dependece of sensitivity in relation to normal operating temperature 20°C for magnetoresistive
sensor Honeywell HMC 5883L
There is a strong, highly linear correlation between sensitivity of the device and operating
temperature. HMC 5883L is very simple magnetoresistive sensor, which has no compensation
circuit to reduce the influence of temperature on the operation of the device.
IV. CONCLUSION
Results of the performed investigation indicates that most of the commercially available
magnetometers exhibit high resistance to the influence of temperature. However, in simple devices
for less demanding applications strong dependence between functional parameters and temperature
is observable.
REFERENCES
[1] Tumański S., Thin film magnetoresistive sensors, CRC Press, New York, 2001
[2] Ramsden E., Hall-Effect Sensors: Theory and Application, Newnes, Boston, 2006

- 83 -
MAGNETIC PROPERTIES AND STRUCTURE AFTER
CRYSTALLIZATION OF Fe80-xB20Nbx (x=4,6,10) METALLIC GLASSES
R. Nowosielski1, M. Kądziołka-Gaweł
2, P. Gębara
3 and R. Babilas
4
1 Institute of Engineering Materials and Biomaterials, Silesian University of Technology
Konarskiego 18a, 44-100 Gliwice, Poland, [email protected] 2 Institute of Physics, University of Silesia, Uniwersytecka 4, 40-007 Katowice, Poland,
[email protected] 3 Institute of Physics, Częstochowa University of Technology, al. Armii Krajowej 19, 42-200 Częstochowa, Poland,
[email protected] 4 Institute of Engineering Materials and Biomaterials, Silesian University of Technology
Konarskiego 18a, 44-100 Gliwice, Poland, [email protected]
Abstract. The ferromagnetic Fe-based amorphous alloys were studied due to properties for soft magnetic applications.
Depending on different Nb addition, the formation of crystalline phases after annealing of amorphous alloys Fe80-
xB20Nbx (x = 4, 6, 10) was studied. The crystallization products as well as the phase structure was determined using
Mössbauer spectrometry combined with XRD, DSC and magnetic measurements. Substitution of Fe atoms by Nb led to
significant changes in hyperfine magnetic field (Bhf) distributions in as-cast amorphous alloys Fe80-xB20Nbx, for x = 10
the minimal value of Bhf is observed. Addition of Nb caused a shift of crystallization process towards higher
temperatures and induced changes in magnetic permeability and disaccommodation of magnetic permeability.
I. INTRODUCTION
In recent years a variety of ferromagnetic metallic glasses have been prepared extensively. The
Fe-based glassy alloys have been mainly prepared due to the attractive properties for soft magnetic
applications. The required magnetic properties are usually large saturation magnetization, low
coercive field and high magnetic permeability [1-3].
II. MATERIAL AND METHODS
The paper presents the structural analysis and magnetic characterization of
Fe80-xB20Nbx metallic glasses (x=4,6,10) in as-cast state and after crystallization. The studies were
performed on metallic glasses in the form of ribbons with thickness of 0.05 mm. The structural
examinations of the samples in as-cast state and phase analysis of alloys after annealing was carried
out by the X-ray diffraction (XRD) methods. Thermal properties associated with onset (Tx) and
peak (Tp) crystallization temperatures was examined by differential scanning calorimetry (DSC).
Moreover, Mössbauer spectroscopy (MS) was also used to investigate the local structure and
crystallization process of examined alloys. The magnetic properties examination contained initial
magnetic permeability (μr), disaccommodation (Δμ/μ) of magnetic permeability, coercive force
(Hc) and saturation magnetization (Js) versus annealing temperature was evaluated.
III. RESULTS AND CONCLUSIONS
The amorphous structure of Fe-based alloys in as-cast state was confirmed by results of XRD
investigations (Fig.1a). The DSC curves (Fig.1b) of studied alloys present the exothermic peaks
describing a two-stage of crystallization for Fe70B20Nb10 and Fe74B20Nb6 alloys. Moreover, a single
crystallization process of Fe76B20Nb4 metallic glass was observed. The Tx = 759 K and Tp = 774 K
was achieved for Fe76B20Nb4 alloy. The addition of 10 at.% Nb caused the increase of Tx to 830 K
and Tp to 840 K, adequately. Substitution of Fe atoms by Nb led to changes in hyperfine magnetic
field (Bhf) distributions in as-cast state. For Fe70B20Nb10 metallic glass the lower value of Bhf was
observed. Therefore, addition of Nb also caused the improve of magnetic permeability and induced
formation of crystalline phases including the α-Fe, Fe2B and Fe3B after annealing. The Mössbauer

- 84 -
spectra obtained for annealed samples indicated the presence of Fe2B and Fe3B with α-Fe in all
alloys. The room temperature Mössbauer spectrum of Fe74B20Nb6 determined after annealing at 773
K for 1 hour is shown in Fig.2a. The corresponding hyperfine magnetic fields distribution p(Bhf) is
also presented in Fig.2b. The initial magnetic permeability increased with the increase of annealing
temperature and reached a distinct maximum near onset crystallization temperature.
Fig.1. X-ray diffraction patterns (a) and DSC curves (b) of studied alloys in as-cast state
Fig.2. Transmission Mössbauer spectrum with fittings (a) and hyperfine magnetic field distribution (b) of Fe74B20Nb6
metallic glass after annealing at 773 K/1h
ACKNOWLEDGMENT
The work was partially supported by National Science Centre under research project no.:
2011/03/D/ST8/04138.
REFERENCES
[1] Inoue A., Bulk amorphous and nanocrystalline alloys with high functional properties, Materials Science
and Engineering A 304-306 (2001) 1-10
[2] Babilas R., Kądziołka-Gaweł M., The influence of Nb atoms on the crystallization process of
Fe-B-Nb amorphous alloys, Acta Physica Polonica A 127 (2015) 573-575
[3] Babilas R., Kądziołka-Gaweł M., Burian A., Temleitner L., A short-range ordering in soft magnetic Fe-
based metallic glasses studied by Mössbauer spectroscopy and Reverse Monte Carlo method, Journal of
Magnetism and Magnetic Materials 406 (2016) 171-178

- 85 -
EFFECT OF HEAT TREATMENT ON THE PHASE TRANSFORMATION
AND MAGNETIC PROPERTIES OF THE RAPIDLY SOLIDIFIED
Pr9Fe58Co13Zr1Nb4B15 ALLOY RIBBONS
K. Pawlik
Institute of Physics, Częstochowa University of Technology, al. Armii Krajowej 19,
42-201 Częstochowa, [email protected]
Pr-Fe-B magnets of low Pr concentration seem to be attractive alternative to more popular
Nd-Fe-B counterparts due to a possibility of their applications at low temperatures. The argument
for that is the fact that hard magnetic Nd2Fe14B phase, undergo a significant reduction of
magnetocrystalline anisotropy below 150 K due to the spin reorientation in this phase [1].
Replacement of Nd by Pr in the alloy composition results in decrease of the spin-reorientation
temperature down to 25 K [2] and maintaining good performance of hard magnetic devices above
this temperature. The present studies are focused on evolution of microstructure and magnetic
properties of the rapidly solidified ribbons of the Pr9Fe58Co13Zr1Nb4B15 alloy subjected to
annealing. The samples were produced by controlled atmosphere single roll melt-spinning
technique at the velocity of the copper roll surface of 25 m/s. Subsequently the controlled
atmosphere heat treatment of fully amorphous samples was carried out at temperatures ranging
from 923 K to 1033 K for 5 min. The phase constitution of devitrified specimens was determined
by the qualitative analysis of XRD spectra supported by the Rietveld refinement. These studies
have shown that precipitation of hard magnetic Pr2(Fe,Co)14B and paramagnetic Pr1+xFe4B4 phases
occurs for all specimens heat treated at temperatures higher than 923 K. It was also demonstrated
that annealing at 1033 K causes formation of the additional α-Fe phase. Furthermore, the Rietveld
refinement has revealed changes in crystal sizes and weight fractions of constituent phases during
annealing. In case of specimen heat treated at 923 K, complementary Mӧ ssbauer studies have
shown a presence of large fraction of the amorphous component. The increase of annealing
temperature has an effect in optimization of the shape of the magnetic hysteresis loops. The highest
values of coercivity JHC, magnetization remanence Jr and maximum energy product (BH)max were
determined for the ribbon subjected to annealing at 1003 K. The increase of the annealing
temperature up to 1033 K resulted in rise of the saturation magnetization due to the precipitation of
the α-Fe phase, however, it has a detrimental effect on both the coercive field and shape of the
demagnetization curve. In order to characterize the influence of the phase constitution and
microstructure on the magnetization process in annealed ribbons, studies of the switching field
distribution (SFD) were performed. The SFDs which are defined as derivatives of the irreversible
magnetization remanence with respect to the magnetic field (dMirr/dH), were calculated from recoil
curves measured on specimens in the initially demagnetized state. This reflects a rate of irreversible
magnetization remanence (Mirr) changes with the increase of maximum applied magnetic fields
(H). Additionally, the profile of SFD curve provides the information about the strength of magnetic
interactions between grains of magnetic phases.
REFERENCES
[1] Xue-Fu Zhong, Ching W.Y., Lai W., Calculation of spin reorientation temperature in Nd2Fe14B,
J. Appl. Phys., 70, 1991, 6146 [2] Liu Z., Davies H.A., Composition and Microstructure Dependent Spin Reorientation in
Nanocrystalline (Nd–Pr)-(Fe–Co)-B Alloys, IEEE Trans. Magn. 40, 4, 2004, 2898-2900

- 86 -

- 87 -
PHASE STRUCTURE AND MAGNETIC PROPERTIES
OF THE CO-PRECIPITATED MAGNETITE NANOPARTICLES
P. Pawlik, M. Pruba, K. Pawlik
Institute of Physics, Czestochowa University of Technology, Al. Armii Krajowej 19, 42-200 Częstochowa, Poland
The hyperthermia is a general name for cancer treatments in which the body tissue is exposed
to the elevated temperature up to ~42oC in order to deteriorate the tumor cells. The advantage of
this therapy is the fact that the most of cancer cells reveal lower thermal conductivity than healthy
tissue, therefore they are more sensitive to the high temperature. Hyperthermia also known as a
thermotherapy frequently used as a whole body treatment is an alternative or complementary
medication to chemotherapy. Recently a great interest is focused on application of
superparamagnetic nanoparticles as a heat carrier, where the heat is induced in the nanoparticles by
the high frequency elektromagnetic field. The advantage of the magnetic hyperthermia is fact that
nanoparticles can be focused on selected organs of the body, thus limiting impact on other healthy
tissue. The major issue in selection of appropriate medium is the toxicity of the magnetic
nanoparticles. Therefore use of magnetic nanoparticles is limited to only few systems. Until now
the ferrimagnetic magnetite (Fe3O4) nanoparticles were accepted for use in human therapies
including drug delivery carriers or magnetic particle imaging (MPI). The aim of the present studies
is the determination of the influence of processing technique on the microstructure and magnetic
properties of the Fe3O4 used as a potential heat carrier in the magnetic hyperthermia. The samples
were produced by co-precipitation method. In this process the iron-oxide nanoparticles were
synthesized from aqueous solutions of Fe (II) and Fe (III) salts in the molar ratio 2:1. To the water
diluted salts the ammonium hydroxide solution was added dropwise under vigorous stirring. The
process was carried out in the nitrogen atmosphere and at the temperature of 60oC. A part of
synthesized iron-oxide nanoparticles were coated with the silica oxide using Stober process. The
X-ray diffractometry was used to determine the phase constitution of the synthesized samples. It
was shown that only one Fe3O4 phase is formed during co-precipitation . To determine the average
grain size of the specimens the Rietveld refinement was used. The analysis shown presence of
nanocrystallites of the average grain diameter of 10 nm. The Mössbauer spectroscopy confirmed
presence of the only one crystalline phase formed during the co-precipitation. However,
aggregation of nanoparticles resulted in ferrimagnetic ordering. On the other hand in case of silica
coated samples, a presence of paramagnetic component of Mössbauer spectrum suggest isolation
of nanoparticles revealing superparamagnetic behavior. Magnetic measurements confirmed
changes in the magnetic behavior of silica coated nanoparticles.
REFERENCES
[1] Pankhurst Q.A., Connolly J., Jones S.K., Dobson J., Applications of magnetic nanoparticles in
biomedicine, Journal of Physics D: Applied Physics, 36: 167-181 (2003)
[2] Frącek M., Podstawy diagnostyki i terapii nowotworów, Alfamedica Press (2008)
[3] Deptała A., Onkologia w praktyce, Wydawnictwo Lekarskie PZWL (2007)
[4] Demir A., Baykal A., Sozeri H., Topkaya R., Low temperature magnetic investigation of Fe3O4
nanoparticles filled into multi walled carbon nanotubes, Synthetic Metals 187: 75-80 (2014)

- 88 -

- 89 -
CONCEPTION OF THE THROTTLE-RETURN VALVE FOR
THE MAGNETORHEOLOGICAL FLUID
Z. Pilch and J. Domin
Faculty of Electrical Engineering, Mechatronic Department, Silesian University of Technology,
44100 Gliwice, Poland, [email protected], [email protected]
Abstract. The paper presents concept of the throttle-return vale dedicated for magnetorheological fluid.
I. INTRODUCTION
Varying viscosity fluids (magnetorheological, electrorheological) belong to one of the groups
of a smart materials. This type of fluid in magnetic field works in three different mode (flow mode,
compressing mode and clutch mode) [5]. Properties of the magnetorheological fluid are determined
by the shear stress τ [6] as a functions of flux density B curve – Fig.1.
Fig.1. The shear stress τ as a functions of flux density B curve for MRF-140CG fluid
II. CONCEPTION OF THE THROTTLE-RETURN VALVE
Examples of the valve for MR fluids are described in [1]. Throttle-return valves are used to
adjust fluid flow in one direction and achieving the free flow in the opposite direction.
Fig.2. Symbol of the hydraulic throttle-return valve a) Qaut =Q1, Q2=0, b) Qaut =Q1+Q2, where Q2>>Q1
The concept of the throttle-return valve dedicated for magnetorheological fluid (MR fluid)
shown in figure below.
Fig.3. The concept of the throttle-return vale dedicated for MR fluid

- 90 -
The valve divides stream of the flowing fluid Qin into two streams Q1 and Q2. The stream Q1
flows through the throttle valve which is responsible for the controlled fluid flow, depending on the
current supply coil number 1. The stream Q2 is set to 0 for the current supply coil number 2 equal
I=Imax, or set to maximum value for I=0.
III. SIMULATION RESULTS
The simulations were performed with using FEMM 4.2 and MATLAB program for: coils
current I=3A, number of turns n=400. As a simulations result obtained magnetic field distribution
of a duct valve cross section – see Fig.4.
Fig.4. Flux density distribution for both channel of the throttle-return valve
Based on magnetic field distribution and with using Bingham‟s model [1] distribution of the
shear stress τ for the valve return channel was determined – Fig.5.
Fig.5. Distribution of the shear stress τ for the valve return channel
IV. SUMMARY
The paper presents novel concept of the throttle-return valve dedicated for magnetorheological
fluid. The advantages of this novel concept is lack off moving parts as in the conventional valves
and possibility of reverse the stop direction and flow direction without turning the valve.
REFERENCES
[1] Abd Fatah A.Y., Mazlan S.A., Koga T. Zamzuri H., Zeinali M. Imaduddin F., A review of design and
modeling of magnetorheological valve. International Journal of Modern Physics B
29(04):1530004 · January 2015. DOI: 10.1142/S0217979215300042
[2] Claracq J., Sarrazin J., Montfort J.p., Viscoelastic properties of magnetorheological fluids. Rheol Acta
(2004) 43: 38–49 DOI 10.1007/s00397-003-0318-7
[3] Szeląg W.: Electromagnetic converters with magnetorheological fluid (in polish), Publishing House of
Poznan University of Technology, Poznań, 2010
[4] Information materials LORD Corporation: www.rheonetic.com

- 91 -
RADIATIVE POWER BEAMING USING HIGH POWER
MAGNETO-STATIC FREE-ELECTRON MASER
Y. Pinhasi
Ariel University, Faculty of Engineering, P.O. Box 3, Ariel 44837, ISRAEL, [email protected]
The concept of millimeter wave radiative power transmission in the W-band is presented. The
power beaming system consists of a powerful source generating radiation at 94GHz, which is fed
to a transmitting dish antenna. The transmitting antenna directs the electromagnetic radiation and
focuses it onto a receiving rectifying array. The rectifying antenna (rectenna) converts the received
radiation into DC electrical power, which is supplied to a consumer.
Various high power radiation sources have been used in the characterization of the rectenna.
Solid states devices produce relatively low power (less than 400mW), while Free-Electron laser
and Gyrotrons can produce several tens of kilo-Watts and above. This enables measurements of the
rectifying antenna efficiency in different operational regimes.
We will discuss the expected performances of each element, including selection of optimal
radiation frequencies as well as possible variable focusing transmitting antenna configuration. The
characteristics of a complete power beaming at millimeter waves will be reviewed and design
aspects of rectifying antenna array will be demonstrated.

- 92 -

- 93 -
ANGULAR AND FREQUENCY BEHAVIOR OF SOME PROPERTIES OF
ELECTRICAL STEEL SHEETS
W.A. Pluta
Czestochowa University of Technology, Faculty of Electrical Engineering, Al. Armii Krajowej 17, 42-200
Czestochowa, Poland, e-mail: [email protected]
Abstract. Electrical steel (ES) is one of the most widely used soft magnetic material available at optimal price. Hence,
it is used to build magnetic cores of large electrical machines and transformers. At design of these cores it is necessary
to take into account anisotropy and frequency influence on magnetic properties of ES. The paper presents angular and
frequency behavior of specific total loss and coercivity of ES.
I. INTRODUCTION
In the electrical industry the most widely used soft magnetic material is electrical steel. The
electrical steel quality influences the efficiency of electrical machines. Magnetic anisotropy
resulting from Goss texture has probably the largest influence on magnetic properties the electrical
steel sheet. Modeling of both anisotropy and frequency influence on magnetic properties of
electrical steel allow optimal and efficient design of electrical machines. The aim of the paper is to
present the influence of anisotropy and frequency on remanence flux density, coercivity and
specific loss components of electrical steel sheets.
II. EXPERIMENTAL DATA
The experiment was carried out on grain-oriented (GO) and non-oriented (NO) electrical steel
sheets. The measurements of specific total power loss were carried out in a non-standard Single
Sheet Tester (SST) on square samples of 100 mm width. Determination of the specific total loss PS
for loss separation purpose has been carried out in computerized system based on LabViewTM
programming platform. The schematic diagram of the used computerized system is presented in
Fig.1.
Isolating transformer
Shunt resistor
DAQ CARDLABVIEW
LabView:
- setup – waveform generation
(reference)
- measurements setup,
- regulator + feedback
Voltage
acquisition
Voltage
generator
Magnetising
current
Sample
under test
Flux density
sensor
Magnetising setup
Power
Amplifier
Fig.1. Schematic diagram of the measurement setup [1]
The flux density range was varied from 0.1 T to 1.3T - 1.8 T in dependence on magnetization
direction. There were chosen 10 to 12 measurement frequencies from the range of 2 Hz to 80 Hz or
100 Hz [1]. The specific total power loss was obtained under controlled sinusoidal magnetic flux
waveform and the deviation from sine wave of magnetic flux was kept well under 0.5 %.
The specific total loss of electrical steel consists of three components: hysteresis loss
component Ph and both additional Pa and classical Pe eddy current loss components. The additional
loss component was described in statistical loss model proposed by G. Bertotti [2]. First two
components hysteresis Ph (Fig. 2a) and additional Pa eddy current loss depend on magnetic
- 94 -
anisotropy and carried out calculations [3] show that the statistical loss model could be used also
for other directions than RD except the transverse direction (TD) due to different domain structure.
Both hysteresis loss Ph and additional loss Pa as a function of the maximum magnetic flux density
Bm fulfil power-law relationship.
The power low can be also used for modelling of frequency behaviour of other magnetic
properties as for example remanence or coercivity presented in Fig. 2b). The equation describing
frequency behaviour of each magnetic property is different but it could be used the same for
different magnetisation directions as for RD.
a) b)
Fig.2. a) Angular dependence of hysteresis Ph specific total loss component and b) frequency dependence of coercivity
measured along RD at different flux densities Bm and at 50 Hz for electrical steel sheet grade M150-27S. Made by a
dotted line circles mark the extrapolated points
Angular dependence of hysteresis Ph component of specific total loss clearly show influence of
magnetic anisotropy. The influence of anisotropy can be separated into two regions of flux density
differentiate by loss mechanisms that occurs in both regions. At low flux density region, up to
about 1.1 T, both hysteresis Ph (Fig. 2a) and additional Pa (not shown) loss components
continuously increase with increasing angle x. At high flux density region, above about 1.1 T, both
components increase with increasing angles x up to 45 and then both components decrease up to
angle x = 90 and faster as flux density increases.
III. CONCLUSIONS
An accurate measurement of the specific total loss of electrical steel sheets is important for
characterizing and analyzing of electrical steel sheets. The magnetic properties were performed by
means of non-standard SST measurement at min 10 frequencies. The magnetic properties of
electrical sheets are strongly dependent on magnetic anisotropy and their frequency behaviour can
be described using power-low.
REFERENCES
[1] Pluta W.A.: Measurements of magnetic properties of electrical steel sheets for the aim of loss
separation., Journal of Electrical Engineering, vol. 12, 2011, 122-127
[2] Berttoti G.: Hysteresis in magnetism. Academic Press, 1998
[3] Pluta W., Directional properties of loss components in electrical steel sheets. presented at 12th
International Workshop on 1 & 2 Dimensional Magnetic Measurement and Testing, 2012, Vienna,
Austria
0 20 40 60 800.0
0.5
1.0
1.5
2.0
2.5
Bm = 0.4 T
Bm = 0.6 T
Bm = 0.8 T
Bm = 1.0 T
Bm = 1.2 T
Bm = 1.4 T
x, deg
P x
h, W/kg
Bm = 1.5 T
0 20 40 60 80 100 1200
10
20
30
40
50
Bm= 1.8 T
Bm= 1.6 T
Bm= 1.4 T
Bm= 1.2 T
Bm= 1.0 T
Bm= 0.8 T
Bm= 0.6 T
Bm= 0.4 T
f, Hz
Hc, A/m
- 95 -
MAGNETIC PROPERTIES AND STRUCTURE AND OF THE
Ni-Mn-Co-In WITH THE BORON ADDITION
K. Prusik1, E. Matyja
2, M. Kubisztal
3, M. Zubko
4, A. Chrobak
5, R. Swadźba
5
1,2,3,4
University of Silesia, Institute of Material Science, Bankowa 12, 40-007 Katowice, Poland 1,2,3,4,5
Silesian Center for Education and Interdisciplinary Research, University of Silesia
75 Pułku Piechoty 1A, 41-500 Chorzów, Poland 5A. Chełkowski Institute of Physics, University of Silesia, Uniwersytecka 4, 40-007 Katowice, Poland
6Institute for Ferrous Metallurgy, Gliwice, Poland
Abstract. Series of Ni45.5-xCo4.5Mn36.6In13.4Bx (at.%) x=0;0.05;0.1;0.5;1.0 polycrystalline magnetic shape memory
alloys (MSMA) were examined in terms of the magnetic properties, structure and transition temperatures. The
magnetic properties of the alloys were determined by VSM whereas the X-Ray and TEM, SEM and EBSD techniques
were applied to determine the structure of alloys. Boron addition promotes nucleation of the second Co-rich and
In-poor phase as well as causes decreasing of the martensitic transformation temperatures.
I. INTRODUCTION
Magnetic shape memory alloys exhibit reversible martensitic transformation which may be
driven by temperature, external strain or magnetic field resulting in macroscopic shape change.
Large recoverable strain and high frequency response make this materials promising magnetic
actuators [1]. In polycrystalline alloys obtained by directional solidification, processed by high
temperature plastic deformation methods [2], extrusion [3] magnetic shape memory effect can be
improved. However, these alloys are very brittle. It is known, that the grain size refinement
(realized e.g. by boron addition) results in an improvement of the mechanical properties [4,5]. In
this paper the effect of the boron addition on the magnetic properties and structure of the
Ni45.5Co4.5Mn36.6In13.4 (at.%) alloy was studied.
II. RESULTS AND DISCUSSION
Polycrystalline Ni45.5-xCo4.5Mn36.6In13.4Bx (at.%) x=0 (B000), 0.05 (B005), 0.1 (B010),
0.5 (B050), 1.0 (B100) alloys were produced by the induction melting and homogenized at 1173
for 24h in vacuum and subsequently quenched into icywater. Depending on the boron addition
contents, two type of microstructures were observed: single phase (B000) and two phase
microstructure (B010-B100) (Fig.1). The matrix shows a very coarse grain microstructure for
which the grains size varies from 200 m to several millimeters. For the two phase alloys
(B005-B100) the volume fraction of precipitates increases with the boron addition. In the B100
(Fig.1b) precipitates creating kind of “subgrains” in the matrix. The average size of the second
phase grains is about 1-2 m. The boron additions also strongly influence the magnetic properties
of the studied alloys. Fig. 1 shows thermomagnetization curves (i.e. the effect of applied magnetic
field on the magnetization response as a function of temperature) for B000 (Fig.1a) and B100
(Fig.1b) alloys measured under several magnetic fields (0.5-70 kOe). For B000 sample under
magnetic field of 500 Oe, the austenite to martensite transformation started at 270 K (Ms) and
finished at 262 K (Mf) upon cooling. The reverse martensite transformation started at 278 K (As)
and finished at around 287 K (Af) upon heating. As one can see up to the 20 kOe transformation is
fully reversible with a relatively small thermal hysteresis (about 15 K at 500 Oe). As the applied
magnetic field increased from 500 Oe to 70 kOe, the transformation temperatures decreased; e.g.,
Ms decreased from 270 to 147 K.

- 96 -
Fig.1. EBSD Orientation Image Maps of B000 (a) and B100 (b) alloys
The decrease of the martensite characteristic temperatures with the magnetic field is mainly due to
the fact that the applied magnetic field favors the phase with the higher saturation magnetization
which for this alloy is austenite. On the other hand, when the content of boron is above the certain
value (in this work about 0.5at.%B the transformation is hindered).
Fig.2. Magnetization vs temperature curves of B000 (a) and B100 (b) alloys
So for the alloys B050 and B100 no martensitic transformations were observed (Fig. 2b). This is
because during the precipitation process majority of cobalt atoms dissolved in the matrix diffuses
to the precipitates and the electron to atom ratio (e/a) of the matrix became lover and as a result the
martensitic transformation temperatures decreases as well. It was proved by EDX chemical
analysis.
To sum up, the main conclusion is that magnetic and structural properties of the
Ni-Co-Mn-In metamagnetic shape memory alloys can be controlled by combination of the applied
magnetic field and boron addition.
REFERENCES
[1] Ulakko K., et. al., Mater. J. Mater. Engin. Perform. 5 (1996), 405-409
[2] Morawiec H., Goryczka T., Drdzeń A., Lelątko J., Prusik K., Solid State Phenomena Vol. 154 (2009)
133-138
[3] Prusik K., Bałdys K., Stróż D., Goryczka T., Lelątko J., Solid State Phenomena 203-204 (2013) 306-
309
[4] Tamirisakandala S., et. al., Scr. Mater. 53 (2005) 1421–1426
[5] Ramudu M., Satish Kumar A., Seshubai V., Intermetallics 28 (2012) 51-57

- 97 -
MECHANICAL PROPERTIES OF SOFT MAGNETIC COMPOSITES AT
THE TEMPERATURE OF LIQUID NITROGEN
M. Przybylski, D. Kapelski and B. Ślusarek
Tele & Radio Research Institute, Ratuszowa 11 St, 03-450 Warsaw, Poland,
[email protected], [email protected], [email protected]
Abstract. Soft magnetic composites are used in a wide range of applications working in different environmental
conditions, between others, in different temperatures. Nowadays devices often work at cryogenic temperatures. The
paper shows influence of liquid nitrogen temperature on mechanical properties of soft magnetic composites prepared
from ABC100.30 iron powder bonded by epoxy resin.
I. INTRODUCTION
Soft magnetic materials are used for preparation of magnetic circuits of electromagnetic and
electromechanical devices. Nowadays electrical steels are mainly used as soft magnetic material for
preparation of magnetic circuits of electric motors. Electric motors manufacturers are looking for
new materials with better physical properties or/and easier to technological application in a
magnetic core. Powder metallurgy gives possibility to prepare new materials for the development
of electric machines.
Soft magnetic composites (SMC), called also dielectromagnetics consists of ferromagnetic
particles distributed in a matrix of binding agent. Parts made of magnetic composites are prepared
by compression moulding technique which involves compaction of powder in a die under high
pressure. In the next step, „green compacts‟ are cured in a furnace at melting temperature of
binding agent for the increase of their mechanical strength.
The basic material for preparing soft magnetic composites are iron powder. The main feature
of these materials is that iron particles are insulated by a thin organic or inorganic coating. Particles
insulation can be made during particles making or by preparing mixture of iron powder and e.g.
resin powder before compression.
Electric motors in drive of pumps operate in liquid gas atmospheres and are applied in devices
for transport and storage of liquid gases such as: nitrogen, hydrogen or oxygen [1-3].
All materials, including magnetic materials change physical properties with changing
temperature. Changes of physical properties of magnetic circuit of electric motors influence
operational parameters of machines.
II. EXPERIMENTS
Specimens investigated in the study were produced from commercially available pure iron
powder type ABC100.30 (Höganäs AB Company). Preparation of composite elements made of this
powder require adding a bonding material. For this purpose epoxy resin Epidian 100 (CIECH
Sarzyna S.A.) was selected. Mixture of iron powder, resin in a form of powder and zinc-stearate
lubricant (0.1 wt. %) were prepared. The samples with contents 0.25, 0.50 and 0.75 wt. % of resin
were made. Then mixture was pressed in a die. The compacting pressure for all samples was 800
MPa. “Green compacts” were hardened in a furnace in a temperature 190°C in air atmosphere, at
120 minutes.
Mechanical properties such as: compressive strength and bending strength were measured at
room and liquid nitrogen temperature (-195.8°C).
The results of testing compressive strength of samples are presented in Table 1. For
comparison purpose value of compressive strength for soft magnetic composites Somaloy 700

- 98 -
(Höganäs AB Company) and AncorLam (Hoeganaes Corporation) are shown [4]. Somaloy 700 and
AncorLam powders have insulation applied on particles in process of preparation of powder.
Table 1. Compressive Strength of Soft Magnetic Composites at Different Temperatures
Type of powder Content of epoxy resin
(wt. %)
Compressive strength at
20°C
Compressive strength at
-195.8°C
ABC100.30 0.25 205 578
ABC100.30 0.50 223 601
Somaloy 700 - 513 804
AncorLam - 304 779
Bending strength called also transverse rapture strength (TRS) of prepared samples from
ABC.100.30 was measured in room and liquid nitrogen temperature. Results are presented in table
2. There are presented in the table values of transverse rapture strength composites from Somaloy
700 and AncorLam powders for comparison purpose [4].
Table 2. Transverse Rupture Strength (TRS) of Soft Magnetic Composites at Different Temperatures
Type of powder Content of epoxy resin
(wt. %) TRS at 20°C TRS at -195.8°C
ABC100.30 0.25 62.8 118.4
ABC100.30 0.50 77.7 150.4
ABC100.30 0.75 99.4 159.6
Somaloy 700 - 37.5 54.9
AncorLam - 32.9 55.3
III. CONCLUSION
The results of investigation show that mechanical properties of soft magnetic composites
increase with decreasing temperature from room to liquid nitrogen temperature. It means that this
type of material, from this point of view can be used in devices working in nitrogen temperatures.
The changes of mechanical properties of soft magnetic composites depend on the type of binding
agent and method of preparing powder with binding material, by covering iron powder by binder
during production of powder or by preparing mixture of iron powder with binding agent before
compression.
REFERENCES
[1] Walker I.R., Small dc motor for producing motion in a cryogenic environment, and a method for
monitoring its orientation, Review of Scientific Instruments, vol. 64, no. 3, 1993, pp. 814-820
[2] Kołowrotkiewicz J., Barański M., Szeląg W., Długiewicz L., FE analysis of induction motor working in
cryogenic temperature, COMPEL: The International Journal for Computation and Mathematics in
Electrical and Electronic Engineering, vol. 26, no. 4, 2007, pp. 952-964
[3] Abe Y., Nakagawa A., Watada M., Torii S., Yamane K., Ebihara D., Basic characteristics of linear
oscillatory actuator for liquid hydrogen pump, IEEE Transactions on Magnetics, vol. 32, no. 5, 1996,
pp. 5025-5027
[4] Kapelski D., Jankowski B., Przybylski M., Ślusarek B., The influence of the temperature of liquid
nitrogen on the physical properties of powder magnetic composites, Archives of Metallurgy and
Materials, vol. 60, no. 2, 2015, pp. 1323-1326

- 99 -
AN INFLUENCE OF THE TEMPERATURE AND MAGNETIC CORE
SATURATION ON THE INDUCTANCE FREQUENCY CHARACTERISTIC
OF AN INDUCTION MACHINE
J. Rolek1, G. Utrata
2 and A. Kaplon
1
1 Kielce University of Technology, Power Electronic, Electrical Machines and Drives Chair, Aleja 1000-lecia
Panstwa Polskiego 7, 25-314 Kielce, Poland, e-mail: [email protected], [email protected] 2 Czestochowa University of Technology, Institute of Environmental Engineering, J.H. Dabrowskiego 73,
42-201 Czestochowa, Poland, e-mail: [email protected]
Abstract. Algorithms for induction machine angular velocity, torque and flux estimation, developed by the authors of
the article, are based on the knowledge of the primary inductance frequency characteristic (PIFCh) of the machine.
The authors analyze the influence of the temperature and magnetic core saturation on the shape of the frequency
characteristic and provide a way to take into account changes of these parameters in the secondary multi-loop
equivalent circuit of an induction machine
I. INTRODUCTION
The PIFCh most fully reproduces variability of electromagnetic parameters of an induction
machine and therefore can be used for estimating of selected electromagnetic and mechanical
quantities of this machine required in regulation and control systems of sensorless AC drives. The
variability of electromagnetic parameters, caused mainly by the the skin effect in rotor bars, follows
also from that fact that these parameters are also a function of the electrical conductivity and
magnetic permeability.
A good approximation of the inductance frequency characteristic is obtained by means of a
machine secondary multi-loop equivalent circuit of the (Fig. 1). The method of construction of
such equivalent circuit is given in [1].
II. PRIMARY INDUCTANCE FREQUENCY CHARACTERISTIC
The PIFCh, which is defined as the ratio of the magnetic flux linkage of the primary winding
in the air gap to the current flowing trough that winding, can be determined by computational
methods. The degree of adequacy of the obtained characteristics in relation to the measured ones
depends on the adopted computational model of induction machine.
This characteristic can also be achieved by measurement according to the formula (1):
11 1 1 1
1 1δ2 1σ 2
1
,
j
U I s RL L L (1)
where: U1(ω1), I1(ω1,s) – stator voltage and current space vectors, respectively, ω1 – stator supply angular
frequency, s – motor slip, R1, L1σ – stator phase winding resistance and leakage inductance, respectively,
L1 (ω2) – inductance associated with the magnetic flux in the motor air gap, j2=-1.
Study was carried out for the induction motor SG 132S-4 with parameters: 5.5 kW, 400 V,
11 A, 1450 rpm, rotor length 114 mm, rotor diameter 133.3 mm, air gap length 0.35 mm. The
magnetic core of the motor is made of steel M600-50A. The variability of the module and
argument of the actual motor inductance in the motor slip range of |s|≤0.2 and the corresponding
circle-shaped characteristic are depicted in Fig. 3 and 2, respectively, by the black line. They are in
the good agreement with the characteristics obtained from the equivalent circuit with eight
two-terminals on the secondary (N0 = 8, Fig. 1), [2], [3]. These characteristics are the reference
ones for which the assumed temperature and relative permeability are 30˚C and 6678, respectively.

- 100 -
μL
1R 1σL
1j Ψx
1I 2I
12R 22R
22L12L
1U
12I 22I
02 NI
02 NR
02 NL
12E 22E02 NE
Fig.1. Machine secondary multi-loop equivalent circuit Fig.2. Circle-shaped characteristic
a) b)
Fig.3. Primary inductance frequency characteristics as a function of: a) temperature, b) permeability
In these figures, the effect of the machine heating and of the magnetic core saturation is also shown
by changing the parameters in equivalent circuit according to the formulas: for resistance
(30 ) 30 (1 )T AlR R T and for inductance ( / ) / ( / )rp r Fe r Fe rpL L l l l l , where:
Al - resistance
temperature coefficient [K-1
], , Fel l - path length for the magnetic flux in the air gap and iron,
respectively [m], , r rp - relative permeability.
III. CONCLUSIONS
Temperature of the electric circuits and saturation of the magnetic core of the induction
machine affect its slip dependent characteristics of the primary inductance module and argument.
For the estimation of electromechanical quantities in the range of angular velocity
corresponding to the slip ns s it is convenient to use the inductance argument, while for the slip
ns s the inductance module.
REFERENCES
[1] Kapłon A., Estymacja parametrów elektromagnetycznych określających stany elektrodynamiczne
maszyn prądu przemiennego analizowanych za pomocą modeli wielowarstwowych, Monografia,
Wydawnictwo PŚk, Kielce, 2003, str. 171 [2] Utrata G., Rolek J., Kaplon A., The Genetic Algorithm for an Electromagnetic Parameters Estimation
of an Induction Motor Secondary Multi-Loop Equivalent Circuit", IREE, vol. 9 no. 6, 2014, pp. 1111-
1118,. DOI:10.15866/iree.v9i6.4599
[3] Rolek J. , Utrata G. , Kaplon A. , Estimation of Electromagnetic Parameters of an Induction Motor
Multi-loop Equivalent Circuit Based on the Machine Inductance Frequency Characteristic, Proc. of
WZEE 2015, Kielce, 2015, Poland, pp. 141-146, DOI:10.1109/WZEE.2015.7394018

- 101 -
RECENT STATE OF RESEARCH ON COMPRESSIVE AND TENSILE
STRESSES INFLUENCE ON MAGNETIC PROPERTIES
OF AMORPHOUS MATERIALS
J. Salach
Institute of Metrology and Biomedical Engineering, Warsaw University of Technology,
Warsaw, Poland, [email protected]
Abstract. The paper presents the recent state of research on compressive and tensile stresses influence on the magnetic
properties of selected amorphous materials with different composition. The materials represent the most important
group of magnetic materials allowing to generalize the impact of stress on the magnetic properties of metallic glasses.
I. INTRODUCTION
The development of amorphous magnetic materials created new possibilities with regard to
further development of magnetoelastic sensors. The main differences between amorphous magnetic
materials and crystalline magnetic materials are their higher magnetic permeability lower
coercive field intensity Hc and higher mechanical strength. Mechanical strength is particularly
significant in case of magnetoelastic sensor core use. Magnetically soft amorphous magnetic
materials are usually built in form of a thin ribbon, about 25 m thick, or a wire of about 125 m
diameter, which results in limiting the shape of cores made of those materials to rings made of
ribbons. Ring-shaped cores are commonly used in constructing inductive components. However,
using them as magnetoelastic sensor cores causes serious difficulties. It is a problem to obtain
a closed magnetic circuit and uniform stress distribution in the core at the same time. Only solution
proposed by the author allowed fulfilling both of these conditions.
II. TECHNICAL INSTRUCTIONS
In the papers up to now concentrated on researching magnetoelastic properties of state of the
art magnetic materials – amorphous alloys. Within the scope of presented research author show
a general description of magnetoelastic B(± )H characteristics for this magnetic material class. The
research described in papers covered amorphous magnetic materials with various physical and
chemical properties:
• cobalt based [1], with low negative saturation magnetostriction coefficient s (below
1 m/m) and very high magnetic permeability r in the region of 106,
• cobalt based with addition of iron [3], with saturation magnetostriction coefficient s close
to zero and very high magnetic permeability r in the region of 5·104,
• iron based [2, 4, 6, 9, 10], with high positive saturation magnetostriction coefficient s (over
35 m/m) and high saturation induction Bs, up to 1,5 T,
• iron and nickel based [2, 5, 7, 8, 11], with positive saturation magnetostriction coefficient s
(around 15 m/m) and possibility to create induced magnetic anisotropy under thermal relaxation.
The comparison of conducted research with regard to alloys both as-quenched and after
thermal relaxation carried out in selected cases with external magnetic field present. The
investigated amorphous magnetic materials represent the most significant amorphous magnetic
material groups varying in terms of physical and chemical composition, as well as in terms of
varying saturation magnetostriction coefficient s. Varying saturation magnetostriction coefficient
s is important because of the function of magnetostriction in a magnetoelastic phenomenon, since
sign and value of this coefficient define the position of the Villari point in magnetoelastic B(± )H
characteristics.

- 102 -
With regard to amorphous magnetic materials, the conducted research made it possible to
provide a general description of magnetoelastic B(± )H characteristics and new guidelines
regarding choosing the composition of these alloys for magnetoelastic sensor cores. As the result of
described works a completely new method for assessment of the influence of stresses on processing
characteristics of current transformers was developed [1]. The developed methodology makes it
possible to relate magnetoelastic characteristics of current transformer cores to their processing
characteristics during current measurement. It was proved that such alloys are fit for current
transformer cores only under the condition that they are not to be subjected to influence of tension
from external forces. The magnetic material proposed in the publication has high magnetoelastic
sensitivity, which makes it potentially fit for use as a stress sensor core.
REFERENCES
[1] Salach J., Stresses influence on magnetic characteristics of amorphous ring cores for current
transducers, Journal of Electrical Engineering, 2015, Vol. 66, No. 7s, 41–44
[2] Salach J., Magnetoelastic effect for three type magnetic materials under torque load, Advances in
Intelligent Systems and Computing, 2015, Vol. 393, 515–520
[3] Salach J., Szewczyk R., Svec Sr P., Bieńkowski A., Jackiewicz D., Svec P., Nowicki M., Winiarski W.,
Kachniarz M. and Gruszecka M. The influence of thermomagnetic treatment on the magnetoelastic
characteristics of Fe61Co19Si5B15 amorphous, Acta Physica Polonica A, 2015, Vol. 127, 617–619
[4] Salach J., Jackiewicz D., Bieńkowski A., Szewczyk R., Gruszecka M., Amorphous soft magnetic
Fe80B11Si9 alloy in tensile stress sensors application, Acta Physica Polonica A, 2014, Vol. 126, 102–
103
[5] Salach J., Szewczyk R., Bieńkowski A., Frydrych P., Methodology of testing the magnetoelastic
characteristics of ring-shaped cores under uniform compressive and tensile stresses, Journal of
Electrical Engineering, 2010, Vol. 61, No. 7s,93–95
[6] Salach J., Jackiewicz D., Bieńkowski A., Nowicki M., Gruszecka M., Influence of tensile force on
magnetic properties of amorphous Fe80B11Si9 alloys in different states of thermal relaxation, Advances
in Intelligent Systems and Computing, 2014, Vol. 267, 665–675
[7] Szewczyk R., Ńvec Sr. P., Salach J., Svec P., Bieńkowski A., Hosko J., Jackiewicz D., Kamiński M.,
Winiarski W., Influence of thermomagnetic treatment on magnetoelastic properties of FeNiMoB
amorphous alloy, Acta Physica Polonica A, 2014. Vol. 126, No.1, 52–53
[8] Bieńkowski A., Salach J., Szewczyk R., Kolano R. The magnetoelastic characteristics of Fe70Ni8Si10B12
amorphous alloy subjected to thermo-magnetic treatment, Acta Physica Polonica A, 2008, Vol. 113,
87–91
[9] Salach J., Szewczyk R., Bieńkowski A., Jackiewicz, D. Possibilities of application of amorphous
Fe77Cr2B16Si5 alloys in different states of thermal relaxation as magnetic tensile force sensors, Solid
State Phenomena, 2013, Vol. 198, 388–393
[10] Salach J., Szewczyk R., Bieńkowski A., Nowicki M. Tensile stress sensor with amorphous ring shape
core, Solid State Phenomena, 2015, Vol. 220–221, 515–519
[11] Szewczyk R., Bieńkowski A., Salach J., The temperature dependence of the magnetoelastic
characteristics of cores for force sensors utilizing Fe70Ni8Si10B12 amorphous alloy, PRAMANA Journal
of Physics 2008, Vol. 71, 591–597

- 103 -
SIMULATION AND INVESTIGATION OF THE MICRO-DISPLACEMENT
ACTUATOR WITH MAGNETOSTRICTIVE ROD
D. Stachowiak and A. Demenko
Poznań University of Technology, Piotrowo 3a, 61-138 Poznań, Poland,
e-mail: [email protected], [email protected]
Abstract. The paper presents the experimental and numerical investigation of the output characteristics of the giant
magnetostrictive actuator. To determine the distribution of the magnetic and the mechanical fields the finite element
method was used. In the proposed model the coupling of magnetic and mechanical field has been taken into account.
The obtained results of simulations and their comparison with the measurements show that the applied method is
sufficiently accurate.
I. INTRODUCTION
The most popular giant magnetostrictive material (GMM) is the Terfenol-D, an alloy made of
iron (Fe) and two rare earth elements terbium (Tb) and dysprosium (Dy). The two main areas of
Terfenol-D applications are actuators and sensors. Giant magnetostrictive actuators (GMA) are used
in high-class industrial devices (linear motors, micropumps, microvalves, micropositioners, etc.),
biomedical applications and arm industry [1].
Magnetostriction is the change in shape of materials under the influence of an external magnetic
field. The simplest form of the GMA consists of a cylindrical rod which is magnetically excited by a
coil surrounding the rod to generate strain and force. The GMA exhibits nonlinear behavior and
magneto-mechanical coupling characteristic. In order to design the GMA, an accurate modeling of
their characteristic is necessary. Usually, to determine the distribution of the magnetic and the
mechanical fields the finite element method was used.
The paper presents a finite element (FE) model of the GMA. The model is based on the
equations of electromagnetic field and Navier‟s equations for mechanical systems. The equations are
coupled using a nonlinear magneto-mechanical constitutive law for Terfenol-D.
II. MAGNETO-MECHANICAL EQUATIONS
In magnetostrictive material the strain and the magnetic flux density B are functions of the
stress and the magnetic field intensity H. The behavior of magnetostrictive materials is described
with nonlinear relations = ( , H), B = B( , H) [1]. Here, the total strain tensor is the sum of
the elastic strain e and the magnetostrictive strain ms, i.e. = e + ms. Only the elastic strain
contributes to mechanical stress [1, 2]. According to Hook‟s law, the stress tensor is described as
follows,
mse εεεσ CCC , (1)
where C is the 6x6 stiffness tensor widely used in structural analysis. The second component of (1)
represents blocked stress block of a material, block = C ms_max.
Very often the magnetostrictive strain is modeled using the linear constitutive relation
ms = d H, where d is the piezo-magnetic strain matrix. However, in reality, the relation between strain
ms and intensity H is nonlinear. In the paper, the relation proposed in [3] is applied.
2
2
3
S
mSms
M
Hχλε , (2)
where S is the saturation magnetostriction, MS is the saturation magnetization, and m is the
magnetic susceptibility [3]. The relationship between the strain and displacement u has been
expressed as, = Du, where D is the strain-displacement (symmetric-gradient) matrix [2].

- 104 -
III. RESULTS AND CONCLUSIONS
The brittle nature of Terfenol-D and its poor machinability restricts its availability to
geometries like cylindrical rods (Fig. 1). The axisymmetrical GMA has been considered. The main
components of the actuator consist of a cylindrical Terfenol-D rod, a wound excitation coil and a
prestress spring washer. Application of proper compressive prestress increases the value of the
maximum strain. The computations have been performed in an axial-symmetric domain with
cylindrical coordinates (r, z, ). The elaborated nonlinear magnetostrictive model has been
implemented in the commercial FE package. It has been assumed that GMA is supplied from a DC
power source. It should be noted that the calculation have been preceded by the measurement of
nonlinear characteristics of the materials applied in the FE model - Fig. 2.
In Figs. 3 and 4 the selected results of calculation have been given. The calculated values of the
output displacement of the GMA have been compared with measured values – see Fig. 3. Fig. 4
shows the blocked force of the GMA as a function of supply current. To determine a blocked force,
the Terfenol-D rod is considered to be clamped.
(a) (b)
Fig.1. The sample of Terfenol D and steel S235 (a),
Kerr microscope image of surface of Terfenol D (b)
Fig.2. Measured magnetization characteristic of the
materials used in the FE model
Fig.3. The displacement of the GMA vs. the supply
current
Fig.4. The blocked force of the GMA vs. the supply
current
The obtained results and their comparison with the measurements show that the proposed
model is sufficiently accurate. Thus, the model can be successfully applied in the analysis and
design of axisymmetrical magnetostrictive actuators.
REFERENCES
[1] Engdahl G., Handbook of giant magnetostrictive materials. San Diego, USA, Academic Press, 2000
[2] Stachowiak D., Finite element analysis of the active element displacement in a giant magnetostrictive
transducer, COMPEL, Vol. 35 Iss. 4, pp.1371 - 1381, 2016
[3] Cullity B.D., Graham C.D., Introduction to Magnetic Materials, Wiley-IEEE Press, 2008
0
0.3
0.6
0.9
1.2
1.5
1.8
0 5 10 15 20 25
Steel S235
GMM Terfenol-D
Magnetic field intensity, H [kA]/m
Mag
net
ic f
lux
den
sity
, B
[T
]
0.00
0.02
0.04
0.06
0.08
0.10
0 2 4 6 8 10 12
Dis
pla
cem
ent,
u [
mm
]
Current, I [A]
EXPERIMENT
FEM calculation0 MPa
7.2 MPa
7.2 MPa
0 MPa
-120
-90
-60
-30
0
0 2 4 6 8 10 12
Current, I [A]
Forc
e, F
[N
]Steel S235
Terfenol-D

- 105 -
HOW TO PERFORM THE ACCURATE MAGNETIC MEASUREMENTS –
PHYSICAL INTERPRETATION AND PRACTICAL IMPLEMENTAION (12 pt)
A. Stupakov
(10pt)
Institute of Physics, Czech Academy of Sciences, Na Slovance 2, 18221 Prague, Czech Republic
[email protected], www.fzu.cz\~stupak
(12 pt)
(12 pt)
Recently we developed a unique system for physically accurate measurement of the magnetic
hysteresis, the magnetic Barkhausen noise (BN) and the magneto-acoustic emission. A novelty of
this setup consists in a combination of two main features: a precise local determination of the
magnetic field and a feedback control of the magnetization process. First, the tangential
components of the surface magnetic field are measured by two Hall sensors at different distances
above the sample. The sample field is determined by a linear extrapolation of these measured fields
to the sample surface (see Fig. 1). Second, a digital feedback loop adjusts the time dependence of
the magnetic induction or field. The feedback algorithm combines two classical methods of
magnetizing signal adjustment: linear corrections of the magnetizing voltage amplitude and phase.
This measurement approach provides stable and physically accurate results, which are independent
of a specific experimental configuration. In particular, the measurements can be correctly
performed in the magnetically open configurations, which was considered to be a real technical
challenge so far (see Fig. 2) [1,2].
(6 pt)
Fig.1. Block schemes of the magnetizing–sensing unit and the measurement setup (6 pt)
An efficiency of the developed measurement system was extensively tested for a wide scale of
the magnetization conditions: different open/closed magnetization circuits, the sinusoidal/triangular
shapes of the controlled field/induction waveforms, magnetizing frequencies in the range
0.1-200 Hz as well as for different industrial materials from the magnetically softest melt-spun
ribbons and electrical steels to the relatively hard spring/TRIP steels. This gave principally new
results, which should activate debates about the principles of the industrial magnetic testing, further
development of the measurement standards and the magnetic non-destructive techniques. In
particular, a strong linear relation between our hysteresis measurements of the soft electrical steels
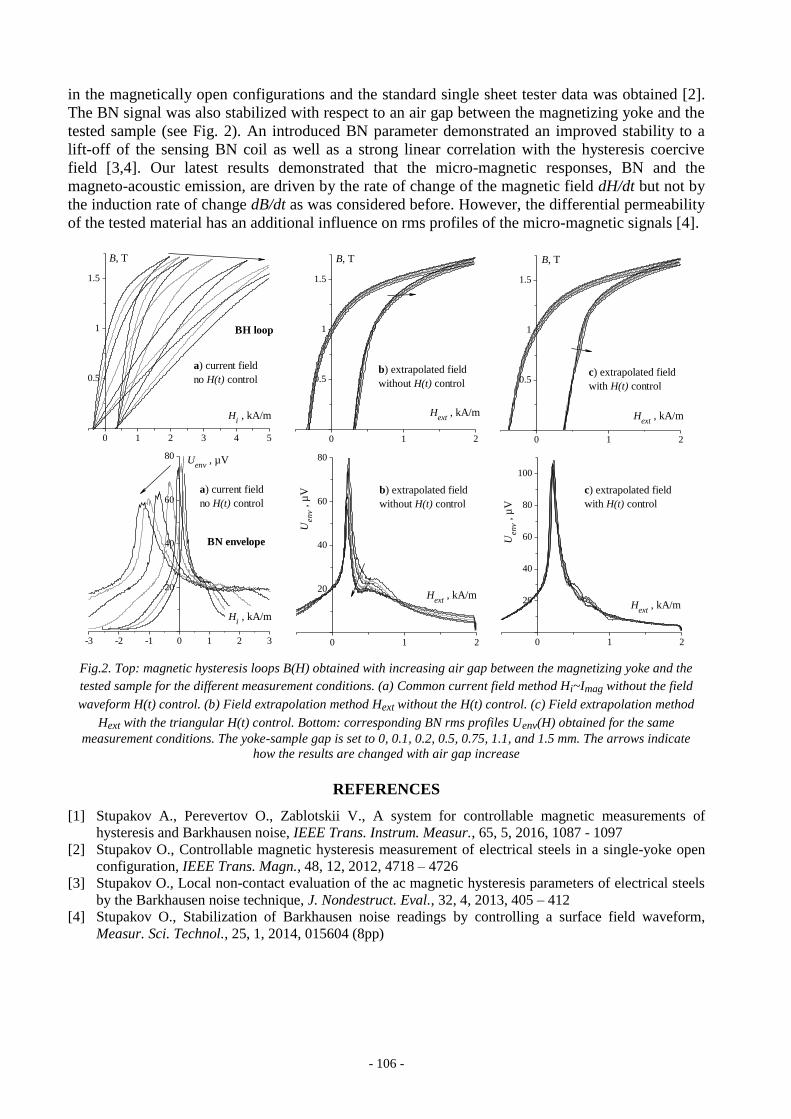
- 106 -
in the magnetically open configurations and the standard single sheet tester data was obtained [2].
The BN signal was also stabilized with respect to an air gap between the magnetizing yoke and the
tested sample (see Fig. 2). An introduced BN parameter demonstrated an improved stability to a
lift-off of the sensing BN coil as well as a strong linear correlation with the hysteresis coercive
field [3,4]. Our latest results demonstrated that the micro-magnetic responses, BN and the
magneto-acoustic emission, are driven by the rate of change of the magnetic field dH/dt but not by
the induction rate of change dB/dt as was considered before. However, the differential permeability
of the tested material has an additional influence on rms profiles of the micro-magnetic signals [4].
Fig.2. Top: magnetic hysteresis loops B(H) obtained with increasing air gap between the magnetizing yoke and the
tested sample for the different measurement conditions. (a) Common current field method Hi~Imag without the field
waveform H(t) control. (b) Field extrapolation method Hext without the H(t) control. (c) Field extrapolation method
Hext with the triangular H(t) control. Bottom: corresponding BN rms profiles Uenv(H) obtained for the same
measurement conditions. The yoke-sample gap is set to 0, 0.1, 0.2, 0.5, 0.75, 1.1, and 1.5 mm. The arrows indicate
how the results are changed with air gap increase
(12 pt)
REFERENCES (6 pt)
[1] Stupakov A., Perevertov O., Zablotskii V., A system for controllable magnetic measurements of
hysteresis and Barkhausen noise, IEEE Trans. Instrum. Measur., 65, 5, 2016, 1087 - 1097
[2] Stupakov O., Controllable magnetic hysteresis measurement of electrical steels in a single-yoke open
configuration, IEEE Trans. Magn., 48, 12, 2012, 4718 – 4726
[3] Stupakov O., Local non-contact evaluation of the ac magnetic hysteresis parameters of electrical steels
by the Barkhausen noise technique, J. Nondestruct. Eval., 32, 4, 2013, 405 – 412
[4] Stupakov O., Stabilization of Barkhausen noise readings by controlling a surface field waveform,
Measur. Sci. Technol., 25, 1, 2014, 015604 (8pp)
0 1 2
20
40
60
80
100
-3 -2 -1 0 1 2 3
20
40
60
80
0 1 2
20
40
60
80
0 1 2
0.5
1
1.5
0 1 2
0.5
1
1.5
0 1 2 3 4 5
0.5
1
1.5
c) extrapolated field
with H(t) controlU
env , µ
V
Hext
, kA/m
Uenv
, µV
Hi , kA/m
BN envelope
a) current field
no H(t) control
b) extrapolated field
without H(t) control
Hext
, kA/m
Uenv , µ
V
b) extrapolated field
without H(t) control
B, T
Hext
, kA/m
B, T
Hext
, kA/m
c) extrapolated field
with H(t) control
a) current field
no H(t) control
BH loop
Hi , kA/m
B, T

- 107 -
OPEN SOURCE ELMER SOFTWARE BASED FEM MODELLING
OF WAVEGUIDES AND RESONANT CAVITIES FOR MICROWAVE
HEATING AND DRYING DEVICES
J. Szałatkiewicz1, R. Szewczyk2, M. Kalinowski1, J. Kataja3, P. Råback3, J. Ruokolainen3
and M. Kachniarz2
1 Industrial Research Institute for Automation and Measurements PIAP,
Al. Jerozolimskie 202,02-486 Warsaw, Poland 2 Institute of Metrology and Biomedical Engineering, Warsaw University of Technology, sw. A. Boboli 8; 02-525
Warsaw, Poland, [email protected] 3 CSC - CSC – IT center for science, P.O Box 405, FI-02101 Espoo, Finland
Abstract. Microwave devices are widely used in the industry and in the specialized laboratory analyses. Development
of such devices require possibility of modeling of microwave energy distribution in the specific resonant chambers.
Until now, such modeling was possible only with the use of commercial software or was limited to specific cases.
Paper presents open-source module for ELMER software for solving time-harmonic Maxwell’s equations, allowing
modelling of microwave waveguide lines. Three test cases of different resonant chambers are investigated at 2.45GHz
frequency. Modelling results obtained from open-source ELMERVectorial Helmholtz module show that application of
this software can be effective in R&D works, enabling high-tech small and medium enterprises involvement in
advanced microwave technology.
I. INTRODUCTION
Modelling of key elements of developed devices is important part of development process,
reducing it cost and increasing efficiency. The most flexible method of this modeling, commonly
implemented in commercial development tool chains is finite element method (FEM). However,
development of special devices, such as microwave chambers for heat drying e.g. in the food
industry [1], require specialized modelling software, which is expensive. As a result development
of special microwave devices is monopolized by large-scale companies, which are able to cover
significant investment costs at the beginning of development process.
Recently, the open source modeling software becomes more and more important alternative,
opening development niches for small enterprises. One of such solution is ELMER FEM, enabling
modeling of mechanical, thermal, electrical and magnetic systems. However, until now, it was not
possible to model microwave systems with this software, which makes microwaves as one of last
area, where FEM modeling during the development of devices was limited by necessity of large
investment in commercial modeling software.
This paper present the solution overcoming this problem. Open source ELMER finite element
method oriented software was equipped in module enabling calculation of microwave distribution
in the resonant chamber. Open source Delaunay tetrahedral meshing modules, visualization
software and solvers using conjugate gradient-oriented algorithms previously available in ELMER
were applied to solve proposed set of differential equations.
II. METHOD OF MODELLING
Real technical cases, described by the full set of differential Maxwell equations, are very
difficult to be modelled, even using advanced methods and high power computers. For this reason,
Maxwell equations are reduced to describe the specific cases, such as magnetostatic,
magnetodynamic, optics or microwaves.

- 108 -
In developed module time-harmonic Maxwell equations system is given as [2]:
(1)
(2)
(3)
(4)
(5)
where f is the frequency of the electromagnetic field, 0 is magnetic constant, r is relative
permeability, 0 is permittivity of vacuum and r is relative permittivity of material. E, H and J are
electric field, magnetic field and impressed current distributions respectively. In the developed
module the Leontovich impedance boundary and the first order absorbing boundary conditions are
implemented together with the port feed described as the Robin boundary.
III. RESULTS AND CONCLUSION
Figure 1 presents the results of simulations of the same WR340 waveguide for 2.45GHz with
two different cylindrical cavities attached to one of its end. It can be clearly seen, that the
resonance and distribution of the electric field in the cavities depends on its diameter.
a) b)
Fig.1. Distribution of electric field in cylindrical cavities attached to WR340 waveguide (frequency f = 2.45 GHz).
Cavity with diameter: a) 250 mm, b) 400 mm
Presented results confirm, that it is possible to perform 3D simulations of microwave devices
using open-source software for finite elements method. Such simulations are especially important
for small, high-tech companies involved in microwave technology.
REFERENCES
[1] Krokida M.K., MaroulIs Z.B., Effect of microwave drying on some quality properties of dehydrated
products, Drying Technology, 17(1999) 449
[2] Råback P., Malinen M., Ruokolainen J., Pursula A., Zwinger T. (Eds.), Elmer Models Manual, CSC –
IT Center for Science, March 30, 2016.

- 109 -
ANALYSIS OF THE APPLICABILITY OF 3D MAGNETIC FILAMENT
TECHNOLOGY IN ELECTRICAL AND ELECTROMECHANICAL
DEVICES
M. Szczygieł1, Z. Pilch
1, J. Domin
1, T. Trawiński
1, K. Kluszczyński
1, M. Przybylski
2, B. Ślusarek
2
1 Faculty of Electrical Engineering, Mechatronic Department, Silesian University of Technology, 44100 Gliwice,
Poland, [email protected], [email protected], [email protected],
[email protected], [email protected] 2 Tele and Radio Research Institute, 03450 Warszawa, Poland, [email protected],
Abstract. In the paper the initial results of experiments with new material dedicated to 3D printing filament technology
are presented. Authors compared properties of new material polylactide (PLA) doped with Nd-Fe-B) with standard
material which are used in electromechanical devices.
I. INTRODUCTION
Nowadays additive production is identified with 3D printing process. The 3D printing methods
can be divided into: powder or resin printing, lamination and Fused Filament Fabrication (FFF)
method (realized by using paste or wire). The FFF method of 3D printing was developed in 80‟s of
20th century but only in recent years devices for 3D printing were designed and control
methodology of these devices were done. Actually FFF method of 3D printing is the cheapest from
the rest of 3D printing methods.
3D printing process is connected with a rapid prototyping method for production of individual
parts of devices for their verification in pre-production.
Elements performed by FFF method have a layered structure, which is important in relation to
the strength parameters [2]. The development of this technology has contributed to the interest of
this technology by universities and scientific research centres. Actually trends in the development
of 3D printing are focused on devices that ensure high repeatability and reliability as well as high
precision of printed elements.
II. CONCEPTION OF MAGNETIC FILAMENT TECHNOLOGY
Conception of magnetic filament technology based on the typical technology which used in
FFF method but wire for printing is a Nd-Fe-B doped magnetic material. The material was
produced on single screw extruder and result is wire with a diameter 1.75 mm dedicated to standard
3D printer.
Fig.1. Cross section of a wire for printing PLA doped Nd-Fe-B

- 110 -
III. INITIAL RESULTS OF EXPERIMENT – 8 POLE PERMANANT MAGNET OF
SPINDLE MOTOR USED IN HARD DISC DRIVE
Spindle motors (SM) used in modern storage devices (hard disk drives) belong to the class of
brushless DC motors. The rotors of these motors composed of a ring of permanent magnet and
yoke of the magnetic circuit (rotor yoke) are fixedly connected to the spindle (on which are
deposited the hard drive platters) [1]. Spindle motors used in modern storage devices have different
internal design features, but the most commonly used configuration between the number of poles of
the permanent magnet ring and the number of stator teeth are as follow: 8 poles / 9 teeth, 8 poles /
12 teeth. In Fig.2 the internal structures of those above mentioned configuration are shown. In
Fig.2. the magnetic yoke of the stator with stator tooth are denoted by (1), by (2) the magnetic yoke
of the rotor is denoted and finally the permanent magnet ring is denoted by (3). For depictive
purposes in Fig.2 the magnetic ring was partitioned into magnetic poles.
Fig.2. Simplified internal structure of a modern spindle motor (stator windings is removed): a) - 8 pole / 9 teeth
configuration, b) – 8 pole / 12 teeth configuration
During experiment SM motor magnet was made in the filament technology and result is
presented in Fig.3. After magnetization process the permanent magnet of rotor will be mounted in
rotor of a SM motor. Results of measurements of operational parameters of a model motor will be
presented.
Fig.3. Results of experiment: rotor of SM motor with original permanent magnet and (on right side)
magnet produced in the filament technology.
REFERENCES
[1] Kołton W., Trawiński T., Badania drgań silników wrzecionowych pamięci masowych, Przegląd
Elektrotechniczny, ISSN 0033-2097, R. 87 NR 12b/2011, s.188-191
[2] Tymrak B.M., Kreiger M., Pearce J.M., Mechanical properties of components fabricated with open-
source 3-D printers under realistic environmental conditions, Materials and Design 58 (2014) 242–246.
www.elsevier.com/locate/matdes

- 111 -
METHOD OF MOMENTS IN JILES-ATHERTON MODEL BASED
MAGNETOSTATIC MODELLING OF THIN LAYERS
R. Szewczyk
Institute of Metrology and Biomedical Engineering, Warsaw University of Technology,
sw. A. Boboli 8; 02-525 Warsaw, Poland, [email protected]
Abstract. Method of moments enables effective magnetostatic modelling of thin layers, where thickness of the layer
should be considered. This paper presents the non-linear extension for this method of modelling.Initial magnetization
curve, necessary for modelling, was reconstructed from saturation hysteresis loops on the base of Jiles-Atherton
model. Finally, the set of non-linear equations was stated, and example of solution for square-shaped magnetic thin
layer is presented.
I. INTRODUCTION
Method of Moments is an important alternative for Finite Elements Method in the case of
magnetostatic simulations of thin layers. For the thin layers, tetrahedral meshing leads to radical
increase of the numbers of elements, which creates calculation problems. In the case of Method of
Moments, thin layer may be described by 2D uniform mesh with given thickness and the set of
linear equations.
However, commonly used linear simplification of description of soft magnetic material with
constant value of magnetic permeability may lead to significant errors. To overcome this problem,
shape of initial magnetization curve should be considered.
II. RECONSTRUCTION OF INITIAL MAGNETIZATION CURVE
Measurement of initial magnetization curve is difficult from technical point of view. For these
reason initial magnetization curve and its relative permeability versus magnetization M
dependence is rarely presented for soft magnetic materials. However, it was previously proven [1],
that Jiles-Atherton model very well reconstructs initial magnetization curve on the base of
saturation magnetic hysteresis loop. In such a case, the parameters of Jiles-Atherton model
determined on the base of magnetic saturation hysteresis loops may be used to calculate both initial
magnetization curve as well as relative permeability versus magnetization M dependence.
Example of such calculations for isotropic 3H13 steel is given in the figure 1.
Due to the necessity of application of the Runge-Kutta method for solving ordinary differential
equations stating Jiles-Atherton model, such calculations are time consuming. For this reason, the
results of modelling of relative permeability versus magnetization M dependence were stored in
the lookup table. Exact values were determined by interpolation.
III. METHOD OF THE MOMENTS FOR THIN LAYERS
Generalization of magnetostatic Method of moments for thin layers with regular rectangular
grids was presented previously [2]. To consider nonlinear dependence of relative permeability
versus magnetization M equations stated the Method of moments (for the x axis direction) should
be extended to the following form:
(1)

- 112 -
Where is spline-based interpolation of relative permeability versus
magnetization M dependence in initial magnetization curve. Solution of such set of nonlinear
equations was implemented with OCTAVE 4.0 software on the base of Powell‟strust-region dogleg
algorithm.
a) b)
Fig.1. Results of modelling based on the Jiles-Atherton model: a) reconstructed hysteresis loop with the initial
magnetization curve (solid line), results of measurements (dotted line), b) reconstructed relative permeability versus
magnetization M dependence
IV. RESULTS OF MODELLING AND CONCLUSIONS
Results of modelling of square-shaped thin film element are presented in the figure 2. The
length of the element was 10 mm, whereas its thickness was 30 m. Magnetizing field strength was
1000 A/m.Relative permeability versus magnetization M dependence for 3H13 steel was used for
simulation.
a) b)
Fig.2. Results of magnetostatic modelling of square-shaped thin film element: flux density B in: a) x-axis, b) y-axis
Results of simulation confirm that nonlinear permeability dependence may be considered in
reasonable time of calculation and significantly improve the accuracy of simulations.
REFERENCES
[1] Roubal Z., Smejkal V., Determination of parameters in the Jiles - Atherton model for measured
hysteresis loops, 9th International Conference MEASUREMENT 2013, Smolenice, Slovakia
[2] Szewczyk R., Generalization of magnetostatic Method of moments for thin layers with regular
rectangular grids, 16th Czech and Slovak Conference on Magnetism 2016, Końice, Slovakia

- 113 -
COMPLEX CHARACTERISTICS OF SINTERED Nd-Fe-B MAGNETS
FROM SCRAP HDDs
M. Szymański1, B. Michalski
1, M. Leonowicz
1 and Z. Miazga
2
1 Warsaw University of Technology, Faculty of Materials Science and Engineering, 141 Woloska Street, 02-507
Warsaw, Poland, [email protected], [email protected], [email protected] 2 P.P.H.U. Polblume Zbigniew Miazga, 35 11-tego Listopada Street, Piaseczno, Poland, [email protected]
Abstract. Sintered Nd-Fe-B magnets were dismantled – by the P.P.H.U. Polblume company – from scrap hard disc
drives (HDDs), thermally demagnetized at 400oC and analyzed in terms of their chemical composition, structure and
magnetic properties. It was noticed that the magnets have bipolar magnetizing. All of the magnets were covered with a
nickel or nickel-cooper coating (around 50 µm in thick), which however was often discontinuous and deeply scratched.
What is more, the majority of the magnets were partially destroyed (broken or corroded). The examined magnets were
basically made of iron (65±1%wt.) and neodymium (30±2%wt.) however they differed with a concentration of alloying
elements such as Co (1-2.5%wt.), Dy (0-1%wt.) or Pr (0-5%wt.). Magnets were textured thus their XRD pattern (for bulk,
as received magnets) did not match with a relevant one for the Nd2Fe14B (φ) phase. A typical XRD pattern of the Nd-
Fe-B magnets was achieved for a powder obtained after mechanical crushing of the magnets. The grey grains of
Nd2Fe14B (φ) phase and a thin Nd-rich grain boundary phase were observed in the magnets by SEM. The magnets
exhibited excellent magnetic properties: maximum energy product above 300 kJ/m3, remanence above 1 T and
coercivity above 1000 kA/m, slightly varying between each magnet. What is more, the magnets were strongly
anisotropic possessing the best properties when measured perpendicular to their flat surface.
I. INTRODUCTION
It is a commonly known fact that a noble and precious metals can be recovered from the Waste
of Electric and Electronic Equipment (WEEE). This is due to both economic and environmental
reasons. The WEEE has to be precisely characterized in order to allow for developing reasonable
recovery methods, dedicated for particular type of the e-scrap. Present work is focused on
characterization of a neodymium-iron-boron magnets which are the important products made of
rare earths elements (with respect to a concentration/volume ratio) and are available in quite large
amounts. The rare earths metals (Nd, Pr, Dy, Tb etc.) are recognized as critical raw materials for
the UE and that is why there is an urgent need for studies focused on recycling technologies for
these elements [1,2]. The Nd-Fe-B magnets are parts of electric motors, detection systems,
loudspeakers etc. Currently, one of the biggest application of Nd-Fe-B magnets are Voice Coil
Motors (VCM) in computer Hard Disc Drives (HDDs) – there are 2 sintered Nd-Fe-B magnets in
the VCM of HDD (for more details see [3]). Old computers are replaced by newer in around 5
years period. Thus, a constant inflow of scrap HDDs (including magnets) occurs [4]. The WEEE
can be recognized as an “urban ore” and can be a source of rare earth metals (urban mining
concept) [5]. Taking all of these into account, a full characteristic of scrap Nd-Fe-B magnets was
carried out hoping that this will help for further processing of these materials.
II. EXPERIMENTAL
The magnets were provided by the P.P.H.U. Polblume Zbigniew Miazga company. Visual
observations were carried out in order to estimate size, shape, mass and general look of the
magnets. A magnetic field viewer film was placed into the magnets revealing they have bipolar
magnetizing. Subsequently, the magnets were thermally demagnetized under an inert atmosphere at
400oC. Coatings of the magnets were examined using both light and scanning electron microscopy.
Chemical composition of the magnets was investigated with two techniques: an Energy-Dispersive
Spectroscopy (EDS/SEM) and an X-Ray Fluorescent spectroscopy (XRF). Results from the XRF
analysis were provided by PANalytical company thanks to courtesy of Katarzyna Stepaniuk and
Sonia Vicente Dols at PANanalytical B.V. Almelo, Netherlands. Phase structure was analyzed

- 114 -
using an X-Ray Diffraction technique and microstructure was observed by a Scanning Electron
Microscope (SEM). In order to measure magnetic properties cubic samples (1.5-1.5-1.5 mm) were
cut from the magnets, magnetized at 6 T pulse field magnetizer along each of the three orthogonal
axes and then demagnetized along the same directions using the Vibrating Sample Magnetometer.
So, as a result, three second-quadrants of the hysteresis loop were gathered for each magnet,
referring to the three perpendicular directions of magnetization/demagnetization (X, Y and Z).
III. RESULTS
The magnets from VCMs are flat and “C” shape (horseshoe) due to the way of working in
HDDs. The magnets are covered with Ni or Ni-Cu coating – around 50 µm thick. The coating
protects the magnets against corrosion and prevents from crumbling individual grains. The mass of
the magnets varies between 10-20 g depending on their size. The chemical composition of the
magnets is dominated by iron (65±1%wt.) and neodymium (30±2%wt.). However, alloying
elements such as Co (1-2.5%wt.), Dy (0-1%wt.) or Pr (0-5%wt.) are incorporated into the material
in order to improve the magnetic properties. In this work the three randomly chosen magnets were
investigated, but one should notice that there is a variety of alloying elements for Nd-Fe-B magnets
[6]. Furthermore, the chemical composition of the magnets changes with time and is not
reproducible by one supplier [7].
The magnets exhibit bipolar magnetizing due to the way of working in the VCMs. The
magnets are anisotropic and exhibit excellent properties in a direction perpendicular to the flat
surface.
REFERENCES
[1] http://ec.europa.eu/growth/sectors/raw-materials/specific-interest/critical/index_en.htm (access on June
26th, 2016)
[2] Massari S., Ruberti M., Rare earth elements as critical raw materials: Focus on international markets
and future strategies, Resources Policy, 38, issue 1, 2013, pp. 36-43
[3] http://hddscan.com/doc/HDD_from_inside.html (access on June 26th, 2016)
[4] Walton A., Han Yi., Rowson N.A., Speight J.D., Mann V.S.J., Sheridan R.S., Bradshaw A., Harris I.R.,
Williams A.J., The use of hydrogen to separate and recycle neodymium-iron-boron-type magnets from
electronic waste, Journal of Cleaner Production, 104, 2015, pp. 236-241
[5] Katagiri N., Ijima K., Halada K., Production of Urban Ores Using Ball Mill for Saving Time and
Effort, NIMS NOW International, vol. 7, no. 5, 2009, p. 9
[6] http://erean.eu/wordpress/additives-in-ndfeb-magnets (access on June 26th, 2016)
[7] https://ec.europa.eu/growth/tools-databases/eip-raw-materials/sites/rawmaterials/files/3%20-
%20Walton%20EIP%20talk%20for%20ERECON.pdf (access on June 26th, 2016)

- 115 -
RELATIVISTIC ENGINE BASED ON A PERMANENT MAGNET
M. Tuval1 and A. Yahalom
2
1 Atidron Ltd., San Martin 15, Ramat Gan 52237, Israel
2 Ariel University, Kiriat Hamata POB 3, Ariel 40700, Israel
[email protected], [email protected]
Abstract. The purpose of this paper is to describe and analyze a relativistic engine based on a permanent magnet.
Newton's third law states that any action is countered by a reaction of equal magnitude but opposite direction. The
total force in a system not affected by external forces is thus zero. However, according to the principles of relativity a
signal can not propagate at speeds exceeding the speed of light. Hence the action cannot be generated at the same time
with the reaction due to the relativity of simultaneity, thus the total force cannot be null at a given time. The above
conclusion leads to the possibility of a relativistic engine based on a permanent magnet. The analysis is based on a
previous paper [1] in which we studied the relativistic effects in a system of two current conducting loops. It should be
emphasized that although momentum can be created in the material part of the system as described in the following
work momentum can not be created in the physical system, hence for any momentum that is acquired by matter an
opposite momentum is attributed to the electromagnetic field.
I. INTRODUCTION
Among the major achievements of Sir Isaac Newton is the formulation of Newton's third law
stating that any action is countered by a reaction of equal magnitude but opposite direction [2, 3].
The total force in a system not affected by external forces is thus zero. This law has numerous
experimental verifications and seems to be one of the corner stones of physics. However, by the
middle of the nineteenth century Maxwell has formulated the laws of electromagnetism in his
famous four partial differential equations [4, 5, 7] which were formulated in their current form by
Oliver Heaviside [8]. One of the consequences of these equations is that an electromagnetic signal
cannot travel at speeds exceeding that of light. This was later used by Albert Einstein [5, 7, 9]
(among other things) to formulate his special theory of relativity which postulates that the speed of
light is the maximal allowed velocity in nature. According to the principles of relativity no signal
(even if not electromagnetic) can propagate at superluminal velocities. Hence an action and its
reaction cannot be generated at the same time because of the relativity of simultaneity. Thus the
total force cannot be null at a given time. In consequence, by not holding rigorously the
simultaneity of action and reaction Newton's third law cannot hold in exact form but only as an
approximation. Moreover, the total force within a system that is not acted upon by an external force
would not be rigorously null since the action and reactions are not able to balance each other and
the total force on a system which is not affected by an external force in not null in an exact sense.
Most locomotive systems of today are based on open systems. A rocket sheds exhaust gas to
propel itself, a speeding bullet generates recoil. A car pushes the road with the same force that is
used to accelerate it, the same is true regarding the interaction of a plane with air and of a ship with
water. However, the above relativistic considerations suggest's a new type of motor in which the
open system is not composed of two material bodies but of a material body and field. Ignoring the
field a naive observer will see the material body gaining momentum created out of nothing,
however, a knowledgeable observer will understand that the opposite amount of momentum is
obtained by the field. Indeed Noether's theorem dictates that any system possessing translational
symmetry will conserve momentum and the total physical system containing matter and field is
indeed symmetrical under translations, while every sub-system (either matter or field) is not.
The purpose of this paper is to describe and analyze a relativistic engine based on a permanent
magnet. Here we will use Jefimenko‟s equation [6] to study the force between a current loop and a
permanent magnet. In this respect the current paper differs from a previous one [1] which discussed
the case of two current carrying coils, but is nevertheless based on this previous analysis. The

- 116 -
current configuration may seem attractive for some purposes since a permanent magnet does not
require a power source.
REFERENCES
[1] Tuval M., Yahalom A., Newton's Third Law in the Framework of Special Relativity, Eur. Phys. J. Plus
(11 Nov 2014) 129: 240 DOI: 10.1140/epjp/i2014-14240-x. (arXiv:1302.2537 [physics.gen-ph])
[2] Newton I., Philosophi Naturalis Principia Mathematica (1687)
[3] Goldstein H., Poole Jr. C.P., Safko J.L., Classical Mechanics, Pearson, 3 edition (2001)
[4] Maxwell J.C., A dynamical theory of the electromagnetic field, Philosophical Transactions of the
Royal Society of London 155: 459–512 (1865)
[5] Jackson J.D., Classical Electrodynamics, Third Edition. Wiley: New York, (1999)
[6] Jefimenko, O.D., Electricity and Magnetism, Appleton-Century Crofts, New York (1966); 2nd edition,
Electret Scientific, Star City, WV (1989)
[7] Feynman R.P., Leighton R.B., Sands M.L., Feynman Lectures on Physics, Basic Books; revised 50th
anniversary edition (2011)
[8] Heaviside O., On the Electromagnetic Effects due to the Motion of Electrification through a Dielectric,
Philosophical Magazine, (1889)
[9] Einstein A., On the Electrodynamics of Moving Bodies, Annalen der Physik 17 (10): 891–921, (1905)

- 117 -
Fig.1. An example of multi-turn winding
DESCRIPTION OF SOURCES OF MAGNETIC FIELD USING EDGE
VALUES OF CURRENT VECTOR POTENTIAL
R.M. Wojciechowski and C. Jędryczka
Poznan University of Technology, ul. Piotrowo 3, 60-965 Poznań, [email protected],
Abstract. The paper discusses the method of description of magnetic field sources in systems with the stranded windings.
The sources are determined on basis of given distribution of edge values of current vector potential T0. The formulas
describing the magnetic field sources in the finite element space have been given. The approach for determining the T0
distribution in stranded windings with simple and complex geometry has been proposed.
I. INTRODUCTION
One of the important aspects ensuring high credibility of the numerical calculations of systems
with magnetic field is proper and accurate method for the field sources description. It can be said
that among the group of magnetic fields sources in finite element space the most difficult is proper
description of the sources for windings of complex geometry. In the open literature many methods
of filed sources description for systems with windings can be found [1,2]. Nevertheless most of
them lead to complex and time consuming calculations for windings of complex geometries. In the
paper authors present and describe an alternative way to define the field sources that is universal
end computational effective for simple as well as for complex current paths in the windings. In the
discussed approach it is assumed that distribution of the turns in the system can be treated as
distribution of current paths inside the region described by the contour of a winding which are
defined by means of current flow field equations. For description of the winding the current vector
potential T0 can be successfully applied and on basis of obtained the T0 distribution the magnetic
field sources can be determined for both the scalar potential as well as the vector potential A
formulations. The expressions describing the magnetic field source have been given.
II. DESCRIPTION OF THE WINDING USING T0 FORMULATION
In the proposed approach the distribution of current vector potential T0 for winding region, for
example simple coil shown in Figure 1, can be determined using following formulas:
c
00T and n
00T (1a,b)
taking into account boundary conditions:
To
00 τT and 0
0 0T (2a,b)
where: is tensor describing the material
resistivity, and 0 is function that describes
the distribution of T0 on the boundary
surface To.
The values of boundary function 0
can be determined numerically. The
simplest way is to use the relation between
magnetomotive force , current density
vector J0 passing thought the cross-section
surface of the coil Sc and potential T0
along line L surrounding the surface Sc
(Fig. 1):

- 118 -
z
SLS
cc liz
cc
120
)(
00 dd τlTsJ (3)
and following condition:
00 nτ (4)
where: ic is value of the current in the winding, 012 is value of the boundary function assigned to edge P1P2 of loop L (Fig.1), lz is length of the edge P1P2 representing the height of the winding, and n is the normal vector to the considered boundary surface. In order to solve equations (1) i.e. to determine the distribution of T0, the edge formulation of finite element method has been applied [3]. The correctness of discussed approach has been verified among others in [4].
III. MAGNETIC FIELD SOURCE CALCULATION
The starting point for determining the magnetic field sources is obtained distribution of current vector potential T0 i.e. distribution of edge values of currents i0. In the case of formulation using
scalar potential , the finite element (FE) equations are equivalent to the nodal equations of magnetic edge network (MEN). In the MEN the field sources, i.e. magnetomotive forces (mmf's), are assigned to edges of elements. Because the edge values of currents i0 are also assigned to the
branches of MEN, they directly from the vector of branch mmf's , i.e.:
0i (5)
The field sources description is different for case when magnetic field in considered system is described by the magnetic vector potential A. In such case FE equations are equivalent to the magnetic facet network equations (MFN). The field sources are described by loop magnetomotive
forces mmf's o assigned to loops of MFN. In order to calculate the loop mmf's on basis of edge values of T0 potential the transformation of the edge quantities to values assigned to facets of elements must be applied first. In the next step these values are transformed to the magnetomotive
forces assigned to the loops of MFN. The source vector of loop mmf's o can be determined using fallowing formulas:
00o ikKKik sTT
s (6)
where: ks is matrix transforming the values assigned with element edge into the values assigned to the element facets in the MFN; whereas K is the matrix converting quantities associated with edges of the elements to quantities associated with facets of the elements.
IV. CONCLUSION
The universal and flexible method for determining the field sources in FE space using current vector potential T0 has been proposed and briefly described. The method has been tested on number of numerical examples. The detailed explanation as well as numerical examples showing the superiority of proposed method over commonly used approached based on application of Biot-Savart law will be given in the extended version of the paper.
REFERENCES
[1] Ohnishi T., Takahashi N., Effective optimal design of 3-D magnetic device having complicated coil
using edge element and Biot - Savart method, IEEE Trans. Magn., 38(2), 2002, 1021 – 1024
[2] Bui V., Le Floch Y, Meunier G., Coulomb J., A new 3D scalar finite element method to compute T0.
IEEE Trans. Magn., 42(4), 2006, 1035-1038
[3] Demenko A., Sykulski J., Wojciechowski R.M., Network representation of conducting regions in 3D
finite-element description of electrical machines, IEEE Trans. Magn, 44(6), 2008, 714-717
[4] Wojciechowski R.M., Description of distribution of windings made from filamentary conductors using
electric vector potential T0, Przegl. Elektrotech., 9/2013, 58 – 61

- 119 -
MAGNETIC SIGNATURE OF LAND VEHICLES
M. Wołoszyn, M. Chojnicki and M. Nowak
Faculty of Electrical and Control Engineering, Gdańsk University of Technology,
11/12 Narutowicza Street, Gdańsk, 80-233, Poland, [email protected]
Abstract. The results of numerical simulations of the magnetic field surrounding of land vehicles' models have been
presented in this paper. Vehicle containing of ferromagnetic elements distorts the Earth's magnetic field. This
distortion can be measured by magnetometers. It is possible to detect and identify an object on the basis of its magnetic
signature.
I. INTRODUCTION
In order to protect different areas, for safety reasons, there is a need to detect and identify
moving objects consisting of ferromagnetic components. Vehicles, ships, and airplanes can be
considered as such objects.
Magnetometric method is one of the techniques of detection and identification of the objects.
Every object comprising of ferromagnetic components perturbs the homogeneity of the Earth
magnetic field around it. This perturbation can be measured with the use of magnetometers
(fluxgate, GMR or scalar magnetometers [1]). Moving objects in the protected area can be detected
this way. Numerical simulations' results of the magnetic field of different land vehicles models
have been presented in this paper.
II. NUMERICAL MODELS OF VEHICLES
Every object composed of ferromagnetic materials perturbs the homogeneity of the Earth
magnetic field. Ferromagnetic components of the object possess permanent and induced
magnetization. Induced magnetization depends on the direction in which the vehicle moves, while
permanent magnetization is independent of the direction. Magnetic field of a ferromagnetic object
such as a vehicle is a composite function of its dimensions, shape, magnetic properties of the
materials, ferromagnetic history of components (permanent magnetization) and the direction in
which the vehicle moves. Numerical calculations of the magnetic field of vehicles models were
performed in the Opera 3D software. The numerical calculations were made for a model of
a bicycle, car and a truck. The example of the sedan car model and the vertical component of the
magnetic flux density are presented in Fig.1. By introducing different values for the external
magnetic field in the numerical model it is possible to analyze magnetic signatures of objects for
any magnetic direction.
The vertical component of the magnetic flux density is the characteristic magnetic signature of
the vehicles [2]. This signature for the compact construction of the vehicle includes one extreme
value and does not depend on the direction in which the vehicle moves. The values of perturbation
of magnetic field for the vehicles of the same dimensions can differ, mainly as a result of a different
degree of permanent magnetization and amount of ferromagnetic elements.

- 120 -
Fig.1. Model of a sedan vehicle with mesh and a result of numerical analysis - vertical magnetic flux density
Fig.2. Measured distribution of the vertical magnetic flux density of vehicle (for cars ro = 3m).
III. CONCLUSIONS
Presented results of the researches in the field of the deformation of magnetic field near to the
vehicles have been presented in this paper. On the basis of the tests of the distributions of
perturbation of the Earth magnetic field performed for different vehicles, the following conclusions
can be formulated:
changes in the quantity and the quality of the distributions of the magnetic field distortions of
different vehicles are more diversified for smaller distances between the magnetic sensors and
the vehicle;
for the vehicles with a trailer or a semitrailer there occur several (most frequently two) local
extreme values in the magnetic induction distribution. Local extrema disappear, joining to
become one extreme value, as the distance between the magnetic sensors and the road
increases;
the measurement of magnetic flux density in a differential circuit eliminates natural and
industrial magnetic interferences;
REFERENCES
[1] Tumański S., Czujniki pola magnetycznego, Przegląd Elektrotechniczny, 2013 nr 10, s. 1- 11
[2] Jakubiuk K., Jankowski P., Wołoszyn M.: System of wireless magnetic sensors for detection and
identification of ferromagnetic vehicles. Acta Technica, no 2, pp.171-184., 2014

- 121 -
EXAMPLE OF VANISHING ANISOTROPY AT HIGH ROTATIONAL
MAGNETISATION OF GRAIN-ORIENTED ELECTRICAL STEEL
S. Zurek
Megger Instruments Ltd, Archcliffe Road, Dover, CT17 9EN, Kent, United Kingdom, [email protected]
Abstract. This paper presents experimental data measured up to 2.0 T under rotational circular flux density. The
results show that at lower excitations there is significant anisotropy of permeability. However at 2.0 T the anisotropy
collapses so that the permeability varies only ±14% from the average value. On a qualitative level the results are very
similar to the directional curves for single-crystal samples for the three significant crystallographic directions [100],
[110] and [111] shown previously in the literature.
I. INTRODUCTION
A crystallite has a cubic shape for which the planes and directions can be defined as shown in
Fig. 1. The alignment of crystallites in grain-oriented electrical steels (GO) is controlled during
production so that one "easy" magnetisation direction is produced [1]. In this so-called Goss
structure the crystallites are aligned in such a way that all three important crystallographic
directions are located within the plane of the sheet (Fig. 1). The "easy" direction is along the rolling
direction (RD) and it caused by all the crystallites having their [100] directions aligned with it. The
direction [110] is the face diagonal (Fig. 1a) and is in the transverse direction (TD, perpendicular
to RD). The direction [111] is the cube diagonal.
a) b) c)
Fig.1. Goss structure in GO: a) directions in a crystallite, b) alignment of crystallites in GO sheet, c) directional
properties [3,4]
B-H curves measured for the three crystallographic directions for a single crystal are shown in
Fig. 2 [1-3]. At lower excitations, within practically applicable range, the [100] direction (0° with
respect to RD) has the highest permeability. The [110] direction (90° with respect to RD) has
significantly lower permeability, and [111] has the lowest permeability (55° with respect to RD,
and other corresponding symmetrical directions: 125°, 235° and 305°).
II. RESULTS AT VERY HIGH FLUX DENSITY
According to the curves shown in Fig. 1c at sufficiently high excitation the material should
saturate. This corresponds to conditions in which for each direction permeability will be the same
or similar – thus the anisotropy of permeability should vanish, or at least be significantly reduced.
Rotational measurements under controlled B rotation [4,5] are quite difficult to carry out in
practice, especially at high B. Values above 1.9 T required using an especially adjusted rotational
grain
rolling direction
GO sheet
grain
boundary crystallite
[100]
[111]
[110]
(011) 0
0.5
1
1.5
2
0 5 10 15 20 25 30
J (T)
H (kA/m)
[100]
[110]
[111]

- 122 -
magnetisation system with two power amplifiers for the magnetising phase working in the TD
direction, and a third power amplifier for the RD direction [5].
The results are shown in Fig. 2. Only data for 1.7 T and above are shown, because for lower
excitation the behaviours is well known. The B loci (Fig. 2a) remain circular because this was the
quantity controlled by a digital feedback [6,7].
Interesting behaviour occurs above 1.8 T (Fig. 2b). At 1.9 T the H loci begins to significantly
"swell" in all directions, including TD and RD. And at 2.0 T the H loci loses its original "butterfly"
shape and develops into a shape whose instantaneous radius varies much less than for lower
excitations. The corresponding directional permeability curves are shown in Fig. 6. At 0° and 180°
the B vector passes through RD or the "easy" direction so permeability is high.
It should be noted that it was required to generate in excess of 30 kA/m in order to reach 2.0 T
in all directions. This is also supported by the curves from Fig. 1c. At such excitation the
anisotropy of permeability reduces to rather small variation, changing only from relative amplitude
permeability μr = 40.0 to 53.6. Therefore the change is only ±14% from the average value through
the whole rotation.
The excitation at 2.0 T is still far from full saturation, for which it would be μr = 1. However, it
can be observed from Fig. 2c that at 2.0 T around 55° (and 125°, 235° 305°) the instantaneous
permeability is higher than at 90° (and and 270°). Again, this is supported by the curves in Fig. 1c
in which at 20-30 kA/m the [111] curve overtakes the [110] curve.
a) b) c)
Fig.2. Rotational results for conventional grain-oriented electrical steel M089-27N, at 50 Hz: a) controlled circular B
loci, b) corresponding H loci, c) corresponding directional µr with vanishing anisotropy at 2.0 T
REFERENCES
[1] Beckley P., Electrical steels, European Electrical Steels, Newport, UK, 2000
[2] Soinski M., Magnetic materials in technology, (in Polish: Materiały magnetyczne w technice),
Centralny Ośrodek Szkolenia i Wydawnictw SEP, 2001
[3] Tumanski S., Handbook of magnetic measurements, CRC Press, 2011
[4] Zurek S., et al., Rotational power losses and vector loci under controlled high flux density and magnetic
field in electrical steel sheets, IEEE Trans. Magnetics, Vol. 42 (10), 2006, p. 2815
[5] Zurek S., Two-dimensional magnetisation problems in electrical steels, PhD thesis, Wolfson Centre for
Magnetics Technology, Cardiff University, Cardiff, United Kingdom, 2005
[6] Zurek S., et al., Use of novel adaptive digital feedback for magnetic measurements under controlled
magnetising conditions, IEEE Trans. Magnetics, Vol. 41 (11), 2005, p. 4242
[7] Zurek S., Practical implementation of universal digital feedback for characterisation of soft magnetic
materials under controlled ac waveforms, presented at Symposium of Magnetic Measurements &
Modeling, Czestochowa – Siewierz, Poland, 2016
-2.0
-1.5
-1.0
-0.5
0.0
0.5
1.0
1.5
2.0
-2.0 -1.5 -1.0 -0.5 0.0 0.5 1.0 1.5 2.0
By(T)
Bx (T)
2.0T
1.9T
1.8T
1.7T
-40
-30
-20
-10
0
10
20
30
40
-40 -30 -20 -10 0 10 20 30 40
Hy (kA/m)
Hx (kA/m)
2.0T
1.9T
1.8T
1.7T

- 123 -
PRACTICAL IMPLEMENTATION OF UNIVERSAL DIGITAL FEEDBACK
FOR CHARACTERISATION OF SOFT MAGNETIC MATERIALS UNDER
CONTROLLED AC WAVEFORMS
S. Zurek
Megger Instruments Ltd, Archcliffe Road, Dover, CT17 9EN, Kent, United Kingdom, [email protected]
Abstract. Practical implementation of digital feedback (DF) for waveshape control is described in the paper. It is
shown that if the system has intrinsically sufficient phase margin then operation of DF can be controlled by changing
just the DF gain even though the system gain can vary more than 2 orders of magnitude. Practical tips as well as
typical difficulties are also discussed. The provided description should be sufficient to implement DF in any
programming language and hardware configuration.
I. INTRODUCTION
International standards define sinusoidal magnetising conditions for measurement of magnetic
properties of soft magnetic materials [1-3]. At high excitations the specimen exhibits strongly non-
linear behaviour which produces distorted output signal if uncontrolled. Desired waveshape can be
obtained e.g. by the means of analogue or digital negative feedback [4].
II. DIGITAL FEEDBACK
The concept of digital feedback (DF) closely follows that of the analogue feedback shown in
Fig. 1. The output waveform is compared with the reference waveform and an appropriate
correction is applied to the generated waveform in order to reduce any discrepancy. Because of the
iterative operation, the algorithm dwells at each amplitude with continuously applied alternating
current for at least one cycle, and usually more than one.
DF algorithm can be summarised in the self-explanatory block diagram as shown in Fig. 1, and
can be implemented with the corresponding block diagram of Fig. 2.
For a given measurement point, the virtual target waveform T (produced virtually in the
software) is kept constant in amplitude and phase. Therefore, the natural approach is to trigger the
controlled real waveform Vout (synonymous with the digitised waveform R) to have the same phase
as the target waveform T. Then the difference waveform D can be calculated by a direct subtraction
of R from T in step 3 (Fig. 1).
In a general case there will be significant phase shift between the generated and the controlled
signal so that the zero crossing will not coincide. This is important because if R is always triggered
at the assumed zero crossing then its phase will by definition be the same as T. But the generated
signal Vgen needs to have its phase shifted accordingly so that the required waveshape control takes
place. It turns out that the phase of the digital waveform held in the buffer for generation of G
might or might not be directly related to the actual phase of the generated signal.
If the phase correlation between the physical voltages cannot be derived from just the digital
information inside the software then it will be required to re-measure the just-generated waveform
Vgen. This can be achieved by simply connecting the same signal to the power amplifier input as
well as simultaneously to another analogue input (Fig. 1). This completely defines the phase
information for all the signals relevant to DF, because T has the arbitrarily set phase, R is triggered
to have the same phase as T and G is re-measured with the actual phase difference between R
and G.

- 124 -
The system gain s was varied from 0.294 to 28.4, which is around 2 orders of magnitude. Yet,
it was sufficient just to change the value of the k multiplier (Fig. 1) in order to obtain stable
operation in all cases, with and without an isolating transformer for blocking DC offset in the
primary current.
The relation between the DF gain g, the system gain s and the feedback multiplier k is
explained in the full paper. Also detailed discussion is provided on: triggering, universality issues,
current glitches, convergence, phase and amplitude performance, multi-channel feedback and
protection against instability.
REFERENCES
[1] IEC 60404-3:1992 (Single Sheet Tester)
[2] IEC 60404-2:1998 (Epstein frame)
[3] IEC 60404-6:2003 (Ring specimen)
[4] Beckley P., Electrical steels, A handbook for producers and users, European Electrical Steels,
Newport, UK, 2000, ISBN 0-9540039-0-X
Vout
N1
sample
N2
signal
generator
Gi
voltmeter
R, Gi-1 computer
software
digital
feedback
T, R, D,
C, G
user
interface
Tpeak
re-measured Vgen
I1
power
amplifier
signal
amplifier
isolating
transformer
V'out
Vgen
Fig.2. Block diagram of magnetising setup with DF:
R corresponds to Vout and G to Vgen (optional
components are shown in grey)
start
set target wave (e.g. sine)
acquire real
waveforms as
(and )
calculate difference
waveform
calculate correction
waveform with multiplier k
calculate waveform to be generated
using data from previous iteration
generate new output
waveform
as Vgen
target
achieved?
Y
N
unstable
stop
1.
2.
3.
4.
5.
6.
7.
real signal
processing
by power
amplifier,
shunt
resistor,
yoke,
specimen
next
iteration
i=i+1
Vgen
Vout
Fig.1. Digital feedback algorithm, i – iteration Fig.3. Data measured with controlled sine at 50 Hz,
1.9 T for toroidal sample of grain-oriented steel

- 125 -
PARTICIPANTS OF
XII SYMPOSIUM OF MAGNETIC MEASUREMENTS & MODELING
Częstochowa – Siewierz, 17th – 19th October 2016
Anna Abramowska EBSCO Sp. z o.o.
Krakowskie Przedmieście 79, 00-079 Warszawa, Poland
e-mail: [email protected]
Babilas Rafał Silesian University of Technology
Institute of Engineering Materials and Biomaterials
Konarskiego 18a, 44-100 Gliwice, Poland
e-mail: [email protected]
Bajorek Jerzy R&J Measurement, Lipowa 48, Borowa, Poland
e-mail: [email protected]
Bereźnicki Michał Częstochowa University of Technology
Faculty of Electrical Engineering
Al. Armii Krajowej 17, 42-200 Częstochowa, Poland
e-mail: [email protected]
Borowik Lech Częstochowa University of Technology
Faculty of Electrical Engineering
Al. Armii Krajowej 17, 42-200 Częstochowa, Poland
e-mail: [email protected]
Burlikowski Wojciech Silesian University of Technology
Faculty of Electrical Engineering, Department of Mechatronics
ul. Akademicka 10a, 44-100 Gliwice, Poland
e-mail: [email protected]
Chwastek Krzysztof Częstochowa University of Technology
Faculty of Electrical Engineering
Al. Armii Krajowej 17, 42-200 Częstochowa, Poland
e-mail: [email protected]
Demenko Andrzej Poznań University of Technology
Faculty of Electrical Engineering
Piotrowo 3A, 60-965 Poznan, Poland
e-mail: [email protected]
Domin Jarosław Silesian University of Technology
Faculty of Electrical Engineering, Department of Mechatronics
ul. Akademicka 10a, 44-100 Gliwice, Poland
e-mail: [email protected]
Garstka Tomasz Częstochowa University of Technology
Faculty of Production Engineering and Materials Technology
Al. Armii Krajowej 19, 42-200 Częstochowa, Poland
e-mail: [email protected]

- 126 -
Gaworska-Koniarek Dominika Electrotechnical Institute
Division of Electrotechnology and Materials Science
ul. 55/61 Sklodowskiej-Curie, 50-369 Wroclaw, Poland
e-mail: [email protected]
Gębara Piotr Częstochowa University of Technology, Faculty of Production
Engineering and Materials Technology, Institute of Physics
al. Armii Krajowej 19, 42-200 Częstochowa, Poland
e-mail: [email protected]
Giżyński Tomasz Warsaw University of Technology
Faculty of Materials Science and Engineering
ul. Wołoska 141, 02-507 Warsaw, Poland
e-mail: [email protected]
Gozdur Roman Technical University of Lodz
Department of Semiconductor and Optoelectronic Devices
211/215 Wolczanska St., 90-924 Łódz, Poland
e-mail: [email protected]
Guzmán Octavio National University of Colombia
Faculty of Science, Magnetic Materials and Nanostructures Group
Carrera 45 # 44-85, Bogota, Colombia
e-mail: [email protected]
Haneczok Grzegorz University of Silesia, Institute of Materials Science
ul. 75 Pułku Piechoty 1A, 41-500 Chorzów, Poland
e-mail: [email protected]
Hasiak Mariusz Wrocław University of Science and Technology
Department of Mechanics and Materials Science
ul. Smoluchowskiego 25, 50-370 Wrocław, Poland
e-mail: [email protected]
Hiergeist Robert Magnet-Physik Dr. Steingroever GmbH
Emil-Hoffmann-Straße 3, 50996 Köln, Germany
e-mail: [email protected]
Jackiewicz Dorota Warsaw University of Technology
Institute of Metrology and Biomedical Engineering
ul. Andrzeja Boboli 8, 02-525 Warsaw, Poland
e-mail: [email protected]
Jakubas Adam Częstochowa University of Technology
Faculty of Electrical Engineering
Al. Armii Krajowej 17, 42-200 Częstochowa, Poland
e-mail: [email protected]

- 127 -
Kachniarz Maciej Warsaw University of Technology
Institute of Metrology and Biomedical Engineering
ul. Andrzeja Boboli 8, 02-525 Warsaw, Poland
e-mail: [email protected]
Industrial Research Institute for Automation and Measurements
al. Jerozolimskie 202, 02-486 Warsaw, Poland
e-mail: [email protected]
Kapelski Dariusz Tele & Radio Research Institute
ul. Ratuszowa 11, 03-450 Warszawa, Poland
e-mail: [email protected]
Kapłon Andrzej Kielce University of Technology
Power Electronic, Electrical Machines and Drives Chair
Aleja 1000-lecia Panstwa Polskiego 7, 25-314 Kielce, Poland
e-mail: [email protected]
Kawalec Damian Rzeszow University of Technology
Faculty of Electrical and Computer Engineering
ul. W. Pola 2, 35-959 Rzeszów, Poland
e-mail: [email protected]
Kielan Paweł Silesian University of Technology
Faculty of Electrical Engineering, Department of Mechatronics
ul. Akademicka 10a, 44-100 Gliwice, Poland
e-mail: [email protected]
Kluszczyński Krzysztof Silesian University of Technology
Faculty of Electrical Engineering, Department of Mechatronics
ul. Akademicka 10a, 44-100 Gliwice, Poland
e-mail: [email protected]
Kotynia Katarzyna Częstochowa University of Technology, Faculty of Production
Engineering and Materials Technology, Institute of Physics
al. Armii Krajowej 19, 42-200 Częstochowa, Poland
e-mail: [email protected]
Kowalik Zygmunt Silesian University of Technology
Faculty of Electrical Engineering, Department of Mechatronics
ul. Akademicka 10a, 44-100 Gliwice, Poland
e-mail: [email protected]
Kowol Paweł Silesian University of Technology
Faculty of Electrical Engineering, Department of Mechatronics
ul. Akademicka 10a, 44-100 Gliwice, Poland
e-mail: [email protected]
Krawczyk Damian Silesian University of Technology
Faculty of Electrical Engineering, Department of Mechatronics
ul. Akademicka 10a, 44-100 Gliwice, Poland
e-mail: [email protected]

- 128 -
Kubisztal Marian University of Silesia, Institute of Materials Science
ul. 75 Pułku Piechoty 1A, 41-500 Chorzów, Poland
e-mail: [email protected]
Kurzawa Milena Poznań University of Technology
Faculty of Electrical Engineering
Piotrowo 3A, 60-965 Poznan, Poland
e-mail: [email protected]
Kwapuliński Piotr University of Silesia, Institute of Materials Science
ul. 75 Pułku Piechoty 1A, 41-500 Chorzów, Poland
e-mail: [email protected]
Majocha Andrzej Technical University of Lodz
Department of Semiconductor and Optoelectronic Devices
211/215 Wolczanska St., 90-924 Łódz, Poland
e-mail: [email protected]
Mazur Damian Rzeszów University of Technology
Faculty of Electrical and Computer Engineering
ul. W. Pola 2, B206, 35-959 Rzeszów, Poland
e-mail: [email protected]
Melikhov Yevgen Polish Academy of Sciences, Institute of Physics
Al. Lotnikow 32/46, 02-668 Warsaw, Poland
e-mail: [email protected]
Cardiff University
Wolfson Centre for Magnetics, School of Engineering
Cardiff, CF24 3AA, United Kingdom
e-mail: [email protected], [email protected]
Mendoza Barón Aminta National University of Colombia
Faculty of Science, Magnetic Materials and Nanostructures Group
Carrera 45 # 44-85, Bogota, Colombia
e-mail: [email protected]
Nadolski Roman Kielce University of Technology
Power Electronic, Electrical Machines and Drives Chair
Aleja 1000-lecia Panstwa Polskiego 7, 25-314 Kielce, Poland
e-mail: [email protected]
Najgebauer Mariusz Częstochowa University of Technology
Faculty of Electrical Engineering
Al. Armii Krajowej 19, 42-200 Częstochowa, Poland
e-mail: [email protected]
Nowak Paweł Warsaw University of Technology
Institute of Metrology and Biomedical Engineering
ul. Andrzeja Boboli 8, 02-525 Warsaw, Poland
e-mail: [email protected]

- 129 -
Nowakowski Andrzej Tele & Radio Research Institute
ul. Ratuszowa 11, 03-450 Warszawa, Poland
e-mail: [email protected]
Nowicki Michał Warsaw University of Technology
Institute of Metrology and Biomedical Engineering
sw. Boboli 8, 02-525 Warsaw, Poland
e-mail: [email protected]
Industrial Research Institute for Automation and Measurements
al. Jerozolimskie 202, 02-486 Warsaw, Poland
e-mail: [email protected]
Pasko Marian Silesian University of Technology
Faculty of Electrical Engineering
ul. Akademicka 10a, 44-100 Gliwice, Poland
e-mail: [email protected]
Pawlik Katarzyna Częstochowa University of Technology
Faculty of Production Engineering and Materials Technology
Al. Armii Krajowej 19, 42-200 Częstochowa, Poland
e-mail: [email protected]
Pilch Zbigniew Silesian University of Technology
Faculty of Electrical Engineering, Department of Mechatronics
ul. Akademicka 10a, 44-100 Gliwice, Poland
e-mail: [email protected]
Pinhasi Yosef Ariel University, Faculty of Engineering
Department of Electrical and Electronic Engineering
Kiriat Hamata POB 3, Ariel 40700, Israel
e-mail: [email protected]
Pluta Wojciech A. Częstochowa University of Technology
Faculty of Electrical Engineering
Al. Armii Krajowej 17, 42-200 Częstochowa, Poland
e-mail: [email protected]
Pruba Marcin Częstochowa University of Technology, Faculty of Production
Engineering and Materials Technology, Institute of Physics
al. Armii Krajowej 19, 42-200 Częstochowa, Poland
e-mail: [email protected]
Prusik Krystian University of Silesia, Institute of Materials Science
ul. Bankowa 12, 40-007 Katowice, Poland
e-mail: [email protected]
University of Silesia
Silesian Center for Education and Interdisciplinary Research,
75 Pułku Piechoty 1A, 41-500 Chorzów, Poland
Przybylski Marek Tele & Radio Research Institute
ul. Ratuszowa 11, 03-450 Warszawa, Poland
e-mail: [email protected]

- 130 -
Salach Jacek Warsaw University of Technology
Institute of Metrology and Biomedical Engineering
ul. Andrzeja Boboli 8, 02-525 Warsaw, Poland
e-mail: [email protected]
Smusz Robert Rzeszów University of Technology
Department of Thermodynamics and Fluid Mechanics
ul. Powstańców Warszawy 12, 35-959 Rzeszów, Poland
e-mail: [email protected]
Stachowiak Dorota Poznań University of Technology
Faculty of Electrical Engineering
Piotrowo 3A, 60-965 Poznan, Poland
e-mail: [email protected]
Stupakov Alexandr Czech Academy of Sciences, Institute of Physics
Na Slovance 2, 18221 Prague, Czech Republic
e-mail: [email protected]
Szczurek Paweł Stalprodukt S.A.
ul. Wygoda 69, 32-700 Bochnia, Poland
e-mail: [email protected]
Szczygieł Marcin Silesian University of Technology
Faculty of Electrical Engineering, Department of Mechatronics
ul. Akademicka 10a, 44-100 Gliwice, Poland
e-mail: [email protected]
Szczygłowski Jan Częstochowa University of Technology
Faculty of Electrical Engineering
Al. Armii Krajowej 17, 42-200 Częstochowa, Poland
e-mail: [email protected]
Szewczyk Roman Warsaw University of Technology
Institute of Metrology and Biomedical Engineering
ul. Andrzeja Boboli 8, 02-525 Warsaw, Poland
e-mail: [email protected]
Szymański Mateusz Warsaw University of Technology
Faculty of Materials Science and Engineering
141 Woloska Street, 02-507 Warsaw, Poland
e-mail: [email protected]
Ślusarek Barbara Tele & Radio Research Institute
ul. Ratuszowa 11, 03-450 Warszawa, Poland
e-mail: [email protected]
Wojciechowski Rafał M. Poznań University of Technology
Faculty of Electrical Engineering
Piotrowo 3A, 60-965 Poznan, Poland
e-mail: [email protected]

- 131 -
Wołoszyn Mirosław Technical University of Gdańsk
Faculty of Electrical and Control Engineering
ul. G. Narutowicza 11/12, 80-233 Gdańsk, Poland
e-mail: [email protected], [email protected]
Wysłocki Jerzy J. Częstochowa University of Technology, Faculty of Production
Engineering and Materials Technology, Institute of Physics
al. Armii Krajowej 19, 42-200 Częstochowa, Poland
e-mail: [email protected]
Yahalom Asher Ariel University, Faculty of Engineering
Department of Electrical and Electronic Engineering
Kiriat Hamata POB 3, Ariel 40700, Israel
e-mail: [email protected]
Żurek Stan Megger Instruments Ltd
Archcliffe Road, Dover, CT17 9EN, Kent, United Kingdom
e-mail: [email protected]

- 132 -