OF ASIA AND THE PACIFIC 2016: Year-End Update Economic and Social Survey of Asia and the Pacific...
64
ECONOMIC AND SOCIAL SURVEY OF ASIA AND THE PACIFIC 2016: Year-End Update
-
Upload
nguyennguyet -
Category
Documents
-
view
215 -
download
0
Transcript of OF ASIA AND THE PACIFIC 2016: Year-End Update Economic and Social Survey of Asia and the Pacific...

The Economic and Social Survey of Asia and the Pacific Year-end Update 2016 presents the latest macroeconomic trends, identifies emerging risks and challenges, and takes stock of fiscal, monetary and structural policy developments in the Asia-Pacific region, providing recommendations for policymakers, civil society and academia.
Economic conditions have stabilized in the Asia-Pacific region in the second half of 2016. Thanks to resilient domestic demand and policy support, the region’s developing economies are growing at a steady pace of 4.9 per cent despite a sluggish global economy and weak trade. The region’s high and steady growth, led by China and India, has been an anchor of stability for the world’s economy.
For 2017, the outlook is broadly positive but there are risks that should not be underestimated. Bouts of financial volatility can re-emerge given the external environment, including policy uncertainty in the wake of a new administration in the United States of America, and negotiations in Europe following the “Brexit” decision of the United Kingdom of Great Britain and Northern Ireland. Monetary authorities in the Asia-Pacific region have adopted accommodative monetary stances, but prudence is required given the partial recovery in oil prices, high levels of private debt, especially corporate debt and banks’ balance sheets, and currency exposure in some economies. To propel investment, improve the allocative efficiency of investments and ensure financial stability, banking supervision and regulation along with macroprudential frameworks should be strengthened further.
Fiscal policy can and should play a proactive role in supporting domestic demand and meeting long-term development priorities. While ensuring long-term fiscal sustainability, there has to be greater emphasis on the quality and composition of public expenditures. Tax policy can be particularly effective in nurturing a balanced society and reducing extreme inequalities. To undertake progressive tax reforms, structural transformations and move towards a sustainable development path, effective governance is fundamental; it enhances investment, promotes productivity and innovation, and mitigates inequality.
ECONOMIC AND SOCIAL SURVEY OF ASIA AND THE PACIFIC 2016:Year-End Update

The shaded areas of the map indicate ESCAP members and associate members.
ESCAP is the regional development arm of the United Nations and serves as the main economic and social development centre for the United Nations in Asia and the Pacific. Its mandate is to foster cooperation between its 53 members and 9 associate members. ESCAP provides the strategic link between global and country-level programmes and issues. It supports Governments of countries in the region in consolidating regional positions and advocates regional approaches to meeting the region’s unique socio-economic challenges in a globalizing world. The ESCAP office is located in Bangkok, Thailand. Please visit the ESCAP website at www.unescap.org for further information.
United Nations publications may be obtained from bookstores and distributors throughout the world. Please consult your bookstore or write to any of the following:
Customers In: America, Asia and the Pacific
Email: [email protected]: un.org/publicationsTel: +1 703 661 1571Fax: +1 703 996 1010
Mail Orders to: United Naitons Publications PO Box 960 Herndon, Virginia 20172United States of America
Customers in: Europe, Afica and the Middle East
United Nations Publication c/o Eurospan Group Email: [email protected] Web: un.org/publicationsTel: +44 (0) 1767 604972Fax: +44 (0) 1767 601640
Mail orders to: United Nations Publications Pegasus Drive, Stratton Business ParkBigglewade, Bedfordshire SG18 8TQUnited Kingdom
For futher information on this publication, please address your enquiries to:
Chief Conference and Documentation Services SectionOffice of the Executive Secretary Economic and Social Commission for Asia and the Pacific (ESCAP)United Nations Building, Rajadamnern Nok AvenueBangkok 10200, ThailandTel: 66 2 288-1100Fax: 66 2 288-3018Email: [email protected]

Economic and Social Survey of Asia and the Pacific 2016: Year-end Update
A
ECONOMIC AND SOCIAL SURVEY
OF ASIA AND THE PACIFIC 2016:
YEAR-END UPDATE
B
Economic and Social Survey of Asia and the Pacific 2016: Year-end Update
ECONOMIC AND SOCIAL SURVEY OF ASIA AND THE PACIFIC 2016:
Year-end Update
Shamshad Akhtar
Executive Secretary
Hongjoo Hahm
Deputy Executive Secretary
Hamza Ali Malik
Officer-in-Charge, Macroeconomic Policy and Financing for Development Division
United Nations publication
Copyright © United Nations 2016
All rights reserved
Printed in Bangkok
e-ISBN: 978-92-1-060003-3
ST/ESCAP/2762
Cover photo credit: Shutterstock (wk1003mike)
This publication may be reproduced in whole or in part for educational or non-profit purposes without special permission from the copyright holder, provided that the source is acknowledged. The ESCAP Publications Office would appreciate receiving a copy of any publication that uses this publication as a source.
No use may be made of this publication for resale or any other commercial purpose whatsoever without prior permission. Applications for such permission, with a statement of the purpose and extent of reproduction, should be addressed to the Secretary of the Publications Board, United Nations, New York.

Economic and Social Survey of Asia and the Pacific 2016: Year-end Update
iii
KEY MESSAGES
Economic conditions stabilized in the Asia-Pacific region in the second half of 2016. Resilient domestic demand and policy support have resulted in the region’s developing economies growing at a steady pace of just below 5 per cent annually despite a sluggish global economy and weak trade growth. Indeed, with developed economies losing some of their recovery momentum, the region’s high and steady growth rate, led by China and India, has arguably been an anchor of stability for the struggling global economy. The outlook for 2017 is broadly positive based on China’s rebalancing-led moderation being offset by an expected return to positive economic growth in the Russian Federation, sustained high economic growth in South Asia supported by moderate inflation, and increased public investment in South-East Asia and the Pacific.
Stable economic conditions provide an opportunity to make progress on the productivity and inclusiveness fronts, particularly in the context of implementing the 2030 Agenda for Sustainable Development. While the region continues to lead global economic growth, output expansion from globalization and technology has not been translated into commensurate increases in decent jobs in a number of countries. Relatively slow employment growth and a persistently high share of vulnerable employment have contributed to rising income inequality. As the region undergoes further structural transformation, efforts to lift productivity and innovation should be matched by measures to enhance worker skills and social protection. Moreover, appropriate policies should ensure that productivity gains derived from technological progress are passed on to workers through higher real wages.
Despite recent stability, the likely impact of some risks for the near-term economic outlook should not be underestimated. Bouts of financial volatility can re-emerge given the uncertain external environment, including policy uncertainties in major economies in the wake of the forthcoming installation of a new administration in the United States of America on 20 January 2017 and the negotiations in Europe related to the planned exit of the United Kingdom of Great Britain and Northern Ireland from the European Union (referred to as Brexit), and vulnerabilities on the domestic front, such as in corporate and bank balance sheets. External demand is likely to remain weak, and there is concern that prolonged weakness in global trade could be a drag on productivity growth and the integration of developing countries into global and regional value chains. Trade protectionist measures and sentiments, which are already on the rise, may increase further, harming export-oriented Asian economies and negatively affecting private investment.
While low inflation and an easing in financial market conditions have allowed monetary authorities to lower policy rates, a prudent stance is needed given the partial recovery in global oil prices and high private debt and currency exposure in some economies. To propel investment, improve efficiency in the allocation of investment resources and ensure financial stability, banking supervision and regulation along with macroprudential frameworks should be strengthened. In this vein, deleveraging and restructuring efforts in countries such as China and India should contribute to enhanced financial stability and higher productivity.
Fiscal policy can and should play a proactive role in supporting domestic demand and in meeting long-term development priorities. While ensuring long-term fiscal sustainability, there has to be greater emphasis on the quality and composition of public expenditures, rather than simply on

iv
Economic and Social Survey of Asia and the Pacific 2016: Year-end Update
aggregate budget deficits and public debt levels. Public infrastructure outlays are deemed particularly effective in supporting domestic demand and addressing structural bottlenecks in the current environment of weak external demand, weak private investment, low borrowing costs and benign inflationary pressures. Improving public financial management, reforming State-owned enterprises and enhancing tax revenues could considerably strengthen fiscal positions on a sustainable basis.
Tax policy can also be particularly effective in nurturing a more balanced society with less extreme inequalities. The population-weighted Gini coefficient, based on household income estimates, has increased by almost 30 per cent in the region between 1990 and 2014. Rising inequality has triggered broad concern and social debate, and promoting inclusive development has become a key priority of countries’ national development strategies. Taxes, and in particular progressive personal income tax, can be a main policy tool for direct redistribution of income and wealth in a society. Taxes can also provide critical public revenues for financing public investments in health care and education, as well as for funding social protection and welfare schemes.
Better economic governance, as reflected, among other things, in the effectiveness and integrity of public institutions is a fundamental element in managing structural transformations, undertaking progressive tax reforms and moving towards a sustainable development path. Effective economic governance can go a long way in enhancing investment that is currently weak; in promoting productivity and innovation that underpins sustained economic growth; and in accelerating poverty reduction and mitigating inequalities, including through progressive tax reforms, that needs consistent policy attention. The role of better and more effective governance in improving development outcomes, especially through public resource management and financial markets, will be explored in detail in the forthcoming issue of the Economic and Social Survey for Asia and the Pacific for 2017.
Economic and Social Survey of Asia and the Pacific 2016: Year-end Update
v
ACKNOWLEDGEMENTS
The main purpose of the Economic and Social Survey of Asia and the Pacific Year-End Update 2016 is to provide recommendations to policymakers, civil society and academia on the current macroeconomic situation and trends in the region.
This report was prepared under the overall direction of Shamshad Akhtar, Under-Secretary General of the United Nations and Executive Secretary of the Economic and Social Commission for Asia and the Pacific (ESCAP), and the guidance of Hongjoo Hahm, ESCAP’s Deputy Executive Secretary. The report was written under the direct supervision of Hamza Ali Malik, Officer-in-Charge of ESCAP’s Macroeconomic Policy and Financing for Development Division. The core drafting team included Daniel Jeongdae Lee, Jose Antonio Pedrosa-Garcia, Steve Gui-Diby, Oliver Paddison, Vatcharin Sirimaneetham, Kiatkanid Pongpanich, Achara Jantarasaengaram, Chawarin Klongdee and Sirinart Suanyam. Other ESCAP colleagues who made valuable contributions included Zheng Jian, Sudip Ranjan Basu, Vanessa Steinmayer, Xin Li and Kantheera Tipkanjanarat.
John Loftus edited the manuscript. Printing services were provided by Clung Wicha Press.
Martin Dessart of the Strategic Communications and Advocacy Section coordinated the launch and dissemination of the report.

vi
Economic and Social Survey of Asia and the Pacific 2016: Year-end Update
CONTENTS
KEY MESSAGES . . . . . . . . . . . . . . . . . . . . . . . . . . . . . . . . . . . . . . . . . . . . . . . . . . . . . . . . iiiACKNOWLEDGEMENTS . . . . . . . . . . . . . . . . . . . . . . . . . . . . . . . . . . . . . . . . . . . . . . . . . . . . vACRONYMS . . . . . . . . . . . . . . . . . . . . . . . . . . . . . . . . . . . . . . . . . . . . . . . . . . . . . . . . . . viiiINTRODUCTION . . . . . . . . . . . . . . . . . . . . . . . . . . . . . . . . . . . . . . . . . . . . . . . . . . . . . . . . . 1
RECENT ECONOMIC DEVELOPMENTS AND OUTLOOK. . . . . . . . . . . . . . . . . . . . . . . . . . . . . . . . 31. Economic growth is relatively stable on the back of increased resilience . . . . . . . . . . . . . . . . . . . . . 32. Despite economic growth, job creation remains a challenge. . . . . . . . . . . . . . . . . . . . . . . . . . . . .153. Benign inflationary pressures have allowed for accommodative monetary stances . . . . . . . . . . . . . . . .214. Financial conditions are favourable, but private debt requires attention. . . . . . . . . . . . . . . . . . . . . . .265. Expansionary fiscal policy and reforms are supporting development efforts . . . . . . . . . . . . . . . . . . . .33
SELECTED MEDIUM-TERM PRIORITIES . . . . . . . . . . . . . . . . . . . . . . . . . . . . . . . . . . . . . . . . . .391. Rising inequality can be alleviated through progressive taxation . . . . . . . . . . . . . . . . . . . . . . . . . .392. Effective governance fosters innovation, investment and inclusive development . . . . . . . . . . . . . . . . . .45
CONCLUDING REMARKS . . . . . . . . . . . . . . . . . . . . . . . . . . . . . . . . . . . . . . . . . . . . . . . . . . .52
BOXES1. Reviving economic growth in the Asia-Pacific region through the “Belt and Road Initiative” . . . . . . . . . . 6 2. The future of work . . . . . . . . . . . . . . . . . . . . . . . . . . . . . . . . . . . . . . . . . . . . . . . . . . . .183. Corporate debt in China . . . . . . . . . . . . . . . . . . . . . . . . . . . . . . . . . . . . . . . . . . . . . . . . .30
FIGURES1. Real GDP growth, developing Asia-Pacific economies, and the world, 2006-2017 . . . . . . . . . . . . . . . . 32. Real GDP growth, by ESCAP subregion and countries with special needs, 2015-2017. . . . . . . . . . . . . 43. Demand-side contributions to GDP growth, first half of both 2015 and 2016. . . . . . . . . . . . . . . . . . . 5 4. Private investment and infrastructure investment in China . . . . . . . . . . . . . . . . . . . . . . . . . . . . . . 55. Manufacturing Purchasing Managers’ Index, China and India . . . . . . . . . . . . . . . . . . . . . . . . . . . . 66. Global GDP growth, global trade growth, and their ratios, 1981-2016 . . . . . . . . . . . . . . . . . . . . . . . 87. Growth in export and import volumes, developing Asia-Pacific economies, and the world . . . . . . . . . . . 98. China’s imports from the rest of the Asia-Pacific region . . . . . . . . . . . . . . . . . . . . . . . . . . . . . . . 99. Housing prices and real estate investment in China . . . . . . . . . . . . . . . . . . . . . . . . . . . . . . . . .1110. Labour market indicators in India. . . . . . . . . . . . . . . . . . . . . . . . . . . . . . . . . . . . . . . . . . . . .1611. Number of employees across subsectors in China . . . . . . . . . . . . . . . . . . . . . . . . . . . . . . . . . .1712. Social protection expenditures . . . . . . . . . . . . . . . . . . . . . . . . . . . . . . . . . . . . . . . . . . . . . . .20

Economic and Social Survey of Asia and the Pacific 2016: Year-end Update
vii
13. Remittance inflows . . . . . . . . . . . . . . . . . . . . . . . . . . . . . . . . . . . . . . . . . . . . . . . . . . . . .2114. Consumer price inflation . . . . . . . . . . . . . . . . . . . . . . . . . . . . . . . . . . . . . . . . . . . . . . . . . .2215. Indices of primary commodity prices (2010 = 100) . . . . . . . . . . . . . . . . . . . . . . . . . . . . . . . . . .2316. Producer prices in China and global inflation . . . . . . . . . . . . . . . . . . . . . . . . . . . . . . . . . . . . .2417. Policy interest rates . . . . . . . . . . . . . . . . . . . . . . . . . . . . . . . . . . . . . . . . . . . . . . . . . . . . .2518. Local currency per United States dollar, and effective exchange rates. . . . . . . . . . . . . . . . . . . . . . .2619. Net portfolio inflows. . . . . . . . . . . . . . . . . . . . . . . . . . . . . . . . . . . . . . . . . . . . . . . . . . . . .27 20. Net capital outflows and estimated foreign exchange purchases in China. . . . . . . . . . . . . . . . . . . . .28 21. Foreign exchange reserves . . . . . . . . . . . . . . . . . . . . . . . . . . . . . . . . . . . . . . . . . . . . . . . .2822. Equity markets . . . . . . . . . . . . . . . . . . . . . . . . . . . . . . . . . . . . . . . . . . . . . . . . . . . . . . . .2923. CBOE Volatility Index. . . . . . . . . . . . . . . . . . . . . . . . . . . . . . . . . . . . . . . . . . . . . . . . . . . .2924. Real GDP growth and primary fiscal balance, 2011-2013 versus 2014-2016 . . . . . . . . . . . . . . . . . . .3325. Change in primary fiscal balance, expenditures and revenues between 2015 and 2016 . . . . . . . . . . . 3426. General government gross debt, current level and change since 2008 . . . . . . . . . . . . . . . . . . . . . 3427. 10-year government bond yields . . . . . . . . . . . . . . . . . . . . . . . . . . . . . . . . . . . . . . . . . . . . .3728. Public investment in 2000-2013, and infrastructure investment targets . . . . . . . . . . . . . . . . . . . . . . .3829. Indicators of inequality of income and wealth . . . . . . . . . . . . . . . . . . . . . . . . . . . . . . . . . . . . .4030. Composition of tax revenues . . . . . . . . . . . . . . . . . . . . . . . . . . . . . . . . . . . . . . . . . . . . . . .4231. Personal income tax rates and thresholds . . . . . . . . . . . . . . . . . . . . . . . . . . . . . . . . . . . . . . 4432. Revenues from wealth-related taxes . . . . . . . . . . . . . . . . . . . . . . . . . . . . . . . . . . . . . . . . . . .4533. Economic complexity index . . . . . . . . . . . . . . . . . . . . . . . . . . . . . . . . . . . . . . . . . . . . . . . .4734. Number of patents granted and rule of law . . . . . . . . . . . . . . . . . . . . . . . . . . . . . . . . . . . . . .4735. Domestic credit extended to private sector, and governance index, 2014 . . . . . . . . . . . . . . . . . . . . .4936. Tax revenues, and governance index, 2010-2014 . . . . . . . . . . . . . . . . . . . . . . . . . . . . . . . . . . .5037. Gender inequality index and governance index, recent years . . . . . . . . . . . . . . . . . . . . . . . . . . . .51
TABLE1. Real GDP growth, selected economies, revised forecasts for 2016-2017 . . . . . . . . . . . . . . . . . . . . .14

viii
Economic and Social Survey of Asia and the Pacific 2016: Year-end Update
ACRONYMS
ASEAN Association of Southeast Asian Nations
BRI Belt and Road Initiative
CDS credit default swaps
CIT corporate income tax
DESA United Nations Department of Economic and Social Affairs
ESCAP Economic and Social Commission for Asia and the Pacific
ETFs exchange-traded funds
FDI foreign direct investment
GDP gross domestic product
ILO International Labour Organization
IMF International Monetary Fund
NPL non-performing loans
OECD Organisation for Economic Co-operation and Development
OPEC Organization of the Petroleum Exporting Countries
PIT personal income tax
PPP purchasing power parity
SDRs special drawing rights
STEM science, technology, engineering and mathematics
TVET technical vocational education and training
VAT value added tax
WTO World Trade Organization
UNCTAD United Nations Conference on Trade and Development
SAARC South Asian Association for Regional Cooperation
SOE State-owned enterprise

Economic and Social Survey of Asia and the Pacific 2016: Year-end Update
1
INTRODUCTIONIn 2016, countries in the Asia-Pacific region started implementing the 2030 Agenda for Sustainable Development.1 In that Agenda, it is recognized that sustainable development involves much more than just economic growth; through the Agenda a broader concept of well-being is promoted, including the focus being given to social inclusiveness and environment sustainability. Managing economic challenges and promoting economic dynamism, nevertheless, are crucial elements for the effective pursuit of the 2030 Agenda. The economies in the Asia-Pacific region will need not only to complement demand management measures with robust supply-side structural reforms but also enhance social protection measures. The region’s policymakers will also need to make a conceptual transition. Rather than focusing solely on a growth-centric development framework, they should internalize the social, environmental and governance dimensions of development in a holistic manner.
In this context, the Economic and Social Survey of Asia and the Pacific, or simply the Survey, published in April 2016, highlighted that the pace of economic expansion and productivity gains in Asia and the Pacific have slowed considerably in recent years, and contained an examination of their implications for eradicating poverty, reducing inequality and improving employment prospects. Issues related to a rising middle class and rapid urbanization were explored as examples of multifaceted challenges to sustainable development. To bolster economic growth in the light of fragile global economic conditions, it was argued in the Survey that higher priority be given to stimulating domestic and regional demand through levels of productivity and increases in real wages. Just as strengthening productivity will contribute to the achievement of many of the Sustainable Development Goals, investing in the Goals will nurture growth in productivity, creating a virtuous cycle between sustainable development and inclusive economic growth.
In this Year-end Update of the Survey for 2016, these themes are picked up, and stock is taken of recent economic developments while their implications are assessed from a sustainable development perspective. It has become clear that, despite a sluggish global economy and weaknesses in trade, the region’s economies are showing resilience, and fiscal and structural reforms are gathering momentum. Although there had been significant volatility in financial and commodities markets in 2015 and early 2016, such conditions stabilized in the second half of 2016, and the outlook for 2017 seem broadly positive. Low inflation allowed further monetary easing, and favourable financing conditions along with a proactive fiscal stance facilitated greater social and infrastructure spending and broader structural reforms.
The region’s developing economies are projected to grow by 5 per cent in 2017, which is in line with the forecast reported in the Survey for 2016. Private consumption is growing at a steady pace on the back of low inflation, although high household debt and stagnant real wages in some economies remain a concern. Several countries are supporting economic growth through lower interest rates but at the same time increasing measures to curb excessive credit and increases in housing prices and to facilitate deleveraging and restructuring in certain corporate and banking sectors. Private investment is less forthcoming given overcapacity and deleveraging challenges in some sectors, but leading indicators point to a gradual recovery. Similarly, while industrial production remains subdued partly due to weak external demand, there are positive signs of economic upgrading, with higher growth in such sectors as high-technology and equipment manufacturing.
Some macroeconomic risks for 2016 noted earlier seem less significant, such as oil prices, while others remain, such as the accumulation of private debt, and new ones have emerged, such as Brexit in Europe and uncertainty following the United States election. Thus, bouts of financial volatility could re-emerge − including those due to external policy uncertainties in major economies − as well as vulnerabilities on the domestic front, such as those on corporate and bank balance sheets. External
1 General Assembly resolution 70/1.

2
Economic and Social Survey of Asia and the Pacific 2016: Year-end Update
demand is likely to remain weak; there is a concern that prolonged weakness in global trade could be a drag on productivity growth and the integration of developing countries into global and regional value chains. Trade protectionist measures and sentiments, which are already on the rise, may increase further, harming export-oriented Asian economies and negatively affecting private investment, as efficiency gains and dissemination of technological innovation associated with trade would suffer.
Nevertheless, overall stable economic conditions provide an opportunity to make progress on the productivity and inclusiveness fronts. While the region continues to lead global economic growth, output expansion has not been translated into commensurate increases in decent jobs in a number of countries. More than 1 billion workers in the Asia-Pacific region are in vulnerable employment, often without access to social or legal protection. Labour productivity remains low in agriculture and small and medium-sized enterprises, and industry’s capacity to absorb labour seems limited. This situation has contributed to rising income inequality, which can be reinforcing, and thus can undermine social cohesion and adversely affect long-term growth. As the region undergoes further structural transformation, there is a need to match efforts to lift productivity and innovation with measures to enhance worker skills and social protection. Moreover, appropriate policies are needed to ensure that productivity gains derived from technological progress are passed on to workers through higher real wages.
Fiscal policy can and should play a proactive role in supporting domestic demand and in meeting long-term development priorities. While ensuring long-term fiscal sustainability, there has to be greater emphasis on the quality and composition of public expenditures, rather than simply on aggregate budget deficits and public debt levels. Indeed, fiscal policy in the region has been largely countercyclical and expansionary. Governments are taking advantage of low borrowing costs and new regional cooperation initiatives to scale up infrastructure investments. Fiscal institutions are being improved, with China moving away from off-budget spending and implicit guarantees and India taking a major step towards putting into effect a nationwide goods and services tax. Public infrastructure outlays are deemed particularly effective in addressing structural bottlenecks in the current environment of weak external demand, weak private investment, low borrowing costs and benign inflationary pressures.
Tax policy can be quite effective in nurturing a more balanced society with less extreme inequalities. The population-weighted Gini coefficient in the region, based on household income estimates, increased by 11 points, from 37 to 48, between 1990 and 2014, an increase of almost 30 per cent in less than three decades. Similarly, wealth inequality is also at very high levels in a number of countries in the Asia-Pacific region. Taxes − in particular progressive personal income tax − can be a main policy tool for direct redistribution of income and wealth in a society. Taxes can also provide critical public revenues for financing public investments in health care and education, as well as for funding social protection and welfare schemes. The Asia-Pacific region as a whole has one of the world’s lowest tax revenues levels, at 17.6 per cent of GDP, with a relatively low share of direct taxes in the general tax mix.
Better economic governance, as reflected, among other things, in the effectiveness and integrity of public institutions, is a fundamental element in managing structural transformations, undertaking progressive tax reforms and moving towards a sustainable development path. Effective economic governance can go a long way in enhancing investment that is currently weak, promoting productivity and innovation that underpins sustained economic growth, accelerating poverty reduction and mitigating inequalities, including through progressive tax reforms, all of which measures need consistent policy attention.
The rest of the publication is organized as follows: section 1 contains an assessment of economic growth performance, along with a discussion of the near-term outlook and prevailing and emerging risks. In section 2, the weak prospects of job creation are discussed in the context of technological progress, and highlights are given on the importance of social protection. Section 3 contains reviews of inflation trends and monetary policy considerations. Section 4 provides an update on financial market conditions and a discussion of issues surrounding private debt. Section 5 highlights aspects of fiscal policy, underscoring its importance for supporting economic growth and improving development outcomes. In the last two sections, there is an examination in some detail on two medium-term priorities: the issue of rising inequality and role of progressive taxation in stemming that trend; and the importance of effective economic governance for fostering innovation, investment and inclusive development.

Economic and Social Survey of Asia and the Pacific 2016: Year-end Update
3
RECENT ECONOMIC DEVELOPMENTS AND OUTLOOK
1. Economic growth is relatively stable on the back of increased resilience
Regional economic growth prospects
Economic conditions stabilized in 2016, and the outlook for 2017 is broadly positive following a period of downward revisions to the economic growth forecast and volatility in financial and commodities markets. The region’s developing economies2 are projected to grow by 5 per cent in 2017, which is slightly higher than the estimated growth rate of 4.9 per cent in 2016 and the actual growth rate of 4.6 per cent in 2015. The Asia-Pacific region continues to lead global economic growth by a wide margin (see figure 1). This is broadly in line with the forecast reported in the Survey in April 2016, and reflects steady growth in China and India, a milder contraction in the Russian Federation and stronger growth in such countries as Bangladesh, Indonesia, Pakistan, the Philippines and Thailand. This relative stability provides an opportunity to pursue needed structural reforms and build resilience, including on the social and environment fronts.
Figure1
Real GDP growth, developing Asia-Pacific economies, and the world, 2006-2017Led by China and India, the Asia-Pacific region is sustaining high and steady growth at a time when developed economies are losing some of their recovery momentum
-6
-4
-2
0
2
4
6
8
10
12
2006 2007 2008 2009 2010 2011 2012 2013 2014 2015 2016 2017
Yea
r-on-
year
per
cent
age
chan
ge
Developing Asia-Pacific economies (revised forecast) Developing Asia-Pacific economies (previous forecast)
Developed economies World
Sources: ESCAP forecasts and United Nations, Department for Economic and Social Affairs (DESA), World Economic and Social Prospects, various issues. Note: The term “developed economies” refers to Australia, Canada, Japan, New Zealand, the United States and the 28 members States of the European Union. ESCAP estimates for 2016 and forecasts for 2017.
2 The term “developing Asia-Pacific economies” refers to all regional members of ESCAP, excluding Australia, Japan and New Zealand.

4
Economic and Social Survey of Asia and the Pacific 2016: Year-end Update
The region’s short-term economic performance could be viewed in the context of its ongoing structural transformation. The economic growth rate in China is projected to ease slightly to 6.4 per cent in 2017 as rebalancing towards consumption, services and higher value-added activities makes further progress. In India, economic growth is expected to remain at 7.6 per cent in 2017 as investment regains momentum and the manufacturing base strengthens on the back of structural reforms. Meanwhile, least developed countries, particularly Bangladesh, Cambodia, Lao People’s Democratic Republic and Myanmar, are growing at nearly or above 7 per cent annually, as envisioned in the Programme of Action for the Least Developed Countries for the Decade 2011–2020 (Istanbul Programme of Action).3 Regional initiatives such as the ASEAN Economic Community also hold the promise of regional integration benefits. Mature economies, such as Japan and the Republic of Korea, are channeling their surplus savings into these high-growth economies which have large investment requirements. However, a number of commodity exporters, such as Azerbaijan, Kazakhstan, Mongolia and Papua New Guinea, are undergoing sharp economic and fiscal adjustments, and this situation has contributed to the subdued growth performance of landlocked developing countries and small island developing States4 as a group (see figure 2, and pages 12 to 15 for further country-level discussion).
Real GDP growth, by ESCAP subregion and countries with special needs, 2015-2017South Asia and least developed countries are increasing their contribution to the region’s dynamism
-2
-1
0
1
2
3
4
5
6
7
2015
2016
2017
2015
2016
2017
2015
2016
2017
2015
2016
2017
2015
2016
2017
2015
2016
2017
2015
2016
2017
2015
2016
2017
2015
2016
2017
DevelopingAsia-Pacificeconomies
East andNorth-East
Asia(excluding
Japan)
South-EastAsia
South andSouth-West
Asia
North andCentral Asia
Pacific islanddevelopingeconomies
Leastdevelopedcountries
Landlockeddevelopingcountries
Smallisland
developingStates
Yea
r-on-
year
per
cent
age
chan
ge
Source: ESCAP estimates for 2016 and forecasts for 2017. Note: Black line indicates the previous forecast reported in April 2016.
China’s rebalancing-led moderation is offset by stronger growth in the rest of the region
Across the Asia-Pacific region, domestic demand has been the main economic growth driver in view of the prolonged weakness in external demand and global trade. Private consumption is growing at a steady pace on the back of low inflation and generally supportive monetary and fiscal policy stances (see figure 3), although high household debt and stagnant real wages in some economies remain a concern. In the case of India, rural consumption was also helped by a better monsoon season in 2016 following two years of poor monsoons. In many countries, robust consumption is also reflected in retail sales of automobiles, appliances and clothing. However, private investment has been less forthcoming given low capacity utilization and deleveraging challenges in some economies. Similarly, industrial production remains generally subdued in line with weak external demand.
3 General Assembly resolution 65/280.4 For further discussion on these countries, see United Nations, Economic and Social Commission for Asia and the Pacific, Asia-Pacific Countries
with Special Needs Development Report 2016: Developing the 2030 Agenda for Sustainable Development at the National Level (Sales No. E.16.II.F.11), Available from www.unescap.org/resources/asia-pacific-countries-special-needs-development-report-2016-adapting-2030-agenda.
Figure2

Economic and Social Survey of Asia and the Pacific 2016: Year-end Update
5
Demand-side contributions to GDP growth, first half of both 2015 and 2016Private consumption is robust in most countries, while investment performance is mixed
-6
-4
-2
0
2
4
6
8
10
12
2015
H1
2016
H1
2015
H1
2016
H1
2015
H1
2016
H1
2015
H1
2016
H1
2015
H1
2016
H1
2015
H1
2016
H1
2015
H1
2016
H1
2015
H1
2016
H1
2015
H1
2016
H1
China India Indonesia Republic ofKorea
Malaysia Philippines RussianFederation
Thailand Turkey
Per
cent
age
poin
ts
Fixed investment Government spendingNet exports Private consumption
Source: ESCAP, based on data from CEIC Data. Available from www.ceicdata.com (accessed 15 November 2016). Note: For China, data are available for total consumption and gross fixed capital formation only. H1 = first half of the year.
However, there are some signs of a bottoming out of these trends. For instance, in China private investment growth started to pick up in September 2016 after having declined steadily previously (see figure 4). Similarly, producer price inflation returned to positive growth in that month after having been in deflation since 2012, reflecting improvements in the supply-demand imbalance in industrial sectors. Similarly, South-East Asian economies have recently seen a moderate expansion in certain export-oriented industries, such as semiconductors, automobiles, food and textiles. It is also worth noting that higher value-added sectors, such as high-technology manufacturing, although often relatively small in size, are experiencing rapid growth. At the same time, the services sector continues to expand at a rapid pace, including in China, where it contributed 60 per cent of GDP growth in the first three quarters of 2016.
Figure4
Private investment and infrastructure investment in ChinaIn China, public infrastructure outlays offset weak private investment in 2016
0
5
10
15
20
25
Jan-
2015
Feb-
2015
Mar
-201
5
Apr
-201
5
May
-201
5
Jun-
2015
Jul-2
015
Aug
-201
5
Sep
-201
5
Oct
-201
5
Nov
-201
5
Dec
-201
5
Jan-
2016
Feb-
2016
Mar
-201
6
Apr
-201
6
May
-201
6
Jun-
2016
Jul-2
016
Aug
-201
6
Sep
-201
6
Oct
-201
6
Year
-on-
year
per
cent
age
grow
th
Private investment Infrastructure investment
Sources: ESCAP, based on data from National Bureau of Statistics of China; and CEIC Data. Available from www.ceicdata.com (accessed 15 November 2016).
Figure3
6
Economic and Social Survey of Asia and the Pacific 2016: Year-end Update
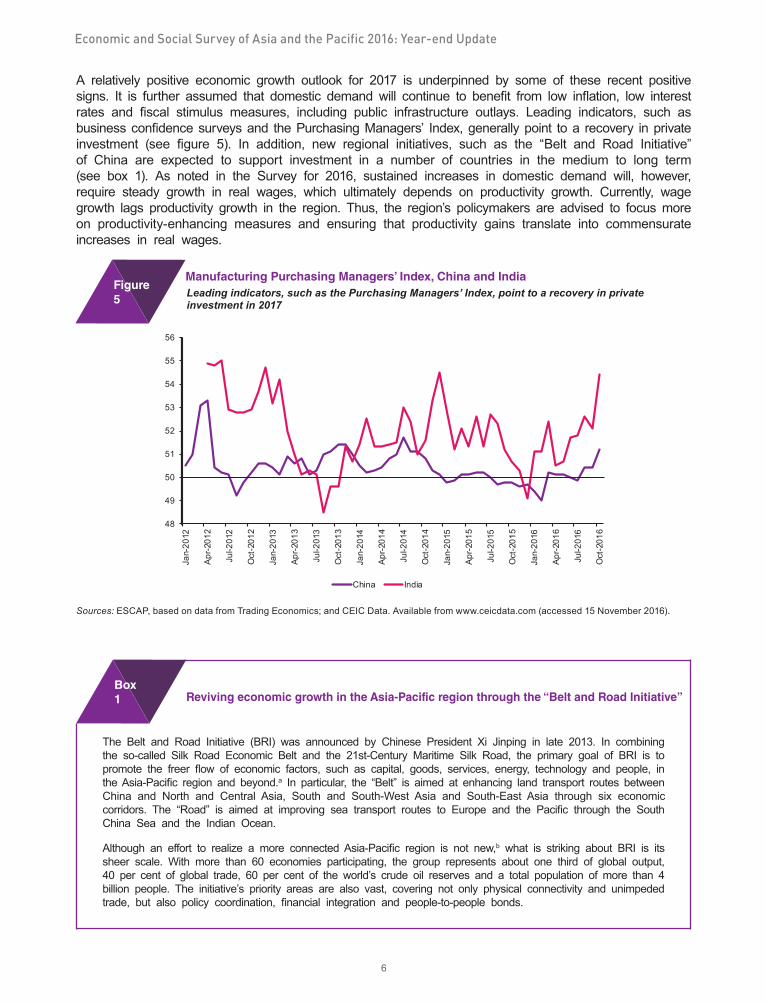
A relatively positive economic growth outlook for 2017 is underpinned by some of these recent positive signs. It is further assumed that domestic demand will continue to benefit from low inflation, low interest rates and fiscal stimulus measures, including public infrastructure outlays. Leading indicators, such as business confidence surveys and the Purchasing Managers’ Index, generally point to a recovery in private investment (see figure 5). In addition, new regional initiatives, such as the “Belt and Road Initiative” of China are expected to support investment in a number of countries in the medium to long term (see box 1). As noted in the Survey for 2016, sustained increases in domestic demand will, however, require steady growth in real wages, which ultimately depends on productivity growth. Currently, wage growth lags productivity growth in the region. Thus, the region’s policymakers are advised to focus more on productivity-enhancing measures and ensuring that productivity gains translate into commensurate increases in real wages.
Manufacturing Purchasing Managers’ Index, China and IndiaLeading indicators, such as the Purchasing Managers’ Index, point to a recovery in private investment in 2017
48
49
50
51
52
53
54
55
56
Jan-
2012
Apr
-201
2
Jul-2
012
Oct
-201
2
Jan-
2013
Apr
-201
3
Jul-2
013
Oct
-201
3
Jan-
2014
Apr
-201
4
Jul-2
014
Oct
-201
4
Jan-
2015
Apr
-201
5
Jul-2
015
Oct
-201
5
Jan-
2016
Apr
-201
6
Jul-2
016
Oct
-201
6
China India
Sources: ESCAP, based on data from Trading Economics; and CEIC Data. Available from www.ceicdata.com (accessed 15 November 2016).
Box1 Reviving economic growth in the Asia-Pacific region through the “Belt and Road Initiative”
The Belt and Road Initiative (BRI) was announced by Chinese President Xi Jinping in late 2013. In combining the so-called Silk Road Economic Belt and the 21st-Century Maritime Silk Road, the primary goal of BRI is to promote the freer flow of economic factors, such as capital, goods, services, energy, technology and people, in the Asia-Pacific region and beyond.a In particular, the “Belt” is aimed at enhancing land transport routes between China and North and Central Asia, South and South-West Asia and South-East Asia through six economic corridors. The “Road” is aimed at improving sea transport routes to Europe and the Pacific through the South China Sea and the Indian Ocean.
Although an effort to realize a more connected Asia-Pacific region is not new,b what is striking about BRI is its sheer scale. With more than 60 economies participating, the group represents about one third of global output, 40 per cent of global trade, 60 per cent of the world’s crude oil reserves and a total population of more than 4 billion people. The initiative’s priority areas are also vast, covering not only physical connectivity and unimpeded trade, but also policy coordination, financial integration and people-to-people bonds.
Figure5

Economic and Social Survey of Asia and the Pacific 2016: Year-end Update
7
Synergies with Asian and Pacific prioritiesBRI comes at a time when merchandise trade growth in developing Asia-Pacific economies has slowed. The value of goods trade increased by only 3.9 per cent per year during the period 2011-2015 compared with 21.4 per cent during the five years prior to the 2008 global financial and economic crisis. Amid sluggish trade, the average annual output growth rate in developing Asia-Pacific economies fell from 8.8 per cent during the period 2003-2007 to 5.4 per cent during the period 2011-2015. Part of that slowdown was also driven by slower productivity growth owing to rising pressure on supply-side constraints, such as infrastructure and energy shortages.
As overall economic prospects in developed economies will remain weak at the same time that trade protectionism rises,c there is a need for the Asia-Pacific region to be focused more on domestic and regional demand in order to revive its growth momentum. Increased intraregional trade will be critical; it will require enhanced connectivity through better transport infrastructure and streamlined cross-border regulations. These areas lie at the heart of BRI.
Potential economic benefits are notableThe potential gains for trade and capital investment are significant. According to estimates by the Government of China, BRI could generate an additional $2.5 trillion in China’s goods trade with participating countries over the next decade,d while total investment by China in other BRI economies would amount to about $4 trillion.e Recent data would allow for some optimism. In the first half of 2016, overseas direct investment (ODI) in BRI countries increased twice as fast as the rise in total ODI. Much of the initial investment is focused on infrastructure investment, such as extending road and rail networks.
The medium-term economic benefits of BRI are far beyond higher trade and investment. For example, for several landlocked economies in North and Central Asia, better transport networks and greater access to inputs would help upgrade productive capacity, thus enabling these countries to participate more actively in global supply chains and to widen their currently narrow, resource-oriented economic base. For energy-deficient South and South-West Asia, access to more diverse energy sources could help improve health outcomes and thus labour productivity by reducing reliance on wood and coal for cooking and heating, fuels which produce harmful indoor air pollution.
Realizing potential gains requires policy changesBRI economies need policy adjustments on several fronts in order to capitalize potential economic gains. For example, economies such as Bangladesh, Cambodia, Nepal and Pakistan specialize in exporting ready-made garments, but China’s import demand for these products is rather small. More extended transport networks brought about by BRI will help enhance connectivity in these countries, but policy changes to make their export products more competitive and increase their value added are still needed.
BRI countries should also promote an enabling business environment to attract investment. Although the Government of China has played a vital role in facilitating financing at this early stage of BRI,f the amount of funds available is still modest relative to the total investment that has been envisaged. The success of the initiative thus largely depends on the ability to attract more private capital. However, active participation by business sectors is being hampered by several factors, such as limited project preparation capacity, inadequate labour skills, lack of a transparent regulatory framework and sudden changes in policy direction.
Finally, while BRI offers various opportunities, it also presents challenges to participating economies. At a broad level, eased access to large foreign loans for infrastructure projects, even if most of them tend to be on a concessional basis, could undermine macroeconomic stability in small economies with underdeveloped financial markets and less effective debt management. On the environment front, unless properly managed, relocating heavy and natural resource-based industries out of China could worsen air quality and resource degradation in recipient countries. There is thus a need for an upfront assessment of environmental safeguards. On the social front, sections of the population could be marginalized, such as workers in industries that will no longer be competitive after the opening up of markets. ____________________
a The official vision document of BRI, released in March 2015, is available for download from http://en.ndrc.gov.cn/newsrelease/201503/t20150330_669367.html.
b For example, the Asian Highway project has been ongoing since 1992. As of February 2016, nearly 130,000 km of roads have been completed. See ESCAP database on the “Status of the Asian Highway in Member Countries”.
c Examples include the recent rise in trade-restrictive measures introduced by the Group of 20 (G-20) economies and the 2016 vote in the United Kingdom to leave the European Union.
d See Daniel Allen, “New opportunities in China’s “One Belt One Road” initiative”, TransPacific News, East West Bank. Available from www.eastwestbank.com/ReachFurther/News/Article/New-Opportunities-In-Chinas-One-Belt-One-Road-Initiative.
e The Economist, “Our bulldozers, our rules”, 2 July 2016. Available from www.economist.com/news/china/21701505-chinas-foreign-policy-could-reshape-good-part-world-economy-our-bulldozers-our-rules.
f Available sources of finance include, among others, $100 billion in initial funding of the China-led Asian Infrastructure Investment Bank, $40 billion in the China-owned Silk Road Fund, and China’s policy banks and State-backed commercial banks.
8
Economic and Social Survey of Asia and the Pacific 2016: Year-end Update
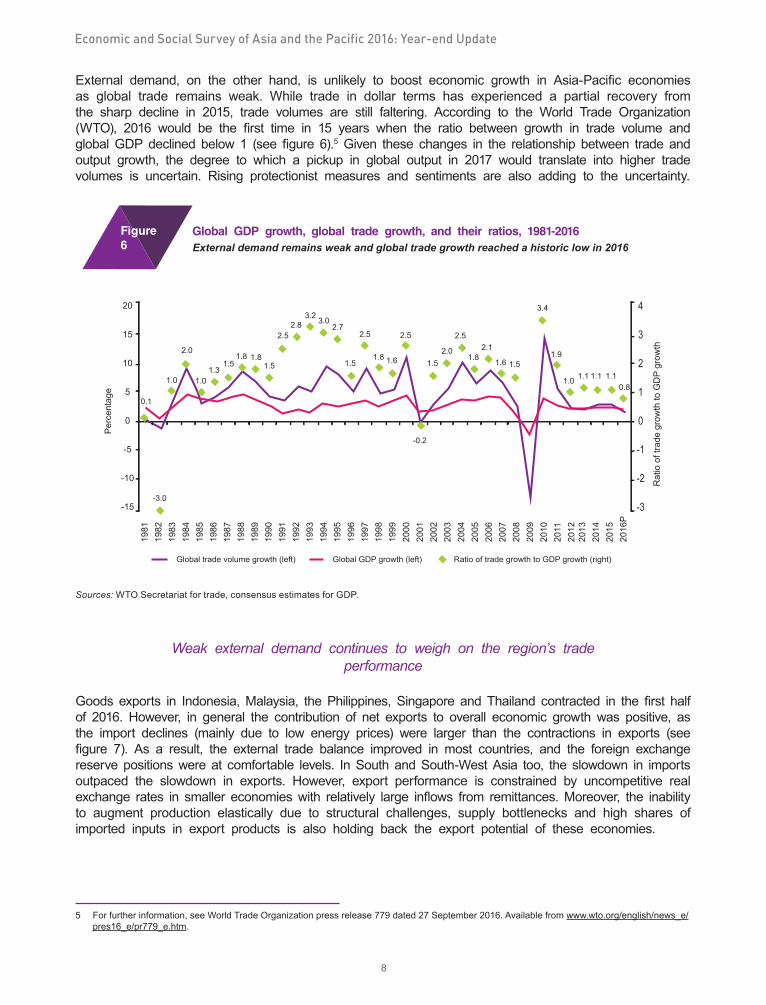
External demand, on the other hand, is unlikely to boost economic growth in Asia-Pacific economies as global trade remains weak. While trade in dollar terms has experienced a partial recovery from the sharp decline in 2015, trade volumes are still faltering. According to the World Trade Organization (WTO), 2016 would be the first time in 15 years when the ratio between growth in trade volume and global GDP declined below 1 (see figure 6).5 Given these changes in the relationship between trade and output growth, the degree to which a pickup in global output in 2017 would translate into higher trade volumes is uncertain. Rising protectionist measures and sentiments are also adding to the uncertainty.
Figure6
Global GDP growth, global trade growth, and their ratios, 1981-2016External demand remains weak and global trade growth reached a historic low in 2016
20
15
10
5
0
-5
-10
-15
1981
1982
1983
1984
1985
1986
1987
1988
1989
1990
1991
1992
1993
1994
1995
1996
1997
1998
1999
2000
2001
2002
2003
2004
2005
2006
2007
2008
2009
2010
2011
2012
2013
2014
2015
2016
P
3.4
1.9
1.0 1.1 1.1 1.10.8
1.5
2.52.1
1.61.82.0
1.5
2.5
1.61.8
2.5
1.5
2.73.03.2
2.82.5
1.51.81.8
1.51.3
1.0
2.0
1.0
0.1
-0.2
-3.0
4
3
2
1
0
-1
-2
-3
Global trade volume growth (left) Global GDP growth (left) Ratio of trade growth to GDP growth (right)
Per
cent
age
Rat
io o
f tra
de g
row
th to
GD
P gr
owth
Sources: WTO Secretariat for trade, consensus estimates for GDP.
Weak external demand continues to weigh on the region’s trade performance
Goods exports in Indonesia, Malaysia, the Philippines, Singapore and Thailand contracted in the first half of 2016. However, in general the contribution of net exports to overall economic growth was positive, as the import declines (mainly due to low energy prices) were larger than the contractions in exports (see figure 7). As a result, the external trade balance improved in most countries, and the foreign exchange reserve positions were at comfortable levels. In South and South-West Asia too, the slowdown in imports outpaced the slowdown in exports. However, export performance is constrained by uncompetitive real exchange rates in smaller economies with relatively large inflows from remittances. Moreover, the inability to augment production elastically due to structural challenges, supply bottlenecks and high shares of imported inputs in export products is also holding back the export potential of these economies.
5 For further information, see World Trade Organization press release 779 dated 27 September 2016. Available from www.wto.org/english/news_e/pres16_e/pr779_e.htm.

Economic and Social Survey of Asia and the Pacific 2016: Year-end Update
9
Figure7
Growth in export and import volumes, developing Asia-Pacific economies, and the worldThe region’s imports declined more than its exports in the first half of 2016, but both are weak
Source: ESCAP, based on UNCTAD international trade statistics. Available from http://unctadstat.unctad.org/EN/Index.html (accessed 15 November 2016). Note: Quarterly (Q) data up to the second quarter of 2016.The UNCTAD grouping for “developing Asia” does not include ESCAP economies in North and Central Asia and in the Pacific.
In going forward, there is a possibility of further weakness in trade as global aggregate demand, in particular investment, remains subdued and the expansion of regional value chains – a major driver of intraregional trade – has plateaued (see figure 8). While this in part reflects China’s rebalancing, which in the medium term could boost trade as the region imports a broader array of goods and services, to the extent that efficiency gains and dissemination of technological innovation associated with trade suffers, the net effect remains somewhat uncertain. Overall, the Asia-Pacific region is expected to experience a 5.2 and 4.2 per cent decline in nominal export and import values respectively in 2016 before bouncing back in 2017, according to the forthcoming publication of the ESCAP Asia-Pacific Trade and Investment Report 2016.
Figure8
China’s imports from the rest of the Asia-Pacific region A somewhat hopeful sign is that the slowdown of China’s imports from the rest of the region may have bottomed out; nevertheless, intraregional trade is not expanding as rapidly as previously
-30
-20
-10
0
10
20
30
40
2012
Q1
2012
Q2
2012
Q3
2012
Q4
2013
Q1
2013
Q2
2013
Q3
2013
Q4
2014
Q1
2014
Q2
2014
Q3
2014
Q4
2015
Q1
2015
Q2
2015
Q3
2015
Q4
2016
Q1
2016
Q2
Perc
enta
ge
Year on year Quarter on quarter
Average 2000-2007
Source: ESCAP, based on data from CEIC Data. Available from www.ceicdata.com (accessed 15 November 2016).
-20
-15
-10
-5
0
5
10
15
20
25
30
2006
Q1
2006
Q3
2007
Q1
2007
Q3
2008
Q1
2008
Q3
2009
Q1
2009
Q3
2010
Q1
2010
Q3
2011
Q1
2011
Q3
2012
Q1
2012
Q3
2013
Q1
2013
Q3
2014
Q1
2014
Q3
2015
Q1
2015
Q3
2016
Q1
Yea
r-on-
year
per
cent
age
chan
ge
Export volume growth rate
World Developing Asia
2016
Q2
-20
-15
-10
-5
0
5
10
15
20
25
30
2006
Q1
2006
Q3
2007
Q1
2007
Q3
2008
Q1
2008
Q3
2009
Q1
2009
Q3
2010
Q1
2010
Q3
2011
Q1
2011
Q3
2012
Q1
2012
Q3
2013
Q1
2013
Q3
2014
Q1
2014
Q3
2015
Q1
2015
Q3
2016
Q1
Yea
r-on-
year
per
cent
age
chan
ge
Import volume growth rate
World Developing Asia
2016
Q2

10
Economic and Social Survey of Asia and the Pacific 2016: Year-end Update
Risks and challenges to the economic outlook
Despite a somewhat positive overall economic outlook for the developing economies in the region, current and emerging risks and challenges should not be underestimated. External risks may be particularly relevant, given the strong interconnections between the Asia-Pacific region and the rest of the global economy. Nearly half of the region’s merchandise exports depend on markets outside the region, and the region is a major destination of global foreign direct investment (FDI), accounting for approximately 42 per cent of the world’s total inbound FDI in 2014. The region is also becoming a major overseas investor, accounting for approximately 32 per cent of the world’s total outbound FDI in 2015.6 In particular, China’s outbound FDI grew from $916 million in 2000 to $127.6 billion in 2015.
In view of these trade and investment features, two external risks are worth noting, as they may easily induce renewed bouts of financial volatility: first, the decision in the United Kingdom to exit the European Union (“Brexit”), for which negotiations are expected to begin in 2017. Financial market volatility resulting from the vote in the June 2016 referendum has been limited and short-lived, but there still could be impacts through the trade channel, especially if European Union growth is affected by Brexit. Indeed, recent studies on Brexit as well as China’s rebalancing found that financial spillovers tend to be higher between countries with close trade linkages.
A source of concern is the noticeable surge in the number of trade-restrictive measures
A second risk identified relates to the economic policies of the incoming administration in the United States. The emphasis by the President-elect during the election campaign on infrastructure spending and tax cuts has sparked a rally in United States stocks and sent benchmark Treasury yields sharply higher, prompting capital outflows from the region. More importantly, uncertainty has markedly increased on the trade front. The President-elect has also promised to scrap the Trans-Pacific Partnership (TPP), in which Japan, Malaysia and Viet Nam were among the signatories from the region, while accusing China of currency manipulation. As China is the United States largest trade partner, the possibility of a trade war could have far-reaching economic consequences for the region’s economy.
Trade protectionist measures and sentiments, which are already on the rise, would be particularly harmful for export-oriented Asian economies and negatively affect private investment. In the forthcoming Asia-Pacific Trade and Investment Report 2016, attention is drawn to a noticeable surge in the number of restrictive trade measures adopted per month from mid-October 2015 to mid-May 2016, a trend observed both globally and regionally. Prolonged weakness in global trade could also be a drag on productivity growth and the integration of developing countries into global value chains.
While contributing to global efforts to revive trade and enhance multilateral negotiations, economies in the Asia-Pacific region could further deepen and broaden regional connectivity and cooperation efforts. Investments and harmonization in regional infrastructure in energy, information and communications technology (ICT) and transport could be a game-changer, especially in the current environment of weak global aggregate demand. Regional initiatives could be broad enough to include countries in North and Central Asia and the Pacific island developing States, where economic diversification remains a priority. Addressing geopolitical tensions would also be important. The recent cancellation of the South Asian Association for Regional Cooperation (SAARC) summit planned to be held in November 2016 represents another missed opportunity for further economic and political dialogue towards economic integration.
At the same time, the Asia-Pacific region’s financial development is expected to present both challenges and opportunities. Larger, deeper and more liquid financial markets can lower the cost of capital and increase investment in such much-needed areas as infrastructure. Better financial markets also would improve resource allocation and enhance diversification of risks and resilience to shocks. They would
6 Source: ESCAP, Asia-Pacific Trade and Investment report (Bangkok, 2016).

Economic and Social Survey of Asia and the Pacific 2016: Year-end Update
11
lengthen the maturity of financing and improve trade and settlement practices. Countries could therefore further enhance regional financial cooperation and integration, which has already made significant progress in regional blocs, such as the Association of Southeast Asian Nations (ASEAN). China’s financial linkages with other countries in the region have also strengthened in recent years through, for example, cross-border banking exposure and equity market interlinkages, gradual capital account liberalization and internationalization of the renminbi. The renminbi recently joined the International Monetary Fund’s Special Drawing Rights (SDR) basket. Moreover, as of 2015 China had the largest number of swap arrangements, amounting to more than $500 billion.
However, risks of financial instability and contagion should be effectively managed. Excessive credit growth and concentration in such sectors as real estate could destabilize the financial sector and undermine productivity growth. As highlighted in previous ESCAP analyses, these risks need to be effectively addressed. In this regard, China’s economy appears to be relatively more exposed to financial market vulnerability, which entails risks for other economies. Currently, the country is undergoing corporate deleveraging and restructuring efforts (see box 3 on page 30). Total debt in China rose to more than 250 per cent of GDP as of March 2016, while there are concerns about renewed price bubbles as housing prices in first-tier cities surged (see figure 9). Financial instability or policy uncertainty in China could have global and regional repercussions. For instance, China triggered a major jump in the volatility index of the Chicago Board Options Exchange for the first time in August 2015, when China’s stock market prices fell sharply despite official support, and the renminbi-fixing mechanism was adjusted.7 Such financial spillovers are reflective of China’s sizeable weight in the global economy and trade, including demand for various primary commodities, and could become more prominent in the future as the capital account gradually opens up.8
Figure9
Housing prices and real estate investment in ChinaChina experienced a renewed housing price surge in 2016, adding to concerns over high levels of private debt
-20
-15
-10
-5
0
5
10
15
20
25
30
Feb-
2012
Jun-
2012
Oct
-201
2
Feb-
2013
Jun-
2013
Oct
-201
3
Feb-
2014
Jun-
2014
Oct
-201
4
Feb-
2015
Jun-
2015
Oct
-201
5
Feb-
2016
Jun-
2016
Oct
-201
6
Year
-on-
year
per
cent
age
chan
ge
Housing prices (nominal) Housing prices (real) Real estate investment
Source: ESCAP, based on data from CEIC Data. Available from www.ceicdata.com (accessed 15 November 2016).
If financial volatility is accompanied by large capital outflows, tighter domestic financing conditions might be prompted. In the Survey for 2016, it was estimated that economic growth in such countries as India, Indonesia and the Republic of Korea was particularly exposed to lower share prices, spikes in market
7 The Chicago Board Options Exchange (CBOE) Volatility Index, known as VIX, is a key measure of market expectations of near-term volatility conveyed by S&P 500 stock index option prices.
8 In 2015, China accounted for 13 per cent of global GDP (18 per cent on purchasing power parity (PPP)), 10 per cent of global imports and 40 per cent of global demand for base metals and 30 per cent for soybeans.

12
Economic and Social Survey of Asia and the Pacific 2016: Year-end Update
risk premiums and deterioration in market confidence.9 Moreover, as highlighted in the Survey for 2016, many of these risks are potentially interconnected. For instance, a sharper-than-expected decline in China’s economic growth rate, together with increases in interest rates set by the United States, may lead to a string of exchange rate depreciations in the region, thereby increasing the financial vulnerability of economies that have extensive exposure to private debt denominated in foreign currencies and those that rely excessively on oil for their foreign exchange earnings. Nevertheless, after considering all these factors, a sharp decline in economic growth for the Asia-Pacific region as a whole seems unlikely given the adequate policy space that exists in many countries. (See section 4 of this report for further discussion on financial markets).
In addition to the above risks, the trajectory of key commodity prices, particularly oil prices, will affect the region’s economic outlook. While the recent agreement by OPEC members to limit oil production may boost global petroleum prices, everything depends on credible implementation. Further partial recovery in oil prices would benefit major net exporters that are undergoing sharp economic and fiscal adjustments. If global oil prices rise too rapidly, however, such net commodity importers as India, which had benefited considerably in terms of price stability, fiscal and current account balances, would face headwinds.
In terms of domestic developments, there is a risk that large public infrastructure projects will be delayed. For instance, the wide government revenue shortfall recorded in Indonesia in 2016 could lead to delays in new infrastructure projects. Similarly, a plan by the Government of Malaysia to carry out a balanced budget by 2020 and Viet Nam’s rising public debt level could undermine those countries’ ability to introduce large fiscal stimulus packages, if needed. In Thailand, the realization of planned spending on large-scale infrastructure projects is conditional on smooth elections that are expected to take place in late 2017.
Recent economic performance and outlook across subregions
In East and North-East Asia, economic rebalancing continues in China, with consumption and services increasingly playing a more prominent role. Final consumption, including market sales of high-end consumer goods, contributed 71 per cent to economic growth in the first three quarters of 2016, which stood at 6.7 per cent, only slightly below the 6.9 per cent achieved in 2015 as a whole. Supply-side structural reform policies coupled with large-scale infrastructure and increased social spending, helped stabilize the economy and expand the labour market, especially in the information technology (IT) and e-commerce sectors.10 The economy is expected to continue its gradual moderating trend in coming years, broadly in line with the targets set out in the current five-year plan.11 Economic growth in 2017 is projected at 6.4 per cent, as real estate investment moderates as a result of recent measures introduced to curb the rapid growth of mortgage loans and housing prices.12 While public infrastructure outlays will continue, demand for raw materials, such as cement and steel, are likely to decline steadily in line with the Government’s targets for capacity reduction.13 Growth will be driven by higher value-added sectors, such as high-technology industry, equipment manufacturing industries and strategic emerging industries – which grew at about 10 per cent in the first three quarters of 2016, well above the total industry growth rate of 6 per cent. The economy of Hong Kong, China continues to experience low growth
9 Under this scenario, economic growth in these countries is estimated to be 0.9 to 1.0 percentage points lower than the baseline forecast, with particularly sharp declines in fixed investments. See box 1.2 in the Survey for 2016, entitled “Spillovers from economic rebalancing and policy changes in China”, pp. 9-10. Available from www.unescap.org/sites/default/files/Chapter1_Survey2016_0.pdf.
10 Online retail sales grew by 25 per cent in the first three quarters of 2016, outpacing the total retail sales growth rate of 10 per cent. 11 China’s 13th five-year plan for the period 2016-2020 is targeted at producing an average annual growth rate of 6.5 per cent to be consistent with
the goal of doubling GDP and 2010 per capita income by 2020. However, the authorities are pursuing this target within the broader context of the economy’s rebalancing and strong commitment to labour market stability and poverty reduction so that growth could slightly undershoot the target as long as there are healthy signs of progress in such areas as job creation and rural income growth.
12 Property prices in 100 major Chinese cities increased by 14.9 per cent in the first nine months of 2016. A growing number of cities have introduced such policies as those requiring higher down payments and imposing home purchase restrictions in order to curb speculative housing purchases. Mortgages represented 55.7 per cent of the 529 billion yuan in household loans in August 2016.
13 Capacity reduction targets of about 10-15 per cent over 3-5 years were announced for the coal and steel sectors. A restructuring fund of 100 billion yuan was established for re-employment and resettlement of affected workers in overcapacity sectors.
Economic and Social Survey of Asia and the Pacific 2016: Year-end Update
13
due to declining domestic demand, business confidence and exports in services. Favourable prospects for the expansion of financial services is seen in terms of the potential role Hong Kong, China could play in the renminbi’s increasing internationalization, supplemented by the renminbi’s inclusion within the IMF currency basket starting on 1 October 2016.
Growth of higher value-added sectors is outpacing the industry sector’s average in China
Japan achieved modest economic growth in 2016, and deflationary concerns that had persisted for 15 years eased somewhat. While the postponement of the increase in the value-added tax (VAT) to 2019 is expected to drive domestic consumption, economic growth in 2017 is likely to be tempered at 0.7 per cent as a stronger yen hampers the country’s exports. In the Republic of Korea, a growth rate of 2.8 per cent is projected for 2017 due to the modest pace of private consumption and corporate restructuring in such sectors as shipbuilding. International sanctions and a sharp fall in the price of coal are expected to set back the economy of the Democratic People’s Republic of Korea. A huge fiscal deficit, falling commodity prices and declining foreign direct investment (FDI) dragged down Mongolia’s growth in 2016.
In South-East Asia, economic growth is on a gradual upward trend because of higher growth in Indonesia and Thailand and sustained high growth rates of 6-8 per cent in the Philippines and the so-called CLMV economies (Cambodia, Lao People’s Democratic Republic, Myanmar and Viet Nam). In Indonesia, consumer spending benefited from much lower inflation driven by lower global oil prices, which resulted in several interest rate reductions, as well as a range of policy measures to support household incomes, such as higher minimum wages, an increase in the tax-free threshold and an employment scheme to help farmers adversely affected by drought. In the Philippines, strong household spending was underpinned by favourable employment conditions, higher workers’ remittances, higher civil service salaries and spending related to the general elections in May 2016. Fixed investment has surged in recent quarters.
In Thailand, both public consumption and investment increased notably as a result of civil service salary increases, higher social transfers and large-scale infrastructure projects in such sectors as water management and transport. However, large spare manufacturing capacity has held back new capital investments. In general, weak external demand has constrained business investment in several export-oriented South-East Asian economies. In Singapore, the decline in private fixed investment was also due to weak investment in the housing sector. In Malaysia, consumer spending was held back by less robust job market conditions and drought that led to a decline in key agricultural outputs and higher prices in the first half of 2016. The overall economic slowdown took place amid some macroeconomic policy support, including a reduction in the interest rate, smaller mandatory employee contributions to the retirement fund and lower income tax rates.
In South and South-West Asia, the fastest-growing subregion, domestic demand is buoyant on the back of lower inflation, broader macroeconomic stability and some easing in supply-side bottlenecks. However, growth continues to rely heavily on consumption. India’s economy is projected to sustain a 7.6 per cent growth rate in both fiscal years 2016/17 and 2017/18. While growth in the first quarter of the current fiscal year (April-June 2016) moderated due to a contraction in fixed investment, a rebound is expected. Initially, growth will be driven by a rebound in agriculture due to normal monsoon rain, which along with civil service pay revisions will support broad-based consumption growth. Later, growth will be underpinned by a recovery in private investment as the recent push to accelerate infrastructure spending and measures to create a better investment climate − due in part to the passage of the goods and services tax and bankruptcy code − “crowd in” the private sector.14 However, a strong recovery in investment continues to be challenged by low capacity utilization and subdued growth in the extension of bank credit to industry.
14 World Bank Open Knowledge Repository, South Asia Economic Focus, Fall 2016: Investment Reality Check, October 2016. Available from https://openknowledge.worldbank.org/handle/10986/25096.

14
Economic and Social Survey of Asia and the Pacific 2016: Year-end Update
Table1 Real GDP growth, selected economies, revised forecasts for 2016-2017
Real GDP growth(Percentage)
Change from Survey 2016 (Percentage points)
2015 2016 2017 2016 2017Developing Asia-Pacific economies 4.6 4.9 5.0 0.1 0.0
East and North-East Asia (excluding Japan) 5.7 5.6 5.4 0.1 0.0
China 6.9 6.7 6.4 0.2 0.1
Republic of Korea 2.6 2.7 2.8 -0.2 -0.3
South-East Asia 4.3 4.4 4.6 -0.1 -0.2
Indonesia 4.8 5.0 5.3 -0.3 -0.2
Malaysia 5.0 4.4 4.6 0.0 -0.2
Philippines 5.9 7.0 6.2 1.0 0.0
Thailand 2.8 3.3 3.4 0.1 -0.1
Viet Nam 6.7 6.0 6.3 -0.8 -0.6
South and South-West Asia 5.6 5.9 6.1 0.0 -0.2
Bangladesh 6.6 7.1 7.0 0.3 0.0
India 7.6 7.6 7.6 0.0 -0.2
Pakistan 4.0 4.7 5.1 1.2 0.3
Sri Lanka 4.8 5.0 5.5 -0.4 -0.4
Turkey 4.0 3.0 3.5 0.0 -0.2
North and Central Asia -2.6 -0.2 1.1 0.7 0.6
Azerbaijan 1.1 -3.1 0.7 -3.4 -0.5
Kazakhstan 1.2 0.3 1.0 -0.2 -0.5
Russian Federation -3.7 -0.6 0.8 0.9 0.8
Pacific island developing economies 6.6 2.3 3.0 -1.1 0.3
Fiji 3.6 2.0 3.6 -0.2 0.5
Papua New Guinea 9.9 2.0 2.8 -2.3 0.4
Least developed countries 6.2 6.2 6.6 -0.2 -0.1
Landlocked developing countries 3.0 1.8 3.0 -0.7 -0.4
Small island developing States 5.8 3.1 3.7 -0.8 0.1
Sources: ESCAP, based on national sources; United Nations, Department of Economic and Social Affairs, World Economic Situation and Prospects 2016: Update as of mid-2016 (Sales No. E.16.II.C.2). Available from www.un.org/en/development/desa/policy/wesp/wesp_current/2016wesp_update.pdf; International Monetary Fund, World Economic Outlook Databases. Available from www.imf.org/external/pubs/ft/weo/2016/02/weodata/index.aspx; Asian Development Bank, Asian Development Outlook 2016: Asia’s potential growth and supplement (Manila, 2016). Both publications are available from www.adb.org/publications/asian-development-outlook-2016-asia-potential-growth; CEIC Data. Available from www.ceicdata.com. Notes: For countries not listed in the table, the growth estimates and forecasts are the same as those reported in the Survey for 2016, and will be revised in the Survey for 2017. Fiscal years are given for Bangladesh, Pakistan (1 July 2015 to 30 June 2016), and India (1 April 2016 to 31 March 2017).
Ongoing structural reforms are expected to benefit private investment in India
Pakistan’s economy grew by 4.7 per cent in fiscal year 2015/16 (July-June), the highest rate in eight years. Economic growth is expected to maintain this trend on the back of higher industrial production and infrastructure projects under the China-Pakistan Economic Corridor. Economic growth in Bangladesh

Economic and Social Survey of Asia and the Pacific 2016: Year-end Update
15
accelerated to 7.1 per cent in fiscal year 2015/16 (July-June), driven by the industrial sector and merchandise exports in the low-end manufacturing sector. Sri Lanka’s economy is growing at a modest pace, supported by tourism and construction activities, but the country is undergoing an IMF programme as a result of severe external sector imbalances. Reconstruction from the severe 2015 earthquake in Nepal and lifting of sanctions in the Islamic Republic of Iran in 2016 are supporting growth in these countries, but political turmoil in Turkey is adversely affecting its economic condition.
The North and Central Asian subregion continues to experience economic contraction, although a partial recovery in global oil prices is supporting a milder recession in the Russian Federation; a contraction of 0.6 per cent is estimated for 2016 as opposed to a contraction of 3.7 per cent in 2015. The economy is expected to return to positive growth in the fourth quarter as rising production among manufacturers and domestic orders outweighed a continued decline in new business from abroad.15 Inflation has declined and domestic financing conditions have improved. Nevertheless, the signs of emerging recovery in investment activity are persistently weak.16 The somewhat improved outlook for the Russian Federation is expected to support activity elsewhere in North and Central Asia, especially in such oil importers as Tajikistan, given linkages through trade and remittances. Other oil and gas exporters, such as Azerbaijan and Kazakhstan, are experiencing considerable economic contraction and a slowdown in growth respectively due to spikes in inflation and substantial depreciation in exchange rates. Uzbekistan, nonetheless, continues to sustain a high economic growth rate.
Pacific island developing economies as a whole are projected to experience an economic slowdown in coming years, with the growth rate moderating to 2.3 per cent in 2016 before rising to 3.0 per cent in 2017. Soft prices for mineral exports weigh down the growth forecast in Papua New Guinea, dragging down overall growth of this group of economies. The modest growth outlook would be supported by expected steady economic expansion in key trading partners, such as Australia and New Zealand, lower energy import bills, higher tourism receipts and continued infrastructure upgrades and post-cyclone reconstruction efforts in some economies. The key downside factor is an increased risk of natural disasters, which could significantly damage productive infrastructure and tourism facilities.
2. Despite economic growth, job creation remains a challenge
GDP growth dynamics tend to influence employment prospects, and they typically move together. However, this is not necessarily a one-for-one relationship. For instance, it is possible that aggregate output growth could slow, while workers are retained by firms and government in their current jobs if the situation is considered to be only a temporary downturn. A prolonged output growth slowdown eventually translates into weak employment data. Economies can also experience instances when output grows at a steady pace, but employment growth remains weak. This is particularly true when the skill bias of modern technology, which drives output growth, reduces the pace of absorption of unskilled labour, leading to weak employment trends. Similarly, as countries make the transition from a primarily agriculture-based economy to a manufacturing and/or service-driven economy, the relationship between output growth and employment becomes weak. At a broad level, these factors explain the prevailing disconnect in the Asia-Pacific region between more or less stable output expansion and weak employment growth in the last few years.
Indeed, while the region continues to lead global economic growth, it has not been sufficiently inclusive, especially in terms of creating decent and productive employment. Approximately 1 billion workers in the Asia-Pacific region are in vulnerable employment, often without access to social or legal protection. Labour productivity remains low in agriculture and small and medium-sized enterprises, and industry’s capacity
15 The manufacturing PMI rose to 52.4 in October 2016, the third consecutive month of expansion, according to Markit Economics. For details, see www.markiteconomics.com/Survey/PressRelease.mvc/1569045debd44410a0245559cbc403ed.
16 Central Bank of the Russian Federation, “The Bank of Russia decided to keep the key rate at 10.00% p.a.”, news release dated 28 October 2016. For details, see http://cbr.ru/eng/press/PR.aspx?file=28102016_133004eng_keyrate2016-10-28T13_17_18.htm.

16
Economic and Social Survey of Asia and the Pacific 2016: Year-end Update
to absorb labour seems limited.17 This situation has contributed to rising income inequality, which can be reinforcing, undermining social cohesion and hurting long-term growth. It is also possible that such structural challenges in the labour market could be compounded by cyclical downturns in the economy.18
As highlighted in the Survey for 2016, economic growth has not been translated into commensurate increases in decent jobs in most countries. This is one of the reasons underlying signs of a slowdown in the pace of poverty reduction in the region. Employment growth in 2015 was merely 1.1 per cent (or 21.3 million jobs) for the region as a whole, a situation influenced considerably by slower economic growth.19 This is a serious concern, as employment generation is critical for countries such as India to realize their so-called demographic dividend. ILO estimates that by 2030 the region’s labour force would reach 2.2 billion; to accommodate this expansion, the region would need to create 249 million additional jobs in the next 15 years. Based on current trends, however, such expansion of jobs is unlikely given that employment growth is projected to decline further to 0.8 per cent per year over the next 15 years.20
This could pose particular challenges for young people in the labour force, who are already four times more likely to be unemployed than their adult counterparts. While official unemployment rates do not always reflect an accurate picture of the labour market in view of the large informal sectors in many countries, it seems that unemployment rates have edged up recently in some countries. For instance, India’s latest government survey for fiscal year 2015/16 showed that the jobless rate rose to 5 per cent, a five-year high, despite strong economic growth of the economy.21,22 Moreover, the same survey estimated that some 20 per cent of urban workers and nearly 50 per cent of rural workers were underemployed, and that only 17 per cent of the workers were regular wage/salaried persons (see figure 10).
Figure10
Labour market indicators in IndiaStructural challenges remain in India’s labour market, including gender gaps and vulnerable employment
Self employed
46%
Regular wage/
salaried17%
Contract workers
4%
Casual labour33%
India's employment by type of contract(percentage of total employment)
0
10
20
30
40
50
60
70
80
Male Female
Per
cent
age
of to
tal e
mpl
oym
ent
Labour participation rate, 2015/16
0
1
2
3
4
5
6
7
8
9
10
Male Female
Per
cent
age
Unemployment rate, 2015/16
Source: ESCAP, based on Government of India, Ministry of Labour and Employment. Report on Fifth Annual Employment - Unemployment Survey (2015-16) Volume I. Available from http://labourbureaunew.gov.in/UserContent/EUS_5th_1.pdf.
17 Along with “premature deindustrialization” in some countries, industry’s capacity to absorb labour − the elasticity of employment − has fallen considerably between the periods 1991-2004 and 2005-2013.
18 For instance, while the years before the global financial crisis were characterized by fairly robust employment growth in the emerging G-20 economies as a whole, in both the crisis and the post-crisis periods economic growth was less employment-intensive. See International Labour Organization and others, G20 Labour Markets in 2015: Strengthening the Link between Growth and Employment. Available from www.ilo.org/wcmsp5/groups/public/---dgreports/---dcomm/---publ/documents/publication/wcms_398025.pdf.
19 See United Nations, Economic and Social Commission for Asia and the Pacific, Economic and Social Survey of Asia and the Pacific 2016, chap. 1, sect. 3.1, entitled “Slower growth having impacts on employment prospects, poverty and inequality”, pp. 36-39. Available from www.unescap.org/sites/default/files/Chapter1_Survey2016_0.pdf.
20 See International Labour Organization, Building an Inclusive Future with Decent Work: Towards Sustainable Development in Asia and the Pacific − report of the Director-General, 16th Asia and the Pacific Regional Meeting, Bali, Indonesia, 6-9 December 2016. Available from www.ilo.org/global/meetings-and-events/regional-meetings/asia/aprm-16/WCMS_531409/lang--en/index.htm.
21 Another possibility would be that the unemployment rate would increase due to positive economic performance as more people could be entering the labour force looking for a job.
22 Government of India, Ministry of Labour and Employment, Labour Bureau, Chandigarh, “Report on Fifth Annual Employment-Unemployment Survey (2015-16)”, vol. I. Available from http://labourbureaunew.gov.in/UserContent/EUS_5th_1.pdf.
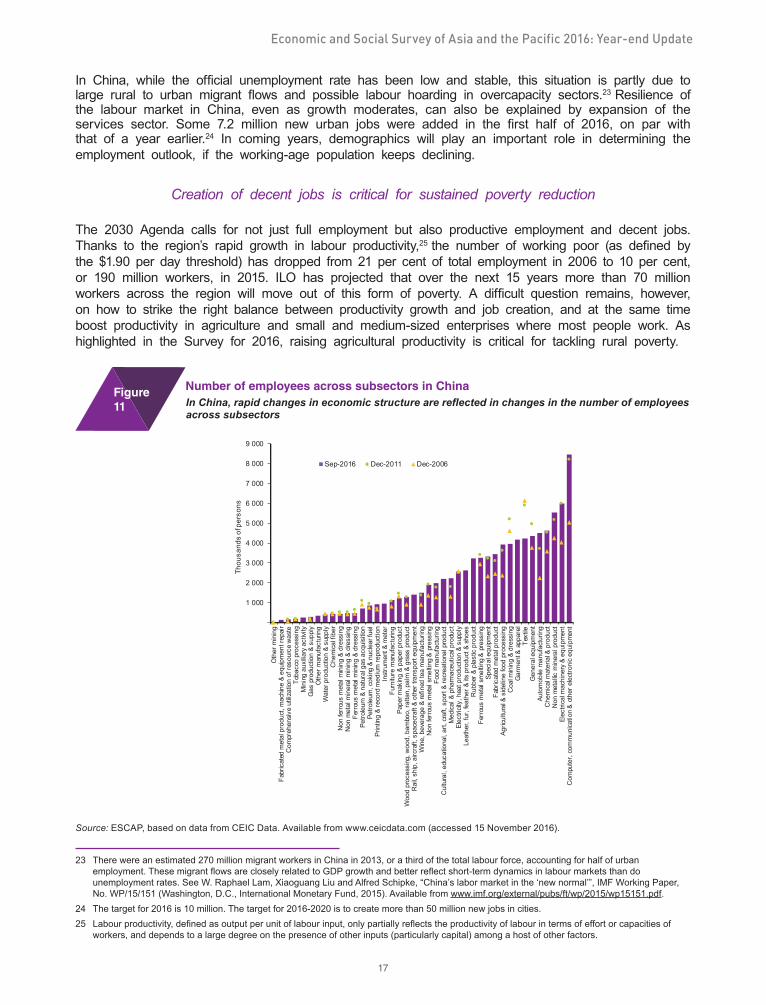
Economic and Social Survey of Asia and the Pacific 2016: Year-end Update
17
In China, while the official unemployment rate has been low and stable, this situation is partly due to large rural to urban migrant flows and possible labour hoarding in overcapacity sectors.23 Resilience of the labour market in China, even as growth moderates, can also be explained by expansion of the services sector. Some 7.2 million new urban jobs were added in the first half of 2016, on par with that of a year earlier.24 In coming years, demographics will play an important role in determining the employment outlook, if the working-age population keeps declining.
Creation of decent jobs is critical for sustained poverty reduction
The 2030 Agenda calls for not just full employment but also productive employment and decent jobs. Thanks to the region’s rapid growth in labour productivity,25 the number of working poor (as defined by the $1.90 per day threshold) has dropped from 21 per cent of total employment in 2006 to 10 per cent, or 190 million workers, in 2015. ILO has projected that over the next 15 years more than 70 million workers across the region will move out of this form of poverty. A difficult question remains, however, on how to strike the right balance between productivity growth and job creation, and at the same time boost productivity in agriculture and small and medium-sized enterprises where most people work. As highlighted in the Survey for 2016, raising agricultural productivity is critical for tackling rural poverty.
Figure11
Number of employees across subsectors in China In China, rapid changes in economic structure are reflected in changes in the number of employees across subsectors
1 000
2 000
3 000
4 000
5 000
6 000
7 000
8 000
9 000
Oth
er m
inin
gFa
bric
ated
met
al p
rodu
ct, m
achi
ne &
equ
ipm
ent r
epai
rC
ompr
ehen
sive
utiliz
atio
n of
reso
urce
was
teTo
bacc
o pr
oces
sing
Min
ing
auxi
liary
act
ivity
Gas
pro
duct
ion
& su
pply
Oth
er m
anuf
actu
ring
Wat
er p
rodu
ctio
n &
supp
lyC
hem
ical
fibe
rN
on fe
rrou
s m
etal
min
ing
& dr
essi
ngN
on m
etal
min
eral
min
ing
& dr
essin
gFe
rrou
s m
etal
min
ing
& dr
essi
ngPe
trole
um &
nat
ural
gas
acq
uisi
tion
Petro
leum
, cok
ing
& nu
clea
r fue
lPr
intin
g &
reco
rd m
ediu
m re
prod
uctio
nIn
stru
men
t & m
eter
Furn
iture
man
ufac
turin
gPa
per m
akin
g &
pape
r pro
duct
Woo
d pr
oces
sing
, woo
d, b
ambo
o, ra
ttan,
pal
m &
gra
ss p
rodu
ctR
ail,
ship
, airc
raft,
spa
cecr
aft &
oth
er tr
ansp
ort e
quip
men
tW
ine,
bev
erag
e &
refin
ed te
a m
anuf
actu
ring
Non
ferr
ous
met
al s
mel
ting
& p
ress
ing
Food
man
ufac
turin
gC
ultu
ral,
educ
atio
nal,
art,
craf
t, sp
ort &
recr
eatio
nal p
rodu
ctM
edica
l & p
harm
aceu
tical
pro
duct
Elec
tricit
y, h
eat p
rodu
ctio
n &
supp
lyLe
athe
r, fu
r, fe
athe
r & it
s pr
oduc
t & s
hoes
Rub
ber &
pla
stic
prod
uct
Ferr
ous
met
al s
mel
ting
& p
ress
ing
Spec
ial e
quip
men
tFa
bric
ated
met
al p
rodu
ctAg
ricul
tura
l & s
idel
ine
food
pro
cess
ing
Coa
l min
ing
& dr
essi
ngG
arm
ent &
app
arel
Text
ileG
ener
al e
quip
men
tAu
tom
obile
man
ufac
turin
gC
hem
ical
mat
eria
l & p
rodu
ctN
on m
etal
lic m
iner
al p
rodu
ctEl
ectri
cal m
achi
nery
& e
quip
men
tC
ompu
ter,
com
mun
icatio
n &
oth
er e
lect
roni
c eq
uipm
ent
Thou
sand
s of
per
sons
Sep-2016 Dec-2011 Dec-2006
Source: ESCAP, based on data from CEIC Data. Available from www.ceicdata.com (accessed 15 November 2016).
23 There were an estimated 270 million migrant workers in China in 2013, or a third of the total labour force, accounting for half of urban employment. These migrant flows are closely related to GDP growth and better reflect short-term dynamics in labour markets than do unemployment rates. See W. Raphael Lam, Xiaoguang Liu and Alfred Schipke, “China’s labor market in the ‘new normal’”, IMF Working Paper, No. WP/15/151 (Washington, D.C., International Monetary Fund, 2015). Available from www.imf.org/external/pubs/ft/wp/2015/wp15151.pdf.
24 The target for 2016 is 10 million. The target for 2016-2020 is to create more than 50 million new jobs in cities. 25 Labour productivity, defined as output per unit of labour input, only partially reflects the productivity of labour in terms of effort or capacities of
workers, and depends to a large degree on the presence of other inputs (particularly capital) among a host of other factors.

18
Economic and Social Survey of Asia and the Pacific 2016: Year-end Update
At the same time, creating more and better jobs would be impossible without continuous structural changes in the economy towards higher value-added activities (see figure 11).The development of a knowledge-based economy, technological innovations and the transition to a low-carbon economy are already bringing fundamental changes to many traditional occupations and employment relations while also creating new opportunities for business and jobs. In particular, low-skilled manual tasks, especially routine and non-cognitive tasks, are being automated through new technologies. The extent of potential job losses will vary depending on the current structure of production, policies and institutional frameworks, and could range from an estimated 27 per cent in Thailand to 5 per cent in India26 (see box 2).
Box2 The future of work
Historically, each new burst of technological progress has produced concerns about a possible displacement of labour. For instance, acknowledging key advances in the 1930s, such as the internal combustion engine, John Maynard Keynes predicted an increase in material prosperity but widespread “technological unemployment”.a Pessimistic predictions in the past, however, have not materialized. As technological progress accelerates, it tends to increase output demand and thus create new employment opportunities. The phenomenon has been visible in Asia and the Pacific where some countries, such as Japan and the Republic of Korea, have long been technological powers.
However, past patterns are not guaranteed to be repeated in the future, especially because technological innovation has intensified since the widespread expansion of the Internet. In China for instance, there has been spectacular growth since 2013 in technological innovation, with the country currently buying more industrial robots each year than any other country in the world.
In looking forward, it is likely that technological advances will create employment possibilities that are now difficult to envisage. On the negative side, some observers are also predicting a polarization of the job market between low- and high-skilled jobs.
Whether production is to be replaced by machines depends on the nature of the specific tasks to be performed, as not all tasks are equally at risk of being executed by machines. Manual jobs are indeed disappearing in some countries, while non-routine jobs that require a high level of creativity are not. For instance, the replacement of manual workers is being witnessed as part of China’s transformation: in a sink factory in Guangdong that started buying robots 4 years ago, “9 robots now do the work of 140 workers”, according to a newspaper article, which quoted the firm’s deputy manager as saying, “machines are cheaper, more precise and more reliable than people”.b By the end of 2016, China is expected to overtake Japan to become the world’s largest operator of industrial robots. Estimates of potential job losses in other countries range from 5 per cent in India to 23 per cent in Fiji and 27 per cent in Thailand. Concern is growing as tasks of a relatively higher cognitive nature are starting to be replaced by machines as well; for instance, driverless cars may affect the job prospects of many taxi drivers in the future.
Lower demand for unskilled jobs may lead to fewer unskilled jobs and/or lower wages in those jobs. On both accounts, such a situation exacerbates inequality between high- and low-skill jobs, and the pressure will be higher if the supply of unskilled labour grows quickly, which is common in developing countries with high population growth rates. Inequality has been rising in Asia and the Pacific since the 1990s, although technology is probably not the only reason for this phenomenon; shortages of skilled labour are widely cited by employers as a major constraint. If such issues are not addressed, however, the risks of social and political instability may increase.
Inequality effects can and should be addressed through active labour market policies. For instance, China is improving labour mobility through the hukou household registration system. Appropriate social protection schemes will also need to be guaranteed, and in this regard fiscal space is vital. At the same time, the
26 However, the speed of adoption will be governed by relative prices, making, for instance, investment in labour-saving robotics in manufacturing more economical in some settings than in others. See International Labour Organization, Building an Inclusive Future with Decent Work: Towards Sustainable Development in Asia and the Pacific − report of the Director-General, 16th Asia and the Pacific Regional Meeting, Bali, Indonesia, 6-9 December 2016. Available from www.ilo.org/global/meetings-and-events/regional-meetings/asia/aprm-16/WCMS_531409/lang--en/index.htm.

Economic and Social Survey of Asia and the Pacific 2016: Year-end Update
19
tax burden should shift away from labour income towards the owners of productive capital and wealthy individuals. Such revenues may then be used to strengthen social protection. Fiscal transfers, however, are not the only policy tool, especially in the medium to long term. Higher public spending on education can increase the supply of highly skilled individuals, as well as the demand for them in the job market. Furthermore, regulation can stimulate higher competition for productive capital so that the productivity gains derived from technological progress would be passed on to society as cheaper goods and services.
The international dimension must also be factored into the equation because negative effects on one country may have positive repercussions for others. For instance, along with growth in salaries in China, the transformation of the country’s industrial sector towards higher innovative activities is incentivizing the relocation of firms to neighbouring countries, such as Viet Nam. This situation supports a sort of ”catch-up effect”: as poorer countries have lower levels of mechanization, incoming cheaper technology and know-how from neighbouring countries that have already climbed up the ladder provide valuable opportunities for leap-frogging the normal development process. ___________________
a John Maynard Keynes, “Economic possibilities for our grandchildren” (1930), in Essays in Persuasion, New York: W.W. Norton & Co., 1963, pp. 358-373.
b Ben Bland, “China’s robot revolution”, Financial Times, 6 June 2016. Available from www.ft.com/content/1dbd8c60-0cc6-11e6-ad80-67655613c2d6.
As “creative destruction” of jobs takes place, it will be important that workers are equipped with the correct skills and are protected from disruptive impacts. Technical vocational education and training (TVET) should be strengthened, and more science, technology, engineering and mathematics (STEM) graduates are needed than are now available. Otherwise, there is a risk of ending up with a lot of displaced workers, long-term unemployment and people being trapped or pushed back into low-productivity and vulnerable employment, as witnessed today.27
Additionally, social protection has to be strengthened. A robust system of social protection not only fulfils people’s basic rights, it also establishes a firm platform for both social and economic development and provides an automatic stabilizer for vulnerable groups affected by volatility in economic circumstances.28
It is an investment in human capabilities to remove people from situations where they are excluded and living in poverty and to build their resilience to risks and vulnerabilities. Moreover, country experiences suggest that social protection could also contribute to long-term economic growth by strengthening domestic demand and facilitating skills development, employment and labour mobility.29
While social protection expenditures in the region have been generally on the rise (see figure 12), such spending remains relatively low at an average of 5.3 per cent of GDP compared with the global average of 8.6 per cent.30 Only 17 per cent of the labour force in the region is potentially eligible to receive unemployment benefits. To enhance social protection, several challenges need to be addressed, including the poor coverage of the informal sector, fragmentation of existing schemes and inadequate financing. Social insurance and assistance schemes could be more effectively linked with active labour market programmes, such as public works and training. Such measures would also help mitigate the impact of economic downturns on employment.31
27 ILO has projected that the vulnerable employment rate will decline only slowly in the next 15 years, from 74 to 66 per cent in South Asia and from 56 to 49 per cent in South-East Asia.
28 For details, see United Nations, Economic and Social Commission for Asia and the Pacific, The Promise of Protection: Social Protection and Development in Asia and the Pacific (Sales No. E.11.II.F.5).
29 For further information, see United Nations, Economic and Social Commission for Asia and the Pacific, Time for Equality: The Role of Social Protection in Reducing Inequalities in Asia and the Pacific (ST/ESCAP/2735). Available from www.unescap.org/resources/time-equality-role-social-protection-reducing-inequalities-asia-and-pacific.
30 See International Labour Office, World Social Protection Report 2014/15: Building Economic Recovery, Inclusive Development and Social Justice (Geneva, 2014). Available from www.ilo.org/global/research/global-reports/world-social-security-report/2014/lang--en/index.htm.
31 For instance, the report shows that, in advanced economies, tax-based fiscal expansions of 1 per cent of GDP are associated with a significant positive effect on the jobs of 1.5 per cent of the working-age population in a two-year period in normal times. In protracted recessions, the expenditure-based fiscal expansion is more effective, and an expenditure increase by 1 per cent of GDP is associated with an employment increase by 1 per cent of the working-age population in a two-year period. See IMF, Fiscal Monitor—Back to Work: How Fiscal Policy Can Help (Washington D.C., October 2014). Available from https://www.imf.org/external/pubs/ft/fm/2014/02/pdf/fm1402.pdf.
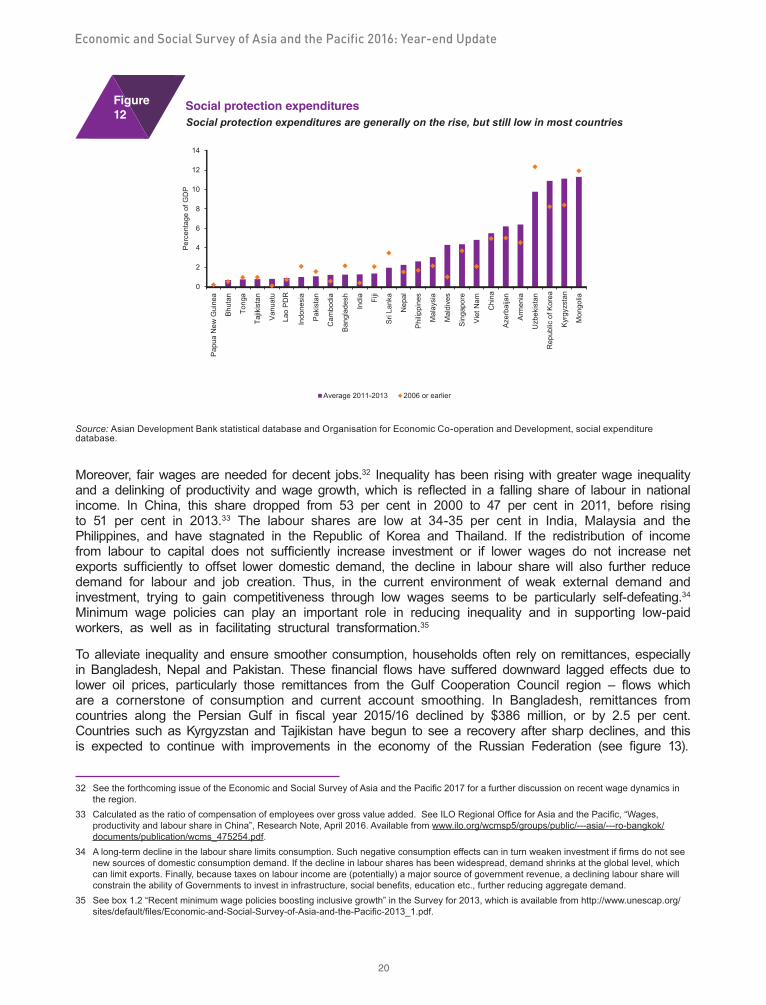
20
Economic and Social Survey of Asia and the Pacific 2016: Year-end Update
Figure12
Social protection expenditures Social protection expenditures are generally on the rise, but still low in most countries
0
2
4
6
8
10
12
14
Pap
ua N
ew G
uine
a
Bhu
tan
Tong
a
Tajik
ista
n
Van
uatu
Lao
PD
R
Indo
nesi
a
Pak
ista
n
Cam
bodi
a
Ban
glad
esh
Indi
a
Fiji
Sri
Lank
a
Nep
al
Phi
lippi
nes
Mal
aysi
a
Mal
dive
s
Sin
gapo
re
Vie
t Nam
Chi
na
Aze
rbai
jan
Arm
enia
Uzb
ekis
tan
Rep
ublic
of K
orea
Kyr
gyzs
tan
Mon
golia
Perc
enta
ge o
f GD
P
Average 2011-2013 2006 or earlier
Source: Asian Development Bank statistical database and Organisation for Economic Co-operation and Development, social expenditure database.
Moreover, fair wages are needed for decent jobs.32 Inequality has been rising with greater wage inequality and a delinking of productivity and wage growth, which is reflected in a falling share of labour in national income. In China, this share dropped from 53 per cent in 2000 to 47 per cent in 2011, before rising to 51 per cent in 2013.33 The labour shares are low at 34-35 per cent in India, Malaysia and the Philippines, and have stagnated in the Republic of Korea and Thailand. If the redistribution of income from labour to capital does not sufficiently increase investment or if lower wages do not increase net exports sufficiently to offset lower domestic demand, the decline in labour share will also further reduce demand for labour and job creation. Thus, in the current environment of weak external demand and investment, trying to gain competitiveness through low wages seems to be particularly self-defeating.34 Minimum wage policies can play an important role in reducing inequality and in supporting low-paid workers, as well as in facilitating structural transformation.35
To alleviate inequality and ensure smoother consumption, households often rely on remittances, especially in Bangladesh, Nepal and Pakistan. These financial flows have suffered downward lagged effects due to lower oil prices, particularly those remittances from the Gulf Cooperation Council region – flows which are a cornerstone of consumption and current account smoothing. In Bangladesh, remittances from countries along the Persian Gulf in fiscal year 2015/16 declined by $386 million, or by 2.5 per cent. Countries such as Kyrgyzstan and Tajikistan have begun to see a recovery after sharp declines, and this is expected to continue with improvements in the economy of the Russian Federation (see figure 13).
32 See the forthcoming issue of the Economic and Social Survey of Asia and the Pacific 2017 for a further discussion on recent wage dynamics in the region.
33 Calculated as the ratio of compensation of employees over gross value added. See ILO Regional Office for Asia and the Pacific, “Wages, productivity and labour share in China”, Research Note, April 2016. Available from www.ilo.org/wcmsp5/groups/public/---asia/---ro-bangkok/documents/publication/wcms_475254.pdf.
34 A long-term decline in the labour share limits consumption. Such negative consumption effects can in turn weaken investment if firms do not see new sources of domestic consumption demand. If the decline in labour shares has been widespread, demand shrinks at the global level, which can limit exports. Finally, because taxes on labour income are (potentially) a major source of government revenue, a declining labour share will constrain the ability of Governments to invest in infrastructure, social benefits, education etc., further reducing aggregate demand.
35 See box 1.2 “Recent minimum wage policies boosting inclusive growth” in the Survey for 2013, which is available from http://www.unescap.org/sites/default/files/Economic-and-Social-Survey-of-Asia-and-the-Pacific-2013_1.pdf.

Economic and Social Survey of Asia and the Pacific 2016: Year-end Update
21
Figure13
Remittance inflowsRemittance inflows have been weak, given economic challenges in destination countries
-80
-60
-40
-20
0
20
40
60
80
100
Mar
-200
8Ju
l-200
8No
v-20
08M
ar-2
009
Jul-2
009
Nov-
2009
Mar
-201
0Ju
l-201
0No
v-20
10M
ar-2
011
Jul-2
011
Nov-
2011
Mar
-201
2Ju
l-201
2No
v-20
12M
ar-2
013
Jul-2
013
Nov-
2013
Mar
-201
4Ju
l-201
4No
v-20
14M
ar-2
015
Jul-2
015
Nov-
2015
Mar
-201
6
Perc
enta
ge
Bangladesh India Nepal Pakistan
Philippines Sri Lanka Viet Nam
-80
-60
-40
-20
0
20
40
60
80
100
Mar
-200
8Ju
l-200
8No
v-20
08M
ar-2
009
Jul-2
009
Nov-
2009
Mar
-201
0Ju
l-201
0No
v-20
10M
ar-2
011
Jul-2
011
Nov-
2011
Mar
-201
2Ju
l-201
2No
v-20
12M
ar-2
013
Jul-2
013
Nov-
2013
Mar
-201
4Ju
l-201
4No
v-20
14M
ar-2
015
Jul-2
015
Nov-
2015
Mar
-201
6
Perc
enta
ge
Georgia Kyrgyzstan Tajikistan
Sources: World Bank migrant and remittances data and CEIC Data.Available from www.ceicdata.com (accessed 15 November 2016).
3. Benign inflationary pressures have allowed for accommodative monetary stances
Inflation and commodity prices
Inflation in developing Asia-Pacific economies is projected to remain low at 3.4 per cent in 2017, compared with an estimate of 3.5 per cent in 2016. However, if North and Central Asian economies are excluded, the region’s average inflation is projected to rise modestly to 3.1 per cent in 2017, compared with an estimate of 3.0 per cent in 2016, which is in line with the partial recovery in global oil prices. This regional context reflects the low prices for international commodities, weak demand and some industrial slack, especially in China. In most countries, inflation has been low since early 2015, although 2016 has brought about some spikes (see figure 14). For instance, inflation surged in Kazakhstan after the country abandoned its exchange rate peg, and in Azerbaijan after it devalued its currency. Other episodes of price acceleration took place in Cambodia, Nepal, Sri Lanka and Viet Nam.
Conversely, in 2016 countries with relatively high inflation have undergone corrections towards stability, especially in North and Central Asia. These improvements had been preceded by the exchange rate depreciation associated with the 2014 oil price slump which led to considerable inflationary hikes among energy exporters, such as Mongolia and the Russian Federation. Other large downward shifts occurred in Armenia, Indonesia and Kyrgyzstan, while in other economies conditions remained much calmer. For instance, in China and Pakistan inflation has been quite stable at between 2 and 4 per cent, while in India it hovered around 5 per cent. Finally, Japan, the Republic of Korea and Thailand are in deflationary territory or very close to it.

22
Economic and Social Survey of Asia and the Pacific 2016: Year-end Update
Figure14
Consumer price inflation
Consumer price inflation remains low in most countries despite some increase in line with global oil prices
-2
0
2
4
6
8
10
12
14
16
18
Rus
sian
Fed
erat
ion
Mya
nmar
Mon
golia
Kyr
gyzs
tan
Indo
nesi
a
Ban
glad
esh
Geo
rgia
Arm
enia
Japa
n
Nep
al
Turk
ey
Kaz
akhs
tan
Tajik
ista
n
Indi
a
Aze
rbai
jan
Pak
ista
n
Mal
aysi
a
Chi
na
Phi
lippi
nes
Lao
PD
R
Cam
bodi
a
Sri
Lank
a
Rep
ublic
of K
orea
Vie
t Nam
Thai
land
Cha
nge
in c
onsu
mer
pric
e in
flatio
n
2015 2016 Jan-Sep 2015 target 2016 target
Countries with accelerating inflationCountries with decelerating inflation
Source: ESCAP, based on data from CEIC Data. Available from www.ceicdata.com (accessed 15 November 2016). Note: Midpoint of target range for India (2-6% in 2016), Kazakhstan (8-10% in 2015, 6-8% in 2016), Kyrgyzstan (5-7% in 2016), Philippines (2-4% in 2015-16) and Thailand (1-4% in 2015-16). The upper limit for Sri Lanka.
High inflation in Azerbaijan and Kazakhstan is largely due to exchange rate adjustments
The recent evolution of inflation has followed a pattern similar to that of commodities. Following a sharp decline in 2014/15, the prices of key commodities, such as energy, food and metals, started to pick up slightly starting in the first quarter of 2016, partly due to China’s stimulus; a modest recovery is expected for 2017 (see figure 15). The recovery in commodity markets may be exemplified by the oil market. The 2014 slump was largely driven by an increase in supply,36
notably in shale oil, and accompanied by the decision of OPEC not to cut production. Recently, however, the context has changed. In September 2016, OPEC noted that global oil demand remained robust, and that due to the current low prices for oil, the prospects of future supply were being negatively affected by cuts in investment and significant layoffs. Hence, OPEC decided to accelerate reduction of the stock overhang and rebalance the market.
If executed as planned, the reduction in oil supply will lead to higher prices, which could have overall negative consequences for most of the economies in the region – higher costs of production will have a restraining effect on the supply side, which would lead to higher (cost-push) inflation. Since most of the Asia-Pacific economies are net importers of oil, this could lead to a pick up in inflation in the region. On the other hand, higher oil prices should alleviate the battered public finances of the region’s net oil exporters. The impact should be even more positive for non-OPEC oil exporters, such as Kazakhstan and the Russian Federation, because they are not formally bound to cut production. In the Islamic Republic of Iran (an OPEC member), the effect should be similar because it has claimed that after years of no production due to international sanctions, its production should not be cut.
36 See Rabah Arezki and Oliver Blanchard, “Seven questions about the recent oil price slump”, iMFdirect. Available from https://blog-imfdirect.imf.org/2014/12/22/seven-questions-about-the-recent-oil-price-slump/#roles.

Economic and Social Survey of Asia and the Pacific 2016: Year-end Update
23
Figure15
Indices of primary commodity prices (2010 = 100)Prices of key commodities stabilized in 2016 following a steady decline in 2014/15
40
50
60
70
80
90
100
110
120
130
140
Jan-
2014
Mar
-201
4
May
-201
4
Jul-2
014
Sep
-201
4
Nov
-201
4
Jan-
2015
Mar
-201
5
May
-201
5
Jul-2
015
Sep
-201
5
Nov
-201
5
Jan-
2016
Mar
-201
6
May
-201
6
Jul-2
016
Sep
-201
6
Pric
e in
dex
2010
=100
Energy Food Agricultural raw materials Metals
Source: ESCAP, based on data from CEIC Data. Available from www.ceicdata.com (accessed 15 November 2016).
Indirectly there may be other effects due to higher oil prices. For instance, the prospect of higher oil prices may contribute to the recovery of shelved investment projects, such as in Bangladesh, where deep sea oil exploration projects were cancelled due to very low oil prices. Higher oil prices reduce the incentive to use oil, which increases the attractiveness of renewable energies and therefore may revive investments in that sector. While higher investment is generally positive for employment, the impact in sectors with high capital intensity should be relatively moderate. Finally, higher inflation may also lead to the end of “quantitative easing” in Japan.
The evolution of inflation does not depend only on international commodity prices, as country-specific policies also play a role. For instance, in Viet Nam inflation has accelerated due to drought and higher fees charged by public hospitals and schools, while in Malaysia a higher excise tax on alcohol and tobacco, along with smaller rebates on electricity tariffs, have pushed prices up. Similarly, in the Republic of Korea, consumer inflation is set to increase to 1 per cent in 2016 from 0.7 per cent in 2015, while Thailand registered mild inflation in 2016 following deflation in 2015.
As countries’ idiosyncratic characteristics differ, not all of them are seeing higher growth in prices. Inflation in Indonesia is estimated to decline from 6.4 per cent in 2015 to 3.8 per cent in 2016 due to the reduction in administered fuel prices in April 2016 and the approval of major food imports. Improvements in monetary policy – in particular better anchoring of inflationary expectations – seem to have contributed to stable inflation in countries such as India, where the Reserve Bank of India made price stability a top priority and established a new rate-setting panel composed of six members.
Given the size of China’s economy, the country deserves special attention in one respect: the producer prices index has seen a 0.1 per cent year-on-year increase in the growth rate in September 2016. To the extent that China’s producer price index influences consumer prices in the rest of the world (see figure 16), slight revivals of inflation lurk ahead. However, given the current levels this should not be worrisome. Indeed in looking ahead, consumer inflation in China is estimated to increase from 1.4 per cent in 2015 to 2 per cent in 2016.

24
Economic and Social Survey of Asia and the Pacific 2016: Year-end Update
Figure16
Producer prices in China and global inflationChina’s Producer Prices Index and World’s Consumer Prices Index
0
1
2
3
4
5
6
92
94
96
98
100
102
104
106
108
Jan-
2010
Oct
-201
0
Jul-2
011
Apr
-201
2
Jan-
2013
Oct
-201
3
Jul-2
014
Apr
-201
5
Jan-
2016
Oct
-201
6
Per
cent
age
chan
ge
Pre
viou
s ye
ar =
100
PPI (Previous year = 100) Consumer price index (right-hand side)
Source: ESCAP, based on data from CEIC Data. Available from www.ceicdata.com (accessed 15 November 2016).
Monetary policy
The region’s slight recovery in prices has been enabled by accommodative monetary policy, as a number of central banks lowered policy interest rates at least once in 2016: in India, Indonesia, Malaysia, Pakistan, Philippines, Republic of Korea and Russian Federation. Policy rates are at historically low levels, and have fallen particularly sharply in China, India, Pakistan and Turkey (see figure 17). For instance, Indonesia lowered its policy rate six times in 2016, from 7.5 per cent in January to 4.75 per cent in October, and Bank Indonesia adopted the seven-day reverse repurchase rate as its new benchmark. Some countries also lowered bank reserve requirements, such as China and Indonesia (both in March) and Thailand (in June).
Not all countries follow the same pattern in monetary policy. The Russian Federation has lowered the policy rate this year but it is still high compared with early 2014 – before oil prices plunged. Sri Lanka is another exception, as policy rates were raised by 100 basis points in 2016 partly to curb rapid credit growth in the construction sector. In Japan, after years of quantitative easing, the Bank of Japan decided in September 2016 to shift the emphasis of its monetary policy and focus on the yield curve instead of the money supply – a move coming after doubts about the sustainability of its asset purchase programme (to the tune of 80 trillion yen annually), because the Bank now holds a third of all Japanese government bonds.
Pass-through from policy rate to credit and investment has been weak in India and Indonesia
Low inflation may provide reasons for further cuts in some countries, but the transmission of monetary policy in terms of supporting growth will not necessarily be proportional. Indeed, credit growth has been moderate in some countries, such as India, as commercial lending rates fell less than policy rates,
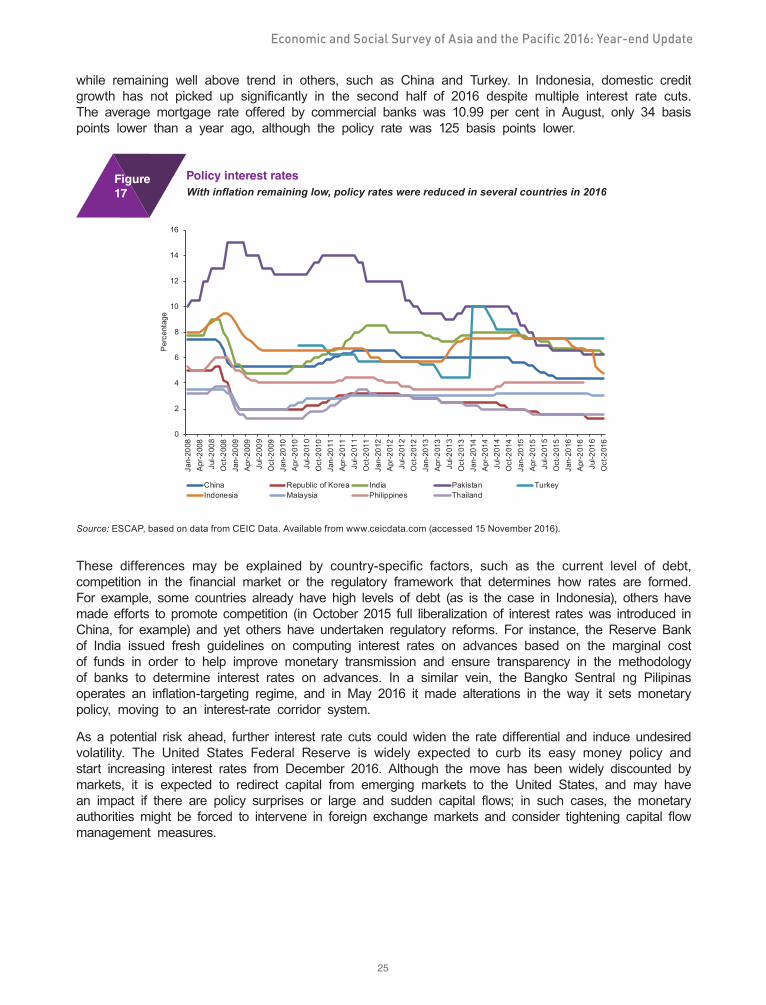
Economic and Social Survey of Asia and the Pacific 2016: Year-end Update
25
while remaining well above trend in others, such as China and Turkey. In Indonesia, domestic credit growth has not picked up significantly in the second half of 2016 despite multiple interest rate cuts. The average mortgage rate offered by commercial banks was 10.99 per cent in August, only 34 basis points lower than a year ago, although the policy rate was 125 basis points lower.
Figure17
Policy interest ratesWith inflation remaining low, policy rates were reduced in several countries in 2016
0
2
4
6
8
10
12
14
16
Jan-
2008
Apr
-200
8Ju
l-200
8O
ct-2
008
Jan-
2009
Apr
-200
9Ju
l-200
9O
ct-2
009
Jan-
2010
Apr
-201
0Ju
l-201
0O
ct-2
010
Jan-
2011
Apr
-201
1Ju
l-201
1O
ct-2
011
Jan-
2012
Apr
-201
2Ju
l-201
2O
ct-2
012
Jan-
2013
Apr
-201
3Ju
l-201
3O
ct-2
013
Jan-
2014
Apr
-201
4Ju
l-201
4O
ct-2
014
Jan-
2015
Apr
-201
5Ju
l-201
5O
ct-2
015
Jan-
2016
Apr
-201
6Ju
l-201
6O
ct-2
016
Per
cent
age
China Republic of Korea India Pakistan TurkeyIndonesia Malaysia Philippines Thailand
Source: ESCAP, based on data from CEIC Data. Available from www.ceicdata.com (accessed 15 November 2016).
These differences may be explained by country-specific factors, such as the current level of debt, competition in the financial market or the regulatory framework that determines how rates are formed. For example, some countries already have high levels of debt (as is the case in Indonesia), others have made efforts to promote competition (in October 2015 full liberalization of interest rates was introduced in China, for example) and yet others have undertaken regulatory reforms. For instance, the Reserve Bank of India issued fresh guidelines on computing interest rates on advances based on the marginal cost of funds in order to help improve monetary transmission and ensure transparency in the methodology of banks to determine interest rates on advances. In a similar vein, the Bangko Sentral ng Pilipinas operates an inflation-targeting regime, and in May 2016 it made alterations in the way it sets monetary policy, moving to an interest-rate corridor system.
As a potential risk ahead, further interest rate cuts could widen the rate differential and induce undesired volatility. The United States Federal Reserve is widely expected to curb its easy money policy and start increasing interest rates from December 2016. Although the move has been widely discounted by markets, it is expected to redirect capital from emerging markets to the United States, and may have an impact if there are policy surprises or large and sudden capital flows; in such cases, the monetary authorities might be forced to intervene in foreign exchange markets and consider tightening capital flow management measures.

26
Economic and Social Survey of Asia and the Pacific 2016: Year-end Update
4. Financial conditions are favourable, but private debt requires attention
In global foreign exchange markets, the dollar and the euro remained broadly unchanged in real effective terms in 2016, while the pound plunged after the United Kingdom’s referendum on Brexit. In the Asia-Pacific region, currencies have mostly stabilized after years of depreciation, with the notable exception of the renminbi, which depreciated against both the dollar and a basket of currencies (see figure 18).
Figure18
Local currency per United States dollar, and effective exchange ratesRegional currencies have been generally stable in 2016 after years of depreciation; a notable exception is the renminbi, which depreciated further against both the United States dollar and a basket of currencies
-10
-8
-6
-4
-2
0
2
4
6
per d
olla
r
NE
ER
RE
ER
per d
olla
r
NE
ER
RE
ER
per d
olla
r
NE
ER
RE
ER
per d
olla
r
NE
ER
RE
ER
China India Republic of Korea Philippines
Per
cent
age
chan
ge
-30
-25
-20
-15
-10
-5
0
5
10
15
20
25
per d
olla
r
NE
ER
RE
ER
per d
olla
r
NE
ER
RE
ER
per d
olla
r
NE
ER
RE
ER
per d
olla
r
NE
ER
RE
ER
per d
olla
r
NE
ER
RE
ER
Indonesia Malaysia RussianFederation
Thailand Turkey
2015 2016 Jan-Oct
Positive value represents appreciation of local currency1
2
3
4
5
6
7
8
9
10
11
12
13
13
Sources: ESCAP, based on data from Bank for International Settlements and CEIC Data. Available from www.ceicdata.com (accessed 15 November 2016). Note: NEER is the weighted average of a country’s currency relatively to an index or basket of currencies. The weights are determined by comparing the relative trade balance of a country’s currency against each country within the index. REER is NEER adjusted for inflation.
On average, major regional currencies gained 4.4 per cent against the United States dollar in the first eight months of 201637 compared with approximately 10 per cent declines in 201538, 201439 and 2013.40
The currencies of commodity exporters have generally stabilized as well. The most volatile of these was the Russian ruble, which has appreciated since January 2016 when it became clear that that country’s economy − highly dependent on energy resources for foreign exchange − would be more resilient to oil price reductions than originally expected owing, among other things, to its low level of debt.
Against this backdrop of relative calm in foreign exchange markets, the region has seen a number of policy developments. Notably, China’s authorities have made strides to revamp the foreign exchange mechanism towards making the renminbi more market oriented. Two milestones are noted in this regard. First, in September 2016 the People’s Bank of China designated an official renminbi clearing and settlement bank for New York, filling in a key gap in the network of offshore institutions that promote the use of the renminbi; and second, on 1 October 2016 the renminbi became part of the IMF’s reserve currency basket, alongside the dollar, euro, yen and pound.41 These efforts were devised to foster the use of the renminbi globally and address the weaker demand for it (for example, offshore deposits in the renminbi have decreased). Such weaker demand for the
37 Unweighted average for China, India, Indonesia, Malaysia, Philippines, Republic of Korea, Russian Federation, Turkey and Thailand. 38 2015 was marked by instability in financial markets rooted in doubts about China’s economy.39 The greatest source of instability during 2014 was the slump in oil markets.40 In 2013, instability stemmed from the “taper tantrum”, the reaction over uncertainty on the end of quantitative easing in the United States.41 For example, see Tom Mitchell, “China’s renminbi joins elite global reserve currency club”, Financial Times, 30 September 2016. Available from
www.ft.com/content/2baa6fec-86d2-11e6-bcfc-debbef66f80e.

Economic and Social Survey of Asia and the Pacific 2016: Year-end Update
27
renminbi can be explained by the Chinese economy’s structural rebalancing: as households get wealthier, their demand for assets in foreign currency, especially United States dollars, is increasing. The reasons include the renminbi’s depreciation, China’s domestic slowdown and diversification of assets, among others.42
Consistent with the overall stabilization of currencies in the region, capital inflows to developing economies have recovered after the sharp downturn in the second half of 2015 (see figure 19), partly because large interest rate differentials (in advanced economies compared with those in the region) have persisted for longer than initially expected. China was the greatest exception, and capital outflows pushed the country to defend its currency during 2015 and in early 2016, although the situation started to ease from March 2016 onwards (see figure 20).
Figure19
Net portfolio inflowsPortfolio flows to the region stabilized in 2016 after a downturn in 2015
-10 000
-5 000
5 000
10 000
15 000
20 000
25 000
30 000
35 000
Mar
-201
4
Jun-
2014
Sep
-201
4
Dec
-201
4
Mar
-201
5
Jun-
2015
Sep
-201
5
Dec
-201
5
Mar
-201
6
Jun-
2016
Milli
ons
of U
nite
d St
ates
dol
lars
Philippines Thailand Indonesia Republic of Korea India Total of five countries
Source: ESCAP, based on data from CEIC Data. Available from www.ceicdata.com (accessed 15 November 2016).
This context has favoured an average rise in foreign exchange reserves of 6.4 per cent across countries in the region – compared with declines in 2015 in China, Indonesia, Malaysia, the Russian Federation and Turkey (see figure 21). The pattern has strengthened a situation in which most countries have comfortable reserves overall. In September 2016, the average and median in terms of months of imports were 9.3 and 8.5 months, respectively. China and Japan have the highest amount of foreign exchange reserves – equivalent to 22.2 and 22.3 months, respectively. Australia and Viet Nam (both at 2.4 months) and Mongolia (3.6 months) have the lowest levels. The maturity of debt might be an issue in some cases, however. Some countries, such as Sri Lanka and Turkey, have sizeable short-term external debt, which exceeds the size of their foreign currency reserves.
42 See EM Squared, “China’s capital controls fail to curb outbound investment”, Financial Times, 11 August 2016.

28
Economic and Social Survey of Asia and the Pacific 2016: Year-end Update
Figure20
Net capital outflows and estimated foreign exchange purchases in ChinaIn China, capital outflows have eased, as have estimated foreign exchange purchases
-600
-400
-200
0
200
400
600
800
-200
-100
0
100
200
Mar
-201
2
Jun-
2012
Sep
-201
2
Dec
-201
2
Mar
-201
3
Jun-
2013
Sep
-201
3
Dec
-201
3
Mar
-201
4
Jun-
2014
Sep
-201
4
Dec
-201
4
Mar
-201
5
Jun-
2015
Sep
-201
5
Dec
-201
5
Mar
-201
6
Jun-
2016
Bill
ions
of U
nite
d S
tate
s do
llars
Bill
ions
of U
nite
d S
tate
s do
llars
Other investments Financial derivativesPortfolio investment Direct investmentEstimated net foreign exchange purchases (right-hand side)
renminbi purchases
Negative values represent net renminbi purchases
Source: ESCAP, based on data from Bank for International Settlements statistics. Available from www.bis.org/statistics; CEIC data. Available from www.ceicdata.com(accessed 15 November 2016).
Figure21
Foreign exchange reservesForeign exchange reserves were rebuilt in 2016 following depletion in previous years
-25
-20
-15
-10
-5
0
5
10
15
China India Indonesia Republic ofKorea
Malaysia Philippines RussianFederation
Thailand Turkey
Per
cent
age
chan
ge
2013 2014 2015 2016 year to date
Negative value represents depletion
Source: ESCAP, based on data from CEIC Data. Available from www.ceicdata.com (accessed 15 November 2016). Note: Percentage change between January and December of each year. For 2016, the data are for year to date.
Other financial markets have also shown a similar recovery in 2016. For instance, stock markets in the Asia-Pacific region have had a positive performance since January 2016 (see figure 22). Indices such as Kazakhstan’s KASE, the Russian Federation’s MICEX and Pakistan’s PSX exhibited the highest performance.

Economic and Social Survey of Asia and the Pacific 2016: Year-end Update
29
Figure22
Equity marketsEquity markets also stabilized in 2016, with the stock exchanges of Kazakhstan and the Russian Federation regaining some of their earlier losses
70
80
90
100
110
120
130
140
150
Jan-
2015
Feb-
2015
Mar
-201
5
Apr
-201
5
May
-201
5
Jun-
2015
Jul-2
015
Aug
-201
5
Sep
-201
5
Oct
-201
5
Nov
-201
5
Dec
-201
5
Jan-
2016
Feb-
2016
Mar
-201
6
Apr
-201
6
May
-201
6
Jun-
2016
Jul-2
016
Aug
-201
6
Sep
-201
6
Oct
-201
6
Inde
x 20
15=1
00
China Japan KazakhstanRussian Federation Bangladesh PakistanSri Lanka Turkey IndonesiaMalaysia Philippines Singapore
Source: ESCAP, based on data from CEIC Data. Available from www.ceicdata.com (accessed 15 November 2016).
Relatively lower volatility has also contributed to the positive performance of financial markets. While in 2015 and 2016 some episodes of high volatility were seen in markets, this may be understood in a global context. Advanced countries, especially in Europe, are still suffering from the effects of the 2008 global financial and economic crisis, and serious geopolitical and social concerns have emerged. At the same time, there are doubts over the economic performance of the so-called BRICS countries (Brazil, Russian Federation, India, China and South Africa). Thus, the reasons for financial market volatility were concerns over the oil market and doubts about the structural slowdown of the Chinese economy. Since January 2016, volatility that affected financial markets has been due to the decision by the United Kingdom to leave the European Union and to a lesser extent by the United States presidential election in November 2016 (see figure 23).
Figure23
CBOE Volatility IndexFinancial market volatility from ”Brexit” was relatively short-lived
10
11
12
13
14
15
16
17
18
19
20
21
22
23
24
25
Jan-
2013
Mar
-201
3
May
-201
3
Jul-2
013
Sep
-201
3
Nov
-201
3
Jan-
2014
Mar
-201
4
May
-201
4
Jul-2
014
Sep
-201
4
Nov
-201
4
Jan-
2015
Mar
-201
5
May
-201
5
Jul-2
015
Sep
-201
5
Nov
-201
5
Jan-
2016
Mar
-201
6
May
-201
6
Jul-2
016
Sep
-201
6
"Taper tantrum"a
Oil price slump
Chinese stock market crash
Devaluation of therenminbi
Concerns overthe Chinese
economy Brexit
Source: Chicago Board Options Exchange (CBOE). Available from www.cboe.com/micro/vix/vixintro.aspx. Note: a Refers to the negative reaction of investors to change in United States Federal Reserve’s move to reduce the pace of its asset purchases.

30
Economic and Social Survey of Asia and the Pacific 2016: Year-end Update
China to undergo major restructuring and deleveraging of its State-owned enterprises and banks
A potential source of renewed volatility in the near future may be worries about excessive indebtedness. China is the most important example of this phenomenon (see box 3), although it actually reflects a global pattern. Global total debt currently stands at record levels of $152 trillion or 225 per cent of global GDP.43 Furthermore, a specific vulnerability of debt accumulation is that, although issuance of local currency bonds has increased, considerable volumes of debt have been issued in hard currency, mostly United States dollars.44 In this form, investors bear both issuer credit and foreign exchange risk, with the consequent concern that interest rate hikes in the United States could spark a trend reversal.
Corporate debt in China
The economy of China is undergoing a long-term transformation that has put key industrial sectors, such as coal or steel, under stress. This situation has become a threat to the financial sector as banks’ profits are going down because they have to make provisions for losses. To revive the economy, public authorities have been undertaking large-scale stimuli, such as the evolution of the central bank’s standard lending facility (medium term), which shows a clear upward trend. As a result, debt has piled up, and the ratio of outstanding credit to GDP is the highest on record. However, not only is the level of credit very high relative to GDP, the credit-to-GDP gap (considered as the best short-term indicator for warning of potential financial crises ahead) has also reached all-time high levels and surpassed that of the United States before the 2007/08 financial crisis (figure A).a This situation has recently been the subject of several warnings.
China has had other episodes of high debt in the past which did not derail the country’s outstanding progress. For instance, in the 2000s some banks had to be bailed out.b Furthermore, the country’s reserves are very large relative to external debt, which isolates it from potential bumps ahead, such as when the United States Federal Reserve raises interest rates. However, the risks are still significant. The shadow banking sector has grown considerably and is much larger than it was in the 2000s, when lending in the Chinese economy was dominated by State-owned banks to State-owned enterprises.c This rise of shadow banks reduces traditional banks’ importance, and the central bank’s task of reining in banks’ risk becomes more complicated. For instance, more credit is flowing to households, especially in real estate, which increases the systemic character of a potential crisis. Moreover, as part of the Chinese economy’s rebalancing process, economic growth itself is considerably lower so the debt-to-GDP ratio will only decrease if debt grows less than GDP.
The key question is whether the current level of debt accumulation in China will inevitably lead to a crisis or to a so-called soft landing. A factor favouring the crash scenario may be the ongoing sluggish demand globally, which is prompting a quick evolution of the economy towards domestic consumption, away from investment and exports. Furthermore, commercial banks’ non-performing loan (NPL) provisions have decreased considerably since 2012. This measure ignores NPLs in the shadow banking sector, and there are widespread doubts about NPL data.d
There are also reasons for optimism though, as the Government of China has recognized the problem and is putting into place policies to prevent a debacle.e First, progress is being made in the development of new instruments and/or markets to promote securitization and risk sharing. For instance, there has been a takeoff in 2016 of some exchange-traded funds (ETFs), and in September it was revealed that China was going to launch a credit default swap (CDS) market. In a similar vein, since 2015 banks have been forced to reflect more of their shadow loans on their balance sheets. Second, State-owned enterprises are increasingly restructuring their NPLs through several schemes. Loan-to-bond swaps involve reforming expensive high-cost short/medium-term debt to convert it into cheaper longer-term debt. A different alternative involves debt-for-equity swaps, where the loan is reconverted as equity so the creditor bank becomes a stockholder of the State-owned enterprise in distress.
These tools may help clean NPLs from banks’ balance sheets, but they are no panacea. While in the medium term a CDS market may have great potential for financial institutions to hedge positions, in the short term company defaults and downgrades are on the rise so adverse selection will likely burden CDS market development. Similarly, in debt-swap schemes the underlying risky asset (the struggling company) is passed on to the bank. The effect is a reshuffling of poor-quality assets around the economy, which contributes to systemic risk.
43 See IMF, Global Financial Stability Report: Fostering Stability in a Low-Growth, Low-Rate Era (Washington D.C., October 2016). Available from www.imf.org/external/pubs/ft/gfsr/2016/02/index.htm.
44 This is not the case in China, but it is in India. In 2015, the Reserve Bank of India issued a new framework allowing corporates to issue rupee-denominated “masala bonds” (or “plain vanilla bonds”) in overseas markets with a minimum maturity of five years with end-use restrictions. Accordingly, corporates are allowed to borrow up to $750 million under the automatic route and anything above that amount using the approval route, while overseas investors would be eligible to hedge their exposure in rupees through permitted derivative products of Indian banks.
Box3

Economic and Social Survey of Asia and the Pacific 2016: Year-end Update
31
To address these issues two interlinked elements should be added: risk sharing must be more widespread, such as with international investors. Indeed, the country has been working in this direction; for example, in September China relaxed quotas for qualified foreign institutions to invest in its stock market. However, the Chinese financial market is still relatively closed and more remains to be done to improve regulatory issues. Transparency is the key. Some Chinese data and opacity in companies’ decision-making raise doubts, which do not encourage more international investments.
In line with past policies, an additional tool is public stimuli. On the fiscal side, some industrial sectors under stress have started to benefit from large infrastructure projects, such as the “One Road One Belt” initiative. This approach helps alleviate the debt burden, but may also delay the inevitable. The least efficient State-owned enterprises have to disappear. Ongoing efforts to achieve this outcome also involve mergers and acquisitions. On the monetary front, short-term public stimuli have decreased in the last few years, but higher interest rates would discourage more debt accumulation – although possibly at the risk of not meeting growth targets.
Finally, some “zombie entities” – State-owned enterprises too weak to survive − are losing favour. Ultimately it is crucial to strike the right balance between supporting troubled State-owned enterprises and letting some disappear. According to some analysts, Chinese authorities seem to have strategic guidelines to let zombie entities go. The most likely are loss-making, highly indebted companies that generate little revenue and are owned by lower-tier governments.f
What seems likely, should the current debt accumulation lead to a crisis in the short run, is that such a crisis would be a systemic one because the Chinese financial sector has grown increasingly interconnected (figure B), and it has a strong shadow banking sector, with debts growing in households as well. An indicator to follow closely may be overnight interbank rates, as they reflect the cost of short-term bank liquidity and gauge the pulse of the financial sector. Currently, those rates reflect calm, but history has shown that nervousness in financial markets can quickly build up.
Sources: Bank for International Settlements statistics. Available from www.bis.org/statistics; CEIC data. Available from www.ceicdata.com (accessed 15 November 2016).
Note: Credit-to-GDP gaps is defined as the difference between the credit-to-GDP ratio and its long-term trend; in percentage points. Long-term trend is calculated using a one-sided Hodrick-Prescott filter with a smoothing parameter of 400,000.
__________________________a As a noteworthy difference, the United States subprime mortgage crisis involved mostly household debt, and the correction was
via housing prices. The credit-to-GDP ratio is the ratio of a country’s outstanding credit volume to its gross domestic product. The credit-to-GDP gap is the difference between the credit-to-GDP ratio and its long-run trend.
b In 1999, the Ministry of Finance injected 400 billion yuan into the debt-to-equity swap pilot to bail out debt-ridden State-owned enterprises (SOEs). The total number of SOE employees has decreased steadily, from 103.5 million in 1990, to 62.1 million in 2015. However, the number of SOEs almost tripled between 2005 (13,856 companies) and 2014 (40,291 companies).
c Estimates of the size of China’s shadow banking sector range from 8 to 80 per cent of the country’s GDP, which is low compared with that of advanced economies; for example, in the United States, the figure is 150 per cent. For details, see Douglas J. Elliot, Arthur R. Kroeber and Yu Qiao, “Shadow banking in China: a primer”, Economic Studies at Brookings (Washington, D.C., Brookings Institution, March 2015).
d The official figure was 1.9 per cent in 2015, according to CEIC Data, but unofficial figures go as high as 21 per cent. For details, see ww.telegraph.co.uk/business/2016/09/22/fitch-warns-bad-debts-in-china-are-ten-times-official-claims-sta/.
e State Council of the People’s Republic of China. For further information, see http://english.gov.cn/policies/latest_releases/2016/10/10/content_281475462906227.htm.
f See James Kynge, EM Squared,“Who’s next? The science of Chinese corporate defaults”, Financial Times, 19 September 2016.
-60
-40
-20
0
20
40
60
Dec
-199
5Se
p-19
96Ju
n-19
97M
ar-1
998
Dec
-199
8Se
p-19
99Ju
n-20
00M
ar-2
001
Dec
-200
1Se
p-20
02Ju
n-20
03M
ar-2
004
Dec
-200
4Se
p-20
05Ju
n-20
06M
ar-2
007
Dec
-200
7Se
p-20
08Ju
n-20
09M
ar-2
010
Dec
-201
0Se
p-20
11Ju
n-20
12M
ar-2
013
Dec
-201
3Se
p-20
14Ju
n-20
15M
ar-2
016
Perc
enta
ge of
GD
P
Figure A. Credit-to-GDP gap
United StatesChinaSpain
-100,000
0
100,000
200,000
300,000
400,000
500,000
600,000
700,000
Sep-
2000
May
-200
1Ja
n-20
02Se
p-20
02M
ay-2
003
Jan-
2004
Sep-
2004
May
-200
5Ja
n-20
06Se
p-20
06M
ay-2
007
Jan-
2008
Sep-
2008
May
-200
9Ja
n-20
10Se
p-20
10M
ay-2
011
Jan-
2012
Sep-
2012
May
-201
3Ja
n-20
14Se
p-20
14M
ay-2
015
Jan-
2016
Sep-
2016
Milli
ons o
f ren
min
bi
Figure B. Turnover interbank loan total

32
Economic and Social Survey of Asia and the Pacific 2016: Year-end Update
Nonetheless, from mid to late 2014 a deleveraging process had been under way, which has recently made net bond issuance in emerging markets negative, that is, the payment of principal and interest has overtaken the issuance of new debt. Indeed, as has been the case with advanced economies which have been deleveraging since the onset of the global financial crisis in 2008, less debt is being issued in emerging markets along with buybacks to pay off existing debt. Such economies as Hong Kong, China; Singapore; and Turkey have seen the most significant reductions, whereas others, such as Indonesia, Malaysia and Thailand, have seen large increases and/or continue to have historically large leverage levels.
A key reason for private debt accumulation in emerging markets has been the quantitative easing schemes in advanced countries, which have flooded markets with liquidity and pushed down bond yields. A large stock of advanced economy sovereign bonds is now trading at negative yields, which means that borrowers are actually paid for investing. As such schemes in developed markets have squeezed yields, financial intermediaries in developed countries struggle to achieve returns similar to those in the past. This has pushed them to look for more profitable opportunities. Thus, demand for emerging market debt, which offers higher yields, has been on the rise; the total return of this asset class in 2016 has been 10.9 per cent.45 As a result of strong demand for emerging market debt and the weaker supply of it, prices have risen, yields have shrunk and debt sales have increased.
Policymakers in the Asia-Pacific region are aware of debt excesses and have started to take remedial policy measures, including macroprudential measures, for better monitoring and assessment of risk in the financial sector. For instance, India has been conducting asset quality reviews of banks since 2015. However, while macroprudential frameworks have been improved, sometimes measures were relaxed to support growth. For instance, in the Republic of Korea the financial regulator raised the leverage cap and allowed for a lower bank levy in cases of sudden capital outflows. The Government of the Republic of Korea implemented a loan conversion programme in 2015, but the household debt level continued to rise afterwards. Similarly, amid concerns over subdued credit growth and investment, the Reserve Bank of India eased pressure on lenders to set aside cash for possible defaults.
India’s Government and the Reserve Bank of India are addressing NPLs through various restructuring mechanisms, which has led to the recognition of NPLs and enhanced provisioning. According to the Reserve Bank of India, NPLs in the country’s banking system increased from $121 billion in December 2015 to $138 billion in June 2016, standing at 11.3 per cent of total loans at public sector banks in June 2016. State banks accounted for 88 per cent of the stressed loans, or more than $138 billion, in June 2016. The Reserve Bank of India has given banks a deadline (March 2017) to make provisions for bad loans.
As a third example of regulation to curb debt, local banks in Indonesia are struggling with low demand and deteriorating loan quality. To foster its banks’ solvency, Indonesia’s Financial Services Authority requires a higher amount of cash reserves to cover for rising NPLs, which is denting banks’ profits. As a result, credit growth in 2016 is projected at 6-7 per cent − until August it was 6.8 per cent − compared with earlier growth of 10-12 per cent.
After NPLs have surfaced, restructuring and/or liquidation may be necessary: as in China, the Reserve Bank of India allows banks to undertake “strategic debt restructuring” by swapping loans for equity for clients who fail to ensure viability. Furthermore, the amendments made in the asset recovery laws, including the legislation of the 2016 Bankruptcy Code, provide a legal basis for the recovery of bad debts and allow for speedier resolution.46 There are ongoing efforts to restructure the balance sheets of India’s nearly two dozen public sector banks. For capital injections, the Government has budgeted 700 billion rupees ($10.5 billion) until March 2019, signaling additional capital injections as a possibility.47
45 Source: Credit-to-GDP gaps data, updated 18 September 2016. Bank of International Settlements.46 Statement made by Mr. Arun Jaitley, Minister of Finance of India, to the International Monetary and Financial Committee on 8 October 2016.
Available from www.imf.org/External/AM/2016/imfc/statement/eng/ind.pdf.47 See Manoj Kumar, "Funding to shore up Indian banks constrained by budgets: Arun Jaitley", Reuters, 16 September 2016. Available from http://
in.reuters.com/article/india-banks-idINKCN11M0NO

Economic and Social Survey of Asia and the Pacific 2016: Year-end Update
33
5. Expansionary fiscal policy and reforms are supporting development efforts
Fiscal stance and space
Fiscal policy has been generally countercyclical and expansionary in recent years. This trend was largely maintained in 2016, with fiscal policy playing a growing role in not only stabilizing the economy but also supporting long-term national development priorities.
Governments should make the most out of low borrowing costs and benign inflationary pressures
Most countries, including China, Indonesia, the Republic of Korea and the Russian Federation, had wider fiscal deficits (or narrower surpluses) and slower economic growth in the period 2014-2016 compared with the period 2011-2013, while India and Pakistan had higher economic growth and narrow fiscal deficits (see figure 24).
Figure24
Real GDP growth and primary fiscal balance, 2011-2013 versus 2014-2016Fiscal policy has been generally countercyclical and expansionary in recent years
Azerbaijan
Bangladesh
China
India
Indonesia
Kazakhstan
Republic of KoeaMalaysia
PakistanPapua New Guinea
Philippines
Russian Federation
Sri Lanka
Thailand
Turkey
Viet Nam
-5
-4
-3
-2
-1
0
1
2
-6 -4 -2 0 2 4 6 8 10 12
Rea
l GD
P g
row
th (p
erce
ntag
e po
ints
cha
nge)
Primary fiscal balance, percentage of GDP (percentage points change)
Lower growth
Widerdeficit
Source: ESCAP based on IMF Fiscal Monitor, October 2016. Available from www.imf.org/external/pubs/ft/fm/2016/02/fmindex.htm. Note: Primary fiscal balance = General government net borrowing or net lending, excluding interest payments on consolidated government liabilities. Three-year average for 2014-2016 is based on estimates.
Meanwhile, such countries as Bangladesh, the Philippines and Viet Nam kept an expansionary stance even with higher economic growth. Based on estimates for 2016, the change in the budget balance in the past year was driven more by the expenditure side in Azerbaijan, Cambodia, Mongolia, the Philippines and Sri Lanka, and by the revenue side in India, Nepal, Pakistan, the Republic of Korea and the Russian Federation. It was more balanced in China, Indonesia and Malaysia (see figure 25). The general government gross debt as a percentage of GDP has risen in most countries in recent years, with more than 20 percentage point increases since 2008 in Azerbaijan, China and Viet Nam, although Bangladesh, India, Nepal and the Philippines have seen moderate decreases (see figure 26).
While ensuring fiscal sustainability, there has to be greater emphasis on the quality and composition of public expenditures, rather than simply on aggregate budget deficits and public debts. ESCAP has been consistently advocating for a more development-oriented fiscal policy. For instance, its analysis on

34
Economic and Social Survey of Asia and the Pacific 2016: Year-end Update
the required public expenditures for an illustrative package of policies to promote inclusive and sustainable development shows that most countries in the region can finance such a package without jeopardizing their macroeconomic stability.48 It is encouraging that many countries are moving in this direction, expanding and exploiting their fiscal space in support of national development priorities.
Figure25
Change in primary fiscal balance, expenditures and revenues between 2015 and 2016Changes in the budget balance were driven more by the expenditure side in some countries and more by the revenue side in others
-4
-2
0
2
4
6
8
10
12M
ongo
lia
Kyr
gyzs
tan
Aze
rbai
jan
Tajik
ista
n
Cam
bodi
a
Turk
ey
Uzb
ekis
tan
Phi
lippi
nes
Thai
land
Vie
t Nam
Ban
glad
esh
New
Zea
land
Japa
n
Rus
sian
Fed
erat
ion
Mal
aysi
a
Sin
gapo
re
Chi
na
Lao
PD
R
Aus
tralia
Mya
nmar
Rep
ublic
of K
orea
Indi
a
Indo
nesi
a
Pak
ista
n
Pap
ua N
ew G
uine
a
Kaz
akhs
tan
Iran
(Isla
mic
Rep
ublic
of)
Sri
Lank
a
Nep
al
Per
cnet
age
of G
DP
(Per
cent
age
poin
ts c
hang
e)
Expenditure Revenue Primary balance
Positive value representshigher deficit/lower surplus, higher expenditures, and higher revenues
1
2
3
4
5
6
7
8
9
10
11
12
13
13Source: ESCAP based on IMF Fiscal Monitor, October 2016. Available from www.imf.org/external/pubs/ft/fm/2016/02/fmindex.htm.
Figure26
General government gross debt, current level and change since 2008Increases in the government debt-to-GDP ratio occurred in most countries, but levels remain manageable
-100
-50
0
50
100
150
200
250
300
-20
-10
0
10
20
30
40
50
60
Japa
n
Aze
rbai
jan
Aus
tralia
Kyr
gyzs
tan
Vie
t Nam
Chi
na
Tajik
ista
n
Mal
aysi
a
Kaz
akhs
tan
New
Zea
land
Pap
ua N
ew G
uine
a
Sin
gapo
re
Rep
ublic
of K
orea
Rus
sian
Fed
erat
ion
Pak
ista
n
Thai
land
Iran
(Isla
mic
Rep
ublic
of)
Cam
bodi
a
Uzb
ekis
tan
Lao
PD
R
Indo
nesi
a
Sri
Lank
a
Indi
a
Ban
glad
esh
Turk
ey
Phi
lippi
nes
Nep
al
Mya
nmar
Per
cent
age
of G
DP
Per
cent
age
poin
ts
2016 in respect to 2012 2012 with regard to 2008 General government debt in 2016 (right-hand side)
Sources: ESCAP based on IMF Fiscal Monitor, October 2016. Available from www.imf.org/external/pubs/ft/fm/2016/02/fmindex.htm.
48 The illustrative package includes the provision of an employment guarantee for 100 days a year, basic social services in education and health, income security for older persons and persons with disabilities and ensuring efficient energy for all. See United Nations, Economic and Social Commission for Asia and the Pacific, Economic and Social Survey of Asia and the Pacific 2013: Forward-looking Macroeconomic Policies for Inclusive and Sustainable Development (Sales No. E.13.II.F.2). Available from www.unescap.org/sites/default/files/Economic-and-Social-Survey-of-Asia-and-the-Pacific-2013_1.pdf.
Economic and Social Survey of Asia and the Pacific 2016: Year-end Update
35
Highlights of national budgets
In China, which embarked on a new five-year plan in 2016, the national budget is aimed at supporting the building of “a moderately prosperous society in all respects”. Funding in the areas of education, science and technology, health care, poverty alleviation, social security and employment continued to be strong. To increase spending efficiency, the number of special transfer payments was reduced, and infrastructure investment by the central Government was refocused on basic public welfare projects instead of on smaller projects. With tax revenues growing at a slow pace, the budget deficit was expected to increase from 2.4 per cent of GDP in 2015 to 3 per cent in 2016.49,50 In the Republic of Korea, the 2017 budget is focused on job creation and economic recovery and contains large increases for health, welfare and labour. Mongolia is undergoing severe budget adjustments due to sharp declines in resource revenues.
Biometric identity will support India’s direct benefit transfers and reduce leakages
In India, the national budget for the current fiscal year ending March 2017 is focused on enhancing expenditure in priority areas of the farm and rural sector, social sector, infrastructure sector, employment generation and recapitalization of banks. Notably, in a step towards universal health coverage, the budget contains a health insurance scheme which protects one third of the population against hospitalization expenditure.51 The Government is pursuing a fiscal consolidation target of a 3.5 per cent fiscal deficit by improving spending efficiency, tax revenue mobilization and effective targeting of subsidies. For instance, the use of biometric-based identity cards is expected to support direct benefit transfers and significant reduction in leakages from transfer of subsidy payments. In Pakistan, the national budget for the current fiscal year ending June 2017 contains additional tax breaks and extra subsidies and higher allocations for defence budget. The Government intends to push tax-to-GDP ratios over 10 per cent and bring the fiscal deficit to 3.8 per cent of GDP.52 In Bangladesh, the national budget for the current fiscal year ending June 2017 contains large increases for education and health, although much of it is driven by increased compensation for government employees.53
In Indonesia, the Government has been shifting subsidy spending to infrastructure and to the health and education sectors since 2015. However, revenue shortfalls resulted in downward revisions to the budget in 2016. In the light of this change, the 2017 budget is based on more realistic revenue and expenditure targets. Large increases have been made in social affairs, transportation, and public works and housing. Transfers to regions have edged up to 36 per cent of the total budget.54 In Thailand, many of the stimulus measures introduced in September 2015 were implemented through 2016, including tax incentives aimed at stimulating private investment and quasi-fiscal measures, such as subsidized loans for farmers and small and medium-sized enterprises. The 2017 budget contains strategies that will contribute towards enhanced competitiveness, while setting aside 20 per cent for investment.55,56 The
49 For details, see Government of China, “Report on the execution of the central and local budgets for 2015 and on the central and local draft budgets for 2016”, adopted by the National People’s Congress on 16 March 2016. Available from www.npc.gov.cn/englishnpc/Speeches/2016-03/23/content_1985907.htm.
50 The actual fiscal deficit is likely to be larger due to sizeable off-budget activities, which are only gradually being phased out. Unofficial estimates by IMF and others are closer to 10 per cent of GDP.
51 See Government of India, Ministry of Finance, “Union budget 2016-17”. Available from http://indiabudget.nic.in/budget.asp. 52 See Government of Pakistan, Ministry of Finance, “Federal budget publications 2016-17”. Available from www.finance.gov.pk/fb_2016_17.html. 53 See Government of Bangladesh, Ministry of Finance, “Budget in brief 2016-17”. Available from http://mof.gov.bd/en/index.php?option=com_
content&view=article&id=343&Itemid=1. 54 For further information, see Siwage Dharma Negara, “Indonesia’s 2017 budget seeks cautious economic expansion”, ISEAS Perspective,
September 2016. Available from www.iseas.edu.sg/images/pdf/ISEAS_Perspective_2016_51.pdf. 55 See Government of Thailand, Public Relations Department, “National budget for the 2017 fiscal year”. Available from http://thailand.prd.go.th/
ewt_news.php?nid=3382&filename=index.56 The 15 strategies for enhancing competitiveness include the following: developing target industries; promoting small and medium-sized
enterprises; integrating special economic zones; improving infrastructure and logistics; integrating the digital economy; promoting research and development; boosting tourism revenue; ensuring sustainable agriculture; and promoting innovation.
36
Economic and Social Survey of Asia and the Pacific 2016: Year-end Update
Philippines continues to use expansionary budgets on the back of strong tax revenues and reforms in public financial management.57 The 2017 budget under the country’s new administration contains large increases for police, education and infrastructure.58 In Malaysia, the national budget is aimed at supporting growth while narrowing the fiscal deficit. The 2017 budget further is aimed at addressing the rising cost of living and contains increased provisions for affordable housing.59
In the Russian Federation, the impact of lower oil prices on the national budget was somewhat mitigated in 2016 as the Government drew on past windfall savings. The national budget for 2017 and the associated medium-term expenditure framework for the period 2017-2019 is aimed at achieving fiscal consolidation mainly through expenditure cuts and some revenue mobilization efforts. The largest cuts are to occur in national defence, social policy and national security, while revenues would be mobilized predominantly from the transfer of dividends of State-controlled companies and increasing tax revenue from the energy sector.60 With revenues remaining subdued, Kazakhstan and Turkmenistan have tightened their fiscal policies, mainly by reducing capital spending. In Azerbaijan, public investment is projected to decline significantly in 2017, reversing the expansionary fiscal stance following the countercyclical stimulus package in 2016.61
For the 2016/17 financial year, the budget deficit of Fiji is 4.7 per cent of GDP, of which 2 per cent is being directed towards reconstruction associated with Cyclone Winston. The capital-to-operating expenditure mix has significantly increased in recent years, from 14 per cent in 2007 to 40 per cent in the latest budget.62 In Papua New Guinea, the 2017 budget shows revenue falling by 2 per cent and has forecast a spending cut of 3.5 per cent to compensate for the shortfall and to stop the deficit from growing. In particular, capital investment declined by 21 per cent compared with the previous budget. Tax collection will be strengthened, including through higher duties on alcohol and tobacco, a levy on diesel fuel and a passenger departure tax.63 National budgets in the Pacific island developing States are subject to several sources of volatility, including natural disasters and a narrow revenue base.
Time is right for infrastructure spending
In the current environment of weak external demand, weak private investment, low borrowing costs and benign inflationary pressures, public infrastructure outlays are deemed particularly effective in supporting demand and addressing structural bottlenecks, especially in countries with relatively low public debt (see figure 27). In fact, several countries are scaling up capital expenditures, including through debt financing or the sale of certain State assets, as well as the reallocation of expenditures and improved revenue collection. Aside from financing, some progress has been seen in project selection, management and implementation capacities.
57 See Government of the Philippines, Department of Budget and Management, “A story of budget and management reforms 2010-2016”. Available from www.dbm.gov.ph/?page_id=16070.
58 Compared with the previous fiscal year, the 2017 budget contains a 25 per cent increase for police and a 31 per cent increase for education, while infrastructure spending would rise to as much as 7 per cent of GDP.
59 Vacant government land will be provided to build affordable houses. Houses will be built to be rented out to youth at below-market rates. Stamp duty will be exempted for first-time buyers of affordable houses.
60 See World Bank, “Russia economic report”, November 2016. Available from http://pubdocs.worldbank.org/en/429441478647721427/Russia-RER-36-Eng.pdf.
61 See International Monetary Fund, “Regional economic outlook: Middle East and Central Asia”, October 2016. Available from www.imf.org/external/pubs/ft/reo/2016/mcd/eng/pdf/cca1016.pdf.
62 See Government of Fiji, Ministry of Economy, “2016 budget address”. Available from www.economy.gov.fj/s/government-budget.html. 63 See Government of Papua New Guinea, Department of Treasury, “National budget – 2017”. Available from www.treasury.gov.pg/html/national_
budget/2017.html

Economic and Social Survey of Asia and the Pacific 2016: Year-end Update
37
Figure27
10-year government bond yieldsGovernment bond yields generally declined in 2016; low borrowing costs, together with benign inflationary pressures, offer an opportunity to scale up public investments, which could be particularly stimulating for the economy in the current context of weak private investment
-1
1
3
5
7
9
11
13
15 J
an-2
014
Feb
-201
4
Mar
-201
4
Apr
-201
4
May
-201
4
Jun
-201
4
Jul
-201
4
Aug
-201
4
Sep
-201
4
Oct
-201
4
Nov
-201
4
Dec
-201
4
Jan
-201
5
Feb
-201
5
Mar
-201
5
Apr
-201
5
May
-201
5
Jun
-201
5
Jul
-201
5
Aug
-201
5
Sep
-201
5
Oct
-201
5
Nov
-201
5
Dec
-201
5
Jan
-201
6
Feb
-201
6
Mar
-201
6
Apr
-201
6
May
-201
6
Jun
-201
6
Jul
-201
6
Aug
-201
6
Sep
-201
6
Oct
-201
6
Per
cent
age
Bangladesh China Hong Kong, China IndiaIndonesia Japan Republic of Korea MalaysiaPhilippines Singapore Thailand Russian Federation
Source: ESCAP, based on data from CEIC Data. Available from www.ceicdata.com (accessed 15 November 2016).
Indonesia, the Philippines and Thailand are scaling up capital expenditures
Indonesia has set a target of about $480 billion in infrastructure investment during the period 2015-2019, which is equivalent to roughly 10 per cent of GDP per year, an amount that is significantly higher than past public investment (see figure 28). On funding sources, the public sector is expected to finance two thirds of the total investment, and the rest is to be done by the private sector.64 The Philippines is targeting infrastructure investment equivalent to 7 per cent of GDP in 2017 on the back of its recent success in attracting large-scale private participation in infrastructure.65 In Thailand, the multi-year transport infrastructure development plan for 2015-2022 contains projects worth 13 per cent of GDP. These include motorways and projects of mass rapid transportation in Bangkok and in the medium term, more complex intercity rail projects with longer preparation time. The public sector is expected to finance about 80 per cent of the total, largely through borrowing by State-owned enterprises with government guarantees; the rest is to be financed by the private sector.
In India, public investment has been constrained in the current fiscal year as the Government sought to meet the fiscal deficit target. Nevertheless, the National Investment and Infrastructure Fund commenced operations in October 2016 with an initial amount of $1 billion for the highway sector and another fund of the same size for the renewable energy industry. The objective is to attract long-term private financing from sovereign wealth funds and pension funds. For many South Asian countries, increasing the supply of electricity is a priority. Both Bangladesh and Pakistan have plans to significantly increase power-generation capacity by 2018.
64 About 30 per cent from the central Government, 11 per cent from local governments and 22 per cent from State-owned enterprises. 65 See World Bank, “2015 East Asia and Pacific PPI Update”. Available from https://ppi.worldbank.org/~/media/GIAWB/PPI/Documents/Data-Notes/
EAP-Update-2015.

38
Economic and Social Survey of Asia and the Pacific 2016: Year-end Update
Figure28
Public investment in 2000-2013, and infrastructure investment targetsSome countries are targeting much higher infrastructure investments than in the past
0
2
4
6
8
10
12
14
16
18
20
Phi
lippi
nes
Indo
nesi
a
Pak
ista
n
Rus
sian
Fed
erat
ion
Turk
ey Fiji
Thai
land
Indi
a
Vie
t Nam
Mal
aysi
a
Chi
na
Pub
lic in
vest
men
t (p
erce
ntag
e of
GD
P
Average annual public investment in the period 2000-2013
Annual infrastructure investment target for coming years
Source: ESCAP, based on national sources, and the IMF capital stock and investment dataset.
Economic and Social Survey of Asia and the Pacific 2016: Year-end Update
39
SELECTED MEDIUM-TERM PRIORITIES
In this issue of the Year-end Update, two selected medium-term priorities are examined for the Asia-Pacific region: the first, the role of progressive taxation in alleviating income inequality; and the second, the role of effective economic governance in fostering innovation, investment and inclusive development. In many respects, the issues of inequality and governance are at the heart of the 2030 Agenda for Sustainable Development; they are not only explicitly targeted under Sustainable Development Goals 10 and 16 respectively but are also cross-cutting across all 17 Goals. To put it differently, addressing inequality and improving governance are not only inherently important, but also instrumental in achieving other development goals and targets. For instance, widening inequality has negative implications for economic growth and macroeconomic stability and could become a barrier to broad-based productivity gains.
Addressing inequality of opportunity and outcome is already high on national agendas, with China calling for “harmonious growth”, India “inclusive growth” and Indonesia “growth with equity”. Public interventions to tackle inequality can take various forms, reflecting the various drivers of inequality. For instance, Goal 10 highlights the role of fiscal, wage and social protection policies, and appropriate financial regulation. The following section is focused on one particular channel, that is, progressive taxation, the significance of which is expected to increase as the region’s income and wealth continue to rise rapidly, albeit in an uneven manner.
Similarly, improving economic governance is also being given high priority in several economies. Many Governments are stepping up efforts to curb corruption, while improving the rule of law and regulatory quality. Importantly, government effectiveness is being enhanced through innovative measures, such as biometric identity and institutional reforms, such as gender budgeting. Such measures can help the Asia-Pacific region to make progress on the fronts of both productivity and inclusiveness. In the section below on governance, an effort is made to provide a preview of the theme of the forthcoming Survey for 2017.
1. Rising inequality can be alleviated through progressive taxation
Income inequality is estimated to have increased by 30 percent since 1990
After decades of remarkable economic growth which lifted millions out of extreme poverty, the Asia-Pacific region is now grappling with a widening gap between the “haves” and the “have-nots”. This section contains an examination of ways in which tax policy can help narrow this gap. It was found that the region could benefit from a more balanced tax mix, a more progressive income tax and greater use of wealth-related taxes. These discussions could be viewed in the light of recent global events, such as Brexit and the United States presidential election, which have highlighted, among other issues, that rapid economic growth and gains from globalization and technology have not been passed on sufficiently well to society, resulting in a rise in inequality of income, wealth and opportunities.

40
Economic and Social Survey of Asia and the Pacific 2016: Year-end Update
Between the early 1990s and 2014, Asia’s income inequality, as measured by the population-weighted Gini coefficient, increased by 4 percentage points, from 33.5 to 37.5.66 The actual increase in income inequality is likely to be higher because these estimates are based on household expenditure data rather than income data. In a recent study based on household income data, it was estimated that Asia’s population-weighted Gini coefficient increased by 11 percentage points, from 37 to 48, since early 1990s.67 The increase in inequality is also apparent from increases in the share of the richest quintile in national income, which increased along with declines of the shares of the three lowest quintiles (see figure 29, left panel).
At the same time, the region’s economic success has led to fast accumulation of private wealth, with a concentration at the top. The number of the region’s high net worth individuals increased from 3 million to 5 million between 2009 and 2015, and their total wealth almost doubled, reaching $17.4 trillion in 2015.68 In such countries as India, Indonesia, the Russian Federation and Thailand, the top 1 per cent of the population account for more than half of the total wealth pool (see figure 29, right panel).69
Figure29
Indicators of inequality of income and wealthHow unequal are countries in Asia and the Pacific?
-50
-40
-30
-20
-10
0
10
20
Bottom10%
Q1 Q2 Q3 Q4 Q5 Top 10%
Per
cent
age
Panel A. Growth of consumption share since early 1990s
Viet Nam (1992, 2012)
China (1993, 2010)
Sri Lanka (1995, 2012)
Lao PDR
Indonesia (1993, 2010)
Bangladesh (1991, 2010)
India (1993, 2011)-10
0
10
20
30
40
50
60
70
80
90
100
D1 D2 D3 D4 D5 D6 D7 D8 D9 D10 Top5%
Top1%
Wea
lth s
hare
(per
cent
age)
Panel B. Distribution of wealth in 2015
Republic of Korea China India Thailand Indonesia Russian Federation
Source: ESCAP, based on World Bank, World Development Indicators. Available from http://data.worldbank.org/data-catalog/world-development-indicators; The Standardized World Income Inequality Database. Available from http://fsolt.org/swiid/ version 5.1; and Credit Suisse, The Global Wealth Report 2015. Note: “Q” means quintiles and “D” means deciles.
66 See United Nations, Economic and Social Commission for Asia and the Pacific, Economic and Social Survey of Asia and the Pacific: Realizing Inclusive Growth (Sales No. E.15.II.F.7). Available from www.unescap.org/resources/economic-and-social-survey-asia-and-pacific-2015. See also United Nations, Economic and Social Commission for Asia and the Pacific, Time for Equality: The Role of Social Protection in Reducing Inequalities in Asia and the Pacific (ST/ESCAP/2735). Available from www.unescap.org/resources/time-equality-role-social-protection-reducing-inequalities-asia-and-pacific.
67 For details, see Sonali Jain-Chandra and others, “Sharing the growth dividend: analysis of inequality in Asia”, IMF Working Paper, No. WP/16/48 (Washington, D.C., 2016). Available from www.imf.org/external/pubs/ft/wp/2016/wp1648.pdf.
68 High net worth individuals are those with more than $1 million in net wealth based on the World Wealth Report. Available from www.worldwealthreport.com. Today the region not only has the largest population of such individuals and wealth pool in the world, but it is also exceeding North America and Europe in terms of the number of people on the Forbes’ billionaire list, with China, India and the Russian Federation all ranking among the top five in that list. Available from www.forbes.com/sites/forbespr/2016/03/01/forbes-30th-annual-worlds-billionaires-issue/#f7c728871a8c.
69 ESCAP calculation based on Credit Suisse, The Global Wealth Report 2015.

Economic and Social Survey of Asia and the Pacific 2016: Year-end Update
41
Excessive inequality in income and wealth undermines social cohesion, hurts long-term growth and reinforces inequality of opportunities. International evidence suggests that income and wealth inequality may have a tendency towards self-perpetuation if unchecked by public policies.70 The significant increase in inequality levels in the region’s largest developing countries and already high inequality levels in a number of others have triggered broad concern and social debate. Promoting inclusive development and containing excessive inequality have increasingly become a key priority of countries’ national development strategies.71
Implementing such strategies, however, could prove to be challenging. This is because technological progress, globalization and market-oriented reforms, which tend to favour skilled labour over unskilled labour, capital over labour and urban and coastal areas over rural and inland areas, all contribute to widening the gap between the poor and the rich, and are essential features of prevailing economic frameworks in most developing economies. Some adjustments through government intervention are therefore inevitable to strike a balance between the benefits of the current approach and its associated costs. Specifically, proactive policy measures will need to be taken by Governments in order to manage rising inequalities that accompany rapid economic growth and structural upgrading, and reverse the trends in the medium term.
Tax policies can help narrow the gap
The current tax mix is biased towards indirect taxes, which tend to be less progressive
Redistribution through taxes and transfers played an important role in developed countries throughout the twentieth century. Despite a decline in tax progressivity72 since the early 1980s, direct taxes, such as taxes on personal incomes and property, still account for more than half of total tax revenues in these countries. Such redistribution has not taken place in most Asian developing countries. This is partly due to their lower levels of tax collection and their heavier reliance on indirect taxes. Many countries in the region still suffer from extremely low levels of tax revenue. Bangladesh, Pakistan and Sri Lanka mobilize less than or barely 10 per cent of GDP in tax revenue, half of what other developing countries mobilize. Such low revenue is becoming a primary bottleneck for these countries to finance necessary investment in education, infrastructure, health care and social protection in order to achieve the Sustainable Development Goals. Strengthening tax revenue would be a key priority for these countries, as highlighted in previous ESCAP analysis.73
As a whole, the tax mix in the Asia-Pacific region is very biased towards indirect taxes compared with the situation in developed countries. Direct taxes account for only 37.6 per cent of the total tax revenue in the region, while for OECD countries 55.8 per cent is mobilized from direct taxes. Such a difference is not surprising because indirect taxes, such as VAT or excise tax, typically pose a smaller tax administrative challenge for developing countries compared with collecting direct taxes. Nevertheless, the outcome is considerably less desirable as indirect taxes tend to be much more regressive. A large presence of indirect taxes and a relatively small share of direct taxes could further aggravate an already high inequality problem, especially when pro-poor public spending in the region is already far from sufficient and optimum.74
70 See Thomas Piketty, Capital in the Twenty-First Century (Cambridge, Massachusetts, Harvard University Press, 2014).71 For instance, China’s 13th five-year plan (2016-2020) emphasizes a more balanced, inclusive and sustainable growth model, as do India’s 12th
five-year plan (2012-2017) and the Philippines Development Plan (2011-2016). 72 Tax progressivity measures the relative tax burden on the rich and the poor. A tax is “progressive” when richer individuals are subject to a higher
tax rate compared with poorer individuals. In this case, the tax redistributes income in favour of the poor. A tax is “regressive” if the opposite is true.
73 See United Nations, Economic and Social Commission for Asia and the Pacific, Economic and Social Survey of Asia and the Pacific: Domestic Resource Mobilization (Sales No. E.14.II.F4). Available from www.unescap.org/resources/economic-and-social-survey-asia-and-pacific-2014.
74 For example, it has been shown that public spending in Asia on education, health and social protection ranks as the lowest in the world. See Pierre Kohler, “Redistributive policies for sustainable development: looking at the role of assets and equity”, DESA Working Paper, No. 139 (ST/ESA/2015/DWP/139). Empirical results of would suggest that social protection and spending on housing in Asia actually increases inequality, which is contradictory to the international experience. See Iris Claus, Jorge Martinez-Vazquez and Violeta Vulovic, “Government fiscal policies and redistribution in Asian countries” ADB Economics Working Paper Series, No. 310 (Manila, 2012).

42
Economic and Social Survey of Asia and the Pacific 2016: Year-end Update
Within direct taxes, concern arises from the greater reliance on corporate income tax (CIT) compared with personal income tax (PIT). On average, Asia-Pacific developing countries collect 4 per cent of GDP from CIT, which is actually more than what OECD countries collect, at 2.9 per cent of GDP. However, the average revenue from PIT in these countries is merely 2 per cent of GDP, while OECD countries collect more than four times this level at 8.8 per cent of GDP. This pattern is quite undesirable because the CIT burden could often be shifted to labour, especially in an increasingly integrated world where capital has greater mobility.75 As economic integration deepens in Asia and the Pacific and worldwide, the effect of CIT on inequality is becoming the subject of debate. In contrast, PIT is potentially the best tax instrument for redistributive purposes; by its nature, it is almost impossible to be shifted it to another party. However, past experience also shows that PIT performs only if it is well designed, well administered and has sufficient coverage.76
Figure30
Composition of tax revenuesHow balanced is the tax mix?
0
5
10
15
20
25
30
Afg
hani
stan
Ban
glad
esh
Pak
ista
n
Iran
(Isla
mic
Rep
ublic
of
Sri
Lank
a
Indo
nesi
a
Bhu
tan
Sin
gapo
re
Aze
rbai
jan
Indi
a
Rep
ublic
of K
orea
Kaz
akhs
tan
Mon
golia
Vie
t Nam
Thai
land
Arm
enia
Japa
n
Chi
na
Turk
ey
Rus
sian
Fed
erat
ion
Geo
rgia
Uzb
ekis
tan
Mal
dive
s
Fiji
Aus
tralia
OEC
D c
ount
ries
Perc
enta
ge o
f GD
P
Taxes on goods and services Taxes on international trade Income taxes: corporateIncome taxes: individual Taxes on payroll and workforce Taxes on propertyTotal tax revenue
Source: ESCAP, based on IMF, Government Finance Statistics. Available from www.imf.org/en/data; and CEIC Data. Available from www.ceicdata.com (accessed 15 November 2016).
The difference between developing Asia-Pacific countries and developed countries is even greater when comparing social contributions. OECD countries on average collect 9.1 per cent of GDP through social contributions, and for some this figure is higher than 15 per cent. In Asia and the Pacific, by contrast, many countries collect little or no social contributions. Indonesia, for instance, introduced a mandatory social contribution programme starting only in 2015, with moderate contribution rates of 3 per cent from employees and 6 per cent from employers for pension and health insurance coverage combined.77 Moreover, in most countries, social protection and welfare coverage remains narrow in many cases, with biases in favour of public and formal sector employees. There are successful regional examples,
75 See Arnold C. Harberger, “Corporate tax incidence: reflections on what is known, unknown and unknowable”, in Fundamental Tax Reform: Issues, Choices, and Implications, J.W. Diamond and G. R. Zodrow, eds. (Cambridge, Massachusetts, MIT Press, 2015).
76 See Eric M. Zolt and Richard M. Bird, “Redistribution via taxation: the limited role of the personal income tax in developing countries”, UCLA Law Review, vol. 52.
77 For details, see https://home.kpmg.com/xx/en/home/insights/2015/08/flash-alert-2015-104a.html.

Economic and Social Survey of Asia and the Pacific 2016: Year-end Update
43
however. In Armenia, China, Mongolia, the Republic of Korea, the Russian Federation, Turkey and Uzbekistan, social contribution is only second to taxes on goods and services in revenue mobilization.
Personal income taxes should go beyond labour income and be effectively enforced
The personal income tax (PIT) is widely considered as the central component of a progressive tax system. In OECD countries, PIT is not only a major source of public revenue, but it also contributes significantly to income redistribution for greater equality. The experience of the developed world formed a basis of the early tax policy thinking in the 1950s and 1960s, which advocated for a central role to be played by highly progressive and comprehensive PIT.78
Experimentation with this idea in developing countries, however, proved disappointing. PIT revenue remained largely stagnant and at very low levels compared with that of developed countries. The redistributive promise also was not realized as income taxes in developing countries are often only progressive for certain types of income or certain ranges of income.79 Indeed, the small revenue size of PIT in developing countries has significantly restricted the overall redistributive effect. Moreover, most of this revenue came from taxing labour income, while income from capital and other economic activities was often left out. As a result, the upper-middle-income working class rather than the really rich shouldered the burden. In addition, developing countries in general lack modern tax-related infrastructure, such as accounting, auditing, data collection and reporting, and the capacity for effective administration of PIT. This situation, coupled with corruption, led to much higher compliance and collection costs of a highly progressive PIT in developing countries than in developed countries, and left many flaws and loopholes that the rich, who are more resourceful and connected, could exploit.
The Asia-Pacific region is not too different on these general points. Average PIT revenue in developing countries in the region grew only marginally between the period 1999-2001 and 2014, from 1.8 per cent of GDP to 2 per cent, less than a quarter of the OECD average. At the same time, the Asia-Pacific region followed the global trend of a decreasing top PIT rate. From 1981 to 2015, the average top PIT rate was almost halved in 10 Asia-Pacific countries (see figure 31, left panel). Such a significant change reflects revision of the earlier emphasis on highly progressive rates and the transition towards a new set of “best practices” anchored on flatter rates and a broader base than in the 1980s and the 1990s in order to minimize collection challenges and economic distortion.
The importance of closing the PIT loopholes exploited by the rich should not be overlooked. In Pakistan for instance, the Federal Board of Revenue in 2012 discovered that more than 1.5 million adult citizens who had travelled abroad at least once a year over many years had not registered with the tax authorities. About half a million who had multiple bank accounts also had not registered. Moreover, of the 341 members of the National Assembly, only 90 had filed tax returns in that year.80 The damage of such weak PIT compliance among the rich is beyond forgone revenue or unfulfilled redistributive promise. Basically, it casts serious doubts on the accountability and fairness of the system and thus in the long run casts a shadow on the efforts to create a conducive tax culture in a society.
Countries should be fully aware that there is no simple one-size-fits-all formula for PIT implementation. The timing, sequencing and detailed design of PIT policies need to take into account the local economic, social and cultural context, as well as capacity constraints for both compliance and administration. In general, countries should choose their PIT implementation strategy according to their development stage and their accumulated experience and capacity in PIT administration. A country with a small middle class and large poor population could focus more on “untaxing” the poor and introducing an easy-to-manage PIT design mainly targeting the top income earners. A middle-income developing country could adopt a
78 Comprehensive in the sense that PIT is based on the aggregate value of all different income sources.79 See Richard M. Bird and Eric M. Zolt, “The limited role of the personal income tax in developing countries”, Journal of Asian Economics, vol. 16,
No. 6, pp. 928–946. Available from www.sciencedirect.com/science/article/pii/S1049007805001363. 80 See NOREF Expert Analysis 2014, citing the statement by the Chairman of Pakistan’s Federal Board of Revenue in February 2013.

44
Economic and Social Survey of Asia and the Pacific 2016: Year-end Update
more balanced approach of gradually broadening the PIT base by including the emerging middle class into the coverage and at the same time strengthening PIT administration to effectively tap capital and other non-wage forms of income. A higher-income developing country with stronger governance and administrative capacity could experiment with a more ideal PIT design offering broad coverage and greater progressivity, and seek to address new challenges, such as expanding income sources from abroad.
At the same time, there is renewed interest in wealth-related taxes amid increases in the ratio of private wealth to national income and the concentration of wealth among the top tier of the population. Such taxes may be levied at regular intervals, one time only, or when there is a change in ownership. They are broadly categorized into four categories: (a) recurrent taxes on immovable property; (b) taxes on financial and capital transactions; (c) estate, inheritance and gift taxes;81 and (d) taxes on net wealth. These taxes are considered highly progressive, albeit at varying degrees, including from an intergenerational perspective.
Personal income tax rates and thresholdsHow progressive is the personal income tax?
0
10
20
30
40
50
60
70
80
China Indonesia Sri Lanka IndiaMalaysia Pakistan Republic of Korea ThailandPhilippines Japan Average 10
1981 1985 1990 1995 2000 2005 2010 2015
Panel A. Top marginal personal income tax rate, 1981 -2015
0
1
2
3
4
5
6
7
8
0
5
10
15
20
25
30
35
40
45
50
45 0
0085
000
125
000
165
000
205
000
245
000
285
000
325
000
365
000
405
000
445
000
485
000
525
000
565
000
605
000
645
000
685
000
725
000
765
000
805
000
845
000
885
000
925
000
965
000
1005
000
Per
cent
age
of u
rban
hou
seho
lds
Tax
rate
Renminbi
Panel B. Marginal and average personal income tax rates by income: China in 2015
Marginal tax rate (left-hand side)Average tax rate (left-hand side)Household income distribution (right-hand side)
Per
cent
age
Sources: ESCAP, based on KPMG Tax Rates Online. Available from https://home.kpmg.com/xx/en/home/services/tax/tax-tools-and-resources/tax-rates-online/individual-income-tax-rates-table.html ; Ernst & Young, Worldwide Personal Tax Guide. Available from www.ey.com/Publication/vwLUAssets/Worldwide_Personal_Tax_Guide_2015-16/$FILE/Worldwide%20Personal%20Tax%20Guide%202015-16.pdf; CEIC Data; and Klara Sabirianova Peter, Steve Buttrick and Denvil Duncan, “Global reform of personal income taxation, 1981-2005: evidence from 189 countries”, National Tax Journal, vol. 63, No. 3, pp. 447-478. Available from www.ntanet.org/NTJ/63/3/ntj-v63n03p447-78-global-reform-personal-income.pdf?v=%CE%B1&r=6698626446417721.
Compared with OECD countries, where approximately 2 per cent of GDP is collected on average (although as much as 4 per cent is collected in France and in the United Kingdom), wealth taxes play only a marginal role in Asian developing countries, collecting less than half a percentage point of GDP in most economies (see figure 32). Such differences partly reflect the administrative challenges of wealth taxes, most notably disclosure and valuation. Capacity constraints, coupled with lack of mature property markets and financial transparency, make the task of estimating and taxing personal wealth extremely challenging. Nevertheless, several countries are moving forward to reap the social and economic benefits of wealth taxes. Thailand, for instance, introduced an inheritance tax for the first time in 2016, while China is preparing for the nationwide introduction of a property tax and inheritance tax.
Tax reforms in recent decades have been focused largely on revenue and efficiency considerations, sometimes based on an understanding that redistribution should come primarily through the spending side. While spending on education and health and social transfers are certainly important for inclusive growth and contain some elements of redistribution, they are relatively ineffective in addressing the
81 An estate tax is one levied on the value of assets at death; an inheritance tax is levied on the recipients of such assets.
Figure31

Economic and Social Survey of Asia and the Pacific 2016: Year-end Update
45
concentration of income and wealth among the top tier. Tax policy can play a particularly useful role in this regard. This is in line with the view that the fairness of the fiscal system should be assessed in a comprehensive manner. Tax reforms in general and progressive tax reforms in particular are challenging, as they require strengthening of institutional capacity, effective governance and a broad national agreement on what is fair. To steer such reforms successfully, setting medium-term strategies and targets and engaging all stakeholders will be important.
Figure32
Revenues from wealth-related taxesHow much do wealth-related taxes collect?
0.0
0.5
1.0
1.5
2.0
2.5
3.0
3.5
Indi
aIra
n(is
lam
ic R
epub
lic o
f)
Bhu
tan
Cam
bodi
a (lo
cal)
Afg
hani
stan
Arm
enia
Aze
rbai
jan
Nep
al (c
entra
l)In
done
sia
Chi
naM
acao
, Chi
naM
ongo
liaK
azak
hsta
nK
yrgy
zsta
n (lo
cal)
Rep
ublic
of K
orea
Sri
Lank
a (c
entra
l)G
eorg
iaH
ong
Kon
g, C
hina
Rus
sian
Fed
erat
ion
Aus
tralia
New
Zea
land
Japa
nS
inga
pore
Per
cent
age
of G
DP
Recurrent taxes on immovable property
LatestPeak
0.0
0.5
1.0
1.5
2.0
2.5
3.0
3.5
Indi
a
Kaz
akhs
tan
Rus
sian
Fed
erat
ion
Afg
hani
stan
Pak
ista
n
Phi
lippi
nes
Indo
nesi
a (c
entra
l)
Arm
enia
New
Zea
land
Iran
(Isla
mic
Rep
ublic
of)
Japa
n
Nep
al
Mac
ao, C
hina
Chi
na (c
entra
l)
Aus
tralia
(cen
tral)
Rep
ublic
of K
orea
Hon
g K
ong,
Chi
na
Per
cent
age
of G
DP
Taxes on financial and capital transactions
LatestPeak
0.0
0.1
0.2
0.3
0.4
0.5
0.6
Chi
na Fiji
Ban
glad
esh
Iran
(Isla
mic
Rep
ublic
of)
Sri
Lank
a
Indi
a
Arm
enia
Kyr
gyzs
tan
Pak
ista
n
Geo
rgia
New
Zea
land
Per
cent
age
of G
DP
Recurrent taxes on net wealth
LatestPeak
0.0
0.1
0.2
0.3
0.4
0.5
0.6
Mon
golia
New
Zea
land
Mal
dive
s
Rus
sian
Fed
erat
ion
Mal
aysi
a
Fiji
Indi
a
Pak
ista
n
Mac
ao, C
hina
Aus
tralia
Iran
(Isla
mic
Rep
ublic
of)
Ban
glad
esh
Phi
lippi
nes
Hon
g K
ong,
Chi
na
Sin
gapo
re
Japa
n
Rep
ublic
of K
orea
Per
cent
age
of G
DP
Estate, inheritance and gift taxes
LatestPeak
Source: ESCAP, based on IMF, Government Finance Statistics. Available from www.imf.org/en/data. Note: General government unless otherwise indicated for recurrent property tax and financial transaction tax.
2. Effective governance fosters innovation, investment and inclusive development
In the medium to long run, structural reforms are necessary for economies to evolve towards a sustainable development path. Better economic governance is a vital element in order to undertake such reforms, although such governance may have to be complemented by knowledge of specific factors, such as
46
Economic and Social Survey of Asia and the Pacific 2016: Year-end Update
historical or cultural differences.82 Effective governance is central to achieve the Sustainable Development Goals. In this section, three mechanisms are illustrated through which this aspect is so: innovation and productivity; investment; and social protection.
Innovation, key to productivity growth, requires government facilitation and support
The Asia-Pacific region has witnessed spectacular economic growth over the last few decades. In most economies in the region, such growth has been driven primarily by factor accumulation, that is, by increases in labour and capital stock.83 Although significant increases in productivity, particularly relating to labour, have taken place, the rates of economic and productivity growth have been declining over the last few years.
Mechanization and robotization can boost productivity, but in the short term they may also have a negative impact on employment by displacing workers who would need to acquire new skill sets to work elsewhere. During this retraining transitory period, there could be a net destruction in the number of jobs. To pursue advances in productivity and avoid such potentially harmful effects, firms could invest to upgrade and/or innovate their products, train their employees and/or use their factors of production more efficiently.
Product innovation is arguably the most important factor driving productivity growth. For instance, panel A of figure 33 shows a positive and significant correlation between the complexity of goods produced in the region and the productivity of economies. Panel B shows that in developing Asia-Pacific economies products have become more complex, particularly in East and North-East Asia, South-East Asia, and South and South-West Asia. Conversely, in the least developed countries, landlocked developing countries, North and Central Asia and in the Pacific, the goods produced between the 1990s and the 2000s became less sophisticated.
To foster the development of new products and stimulate the use of science and technology on the productive processes of economies, the institutional context must include organizations, rules and infrastructure that are conducive to innovation. International experience shows that the success of countries with high economic complexity can be attributed to better institutional and governance frameworks. Rules governing management of property rights, protection of intellectual property, effective settlement of disputes or the possibility to contest specific regulations, among others, should be transparent and enforced. For instance, the successful protection of property rights and the existence of efficient bureaucracies have significantly contributed to a higher number of patents. Malaysia and Singapore are good examples of this, as they have both strong regulatory frameworks and a high number of patents per capita. Figure 34 illustrates the positive relationship between rule of law and innovation in the form of patents obtained. and efficiency of Government’s initiatives to support science, technology and innovation (STI).
82 Governance is loosely defined as “the traditions and institutions by which authority in a country is exercised”. See D. Kaufmann, A. Kray and P. Zoido-Lobaton, Governance Matters (Washington, D.C., World Bank, 1999). A qualifying phrase could well be added: without any consideration to how it is acquired. See Francis Fukuyama, “What is Governance?”, vol. 26, No. 3. In this context, it is understood that good governance is achieved “when citizens cease to be passive recipients of services and become engaged in issues that matter to them”. See Yap Kioe Sheng and others, “Access to basic services for the poor: the importance of good governance”, E&U Series on Asia-Pacific MDG Studies (ST/ESCAP/2438). Available from www.environmentandurbanization.org/print/2406.
83 See United Nations, Economic and Social Commission for Asia and the Pacific, Economic and Social Survey of Asia and the Pacific 2016: Nurturing Productivity for Inclusive Growth and Sustainable Development (Sales No. E.16.II.F.10).

Economic and Social Survey of Asia and the Pacific 2016: Year-end Update
47
Figure33
Economic complexity indexProduction innovation is arguably the most important factor driving productivity growth
Pro
duct
ivity
(in
loga
rithm
)
R² = 0.4156
7.5
8.0
8.5
9.0
9.5
10.0
10.5
11.0
11.5
12.0
-2.0 -1.0 0.0 1.0 2.0
Prod
uctiv
ity (
in lo
garit
hm)
Panel A: Economic complexity index and prodcutivity in Asia and the Pacific
-1.5
-1.0
-0.5
0.0
0.5
1.0
1.5
2.0
Leas
t dev
elop
ing
coun
tries
Land
lock
ed d
evel
opin
gco
untri
es
Paci
fic
Sout
h an
d So
uth-
Wes
t Asia
Sout
h-Ea
st A
sia
Nor
th a
nd C
entra
l Asia
Asia
-Pac
ific
East
and
Nor
th-E
ast A
sia
Dev
elop
edec
onom
ies
Panel B: Economic complexity index by region in 1990s and 2000s
1990s 2000sEconomic complexity index
Sources: ESCAP, based on data from the World Development Indicators. Available from http://data.worldbank.org/data-catalog/world-development-indicators; and the Observatory of Economic Complexity. Available from http://atlas.media.mit.edu/en/. Note: For panel A: The economic complexity index measures the degree of sophistication of goods produced in a country. The purpose is to measure the degree of knowledge embedded in products; high index values correspond to higher levels of sophistication of the products concerned.
Figure34
Number of patents granted and rule of lawGovernance indicators, such as the rule of law, are positively related to innovation indicators, such as patents
R² = 0.3343
0
2
4
6
8
10
12
14
0 10 20 30 40 50 60 70 80 90 100
Num
ber o
f pat
ents
gra
nted
(log
arith
m)
Rule of law
Source: ESCAP, based on data from the Worldwide Governance Indicators. Available from http://info.worldbank.org/governance/wgi/index.aspx#home; and the WIPO Statistics Database. Available from www.wipo.int/ipstats/en/.

48
Economic and Social Survey of Asia and the Pacific 2016: Year-end Update
Besides establishing and enforcing rules, Governments can actively facilitate interactions between public organizations, academia and civil society research institutions, and the private sector. An example of such interaction is the widespread promotion of the use of STI across institutional sectors. Governments can also apply open innovation policies for publicly funded projects; they can subsidize and/or partially fund tripartite initiatives between universities, industry and the public sector for research and education, or provide infrastructure that encourages research and development activities, and the creation of start-ups or business incubation, among others. Effective governance is also important to ensure the existence of a minimum critical mass of highly qualified and equipped personnel and researchers, such as through the development of STI infrastructure or specific physical infrastructure for research and education.
The lack of all these elements can become detrimental for innovation. Weak governance can reduce the amount and efficiency of a Government’s initiatives to support STI. For instance, the impact of public expenditure on research and development and STI is weakened if government funds are not efficiently allocated and used, or if regulations governing the access to public funds are not enforced and transparent.84
Weak legal systems and credit market imperfections weigh on investment
Ineffective economic governance creates operational inefficiencies, which can result in higher risk-aversion and deter investment. For instance, corruption is considered by foreign investors as an unpredictable tax which does not automatically provide results.85 Thus, large differences between corruption levels in host and home countries can be an impediment to investment.86 Moreover, weak governance alters investment patterns. For instance, although investors prefer to have sole ownership of subsidiaries, corruption shifts the ownership towards joint venture structures as these allow a reduction in transaction costs with government officials when the local partner is able to assist the foreign investor to deal with the Government.87 In turn, if the recipient country does not have local firms with a suitable profile for foreign investors, this situation may lead to lower levels of FDI inflows.
In addition to corruption, factors such as rule of law, property rights protection or regulatory quality also affect investment. These elements are particularly important to access credit, a major constraint for small and medium-sized enterprises in the Asia-Pacific region. Thus, credit market imperfections, such as information asymmetries and legal systems’ limitations, can negatively affect the capacity of creditors to recover defaulted loans, or protect a debtor’s assets.88 Such a situation results in loans not being granted, and consequently the prospects dwindle for small and medium-sized enterprises to invest and improve productivity. Figure 35 shows the positive and significant correlation between governance and credit extended to the private sector.
84 For a theoretical framework of the impact of governance on innovation, see Edinaldo Tebaldi and Bruce Elmslie, “Institutions, innovation and economic growth”, Journal of Economic Development, vol. 33, No. 2 (2008), pp. 27-53. For a detailed analysis on the issue of science, technology and innovation in Asia and the Pacific, see United Nations, Economic and Social Commission for Asia and the Pacific, Science, Technology and Innovation for Sustainable Development in Asia and the Pacific: Policy Approaches for Least Developed Countries (Sales No. E.16.II.F.22).
85 See Shang-Jin Wei, “How taxing is corruption on international investors?” Review of Economics and Statistics, vol. 82, No. 1 (February 2000), pp. 1-11.
86 For further information, see Josef C. Brada, Zdenek Drabek and M. Fabricio Perez, “The effect of home-country and host-country corruption on foreign direct investment”, Review of Development Economics, vol. 16, No. 4 (November 2012), pp. 640-663.
87 See Beata S. Javorcik and Shang-Jin Wei, “Corruption and cross-border investment in emerging markets: firm-level evidence”, Journal of International Money and Finance, vol. 28, No. 4 (2009), pp. 605-624.
88 See Robert J. Barro, “Inequality and growth in a panel of countries”, Journal of Economic Growth, vol. 5, No. 1 (March 2000), pp. 5-32.

Economic and Social Survey of Asia and the Pacific 2016: Year-end Update
49
Figure35
Domestic credit extended to private sector, and governance index, 2014Institutional quality has strong positive correlation with financial development and access
0
50
100
150
200
250
30 40 50 60 70 80 90
Dom
estic
cre
dit t
o pr
ivat
e se
ctor
(P
erce
ntag
e of
GD
P)
Governance
Source: ESCAP, based on data from the World Development Indicators database and the Worldwide Governance Indicators, as utilized by Daniel Kaufmann, Aart Kraay and Massimo Mastruzzi, “The Worldwide Governance Indicators: methodology and analytical issues”, Policy Research Working Paper, No. 5430 (Washington D.C., World Bank, 2010). Note: Worldwide Governance Indicators have been rebased to 100. High values of the indices represent a good perception of institutional quality. The index “governance” is the average of four indicators: control of corruption; rule of law; regulatory quality; and government effectiveness.
Embezzlement of public resources aggravates income and gender inequality
Inequality and inclusion are at the heart of the 2030 Agenda for Sustainable Development. From a public administration standpoint, the most important tool to address inequality is fiscal policy. In the short run, public authorities can have a strong impact by pursuing income redistribution schemes either directly, such as through cash transfers, or indirectly, such as through subsidies on specific goods for the poor. Inequality goes beyond income and wealth, however. In the medium to long run, for policymakers to reduce fundamental sources of inequality, such as inequality of opportunity, public authorities must deliver high-quality public services, such as education, and develop strong social protection schemes, such as for health care. On all accounts, weak governance is likely to have an adverse effect and increase inequality. For instance, with weak governance, a Government’s investment decisions are more likely to be affected by favouritism rather than public welfare considerations,89 a phenomenon that may be aggravated in the presence of State-owned enterprises with rent-seeking power. As public resources are privately captured, this will result in more inefficiencies for the general population, such as in the form of poorer-quality public goods (roads, for example), and have an adverse impact on economic growth.
To the extent that weak governance results in the implementation of fiscal policies which only benefit elites, such as tax exemption schemes, income inequality can also be aggravated due to lower tax collection and less efficient tax administration (see figure 36).90 Such a situation contributes to higher income and wealth inequality.
89 See Theodore R. Breton, “Can institutions or education explain world poverty? An augmented Solow model provides some insights”, Journal of Socio-Economics, vol. 33, No. 1 (March 2004), pp. 45-69.
90 See Sanjeev Gupta, Hamid Davoodi and Rosa Alonso-Terme, “Does corruption affect income inequality and poverty?” Economics of Governance, vol. 3, No. 1 (March 2002),, pp. 23-45.

50
Economic and Social Survey of Asia and the Pacific 2016: Year-end Update
Figure36
Tax revenues, and governance index, 2010-2014Corruption can severely undermine efforts to enhance tax revenues and distort government spending such that it benefits only a few, and thereby aggravates income and wealth inequality
R² = 0.214
0
5
10
15
20
25
30
35
40
0 10 20 30 40 50 60 70 80 90 100
Tax
reve
nue
(Per
cent
age
of G
DP
)
Governance
Sources: ESCAP, based on data from the World Development Indicators database, and the Worldwide Governance Indicators utilized by Daniel Kaufmann, Aart Kraay and Massimo Mastruzzi, “The Worldwide Governance Indicators. methodology and analytical issues”, Policy Research Working Paper, No. 5430 (Washington D.C.: World Bank, 2010). Notes: Worldwide Governance Indicators have been rebased to 100. High values of the indices represent a good perception of institutional quality. The index “governance” is the average of four indicators: control of corruption; rule of law; regulatory quality; and government effectiveness.
Public service provision, both in terms of access and quality, is influenced by weak governance as well. For instance, lower tax revenues limit the scope of pro-poor spending that Governments can undertake, thereby hampering their efforts to reduce inequality. This effect can be particularly harmful to gender equality, as women are often more vulnerable than men (see figure 37). For example, embezzlement of public resources can reduce people’s access to public services, such as safe water and sanitation, which has a particular impact on women due their cultural water-fetching responsibilities in some societies. In turn, this situation may limit their capabilities (fewer opportunities) and income (less empowerment).91 In a similar vein, fewer resources due to weak governance may entail poorer access to medical services. This phenomenon has a particularly strong bearing on women, because they usually assume the responsibility of taking care of others, and because they are the central beneficiary of reproductive health services (attendance by midwives during childbirth). Hence, mechanisms that aim to achieve good governance create cycles of empowerment that will increase the efficiency and effectiveness of services and empower the poor to become agents of their own development.92
91 Corruption in the form of sexual extortion is also used as a “currency”, but it is not easily measurable because it is less likely reported. For further information, see United Nations Development Programme and United Nations Development Fund for Women, Corruption, Accountability and Gender: Understanding the Connections (New York, 2010).
92 ESCAP, UNDP and ADB, “Access to Basic Services for the Poor: The Importance of Good Governance”, Asia Pacific MDG Study Series (2007).

Economic and Social Survey of Asia and the Pacific 2016: Year-end Update
51
Figure37
Gender inequality index and governance index, recent yearsGovernance has strong gender dimensions
y = -0.311ln(x) + 1.5552
0
0.1
0.2
0.3
0.4
0.5
0.6
0.7
0.8
10 20 30 40 50 60 70 80 90 100
Gen
der i
nequ
ality
inde
x
Governance
Sources: ESCAP, based on data from the International Monetary Fund Research Department, the World Development Indicators database and the Worldwide Governance Indicators as utilized by Daniel Kaufmann, Aart Kraay and Massimo Mastruzzi, “The Worldwide Governance Indicators: methodology and analytical Issues”, Policy Research Working Paper, No. 5430 (Washington D.C., World Bank, 2010). Notes: Worldwide Governance Indicators have been rebased to 100. High values of the indices represent a good perception of institutional quality. The index “governance” is the average of four indicators: control of corruption; rule of law; regulatory quality; and government effectiveness. Higher value of the gender inequality index means higher inequality between men and women. The size of bubbles represents PPP-adjusted per capita GDP at constant 2011 international United States dollars.
Besides corruption, a deficient rule of law can also contribute to gender inequality by hindering female participation in the labour force. For example, while lack of education or inefficient bureaucracy may hamper women’s entrepreneurship ability, unequal rights − either de facto or de jure − may add up by preventing them from having assets, such as land deeds, through inheritance. In turn, women’s lack of collateral is an obstacle to access credit, which denies them the opportunity to empower their lives.93
To conclude, governance will arguably be an instrumental factor for the achievement of the Sustainable Development Goals. The three mechanisms presented in this section have exemplified transmission channels of governance, vital to evolve from a focus on economic growth to a more holistic focus on sustainable development. These and other aspects will be examined in greater detail in the Survey for 2017.
93 See World Bank Group, Business and the Law 2016: Getting to Equal (Washington D.C., 2015).
52
Economic and Social Survey of Asia and the Pacific 2016: Year-end Update
CONCLUDING REMARKS
The Asia-Pacific region is at a crossroads. After having achieved rapid economic growth in the past two decades, the region is undergoing an economic structural transformation exemplified by China’s rebalancing, which has implications that go beyond its borders, increased dynamism in South and South-West Asia and a number of least developed countries, and further regional integration in South-East Asia under ASEAN. However, several commodity exporters in North and Central Asia and the Pacific are facing tough challenges and need to prioritize economic diversification. In many respects, China’s rebalancing and opening is a healthy development and will augur well for China and the region in the long term. However, as highlighted in this report, short-term risks concerning private debt needs to be effectively managed.
As a corollary to such economic transformations, excellent growth performance in the past will no longer be sufficient in the new era of sustainable development. If countries are to achieve the Sustainable Development Goals, they will have to fully internalize the three dimensions of development (economic, social and environmental) in a holistic manner so as to ensure that no one is left behind. Recent global developments, such as the Paris Agreement,94 are an expression of this new holistic approach, and bring hope to countries where it is much needed. Promoting inclusive development and curbing excessive inequality have become key priorities in national development plans and budgets.
In order to undertake such transitions smoothly and ensure that countries are on a sustainable development path, proactive fiscal policy and effective economic governance will be vital. Fiscal policy is a key tool for achieving diverse economic, social and environmental goals. While ensuring long-term fiscal sustainability, there has to be greater emphasis on the quality and composition of public expenditures. Better economic governance, as reflected, among other things, in the effectiveness and integrity of public institutions, can go a long way in enhancing investment that is currently weak; in promoting productivity and innovation that underpins sustained economic growth; and in accelerating poverty reduction and mitigating inequalities.
94 In reference to the Framework Convention on Climate Change, see Report of the Conference of the Parties on its twenty-first session, held in Paris from 30 November to 13 December 2015, and its decision 1/CP.21.

The shaded areas of the map indicate ESCAP members and associate members.
ESCAP is the regional development arm of the United Nations and serves as the main economic and social development centre for the United Nations in Asia and the Pacific. Its mandate is to foster cooperation between its 53 members and 9 associate members. ESCAP provides the strategic link between global and country-level programmes and issues. It supports Governments of countries in the region in consolidating regional positions and advocates regional approaches to meeting the region’s unique socio-economic challenges in a globalizing world. The ESCAP office is located in Bangkok, Thailand. Please visit the ESCAP website at www.unescap.org for further information.
United Nations publications may be obtained from bookstores and distributors throughout the world. Please consult your bookstore or write to any of the following:
Customers In: America, Asia and the Pacific
Email: [email protected]: un.org/publicationsTel: +1 703 661 1571Fax: +1 703 996 1010
Mail Orders to: United Naitons Publications PO Box 960 Herndon, Virginia 20172United States of America
Customers in: Europe, Afica and the Middle East
United Nations Publication c/o Eurospan Group Email: [email protected] Web: un.org/publicationsTel: +44 (0) 1767 604972Fax: +44 (0) 1767 601640
Mail orders to: United Nations Publications Pegasus Drive, Stratton Business ParkBigglewade, Bedfordshire SG18 8TQUnited Kingdom
For futher information on this publication, please address your enquiries to:
Chief Conference and Documentation Services SectionOffice of the Executive Secretary Economic and Social Commission for Asia and the Pacific (ESCAP)United Nations Building, Rajadamnern Nok AvenueBangkok 10200, ThailandTel: 66 2 288-1100Fax: 66 2 288-3018Email: [email protected]
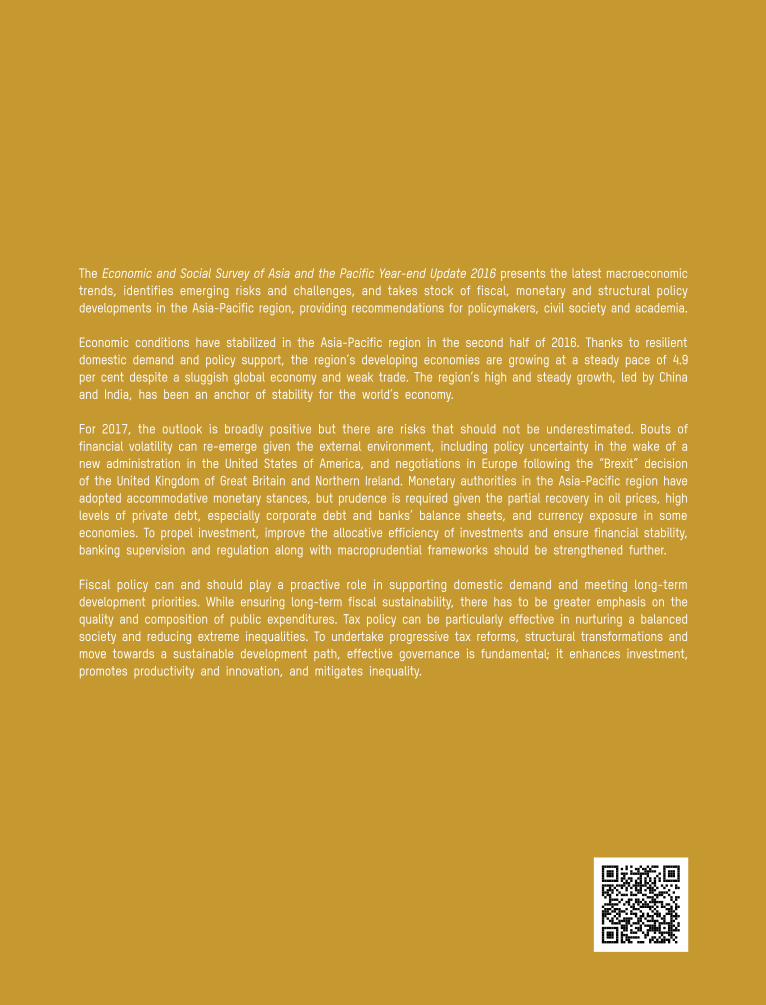
The Economic and Social Survey of Asia and the Pacific Year-end Update 2016 presents the latest macroeconomic trends, identifies emerging risks and challenges, and takes stock of fiscal, monetary and structural policy developments in the Asia-Pacific region, providing recommendations for policymakers, civil society and academia.
Economic conditions have stabilized in the Asia-Pacific region in the second half of 2016. Thanks to resilient domestic demand and policy support, the region’s developing economies are growing at a steady pace of 4.9 per cent despite a sluggish global economy and weak trade. The region’s high and steady growth, led by China and India, has been an anchor of stability for the world’s economy.
For 2017, the outlook is broadly positive but there are risks that should not be underestimated. Bouts of financial volatility can re-emerge given the external environment, including policy uncertainty in the wake of a new administration in the United States of America, and negotiations in Europe following the “Brexit” decision of the United Kingdom of Great Britain and Northern Ireland. Monetary authorities in the Asia-Pacific region have adopted accommodative monetary stances, but prudence is required given the partial recovery in oil prices, high levels of private debt, especially corporate debt and banks’ balance sheets, and currency exposure in some economies. To propel investment, improve the allocative efficiency of investments and ensure financial stability, banking supervision and regulation along with macroprudential frameworks should be strengthened further.
Fiscal policy can and should play a proactive role in supporting domestic demand and meeting long-term development priorities. While ensuring long-term fiscal sustainability, there has to be greater emphasis on the quality and composition of public expenditures. Tax policy can be particularly effective in nurturing a balanced society and reducing extreme inequalities. To undertake progressive tax reforms, structural transformations and move towards a sustainable development path, effective governance is fundamental; it enhances investment, promotes productivity and innovation, and mitigates inequality.
ECONOMIC AND SOCIAL SURVEY OF ASIA AND THE PACIFIC 2016:Year-End Update