
OECD QSAR Toolbox v.4oasis-lmc.org/media/74786/Tutorial_2_TB 4.1_Predicting AMES by... · OECD QSAR...
100
OECD QSAR Toolbox v.4.1 Step-by-step example for predicting Ames mutagenicity by making use of read-across
-
Upload
nguyenhuong -
Category
Documents
-
view
236 -
download
0
Transcript of OECD QSAR Toolbox v.4oasis-lmc.org/media/74786/Tutorial_2_TB 4.1_Predicting AMES by... · OECD QSAR...

OECD QSAR Toolbox v.4.1
Step-by-step example for predicting Ames mutagenicity by making use of read-across

Outlook
• Background
• Objectives
• Specific Aims
• Read-across
• The exercise
• Workflow of the exercise
• Save the prediction
2
The OECD QSAR Toolbox for Grouping Chemicals into Categories July 2017
Background
• This is a step-by-step presentation designed to take you through the workflow of the Toolbox in a data-gap filling exercise using read-across based on molecular similarity with data pruning.
• If you are a novice user of the Toolbox you may wish to review the “Getting Started” document available at [www.oecd.org/env/existingchemicals/qsar] as well as go through tutorials 1 and 3.
3
The OECD QSAR Toolbox for Grouping Chemicals into Categories July 2017
Outlook
• Background
• Objectives
• Specific Aims
• Read-across
• The exercise
• Workflow of the exercise
• Save the prediction
4
The OECD QSAR Toolbox for Grouping Chemicals into Categories July 2017

Objectives
• This presentation demonstrates a number of functionalities of the Toolbox:
•Entering a target chemical by SMILES notation and Profiling
• Identifying analogues for a target chemical by molecular similarity
•Retrieving experimental results available for those analogues, and for multiple endpoints
• Filling data gaps by read-across
5
The OECD QSAR Toolbox for Grouping Chemicals into Categories July 2017

Outlook
• Background
• Objectives
• Specific Aims
• Read-across
• The exercise
• Workflow of the exercise
• Save the prediction
6
The OECD QSAR Toolbox for Grouping Chemicals into Categories July 2017
Specific Aims
• To review the workflow of the Toolbox.
• To reacquaint the user with the six modules of the Toolbox.
• To reacquaint the user with the basic functionalities within each module.
• To introduce the user to new functionalities of selected modules.
• To explain to the rationale behind each step of the exercise.
7
The OECD QSAR Toolbox for Grouping Chemicals into Categories July 2017

Outlook
• Background
• Objectives
• Specific Aims
• Read-across
• The exercise
• Workflow of the exercise
• Save the prediction
8
The OECD QSAR Toolbox for Grouping Chemicals into Categories July 2017

Read-across & the Analogue Approach
• Remember, read-across is a method that can be used to estimate missing data from a single or limited number of chemicals using the analogue approach.
• In the analogue approach, experimental endpoint information for a single or small number of tested chemicals is used to predict the same endpoint for an untested chemical that is considered to be “similar” (i.e., within the same category).
9
The OECD QSAR Toolbox for Grouping Chemicals into Categories July 2017

Analogous Chemicals
• Previously you learned that analogous sets of chemicals are often selected based on the hypothesis that the toxicological effects of each member of the set will show a common behaviour.
• For this reason mechanistic profilers and grouping methods have been shown to be of great value in using the Toolbox.
• However, there are cases where the mechanistic profilers and grouping methods are inadequate and one is forced to rely on molecular similarity to form a category.
• The Toolbox allows one to develop a category by using either a mechanistic category like DNA binding or structural similarity.
• Since there is no preferred way of identifying structural similarity, the user is guided to use DNA binding as a first option.
10
The OECD QSAR Toolbox for Grouping Chemicals into Categories July 2017
Outlook
• Background
• Objectives
• Specific Aims
• Read-across
• The exercise
• Workflow of the exercise
• Save the prediction
11
The OECD QSAR Toolbox for Grouping Chemicals into Categories July 2017

Exercise
• In this exercise we will predict the Ames mutagenicity potential for an untested compound, (n-hexanal) [SMILES CCCCCC=O)], which is the “target” chemical.
• This prediction will be accomplished by collecting a small set of test data for chemicals considered to be in the same category as the target molecule.
• The category will be defined by empirical similarity, with respect to “Organic functional groups” profiler.
• The prediction itself will be made by “read-across” analysis.
12
The OECD QSAR Toolbox for Grouping Chemicals into Categories July 2017

Side-Bar On Mutagenesis
• Mutagens do not create mutations.
• Mutagens create DNA damage.
• Mutations are changes in nucleotide sequence.
• Mutagenesis is a cellular process requiring enzymes and/or DNA replication, thus cells create mutations.
13
The OECD QSAR Toolbox for Grouping Chemicals into Categories July 2017

Side-Bar On Mutagenesis
• Mutations within a gene are generally base-substitutions or small deletions/insertions (i.e., frame shifts).
• Such alteration are generally called point mutations.
• The Ames scheme based on strains of Salmonella provide the corresponding experimental data.
14
The OECD QSAR Toolbox for Grouping Chemicals into Categories July 2017
Side-Bar On Mutagenesis
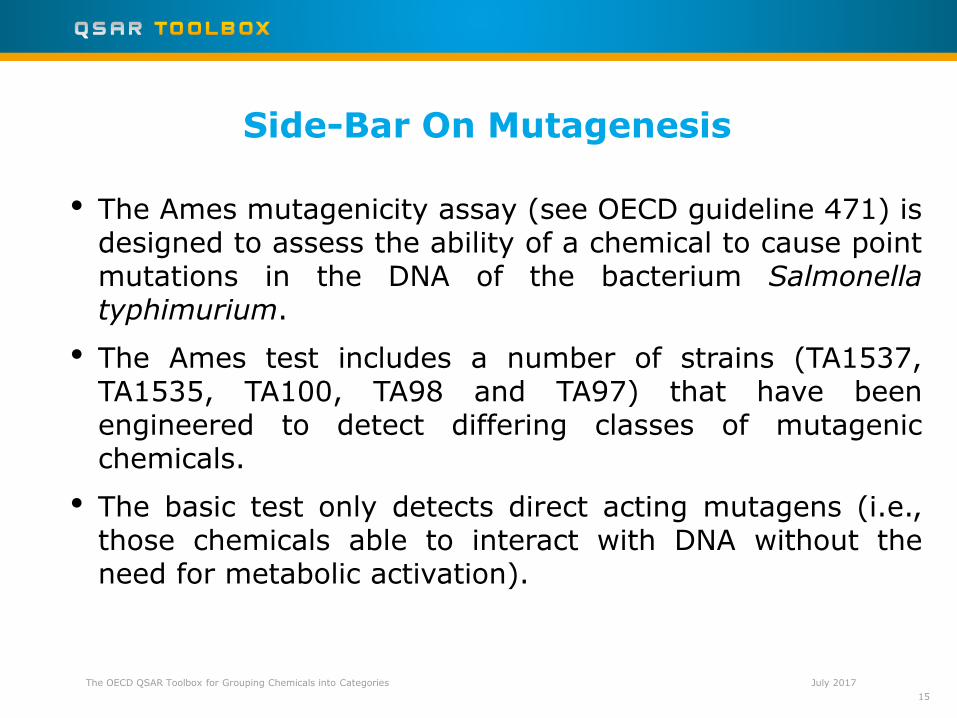
• The Ames mutagenicity assay (see OECD guideline 471) is designed to assess the ability of a chemical to cause point mutations in the DNA of the bacterium Salmonella typhimurium.
• The Ames test includes a number of strains (TA1537, TA1535, TA100, TA98 and TA97) that have been engineered to detect differing classes of mutagenic chemicals.
• The basic test only detects direct acting mutagens (i.e., those chemicals able to interact with DNA without the need for metabolic activation).
15
The OECD QSAR Toolbox for Grouping Chemicals into Categories July 2017

Side-Bar on Metabolic Activation
• The inclusion of an S9 mix of rodent liver enzymes is designed to assess those chemicals requiring metabolic activation in order to be mutagenic.
• Typically, chemicals are assayed both without S9 and with S9 with results being reported in a binary fashion
• A positive result in any of the bacterial strains with or without S9 confirms mutagenic potential.
16
The OECD QSAR Toolbox for Grouping Chemicals into Categories July 2017
Outlook
• Background
• Objectives
• Specific Aims
• Read-across
• The exercise
• Workflow of the exercise
• Save the prediction
17
The OECD QSAR Toolbox for Grouping Chemicals into Categories July 2017

Workflow
• The Toolbox has six modules which are used in a sequential workflow:
•Chemical Input • Profiling •Endpoints •Category Definition • Filling Data Gaps •Report
18
The OECD QSAR Toolbox for Grouping Chemicals into Categories July 2017
Outlook
• Background
• Objectives
• Specific Aims
• Read-across
• The exercise
• Workflow of the exercise
•Chemical input
19
The OECD QSAR Toolbox for Grouping Chemicals into Categories July 2017

Chemical Input Overview
• As you leader in the previous tutorials, this module provides the user with several means of entering the chemical of interest or the target chemical.
• Since all subsequent functions are based on chemical structure, the goal here is to make sure the molecular structure assigned to the target chemicial is the correct one.
20
The OECD QSAR Toolbox for Grouping Chemicals into Categories July 2017

Chemical Input Ways of Entering a Chemical
• Remember there are several ways to enter a target chemical and the most often used are:
•CAS#,
•SMILES (simplified molecular information line entry system) notation, and
•Drawing the structure
• Click on Structure.
• This inserts the window entitled “2D editor” (see next screen shot).
21
The OECD QSAR Toolbox for Grouping Chemicals into Categories July 2017

Chemical Input Input target chemical by drawing
22
1
1. Click on Structure
The OECD QSAR Toolbox for Grouping Chemicals into Categories July 2017

Chemical Input Input target chemical by SMILES
• In the area next to “Smiles” type CCCCCC=O.
• Note as you type the SMILES code the structure is being drawn in the centre of the structure field (see next screen shot).
• Click “OK” to accept the target chemical.
23
The OECD QSAR Toolbox for Grouping Chemicals into Categories July 2017

1. Type CCCCCC=O in Smiles window; 2. 2D structure; 3. Click OK;
24
1
3
2
Chemical Input Input target chemical by SMILES
The OECD QSAR Toolbox for Grouping Chemicals into Categories July 2017
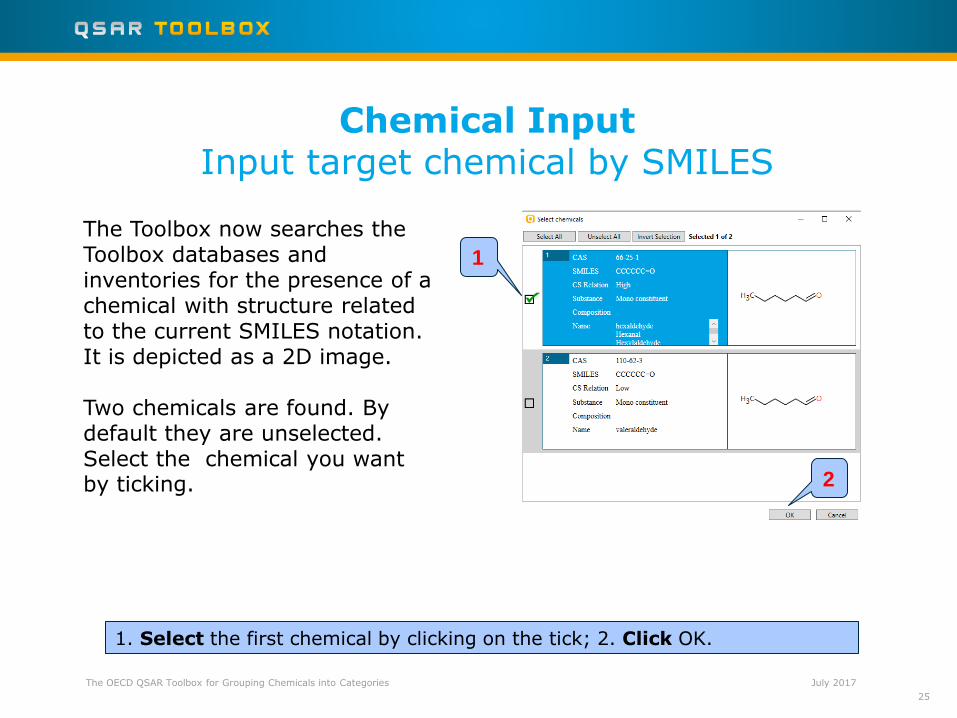
1. Select the first chemical by clicking on the tick; 2. Click OK.
Chemical Input Input target chemical by SMILES
25
The Toolbox now searches the Toolbox databases and inventories for the presence of a chemical with structure related to the current SMILES notation. It is depicted as a 2D image. Two chemicals are found. By default they are unselected. Select the chemical you want by ticking.
1
2
The OECD QSAR Toolbox for Grouping Chemicals into Categories July 2017

Chemical Input Target chemical identity
• You have now selected your target chemical.
• Expand “Structure info” field to display chemical identification information (see next screen shot).
• It is important to remember that the workflow is based on the structure coded in SMILES.
26
The OECD QSAR Toolbox for Grouping Chemicals into Categories July 2017

The workflow on the first module is now complete; click on “Profiling” [1] to move to the next module.
Chemical Input Target chemical identity
27
1
The OECD QSAR Toolbox for Grouping Chemicals into Categories July 2017

Outlook
• Background
• Objectives
• Specific Aims
• Read-across
• The exercise
• Workflow of the exercise
•Chemical input
•Profiling
28
The OECD QSAR Toolbox for Grouping Chemicals into Categories July 2017
Profiling Overview
• As you may remember, “Profiling” refers to the electronic process of retrieving relevant information on the target compound, other than environmental fate, ecotoxicity and toxicity data, which are stored in the Toolbox.
• Available profilers includes likely mechanism(s) of action which have been shown to be useful in forming categories that include the target chemical.
29
The OECD QSAR Toolbox for Grouping Chemicals into Categories July 2017
• The outcome of the profiling determines the most appropriate way to search for analogues (detailed information in Manual for getting started (Chapter 4) http://www.oecd.org/dataoecd/58/56/46210452.pdf
• Table 4-1 in chapter 4 (Manual for getting started) lists a selection of profilers and their relevance for different endpoints of regulatory relevance.
• To help the user to choose suitable profiling methods, a new feature has been developed – see next slide.
Profiling Profiling the target chemical
30
The OECD QSAR Toolbox for Grouping Chemicals into Categories July 2017

Profiling
Profiling the target chemical
1. Click on the box to open the nodes of the tree;
2. Mark the box in the data matrix related to the target endpoint of chemical;
3. From Profiling / Profiling methods / Options / Color by (pop-up menu) select Endpoint selected in the data matrix
According to the legend profilers related to the selected endpoint are highlighted in
or
1
2
3
The OECD QSAR Toolbox for Grouping Chemicals into Categories July 2017

Profiling
Profiling the target chemical
• For this example, the following general mechanistic profiling methods are relevant to genetic toxicity:
- DNA binding by OASIS – mechanistic grouping
- DNA binding by OECD – mechanistic grouping
- Protein binding by OASIS – mechanistic grouping
- Protein binding by OECD – mechanistic grouping
- Carcinogenicity (genotox and nongenotox) alerts by ISS - endpoint specific
- DNA alerts for AMES by OASIS - endpoint specific
- in vitro mutagenicity (Ames test) alerts by ISS - endpoint specific
- in vivo mutagenicity (Micronucleus) alerts by ISS - endpoint specific
- Organic function groups - empiric
The OECD QSAR Toolbox for Grouping Chemicals into Categories July 2017
• Select the “Profiling methods” related to the target endpoint.
• This selects (a green check mark appears) or deselects (green check disappears) profilers.
• For this example, select the profilers relevant to genetic toxicity (see next screen shot).
Profiling Profiling the target chemical
33
The OECD QSAR Toolbox for Grouping Chemicals into Categories July 2017

Profiling Profiling the target chemical
34
2
1. Check the profilers related to the target endpoint (see slide 32); 2. Click Apply
1
The OECD QSAR Toolbox for Grouping Chemicals into Categories July 2017

• The actual profiling will take several seconds depending on the number and type of selected profilers.
• The results of profiling automatically appear as a dropdown boxes under the target chemical (see next slide).
• Please note the specific profiling results by DNA, Protein binding, and Organic functional groups.
• These results will be used to search for suitable analogues in the next steps of the exercise.
Profiling Profiling the target chemical
35
The OECD QSAR Toolbox for Grouping Chemicals into Categories July 2017

Profiling Profiles of n-hexanal
36
1
Green-white rectangles in the result boxes indicate there is more than one profiling result and the fields need to be expanded (1).
The OECD QSAR Toolbox for Grouping Chemicals into Categories July 2017

Profiling Profiles of n-hexanal
37
2
• In this case there is structural evidence that the target has positive DNA and Protein binding alert
• This allows to bind covalently to DNA
• This mechanistic information is important for the grouping of analogues.
1. Right click on the box with profiling result by DNA binding by OECD.
2. Left Click on the “Explain” box to see why the target is profiled as “Mono-aldehydes” by DNA binding by OECD (see next slide). 1
The OECD QSAR Toolbox for Grouping Chemicals into Categories July 2017
Profiling Profiles of n-hexanal
38
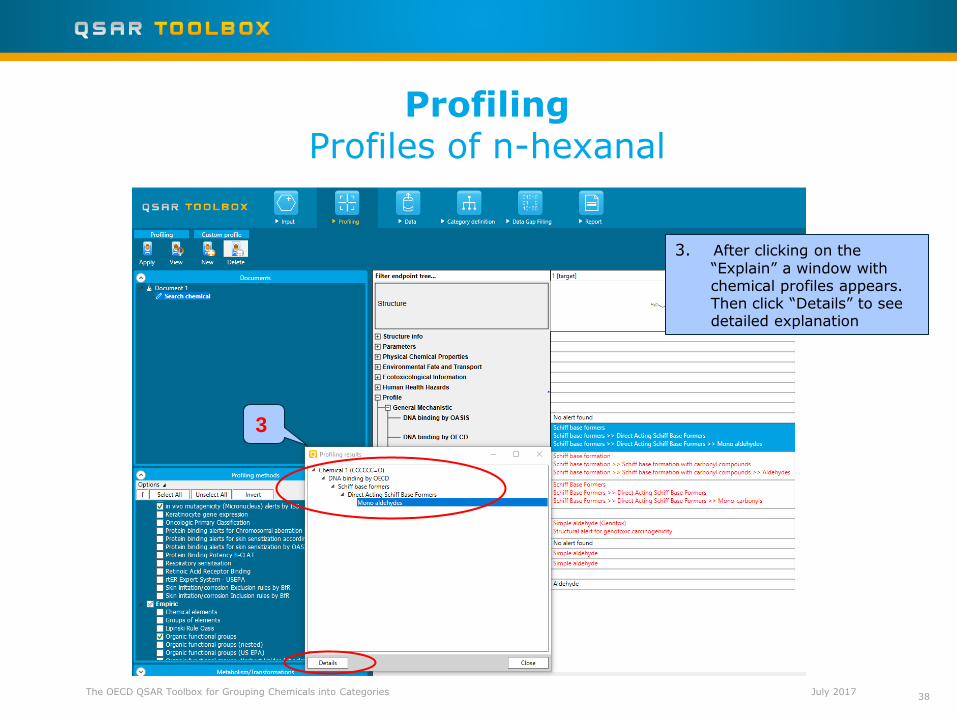
3. After clicking on the “Explain” a window with chemical profiles appears. Then click “Details” to see detailed explanation
3
The OECD QSAR Toolbox for Grouping Chemicals into Categories July 2017

Profiling DNA binding by OECD
of n-hexanal
1. Structural boundary of the category; 2. Definition of the used common fragments; 3. Mechanistic justification of the category (Literature tab)
39
1
2
3 3
The OECD QSAR Toolbox for Grouping Chemicals into Categories July 2017

Outlook
• Background
• Objectives
• Specific Aims
• Read-across
• The exercise
• Workflow of the exercise
•Chemical input
• Profiling
•Data
40
The OECD QSAR Toolbox for Grouping Chemicals into Categories July 2017

Data Overview
• As you should remember, “Data” refers to the electronic process of retrieving the fate and toxicity data that are stored in the Toolbox database.
• Note, data can be gathered in a global fashion (i.e., collecting all data of all endpoints) or on more narrowly defined settings (e.g., collecting data for a single or limited number of endpoints).
41
The OECD QSAR Toolbox for Grouping Chemicals into Categories July 2017

A new functionality for specifying databases containing data with desired endpoint is available
Data Case study
42
1. Click on Data; 2. Click on the box to open the nodes of the tree; 3. Mark the box related to the target endpoint; 4. From Databases / Options / Color by (pop-up menu) select Endpoint selected in the datamatrix
1
3
2
4
The OECD QSAR Toolbox for Grouping Chemicals into Categories July 2017

Data Case study
• In our example, we limit our data gathering to the common genotoxicity endpoints from databases containing genotoxicity data (Bacterial mutagenicity ISSSTY, Genotoxicity OASIS, Micronucleus ISSMIC, Micronucleus OASIS and Toxicity Japan MHLW) – see next slide.
• According to the legend in Databases / Options databases containing data related to selected endpoint are highlighted
in
The OECD QSAR Toolbox for Grouping Chemicals into Categories July 2017

Data Gather data
44
3
1. Go to Databases / Human Health Hazards section; 2. Select databases related to the target endpoint (slide 43); 3. Click Gather
1
2
The OECD QSAR Toolbox for Grouping Chemicals into Categories July 2017

Toxicity information on the target chemical is electronically collected from the selected datasets.
A window with “Read data?” appears. Now the user could choose to collect “all” or “endpoint specific” data.
Data Process of collecting data
45
Click OK to read all available data
The OECD QSAR Toolbox for Grouping Chemicals into Categories July 2017

In this example, an insert window appears stating that there was 2 data points available for the target chemical appears.
Data Process of collecting data
46 The OECD QSAR Toolbox for Grouping Chemicals into Categories July 2017
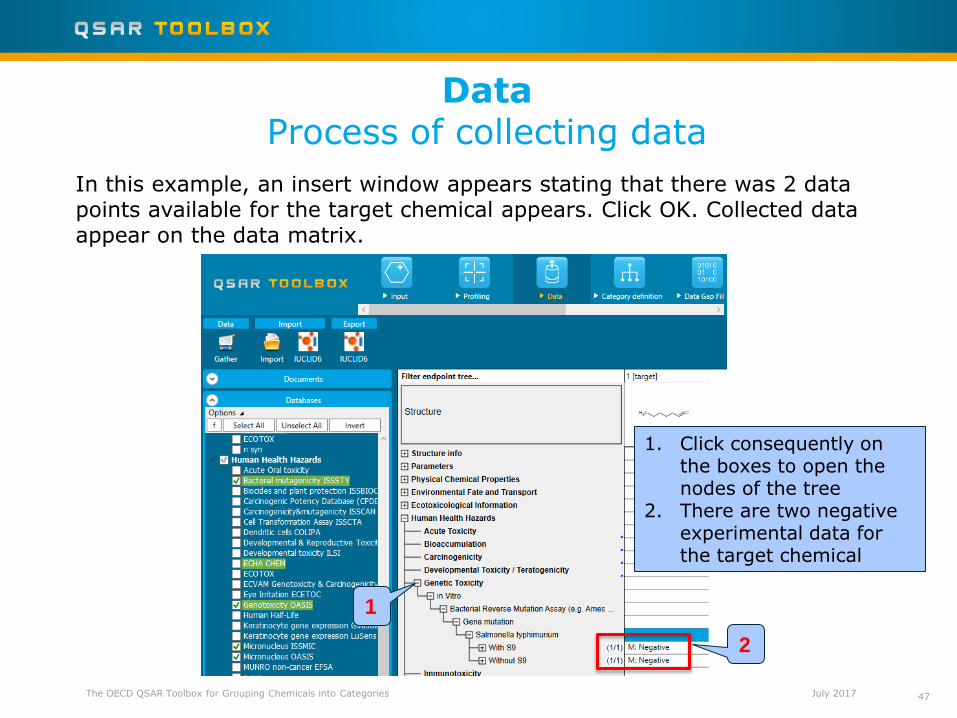
In this example, an insert window appears stating that there was 2 data points available for the target chemical appears. Click OK. Collected data appear on the data matrix.
Data Process of collecting data
47
1. Click consequently on the boxes to open the nodes of the tree
2. There are two negative experimental data for the target chemical
1
2
The OECD QSAR Toolbox for Grouping Chemicals into Categories July 2017

• You have entered the target chemical by SMILES and found a substance with CAS: 66-25-1 (n-hexanal).
• You have collected two negative experimental data for n-hexanal.
• We will try to reproduce the experimental data by making read-across.
• Click on “Category definition” to move to the next module.
Data Recap
48 The OECD QSAR Toolbox for Grouping Chemicals into Categories July 2017

Outlook
• Background
• Objectives
• Specific Aims
• Read-across
• The exercise
• Workflow of the exercise
•Chemical input
• Profiling
•Data
•Category definition
49 The OECD QSAR Toolbox for Grouping Chemicals into Categories July 2017

Category Definition Overview
• As stated in the previous tutorials, this module provides the user with several means of grouping chemicals into a toxicologically meaningful category that includes the target molecule.
• Remember, this is the critical step in the workflow of the Toolbox.
• Several options are available in the Toolbox to assist the user in defining the category definition.
50 The OECD QSAR Toolbox for Grouping Chemicals into Categories July 2017

• It is important to remember that mutagens are really cell-damaging agents, which can create a wide array of adverse effects beyond damage to DNA.
• Mechanistic profile of the target chemical is showed in this Section (see next screen shots).
Category Definition Side-Bar on Mutagens
51 The OECD QSAR Toolbox for Grouping Chemicals into Categories July 2017

Category Definition Grouping methods
• The different grouping methods allow the user to group chemicals into chemical categories according to different measures of “similarity” so that within a category data gaps can be filled by read-across.
• Detailed information about grouping chemical (Chapter 4) could be downloaded from:
http://www.oecd.org/dataoecd/58/56/46210452.pdf
• For this example, we will start from a broad group based on Organic functional group and after that
• Will refine the category by a specific DNA binding mechanism identified for the target chemical and find analogues which can bind by the same mechanism and for which experimental results are available.
52 The OECD QSAR Toolbox for Grouping Chemicals into Categories July 2017

Category Definition Defining Organic functional group
53
2
1. Select Organic functional groups; 2. Click Define; 3. The target category is Aldehydes; 4. Click OK
1
3
4
The OECD QSAR Toolbox for Grouping Chemicals into Categories July 2017
Category Definition Analogues
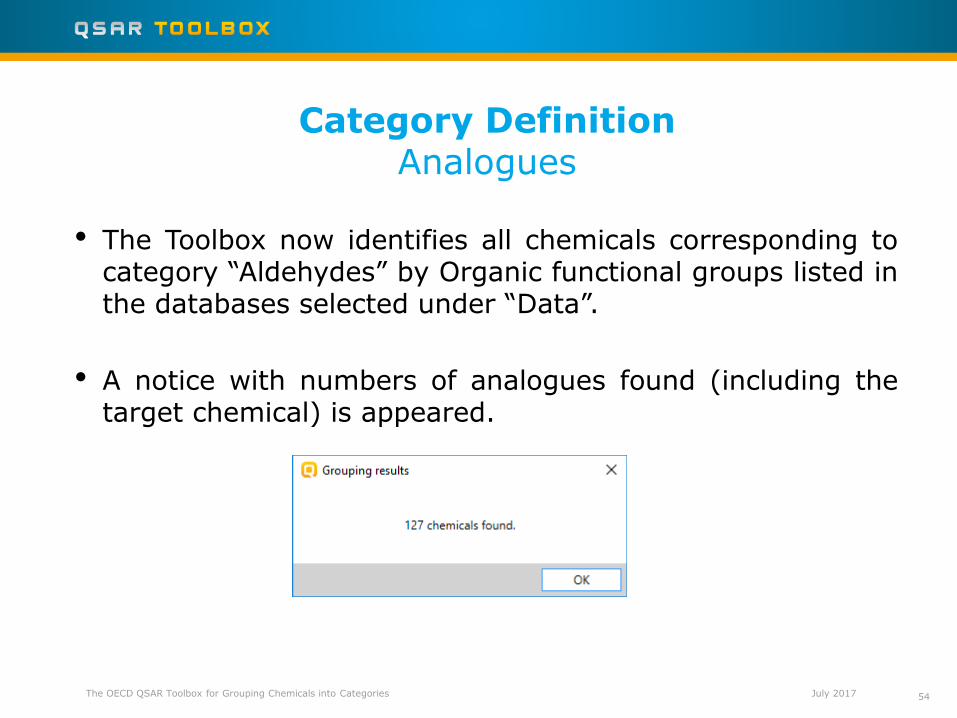
• The Toolbox now identifies all chemicals corresponding to category “Aldehydes” by Organic functional groups listed in the databases selected under “Data”.
• A notice with numbers of analogues found (including the target chemical) is appeared.
54 The OECD QSAR Toolbox for Grouping Chemicals into Categories July 2017

Category Definition Read data for Analogues
• The Toolbox automatically requests the user to select the endpoint that should be retrieved.
• The user can either select the specific endpoint or by default choose to retrieve data on all endpoints (see below)
55
• In this example, because only databases that contain information for genetic toxicity endpoint are selected, both options give the same results.
The OECD QSAR Toolbox for Grouping Chemicals into Categories July 2017

The experimental results for the analogues are inserted into the matrix.
Category Definition Summary information for Analogues
56 The OECD QSAR Toolbox for Grouping Chemicals into Categories July 2017

Category Definition Side-Bar of experimental data
Double-click on the cell with measured data to see detailed information in drop down box.
The OECD QSAR Toolbox for Grouping Chemicals into Categories July 2017
Category Definition Recap
• You have identified a category consisting of 127 analogous (“Aldehydes” by OFG classification) with the target chemical (n-hexanal).
• The available experimental data for these 127 similar chemicals are collected from the previously selected databases under Data section.
• The user can proceed with “Filling data gap” module, but before that he/she should navigate throw the endpoint tree and find the gap that will be filled in.
58 The OECD QSAR Toolbox for Grouping Chemicals into Categories July 2017
Category Definition Navigation throw the endpoint tree
• The user can navigate through the data tree by closing or opening the nodes of the tree.
• In this example, results from genotox testing are available (see next screen shot).
• In this example to see does the target is mutagenic or not, it is recommended to check subsequently the two mutagenic endpoints:
• Ames without S9
• Ames with S9
• By clicking on the nodes of endpoint tree open the tree to the target: Bacterial reverse mutation (Ames) assay without S9 (i.e., click on Human Health Hazards then click on Genetic Toxicity followed by in Vitro and Bacterial Reverse Mutation Assay (e.g. Ames Test), Gene Mutation, Salmonella typhimurium, Without S9) (see next screen shot).
59 The OECD QSAR Toolbox for Grouping Chemicals into Categories July 2017
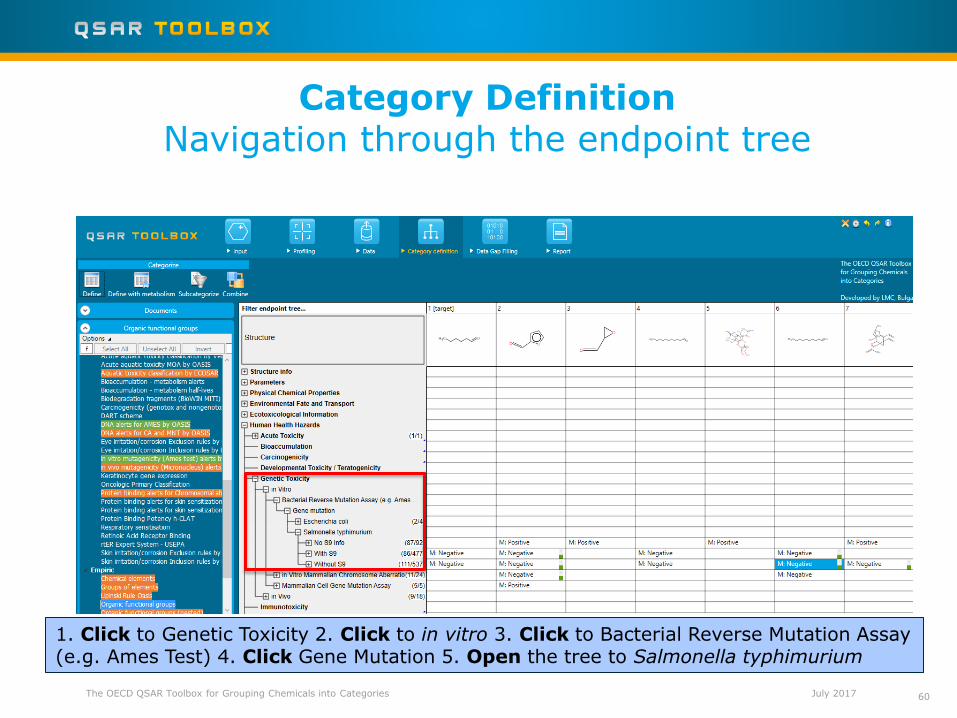
Category Definition Navigation through the endpoint tree
60
1. Click to Genetic Toxicity 2. Click to in vitro 3. Click to Bacterial Reverse Mutation Assay (e.g. Ames Test) 4. Click Gene Mutation 5. Open the tree to Salmonella typhimurium
The OECD QSAR Toolbox for Grouping Chemicals into Categories July 2017

Category Definition Navigation through the endpoint tree
61
In order to examine the target endpoint “Ames without S9”, select the cell as shown.
The OECD QSAR Toolbox for Grouping Chemicals into Categories July 2017

Category Definition Recap
• You have now retrieved the available experimental data on genetic toxicity for 111 chemicals classified as “Aldehydes” by OFG, found in the databases containing mutagenicity data.
• 537 experimental data for 111 chemicals have been found.
• You are now ready to fill in the data gap and trying to reproduce the experimental data of the target.
• In this example with qualitative mutagenicity data we can only use read-across.
62 The OECD QSAR Toolbox for Grouping Chemicals into Categories July 2017

Outlook
• Background
• Objectives
• Specific Aims
• Read-across
• The exercise
• Workflow of the exercise
•Chemical input
• Profiling
•Data
•Category definition
•Data Gap Filling
• Ames without S9
63 The OECD QSAR Toolbox for Grouping Chemicals into Categories July 2017

Data Gap Filling Preparing for Model domain save
In order to save model and export data for the analogues in Read-across analysis the user should preliminary create a custom profile (see this and the next few files)
1. Go to Input; 2. Click New; 3. Give a name to the new document; 4. Click OK
1
2
4
3
The OECD QSAR Toolbox for Grouping Chemicals into Categories July 2017

Data Gap Filling Preparing for Model domain save
1. Go to Profiling; 2. Click New (Custom profile); 3. Give a name to the new profile; 4. Click OK;
1
2
4
5. For save domain purposes “Linear or hierarchical scheme” should be chosen; 6. Click OK;
5 6
3
The OECD QSAR Toolbox for Grouping Chemicals into Categories July 2017
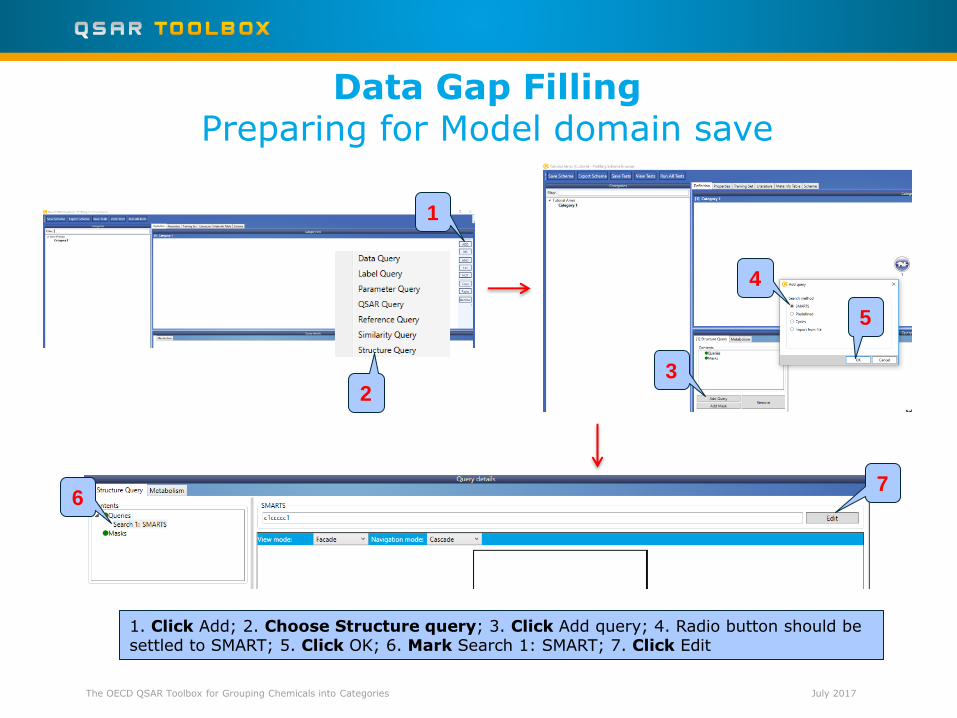
Data Gap Filling Preparing for Model domain save
1. Click Add; 2. Choose Structure query; 3. Click Add query; 4. Radio button should be settled to SMART; 5. Click OK; 6. Mark Search 1: SMART; 7. Click Edit
3
4
5
6 7
1
2
The OECD QSAR Toolbox for Grouping Chemicals into Categories July 2017

Data Gap Filling Preparing for Model domain save
In the SMART Editor input the target chemical (see slide 24);
1. Click Save scheme; 2. Click OK on the message evidencing scheme saving; 3. The newly created profile appears in the Custom section of Profiling methods;
1
2
3
The OECD QSAR Toolbox for Grouping Chemicals into Categories July 2017

Data Gap Filling (Ames without S9) Apply read-across
68
1
2
3
4
5
1. Click on Data Gap Filling; 2. The data endpoint box corresponding to Ames without S9 under the target chemical is already highlighted; 3. Click Read across button; 4. Choose desired strains; 5. Click OK.
The OECD QSAR Toolbox for Grouping Chemicals into Categories July 2017

Data Gap Filling (Ames without S9) Results of Read across
69 The OECD QSAR Toolbox for Grouping Chemicals into Categories July 2017

Data Gap Filling (Ames without S9) Interpreting Read-across
• The resulting plot outlines the experimental Ames results of all analogues (Y axis) according to a descriptor (X axis). Note, Log Kow is on the X-axis; while this descriptor is not significant to Ames data, it is the default descriptor for data gap filing (see next screen shot).
• The RED dot represents the predicted value for target chemical (see next screen shot).
• The PURPLE dots represent the observed value for the target neighbours (analogues) used for read-across (see next screen shot).
• The BLUE dots represent the experimental results available for the analogues but not used for read-across (see next screen shot).
• Please note LIGHT BLUE dots (which you will see shortly) represent analogues belonging to different subcategories.
70 The OECD QSAR Toolbox for Grouping Chemicals into Categories July 2017

Data Gap Filling (Ames without S9) Interpretation of the Read across
• Seven of the analogues are mutagenic in the Ames assays without S9, the rest analogues are non-mutagenic
• Non-mutagenic potential (Negative) is, therefore, predicted with confidence for the target chemical.
• However, before data gap filling it is recommended to check the similarity of the analogues used in the prediction (see next screen shot). This is performed in order to assure the category consists of analogues that are both mechanistically and structurally similar.
71 The OECD QSAR Toolbox for Grouping Chemicals into Categories July 2017

Data Gap Filling (Ames without S9)
Subcategorization by DNA binding by OASIS (endpoint specific)
72
1. Click Select / filter data; 2. Select Subcategorize 3. Select DNA alerts for AMES by OASIS (note the same highlighting according profiler relevancy is available) 4. Examine dissimilar chemicals – coloured in light blue on the plot 5. Click Remove selected.
1
2
3
4
5
The OECD QSAR Toolbox for Grouping Chemicals into Categories July 2017
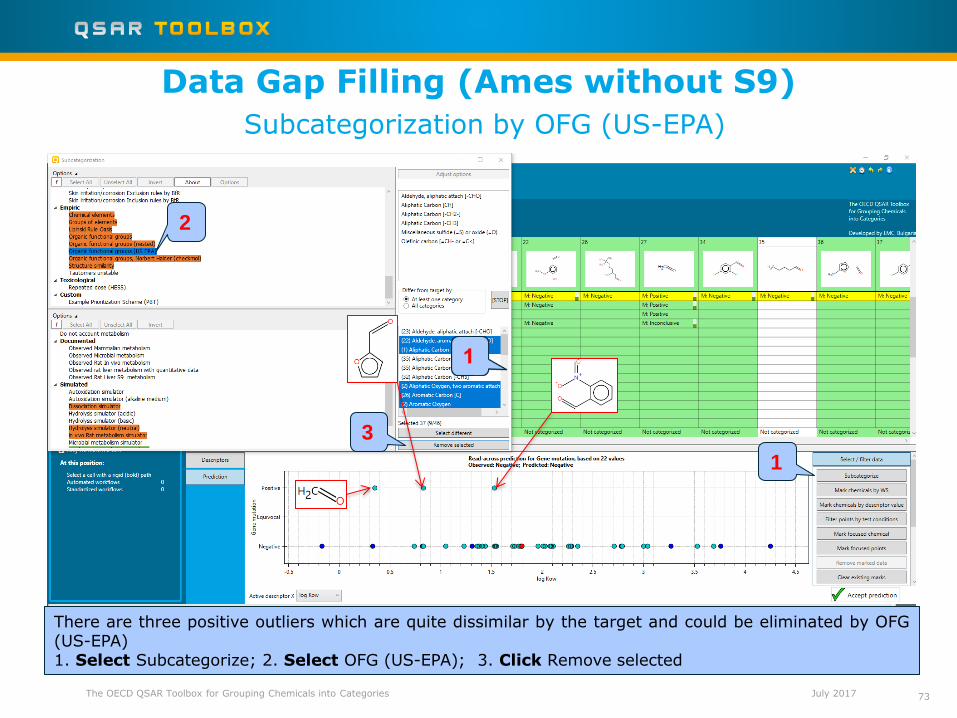
Data Gap Filling (Ames without S9)
Subcategorization by OFG (US-EPA)
73
There are three positive outliers which are quite dissimilar by the target and could be eliminated by OFG (US-EPA) 1. Select Subcategorize; 2. Select OFG (US-EPA); 3. Click Remove selected
1
2
3
The OECD QSAR Toolbox for Grouping Chemicals into Categories July 2017

Data Gap Filling (Ames without S9) Interpretation of the Read across
Now all analogues are structurally similar (Aldehydes) and negative by the experimental data. The prediction could be accepted by: 1. Click on “Accept prediction”;
74
1
The OECD QSAR Toolbox for Grouping Chemicals into Categories July 2017

Data Gap Filling (Ames without S9) Interpretation of the Read across
75
• A message appears:
• Clicking on No allows to continue with the subcategorization
• Click Yes to accept prediction
The OECD QSAR Toolbox for Grouping Chemicals into Categories July 2017

Data Gap Filling (Ames without S9) Results
• By accepting the prediction the data gap is filled.
• The read-across for the current endpoint is finished.
• The screen is returned back to the Matrix
• The user can proceed with the workflow for the second endpoint, which in this case will be “Ames with S9” (see next screen shot).
76 The OECD QSAR Toolbox for Grouping Chemicals into Categories July 2017

Data Gap Filling (Ames without S9) Results
77
1. This is the prediction for the first endpoint. 2. This is the data gap for the second endpoint.
1
2
The OECD QSAR Toolbox for Grouping Chemicals into Categories July 2017
Outlook
• Background
• Objectives
• Specific Aims
• Read-across
• The exercise
• Workflow of the exercise
•Chemical input
• Profiling
•Data
•Category definition
•Data Gap Filling
• Ames without S9
• Ames with S9
78 The OECD QSAR Toolbox for Grouping Chemicals into Categories July 2017

Data Gap Filling (Ames with S9)
• Do this the same way as with Ames without S9.
• Make sure Data Gap Filling is highlighted.
• Highlight the data endpoint box; Now it should correspond to Ames with S9.
• Select Read across.
• Choose desired strains.
79 The OECD QSAR Toolbox for Grouping Chemicals into Categories July 2017

Data Gap Filling (Ames with S9) Results of Read across
80 The OECD QSAR Toolbox for Grouping Chemicals into Categories July 2017
Data Gap Filling (Ames with S9) Results of Read across
• As with Ames without S9, before accepting the estimated result for the target chemical, by read-across the user should refined the category by subcategorization.
• Subcategorization refers to the process of applying additional profilers to the previously defined category, identifying chemicals which have differing profiling results and eventually eliminating these chemicals from the category.
• In this example, we are going to use several different profilers to repeatedly subcategorise the data set.
81 The OECD QSAR Toolbox for Grouping Chemicals into Categories July 2017

Data Gap Filling (Ames with S9) Side Bar of Subcategorization
The analogues which are dissimilar to the target chemical with respect to:
- DNA binding alerts (endpoint specific) taking into account liver metabolism – The categorization based on this profiler identifies analogues having same DNA binding alerts as the target after metabolic activation
- Organic functional groups (US-EPA) – The categorization based on this profiler identifies analogues having the same organic functional groups
can be removed from the initial list of analogues previously defined by OFG.
82 The OECD QSAR Toolbox for Grouping Chemicals into Categories July 2017
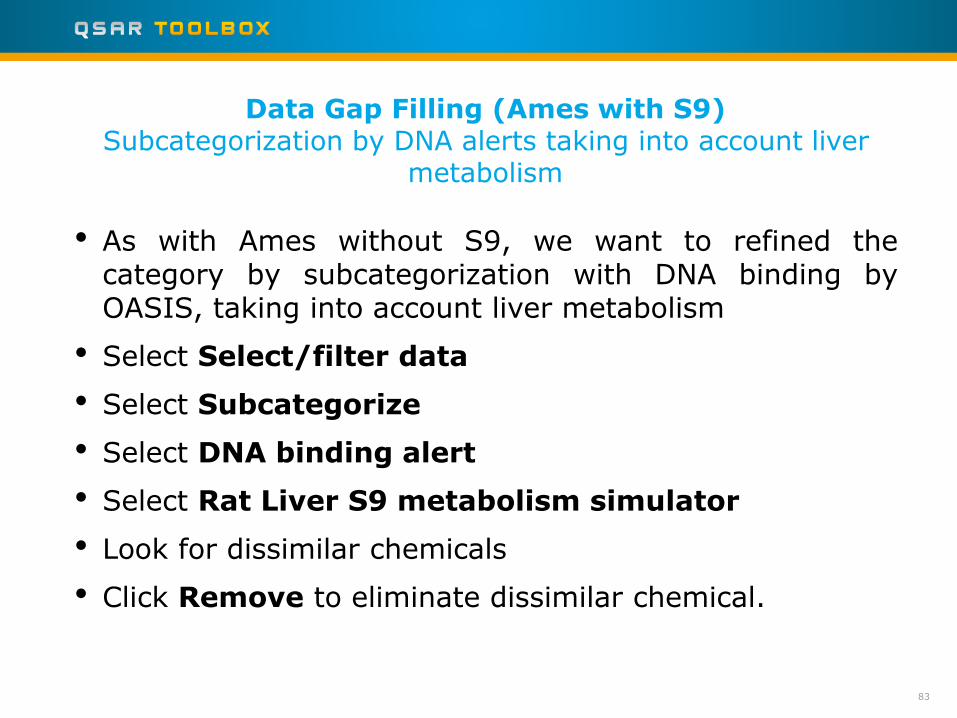
• As with Ames without S9, we want to refined the category by subcategorization with DNA binding by OASIS, taking into account liver metabolism
• Select Select/filter data
• Select Subcategorize
• Select DNA binding alert
• Select Rat Liver S9 metabolism simulator
• Look for dissimilar chemicals
• Click Remove to eliminate dissimilar chemical.
Data Gap Filling (Ames with S9) Subcategorization by DNA alerts taking into account liver
metabolism
83

Data Gap Filling (Ames with S9) Subcategorization by DNA binding alerts taking into account Rat
liver metabolism
84
1. Select Select/Filter data 2. Click Subcategorize 3. Select DNA alerts for AMES by OASIS 4. Select Rat liver metabolism simulator from the bottom window 5. Click Remove selected
1
2
3
4
5
The OECD QSAR Toolbox for Grouping Chemicals into Categories July 2017

• As with Ames without S9, we want to refined the category by subcategorization with OFG (US-EPA)
• Select Select/filter data
• Select Subcategorize
• Select Organic functional groups (US-EPA)
• Unselect Do not account metabolism
• Look for dissimilar chemicals
• Click Remove to eliminate dissimilar chemical.
Data Gap Filling (Ames with S9) Subcategorization by OFG (US-EPA)
85 The OECD QSAR Toolbox for Grouping Chemicals into Categories July 2017
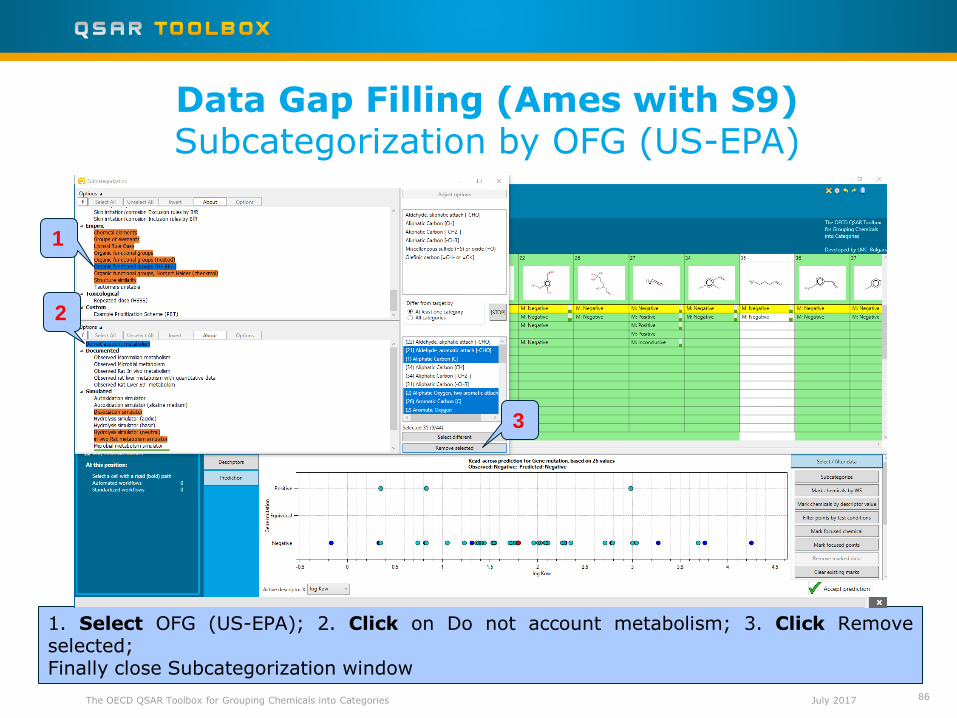
1. Select OFG (US-EPA); 2. Click on Do not account metabolism; 3. Click Remove selected; Finally close Subcategorization window
Data Gap Filling (Ames with S9) Subcategorization by OFG (US-EPA)
86
1
2
3
The OECD QSAR Toolbox for Grouping Chemicals into Categories July 2017

Data Gap Filling (Ames with S9) Result of read-across
87
1. A blue helper appears in top right of the screen. By clicking on it the message can be read. Now all 6 analogues are structurally and mechanistically similar, then the prediction could be accepted or saved as a category (domain) in the custom profiler, which could be used further for screening purposes. This could be done by 2. Deselect Select / filter data 3. Click on Model/(Q)SAR; 4. Click on Save domain as category 5. Since a custom profiler has previously been defined, highlight custom profiler and 6. Click OK.
1
2
3
4
5
6
The OECD QSAR Toolbox for Grouping Chemicals into Categories July 2017

Data Gap Filling (Ames with S9) Result of read-across
1. Type a name of the category in the “Name” box; 2. Click OK; 3. Click OK on the message evidencing domain saving; 4. The result can be seen through Profiling / Profiling methods / Right click on the Custom profile / View scheme. The individual steps are presented in different boundaries.
88
1
2
3
4
The OECD QSAR Toolbox for Grouping Chemicals into Categories July 2017

Data Gap Filling (Ames with S9) Result of read-across
1. Click Accept prediction 2. Click Yes if you want to Accept prediction 3. Click No if you decided to continue Subcategorization. 4. Click OK on the message
89
1
2 3
4
The OECD QSAR Toolbox for Grouping Chemicals into Categories July 2017

Data Gap Filling (Ames with S9) Result of read-across
The OECD QSAR Toolbox for Grouping Chemicals into Categories July 2017

Outlook
• Background
• Objectives
• Specific Aims
• Read-across
• The exercise
• Workflow of the exercise
•Chemical input
• Profiling
•Data
•Category definition
•Data Gap Filling
•Report
91 The OECD QSAR Toolbox for Grouping Chemicals into Categories July 2017

Report Overview
• Report module could generate Prediction report and Data matrix report for each of predictions performed with the Toolbox.
• It is necessary just the cell with the desired prediction to be marked and then to click on the respective button.
• Report module contains predefined reports. The user can choose how to customize them.
• The Prediction and Data matrix report can be saved respectively in PDF / MS Excel formats. (see next screen shot).
92 The OECD QSAR Toolbox for Grouping Chemicals into Categories July 2017

Report Generate Report
93
1. Select Report; 2. Mark the desired prediction cell; 3. Click Prediction; 4. Customize the report; 5. Choose type of the report;
1
2
3
4
6
The OECD QSAR Toolbox for Grouping Chemicals into Categories July 2017
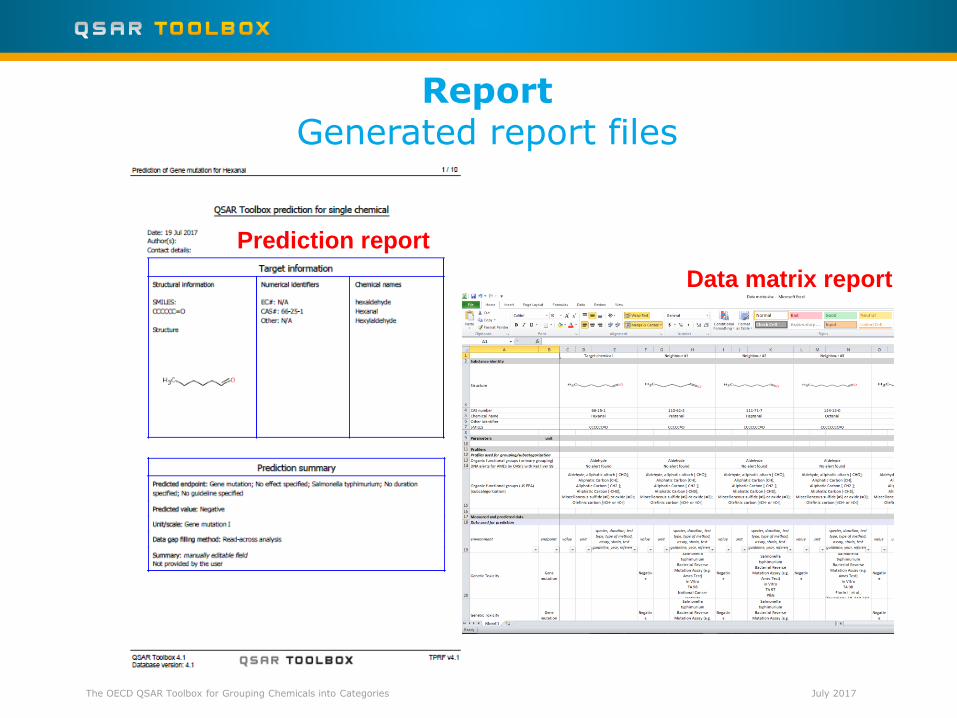
Report Generated report files
Prediction report
Data matrix report
The OECD QSAR Toolbox for Grouping Chemicals into Categories July 2017

Outlook
• Background
• Objectives
• Specific Aims
• Read-across
• The exercise
• Workflow of the exercise
• Save the prediction
95 The OECD QSAR Toolbox for Grouping Chemicals into Categories July 2017

Saving the prediction result
96
• This functionality allow storing/restoring the current state of Toolbox documents including loaded chemicals, experimental data, profiles, predictions etc, on the same computer. The functionality is implemented based on saving the sequence of actions that led to the current state of the Toolbox document and later executing these actions in the same sequence in order to get the same result(s).
• Saving/Loading the file with TB prediction is shown on next screenshots
The OECD QSAR Toolbox for Grouping Chemicals into Categories July 2017

Saving the prediction result
97
1. Go to Input section; 2.Click on Save button; 3. Click OK; 4. Define name of the file; 5. Click Save button (Message “File saved successfully”
1
2
3
4 5
The OECD QSAR Toolbox for Grouping Chemicals into Categories July 2017

Open saved file
98
1. Create new document; 2. Click Open; 3. Find and select file; 4. Click Open;
1
2
3
4
The OECD QSAR Toolbox for Grouping Chemicals into Categories July 2017

Open saved file
99
The file is opened successfully 1. Click OK; 2. Click OK;
The OECD QSAR Toolbox for Grouping Chemicals into Categories July 2017
1 2

Congratulation
• By now you should feel comfortable with the six basic modules of the Toolbox and how they form the work flow of the Toolbox.
• In this tutorial you have now been introduced to several additional functions in the Toolbox, especially using different profilers in subcategorizing the category of the target chemical.
• Remember proficiency only comes with practice.
The OECD QSAR Toolbox for Grouping Chemicals into Categories July 2017 100