OECD Information Technology Outlook · The Information Technology Outlook 2002 has been prepared by...
325
2002 OECD Information Technology Outlook ICTs AND THE INFORMATION ECONOMY «
-
Upload
dinhnguyet -
Category
Documents
-
view
218 -
download
0
Transcript of OECD Information Technology Outlook · The Information Technology Outlook 2002 has been prepared by...

OECD Information Technology OutlookICTs AND THE INFORMATION ECONOMY
20022002
2002
OE
CD
Info
rma
tion
Te
ch
no
log
y O
utlo
ok
OECD InformationTechnology Outlook
ICTs AND THE INFORMATIONECONOMY
«Information technology (IT) continues to be a major driver of economic change, restructuringbusinesses, affecting skills and employment, and contributing significantly to growth andwealth creation. This volume describes the main trends in industries and businesses supplying IT goods and services. It looks at the impact of IT diffusion and applications, aswell as the growing importance of network effects as the use of IT expands. It describesrecent market dynamics and gives a detailed overview of the globalisation of the informationand communication technology (ICT) sector. It also analyses the increasingly important software sector and examines the growth in electronic commerce as well as some of thebarriers to its expansion.
This volume also looks at developments in the provision and use of ICT skills, mismatchesbetween supply and demand and potential remedies. It traces the diffusion of ICTs and examines the digital divide among individuals, households and businesses, then highlightsthe potential of selected technological developments that will affect the commercial exploitationand socio-economic impacts of ICTs in the medium term.
Finally, it provides an overview of IT policies in OECD countries, particularly those aimed atexpanding the supply and use of ICT skills and overcoming the digital divide.
National IT policy profiles are available at the following URL: www.oecd.org/sti/information-economy
-:HSTCQE=V^\ZYV:ISBN 92-64-19754-093 2002 02 1P
www.oecd.org
OECD's books, periodicals and statistical databases are now available via www.SourceOECD.org, our online library.
This book is available to subscribers to the following SourceOECD themes:Science and Information TechnologySocial Issues/Migration/Health
Ask your librarian for more details on how to access OECD books on line, or write to us at

© OECD, 2002.
© Software: 1987-1996, Acrobat is a trademark of ADOBE.
All rights reserved. OECD grants you the right to use one copy of this Program for your personal use only. Unauthorised reproduction,lending, hiring, transmission or distribution of any data or software is prohibited. You must treat the Program and associated materialsand any elements thereof like any other copyrighted material.
All requests should be made to:
Head of Publications Service,OECD Publications Service,2, rue André-Pascal, 75775 Paris Cedex 16, France.
OECD InformationTechnology Outlook
ICTs AND THE INFORMATION ECONOMY
2002
ORGANISATION FOR ECONOMIC CO-OPERATION AND DEVELOPMENT

ORGANISATION FOR ECONOMIC CO-OPERATION AND DEVELOPMENT
Pursuant to Article 1 of the Convention signed in Paris on 14th December 1960, and which came intoforce on 30th September 1961, the Organisation for Economic Co-operation and Development (OECD)shall promote policies designed:
– to achieve the highest sustainable economic growth and employment and a rising standard ofliving in Member countries, while maintaining financial stability, and thus to contribute to thedevelopment of the world economy;
– to contribute to sound economic expansion in Member as well as non-member countries in theprocess of economic development; and
– to contribute to the expansion of world trade on a multilateral, non-discriminatory basis inaccordance with international obligations.
The original Member countries of the OECD are Austria, Belgium, Canada, Denmark, France,Germany, Greece, Iceland, Ireland, Italy, Luxembourg, the Netherlands, Norway, Portugal, Spain,Sweden, Switzerland, Turkey, the United Kingdom and the United States. The following countriesbecame Members subsequently through accession at the dates indicated hereafter: Japan(28th April 1964), Finland (28th January 1969), Australia (7th June 1971), New Zealand (29th May 1973),Mexico (18th May 1994), the Czech Republic (21st December 1995), Hungary (7th May 1996), Poland(22nd November 1996), Korea (12th December 1996) and the Slovak Republic (14th December 2000). TheCommission of the European Communities takes part in the work of the OECD (Article 13 of the OECDConvention).
Publié en français sous le titre :
Perspectives des technologies de l’information de l’OCDELES TIC ET L’ÉCONOMIE DE L’INFORMATION
2002
© OECD 2002Permission to reproduce a portion of this work for non-commercial purposes or classroom use should be obtainedthrough the Centre français d’exploitation du droit de copie (CFC), 20, rue des Grands-Augustins, 75006 Paris,France, tel. (33-1) 44 07 47 70, fax (33-1) 46 34 67 19, for every country except the United States. In the United Statespermission should be obtained through the Copyright Clearance Center, Customer Service, (508)750-8400,222 Rosewood Drive, Danvers, MA 01923 USA, or CCC Online: www.copyright.com. All other applications forpermission to reproduce or translate all or part of this book should be made to OECD Publications, 2, rue André-Pascal,75775 Paris Cedex 16, France.

3
FOREWORD
The Information Technology Outlook 2002 has been prepared by the OECD under the guidance of theOECD Committee for Information, Computer and Communications Policy (ICCP), and in particular itsWorking Party on the Information Economy. It is the sixth in a biennial series designed to provideMember countries with a broad overview of trends and near-term prospects in the informationtechnology (IT) industry, an analysis of the growing impact of IT on the economy and society, newdevelopments in selected areas of information technology and a description of IT policy directions.
Building on the 2000 edition, the 2002 edition further extends the economic and policy analysis.The first three chapters provide an overview of the importance of information and communicationtechnologies (ICTs) in national economies, describe recent market dynamics and examine some of theimpacts of the use of ICTs, give a detailed overview of the globalisation of the ICT sector and provide athorough analysis of the increasingly important software sector. The next three chapters describe thegrowing use of electronic commerce, rapidly evolving developments in the provision and use of ICTskills and the diffusion of ICTs and the digital divide. The last two chapters examine selectedtechnological developments that will shape ICT exploitation and socio-economic impacts in themedium term and provide an overview of IT policies in OECD countries. Detailed statistical tables areprovided in Annex 2. Information technology policy profiles are posted separately on the OECD Website to enable their widespread diffusion (www.oecd.org/sti/information-economy).
The IT Outlook 2002 was prepared by: Graham Vickery, Vladimir López-Bassols, Catalina Martinez,Pierre Montagnier and Elizabeth Muller of the OECD's Information, Computer and Communications PolicyDivision; Alessandra Colecchia, Elena Anton-Zabalza and Andrew Devlin of the Economic Analysis andStatistics Division (Chapter 4); and John Houghton (consultant). It benefited from valuable contributionsfrom Delegates to the ICCP Committee's Working Party on the Information Economy, under thechairmanship of Mr. Richard Simpson (Canada), particularly regarding national IT policy developmentsand up-to-date national statistics on the production and use of IT goods and services.
The report is published on the responsibility of the Secretary-General of the OECD.
© OECD 2002

5
TABLE OF CONTENTS
Highlights.............................................................................................................................................................................. 13
Chapter 1. ICTs and their Role in the Economy.............................................................................................................. 21
ICTs and their contribution to growth and economic performance .................................................................. 21The ICT-producing sector ....................................................................................................................................... 23
The growing role of ICTs across the economy...................................................................................................... 45
Conclusion................................................................................................................................................................ 60
Appendix. ICT Firms ............................................................................................................................................................ 61
Notes ..................................................................................................................................................................................... 77
References ............................................................................................................................................................................ 78
Chapter 2. Globalisation of the ICT Sector ..................................................................................................................... 79
Globalisation of the ICT sector .............................................................................................................................. 79
Conclusion................................................................................................................................................................ 100
Notes ..................................................................................................................................................................................... 102
References ............................................................................................................................................................................ 104
Chapter 3. The Software Sector........................................................................................................................................ 105
Growth trends .......................................................................................................................................................... 105
R&D in the software sector..................................................................................................................................... 108
Software patents...................................................................................................................................................... 108
Software as an intangible investment................................................................................................................... 110
International trade and foreign direct investment.............................................................................................. 110
Domestic markets.................................................................................................................................................... 112
Packaged software................................................................................................................................................... 114
Industry structure .................................................................................................................................................... 116
Conclusion................................................................................................................................................................ 123
Notes ..................................................................................................................................................................................... 124
References ............................................................................................................................................................................ 126
Chapter 4. E-commerce Intensity...................................................................................................................................... 129
Introduction.............................................................................................................................................................. 129
Defining and measuring electronic commerce transactions.............................................................................. 130
The use of the Internet in transaction-related business processes ................................................................. 131Volume and nature of e-commerce transactions................................................................................................. 139
Drivers and inhibitors of electronic commerce transactions ............................................................................. 148
Conclusion................................................................................................................................................................ 152
Notes ..................................................................................................................................................................................... 154
References ............................................................................................................................................................................ 155
© OECD 2002

OECD Information Technology Outlook 2002
6
Chapter 5. ICT Skills and Employment ............................................................................................................................ 157
Knowledge, skills and IT ........................................................................................................................................ 157Measuring the IT workforce.................................................................................................................................... 159Shortages of IT workers? Data and analysis......................................................................................................... 161Enterprise responses to labour market conditions ............................................................................................ 164The supply of IT workers ........................................................................................................................................ 165Defining and identifying IT skill requirements ................................................................................................... 169Policy options and action ....................................................................................................................................... 171Conclusion................................................................................................................................................................ 176
Appendix. NWCET Information Technology Skill Standards.......................................................................................... 178
Notes ..................................................................................................................................................................................... 180
References ............................................................................................................................................................................ 182
Chapter 6. ICT Diffusion and the Digital Divide............................................................................................................. 187
Indicators of ICT access and use ........................................................................................................................... 187Leaders and laggards: households and individuals........................................................................................... 198Leaders and laggards: business and government .............................................................................................. 209Conclusion................................................................................................................................................................ 216
Notes ..................................................................................................................................................................................... 217
References ............................................................................................................................................................................ 218
Chapter 7. Technology Trends in the ICT Sector ........................................................................................................... 221
Current technological trends ................................................................................................................................. 221Conclusion................................................................................................................................................................ 234
Notes ..................................................................................................................................................................................... 235
References ............................................................................................................................................................................ 236
Chapter 8. IT Policies .......................................................................................................................................................... 239
Overview of IT policies ........................................................................................................................................... 239Policies for ICT skills ............................................................................................................................................... 248Policies to address the digital divide................................................................................................................... 250Conclusion................................................................................................................................................................ 253
Appendix............................................................................................................................................................................... 254
Notes ..................................................................................................................................................................................... 263
References ............................................................................................................................................................................ 264
Annex 1. Methodology and Definitions......................................................................................................................... 265Annex 2. Annex Tables..................................................................................................................................................... 271
List of Boxes
Chapter 1 – Appendix
A1.1. Methodology used for identifying ICT firms ........................................................................................................ 61A1.2. The shift to services: the case of IBM ................................................................................................................... 68A1.3. Large and small firms: outsourcing, networking and changing growth models............................................... 71
Chapter 2
1. ICTs in the evolving profile of FDI in China ......................................................................................................... 89
Chapter 4
1. Measuring electronic commerce transactions ..................................................................................................... 1322. Results from the OECD Electronic Commerce Business Impacts Project (EBIP) ............................................ 138
© OECD 2002

Table of Contents
7
Chapter 5
1. Human capital, labour and growth ........................................................................................................................ 1582. IT degrees and gender............................................................................................................................................ 1673. Foreign ICT worker programmes in various OECD countries ............................................................................ 170
Chapter 6
1. ICT access in schools............................................................................................................................................... 194
Chapter 7
1. The development of alternative Internet access routes .................................................................................... 2262. Linux.......................................................................................................................................................................... 2273. Napster ..................................................................................................................................................................... 232
Chapter 8
1. The Ottawa Declaration on Authentication for Electronic Commerce.............................................................. 2442. Broadband policies................................................................................................................................................. 2463. Policies for the software sector .............................................................................................................................. 247
List of Tables
Chapter 1
1. Computer equipment trade, 1990-2000 ............................................................................................................... 342. Communication equipment trade, 1990-2000 ..................................................................................................... 353. Electronic component trade, 1990-2000 ............................................................................................................... 364. Software products trade, 1996-2000...................................................................................................................... 385. Software products: leading exporting and importing countries, 2000.............................................................. 386. Trade in ICT services, 2000..................................................................................................................................... 397. World semiconductor market shares by region, 1995 and 2000 ........................................................................ 52
A1.1. Top 50 ICT firms ....................................................................................................................................................... 63A1.2. Top 10 communication equipment and systems firms....................................................................................... 65A1.3. Top 10 electronics and components firms ........................................................................................................... 66A1.4. Top 10 IT equipment and systems firms .............................................................................................................. 66A1.5. Top 10 IT services firms .......................................................................................................................................... 67A1.6. Top 10 software firms .............................................................................................................................................. 67A1.7. Top 10 telecommunications firms ......................................................................................................................... 69A1.8. Top 25 Internet firms, 2001..................................................................................................................................... 72A1.9. Top 25 Internet firms by industry and activity..................................................................................................... 73
A1.10. Primary SIC and activity description of the top 10 ICT firms by sector ............................................................ 74
Chapter 2
1. US intra-firm trade by industry, 2000 .................................................................................................................... 872. ICT-sector foreign affiliates operating in the United States, 1998..................................................................... 913. Foreign affiliates of US firms, 1998 ........................................................................................................................ 914. US exports and imports associated with US parents and their affiliates, 1998 ............................................... 925. Foreign-owned enterprises in Sweden’s ICT sector, 2000.................................................................................. 926. Country of origin of foreign-owned enterprises in Sweden’s ICT sector, 2000................................................. 93
Chapter 3
1. Top 20 software vendors, 2000............................................................................................................................... 1182. Leading vendors worldwide by license and service revenues, 1999 ............................................................... 1193. European and US software venture capital investments, 1996-2001................................................................ 123
© OECD 2002
OECD Information Technology Outlook 2002
8
Chapter 4
1. OECD definitions of electronic commerce transactions and proposed guidelinesfor their interpretation............................................................................................................................................ 131
2. Business processes related to selling activities over the Web, the Internet and computer-mediatednetworks, 2000 ......................................................................................................................................................... 139
3. Indicators of consumers’ transactions over the Internet in selected OECD countries, 2000......................... 142
Chapter 5
1. Employment in IT-related occupations by skill level in the United States, 2000........................................... 1602. Estimated unfilled vacancies in IT and e-business in Europe, 2001 and 2003 ............................................... 1623. Firm strategies for coping with skills shortages .................................................................................................. 1644. Worldwide commercial IT certifications, early 2000............................................................................................ 1675. Leading employers of H-1B visa holders, petitions approved by the INS between October 1999
and February 2000................................................................................................................................................... 1696. Annual growth in compensation for workers in software firms in the United States, 1997-99....................... 1717. Assessing costs and benefits of human capital investment .............................................................................. 1738. ICT skills: issues and actions ................................................................................................................................. 1749. Examples of PCs/Internet for employees programmes in various firms .......................................................... 176
A5.1. H-1 visas granted in the United States by country of origin, 1989-99 .............................................................. 179
Chapter 6
1. Internet usage in Finland, 1996-2001.................................................................................................................... 1962. Locations used by adults to access the Internet for personal use in the United Kingdom,
July 2000 and 2001 ................................................................................................................................................... 1973. Households with a PC and Internet access, United States, 2001 ...................................................................... 2014. Internet and gender ................................................................................................................................................ 2035. Urban regions have better access than rural ones.............................................................................................. 2056. Use of a computer and the Internet at work affects use at home ..................................................................... 2067. ICT use within government in Finland.................................................................................................................. 2148. IT equipment installations at national government level in Japan, 1999 ........................................................ 2149. Households in Canada using the Internet from home, by purpose of use...................................................... 215
10. Adults accessing government services via the Internet in Australia for private purposes, 2000.................. 21511. Importance of government services over the Internet in Australia and in Finland........................................ 216
Chapter 7
1. Capabilities of different access technologies...................................................................................................... 226
Chapter 8
1. Summary of OECD country IT policy responses.................................................................................................. 2402. Summary of OECD country digital divide policy responses ............................................................................. 2513. Comparative policy emphasis by groups of OECD economies......................................................................... 252
A8.1. Examples of policy actions and recommendations for building ICT skills ...................................................... 254A8.2. Digital divide policy examples by groups of OECD economies ....................................................................... 258
Annex Tables
1.1. Worldwide production of ICT goods, 1999 ........................................................................................................... 2721.2. Exports and imports of ICT equipment, 1990-2000............................................................................................. 2731.3. Trade in computer equipment, 1990-2000........................................................................................................... 2741.4. Trade in communication equipment, 1990-2000................................................................................................. 2751.5. Trade in electronic components, 1990-2000 ........................................................................................................ 2761.6. Trade in software products, 1996-2000 ................................................................................................................. 2771.7. Communication and computer and information services, 2000........................................................................ 2782.1. Compound annual growth in electronics equipment trade and production in Europe
and other regions, 1992-99..................................................................................................................................... 2792.2. Grubel-Lloyd index for ICT equipment trade, 1990-2000 .................................................................................. 2802.3. US intra-firm trade by region, 2000 ....................................................................................................................... 280
© OECD 2002

Table of Contents
9
2.4. World FDI, cross-border M&As and activities of affiliates, 1990-2000 .............................................................. 2812.5. World FDI flows and stocks in ICT-related industries, 1988 and 1997 .............................................................. 2822.6. FDI flows into ICT and office machinery manufacturing, 1990-99...................................................................... 2832.7. FDI flows into telecommunications, 1990-99 ....................................................................................................... 2842.8. Activities of affiliates worldwide, 1990-2000 ........................................................................................................ 2842.9. ICT-sector transnational corporations among the top 100 companies, ranked by foreign assets in 1999 ... 285
2.10. ICT-sector affiliates under majority control.......................................................................................................... 2862.11. Employment by ICT-sector affiliates..................................................................................................................... 2872.12. Value added for ICT sector affiliates..................................................................................................................... 2882.13. Exports of ICT-sector affiliates ............................................................................................................................... 2892.14. R&D expenditure by ICT-sector affiliates............................................................................................................. 2902.15. Sales by foreign affiliates in the United States, by country, 1998..................................................................... 2902.16. Sales by US affiliates overseas, 1998 .................................................................................................................... 2912.17. Foreign-owned enterprises in Sweden’s ICT sector, 2000.................................................................................. 2912.18. Swedish-owned ICT sector enterprises operating overseas, 1999.................................................................... 2922.19. Total and ICT cross-border M&As, 1990-2000 ...................................................................................................... 2922.20. Top 25 ICT M&A deals, 1990-2000 ......................................................................................................................... 2932.21. Cross-border M&As by ICT industry, 1990-2000 .................................................................................................. 2942.22. Cross-border M&As by ICT industry target, 1990-2000....................................................................................... 2952.23. Cross-border M&As by ICT-industry acquirer, 1990-2000................................................................................... 2962.24. Cross-border ICT M&As (outflows), 1990-2000..................................................................................................... 2972.25. Cross-border ICT M&As (inflows), 1990-2000 ....................................................................................................... 2982.26. Top 20 M&A deals targeting communication equipment manufacturing, 1990-2000 ..................................... 2992.27. Top 20 M&A deals targeting computer and office equipment manufacturing, 1990-2000 ............................. 3002.28. Top 20 M&A deals targeting electronic equipment and components manufacturing, 1990-2000 ................ 3012.29. Top 20 M&A deals targeting computer services, 1990-2000............................................................................... 3022.30. Top 20 M&A deals targeting communications services, 1990-2000................................................................... 3032.31. Top 20 M&A deals targeting ICT wholesaling, 1990-2000 ................................................................................... 3042.32. Top 20 M&A deals targeting media and content, 1990-2000.............................................................................. 3052.33. Cross-border strategic alliances in the ICT sector, 1990-2000............................................................................ 3062.34. Cross-border joint ventures and strategic alliances in the ICT sector, 1990-2000........................................... 3072.35. Basis of cross-border strategic alliances in the ICT sector, 1990-2000.............................................................. 3072.36. ICT sector cross-border strategic alliances by OECD countries, 1990-2000..................................................... 3082.37. Cross-border R&D strategic alliances in the ICT sector, 1990-2000................................................................... 309
3.1. Value added in computer and related activities in selected OECD countries, 1993-2000............................ 3103.2. Value added in software and computer-related activities in the United States, 1990-2000 ......................... 3113.3. Employment in computer and related activities in selected OECD countries, 1993-2000............................ 3123.4. US employment in software and computer services, 1990-2001....................................................................... 3123.5. BERD in computer and related activities as a share of total BERD, 1990-2000 .............................................. 3133.6. Share of BERD in computer and related activities funded by government, 1990-99..................................... 3143.7. Number of patents granted by class and year in the United States, 1990-99 ................................................. 3153.8. Number of patents granted in the United States that include the word “software” in the description,
1990-99...................................................................................................................................................................... 3163.9. Number of patents granted to major software vendors in the United States which include
the word “software” in the description, 1999....................................................................................................... 3163.10. Trade in computer and information services, 1999............................................................................................. 3173.11. US affiliates in computer and related activities abroad, 1993 and 1998 .......................................................... 3183.12. Foreign affiliates in computer and related activities in the United States, 1990 and 1996 ........................... 3183.13. Foreign-owned enterprises in computer and related activities in Sweden, 2000 .......................................... 3193.14. The market for packaged software and IT services, 2001................................................................................... 3203.15. Changes in product leadership in PC software, 1974-97 .................................................................................... 3213.16. PC software top ten publishers by revenue, 1983 and 2000.............................................................................. 3223.17. Share of top software and services vendors in world markets, 1995-2000....................................................... 3223.18. Software industry leader’s market share in selected European countries: 1990-2000 ................................... 323
6.1. Households and individuals with access to a home computer in selected OECD countries, 1986-2001 .... 3246.2. Households and individuals with access to Internet in selected OECD countries, 1996-2001 ..................... 3256.3. Households and individuals with Internet access by income bracket............................................................. 326
© OECD 2002

OECD Information Technology Outlook 2002
10
6.4. Internet home access among households by income quartile, 2000 (%) ......................................................... 3276.5. Gini coefficients, PCs .............................................................................................................................................. 3276.6. Gini coefficients, Internet....................................................................................................................................... 3276.7. Growth rates for households and individuals with Internet access by income bracket ................................ 328
List of Figures
Chapter 1
1. Share of ICT investment in total non-residential investment, 2000 ................................................................. 222. Percentage point contribution of ICT and other capital services to output growth, 1995-2000 .................... 233. Contribution of ICT-producing and ICT-using sectors to GDP growth in selected
OECD countries, 1995-99........................................................................................................................................ 244. Contribution of ICT-producing and ICT-using sectors to labour productivity growth in selected
OECD countries, 1995-99........................................................................................................................................ 245. Quarterly ICT shipments in the United States, 1999-2001 ................................................................................. 256. Quarterly ICT shipments in the United States .................................................................................................... 267. Monthly inventories of ICT goods in the United States, 1999-2001.................................................................. 278. Monthly inventory-to-shipments ratio for computer and electronic products in the United States,
January 1999 to December 2001 ............................................................................................................................ 289. World ICT-sector production by region, 1999 ...................................................................................................... 29
10a. Share of ICT value added in business sector value added, 1995 and 1999..................................................... 3110b. Share of ICT manufacturing in total manufacturing value added, 1999............................................................ 3110c. Share of ICT services in total business services value added, 1999................................................................. 3111a. Share of ICT employment in business sector employment, 1995 and 1999.................................................... 3211b. Share of ICT manufacturing in manufacturing employment, 1999 .................................................................... 3211c. Share of ICT services in market services employment, 1999............................................................................. 3212. OECD trade in ICT goods, 1990-2000 .................................................................................................................... 3313. Composition of OECD trade in ICT goods, 1990-2000 ........................................................................................ 3414. OECD trade in software products, 1996-2000 ...................................................................................................... 3715. R&D expenditure in selected ICT industries, 1999 or latest available year.................................................... 4116. Average R&D intensity in top ICT firms by sector, 2000 ..................................................................................... 4117. US consumer price index for ICT goods and services, 1997-2001 ..................................................................... 4218. PC producer price index, France and United States .......................................................................................... 4219. Prices of selected ICT goods and services, the Netherlands, 1995-99 ............................................................. 4320. Consumer price index for PCs and accessories, Denmark, 1994-2000.............................................................. 4321. ICT patents as a percentage of total national patents filed at the European Patent Office (EPO),
for priority years 1990 and 1998............................................................................................................................. 4422. Venture capital in the ICT sector as a percentage of GDP, 1995-2000 .............................................................. 4523. Percentage share of the ICT sector in total venture capital, 1995-2000 ........................................................... 4524. Venture capital investments in ICT industries in the United States, 1999-2000............................................. 4625. US venture capital investments in 2000, by type................................................................................................ 4626. OECD ICT spending by region/country, 1992-2001 ............................................................................................. 4727. ICT intensity in OECD countries, 2001.................................................................................................................. 4828. OECD ICT spending by segment, 1992-2001 ....................................................................................................... 4829. OECD hardware markets by country, 1992 and 2001 .......................................................................................... 4930. PC installed base per 100 inhabitants and share in businesses and government in the OECD area,
1992 and 2001 .......................................................................................................................................................... 5131. World semiconductor market by region, 1990-2001............................................................................................ 5232. World semiconductor market by segment, 1990-2001........................................................................................ 5333. World semiconductor market by application (end markets), 1990 and 2000 .................................................. 5334. Main semiconductor end markets, 1990-2001 ..................................................................................................... 5435. OECD packaged software markets by country, 1992-2001 ................................................................................. 5536. OECD IT services markets by country, 1992-2001 ............................................................................................... 5637. OECD telecommunication markets by country, 1992-2001 ................................................................................ 5738. ICT markets in selected non-member countries, 1992 and 2001 ...................................................................... 5839. ICT market growth by main segment and region, CAGR 1992-2001.................................................................. 5940. Contribution by segment to non-member countries ICT market growth, 1993-2001...................................... 59
© OECD 2002

Table of Contents
11
A1.1. Top 50 ICT firms revenue by sector....................................................................................................................... 64A1.2. Top 50 ICT firms revenue by country .................................................................................................................... 64A1.3. IBM’s revenues by market segment, 1992 to 2000 .............................................................................................. 68A1.4. Relative size of ICT top 10s .................................................................................................................................... 69A1.5. Revenue growth of top 10 firms, 1998-2001.......................................................................................................... 70
Chapter 2
1. OECD trade: total and ICT products, 1990-2000.................................................................................................. 802. Spending on ICT hardware and trade, 1992-2000................................................................................................ 813. Spending on IT services and trade, 1995-2000 .................................................................................................... 824. Share of ICTs in total merchandise exports, 1990-2000 ...................................................................................... 835. ICT equipment exports as a share of GDP, 1990-2000 ........................................................................................ 836. ICT equipment trade as a share of total trade, 1990-2000 ................................................................................. 847. Export/Import ratio for ICT equipment, 2000....................................................................................................... 858. Revealed comparative advantage in ICT equipment, 2000............................................................................... 859. US cross-border and intra-firm services sales, 1990-99...................................................................................... 87
10. Inward and outward FDI flows: OECD total, 1988-99 .......................................................................................... 8811. ICT and total M&As, 1990-2000 .............................................................................................................................. 9312. Share of horizontal M&As in the ICT sector, 1990-2000....................................................................................... 9513. Share of domestic and cross-border strategic alliances, 1990-2000 ................................................................. 9714. Cross-border strategic alliances, 1990-2000......................................................................................................... 9815. Cross-border joint ventures and alliances, 1990-2000........................................................................................ 9816. Share of joint venture and other alliances in ICT sector, 1990-2000 ................................................................. 9917. Purpose of ICT sector cross-border alliances, 1990-2000 ................................................................................... 10018. ICT sector cross-border alliances, 1990-2000....................................................................................................... 101
Chapter 3
1. Nominal value added of computer and related activities in selected OECD countries, 1990-99 ................ 1062. Employment in computer and related activities in selected OECD countries, 1990-99................................ 1073. Patents granted in the United States, 1990-99 .................................................................................................... 1094. Share of software in business sector nominal gross fixed capital formation ................................................... 1105. Geographical breakdown of packaged software markets, 1990-2001 ............................................................... 1136. Packaged software as a share of total ICT markets, 2001 ................................................................................... 1147. World packaged software market by segments, 1999......................................................................................... 1158. Share of software and services in IBM revenue, 1989-2000 ............................................................................... 1199. Share of selected software-related strategic alliances in all announced alliances, 1990-2000 ..................... 120
10. Share of selected software-related M&As in all completed M&As, 1990-2000................................................ 12111. Share of top software and services vendors on world markets, 1995-2000...................................................... 122
Chapter 4
1. User needs for e-commerce indicators................................................................................................................. 1292. Proportion of businesses with ten or more employees using the Internet for purchasing
and selling, 2000 ...................................................................................................................................................... 1333. Internet and electronic purchases and sales by enterprise size class, 2000................................................... 1344. Businesses ordering over the Internet by industry, 2000................................................................................... 1365. Broad and narrow official estimates of electronic commerce sales in 2000..................................................... 1406. Internet or electronic commerce sales by industry ............................................................................................ 1417. Percentage of individuals using and ordering goods and services over the Internet, 2000.......................... 1438. Share of Internet sales by type of customer, 2000 .............................................................................................. 1439. Value of Internet sales as a proportion of total revenue or sales of the retail sector, 2000........................... 144
10. Quarterly retail electronic commerce sales in the United States, 1999-2001.................................................. 14511. Consumers’ Internet purchases by product......................................................................................................... 14512. Distribution of Internet sales, business-to-consumer Internet sales and Internet exports
by selected industries in Canada, 2000................................................................................................................ 14613. Share of Internet sales in domestic and international markets, 2000 .............................................................. 14714. Relative business motivation factors for Internet commerce, 2000.................................................................. 148
© OECD 2002

OECD Information Technology Outlook 2002
12
15. Percentage of enterprises introducing business-to-business and business-to-consumer e-commercein Japan ..................................................................................................................................................................... 149
16. Perceived barriers to buying and selling over the Internet in Canada, 2000 .................................................. 15017. Barriers to e-commerce in Nordic countries........................................................................................................ 15118. Barriers to Internet and ICT use in Japan ............................................................................................................. 15119. Australian household Internet access barriers and income level..................................................................... 152
Chapter 5
1. Employment growth in EU countries and the United States, by occupational group, 1992-99 .................... 1582. How skills are acquired .......................................................................................................................................... 1593. Computer workers as a percentage of total employment in selected OECD countries/regions,
1995 and 1999 .......................................................................................................................................................... 1614. Distribution of estimated “IT worker gap” in the United States by activity, 2000 .......................................... 1625. Expected duration with first employer by year of graduation .......................................................................... 1656. Computing in tertiary education in OECD countries, 1999 ................................................................................ 1667. Geographical distribution of H-1B petitions approved by the INS between October 1999
and February 2000, by country of origin............................................................................................................... 168
Chapter 6
1. Fixed telecommunication access channels in OECD countries ........................................................................ 1882. Internet hosts in OECD countries per 1 000 inhabitants, July 2001 .................................................................. 1893. Secure servers per million inhabitants, July 2001............................................................................................... 1904. Access to a home computer in selected OECD countries, 1994-2001 .............................................................. 1915. Households with access to a home computer, 2000 and 2001 .......................................................................... 1926. Household access to Internet in selected OECD countries, 1996-2001 ........................................................... 1927. Households with access to Internet, 2000 and 2001 ........................................................................................... 1938. Internet access basket for 40 hours at peak times using discounted PSTN rates, August 2001 ................... 1959. On-line activities of individuals, United States, 2001 ........................................................................................ 197
10. Internet home access among households by income level, 2000..................................................................... 19811. Gini coefficients: distribution of computers by household income, 2000 ....................................................... 19912. Gini coefficients: distribution of Internet access by household income, 2000 ............................................... 20013. PC and Internet access by type of household..................................................................................................... 20114. PC and Internet penetration rate by age.............................................................................................................. 20215. Urban homes are more connected than rural ones ............................................................................................ 20416. English is the main language of e-commerce ...................................................................................................... 20517. Household Internet access by family income, United States, 2001.................................................................. 20718. Gini coefficients for household access to a computer by income .................................................................... 20819. Gini coefficients for household access to the Internet by income ................................................................... 20820. Businesses with Internet and Web sites, 2000 .................................................................................................... 20921. Internet penetration by industry, 2000................................................................................................................. 21022. Internet access in the business sector by firm size ............................................................................................ 21123. PCs per 100 white collar workers, 2000 ................................................................................................................. 21224. E-government services and delivery objectives................................................................................................. 213
© OECD 2002

13
HIGHLIGHTS
ICTs play a strong and increasing role in the world economy
ICTs play an increasingly important role in the economy.
Information and communications technologies (ICTs) are increasinglyubiquitous and firms, industries and countries are reaping greater benefits fromtheir ongoing investments in ICTs and the more widespread use of the Internet.This is true despite considerable changes in the economic landscape sincethe 2000 edition of the IT Outlook and questions about the existence of a “new”,knowledge-based economy, in light of the recent sharp decline in technologystocks and the slump in the ICT equipment industry.
ICTs account for a large share of investment and contribute significantly to output and productivity growth.
During the late 1990s, ICTs accounted for a large and growing share ofinvestment and contributed significantly to output growth, particularly in theUnited States, Australia and Finland. The diffusion of ICTs throughout theeconomy has enhanced economic efficiency and substantially boostedproductivity growth and the ICT-producing and ICT-using sectors haveaccounted for the bulk of overall productivity growth in a wide range of OECDcountries.
Despite current cyclical difficulties, trend growth of the ICT sector remains strong…
Since late 2000, however, the world ICT equipment industry has faced asevere downturn, although there are signs of an upturn on the horizon, asOECD economies begin to recover and demand and investment slowlypick up. Despite the short-term turbulence, prospects for the industryremain strong, as new products and services such as broadband continueto drive demand from firms, households and governments. In most OECDcountries, the ICT sector accounts for a growing share of production, valueadded, employment and trade, owing to sustained price declines andcontinuing technological developments and venture capital investment inICT firms.
... and the overall market for ICT goods and services continues to grow.
In the OECD area, ICT intensity (total ICT markets/GDP) increased, drivenby strong growth in telecommunications services, to an average 8.3% in 2001for goods and services combined. Software still represents less than 10% ofthe total ICT market, but is growing fastest, at almost 16% a year since 1992.Growth in non-member countries has been even more dynamic, and marketssuch as China and Brazil are now among the world’s ten largest.
ICT producers are an essential part of the current trend towards globalisation of economic activity
The ICT sector is highly globalised in an increasingly globalised world economy…
The ICT sector is highly and increasingly globalised. Trade in ICT goodshas grown at almost double the rate of trade in total goods, with exports ofICT equipment equivalent to well over 5% of GDP in a few OECD countriesand trade in IT services growing faster than trade in equipment. Both aregrowing at much higher rates than GDP.
© OECD 2002

OECD Information Technology Outlook 2002
14
... with intra-firm tradeplaying an ever
larger role.
As cross-border investment increases, intra-firm trade is beginning todominate trade, with ICT producers in the lead. US data show that ICTproducts represent over one-quarter of all imports of related parties andone-fifth of exports, shares higher than those of ICT products in totaltrade. Over two-thirds of all US ICT imports and one-third of US ICTexports are related party trade. Sales of ICT products by foreign-ownedaffiliates operating in the United States are of the same order ofmagnitude as imports of ICT products by related parties, and overseassales by US foreign affiliates are approximately three times exports of ICTproducts by US related parties.
The focusof international
investment in ICTsis shifting from
manufacturing towardsservices.
Foreign investment in the ICT sector is strong, and the focus of newinternational investment in ICTs is shifting from manufacturing to servicesactivities. This trend is likely to continue as services undergo greaterdomestic deregulation and competition, as trade liberalisation continuesand as marketed services take a larger part in economic activity. Asderegulation has created new markets, telecommunication services havebeen at the forefront of investment and M&A activities. Owing, forexample, to the large future cost of third-generation mobile networksand the substantial investments required in broadband, significantconsolidation is likely. This will be tempered, however, by regulatorydemands for competition and choice in national markets.
Mergers, acquisitionsand strategic alliances
focus on R&Dand technology access.
Technology-oriented M&As and strategic alliances in the ICT-producingsector are being propelled by rapid technological change, as product life cyclesbecome shorter and new markets open up for innovative products and services.Through M&As and alliances, ICT-sector firms are likely to continue to seek waysto exploit emerging technologies (e.g. in IP networking, radio and opticalcommunications, broadband applications) and bring them rapidly to market.However, the sector has felt the impact of the business cycle, with significantreductions in the level of FDI, M&As and strategic alliances likely in 2002 andbeyond. Despite the recent slowdown, the ICT sector’s underlying structure anddynamics will ensure that it continues to play a leading role in industrialglobalisation.
Strong growth in the software sector is due to its increasingly crucial rolein the ICT sector and the economy
Software is one of themost rapidly growingand evolving sectors
in OECD countries.
Dynamic growth and the impact of software investment on firm-level andeconomy-wide productivity and competitiveness underpin policy interest inthe software sector. It is among the most rapidly growing sectors in OECDcountries, with strong increases in value added, employment and R&Dinvestment. Both packaged software and software-related services have agrowing share in overall ICT markets. World packaged software markets wereestimated at USD 196 billion in 2001, 95% of which in OECD countries.Businesses across all sectors of the economy increasingly invest in software,and the nominal share of software in business sector gross fixed capitalformation has increased constantly since 1990. At the end of the 1990s, itreached 13.6% and 11.9% for the United States and Finland, respectively. Atthe same time, market structures in the software sector have changed rapidly,owing to technical innovation and the emergence of new product segments, andnew firm entry, alliances, M&As and fierce competition among incumbent firms.
© OECD 2002

Highlights
15
Software that underpins network integration, interconnectionand compatibilitywill be essential…
Many competing forces are thus shaping the software sector. The crucialimportance of integration, interconnection and software product compatibilitywill test the rival approaches to software development and exploitation: openand proprietary source code software. Network computing and the ubiquity ofthe Internet are driving new software supply strategies by application serviceproviders, reinforced by outsourcing-driven business strategies adopted byuser firms of all sizes.
... and software-related patenting is increasing rapidly.
Innovation is a particularly important driver of change, and software firmsare the most R&D-intensive of ICT firms, important recipients of venturecapital (up to 20% of total technology venture capital in the United States,over 30% in Europe) and increasingly active in patenting. In the United States,for example, the number of software-related patents has grown much fasterthan total patents granted and now account for between 4% and 10% of allpatents, depending on how they are counted.
Trade in softwareis dynamic but difficult to measure.
Trade in software goods and services is growing strongly but is difficult tomeasure, partly owing to the increasing diversity of delivery channels. Thevalue of software goods traded on physical supports gives an indication ofcross-border sales of software goods. Ireland and the United Statesaccounted for more than 55% of OECD exports of software goods in 2000.Ireland has become the European manufacturing and distribution centre forthe software of many of the world’s top software vendors, accounting forover 40% of all packaged software and 60% of all business software sold inEurope. In 2000, Ireland also ranked first in the value of software servicesexports (mostly computer and information services) (USD 5.48 billion,followed by the United States with USD 4.9 billion) and in terms of thenational share of software in total services exports (33%). Software trade issignificantly underestimated because it is usually based on the value ofphysical supports (CD-ROM, diskettes) rather than content and is oftenbundled with computer hardware, while digitally delivered software is notmeasured in trade statistics. On the services and intangibles side, softwareand copyright trade are poorly measured.
Electronic commerce is growing, but is still in its infancy, especially among consumers
Electronic commerce has the potentialto transform economic activity, buttransactions are taking off more slowlythan predicted.
Electronic commerce has the potential to alter economic activity and thesocial environment. In the aftermath of the “dot com” crash, many start-upsthat sold and/or purchased exclusively on line have disappeared, and growthin electronic commerce transactions has been less spectacular than predicted.Nevertheless, the volume of electronic transactions is growing and the Internetis increasingly used as a transaction channel, particularly for purchases.
However, electronic transactions are growing, the Internetis increasingly usedfor purchase and EDI remains important.
Recent official surveys show that while Internet and electronic commercetransactions are rising fast, they still play a small role. In the few countries thatcurrently measure the value of Internet or electronic sales, total Internet salesin 2000 ranged between 0.4% and 1.8% of total sales. Electronic sales(including those over all computer-mediated networks) were over 10% inSweden. In most countries, sales via electronic data interchange (EDI) are atleast twice sales via the Internet. Use of the Internet to carry out transactionsvaries according to whether the business is a customer or supplier, withpurchasing more common than selling.
© OECD 2002

OECD Information Technology Outlook 2002
16
Internet transactionsremain concentrated
in a few sectorsand the relation
between Internet useand firm size
is complex.
Internet sales and purchases tend to be concentrated in a few sectors. Thenature and type of transactions that typically take place in these sectors stronglydetermine the characteristics of Internet transactions. Available statistics showthat Internet sales are mainly domestic or regional. Results for eight EU countriesshow that European companies have a high propensity to sell over the Internet tolocations within Europe. The relation between Internet use and firm size iscomplex, and industry-specific factors play a considerable role. Smaller Internet-using businesses have roughly the same propensity to sell over the Internet aslarger ones in Australia, Denmark and Sweden. However, use of the Internet forpurchases seems to be more sensitive to firm size in all countries. Businessesthat do not conduct transactions electronically perceive electronic commerce asill-suited to the nature of their business. Other reasons vary. While Canadian firmsseem to prefer to maintain their current business model, the major concerns inEurope relate to security in handling payments, uncertainty over contracts and aninsufficient customer base.
Business-to-consumerInternet sales remain
low with lackof consumer interest
a common reason.
Business-to-consumer Internet sales have not taken off. The share ofInternet users buying over the Internet and the volume of transactions remainquite low and vary widely across countries. Computer products, clothing anddigitised products such as music, books and software often constitute the majorsources of Internet sales to consumers. However, the best-selling products vary,reflecting the nature of the product and consumer tastes and habits. Forconsumers, the main reasons for not purchasing over the Internet are “lack ofinterest or no use for the Internet” and cost of access.
The need for ICT skills at all levels of competence is of continuing concern
The demand for ICTskills continues to grow,creating concerns about
possible labourshortages and gaps
in worker skills.
Given their role in the current transformation of advanced economies,ICTs offer the promise of new business and employment opportunitiesalong with higher productivity gains, but also make new demands onskills. OECD countries are confronted with the dual challenge of ensuringthat the growth of new industries and activities is not stifled by labourbottlenecks and skill mismatches and that their population is equipped tomaster the basic ICT skills which these transformations require. Despiterecent claims of a widespread ICT worker shortage, the analysis suggeststhat although there is indeed some evidence of tightness in labourmarkets for particular categories of such workers, the main issue ofconcern for policy makers and firms should be the gap between thecurrent skills of some IT workers and those sought by firms.
Governments, firms andeducational institutionsin OECD countries are
taking measuresto meet changing skill
demands in the ITworkforce.
Both short- and long-term private-sector strategies can be implementedto address the rapidly changing skill requirements for ICT jobs. OECD firmsappear to be taking similar measures, but they also emphasise the need forbetter data to measure the IT workforce and for new kinds of partnerships. Itis broadly agreed that all stakeholders have a role in implementing short-term solutions and in facilitating development of longer-term strategies.Various supply- and demand-side measures are being deployed. On thesupply side, these include providing more information to students,developing stronger IT skills in secondary schools, assisting in teachertraining, making IT careers more attractive (in particular to under-representedgroups such as women), ensuring better integration of educationalprogrammes with “real world” problems, helping workers maintain up-to-dateskills. On the demand and user side, these include better use by employersof the existing workforce (both in terms of recruitment and retention), more
© OECD 2002

Highlights
17
information on skill needs and opportunities (including new pathways to ITjobs), adequate training programmes for various categories of workers(including unemployed and older workers) and governments taking a leadrole as employers of IT workers.
Immigration is only one tool to increase short-term supply and must be part of a broader policy framework.
Immigration is one means of increasing the short-term supply of ITworkers. Many countries favour this solution, but immigration alone cannotaddress the need for cyclical adjustments to the labour market, and, bydampening wage growth, it can send conflicting signals to firms, workers andstudents.
Reducing the digital divide among and within countries is another pressing issue
Differences in access to ICTs create a “digital divide”.
Differences in access to ICTs, such as computers and the Internet, createa “digital divide” between those able to benefit from opportunities providedby ICTs and those who cannot. Access to and development of the informationand communication resources that these technologies enable is increasinglyviewed as crucial for economic and social development. Network economicsmean that the more the participants in ICTs the greater the value to all.
Household digital divides exist by income, education, age, family type, sub-national region.
There are considerable differences in the diffusion and use of ICTs andelectronic commerce across, and within, OECD countries. Differences maycreate new kinds of social divides and accentuate existing divides relating toincome, education, age, family type and sub-national regions. There areparticularly striking differences by household income and education inhousehold PC and Internet access, but these are greatly influenced by otheraccess factors, particularly whether individuals also have access in theworkplace.
The shape of the digital divide is changing.
The digital divide may be said to be growing, as the access gap betweenthose with the highest and lowest levels of ICT access is increasing. Conversely,the digital divide may be said to be shrinking, as rates of growth are much fasterfor lagging groups. Common measures of distributional inequalities such as Ginicoefficients also show the digital divide to be shrinking.
Different kinds of firms have different ratesof ICT useand e-governmentwill affect the divide.
Differences in diffusion may also be creating new kinds of businessdivides. Sector-specific factors and firm size have an important influence on theuptake and use of ICT, and the regional concentration of particular kinds of firmsand industries accentuates these divides. Government use of ICT is alsoincreasingly important in OECD countries. As e-government is more widelyimplemented, it may both provide incentives to increase ICT use by citizens andbusinesses and accentuate existing digital differences.
These issues are affected by the rapid evolution of ICT technologies
New computing potential and communication channels are being developed and are proliferating.
As computing power increases, unit price and size decrease andcommunication capabilities expand. These trends are likely to havewidespread impacts, increasing ICT ubiquity and possible associated benefits,such as productivity growth. More devices will be fitted with computing andcommunication capabilities that will provide new functionalities for users.There will be more communication channels, and people will increasinglycommunicate with each other and with applications, while applications willincreasingly communicate directly.
© OECD 2002

OECD Information Technology Outlook 2002
18
Many new technologiesare being developed…
Efficient and more effective information exchange is a major aim ofinformation technology (IT) innovation. The development and rapiddiffusion of new communications technologies and channels are alteringcommunications structures and providing possibilities for furthereconomic and social gains through greater networking. The Internet is avital infrastructure for communication, collaboration and informationsharing and contributes to efficiency improvements and productivitygains. Updating capacity and other constraints in its architecture whileretaining its open and relatively simple architecture will provideadditional benefits.
... shifting the focusfrom a centralisedto a decentralised
model of informationexchange.
With increasingly ubiquitous computing power and communicationscapacity, the dominant model of information exchange is shifting from acentralised and hierarchical model to one that is decentralised, horizontaland more equally distributed and democratic. Open source, Internetprotocol version 6 (IPv6), wireless and peer-to-peer are examples ofdifferent aspects of the shift in the structure and nature of informationexchange. The potential for encouraging decentralised information flows isjust beginning to be realised and has already profoundly affectedestablished structures.
New technologiespresent new policy
challenges.
The development of new technologies is driven by the interplay oftechnological potential, commercial exploitation and socio-economicacceptance. The challenge for government is to foster innovation andtechnological development while attending to equity considerations(e.g. digital divide issues related to new technologies) and potentialproblem areas (e.g. system security, privacy and trust issues).Technological developments are moving rapidly and it is not easy toanticipate future policy impacts in detail.
OECD governments are addressing ICT issues through a wide varietyof policies
OECD countriesincreasingly have broad
action plans forthe information society.
Almost all OECD countries have well-developed and clearlyenunciated broad strategies and action plans for IT and an overarchingpolicy approach to the information society. These usually covertechnology development, technology diffusion, improving the ITenvironment and the global diffusion and distribution of ICTs. Policies toencourage broadband infrastructure investment and use are receivingmore and more attention. The potential cost-effectiveness of public-private partnerships in promoting the development and use of ICTs isincreasingly recognised.
Governments areimplementing policiesto facilitate the supply
of skills…
OECD governments recognise the importance of a skilled workforce, andare increasingly taking policy measures to support the efforts of business.While professional ICT skills are important for growth of industry in general,they are also increasingly needed throughout the economy. ICT skills havebecome a new type of “general” skill, like literacy or numeracy. Governmentsare implementing an array of policies targeting different segments of thepopulation in order to promote basic and advanced ICT skills. Somegovernment policies do not specifically target the development of IT skillsbut imply the need for them (e.g. e-learning, on-line job searching).
© OECD 2002
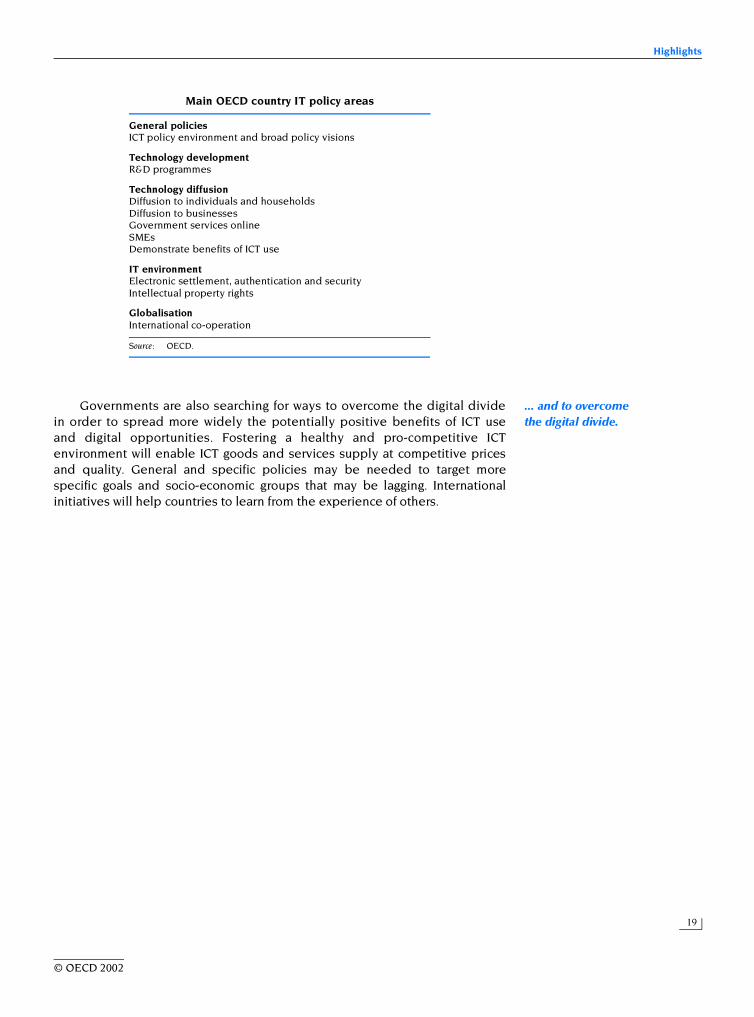
Highlights
19
... and to overcomethe digital divide.
Governments are also searching for ways to overcome the digital dividein order to spread more widely the potentially positive benefits of ICT useand digital opportunities. Fostering a healthy and pro-competitive ICTenvironment will enable ICT goods and services supply at competitive pricesand quality. General and specific policies may be needed to target morespecific goals and socio-economic groups that may be lagging. Internationalinitiatives will help countries to learn from the experience of others.
Main OECD country IT policy areas
Source: OECD.
General policiesICT policy environment and broad policy visions
Technology developmentR&D programmes
Technology diffusionDiffusion to individuals and householdsDiffusion to businessesGovernment services onlineSMEsDemonstrate benefits of ICT use
IT environmentElectronic settlement, authentication and securityIntellectual property rights
GlobalisationInternational co-operation
© OECD 2002

21
Chapter 1
ICTS AND THEIR ROLE IN THE ECONOMY
This issue of the Information Technology Outlook suggests, on the basis of recent evidence and analysis,that something new is indeed taking place in the structure of OECD economies and that it is thistransformation, driven and facilitated by information and communication technologies (ICTs), which hascontributed to the high growth recorded in several OECD countries during the second half of the 1990s(OECD, 2001a). In many respects, Solow’s paradox is being resolved. In addition to the surge ininvestment, ICT also appears to have brought other, more qualitative, economic benefits, like valuablenetworks between suppliers and more choice for consumers, notably thanks to the Internet. ICT hasspurred innovation in services, has improved the efficiency of manufacturing and design, while makinginventories and overheads more manageable. It has been a catalyst of change in business, improvingwork organisation, and helping firms to reduce routine transaction costs and rationalise their supplychains. Crucially, ICT, particularly when combined with skill upgrading and organisational change, seemsto have facilitated productivity-enhancing changes within firms, in both new and traditional industries.Such benefits are long-term in their effects, and will continue to develop, even given the difficulties andchallenges that the industry faces today.
However the economic landscape has changed considerably since the 2000 edition of the OECDInformation Technology Outlook: the Internet bubble burst, the US economy entered a recession, ICT firmsworldwide have faced the difficult consequences of a sharp economic downturn. Although most of the“irrational exuberance” of the “dot com” era has dissipated and we now know that the effects of ICTmust be put in the context of other major inventions of the past, it would indeed be wrong to concludethat there was nothing particularly exceptional about the recent US experience and experience in anumber of other countries and that the “new economy” was in fact a myth (OECD, 2001b). This chapterexamines developments in the ICT-producing sector, as well as the growing role of ICT diffusion andinvestment across the whole of the economy. It looks first at the role of ICT investment in growth as wellas the importance of ICT-producing and ICT-using sectors for economic performance in terms of growthand productivity. Next, it discusses developments in the ICT-producing sector, including the recentdownturn, but also ongoing structural changes. Finally, it presents data on ICT markets. An appendixprovides a firm-level view of the top ICT firms.
ICTs and their contribution to growth and economic performance
This section examines the growing importance of ICTs at both aggregate and firm level. It presentsrecent evidence of the growing share of ICT in investment in OECD countries, as well as thecontributions of ICT-producing and ICT-using sectors to economic growth and performance.
ICT investment
ICTs have an increasing share in all investment across the economy, owing to rapid price declinesand growing demand for ICT applications. In a group of nine OECD countries (the G7 countries plusAustralia and Finland), ICT investment rose from less than 15% of total non-residential investment in thebusiness sector in the early 1980s to between 15% and 30% in 2000 (Figure 1). Investment in hardwarehas typically increased at the most rapid rate, but software investment has also experienced fast growth
© OECD 2002
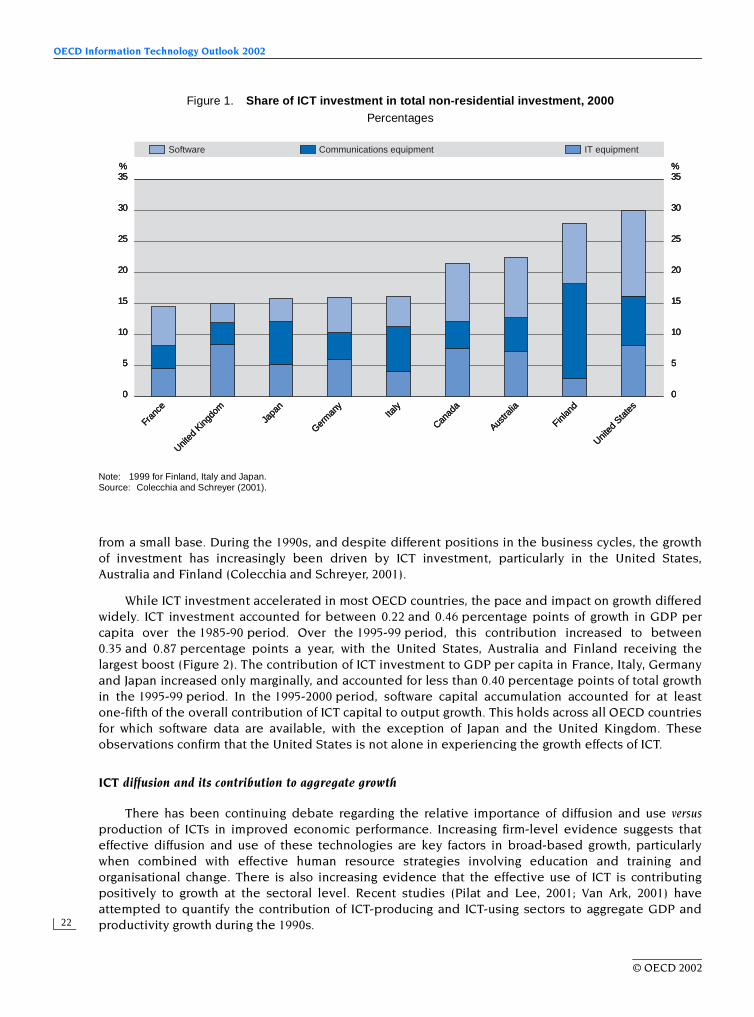
OECD Information Technology Outlook 2002
22
from a small base. During the 1990s, and despite different positions in the business cycles, the growthof investment has increasingly been driven by ICT investment, particularly in the United States,Australia and Finland (Colecchia and Schreyer, 2001).
While ICT investment accelerated in most OECD countries, the pace and impact on growth differedwidely. ICT investment accounted for between 0.22 and 0.46 percentage points of growth in GDP percapita over the 1985-90 period. Over the 1995-99 period, this contribution increased to between0.35 and 0.87 percentage points a year, with the United States, Australia and Finland receiving thelargest boost (Figure 2). The contribution of ICT investment to GDP per capita in France, Italy, Germanyand Japan increased only marginally, and accounted for less than 0.40 percentage points of total growthin the 1995-99 period. In the 1995-2000 period, software capital accumulation accounted for at leastone-fifth of the overall contribution of ICT capital to output growth. This holds across all OECD countriesfor which software data are available, with the exception of Japan and the United Kingdom. Theseobservations confirm that the United States is not alone in experiencing the growth effects of ICT.
ICT diffusion and its contribution to aggregate growth
There has been continuing debate regarding the relative importance of diffusion and use versusproduction of ICTs in improved economic performance. Increasing firm-level evidence suggests thateffective diffusion and use of these technologies are key factors in broad-based growth, particularlywhen combined with effective human resource strategies involving education and training andorganisational change. There is also increasing evidence that the effective use of ICT is contributingpositively to growth at the sectoral level. Recent studies (Pilat and Lee, 2001; Van Ark, 2001) haveattempted to quantify the contribution of ICT-producing and ICT-using sectors to aggregate GDP andproductivity growth during the 1990s.
Figure 1. Share of ICT investment in total non-residential investment, 2000Percentages
Note: 1999 for Finland, Italy and Japan.Source: Colecchia and Schreyer (2001).
35% %
30
25
20
15
10
5
0
35
30
25
20
15
10
5
0
Fran
ce
United
King
dom
Japa
n
Germ
any
Italy
Canad
a
Austra
lia
Finlan
d
United
Sta
tes
IT equipmentCommunications equipmentSoftware
35% %
30
25
20
15
10
5
0
35
30
25
20
15
10
5
0
Fran
ce
United
King
dom
Japa
n
Germ
any
Italy
Canad
a
Austra
lia
Finlan
d
United
Sta
tes
IT equipmentCommunications equipmentSoftware
35% %
30
25
20
15
10
5
0
35
30
25
20
15
10
5
0
Fran
ce
United
King
dom
Japa
n
Germ
any
Italy
Canad
a
Austra
lia
Finlan
d
United
Sta
tes
IT equipmentCommunications equipmentSoftware
© OECD 2002

ICTs and their Role in the Economy
23
Figure 3 shows the contributions of ICT-producing, ICT-using and other sectors to GDP growthbetween 1995 and 1999 in the G7 countries as well as Denmark, Finland and the Netherlands. The dataconfirm that the contribution from ICT sectors was highest in the United States (mainly owing toICT-using sectors) and Finland (mainly owing to ICT-producing sectors). Even in Japan and Italy, whichexperienced relatively slow GDP growth, the contribution of ICT-producing and ICT-using sectors wasstill significant, exceeding 50%. When compared with the period 1990-95, the contributions from boththe ICT-producing and ICT-using sectors to the acceleration of GDP growth during the second half of thedecade were particularly high in Finland, followed by the Netherlands and the United States.
If ICTs are indeed contributing to the shift in our economies towards higher sustainable growthpaths, one would expect them to be playing an important role in the recent acceleration of productivitygrowth. During the period 1995-99, for all ten countries examined, labour productivity growth in theICT-producing sector was substantially higher than in the rest of the economy. Overall, as Figure 4shows, ICT-producing and ICT-using industries contributed in an important way to the growth of totallabour productivity across the economy during the second half of the 1990s, particularly in Finland andthe United States.
These results support the view that countries can reap benefits (in terms of economic growth) fromdifferent ICT-related strategies: fostering a strong ICT-producing sector (e.g. Finland) or successfullyharnessing the benefits of ICT usage in other sectors of the economy (e.g. United States, Denmark).
The ICT-producing sector
This section discusses trends in the ICT-producing sector. As already noted, the ICT sectorcontributes directly to growth, but also provides goods and services that improve the functioning ofother economic sectors.
Figure 2. Percentage point contribution of ICT and other capital services to output growth, 1995-2000Business sector, harmonised price index
Note: 1995-99 for Australia, Finland, Italy and Japan.Source: Colecchia and Schreyer (2001).
1.8
1.6
1.4
1.2
1.0
0.8
0
-0.2
0.2
0.4
0.6
1.8
1.6
1.4
1.2
1.0
0.8
0
-0.2
0.2
0.4
0.6
Fran
ce Italy
Germ
any
Japa
n
United
King
dom
Canad
a
Finlan
d
Austra
lia
United
Sta
tes
Software IT and communications equipmentOther capital services
1.8
1.6
1.4
1.2
1.0
0.8
0
-0.2
0.2
0.4
0.6
1.8
1.6
1.4
1.2
1.0
0.8
0
-0.2
0.2
0.4
0.6
Fran
ce Italy
Germ
any
Japa
n
United
King
dom
Canad
a
Finlan
d
Austra
lia
United
Sta
tes
Software IT and communications equipmentOther capital services
1.8
1.6
1.4
1.2
1.0
0.8
0
-0.2
0.2
0.4
0.6
1.8
1.6
1.4
1.2
1.0
0.8
0
-0.2
0.2
0.4
0.6
Fran
ce Italy
Germ
any
Japa
n
United
King
dom
Canad
a
Finlan
d
Austra
lia
United
Sta
tes
Software IT and communications equipmentOther capital services
© OECD 2002

OECD Information Technology Outlook 2002
24
Figure 3. Contribution of ICT-producing and ICT-using sectors to GDP growth in selected OECD countries, 1995-99
Percentages
1. Data for 1995-98.Source: Van Ark (2001).
6% %
5
4
3
2
1
0
6
5
4
3
2
1
0
Italy
Japa
n1
Germ
any1
Denm
ark
Canad
a
United
King
dom
Nethe
rland
s
Finlan
d
United
Sta
tes
Non-ICT ICT-using ICT-producing
Fran
ce1
6% %
5
4
3
2
1
0
6
5
4
3
2
1
0
Italy
Japa
n1
Germ
any1
Denm
ark
Canad
a
United
King
dom
Nethe
rland
s
Finlan
d
United
Sta
tes
Non-ICT ICT-using ICT-producing
Fran
ce1
6% %
5
4
3
2
1
0
6
5
4
3
2
1
0
Italy
Japa
n1
Germ
any1
Denm
ark
Canad
a
United
King
dom
Nethe
rland
s
Finlan
d
United
Sta
tes
Non-ICT ICT-using ICT-producing
Fran
ce1
Figure 4. Contribution of ICT-producing and ICT-using sectors to labour productivity growth in selected OECD countries, 1995-99
Percentages
1. Data for 1995-98.Source: Van Ark (2001).
3.0% %
2.0
1.5
1.0
0.5
0
-0.5
2.5
3.0
2.0
1.5
1.0
0.5
0
-0.5
2.5
Italy
Japa
n1
Germ
any1
Denm
ark
Canad
a
United
King
dom
Nethe
rland
s
Finlan
d
United
Sta
tes
Non-ICT ICT-using ICT-producing
Fran
ce1
3.0% %
2.0
1.5
1.0
0.5
0
-0.5
2.5
3.0
2.0
1.5
1.0
0.5
0
-0.5
2.5
Italy
Japa
n1
Germ
any1
Denm
ark
Canad
a
United
King
dom
Nethe
rland
s
Finlan
d
United
Sta
tes
Non-ICT ICT-using ICT-producing
Fran
ce1
3.0% %
2.0
1.5
1.0
0.5
0
-0.5
2.5
3.0
2.0
1.5
1.0
0.5
0
-0.5
2.5
Italy
Japa
n1
Germ
any1
Denm
ark
Canad
a
United
King
dom
Nethe
rland
s
Finlan
d
United
Sta
tes
Non-ICT ICT-using ICT-producing
Fran
ce1
© OECD 2002
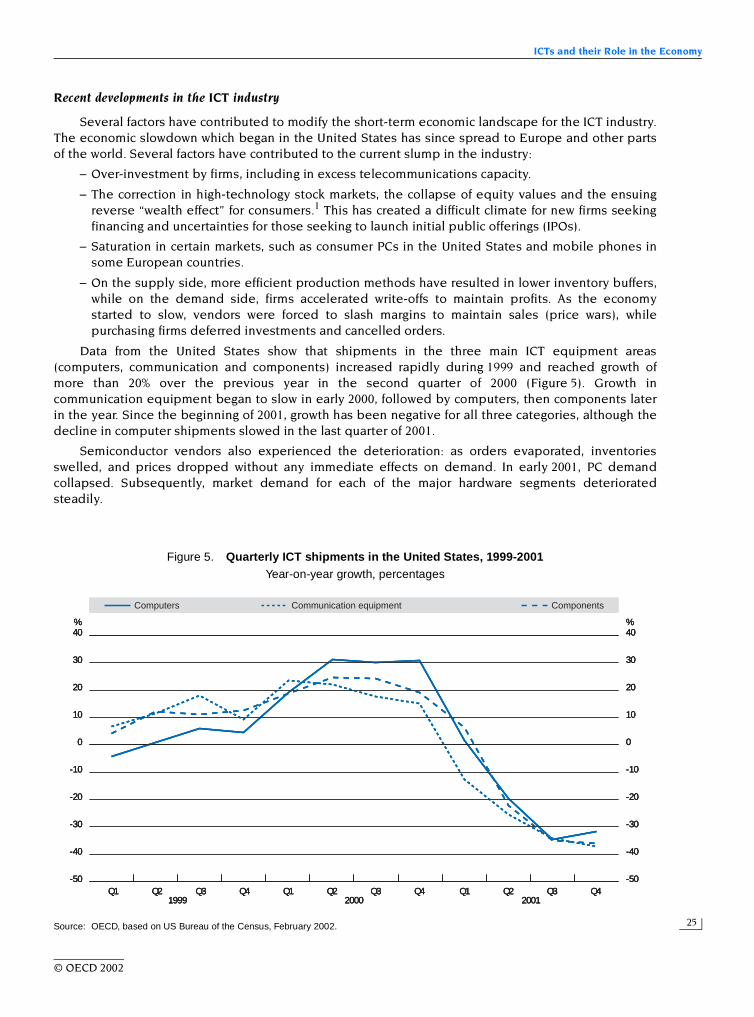
ICTs and their Role in the Economy
25
Recent developments in the ICT industry
Several factors have contributed to modify the short-term economic landscape for the ICT industry.The economic slowdown which began in the United States has since spread to Europe and other partsof the world. Several factors have contributed to the current slump in the industry:
– Over-investment by firms, including in excess telecommunications capacity.
– The correction in high-technology stock markets, the collapse of equity values and the ensuingreverse “wealth effect” for consumers.1 This has created a difficult climate for new firms seekingfinancing and uncertainties for those seeking to launch initial public offerings (IPOs).
– Saturation in certain markets, such as consumer PCs in the United States and mobile phones insome European countries.
– On the supply side, more efficient production methods have resulted in lower inventory buffers,while on the demand side, firms accelerated write-offs to maintain profits. As the economystarted to slow, vendors were forced to slash margins to maintain sales (price wars), whilepurchasing firms deferred investments and cancelled orders.
Data from the United States show that shipments in the three main ICT equipment areas(computers, communication and components) increased rapidly during 1999 and reached growth ofmore than 20% over the previous year in the second quarter of 2000 (Figure 5). Growth incommunication equipment began to slow in early 2000, followed by computers, then components laterin the year. Since the beginning of 2001, growth has been negative for all three categories, although thedecline in computer shipments slowed in the last quarter of 2001.
Semiconductor vendors also experienced the deterioration: as orders evaporated, inventoriesswelled, and prices dropped without any immediate effects on demand. In early 2001, PC demandcollapsed. Subsequently, market demand for each of the major hardware segments deterioratedsteadily.
Figure 5. Quarterly ICT shipments in the United States, 1999-2001Year-on-year growth, percentages
Source: OECD, based on US Bureau of the Census, February 2002.
40% %
30
20
10
0
-10
-20
-30
-40
-50
40
30
20
10
0
-10
-20
-30
-40
-50
1999 2000 2001Q1 Q2 Q3 Q4 Q1 Q2 Q3 Q4 Q1 Q2 Q3 Q4
ComponentsCommunication equipmentComputers
40% %
30
20
10
0
-10
-20
-30
-40
-50
40
30
20
10
0
-10
-20
-30
-40
-50
1999 2000 2001Q1 Q2 Q3 Q4 Q1 Q2 Q3 Q4 Q1 Q2 Q3 Q4
ComponentsCommunication equipmentComputers
40% %
30
20
10
0
-10
-20
-30
-40
-50
40
30
20
10
0
-10
-20
-30
-40
-50
1999 2000 2001Q1 Q2 Q3 Q4 Q1 Q2 Q3 Q4 Q1 Q2 Q3 Q4
ComponentsCommunication equipmentComputers
© OECD 2002

OECD Information Technology Outlook 2002
26
During the second half of the 1990s, capital was heavily invested in network and equipment andthe number of operators increased. As a result, equipment manufacturers initially saw their revenuesboom. The growth strategy followed by these firms (i.e. Lucent, Nortel, Cisco, Siemens) during thisperiod was mainly oriented towards external acquisitions. When the Internet bubble burst, the cost ofthose acquisitions had heavy financial implications. In addition, the operators, the main clients ofequipment manufacturers, suddenly slashed orders. Furthermore, some markets where heavyinvestment had taken place, such as mobile telephony, started to reach maturity. As a result,telecommunication manufacturers (infrastructure and handsets) faced a sudden downturn, and theirsemiconductor orders followed suit. The semiconductor industry was then faced with a demand-induced downturn due not only to the telecommunications market but also to the hardware market. Forthe first time, the PC market (in the United States, Germany and the United Kingdom) decreased interms of shipments during the second quarter of 2001, albeit very slightly.
Figure 6 illustrates the sharp drop in orders during the fourth quarter of 2000 and the first quarterof 2001 for all three categories of ICT goods in the United States, which was followed by a steeperdecline during the second and third quarters of 2001.
Outside the United States, data on semiconductor markets show that shipments had beenincreasing at an accelerating pace in the four main regions (Americas, Europe, Japan and Asia-Pacific)since early 1998 to reach more than 50% year-on-year growth in June 2000. This was followed by slowinggrowth during the second half of 2000 and a decline in the value of orders during the first three quartersof 2001. World-wide, the value of orders in August 2001 was similar to that of three years earlier atUSD 9.4 billion, compared to a peak of more than USD 21 billion in September 2000. The recent declinehas been less sharp in Japan and the Asia-Pacific region, which now account for more than half of allorders (Semiconductor Industry Association, 2001a).
Figure 6. Quarterly ICT shipments in the United StatesGrowth over six-month period, percentages
Source: OECD based on US Bureau of the Census, January 2002.
20
10
0
-10
-20
-30
-40
20
10
0
-10
-20
-30
-40
% %
Computers Communicationequipment
Components
Q1 01-Q3 01Q3 00-Q1 01Q1 00-Q3 00Q3 99-Q1 00Q1 99-Q3 99
20
10
0
-10
-20
-30
-40
20
10
0
-10
-20
-30
-40
% %
Computers Communicationequipment
Components
Q1 01-Q3 01Q3 00-Q1 01Q1 00-Q3 00Q3 99-Q1 00Q1 99-Q3 99
20
10
0
-10
-20
-30
-40
20
10
0
-10
-20
-30
-40
% %
Computers Communicationequipment
Components
Q1 01-Q3 01Q3 00-Q1 01Q1 00-Q3 00Q3 99-Q1 00Q1 99-Q3 99
© OECD 2002

ICTs and their Role in the Economy
27
When can we expect an upturn?
Given the overall economic uncertainty, it is difficult to predict when a full recovery in ICT demandwill occur. As of late 2001, consumer demand was still high in the United States and Europe, despitethe events of 11 September. Also as of late 2001 and early 2002, business demand for ICTs in theUnited States has remained high by historical standards. Overall, the sharp declines in nominal termson the supply side only took output back to historically high levels of a few years earlier. Most analystshad forecast some uncertainty during the first half of 2002, which should gradually dissipate as businessconfidence improves, the effects of monetary loosening are felt, and, in some countries, those of fiscalstimulus, which already supports aggregate demand. Other positive factors will contribute to therecovery within the sector: ICTs enable firms to operate more efficiently and control costs, and thisbecomes a vital competitive advantage during a period of economic turmoil. Among recent positivedevelopments, stocks of ICT goods had been significantly reduced by late 2001 compared to the firstquarter of the year in the United States, for both telecommunications equipment and electroniccomponents (Figure 7). In the case of computers, inventories had already been on a steadily decliningtrend since early 1996 owing to rationalisations in the ICT industry which have improved ordering andmanufacturing systems, thereby minimising the risk of inventory overhangs.
In the United States, the ratio of inventories to shipments for computer and electronic products (abroader category which does not include electronic components) declined steadily during 1999 andmost of 2000, then increased rapidly during 2001 as the abrupt fall in shipments outpaced the ensuingdecline in inventories (Figure 8). After reaching a peak in August 2001, this ratio was on a sharplydeclining trend during the fourth quarter of 2001, suggesting improving conditions for the industry.
Although many firms have succeeded in cutting costs (some through layoffs), there is still a risk thatsales growth will not pick up until late 2002 and that margins will be further squeezed. Most analystssuggested that hardware sales would remain slow following the sharp slowdown in many segments
Figure 7. Monthly inventories of ICT goods in the United States, 1999-2001Index: January 1999 = 100 (seasonally adjusted)
Source: OECD based on US Bureau of the Census, February 2002.
140
130
120
110
100
90
80
70
140
130
120
110
100
90
80
701999 2000 2001 2002
Computer equipment Communications equipment
Electronic components Total ICT
140
130
120
110
100
90
80
70
140
130
120
110
100
90
80
701999 2000 2001 2002
Computer equipment Communications equipment
Electronic components Total ICT
140
130
120
110
100
90
80
70
140
130
120
110
100
90
80
701999 2000 2001 2002
Computer equipment Communications equipment
Electronic components Total ICT
© OECD 2002

OECD Information Technology Outlook 2002
28
in 2001, although software sales grew moderately; the outlook, for example, for electronic componentsin 2002 is for moderate growth from 2001 (IDC, 2001; Forrester Research, 2001; Semiconductor IndustryAssociation, 2001b).
Ongoing structural change of the ICT sector
Despite the cyclical downturn, longer-term prospects for the industry remain solid since, based onpast experience, new products and services will drive demand from businesses, households andgovernments. This section examines the main economic variables relating to the ICT supply side(production, value added, employment, trade) and some of the main drivers behind the long-termgrowth of the industry (R&D expenditures, price declines, patents, venture capital). The analysis coversthe 1990s, with the focus on the second half, and in particular on the most recent data available(1998-2000). When possible, official OECD definitions of the ICT sector are used (see Annex 1:Methodology; and OECD, 2000).
Production
Between 1995 and 1999, the production of ICT goods in the OECD area increased slightly in value at acompound growth rate (CAGR) of 1.4% in nominal terms, mainly owing to radio communication, mobileand telecommunication equipment [data from Reed Electronics Research (2001); ICT goods comprise EDPequipment, office equipment, control and instrumentation, radio communications, including mobiles, andradar, telecommunications, consumer and components: growth in real terms would show faster gainsowing to price declines in these market segments]. Countries experiencing strong growth includedDenmark, Finland and Sweden, and, to a lesser extent, the United Kingdom, Korea and Ireland (seeAnnex Table 1.1). Ireland is also the only OECD country to have enjoyed very strong growth in productionduring the last half of the decade, owing mainly to EDP (electronic data processing equipment) andcomponents (CAGR of 6.1% and 7.5% respectively). On the other hand, at the OECD level as well as inindividual countries, consumer electronics and office equipment have been declining slightly.
Figure 8. Monthly inventory-to-shipments ratio for computer and electronic products in the United States, January 1999 to December 2001
Source: US Bureau of the Census, January 2002.
1.7
1999
1.6
1.5
1.4
1.3
1.2
1.1
1.0
1.7
1.6
1.5
1.4
1.3
1.2
1.1
1.02000 2001 2002
1.7
1999
1.6
1.5
1.4
1.3
1.2
1.1
1.0
1.7
1.6
1.5
1.4
1.3
1.2
1.1
1.02000 2001 2002
1.7
1999
1.6
1.5
1.4
1.3
1.2
1.1
1.0
1.7
1.6
1.5
1.4
1.3
1.2
1.1
1.02000 2001 2002
© OECD 2002

ICTs and their Role in the Economy
29
Mirroring the situation in the OECD countries, production in the Asian countries grew at more thansix times the pace in OECD countries (CAGR of 8.7%) and was mainly concentrated in EDP, consumerelectronics and components. The Philippines, China, Malaysia and Chinese Taipei grew most rapidlymainly owing to components and EDP, as well as consumer electronics for China. China alone accountedfor around one-fifth of the production of consumer electronics in 1999, against less than 10% in 1995.2 Asa result, the Asian countries had around 21% of global ICT goods production in 1999, against only 15.6%in 1995 and 10.4% in 1990.
The United States remains the world’s largest ICT producer (29.5%), with a specialisation in EDPand radio- and telecommunication. Japan remains the second largest ICT producer (20%) and the firstfor consumer electronics and components. However, its relative share in global ICT strongly declinedduring the 1990s, especially sharply in the second half of the decade, mainly to the benefit of otherAsian countries, especially China and Chinese Taipei for EDP (see Chapter 2). The situation in Europehas been more contrasted, with some of the Nordic countries specialising in communication equipmentand Ireland in EDP and components. During the 1990s, ICT production increased relatively more incomponents, EDP and radio and mobile communication, mainly to the detriment of consumerelectronics, and to a lesser extent, office equipment (Figure 9).
Value added
In the second half of the 1990s, the share of the ICT sector in value added increased in OECDcountries, mainly owing to the strong growth of ICT services. There are exceptions, such as Finland,where the ICT manufacturing sector more than doubled, owing to the importance of thetelecommunication equipment manufacturer, Nokia.
Figure 9. World ICT-sector production by region, 1999
1. Includes China, Chinese Taipei, Hong Kong (China), India, Indonesia, Malaysia, Philippines, Singapore and Thailand.Source: OECD estimates, based on Reed Electronics Research (2001).
0 20 40 60 80 100%
Total ICT
Other G-7JapanUnited States
Components
Consumer audio/video
Telecommunications
Radiocommunications(incl. mobiles) and radar
Control and instrumentation
Office equipment
Electronic data processing
Other non-OECDAsian countries1Other OECD
0 20 40 60 80 100%
Total ICT
Other G-7JapanUnited States
Components
Consumer audio/video
Telecommunications
Radiocommunications(incl. mobiles) and radar
Control and instrumentation
Office equipment
Electronic data processing
Other non-OECDAsian countries1Other OECD
0 20 40 60 80 100%
Total ICT
Other G-7JapanUnited States
Components
Consumer audio/video
Telecommunications
Radiocommunications(incl. mobiles) and radar
Control and instrumentation
Office equipment
Electronic data processing
Other non-OECDAsian countries1Other OECD
© OECD 2002

OECD Information Technology Outlook 2002
30
On average, the ICT sector contributed around 9.5% of business sector GDP in 1999, against only 8%in 1995. The share varies from 4% to more than 16% (Figure 10a). Austria and Greece are the onlycountries for which the share of the ICT sector (in terms of value added) did not increase during theperiod 1995-99. In both cases, the ICT manufacturing sector saw its relative share remain stable, whilethe share of the ICT services sector decreased slightly.
Ireland has the largest ICT-producing sector relative to GDP and is the only OECD country in whichICT manufacturing activities are mainly oriented towards computer and related equipment (more than50%) (Figure 10b). Along with Finland and Korea, Ireland is also the only OECD country for which the ICTmanufacturing sector is larger than the ICT services sector. This was also the case in Japan in 1995 butthe situation has changed owing to strong growth in the telecommunication services sector.
In most countries the relative share of the ICT manufacturing sector increased slightly, andparticularly in Finland, Ireland, Korea, the United States and Mexico. Almost one-fifth of the Finnish andthe Irish manufacturing industry output came from ICT-producing industries in 1999, compared witharound 13.0 and 12.5% in the United States and Japan respectively. Hungary experienced the fastestgrowth in its ICT-manufacturing sector (relative to other manufacturing activities), and in 1999 its sharewas comparable to that of the United Kingdom.
In most cases, the ICT services sector accounts for more than two-thirds of the overall ICT sector interms of value added (Figure 10c). In about half of the OECD countries for which data are available, ICTservices industries accounted for between 9% and 11% of business services value added. The share ishighest in Ireland, where in 1999 almost 15% of business services value added originated from ICTservices, mainly owing to the large share of the computer and related services industry. Sweden and theUnited Kingdom are also highly specialised in ICT services industries, ahead of France, the UnitedStates and Canada. Hungary and the Czech Republic, with the highest relative share oftelecommunication services, are reaping the benefits of liberalisation reforms in the mid-1990s, whichhave resulted in more dynamic growth relative to other services sectors.
Employment
In 1999, the 22 OECD countries for which data are available employed more than 15 million personsin the ICT sector or around 6.1% of total employment in the business sector. The United Statesaccounted for around one-third of total OECD ICT sector employment, the European Union for around35% and Japan for 17%; the G7 countries alone accounted for over three-quarters of the total.
In 1999, the size of the ICT sector represented between 3% and over 9.5% of total business sectoremployment. Only a handful of OECD countries (Hungary, Japan, Mexico, Korea) employed morepeople in ICT manufacturing activities than in ICT services, and in more than three-fifths of countries,more than seven out of ten ICT employees worked in services activities.
In all OECD countries except Korea, the Czech Republic and Spain, employment in the ICT sectorincreased in relative terms between 1995 and 1999, most notably in the Netherlands, the UnitedKingdom, Finland and the United States.
Between 1995 and 1999 in almost all the OECD countries, the share of employment in ICTmanufacturing activities (as a percentage of total manufacturing employment) remained stable, owing toa slight decrease in overall OECD manufacturing employment. In Ireland, Finland, Korea and Hungary, itincreased significantly since 1995. Except for Finland, these countries also had the largest computerequipment sector, in terms of ICT manufacturing employment.
Unlike ICT manufacturing activities, ICT services had a phase of relative expansion during thesecond half of the 1990s, adding more than 2 million jobs at the OECD level. The Netherlands, Finland,Denmark, the United Kingdom and the United States had a significant increase in the relative share ofICT services in overall services (Figure 11). Together, these countries contributed almost three-quartersof the growth in ICT services employment in the OECD area.
© OECD 2002
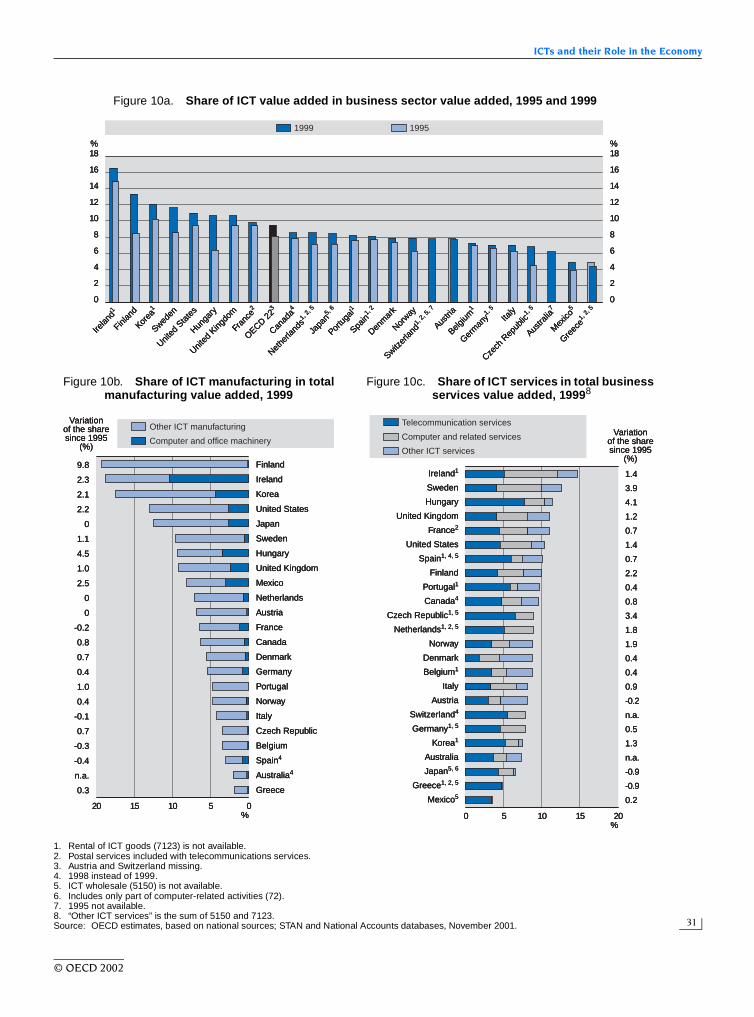
ICTs and their Role in the Economy
31
Figure 10a. Share of ICT value added in business sector value added, 1995 and 1999
Figure 10b. Share of ICT manufacturing in total manufacturing value added, 1999
Figure 10c. Share of ICT services in total business services value added, 19998
1. Rental of ICT goods (7123) is not available.2. Postal services included with telecommunications services.3. Austria and Switzerland missing.4. 1998 instead of 1999.5. ICT wholesale (5150) is not available.6. Includes only part of computer-related activities (72).7. 1995 not available.8. “Other ICT services” is the sum of 5150 and 7123.Source: OECD estimates, based on national sources; STAN and National Accounts databases, November 2001.
1999
18% %
16
14
12
10
8
6
4
2
0
18
1995
16
14
12
10
8
6
4
2
0
Irelan
d1
Finlan
d
Korea
1
Sweden
United
Sta
tes
Hunga
ry
United
King
dom
Fran
ce2
OECD 223
Canad
a4
Nethe
rland
s1,
2, 5
Japa
n5,
6
Portu
gal1
Spain1,
2
Denm
ark
Norway
Switzer
land1,
2, 5
, 7
Austri
a
Belgium
1
Germ
any1,
5
Italy
Czech
Rep
ublic1,
5
Austra
lia7
Mex
ico5
Greec
e1,
2, 5
20 15 10 5 0%
Finland
Ireland
Korea
United States
Japan
Sweden
Hungary
United Kingdom
Mexico
Netherlands
Austria
France
Canada
Denmark
Germany
Portugal
Norway
Italy
Czech Republic
Belgium
Spain4
Australia4
Greece
Variationof the sharesince 1995
(%)
Other ICT manufacturing
Computer and office machinery
9.8
2.3
2.1
2.2
0
1.1
4.5
1.0
2.5
0
0
-0.2
0.8
0.7
0.4
1.0
0.4
-0.1
0.7
-0.3
-0.4
n.a.
0.3
0 5 10 15 20%
Variationof the sharesince 1995
(%)
Computer and related services
Other ICT services
Telecommunication services
Ireland1
Sweden
Hungary
United Kingdom
France2
United States
Spain1, 4, 5
Finland
Portugal1
Canada4
Czech Republic1, 5
Netherlands1, 2, 5
Norway
Denmark
Belgium1
Italy
Austria
Switzerland4
Germany1, 5
Korea1
Australia
Japan5, 6
Greece1, 2, 5
Mexico5
1.4
3.9
4.1
1.2
0.7
1.4
0.7
2.2
0.4
0.8
3.4
1.8
1.9
0.4
0.4
0.9
-0.2
n.a.
0.5
1.3
n.a.
-0.9
-0.9
0.2
© OECD 2002

OECD Information Technology Outlook 2002
32
Figure 11a. Share of ICT employment in business sector employment, 1995 and 1999Percentages
Figure 11b. Share of ICT manufacturing in manufacturing employment, 1999
Percentages
Figure 11c. Share of ICT services in market services employment, 19997
Percentages
1. Rental of ICT goods (7123) not available.2. ICT wholesale (5150) not available.3. ICT services include market research and public opinion polling.4. Based on employee figures.5. 1998 instead of 1999.6. ICT services include postal services.7. “Other ICT services” is the sum of 5150 and 7123.Source: OECD estimates, based on national sources; STAN and National Accounts databases, November 2001.
1999
12% %
10
8
6
4
2
0
12
10
8
6
4
2
0
1995
ICT sectorand postal services
Finlan
d
Sweden
Irelan
d1
United
King
dom
Japa
n2,
3
Denm
ark
Belgium
Hunga
ry4
United
Sta
tes
Norway
Czech
Rep
ublic1,
2, 4
Korea
1, 2
Italy
Canad
a1
Austra
lia5
Germ
any1,
2
Portu
gal4
Nethe
rland
s1,
6
Fran
ce6
Austri
a6
Spain1,
6
Mex
ico4,
6
15 10 5 0%
Variationof the sharesince 1995
(%)
Other ICT manufacturing
Computer and office machinery
Korea1, 2
Ireland1
Japan2, 3
Finland
Sweden
United States
Mexico4, 6
Hungary4
United Kingdom
Netherlands1, 6
Germany1, 2
Austria6
France6
Canada1, 5
Denmark
Norway
Italy
Belgium
Czech Republic1, 2, 4
Portugal1, 5
Spain1, 5, 6
Australia5
Greece1, 2, 6
1.2
3.0
0.4
2.5
0.4
0.3
0.9
2.3
0.2
-0.1
0.0
0.2
0.3
0.1
0.2
0.1
0.1
-0.2
0.4
0.4
-0.1
n.a.
0.2
1.4
1.0
0.8
-2.7
1.4
0.5
0.3
0.6
0.2
n.a.
1.2
-0.3
0.2
0.3
0.0
0.3
0.3
1.9
0.3
0.4
0.0
0.2
0 5 10 15%
Variationin share
since 1995(%)
Computer and related services
Other ICT services
Telecommunications services
Finland
Denmark
Sweden
Czech Republic1, 2, 4
United Kingdom
Belgium
Norway
Ireland1
Italy
Australia5
United States
Hungary4
Canada1, 5
Japan2, 3
Portugal1, 5
Germany1, 2
Korea1, 2
Netherlands1, 6
France6
Austria6
Spain1, 5, 6
Greece1, 2, 6
ICT services and postal services
1.4
1.0
0.8
-2.7
1.4
0.5
0.3
0.6
0.2
n.a.
1.2
-0.3
0.2
0.3
0.0
0.3
0.3
1.9
0.3
0.4
0.0
0.2
0 5 10 15%
Variationin share
since 1995(%)
Computer and related services
Other ICT services
Telecommunications services
Finland
Denmark
Sweden
Czech Republic1, 2, 4
United Kingdom
Belgium
Norway
Ireland1
Italy
Australia5
United States
Hungary4
Canada1, 5
Japan2, 3
Portugal1, 5
Germany1, 2
Korea1, 2
Netherlands1, 6
France6
Austria6
Spain1, 5, 6
Greece1, 2, 6
ICT services and postal services
© OECD 2002

ICTs and their Role in the Economy
33
There is currently some debate over the extent to which a large ICT-producing sector contributespositively to growth (OECD, 2001b). In terms of the broader growth picture across the economy, fewOECD countries – the United States, Canada, Australia, Ireland and Norway – increased trend growth inthe 1990s compared with the 1980s both in GDP per capita and in adjusted multifactor productivity(MFP), and all but Australia had a relatively large ICT sector (in terms of value added and employment).In countries that have seen a slowdown in trend GDP and a deceleration in adjusted MFP growth, thepicture is more mixed, with some countries having large ICT sectors, while others did not.3
Trade
The following section examines the main trends in ICT trade, while Chapter 2 examines this topic inmore detail and provides additional insights into the extent and nature of globalisation in theICT-producing sector. For the purposes of this analysis, ICT products are divided into four mainsegments: computer equipment, communication equipment, electronic components and softwareproducts (see Annex 1: Methodology). Owing to the use of different classification systems, software andhardware products are treated separately. The recent downturn is not yet evident in ICT trade data,with 2000 being the most recent year for which complete data are available. Nonetheless, preliminarydata suggest that during 2001, the regions and countries that experienced the strongest export declineswere also those that traded intensely in ICT goods (WTO, 2002).
OECD trade in ICT goods (excluding software) grew rapidly during the 1990s, through to 2000.In 1990, ICT goods accounted for 6.5% of OECD merchandise trade; by 2000 they accounted foralmost 13%.4 In 1990, ICT goods trade (defined as the average of imports and exports) was worth almostUSD 160 billion. By 2000, it had reached almost USD 580 billion. Over that period, ICT goods exportsincreased from USD 154 billion to USD 559 billion, and imports increased from USD 162 billion toUSD 602 billion (see Annex Table 1.2). Trade in ICT goods grew 13.8% a year over the period 1990-2000,compared to growth of 6.5% a year in total merchandise trade (Figure 12).
Figure 12. OECD trade in ICT goods, 1990-2000Index 1990 = 100
Source: OECD, ITS database, January 2002.
700
600
500
400
300
200
100
0
700
600
500
400
300
200
100
01990 1991 1992 1993 1994 1995 1996 1997 1998 1999 2000
Electronic componentsCommunication equipmentComputer equipment
Total tradeTotal ICTs
700
600
500
400
300
200
100
0
700
600
500
400
300
200
100
01990 1991 1992 1993 1994 1995 1996 1997 1998 1999 2000
Electronic componentsCommunication equipmentComputer equipment
Total tradeTotal ICTs
700
600
500
400
300
200
100
0
700
600
500
400
300
200
100
01990 1991 1992 1993 1994 1995 1996 1997 1998 1999 2000
Electronic componentsCommunication equipmentComputer equipment
Total tradeTotal ICTs
© OECD 2002
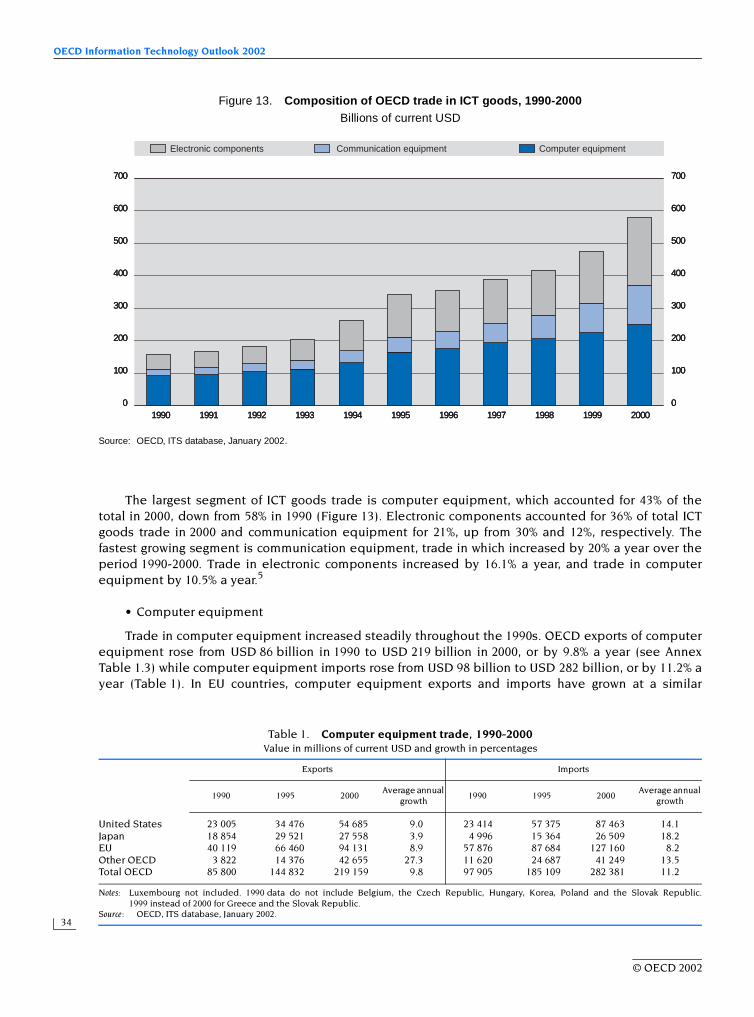
OECD Information Technology Outlook 2002
34
The largest segment of ICT goods trade is computer equipment, which accounted for 43% of thetotal in 2000, down from 58% in 1990 (Figure 13). Electronic components accounted for 36% of total ICTgoods trade in 2000 and communication equipment for 21%, up from 30% and 12%, respectively. Thefastest growing segment is communication equipment, trade in which increased by 20% a year over theperiod 1990-2000. Trade in electronic components increased by 16.1% a year, and trade in computerequipment by 10.5% a year.5
• Computer equipment
Trade in computer equipment increased steadily throughout the 1990s. OECD exports of computerequipment rose from USD 86 billion in 1990 to USD 219 billion in 2000, or by 9.8% a year (see AnnexTable 1.3) while computer equipment imports rose from USD 98 billion to USD 282 billion, or by 11.2% ayear (Table 1). In EU countries, computer equipment exports and imports have grown at a similar
Figure 13. Composition of OECD trade in ICT goods, 1990-2000Billions of current USD
Source: OECD, ITS database, January 2002.
700
600
500
400
300
200
100
0
700
600
500
400
300
200
100
01990 1991 1992 1993 1994 1995 1996 1997 1998 1999 2000
Electronic components Communication equipment Computer equipment
700
600
500
400
300
200
100
0
700
600
500
400
300
200
100
01990 1991 1992 1993 1994 1995 1996 1997 1998 1999 2000
Electronic components Communication equipment Computer equipment
700
600
500
400
300
200
100
0
700
600
500
400
300
200
100
01990 1991 1992 1993 1994 1995 1996 1997 1998 1999 2000
Electronic components Communication equipment Computer equipment
Table 1. Computer equipment trade, 1990-2000Value in millions of current USD and growth in percentages
Notes: Luxembourg not included. 1990 data do not include Belgium, the Czech Republic, Hungary, Korea, Poland and the Slovak Republic.1999 instead of 2000 for Greece and the Slovak Republic.
Source: OECD, ITS database, January 2002.
Exports Imports
1990 1995 2000Average annual
growth1990 1995 2000
Average annual growth
United States 23 005 34 476 54 685 9.0 23 414 57 375 87 463 14.1Japan 18 854 29 521 27 558 3.9 4 996 15 364 26 509 18.2EU 40 119 66 460 94 131 8.9 57 876 87 684 127 160 8.2Other OECD 3 822 14 376 42 655 27.3 11 620 24 687 41 249 13.5Total OECD 85 800 144 832 219 159 9.8 97 905 185 109 282 381 11.2
© OECD 2002

ICTs and their Role in the Economy
35
rate (between 8% and 9% a year between 1990 and 2000). Computer equipment imports into theUnited States and Japan have grown much faster than their exports from these countries, while exportsfrom other OECD countries have grown much faster than imports.
The United States and Japan are still the leading exporters of computer equipment, but their shareof total OECD exports is falling. Exports of computer equipment from other OECD countries represent arising share. In 2000, the United States accounted for one-quarter of total OECD exports of computerequipment, Japan for 13%, the European Union 43% and other OECD countries for the remaining 20%.Other leading exporters of computer equipment in 2000 included the Netherlands and theUnited Kingdom (around USD 20 billion each), Korea (USD 19 billion), Ireland (USD 17 billion),Germany (USD 15 billion), Mexico (USD 11 billion) and France (USD 9 billion).
The United States is also a major import market for computer equipment (31% of imports in 2000);as are the European Union and other OECD countries. Japan accounts for a relatively smaller share ofcomputer imports at just 9% of the total in 2000. Nevertheless, imports of computer equipment intoJapan increased by more than 18% a year between 1990 and 2000. Other major import markets forcomputer equipment in 2000 included Germany and the United Kingdom (around USD 26 billion),the Netherlands (USD 23 billion), France (USD 14 billion), Canada (USD 11 billion) and Ireland(USD 10 billion).
Ireland’s role in assembly and re-export is evident from its USD 10 billion in imports andUSD 17 billion in exports of computer equipment in 2000. Ireland’s exports of computer equipmenthave increased by 14.5% a year since 1990. Mexico also stands out in terms of assembly and re-export.Its imports of computer equipment increased by 25% a year between 1990 and 2000, fromUSD 560 million to USD 5.2 billion, while its exports increased from just USD 450 million to more thanUSD 11 billion, or by 38% a year.
• Communication equipment
Communication equipment is the fastest growing segment. Exports of communication equipmentfrom OECD countries increased by almost 20% a year, from USD 21 billion in 1990 to USD 126 billionin 2000. Imports of communication equipment into OECD countries increased by 21% a year over thesame period, from USD 18 billion to USD 116 billion (Table 2).
In 2000, EU countries accounted for 55% of OECD country exports of communication equipment, theUnited States for 16.4%, Japan for 6.4% and other OECD countries for the remaining 22.1% (see AnnexTable 1.4). Japan’s share of communication equipment exports declined rapidly, while that of otherOECD countries has increased. Communication equipment exports from Japan have grown relativelyslowly since 1990 (3.7% a year), while exports from the United States increased by 18% a year, exportsfrom European Union countries rose by 22% a year and those from other OECD countries advancedby 31% a year.
Table 2. Communication equipment trade, 1990-2000Value in millions of current USD and growth in percentages
Notes: Luxembourg not included. 1990 data do not include Belgium, the Czech Republic, Hungary, Korea, Poland and the Slovak Republic.1999 instead of 2000 for Greece and the Slovak Republic.
Source: OECD, ITS database, January 2002.
Exports Imports
1990 1995 2000Average annual
growth1990 1995 2000
Average annual growth
United States 4 063 10 933 20 680 17.7 6 016 10 649 34 652 19.1Japan 5 614 6 904 8 106 3.7 805 3 023 5 165 20.4EU 9 541 26 440 69 179 21.9 8 022 18 194 52 017 20.6Other 1 854 6 931 27 871 31.1 2 964 8 559 23 988 23.3Total OECD 21 071 51 207 125 837 19.6 17 807 40 425 115 822 20.6
© OECD 2002

OECD Information Technology Outlook 2002
36
In 2000, EU countries accounted for 45% of OECD country imports of communication equipment,the United States accounted for 30%, Japan for less than 5% and other OECD countries for theremaining 21%. Import shares for the major groupings were stable throughout the last decade. Importsof communication equipment into OECD countries have grown strongly since 1990, by around 20% ayear into the United States, the European Union and Japan.
After the United States, leading exporters of communication equipment in 2000 included theUnited Kingdom (USD 14.0 billion), Germany (USD 11.5 billion), Canada (USD 10.4 billion), Sweden(USD 10.2 billion) and France (almost USD 10 billion). Sweden and Finland (with Ericsson and Nokia)are much larger exporters of communication equipment than they are importers. The United Statesaccounts for almost 30% of OECD communication equipment imports at almost USD 35 billion in 2000.Other markets for communication equipment imports are small in comparison. They include theUnited Kingdom (USD 12.7 billion), Germany (USD 7.6 billion), the Netherlands (5.8 billion), Canada(USD 5.5 billion) and Japan, France and Italy (around USD 5 billion each). Mexico’s trade incommunication equipment is also significant, with exports growing from just USD 24 million in 1990 tomore than USD 8 billion in 2000. Ireland too has experienced very strong growth in its trade incommunication equipment, with exports increasing from USD 211 million in 1990 to USD 2.8 billionin 2000.
• Electronic components
Trade in electronic components has also grown rapidly; faster than trade in computer equipmentand almost as fast as trade in communication equipment. Exports of electronic components from OECDcountries increased from USD 48 billion in 1990 to USD 214 billion in 2000, or by 16% a year. Over thesame period, imports of electronic components into OECD countries increased from USD 47 billion toUSD 204 billion, or by 16% a year (Table 3).
Exports of electronic components from the United States increased by 18% a year over thedecade 1990 to 2000, while those from both Japan and the European Union increased by 13% a year, andthose from other OECD countries by 29% a year (see Annex Table 1.5). Imports of electronic componentsinto other OECD countries also increased rapidly (26% a year), while those into Japan increased by 19%a year, and those into the United States by 14% a year. Imports of electronic components into theEuropean Union increased at the more modest rate of a little over 12% a year.
In 2000, the United States accounted for 33% of total OECD electronic component exports, Japanand the European Union for around 25% each and the other OECD countries for the remaining 17%. TheUnited States’ share of exports rose over the decade to 2000, while the shares of the European Unionand Japan fell. EU countries accounted for the largest share (34%) of OECD electronic componentimports in 2000, the United States was a close second (28%), Japan accounted for just 10% and other
Table 3. Electronic component trade, 1990-2000Value in millions of current USD and growth in percentages
Notes: Luxembourg not included. 1990 data do not include Belgium, the Czech Republic, Hungary, Korea, Poland and the Slovak Republic.1999 instead of 2000 for Greece and the Slovak Republic.
Source: OECD, ITS database, January 2002.
Exports Imports
1990 1995 2000Average annual
growth1990 1995 2000
Average annual growth
United States 13 826 27 668 70 001 17.6 15 653 44 283 56 190 13.6Japan 14 678 43 270 50 348 13.1 3 585 12 592 20 970 19.3EU 16 330 36 393 55 972 13.4 21 776 44 810 69 070 12.2Other 2 753 26 045 35 712 29.2 5 491 26 931 57 366 26.4Total OECD 47 587 133 376 213 658 16.2 46 505 128 615 203 596 15.9
© OECD 2002
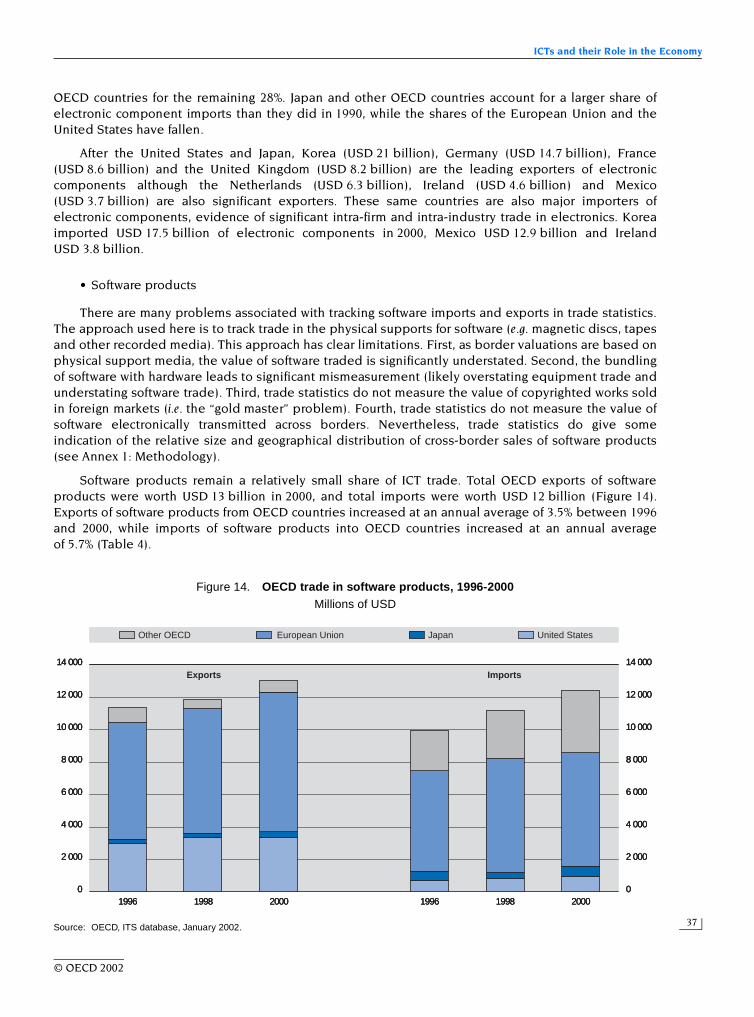
ICTs and their Role in the Economy
37
OECD countries for the remaining 28%. Japan and other OECD countries account for a larger share ofelectronic component imports than they did in 1990, while the shares of the European Union and theUnited States have fallen.
After the United States and Japan, Korea (USD 21 billion), Germany (USD 14.7 billion), France(USD 8.6 billion) and the United Kingdom (USD 8.2 billion) are the leading exporters of electroniccomponents although the Netherlands (USD 6.3 billion), Ireland (USD 4.6 billion) and Mexico(USD 3.7 billion) are also significant exporters. These same countries are also major importers ofelectronic components, evidence of significant intra-firm and intra-industry trade in electronics. Koreaimported USD 17.5 billion of electronic components in 2000, Mexico USD 12.9 billion and IrelandUSD 3.8 billion.
• Software products
There are many problems associated with tracking software imports and exports in trade statistics.The approach used here is to track trade in the physical supports for software (e.g. magnetic discs, tapesand other recorded media). This approach has clear limitations. First, as border valuations are based onphysical support media, the value of software traded is significantly understated. Second, the bundlingof software with hardware leads to significant mismeasurement (likely overstating equipment trade andunderstating software trade). Third, trade statistics do not measure the value of copyrighted works soldin foreign markets (i.e. the “gold master” problem). Fourth, trade statistics do not measure the value ofsoftware electronically transmitted across borders. Nevertheless, trade statistics do give someindication of the relative size and geographical distribution of cross-border sales of software products(see Annex 1: Methodology).
Software products remain a relatively small share of ICT trade. Total OECD exports of softwareproducts were worth USD 13 billion in 2000, and total imports were worth USD 12 billion (Figure 14).Exports of software products from OECD countries increased at an annual average of 3.5% between 1996and 2000, while imports of software products into OECD countries increased at an annual averageof 5.7% (Table 4).
Figure 14. OECD trade in software products, 1996-2000Millions of USD
Source: OECD, ITS database, January 2002.
14 000
12 000
10 000
8 000
6 000
4 000
2 000
01996 1998 2000
14 000
12 000
10 000
8 000
6 000
4 000
2 000
01996 1998 2000
Exports Imports
Other OECD European Union Japan United States
14 000
12 000
10 000
8 000
6 000
4 000
2 000
01996 1998 2000
14 000
12 000
10 000
8 000
6 000
4 000
2 000
01996 1998 2000
Exports Imports
Other OECD European Union Japan United States
14 000
12 000
10 000
8 000
6 000
4 000
2 000
01996 1998 2000
14 000
12 000
10 000
8 000
6 000
4 000
2 000
01996 1998 2000
Exports Imports
Other OECD European Union Japan United States
© OECD 2002

OECD Information Technology Outlook 2002
38
In 2000, EU countries accounted for 66% of all OECD exports of software products, the United Statesfor 26%, Japan for just 2.4% and other OECD countries for the remaining 5.6% (see Annex Table 1.6).Software product imports are more evenly distributed. EU countries accounted for 56% of total OECDimports in 2000, the United States for 8%, Japan for 5% and the other OECD countries for theremaining 31%.
The leading exporters of software products are Ireland and the United States (Table 5). Irelandexported USD 3.8 billion in 2000, or almost 30% of total OECD exports of software products. TheUnited States exported USD 3.4 billion, or around 26% of the OECD total. Except for the Netherlands, noother country exported more than USD 1 billion. However, the United Kingdom (USD 895 million) wasalso a major exporter.
The United Kingdom was the leading import market for software products in 2000; atUSD 1.6 billion or 13% of OECD total. Canada (USD 1 billion), Germany (USD 988 million), France(USD 959 million), the United States (USD 956 million) and Switzerland (USD 823 million) were theother major import markets for software products in 2000.
Table 4. Software products trade, 1996-2000Value in millions of current USD and growth in percentages
Notes: Luxembourg not included. 1990 data do not include Belgium, the Czech Republic, Hungary, Korea, Poland and the Slovak Republic.1999 instead of 2000 for Greece and the Slovak Republic.
Source: OECD, ITS database, January 2002.
Exports Imports
1996 1998 2000Average annual
growth1996 1998 2000
Average annual growth
United States 3 002 3 325 3 382 3.0 714 822 956 7.6Japan 254 292 317 5.7 560 385 629 3.0EU 7 188 7 681 8 618 4.6 6 185 7 014 6 984 3.1Other 920 549 734 –5.5 2 501 2 987 3 850 11.4Total OECD 11 363 11 847 13 051 3.5 9 959 11 208 12 418 5.7
Table 5. Software products: leading exporting and importing countries, 2000Value in millions of current USD and share in percentages
Notes: 1999 data for Greece and the Slovak Republic. OECD and EU are partial totals from available data.Source: OECD, ITS database, January 2002.
Exports USD millions Share (%) Imports USD millions Share (%)
Ireland 3 819 29 United Kingdom 1 592 13United States 3 382 26 Canada 1 054 8Netherlands 1 079 8 Germany 988 8United Kingdom 895 7 France 959 8Austria 780 6 United States 956 8Germany 702 5 Switzerland 823 7France 483 4 Italy 815 7Japan 317 2 Japan 629 5Belgium 308 2 Netherlands 567 5Canada 241 2 Korea 527 4
OECD 13 051 100 OECD 12 418 100EU 8 618 66 EU 6 984 56
© OECD 2002

ICTs and their Role in the Economy
39
• Services
Because of their intangible nature and the increasing complexity of delivery mechanisms, trade inservices is more difficult to quantify. Moreover, there is greater variation among countries in thecollection of services trade data in terms both of definitions used and of the quality and coverage ofcollections.6 Nevertheless, it is clear that trade in ICT-related services is significant and growing.
Communications services exports from OECD countries were worth around USD 23 billion in 2000,while imports of communications services cost OECD countries more than USD 26 billion (Table 6).OECD exports of computer and information services were worth around USD 29 billion, while importscost almost USD 20 billion. Over the period 1995-2000, OECD-area communications services exportsincreased by 33%, while imports increased by 18%. Computer and information services exportsincreased by 173% over the same period, while imports increased by 146%.
The United States was the leading exporter and importer of communications services; USD 4.1and USD 5.8 billion, respectively (see Annex Table 1.7). The United States accounted for 18% of OECDexports of communications services, and 22% of imports. Other major exporters of communicationsservices included the United Kingdom (USD 2.5 billion), Belgium-Luxembourg (USD 1.9 billion),Germany and the Netherlands (USD 1.4 billion), and France and Italy (around USD 1.3 billion). Othermajor importers of communications services included: Germany (USD 3.2 billion), the United Kingdom(USD 2.3 billion), Italy (USD 1.9 billion), Netherlands (USD 1.4 billion), Canada (USD 1.3 billion), andJapan and France (around USD 1.1 billion). The top ten exporters account for 75% of all OECD exports ofcommunications services, and the top ten importers for 78% of imports.
Table 6. Trade in ICT services, 2000Value in millions of current USD
Source: OECD/Eurostat (2001), Statistics on International Trade in Services; IMF, Balance of Payments, January 2002.
Communication services Computer and information services
Imports Exports Imports Exports
Australia 1 095 819 261 421Austria 425 472 212 135Belgium-Luxembourg 958 1 861 1 320 1 721Canada 1 254 1 215 791 1 345Czech Republic 46 215 83 95Finland 270 203 281 181France 1 143 1 322 742 807Germany 3 150 1 436 4 836 3 716Greece 288 257 157 89Hungary 76 69 127 122Iceland 2 10 2 31Ireland 342 328 275 5 479Italy 1 935 1 274 926 448Japan 1 150 821 3 066 1 569Korea 623 387 92 11Mexico 366 1 213 . . . .Netherlands 1 426 1 426 1 187 1 152New Zealand 198 181 100 79Norway 169 286 243 92Poland 423 234 218 60Portugal 158 176 160 75Slovak Republic 26 52 56 52Spain 743 668 1 226 2 041Sweden 792 644 1 067 1 191Switzerland 858 891 . . . .United Kingdom 2 310 2 505 1 150 3 684United States 5 800 4 090 1 040 4 900
OECD 26 022 23 055 19 617 29 495EU 13 938 12 572 13 538 20 718
© OECD 2002
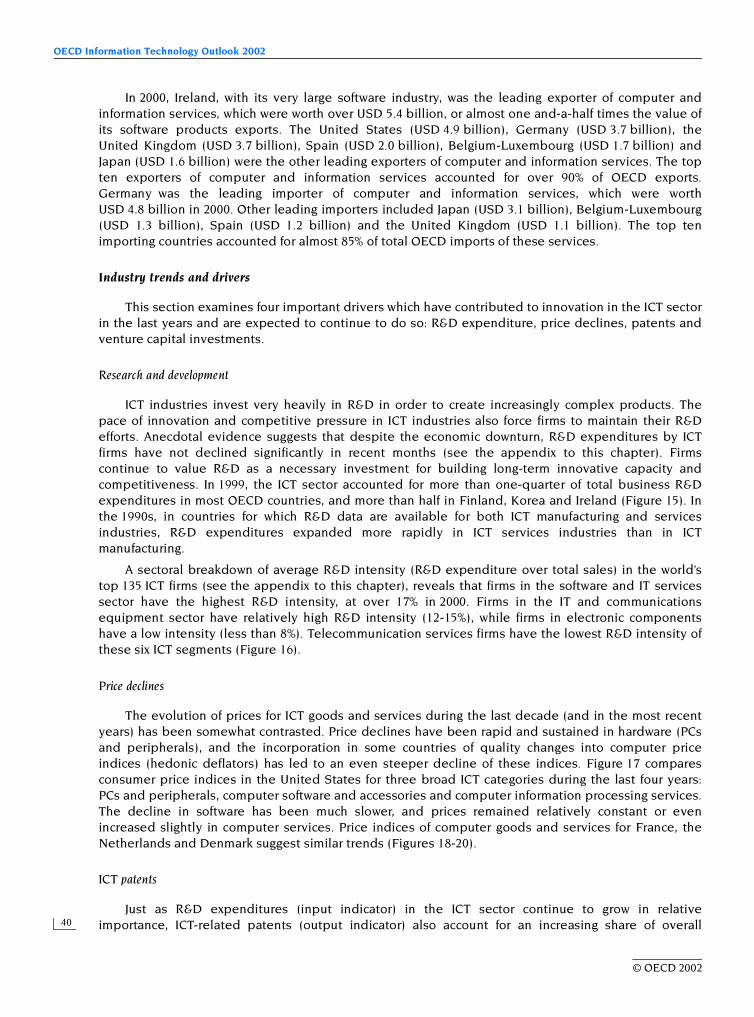
OECD Information Technology Outlook 2002
40
In 2000, Ireland, with its very large software industry, was the leading exporter of computer andinformation services, which were worth over USD 5.4 billion, or almost one and-a-half times the value ofits software products exports. The United States (USD 4.9 billion), Germany (USD 3.7 billion), theUnited Kingdom (USD 3.7 billion), Spain (USD 2.0 billion), Belgium-Luxembourg (USD 1.7 billion) andJapan (USD 1.6 billion) were the other leading exporters of computer and information services. The topten exporters of computer and information services accounted for over 90% of OECD exports.Germany was the leading importer of computer and information services, which were worthUSD 4.8 billion in 2000. Other leading importers included Japan (USD 3.1 billion), Belgium-Luxembourg(USD 1.3 billion), Spain (USD 1.2 billion) and the United Kingdom (USD 1.1 billion). The top tenimporting countries accounted for almost 85% of total OECD imports of these services.
Industry trends and drivers
This section examines four important drivers which have contributed to innovation in the ICT sectorin the last years and are expected to continue to do so: R&D expenditure, price declines, patents andventure capital investments.
Research and development
ICT industries invest very heavily in R&D in order to create increasingly complex products. Thepace of innovation and competitive pressure in ICT industries also force firms to maintain their R&Defforts. Anecdotal evidence suggests that despite the economic downturn, R&D expenditures by ICTfirms have not declined significantly in recent months (see the appendix to this chapter). Firmscontinue to value R&D as a necessary investment for building long-term innovative capacity andcompetitiveness. In 1999, the ICT sector accounted for more than one-quarter of total business R&Dexpenditures in most OECD countries, and more than half in Finland, Korea and Ireland (Figure 15). Inthe 1990s, in countries for which R&D data are available for both ICT manufacturing and servicesindustries, R&D expenditures expanded more rapidly in ICT services industries than in ICTmanufacturing.
A sectoral breakdown of average R&D intensity (R&D expenditure over total sales) in the world’stop 135 ICT firms (see the appendix to this chapter), reveals that firms in the software and IT servicessector have the highest R&D intensity, at over 17% in 2000. Firms in the IT and communicationsequipment sector have relatively high R&D intensity (12-15%), while firms in electronic componentshave a low intensity (less than 8%). Telecommunication services firms have the lowest R&D intensity ofthese six ICT segments (Figure 16).
Price declines
The evolution of prices for ICT goods and services during the last decade (and in the most recentyears) has been somewhat contrasted. Price declines have been rapid and sustained in hardware (PCsand peripherals), and the incorporation in some countries of quality changes into computer priceindices (hedonic deflators) has led to an even steeper decline of these indices. Figure 17 comparesconsumer price indices in the United States for three broad ICT categories during the last four years:PCs and peripherals, computer software and accessories and computer information processing services.The decline in software has been much slower, and prices remained relatively constant or evenincreased slightly in computer services. Price indices of computer goods and services for France, theNetherlands and Denmark suggest similar trends (Figures 18-20).
ICT patents
Just as R&D expenditures (input indicator) in the ICT sector continue to grow in relativeimportance, ICT-related patents (output indicator) also account for an increasing share of overall
© OECD 2002

ICTs and their Role in the Economy
41
Figure 15. R&D expenditure in selected ICT industries, 1999 or latest available yearAs a percentage of business enterprise sector R&D expenditure
1. ISIC, Rev. 3 divisions: 30 (manufacture of office, accounting andcomputing machinery); 32 (manufacture of radio, television andcommunication equipment and apparatus) and 33 (manufacture ofmedical, precision and optical instruments, watches and clocks).
2. ISIC, Rev. 3 divisions: 64 (post and telecommunications) and 72(computer and related activities).
3. 1997 instead of 1999.4. 2000 instead of 1999.5. 1998 for manufacturing industries and 1997 for services industries
instead of 1999.6. Due to unavailability of data for division 64, class 642
(telecommunication) is included in services ICT R&D as a proxy.Available information shows that in the United States class 642accounts for about 97-98% of division 64 total.
7. 1998 instead of 1999.Source: OECD (2001c).
58.5
0 10 20 70%
30 40 50 60
56.1
50.2
43.5
36.9
36.3
33.6
26.6
25.6
24.4
24.1
23.1
8.6
6.0
33.2
29.4
22.3
17.4
13.5
Finland
Korea
Ireland3
Canada4
Sweden
Norway5
United States6
Italy
Spain
Belgium4
United Kingdom
Denmark7
Poland
Czech Republic
Japan
Netherlands7
France7
Germany
Australia7
ICT-related R&D expenditurein manufacturing industries1
ICT-related R&D expenditurein services industries2
ICT-related R&D expenditurein manufacturing industries only
Figure 16. Average R&D intensity in top ICT firms by sector, 2000
Source: OECD, based on a sample of the top 135 ICT firms.
0 2 4 6 8 10 12 14 16 18 20%
Software
IT services
IT equipment
Communication equipment
Electronics and components
Telecommunications
0 2 4 6 8 10 12 14 16 18 20%
Software
IT services
IT equipment
Communication equipment
Electronics and components
Telecommunications
0 2 4 6 8 10 12 14 16 18 20%
Software
IT services
IT equipment
Communication equipment
Electronics and components
Telecommunications
© OECD 2002
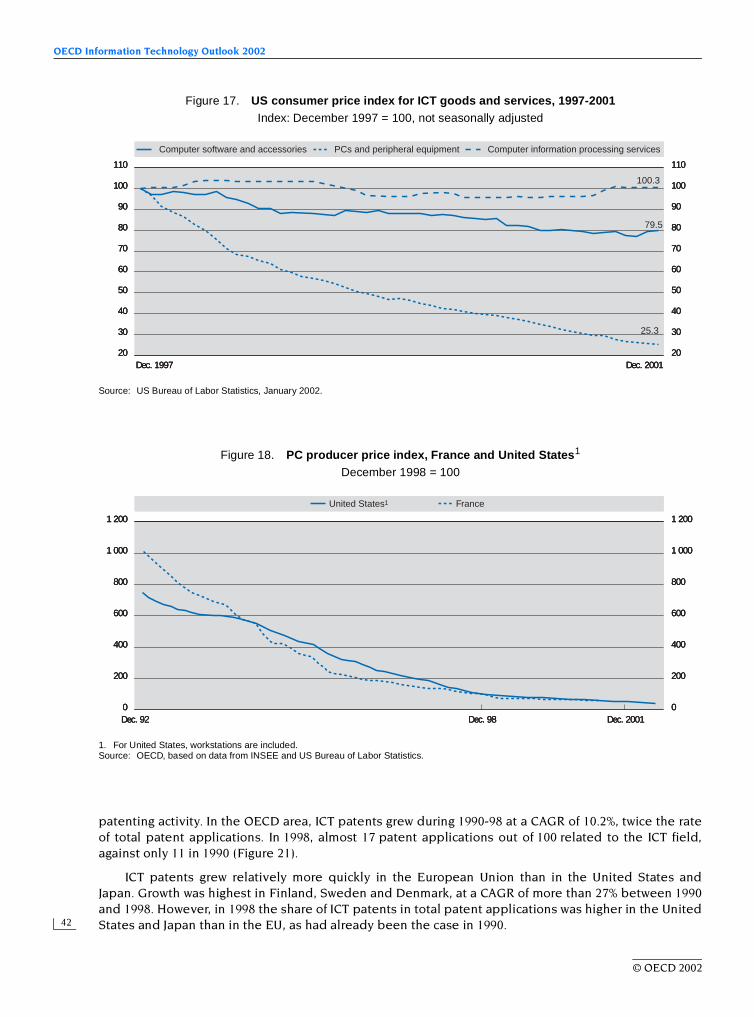
OECD Information Technology Outlook 2002
42
patenting activity. In the OECD area, ICT patents grew during 1990-98 at a CAGR of 10.2%, twice the rateof total patent applications. In 1998, almost 17 patent applications out of 100 related to the ICT field,against only 11 in 1990 (Figure 21).
ICT patents grew relatively more quickly in the European Union than in the United States andJapan. Growth was highest in Finland, Sweden and Denmark, at a CAGR of more than 27% between 1990and 1998. However, in 1998 the share of ICT patents in total patent applications was higher in the UnitedStates and Japan than in the EU, as had already been the case in 1990.
Figure 17. US consumer price index for ICT goods and services, 1997-2001Index: December 1997 = 100, not seasonally adjusted
Source: US Bureau of Labor Statistics, January 2002.
110
20
100
80
60
40
30
50
70
90
110
20
100
80
60
40
30
50
70
90
100.3
79.5
25.3
Dec. 1997 Dec. 2001
PCs and peripheral equipment Computer information processing servicesComputer software and accessories
110
20
100
80
60
40
30
50
70
90
110
20
100
80
60
40
30
50
70
90
100.3
79.5
25.3
Dec. 1997 Dec. 2001
PCs and peripheral equipment Computer information processing servicesComputer software and accessories
110
20
100
80
60
40
30
50
70
90
110
20
100
80
60
40
30
50
70
90
100.3
79.5
25.3
Dec. 1997 Dec. 2001
PCs and peripheral equipment Computer information processing servicesComputer software and accessories
Figure 18. PC producer price index, France and United States1
December 1998 = 100
1. For United States, workstations are included.Source: OECD, based on data from INSEE and US Bureau of Labor Statistics.
1 200
0
1 000
800
600
400
200
1 200
0
1 000
800
600
400
200
United States1 France
Dec. 92 Dec. 98 Dec. 2001
1 200
0
1 000
800
600
400
200
1 200
0
1 000
800
600
400
200
United States1 France
Dec. 92 Dec. 98 Dec. 2001
1 200
0
1 000
800
600
400
200
1 200
0
1 000
800
600
400
200
United States1 France
Dec. 92 Dec. 98 Dec. 2001
© OECD 2002
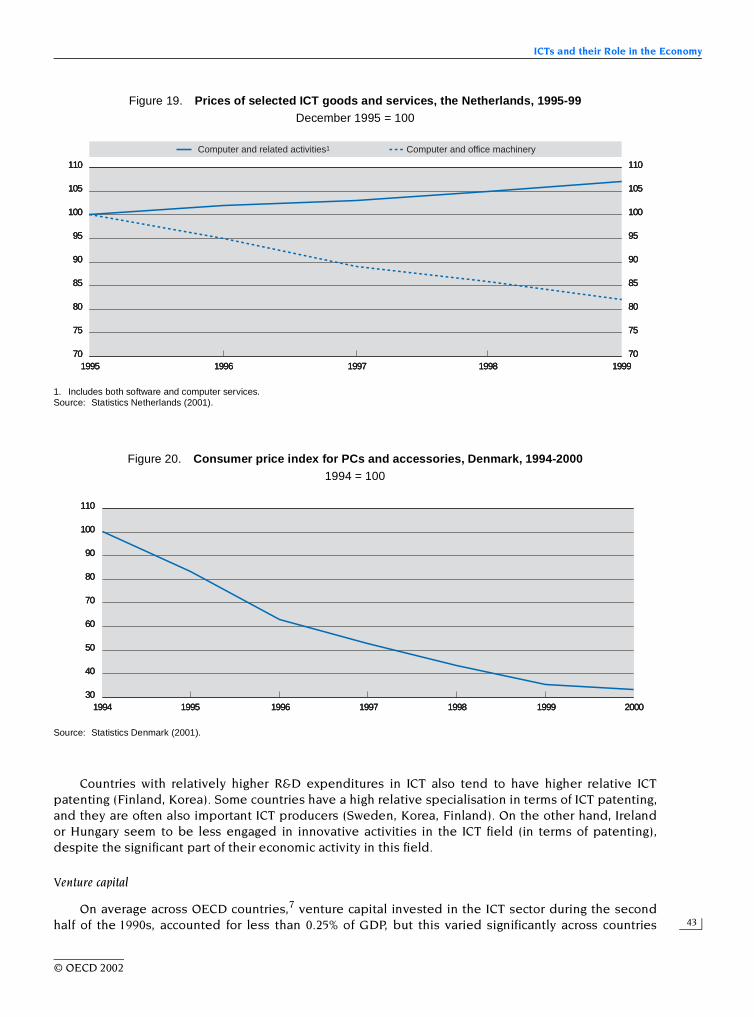
ICTs and their Role in the Economy
43
Countries with relatively higher R&D expenditures in ICT also tend to have higher relative ICTpatenting (Finland, Korea). Some countries have a high relative specialisation in terms of ICT patenting,and they are often also important ICT producers (Sweden, Korea, Finland). On the other hand, Irelandor Hungary seem to be less engaged in innovative activities in the ICT field (in terms of patenting),despite the significant part of their economic activity in this field.
Venture capital
On average across OECD countries,7 venture capital invested in the ICT sector during the secondhalf of the 1990s, accounted for less than 0.25% of GDP, but this varied significantly across countries
Figure 19. Prices of selected ICT goods and services, the Netherlands, 1995-99December 1995 = 100
1. Includes both software and computer services.Source: Statistics Netherlands (2001).
1995 1996 1997 1998 1999
110
70
105
100
95
90
85
80
75
110
70
105
100
95
90
85
80
75
Computer and related activities1 Computer and office machinery
1995 1996 1997 1998 1999
110
70
105
100
95
90
85
80
75
110
70
105
100
95
90
85
80
75
Computer and related activities1 Computer and office machinery
1995 1996 1997 1998 1999
110
70
105
100
95
90
85
80
75
110
70
105
100
95
90
85
80
75
Computer and related activities1 Computer and office machinery
Figure 20. Consumer price index for PCs and accessories, Denmark, 1994-20001994 = 100
Source: Statistics Denmark (2001).
1994 1996 1997 1998 2000
110
30
100
90
80
70
60
50
40
1995 19991994 1996 1997 1998 2000
110
30
100
90
80
70
60
50
40
1995 19991994 1996 1997 1998 2000
110
30
100
90
80
70
60
50
40
1995 1999
© OECD 2002

OECD Information Technology Outlook 2002
44
(Figure 22). However the ICT sector attracted much interest among venture capitalists during thesecond half of the 1990s, and, as a result, the funds raised increased strongly. The share in 19 OECDcountries was multiplied on average by a factor of more than 12 between 1995 and 1999, with abouttwo-thirds of the funds to the IT field and the rest to communications.
The ICT sector attracts more than one-third of the total venture capital in the OECD area, andaround one-fifth in the European Union. Ireland is the only European country in which the ICT sectorattracts more than half of all venture capital, of which three-quarters went to the IT field (Figure 23).Korea is one of the countries in which at least 40% of total venture capital is concentrated in the ICTfield, far above G7 countries such as the United Kingdom, Germany or Japan.
A more detailed analysis of the US data (with a slightly different definition of the ICT sector) showsthe vitality of the country’s venture capital financing system and the ICT sector. In 2000, total venturecapital in the United States reached a record USD 103 billion, a 73.5% rise over the previous year.Figure 24 shows the strong growth of venture capital investments in each of the four main ICT-relatedindustries, which accounted for a total of USD 40.4 billion in 2000 (compared to USD 21.3 billion theprevious year). In addition to these industries, a further USD 47.9 billion was invested in 2000 in variousother “Internet-specific” firms.
Using a different breakdown, Figure 25 shows Internet-related firms as the main beneficiaries ofventure capital investment in the United States: these firms accounted for three-quarters of allinvestments in 2000, with e-commerce and content accounting for a full third.8 Preliminary data suggestthat the decline throughout successive quarters during 2000 continued until the third quarter of 2001,with a significant pickup in the final quarter of that year, particularly in the software sector(PricewaterhouseCoopers, 2002).
Figure 21. ICT1 patents as a percentage of total national patents filed at the European Patent Office (EPO), for priority years 1990 and 1998
1. International Patent Classification classes: G06 (computing, calculating, counting devices), G11 (information storage equipment) and H04(electrical communication systems).
Source: OECD Patent Database, March 2002.
% %45
35
30
15
10
5
0
20
25
40
45
35
30
15
10
5
0
20
25
40
1998 1990
Finlan
d
Korea
Japa
n
Nethe
rland
s
Icelan
d
Canad
a
Greec
eSpa
in
Czech
Rep
ublic
Sweden
United
Sta
tes
Irelan
d
Norway
OECD
Turke
y
United
King
dom
Fran
ce EU
Austra
lia
Germ
any
Denm
ark
Belgium
Hunga
ry
Switzer
land
Portu
gal
Austri
a
Poland
Mex
ico
Luxe
mbo
urg
Italy
Slovak
Rep
ublic
New Z
ealan
d
© OECD 2002

ICTs and their Role in the Economy
45
The growing role of ICTs across the economy
This section looks at ICT markets in OECD and selected non-member countries. It provides data ontotal ICT markets, then focuses on four main segments: hardware (and semiconductors), packagedsoftware, IT services and telecommunications.
ICT markets
Overview
ICT markets in the OECD area continued to grow strongly in the second half of the 1990s, averaging6.3% a year between 1995 and 2001 in nominal terms (Figure 26). The United States experienced thefastest growth during 1995-98 (8.9% a year), while all other OECD regions had their strongest growthin 1998-2000 (6.8% in the EU, 12.1% in Japan and 9.8% in the other OECD countries). Between 2000and 2001, growth slowed considerably in all OECD regions, averaging only 3.4%. OECD countriesrepresent the largest market in the world by far, although their share has declined steadily from 92%
Figure 22. Venture capital in the ICT sector as a percentage of GDP, 1995-2000
Figure 23. Percentage share of the ICT sector in total venture capital, 1995-2000
1. 1995-1999.2. 1998-2000.3. 1995-1998.Source: OECD estimates based on data from EVCA (Europe); NVCA (United States); CVCA (Canada); Asian Venture Capital Journal (The 2000
Guide to Venture Capital in Asia). Data compiled in November 2001.
0.25 0.15 0.10 0.05 0%
0.20
United States1
IcelandCanadaUnited KingdomOECD-191
NetherlandsBelgiumKorea3
NorwaySwedenIrelandCzech Republic2
FranceEUPoland2
FinlandGreeceGermanySwitzerlandHungary2
New Zealand3
ItalyPortugalSpainAustralia3
DenmarkAustriaJapan3
IT
Communication
0.25 0.15 0.10 0.05 0%
0.20
United States1
IcelandCanadaUnited KingdomOECD-191
NetherlandsBelgiumKorea3
NorwaySwedenIrelandCzech Republic2
FranceEUPoland2
FinlandGreeceGermanySwitzerlandHungary2
New Zealand3
ItalyPortugalSpainAustralia3
DenmarkAustriaJapan3
IT
Communication
0.25 0.15 0.10 0.05 0%
0.20
United States1
IcelandCanadaUnited KingdomOECD-191
NetherlandsBelgiumKorea3
NorwaySwedenIrelandCzech Republic2
FranceEUPoland2
FinlandGreeceGermanySwitzerlandHungary2
New Zealand3
ItalyPortugalSpainAustralia3
DenmarkAustriaJapan3
IT
Communication
0 20 40 60 80%
United States1
IrelandNew Zealand3
NorwayBelgiumCanadaPoland2
Korea3
Czech Republic2
OECD-191
Hungary2
DenmarkFinlandIceland
SwitzerlandGreece
NetherlandsGermany
FranceJapan3
EUSweden
United KingdomAustralia3
SpainPortugal
AustriaItaly
Communication
IT
0 20 40 60 80%
United States1
IrelandNew Zealand3
NorwayBelgiumCanadaPoland2
Korea3
Czech Republic2
OECD-191
Hungary2
DenmarkFinlandIceland
SwitzerlandGreece
NetherlandsGermany
FranceJapan3
EUSweden
United KingdomAustralia3
SpainPortugal
AustriaItaly
Communication
IT
0 20 40 60 80%
United States1
IrelandNew Zealand3
NorwayBelgiumCanadaPoland2
Korea3
Czech Republic2
OECD-191
Hungary2
DenmarkFinlandIceland
SwitzerlandGreece
NetherlandsGermany
FranceJapan3
EUSweden
United KingdomAustralia3
SpainPortugal
AustriaItaly
Communication
IT
© OECD 2002
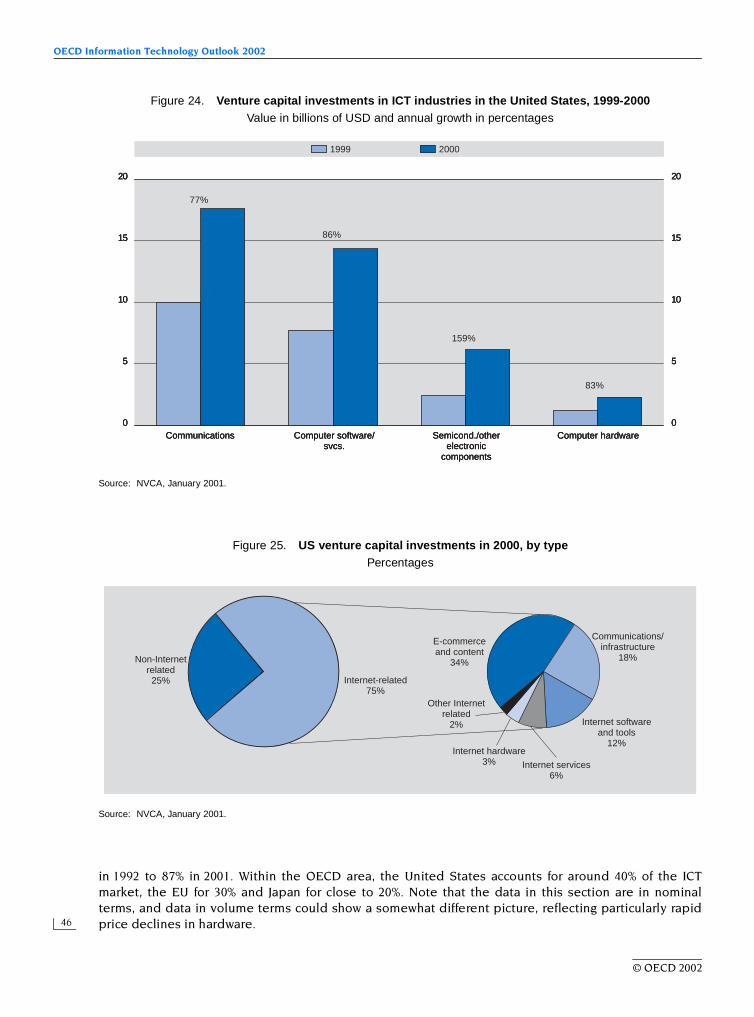
OECD Information Technology Outlook 2002
46
in 1992 to 87% in 2001. Within the OECD area, the United States accounts for around 40% of the ICTmarket, the EU for 30% and Japan for close to 20%. Note that the data in this section are in nominalterms, and data in volume terms could show a somewhat different picture, reflecting particularly rapidprice declines in hardware.
Figure 24. Venture capital investments in ICT industries in the United States, 1999-2000Value in billions of USD and annual growth in percentages
Source: NVCA, January 2001.
20
10
5
0
15
20
10
5
0
15
20001999
Communications Computer software/svcs.
Semicond./otherelectronic
components
Computer hardware
77%
86%
159%
83%
20
10
5
0
15
20
10
5
0
15
20001999
Communications Computer software/svcs.
Semicond./otherelectronic
components
Computer hardware
77%
86%
159%
83%
20
10
5
0
15
20
10
5
0
15
20001999
Communications Computer software/svcs.
Semicond./otherelectronic
components
Computer hardware
77%
86%
159%
83%
Figure 25. US venture capital investments in 2000, by typePercentages
Source: NVCA, January 2001.
Internet-related75%
Non-Internetrelated25%
Communications/infrastructure
18%
Internet softwareand tools
12%
Internet services6%
Internet hardware3%
E-commerceand content
34%
Other Internetrelated
2%
Internet-related75%
Non-Internetrelated25%
Communications/infrastructure
18%
Internet softwareand tools
12%
Internet services6%
Internet hardware3%
E-commerceand content
34%
Other Internetrelated
2%
Internet-related75%
Non-Internetrelated25%
Communications/infrastructure
18%
Internet softwareand tools
12%
Internet services6%
Internet hardware3%
E-commerceand content
34%
Other Internetrelated
2%
© OECD 2002

ICTs and their Role in the Economy
47
In terms of ICT intensity (ICT market/GDP), the OECD area averaged 8.3% in 2001, compared to lessthan 6% in 1992 (Figure 27). In 2001, New Zealand took first place in the OECD area in terms of ICTintensity (14.7%), owing to the strong contribution of telecommunications. Sweden ranked second (12%)mostly owing to the importance of ICT services. Growth has been strong throughout the OECD regionwith 17 out of 28 countries having an ICT intensity greater than 8% in 2001, compared to only ten in 1999.
In terms of market segments within the OECD area, telecommunications accounts for the largestshare (almost 40%) followed by IT services (around 35%), hardware (16.7%) and software (8.8%)(Figure 28). Countries differ markedly: in the United States, France and Sweden, IT (hardware, software,services) accounted for more than two-thirds of all ICT spending, while southern and eastern Europeancountries spent a significantly higher share on telecommunications. Telecommunications accounted forover 60% of all ICT spending in the Slovak Republic, Poland and Greece. In Hungary, Poland, Portugal,Japan, Greece and the Czech Republic, countries that experienced the fastest ICT intensity growthduring the 1990s, telecommunication expenditure accounted for most of the growth. Slower overall ICTmarket growth in 2001 was mainly due to the decline in the OECD hardware market (–10.9% over 2000),particularly in the United States (–17.8% over the previous year).
Hardware and semiconductors
• Hardware
The United States has been a strong driver of growth in the hardware market, with a nominal CAGRof almost 8% versus only 5.7% for the OECD as a whole (Figure 29). This is despite a nominal declinein 2000 and 2001 (hardware spending in volume terms continued to grow in 2000 due to price declinesin this segment). Overall, the US share has remained stable at around 40%. By way of contrast, Japan, thesecond largest market by size, has experienced below-average growth (less than 2% a year). In mostEuropean countries, hardware has grown more slowly than the OECD average. Growth has been morevigorous in smaller markets such as Greece, Ireland, Portugal and Poland. Korea was also among themost dynamic countries, with a CAGR higher than that of the United States, and is now the eighthlargest hardware market in the OECD area.
Figure 26. OECD ICT spending by region/country, 1992-2001Value in billions of current USD
Source: OECD, based on World Information Technology and Services Alliance (WITSA)/International Data Corporation (IDC), 2002.
1992 1993 1994 1995 1996 1997 1998 20011999 2000
2 500
1 000
500
0
1 500
2 000
2 500
1 000
500
0
1 500
2 000
Total ICT spending
11%
31%
39%
38%
34%
18%
20%
11%
United StatesEU-14JapanOther OECD
1992 1993 1994 1995 1996 1997 1998 20011999 2000
2 500
1 000
500
0
1 500
2 000
2 500
1 000
500
0
1 500
2 000
Total ICT spending
11%
31%
39%
38%
34%
18%
20%
11%
United StatesEU-14JapanOther OECD
1992 1993 1994 1995 1996 1997 1998 20011999 2000
2 500
1 000
500
0
1 500
2 000
2 500
1 000
500
0
1 500
2 000
Total ICT spending
11%
31%
39%
38%
34%
18%
20%
11%
United StatesEU-14JapanOther OECD
© OECD 2002
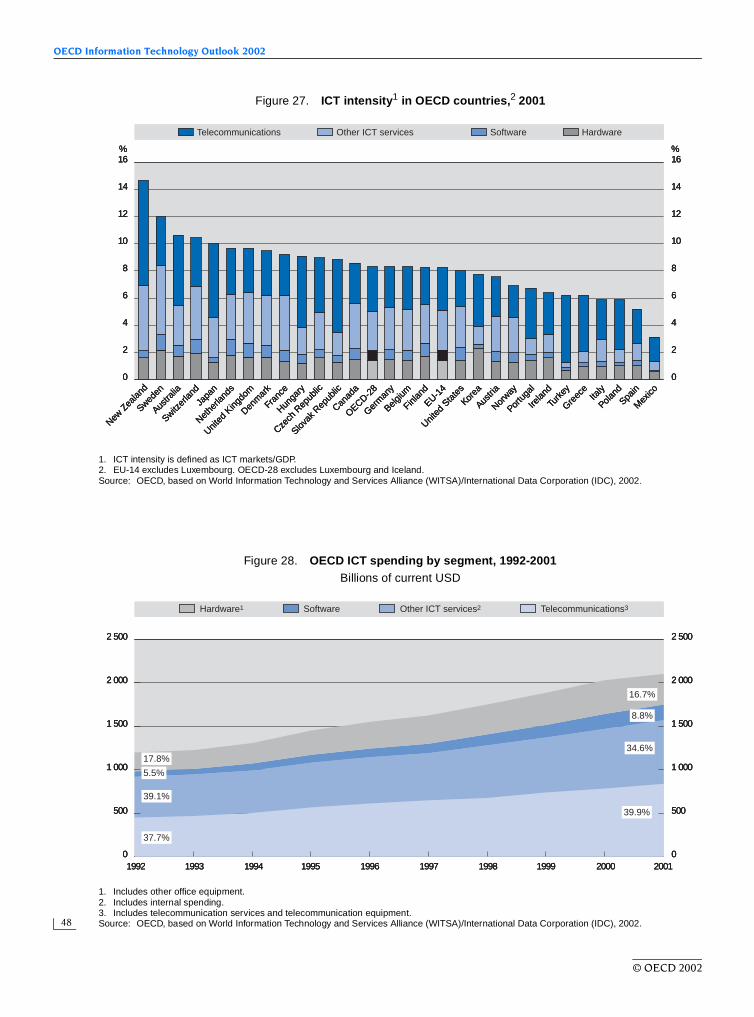
OECD Information Technology Outlook 2002
48
Figure 27. ICT intensity1 in OECD countries,2 2001
1. ICT intensity is defined as ICT markets/GDP.2. EU-14 excludes Luxembourg. OECD-28 excludes Luxembourg and Iceland.Source: OECD, based on World Information Technology and Services Alliance (WITSA)/International Data Corporation (IDC), 2002.
% %16
14
8
6
4
2
0
12
10
16
14
8
6
4
2
0
12
10
Telecommunications Other ICT services Software Hardware
New Z
ealan
d
Sweden
Austra
lia
Switzer
land
Nethe
rland
s
United
King
dom
Denm
ark
Fran
ce
Hunga
ry
Japa
n
Czech
Rep
ublic
Slovak
Rep
ublic
Canad
a
OECD-28
Germ
any
Belgium
Finlan
d
EU-14
United
Sta
tes
Korea
Austri
a
Norway
Portu
gal
Irelan
d
Turke
y
Greec
eIta
ly
Poland
Spain
Mex
ico
Figure 28. OECD ICT spending by segment, 1992-2001Billions of current USD
1. Includes other office equipment.2. Includes internal spending.3. Includes telecommunication services and telecommunication equipment.Source: OECD, based on World Information Technology and Services Alliance (WITSA)/International Data Corporation (IDC), 2002.
1992 1993 1994 1995 1996 1997 1998 20011999 2000
2 500
1 000
500
0
1 500
2 000
2 500
1 000
500
0
1 500
2 00016.7%
34.6%
39.9%
37.7%
39.1%
5.5%
8.8%
17.8%
Telecommunications3Other ICT services2SoftwareHardware1
1992 1993 1994 1995 1996 1997 1998 20011999 2000
2 500
1 000
500
0
1 500
2 000
2 500
1 000
500
0
1 500
2 00016.7%
34.6%
39.9%
37.7%
39.1%
5.5%
8.8%
17.8%
Telecommunications3Other ICT services2SoftwareHardware1
1992 1993 1994 1995 1996 1997 1998 20011999 2000
2 500
1 000
500
0
1 500
2 000
2 500
1 000
500
0
1 500
2 00016.7%
34.6%
39.9%
37.7%
39.1%
5.5%
8.8%
17.8%
Telecommunications3Other ICT services2SoftwareHardware1
© OECD 2002

ICTs and their Role in the Economy
49
Figure 29. OECD hardware markets by country, 1992 and 2001Value in billions of USD and nominal growth in percentages
Source: OECD based on World Information Technology and Services Alliance (WITSA)/International Data Corporation (IDC), 2002.
150 10%
2001 1992
120
90
60
30
0
8
6
4
2
0
10 16%
9
8
7
6
5
4
3
2
1
0
14
12
10
8
6
4
2
0
United
Sta
tes
G7 countries
CAGR (%)
Korea
Other OECD
Japa
n
Germ
any
United
King
dom
Fran
ce
Canad
aIta
ly
Nethe
rland
s
Austra
liaSpa
in
Switzer
land
Sweden
Mex
ico
Belgium
Denm
ark
Austri
a
Norway
Finlan
d
Poland
Irelan
d
Portu
gal
Greec
e
Turke
y
Czech
Rep
ublic
New Z
ealan
d
Hunga
ry
Slovak
Rep
ublic
OECD CAGR: 5.7%
OECD CAGR: 5.7%
© OECD 2002
OECD Information Technology Outlook 2002
50
The installed PC base (per inhabitant) continues to increase significantly across OECD countries,almost quadrupling between 1992 and 2001 (Figure 30). Growth of the installed base has beenparticularly strong in some of the smaller OECD economies (e.g. Poland, Greece, Turkey), as well as inJapan and Korea (more than 19% a year). There is a large disparity among countries in terms of thedistribution of the PC installed base across the various sectors of use (businesses, government,households and educational institutions). In 2001, businesses and government accounted for aroundone-half of the total PC installed base in more than half of all OECD countries, ranging from more thanthree-quarters of all PCs in eastern Europe, to less than one-third in the Netherlands.
• Semiconductors
From its beginning in the 1950s, the semiconductor industry has undergone economic cycles,usually of four years’ duration. However, the 1990s were somewhat atypical. After a first pause in 1996,and a second in 1998, 2001 is likely to witness the strongest decrease in value (a drop of 31.2%), owingto a strong inventory correction in some end markets combined with significantly weakening demandthroughout all regions (particularly in the United States).
Between 1990 and 2001, the world semiconductor market grew at a CAGR of 9.6%, albeit unevenlyacross regions (Figure 31). In 1990, Japan had the largest share (almost 40%), followed by the Americas(less than 30%) and Europe (around 20%). Both Japan and the Americas have seen their shares drop,mainly to the benefit of other Asia-Pacific countries, which now account for 28% of world orders againstless than 14% in 1990. This reflects the progressive shift of the Asian semiconductor and electroniccomponents industries away from Japan and towards other countries, notably China.9 Europe’s sharehas remained relatively stable.
Table 7 shows the source of semiconductor shipments for the main regions as well as the world total.The United States is an increasingly important supplier for all regions, accounting in 2000 for one-fifth ofshipments to Japan, around one-half to Asia-Pacific and Europe and 70% to the US market. Japanese firmshave lost ground in all markets, particularly in the Asia-Pacific region (21.6% in 2000 versus 34.9% five yearsearlier) and the United States (their share has dropped to almost half of its 1995 value).
This decade of growth has mainly benefited microprocessors, sales of which increased at a CAGRof 14.8% between 1990 and 2001 (Figure 32). At the beginning of the decade, less than USD 2 out ofUSD 10 spent on semiconductors went to microprocessors, by 1998 the ratio was close to USD 4 out ofUSD 10, but it then decreased to USD 3 out of USD 10 by the end of the decade. Memories wentthrough an overproduction crisis in the middle of the decade, but, on average, their relative shareremained stable at between one-fifth and one-quarter of the market.10 Other categories, discrete inparticular, lost share, with the noticeable exception of ASICS (devices dedicated to specificapplications), which experienced a slight increase between 1991 and 2001, from 14.9% to 16.4% of themarket. Although usually aimed at a limited market, the growth of ASICS reflects the diffusion ofsemiconductors to various broader fields of application.
In terms of end markets, at world level, telecommunications is the segment that has grown mostrapidly, reaching second place in terms of consumption of semiconductors, behind computers(Figure 33). This reflects the strong growth of Internet infrastructure (in particular xDSL equipment) andmobile devices. The share of consumer electronics has declined steadily although recent growth in thegame console, DVD and digital set-top box markets should contribute to a recovery (J.P. MorganSecurities, 2001).
The relative importance of computers as the segment of final destination has declined in allregions since 1998-99 although it is still the main end market in all regions (Figure 34). Growth in thetelecommunication end market picked up first in Europe (in 1992-93) and only in the second half of thedecade in other regions. Japan is the only region in which consumer electronics accounted for a sizeableshare, at around 30% in 2001, while in Europe and the Americas, the share was below 10%. Automobileshave become an increasingly important sector of final use for semiconductors in Europe but stillaccounted for only an estimated 12% of the market in 2001.
© OECD 2002
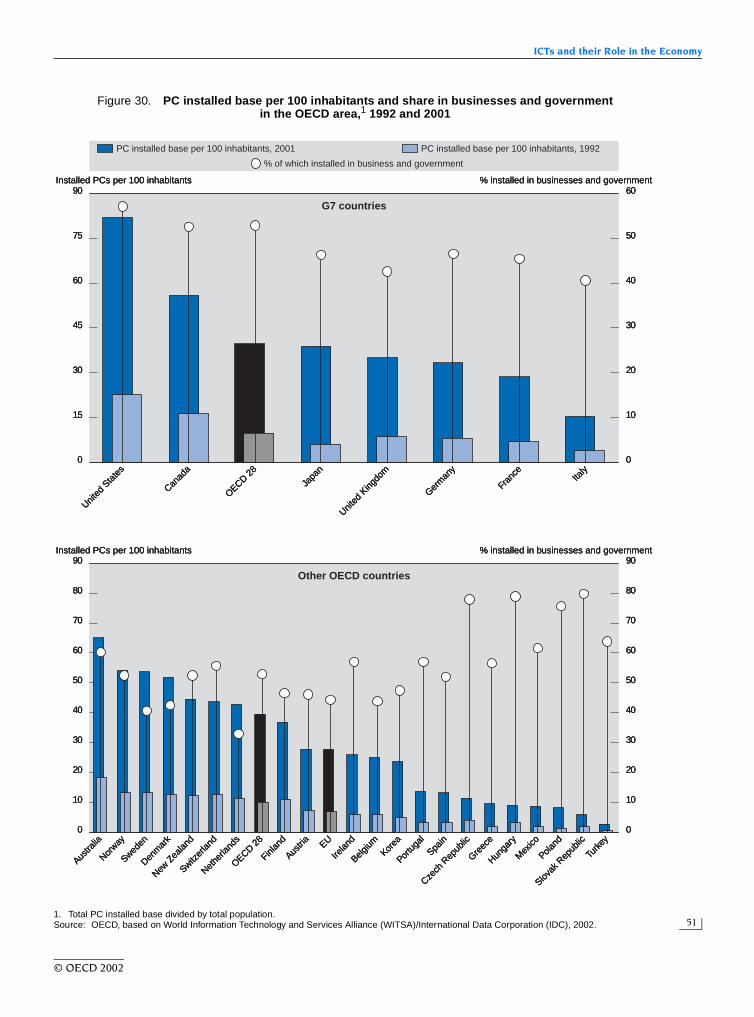
ICTs and their Role in the Economy
51
Figure 30. PC installed base per 100 inhabitants and share in businesses and government in the OECD area,1 1992 and 2001
1. Total PC installed base divided by total population.Source: OECD, based on World Information Technology and Services Alliance (WITSA)/International Data Corporation (IDC), 2002.
90 60
75
60
45
30
0
50
40
30
20
0
90
80
70
60
50
40
30
20
10
0
15 10
90
80
70
60
50
40
30
20
10
0
United
Sta
tes
Installed PCs per 100 inhabitants
G7 countries
% of which installed in business and government
Austra
lia
Other OECD countries
Installed PCs per 100 inhabitants
Japa
n
Germ
any
United
King
dom
Fran
ce
Canad
aIta
ly
Norway
Sweden
Denm
ark
New Z
ealan
d
Switzer
land
Nethe
rland
s
OECD 28
Finlan
d
Austri
a
Belgium
Korea
Portu
gal
Spain
Czech
Rep
ublic
Greec
e
Hunga
ry
Mex
ico
Poland
Slovak
Rep
ublic
Turke
y
PC installed base per 100 inhabitants, 2001 PC installed base per 100 inhabitants, 1992
% installed in businesses and government
% installed in businesses and government
OECD 28
EU
Irelan
d
© OECD 2002

OECD Information Technology Outlook 2002
52
Packaged software
Packaged software has been the most rapidly growing ICT segment in OECD countries, with a CAGRof 12.3% between 1992 and 2001 (Figure 35). By 2001, packaged software accounted on average foraround 8.8% of ICT spending for OECD countries, against only 5.5% nine years earlier. However, if theOECD as a whole maintains a relatively stable share of the world market, the United States is clearly, asfor hardware, the main driver, having continued to increase its share from 43.6% to 49.2% between 1992and 2001. The US market in 2001 was about 1.5 times larger than that of all the other G7 countriescombined. Among these countries, the Canadian market was also very dynamic, displaying the secondhighest CAGR among the G7 countries (13.7%). Japan was the second largest market in the OECD areauntil 1997, when it was overtaken by Germany. Most of the smaller markets (less than USD 1 billionin 2001) experienced above-average growth rates during the 1990s (Poland, Portugal, Ireland, theCzech Republic, Hungary, Greece, Turkey, the Slovak Republic).
Figure 31. World semiconductor market by region, 1990-20011
Billions of USD
1. Data for 2001 are an autumn 2001 projection.Source: World Semiconductor Trade Statistics (WSTS).
1990 1991 1992 1993 1994 1995 1996 1997 1998 20011999 2000
210
120
90
60
30
0
150
180
210
120
90
60
30
0
150
180
Asia-Pacific Europe Japan Americas
1990 1991 1992 1993 1994 1995 1996 1997 1998 20011999 2000
210
120
90
60
30
0
150
180
210
120
90
60
30
0
150
180
Asia-Pacific Europe Japan Americas
1990 1991 1992 1993 1994 1995 1996 1997 1998 20011999 2000
210
120
90
60
30
0
150
180
210
120
90
60
30
0
150
180
Asia-Pacific Europe Japan Americas
Table 7. World semiconductor market shares by region, 1995 and 2000Percentages of regional market
Source: WSTS, 2001.
Market
Base country
1995 2000
Americas Japan Other Americas Japan Other
Americas 61.3 22.6 16.1 70.2 11.6 18.2Europe 47.1 18.0 34.9 55.0 13.8 31.2Japan 17.9 76.0 6.1 20.4 70.3 9.3Asia-Pacific 33.6 34.9 31.5 47.3 21.6 31.1
Total 40.9 38.9 20.2 49.9 28.3 21.8
© OECD 2002
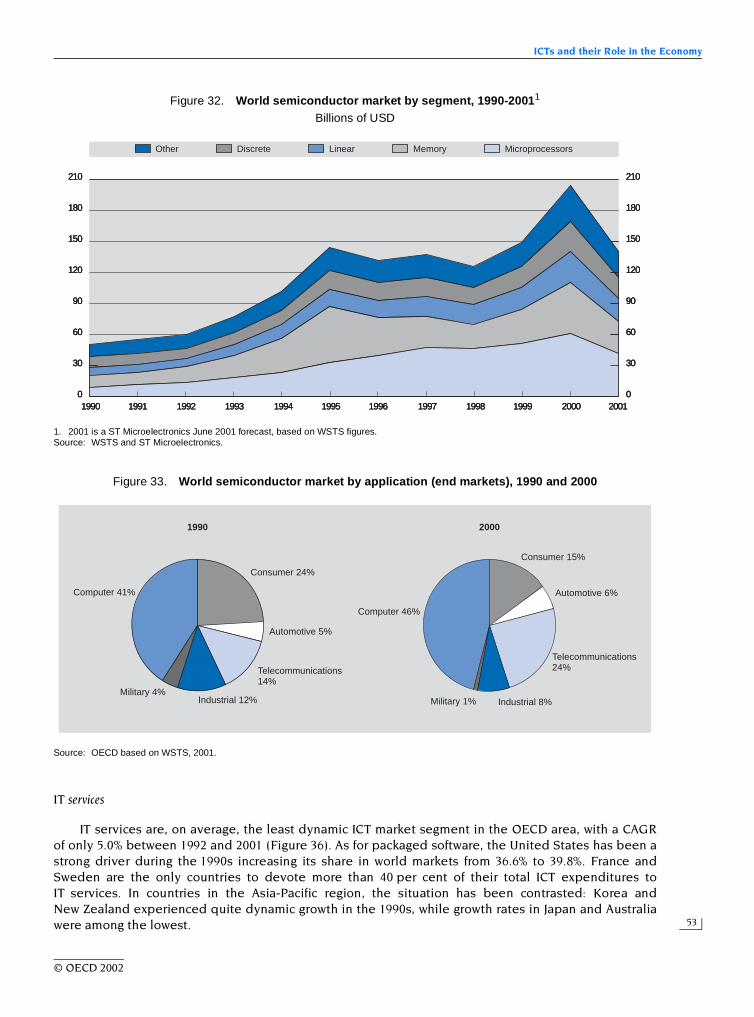
ICTs and their Role in the Economy
53
IT services
IT services are, on average, the least dynamic ICT market segment in the OECD area, with a CAGRof only 5.0% between 1992 and 2001 (Figure 36). As for packaged software, the United States has been astrong driver during the 1990s increasing its share in world markets from 36.6% to 39.8%. France andSweden are the only countries to devote more than 40 per cent of their total ICT expenditures toIT services. In countries in the Asia-Pacific region, the situation has been contrasted: Korea andNew Zealand experienced quite dynamic growth in the 1990s, while growth rates in Japan and Australiawere among the lowest.
Figure 32. World semiconductor market by segment, 1990-20011
Billions of USD
1. 2001 is a ST Microelectronics June 2001 forecast, based on WSTS figures.Source: WSTS and ST Microelectronics.
1990 1991 1992 1993 1994 1995 1996 1997 1998 20011999 2000
210
120
90
60
30
0
150
180
210
120
90
60
30
0
150
180
Other Discrete Linear Memory Microprocessors
1990 1991 1992 1993 1994 1995 1996 1997 1998 20011999 2000
210
120
90
60
30
0
150
180
210
120
90
60
30
0
150
180
Other Discrete Linear Memory Microprocessors
1990 1991 1992 1993 1994 1995 1996 1997 1998 20011999 2000
210
120
90
60
30
0
150
180
210
120
90
60
30
0
150
180
Other Discrete Linear Memory Microprocessors
Figure 33. World semiconductor market by application (end markets), 1990 and 2000
Source: OECD based on WSTS, 2001.
1990 2000
Consumer 24%
Consumer 15%
Automotive 5%
Automotive 6%
Telecommunications14%
Telecommunications24%
Industrial 12% Industrial 8%Military 4%
Military 1%
Computer 41%
Computer 46%
1990 2000
Consumer 24%
Consumer 15%
Automotive 5%
Automotive 6%
Telecommunications14%
Telecommunications24%
Industrial 12% Industrial 8%Military 4%
Military 1%
Computer 41%
Computer 46%
1990 2000
Consumer 24%
Consumer 15%
Automotive 5%
Automotive 6%
Telecommunications14%
Telecommunications24%
Industrial 12% Industrial 8%Military 4%
Military 1%
Computer 41%
Computer 46%
© OECD 2002

OECD Information Technology Outlook 2002
54
Telecommunications
In 2001, out of USD 10 spent in the OECD-area ICT market, almost USD 4 went totelecommunications (including equipment and services). Market liberalisation was the main underlyingfactor in this market’s development during the 1990s. New technologies and new services, and theadvent of a commercial Internet, also contributed to an increase in the demand for most types oftelecommunication goods and services.
Extremely rapid growth between 1992 and 2001 in Hungary, the Czech Republic, theSlovak Republic and Poland reflects the joint effects of economic development and basic infrastructureinvestment as well as anticipated or on-going liberalisation. For similar reasons, Portugal, Greece andTurkey also experienced strong growth in their telecommunications market during the period(Figure 37).
Among the G7 countries, growth in Japan was particularly resilient, mainly owing to the expansionof the mobile telecommunication market. As a result, the market more than tripled in value during theperiod, and in 2001 Japan accounted for over one-quarter of the overall OECD telecommunicationmarket, second only to the United States which had almost one-third.
Korea, Finland and Ireland also saw their communication market grow at an above-average pace,Ireland mainly owing to the effects of liberalisation and the others mainly owing to the expansion ofmobile services (Finland), and Internet access equipment (Korea).
ICT markets in non-member countries
Although OECD countries remained by far the world’s main ICT market with more than 87% of thetotal in 2001, non-member countries significantly increased their share from 8% in 1992. Outside theOECD area, ICT expenditures grew at a rate almost double that of the OECD countries: 12.9% CAGRbetween 1992 and 2001 versus 6.5% for the OECD region. China, India and Brazil were among the
Figure 34. Main semiconductor end markets, 1990-20011
Percentages of regional market
1. 2001 data are June 2001 forecasts by ST Microelectronics based on WSTS figures.2. Until 1994, South America is included under “Rest of World”. Since then, it is included in “Americas”.Source: WSTS and ST Microelectronics.
% %70 35
0
60
50
40
30
20
10
0
30
25
20
15
10
5
1990 20001992 1994 1996 1998 1990 20001992 1994 1996 1998
Europe Japan World Americas Rest of world
Computers Telecommunication
% %70 35
0
60
50
40
30
20
10
0
30
25
20
15
10
5
1990 20001992 1994 1996 1998 1990 20001992 1994 1996 1998
Europe Japan World Americas Rest of world
Computers Telecommunication
% %70 35
0
60
50
40
30
20
10
0
30
25
20
15
10
5
1990 20001992 1994 1996 1998 1990 20001992 1994 1996 1998
Europe Japan World Americas Rest of world
Computers Telecommunication
© OECD 2002

ICTs and their Role in the Economy
55
Figure 35. OECD packaged software markets by country, 1992-2001Value in billions of USD and growth in percentages
Source: OECD, based on World Information Technology and Services Alliance (WITSA)/International Data Corporation (IDC), 2002.
100 16%
2001 1992
90
80
70
60
0
14
12
10
8
0
4.5 25%
4.0
3.5
3.0
2.5
2.0
1.5
1.0
0.5
0
20
15
10
5
0
50
40
30
20
10
6
4
2
United
Sta
tes
G7 countries
CAGR (%)
Nethe
rland
s
Other OECD
Japa
n
Germ
any
United
King
dom
Fran
ce
Canad
aIta
ly
Austra
lia
Switzer
land
Sweden
Spain
Belgium
Denm
ark
Austri
a
Norway
Finlan
d
Korea
Mex
ico
Poland
Portu
gal
Irelan
d
Czech
Rep
ublic
Hunga
ry
Greec
e
New Z
ealan
d
Turke
y
Slovak
Rep
ublic
OECD CAGR: 12.3%
OECD CAGR: 12.3%
© OECD 2002

OECD Information Technology Outlook 2002
56
Figure 36. OECD IT services markets by country, 1992-2001Value in billions of USD and growth in percentages
Source: OECD, based on World Information Technology and Services Alliance (WITSA)/International Data Corporation (IDC), 2002.
350 7%
2001 1992
300
250
200
150
0
6
5
4
0
18%
16
14
12
10
8
6
4
2
0
100
50
3
2
1
18
16
14
12
10
8
6
4
2
0
United
Sta
tes
G7 countries
CAGR (%)
Nethe
rland
s
Other OECD
Japa
n
Germ
any
United
King
dom
Fran
ce
Canad
aIta
ly
Sweden
Austra
lia
Switzer
land
Spain
Belgium
Denm
ark
Korea
Austri
a
Norway
Mex
ico
Finlan
d
New Z
ealan
d
Poland
Czech
Rep
ublic
Irelan
d
Portu
gal
Hunga
ry
Greec
e
Turke
y
Slovak
Rep
ublic
OECD CAGR: 5.0%
OECD CAGR: 5.0%
© OECD 2002

ICTs and their Role in the Economy
57
Figure 37. OECD telecommunication markets by country, 1992-2001Value in billions of USD and growth in percentages
Source: OECD, based on World Information Technology and Services Alliance (WITSA)/International Data Corporation (IDC), 2002.
300 16%
2001 1992
250
200
150
0
12
10
8
0
20%
16
14
12
10
8
6
4
2
0
100
50
6
4
2
35
30
25
20
15
10
5
0
14
18
United
Sta
tes
G7 countries
CAGR (%)
Austra
lia
Other OECD
Japa
n
Germ
any
United
King
dom
Fran
ce Italy
Canad
a
Korea
Spain
Nethe
rland
s
Mex
ico
Switzer
land
Sweden
Turke
y
Belgium
Poland
Austri
a
Denm
ark
Greec
e
Portu
gal
Norway
New Z
ealan
d
Finlan
d
Irelan
d
Hunga
ry
Czech
Rep
ublic
Slovak
Rep
ublic
OECD CAGR: 7.1%
OECD CAGR: 7.1%
© OECD 2002

OECD Information Technology Outlook 2002
58
countries with the most rapid growth, averaging between 20% and 35% a year over the period. As aresult, those three countries saw their combined share of the world market more than double, from 2.0%in 1992 to 5.6% in 2001 (Figure 38).
China ranked as the world’s sixth largest ICT market in 2001, while Brazil ranked eighth (ahead ofAustralia). Brazil was not the only country in the region experiencing rapid growth: all South Americancountries had annual growth rates exceeding 8%. Colombia was the world’s third most rapidly growingICT market, after Vietnam and China, and in 2001 its size was comparable to that of Poland or Finland.
As in OECD countries, software was the fastest growing segment in nominal terms in the 1990s(15.9% CAGR between 1992 and 2001), followed by telecommunications, hardware, and finally, ITservices (Figure 39). However, it should be noted that price declines have been much smaller insoftware than in hardware, and growth in volume terms is much more comparable between hardwareand other ICT market segments.
In most of these countries, telecommunication markets have been the main driving force behindthe growth in ICT markets in nominal terms; they contributed on average around two-thirds of growthduring the period 1992-2001. This is particularly true in South America and also, to a lesser extent, inAsia. Hardware generally ranks second by order of importance as a contributor to ICT market growth innominal terms. Other ICT services and software have generally only contributed modestly to growthduring the period, less than 15% on average. Taken together, these two components accounted in 2001for just over 17% of the overall ICT market in non-member countries, compared to more than 43% in theOECD area, an indication of the overall lower share of services within these economies (Figure 40).
Figure 38. ICT markets in selected non-member countries, 1992 and 2001Value in billions of USD and growth rate in percentages
Source: OECD calculations, based on World Information Technology and Services Alliance (WITSA)/International Data Corporation (IDC), 2002.
70 45%
2001 1992
60
50
40
0
35
25
0
30
20
20
15
10
105
40
30
Value in billions of USD
CAGR (%)
China
Brazil
India
Chines
e Ta
ipei
Hong
Kong,
Chin
a
Argen
tina
South
Afri
ca
Average CAGR forthese countries: 12.9%
Colom
bia
Russia
Singap
ore
Israe
l
Mala
ysia
Saudi
Arabia
/Gulf
Sta
tes
Chile
Venez
uela
Thaila
nd
Indo
nesia
Philipp
ines
Egypt
Vietna
m
Sloven
ia
Roman
ia
Bulgar
ia
© OECD 2002

ICTs and their Role in the Economy
59
Figure 39. ICT market growth by main segment and region, CAGR 1992-2001Percentages
Source: OECD calculations, based on World Information Technology and Services Alliance (WITSA)/International Data Corporation (IDC), 2002.
18
16
14
12
10
8
6
0
% %
4
2
18
16
14
12
10
8
6
0
4
2
12.3
15.9
7.1
13.8
5.7
12.7
5.0
9.5
Software Telecommunications Hardware Other IT services
OECD NMCs
18
16
14
12
10
8
6
0
% %
4
2
18
16
14
12
10
8
6
0
4
2
12.3
15.9
7.1
13.8
5.7
12.7
5.0
9.5
Software Telecommunications Hardware Other IT services
OECD NMCs
18
16
14
12
10
8
6
0
% %
4
2
18
16
14
12
10
8
6
0
4
2
12.3
15.9
7.1
13.8
5.7
12.7
5.0
9.5
Software Telecommunications Hardware Other IT services
OECD NMCs
Figure 40. Contribution by segment to non-member countries1 ICT market growth, 1993-2001
1. See Figure 38 for list of countries included.Source: OECD calculations, based on World Information Technology and Services Alliance (WITSA)/International Data Corporation (IDC), 2002.
20
18
16
14
12
10
8
-21996
% %
-21993 1994 1995
6
4
2
0
20
18
16
14
12
10
8
6
4
2
0
1997 1998 1999 2000 2001
Total ICT
Other ICT Services Telecommunications Software Hardware
20
18
16
14
12
10
8
-21996
% %
-21993 1994 1995
6
4
2
0
20
18
16
14
12
10
8
6
4
2
0
1997 1998 1999 2000 2001
Total ICT
Other ICT Services Telecommunications Software Hardware
20
18
16
14
12
10
8
-21996
% %
-21993 1994 1995
6
4
2
0
20
18
16
14
12
10
8
6
4
2
0
1997 1998 1999 2000 2001
Total ICT
Other ICT Services Telecommunications Software Hardware
© OECD 2002

OECD Information Technology Outlook 2002
60
Conclusion
In conclusion, the impacts of ICTs are being strongly felt throughout the economy. ICTs areincreasingly ubiquitous and firms, industries and countries are reaping ever more benefits from theirongoing investments in ICTs and the more widespread use of the Internet. This is true despiteconsiderable changes in the economic landscape since the 2000 edition of the IT Outlook. Detailedevidence shows that during the late 1990s, ICTs accounted for a large and growing share of investmentand contributed significantly to output growth, particularly in the United States, Australia and Finland.
The diffusion of ICTs throughout the economy has enhanced economic efficiency and substantiallyboosted productivity growth. The ICT-producing and ICT-using sectors have accounted for the bulk ofoverall productivity growth in a wide range of OECD countries. The most recent analysis from the UnitedStates shows that non-farm business productivity growth remained positive for most of 2001, even whiletotal output was declining, and that this positive productivity performance continued in the first quarterof 2002, an indication that continuing investments in ICTs are resulting in increasing economic benefits(US Department of Commerce, 2002). It is probably still too early to clearly understand and measurehow returns to ICT investment, at both firm-level and in aggregate terms, differ from those derived fromother types of investment. In other words, many crucial questions remain, such as the extent to whichinvestments in ICT have a substantially higher impact on productivity growth than other types ofinvestments, the extent to which there are differences across countries in these relationships, and theinterplay between the impact of ICTs across the economy and the performance of the ICT industry.
The long-term prospects of the ICT industry remain solid. ICTs continue to play an increasinglyimportant role in the growth and performance of advanced economies, and the demand for productsand services will return to an upward trend. Firms investing in ICTs will continue to benefit from theincreasing integration of network technologies and the efficiencies made possible by moving a widerrange of business processes on line. Technological advances will allow price/performance ratios of ICTequipment to decline further in the foreseeable future, thus ensuring that the substitution of this typeof capital for other types of inputs will continue. Thus, the contribution of ICTs to the economy as awhole can be expected to grow, despite the short-term turbulence which reminds us that, contrary tosome claims, the business cycle has far from disappeared. Having witnessed how the ICT sector wasaffected by (and itself contributed to) the current economic downturn, there is strong reason to believethat it will have a significant role to play in the next recovery.
© OECD 2002

ICTs and their Role in the Economy
61
Appendix
ICT FIRMS
This appendix describes the business activities of top ICT firms. ICT firms are ranked according to their totalrevenue for the most recent financial year ending on, or before, 30 September 2001. They are classified by ICTindustry sectors according to their official industry classification or, where it appears reasonable to do so, accordingto the ICT market segment from which they derived their largest share of ICT related revenues. The analysis coversthe top 50 firms (all ICT sectors), and the top 10 firms in each of the six major ICT industry sectors – communicationequipment and systems, electronics and components, IT equipment and systems, IT services, software andtelecommunications, followed by a selection of Internet-related firms (see Box A1.1). However, many large ICT firmsare active in a number of sectors (for example, large Japanese and European firms have several ICT activities) andallocating firms to a single ICT sector can be misleading. Furthermore, there are changes in the composition of firmactivities over time, as equipment firms shift into services and vice-versa (see Box A1.2).
Among the top 250 ICT firms (ranked by revenue), 89 (36%) are electronics and components manufacturers,48 (19%) are IT equipment and systems producers, 35 (14%) are IT services providers, 30 (12%) aretelecommunication services providers, 26 (10%) are software publishers and 22 (9%) are communication equipmentand systems producers. In terms of location, 150 (60%) are based in the United States and 42 (17%) are based inJapan. After that, no country has more than ten. There are eight based in the United Kingdom and in France, sevenin Canada, six in Chinese Taipei, five in Germany and the Netherlands, three in Korea, two in Denmark, Israel,Singapore, Sweden and Switzerland and one in Australia, Bermuda, Finland, Italy, Mexico and Spain.
Box A1.1. Methodology used for identifying ICT firms
A variety of sources were used to identify the top 250 ICT firms. These include the Financial Times 500,the United Kingdom Department of Trade and Industry’s R&D scoreboard, Business Week’s InformationTechnology 100, Software Magazine’s Software 500, Soft*Letter’s Software 100, the Washington Post’s TopInformation Technology Companies, Forbes 500 largest private companies, NetValley’s ComputerIndustry Top 100 and a number of other Internet listings (including Yahoo!Finance and Wall StreetResearch Net). Having identified the candidates for a top 250 listing, details were sourced from the latestannual reports, either from the Securities Exchange Commission 10K forms or directly from annualreports. Each of the top 250 firms was classified by ICT industry sector, i.e. communication equipment andsystems, electronics and components, IT equipment and systems, IT services, software andtelecommunication services. Because many firms operate in more than one market segment,classification is far from straightforward. Where possible, firms have been classified according to theirofficial industry classification (US SIC), and where it was not possible, or relevant, they have beenclassified according to their main ICT-related activity (on the basis of revenue derived from that activity).This necessarily involves a degree of judgement, and some may disagree with the categorisation.Nevertheless, a consistent and workable framework was established.
The top 250 are ranked by total revenue in the most recent financial year ending prior to30 September 2001. In each case, company name, country, industry, revenue, employment, R&Dexpenditure, net income and market capitalisation are reported. All items are taken from the most recentannual reports, except market capitalisation, which is that reported by Wall Street Research Net on12 October 2001. In the absence of set criteria to identify Internet firms, the top 25 Internet-related firmswere identified from the Wall Street Research Net’s Internet Investment Network listings of Internet-related companies listed on the New York stock exchange in October 2001, and they are ranked bymarket capitalisation.
© OECD 2002

OECD Information Technology Outlook 2002
62
The top 50 ICT firms
During 2000-01, the top 50 ICT firms generated total revenues of USD 1.8 trillion, employed more than6.4 million people worldwide, spent more than USD 90 billion on R&D, earned net income of some USD 125 billionand had a market capitalisation in October 2001 of around USD 2.5 trillion. These top 50 firms have grownsignificantly. Although data are incomplete, total top 50 firms’ revenue appears to have increased by around 30%between 1998 and 2001, the number of employees by 17%, R&D expenditures by 14% and net income by around 50%.
The top 10 firms accounted for 39% of top 50 revenue, 41% of top 50 employment, 33% of top 50 R&D expenditure,37% of top 50 net income and 30% of top 50 market capitalisation. Reflecting the dynamism of the ICT sector, thetop 10 firms have under-performed the top 50 over the last two years, with some of the smaller firms growing fasterthan the largest. For example, top 10 firms’ revenue grew by 14% between 1998 and 2001, while top 50 firms’ revenueincreased by 29%. Similarly, top 10 employment grew by 6.6% compared to 17%, top 10 R&D expenditure grew by 3%compared to 14% and top 10 income grew by 27% compared to 50%.
Top 50 ICT firms by sector
Fifteen of the top 50 ICT firms were telecommunication services providers, 14 were electronics and componentsmanufacturers, eight were IT equipment and systems producers, seven were communication equipment and systemsproducers, five were IT services providers and one was a software publisher (i.e. Microsoft) (Table A1.1).Telecommunication services providers accounted for 31% of the top 50 revenue in 2000-01 (USD 556 billion),electronics and component manufacturers accounted for 28% (USD 499 billion), IT equipment and systems producersfor 22% (USD 386 billion), communication equipment and systems producers for 12% (USD 204 billion), IT servicesproviders for 6% (USD 105 billion) and software publishers for just 1% (Figure A1.1). Sector shares of employmentwere similar, except that electronics and components manufacturers accounted for a slightly larger share ofemployment, and IT and communication equipment and systems producers for a correspondingly smaller share.
There are gaps in the data for IT services and software firms. In spite of this, it is evident that the top 50 firms inthe IT services and software sectors are growing faster than firms in other sectors of the ICT industry. Microsoft (theonly software publisher in the top 50) increased its revenue by 65% between 1998 and 2000-01, employment by 63%,R&D expenditure by 47% and net income by 64%. The four IT services firms for which complete data are available(PricewaterhouseCoopers being new) increased their revenues by 47%. ICT equipment and systems producersamong the top 50 had somewhat lower growth. Communication equipment and systems producers increased theiraggregate revenues by 45% between 1998 and 2000-01, IT equipment and systems producers increased theirs by 29%and electronics and component manufacturers increased theirs by 13%.
While data are incomplete, equipment manufacturers clearly spend more than services providers on R&D.Moreover, communication equipment and systems firms among the top 50 appear to be more R&D-intensive thantheir counterparts in electronics and components or IT equipment and systems. Communication equipment andsystems producers spent around 13% of revenue on R&D during 2000-01, compared to the electronics andcomponents manufacturers’ 6.4% and the IT equipment and systems producers’ 5.6%. Market capitalisation is moreevenly distributed across the sectors, but it is clear that communication equipment and systems producers andservice providers enjoy a somewhat higher level of market capitalisation, relative to revenue, than firms in otherIT sectors.
Top 50 ICT firms by country
Most of the top 50 ICT firms are based in the United States or Japan (Figure A1.2). The 26 firms based in theUnited States accounted for 47% of total top 50 revenue in 2000-01 (USD 834 billion), 41% of employment (2.7 million),39% of R&D expenditure (USD 35 billion), 60% of net income and 65% of total market capitalisation. The 12top 50 firms based in Japan accounted for 31% of total revenue (USD 557 billion), 29% of employment (1.9 million),34% of R&D expenditure (USD 31 billion), just 5% of net income (USD 5.8 billion) and 13% of market capitalisation.Germany, France and the United Kingdom each have two firms in the top 50, and the Netherlands, Canada, Sweden,Finland, Italy and Spain each have one.
Data are incomplete, but US-based companies among the top 50 appear to be growing faster than those basedin Japan. They increased their total revenues by 36% between 1998 and 2000-01 compared to 19% for companiesbased in Japan, increased employment by 25% compared to 7% and increased their aggregate net income by 56%compared to a decrease of 35% for Japan. The top 50 ICT firms based outside the United States and Japan increasedtheir aggregate revenues by 28%, employment by 18% and net income by 72%. Finland (Nokia) and Canada (Nortel)were the stellar performers, with revenues growing by 90% and 80%, respectively.
The R&D intensity of the top 50 ICT firms is relatively high, at 5% of revenue in 2000-01. Some strong R&Dperformers stand out, but overall R&D intensity varies little among countries. Top 50 IT firms based in the UnitedStates spent around 4.2% of their revenues on R&D, those based in Japan around 5.5% and those in other countriesan average of around 6%.
© OECD 2002

ICTs and their Role in the Economy
63
Table A1.1. Top 50 ICT firmsUSD millions and number employed
Notes: Verizon Communications results for 1998 are a consolidation of Bell Atlantic and GTE, Compaq and Hewlett-Packard results are pre-merger,Olivetti and Telecom Italia are consolidated, and Accenture results for 1998 relate to Andersen Consulting.
Source: OECD, compiled from annual reports and SEC filings.
Company Industry Revenue 1998
Revenue 2001
Employed 1998
Employed 2001
R&D1998
R&D2001
Net income
1998
Net income
2001
Marketcap2001
NTT Japan Telecoms 78 099 92 679 226 000 224 000 2 806 3 178 5 835 –603 71 200IBM United States IT equipment 81 667 88 396 291 067 316 303 5 046 5 151 6 328 8 093 168 900Hitachi Japan Electronics 64 305 71 158 331 494 323 827 4 825 3 870 27 151 25 600Siemens Germany Electronics 66 896 70 964 416 000 447 000 4 839 5 328 1 511 11 539 38 600AT&T United States Telecoms 51 319 65 981 107 800 166 000 550 402 7 487 4 277 69 300Matsushita Electric Japan Electronics 60 285 64 916 276 000 290 448 4 667 4 670 715 887 25 500Verizon Communications United States Telecoms 57 075 64 707 255 000 260 000 . . . . 4 980 11 797 146 600Sony Japan Electronics 51 178 59 467 173 000 189 700 3 089 3 505 1 682 1 084 033 500Toshiba Japan IT equipment 41 704 55 194 186 000 188 042 2 467 3 041 112 892 21 929SBC Communications United States Telecoms 46 241 51 476 200 380 220 090 . . . . 7 690 7 967 157 700Fujitsu Japan IT equipment 40 057 50 863 180 000 188 042 3 018 3 741 –104 79 29 946NEC Japan IT equipment 37 976 50 171 152 450 149 931 3 045 3 199 316 525 30 983Hewlett-Packard United States IT equipment 38 419 48 782 124 600 88 500 2 380 2 646 2 945 3 697 33 000Compaq Computer United States IT equipment 31 169 42 383 90 000 70 100 1 353 1 469 –2 743 569 16 100Worldcom United States Telecoms 17 617 39 090 20 300 59 000 3 725 . . –2 506 4 238 40 600Mitsubishi Electric Japan Electronics 29 043 38 297 115 206 116 715 1 393 1 731 –758 1 157 13 673Deutsche Telekom Germany Telecoms 38 957 37 021 197 000 170 000 692 667 2 314 6 698 71 200Philips Electronics Netherlands Electronics 33 915 34 956 252 680 231 161 2 280 2 553 6 740 8 863 28 400Lucent Technologies United States
Com equipment 24 367 33 813 153 000 126 000 3 655 4 024 1 065 1 219 22 000
Intel United States Electronics 26 273 33 726 64 500 86 100 2 509 3 897 6 068 10 535 155 000Dell Computer United States IT equipment 18 243 31 888 24 400 40 000 272 482 1 460 2 177 60 600Motorola United States Com
equipment 29 398 30 931 133 000 121 000 3 209 4 440 –962 817 37 300Ingram Micro United States Services 22 034 30 715 . . 16 500 . . . . 245 226 1 910France Telecom France Telecoms 26 851 30 480 156 600 188 866 801 428 2 373 3 313 40 500Nortel Networks Canada Com
equipment 16 857 30 275 75 050 94 500 2 532 4 005 –1 282 –3 407 17 500Ericsson Sweden Com
equipment 23 209 29 931 101 485 105 129 3 527 4 587 1 641 2 300 32 300Alcatel France Com
equipment 23 671 28 992 118 272 131 598 2 014 2 610 2 605 1 222 85 800Nokia Finland Com
equipment 14 838 28 039 41 091 58 708 1 387 2 385 1 280 3 635 89 200Telecom Italia/Olivetti Italy Telecoms . . 27 799 . . 120 973 . . 138 . . –868 15 643BT United Kingdom Telecoms 25 597 27 486 124 700 132 000 444 552 4 883 3 018 59 017Bell South United States Telecoms 20 561 26 151 81 000 103 900 . . . . 3 527 4 220 77 000Canon Japan Electronics 21 593 25 794 79 799 86 673 1 719 1 729 837 1 244 32 629Telefonica Spain Telecoms 16 141 25 783 64 100 145 730 80 101 1 349 2 267 52 100Microsoft United States Software 15 262 25 296 29 159 47 600 2 970 4 380 4 490 7 346 299 900Sprint (consolidated) United States Telecoms 17 144 23 613 . . 84 100 179 . . 190 505 49 900Cisco Systems United States Com
equipment 8 489 22 293 15 000 38 000 1 663 3 922 1 331 –1 014 111 100PWC United States Services . . 21 500 . . 150 000 . . . . . . . . PrivateTech Data United States Services 7 056 20 428 8 240 10 500 . . . . 90 178 2 280EDS United States Services 17 243 19 227 120 000 122 000 43 24 743 1 413 27 500Xerox United States Electronics 19 593 18 701 94 600 92 500 1 035 1 044 273 –257 5 650Sun Microsystems United States IT equipment 9 862 18 250 26 300 43 300 1 029 2 016 755 927 29 400Sanyo Electric Japan Electronics 16 474 17 914 . . 83 519 920 885 . . 193 6 9603M United States Electronics 15 094 16 724 70 549 75 026 648 727 1 213 1 857 40 100Qwest United States Telecoms 12 395 16 610 8 700 67 000 . . . . 1 508 –81 30 700Sharp Japan Electronics 15 812 16 495 48 820 49 748 1 285 1 096 45 250 13 456Emerson Electric United States Electronics 13 447 15 545 116 900 123 400 491 594 1 229 1 422 20 200Solectron United States Electronics 6 102 14 137 37 936 65 270 31 57 251 497 8 480DDI Japan Telecoms 9 738 13 571 2 927 7 361 37 73 165 –93 18 342Cable and Wireless United Kingdom Telecoms 13 599 13 513 46 550 54 919 . . 18 2 160 5 469 12 200Accenture United States Services 8 307 13 500 65 134 71 300 . . . . . . 1 650 11 000
© OECD 2002

OECD Information Technology Outlook 2002
64
Figure A1.1. Top 50 ICT firms revenue by sectorUSD billions
Source: OECD, compiled from annual reports and SEC filings. See Box A1.1 for details.
600 000
1998 2000-01
500 000
400 000
300 000
200 000
100 000
0
600 000
500 000
400 000
300 000
200 000
100 000
0Telecommunications Electronics
and componentsIT equipment Communication
equipmentIT services Software
600 000
1998 2000-01
500 000
400 000
300 000
200 000
100 000
0
600 000
500 000
400 000
300 000
200 000
100 000
0Telecommunications Electronics
and componentsIT equipment Communication
equipmentIT services Software
600 000
1998 2000-01
500 000
400 000
300 000
200 000
100 000
0
600 000
500 000
400 000
300 000
200 000
100 000
0Telecommunications Electronics
and componentsIT equipment Communication
equipmentIT services Software
Figure A1.2. Top 50 ICT firms revenue by countryUSD billions
Source: OECD, compiled from annual reports and SEC filings.
900 000
1998 2000-01
500 000
400 000
300 000
200 000
100 000
0
800 000
700 000
600 000
900 000
500 000
400 000
300 000
200 000
100 000
0
800 000
700 000
600 000
United
Sta
tes
Japa
n
Germ
any
Fran
ce
United
King
dom
Nethe
rland
s
Canad
a
Sweden
Finlan
dIta
ly
Spain
900 000
1998 2000-01
500 000
400 000
300 000
200 000
100 000
0
800 000
700 000
600 000
900 000
500 000
400 000
300 000
200 000
100 000
0
800 000
700 000
600 000
United
Sta
tes
Japa
n
Germ
any
Fran
ce
United
King
dom
Nethe
rland
s
Canad
a
Sweden
Finlan
dIta
ly
Spain
900 000
1998 2000-01
500 000
400 000
300 000
200 000
100 000
0
800 000
700 000
600 000
900 000
500 000
400 000
300 000
200 000
100 000
0
800 000
700 000
600 000
United
Sta
tes
Japa
n
Germ
any
Fran
ce
United
King
dom
Nethe
rland
s
Canad
a
Sweden
Finlan
dIta
ly
Spain
© OECD 2002

ICTs and their Role in the Economy
65
The differences between firms based in the United States and in Japan are likely to reflect a range of structuralfactors and sectoral differences. For example, the top 50 firms based in Japan are somewhat larger than those basedin the United States. Average per company revenue of the Japan-based firms was USD 46.4 billion, compared to anaverage of USD 32 billion for those based in the United States. While 24% of the top 50 IT firms are based in Japan,they account for 31% of total top 50 revenue and 29% of employment. While 52% of the top 50 IT firms are based inthe United States, they account for 47% of total revenue and 41% of employment. Seven (58%) of the 12 top 50 firmsbased in Japan are electronics and components manufacturers, three (25%) are IT equipment and systems producersand the other two (17%) are telecommunication services providers. By contrast, only five (19%) of the 26 top 50 firmsbased in the United States are electronics and components manufacturers and a further five are IT equipment andsystems producers. Finally, 13 (50%) of the 26 top 50 firms based in the United States are services firms – seven intelecommunication services, five in IT services and one in software.
The top 10 ICT firms in each sector
Because the top 50 group is dominated by large equipment manufacturers, it does not reveal much about majorplayers in specific ICT industry sectors. This section explores the top 10 firms in each sector – communicationequipment and systems, IT equipment and systems, electronics and components, IT services, software andtelecommunication services.
The communication equipment and systems top 10
The top 10 communication equipment and systems firms generated a combined revenue of USD 226 billionduring 2000-01, employed 770 578 people worldwide, spent USD 28 billion on R&D, earned USD 4.5 billion in netincome and had a combined market capitalisation of USD 432 billion. Seven were in the top 50 IT firms in 2001(Table A1.2). Between 1998 and 2000-01, the top 10 communication equipment and systems firms enjoyed a 44%increase in revenue and a more modest increase of around 14% in the number of employees. However, net incomefell by around 34%. Communication equipment manufacturing is R&D-intensive. Between 1998 and 2000-01, thetop 10 communication equipment and systems firms increased their R&D expenditure by 48%, spending theequivalent of 12% of revenue on R&D. Five of the top 10 communication equipment and systems firms are based inthe United States, but no other country has more than one – with Canada, Sweden, France, Finland and theUnited Kingdom all represented.
The electronics and components top 10
Electronics and components firms include a range of large conglomerate producers of ICT-related electronicsand components. The top 10 firms generated a combined revenue of USD 436 billion during 2000-01, employedalmost 2 million people worldwide, spent USD 29 billion on R&D, earned more than USD 35 billion net income andhad a combined market capitalisation of USD 366 billion (Table A1.3). All were in the top 50 IT firms in 2001.Between 1998 and 2000-01, the top 10 electronics and components firms increased their combined revenues by 12%and employment by just 3.4%, while doubling net income. R&D expenditure amounted to 6.7% of revenue from sales.Six of the top 10 electronics and components firms are based in Japan, two in the United States, one in Germany andin the Netherlands.
Table A1.2. Top 10 communication equipment and systems firmsUSD millions and number employed
Source: OECD, compiled from annual reports and SEC filings.
CompanyRevenue
1998Revenue
2001Employed
1998Employed
2001R&D1998
R&D2001
Net income
1998
Net income
2001
Marketcap2001
Lucent Technologies United States 24 367 33 813 153 000 126 000 3 655 4 024 1 065 1 219 22 000Motorola United States 29 398 30 931 133 000 121 000 3 209 4 440 –962 817 37 300Nortel Networks Canada 16 857 30 275 75 050 94 500 2 532 4 005 –1 282 –3 407 17 500Ericsson Sweden 23 209 29 931 101 485 105 129 3 527 4 587 1 641 2 300 32 300Alcatel France 23 671 28 992 118 272 131 598 2 014 2 610 2 605 1 222 85 800Nokia Finland 14 838 28 039 41 091 58 708 1 387 2 385 1 280 3 635 89 200Cisco Systems United States 8 489 22 293 15 000 38 000 1 663 3 922 1 331 –1 014 111 100Marconi United Kingdom 6 353 10 522 36 838 56 000 411 1 014 689 –640 28 903Avaya United States 7 754 7 680 . . 31 000 302 690 43 –375 2 900Tellabs United States 1 706 3 387 5 000 8 643 224 415 392 731 5 340
© OECD 2002

OECD Information Technology Outlook 2002
66
The IT equipment and systems top 10
The top 10 IT equipment and systems firms generated a combined revenue of USD 404 billion during 2000-01,employed 1.3 million people worldwide, spent almost USD 23 billion on R&D, earned USD 19 billion net income andhad a combined market capitalisation of USD 420 billion (Table A1.4). Eight were in the top 50 IT firms in 2001. Withthe recently announced merger of Hewlett-Packard and Compaq Computer (ranked fifth and sixth, respectively), theleading IT equipment and systems firms will further consolidate. Between 1998 and 2000-01, the top 10 IT equipmentand systems firms increased their combined revenues by 30% and employment by just 2%, while enjoying an 88%increase in net income. R&D expenditure amounted to 5.6% of revenue from sales. Seven of the top 10 IT equipmentand systems firms are based in the United States and the other three in Japan.
The IT services top 10
IT services firms tend to be smaller than manufacturing firms. The top 10 IT services firms generated combinedrevenue of USD 142 billion during 2000-01, employed around 570 000 people worldwide, earned aroundUSD 5.2 billion net income and had a combined market capitalisation of USD 101 billion (Table A1.5). Five were in
Table A1.3. Top 10 electronics and components firmsUSD millions and number employed
Source: OECD, compiled from annual reports and SEC filings.
CompanyRevenue
1998Revenue
2001Employed
1998Employed
2001R&D1998
R&D2001
Net income
1998
Net income
2001
Marketcap2001
Hitachi Japan 64 305 71 158 331 494 323 827 4 825 3 870 27 150 25 600Siemens Germany 66 896 70 964 416 000 447 000 4 839 5 328 1 511 11 539 38 600Matsushita Electric Japan 60 285 64 916 276 000 290 448 4 667 4 670 715 887 25 500Sony Japan 51 178 59 467 173 000 189 700 3 089 3 505 1 682 1 084 33 500Mitsubishi Electric Japan 29 043 38 297 115 206 116 715 1 393 1 731 –758 1 157 13 673Philips Electronics Netherlands 33 915 34 956 252 680 231 161 2 280 2 553 6 740 8 863 28 400Intel United States 26 273 33 726 64 500 86 100 2 509 3 897 6 068 10 535 155 000Canon Japan 21 593 25 794 79 799 86 673 1 719 1 729 837 1 243 32 629Xerox United States 19 593 18 701 94 600 92 500 1 035 1 044 273 –257 5 650Sanyo Electric Japan 16 474 17 914 . . 83 519 920 885 . . 193 6 960
Table A1.4. Top 10 IT equipment and systems firmsUSD millions and number employed
Source: OECD, compiled from annual reports and SEC filings.
CompanyRevenue
1998Revenue
2001Employed
1998Employed
2001R&D1998
R&D2001
Net income
1998
Net income
2001
Market cap2001
IBM United States 81 667 88 396 291 067 316 303 5 046 5 151 6 328 8 093 168 900Toshiba Japan 41 704 55 194 186 000 188 042 2 467 3 041 112 892 21 929Fujitsu Japan 40 057 50 863 180 000 188 042 3 018 3 741 –104 79 29 946NEC Japan 37 976 50 171 152 450 149 931 3 045 3 199 316 525 30 983Hewlett-Packard United States 38 419 48 782 124 600 88 500 2 380 2 646 2 945 3 697 33 000Compaq Computer United States 31 169 42 383 90 000 70 100 1 353 1 469 –2 743 569 16 100Dell Computer United States 18 243 31 888 24 400 40 000 272 482 1 460 2 177 60 600Sun Microsystems United States 9 862 18 250 26 300 43 300 1 029 2 016 755 927 29 400Gateway United States 7 703 9 601 . . 24 600 70 90 346 242 1 620EMC United States 5 436 8 873 9 400 24 100 393 781 654 1 782 27 100
© OECD 2002

ICTs and their Role in the Economy
67
the top 50 IT firms in 2001. Two of the IT services top 10 are private firms. Data relating to the IT services top 10 arelimited, but they appear to be enjoying rapid growth. Between 1998 and 2000-01, the top 10 IT services firms forwhich complete data are available increased their combined revenues by 45%, employment by 18% and net incomeby 38%. Two are primarily distribution firms, while the others are IT services and consulting firms. At least nine of thetop 10 IT services firms are based in the United States, and Cap Gemini Ernst and Young is French/US.
The software top 10
The top 10 software firms generated a combined revenue of USD 60 billion during 2000-01, employed220 000 people worldwide, earned around USD 10.5 billion net income and had a combined market capitalisation ofUSD 477 billion (Table A1.6). Only one, Microsoft, was in the top 50 IT firms in 2001. The top 10 software firms areexperiencing rapid growth. Between 1998 and 2000-01, they increased their combined revenues and employmentby 47% and net income by 35%. Data are incomplete, but the top 10 appear to be R&D-intensive; the eight top 10software firms for which data are available increased their R&D expenditures by 60% between 1998 and 2000-01, andby the end of the period R&D expenditures were equivalent to 15% of revenue from sales. Eight of the top 10 softwarefirms are based in the United States, one (SAP) in Germany and one (Softbank) in Japan.
Table A1.5. Top 10 IT services firmsUSD millions and number employed
Source: OECD, compiled from annual reports and SEC filings.
CompanyRevenue
1998Revenue
2001Employed
1998Employed
2001R&D1998
R&D2001
Net income
1998
Net income
2001
Market cap2001
Ingram Micro United States 22 034 30 715 . . 16 500 . . . . 245 226 1 910Pricewaterhouse- Coopers United States . . 21 500 . . 150 000 . . . . . . . . PrivateTech Data United States 7 056 20 428 8 240 10 500 . . . . 89 178 2 280EDS United States 17 243 19 227 120 000 122 000 43 24 743 1 413 27 500Accenture United States 8 307 13 500 65 134 71 300 . . . . . . 1 650 11 000CSC United States 8 111 10 524 45 000 68 000 . . . . 355 233 5 670ADP United States 4 926 7 018 34 000 41 000 416 467 608 925 31 000Unisys United States 7 244 6 885 33 200 36 900 308 334 376 225 2 640Cap Gemini Ernst and Young France/United States 4 397 6 398 34 606 50 249 . . . . 195 398 18 675SAIC United States . . 5 900 . . . . . . . . . . . . Private
Table A1.6. Top 10 software firmsUSD millions and number employed
Source: OECD, compiled from annual reports and SEC filings.
CompanyRevenue
1998Revenue
2001Employed
1998Employed
2001R&D1998
R&D2001
Net income
1998
Net income
2001
Marketcap2001
Microsoft United States 15 262 25 296 29 159 47 600 2 970 4 380 4 490 7 346 299 900Oracle United States 7 144 10 860 36 802 42 927 810 1 139 814 2 561 80 000SAP Germany 4 806 5 783 19 308 23 700 597 923 587 585 37 500Computer Associates United States 4 206 4 918 11 400 18 200 325 1 110 1 169 –591 16 700Softbank Japan 3 922 3 925 1 002 7 219 . . . . 79 78 11 660Compuware United States 1 139 2 010 10 016 13 220 77 116 194 119 3 430Siebel Systems United States 418 1 795 1 450 7 389 . . . . 42 222 8 600Peoplesoft United States 1 475 1 737 7 032 8 019 270 329 140 146 7 750BMC Software United States 985 1 504 3 604 7 330 164 235 189 42 3 640Electronic Arts United States 909 1 322 . . 3 500 146 389 73 –11 7 430
© OECD 2002
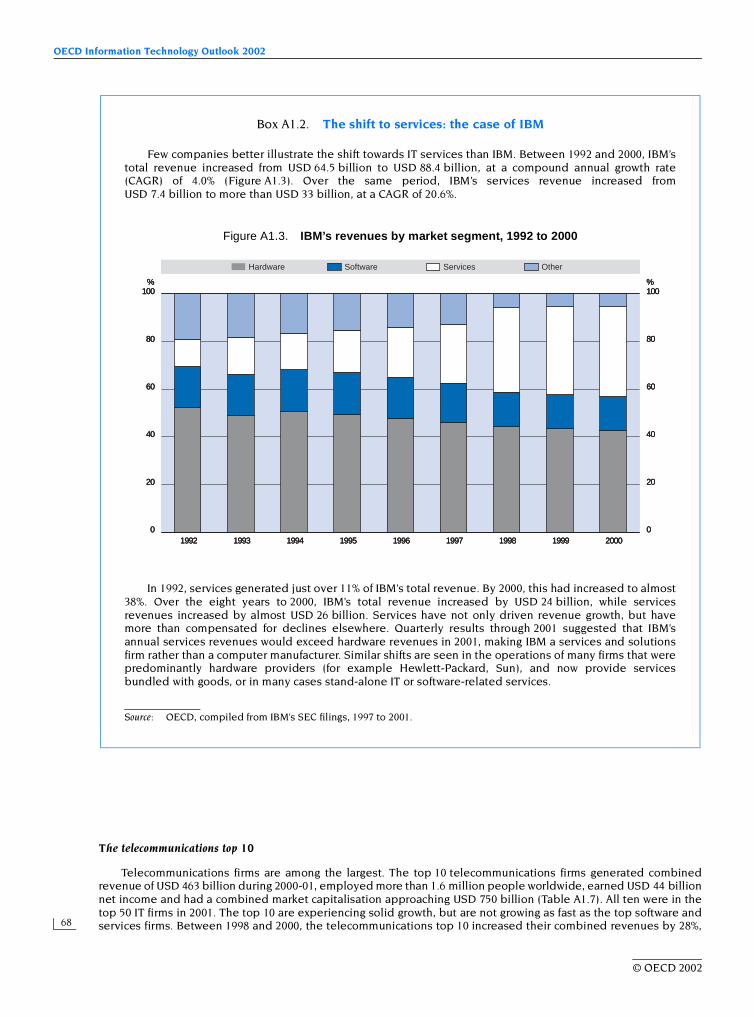
OECD Information Technology Outlook 2002
68
The telecommunications top 10
Telecommunications firms are among the largest. The top 10 telecommunications firms generated combinedrevenue of USD 463 billion during 2000-01, employed more than 1.6 million people worldwide, earned USD 44 billionnet income and had a combined market capitalisation approaching USD 750 billion (Table A1.7). All ten were in thetop 50 IT firms in 2001. The top 10 are experiencing solid growth, but are not growing as fast as the top software andservices firms. Between 1998 and 2000, the telecommunications top 10 increased their combined revenues by 28%,
Box A1.2. The shift to services: the case of IBM
Few companies better illustrate the shift towards IT services than IBM. Between 1992 and 2000, IBM’stotal revenue increased from USD 64.5 billion to USD 88.4 billion, at a compound annual growth rate(CAGR) of 4.0% (Figure A1.3). Over the same period, IBM’s services revenue increased fromUSD 7.4 billion to more than USD 33 billion, at a CAGR of 20.6%.
In 1992, services generated just over 11% of IBM’s total revenue. By 2000, this had increased to almost38%. Over the eight years to 2000, IBM’s total revenue increased by USD 24 billion, while servicesrevenues increased by almost USD 26 billion. Services have not only driven revenue growth, but havemore than compensated for declines elsewhere. Quarterly results through 2001 suggested that IBM’sannual services revenues would exceed hardware revenues in 2001, making IBM a services and solutionsfirm rather than a computer manufacturer. Similar shifts are seen in the operations of many firms that werepredominantly hardware providers (for example Hewlett-Packard, Sun), and now provide servicesbundled with goods, or in many cases stand-alone IT or software-related services.
Source: OECD, compiled from IBM’s SEC filings, 1997 to 2001.
Figure A1.3. IBM’s revenues by market segment, 1992 to 2000
100% %
1992
80
60
40
20
0
100
80
60
40
20
01993 1994 1995 1996 1997 1998 1999 2000
OtherServicesSoftwareHardware
100% %
1992
80
60
40
20
0
100
80
60
40
20
01993 1994 1995 1996 1997 1998 1999 2000
OtherServicesSoftwareHardware
100% %
1992
80
60
40
20
0
100
80
60
40
20
01993 1994 1995 1996 1997 1998 1999 2000
OtherServicesSoftwareHardware
© OECD 2002
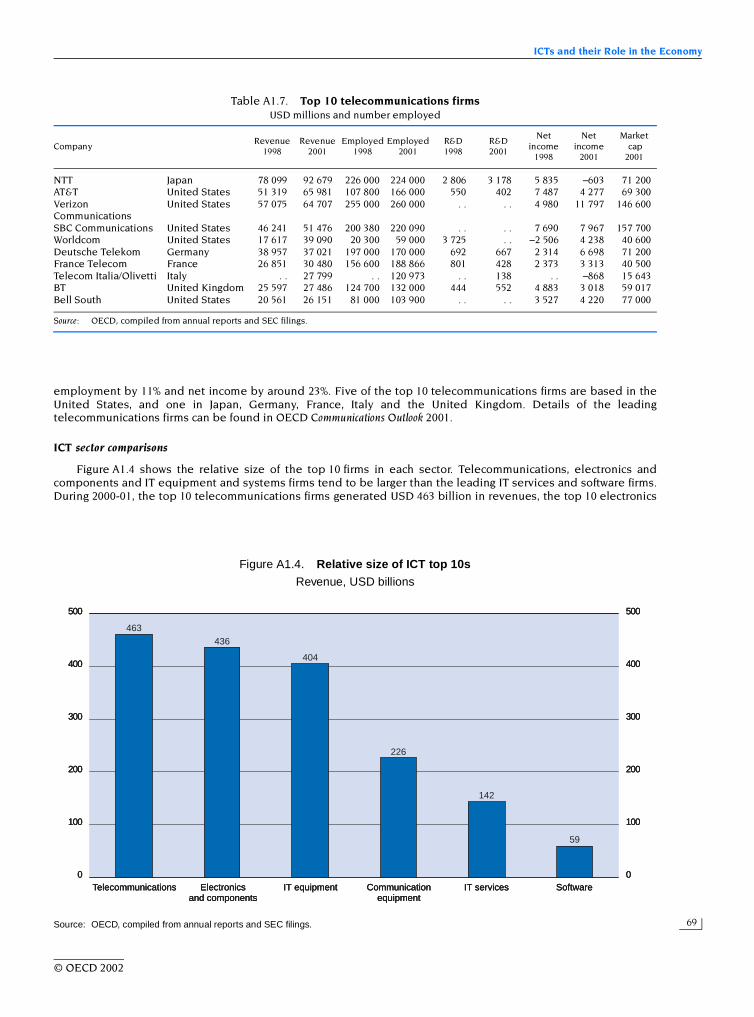
ICTs and their Role in the Economy
69
employment by 11% and net income by around 23%. Five of the top 10 telecommunications firms are based in theUnited States, and one in Japan, Germany, France, Italy and the United Kingdom. Details of the leadingtelecommunications firms can be found in OECD Communications Outlook 2001.
ICT sector comparisons
Figure A1.4 shows the relative size of the top 10 firms in each sector. Telecommunications, electronics andcomponents and IT equipment and systems firms tend to be larger than the leading IT services and software firms.During 2000-01, the top 10 telecommunications firms generated USD 463 billion in revenues, the top 10 electronics
Table A1.7. Top 10 telecommunications firmsUSD millions and number employed
Source: OECD, compiled from annual reports and SEC filings.
CompanyRevenue
1998Revenue
2001Employed
1998Employed
2001R&D1998
R&D2001
Net income
1998
Net income
2001
Market cap2001
NTT Japan 78 099 92 679 226 000 224 000 2 806 3 178 5 835 –603 71 200AT&T United States 51 319 65 981 107 800 166 000 550 402 7 487 4 277 69 300Verizon Communications
United States 57 075 64 707 255 000 260 000 . . . . 4 980 11 797 146 600
SBC Communications United States 46 241 51 476 200 380 220 090 . . . . 7 690 7 967 157 700Worldcom United States 17 617 39 090 20 300 59 000 3 725 . . –2 506 4 238 40 600Deutsche Telekom Germany 38 957 37 021 197 000 170 000 692 667 2 314 6 698 71 200France Telecom France 26 851 30 480 156 600 188 866 801 428 2 373 3 313 40 500Telecom Italia/Olivetti Italy . . 27 799 . . 120 973 . . 138 . . –868 15 643BT United Kingdom 25 597 27 486 124 700 132 000 444 552 4 883 3 018 59 017Bell South United States 20 561 26 151 81 000 103 900 . . . . 3 527 4 220 77 000
Figure A1.4. Relative size of ICT top 10sRevenue, USD billions
Source: OECD, compiled from annual reports and SEC filings.
500
400
300
200
100
0
500
400
300
200
100
0
463436
404
226
142
59
Telecommunications Electronicsand components
IT equipment Communicationequipment
IT services Software
500
400
300
200
100
0
500
400
300
200
100
0
463436
404
226
142
59
Telecommunications Electronicsand components
IT equipment Communicationequipment
IT services Software
500
400
300
200
100
0
500
400
300
200
100
0
463436
404
226
142
59
Telecommunications Electronicsand components
IT equipment Communicationequipment
IT services Software
© OECD 2002
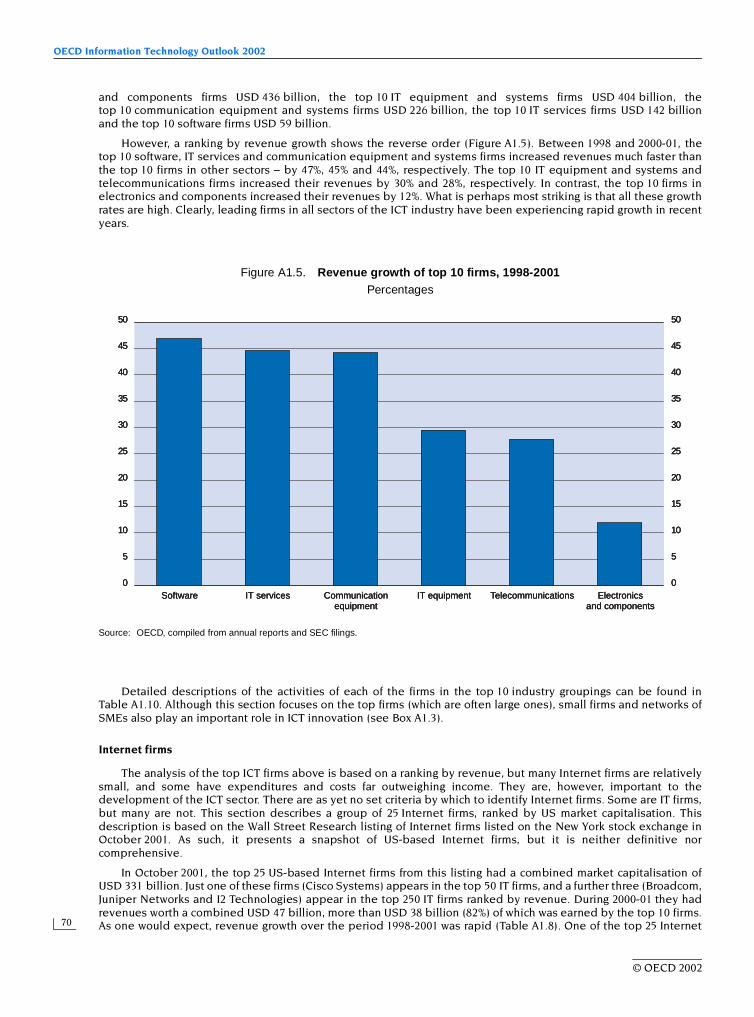
OECD Information Technology Outlook 2002
70
and components firms USD 436 billion, the top 10 IT equipment and systems firms USD 404 billion, thetop 10 communication equipment and systems firms USD 226 billion, the top 10 IT services firms USD 142 billionand the top 10 software firms USD 59 billion.
However, a ranking by revenue growth shows the reverse order (Figure A1.5). Between 1998 and 2000-01, thetop 10 software, IT services and communication equipment and systems firms increased revenues much faster thanthe top 10 firms in other sectors – by 47%, 45% and 44%, respectively. The top 10 IT equipment and systems andtelecommunications firms increased their revenues by 30% and 28%, respectively. In contrast, the top 10 firms inelectronics and components increased their revenues by 12%. What is perhaps most striking is that all these growthrates are high. Clearly, leading firms in all sectors of the ICT industry have been experiencing rapid growth in recentyears.
Detailed descriptions of the activities of each of the firms in the top 10 industry groupings can be found inTable A1.10. Although this section focuses on the top firms (which are often large ones), small firms and networks ofSMEs also play an important role in ICT innovation (see Box A1.3).
Internet firms
The analysis of the top ICT firms above is based on a ranking by revenue, but many Internet firms are relativelysmall, and some have expenditures and costs far outweighing income. They are, however, important to thedevelopment of the ICT sector. There are as yet no set criteria by which to identify Internet firms. Some are IT firms,but many are not. This section describes a group of 25 Internet firms, ranked by US market capitalisation. Thisdescription is based on the Wall Street Research listing of Internet firms listed on the New York stock exchange inOctober 2001. As such, it presents a snapshot of US-based Internet firms, but it is neither definitive norcomprehensive.
In October 2001, the top 25 US-based Internet firms from this listing had a combined market capitalisation ofUSD 331 billion. Just one of these firms (Cisco Systems) appears in the top 50 IT firms, and a further three (Broadcom,Juniper Networks and I2 Technologies) appear in the top 250 IT firms ranked by revenue. During 2000-01 they hadrevenues worth a combined USD 47 billion, more than USD 38 billion (82%) of which was earned by the top 10 firms.As one would expect, revenue growth over the period 1998-2001 was rapid (Table A1.8). One of the top 25 Internet
Figure A1.5. Revenue growth of top 10 firms, 1998-2001Percentages
Source: OECD, compiled from annual reports and SEC filings.
50
45
40
35
30
0
25
20
15
10
5
0
15
10
5
50
45
40
35
30
25
20
Telecommunications Electronicsand components
IT equipmentCommunicationequipment
IT servicesSoftware
50
45
40
35
30
0
25
20
15
10
5
0
15
10
5
50
45
40
35
30
25
20
Telecommunications Electronicsand components
IT equipmentCommunicationequipment
IT servicesSoftware
50
45
40
35
30
0
25
20
15
10
5
0
15
10
5
50
45
40
35
30
25
20
Telecommunications Electronicsand components
IT equipmentCommunicationequipment
IT servicesSoftware
© OECD 2002

ICTs and their Role in the Economy
71
firms is a recent start-up (Hotel Reservation), but the remaining 24 increased their combined revenues fromUSD 13.5 billion in 1998 to USD 46.6 billion in 2001 – a 247% increase. Unfortunately, the net income realised by theseleading Internet firms deteriorated even more spectacularly, falling from a combined profit of USD 1.1 billion in 1998to a combined loss of USD 28 billion in 2001. Verisign Software contributed no less than USD 15 billion to thiscombined loss, with WebMD contributing a further USD 4 billion, I2 Technologies USD 3 billion, and Amazon,Broadcom and Cisco Systems each contributing more than USD 1 billion. No fewer than 19 of the top 25 Internet firmsmade a loss in 2001, whereas 15 showed losses in 1998.
Box A1.3. Large and small firms: outsourcing, networking and changing growth models
Large firms play key roles shaping the broad structure of economies. They lead small firms in allmeasures of technology use, including ICTs and the Internet, efficiency and productivity, although theextent and impacts of use of ICTs depend on sectoral factors, with manufacturing, wholesale and retailtrade and business services more likely to use ICTs.
In recent years outsourcing (purchasing from outside vendors intermediate components andproduction-related services previously produced in-house) has increased more rapidly than industrialproduction, particularly in growing industries such as electronics and electrical engineering. Reasonsinclude a tendency of companies to concentrate on their core competencies, and pressures to reducecosts and use specialised vendors more efficiently. Specialised producers can provide intermediategoods at lower cost and offer a wider choice of innovative products due to larger production volumes andthe positive effects of competition. On the other hand, outsourcing may reduce in-house knowledgecreation and innovative activity. Furthermore, outsourcing involves transaction costs in negotiation,co-ordination and monitoring.
Nokia is one example of increasing co-operation with outside suppliers. Rather than produceeverything, it is strengthening vertical relations and permanent partnerships. In the 1980s inter-firmco-operation was mostly traditional subcontracting to stabilise manufacturing capacity over businesscycles. In the 1990s outsourcing became a permanent mode for manufacturing accessories, andmanufacturing partnerships were gradually expanded to other areas to reorganise supply chains and useassembler services. Now these relationships encompass R&D subcontracting, and are moving towardsR&D partnerships.
Extensive orchestration of the supply chain has helped gain competitive advantage and producemutual benefits to both partners in sales growth and geographical expansion. Usually suppliers and keycustomers have common teams that meet frequently to solve problems, exchange information aboutstrategies, future technologies and products, with suppliers involved in the very early planning phases.Some suppliers have also internationalised, and established R&D units abroad to offer global services toother customers.
Co-operation has encouraged joint learning on technologies, market development and marketrequirements. This has enabled some smaller subcontractors to grow rapidly to reach size and scalerequirements of large partners. A continuing challenge to increased networking in small open economiesis size differences between suppliers and customers, and the ability of small and medium-sizedcomponent and services companies to deliver large volumes required by the key customer. Furthermore,large firms are decreasing the number of direct suppliers, to reduce the complexity of relationships, andencourage common systems and components along supply chains.
Partnerships with reasonable shared risk appear to be the most rewarding business relations.However, close co-operation can bring difficulties. For example, in demand-pull sourcing the entiresupply chain needs the same real-time information about expected demand changes to reduceinstability. Second, dependence on a single customer may constitute a high long run risk. The thirdpossible drawback of networking is where patents, copyrights and trademarks from R&D co-operation areleft to the partner, limiting utilisation of the results of co-operation. Finally, just-in-time strategies canlead fluctuations in demand to cause immediate impacts at the beginning of the production chain.
Sources: Pajarinen, M. (2001), Make or buy – Outsourcing in Finnish industry, ETLA, The Research Institute of the FinnishEconomy, Helsinki; Ali-Yrkkö, J. (2001), “The role of Nokia in the Finnish Economy”, The Finnish Economy andSociety, 1/2001.
© OECD 2002

OECD Information Technology Outlook 2002
72
The activities of this group of Internet firms are very heterogeneous (Table A1.9). These firms can be broadlygrouped into four categories: six provide communication equipment and software, seven provide some form of on-line retail, reservation or trading service, six provide software for authentication, security and other e-businessapplications, and six provide ISP and portal and related content services. According to the detailed US SIC code,seven of the top 25 Internet firms report packaged software (SIC 7372) as their primary business, two report computersystems design (SIC 7373), two report computer peripheral equipment manufacturing (SIC 3577) and two reportbusiness services (SIC 7389). The remaining firms all report different primary business activities. These include: bookpublishing and printing (SIC 2731), telephone and telegraph apparatus manufacturing (SIC 3661), semiconductormanufacturing (SIC 3674), travel agency (SIC 4724), communications services (SIC 4899), security brokers and dealers(SIC 6211), hotels and motels (SIC 7011), computer programming services (SIC 7371), computer processing services(SIC 7374), information retrieval services (SIC 7375), motion picture and video tape production (SIC 7812) andamusement and recreation services (SIC 7999). This list clearly shows the diversity of Internet activities and of thebackgrounds of “Internet” firms, hence the difficulty in unambiguously identifying and tracking them.
Table A1.8. Top 25 Internet firms, 2001USD millions and percentage change
Note: Ranked by market capitalisation on 12 October 2001.Source: OECD, US-based Internet firms compiled from Wall Street Research Net (WSRN)’s Internet Investing Network.
Company ActivityRevenue
1998Revenue
2001Change
%Net income
1998Net income
2001Market cap
2001
AOL Time Warner ISP/Content 2 600 7 703 196 92 1 152 142 175Cisco Communication equipment 8 489 22 293 163 1 331 –1 014 111 100E Bay Online trading 47 582 1 129 2 85 16 833Verisign Authentication 39 815 1 990 –20 –15 205 9 147Broadcom Communication equipment 203 1 181 482 36 –1 576 6 726Checkpoint Software Security software 142 544 283 70 313 5 984Yahoo! ISP/Portal 203 969 377 26 –110 5 820Juniper Networks Communication equipment 4 1 031 27 032 –31 142 4 777Terra Networks ISP 14 290 1 925 –4 –524 3 541Amazon Online store 610 2 978 388 –125 –1 178 2 507Earthlink ISP 176 1 135 545 –60 –368 2 301E Trade Online trading 285 2 202 672 –1 19 2 136I2 Technologies E-business software 362 1 295 258 20 –3 118 2 073Ticketmaster Online booking 28 471 1 582 –17 –199 1 838Hotel Reservation Online booking . . 438 . . . . 14 1 755Tibco Software E-business software 53 330 524 –13 –26 1 491Expedia Online travel booking 39 222 474 –20 –78 1 487Quest Software E-business software 35 230 561 2 –43 1 315WebMD Portal (Medical) 49 713 1 362 –57 –3 997 1 219Openwave Sys ISP/Software 2 465 21 050 –11 –690 1 191Research In Motion Communication equipment 23 271 1 059 0 –3 1 174Sycamore Networks Communication equipment 11 375 3 216 –20 –180 1 149Liberate Technologies TV Software 17 60 249 –33 –296 1 136Vignette Corp E-business software 16 408 2 419 –26 –811 1 121Webex Online exchange 3 52 1 892 –14 –65 1 101
© OECD 2002
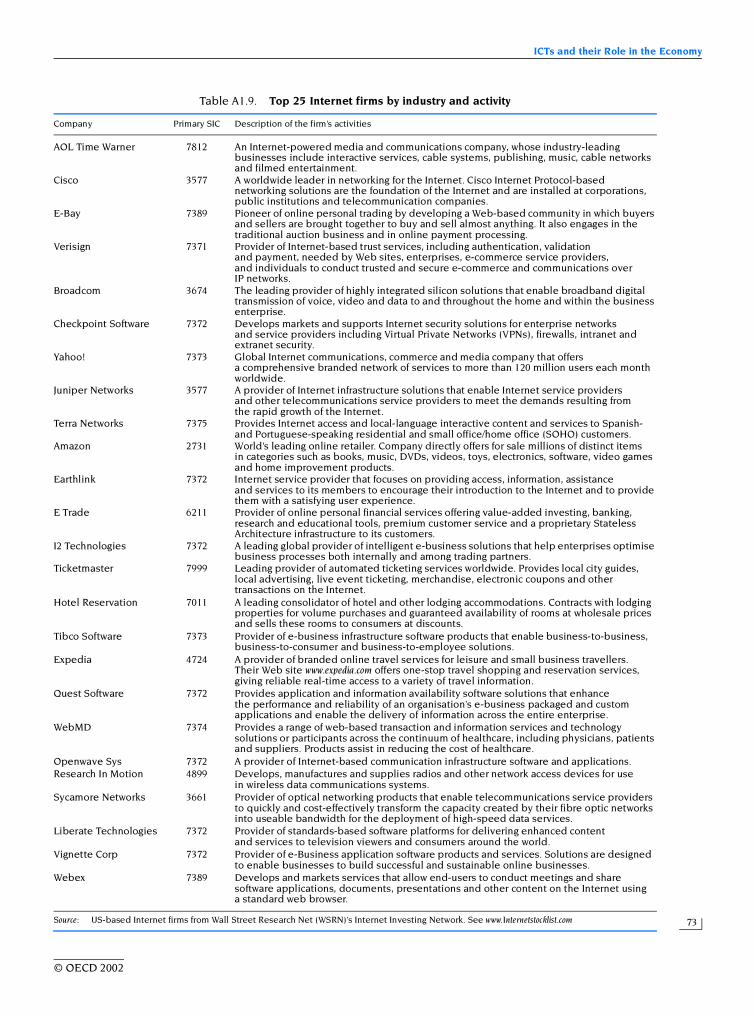
ICTs and their Role in the Economy
73
Table A1.9. Top 25 Internet firms by industry and activity
Source: US-based Internet firms from Wall Street Research Net (WSRN)’s Internet Investing Network. See www.Internetstocklist.com
Company Primary SIC Description of the firm’s activities
AOL Time Warner 7812 An Internet-powered media and communications company, whose industry-leading businesses include interactive services, cable systems, publishing, music, cable networks and filmed entertainment.
Cisco 3577 A worldwide leader in networking for the Internet. Cisco Internet Protocol-based networking solutions are the foundation of the Internet and are installed at corporations, public institutions and telecommunication companies.
E-Bay 7389 Pioneer of online personal trading by developing a Web-based community in which buyers and sellers are brought together to buy and sell almost anything. It also engages in the traditional auction business and in online payment processing.
Verisign 7371 Provider of Internet-based trust services, including authentication, validation and payment, needed by Web sites, enterprises, e-commerce service providers, and individuals to conduct trusted and secure e-commerce and communications over IP networks.
Broadcom 3674 The leading provider of highly integrated silicon solutions that enable broadband digital transmission of voice, video and data to and throughout the home and within the business enterprise.
Checkpoint Software 7372 Develops markets and supports Internet security solutions for enterprise networks and service providers including Virtual Private Networks (VPNs), firewalls, intranet and extranet security.
Yahoo! 7373 Global Internet communications, commerce and media company that offers a comprehensive branded network of services to more than 120 million users each month worldwide.
Juniper Networks 3577 A provider of Internet infrastructure solutions that enable Internet service providers and other telecommunications service providers to meet the demands resulting from the rapid growth of the Internet.
Terra Networks 7375 Provides Internet access and local-language interactive content and services to Spanish- and Portuguese-speaking residential and small office/home office (SOHO) customers.
Amazon 2731 World’s leading online retailer. Company directly offers for sale millions of distinct items in categories such as books, music, DVDs, videos, toys, electronics, software, video games and home improvement products.
Earthlink 7372 Internet service provider that focuses on providing access, information, assistance and services to its members to encourage their introduction to the Internet and to provide them with a satisfying user experience.
E Trade 6211 Provider of online personal financial services offering value-added investing, banking, research and educational tools, premium customer service and a proprietary Stateless Architecture infrastructure to its customers.
I2 Technologies 7372 A leading global provider of intelligent e-business solutions that help enterprises optimise business processes both internally and among trading partners.
Ticketmaster 7999 Leading provider of automated ticketing services worldwide. Provides local city guides, local advertising, live event ticketing, merchandise, electronic coupons and other transactions on the Internet.
Hotel Reservation 7011 A leading consolidator of hotel and other lodging accommodations. Contracts with lodging properties for volume purchases and guaranteed availability of rooms at wholesale prices and sells these rooms to consumers at discounts.
Tibco Software 7373 Provider of e-business infrastructure software products that enable business-to-business, business-to-consumer and business-to-employee solutions.
Expedia 4724 A provider of branded online travel services for leisure and small business travellers. Their Web site www.expedia.com offers one-stop travel shopping and reservation services, giving reliable real-time access to a variety of travel information.
Quest Software 7372 Provides application and information availability software solutions that enhance the performance and reliability of an organisation’s e-business packaged and custom applications and enable the delivery of information across the entire enterprise.
WebMD 7374 Provides a range of web-based transaction and information services and technology solutions or participants across the continuum of healthcare, including physicians, patients and suppliers. Products assist in reducing the cost of healthcare.
Openwave Sys 7372 A provider of Internet-based communication infrastructure software and applications.Research In Motion 4899 Develops, manufactures and supplies radios and other network access devices for use
in wireless data communications systems.Sycamore Networks 3661 Provider of optical networking products that enable telecommunications service providers
to quickly and cost-effectively transform the capacity created by their fibre optic networks into useable bandwidth for the deployment of high-speed data services.
Liberate Technologies 7372 Provider of standards-based software platforms for delivering enhanced content and services to television viewers and consumers around the world.
Vignette Corp 7372 Provider of e-Business application software products and services. Solutions are designed to enable businesses to build successful and sustainable online businesses.
Webex 7389 Develops and markets services that allow end-users to conduct meetings and share software applications, documents, presentations and other content on the Internet using a standard web browser.
© OECD 2002

OECD Information Technology Outlook 2002
74
Table A1.10. Primary SIC and activity description of the top 10 ICT firms by sector
Company Primary SIC Description of the firm’s activities
Communication equipment and systems
Lucent Technologies 4813 Designer, developer and manufacturer of communications systems, software and products. It sells public/private communications systems, supplies systems and software to network operators and service providers, and sells related microelectronic components.
Motorola 3663 Provider of integrated communications solutions and embedded electronic solutions such as: software-enhanced wireless telephone radio and satellite communications; embedded semiconductor products and embedded electronic systems.
Nortel Networks 3661 Engaged in the telecommunications equipment industry, which consists of the research and the design, development, manufacture, marketing, sale, installation, financing, support and servicing of enterprise, public carrier, wireless and broadband networks.
Ericsson 3661 International leader in telecommunications, recognised for its advanced systems and products for wired and mobile communications in public and private networks. It also provides wireless communication and Internet-based technology.
Alcatel 3669 Provider of communications equipment including ADSL equipment, terrestrial and submarine optical networks, public switching, fixed wireless access and intelligent networks.
Nokia 4813 Supplier of data, video and voice network solutions, mobile and fixed access solutions, and broadband and IP network solutions. It also manufactures mobile phones and is a pioneer in digital multimedia terminals for digital TV and interactive services.
Cisco Systems 3577 A worldwide leader in networking for the Internet. Cisco Internet Protocol-based networking solutions are the foundation of the Internet and are installed at corporations, public institutions and telecommunication companies.
Marconi . . UK-based communication equipment firm.
Avaya 3661 A provider of communications systems and software for enterprises, including businesses, government agencies and other organisations.
Tellabs 3661 Developer, manufacturer and marketer of voice-quality enhancement products for wireless, satellite-based, cable communication, and wireline telecommunications systems. Company’s products are sold in domestic and international marketplaces.
Electronics
Hitachi 3511 Manufactures and markets a wide range of products, including computers, semiconductors, consumer products and power and industrial equipment. It is one of the world’s leading global electronics companies.
Siemens 8711 An electronics and engineering company that operates worldwide, delivering advanced solutions for e-business, mobile communications, manufacturing, transportation, health care, energy and lighting.
Matsushita Electric 3651 Major producer of electronic and electric products. It offers a comprehensive range of products, systems and components for consumer, business and industrial use. Brand names include Panasonic, National, Technics, Quasar, Victor and JVC.
Sony 3651 Engaged in the development, manufacture and sale of various kinds of electronic equipment, instruments and devices. It is also engaged worldwide in the development, production, manufacture and distribution of recorded music in all commercial formats.
Mitsubishi Electric . . Large conglomerate electronics firms.
Philips Electronics 3651 Products, systems and services are delivered in the fields of lighting, consumer products, consumer electronics, domestic appliances and personal care, components, semiconductors, medical systems and business electronics.
Intel 3674 World’s largest semiconductor chip maker, supplies the computing and communications industries with chips, boards, systems and software that are integral in computers/servers and networking and communications products.
Canon 3861 Designs, develops and manufactures a variety of high-tech products including business machines and systems, cameras, computers, printers, faxes, semiconductor production equipment, medical equipment, typewriters and copiers.
Xerox 3861 Provides solutions to help customers manage documents whether on paper, electronically or online. Offers hardware, software services and solutions for small businesses, global enterprises or home offices.
Sanyo Electric 3663 Manufactures and distributes consumer and commercial electronics, including multimedia and telecommunication products such as information and communication equipment, home appliances, industrial and commercial equipment, electronic devices and batteries.
© OECD 2002

ICTs and their Role in the Economy
75
Table A1.10. Primary SIC and activity description of the top 10 ICT firms by sector (cont.)
Company Primary SIC Description of the firm’s activities
IT equipment and systems
IBM 3571 Develops, manufactures, and sells information processing products, including computers and microelectronics technology, software, networking systems, and information technology-related services operating on a worldwide basis.
Toshiba . . Major producer of IT and office equipment.
Fujitsu . . Major producer of a range of IT, communications and related equipment, systems and services.
NEC 3571 Provider of Internet solutions, dedicated to meeting the specialised needs of its customers in the key computer, network and electron device fields through its three market-focused in-house companies: NEC Solutions, NEC Networks and NEC Electron Devices.
Hewlett-Packard 3571 Global provider of computing and imaging solutions and services for business and home. The Company’s operations are organised into four major businesses: Imaging and Printing, Computing Systems, Information Technology Services, and Measurement Systems.
Compaq Computer 3571 Designs, develops, manufactures and markets hardware, software, solutions and services, including fault-tolerant business-critical solutions, networking and communication products, desktop and portable products and consumer PCs.
Dell Computer 3571 World’s largest direct computer systems company. Company offers its customers a full range of computer systems, ranging from desktops to peripheral hardware; including computer software and related services.
Sun Microsystems 7373 Worldwide provider of products, services and support solutions for building and maintaining network computing environments. It sells scalable computer systems, high-speed microprocessors and a complete line of related high performance software.
Gateway 3571 Major PC manufacturer that has a company-owned retail network and focuses on providing complete technology solutions for its clients, including financing, Internet service, a personalised Internet portal, peripherals and software, and service.
EMC 3572 Designs, manufactures, markets and supports a wide range of hardware and software and provides services for the storage, management, protection and sharing of electronic information.
IT services
Ingram Micro 5045 Wholesale distributor of computer-based technology products and services worldwide. It markets computer hardware, networking equipment and software products to more than 140 000 reseller customers in more than 130 countries.
Pricewaterhouse- Coopers . . Major international technology and business consulting firm.
Tech Data 5045 Provider of information technology products, logistics management and other value-added services. It distributes microcomputer hardware and software products to value-added resellers, corporate resellers, retailers, direct marketers and Internet resellers.
EDS 7373 Professional services firm that applies consulting, information and technical expertise to enhance clients’ business performance. Services include the management of computers, networks, information systems, business operations and related personnel.
Accenture . . Technology consulting and services.
CSC 7373 One of the world leaders in the information technology (IT) services industry. Its services, both US federal and global commercial, include outsourcing system integration and IT and management consulting and other professional services.
ADP 7374 Provides computerised transaction processing, data communication and information services. Major services include payroll and human resources information management, benefits administration and time and labour management.
Unisys 7373 Worldwide information services and technology company; provides services, systems and solutions, its Unisys e-@ction Solutions, that help customers apply information technology to seize opportunities and overcome the challenges of the Internet economy.
CapGemini Ernst and Young . . Combined software, services and consulting business.
SAIC . . Former defence contractor that now takes on wider outsourcing and services contracts, especially for government clients.
© OECD 2002

OECD Information Technology Outlook 2002
76
Table A1.10. Primary SIC and activity description of the top 10 ICT firms by sector (cont.)
Source: Wall Street Research Net’s Internet Investing Network, October 2001, and other sources.
Company Primary SIC Description of the firm’s activities
Software
Microsoft 7372 Develops, manufactures, licenses and supports a wide range of software products for a multitude of computing devices. Software includes scalable operating systems for servers. Online efforts include the MSN network.
Oracle 7372 A world supplier of software for information management. Company develops, manufactures, markets and distributes computer software that is categorised as systems software and Internet business applications software that help manage and grow company business.
SAP 7372 International developer and supplier of integrated business software designed to provide cost-effective comprehensive solutions for businesses. It designs, develops, markets and supports client/server and mainframe standard business application software.
Computer Associates 7372 A leading e-business software company. Company’s solutions address all aspects of e-business process management, information management and infrastructure management in six focus areas.
Softbank . . Software producer based in Japan.
Compuware 7372 Provides software products and professional services designed to increase the productivity of the information technology departments of businesses worldwide.
Siebel Systems 7372 Provider of enterprise-class sales, marketing and customer service information software systems. It designs, develops and markets Siebel Enterprise Applications, a leading Internet-enabled, object oriented client/server application software product.
Peoplesoft 7372 Designs, develops, markets and supports a family of enterprise application software products for use throughout large and medium sized organisations, including corporations, higher education institutions, and government agencies.
BMC Software 7372 An independent systems software vendor, delivering comprehensive enterprise management. Provides solutions to enhance the performance of customers’ applications to help them better manage their businesses.
Electronic Arts 7372 Creates, markets and distributes interactive entertainment software for a variety of hardware platforms.
© OECD 2002

ICTs and their Role in the Economy
77
NOTES
1. Internet stocks were the first to be hit during the dramatic stock market correction in 2000: the NASDAQ indexlost more than two-thirds of its value between March 2000 and April 2001.
2. Japanese and Korean consumer electronics firms, which had previously focused on domestic production, haveprogressively delocalised part of their production to other Asian countries, notably China. A recent illustrationis provided by Matsushita, which, in order to strengthen price competitiveness both in its national market andabroad, was planning in October 2001 to move its DVD player manufacturing facilities to China(www.digitimes.com, 3 October 2001).
3. For those countries that have both data sets, MFP growth in the most recent period (1995-99) is positively andweakly correlated with the share of the ICT sector in business value added, but the correlation is notsignificant. Similar patterns apply for ICT manufacturing, where Australia and Norway (and Denmark) haverelatively small ICT sectors and relatively good adjusted MFP growth; the correlation is again positive but notsignificant (OECD, 2001b).
4. Analysis in this section is based on data from the OECD ITS database (International Trade Services) inJanuary 2002. The data are complete for all OECD countries except: the Czech Republic (data from 1994),Hungary (from 1992), Korea (from 1994), and the Slovak Republic (from 1997). Luxembourg is not included.Data for 2000 are incomplete and 1999 data were used for Greece and the Slovak Republic.
5. As Chapter 2 shows, foreign trade is only one dimension of globalisation: it is estimated that in 1998, sales byforeign affiliates of US IT firms were almost twice as large as total exports of IT goods and services by firmsbased in the United States (US Department of Commerce, 2002).
6. ICT-related services include communications services and computer and information services (see Annex 1:Methodology).
7. Averages over the period 1995-2000 are used since the value of venture capital investments displays strongannual fluctuations, so shares can change significantly between years.
8. A different source (PricewaterhouseCoopers, 2001) estimates an even higher share for Internet-related venturecapital investments in the United States during 2000, at around 83%.
9. According to the Statistics Bureau of China, the electronics and information manufacturing industry has becomethe largest component of the Chinese industry in 2000, with output growing at an annual average rate of about32% over the last ten years, compared to only 14% for the industry as a whole (KISDI, 2001).
10. The average price of a 16-Megabyte DRAM fell between June 2000 and 2001 from USD 20 to USD 4. On average,selling prices are now below production costs.
© OECD 2002

OECD Information Technology Outlook 2002
78
REFERENCES
Colecchia, A. and P. Schreyer (2001),“ICT Investment and Economic Growth in the 1990s: Is the United States a Unique Case? A Comparative Studyof Nine OECD Countries”, STI Working Paper 2001/7, OECD, Paris; www.oecd.org/sti
Forrester Research (2001),“Tech Recovery in 2003: A Different Beast”, Forrester Brief, 24 October.
International Data Corporation (IDC) (2001),“IT Industry Headed for Gradual Recovery in 2002, Led by Software and Services”, Press Release, 13 November.www.idc.com/ITOver/press/G111301pr.stm
International Data Corporation (IDC) (2002),“Economic Recovery to Drive IT Market Rebound in 2002”, Press Release, 1 May.
J.P. Morgan Securities (2001),Industry Analysis – European Semiconductors: A Foggy Road to Recovery, November, London.
Korea Information Society Development Institute (KISDI) (2001),Review of the Development and Reforms of the Telecommunication Sector in China, mimeo, September.
OECD (2000),Measuring the ICT Sector, Paris.
OECD (2001a),Science, Technology and Industry Outlook – Drivers of Growth: Information Technology, Innovation and Entrepreneurship, Paris.
OECD (2001b),The New Economy: Beyond the Hype – The OECD Growth Project, Paris.
OECD (2001c),OECD Science, Technology and Industry Scoreboard – Towards A Knowledge-Based Economy, Paris.
Pilat, D. and F.C. Lee (2001),“Productivity Growth in ICT-Producing and ICT-using Industries: A Source of Growth Differentials in the OECD?”,STI Working Paper 2001/4, OECD, Paris. www.oecd.org/sti/
PricewaterhouseCoopers (2001),“MoneyTree Survey – Full Year 2000 and Q1 2001 Results”. www.pwcmoneytree.com/index.asp
PricewaterhouseCoopers (2002),“MoneyTree Survey – Q4 2001 Highlights”. www.pwcmoneytree.com
Reed Electronics Research (2001),Yearbook of World Electronics Data 2001, Vol. 1-2, Sutton, United Kingdom.
Semiconductor Industry Association (SIA) (2001a),“Global Billings Report History”. www.sia-online.org
Semiconductor Industry Association (SIA) (2001b),“Semiconductor Forecast Summary: 2001-2004”, November. www.sia-online.org
Statistics Denmark (2001),Information Society Denmark – A Statistical Mosaic, Copenhagen.
Statistics Netherlands (2001),De Digitale Economie 2001, Voorburg/Heerlen.
United States Department of Commerce (2002),Digital Economy 2002, Economics and Statistics Administration, February. www.esa.doc.gov/508/esa/DIGITALECONOMY2002.htm
Van Ark, B. (2001),“The Renewal of the Old Economy: An International Comparative Perspective”, STI Working Paper 2001/5,OECD, Paris. www.oecd.org/sti
World Information Technology and Services Alliance (WITSA)/International Data Corporation (IDC) (2002),Digital Planet 2002.
World Trade Organization (WTO) (2002),“Trade to Pick Up Slightly in 2002 After Sharp Drop in 2001”, Press Release, 2 May. www.wto.org/english/news_e/pres02_e/pr288_e.htm
© OECD 2002

79
Chapter 2
GLOBALISATION OF THE ICT SECTOR
ICT firms are a dynamic and leading part of the wider globalisation of industry. Industrialglobalisation refers to an evolving pattern of cross-border collaboration for product development,investment, production, sourcing, marketing and trade. It is the result of firms’ strategies to exploit theircompetitive advantages at international level, locate in final markets and take advantage of favourableproduction factors and infrastructures. New trends and combinations of trade, investment and inter-firmcollaboration are changing the pattern and scope of business and expanding the presence andincreasing the influence of foreign companies in national economies. These international activitiesenable firms to exploit their technological and organisational advantages, reduce business costs, enternew markets and spread risks.
Underlying the international expansion of firms, and in part driven by it, are technologicaladvances, especially in information and communication technologies (ICT), the liberalisation of marketsand increased mobility of capital and other production factors. Globalisation is fundamentally firm-driven. In the past, international strategies were based on exports or multi-domestic operations. Thesehave given way to strategies based on a mix of cross-border operations, including exports and sourcing,foreign investment and international alliances. Globalisation thus has three main routes: internationaltrade, foreign direct investment (FDI) and various kinds of international alliances, collaboration andco-operation.
On any measure, the world economy is rapidly globalising. Between 1990 and 2000, OECDmerchandise trade grew by 7.6% a year, significantly faster than gross domestic product (GDP). Trade inservices grew faster still. Worldwide, FDI inflows reached USD 1.3 trillion in 2000, and accounted for 20%of global gross domestic capital formation, compared with 2% 20 years earlier (UNCTAD, 2001). Grossproduct associated with international production and foreign affiliate sales worldwide increased fasterthan GDP and global exports, respectively, and sales by foreign affiliates – worth USD 15.7 trillionin 1999, compared with USD 3 trillion in 1980 – were twice as high as global exports. The gross productassociated with international production is about one-tenth of global GDP, compared with one-twentieth in 1982. The number of transnational parent firms in 15 developed countries increased fromaround 7 000 at the end of the 1960s to 40 000 at the end of the 1990s (UNCTAD, 2001).
This chapter examines the globalisation of the ICT-producing sector. Drawing on official industryand trade sources, it looks at quantitative indicators of the globalisation of ICT industries and markets.This leads to a brief exploration of some of the issues involved in the globalisation of the ICT sector andpossible implications for the further development of the sector.1
Globalisation of the ICT sector
This section presents a variety of quantitative indicators of the globalisation of the ICT-producingsector in order to highlight major trends and developments. It demonstrates that the ICT sector hasbeen, and remains, at the forefront of industrial globalisation.
© OECD 2002

OECD Information Technology Outlook 2002
80
Trade
Over the last 20 years or so, the overall pattern of world trade has changed owing to the rapidgrowth of exporting economies, notably in East Asia, and to the spread of high-technology industriesacross developed economies. In addition to the increasing intensity of trade, a key feature ofthis transformation has been the development of global sourcing (i.e. international purchasing ofintermediate inputs) both within firms and between firms in the same industry (i.e. intra-firm and intra-industry trade). This section explores these features of the globalisation of the ICT sector.2
ICT trade is growing faster than total trade
In the past decade, trade in high-technology industries has accelerated, and their share in totalOECD trade has increased. At the end of the 1990s, high-technology industries accounted for 25% ofOECD manufacturing trade, compared with 18% in 1990 (OECD, 2001c). The three industries with thehighest growth rates were pharmaceuticals, radio, television and communication equipment andcomputers. Six of the seven fastest-growing manufactures in world trade over the period 1980-95 weretypes of ICT equipment. The top four accounted for one-third of the value of dynamic exports in 1995and for 37% of the growth in value since 1980 (UNCTAD, 1999, p. 229).
In 1990, ICT products (including computer and communication equipment and electroniccomponents – see Annex 1 for definitions) accounted for 6.5% of OECD merchandise trade. By 2000,they accounted for more than 12%.3 Trade in ICT products showed a compound annual growth rate of13.8% a year over the period 1990-2000, compared with growth of 6.5% in total merchandise trade(Figure 1). Trade in software products has also grown, from USD 10.7 billion in 1996 to USD 12.7 billionin 2000. Exports of software products from OECD countries increased at a compound annual rate of 3.5%between 1996 and 2000, while imports of software products into OECD countries increased at 5.7%. Thevalue of software royalties received and paid by countries is another indicator of the magnitude ofsoftware trade. Information available for the United States shows that the inflow of software royaltiesinto the United States tripled between 1992 and 1998 from USD 1.1 billion to USD 3.2 billion (OECD,2001d; see also Chapter 3). Similarly, software royalty and license fee payments into Australia doubledfrom AUD 172 million in 1993-94 to AUD 346 million in 2000-01 (Houghton, 2001).4
Figure 1. OECD trade: total and ICT products, 1990-2000Index 1990 = 100
Note: OECD total does not include Luxembourg. 1990 data do not include Belgium, the Czech Republic, Hungary, Korea, Poland and theSlovak Republic. Based on 1999 instead of 2000 data for Greece and the Slovak Republic.
Source: OECD, ITS database, January 2002.
400
50
350
300
250
200
150
100
400
50
350
300
250
200
150
100
1990 1991 1992 1993 1994 1995 1996 1997 1998 1999 2000
Total ICT trade Total merchandise trade
400
50
350
300
250
200
150
100
400
50
350
300
250
200
150
100
1990 1991 1992 1993 1994 1995 1996 1997 1998 1999 2000
Total ICT trade Total merchandise trade
400
50
350
300
250
200
150
100
400
50
350
300
250
200
150
100
1990 1991 1992 1993 1994 1995 1996 1997 1998 1999 2000
Total ICT trade Total merchandise trade
© OECD 2002

Globalisation of the ICT Sector
81
Trade in ICT-related services also appears to be growing faster than total trade in services. OECDtrade in combined communications and computer and information services increased from aroundUSD 29 billion in 1995 to more than USD 49 billion in 2000, and their combined share of total servicestrade increased from 3.1% to 4.3%. ICT products clearly account for an increasing share of OECDmerchandise trade and, despite limited data, it seems that trade in software and in ICT-related servicesrepresents an increasing share of total services trade. In that sense, the ICT sector is globalising fasterthan many other sectors.
ICT trade is growing faster than sales
ICT trade grew faster than ICT spending in the 1990s. Not only is the ICT sector highly globalisedrelative to other sectors, a comparison of national data on ICT spending by category with ICT-relatedtrade data suggests that it is also becoming increasingly globalised.
Spending on information technology (IT) hardware in OECD countries increased from USD 193 billionin 1992 to USD 362 billion in 2000, or by a compound annual rate of 8.2% (Figure 2). World spending on IThardware increased by 8.8% a year over the same period. In comparison, OECD trade in ICT equipment(computer and communication equipment and electronic components) increased by a compound annualrate of 15.5%. Between 1992 and 2000, OECD ICT equipment trade increased by 159%, OECD spending onICT hardware increased by 88%, and world spending on ICT hardware increased by 96%.
Spending on IT services in OECD countries increased from USD 227 billion in 1995 toUSD 372 billion in 2000, or by a compound annual rate of 10.4% (Figure 3). World spending on ITservices increased by a compound annual rate of 10.7% over the period. By comparison, OECD trade incomputer and information services increased from USD 9.4 billion in 1995 to USD 24.5 billion in 2000, orby a compound annual rate of 21%. Between 1995 and 2000, OECD trade in computer and informationservices increased by 158%, OECD spending on IT services by 64% and world spending on IT services by66%. Clearly, IT-related trade is growing faster than IT spending, an indication that the IT sector isbecoming increasingly globalised.
Figure 2. Spending on ICT hardware and trade, 1992-2000Index 1992 = 100
Note: IDC spending data do not include Luxembourg and Iceland. IT hardware does not include office equipment. OECD 1990 trade data do notinclude Belgium, the Czech Republic, Hungary, Korea, Poland and the Slovak Republic. Based on 1999 instead of 2000 for Greece and theSlovak Republic.
Source: OECD, ITS database, January 2002; IDC.
350
50
300
250
200
150
100
350
50
300
250
200
150
100
1992 1993 1994 1995 1996 1997 1998 1999 2000
OECD merchandise tradeOECD ICT equipment tradeOECD IT hardware spending
350
50
300
250
200
150
100
350
50
300
250
200
150
100
1992 1993 1994 1995 1996 1997 1998 1999 2000
OECD merchandise tradeOECD ICT equipment tradeOECD IT hardware spending
350
50
300
250
200
150
100
350
50
300
250
200
150
100
1992 1993 1994 1995 1996 1997 1998 1999 2000
OECD merchandise tradeOECD ICT equipment tradeOECD IT hardware spending
© OECD 2002

OECD Information Technology Outlook 2002
82
ICT trade is growing faster than production
Reed Electronics Research publishes data on world production and trade in ICT goods. In Europe,overall electronics trade increased at a compound annual rate of 9.4% between 1992 and 1999, whileEuropean production of electronics increased by 4.2%. Similarly, Asia-Pacific trade in electronicsincreased by a compound annual rate of 10.8% and regional production by 6.5% (Reed ElectronicsResearch, various years). In both Europe and the Asia-Pacific region, ICT trade is growing faster than ICTproduction (see Annex Table 2.1).
Specialisation in ICT production
Rationalisation of production at world level might be expected to lead to countries becoming morespecialised in the production of a smaller and more defined range of products and services,i.e. globalisation and specialisation would go hand in hand. The share of manufactured exportsaccounted for by ICTs is one indicator of the level of specialisation in ICT production.
Countries vary significantly in this respect. Throughout the 1990s, ICT equipment’s share of totalmerchandise trade was highest in Ireland, with ICTs accounting for 22% of trade in 1990 and 32% in 2000.Iceland has been at the opposite end of the scale, with ICTs accounting for 0.06% of trade in 1990 and0.08% in 2000 (Figure 4). Generally, OECD countries that specialised in ICT manufacture at the end ofthe decade also did at the beginning. However, rankings and levels have changed. Mexico, Greece(albeit from a very low base), Finland and the Netherlands most rapidly increased their level ofspecialisation in ICT manufacturing. Italy was the only country whose level of ICTs in exports was lowerin 2000 than in 1990, although Australia and Japan had lower levels of ICTs in total exports in 2000 thanin 1995.
Perhaps a more direct indicator of specialisation and the globalisation of a country’s ICTmanufacturing sector is the ratio of ICT exports to GDP, which indicates how important those exports arein the industrial structure. Again, Ireland’s economy is strongly oriented to ICT production for export,with ICT equipment exports equivalent to 26% of GDP in 2000 (Figure 5), followed by Hungary (11.5%),
Figure 3. Spending on IT services and trade, 1995-2000Index 1995 = 100
Note: IDC spending data do not include Luxembourg and Iceland. IT services does not include internal spending. OECD 1990 trade data do notinclude Belgium, the Czech Republic, Hungary, Korea, Poland and the Slovak Republic. Based on 1999 instead of 2000 for Greece and theSlovak Republic.
Source: OECD/Eurostat (2001); IDC.
300
50
250
200
150
100
300
50
250
200
150
100
1995 1996 1997 1998 1999 2000
OECD services tradeOECD IT services tradeOECD IT services spending
300
50
250
200
150
100
300
50
250
200
150
100
1995 1996 1997 1998 1999 2000
OECD services tradeOECD IT services tradeOECD IT services spending
300
50
250
200
150
100
300
50
250
200
150
100
1995 1996 1997 1998 1999 2000
OECD services tradeOECD IT services tradeOECD IT services spending
© OECD 2002
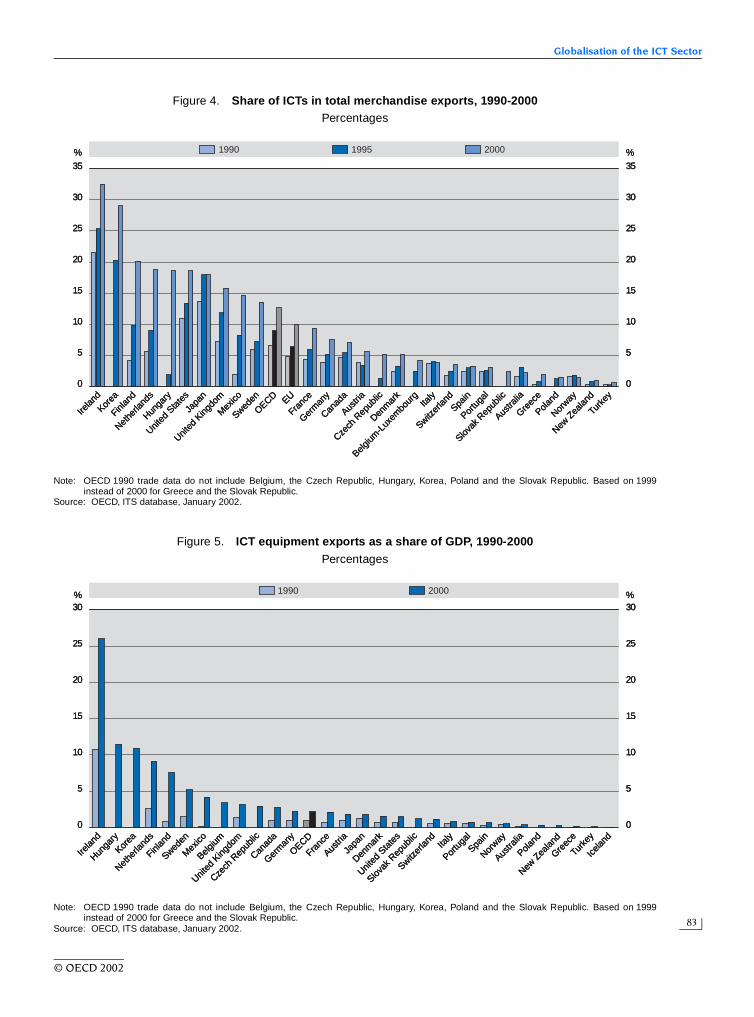
Globalisation of the ICT Sector
83
Figure 4. Share of ICTs in total merchandise exports, 1990-2000Percentages
Note: OECD 1990 trade data do not include Belgium, the Czech Republic, Hungary, Korea, Poland and the Slovak Republic. Based on 1999instead of 2000 for Greece and the Slovak Republic.
Source: OECD, ITS database, January 2002.
35
30
20
15
10
5
0
25
35
30
20
15
10
5
0
25
1990 1995 2000% %
Irelan
d
Hunga
ry
Japa
nEU
Denm
ark
Belgium
-Lux
embo
urg
Italy
Greec
e
Norway
Franc
e
Korea
Finlan
d
Nethe
rland
s
United
Sta
tes
United
King
dom
Mex
ico
Sweden
OECD
Germ
any
Canad
a
Austri
a
Czech
Rep
ublic
Switzer
landSpa
in
Portu
gal
Slovak
Rep
ublic
Austra
lia
Poland
New Z
ealan
d
Turk
ey
35
30
20
15
10
5
0
25
35
30
20
15
10
5
0
25
1990 1995 2000% %
Irelan
d
Hunga
ry
Japa
nEU
Denm
ark
Belgium
-Lux
embo
urg
Italy
Greec
e
Norway
Franc
e
Korea
Finlan
d
Nethe
rland
s
United
Sta
tes
United
King
dom
Mex
ico
Sweden
OECD
Germ
any
Canad
a
Austri
a
Czech
Rep
ublic
Switzer
landSpa
in
Portu
gal
Slovak
Rep
ublic
Austra
lia
Poland
New Z
ealan
d
Turk
ey
Figure 5. ICT equipment exports as a share of GDP, 1990-2000Percentages
Note: OECD 1990 trade data do not include Belgium, the Czech Republic, Hungary, Korea, Poland and the Slovak Republic. Based on 1999instead of 2000 for Greece and the Slovak Republic.
Source: OECD, ITS database, January 2002.
30
20
15
10
5
0
25
30
20
15
10
5
0
25
1990 2000% %
Irelan
d
Finlan
d
Mex
ico
Germ
any
United
Sta
tes
Slovak
Rep
ublic
Switzer
land
Poland
Greec
e
OECD
Hunga
ry
Korea
Nethe
rland
s
Sweden
Belgium
United
King
dom
Czech
Rep
ublic
Canad
a
Franc
e
Austri
a
Japa
n
Denm
ark
Italy
Portu
gal
Spain
Norway
Austra
lia
New Z
ealan
d
Turk
ey
Icelan
d
30
20
15
10
5
0
25
30
20
15
10
5
0
25
1990 2000% %
Irelan
d
Finlan
d
Mex
ico
Germ
any
United
Sta
tes
Slovak
Rep
ublic
Switzer
land
Poland
Greec
e
OECD
Hunga
ry
Korea
Nethe
rland
s
Sweden
Belgium
United
King
dom
Czech
Rep
ublic
Canad
a
Franc
e
Austri
a
Japa
n
Denm
ark
Italy
Portu
gal
Spain
Norway
Austra
lia
New Z
ealan
d
Turk
ey
Icelan
d
© OECD 2002

OECD Information Technology Outlook 2002
84
Korea (10.9%) and the Netherlands (9.1%). These countries also had the highest ratio of trade in ICTequipment (defined as the average of ICT equipment imports and exports) to GDP. Interestingly, thecountries that were already the most specialised increased their ratio of ICT equipment exports to GDPfaster than others (i.e. they became increasingly specialised). Mexico recorded the fastest growth in theratio over the period 1990-2000. Finland, Sweden and the Netherlands also experienced rapid growth.
An examination of the share of ICT trade (defined as the average of ICT imports and ICT exports) intotal manufacturing trade emphasises specialisation in ICT production for export by focusing on intra-industry and intra-firm trade (Figure 6). Again, Ireland had the highest share of ICTs in total merchandisetrade in 2000, at 32%. It is clear that some of the more specialised producers of ICT equipment forexport in the early 1990s increased their levels of specialisation more rapidly than others (e.g. Ireland,the Netherlands, Hungary, Finland, Mexico and Sweden).
Indicators of ICT trade performance
The ratio of exports to imports is an indicator of how well a country is performing as a producer andexporter. A ratio of more than one indicates a surplus of exports over imports, and a ratio of less than onea deficit. In 2000, Finland, Japan, Ireland, Korea and Sweden had surpluses of ICT equipment exports overimports (see Figure 7). All other OECD countries had an export/import ratio of less than one.
Another way to look at specialisation in ICT equipment manufacture for trade is to calculate anindex of “revealed comparative advantage” to see whether an industry performs better or worse in eachcountry than the average across the OECD.5 Such an indicator shows that ten OECD countries had acomparative advantage in ICT manufacturing in 2000: Ireland, Korea, Finland, the Netherlands, Hungary,the United States, Japan, the United Kingdom, Mexico and Sweden (see Figure 8). Ireland (2.58) andKorea (2.30) had the greatest advantage in ICT manufacturing, with the other eight countries havingindexes ranging from 1.07 (Sweden) to 1.60 (Finland). There have been some interesting changes in the
Figure 6. ICT equipment trade as a share of total trade, 1990-2000Percentages
Note: OECD 1990 trade data do not include Belgium, the Czech Republic, Hungary, Korea, Poland and the Slovak Republic. Based on 1999instead of 2000 for Greece and the Slovak Republic.
Source: OECD ITS database, January 2002.
1990 1995
35
25
15
10
0
20
5
30
2000
35
25
15
10
0
20
5
30
% %
Irelan
d
Hunga
ry
Japa
n
Fran
ce Italy
Switzer
land
Poland
New Z
ealan
d
Germ
any
Korea
Finlan
d
Nethe
rland
s
United
Sta
tes
United
King
dom
Mex
ico
Sweden
OECD
Canad
a
Austri
a
Czech
Rep
ublic
Denm
ark
Spain
Portu
gal
Slovak
Rep
ublic
Austra
lia
Greec
e
Icelan
d
Turke
yEU
Belgium
© OECD 2002
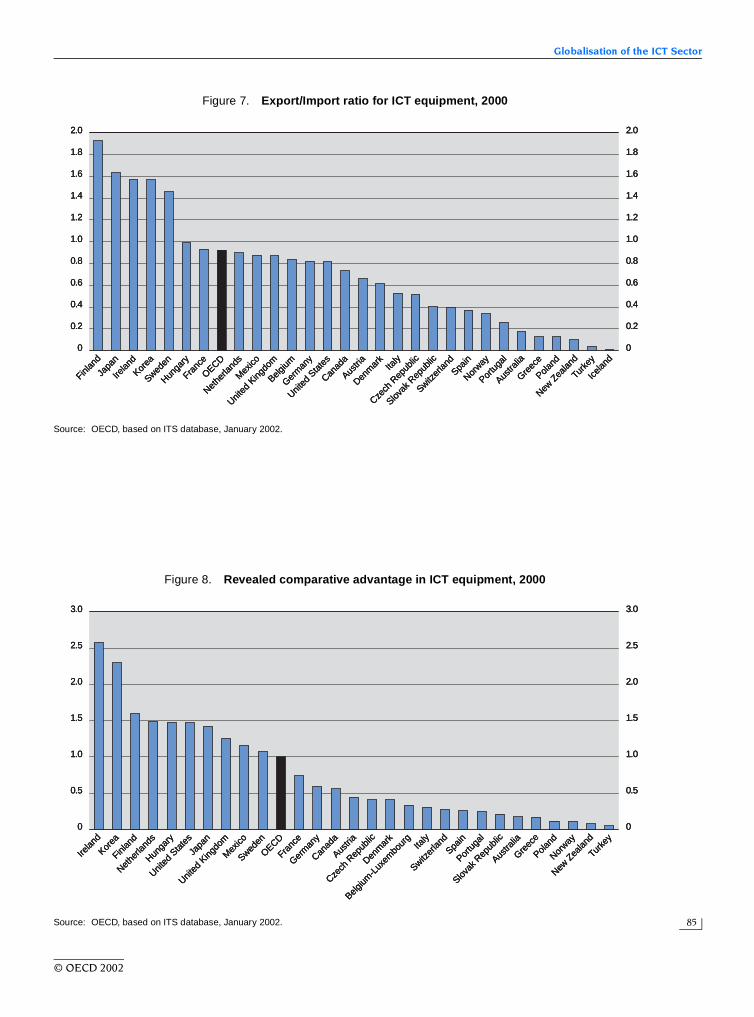
Globalisation of the ICT Sector
85
Figure 7. Export/Import ratio for ICT equipment, 2000
Source: OECD, based on ITS database, January 2002.
2.0
1.8
1.4
1.2
1.0
0.8
0
1.6
0.6
0.4
0.2
2.0
1.8
1.4
1.2
1.0
0.8
0
1.6
0.6
0.4
0.2
Finlan
d
Sweden
Franc
e
Belgium Ita
ly
Czech
Rep
ublic
Slovak
Rep
ublic
Greec
e
New Z
ealan
d
Germ
any
Japa
n
Irelan
d
Korea
Hunga
ry
OECD
Nethe
rland
s
Mex
ico
United
King
dom
United
Sta
tes
Canad
a
Austri
a
Denm
ark
Switzer
landSpa
in
Norway
Portu
gal
Austra
lia
Poland
Turk
ey
Icelan
d
2.0
1.8
1.4
1.2
1.0
0.8
0
1.6
0.6
0.4
0.2
2.0
1.8
1.4
1.2
1.0
0.8
0
1.6
0.6
0.4
0.2
Finlan
d
Sweden
Franc
e
Belgium Ita
ly
Czech
Rep
ublic
Slovak
Rep
ublic
Greec
e
New Z
ealan
d
Germ
any
Japa
n
Irelan
d
Korea
Hunga
ry
OECD
Nethe
rland
s
Mex
ico
United
King
dom
United
Sta
tes
Canad
a
Austri
a
Denm
ark
Switzer
landSpa
in
Norway
Portu
gal
Austra
lia
Poland
Turk
ey
Icelan
d
Figure 8. Revealed comparative advantage in ICT equipment, 2000
Source: OECD, based on ITS database, January 2002.
3.0
2.5
1.5
1.0
0
2.0
0.5
3.0
2.5
1.5
1.0
0
2.0
0.5
Irelan
d
Hunga
ry
Japa
n
Franc
e
Belgium
-Lux
embo
urg
Italy
Switzer
land
Poland
New Z
ealan
d
Germ
any
Korea
Finlan
d
Nethe
rland
s
United
Sta
tes
United
King
dom
Mex
ico
Sweden
OECD
Canad
a
Austri
a
Czech
Rep
ublic
Denm
ark
Spain
Portu
gal
Slovak
Rep
ublic
Austra
lia
Greec
e
Norway
Turk
ey
3.0
2.5
1.5
1.0
0
2.0
0.5
3.0
2.5
1.5
1.0
0
2.0
0.5
Irelan
d
Hunga
ry
Japa
n
Franc
e
Belgium
-Lux
embo
urg
Italy
Switzer
land
Poland
New Z
ealan
d
Germ
any
Korea
Finlan
d
Nethe
rland
s
United
Sta
tes
United
King
dom
Mex
ico
Sweden
OECD
Canad
a
Austri
a
Czech
Rep
ublic
Denm
ark
Spain
Portu
gal
Slovak
Rep
ublic
Austra
lia
Greec
e
Norway
Turk
ey
© OECD 2002
OECD Information Technology Outlook 2002
86
index of comparative advantage during the last decade. Mexico, Greece and Finland have experiencedlarge increases since 1990, with the largest percentage increase in Finland. Ireland and Japan havesuffered the largest declines, with the largest percentage falls in Italy, Portugal, Norway and Japan.
Intra-industry trade
Traditional economic theory suggests that trade is based on factor endowment and comparativeadvantage, with countries specialising in producing those things for which they possess relativelyabundant factors and comparative advantage and trading them for products of different industries.Recently, however, developed countries have increasingly traded products of the same industries.Intra-industry trade tends to enhance the gains from trade through specialisation in a limited number ofproducts within any particular industry, through better exploitation of economies of scale and sourcingand intra-firm exchange of products (Ruffin, 1999). Intra-industry trade is a consequence of the globalrationalisation of production (i.e. globalisation).
The most widely used measure of intra-industry trade is the Grubel-Lloyd Index (Grubel andLloyd, 1975). The index represents the fraction of total trade in the industry accounted for by intra-industry trade, expressed as a percentage (Annex Table 2.2).6 The closer the values of imports andexports the higher the index. Because the ICT equipment trade categories used here include bothequipment and components, they approximate the inputs and outputs of the ICT-producing sector.Although they are at a relatively high level of aggregation, they can be used to construct a Grubel-LloydIndex. The index has a number of limitations, which are especially noticeable where trade is either verylarge (e.g. United States) or very small (e.g. Iceland). Nevertheless, it does reveal something about theglobalisation of the ICT sector.
In general, the ICT equipment-producing sector appears to be becoming more specialised, withhigher levels of intra-industry trade at the end of the 1990s than at the beginning. For most OECDcountries, the level of intra-industry trade increased during the 1990s, although in a few cases it waslower in 2000 than in the mid 1990s.
Intra-firm trade
Intra-firm trade consists of cross-border transactions between affiliated units of multinationalcompanies (MNCs). The level and growth of intra-firm trade as a share of total trade reflects the searchby MNCs for greater efficiency and the consequent rationalisation of production at global level. Highand increasing levels of intra-firm trade are an indicator of globalisation.
The United States is one of the few countries to report intra-firm trade in any detail. In 2000, intra-firm trade accounted for 47% of the total value of merchandise imports into the United States and 32% ofthe value of merchandise exports (see Annex Table 2.3). Figure 9 shows that total US cross-border andintra-firm services sales rose over the 1990s. The ratio of goods traded by related parties varies fromhighs of 74% for US imports from Japan and 42% of exports to Canada, to lows of 16% for imports fromArgentina and 11% for exports to Korea.
Limited data are available on intra-firm trade in the ICT sector. US data on ICT products andservices trade between related parties show that the ICT sector is characterised by relatively high levelsof intra-firm trade (Table 1). Clearly, intra-firm trade is becoming increasingly significant, and ICTproducers are at the forefront. Intra-firm trade in all ICT goods industries accounts for a larger share ofUS imports than it does of exports.
Foreign direct investment
In recent years, trade has become less important as an avenue for globalisation as a new andevolving pattern of cross-border business activity is emerging. Recent modes of globalisation includeFDI,7 cross-border mergers and acquisitions (M&As)8 and strategic alliances.9 Each plays an importantpart in the increasing globalisation of production. The remainder of this chapter explores each of theseforms of internationalisation and examines the resulting activities of foreign affiliates in host economies.
© OECD 2002

Globalisation of the ICT Sector
87
FDI has played a fundamental role in furthering international economic integration and has been adriving force behind world economic restructuring over the past 15 years. World FDI inflows, whichaccounted for 2.3% of global gross domestic capital formation in 1980, reached almost 20% in 2000 (seeAnnex Table 2.4). As many as 65 countries had compound annual growth in FDI of 30% or morebetween 1986 and 2000, and a further 29 had rates of 20% or more. In 2000, world FDI inflows reachedUSD 1.3 trillion, up from USD 202 billion in 1990. World FDI inflows rose more rapidly between 1990and 2000 (20% compound annual growth) than GDP (4%), domestic investment (3.7%), licensingpayments (9%) and trade (5%) (UNCTAD, 2001).
FDI inflows to OECD countries grew from USD 138 billion in 1988 to USD 684 billion in 1999, andoutflows rose from USD 175 billion to USD 768 billion (Figure 10). FDI inflows accounted for 0.93% ofOECD GDP in 1988 and outflows for 1.18%, compared with 2.8% and 3.2%, respectively, in 1999. Hence,FDI has grown more quickly than GDP both worldwide and among OECD countries, with particularlyhigh rates of growth in the latter halves of the 1980s and 1990s.
Figure 9. US cross-border and intra-firm services sales, 1990-99USD billions
Source: Mann and Borga (2001).
350
0
300
250
200
150
100
50
1990 1991 1992 1993 1994 1995 1996 1997 1998 1999
350
0
300
250
200
150
100
50
Cross-border exports Sales by US affiliates Cross-border imports Sales by foreign affiliates
350
0
300
250
200
150
100
50
1990 1991 1992 1993 1994 1995 1996 1997 1998 1999
350
0
300
250
200
150
100
50
Cross-border exports Sales by US affiliates Cross-border imports Sales by foreign affiliates
350
0
300
250
200
150
100
50
1990 1991 1992 1993 1994 1995 1996 1997 1998 1999
350
0
300
250
200
150
100
50
Cross-border exports Sales by US affiliates Cross-border imports Sales by foreign affiliates
Table 1. US intra-firm trade by industry, 2000USD millions and percentage shares
Note: ICT sector based on 4-digit NAICS.Source: US Department of Commerce, June 2001.
US imports US exports
Total importsRelated party
tradeShare Total exports
Related party trade
Share
All industries 1 205 339 563 084 46.7 779 624 245 863 31.5Computer equipment 68 542 46 603 68.0 44 247 17 581 39.7Communication equipment 30 998 21 293 68.7 18 965 5 184 27.3Audio and video equipment 28 701 20 522 71.5 4 165 1 476 35.4Electronic components 98 157 63 133 64.3 65 180 25 751 39.5Magnetic and optical media 2 762 1 631 59.1 1 717 724 42.2ICT products 229 160 153 182 66.8 134 274 50 716 37.8ICT share of total 19.0 27.2 . . 17.2 20.6 . .
© OECD 2002
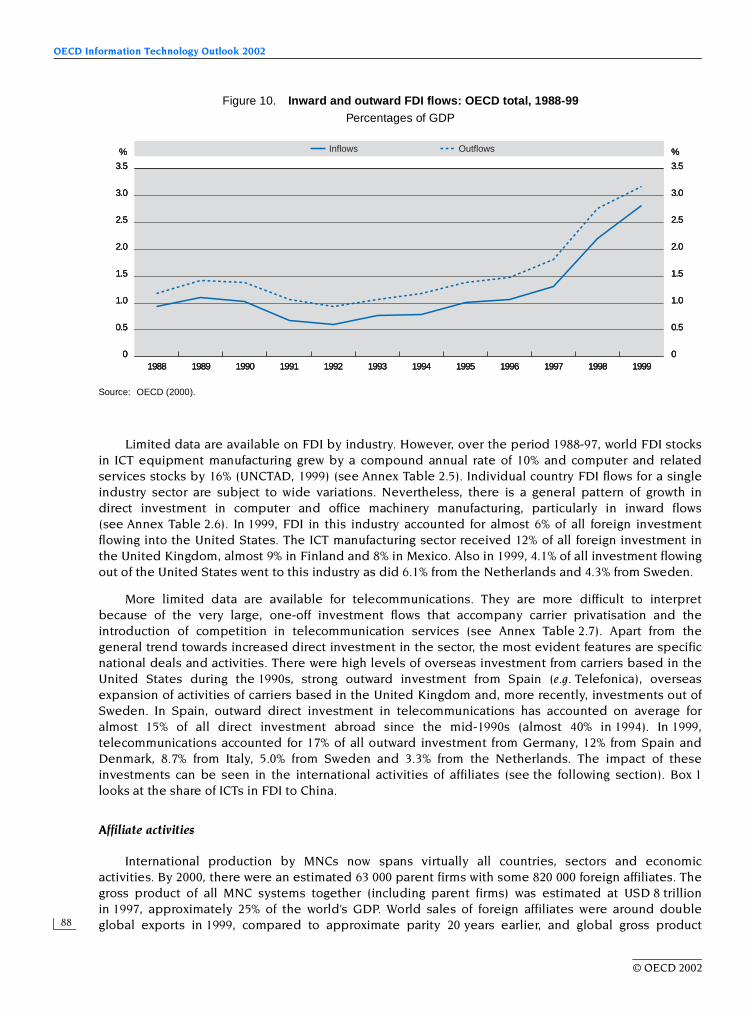
OECD Information Technology Outlook 2002
88
Limited data are available on FDI by industry. However, over the period 1988-97, world FDI stocksin ICT equipment manufacturing grew by a compound annual rate of 10% and computer and relatedservices stocks by 16% (UNCTAD, 1999) (see Annex Table 2.5). Individual country FDI flows for a singleindustry sector are subject to wide variations. Nevertheless, there is a general pattern of growth indirect investment in computer and office machinery manufacturing, particularly in inward flows(see Annex Table 2.6). In 1999, FDI in this industry accounted for almost 6% of all foreign investmentflowing into the United States. The ICT manufacturing sector received 12% of all foreign investment inthe United Kingdom, almost 9% in Finland and 8% in Mexico. Also in 1999, 4.1% of all investment flowingout of the United States went to this industry as did 6.1% from the Netherlands and 4.3% from Sweden.
More limited data are available for telecommunications. They are more difficult to interpretbecause of the very large, one-off investment flows that accompany carrier privatisation and theintroduction of competition in telecommunication services (see Annex Table 2.7). Apart from thegeneral trend towards increased direct investment in the sector, the most evident features are specificnational deals and activities. There were high levels of overseas investment from carriers based in theUnited States during the 1990s, strong outward investment from Spain (e.g. Telefonica), overseasexpansion of activities of carriers based in the United Kingdom and, more recently, investments out ofSweden. In Spain, outward direct investment in telecommunications has accounted on average foralmost 15% of all direct investment abroad since the mid-1990s (almost 40% in 1994). In 1999,telecommunications accounted for 17% of all outward investment from Germany, 12% from Spain andDenmark, 8.7% from Italy, 5.0% from Sweden and 3.3% from the Netherlands. The impact of theseinvestments can be seen in the international activities of affiliates (see the following section). Box 1looks at the share of ICTs in FDI to China.
Affiliate activities
International production by MNCs now spans virtually all countries, sectors and economicactivities. By 2000, there were an estimated 63 000 parent firms with some 820 000 foreign affiliates. Thegross product of all MNC systems together (including parent firms) was estimated at USD 8 trillionin 1997, approximately 25% of the world’s GDP. World sales of foreign affiliates were around doubleglobal exports in 1999, compared to approximate parity 20 years earlier, and global gross product
Figure 10. Inward and outward FDI flows: OECD total, 1988-99Percentages of GDP
Source: OECD (2000).
3.5
0
3.0
2.5
2.0
1.5
1.0
0.5
1988 1991 1992 1993 1994 1995 1996 1997 1998 1999
3.5
0
3.0
2.5
2.0
1.5
1.0
0.5
1989 1990
%% Inflows Outflows
3.5
0
3.0
2.5
2.0
1.5
1.0
0.5
1988 1991 1992 1993 1994 1995 1996 1997 1998 1999
3.5
0
3.0
2.5
2.0
1.5
1.0
0.5
1989 1990
%% Inflows Outflows
3.5
0
3.0
2.5
2.0
1.5
1.0
0.5
1988 1991 1992 1993 1994 1995 1996 1997 1998 1999
3.5
0
3.0
2.5
2.0
1.5
1.0
0.5
1989 1990
%% Inflows Outflows
© OECD 2002

Globalisation of the ICT Sector
89
attributed to foreign affiliates was around 10% of global GDP, compared to 5% in 1982 (see AnnexTable 2.8). Moreover, global sales and gross product associated with international production haveincreased faster than global exports and GDP, by 3.2 percentage points and 4.1 percentage points,respectively, during the period 1982-99. Global sales of foreign affiliates are now worth more than twicethe value of world exports of goods and services (UNCTAD, 2000, 2001).
The ICT sector is a significant part of this process. In 1999, 21 of the top 100 MNCs were in the ICTsector, 18 in electronics and related manufacturing and three in telecommunications. They held foreignassets worth in excess of USD 500 billion, recorded foreign affiliate sales in excess of USD 450 billion
Box 1. ICTs in the evolving profile of FDI in China
China’s portfolio of FDI has evolved over the past two decades. Inflows concentrated in labour-intensive industries in the 1980s and moved towards capital-intensive ones in the early 1990s. In recentyears, technology-intensive industries have been attracting an increasing share. The old image of a Chinaat a relatively low level of the value chain is giving way to that of a rising competitive location for thetechnology-intensive activities of multinational corporations.
Nearly 400 of the Fortune 500 firms have invested in over 2 000 projects in China. The world’sleading manufacturers of computers, electronics, telecommunication equipment, pharmaceuticals,petrochemicals and power-generating equipment have extended their production networks there. Morerecently, R&D activities have emerged as a bright spot for FDI, with over 100 R&D centres established byMNCs. Microsoft, Motorola, GE, JVC, Lucent-Bell, Samsung, Nortel, IBM, Intel, Ericsson, Nokia, Panasonic,Mitsubishi, AT&T and Siemens all have R&D facilities in China. Motorola, for example, has established R&Dcentres, with a USD 200 million investment and 650 research personnel. Microsoft invested USD 80 millionin a Chinese research institute and has announced the investment of a further USD 50 million to create aMicrosoft Asian Technology Centre in Shanghai. The need to adapt technology to the huge local market hasbeen one of the push factors. The availability of extensive hard and soft R&D infrastructure (particularlywell-educated and hardworking researchers at low costs, including many graduates returning from abroad)is the main pull factor. In addition, the government has introduced policy measures to reform the nationalscience and technology system and promote self-sustained and market-oriented research institutions. As aresult, Chinese R&D institutions actively seek partnerships with MNCs.
The prominence of FDI in technology-intensive industries is also evident in China’s foreign trade (seetable). Exports of new high-technology products by foreign affiliates increased from USD 4.5 billionin 1996 to USD 29.8 billion in 2000. They accounted for 25% of total exports by foreign affiliates, and 81% ofthe country’s total exports in high-technology products. Since the second half of the 1990s, China hassignificantly reduced its imports of complete sets of advanced equipment and is now relying more andmore on FDI to acquire foreign technology. In fact, FDI has become the engine of growth of China’shigh-technology exports and an essential means of inward technology transfer.
Source: UNCTAD (2001).
Exports of high-technology products from China by ownership of production, 1996-2000
Note: SOEs = state-owned enterprises.Source: UNCTAD (2001), p. 26.
Total USD millions SOEs (%) Affiliates (%)
1996 7 681 39 591997 16 310 . . . .1998 20 251 25 741999 24 704 23 762000 37 040 18 81
© OECD 2002

OECD Information Technology Outlook 2002
90
and employed almost 3.9 million worldwide, more than 1.5 million of whom were employed by theirforeign affiliates. These 21 ICT firms account for around 30% of the total assets and employment of thetop 100 MNCs, and about one-fifth of their sales.
ICT sector affiliate activities in OECD countries
Data on affiliate activities in OECD countries are limited (see Annex Tables 2.9-2.14). However,these data indicate that a significant and growing number of affiliated enterprises operate in the ICTsector. During the 1990s, there was more growth in equipment manufacturing in communication thanin IT, as the deregulation of telecommunications services has reduced national monopsony purchasing.For example, the number of majority-owned communication equipment manufacturing enterprisesoperating in Canada increased from 39 in 1990 to 57 in 1998. Similarly, the number of majority-ownedaffiliate communication equipment manufacturing enterprises increased from 1990 to 1998 in Italy,Norway, Sweden, the United Kingdom and the United States. Employment in these foreign affiliates isalso high. In 1998, more than 61 000 were employed in ICT equipment manufacturing affiliates in France,34 000 in Germany, 24 600 in Ireland, almost 47 000 in Italy, and 134 000 in the United Kingdom.
Value added and exports generated by ICT equipment manufacturing affiliates have also beenincreasing. In 1998, their value added reached USD 4.5 billion in France, USD 5 billion in Ireland andalmost USD 11 billion in the United Kingdom. They exported for USD 12.6 billion from France, more thanUSD 2 billion from the Netherlands, USD 950 million from Finland and USD 500 million from Sweden.
ICT equipment manufacturing affiliates also contribute significantly to R&D expenditure. In 1998,they spent USD 500 million on R&D in Canada, more than USD 1 billion in France, USD 120 million inIreland, more than USD 400 million in the United Kingdom and USD 3.3 billion in the United States. Theshare of foreign affiliates in industrial R&D varies widely across countries, ranging from less than 2% inJapan to over 68% in Ireland and 70% in Hungary. At over 30%, the share of R&D conducted by foreignaffiliates is also high in Spain, the Netherlands, the United Kingdom, Canada, Australia and the CzechRepublic. The differences primarily reflect the contribution of foreign affiliates to industrial activity. Forinstance, the share of foreign affiliates in manufacturing production is high in Ireland and low in Japan.The share of foreign affiliates in R&D also reflects the size of their R&D effort relative to that of domesticfirms. In Ireland, for example, foreign affiliates carry out relatively more R&D than national firms. InJapan, the opposite is true (OECD, 2001c, p. 102).
Affiliate activities in the United States
The United States provides detailed data on the activities of affiliates. This section explores thatdata to develop a picture of the extent and nature of ICT sector affiliate activities in a large OECDeconomy (Table 2). In 1998, foreign affiliates in all industries accounted for 22% of all goods exports fromthe United States and 32% of all imports. ICT-sector foreign affiliates operating in the United Statesaccounted for 8% of all foreign affiliate employment in the United States, 7% of affiliate sales, 8% ofaffiliate gross product and 10% of affiliate exports. Finally, 46% of the computer and electronic productsaffiliate sales in the United States were sold by affiliates of Japanese firms and 33% by affiliates ofEuropean firms (see Annex Table 2.15).
Among affiliates of US firms operating abroad in the ICT sector (Table 3), those manufacturingelectronic and electrical equipment overseas accounted for the largest shares of ICT sector affiliatesales in 1998 (30%) and of employment (46%). Those manufacturing computer and office equipmentaccounted for 29% of the sector’s affiliate sales and 15% of employment. Those providingtelecommunication services accounted for 20% of both affiliate sales and employment, while thoseproviding computer and data processing services represented 19% and employed 15%.
In 1998, sales by US affiliates in Europe accounted for 54% of worldwide affiliate sales in allindustry sectors, and those in Japan for just 7% (see Annex Table 2.16). ICT sector affiliates’ sales(USD 185 billion) accounted for 14% of the total in Europe in all sectors and 16% in Japan(USD 30 billion), with 50% of all ICT affiliate sales in Europe and just 8% in Japan. In Europe, computer
© OECD 2002

Globalisation of the ICT Sector
91
and office equipment accounted for 32% of sales, computer and data processing services for 22% andcommunication services for 21%, very similar to the worldwide breakdown (Table 3). By contrast, inJapan, computer and office equipment accounted for less than 4% of US ICT affiliate sales, computer anddata processing services for 56% and communication services for just 8%.
Table 4 shows exports and imports to and from US-based multinational parents and their affiliates.Close to 70% of parents’ ICT products and services exports during 1998 went to their affiliates abroad.US-based multinational computer and office equipment manufacturers shipped 93% of their exports to
Table 2. ICT-sector foreign affiliates operating in the United States, 1998USD millions and thousands of affiliates and employees
. . No data available or suppressed for reasons of confidentiality.Source: US Department of Commerce, 2001.
Affiliates (‘000)
Employees (‘000)
Paymentto
employees
Totalassets
SalesGross
productExports ofaffiliates
Imports byaffiliates
All industries 9 738 5 633 260 661 3 525 885 1 881 865 418 138 150 836 289 679Manufacturing 2 944 2 540 134 886 878 864 834 396 224 372 87 581 126 924
Computers and electronic products 353 283 16 091 81 604 97 391 19 402 14 306 26 771Computers and peripheral equipment 74 36 1 926 9 869 17 303 1 552 1 489 . .Communications equipment 54 85 4 818 23 760 26 685 5 169 4 514 5 906Semiconductors and other electronics 112 72 3 712 19 708 20 718 5 273 3 145 5 402Magnetic and optical media 12 . . . . . . 2 887 . . 313 386ICT share of manufacturing 12 11 12 9 12 9 16 21
ICT services 248 156 9 602 72 287 39 678 14 738 141 151Software publishers 46 14 1 019 7 921 4 635 2 919 31 . .Telecommunications 55 86 4 583 52 099 24 123 7 184 1 . .Information and data processing 39 18 1 062 3 452 3 439 1 588 2 0Computer systems design services 108 39 2 938 8 815 7 481 3 047 107 151
Total ICT sector 601 439 25 693 153 891 137 069 34 140 14 447 26 922ICT share of total 6 8 10 4 7 8 10 9
Table 3. Foreign affiliates of US firms, 1998USD millions, number of affiliates and thousands of employees
. . No data available or suppressed for reasons of confidentiality.Source: US Department of Commerce, 2001.
Affiliates Assets Sales Net incomePayment to employees
Employees
All industries 23 744 4 000 842 2 443 350 155 292 271 386 8 388
Computer and office equipment 173 71 682 105 968 5 737 9 303 262Electronic and other electric equipment 933 90 176 110 418 3 231 14 733 782
Household appliances 65 . . . . . . 1 800 96Audio/video and communication equipment 111 20 191 26 713 594 . . . .Electronic components and accessories 519 46 017 58 052 1 745 6 944 398Electronic and other electric equipment 238 . . . . . . . . . .
Computer and data processing services 844 70 672 70 671 4 097 15 610 250Computer processing and data services 131 11 540 10 818 440 3 637 68Information retrieval services 48 665 1 027 –18 277 5Computer related services, n.e.c. 665 58 468 58 826 3 675 11 696 177
Communication 295 166 555 82 535 3 213 15 011 399Telephone and telegraph communications 183 135 858 72 350 3 686 12 788 333Other communications services 112 30 698 10 185 –473 2 223 66
Total ICT sector 2 245 399 085 369 592 16 278 54 657 1 692
© OECD 2002

OECD Information Technology Outlook 2002
92
overseas affiliates. US-based multinational audio, video and communication equipment manufacturersshipped close to 50% of their exports to affiliates. For their part, overseas affiliates supply a significantproportion of their US-based parent imports. In 1998, 77% of US-based multinational parent imports inthe ICT sector came from their overseas affiliates. Intra-firm trade was particularly significant amongcomputer and office equipment manufacturers, with overseas affiliates supplying more than 90% ofUS-based parent imports, almost the same share as for exports from parents to affiliates.
Affiliate activities in Sweden
Sweden also provides detailed data on the activities of affiliates. This section explores these data inorder to develop a picture of the extent and nature of ICT sector affiliate activities in a much smallercountry. Table 5 shows the number of affiliates of foreign-owned enterprises operating in Sweden in 2000.The ICT sector represented 20% of all enterprises and employed 14% of all employees (see AnnexTable 2.17). The largest employers among foreign affiliates operating in Sweden in 2000 were in softwareconsultancy. In the same year, 95% of all foreign affiliates operating in Sweden’s ICT sector were serviceproviders, 63% were in wholesale activities and 29% in computer services. Just 5% were in manufacturing.Table 6 shows the countries of origin of foreign-owned enterprises in Sweden’s ICT sector.
Affiliates of Swedish ICT sector firms operating abroad employed a total of 210 557 in 1999, ofwhom 77 462 were abroad and 133 095 in Sweden (see Annex Table 2.18). Those employed by Swedishaffiliates abroad in the ICT sector accounted for almost 13% of those employed by Swedish affiliates inall industries. Not surprisingly, communication equipment manufacturing was a major activity ofSwedish affiliates abroad, employing more than 8% of Sweden’s total affiliate employment abroad.
Table 4. US exports and imports associated with US parents and their affiliates, 1998USD millions and percentage shares
1. Partial total.Source: US Department of Commerce, 2001.
US exports US imports
Total by parents
To affiliates ShareTotal
to parentsBy affiliates Share
All industries 438 293 217 153 49.5 355 976 187 610 52.7
Computer and office equipment 36 965 34 273 92.7 30 938 28 401 91.8Audio, video and communication equipment 21 821 10 388 47.6 15 663 7 193 45.9Computer and data processing services 4 655 . . . . . . . . . .Communication services 2 247 469 20.9 . . 60 . .ICT sector1 65 688 45 130 68.7 46 601 35 654 76.5
Table 5. Foreign-owned enterprises in Sweden’s ICT sector, 2000Numbers and percentage shares
Source: ITPS (2001).
Enterprises Employment
Equipment manufacturing 53 15 876Wholesale 680 25 252Computer and related services 309 18 242Renting office machinery 9 133Telecommunication services 35 3 301Total ICT sector 1 086 62 804ICT sector share 20 14
All industries 5 519 446 893
© OECD 2002

Globalisation of the ICT Sector
93
Mergers and acquisitions
Cross-border M&As are now the most common form of FDI. It is generally held that scale, speed andtechnological and regulatory change are among the principal motivations for M&As. M&As allow rapidentry into a market. Scale is often sought as a means of spreading the costs and risks associated with largeR&D investments and rapid technological change, while speed of entry suits industries wheretechnological change is rapid and product life cycles short. Such motivations are present in the ICT sector.
Between 1990 and 2000, cross-border M&As increased at a compound annual rate of 23% worldwideon a value basis.10 The upsurge in both deal value and number of deals was especially significant after themid-1990s (Figure 11). Large-scale cross-border M&As account for the bulk of the increase in the value ofcross-border M&As. Cross-border M&As now account for around 90% of total FDI inflows in value.
Table 6. Country of origin of foreign-owned enterprises in Sweden’s ICT sector, 2000Numbers and percentage shares
Source: ITPS (2001).
ICT sector Share (%)
Enterprises Employment Enterprises Employment
United States 236 17 301 22 28United Kingdom 104 6 157 10 10Switzerland 53 5 807 5 9Finland 114 5 460 10 9France 50 5 199 5 8Netherlands 81 4 397 7 7Germany 118 3 372 11 5Norway 101 3 335 9 5Japan 36 2 079 3 3Denmark 81 1 779 7 3Top ten 974 54 886 90 87Other countries 112 7 918 10 13
Total 1 086 62 804 100 100
Figure 11. ICT and total M&As, 1990-2000Index 1990 = 100
Source: Thomson Financial, 2001.
1 600
0
1 400
1 200
1 000
800
600
400
1990 1991 1992 1993 1994 1995 1996 1997 1998 2000
200
1 600
0
1 400
1 200
1 000
800
600
400
200
1999
ICT M&As (value) Total M&As (value) ICT deals (number) Total deals (number)
1 600
0
1 400
1 200
1 000
800
600
400
1990 1991 1992 1993 1994 1995 1996 1997 1998 2000
200
1 600
0
1 400
1 200
1 000
800
600
400
200
1999
ICT M&As (value) Total M&As (value) ICT deals (number) Total deals (number)
1 600
0
1 400
1 200
1 000
800
600
400
1990 1991 1992 1993 1994 1995 1996 1997 1998 2000
200
1 600
0
1 400
1 200
1 000
800
600
400
200
1999
ICT M&As (value) Total M&As (value) ICT deals (number) Total deals (number)
© OECD 2002
OECD Information Technology Outlook 2002
94
M&A activity in the ICT sector has increased faster than average over the last decade.11 Deal valueincreased by a compound annual rate of 25% between 1990 and 2000, with almost as large an increasein the number of deals (see Annex Table 2.19). In 2000, ICT sector M&A deal value reachedUSD 245 billion, up from USD 27 billion in 1990. Over the decade, the number of (completed) ICT sectorcross-border M&As rose from 86 to 756. The ICT sector increased its share of deals and deal value fromaround 3.5% in the early 1990s to 21% of deal value and 10% of total deals in 2000. Because of very largedeals in telecommunications, the ICT sector accounted for 49% of the value of all cross-border M&Asworldwide in 1999. Over the period 1990-2000, the ICT sector accounted for 22% of the value of all cross-border M&A deals worldwide and 7% of the deals completed. This clearly suggests a larger than averagedeal value and higher than average M&A activity in the sector (see Annex Table 2.20).
ICT M&As by industry
As targets of M&As, ICT services firms are both the main focus of activity and the fastest-growingarea (see Annex Tables 2.21-2.23). There has also been considerable and strongly growing M&A activityin electronic component and other equipment manufacturing and communication equipmentmanufacturing. As acquirers, ICT services firms, especially telecommunications services firms, are boththe most active (in value terms) and the fastest growing group. In fact, the deregulation oftelecommunications, privatisation of infrastructure and the mobile revolution have driven much of theactivity in ICT sector cross-border M&As since the mid-1990s.
Some interesting features emerge from these broad trends. For example, electronic componentand other equipment manufacturing activities represented 45% of all ICT manufacturing inflows in 2000but only accounted for 11% of all ICT manufacturing M&A outflows. Conversely, communicationequipment manufacturers accounted for 83% of M&A outflows and 37% of inflows in 2000. However,vertical M&As do not appear to be a major feature of ICT manufacturing M&A activities. There are somesigns of acquisitions of component manufacturers by communication equipment manufacturers, butmany acquisitions of component manufacturers appear to be by non-specialised ICT producers(conglomerates). Large deals create volatility in the data, but it seems that non-primary ICT firms aremore often acquirers than targets. This suggests that there is a greater tendency for firms operatingaround the edges of the ICT sector, as non-specialist ICT producers, to buy into the ICT sector, thanthere is for ICT firms to buy out, as one would expect for a high-growth sector.
Horizontal M&As accounted for 49% of the value of all deals in the ICT sector over theperiod 1990-2000, ranging from a low of 25% in 1995 to a high of 92% in 1999 (Figure 12). Since 1998, theyhave accounted for 60-90% of all ICT-related M&As by value, owing, in part, to a few very large deals,notably in telecommunications. Nevertheless, they accounted for 41% of all deals in the sector over theperiod 1990-2000, with a low of 34% in 1997 and a high of 51% in 1999. This suggests that scale,technology access and risk spreading may be significant drivers of M&A activity in the sector.
ICT M&As by country
In terms of outflows (see Annex Table 2.24), OECD countries accounted for more than 96% of totalworld ICT sector M&A outflows over the period 1990-2000. The United States, the United Kingdom andFrance accounted for 67%, while Japan accounted for a surprisingly modest 2.3%. Germany accountedfor 7%; Canada, 6.3%; Spain, 4%; the Netherlands, 3.1%; and Australia, 1.2%.
Large deals by Nokia (Finland) and France Telecom and Vivendi (France) in 2000 and Mannesmannand Deutsche Telekom (Germany) and Vodafone (United Kingdom) in 1999 have driven rapid growth inICT M&A outflows. M&A outflows from the United States, while strong throughout, have grown lessquickly than those from other countries (14% compound annual growth, compared to 25% for the OECDas a whole). Only Korea and Japan had lower ICT-related M&A outflows in 2000 than in 1990, althoughoutflows from Japan were substantial in 2000, and high relative to the decade average.
ICT-related M&A inflows are somewhat more evenly distributed (see Annex Table 2.25). OECDcountry inflows have grown faster than outflows over the period, at a compound annual rate of 27%. Over
© OECD 2002

Globalisation of the ICT Sector
95
the period 1990-2000, the United States and Germany were each the target of 28% of ICT M&A inflows,partly owing to the Vodafone/Mannesmann deal in 1999 in the latter case, and the United Kingdomreceived 16% of ICT M&A inflows. Again, major deals shape the overall picture.
Major deals by industry
Telecommunication services assets have been major targets of cross-border M&As in the ICT sectorover the last decade and have involved some very large deals. M&As targeting telecommunicationsbetween 1990 and 2000 were valued at USD 510 billion, with no fewer than 41 deals worth more thanUSD 1 billion. Computer and related services assets were the second largest target of cross-borderM&As in the sector, with 1 248 deals worth USD 88 billion. Communications equipment, computer andoffice equipment, and electronic equipment and component manufacturing assets were each the targetof cross-border M&As valued at between USD 25 billion and USD 40 billion.
During the period 1990-2000, the top 20 cross-border M&A deals targeting communications equipmentmanufacturing were valued at USD 29.5 billion and accounted for 3.7% of the total value of M&As in the ICTsector. Each of the top seven deals was worth more than USD 1 billion (see Annex Table 2.26). The largestM&A deal was worth USD 7 billion. Announced in February 2000, it involved Alcatel of France acquiring100% of Newbridge Networks of Canada in a stock swap deal which focused on networking technologiesand products. Alcatel, in various national guises, was the acquirer in six of the top 20 acquisitions incommunication equipment manufacturing, including the top four, worth a total of USD 19.5 billion. All werehorizontal deals, three were 100% acquisitions and all but one were majority acquisitions.
Of the top 20 deals targeting communication equipment manufacturing, 13 were horizontal deals; inthree cases, the acquiring firms were in the telecommunications services industry (vertical acquisitions),in three cases the acquiring firms were in non-ICT industries and in one case the acquiring firm was inthe electronic equipment and component manufacturing industry. In only one of these top 20 deals wasthe acquirer from a non-OECD country (ECI Telecom Ltd., Israel, which acquired TelematicsInternational Inc. of the United States in 1993 for USD 279 million), and in only three cases was thetarget in a non-OECD country (Exalink Ltd., Israel; NGI, Brazil; and VTR Hipercable, Chile).
Figure 12. Share of horizontal M&As in the ICT sector, 1990-2000Percentages
Source: Thomson Financial, 2001.
100
90
80
70
60
50
40
01994 1995 19961990 1991 1992
30
20
10
100
90
80
70
60
50
40
0
30
20
10
1993 1997 1998 1999 2000
% %Horizontal share of value Horizontal share of deals
100
90
80
70
60
50
40
01994 1995 19961990 1991 1992
30
20
10
100
90
80
70
60
50
40
0
30
20
10
1993 1997 1998 1999 2000
% %Horizontal share of value Horizontal share of deals
100
90
80
70
60
50
40
01994 1995 19961990 1991 1992
30
20
10
100
90
80
70
60
50
40
0
30
20
10
1993 1997 1998 1999 2000
% %Horizontal share of value Horizontal share of deals
© OECD 2002
OECD Information Technology Outlook 2002
96
The top 20 deals targeting computer and office equipment manufacturing were valued at almostUSD 25 billion, around 3% of the total value of M&As in the ICT sector over the period 1990-2000. Thelargest deal was the 1998 acquisition of Bay Networks of the United States by Nortel Networks of Canadafor a little under USD 9.3 billion (see Annex Table 2.27). Although not listed as a horizontal deal, it clearlyinvolves two major communication equipment manufacturers. It can, perhaps, be characterised as anexample of the convergence of computer and communication networking and the need for communicationequipment manufacturers to acquire capabilities in IP networking. In 14 of the top 20 deals, the target firmwas located in the United States. These deals involved acquiring firms based in Canada, theUnited Kingdom, Japan, Korea, Belgium, Germany and Macau (China). In many cases, access to technologywas a significant driver. Only three of the top 20 were listed as horizontal deals.
The top 20 deals targeting electronic equipment and components manufacturing were valued at a total ofUSD 30 billion, and accounted for 3.7% of the value of all deals in the ICT sector. The largest was theacquisition in 2000 of Alteon WebSystems of the United States by Nortel Networks of Canada in a stockswap worth USD 7 billion (see Annex Table 2.28). Alteon WebSystems was a provider of Internetinfrastructure solutions and is another example of Nortel developing its IP capabilities throughacquisition. Interestingly, at least four of the targeted firms were working on optical fibre and/or opto-electronic equipment and systems. Only four of the top 20 were horizontal deals, but six involvedacquiring firms from communication equipment manufacturing and one from computer and officeequipment manufacturing, suggesting the presence of vertical deals.
The top 20 deals targeting computer and related services were valued at USD 47.7 billion, 6% of totalM&A activity by value in the ICT sector. The largest deal was the acquisition in 2000 of Lycos Inc. of theUnited States, an Internet Web portal, by Terra Networks (Telefonica) of Spain for USD 6.2 billion in astock swap transaction (see Annex Table 2.29). The second largest deal, in which NTT Communicationsof Japan acquired Verio of the United States, was worth USD 5.7 billion. M&As targeting the computerservices industry have been both common and relatively large, with 1 248 deals over the decade worthalmost USD 88 billion. All of the top 20 deals were worth more than USD 1 billion. Seven of the top 20were horizontal deals; four telecommunication services firms acquired assets in computer and relatedservices, often relating to Internet service provider (ISP) and other Internet activities; and four involvedcommunication equipment manufacturers seeking vertical integration. In only one deal, where theacquiring nation was listed as Bermuda, was the target or the acquirer outside the OECD.
The top 20 deals targeting telecommunication services were worth a total of USD 440 billion, 55% of thevalue of all M&As in the ICT sector. The largest deal was the 1999 acquisition of Mannesmann ofGermany by Vodafone of the United Kingdom for USD 203 billion (see Annex Table 2.30). M&As in thetelecommunications industry are large: eight of the top 20 deals were worth more than USD 10 billionand 41 were worth more than USD 1 billion. Vodafone of the United Kingdom was the acquirer in threeof the top five, worth a combined USD 277 billion in 1999 and 2000. At least seven of the top 20 deals intelecommunications targeted mobile network operators, and 16 were horizontal deals. Among theacquiring firms in the top 20 deals in telecommunications, only Global Crossing of Bermuda was basedoutside the OECD area. Significant acquisitions in South America (notably by Telefonica of Spain)meant that six of the top 20 targeted assets outside the OECD.
Deals targeting ICT wholesaling were generally smaller, worth a total of USD 4.7 billion andaccounting for less than 1% of all deals in the ICT sector. Nevertheless, the acquisition of STC (UnitedKingdom) by Nortel of Canada in 1990 was valued at USD 2.6 billion (see Annex Table 2.31). The largestdeal targeting ICT wholesaling during 2000 was worth just USD 26 million.
Deals targeting the ICT-related media and content industries were valued at USD 76 billion andaccounted for more than 9% of the value of cross-border M&As in the ICT sector. They included somelarge deals, with the top seven worth more than USD 1.5 billion and the largest (the acquisition ofSeagram of Canada by Vivendi of France in June 2000) worth more than USD 40 billion (see AnnexTable 2.32).
© OECD 2002

Globalisation of the ICT Sector
97
Strategic alliances
As firms restructure, there has been a significant increase in strategic alliances.12 Cross-borderstrategic alliances accounted for 60% of all alliances that took place between 1990 and 2000 (Figure 13).They numbered 2 531 in 1990 and 4 532 in 1999. For smaller countries (e.g. Iceland, Belgium, Luxembourg,Austria), international alliances have been more numerous than alliances among domestic firms,accounting for over 90% of all their deals. The United States accounted for about two-thirds of all strategicalliances in the 1990s, half of them with foreign partners.
Between 1990 and 2000, 6% of cross-border alliances were in the ICT sector (see Annex Table 2.33).Out of a total of 2 765, 2 335 were completed and the remaining 430 were pending or terminated. Whilea relatively small share of the total, ICT sector cross-border alliances have been growing faster than totalalliances, with a compound annual growth rate of 12% compared to 8%, a further indication that the ICTsector is rapidly globalising.
ICT cross-border alliances by industry
Between 1990 and 2000, 54% of ICT sector cross-border alliances targeted ICT services activities,36% targeted ICT manufacturing and the remaining 10% targeted media and other activities (Figure 14).ICT sector cross-border alliances focused primarily on computer services (32%), telecommunicationservices (12%) and ICT wholesaling activities (10%). Among ICT manufacturing industries, more than 15%of all ICT sector cross-border alliances between 1990 and 2000 focused primarily on electroniccomponents and parts manufacturing activities, almost 13% on communication equipmentmanufacturing and 8% on computer and office machinery manufacturing.
Over the period 1990-2000, the most obvious trend is a shift away from ICT manufacturing activities toICT services. Manufacturing activities were the primary focus of more than 50% of all cross-border alliancesin 1990 but of less than 5% in 2000, while services were the primary focus of 29% in 1990 and of 73% in 2000,
Figure 13. Share of domestic and cross-border strategic alliances, 1990-2000Number of deals
Source: Thomson Financial, 2001.
1994 1995 19961990 1991 1992
12 000
10 000
8 000
6 000
4 000
2 000
01993 1997 1998 1999 2000
12 000
10 000
8 000
6 000
4 000
2 000
0
DomesticCross-border
1994 1995 19961990 1991 1992
12 000
10 000
8 000
6 000
4 000
2 000
01993 1997 1998 1999 2000
12 000
10 000
8 000
6 000
4 000
2 000
0
DomesticCross-border
1994 1995 19961990 1991 1992
12 000
10 000
8 000
6 000
4 000
2 000
01993 1997 1998 1999 2000
12 000
10 000
8 000
6 000
4 000
2 000
0
DomesticCross-border
© OECD 2002

OECD Information Technology Outlook 2002
98
increasing at a compound annual rate of 23% over the period. The alliances focused on computer servicesincreased at a compound annual rate of 25%, compared to 18% for telecommunications and 15% forwholesale activities, while those in all areas of ICT manufacturing declined.
The nature of cross-border alliances in the ICT sector
Across all industries, joint ventures accounted for 55% of all cross-border alliances over theperiod 1990-2000 (Figure 15), but for only a little over 22% in the ICT sector. In 1990, joint venturesaccounted for 32% of all cross-border alliances in the ICT sector, but by 2000, their share had fallen to just
Figure 14. Cross-border strategic alliances, 1990-2000Index 1990 = 100
Source: Thomson Financial, 2001.
1 800
0
1 600
1 400
1 200
1 000
800
400
1990 1991 1992 1993 1994 1995 1996 1997 1998 20001999
600
200
1 800
0
1 600
1 400
1 200
1 000
800
400
600
200
ICT alliances Total alliances ICT manufacturing ICT Services
1 800
0
1 600
1 400
1 200
1 000
800
400
1990 1991 1992 1993 1994 1995 1996 1997 1998 20001999
600
200
1 800
0
1 600
1 400
1 200
1 000
800
400
600
200
ICT alliances Total alliances ICT manufacturing ICT Services
1 800
0
1 600
1 400
1 200
1 000
800
400
1990 1991 1992 1993 1994 1995 1996 1997 1998 20001999
600
200
1 800
0
1 600
1 400
1 200
1 000
800
400
600
200
ICT alliances Total alliances ICT manufacturing ICT Services
Figure 15. Cross-border joint ventures and alliances, 1990-2000Index 1990 = 100
Source: Thomson Financial, 2001.
1 200
0
1 000
800
400
1990 1991 1992 1993 1994 1995 1996 1997 1998 20001999
600
200
1 200
0
1 000
800
400
600
200
Total joint ventures Total alliances ICT joint ventures ICT alliances
1 200
0
1 000
800
400
1990 1991 1992 1993 1994 1995 1996 1997 1998 20001999
600
200
1 200
0
1 000
800
400
600
200
Total joint ventures Total alliances ICT joint ventures ICT alliances
1 200
0
1 000
800
400
1990 1991 1992 1993 1994 1995 1996 1997 1998 20001999
600
200
1 200
0
1 000
800
400
600
200
Total joint ventures Total alliances ICT joint ventures ICT alliances
© OECD 2002

Globalisation of the ICT Sector
99
11% (see Annex Table 2.34). Interestingly, there is little difference between the shares of agreementsfocused on manufacturing and on services in joint ventures and other ICT sector alliances over the lastdecade (Figure 16). Manufacturing activities were the focus of 36% of agreements and services activitiesthe focus of a little over 50% whether they were joint ventures or other forms of alliance.
Purpose of cross-border alliances in the ICT sector
Technology is the main driver of cross-border alliances in the ICT sector (see Annex Table 2.35).R&D was the focus of 36% of all cross-border alliances over the period 1990-2000, compared to 23% fortechnology transfer and 19% for technology licensing. It was cited as the primary focus of just 13% ofcross-border alliances across all industries.
Together, R&D, technology transfer and licensing have been the primary focus of 1 807 cross-borderalliances in the ICT sector since 1990 or 78% of a total of 2 335 (Figure 17).13 Marketing was also animportant focus, with more than 880 deals, while manufacturing was less important, with 430. Perhapscuriously, given the level of intra-industry trade in ICT equipment, supply has not been a major focus ofcross-border alliances. This may reflect the relatively low and declining share of manufacturing-orientedalliances and the level of direct investment and sales through affiliates in the sector.
Of the 834 ICT sector cross-border alliances focused on R&D between 1990 and 2000, only 116 werejoint ventures (see Annex Table 2.36). By industry, the largest number of R&D alliances were incomputer and related services (296); 186 were in electronic equipment and component manufacturing,128 in communication equipment manufacturing, 101 in computer and office equipment manufacturingand 44 in telecommunication services. Overall, 50% of the sector’s cross-border R&D alliances havebeen in ICT equipment manufacturing and 43% in services.
Curiously, there were many more cross-border R&D alliances early in the decade, with almost 87%established between 1990 and 1995 (90% of those in manufacturing and 84% of those in services).Cross-border R&D alliances peaked in the years 1992-95, perhaps owing to expansion after thedownturn of 1991-92 as firms looked for a technological “leg up”. In 1994, 58% of all cross-borderalliances focused on R&D14 but in 1999, this was the declared focus of just 4.4%. Firms may feel lessneed to push the technology boundaries during boom sales years.
Figure 16. Share of joint venture and other alliances in ICT sector, 1990-2000Number of deals
Source: Thomson Financial, 2001.
1994 1995 19961990 1991 1992
450
250
200
150
100
50
01993 1997 1998 1999 2000
300
350
400
450
250
200
150
100
50
0
300
350
400
Joint venture Other alliance
1994 1995 19961990 1991 1992
450
250
200
150
100
50
01993 1997 1998 1999 2000
300
350
400
450
250
200
150
100
50
0
300
350
400
Joint venture Other alliance
1994 1995 19961990 1991 1992
450
250
200
150
100
50
01993 1997 1998 1999 2000
300
350
400
450
250
200
150
100
50
0
300
350
400
Joint venture Other alliance
© OECD 2002

OECD Information Technology Outlook 2002
100
The country focus of ICT sector cross-border alliances
The United States has been a party to 66% of the cross-border alliances in the ICT sector over thelast decade (Figure 18). In 72% of these, it was the principal nation of the alliance. Its involvement inthese alliances is somewhat higher than the average across all sectors (60%). Japan was a party to 32%and less than half the number involving the United States; it was the primary nation of the alliance injust 39%. Involvement in ICT sector cross-border alliances then tails off very quickly.
Only the United States, France and Finland are cited as the principal nation of the alliance in morethan 50% of their cross-border alliances (see Annex Table 2.37). Australia, Sweden the United Kingdomand Canada are the principal nation in more than 40% of their cross-border alliances. The mainsecondary countries have been New Zealand, Italy and Luxembourg, followed by Hungary, Belgium,Ireland and Spain.
Conclusion
The ICT sector is highly and increasingly globalised and, in many respects, a leading example ofindustrial globalisation. While the different segments of the ICT sector vary, owing to differentregulatory and market imperatives, the ICT sector overall reveals some of the key drivers and corecharacteristics of industrial globalisation.
ICT trade is very dynamic, with trade in ICT goods growing at almost double the rate of all goods;trade in ICT services is growing faster than trade in ICT goods. In terms of investment, there has been amajor shift away from globalised manufacturing activities towards globalising services activities. Asservices become the focus of deregulation and trade liberalisation and marketed services a larger partof economic activity in most economies, this trend seems likely to continue. In recent years,telecommunication services have been at the forefront of investment and M&A activities asderegulation creates new markets. The focus on mobile communications is likely to continue, owing tothe recent loss of share value and the large future cost of rolling out third-generation mobile networks.One can expect to see significant consolidation, tempered to some degree by regulatory demands forcompetition and real choices in national markets.
Figure 17. Purpose of ICT sector cross-border alliances, 1990-2000
Source: Thomson Financial, 2001.
1994 1995 19961990 1991 1992
100
60
50
40
30
20
01993 1997 1998 1999 2000
70
80
90
% %
10
100
60
50
40
30
20
0
70
80
90
10
MarketingManufacturingLicencing R&D Technology Supply
1994 1995 19961990 1991 1992
100
60
50
40
30
20
01993 1997 1998 1999 2000
70
80
90
% %
10
100
60
50
40
30
20
0
70
80
90
10
MarketingManufacturingLicencing R&D Technology Supply
1994 1995 19961990 1991 1992
100
60
50
40
30
20
01993 1997 1998 1999 2000
70
80
90
% %
10
100
60
50
40
30
20
0
70
80
90
10
MarketingManufacturingLicencing R&D Technology Supply
© OECD 2002

Globalisation of the ICT Sector
101
The globalisation of all parts of the ICT-producing sector is also being propelled by rapidtechnological change, which makes product life cycles ever shorter and opens up new markets forinnovative products and services. The importance of R&D and various forms of technologydevelopment and access is clearly evident in the sector’s M&As and strategic alliances. ICT-sector firmsare likely to continue to seek ways of embracing emerging technologies (e.g. in IP networking, radio andoptical communications) and bringing them rapidly to market, be it through M&As or alliances.
The impact of the business cycle on the level of activity in FDI, M&As and strategic alliances isclear. The boom years of the 1990s were a period of rapid globalisation. The recent “tech wreck” and theinternational economic downturn are likely to have a significant impact on these forms of globalisingactivity in the ICT sector in 2002 and beyond. Despite the tendency in the ICT sector for those leftstanding to pick up international assets while they are relatively cheap, there is likely to be a reductionin the levels of FDI, M&A and alliance activity over the next few years. Whatever happens, it seemslikely that its underlying structure and dynamics will ensure that the ICT sector will remain at theforefront of industrial globalisation.
Figure 18. ICT sector cross-border alliances, 1990-2000Number of deals
Source: Thomson Financial, 2001.
1 600
1 200
1 000
800
600
0
1 400
400
200
1 600
1 200
1 000
800
600
0
1 400
400
200
120
0
100
80
60
40
20
United
Sta
tes
Germ
any
Franc
eSpa
in
Irelan
d
Norway
Denm
ark
Austri
a
Slovak
Rep
ublic
Belgium
Japa
n
Canad
a
United
King
dom
Korea
Nethe
rland
s
Austra
liaIta
ly
Sweden
Mex
ico
Finlan
d
New Z
ealan
d
Switzer
land
Luxe
mbo
urg
Portu
gal
Poland
Greec
e
Hunga
ry
Czech
Rep
ublic
Turk
ey
Icelan
d
Franc
eSpa
in
Irelan
d
Norway
Denm
ark
Austri
a
Slovak
Rep
ublic
Belgium
Korea
Nethe
rland
s
Austra
liaIta
ly
Sweden
Mex
ico
Finlan
d
New Z
ealan
d
Switzer
land
Luxe
mbo
urg
Portu
gal
Poland
Greec
e
Hunga
ry
Czech
Rep
ublic
Turk
ey
Icelan
d
Primary country Secondary country
1 600
1 200
1 000
800
600
0
1 400
400
200
1 600
1 200
1 000
800
600
0
1 400
400
200
120
0
100
80
60
40
20
United
Sta
tes
Germ
any
Franc
eSpa
in
Irelan
d
Norway
Denm
ark
Austri
a
Slovak
Rep
ublic
Belgium
Japa
n
Canad
a
United
King
dom
Korea
Nethe
rland
s
Austra
liaIta
ly
Sweden
Mex
ico
Finlan
d
New Z
ealan
d
Switzer
land
Luxe
mbo
urg
Portu
gal
Poland
Greec
e
Hunga
ry
Czech
Rep
ublic
Turk
ey
Icelan
d
Franc
eSpa
in
Irelan
d
Norway
Denm
ark
Austri
a
Slovak
Rep
ublic
Belgium
Korea
Nethe
rland
s
Austra
liaIta
ly
Sweden
Mex
ico
Finlan
d
New Z
ealan
d
Switzer
land
Luxe
mbo
urg
Portu
gal
Poland
Greec
e
Hunga
ry
Czech
Rep
ublic
Turk
ey
Icelan
d
Primary country Secondary country
© OECD 2002

OECD Information Technology Outlook 2002
102
NOTES
1. This chapter focuses on what is happening rather than why. Management and policy implications are notanalysed in depth, as there is an extensive literature on these aspects of globalisation.
2. In a recent study (OECD, 2001a), the OECD made a first attempt to focus on the trade and investmentdimensions of the new economy. The study concluded that, in trade terms, the ICT sector expanded the mostover the last decade, and that the ICT share in trade in goods and services has continuously increased. Further,while trying to gauge the effects on global trade of the dissemination of ICTs, it concluded that countries withthe highest ICT expenditure are more open and have increased their participation in global trade more rapidly.While showing significant disparities among ICT trade actors – from country to country and from business tobusiness – the study revealed that the emerging economies are often achieving better trade results in ICT thanin other sectors.
3. Analysis in this section is based on data in the OECD ITS (International Trade Statistics) database inJanuary 2002. The data are complete for all OECD countries except the Czech Republic (data from 1994),Hungary (from 1992), Korea (from 1994), and the Slovak Republic (from 1997). Luxembourg is not included.Data for 2000 are incomplete and 1999 data are used for Greece and the Slovak Republic.
4. Neither trade in software products nor cross-border payments for software royalties and license fees fullycapture the extent of software-related trade. Digital delivery of software is significant and growing.Unfortunately, it is also very difficult to measure. However, software is the main product in digital delivery.In 1999, the value of on line software sales was estimated at USD 1.24 billion, of which around 6.5% weredelivered on line (OECD, 2001d).
5. Revealed comparative advantage is calculated as the ratio of the share of ICT equipment exports in totalmerchandise exports for each country to the share of OECD ICT exports in total OECD merchandise exports. Avalue greater than 1 indicates a comparative advantage, and a value less than 1 a comparative disadvantage.
6. For an industry “i” with exports Xi and imports Mi the index is GLI = [1 – |Mi – Xi|/(Mi + Xi)].
7. FDI is defined as an investment by an entity based in another country involving a long-term relationship,interest and management control.
8. M&As take place when operating enterprises merge with or acquire control of the whole or part of the businessof other enterprises. Cross-border M&As are undertaken between firms of different national origin or homecountries. M&As allow firms quick entry into a specific market through the acquisition of production facilitiesand intangible assets.
9. Strategic alliances may involve equity participation, but contrary to M&As, investment is typically not asignificant factor. There are two kinds of strategic alliance. Joint ventures, in which a new jointly funded andcontrolled entity is created; and other alliances, in which no new entity is created. The core of a strategicalliance is an inter-firm co-operative relationship that enhances the effectiveness of the competitive strategiesof the participating firms through the trading of mutually beneficial resources such as technologies, skills, etc.Their flexibility allows firms to respond to changing market conditions effectively, without changes in theownership structure of participating firms. See OECD (2001b), p. 14.
10. This analysis of cross-border M&As is based on Thomson Financial data and includes deals between entitiesbased in different economies (cross-border) and declared completed or unconditional. They are recorded asoccurring in the year of announcement and defined as deals involving the acquisition of more than 10% equity.Not all deal values are recorded, and not all deals are reported. Consequently, these data are no more than aguide to M&A activity.
11. There are three types of ICT sector M&As: i) the primary activity of the acquirer is in the ICT sector; ii) theprimary activity of the target in the ICT sector; and iii) ICTs are not the primary activity of either acquirer ortarget, but are among the activities of the wider corporate entity. ICT industries include: ICT equipmentmanufacturing (office and computer equipment, communication equipment, and electronic equipment andcomponents); ICT-related services (computer and related services, telecommunication services, and wholesaleactivities); and ICT media (principally broadcasting and content industries).
© OECD 2002
Globalisation of the ICT Sector
103
12. This analysis is based on strategic alliances listed in the Thomson Financial database, is presented in terms ofthe year of announcement and includes completed deals.
13. Some cross-border alliances have more than one focus and some do not record a focus. R&D, technologytransfer and licensing account for 56% of the total number of cross-border alliances that registered the focus orfoci of the alliance.
14. Percentages do not sum to 100 because some alliances indicate more than one purpose.
© OECD 2002
OECD Information Technology Outlook 2002
104
REFERENCES
Grubel, H.G. and P.J. Lloyd (1975),Intra-Industry Trade: The Theory and Measurement of International Trade in Differentiated Products, Wiley, New York.
Houghton, J.W. (2001),“Australian ICT Trade Update 2001”, Centre for Strategic Economic Studies, Victoria University, Melbourne(www.cfses.com).
Mann, M.A. and M. Borga (2001),“US International Services: Cross-border Trade in 2000 and Sales Through Affiliates in 1999”, US Department ofCommerce, November 2001. www.bea.doc.gov/bea/ARTICLES/2001/11November/1101IntlServ.pdf
OECD (2000),International Direct Investment Statistics Yearbook 2000, Paris.
OECD (2001a),“Measuring the New Economy: Trade and Investment Dimensions”, TD/TC/WP(2001)23/FINAL, Paris.
OECD (2001b),New Patterns of Industrial Globalisation: Cross-border Mergers and Acquisitions and Strategic Alliances, Paris.
OECD (2001c),Science, Technology and Industry Scoreboard 2001: Towards a Knowledge-based Economy, Paris.
OECD (2001d),The Software Sector: Growth, Structure and Policy Issues, DSTI Working Paper, forthcoming.
OECD/Eurostat (2001),Statistics on International Trade in Services, Paris.
Reed Electronics Research (various years),Yearbook of World Electronics Data, Reed Elsevier, London.
Ruffin, R.J. (1999),“The Nature and Significance of Intra-industry Trade”, Economic and Financial Review, Federal Reserve of Dallas.
Thomson Financial (2001).
UNCTAD (various years),World Investment Report.
Yoshino, M.Y. (1995),Strategic Alliances: An Entrepreneurial Approach to Globalisation, Harvard University Press, Cambridge, Massachusetts.
© OECD 2002

105
Chapter 3
THE SOFTWARE SECTOR
The software industry is at the heart of information technologies and is closely linked to thecomputer and communications industries both technologically and through the activities of firms. It hasbeen of growing policy interest since its emergence as an independent economic activity. It isincreasingly important for driving the information economy and a key component of investment. Theimpacts of software are pervasive owing to the constant innovations that underpin the increasingspread of information and communication technologies (ICTs) and the Internet throughout the economyand society. In the knowledge-based economy, “the creation of wealth becomes synonymous withcreating products and services with large software content” (Hagel and Armstrong, 1997).
The evolution of the software sector rests on the complementarities between software andhardware. Software programmes require the support of hardware, and hardware usually relies onsoftware to be functional. Software production entails high sunk costs for development and testing(“first copy” costs) prior to launching the product. However, once products are developed, replicationcosts are minimal, thereby generating large economies of scale. In addition, owing to network effects onthe demand side, the value of a software programme increases with the rise in the number of usersrunning it. Thus, users can exchange information with other users running compatible programmes andsoftware developers and hardware manufacturers have incentives to develop products for commonplatforms.
The combination of economies of scale on the supply side and network effects on the demand sidecan lead to the establishment of de facto standards. In dynamic software markets, technologicalinnovation constantly challenges leaders, and network effects may accelerate the advent of newstandards and the displacement of old ones, in a process frequently referred to as “creativedestruction” (Schumpeter, 1950).
This chapter describes the latest developments, on both the supply and the demand side, in thisrapidly growing and fiercely competitive industry. It highlights methodological problems which point toareas requiring further research. It first describes growth trends and shows how the software sector hasgrown in terms of most economic variables in the last few years and how software R&D and investmenthave spread throughout the economy. It then turns to international trade and foreign direct investment(FDI) in software. The next two sections look at packaged software markets, from the geographical pointof view in the section on domestic markets and from the product point of view in the section on productcategories for packaged software. A section on industry structure concludes the chapter.
Growth trends
The software sector is one of the most rapidly growing sectors in OECD countries, with a relativelystrong performance across all economic variables. The sector contributes directly to economicperformance because of its dynamism, and software applications help boost growth across the wholeeconomy through their use in an ever-expanding array of applications. Rapid growth in the sector isevident in terms of value added, employment, wages, R&D intensity, patents and investment. Theseare described in more detail below.
© OECD 2002

OECD Information Technology Outlook 2002
106
Value added
Over the last decade, the software sector has been one of the areas of the economy experiencingthe highest growth rates. Value added has increased at a faster pace than in any other ICT sector.Nominal value added in the broadly defined software sector represents around 1% to 3% of businesssector value added in OECD countries.1 This relatively small share has been increasing regularly(Figure 1).
Growth has been highest in the Netherlands, where value added in the broadly defined softwaresector more than doubled its share of total business sector value added, from 1.3% in 1992 to 2.9%in 1999, and in the United States where the share increased from 1.6% to 3.1% (see Annex Table 3.1). Allcountries for which detailed time series data are available (Figure 1) had a share above 2% in 1999 andshowed considerable growth (see Annex Table 3.2).
Value added per employee in the industry is generally higher than the average for the wholebusiness sector, reflecting the sector’s high productivity. New technologies and new organisationalapproaches may further raise its productivity. However, more work is required to improve themeasurement of productivity.2
Employment
The broadly defined software sector (computer and related activities) accounts for 1% to 2.6% oftotal business sector employment3 (see Annex Table 3.3). The shares of the Netherlands, Finland andItaly are all relatively close (around 2.5% in 1999). Growth rates have been high in the past decade,especially in Canada, Finland and the Netherlands (Figure 2).
Figure 1. Nominal value added of computer and related activities in selected OECD countries, 1990-99As a share of total business sector value added
Source: OECD, based on data from the STAN database, Services Statistics on Value Added and Employment, 2000 Edition (ISIC 72), and USDepartment of Commerce (SIC 737 less 7377).
% %
1990 1991 1992 1993 1994 1995 1996 1997 1998 1999
3.5
2.0
1.5
1.0
0.5
0
2.5
3.0
3.5
2.0
1.5
1.0
0.5
0
2.5
3.0
FranceNetherlandsUnited States
FinlandItaly
United Kingdom
Germany
% %
1990 1991 1992 1993 1994 1995 1996 1997 1998 1999
3.5
2.0
1.5
1.0
0.5
0
2.5
3.0
3.5
2.0
1.5
1.0
0.5
0
2.5
3.0
FranceNetherlandsUnited States
FinlandItaly
United Kingdom
Germany
% %
1990 1991 1992 1993 1994 1995 1996 1997 1998 1999
3.5
2.0
1.5
1.0
0.5
0
2.5
3.0
3.5
2.0
1.5
1.0
0.5
0
2.5
3.0
FranceNetherlandsUnited States
FinlandItaly
United Kingdom
Germany
© OECD 2002

The Software Sector
107
Between January 1990 and January 2001, slightly more than 1.2 million jobs were created in theUnited States in the broadly defined software sector, which now accounts for more than 1.9% of totalprivate employment (US Department of Commerce, 2002) (see Annex Table 3.4). Packaged software andcomputer programming services accounted for more than 40% of these jobs. Employment in Internet-related computer services was the segment with the highest growth, with an average annual growth rateof 34% between 1995 and 2000 for information retrieval services (US SIC 7375), compared to around 14%for the narrowly defined software sector (computer programming services and packaged software),according to the US Bureau of Labor Statistics.
Information from other countries confirms these trends. In France, the number of employees incomputer and related activities increased by more than 160 000 between 1981 and 1998. By the endof 1998, one employee in ten in professional services worked in computer and related activities (i.e. thebroadly defined software sector (INSEE, 2000). In Canada, employment (excluding self-employment) insoftware and computer services showed similarly high growth rates, increasing between 1993 and 1997at a compound annual growth rate almost ten times that of total employment (Statistics Canada).
Although software sector employment has been growing rapidly, jobs in the software sector aloneare only part of the contribution of software activities to total employment. In the United States, allemployment in computer and related services accounted for only 1% of total employment in 1998(including the public sector), whereas the share of computer-related occupations in the economy wasaround 2%. As a result, as much as 76% of computer-related occupations were in other industries.4
Likewise, in France, all employment in computer and related activities was 1% of total privateemployment in 1997, whereas all computer-related occupations5 amounted to 1.4% of employment inthe whole economy, i.e. 66% were employed in other industries (Lerenard and Tanay, 1998).
Wages
Wages and salaries in the software sector are relatively higher and growing more rapidly than theoverall average for the economy, indicating among other things a high share of employees with
Figure 2. Employment in computer and related activities in selected OECD countries, 1990-99As a share of total business sector employment
Source: OECD, based on data from STAN database, Services Statistics on Value Added and Employment, 2000 Edition (ISIC 72), US Departmentof Commerce (SIC 737 less 7377).
% %
1990 1991 1992 1993 1994 1995 1996 1997 1998 1999
2.0
1.5
1.0
0.5
0
2.5
3.0
2.0
1.5
1.0
0.5
0
2.5
3.0
Netherlands
United Kingdom GermanyUnited States
Italy Canada
France
Finland
% %
1990 1991 1992 1993 1994 1995 1996 1997 1998 1999
2.0
1.5
1.0
0.5
0
2.5
3.0
2.0
1.5
1.0
0.5
0
2.5
3.0
Netherlands
United Kingdom GermanyUnited States
Italy Canada
France
Finland
% %
1990 1991 1992 1993 1994 1995 1996 1997 1998 1999
2.0
1.5
1.0
0.5
0
2.5
3.0
2.0
1.5
1.0
0.5
0
2.5
3.0
Netherlands
United Kingdom GermanyUnited States
Italy Canada
France
Finland
© OECD 2002

OECD Information Technology Outlook 2002
108
tertiary-level education. In the United States, wages in the broadly defined software sector have beenaround twice as high and have grown twice as fast the national average for all private industries duringthe 1990s. Within the sector, packaged software experienced the highest growth rates, with a compoundannual growth rate of 9.5% compared to 7.8% for the whole sector between 1992 and 2000.
Prices
One of the most striking phenomena of the ICT equipment industry has been the rapid decline incomputer prices per unit of computing power. However, services have resisted better, among otherthings owing to the high wage content in their total price.6 Recent data on hedonic consumer priceindices7 for various information technology (IT) goods and services in the United States show thatcomputer software and related accessories have seen a modest decline in prices since the end of 1997,in contrast with the rapid decline in prices of PCs and peripheral equipment (see Chapter 1, Figure 18).
R&D in the software sector
Like the rest of the ICT industry, the software sector invests heavily in R&D. Earlier analysisindicates that the software sector tends to be the main R&D performer (for a discussion onmeasurement issues for R&D in services, including software consultancy and supply, see Young, 1996).Computer and related activities (ISIC 72) account for between 2% and 16% of total gross businessexpenditure on R&D (BERD) across OECD countries (see Annex Table 3.5), ranging from more than 10%in Australia, Denmark, Norway, Iceland and Greece, to less than 2% in Germany, where, however, thelevel of BERD in computer and related activities is one of the highest in the OECD area.8 In somecountries, a significant share of BERD in this sector is funded by government (see Annex Table 3.6).
The United States has the highest business R&D in computer and related activities, with almostUSD 14 billion in purchasing power parity (PPP) in 1997, more than ten times the amount spent by thenext two spenders in the OECD area at the time, Japan and the United Kingdom. Canada, Germany,France and Australia are also among the top spenders.
Software R&D throughout the economy
An alternative way of measuring R&D intensity in software is to look at R&D expenditures onsoftware across all sectors of the economy.9 Software R&D is also performed outside the broadlydefined software sector, and if this is not taken into account, the overall importance of R&D related tosoftware will be underestimated.
Information from a number of national surveys confirms the relevance of software-related R&D inother industries, although the lack of official data prevents a comprehensive cross-country analysis. Atthe beginning of the 1990s, about 40% of services firms in Japan and Italy undertook some form of ITR&D, about three-quarters of all R&D reported by “other services industries” was computer-related inDenmark, and over half of all R&D in the services industries was software-related in Canada (Young,1996). In 1998, almost one-quarter of BERD in the Netherlands could be labelled software R&D(Statistics Netherlands, 2000, cited in Khan, 2001).
Software patents
Information on the number of patents granted in the United States provides an indication of thespectacular increase in patented software inventions in the last few years. The heterogeneity of patentregimes across countries, the changes in the definition of what can be patented in individual countriesand the lack of a widely acknowledged classification of software patents and sources of data on patentcounts hamper empirical analysis of the impacts of patenting on software innovation.10
There are two ways to measure the number of “software patents” granted in the United States,although they should only be considered as proxies owing to the current lack of more preciseclassifications. One is the number of patents originally classified11 in a selection of software-related
© OECD 2002

The Software Sector
109
patent classes, more precisely computer graphics processing and data processing (US patentclasses 345 and 700-707 and 716-717).12 The second is the number of patents that include the word“software” in the description13 (see Annex Tables 3.7 and 3.8).
The number of patents granted in the United States under the software-related patent classesmentioned above almost tripled in the 1990s, from less than 2 000 in 1990 to more than 6 000 in 1999, orfrom 2% to 4% of all patents granted. This selection includes US patent class 705, also known as businessmethods, which has become an area of vigorous debate owing to the increasing number of patentapplications for software-based business methods, mainly relating to electronic commerce. Examples ofsuch patents are the British Telecom patent on hyperlinks, the Amazon patent on its One Clickshopping system and the Priceline patent on reverse auctions.
On the other hand, the number of patents including the word “software” in the patent descriptionwas over four times higher in 1999 than in 1990, increasing from over 3 000 in 1990 to more than 17 000in 1999 (10% of the total number of patents granted in 1999, compared to only 3% in 1990). However, asthe subject matter of such a patent might not be a software invention, this second indicator should beonly considered as a proxy. A search for the number of patents granted to a selection of firms among thelargest software vendors worldwide (see Annex Table 3.9) shows that 89% of the patents granted toOracle, 85% of the patents granted to Novell and 64% of the patents granted to Microsoft in 1999included the word software in the description.
Overall, these measures show that, in the United States, the number of software-related patentshas grown at a much faster pace than the total number of patents granted. The total number of patentsgranted had a compound annual growth rate (CAGR) of only 6% between 1990 and 1999, but the numberof patents originally classified in these software-related patent classes has had a CAGR of 16% (15% ifpatents for business methods are excluded), while the number of patents granted with the word“software” in their description grew at a CAGR as high as 22% (Figure 3).
Figure 3. Patents granted in the United States, 1990-99Index 1990 = 100
Note: US Patent Class 705 is also known as “business methods”. USPTO patent counts by class only take into account the original classification ofeach patent in order to avoid double counting. These patent counts cover all patent documents, including utility, design, plant and reissuepatents, as well as statutory invention registrations and defensive publications.
Source: US Patent and Trademark Office (USPTO), “Patent Counts by Class by Year: January 1977-December 1999” (April 2000); and USPTO FullText Database for number of patents with the word “software” in the description.
1990 1991 1992 1993 1994 1995 1996 1997 1998 1999
600
500
300
200
100
700
800
400
600
500
300
200
100
700
800
400Patents granted in computergraphics & data processingclasses (exc. Class 705)
Patents granted for businessmethods (Class 705)
Patents granted containingword “software” in thedescription
All patents granted
© OECD 2002

OECD Information Technology Outlook 2002
110
Software as an intangible investment
Software has been the most dynamic component of ICT investment in overall investment growth,and hence in GDP growth, in OECD countries in the 1990s.14
The nominal share of software in business sector gross fixed capital formation, as reported in theNational Accounts, has increased constantly since 1990, and in 1999 reached levels as high as 13.6%and 11.9% for the United States and Finland, respectively. Canada and Australia present a more modestshare of around 9%, followed by France, Germany, Italy and Japan with shares below 6% (Figure 4).
International trade and foreign direct investment
International trade
International trade in software goods and services is growing rapidly but is difficult to measure,among other things owing to the increasing diversity of delivery channels (OECD, 1998, 2000a). Thevalue of software goods trade has been significantly underestimated in border valuations because, inmost countries, it is based on the value of physical supports (CD-ROM, diskettes) rather than ofcontent.
The potential for significant mismeasurement is further increased by the bundling of software withcomputer hardware. Moreover, trade statistics do not measure the value of copyrights sold in foreignmarkets, although a substantial amount of international software trade involves licenses to use softwarein foreign countries, or the value of software electronically transmitted to and then subsequently soldby a foreign affiliate of a company or digitally delivered directly to final consumers. This last point ispart of a larger problem related to the transition to the electronic distribution of intangible goods, since
Figure 4. Share of software in business sector nominal gross fixed capital formation
Note: Only “made to order” software is included for Japan.Source: Colecchia and Schreyer, 2001.
18
15
12
9
6
3
0
18
15
12
9
6
3
0
199919951990
% %
Fran
ce Italy
Germ
any
Japa
n
Canad
a
Finlan
d
Austra
lia
United
Sta
tes
18
15
12
9
6
3
0
18
15
12
9
6
3
0
199919951990
% %
Fran
ce Italy
Germ
any
Japa
n
Canad
a
Finlan
d
Austra
lia
United
Sta
tes
18
15
12
9
6
3
0
18
15
12
9
6
3
0
199919951990
% %
Fran
ce Italy
Germ
any
Japa
n
Canad
a
Finlan
d
Austra
lia
United
Sta
tes
© OECD 2002
The Software Sector
111
measuring and valuing domestic and international transactions involving intangible goods(e.g. software) are much harder than measuring those involving physically delivered tangible goods.Finally, software-related services trade is identified and measured poorly and is often not distinguishedfrom other services.15
Statistics on software traded on physical supports (diskettes, CD-ROMs and other media) give anindication of the relative size and geographical distribution of cross-border sales of software goods.International trade of media for reproducing phenomena other than sound or image (predominantlysoftware) is a relatively small percentage of all exports, varying between less than 0.1% and 0.4% for allOECD countries except Ireland (over 5% in 2000). Imports of these software-related media represent up to1% of all goods imports. All OECD countries except Ireland, the United States, Austria and the Netherlandswere net importers of software traded in physical supports in the period 1997-2000. The OECD was a netexporter overall, mainly because of the strong performance of Ireland and the United States, which haveaccounted for more than 55% of OECD exports in software goods in the period.
In Ireland, according to official Irish sources, more than 60% of the production of software wasexported in 2000. That year, however, foreign firms based in Ireland accounted for about 90% of softwareexports.16 Ireland appears to have become the manufacturing and distribution centre of the software soldby many of the world’s top software vendors, particularly for Europe.17 Over 40% of all packaged software(and 60% of all business software) sold in Europe is produced in Ireland.18 More broadly, a significantshare of EU exports correspond to software products produced by local affiliates of US-based firms.
Finally, although software-related services trade is also identified and measured poorly, Irelandalso ranked first in terms of value of exported computer and information services in 2000(USD 5.48 billion, followed by the United States with USD 4.9 billion) and in terms of the national shareof total services exported (32.6%), followed by Sweden (5.9%) (see Annex Table 3.10). As for computerservices alone, the item in computer and information services most closely linked to software-relatedservices, Ireland also ranked first in terms of exports in 2000 (USD 5.48 billion)19 followed by Germany(USD 3.71 billion) among countries for which such information was available.
In 2000, the United Kingdom and Spain ranked third and fourth, respectively, among net exportersof computer and information services in value terms, after Ireland and the United States. Germany, thethird largest exporter, was a net importer in 2000, with imports valued at USD 4.47 billion. With importsvalued at USD 3.07 billion, Japan was also a net importer. Imports and exports of computer andinformation services accounted for less than 5% of the total value of imports and exports of services inGermany and Japan. Available information on computer services shows that trade in computer andinformation services is largely trade in computer services in most OECD countries, except for Spainwhere information services account for more than two-thirds of trade in computer and informationservices.
The value of software royalties received and paid by a country is another indicator of themagnitude of its software trade. Information available for the United States shows that the inflow ofsoftware royalties more than tripled between 1992 and 2000, from USD 1.1 billion to USD 3.9 billion,considerably above the level of software royalties paid by the United States in other countries, areflection of its position as the world’s largest producer of software (US Department of Commerce,2000a, 2001).
Digital delivery
Digital delivery has a potentially large impact on the patterns of international trade andinvestment. Software ranks first in terms of on-line sales by type of product and digital delivery, withpotentially major effects on conventionally measured trade in software. In 1999, the value of softwareon-line sales was estimated at USD 1.24 billion, of which 6.5% was delivered on line. Books rankedsecond, followed by music, which ranked second in terms of digital delivery (Forrester Research, citedin Goldman Sachs, 2000). Electronic distribution of software and of other digitisable products isexpected to grow as technologies and bandwidth improve.
© OECD 2002
OECD Information Technology Outlook 2002
112
Digital delivery can take several forms. Using e-mail, files can be transferred from one computer toanother over the Internet. In centralised downloading, files are made available to a number of users ona server; for example, a file may be made available on the Internet for the general public to download(using FTP, HTTP, etc.). In peer-to-peer downloading (also called file swapping), one of the most recentdevelopments, a computer links directly to another and can download a file from the linked computer’shard drive (OECD, 1999).
Foreign direct investment
FDI is growing rapidly and is an important means of enabling the software industry to enter foreignmarkets and, in some cases, to access human resources abroad. A picture of its importance can beobtained from data on the activities of foreign affiliates of software firms (defined as those classifiedunder computer and related activities, ISIC 72), as detailed data on FDI flows are generally not availablefor the software sector.
Affiliates of US companies abroad account for a very significant share of computer and relatedactivities in the rest of the world, with total turnover equivalent to around one-half of the total worldpackaged software market in 1998. Their turnover has increased rapidly in the last decade and wasapproximately four times higher in 1998 than in 1993 (see Annex Table 3.11). US affiliates haveincreasingly turned towards Asian countries, in particular Japan, whose relative share has doubled interms of turnover, employment and employee compensation. Although there are no detailed dataavailable for India, it has been a dynamic exporter of customised software products. While some of itsexports are due to US and other foreign affiliates, most are due to extensive outsourcing to Indiansoftware firms to gain access to skilled software professionals (see in particular OECD, 2000a, Chapter 6).
Europe remains the main region for US software sector investment, although its share in terms ofturnover decreased between 1993 and 1998 from 67% to 58%. According to the Irish National SoftwareDirectorate, seven out of the ten of the world’s biggest independent software companies (Microsoft,Computer Associates, Oracle, Informix, Novell, SAP and Symantec) had a local productionestablishment in Ireland in 1997.20 In 2000, foreign companies accounted for more than 86% of softwaresector revenues, although they represented only 15% of the total number of software companies inIreland.21 Ireland’s success in attracting software investment has been largely driven by low corporatetaxes, good IT infrastructure and other factors, such as a large pool of skilled, English-speaking labour.
During the 1990s, European firms accounted for by far the most FDI in computer and relatedactivities in the United States in terms of employment and turnover (see Annex Table 3.12).Nonetheless, with the exception of the United Kingdom, Europe’s share of affiliate activity in the UnitedStates has declined, while foreign affiliates from Japan and Canada have significantly increased theiractivities. Overall, turnover of foreign affiliates in the United States almost doubled between 1990and 1996. Detailed official data on inward investment is also available for Sweden, where softwareconsultancy and supply (NACE 72.2, equivalent to ISIC 72.20) concentrates more than 81% of foreign-owned enterprises providing computer and related services (see Annex Table 3.13). In Sweden, theUnited States and the United Kingdom account for around 40% of foreign software sector employmentin the broadly defined software sector (NACE 72, equivalent to ISIC 72), while Finland and Franceaccounted for almost 15% each.
Domestic markets
National markets for software are growing rapidly, matching supply. Analysis of these marketsprovides further information on the development of the software industry. Market data are available forpackaged software and total IT services. According to International Data Corporation (IDC) data, aroundthree-quarters of expenditures on IT services are devoted to professional services, with the remainingquarter going to support services. However, as it is not possible to separate software-relatedprofessional services from total IT services, most information on domestic markets in this chapter refersto packaged software.
© OECD 2002

The Software Sector
113
The combined size of domestic markets for packaged software and total IT services, as a share ofGDP, differs considerably across OECD countries and remains relatively modest in most, ranging in 2001from 6.2% in Sweden to 0.6% in Turkey. In 2001, the average share in GDP of the domestic markets forpackaged software and IT services in OECD countries was 3.6%, with Sweden and New Zealand rankingfirst, with shares above 5%. The ranking changes, however, when looking at packaged software alone, asthe two countries with the largest packaged software markets as a share of GDP are the Netherlands andSweden, both slightly above 1%.
The world packaged software market was estimated at USD 196 billion in 2001 (see AnnexTable 3.14). The bulk of world packaged software sales remains highly concentrated within OECDcountries (95%). North America increased its share to 54% during the 1990s, with the United Statesaccounting for almost 50% against 44% in 1990. In contrast, EU countries and Japan saw their sharedecline, slightly for the former and more significantly for the latter, from 35% to 30% (Figure 5).
Packaged software has continued to increase its relative importance with respect to the total OECDICT market, although there is a wide dispersion across countries. On average in 2001, less thanUSD 9 out of USD 100 spent on ICT went towards packaged software (compared to 5.5% in 1992). Thisratio varied from more than 10% in the Netherlands, the United States, Finland and the United Kingdomto less than 5% in Poland, Greece, New Zealand, Japan, Korea, Mexico and Turkey (Figure 6). In terms ofdynamics, the Netherlands, Finland and Canada grew most rapidly between 1992 and 2001, with therelative importance of software within the ICT markets almost doubling. Countries which already in 1992had a high propensity to spend ICT funds on software increased that propensity in 2001. Among theG7 countries, only Italy saw the relative share of software decline slightly between 1992 and 2001; Japanis the least specialised, although the share of software in ICT spending increased slightly duringthe 1990s.
Figure 5. Geographical breakdown of packaged software markets, 1990-2001Billion current USD
Note: OECD North America includes Canada, Mexico and United States. OECD Asia includes Australia, Japan, Korea and New Zealand. OtherOECD include the Czech Republic, Hungary, Norway, Poland, the Slovak Republic, Switzerland and Turkey.
Source: OECD, based on data from WITSA/IDC.
1990 1991 1992 1993 1994 1995 1996 1997 1998 20011999 2000
200
140
120
100
80
0
160
180
60
40
20
200
140
120
100
80
0
160
180
60
40
20
9%
30%
54%
47%
35%
11%
OECD: North AmericaOECD: EU-14OECD: AsiaOther OECDRest of the world
1990 1991 1992 1993 1994 1995 1996 1997 1998 20011999 2000
200
140
120
100
80
0
160
180
60
40
20
200
140
120
100
80
0
160
180
60
40
20
9%
30%
54%
47%
35%
11%
OECD: North AmericaOECD: EU-14OECD: AsiaOther OECDRest of the world
1990 1991 1992 1993 1994 1995 1996 1997 1998 20011999 2000
200
140
120
100
80
0
160
180
60
40
20
200
140
120
100
80
0
160
180
60
40
20
9%
30%
54%
47%
35%
11%
OECD: North AmericaOECD: EU-14OECD: AsiaOther OECDRest of the world
© OECD 2002

OECD Information Technology Outlook 2002
114
Packaged software
This section describes product categories for packaged software based on demand-sideinformation (IDC, as reported in US Department of Commerce, 2000b). In 1999, applications softwareaccounted for about half of the market for packaged software worldwide, with 32% for systeminfrastructure software and 19% for software development tools, according to IDC (Figure 7).
Applications software
Applications software, the largest segment of the packaged software market, consists of computerprogrammes that enable users to perform specific activities. It can be broken down by user type intobusiness and consumer/home applications. Business applications can be further divided into cross-industry applications, for activities related to a particular business function, and vertical industryapplications, for activities inherent to a particular industry.
Enterprise Resource Planning (ERP) software22 takes the lion’s share of revenues in the cross-industry business applications software segment, with 14.2% of the world market for packaged softwarein 1999 (the highest market share for a single type of product, followed by operating systems in thesystems infrastructure segment, with 12.9%). Accounting, human resource management or wordprocessing are other office activities that can be performed by cross-industry business applications
Figure 6. Packaged software as a share of total ICT markets, 2001Percentages
Source: OECD, based on IDC data.
%0 2 4 6 8 10 12
United States
OECD 28
United Kingdom
Norway
Germany
Sweden
Belgium
Spain
Australia
Hungary
Portugal
Poland
New Zealand
Korea
Turkey
Netherlands
Finland
Switzerland
Canada
Austria
Denmark
France
EU 14
Czech Republic
Italy
Ireland
Slovak Republic
Greece
Japan
Mexico
%0 2 4 6 8 10 12
United States
OECD 28
United Kingdom
Norway
Germany
Sweden
Belgium
Spain
Australia
Hungary
Portugal
Poland
New Zealand
Korea
Turkey
Netherlands
Finland
Switzerland
Canada
Austria
Denmark
France
EU 14
Czech Republic
Italy
Ireland
Slovak Republic
Greece
Japan
Mexico
%0 2 4 6 8 10 12
United States
OECD 28
United Kingdom
Norway
Germany
Sweden
Belgium
Spain
Australia
Hungary
Portugal
Poland
New Zealand
Korea
Turkey
Netherlands
Finland
Switzerland
Canada
Austria
Denmark
France
EU 14
Czech Republic
Italy
Ireland
Slovak Republic
Greece
Japan
Mexico
© OECD 2002
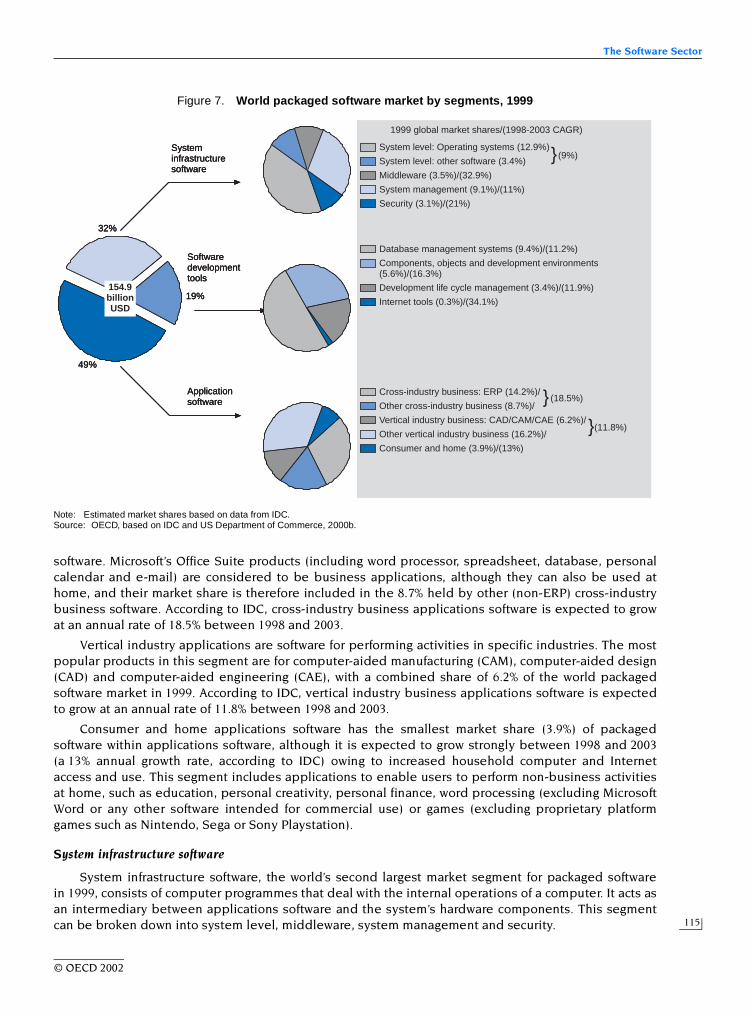
The Software Sector
115
software. Microsoft’s Office Suite products (including word processor, spreadsheet, database, personalcalendar and e-mail) are considered to be business applications, although they can also be used athome, and their market share is therefore included in the 8.7% held by other (non-ERP) cross-industrybusiness software. According to IDC, cross-industry business applications software is expected to growat an annual rate of 18.5% between 1998 and 2003.
Vertical industry applications are software for performing activities in specific industries. The mostpopular products in this segment are for computer-aided manufacturing (CAM), computer-aided design(CAD) and computer-aided engineering (CAE), with a combined share of 6.2% of the world packagedsoftware market in 1999. According to IDC, vertical industry business applications software is expectedto grow at an annual rate of 11.8% between 1998 and 2003.
Consumer and home applications software has the smallest market share (3.9%) of packagedsoftware within applications software, although it is expected to grow strongly between 1998 and 2003(a 13% annual growth rate, according to IDC) owing to increased household computer and Internetaccess and use. This segment includes applications to enable users to perform non-business activitiesat home, such as education, personal creativity, personal finance, word processing (excluding MicrosoftWord or any other software intended for commercial use) or games (excluding proprietary platformgames such as Nintendo, Sega or Sony Playstation).
System infrastructure software
System infrastructure software, the world’s second largest market segment for packaged softwarein 1999, consists of computer programmes that deal with the internal operations of a computer. It acts asan intermediary between applications software and the system’s hardware components. This segmentcan be broken down into system level, middleware, system management and security.
Figure 7. World packaged software market by segments, 1999
Note: Estimated market shares based on data from IDC.Source: OECD, based on IDC and US Department of Commerce, 2000b.
Systeminfrastructuresoftware
Softwaredevelopmenttools
Applicationsoftware
154.9billionUSD
32%
49%
19%
1999 global market shares/(1998-2003 CAGR)
System level: Operating systems (12.9%)
System level: other software (3.4%)
Middleware (3.5%)/(32.9%)
System management (9.1%)/(11%)
Security (3.1%)/(21%)
Database management systems (9.4%)/(11.2%)
Components, objects and development environments(5.6%)/(16.3%)
Development life cycle management (3.4%)/(11.9%)
Internet tools (0.3%)/(34.1%)
Cross-industry business: ERP (14.2%)/
Other cross-industry business (8.7%)/
Vertical industry business: CAD/CAM/CAE (6.2%)/
Other vertical industry business (16.2%)/
Consumer and home (3.9%)/(13%)
}
(11.8%)
(18.5%)
} (9%)
}
© OECD 2002
OECD Information Technology Outlook 2002
116
System-level software includes programmes such as operating systems and networking software.In 1999, operating systems had the highest share of the overall packaged software market for thissegment (12.9%). This subsegment is expected to grow at an annual rate of 9% between 1998 and 2003.
Middleware is software that enables shared use of computing resources across heterogeneoussystems. After Internet tools, it is expected to be the segment with the highest annual growth rate(32.9%) between 1998 and 2003. According to the US Department of Commerce (2000b), much of thisgrowth is due to programmes integrating software applications, in particular e-commerce applications.
The growing number of attacks on computer systems is drawing more attention to the issue ofinformation security. The number of incidents reported has risen enormously in the past few years.In 2000 and 2001, reported incidents grew by 121% and 142%, respectively.23 The security softwaresegment comprises firewall, encryption and antivirus software. It currently has a small share of theoverall packaged software market (3.1% in 1999), but it is projected to have the highest growth rate (21%between 1998 and 2003) after Internet tools and middleware.
Software development tools
Software development tools account for the smallest market share of the three segments, witharound one-fifth of the world market for packaged software in 1999. The segment is divided into:i) database management system tools; ii) components, objects and development environments(CODE), which are used to write code for software programmes; iii) development life cycle management(DLM) to support the software development process; and iv) Internet tools.
With 9.4%, database management systems, used to manipulate information in databases, has thelargest share of the overall packaged software market within this segment. For the other softwaredevelopment tools, growth will be driven by the increasing demand for Internet-related software, inparticular owing to the need to provide Internet access to databases.
Finally, although still small, Internet tools are projected to have the highest growth rates of allsoftware types considered, with a projected annual growth rate of 34.1% between 1998 and 2003. Growthin this area should be driven by increasing business demand for e-commerce solutions and overall veryrapid growth of Internet use for a widening range of other applications.
Open source
Open source software refers to software whose source code is publicly available.24 While opensource has been around since the early development of the computer industry, the communicationpossibilities made possible by the Internet has significantly boosted open source development. Opensource software is covered more extensively in Chapter 7.
Industry structure
Technical innovation, new entrants, alliances, mergers and acquisitions (M&As) and fiercecompetition are characteristics of the software sector that lead to rapidly changing market structures.This section focuses on firm-level developments, particularly on leading firms, strategic alliances,M&As, new entrants and global market concentration.
Leading vendors worldwide
Leadership tends to be a short-term phenomenon in software markets. Changes in top positionscan be illustrated by looking at the different products that have dominated software markets in thepast. For example, no product had more than 12 years with at least 25% of the market in the followingmarket segments for PC software: word processors, spreadsheets, databases, personal finance andoperating systems. The product which was a leader longest is DBASE, a database application softwareproduced by Ashton-Tate, which maintained its leadership from 1981 to 1993 (see Annex Table 3.15).
© OECD 2002

The Software Sector
117
However, for the first time in the history of the software industry, a single company, Microsoft, leadsin most of the selected market segments for PC software. Network effects derived from the fact that it isthe leader in several related markets may help extend its leadership.
Besides changes in leading positions, the growth in revenues of top companies is striking. Acomparison of the revenues obtained by the top ten vendors of PC applications software in 1983(USD 355 million) and in 2000 (USD 30.8 billion) (Softletter, 2001) reflects the spectacular growth of theindustry (see Annex Table 3.16).
Software Magazine’s ranking of the world’s top software and related services suppliers provides agood illustration of the market structure of the software sector. In 2000, the top 20 software and servicesvendors accounted for more than one-third of total sales of packaged software and IT services. Thefierce competition and constant technological innovation that characterise the industry can also beillustrated by the different positions held by current leading firms in previous rankings. However,despite considerable churning at the top, three of the current leading software vendors have beenamong the top five from 1996: IBM, Microsoft and Oracle.
Table 1 lists the top 20 software vendors in 2000, their software-related revenue (licenses andservices), their main corporate industrial activity and their primary software business. As regards mainindustrial activity, they can be broken down into independent software vendors, hardwaremanufacturers and consulting firms.
Table 2 shows 1999 revenues broken down by license (e.g. packaged software) and services.Independent software vendors and hardware manufacturers are active in both segments; consultingfirms only provide services. The top ten firms by license revenue concentrate 34% of the value of theworld’s packaged software sales, as estimated by IDC. On the other hand, the top ten firms by servicesrevenue account for only 10% of the overall market for IT services. The market for IT services is thus lessconcentrated and enjoys higher revenues than the market for packaged software, with total market sizeof IT services more than five times the market for packaged software.
Independent software vendors
Independent software vendors are companies whose primary activity is the development andsupply of software. Examples include the companies listed in Table 1 whose primary business fallsunder US SIC 7371 (computer programming services) or 7372 (packaged software), such as Microsoft,Oracle and Computer Associates.
In 1999, Microsoft ranked first in terms of packaged software sales (license revenue), at almosttwice the revenues of IBM (Table 2). Microsoft has a strong presence in all packaged software marketsegments: in system infrastructure software with the Windows operating system, in businessapplications software with its Office Suite and in software development tools with Visual Basic.
Other independent software vendors hold top positions in packaged software market sub-segments but are also active in other software market segments, such as Computer Associates in systemmanagement software, the German-based SAP AG in enterprise resource management (ERP) and Oraclein databases.
Independent software vendors often provide both packaged and customised software. However,owing to lack of information, it is not possible to distinguish between these two types of revenues.
Hardware manufacturers
Hardware manufacturers have long been at the top of the ranking of software vendors. From theearly 1960s, computer manufacturers supplied software together with hardware. Some was systeminfrastructure software, and some was applications software designed for the specific requirements oflarge customers installing computer systems.
© OECD 2002

OECD Information Technology Outlook 2002
118
System infrastructure software was included in the price of the hardware (“bundled”) and notinvoiced separately, while applications software was usually the object of a turnkey contract. Somemanufacturers also designed custom software as part of their time-sharing services. But the ancillarystatus of software as a sales support for hardware evolved over the 1960s and 1970s, particularlyfrom 1969, when the US Department of Justice required IBM to invoice its hardware and softwareseparately. This arrangement, by which hardware manufacturers supplied software separately(“unbundled”), is regarded as having founded the software market and thereby the software industry(OECD, 1985).
IBM is the only hardware manufacturer that has remained a leading software vendor since then, aposition consolidated in 1995 with its acquisition of Lotus. The increasing importance of its softwareproducts and services sales is reflected in the fact that software-related revenue surpassed hardwaresales in 1997 and continues to grow (Figure 8).
Table 1. Top 20 software vendors, 2000
Note: The ranking is based on total worldwide software/services revenue, which comprises license revenue, maintenance and support, training andsoftware-related services revenue. Suppliers are not ranked on their total corporate revenue, since many have other lines of business, such ashardware or entertainment/gaming software. When possible, revenues are based on the calendar year so that all firms are measured over thesame four quarters. Financial information was gathered from Software Magazine’s vendor survey, public documents, press releases, SEC filingsand industry analysts. Official US SIC classifications from EDGAR (www.edgar-online.com), except for privately owned companies(e.g. PricewaterhouseCoopers). Primary software business as reported by Software Magazine.
1. Calendar year revenue annualised from quarterly filings. Fiscal year ends 30 June 2000.2. Revenue reflects fiscal year ending 30 June 2000.3. Total software/services revenue includes estimated software revenue, based on 1999 estimates by IDC.4. Revenue is pro forma, includes Ernst and Young.5. Revenue is pro forma, pro rata, as the company has changed its business model and the way it reports revenue.6. Revenue reflects fiscal year ending 31 March 2001.7. Revenue restated to reflect acquisitions.Source: OECD, based on Software Magazine (2001), “2001 Software 500”, June.
Ranking 2000
CompanySoftware
and services revenue (USD millions)
US SIC Primary software business
1 IBM Corp. 45 750.0 3570 Middleware, connectivity, application servers, Web servers, operating system
2 Microsoft Corp.1 23 845.0 7372 Desktop applications, operating system3 PricewaterhouseCoopers2 21 500.0 – IT services, sourcing, consulting4 EDS 19 227.0 7370 IT services, sourcing, consulting5 Oracle Corp.1 10 745.1 7372 Databases6 Hewlett-Packard Co.3 10 397.0 3570 Infrastructure and systems management,
middleware, connectivity, operating system7 Accenture 10 276.0 7389 IT services, sourcing, consulting8 Cap Gemini Ernst and Young4 8 064.4 7371 IT services, sourcing, consulting9 Compaq Computer Corp.3 7 352.0 3570 IT services, sourcing, consulting, operating system
10 Unisys Corp.3 5 843.2 7373 Infrastructure and systems management, middleware, storage management
11 SAP AG 5 797.0 7372 ERP12 Computer Associates International Inc.5 5 515.0 7372 Management of Infrastructure, performance,
assets, systems 13 Hitachi Ltd.6 5 300.0 3570 Management of Infrastructure, performance, asset,
systems 14 Sun Microsystems Inc.1, 3 4 668.9 3571 Application development and testing tools,
middleware, connectivity, servers, operating system
15 NCR Corp. 3 010.0 7374 Data warehouses, query tools, OLAP16 Compuware Corp. 2 077.6 7372 Application development, testing and lifecycle
tools17 Siebel Systems Inc.7 1 795.4 7372 CRM18 PeopleSoft Inc. 1 736.5 7372 ERP19 SunGard Data Systems Inc. 1 660.7 7374 Financial application20 Fiserv Inc. 1 653.6 7374 ASP, MSP
© OECD 2002

The Software Sector
119
Consulting firms
Consulting firms have been ranked among the top positions since 1999, owing to a change inSoftware Magazine’s definition of “software vendor” to reflect the software industry’s shift to a services-based business model. In that year, Software Magazine added revenues from training and software-relatedservices to the revenues used to build the ranking of top software vendors; it had previously countedonly license fees and revenues from product maintenance and support.
Table 2. Leading vendors worldwide by license and service revenues, 1999
Note: Software license revenue estimates provided by IDC for Hewlett-Packard Company, Unisys Corp. and Compaq Computer Corp.Source: Software Magazine, 2000.
Top ten by software license Top ten by service revenue
1999 overall ranking
CompanyLicense revenue (USD millions)
1999 overall ranking
CompanyService revenue (USD millions)
2 Microsoft Corp. 21 591 1 IBM Corp. 32 2001 IBM Corp. 12 700 3 PricewaterhouseCoopers 17 3008 Computer Associates International Inc. 4 962 5 Andersen Consulting LLP 8 9414 Oracle Corp. 3 873 7 Compaq Computer Corp. 6 6236 Hewlett-Packard Company 2 542 6 Hewlett-Packard Company 6 192
10 SAP AG 1 946 4 Oracle Corp. 5 45511 Sun Microsystems Inc. 1 302 10 SAP AG 3 12520 Unisys Corp. 1 207 12 Bull Worldwide Information Systems 2 7907 Compaq Computer Corp. 1 156 14 Ernst and Young LLP 2 000
19 Novell Inc. 1 092 11 Sun Microsystems Inc. 1 935
Top ten total 52 371 Top ten total 86 562
Figure 8. Share of software and services in IBM revenue, 1989-2000
Note: Break in series in 1996.Source: OECD, based on annual reports.
1989 1990 1992 1993 1994 1995 19961 1997 1998 2000
70
40
30
20
10
0
50
60
1991 1999
70
40
30
20
10
0
50
60
Software and services Hardware
% of the total revenue % of the total revenue
1989 1990 1992 1993 1994 1995 19961 1997 1998 2000
70
40
30
20
10
0
50
60
1991 1999
70
40
30
20
10
0
50
60
Software and services Hardware
% of the total revenue % of the total revenue
1989 1990 1992 1993 1994 1995 19961 1997 1998 2000
70
40
30
20
10
0
50
60
1991 1999
70
40
30
20
10
0
50
60
Software and services Hardware
% of the total revenue % of the total revenue
© OECD 2002

OECD Information Technology Outlook 2002
120
The success of IT consulting services began in the 1980s, mainly owing to the popularisation ofautomated internal processing, which required re-engineering, for example ERP systems. Companiessuch as EDS, Cambridge Technology Partners, Cap Gemini Sogeti and the Big Five accounting firms ledsales at the time.
The last few years have seen a major reorganisation in the largest traditional accountancy andconsulting firms, in an effort to adapt to, and profit from, new Internet-related business models. Theincreasing need to make e-business methods profitable has fostered the application of traditionalmanagement consulting services to IT applications. Recent strategic alliances between traditionalconsulting firms and software producers have helped configure these new business models. Examplesare the acquisition of the consulting arm of Ernst and Young by Cap Gemini Sogeti, and Cisco Systems’alliances with KPMG Consulting and Cap Gemini Sogeti. Three of the Big Five accountancy andconsulting firms are now among the world’s top 10 software vendors: PricewaterhouseCoopers,Accenture (formerly Andersen Consulting) and Cap Gemini Ernst and Young (Table 1).
Strategic alliances
Software is becoming one of the most popular areas for strategic alliances, whether or not thepartners belong to the software sector. Strategic alliances are commonly seen as a way to gain access toneeded complementary capabilities. This explains why companies outside the software sector enterinto software-related alliances. The number of software-related strategic alliances has increasedstrongly in the last few years. In particular, strategic alliances to provide information retrieval services(which mainly cover Internet-related activities) represented around one-third of all strategic alliancesin 2000. Figure 9 shows the share of alliances mainly concerned with packaged software and informationretrieval services, the software-related areas with the highest number of strategic alliances as apercentage of all announced strategic alliances between 1990 and 2000.
Figure 9. Share of selected software-related strategic alliances in all announced alliances, 1990-2000
Note: The selected software-related strategic alliances comprise those mainly concerned with packaged software (US SIC 7372) or informationretrieval services (US SIC 7375).
Source: OECD, based on Thomson Financial.
1990 1992 1993 1994 1995 1996 1997 1998 20001991 1999
25
10
5
0
15
20
25
10
5
0
15
20
% %
Prepackaged Information retrieval
1990 1992 1993 1994 1995 1996 1997 1998 20001991 1999
25
10
5
0
15
20
25
10
5
0
15
20
% %
Prepackaged Information retrieval
1990 1992 1993 1994 1995 1996 1997 1998 20001991 1999
25
10
5
0
15
20
25
10
5
0
15
20
% %
Prepackaged Information retrieval
© OECD 2002

The Software Sector
121
Mergers and acquisitions
Software companies are very active in mergers and acquisitions. Growth by acquisition is acommon strategy in the software industry: according to Software Magazine, 36% of the top 500 softwarevendors acquired at least one company during 2000. Software developers and suppliers are among themost common targets for cross-sectoral M&As, with financial institutions and telecommunicationscompanies among the top acquirers. Within the broadly defined software sector, M&As betweensoftware developers and providers of computer-related services are relatively frequent (OECD, 2001).
Figure 10 shows that, as for strategic alliances, packaged software and information retrieval servicesare also the software-related areas with the highest number of M&As as a percentage of all completedM&As between 1990 and 2000. Overall, as many as 10% of all completed M&As in 2000 involvedproviders of packaged software, and another 10% involved firms providing information retrievalservices.
Supply-side concentration
The market share of the world’s top software vendors has increased regularly (Figure 11). However, acloser look shows that much of this is due to changes in the definition of software vendors and thereclassification of very large firms. The substantial increase in concentration ratios between 1995 and 1996was largely due to the reclassification of IBM as a software vendor after its acquisition of Lotus in 1995.While IBM was not among the top 100 software vendors in 1995, it ranked first in 1996. In addition, theinclusion of revenue from training and software-related services in total software and services revenuessince 1999 not only increased the range of software-related revenues considered to determine theranking, but also added two of the world’s largest consulting and accountancy firms to the top 100 softwarevendors in 2000: PricewaterhouseCoopers in third place and Cap Gemini Ernst and Young in eighth.In 2000, although the share of the top vendor (IBM) declined slightly, concentration ratios for the top 5,top 10, top 20, top 50 and top 100 software firms all increased (see Annex Table 3.17).
Figure 10. Share of selected software-related M&As in all completed M&As, 1990-2000
Note: The selected software-related M&As comprise deals for which the primary activity of the target or the acquirer is packaged software (US SIC7372) or information retrieval services (US SIC 7375).
Source: OECD, based on Thomson Financial.
1990 1992 1993 1994 1995 1996 1997 1998 20001991 1999
% %10
7
6
0
8
9
5
2
3
4
1
10
7
6
0
8
9
5
2
3
4
1
Prepackaged software Information retrieval services
1990 1992 1993 1994 1995 1996 1997 1998 20001991 1999
% %10
7
6
0
8
9
5
2
3
4
1
10
7
6
0
8
9
5
2
3
4
1
Prepackaged software Information retrieval services
1990 1992 1993 1994 1995 1996 1997 1998 20001991 1999
% %10
7
6
0
8
9
5
2
3
4
1
10
7
6
0
8
9
5
2
3
4
1
Prepackaged software Information retrieval services
© OECD 2002

OECD Information Technology Outlook 2002
122
Recent data show that while the industry leader significantly increased its share between 1997and 2000 in the United Kingdom, its share has remained stable over the period both in Germany andItaly, and has decreased in both France and Spain (see Annex Table 3.18). Concentration ratios in thesoftware industry should nevertheless be treated with caution, as they may be affected by changes inthe definition of software markets and software vendors.
New entrants
In spite of a few large players, the software sector is relatively fragmented and remains much lessconcentrated than computer hardware, for example. Some commentators suggest that thepredominance of a fringe of small companies in the industry will be reinforced by the move tocomponent-based software development, which will lead to greater specialisation and foster thecreation of strategic alliances and further globalisation of software supply (Nowak and Grantham, 2000).On the other hand, network effects may lead to increasing consolidation; despite high entry rates, largeestablished firms tend to acquire successful start-ups to acquire new technologies or reach newmarkets. New entrants are nevertheless an important driver of competition in software and servicesmarkets, where close to 40% of the top 500 vendors in 1999 were founded after 1990.25
A large part of this new fringe consists of start-ups born from partnerships between entrepreneursand venture capitalists. Both private and public investment is increasing, with funds coming from publicsector grants, public-private partnerships and business incubators (often working in conjunction withstate and regional funds) as well as private venture capitalists. In addition to financial resources,external support is also essential, including access to low-cost infrastructure, adequate managementskills and knowledge and marketing resources.
The share of software in technology venture capital investments has remained relatively constantin the last few years in both the United States (around one-sixth) and Europe (around 30%), althoughthese ratios are not directly comparable owing to methodological differences in surveys (Table 3).
Figure 11. Share of top software and services vendors on world markets, 1995-2000
Note: Break in series in 1999. Software and services revenues until 1998 only include license fees and revenues from product maintenance andsupport. Revenue from professional services/consulting, custom programming, training and hardware sales was excluded. In 1999, revenuefrom training and software-related services was added.
Source: OECD, based on data from Software Magazine and WITSA/IDC.
45% %
40
35
30
25
20
15
10
5
0
45
40
35
30
25
20
15
10
5
01995 1996 1997 1998 1999 2000
TOP 100TOP 50TOP 20TOP 10TOP 5TOP 1
45% %
40
35
30
25
20
15
10
5
0
45
40
35
30
25
20
15
10
5
01995 1996 1997 1998 1999 2000
TOP 100TOP 50TOP 20TOP 10TOP 5TOP 1
45% %
40
35
30
25
20
15
10
5
0
45
40
35
30
25
20
15
10
5
01995 1996 1997 1998 1999 2000
TOP 100TOP 50TOP 20TOP 10TOP 5TOP 1
© OECD 2002

The Software Sector
123
However, total European technology venture capital investments are only a fraction of those in theUnited States, which may help explain why Europe and the rest of the world lag the United States insoftware industry developments.
Conclusion
The software sector will continue to undergo dynamic change, driven by innovation and businessstrategies. Provision of software applications services is one emerging trend already evident in theappearance of some of the world’s largest consulting firms among software vendors; it will be reinforcedif outsourcing continues to gain acceptance. The Internet and the move to network computing willfacilitate this type of software supply which now focuses on certain software segment applications (e-mail and ERP) and may extend to all kinds of e-commerce and specialised software services.Application service providers (ASPs) include new entrants such as Verio, as well as established softwarevendors (Oracle, Sun Microsystems, IBM) that are facing competition from new entrants in this emergingmarket segment (US Department of Commerce, 2000b).
The rivalry between open and proprietary source code software will intensify, with most of the largesoftware vendors already supporting the open source movement. This may become one of the driversof changes in market structure.
Integration and greater compatibility of software products are crucial in a world whereinterconnection, e-commerce and automation of business functions are increasingly important. Openstandards and the open source movement may help to meet this need. On the other hand, newbusiness models, such as software outsourcing to ASPs, may help small and medium-sized enterpriseskeep pace with the constant technological changes that characterise the software industry, withoutincurring substantial sunk costs. Software companies will have to take these new trends in softwaredevelopment and supply into account.
Table 3. European and US software venture capital investments,1 1996-2001
1. Amounts may be not comparable owing to methodological differences across regions.Source: OECD, adapted from PricewaterhouseCoopers (2002 for the United States and 2001 for Europe).
1996 1997 1998 1999 2000 2001
United StatesSoftware (USD millions) 1 736 2 932 3 675 8 311 16 978 6 851As a percentage of total technology 18.0 20.4 19.2 15.8 17.0 18.8
EuropeSoftware (USD millions) . . . . . . 2 247 3 819 . .As a percentage of total technology . . . . . . 30.9 31.3 . .
© OECD 2002

OECD Information Technology Outlook 2002
124
NOTES
1. The broadly defined software sector comprises computer and related activities (ISIC 72). For countries forwhich information is available, value added of the narrowly defined software sector (software consultancy andsupply: ISIC 7220) represents a large share of the value added of computer and related activities (ISIC 72),ranging in 1998 from 86% for Sweden to 44% for France.
2. As improved data become available, cross-country value added per employee trends and comparisons for thesector could be explored in more detail.
3. As in the case of value added, core software activities (software consultancy and supply: ISIC 7220) represent alarge share of total employment in computer and related activities, ranging from 84% for Sweden to 41% forFrance in 1998.
4. According to US Bureau of Labor Statistics data. Computer related occupations are considered to beengineering, natural science and computer and information system managers, database administrators,systems analysts, computer programmers, computer engineers, computer support specialists, all othercomputer scientists, data entry keyers and computer operators.
5. “Informaticiens”, i.e. computer engineers and computer technicians, excluding maintenance.
6. The estimation of price indices for rapidly evolving ICT products is very difficult. Quality improvements insoftware are even more difficult to measure than in hardware. For recent work on this issue, see Colecchia andSchreyer (2001).
7. Colecchia and Schreyer (2001) give a brief description of deflation methods applied to ICT assets acrossselected countries, including the United States.
8. Data on business enterprise expenditure on R&D (BERD) include both costs of in-house production financedby own funds and the purchase of R&D from third parties.
9. Since the 1993 edition of the OECD statistical guidelines (Frascati Manual), a software development project isclassified as R&D if its completion is dependent on the development of a scientific and/or technologicaladvance, and the aim of the project is resolution of a scientific and/or technological uncertainty on a systematicbasis. As a result, software-related activities of a routine nature, or technical problems which have beenovercome in previous projects, are not considered to be R&D. It is also worth noting that R&D expendituresalso include software activities undertaken as part of an overall R&D project (Young, 1996).
10. One of the main difficulties for counting software patents is that patent classes tend to be broken down bytechnological fields and that software inventions may cover several. Ongoing work at the OECD aims atidentifying international patent classes related to e-commerce, ICT (hardware and software) andbiotechnology.
11. Each patent is assigned a single original patent classification by the US Patent and Trademark Office (USPTO),and often several other cross-reference classifications. Counting patents by their original classification preventsdouble counting.
12. The USPTO does not provide information on the number of patents originally classified under patentclasses 703, 716 and 717. See USPTO, 2000.
13. Searching for the word software in the patent claim instead of the patent description provides lower figures forsoftware-related patents.
14. The system of National Accounts 1993 (SNA 93) stipulated that software purchases by firms, subject to certainconditions, should be considered as investment. Previously, software expenditures were accounted as grossfixed capital formation when integrated into purchases of hardware, and as intermediate consumptionotherwise (OECD, 2000b; Colecchia and Schreyer, 2001). Khan (2001) provides a comparison of information fromprivate sources and national accounts on investment in software. According to SNA 93, software only qualifiesas an intangible investment if not bundled with hardware (when it is counted as a tangible asset under“machinery and equipment”), if it is used for more than one year and if its cost exceeds a certain threshold.Otherwise it is counted as intermediate consumption. Countries have only recently started to apply this newsystem and several measurement and methodological differences need to be addressed before proper
© OECD 2002

The Software Sector
125
international comparisons can be made, in particular: i) the interpretation of what should be treated assoftware; ii) the valuation of own-account software; and iii) the choice of appropriate deflators to measureinvestments in real terms. For an analysis of the contribution of software expenditures to output growth, seeColecchia and Schreyer (2001).
15. OECD (1998) illustrates some of these problems: “If a company sells a software application and manualsabroad directly, the operation can be recorded as exports of goods. If it sells them to a computer companywhich loads them on its computers before export, they will be included in the value of the computers that areexported. If instead a copy of the software is sold to a foreign firm which pays royalties to make further use of it,this operation will appear in the balance of payments as an export of business services. To complicate thematter further, if a company opens a branch abroad, the income accruing from software sales will be recordedas the income of the branch and will be a component in its profits. When these are remitted to the homecountry, they will appear in the balance of payments as investment income.”
16. Enterprise Ireland Software Industry Statistics for 1993-2000, at: www.nsd.ie/htm/ssii/stat.htm (viewed inJanuary 2002).
17. “The Irish software industry – a European success story” at www.techwatch.ie/fea/1998_314.htm (viewed inMay 2001).
18. “Ireland, the software capital of Europe” at www.enterprise-ireland.ie/connect-profiles.asp?sectorid=19 (viewed inJanuary 2002).
19. Computer services accounted for 100% of computer and information services trade in Ireland, 1998-2000.Information services trade alone was below the statistical significance threshold (conversation with expertsfrom the Irish Central Statistical Office, 14 February 2002).
20. “Ireland as an offshore software location” at www.nsd.ie/inflitof.htm (viewed in April 1999).
21. Enterprise Ireland Software Industry Statistics for 1993-2000, at: www.nsd.ie/htm/ssii/stat.htm (viewed inJanuary 2002).
22. ERP software consists of cross-industry applications that automate firms’ business processes. Commonapplications include human resources, manufacturing and financial management (US Department ofCommerce, 2000b).
23. CERT Coordination Centre, www.cert.org/stats/cert_stats.html (viewed in May 2002). CERT/CC defines an incident as“the act of violating an explicit or implied security policy” and includes in this definition: i) attempts (failed orsuccessful) to gain unauthorised access to a system or its data; ii) unwanted disruption or denial of service;iii) unauthorised use of a system for the processing or storage of data; iv) changes to system hardware orsoftware characteristics without the owner’s knowledge, instruction or consent.
24. For a more specific definition, see DiBona et al., 1999, Appendix B, The Open Source Definition, Version 1.0.
25. “In like a legacy, out like an e-business” at www.softwaremag.com (viewed in May 2001).
© OECD 2002

OECD Information Technology Outlook 2002
126
REFERENCES
CBS/Statistics Netherlands (2000),R&D en software-onderzoek bij bedrijven in Nederland, CBS/Statistics Netherlands, Voorburg.
Colecchia, A. and P. Schreyer (2001),“ICT investment and economic growth in the 1990s: is the United States a unique case? A comparative study ofnine OECD countries”, OECD STI Working Papers 2001/7.
C. DiBona, S. Ockman and M. Stone (1999),Open Sources, O’Reilly.
Goldman Sachs (2000),“Internet Global”, 6 October 2000.
Hagel, J. and A.G. Armstrong (1997),Net Gain, Harvard Business School Press.
INSEE (2000),L’emploi dans les services marchands, Paris.
Khan, M. (2001),“Investment in Knowledge”, OECD STI Review, No. 27.
Lerenard, A. and A. Tanay (1998),L’emploi dans le secteur des technologies de l’information et des télécommunications, Premières Informations et Premières Synthèses,DARES, ministère de l’Emploi et de la Solidarité.
Nowak, M.J. and C.E. Grantham (2000),“The Virtual Incubator: Managing Human Capital in the Software Industry”, Research Policy, 29.
OECD (1985),Software: An Emerging Industry, OECD, Paris.
OECD (1998),Measuring Electronic Commerce: International Trade in Software, OECD, Paris.
OECD (1999),“Electronic Commerce: Case Studies on the ‘Downloadable’ Digital Products”, internal working document.
OECD (2000a),Information Technology Outlook 2000, Paris.
OECD (2000b),“Software in the National Accounts: Recent Developments”, STD/NA(2000)37.
OECD (2001),New Patterns of Industrial Globalisation: Cross-Border M&As and Alliances, Paris.
PricewaterhouseCoopers (2001),Money for Growth: the European Technology Investment Report.
PricewaterhouseCoopers (2002),MoneyTree Survey 1995-2000.
Schumpeter, J.A. (1950),Capitalism, Socialism and Democracy, Harper.
Softletter (2001),The 2001 Softletter 100. www.softletter.com
US Department of Commerce (2000a),Digital Economy 2000, Washington, DC.
US Department of Commerce (2000b),US Industry and Trade Outlook 2000, Washington, DC.
© OECD 2002

The Software Sector
127
US Department of Commerce (2001),Survey of Current Business, December 2001 issue, US International Services, Washington.
US Department of Commerce (2002),Digital Economy 2002, Washington, DC.
US Patent and Trademark Office (2000),“Patent Counts by Class by Year: January 1977-December 1999”, Washington, DC, April.
Young, A. (1996),Measuring R&D in Services, STI Working Paper, OCDE/GD(96)132.
© OECD 2002
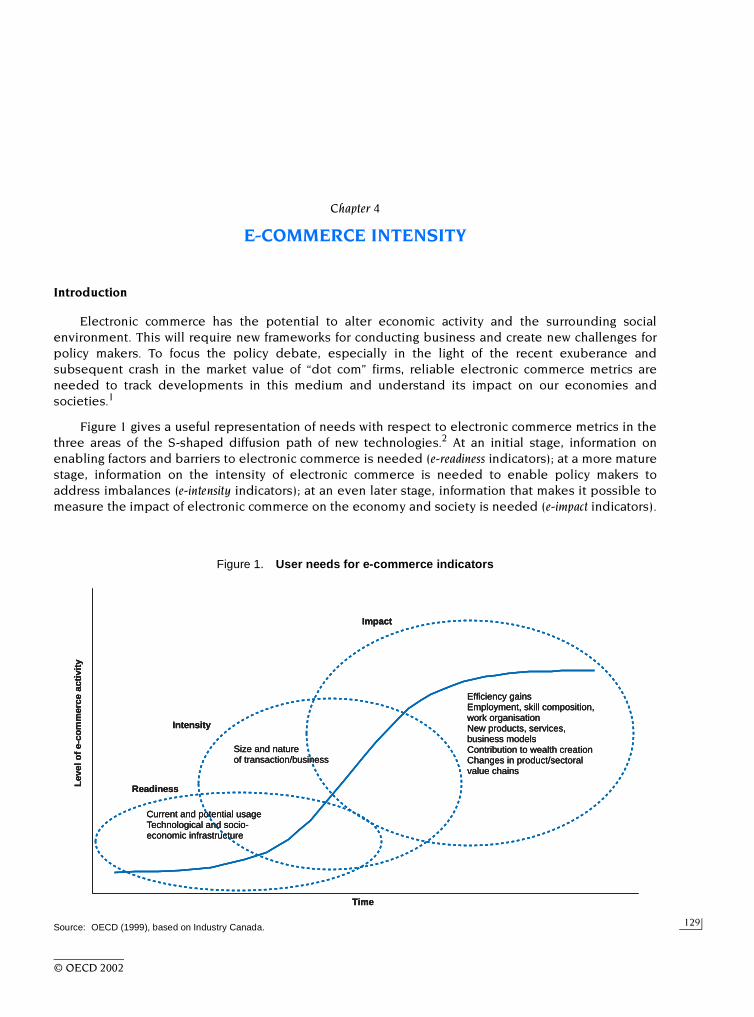
129
Chapter 4
E-COMMERCE INTENSITY
Introduction
Electronic commerce has the potential to alter economic activity and the surrounding socialenvironment. This will require new frameworks for conducting business and create new challenges forpolicy makers. To focus the policy debate, especially in the light of the recent exuberance andsubsequent crash in the market value of “dot com” firms, reliable electronic commerce metrics areneeded to track developments in this medium and understand its impact on our economies andsocieties.1
Figure 1 gives a useful representation of needs with respect to electronic commerce metrics in thethree areas of the S-shaped diffusion path of new technologies.2 At an initial stage, information onenabling factors and barriers to electronic commerce is needed (e-readiness indicators); at a more maturestage, information on the intensity of electronic commerce is needed to enable policy makers toaddress imbalances (e-intensity indicators); at an even later stage, information that makes it possible tomeasure the impact of electronic commerce on the economy and society is needed (e-impact indicators).
Figure 1. User needs for e-commerce indicators
Source: OECD (1999), based on Industry Canada.
Impact
Size and natureof transaction/business
Intensity
Readiness
Time
Lev
el o
f e-
com
mer
ce a
ctiv
ity
Current and potential usageTechnological and socio-economic infrastructure
Efficiency gainsEmployment, skill composition,work organisationNew products, services,business modelsContribution to wealth creationChanges in product/sectoralvalue chains
© OECD 2002

OECD Information Technology Outlook 2002
130
The degree of e-readiness requires indicators that reflect the country’s socio-economic andtechnological infrastructure and its use. Particularly important are indicators that express the potentialfor readiness, i.e. the propensity of individuals, businesses or governments to transact or carry outbusiness electronically (e.g. indicators of credit card use, indicators of the barriers or the perceivedbenefits to electronic commerce). E-intensity indicators give information on the size, growth and natureof electronic commerce transactions/business. It is important to know: for what component of atransaction electronic commerce is used (e.g. information gathering, purchase, sale, payment) or in whatbusiness function; who are the actors involved in the transaction/business and what are their socio-economic characteristics; what are the products and services involved; and whether the transaction isdomestic, international, urban or rural. The e-impact indicators would focus on the value addedgenerated by the use of electronic business processes, such as the impact on production processes andbusiness models, on the workplace and more generally on society.
This chapter focuses on e-intensity indicators, in particular on the use of the Internet to purchase andsell, as well as on the nature and volume of electronic commerce transactions. In the aftermath of the“dot com” crash, many “virtual” start-ups that sold and/or purchased exclusively on line havedisappeared. Overall, the growth of electronic commerce transactions has been less spectacular thansome consultants had predicted. On the other hand, newly available official statistics show that, whilestill small, the volume of electronic transactions is growing and that the Internet is increasingly beingused as a channel for transactions, especially purchases.
The chapter begins by defining what is meant by electronic commerce transactions and byhighlighting some of the relevant measurement issues. Available and comparable official statistics formeasuring electronic transactions are still limited. This chapter uses the few high-quality indicatorsavailable to capture the nature and volume of electronic commerce transactions and identify commontrends across countries, sectors and firm size. Finally, it exploits existing surveys to discuss some of thebenefits of and barriers to electronic commerce transactions as perceived by businesses andindividuals.
Defining and measuring electronic commerce transactions
The need for statistics that measure the level, growth and composition of e-commerce has fuelledthe increase in e-consultants who provide many kinds of “e-estimates” that cannot be easily compared.Despite very recent efforts by national statistical offices, internationally comparable statisticsmeasuring the level, growth and composition of electronic commerce transactions are not yet available.Comparisons are hampered by the use of different definitions across countries as well as by differencesin survey coverage. The United States, for example, does not produce economy-wide estimates anduses a broad definition that includes sales over “Internet, extranet, electronic data interchange (EDI)3 orother on-line systems”. France currently only published estimates of Web retail sales. Figures for theNordic countries refer to sales via a Web page and do not cover the financial sector. Australia andCanada have similar definitions and coverage of Internet transactions.
To improve the comparability of estimates of electronic commerce transactions, OECD Membercountries endorsed, in April 2000, two definitions of electronic transactions (electronic orders), basedon narrower and broader definitions of the communications infrastructure. According to the OECDdefinitions, the method by which the order is placed or received, not the payment or the channel ofdelivery, determines whether the transaction is an Internet transaction (conducted over the Internet) oran electronic transaction (conducted over computer-mediated networks). In 2001, the OECD developedguidelines for interpreting the definitions of electronic commerce and encouraged Member countries totake such guidelines into account when developing their questionnaires (Table 1).
The OECD definitions of electronic commerce transactions, as well as a list of core electroniccommerce indicators that Member countries seek to measure on an internationally comparable basis,have been incorporated into the OECD model questionnaire on ICT usage in businesses.4 This chaptermakes an attempt to exploit some of the most recent official statistics. Given that efforts to harmonise
© OECD 2002

E-commerce Intensity
131
these statistics are very recent, that in some countries the surveys have been carried out for the firsttime and that there exist differences in collection vehicles, international comparisons of electroniccommerce transactions should be interpreted with caution (see Box 1).
The use of the Internet in transaction-related business processes
A pattern that emerges from the available surveys is that different applications (e.g. Web, extranet,EDI) are used for different business processes. One implication is that there will be a different degreeof substitutability among electronic commerce technologies. The use of Internet-based applications, forexample, has emerged in every country as a medium for sharing information and for marketing; theintroduction of low-cost Internet applications for procurement, however, promotes the use of theInternet for purchasing. The rate of diffusion of Internet applications across countries will thus differ andwill depend on the prior use of alternative technologies/applications to perform the same businessfunctions and on the cost of switching to the Internet.
The Internet is still mostly used by enterprises to provide and access information (marketing,information search). In some countries a large proportion of businesses using the Internet also use it tocarry out financial transactions (e.g. 84% in Finland, 70% in Denmark and 36% in Australia). However, theInternet is still rarely used to carry out transactions (sending and receiving orders).
The International Benchmarking Study5 (Department of Trade and Industry – DTI, 2000) containsinformation on the use of different applications for ordering goods from suppliers or accepting ordersfrom customers (e-mail, Web site/Internet, extranet or EDI). Of the four applications considered, e-mailis generally the one most used for receiving orders on line, while extranets are least used.6 For the eightcountries covered in the report, 9% of businesses7 on average allowed their customers to use anextranet to order on line, compared with 20% for EDI, 65% for the Web and 74% for e-mail. EDI orderswere highest in France (31%) and lowest in Sweden (10%). E-mail was least popular for on-line orders inFrance (51%) and most popular in Italy (85%). In the case of purchases, Web applications are used morefrequently than e-mail orders.
Table 1. OECD definitions of electronic commerce transactions and proposed guidelines for their interpretation
Source: OECD.
E-commerce transactions OECD definitionsGuidelines for the interpretation of the definitions (WPIIS proposal April 2001)
BROAD definition An electronic transaction is the sale or purchase of goods or services, whether between businesses, households, individuals, governments, and other public or private organisations, conducted over computer-mediated networks. The goods and services are ordered over those networks, but the payment and the ultimate delivery of the good or service may be conducted on or off line.
Include: orders received or placed on any on line application used in automated transactions such as Internet applications, EDI, Minitel or interactive telephone systems.
NARROW definition An Internet transaction is the sale or purchase of goods or services, whether between businesses, households, individuals, governments, other public or private organisations, conducted over the Internet. The goods and services are ordered over the Internet, but the payment and the ultimate delivery of the good or service may be conducted on or off line.
Include: orders received or placed on any Internet application used in automated transactions such as Web pages, extranets and other applications that run over the Internet, such as EDI over the Internet, Minitel over the Internet, or over any other Web-enabled application regardless of how the Web is accessed (e.g. through a mobile or a TV set, etc.).Exclude: orders received or placed by telephone, facsimile or conventional e-mail.
© OECD 2002
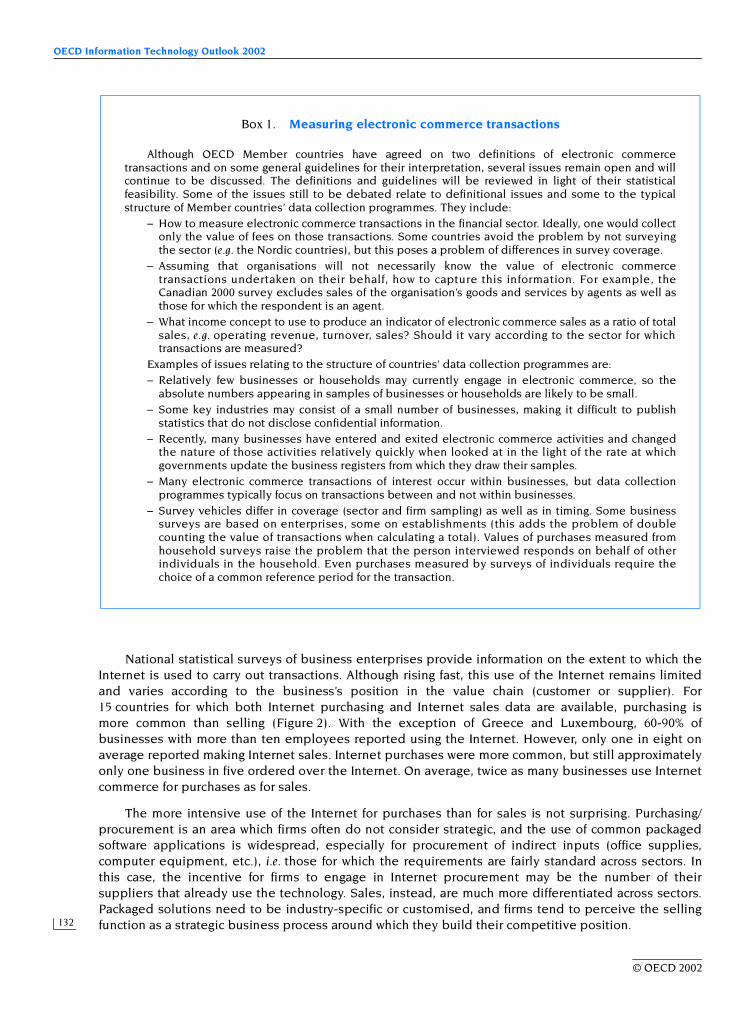
OECD Information Technology Outlook 2002
132
National statistical surveys of business enterprises provide information on the extent to which theInternet is used to carry out transactions. Although rising fast, this use of the Internet remains limitedand varies according to the business’s position in the value chain (customer or supplier). For15 countries for which both Internet purchasing and Internet sales data are available, purchasing ismore common than selling (Figure 2). With the exception of Greece and Luxembourg, 60-90% ofbusinesses with more than ten employees reported using the Internet. However, only one in eight onaverage reported making Internet sales. Internet purchases were more common, but still approximatelyonly one business in five ordered over the Internet. On average, twice as many businesses use Internetcommerce for purchases as for sales.
The more intensive use of the Internet for purchases than for sales is not surprising. Purchasing/procurement is an area which firms often do not consider strategic, and the use of common packagedsoftware applications is widespread, especially for procurement of indirect inputs (office supplies,computer equipment, etc.), i.e. those for which the requirements are fairly standard across sectors. Inthis case, the incentive for firms to engage in Internet procurement may be the number of theirsuppliers that already use the technology. Sales, instead, are much more differentiated across sectors.Packaged solutions need to be industry-specific or customised, and firms tend to perceive the sellingfunction as a strategic business process around which they build their competitive position.
Box 1. Measuring electronic commerce transactions
Although OECD Member countries have agreed on two definitions of electronic commercetransactions and on some general guidelines for their interpretation, several issues remain open and willcontinue to be discussed. The definitions and guidelines will be reviewed in light of their statisticalfeasibility. Some of the issues still to be debated relate to definitional issues and some to the typicalstructure of Member countries’ data collection programmes. They include:
– How to measure electronic commerce transactions in the financial sector. Ideally, one would collectonly the value of fees on those transactions. Some countries avoid the problem by not surveyingthe sector (e.g. the Nordic countries), but this poses a problem of differences in survey coverage.
– Assuming that organisations will not necessarily know the value of electronic commercetransactions undertaken on their behalf, how to capture this information. For example, theCanadian 2000 survey excludes sales of the organisation’s goods and services by agents as well asthose for which the respondent is an agent.
– What income concept to use to produce an indicator of electronic commerce sales as a ratio of totalsales, e.g. operating revenue, turnover, sales? Should it vary according to the sector for whichtransactions are measured?
Examples of issues relating to the structure of countries’ data collection programmes are:– Relatively few businesses or households may currently engage in electronic commerce, so the
absolute numbers appearing in samples of businesses or households are likely to be small.– Some key industries may consist of a small number of businesses, making it difficult to publish
statistics that do not disclose confidential information.– Recently, many businesses have entered and exited electronic commerce activities and changed
the nature of those activities relatively quickly when looked at in the light of the rate at whichgovernments update the business registers from which they draw their samples.
– Many electronic commerce transactions of interest occur within businesses, but data collectionprogrammes typically focus on transactions between and not within businesses.
– Survey vehicles differ in coverage (sector and firm sampling) as well as in timing. Some businesssurveys are based on enterprises, some on establishments (this adds the problem of doublecounting the value of transactions when calculating a total). Values of purchases measured fromhousehold surveys raise the problem that the person interviewed responds on behalf of otherindividuals in the household. Even purchases measured by surveys of individuals require thechoice of a common reference period for the transaction.
© OECD 2002

E-commerce Intensity
133
Data broken down by class size show that smaller businesses that use the Internet appear to haveroughly the same propensity to sell over the Internet as larger ones in Australia, Denmark and Sweden(Figure 3). Use of the Internet for purchases seems to be more sensitive to firm size across all countries.However, the relation between Internet use and size is a complex one. Not only is business sizeindustry-specific, i.e. what may be a small enterprise in one industry might be a large one in another,but also Internet use for transactions is industry-specific.
Figure 4 shows the propensity of businesses to carry out Internet purchases across selected sectorsin six OECD countries. This propensity is higher in services than in manufacturing, and financialservices, business services and wholesale trade are generally the most intensive users. Internet ordersare most popular in the finance and insurance industry in Sweden and the United Kingdom, and thebusiness services8 industry also has high rates of Internet commerce. In Denmark and Finland, thebusiness services industry reported approximately every second order to be an Internet order. InCanada and Australia, the propensity to buy over the Internet seems to be more equally distributedacross sectors. In Canada, the industries with the highest percentage of businesses purchasing over theInternet in 2000 were information and cultural industries (53%), private educational services (41%) andprofessional, scientific and technical services (41%). In Australia, Internet procurement in 1999-2000 wasmost common in the electricity, gas and water supply and communication services industries (38% and29% of Internet users, respectively).
Figure 2. Proportion of businesses with ten or more employees using the Internet for purchasing and selling, 2000
Note: The results of the Eurostat survey are based on a selection of industries that changes slightly across countries. The main sectors coveredare manufacturing, wholesale and retail trade, hotels and restaurants, transport, storage and communications, financial intermediation, realestate, renting and business activities. The surveys of Denmark, Italy, Finland and Norway do not cover financial intermediation; those ofDenmark, the Netherlands, Finland, the United Kingdom and Norway also cover construction; Denmark and Norway also survey personalservices.
1. All businesses.2. Use, orders received and made refer to Internet and other computer mediated networks.3. Orders received and made over the Internet and other computer mediated networks.4. Expectations for the year 2001 measured in 1999.Source: OECD, ICT database and, Eurostat, E-commerce Pilot Survey, December 2001.
% %100
60
40
20
0
80
100
60
40
20
0
80
Finlan
d
Businesses ordering over the Internet (% of all businesses with 10 or more employees)
Sweden
Austri
a
Norway
Denm
ark
Italy
Spain1
Greec
e
Luxe
mbo
urg
Austra
lia
Businesses receiving orders over the Internet (% of all businesses with 10 or more employees)
Businesses using the Internet (% of all businesses with 10 or more employees)
Nethe
rland
s2, 4
Portu
gal1
Canad
a1
United
King
dom3
© OECD 2002
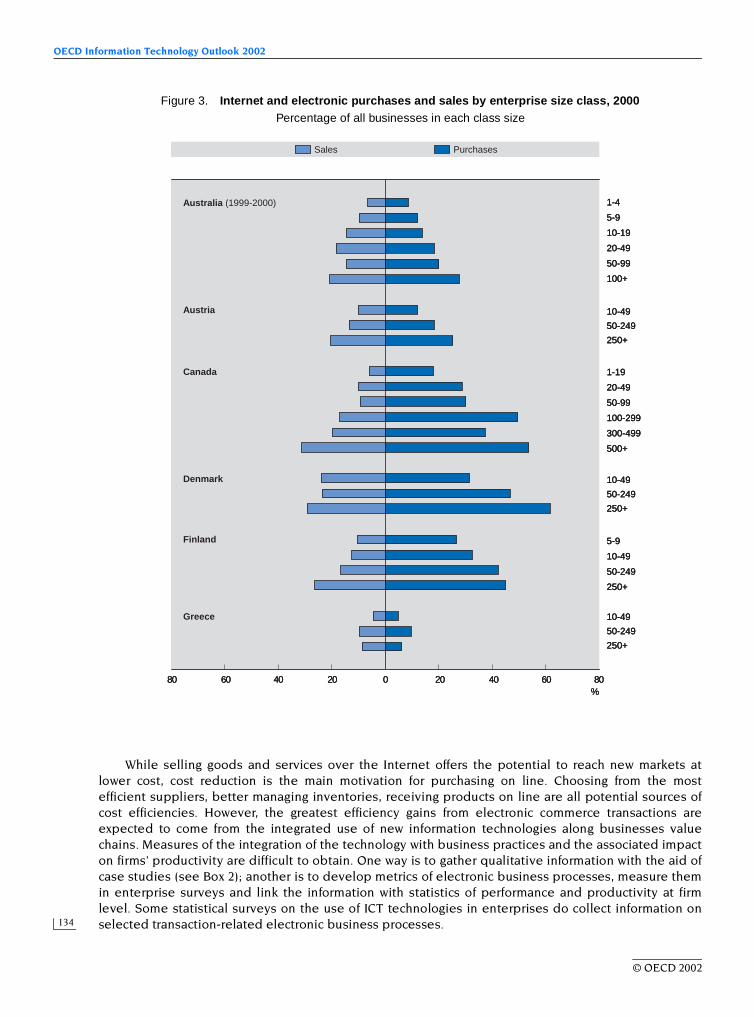
OECD Information Technology Outlook 2002
134
While selling goods and services over the Internet offers the potential to reach new markets atlower cost, cost reduction is the main motivation for purchasing on line. Choosing from the mostefficient suppliers, better managing inventories, receiving products on line are all potential sources ofcost efficiencies. However, the greatest efficiency gains from electronic commerce transactions areexpected to come from the integrated use of new information technologies along businesses valuechains. Measures of the integration of the technology with business practices and the associated impacton firms’ productivity are difficult to obtain. One way is to gather qualitative information with the aid ofcase studies (see Box 2); another is to develop metrics of electronic business processes, measure themin enterprise surveys and link the information with statistics of performance and productivity at firmlevel. Some statistical surveys on the use of ICT technologies in enterprises do collect information onselected transaction-related electronic business processes.
Figure 3. Internet and electronic purchases and sales by enterprise size class, 2000Percentage of all businesses in each class size
80 60 40 20 0 20 40 60 80%
Sales Purchases
Australia (1999-2000)
Austria
Canada
Denmark
Finland
Greece
1-4
100+
5-9
10-19
20-49
50-99
1-19
500+
20-49
50-99
100-299
300-499
5-9
10-49
50-249
250+
50-249
10-49
250+
50-249
10-49
250+
50-249
10-49
250+
80 60 40 20 0 20 40 60 80%
Sales Purchases
Australia (1999-2000)
Austria
Canada
Denmark
Finland
Greece
1-4
100+
5-9
10-19
20-49
50-99
1-19
500+
20-49
50-99
100-299
300-499
5-9
10-49
50-249
250+
50-249
10-49
250+
50-249
10-49
250+
50-249
10-49
250+
80 60 40 20 0 20 40 60 80%
Sales Purchases
Australia (1999-2000)
Austria
Canada
Denmark
Finland
Greece
1-4
100+
5-9
10-19
20-49
50-99
1-19
500+
20-49
50-99
100-299
300-499
5-9
10-49
50-249
250+
50-249
10-49
250+
50-249
10-49
250+
50-249
10-49
250+
© OECD 2002

E-commerce Intensity
135
Table 2 shows data on the use of Web, Internet or computer network applications in selectedtransaction-related business processes. Firms mainly use the Internet or the Web for marketingpurposes and, to a limited extent, to sell on line; however, among firms that use the Internet, only a fewdistribute goods and services on line or offer interactive electronic payment capability. An analysis ofthe use of computer networks in US manufacturing plants in mid-2000 revealed that the integration oftransaction-related business processes via the use of Internet applications is still very limited. Someplants that do not accept on-line orders accept on-line payments, while some plants that reported noon-line orders provided on-line customer support. About 34% of manufacturing plants reported havingpurchased on line, while only 9% paid on line. Although firms may not pay on line for security reasons,29% of those that did, did not purchase on line (US Department of Commerce, 2001).
Figure 3. Internet and electronic purchases and sales by enterprise size class, 2000 (cont.)
Percentage of all businesses in each class size
1. Orders received or made over the Internet and other computer mediated networks.2. Expectations for the year 2001 measured in 1999.Source: OECD, ICT database, and Eurostat, E-commerce Pilot Survey, December 2001.
80 60 40 20 0 20 40 60 80%
10-49
50-249
250+
10-49
50-249
250+
5-9
10-49
50+
10-49
50-249
250+
10-49
50+
1-4
5-9
10-49
50-249
250+
10-49
50-249
250+
10-49
50-249
250-999
1 000+
Sales Purchases
Italy
Luxembourg
Netherlands1, 2
Norway
Portugal
Spain
Sweden
United Kingdom1
80 60 40 20 0 20 40 60 80%
10-49
50-249
250+
10-49
50-249
250+
5-9
10-49
50+
10-49
50-249
250+
10-49
50+
1-4
5-9
10-49
50-249
250+
10-49
50-249
250+
10-49
50-249
250-999
1 000+
Sales Purchases
Italy
Luxembourg
Netherlands1, 2
Norway
Portugal
Spain
Sweden
United Kingdom1
80 60 40 20 0 20 40 60 80%
10-49
50-249
250+
10-49
50-249
250+
5-9
10-49
50+
10-49
50-249
250+
10-49
50+
1-4
5-9
10-49
50-249
250+
10-49
50-249
250+
10-49
50-249
250-999
1 000+
Sales Purchases
Italy
Luxembourg
Netherlands1, 2
Norway
Portugal
Spain
Sweden
United Kingdom1
© OECD 2002
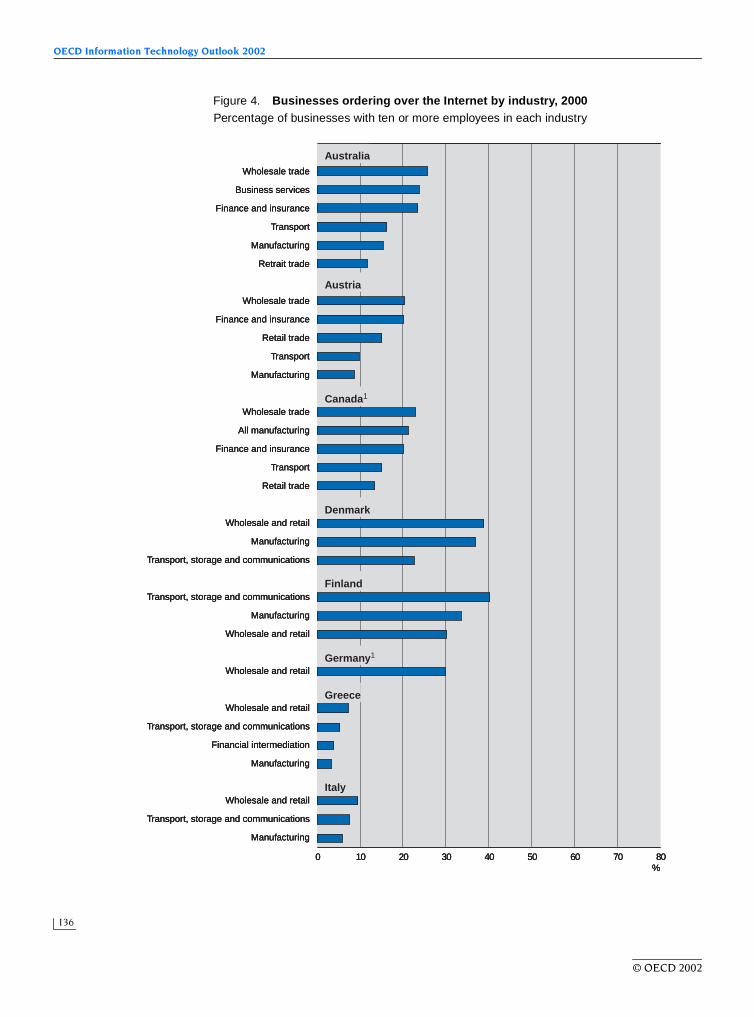
OECD Information Technology Outlook 2002
136
Figure 4. Businesses ordering over the Internet by industry, 2000Percentage of businesses with ten or more employees in each industry
0 10 20 30 40 50 60 70 80%
Wholesale trade
Business services
Finance and insurance
Transport
Manufacturing
Retrait trade
Wholesale trade
Finance and insurance
Retail trade
Transport
Manufacturing
Wholesale trade
All manufacturing
Finance and insurance
Transport
Retail trade
Wholesale and retail
Manufacturing
Transport, storage and communications
Transport, storage and communications
Manufacturing
Wholesale and retail
Wholesale and retail
Wholesale and retail
Transport, storage and communications
Financial intermediation
Manufacturing
Wholesale and retail
Transport, storage and communications
Manufacturing
Australia
Austria
Canada1
Denmark
Finland
Germany1
Greece
Italy
© OECD 2002

E-commerce Intensity
137
Figure 4. Businesses ordering over the Internet by industry, 2000 (cont.)
Percentage of businesses with ten or more employees in each industry
1. All businesses.2. Internet and other computer-mediated networks.3. Expectations for the year 2001 measured in 1999.Source: OECD, ICT database and Eurostat, E-commerce Pilot Survey, December 2001.
0 10 20 30 40 50 60 70 80%
Financial intermediation
Wholesale and retail
Manufacturing
Transport, storage and communications
Wholesale and retail
Financial intermediation
Manufacturing
Transport, storage and communications
Manufacturing
Wholesale and retail
Transport, storage and communications
Transport, storage and communications
Financial intermediation
Wholesale and retail
Manufacturing
Financial intermediation
Wholesale and retail
Manufacturing
Transport, storage and communications
Financial intermediation
Manufacturing
Wholesale and retail
Transport, storage and communications
Finance and insurance
Business services
Wholesale trade
Transport
Retail trade
Manufacturing
Luxembourg
Netherlands2, 3
Norway
Portugal
Spain1
Sweden
United Kingdom2
© OECD 2002

OECD Information Technology Outlook 2002
138
Box 2. Results from the OECD Electronic Commerce Business Impacts Project (EBIP)*
What is more important, the “commerce” factor or the “e” factor? Successful e-commerce strategies are ledmore by commercial than by technological considerations. E-commerce is part of much larger businessand economic transformations, and successful application and use are usually embedded in broaderstrategies to respond to business challenges. Nevertheless, e-commerce is a major business innovationthat all firms will have to adopt, and successful firms have coherent overall business strategies with amajor emphasis on the development of both e-commerce and IT skills.
Why do firms engage in e-commerce and what is going on line? Motivations to apply e-commerce are highwhere ICT investment is already large and risk is low. Most firms want to reduce costs, increase the speedand reliability of transactions, improve management capabilities, develop or improve collaboration,create interdependencies, manage customer relations better and create more added value. Firms arecautious about putting important things on the Web; when they do, they protect their transactions andadvantages: advertising catalogues, information services are overwhelmingly on the WWW, buttransactions (ordering, billing and payment, finance) are on EDI, EDI over the Internet or extranets. Therehas been only partial migration from EDI to Web-based systems, for example for ordering, and many firmsare still slow to move from their established closed systems.
What are the impacts on firms? Most firms consider that e-commerce facilitates the management ofbusiness relationships and that e-commerce tools lower the costs of reaching new customers andsuppliers. There are considerable differences by sector and firm size. Product innovations are morecommon among firms with intangible products and assets (mainly services firms); process innovations aremore frequently implemented by large firms. Market expansion and segmentation are more common forfirms with intangible products and assets, and small firms benefit from Internet-based expansionstrategies, as they use e-commerce to make themselves known and explore new markets to a greaterextent than large firms.
Almost one-third of firms reported positive measurable impacts on turnover and on profitability, andnone reported decreases. However, well over half of firms were unable to report on impacts or indicatedthat the question was not applicable. The share of firms reporting employment impacts was lower, andmore firms reported positive than negative employment impacts. However, many firms reportedupskilling and changes in the composition of the workforce. A crucial emerging issue is the organisation offirms to use their human resources and other assets more effectively to achieve business goals. Overall,the impacts of e-commerce are hard to quantify, suggesting that it is too soon to measure impacts or thatfirms are unable to identify separately effects solely due to e-commerce.
What are the impacts on market structure and competition? Many types of markets may become more open andefficient, with obvious benefits to producers and consumers. E-commerce results in a greater mix of directand intermediated sales, helping customers to bypass traditional intermediaries (disintermediation) andfacilitating new intermediaries (reintermediation). E-commerce may provide new avenues for firms to createnew dominant positions or perpetuate existing ones. Incumbent firms and their established businessmodels are surviving, and e-commerce is not significantly altering the established basis of market power.Very few interviewed firms saw e-commerce destabilising existing commercial relations. Overall, “firstmover” advantages by new firms have not been as clear as earlier thought. Established firms and industriesare benefiting from e-commerce, and small firms may not be advantaged.
What policy issues are important? Firms identified competence factors (general education, specific IT/e-business skills) as being crucial to their involvement in e-commerce activities. Other factors consistentlymentioned were costs, including, but not limited to, technology. According to firms, in the area ofconfidence and trust, problems relate mostly to clarification, enforcement and cross-border interoperabilityof existing legal frameworks rather than the need for new ones. Overall, several broad areas where the scopefor government policy action is greatest were identified: skills and competencies, infrastructure (pricing,broadband) and market structure/competition areas, with continuing concern for small firm issues.Notes
* The OECD Electronic Commerce Business Impacts Project (EBIP) was undertaken under the aegis of the WorkingParty on the Information Economy (WPIE). It aimed to improve comparability of firm-level case studies acrosssectors and countries through the use of a common analytical framework and an interview reporting instrument. Theproject focused on e-commerce and Internet applications by proactive firms in established industries, mainly inbusiness-to-business e-commerce. It was launched in late 1999 with ten countries participating: Canada, France,Italy, Korea, Mexico, the Netherlands, Norway, Spain, Sweden and the United Kingdom, with Portugal joiningsubsequently. The studies were mainly undertaken during the second half of 2000 and early 2001. The final reportdraws on a database of 217 reporting firms, and 30 sector reports across 14 broad sectors in both physical andintangible products in the 11 participating countries.
Source: See OECD (2002), Electronic Commerce Business Impacts Project: Synthesis Report, forthcoming.
© OECD 2002

E-commerce Intensity
139
Volume and nature of e-commerce transactions
Electronic and Internet transactions: still very small but growing
The number of secure servers, one indicator of a country’s infrastructure for Internet commerce, isoften used as a proxy for countries’ propensity to carry out Internet transactions.9 The United Statesaccounted for about 65% of the OECD total of secure servers in July 2001; the United Kingdom wassecond with 6%. In July 2001, Iceland and the United States recorded the most intensive use, with 328and 315 secure servers per million inhabitants, respectively. Other countries above the OECD averageof 119 per million inhabitants were New Zealand (203), Canada (197), Australia (193), Switzerland (191),Luxembourg (155) and Sweden (142). Available statistics from business surveys show that theproportion of Web sites with secure capabilities is much lower than the number of businesses actuallyselling on line. In Australia, only 6% of businesses’ homepages allowed for secure transactionsin 1999-2000, while 14% of businesses with Web sites offered on-line ordering. In Canada, thepercentage of secure Web sites in 2000 was three times higher.
For the few countries that currently measure the value of Internet or electronic sales, total Internetsales in 2000 ranged between 0.4% and 1.8% of total sales; electronic sales (including those over allcomputer-mediated networks) were over 10% in Sweden (Figure 5). Sales via EDI are generally higherthan sales via the Internet, with almost all countries reporting EDI sales to be at least twice as high asInternet sales. Scandinavian countries reported being the biggest users of the Internet ande-commerce.
These relatively low shares indicate that the uptake of e-commerce is still very low and that there isconsiderable scope for growth. On the other hand, there are already signs that the volume oftransactions may tend to be concentrated in a few sectors or firms. The US Bureau of the Census notedthat in 1999 on-line sales of manufacturing plants were concentrated in five of the 21 subsectors. On-line
Table 2. Business processes related to selling activities over the Web, the Internet and computer-mediated networks, 2000
Source: OECD, ICT Database and Eurostat, E-commerce Pilot Survey, December 2001.
Business processes via:
AUT DNK FIN GRC ITA LUX NOR POR SPA SWE NLD
Web page
Enterprises with Internet (%)
Enterprises with computer
mediated networks (%)
Sales 12.9 27.6 15.1 9.1 2.3 12.6 23.2 4.9 6.3 19.3 36.4Delivery of digitised products 1.0 7.7 2.0 0.4 3.1 6.0 1.0 2.1 4.3Receiving on-line payments 3.0 8.1 2.4 2.5 0.9 4.5 5.5 1.5 1.6 4.3 16.1
Business processes via:
AUS CAN USA
Web page Computer networks
Enterprises with home page (%)Manufacturing plants with computer
(%)
Marketing 79.0Sales 14.0 31.0After sales services 11.0 19.2Delivery of digitised products 4.0 13.0Receiving on-line payments 2.0 8.0 11.1
© OECD 2002
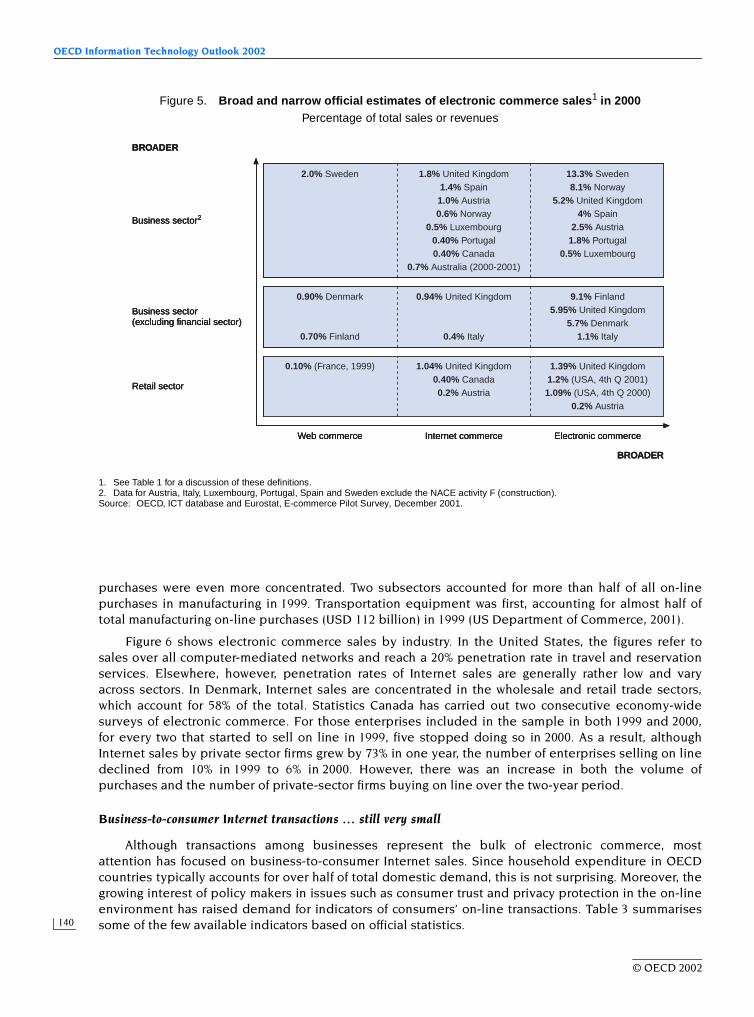
OECD Information Technology Outlook 2002
140
purchases were even more concentrated. Two subsectors accounted for more than half of all on-linepurchases in manufacturing in 1999. Transportation equipment was first, accounting for almost half oftotal manufacturing on-line purchases (USD 112 billion) in 1999 (US Department of Commerce, 2001).
Figure 6 shows electronic commerce sales by industry. In the United States, the figures refer tosales over all computer-mediated networks and reach a 20% penetration rate in travel and reservationservices. Elsewhere, however, penetration rates of Internet sales are generally rather low and varyacross sectors. In Denmark, Internet sales are concentrated in the wholesale and retail trade sectors,which account for 58% of the total. Statistics Canada has carried out two consecutive economy-widesurveys of electronic commerce. For those enterprises included in the sample in both 1999 and 2000,for every two that started to sell on line in 1999, five stopped doing so in 2000. As a result, althoughInternet sales by private sector firms grew by 73% in one year, the number of enterprises selling on linedeclined from 10% in 1999 to 6% in 2000. However, there was an increase in both the volume ofpurchases and the number of private-sector firms buying on line over the two-year period.
Business-to-consumer Internet transactions … still very small
Although transactions among businesses represent the bulk of electronic commerce, mostattention has focused on business-to-consumer Internet sales. Since household expenditure in OECDcountries typically accounts for over half of total domestic demand, this is not surprising. Moreover, thegrowing interest of policy makers in issues such as consumer trust and privacy protection in the on-lineenvironment has raised demand for indicators of consumers’ on-line transactions. Table 3 summarisessome of the few available indicators based on official statistics.
Figure 5. Broad and narrow official estimates of electronic commerce sales1 in 2000Percentage of total sales or revenues
1. See Table 1 for a discussion of these definitions.2. Data for Austria, Italy, Luxembourg, Portugal, Spain and Sweden exclude the NACE activity F (construction).Source: OECD, ICT database and Eurostat, E-commerce Pilot Survey, December 2001.
Web commerce
2.0% Sweden
BROADER
1.8% United Kingdom1.4% Spain1.0% Austria0.6% Norway
0.5% Luxembourg0.40% Portugal0.40% Canada
0.7% Australia (2000-2001)
13.3% Sweden8.1% Norway
5.2% United Kingdom4% Spain
2.5% Austria1.8% Portugal
0.5% Luxembourg
BROADER
0.90% Denmark
0.70% Finland
0.94% United Kingdom
0.4% Italy
9.1% Finland5.95% United Kingdom
5.7% Denmark1.1% Italy
0.10% (France, 1999) 1.04% United Kingdom0.40% Canada0.2% Austria
1.39% United Kingdom1.2% (USA, 4th Q 2001)1.09% (USA, 4th Q 2000)
0.2% Austria
Internet commerce Electronic commerce
Business sector2
Business sector(excluding financial sector)
Retail sector
© OECD 2002
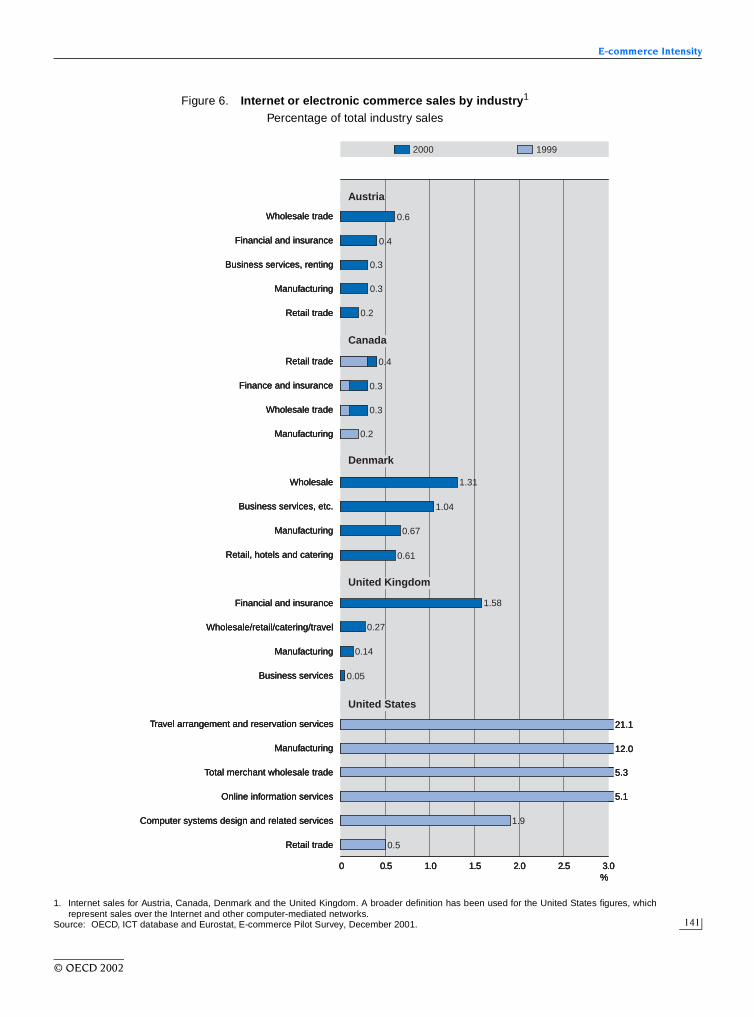
E-commerce Intensity
141
Figure 6. Internet or electronic commerce sales by industry1
Percentage of total industry sales
1. Internet sales for Austria, Canada, Denmark and the United Kingdom. A broader definition has been used for the United States figures, whichrepresent sales over the Internet and other computer-mediated networks.
Source: OECD, ICT database and Eurostat, E-commerce Pilot Survey, December 2001.
0.6
2000 1999
0 0.5 1.0 1.5 2.0 2.5 3.0
0.4
0.3
0.3
0.2
0.4
0.3
0.3
0.2
1.31
1.04
0.67
0.61
1.58
0.27
0.14
0.05
21.1
12.0
5.3
5.1
1.9
0.5
%
Wholesale trade
Financial and insurance
Business services, renting
Manufacturing
Retail trade
Retail trade
Finance and insurance
Wholesale trade
Manufacturing
Wholesale
Business services, etc.
Manufacturing
Retail, hotels and catering
Financial and insurance
Wholesale/retail/catering/travel
Manufacturing
Business services
Travel arrangement and reservation services
Manufacturing
Total merchant wholesale trade
Online information services
Computer systems design and related services
Retail trade
Austria
Canada
Denmark
United Kingdom
United States
© OECD 2002

OECD Information Technology Outlook 2002
142
The share of Internet users buying over the Internet is generally quite low and varies widely. It ishighest in Sweden, where 43% of individuals using the Internet ordered products in 2000, followed bythe United Kingdom (33%) and the United States (30%). With about one in seven Internet userspurchasing goods over the Internet in Finland and Australia, there is still a potential for a markedincrease in Internet sales, especially since approximately one out of two households in those countrieshad access to a computer in 2000 (Figure 7).
A growing minority of consumers use on-line banking. Fewer than three in ten regular Internethousehold users in Canada reported having carried out financial transactions over the Internet in 1999.In Australia, only 13% of all adults paid bills or transferred funds via the Internet in 1999-2000. InAustralia at present, Internet banking is less popular than paying bills or transferring funds using otherelectronic means; for example, 49% of all Australian adults reported using the telephone to pay bills ortransfer funds electronically and two out of three reported using EFTPOS10 for these purposes.
Some countries have started to collect statistics on the proportion or volume of business-to-consumer Internet transactions (Figure 8). Generally, less than 30% of Internet sales are to households,although the share varies considerably, ranging from an estimated almost 30% in Finland (StatisticsFinland, 2001a) to only a little over 1% in Singapore in 2000 (Infocomm Development Authority, 2000). Inthe United Kingdom, most Internet sales to households are accounted for by the financial sector; ifsales of the financial sector are excluded, household Internet sales drop from 0.36% to 0.1%. In Canada,the finance and insurance sector only accounted for 8% of total business-to-consumer transactions in2000. Retail enterprises had the largest volume of transactions to consumers (30%), followed bywholesale trade (19%) and transportation and warehousing (13%). Manufacturing enterprises had thelargest share of business-to-business Internet transactions (22%).
Because it is difficult to estimate business-to-consumer electronic transactions, retail transactionsover the Internet are often used as proxies. Interestingly, the 2000 Canadian e-commerce survey, whichproduces estimates of Internet business-to-consumer transactions across all sectors of the economy,
Table 3. Indicators of consumers’ transactions over the Internet in selected OECD countries, 2000
1. Age cut-off: 16 years and older except for Canada and Finland (15+), Italy (11+), Korea (6+) and Australia and Turkey (18+).2. Sales of computer-mediated networks.3. First quarter 2001 for the number of individuals purchasing over the Internet.4. Third quarter 2001.5. Individuals belonging to households in urban areas.6. Last quarter 2000 for the number of individuals purchasing over the Internet.Source: OECD, ICT database, and Eurostat, E-commerce Pilot Survey, December 2001.
Number of individuals purchasing over the Internet1 Volume of Internet retail transactions
Share of total Share of Internet users USD millions Share of retail sales
Share ofbusiness-to-consumer
in total Internet commerce
Australia 7.1 15.0Austria2 59.1 0.2 6.95Canada 12.3 24.0 599.2 0.4 20.0Denmark3 18.0 29.0 12.15Finland 9.1 16.8 29France 162.4 0.1Italy 1.1 5.9Korea4 8.1 15.3Luxembourg2 31.28Norway 12.51Portugal2 4.80Singapore 1.26Sweden 29.2 42.5 15.59Turkey5 0.4 4.6United Kingdom6 14.9 33.0 2 686.5 1.04 17.48United States 14.1 30.0 27 287.0 0.89
© OECD 2002

E-commerce Intensity
143
Figure 7. Percentage of individuals using and ordering goods and services over the Internet, 20001
1. Age cut-off: 16 years and older except for Canada and Finland (15+), Italy (11+), Korea (6+) and Australia and Turkey (18+).2. Third quarter 2001.3. Last quarter 2000.4. Individuals belonging to households in urban areas.Source: OECD (2001a).
80% %
60
40
20
0
80
60
40
20
0
Individuals using the Internet Individuals ordering goods or services over the Internet
Sweden Denmark Finland Canada Korea2 Australia United States UnitedKingdom3
Italy Turkey4
80% %
60
40
20
0
80
60
40
20
0
Individuals using the Internet Individuals ordering goods or services over the Internet
Sweden Denmark Finland Canada Korea2 Australia United States UnitedKingdom3
Italy Turkey4
80% %
60
40
20
0
80
60
40
20
0
Individuals using the Internet Individuals ordering goods or services over the Internet
Sweden Denmark Finland Canada Korea2 Australia United States UnitedKingdom3
Italy Turkey4
Figure 8. Share of Internet sales by type of customer, 2000
1. E-commerce sales.2. Data for the second quarter of 2001.Source: OECD, ICT database and Eurostat, E-commerce Pilot Survey, December 2001.
%0 20 40 60 80 100
Luxembourg1
Finland
Canada
United Kingdom
Sweden
Denmark
Norway
Austria1
Portugal1
Korea2
Singapore
Households Public sector Enterprises Public sector and enterprises
%0 20 40 60 80 100
Luxembourg1
Finland
Canada
United Kingdom
Sweden
Denmark
Norway
Austria1
Portugal1
Korea2
Singapore
Households Public sector Enterprises Public sector and enterprises
%0 20 40 60 80 100
Luxembourg1
Finland
Canada
United Kingdom
Sweden
Denmark
Norway
Austria1
Portugal1
Korea2
Singapore
Households Public sector Enterprises Public sector and enterprises
© OECD 2002
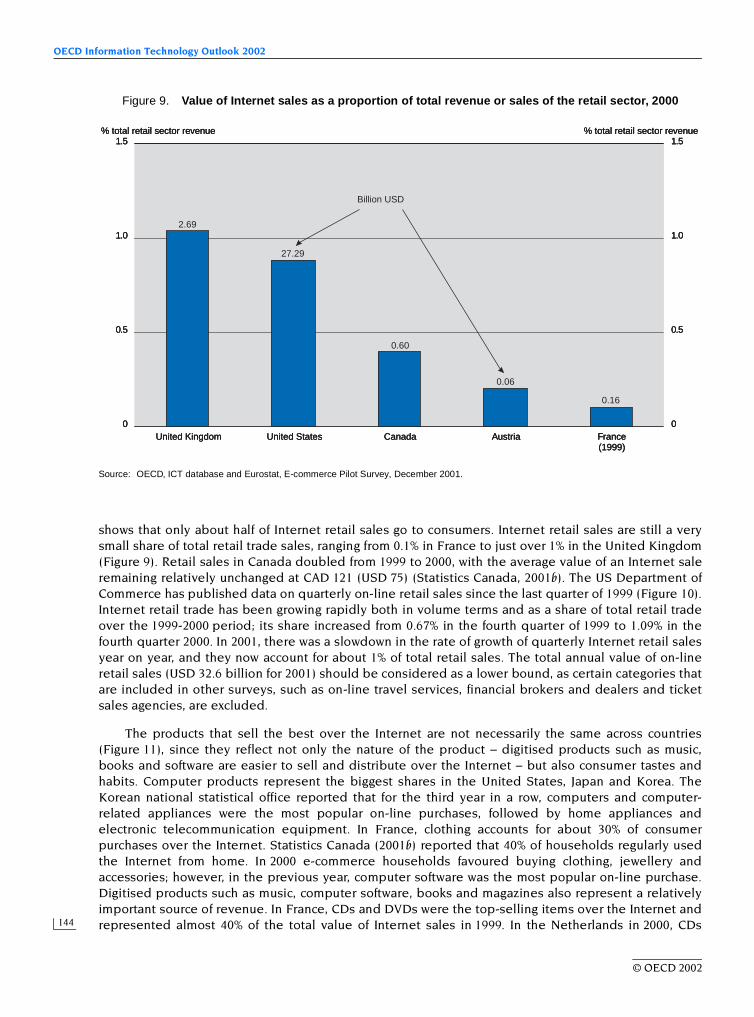
OECD Information Technology Outlook 2002
144
shows that only about half of Internet retail sales go to consumers. Internet retail sales are still a verysmall share of total retail trade sales, ranging from 0.1% in France to just over 1% in the United Kingdom(Figure 9). Retail sales in Canada doubled from 1999 to 2000, with the average value of an Internet saleremaining relatively unchanged at CAD 121 (USD 75) (Statistics Canada, 2001b). The US Department ofCommerce has published data on quarterly on-line retail sales since the last quarter of 1999 (Figure 10).Internet retail trade has been growing rapidly both in volume terms and as a share of total retail tradeover the 1999-2000 period; its share increased from 0.67% in the fourth quarter of 1999 to 1.09% in thefourth quarter 2000. In 2001, there was a slowdown in the rate of growth of quarterly Internet retail salesyear on year, and they now account for about 1% of total retail sales. The total annual value of on-lineretail sales (USD 32.6 billion for 2001) should be considered as a lower bound, as certain categories thatare included in other surveys, such as on-line travel services, financial brokers and dealers and ticketsales agencies, are excluded.
The products that sell the best over the Internet are not necessarily the same across countries(Figure 11), since they reflect not only the nature of the product – digitised products such as music,books and software are easier to sell and distribute over the Internet – but also consumer tastes andhabits. Computer products represent the biggest shares in the United States, Japan and Korea. TheKorean national statistical office reported that for the third year in a row, computers and computer-related appliances were the most popular on-line purchases, followed by home appliances andelectronic telecommunication equipment. In France, clothing accounts for about 30% of consumerpurchases over the Internet. Statistics Canada (2001b) reported that 40% of households regularly usedthe Internet from home. In 2000 e-commerce households favoured buying clothing, jewellery andaccessories; however, in the previous year, computer software was the most popular on-line purchase.Digitised products such as music, computer software, books and magazines also represent a relativelyimportant source of revenue. In France, CDs and DVDs were the top-selling items over the Internet andrepresented almost 40% of the total value of Internet sales in 1999. In the Netherlands in 2000, CDs
Figure 9. Value of Internet sales as a proportion of total revenue or sales of the retail sector, 2000
Source: OECD, ICT database and Eurostat, E-commerce Pilot Survey, December 2001.
1.5
1.0
0.5
0
1.5
1.0
0.5
0
0.16
0.06
0.60
27.29
2.69
Billion USD
United Kingdom
% total retail sector revenue % total retail sector revenue
United States Canada Austria France(1999)
1.5
1.0
0.5
0
1.5
1.0
0.5
0
0.16
0.06
0.60
27.29
2.69
Billion USD
United Kingdom
% total retail sector revenue % total retail sector revenue
United States Canada Austria France(1999)
1.5
1.0
0.5
0
1.5
1.0
0.5
0
0.16
0.06
0.60
27.29
2.69
Billion USD
United Kingdom
% total retail sector revenue % total retail sector revenue
United States Canada Austria France(1999)
© OECD 2002
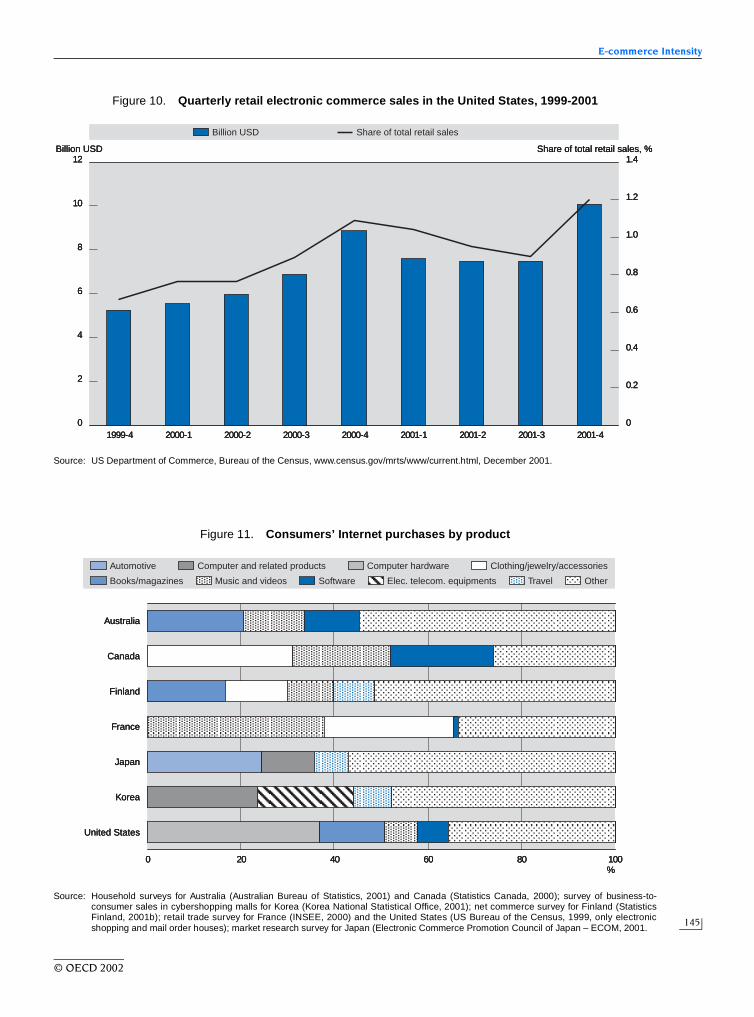
E-commerce Intensity
145
Figure 10. Quarterly retail electronic commerce sales in the United States, 1999-2001
Source: US Department of Commerce, Bureau of the Census, www.census.gov/mrts/www/current.html, December 2001.
1999-4
12 1.4
10
8
6
4
2
0
1.2
1.0
0.8
0.6
0.4
0.2
02000-1 2000-2 2000-3 2000-4 2001-1 2001-2 2001-3 2001-4
Billion USD Share of total retail sales, %
Billion USD Share of total retail sales
1999-4
12 1.4
10
8
6
4
2
0
1.2
1.0
0.8
0.6
0.4
0.2
02000-1 2000-2 2000-3 2000-4 2001-1 2001-2 2001-3 2001-4
Billion USD Share of total retail sales, %
Billion USD Share of total retail sales
1999-4
12 1.4
10
8
6
4
2
0
1.2
1.0
0.8
0.6
0.4
0.2
02000-1 2000-2 2000-3 2000-4 2001-1 2001-2 2001-3 2001-4
Billion USD Share of total retail sales, %
Billion USD Share of total retail sales
Figure 11. Consumers’ Internet purchases by product
Source: Household surveys for Australia (Australian Bureau of Statistics, 2001) and Canada (Statistics Canada, 2000); survey of business-to-consumer sales in cybershopping malls for Korea (Korea National Statistical Office, 2001); net commerce survey for Finland (StatisticsFinland, 2001b); retail trade survey for France (INSEE, 2000) and the United States (US Bureau of the Census, 1999, only electronicshopping and mail order houses); market research survey for Japan (Electronic Commerce Promotion Council of Japan – ECOM, 2001.
%0 20 40 60 80 100
Books/magazines
Australia
Canada
Finland
France
Japan
Korea
United States
OtherTravelElec. telecom. equipmentsSoftware
Clothing/jewelry/accessoriesComputer hardwareComputer and related productsAutomotive
Music and videos
%0 20 40 60 80 100
Books/magazines
Australia
Canada
Finland
France
Japan
Korea
United States
OtherTravelElec. telecom. equipmentsSoftware
Clothing/jewelry/accessoriesComputer hardwareComputer and related productsAutomotive
Music and videos
%0 20 40 60 80 100
Books/magazines
Australia
Canada
Finland
France
Japan
Korea
United States
OtherTravelElec. telecom. equipmentsSoftware
Clothing/jewelry/accessoriesComputer hardwareComputer and related productsAutomotive
Music and videos
© OECD 2002
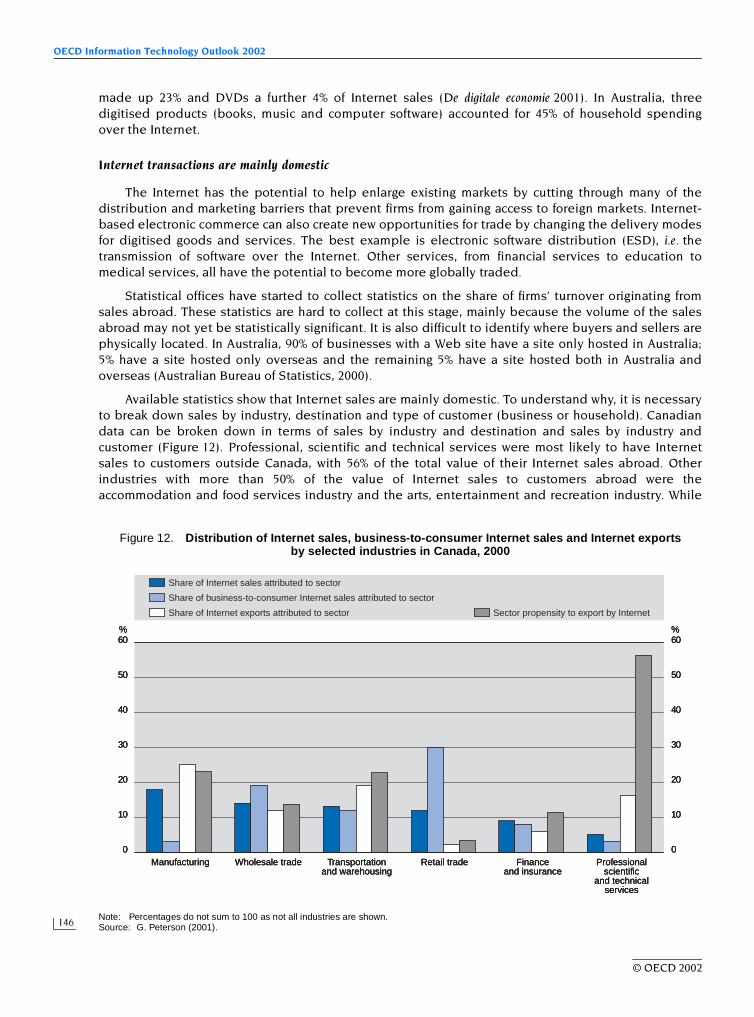
OECD Information Technology Outlook 2002
146
made up 23% and DVDs a further 4% of Internet sales (De digitale economie 2001). In Australia, threedigitised products (books, music and computer software) accounted for 45% of household spendingover the Internet.
Internet transactions are mainly domestic
The Internet has the potential to help enlarge existing markets by cutting through many of thedistribution and marketing barriers that prevent firms from gaining access to foreign markets. Internet-based electronic commerce can also create new opportunities for trade by changing the delivery modesfor digitised goods and services. The best example is electronic software distribution (ESD), i.e. thetransmission of software over the Internet. Other services, from financial services to education tomedical services, all have the potential to become more globally traded.
Statistical offices have started to collect statistics on the share of firms’ turnover originating fromsales abroad. These statistics are hard to collect at this stage, mainly because the volume of the salesabroad may not yet be statistically significant. It is also difficult to identify where buyers and sellers arephysically located. In Australia, 90% of businesses with a Web site have a site only hosted in Australia;5% have a site hosted only overseas and the remaining 5% have a site hosted both in Australia andoverseas (Australian Bureau of Statistics, 2000).
Available statistics show that Internet sales are mainly domestic. To understand why, it is necessaryto break down sales by industry, destination and type of customer (business or household). Canadiandata can be broken down in terms of sales by industry and destination and sales by industry andcustomer (Figure 12). Professional, scientific and technical services were most likely to have Internetsales to customers outside Canada, with 56% of the total value of their Internet sales abroad. Otherindustries with more than 50% of the value of Internet sales to customers abroad were theaccommodation and food services industry and the arts, entertainment and recreation industry. While
Figure 12. Distribution of Internet sales, business-to-consumer Internet sales and Internet exports by selected industries in Canada, 2000
Note: Percentages do not sum to 100 as not all industries are shown.Source: G. Peterson (2001).
60% %
50
40
30
20
10
0
60
50
40
30
20
10
0Manufacturing
Share of Internet sales attributed to sector
Share of business-to-consumer Internet sales attributed to sector
Share of Internet exports attributed to sector Sector propensity to export by Internet
Wholesale trade Transportationand warehousing
Retail trade Financeand insurance
Professionalscientific
and technicalservices
© OECD 2002

E-commerce Intensity
147
these services sectors have the highest propensity to sell abroad, four sectors – manufacturing,transport, wholesale trade and retail trade – accounted for 60% of total Internet sales in Canada in 2000.In sum, 16.6% of total Internet sales are to customers outside Canada, but their industry composition ishighly skewed. Wholesale trade and retail trade account for over a quarter of Internet sales, but theirpropensity to export is rather low, at 13.6% and 3.2% of all sales, respectively.
In Eurostat’s E-commerce Pilot Survey, sales abroad are broken down by destination within andoutside Europe (Figure 13). Initial results for nine European countries indicate that Europeancompanies mainly sell over the Internet to locations within rather than outside Europe. This may partlyreflect the overall (intra-Europe) tendency of European trade. In Austria, Denmark and Finland, theshare of exports to Europe to total exports of goods is between 55% and 63%. This roughly coincideswith the ratio of intra-European Internet exports to total exports in Finland (56%) and Denmark (63%),while it is a little higher for Austria (73%). The share of international Internet sales is particularly small inthe United Kingdom, at only 0.05% of total sales in the sectors surveyed; the air transport industry hasthe highest propensity to export, with 0.7% of total sales (ONS, 2001).
The available data do not allow for breaking Internet exports down by type of customer in order toknow whether business-to-consumer Internet transactions are more “international” in nature thanbusiness-to-business transactions. It is also difficult for consumers to know where a firm or a Web site isphysically located, or whether a firm’s location and that of its Web site coincide. Moreover, even ifbusiness-to-consumer transactions have a higher propensity to be “international”, Internet sales involume terms are more likely to be domestic, owing to the weight of business-to-business transactions.Statistics on international Internet purchases drawn from household surveys or surveys of individualsmight help but rarely exist as yet. In Australia, 50% of adults purchasing over the Internet buy only fromAustralian Web sites, 32% only from overseas Web sites and 18% from both. Singapore reports thatbusiness-to-consumer sales are dominated by overseas customers, with particularly large shares ofcustomers in Malaysia, Thailand, Japan and the United States (Infocomm Development Authority, 2000).
Figure 13. Share of Internet sales in domestic and international markets, 2000
Source: OECD, ICT database and Eurostat, E-commerce Pilot Survey, December 2001.
%0 20 40 60 80 100
Abroad
Luxembourg
Italy
Sweden
Denmark
Spain
Canada
Norway
Austria
Finland
United Kingdom
European Union Domestic
%0 20 40 60 80 100
Abroad
Luxembourg
Italy
Sweden
Denmark
Spain
Canada
Norway
Austria
Finland
United Kingdom
European Union Domestic
%0 20 40 60 80 100
Abroad
Luxembourg
Italy
Sweden
Denmark
Spain
Canada
Norway
Austria
Finland
United Kingdom
European Union Domestic
© OECD 2002

OECD Information Technology Outlook 2002
148
Drivers and inhibitors of electronic commerce transactions
Surveys by national statistical offices do not usually collect information on perceived benefits of orobstacles to the use of technologies, since such information is largely qualitative. However, owing topolicy interest in electronic commerce, several surveys of business enterprises have attempted tocollect information on the drivers and inhibitors to buying and selling on line. Issues of interpretation,differences in the formulation of questions and the use of qualitative response scales makeinternational comparisons in this area particularly difficult.
One source of differences in countries’ implementation of electronic commerce as well as in theimpact of electronic transactions on business performance and productivity is the extent to which firmsstrategically incorporate the technology into their business processes. Firms carrying out transactionson line may seek greater efficiency, or speed, in their business processes or production-relatedefficiency, i.e. reduction of transaction costs or of the costs of intermediate inputs, by reaching moreefficient suppliers. Other firms may adopt e-commerce technologies to develop new business practicesand change their way of interacting in the marketplace, while still others implement e-commercetechnologies as a result of pressures from customers and suppliers or to remain competitive.
A number of studies or survey results on perceived motivations or benefits mention companyimage, satisfaction of customer demand and improved customer service among the main reasons foradopting e-commerce (e.g. DTI, 2000; INSEE, 2001). Another significant factor driving the uptake ofelectronic commerce is the behaviour of competitors and the fear of losing market share. Frenchretailers cited “because you have to be on the Web” as a primary driver of e-commerce.
Figure 14 shows the relative importance of various drivers of electronic commerce. Motivation factorsare grouped into three classes: innovation, efficiency and external pressure. The innovation factorsinclude reaching new/more customers and geographical market expansion. These two factors account forabout 30% of motivation factors. Efficiency measures include speed of processing, improvement in service
Figure 14. Relative business motivation factors for Internet commerce, 2000
Source: OECD, based on Eurostat, E-commerce Pilot Survey, December 2001.
100
90
80
70
60
50
40
30
20
10
0
100
90
80
70
60
50
40
30
20
10
0
Relative share (%) Relative share (%)
Austria Germany Greece Italy Luxembourg Portugal Spain Sweden
Reaching new/more customers Geographic expansion of market Speed of processing
Simpler business processesCost reductionsImprovement of service quality
Fear of losing market shares
100
90
80
70
60
50
40
30
20
10
0
100
90
80
70
60
50
40
30
20
10
0
Relative share (%) Relative share (%)
Austria Germany Greece Italy Luxembourg Portugal Spain Sweden
Reaching new/more customers Geographic expansion of market Speed of processing
Simpler business processesCost reductionsImprovement of service quality
Fear of losing market shares
© OECD 2002

E-commerce Intensity
149
quality, simplification of tasks, cost reductions and simpler business processes. These factors account forabout 50% of motivation factors. Fear of losing market share accounts for at most 20%. Reaching new/morecustomers is the factor generally regarded as the leading motivation factor.
Drivers of electronic commerce transactions can also be explored in terms of the target market.Factors affecting growth in business-to-consumer transactions differ significantly from those affectingbusiness-to-business electronic transactions. The use of electronic commerce technologies in business-to-business relationships has resulted in considerable efficiency gains through cost cutting andrationalisation of business processes. Successful business-to-consumer models, instead, have oftencreated new products or value (e.g. convenience, customisation). Cost reductions obtained by reachingmore efficient suppliers or better managing inventories are easier to quantify than the perceivedbenefits of experimenting with new business models in the business-to-consumer arena.
It is not very surprising that Japanese businesses reported business-to-business electroniccommerce transactions as far more appealing and lucrative for the near future than business-to-consumer ones. Approximately three in four businesses reported already conducting or intending toconduct business-to-business electronic transactions in the next three years. Only 28% of businessesexpressed no intention of carrying out such transactions. In comparison, approximately four in tenJapanese businesses said that they were either already conducting or expected to conduct electronictransactions with consumers in the next three years (Figure 15); the rest (58.5%) expressed no intentionof introducing business-to-consumer applications (Japanese Cabinet Office, 2001).
Statistical surveys can also be used to measure barriers to electronic commerce transactions. Thebarriers and policy issues of concern differ, depending on whether the transactions involved arebusiness-to-business or business-to-consumer. For the former, existing transaction models or tight linkswith customers and suppliers along the value chain may discourage businesses from introducing newmodels. There may also be questions of the security or reliability of complex systems that can link all
Figure 15. Percentage of enterprises introducing business-to-business and business-to-consumer e-commerce in Japan
Source: Japanese Cabinet Office, 2001.
%0 10 20 30 40 50
Already introduced
B2C B2B All companies
Will introduce inthe next three years
No plan to introduce
%0 10 20 30 40 50
Already introduced
B2C B2B All companies
Will introduce inthe next three years
No plan to introduce
%0 10 20 30 40 50
Already introduced
B2C B2B All companies
Will introduce inthe next three years
No plan to introduce
© OECD 2002

OECD Information Technology Outlook 2002
150
customers and suppliers. Business-to-consumer transactions, instead, are typically hampered byconcerns about security of payment, the possibility of redress in the on-line environment or privacy ofpersonal data. Other factors that have considerable impact on the development of on-line consumertransactions are ease and cost of access, convenience of shopping on line and the appeal ofcustomisation.
Given the preponderance of business-to-business transactions, business surveys are probably agood source of indicators on the relevant barriers (Figures 16-18). Indicators from surveys of householdsand individuals can capture reasons why customers do not buy on line.
For countries for which data are available, the leading reason cited by businesses for notconducting transactions electronically was a view that electronic commerce was not suited to the natureof their business. In Canada, among businesses that did not buy or sell over the Internet, 56% believedthat their goods or services did not lend themselves to Internet transactions; 36% preferred to maintaintheir current business model. Smaller shares of these enterprises felt that security was a concern (14%)or that the cost of development and maintenance was too high (12%) (Statistics Canada, 2001a). In theNordic countries and in Austria, instead, issues of major significance are security of payments,uncertainty in contracts and insufficient customer base. Security issues regarding handling of paymentsare not surprising given the very small percentage of sites that ensure secure transactions.
Issues of system security and reliability are a major concern in Japan. Businesses were specificallyasked about viruses. Just under one in every two Japanese businesses rated viruses as the major reasonfor not using the Internet (Tachibana, 2000).
The absence of recognition of on-line signatures may also act as a barrier to transactions betweentwo parties. It appears that by 2000 most Member countries had laws in place that recognise electronicsignatures for domestic business-to-business or business-to-consumer transactions. Regulations onsignatures related to international on-line transactions are still being drafted in many countries(OECD, 2001b). While electronic signatures are only just starting to be recognised legally, their
Figure 16. Perceived barriers to buying and selling over the Internet in Canada, 2000Percentage of businesses that did not buy or sell on line
Source: Statistics Canada, 2001a.
%0 10 20 30 40 50 60
Goods do not lend themselves to Internet transactions
Prefer to maintain current business model
Security concerns
Cost of development and maintenance is too high
Lack of skilled employees
Uncertain about benefits
Customers not ready
Concern about competitorsanalysing company information
Suppliers not ready
Internet available to us is too slow
© OECD 2002

E-commerce Intensity
151
Figure 17. Barriers to e-commerce in Nordic countries
Source: Statistics Denmark et al., The Use of ICT in Nordic Enterprises, 1999/2000.
%0 10 20 30 40 50
Goods not suitable for Internet sales
Uncertainty concerning payments
Uncertainty regarding guarantees, etc.
Customer potential too small
Considerations regarding existing sales channels
Expenses due to internal readjustment
NorwaySwedenDenmarkFinland
%0 10 20 30 40 50
Goods not suitable for Internet sales
Uncertainty concerning payments
Uncertainty regarding guarantees, etc.
Customer potential too small
Considerations regarding existing sales channels
Expenses due to internal readjustment
NorwaySwedenDenmarkFinland
%0 10 20 30 40 50
Goods not suitable for Internet sales
Uncertainty concerning payments
Uncertainty regarding guarantees, etc.
Customer potential too small
Considerations regarding existing sales channels
Expenses due to internal readjustment
NorwaySwedenDenmarkFinland
Figure 18. Barriers1 to Internet and ICT use in Japan
1. Businesses with 100 or more employees. Businesses were asked to choose the three biggest barriers.Source: Tachibana (2000).
%0 10 20 30 40 50 60
Risk of viruses
Security
Costs and prices
Troublesomeness for search topics
Confidentiality of e-transaction
Protection of intellectual property
Timeliness of e-mail
Confidentiality of technology for certification
Anxiety for the data transmission route
Others
%0 10 20 30 40 50 60
Risk of viruses
Security
Costs and prices
Troublesomeness for search topics
Confidentiality of e-transaction
Protection of intellectual property
Timeliness of e-mail
Confidentiality of technology for certification
Anxiety for the data transmission route
Others
%0 10 20 30 40 50 60
Risk of viruses
Security
Costs and prices
Troublesomeness for search topics
Confidentiality of e-transaction
Protection of intellectual property
Timeliness of e-mail
Confidentiality of technology for certification
Anxiety for the data transmission route
Others
© OECD 2002
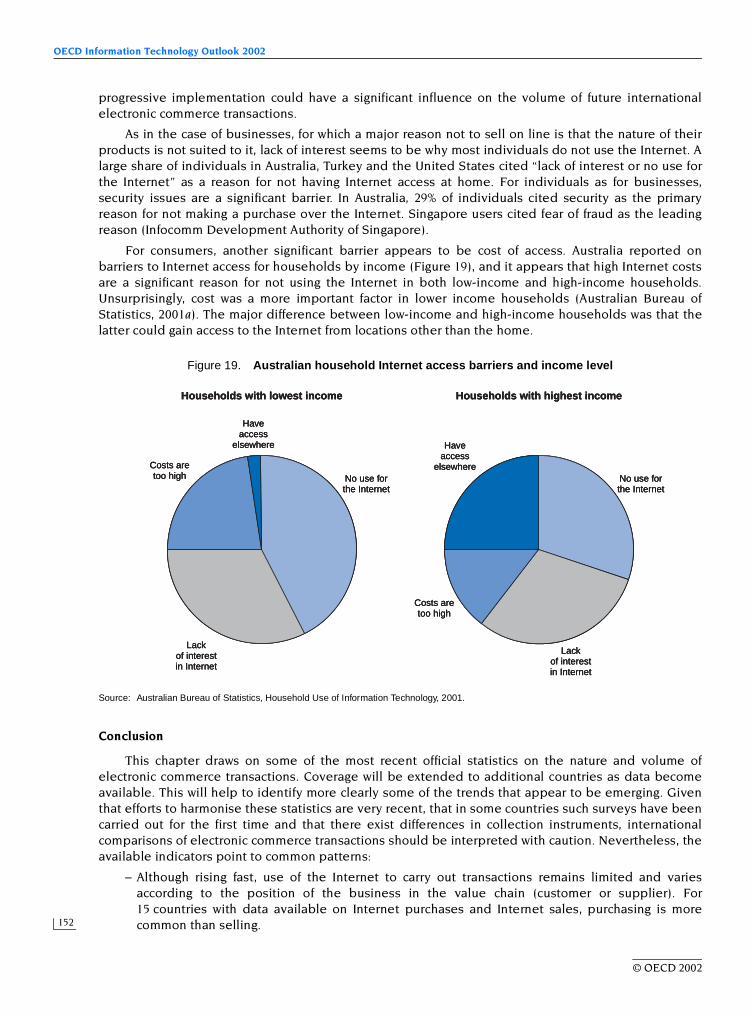
OECD Information Technology Outlook 2002
152
progressive implementation could have a significant influence on the volume of future internationalelectronic commerce transactions.
As in the case of businesses, for which a major reason not to sell on line is that the nature of theirproducts is not suited to it, lack of interest seems to be why most individuals do not use the Internet. Alarge share of individuals in Australia, Turkey and the United States cited “lack of interest or no use forthe Internet” as a reason for not having Internet access at home. For individuals as for businesses,security issues are a significant barrier. In Australia, 29% of individuals cited security as the primaryreason for not making a purchase over the Internet. Singapore users cited fear of fraud as the leadingreason (Infocomm Development Authority of Singapore).
For consumers, another significant barrier appears to be cost of access. Australia reported onbarriers to Internet access for households by income (Figure 19), and it appears that high Internet costsare a significant reason for not using the Internet in both low-income and high-income households.Unsurprisingly, cost was a more important factor in lower income households (Australian Bureau ofStatistics, 2001a). The major difference between low-income and high-income households was that thelatter could gain access to the Internet from locations other than the home.
Conclusion
This chapter draws on some of the most recent official statistics on the nature and volume ofelectronic commerce transactions. Coverage will be extended to additional countries as data becomeavailable. This will help to identify more clearly some of the trends that appear to be emerging. Giventhat efforts to harmonise these statistics are very recent, that in some countries such surveys have beencarried out for the first time and that there exist differences in collection instruments, internationalcomparisons of electronic commerce transactions should be interpreted with caution. Nevertheless, theavailable indicators point to common patterns:
– Although rising fast, use of the Internet to carry out transactions remains limited and variesaccording to the position of the business in the value chain (customer or supplier). For15 countries with data available on Internet purchases and Internet sales, purchasing is morecommon than selling.
Figure 19. Australian household Internet access barriers and income level
Source: Australian Bureau of Statistics, Household Use of Information Technology, 2001.
Households with lowest income Households with highest income
Haveaccess
elsewhere
No use forthe Internet
Costs aretoo high
Lackof interestin Internet
Haveaccess
elsewhereNo use forthe Internet
Costs aretoo high
Lackof interestin Internet
Households with lowest income Households with highest income
Haveaccess
elsewhere
No use forthe Internet
Costs aretoo high
Lackof interestin Internet
Haveaccess
elsewhereNo use forthe Internet
Costs aretoo high
Lackof interestin Internet
Households with lowest income Households with highest income
Haveaccess
elsewhere
No use forthe Internet
Costs aretoo high
Lackof interestin Internet
Haveaccess
elsewhereNo use forthe Internet
Costs aretoo high
Lackof interestin Internet
© OECD 2002

E-commerce Intensity
153
– Smaller businesses that use the Internet appear to have roughly the same propensity to sell overthe Internet as larger ones in Australia, Denmark and Sweden. Use of the Internet for purchasesseems to be more sensitive to firm size across all countries. However, the relation betweenInternet use and size is a complex one. Not only is business size industry-specific – a smallenterprise in one industry might be a large one in another – Internet use for transactions is alsoindustry-specific.
– Internet and electronic commerce transactions are still relatively small. For the few countries thatcurrently measure the value of Internet or electronic sales, total Internet sales in 2000 rangedbetween 0.4% and 1.8% of total sales. Electronic sales (including those over all computer-mediatednetworks) were over 10% in Sweden. Sales via EDI are generally higher than sales via the Internet,with almost all countries reporting EDI sales to be at least twice as high as Internet sales.
– There is evidence that Internet sales and purchases tend to be concentrated in a few sectors.Hence, at this stage, the characteristics of Internet transactions, whether for example they occurmostly within businesses or are mostly domestic, are strongly determined by the nature and typeof transactions that typically take place in those sectors.
– Although most policy attention has focused on business-to-consumer Internet sales, these do notseem to have taken off. In general, the share of Internet users buying over the Internet and thevolume of transactions are still quite low and vary widely across countries.
– The best-selling products over the Internet are not necessarily the same across countries, sincethey reflect not only the nature of the product but also consumer tastes and habits. Nevertheless,computer products, clothing and digitised products such as music, books and software oftenconstitute the major sources of Internet sales to consumers.
– Available statistics show that Internet sales are mainly domestic. Results for eight EU countriesindicate that European companies have a higher propensity to sell over the Internet to locationswithin Europe. This seems to reflect regional trade patterns.
– The main reason why businesses are not conducting transactions electronically is a perceptionthat electronic commerce is not suited to the nature of their business. Other reasons vary. WhileCanadian firms seem to prefer to maintain their current business model, the major concerns inEurope relate to security in handling payments, uncertainty over contracts and an insufficientcustomer base. For consumers, the main reasons not to use the Internet are “lack of interest or nouse for the Internet” and cost of access and use.
© OECD 2002

OECD Information Technology Outlook 2002
154
NOTES
1. Because of the high policy interest in electronic commerce and the mandate given by OECD Ministers(Ottawa, 1998) to “compile definitions of electronic commerce that are policy relevant and statisticallyfeasible”, the OECD Working Party on Indicators for the Information Society (WPIIS) has devoted muchattention to the measurement of electronic commerce. In particular, WPIIS has worked on the development of aframework for user needs and priorities, definitions and statistical measurement of core electronic commerceindicators, OECD internal working document.
2. The S-curve is used here as a synthetic expositional device. In fact, the sequence readiness-intensity-impact isa static image of a more dynamic interaction between user needs and measurement “possibilities”. There aremany S curves and countries are on different points of the many curves with respect to both e-commercedevelopments and user needs for indicators. The curve illustrates different stages of OECD methodologicalwork in this area. While this is by no means the only approach to the development of indicators, it has provedto be a good approach for setting priorities in the development of internationally comparable statisticalsurveys.
3. EDI transmits information from one computer to another without creating the need to re-enter or scan theinformation. EDI does not including faxing as this requires the receiver of the information to re-enter or scanthe data before using it electronically.
4. After two years of sharing experience and testing, a model questionnaire on ICT usage in the businessenterprise sector was approved at the meeting of the Working Party on Indicators for the Information Society(WPIIS) in April 2001. The questionnaire is intended to provide guidance to OECD Member countries formeasuring indicators of ICT, Internet use and electronic commerce; it is composed of separate, self-containedmodules to ensure flexibility and adaptability to a rapidly changing environment. While the use of “core”modules allows measurement on an internationally comparable basis, additional modules can be added torespond to evolving or country-specific policy needs in this area. The OECD definitions and the modelquestionnaire have been used as a basis for the development of the Eurostat Pilot Survey on E-commerce aswell as other e-commerce surveys in OECD Member countries.
5. The study was conducted by a market research company for the UK Department of Trade and Industry, andcovered all G7 countries plus Sweden. It collected information on the types of business processes performedelectronically.
6. Note that some of those in the Internet group also use one or more of the other technologies. The extranetcategory, for example, only includes those that use the extranet to take orders and do not use the Internet fortaking orders.
7. All business respondents are weighted by number of employees.
8. The business services industry is based on International Standard Industrial Classification (ISIC), Rev. 3. ISICbusiness services industry codes 72-74 include computer and related activities, research and development,legal activities, advertising activities and architectural, engineering and other technical activities.
9. This indicator, based on Netcraft’s Secure Socket Layer (SSL) surveys, measures the number of servers with asecure software commonly used for purchasing goods and services or transmitting privileged information overthe Internet. Over the period 1998-2000, there was an increase of 470% in the number of secure servers inOECD countries.
10. Electronic funds transfer at point of sale.
© OECD 2002
E-commerce Intensity
155
REFERENCES
Australian Bureau of Statistics (2000),“Business Use of Information Technology December 2000”, 8129, ABS, Canberra. www.abs.gov.au
Australian Bureau of Statistics (2001a),“Household Use of Information Technology November 2000”, 8147, ABS, Canberra. www.abs.gov.au
Australian Bureau of Statistics (2001b),“Household Use of Information Technology 2000”, 8146, ABS, Canberra. www.abs.gov.au
Electronic Promotion Council of Japan (ECOM) (2001),Market Survey of Electronic Commerce 2000 in Japan, September, ECOM, Tokyo.
Department of Trade and Industry (DTI) (2001),“International Benchmarking Study 2000”, www.dti.gov.uk
Dickinson, P. and J. Ellison (1999),“Plugging In: The Increase of Household Internet Use Continues into 1999”, Connectedness Series, StatisticsCanada, Ottawa, www.statcan.ca
Eurostat (2001),“The European Community Survey on E-commerce: First Results”, Information Newsletter, No. 1, July, Eurostat,Luxembourg.
Gault, F. (2000),“The Canadian Landscape of E-commerce”, paper presented at the National Policy Research Conference,1 December.
Infocomm Development Authority of Singapore (2000),“Survey on E-commerce 2000, Executive Summary”, IDA, Singapore.
INSEE (2001),“Retailers’ first steps on the Internet”, No. 771, April, INSEE, Paris, www.insee.fr
Japanese Cabinet Office (2001),“Questionnaire on Corporate Activities”, www.cao.go.jp
Korea National Statistical Office (2001),“Cyber Shopping Mall Survey”, August, www.nso.go.kr
Korea National Statistical Office (2002),“E-commerce Transactions in the Second Quarter of 2001”, February, www.nso.go.kr
OECD (1999),“Defining and Measuring Electronic Commerce: A Status Report”, DSTI/ICCP/IIS(99)4/FINAL.
OECD (2000),Information Technology Outlook 2000, OECD, Paris.
OECD (2001a),Science, Technology and Industry Scoreboard. Towards A Knowledge Based Economy, OECD, Paris.
OECD (2001b),“Progress achieved by the OECD Member Countries in the Furtherance of the Ottawa Declaration onAuthentication for Electronic Commerce”, forthcoming.
Office of National Statistics (ONS) (2001),“E-commerce Inquiry to Business 2000”, ONS, London.
Peterson, G. (2001),“Electronic Commerce and Technology Use”, Statistics Canada Connectedness Series, No. 5, September.
Statistik Austria (2001),Europäische Piloterhebung über E-commerce 2000/2001, Statistik Austria, Vienna.
© OECD 2002

OECD Information Technology Outlook 2002
156
Statistics Canada (1999),Information and Communications Technologies and Electronic Commerce in Canadian Industry, Statistics Canada, Ottawa.
Statistics Canada (2001a),The Daily, April, Statistics Canada, Ottawa.
Statistics Canada (2001b),The Daily, October, Statistics Canada, Ottawa.
Statistics Denmark et al. (2000),“Use of ICT in Nordic Enterprises 1999/2000”, Statistics Norway, Kongsvinger, www.ssb.no
Statistics Finland (2001a),Internet Use and E-commerce in Enterprises 2001, Statistics Finland, Helsinki.
Statistics Finland (2001b),On the road of the Finnish Information Society III 2001.
Statistics Netherlands (2001),De digitale economie 2001, CBS, Voorburg.
Tachibana, T. (2000),“The Survey on ICT Usage and E-commerce on Business in Japan”, paper presented at the Voorburg Group onServices Statistics meeting, Madrid, 18-22 September.
US Department of Commerce (2001),“E-Stats”, www.census.gov/estats
© OECD 2002

157
Chapter 5
ICT SKILLS AND EMPLOYMENT
ICT skills and employment continue to be major issues, owing to growth and change in the numbersand characteristics of ICT workers and concerns about possible skill mismatches in ICT-related jobs(OECD, 2000a).1 As ICT employment continues to expand, broad trends are transforming OECD economiesand the workforce: the process of globalisation and economic integration has strengthened, and structuralchanges have shifted economic activity (and employment) towards services. Demographic andeducational trends (such as ageing populations and rising overall attainment levels) are substantiallyaltering the size and composition of the workforce. Apart from these general trends affecting IT work andIT workers, the rapid growth of new segments of the ICT sector, such as the Internet, e-commerce and ITservices, has created new types of jobs requiring new skills (OECD, 1999).
It is useful to distinguish the characteristics of different IT skill sets. A simple categorisation is:
– Professional IT skills: ability to use advanced IT tools and/or to develop, repair and create them.2
– Applied IT skills: ability to apply simple IT tools in general workplace settings (in non-IT jobs).
– Basic IT skills or “IT literacy”: ability to use IT for basic tasks and as a tool for learning.
This chapter focuses on the IT workforce, or those with professional IT skills, and the growing demandfor these skills across the economy. It examines the following related questions. Why are IT skillsimportant? Where are IT workers employed? How are firms coping with skill mismatches and tight labourmarkets? Does immigration play a significant role? It then turns to the issue of IT skills. What are the skillrequirements for IT jobs? Can certification schemes help signal IT skills to employers? How is the supplyof potential IT workers evolving? It next addresses the roles for different stakeholders when faced withchanging skill requirements. What are the relative incentives and barriers for upgrading skills? How mightthe various economic actors respond if IT skills become a new category of “general” skill?
Knowledge, skills and IT
As OECD economies continue to move towards “knowledge-based societies”, the role ofknowledge workers and information workers becomes increasingly crucial (OECD, 2001a). In the 1990s,knowledge workers (including computer workers, along with engineers and applied and socialscientists) were the fastest-growing occupational category in the United States and the EU area(Figure 1). Although the links to aggregate growth are difficult to quantify (see Box 1), firm-levelevidence suggests a positive association between productivity gains and use of knowledge workers.The sustained growth of new ICT industries and the diffusion of ICTs throughout all sectors have creatednew skill requirements. However, despite the importance of these new skills, there are great conceptualand practical difficulties in attempting to define and measure skills, particularly in fast-moving areasbased on information technology.
On a basic level, skills refer to the ability to perform tasks, while occupations refer to jobs or workrequiring given sets of skills (see OECD, 1998; Advisory Council on Science and Technology – ACST,2000). Skills are important for:
– Individuals: in terms of compensation, employability, personal development.
– Firms: as they allow increases in productivity, competitiveness, adaptability.
– Countries and regions: as determinants of economic growth and social cohesion.
© OECD 2002

OECD Information Technology Outlook 2002
158
Although there is growing agreement on the importance of skills per se as a key driver of economicgrowth and the spread of the knowledge economy, there is far less consensus on which competenciesand skills make the difference (OECD, 2001d). Since skills cannot be easily measured, different proxiesare used to capture observable characteristics, such as educational attainment on the supply side andoccupations on the demand side. As Figure 2 shows, skills are acquired through a variety of channels.
By its nature, IT work requires individuals to master codified and tacit knowledge and technical andabstract concepts, which are acquired through various formal (education) and non-formal (workexperience) channels. Even for non-IT workers, ICTs are affecting the skills required and the nature andorganisation of work (US Council on Competitiveness, 1998; International Labour Organization – ILO,2001). Overall, the rapid growth of ICT industries and the wide diffusion of ICTs are radically changingskill sets and occupations, and it is important to gain a better understanding of the employment
Figure 1. Employment growth in EU countries and the United States, by occupational group, 1992-99Average annual percentage change
Note: See OECD (2001a) for a complete breakdown by occupational categories.Source: OECD (2001b).
-0.5 0 0.5 1.0 1.5 2.0 2.5 3.0 3.5
3.3
2.2
1.6
0.9
-0.2
%
Knowledge workers
Service workers
Management workers
Data workers
Goods-producingworkers
-0.5 0 0.5 1.0 1.5 2.0 2.5 3.0 3.5
3.3
2.2
1.6
0.9
-0.2
%
Knowledge workers
Service workers
Management workers
Data workers
Goods-producingworkers
-0.5 0 0.5 1.0 1.5 2.0 2.5 3.0 3.5
3.3
2.2
1.6
0.9
-0.2
%
Knowledge workers
Service workers
Management workers
Data workers
Goods-producingworkers
Box 1. Human capital, labour and growth
Skills and human capital are increasingly regarded as major factors in development and growth. Abroad consensus is emerging that there is a positive association between investment in human capitaland economic growth (Ahn and Hemmings, 2000; Temple, 2000; OECD, 1998, 2001c). Micro-level studiesusing regressions on earnings find that schooling often has a significant impact, although it may also act asa signalling/screening/credential device.
Recent analysis of the determinants of economic growth across OECD countries reveals that labourutilisation plays an important role and that strong productivity performance at sectoral level tends tocorrelate with a general upskilling of the workforce (Scarpetta et al., 2000). In many OECD countries,structural changes have led to higher overall labour utilisation in a context of more productive use offactor inputs. There is still a potential for higher levels of labour utilisation, particularly in continentalEurope where employment rates are low, especially among youths, prime-age women and older workers.Labour productivity growth was estimated to account for at least half of the recent GDP per capita growthin most OECD countries.
Compositional changes in the quality of labour input can be measured using educational attainmentas a proxy for skills. Scarpetta et al. (2000) found a positive effect from labour composition (skillupgrading) in all countries but Germany for the 1985-98 period. In countries such as the United States,Australia and the Netherlands, skill upgrading seems to have played a modest role, while in others(including most European countries) its role appears to have been more significant. In most OECDcountries, there is a general tendency to skill-biased employment growth.
© OECD 2002

ICT Skills and Employment
159
patterns of this new IT workforce, including new types of compensation, new types of jobs and newmotivations. The recent debate on the supply and demand of IT skills (and possible “gaps”) must beexamined in the context of earlier (and more general) concerns about “skill shortages” (Massé et al.,1998) and the effects of skill-biased technological change on employment and wages (OECD, 1996; Katz,1999; Acemoglu, 2000).
Measuring the IT workforce
Industry-based data can provide information on the relative importance of IT-producing sectors innational economies, but are insufficient to capture the true size and nature of the IT workforce. First, notall workers in these industries perform IT-related tasks: many are involved in marketing, sales andvarious other activities that are not strictly IT-related. Conversely, many IT workers are employed insectors other than those producing ICT goods and services: the business and financial service sectorsare important employers of IT workers. It is therefore necessary to use other ways of measuring the sizeand composition of the IT workforce, such as occupational data.
For the United States, Table 1 shows the most recent available data for the entire IT workforce,which reached more than 6.5 million in 2000. Almost 60% of these workers were employed in high-skillIT occupations (as determined by educational attainment), one-quarter in medium-skill jobs, and theremaining one-fifth in low-skill occupations.
The Information Technology Association of America (ITAA) estimates that in 2001 about 10.4 millionworkers were employed in ICT-related jobs in the United States (all sectors) (ITAA, 2001). Others (USNational Research Council – NRC, 2001) have questioned this figure owing to the small sample size, thelow response rate,3 and possible ambiguities in the survey interview questions used to identify ITworkers. Nonetheless, this figure may be considered an upper bound for a broad definition of thoseusing IT as a main component of their work. The US Bureau of Labor Statistics estimates that thenumber of “core” IT workers will grow from 2.2 million in 1998 to 3.9 million in 2008.4 Additionally, theUnited States will need to replace 306 000 workers who leave these occupations permanently.Accordingly, the United States could require an average of about 201 800 new IT workers a year to filljobs in these occupations. As can be seen, measuring with any precision the size of the IT workforce is achallenging task.
Figure 2. How skills are acquired
Source: OECD.
Skilldevelopment
Training(on-the-job or external)
Other(e.g. self-training,
non-formal learning)
Workexperience
Formaleducation
Naturalabilities
Skilldevelopment
Training(on-the-job or external)
Other(e.g. self-training,
non-formal learning)
Workexperience
Formaleducation
Naturalabilities
Skilldevelopment
Training(on-the-job or external)
Other(e.g. self-training,
non-formal learning)
Workexperience
Formaleducation
Naturalabilities
© OECD 2002

OECD Information Technology Outlook 2002
160
Analysis of occupational data by sector of employment shows that in the United States in 2000,almost two-thirds of all high-skilled IT workers (as defined in Table 1) were employed in sectors otherthan computer and data processing services (US BLS, 2002). The US Department of Commerceestimates that by 2008, in addition to computer-related services, the following industries will employmore than 100 000 IT workers each: wholesale trade, management and public relations, personnelsupply services and education (US DOC, 2000a).
For the United Kingdom, the most recent analysis of labour force statistics (Institute forEmployment Studies – IES, 2002) estimates that in 2000, the number of IT jobs (in both IT-producingand IT-using industries) was between 1.1 million and 1.3 million, including 940 000 in “core” ICToccupations. Of these, just under half were employed in ICT-producing industries.
In Italy, a study conducted by the IT industry association (ASSINFORM et al., 2000) estimated thenumber of ICT workers at around 890 000 in 1999.5 It also estimated that a further 122 000 workers had(non-professional) IT skills.
In Denmark, an analysis of labour force data at the end of 1998 estimated that there were 92 900 ICTworkers, 60 600 of whom were classified as “primary” IT workers. Of these, 72% were employed in
Table 1. Employment in IT-related occupations by skill level in the United States, 2000
Thousands
Source: US Department of Commerce (US DOC) (2002), based on Bureau of Labor Statistics (US BLS),Occupational Employment Statistics (OES) (2002).
Occupation Employment
High skillComputer support specialists 523Computer software engineers, applications 375Computer systems analysts 463Computer programmers 531Computer software engineers, systems software 265Computer and information systems managers 283Network and computer systems administrators 234Engineering managers 242Electrical and electronic engineering technicians 245Network systems and data communications analysts 119Database administrators 108Electrical engineers 162Electronics engineers, except computer 124Computer hardware engineers 64Computer and information scientists, research 26
Medium skillData entry keyers 459Electrical and electronic equipment assemblers 367Telecommunications line installers and repairers 168Computer, ATM, and office machine repairers 142Electrical power-line installers and repairers 96Telecommunications equipment installers and repairers, exc. line installers 192Electrical and electronics repairers, commercial and industrial equipment 82Semiconductor processors 67Electromechanical equipment assemblers 73
Low skillBilling and posting clerks and machine operators 492Switchboard operators, including answering service 243Mail clerks and mail machine operators except postal service 182Computer operators 186Office machine operators, except computers 86Telephone operators 52
Total IT occupations 6 652
© OECD 2002
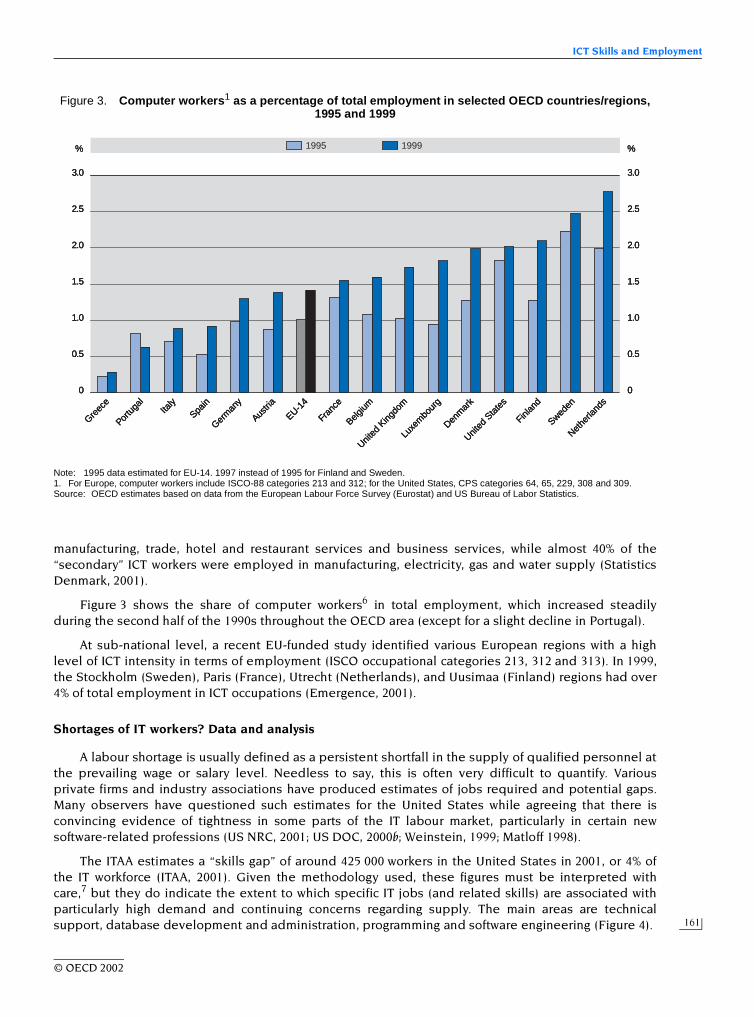
ICT Skills and Employment
161
manufacturing, trade, hotel and restaurant services and business services, while almost 40% of the“secondary” ICT workers were employed in manufacturing, electricity, gas and water supply (StatisticsDenmark, 2001).
Figure 3 shows the share of computer workers6 in total employment, which increased steadilyduring the second half of the 1990s throughout the OECD area (except for a slight decline in Portugal).
At sub-national level, a recent EU-funded study identified various European regions with a highlevel of ICT intensity in terms of employment (ISCO occupational categories 213, 312 and 313). In 1999,the Stockholm (Sweden), Paris (France), Utrecht (Netherlands), and Uusimaa (Finland) regions had over4% of total employment in ICT occupations (Emergence, 2001).
Shortages of IT workers? Data and analysis
A labour shortage is usually defined as a persistent shortfall in the supply of qualified personnel atthe prevailing wage or salary level. Needless to say, this is often very difficult to quantify. Variousprivate firms and industry associations have produced estimates of jobs required and potential gaps.Many observers have questioned such estimates for the United States while agreeing that there isconvincing evidence of tightness in some parts of the IT labour market, particularly in certain newsoftware-related professions (US NRC, 2001; US DOC, 2000b; Weinstein, 1999; Matloff 1998).
The ITAA estimates a “skills gap” of around 425 000 workers in the United States in 2001, or 4% ofthe IT workforce (ITAA, 2001). Given the methodology used, these figures must be interpreted withcare,7 but they do indicate the extent to which specific IT jobs (and related skills) are associated withparticularly high demand and continuing concerns regarding supply. The main areas are technicalsupport, database development and administration, programming and software engineering (Figure 4).
Figure 3. Computer workers1 as a percentage of total employment in selected OECD countries/regions, 1995 and 1999
Note: 1995 data estimated for EU-14. 1997 instead of 1995 for Finland and Sweden.1. For Europe, computer workers include ISCO-88 categories 213 and 312; for the United States, CPS categories 64, 65, 229, 308 and 309.Source: OECD estimates based on data from the European Labour Force Survey (Eurostat) and US Bureau of Labor Statistics.
3.0
2.5
2.0
1.5
1.0
0.5
0
3.0
2.5
2.0
1.5
1.0
0.5
0
19991995 %%
Greec
e
Portu
gal
Italy
Spain
Austri
a
EU-14
Fran
ce
Belgium
United
King
dom
Germ
any
Luxe
mbo
urg
Denm
ark
United
Sta
tes
Finlan
d
Sweden
Nethe
rland
s
3.0
2.5
2.0
1.5
1.0
0.5
0
3.0
2.5
2.0
1.5
1.0
0.5
0
19991995 %%
Greec
e
Portu
gal
Italy
Spain
Austri
a
EU-14
Fran
ce
Belgium
United
King
dom
Germ
any
Luxe
mbo
urg
Denm
ark
United
Sta
tes
Finlan
d
Sweden
Nethe
rland
s
3.0
2.5
2.0
1.5
1.0
0.5
0
3.0
2.5
2.0
1.5
1.0
0.5
0
19991995 %%
Greec
e
Portu
gal
Italy
Spain
Austri
a
EU-14
Fran
ce
Belgium
United
King
dom
Germ
any
Luxe
mbo
urg
Denm
ark
United
Sta
tes
Finlan
d
Sweden
Nethe
rland
s
© OECD 2002

OECD Information Technology Outlook 2002
162
The International Data Corporation (IDC) estimates a demand for 11.2 million IT workers in Europein 2001, three-quarters of whom with “high-level” (professional) skills (European InformationTechnology Observatory – EITO, 2001). In addition, IDC forecasts a demand for 3.9 million workers with“e-business” skills (a combination of technical and business/management skills). This total of more than15 million workers is then compared to the estimated number of currently available workers, to obtainan estimate of unfilled vacancies (Table 2). IDC expects the demand for IT workers to continue growingrapidly to 13 million workers with IT skills and 6.3 million with e-business skills in 2003. It is worth notingthat, according to this estimate, the locus of the problem in the next few years will not be an insufficientsupply of qualified IT workers, but a mismatch due to a growing demand for e-business employees,i.e. those with strong knowledge of IT applications, but not IT professionals per se. In October 1999, theGerman IT industry association (BITKOM) estimated a need for 75 000 jobs in Germany, for theIT-producing industries only (Klotz, 2000).
Examining the evidence
Discussion of IT worker shortages must keep in mind that “economic theory suggests that skillshortages and surpluses are a permanent feature of decentralised labour markets. Hence, at any pointin time, labour market economists examining the data will find evidence of occupational imbalances”(Roy et al., 1996, in Stager, 1999), but there will be market responses. Shortages are conceptually difficultto measure; some possible indicators of a tight labour market are strong employment growth, high
Figure 4. Distribution of estimated “IT worker gap” in the United States by activity, 2000
Source: ITAA (2000).
Digital media2%
Technicalsupport
38%
Databasedevelopment/administration
17%
Programming/software
engineering13%
Webdevelopment/administration
11%
Network design/administration
9%
Other3%Technical
writing4%
Enterprisesystems
3% Digital media2%
Technicalsupport
38%
Databasedevelopment/administration
17%
Programming/software
engineering13%
Webdevelopment/administration
11%
Network design/administration
9%
Other3%Technical
writing4%
Enterprisesystems
3% Digital media2%
Technicalsupport
38%
Databasedevelopment/administration
17%
Programming/software
engineering13%
Webdevelopment/administration
11%
Network design/administration
9%
Other3%Technical
writing4%
Enterprisesystems
3%
Table 2. Estimated unfilled vacancies in IT and e-business in Europe, 2001 and 2003
Millions
Source: EITO (2001).
2001 2003
IT 1.36 1.69E-business 0.87 1.98
Total 2.23 3.67
© OECD 2002

ICT Skills and Employment
163
employment rates for recent graduates, low unemployment rates, strong rise in vacancies8 and upwardpressure on wages and compensation. Various recent studies have examined the evidence for theUnited States and concluded that claims of a severe across-the-board shortage are unsubstantiated (USNRC, 2001; US Department of Commerce – DOC, 2000b; US National Science Foundation – NSF, 2000a;Ellis and Lowell, 1999a, 1999b, 1999c, 1999d). In addition, the current economic slowdown in theUnited States and other OECD economies should contribute to ease tensions in the IT labour market asfirms adjust to the cycle and reduce staff numbers.9
In the United States, employment growth is strong and unemployment rates in IT professions remainvery low. Earnings continue to increase, but not at a rate consistent with a shortage (except for specificcategories of workers in high demand). A factor that may contribute to this wage moderation is theincreasing number of foreign workers admitted under the H-1B programme (see the section on foreignworkers below). Admittedly, data on wages do not adequately describe compensation trends, asdifferent forms of compensation, such as bonuses, profit-sharing schemes and stock options, areincreasingly used to attract top workers. Nonetheless, wages are still an important indicator of labourmarket conditions, as these other forms of compensation usually only concern a small share of all ITworkers, and the recent plunge of technology-related stock prices has made many of these schemesmuch less appealing to workers.
On the supply side, many countries appear to have had an upturn in the number of IT-relateddegrees granted, along with increasing student participation in IT courses, regardless of the field ofstudy (see the section on higher education below).
Overall, although there is high demand in new and rapidly expanding areas, it is not possible toconclude that a severe shortage of IT workers exists across all categories of IT jobs. A distinction shouldbe made between a shortage of IT workers, for which there is little or no aggregate evidence, and a gapbetween the current skills of IT workers and those sought by firms, for which some anecdotal evidenceexists (such as employer surveys). Analysis of the data reveals that indicators of labour market tightnessmay mask many other problems related to labour market imperfections which are exacerbated by thehighly specialised nature of IT jobs. Employers seek specific combinations of (IT and other) skill setswhich may not be readily found in many otherwise qualified job seekers. Other problems includeinadequate recruitment practices, uncertainty related to temporary work and differences inremuneration (e.g. for IT teachers). Even the growing demand for Internet-related skills may mask apolarisation between highly sought “next-generation” skills (e.g. design and management of securehigh-speed networks, e-business integration) and the skills needed to perform increasingly routinetasks such as Web site authoring and maintenance (Institute for the Management of InformationSystems, 2001).
In the United Kingdom, a survey on skills shortages revealed that the hardest to fill vacancies were forjobs in crafts (mechanic, carpenter, plumber, electrician) and sales/marketing, ahead of IT staff (Wilson,2000).
In Australia, somewhat outdated figures suggest a tight labour market for IT workers (NOIE, 1998).Relevant indicators include strong employment growth (15% between 1996-98 compared to 10% for allprofessionals and 2.6% for all occupations), low unemployment rates (2.7% in August 1998 compared to3.8% for all professionals) and a sharp increase in published vacancies. Employment prospects forcomputer science and engineering graduates were also more favourable than for all graduates, althoughlower than in the late 1980s. Trends in earnings are inconclusive: the ratio of earnings of IT workers to alloccupations has remained relatively stable throughout the 1990s, with short peaks following cyclicaltrends. More recent data suggest that in early 2001, the number of ICT-related vacancies declinedcontinuously (as measured by vacancies posted on on-line recruiting sites) (Department of Employment,Workplace Relations and Small Business – DEWRSB, 2001).
In Canada, wage and other data suggest that there is no severe shortage, but that certain skills are inhigh demand (both technical and business/personal skills) (Gingras and Roy, 1998; ACST, 2000). Ananalysis of labour force survey data predicted that “there should not be an emerging problem ofshortage over the next five to seven years” but also acknowledged the need to improve occupationaldata and knowledge of current skill requirements at a finer level of disaggregation (Stager, 1999).
© OECD 2002

OECD Information Technology Outlook 2002
164
In France, professionals (“cadres”) in the computer services sector continue to enjoy strongemployment growth: 41 590 new jobs (+10%) were created between 1999 and 2000 and 37 410 (+14.6 %)between 2000 and 2001. This accounts for almost one-quarter of all new professional jobs and more thanone-third of all those in service sectors. More than half of the new jobs went to recent graduates.Employment growth has remained strong in communication equipment but much more modest (and evennegative during 2000/2001) in IT manufacturing activities. Altogether, growth in ICT jobs is slowing downfrom previous years but remains strong (APEC, 2001; APEC, 2002). Although the ratio of job offers to jobseekers in computer-related occupations increased rapidly between 1996 and 1998 (to twice the averagefor all occupations), there appears to be a slowdown since early 1999 (ministère du Travail, 2000).
Enterprise responses to labour market conditions
Employers can opt for either internal or external strategies to address tightness in the labourmarket10 (Table 3). Internal strategies imply using the existing workforce in more effective andproductive ways. External strategies imply expanding the pool of potential employees and eitherattracting new recruits or using external workers. A distinction should also be made between short-termsolutions which firms can adopt to address immediate labour requirements and longer-term remediesrelated to changes in supply. Within medium-/long-term solutions, firms can also focus on twocomplementary aspects: retaining their current workforce or attracting new skilled workers.
Firms adopt different strategies, depending on costs and benefits, which differ according to the typeof skills required (US DOC, 1999; Wilson, 2000; ASSINFORM et al., 2000). For example, the demand fortechnical support specialists (the category identified in the ITAA survey as the one for which the mostunfilled vacancies exist) might be better addressed through outsourcing, than the demand for databasespecialists (which could be addressed through training). The ITAA study finds that in the United States,outsourcing is the strategy most commonly used by firms to fill vacant IT positions (ITAA, 2000). Anotherrecent US study argues that although firms face important human resource challenges with respect tosupply (due to lags in labour market adjustments), the most critical of these stem from managing workersinside companies, including reducing turnover and improving recruitment practices (Cappelli, 2000).
Turnover rates of IT workers in the United States have been particularly high, especially for youngerworkers (US NRC, 2001). On the one hand, if turnover is indeed high, this may have adverse effects onthe willingness of firms to train. On the other hand, rapid turnover may also have positive spillovers, as
Table 3. Firm strategies for coping with skills shortages
Source: OECD.
Short-term Medium-/long-term
Internal strategies Train (or retrain) existing staff Train (or retrain) existing staff
Overtime Changes in management practices and workplace organisation
Increase wages or other forms of compensation (profit-sharing, stock options) to retain current skilled workers
Offer better non-wage benefits (flexible work schedule, holidays, health benefits and services) to retain workers
External strategies Outsourcing OutsourcingIncrease compensation and non-wage benefits to attract workers, either unemployed or employed by other firms
Hire foreign workers (either offshore or immigrants)
Expand scope of recruiting: use private recruitment firms, campus recruiting, Internet recruiting
Temporarily hire less skilled workers Work with educational institutions to identify and build skills for the future
© OECD 2002

ICT Skills and Employment
165
workers learn a variety of new (and marketable) skills when moving to different jobs. The evidence ofrapid turnover must be examined in the context of the changing expectations of recent graduates andtheir desire to build experience by moving from job to job. Various McKinsey surveys of computerscience and engineering graduates in the United States show that in the early 1990s fewer than one-third expected to stay more than six years with their first employer, compared to almost one-half ofthose graduating in the 1970s and 1980s (Figure 5) and almost two-thirds of those graduating earlier.Among more recent graduates (1994-96), 47% expected to spend less than two years with their firstemployer (Business 2.0, 2000).
The supply of IT workers
Higher education
The main source of IT workers continues to be tertiary-level education. Data from the US CurrentPopulation Survey (CPS) show that 60.2% of all computer programmers held a bachelor’s degree or higherin 2000, while an additional 11% held an associate’s degree. In the case of computer systems analysts, thefigures were 69.8% and 9.1%, respectively. Figure 6 shows the ratio of computer science tertiary-levelgraduates to those in other fields of study, which averaged 2.9% in the OECD area in 1999. Data from theUS Department of Education show that in 1997-98 computer and information sciences accounted for 2.4%of all bachelor’s and master’s degrees granted, up from 2.2% in the mid-1990s, but a full percentage pointlower than in the late 1980s (National Center for Education Statistics – NCES, 2001).
There is recent evidence of sustained increases in the supply of IT graduates. The Taulbee Surveycovers PhD-granting departments of computer science and computer engineering in the United Statesand Canada (Computing Reasearch Association – CRA, 2000 and 2001) and provides data broken downby type of degree.11 Results from the latest survey show that the number of bachelor’s degrees awardedwas projected to grow from around 8 000 in 1997 to almost 16 000 (estimated) in 2001. There has alsobeen significant growth in the number of master’s degrees, with a 19% increase between 1999 and 2000.On the other hand, there has been an observable slowdown in the growth of PhDs since the mid-1990s,
Figure 5. Expected duration with first employer by year of graduation
Source: McKinsey, in Business 2.0 (2000).
% %100
90
80
70
60
50
0
40
30
20
10
100
90
80
70
60
50
0
40
30
20
10
20
22
58
23
29
48
33
40
27
Before 1971
6 or more years at first company3-5 years 2 years or less
1971-90 1991-93
% %100
90
80
70
60
50
0
40
30
20
10
100
90
80
70
60
50
0
40
30
20
10
20
22
58
23
29
48
33
40
27
Before 1971
6 or more years at first company3-5 years 2 years or less
1971-90 1991-93
% %100
90
80
70
60
50
0
40
30
20
10
100
90
80
70
60
50
0
40
30
20
10
20
22
58
23
29
48
33
40
27
Before 1971
6 or more years at first company3-5 years 2 years or less
1971-90 1991-93
© OECD 2002

OECD Information Technology Outlook 2002
166
partly owing to changes in the labour market as job prospects are currently very positive for holders ofmaster’s degrees. In the United Kingdom, the number of graduates in computer science has increasedby 25% since 1995 and is currently just over 10 000 (IES, 2002). If other ICT-related fields are included(i.e. mathematics, electrical and electronic engineering, etc.), the figure reaches 65 000.
Although post-secondary education is the main supplier of workers entering IT jobs, graduates incomputer science and engineering are only a part of all individuals eventually pursuing IT careers. USdata for 1997 reveal that among “core” IT workers, 46% had IT degrees (BA or higher, including minors orsecond majors), 14% engineering (other than computer), 26% science and maths and 6% business (USDOC, 1999).
In the United Kingdom, the share of IT workers with an IT degree increased slightly from 33%in 1994 to 37% in 1998. Among ICT workers, software engineers have, on average, the highest academicdegrees: in 2000 almost 60% held a first degree or higher (IES, 2002). However, two-thirds of IT workersdo not have IT degrees, and two-thirds of IT graduates do not work in IT jobs (AISS/ITNTO, 1999). Similarresults from Statistics Denmark (2001) confirm that there is no systematic link between ICT educationand ICT occupations: almost half of those employed in ICT jobs do not have formal ICT educationdegrees. Likewise, more than half of those with formal ICT education work in non-ICT jobs.
As Box 2 shows, women are usually underrepresented, even when compared to other science andengineering fields. By enhancing the attractiveness of this career, governments and firms could help toexpand the pool of potential IT workers.
Private sector certification
In the last few years, there has been a strong increase in the number of technical credentialsgranted by companies, business associations and commercial IT bodies. Table 4 shows that byearly 2000, Cisco, Microsoft, Novell and other firms or private bodies had awarded more than 1.8 millioncredentials12 certifying IT skills to individuals.
Figure 6. Computing in tertiary education in OECD countries, 1999Tertiary-level graduates in computing as a percentage of all fields of study
Source: OECD Education Database, May 2001.
10
9
8
7
6
5
0
4
3
2
1
10
9
8
7
6
5
0
4
3
2
1
% %
Irelan
d
Mex
ico
Switzer
land
Slovak
Rep
ublic
Icelan
d
Norway
Fran
ce
Austra
liaSpa
in
United
King
dom
Canad
a
Denm
ark
Sweden
Czech
Rep
ublic
Austri
a
United
Sta
tes
Finlan
d
Belgium
(FL)
Germ
any
Turke
y
Korea
Nethe
rland
s
New Z
ealan
d
Hunga
ryIta
ly
Poland
10
9
8
7
6
5
0
4
3
2
1
10
9
8
7
6
5
0
4
3
2
1
% %
Irelan
d
Mex
ico
Switzer
land
Slovak
Rep
ublic
Icelan
d
Norway
Fran
ce
Austra
liaSpa
in
United
King
dom
Canad
a
Denm
ark
Sweden
Czech
Rep
ublic
Austri
a
United
Sta
tes
Finlan
d
Belgium
(FL)
Germ
any
Turke
y
Korea
Nethe
rland
s
New Z
ealan
d
Hunga
ryIta
ly
Poland
© OECD 2002

ICT Skills and Employment
167
There is still insufficient information on the exact role played by such certification programmes interms of IT employment. Analysis of recent vacancy data underscores the growing role of these tools(and provides an interesting corollary to IT worker shortage estimates based on vacancies). Around onein seven positions advertised in the United States was found to require a commercial certification(Adelman, 2000). Further analysis could include identifying the types of workers undergoingcertification and examining the incentives for workers (or firms) to pay for such programmes. Theseprogrammes should also be linked to broader attempts to recognise, certify and accredit different formsof non-formal learning.13
Box 2. IT degrees and gender
Data on tertiary-level graduates highlight a gender imbalance: computing continues to be a field oftertiary-level study that attracts a disproportionate share of men. In 1999, in four-fifths of OECD countries,men accounted for over 80% of tertiary-level computing degrees.
A UK study estimates that in 1997 women accounted for only 17% of entrants to computer sciencehigher education courses, compared to 53% for all fields of study (IES, 2002).
In the United States in 1997-98, women accounted for only 26.7% of bachelor’s degrees in computerand information sciences and 29.0% of all master’s degrees (NCES, 2001). Between 1980 and 1997,one-quarter of all graduate students in computer science in the United States were women, compared toone-third for all science and engineering fields (NSF, 2000b).
In Sweden, of the 43 000 graduates from higher education IT programmes from 1977/78 to 1998/99,just over a quarter were women. For the latest year available, the share was 28% after a decline during themid-1990s (Swedish Ministry of Industry, Employment and Communications, 2000).
In Norway, the Norwegian University of Science and Technology (NTNU) introduced in 1997 a specialquota system for women in computer technology studies. The project soon produced positive results. Inthe first two years, the percentage of female students increased to more than 30%. In addition, theGovernment has carried into effect several initiatives to increase the number of female pupils and studentstaking up IT and technology-related skills. Finally “ICT Norway”, the largest IT-organisation in Norwayinitiated in 2002 a special mentor-program to increase the number of women in the IT-sector, titled “OD@”.
Table 4. Worldwide commercial IT certifications, early 2000
Source: Adelman (2000) and 21st Century Workforce Commission (2000).
Certifications
Microsoft Certified Professional (MCP) 457 603Microsoft Certified Solutions Developer (MCSD) 23 785Microsoft Certified Systems Engineer (MCSE) 231 180Other Microsoft Certified Professional Programmes 176 028Certified Cisco Design Associate (CCDA) 4 000Other Cisco certifications 31 000Certified Novell Engineer (CNE) 175 000Certified Novell Administrator (CNA) 370 000Other Novell Certifications 18 300Oracle (all certifications) 24 000CISSP (Certified Info Systems Security Professional) 1 500CCA (Citrix Certified Associate) 8 000A+ (Computer Tech Industry Associate) 180 000Institute for Certification of Computing Professionals 50 000Natl. Assoc. of Communication Systems Engineers (all Certif.) 18 000Others (Baan, Sybase, SAP, Adobe, etc.) 43 778
Total 1 812 174
© OECD 2002

OECD Information Technology Outlook 2002
168
Foreign workers
Foreign workers are an important source of labour and play an increasingly important role in the contextof tight national labour markets for IT specialists. The two main categories are immigrants (both temporaryand permanent) and offshore workers.14 Although foreigners can help alleviate problems related to stronglabour demand during economic upturns, immigration alone cannot resolve the need for cyclicaladjustments to the labour market (OECD 2001e). In the case of occupations or skills in high demand (such asICT), five main types of measures are being taken to facilitate the admission of foreign specialists:
– Relaxing quantitative constraints (e.g. United States).
– Setting up special inward migration programmes for occupations with shortages (e.g. Germany,Canada, Australia).
– Facilitating recruitment conditions or procedures and relaxing criteria for issuing employmentvisas for highly skilled workers (e.g. Australia, Canada, France, Japan, New Zealand, Norway,United Kingdom).
– Increasing non-wage incentives for skilled foreign workers (e.g. Australia).
– Allowing foreign students to change status at the end of their studies (e.g. Germany, Switzerland,Australia, United States).
In the United States, the H-1B visa programme aims to attract skilled non-immigrant workers.Although the programme is not restricted to IT workers, more than half of the petitions currently grantedare issued to workers in computer-related occupations (US INS, 2000a).15 The number of such visas hasincreased from 65 000 a year before 1998, to 115 000 and then to 195 000 (from FY2001 to 2003). Thesetemporary visas are valid for six years, and must be renewed after the first three. Although there are nocountry quotas under this programme, recent data show that about half of all visas are granted toworkers from India, followed by China and Canada (Figure 7 and Appendix Table A5.1). It is estimatedthat the current H-1B population in the United States is around 425 000 and that about one-quarter of
Figure 7. Geographical distribution of H-1B petitions approved by the INS between October 1999 and February 2000, by country of origin
Source: US INS (2000a).
Philippines3.2%
Other37.6%
India42.3%
United Kingdom3.2%
China9.8%
Canada3.9%
Other countries21.8%
Brazil1.1%
Unknown0.6%
Chinese Taipei2.2%
Korea2.1%
Japan2.0%
Pakistan1.9%
Russia1.7%
Germany1.6%
France1.5%
Mexico1.2%
Total = 81 262
Philippines3.2%
Other37.6%
India42.3%
United Kingdom3.2%
China9.8%
Canada3.9%
Other countries21.8%
Brazil1.1%
Unknown0.6%
Chinese Taipei2.2%
Korea2.1%
Japan2.0%
Pakistan1.9%
Russia1.7%
Germany1.6%
France1.5%
Mexico1.2%
Total = 81 262
Philippines3.2%
Other37.6%
India42.3%
United Kingdom3.2%
China9.8%
Canada3.9%
Other countries21.8%
Brazil1.1%
Unknown0.6%
Chinese Taipei2.2%
Korea2.1%
Japan2.0%
Pakistan1.9%
Russia1.7%
Germany1.6%
France1.5%
Mexico1.2%
Total = 81 262
© OECD 2002
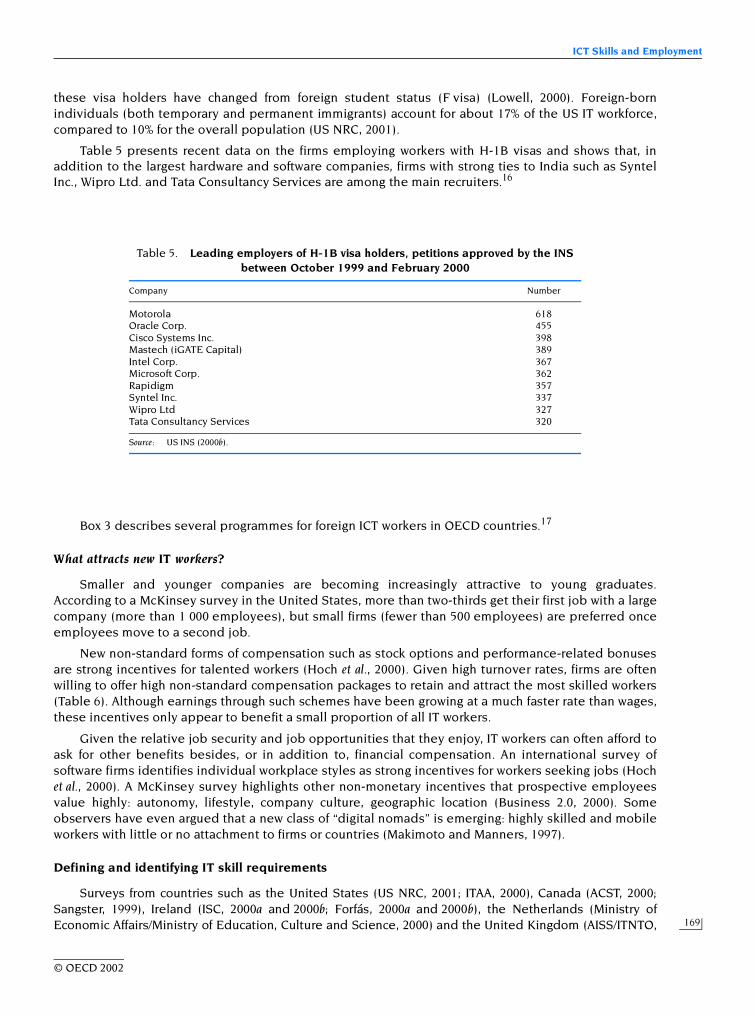
ICT Skills and Employment
169
these visa holders have changed from foreign student status (F visa) (Lowell, 2000). Foreign-bornindividuals (both temporary and permanent immigrants) account for about 17% of the US IT workforce,compared to 10% for the overall population (US NRC, 2001).
Table 5 presents recent data on the firms employing workers with H-1B visas and shows that, inaddition to the largest hardware and software companies, firms with strong ties to India such as SyntelInc., Wipro Ltd. and Tata Consultancy Services are among the main recruiters.16
Box 3 describes several programmes for foreign ICT workers in OECD countries.17
What attracts new IT workers?
Smaller and younger companies are becoming increasingly attractive to young graduates.According to a McKinsey survey in the United States, more than two-thirds get their first job with a largecompany (more than 1 000 employees), but small firms (fewer than 500 employees) are preferred onceemployees move to a second job.
New non-standard forms of compensation such as stock options and performance-related bonusesare strong incentives for talented workers (Hoch et al., 2000). Given high turnover rates, firms are oftenwilling to offer high non-standard compensation packages to retain and attract the most skilled workers(Table 6). Although earnings through such schemes have been growing at a much faster rate than wages,these incentives only appear to benefit a small proportion of all IT workers.
Given the relative job security and job opportunities that they enjoy, IT workers can often afford toask for other benefits besides, or in addition to, financial compensation. An international survey ofsoftware firms identifies individual workplace styles as strong incentives for workers seeking jobs (Hochet al., 2000). A McKinsey survey highlights other non-monetary incentives that prospective employeesvalue highly: autonomy, lifestyle, company culture, geographic location (Business 2.0, 2000). Someobservers have even argued that a new class of “digital nomads” is emerging: highly skilled and mobileworkers with little or no attachment to firms or countries (Makimoto and Manners, 1997).
Defining and identifying IT skill requirements
Surveys from countries such as the United States (US NRC, 2001; ITAA, 2000), Canada (ACST, 2000;Sangster, 1999), Ireland (ISC, 2000a and 2000b; Forfás, 2000a and 2000b), the Netherlands (Ministry ofEconomic Affairs/Ministry of Education, Culture and Science, 2000) and the United Kingdom (AISS/ITNTO,
Table 5. Leading employers of H-1B visa holders, petitions approved by the INS between October 1999 and February 2000
Source: US INS (2000b).
Company Number
Motorola 618Oracle Corp. 455Cisco Systems Inc. 398Mastech (iGATE Capital) 389Intel Corp. 367Microsoft Corp. 362Rapidigm 357Syntel Inc. 337Wipro Ltd 327Tata Consultancy Services 320
© OECD 2002

OECD Information Technology Outlook 2002
170
Box 3. Foreign ICT worker programmes in various OECD countries
Germany
In August 2000, Germany launched a “Green Card” programme that allows for 20 000 temporary visasto be issued to computer specialists from outside western Europe. An analysis of the data1 for the first8.5 months of the programme shows that the main source of workers are eastern European countries(around 40%), followed by India and Pakistan (about one-fifth). Most are men (88%) and are hired fromabroad (about 85%), except for North Africans, who are predominantly hired after study in Germany.Although there are two criteria for eligibility – educational attainment and income – the former isdetermining in almost 90% of cases. Around two-thirds of these workers are employed in small firms(fewer than 100 employees). By mid-April 2001, only one-third of the 20 000 cards had been allotted.
Canada
In terms of IT workers, Canada faces both immigration and emigration issues. Despite a perceivedgap in employment opportunities and income tax differentials, there seems to be no evidence of anincreasing “brain drain” towards the United States. The net effect is in fact estimated to be positive, as agrowing number of foreign workers are moving to Canada (Helliwell, 1999). A recent study of Asiancomputer professionals hired by Canadian firms shows that effective recruitment and retention strategiesare needed, given the global nature of competition for skilled workers (CPRN, 2001).
Australia/New Zealand
In Australia, 3 200 temporary immigrant visas were granted in 1997-98 to IT professionals (18% of allskilled temporary nominations) (NOIE, 1998). If IT workers meet the test-points criteria, they are eligibleunder the Independent and Skilled Australian-linked categories: in 1997-98, 613 computer professionalsentered under the Independent category compared to 180 under the Skilled Australian-linked category.According to the Department for Immigration and Multicultural Affairs (DIMA), the number of ITprofessionals entering Australia has increased markedly since 1997: 7 000 IT managers, computingprofessionals, and computer support technicians entered Australia and 4 200 departed, resulting in a netgain of 2 800 IT workers (DIMA, October 2000). The New Zealand Immigration Service recently announcedthat it would start pilot testing on-line applications for visas and permits in order to attract IT talent.2
United Kingdom
Of the 42 000 work permits granted in 1999 to non-EU nationals, 2 000 went to immigrants employedin ICT occupations. Of these, two-thirds were from India, and the remainder were mainly from English-speaking countries (IES, 2002). A “fast-track” work permit system has since been implemented to speedup the recruitment of foreign workers by companies experiencing skills shortages. In addition, certain ICToccupations have been added to the “shortage occupation list”, and other measures have been taken toattract workers from Asia and Eastern Europe, as well as extending the period of stay from four to fiveyears (OECD, 2001f).
Norway
In March 2001, the Norwegian government launched a programme to amend regulations to simplifythe recruitment of skilled workers and specialists from countries outside the EEA area. With the amendedregulations, the processing time of applications will be reduced, and a non-EEA citizen will be able toobtain a work permit more rapidly than before. The regulations will enter into force from January 2002.
1. Data on Green Cards were kindly provided to the OECD by the German Ministry of Employment.2. As part of the recently disclosed New Zealand E-commerce Strategy, see www.ecommerce-summit.govt.nz/minister/
index.htmlSource: OECD and other sources as cited.
© OECD 2002

ICT Skills and Employment
171
1999; Hendry 1999; DfEE 2000a and 2000b) concur with the finding that IT firms tend to seek a combinationof three main types of skills:18
– Technical skills: primarily IT, but also quantitative analysis/data modelling, digital media,technical writing, etc.
– Business/management skills: in particular marketing, strategy and business writing.
– Personal skills: communication, leadership, teamwork, problem-solving ability.
Along with the emergence of new occupations, new jobs are appearing which require hybrid skills(Ducatel and Burgelman, 2000). Content industries are an example of activities where interdisciplinarywork calls for a combination of creative and technical skills, as well as business abilities.
Data based on industrial and occupational classifications do not provide sufficient information onthe specific skills of the IT workforce. Given that IT workers undertake a wide range of activities that fallunder different occupational categories (not always IT-related), more detailed tools are needed toidentify IT jobs and the specific skills required. The appendix to this chapter contains a detailed list ofIT-related occupations from the US Northwest Center for Emerging Technologies (NWCET), divided intoeight clusters. These standards cover technical skills, employability skills and basic knowledgerequirements for each IT career cluster. Each cluster has a range of jobs at various levels.
In the United Kingdom, a Skills Framework for the Information Age (SFIA) along similar lines hasbeen developed by a consortium of public and private bodies. It is constructed as a two-dimensionalmatrix with skills and responsibility levels as the axes. One axis divides ICT activities into skills groupedinto subcategories or “business roles”. Subcategories are then grouped into six work areas: strategy andplanning, management and administration, development and implementation, service delivery, salesand marketing and use. The other axis defines the level of responsibility and accountability exercisedby ICT workers and users. Each of seven levels, from new entrant to strategist, is defined in terms ofautonomy, influence, complexity and business skills. A skills/levels matrix can then be used to showwhich skills are relevant at which levels (ITNTO, 2000). This system is intended as a diagnostic tool toassist employers in determining more precisely and systematically the skill content of current jobs andnew skill requirements. It is also meant to help firms to develop training, recruitment and outsourcingpolicies. The framework is designed in such a way as to be compatible with detailed competencedescriptions and other schemes, such as the IT National Occupational Standards, the British ComputerSociety’s Industry Structure Model 3 (ISM3.2) and the NWCET system.
Policy options and action
Firm responses
There is a need to balance costs and benefits for both firms and employees as training generatesincreased wages for workers, but also increased productivity for firms, especially if introduced inconnection with changes in work organisation (OECD, 1996; OECD, 1998; Bresnahan et al., 1999). Highturnover rates might act as a strong disincentive for firms to invest in generic (not company-specific)
Table 6. Annual growth in compensation for workers in software firms in the United States, 1997-99
Source: Executive Alliance in US NRC (2001).
Base salary (%) Cash awards (%)Long-term incentives
(%)Total compensation
(%)Number of incumbents
(1999)
Technical staff 5.12 15.85 36.79 7.15 35 022Managerial jobs 6.76 32.28 95.77 24.95 5 339
© OECD 2002
OECD Information Technology Outlook 2002
172
skills (IT or other), especially given the rapid pace of change in the industry. On the other hand, theavailability of training can be an additional incentive for a worker to accept a job within that firm.19 Inthe case of IT training, there is reason to believe that workers will be willing to share some of the costsof training aimed at building and updating highly marketable skills. Many firms have opted for acombination of on-the-job and training outside of normal working hours.20
Firms are also establishing closer links with educational institutions, both through in-houseprogrammes (apprenticeships)21 as well as through involvement in formal education (both directsupport in terms of equipment and/or human resources and co-operation in designing curricula andacademic programmes). Finally, employers can contribute by clarifying which attributes they considerto be essential for IT jobs and which ones are merely desirable (US NRC, 2001).
Industry associations also play an important role in helping identify skill needs of firms. They canact as a bridge with educational institutions and facilitate structured assessment programmes atindustry-wide level. Two examples previously mentioned are the NWCET and SFIA skill-settingexercises in which industry associations have played a significant role. The Council of EuropeanProfessional Informatics Societies (CEPIS) has developed a similar set of standard statements ofattributes and skills for ICT jobs (CEPIS, 2001). Given rapid changes in the industry, certification canhelp firms to identify workers with the latest skills quickly. In Australia, the Industry IT&T SkillsTaskforce has played an important role in relaying concerns from private firms to policy makers. InCanada, the sector councils (e.g. Software Human Resources Council) play a key role, includingsurveying sectoral skills needs, establishing occupational/skill standards and developing education andtraining programmes (ACTS, 2000). In the United States, the ITAA has launched a series of WorkforceDevelopment Initiatives, including organising nation-wide and regional conferences, implementing aprogramme to engage IT employers in the “School-to-Careers” programme, launching a nationalinternship programme targeting minority students and assisting in the development of an IT careercluster model (ITAA, 2000). The World Information Technology and Services Alliance (WITSA), afederation of national industry associations, has recently compiled an extensive inventory of studiesand actions undertaken by governments, firms and other stakeholders (WITSA, 2001).
Incentives and barriers
A range of stakeholders are involved in building IT skills, with different incentive structures (costsand benefits) resulting in a variety of human capital investment strategies. Table 7 provides a generalframework relating to the main questions: who pays for what and who can expect to appropriate thebenefits, keeping in mind that private and social rates of return do not always converge (OECD, 1998).Although there is strong evidence that secondary education yields important social rates of return(strengthening the case for government support), the evidence for tertiary education and trainingseems to suggest greater relative private rates of return to individuals. This is particularly the case for ITtraining and work; given the backdrop of favourable employment opportunities and increasingcompensation, this supports arguments favouring cost sharing. Although no analysis has been donespecifically on IT workers, studies on the broader group of scientists and engineers and other categoriesof “knowledge workers” suggest that important spillovers exist and that government policy should focuson increasing the supply of such workers instead of targeting demand (Romer, 2000).
The complexity of linkages reinforces the need to develop a systemic approach to addressing thevarious relevant parties: schools and higher education institutions, private firms, government andindividuals. Workers and graduates need information on which skills are in demand, as well as on whereand how to obtain them. Policy makers require better measurement tools and continuous monitoring,not only of employment and skills, but also of related data such as compensation, mobility andimmigration. Firms seek clearer signals on the supply of skilled workers while working out new ways ofcommunicating their changing requirements in a more efficient and timely way to the educationalsystem.
© OECD 2002

ICT Skills and Employment
173
Other stakeholders
Australia, Canada, Ireland, the Netherlands, Sweden, the United Kingdom and the United Stateshave set up task forces to examine skills issues and suggest urgent action. The mandate of these bodiesis often much broader than the narrow question of IT skills (both professional and basic) and oftenincludes recommendations for related areas of policy making. In order for these to be effective,programmes aimed at building IT skills will need to be well integrated into the educational,employment and other social and economic policy frameworks (Netherlands Ministry of EconomicAffairs/Ministry of Education, Culture and Science, 2000).
Governments
A wide range of policy recommendations and actions which countries consider relevant whenaddressing the challenge of building ICT skills for the future are presented in Chapter 8.22 Reviews ofskill requirements in various OECD countries all point towards the need for a strong co-ordinating roleby governments in addressing the relevant issues. Through the use of both direct and indirectmeasures, governments can play a leading role in setting priorities and leveraging the action of otherstakeholders. Table 8 summarises some of the main issues and policy areas for governments.
Chapter 8 provides a comprehensive listing of various policies undertaken by OECD governmentsto promote ICT skills. The following is a brief presentation of some promising examples.
In Australia, the government and the private sector are in the process of setting up an IT&T SkillsExchange. The Exchange will be a privately incorporated body driven by industry needs, focused on
Table 7. Assessing costs and benefits of human capital investment
Source: OECD (1998).
Individuals Enterprises Government/society
Costs Benefits Costs Benefits Costs Benefits
Compulsory education
Tuition fees and other educational costs
Future productive and social capabilities and better quality of life
Some direct financial contributions
Improved skills, cognitive and behavioural attributes of workers
Direct outlays Higher skill levels, social cohesion, growth and tax returns
Post-compulsory and higher education
Tuition fees, other educational costs and foregone earnings while studying
Skills/qualifications leading to higher earnings, employability and quality of life
Direct financial contributions
Improved skills, cognitive and behavioural attributes of workers
Direct outlays on educational institutions, transfers to students
Higher skill levels, social cohesion, economic growth and tax returns
Enterprise training
Zero to full cost depending on terms of contract
Studies suggest positive impact on wages, job tenure and productivity
Direct outlays, wages paid and some training levies
Enterprise-specific knowledge with improvements in productivity
Zero to full subsidy
Higher skill levels, social cohesion, economic growth and tax returns
Informal learning Opportunity time costs and direct financial costs
Economic and non-economic gains depending on qualifications earned
Cost of lost production time due to learning
Enterprise-specific knowledge with improvements in productivity
No cost Economic and social spin-offs
© OECD 2002

OECD Information Technology Outlook 2002
174
providing just-in-time training and complementing the public education and training infrastructure. Theprojects undertaken by the Exchange will involve three areas:
– A survey of industry demand for IT&T skills, administered to around 3 000 businesses Australia-wide.
– A survey of the current enrolment and completion rates of public and private education suppliersto determine the supply of IT&T skills in Australia.
– A systematic analysis of the survey outcomes to determine the economic implications of anyshortfalls.
The Ignite Careers Web site (www.ignite.net.au/), jointly managed by the Commonwealth, state andterritory governments and the Industry IT&T Taskforce, provides information on IT courses and financialassistance and has three parts: programmes, apprenticeships and careers. It also links to skill shortagelists compiled at national and regional level by the Department of Employment, Workplace Relationsand Small Business. Regional authorities such as the state governments of Victoria, New South Walesand Queensland have been very active in recognising the importance of building a strong ICT skillsbase to strengthen both traditional and emerging industries (e.g. Multimedia Victoria, 2000). TheAsia-Pacific Economic Cooperation (APEC) Telecommunications and Information Working Groupannounced an initiative to address e-commerce skills gaps in the region and define standards. Australiawill be leading this activity, which also includes China, the Philippines and Indonesia (NOIE, 2001).
A study of skill requirements in the Canadian ICT sector (Denton and Pereboom, 1999) highlightsthe success of the “O-Vitesse” programme which provides university-level training to engineers,mathematicians and other qualified professionals in fields relevant to software development. Theprogramme, which runs as a partnership between government, industry and educational institutions,was originally created by the National Research Council Canada and is now being privatised. A reportprepared by the Canadian Expert Panel on Skills for the Advisory Council on Science and Technologycalls for new decision-making structures, such as an executive agency that could be federally fundedand private sector-led, working at national, regional and local level to integrate skills and enterprisedevelopment strategies (ACST, 2000).
Table 8. ICT skills: issues and actions
Source: OECD based on Multimedia Victoria (2000).
Skills formation (which skills?)
Skills acquisition/renewal (when and where?)
Main issues Areas for government action
Professional ICT skills Skills required to develop, use or service ICTs professionally
Post-secondary education, IT vendor certification
– Balance specialist ICT skills with other more generic skills
– High mobility– Recognise non-formal
qualifications
– Improve attractiveness of ICT careers
– Assist in providing labour market information
– Examine options for using foreign labour
Applied ICT skills Ability to use ICTs in non-ICT jobs
Post-compulsory education, workplace training
– Importance of integrating ICT into a sector/profession
– Help identify emerging ICT skill requirements for non-ICT jobs
– Provide incentives for firms to train workers
Basic ICT skills Strong life-long learning skills: fluency to use ICT for learning, working, recreation
Learning context: schools (children), training (adults) [at work, formal courses, informal exposure]
– Develop common standards
– Build core ICT competencies in curricula
– Enhance teacher skills
– Promote ICT skills as important “generic” skills for life-long learning
– Facilitate roll-out of ICTs in schools
– Promote ICT skills among teachers
© OECD 2002

ICT Skills and Employment
175
The Swedish government has collaborated with industry through a national IT training programme(SwIT). Government Bill 1997/98:1 allocated some SEK 1.3 billion to cover the costs of training courses,administration, evaluation and assessment, as well as unemployment training grants. This programme,which ran from 1998 to March 2000, provided training for 11 700 persons, mainly unemployed, andfocused on women, immigrants and the occupationally disabled. The average training period was25 weeks. An initial evaluation of the programme indicated that 62% of those who participated weresubsequently employed and 2% were pursuing higher education degrees. The results also indicatedthat SMEs found the programme to be very useful, valuing the close contact between the trainingorganisation and local business communities.
Educational institutions
Higher education institutions are facing the challenge of having to respond quickly in a rapidlymoving area. The two main concerns regarding IT students are: i) ensuring that graduates have acquiredthe right balance of theoretical and more applied skills; and ii) incorporating the teaching of business/management skills and “soft” skills into technical degrees. To address the first goal, educationalinstitutions must ensure that students are exposed to real-life situations and problems. In manycountries, the importance of apprenticeships (or “co-ops”) and other programmes where students gainon-the-job experience has been growing through partnerships with business. New forms of industry/academia collaborations should also be encouraged to attract qualified teaching staff, given the salarydifferentials which often discourage computer science graduates from following academic careers. Interms of revising IT curricula, educational institutions are responding to concerns voiced by industrygroups that many IT-related occupations require a broad range of often non-technical skills. Manybusiness schools have begun to introduce innovative e-business programmes that combine technicaland business skills.23
It is also important that existing educational institutions recognise the growing role of other actorssuch as private training firms and vendors, and engage in new partnerships to collaborate on issues ofcommon concern such as developing and reviewing certification programmes.
Individuals
Clearly, individuals themselves have strong incentives to upgrade their skills although they oftenlack information on how to do so. Students can benefit from better information on labour marketprospects and clearer information on educational pathways to IT careers. Apprenticeship and otherlearning-at-work programmes contribute to raising students’ awareness of industry’s concerns, workmethods and challenges. For workers, various reports stress the importance of self-training and theneed for better information on the possibilities of retraining into IT jobs.
IT skills for all?
There is a growing recognition that the digital revolution has brought about the need for digitalliteracy, or widespread basic IT skills. In order to avoid digital exclusion, countries must ensure that ITskills are integrated into the concept of lifelong learning. All stakeholders agree on the need for an earlyintroduction of students to computers and other new technologies (OECD, 2000b). Investments intechnologies (hardware and software) must be accompanied by an adequate supply of qualifiedinstructors able to teach these new skills, as well as innovative curricula which take into account thepossibilities (and limitations) of the new technologies. Other possible actions include enhancing theopportunities for computer science graduates wanting to be teachers, strengthening the teaching ofmathematics and other sciences and encouraging post-secondary students to take basic IT coursesregardless of their main field of study.24 A wide range of OECD work has already addressed these issuesand a detailed analysis falls outside the scope of this study.
© OECD 2002
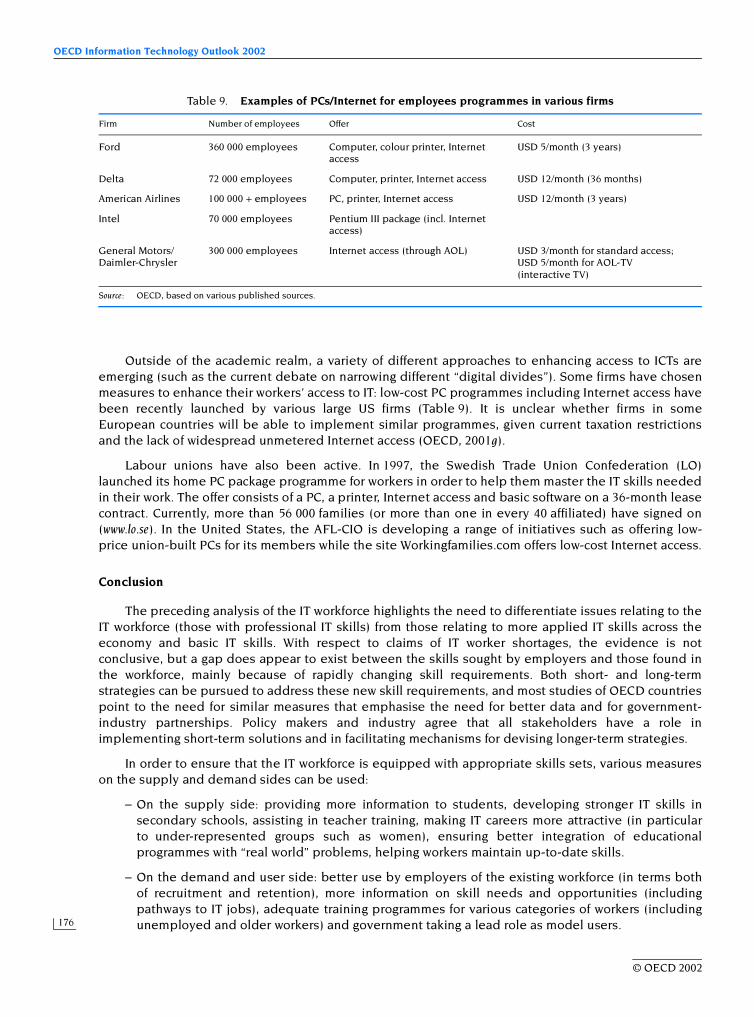
OECD Information Technology Outlook 2002
176
Outside of the academic realm, a variety of different approaches to enhancing access to ICTs areemerging (such as the current debate on narrowing different “digital divides”). Some firms have chosenmeasures to enhance their workers’ access to IT: low-cost PC programmes including Internet access havebeen recently launched by various large US firms (Table 9). It is unclear whether firms in someEuropean countries will be able to implement similar programmes, given current taxation restrictionsand the lack of widespread unmetered Internet access (OECD, 2001g).
Labour unions have also been active. In 1997, the Swedish Trade Union Confederation (LO)launched its home PC package programme for workers in order to help them master the IT skills neededin their work. The offer consists of a PC, a printer, Internet access and basic software on a 36-month leasecontract. Currently, more than 56 000 families (or more than one in every 40 affiliated) have signed on(www.lo.se). In the United States, the AFL-CIO is developing a range of initiatives such as offering low-price union-built PCs for its members while the site Workingfamilies.com offers low-cost Internet access.
Conclusion
The preceding analysis of the IT workforce highlights the need to differentiate issues relating to theIT workforce (those with professional IT skills) from those relating to more applied IT skills across theeconomy and basic IT skills. With respect to claims of IT worker shortages, the evidence is notconclusive, but a gap does appear to exist between the skills sought by employers and those found inthe workforce, mainly because of rapidly changing skill requirements. Both short- and long-termstrategies can be pursued to address these new skill requirements, and most studies of OECD countriespoint to the need for similar measures that emphasise the need for better data and for government-industry partnerships. Policy makers and industry agree that all stakeholders have a role inimplementing short-term solutions and in facilitating mechanisms for devising longer-term strategies.
In order to ensure that the IT workforce is equipped with appropriate skills sets, various measureson the supply and demand sides can be used:
– On the supply side: providing more information to students, developing stronger IT skills insecondary schools, assisting in teacher training, making IT careers more attractive (in particularto under-represented groups such as women), ensuring better integration of educationalprogrammes with “real world” problems, helping workers maintain up-to-date skills.
– On the demand and user side: better use by employers of the existing workforce (in terms bothof recruitment and retention), more information on skill needs and opportunities (includingpathways to IT jobs), adequate training programmes for various categories of workers (includingunemployed and older workers) and government taking a lead role as model users.
Table 9. Examples of PCs/Internet for employees programmes in various firms
Source: OECD, based on various published sources.
Firm Number of employees Offer Cost
Ford 360 000 employees Computer, colour printer, Internet access
USD 5/month (3 years)
Delta 72 000 employees Computer, printer, Internet access USD 12/month (36 months)
American Airlines 100 000 + employees PC, printer, Internet access USD 12/month (3 years)
Intel 70 000 employees Pentium III package (incl. Internet access)
General Motors/ Daimler-Chrysler
300 000 employees Internet access (through AOL) USD 3/month for standard access; USD 5/month for AOL-TV (interactive TV)
© OECD 2002

ICT Skills and Employment
177
Messages are more mixed in terms of immigration policy. Most countries seem to favour expandingthe short-term supply of IT workers through the use of foreign labour, but some observers point to therisks of such solutions. Even temporary increases in supply (such as short-term immigration) can putdownward pressure on wages, which in the medium term might discourage more students frompursuing careers in this field and send conflicting signals to current IT workers and firms.25
There are strong reasons to believe that as IT continues to diffuse throughout the economy, basicIT skills are becoming a new category of “general” competency, like numeracy or literacy skills.26 ITskills not only increase the earnings potential of information workers, they are becoming necessary for abroad range of activities. Therefore, in addition to creating a larger and more skilled IT workforce, thefocus should also be on building IT skills for all. Many countries have already formulated the explicitgoal of achieving in the near future IT literacy for all students completing secondary education. To beeffective, however, these programmes must be well integrated into broader policy frameworks such asthose aimed at strengthening educational systems, promoting lifelong learning and facilitatingworkforce upskilling.
© OECD 2002
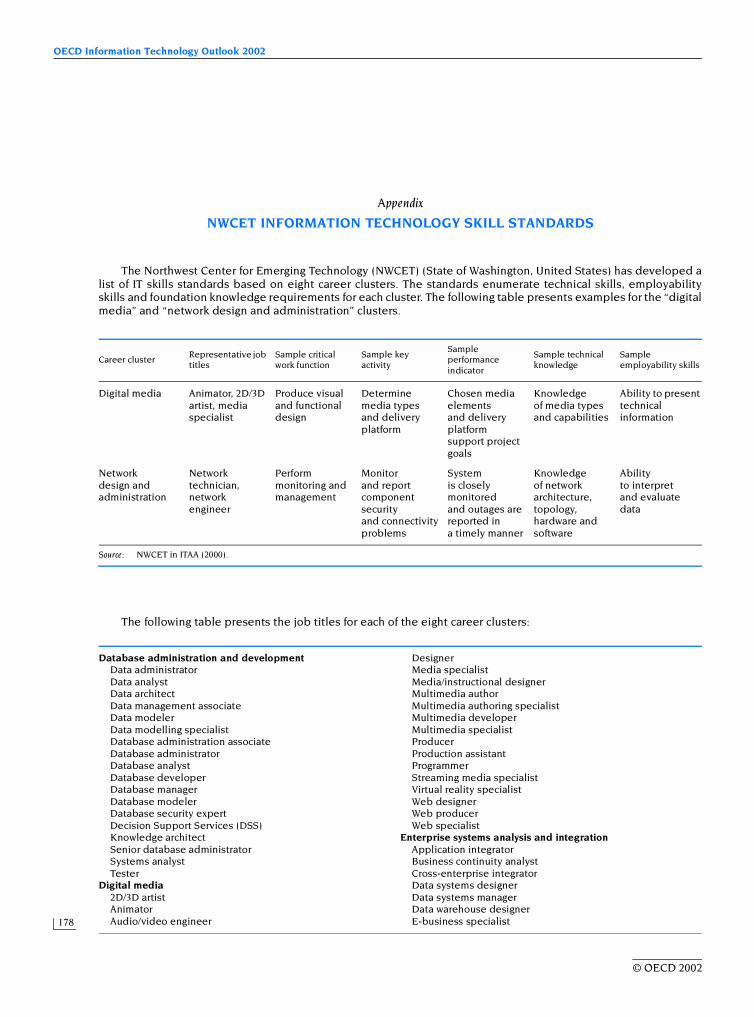
OECD Information Technology Outlook 2002
178
Appendix
NWCET INFORMATION TECHNOLOGY SKILL STANDARDS
The Northwest Center for Emerging Technology (NWCET) (State of Washington, United States) has developed alist of IT skills standards based on eight career clusters. The standards enumerate technical skills, employabilityskills and foundation knowledge requirements for each cluster. The following table presents examples for the “digitalmedia” and “network design and administration” clusters.
Source: NWCET in ITAA (2000).
The following table presents the job titles for each of the eight career clusters:
Career clusterRepresentative job titles
Sample critical work function
Sample key activity
Sample performance indicator
Sample technical knowledge
Sample employability skills
Digital media Animator, 2D/3D artist, media specialist
Produce visual and functional design
Determine media types and delivery platform
Chosen media elements and delivery platform support project goals
Knowledge of media types and capabilities
Ability to present technical information
Networkdesign and administration
Network technician, network engineer
Perform monitoring and management
Monitor and report component security and connectivity problems
System is closely monitored and outages are reported in a timely manner
Knowledge of network architecture, topology, hardware and software
Ability to interpret and evaluate data
Database administration and development DesignerData administrator Media specialistData analyst Media/instructional designerData architect Multimedia authorData management associate Multimedia authoring specialistData modeler Multimedia developerData modelling specialist Multimedia specialistDatabase administration associate ProducerDatabase administrator Production assistantDatabase analyst ProgrammerDatabase developer Streaming media specialistDatabase manager Virtual reality specialistDatabase modeler Web designerDatabase security expert Web producerDecision Support Services (DSS) Web specialistKnowledge architect Enterprise systems analysis and integrationSenior database administrator Application integratorSystems analyst Business continuity analystTester Cross-enterprise integrator
Digital media Data systems designer2D/3D artist Data systems managerAnimator Data warehouse designerAudio/video engineer E-business specialist
© OECD 2002

ICT Skills and Employment
179
Source: NWCET in ITAA (2000).
Table A5.1. H-1 visas granted in the United States by country of origin, 1989-99
Source: Lowell (2000).
Electronic transactions implementer Software QA specialistInformation systems architect Software testerInformation systems planner Systems analystSystems analyst Systems administratorSystems integrator Test engineer
Network design and administration TesterCommunications analyst Technical supportData communications analyst AnalystInformation systems operator Call centre support representativeInformation technology engineer Content managerNetwork administrator Customer liaisonNetwork analyst Customer service representativeNetwork architect Customer support professionalNetwork engineer Help desk specialistNetwork manager Help desk technicianNetwork operations analyst Senior systems analystNetwork security analyst Systems analystNetwork specialist Technical account managerNetwork technician Technical support engineerNetwork transport administrator Technical support representativePC support specialist Testing engineerPC network engineer Technical writingSystems administrator Desktop publisherSystems engineer Document specialistTechnical support specialist EditorUser support specialist Electronic publications specialist
Programming/software engineering Electronic publisherApplications analyst Instructional designerApplications engineer Online publisherBusiness analyst Technical communicatorComputer engineer Technical editorData modeler Technical publications managerOperating system designer/engineer Technical writerOperating system programmer/analyst Web development and administrationProgramme manager Web administratorProgrammer/analyst Web architectProject lead Web designerSoftware applications specialist Web page developerSoftware architect Web site developerSoftware design engineer Web specialistSoftware design engineer and tester WebmasterSoftware development engineer
1989 1990 1991 1992 1993 1994 1995 1996 1997 1998 1999
India 2 144 2 697 4 102 5 552 7 606 11 301 15 528 19 203 31 686 40 247 55 047United Kingdom 6 663 7 174 8 794 6 726 3 993 4 230 4 771 5 601 6 928 6 343 6 665China 837 610 1 145 894 1 031 1 256 1 887 2 330 3 214 3 883 5 779Japan 3 678 3 791 5 167 2 767 2 152 2 217 2 070 2 411 2 929 2 878 3 339Philippines 6 055 7 302 7 221 7 550 7 596 8 753 10 026 4 601 2 685 2 758 3 065France 2 318 2 293 2 413 1 686 870 1 003 1 216 1 463 1 894 2 110 2 633Germany 1 798 1 637 1 888 1 501 1 012 1 092 1 484 1 518 2 088 2 242 2 451Mexico 2 951 3 727 3 227 2 488 1 307 1 147 1 451 1 909 2 785 2 320 2 419Australia 872 827 1 102 990 863 1 050 1 042 1 123 1 438 1 666 1 651Russia 2 256 3 709 3 942 1 651 1 892 1 245 1 196 1 255 1 357 1 395 1 619Other 19 248 24 906 20 324 19 862 13 884 15 990 18 422 18 658 23 604 25 536 32 027
Total 48 820 58 673 59 325 51 667 42 206 49 284 59 093 60 072 80 608 91 378 116 695
© OECD 2002

OECD Information Technology Outlook 2002
180
NOTES
1. In this chapter, the terms IT and ICT are used interchangeably. Although the discussion most often refers to the“IT workforce” and IT workers, the data usually include telecommunication jobs to the extent that they relate tothe IT infrastructure.
2. Even within ICT jobs, a distinction must be made between: routine technical work (sales, support, basic Webdevelopment), which is often tied to vendor products, subject to rapid obsolescence and the need for frequenttraining; the implementation of business applications (ICT business analysts); and “high-level” ICT roles(programmers, systems engineers/analysts).
3. Responses were received from 532 firms in a sample of 1 493.
4. This includes the following IT occupations: computer programmers, computer engineers, computer systemsanalysts, database administrators, computer support specialists and all other computer scientists.
5. This figure is an overestimate of the actual number of ICT workers since it includes all employment inICT-producing industries, as well as ICT jobs in other sectors.
6. For Europe, computer workers include ISCO-88 categories 213 and 312; for the United States, CPS categories 64,65, 229, 308 and 309.
7. The ITAA study calculates the “skills gap” as follows: current demand (vacancies) times percentage ofapplicants that employers deem qualified to fill a specific job.
8. Vacancy rates are a useful but imperfect indicator of tightness in the labour market. Vacancies are to beexpected in high-growth industries and occupations and can also mask inadequate recruitment practices (USDOC, 1999). In addition, various firms may advertise openings for a same (IT services) contract which they allexpect to win, resulting in multiple counting of individual jobs.
9. It is estimated that in March 2001, almost 10% of layoffs in the United States took place in Internet-related firms(Industry Standard, 2001; US Bureau of Labor Statistics, 2001).
10. Internal and external strategies are sometimes also referred to as functional and numerical, respectively(OECD, 1996).
11. The institutions covered in the survey usually award about one-third of all bachelor’s degrees in these fields inthe United States.
12. This does not provide an estimate of the number of persons with credentials since individuals often possessmore than one. It is estimated that there are more than 37 000 Microsoft Certified individuals in theUnited Kingdom and Ireland (Department for Education and Employment, 2000a).
13. Countries such as the Netherlands have recognised the need to facilitate certification mechanisms, includingrecognition of non-formal learning (Duvekot, 2000).
14. To address the lack of reliable data on the use of offshore workers and the international relocation ofemployment, the UK Institute of Employment Studies (IES) is co-ordinating the EU-funded EMERGENCEproject (www.emergence.nu) which attempts to gather statistical evidence on international outsourcing activities.
15. The H1 visa programme was created in the 1960s to attract skilled non-immigrant workers to the United States.Following the Immigration Nursing Relief Act of 1989, H-1A visas were granted to registered nurses. Since 1995,this programme has been discontinued and all H1 visas are now H-1B (speciality worker). Numerical caps tothe H-1B programme were first set by the US Congress in the early 1990s.
16. For more on the Indian software industry and its links to the United States see OECD, 2000a, Chapter 6.Immigration policies of host countries have a strong impact on education policy in home countries of IT workerssuch as India. Given the strong (and growing) demand for Indian IT professionals, the Indian governmentrecently announced a decision to double the capacity of engineering colleges and to set up a task force onhuman resources development in IT [www.wired.com/news/business/0,1367,39902,00.html]
17. See OECD (2001a) Annex 5.D for more detailed country-specific criteria and conditions for admission and DIMA(2001) for a comparison of policies relating to ICT skills for temporary business entry and students in variousOECD and non-member countries.
© OECD 2002

ICT Skills and Employment
181
18. In several non-English-speaking countries, foreign language skills were often cited as an important asset for ITworkers given the predominance of English as a technical language.
19. Autor (2000) argues that temporary help firms have an incentive to provide free general skills training giventhat their main role (and business) is to gather and sell information about worker “quality” to employers(screening).
20. The American Society for Training and Development (ASTD) estimates that between 11% and 13% of trainingexpenditures in the United States are currently allocated to IT training, including training for both ITemployees and for other categories of workers (21st Century Workforce Commission, 2000). Statistics Finlandestimated that in Finland in 1997, in all occupations at least one-third of employees had received employer-arranged computer training in the previous two years (Statistics Finland, 1999).
21. An oft-cited example is Nortel Networks’ co-op programme in Canada and the United States aimed at bothhigh school and university students.
22. Button et al. (2000) provides a short overview of IT policies in various OECD and non-member economiesrelating to workforce and skill development.
23. See for example www.dmsoz.org/Business/E-Commerce/Education/Degree_Programs/ for a list of e-commerce degreeprogrammes offered at various institutions across OECD countries. Oglivie (2000) presents an overview ofresearch and course offerings related to e-commerce in Canadian universities.
24. By late 2001, the European/International Computer Driving Licence (ECDL/ICDL) programme had alreadyexceeded the mark of 1.5 million persons certified with basic IT skills. At that time, there were over 10 000 testcentres world-wide issuing such certification (www.ecdl.com).
25. While some observers point to the risk for developing countries of losing valuable human resources(“brain drain”), in India and other Asian countries, a new view is that scientists and engineers working overseasmay represent a “brain bank” that can be drawn upon to encourage innovative development at home(OECD, 2000c).
26. At their April 2001 meeting, OECD Education Ministers acknowledged the importance of developing ICT skillsas a general competence, within the theme of fostering “Competencies for the Knowledge Society”(OECD, 2001d).
© OECD 2002

OECD Information Technology Outlook 2002
182
REFERENCES
21st Century Workforce Commission (2000),“A Nation of Opportunity: Building America’s 21st Century Workforce”, www.workforce21.org/finalreport.htm
Acemoglu, D. (2000),“Technical Change, Inequality and the Labor Market”, NBER Working Paper No. 7800, July, www.nber.org/papers/w7800
Adelman, C. (2000),“A Parallel Universe Expanded: Certification in the Information Technology Guild”, revised version of articlefirst appearing in Change, Vol. 32, No. 3, May-June, www.aahe.org/change/paralleluniverse.htm
Advisory Council on Science and Technology (Canada) (ACST) (2000),“Stepping Up: Skills and Opportunities in the Knowledge Economy, Report of the Expert Panel on Skills”, acst-ccst.gc.ca/acst/skills/home_e.html
Ahn, S. and P. Hemmings (2000),“Policy Influences of Economic Growth in OECD Countries: An Evaluation of the Evidence”, OECD EconomicsDepartment Working Papers No. 246, June, www.oecd.org/eco/eco
Alliance for Information Systems Skills/IT National Training Organisation (AISS/ITNTO) (United Kingdom)(ITNTO) (1999),Skills 99, Report for the Department of Trade and Industry and the Department for Education and Employment(United Kingdom).
ASSINFORM/Netconsulting/ESDW-UNIMIB (2000),“Rapporto 2000 sull’Occupazione nel settore dell’Informatica e delle Telecommunicazioni in Italia”,www.assinform.it/aree_sx/pubblicazioni/index_rapporto_occupazione2000a.htm
Association pour l’emploi des cadres (APEC) (2001),“Panel Entreprises Apec: Emploi Cadre – Bilan 2000, Perspectives 2001”, www.apec.asso.fr/
Autor, D.H. (2000),“Why Do Temporary Help Firms Provide Free General Skills Training?”, NBER Working Paper No. W7637, April,papers.nber.org/papers/W7637
Bresnahan, T.F., E. Brynjolfsson and L.M. Hitt (1999),“Information Technology and Recent Changes in Work Organization Increase the Demand for Skilled Labor”,February, Stanford University.
Business 2.0 (2000),“Talent Crunch”, 10 October.
Button K., K. Cox, R. Stough and S. Taylor (2000),“Comparative Analysis of International Policy and Practice for High-Technology Workforce Development”,Mason Enterprise Center, School of Public Policy, George Mason University, May, www.workforce21.org/comparative_analysis.htm
Canadian Policy Research Networks (CPRN) (2001),“Economic Migrants in a Global Labour Market: A Report on the Recruitment and Retention of Asian ComputerProfessionals by Canadian High-tech Firms”, CPRN Discussion Paper No. W 13, July, www.cprn.org
Cappelli, P. (2000),“Is There a Shortage of Information Technology Workers?”, Wharton School, University of Pennsylvania, reportprepared for McKinsey and Co., June.
Computing Research Association (CRA) (2000),“1998-1999 Taulbee Survey”, “Computing Research News”, Vol. 12, No. 2, March, www.cra.org/CRN/online.html
Computing Research Association (CRA) (2001),“1999-2000 Taulbee Survey”, “Computing Research News”, Vol. 13, No. 2, March, www.cra.org/CRN/online.html
© OECD 2002

ICT Skills and Employment
183
Council of European Professional Informatics Societies (CEPIS) (2001),“European Informatics Skills Structure”, www.cepis.org/prof/eiss.htm
Denton, T. and B. Pereboom (1999),“Profile of the Information and Communications Technologies Sector”, report prepared for the Expert Panel onSkills, http://acst-ccst.gc.ca/skills
Department of Employment, Workplace Relations and Small Business (DEWRSB) (Australia) (2001),“Vacancy Report – April 2001”, www.dewrsb.gov.au/employment/publications/vacancyReport/
Department of Immigration and Cultural Affairs (DIMA) (Australia) (2001),“ICT in Focus: Immigration Initiatives for Australia’s ICT Industry Innovation Action Plan”, January,www.dima.gov.au/ict/index.html
Department for Education and Employment (DfEE) (United Kingdom) (2000a),“Skills for the Information Age”, Final Report from the Information Technology, Communications and ElectronicSkills Strategy Group, www.dfee.gov.uk/skillsforce/index.htm
Department for Education and Employment (DfEE) (United Kingdom) (2000b),“Skills for All: Proposals for a National Skills Agenda”, Final Report of the National Skills Task Force, June,www.dfee.gov.uk/skillsforce/index.htm
Ducatel, K. and J.C. Burgelman (2000),“ICTs and Employment in Europe: Outlook to 2010”, paper presented at the EURO-CPR 2000 Conference,Venice, March.
Duvekot, R. (2000),“Working and Learning Together: A Model for European Cooperation”, Ministry of Economic Affairs of theNetherlands, paper presented for the Conference on “Identification, Assessment and Recognition ofNon-Formal Learning: European Experiences and Solutions”, Lillehammer, Norway, 15-16 May.
Ellis, R. and B.L. Lowell (1999a),“Core Occupations of the US Information Technology Workforce”, Report 1 of the Information TechnologyWorkforce Data Project, United Engineering Foundation, November, www.uefoundation.org/itworkfp.html
Ellis, R. and B.L. Lowell (1999b),“The Production of US Degrees in Information Technology Disciplines”, Report 2 of the Information TechnologyWorkforce Data Project, United Engineering Foundation, November, www.uefoundation.org/itworkfp.html
Ellis, R. and B.L. Lowell (1999c),“Foreign Origin Persons in the US Information Technology Workforce”, Report 3 of the Information TechnologyWorkforce Data Project, United Engineering Foundation, November, www.uefoundation.org/itworkfp.html
Ellis, R. and B.L. Lowell (1999d),“Assessing the Demand for Information Technology Workers”, Report 4 of the Information TechnologyWorkforce Data Project, United Engineering Foundation, November, www.uefoundation.org/itworkfp.html
EMERGENCE (2001),“Where the Butterfly Alights: the Global Location of eWork”, Press Release, www.emergence.nu/news/balights.html
European Information Technology Observatory (EITO) (2001),EITO 2001, Frankfurt am Main.
Forfás (2000a),“Second Report of the Expert Group on Future Skills Needs”, www.forfas.ie/publications/fskills_2.htm
Forfás (2000b),“Report on e-Business Skills”, Expert Group on Future Skills Needs, www.forfas.ie/publications/e-business_skills.htm
Gingras, Y. and R. Roy (1998),“Is there a Skills Gap in Canada?”, Human Resources Development Canada, October.
Helliwell, J.F. (1999),“Checking the Brain Drain: Evidence and Implications”, report prepared for the Expert Panel on Skills, http://acst-ccst.gc.ca/skills
Hendry, C. (1999),“Skills Task Force Research Paper No. 10: New Technology Industries”, September, www.dfee.gov.uk/skillsforce
Hoch, D.J., C.R. Roeding, G. Purkert and S.K. Lindner (2000),Secrets of Software Success: Management Insights from 100 Software Firms Around the World, Harvard Business SchoolPress, Boston MA.
Industry Standard (2001),“Putting Layoffs in Perspective”, 23 April.
Information Technology Association of America (ITAA) (2000),“Bridging the Gap: Information Technology Skills For A New Millennium”, April, www.itaa.org
© OECD 2002

OECD Information Technology Outlook 2002
184
Information Technology Association of America (ITAA) (2001),Where Can You Start? Building Better Information Technology Skills and Careers, Executive Summary, April.
Institute for Employment Studies (IES) (2002),An Assessment of Skill Needs in Information and Communication Technology, report prepared for the ICT Skills Dialogue,United Kingdom.
Institute for the Management of Information Systems (IMIS) (2001),“What Skills Shortages? 2001 IT Skills Trend Report”, Discussion draft for IMIS and Computer Weekly 500 Club,Management Summary, August, www.imis.org.uk/members/a_white/skills-shortage.pdf
International Labour Organization (ILO) (2001),World Employment Report 2001: Life At Work in the Information Economy, Geneva.
Ireland Information Society Commission (ISC) (2000a),“IT Access for All”, March, www.infosocomm.ie
Ireland Information Society Commission (ISC) (2000b),“New Technology in Irish Business: Skills and Training (Business 3)”, May, www.infosocomm.ie
IT National Training Organisation (United Kingdom) (ITNTO) (2000),“Tracking the Skills for Prosperity”, August, www.sfia.org.uk/What_SFIA_is/sfiaintro_1_1.pdf
Katz, L.F. (1999),“Technological Change, Computerization and the Wage Structure”, paper presented at the Conference on“Understanding the Digital Economy: Data, Tools and Research”, Washington, DC, 25-26 May.
Klotz, U. (2000),“Facts on the IT Labour Market”, IBITS, April, www.union-network.org/uniibits.nsf
Lowell, B.L. (2000),“H1-B Temporary Workers: Estimating the Population”, Institute for the Study of International Migration,Georgetown University, April.
Makimoto, T. and D. Manners (1997),Digital Nomad, John Wiley and Sons.
Massé, P., R. Roy and Y. Gingras (1998),The Changing Skill Structure of Employment in Canada, R-99-7E, Human Resources Development Canada, November.
Matloff, N. (1998),“Debunking the Myth of a Desperate Software Labor Shortage”, University of California at Davis, Testimony tothe US House Judiciary Committee – Subcommittee on Immigration, 21 April (updated October 2000),www.heather.cs.ucdavis.edu/itaa.real.html
Ministère du Travail – DARES (2000),“Recruter en 1999, des difficultés plus ou moins vives suivant les métiers recherchés”, Premières Synthèses,No. 22.1, June, www.travail.gouv.fr
Ministry of Economic Affairs/Ministry of Education, Culture and Science (Netherlands) (2000),Competing with ICT Competencies: Know-how and Innovation for the Dutch Digital Delta, April.
Ministry of Industry, Employment and Communications (Sweden) (2000),“The Development of IT Skills”, No. 2000.076, December, www.naring.regeringen.se/pressinfo/infomaterial/pdf/n2000_076en.pdf
Multimedia Victoria (2000),Skills × Knowledge = Growth, State Government of Victoria (Australia), October.
National Center for Education Statistics (United States) (NCES) (2001),“Digest of Education Statistics”, NCES-2001-034, www.nces.ed.gov/pubs2001/digest/
National Office for the Information Economy (Australia) (NOIE) (1998),“Skills shortages in Australia’s IT and T industries”, www.noie.gov.au/projects/ecommerce/skills/discpaper_dec98/skills.html
National Office for the Information Economy (Australia) (NOIE) (2001),“APEC TEL Aims to Remedy ICT Skills Shortage in Asia-Pacific Region”, Press Release, 16 March.
OECD (1996),Technology, Productivity and Job Creation, Vol. 2: Analytical Report, OECD, Paris.
OECD (1998),Human Capital Investment: An International Comparison, Centre for Educational Research and Innovation, OECD,Paris.
OECD (1999),The Economic and Social Impacts of Electronic Commerce, OECD, Paris.
© OECD 2002
ICT Skills and Employment
185
OECD (2000a),Information Technology Outlook 2000, OECD, Paris.
OECD (2000b),Learning to Bridge the Digital Divide, Centre for Educational Research and Innovation (CERI), US National Center onAdult Literacy (NCAL), OECD, Paris.
OECD (2000c),Proceedings of the “Joint German – OECD Conference on Benchmarking Industry-Science Relationships”, heldin Berlin 16-17 October 2000, Paris, www.oecd.org/pdf/M00008000/M00008214.pdf
OECD (2001a),“Knowledge, Work Organisation and Economic Growth”, DEELSA/ELSA(2001)2, mimeo.
OECD (2001b),The New Economy: Beyond the Hype – The OECD Growth Project, OECD, Paris.
OECD (2001c),The Well-being of Nations: the Role of Human and Social Capital, Centre for Educational Research and Innovation(CERI), OECD, Paris.
OECD (2001d),Education Policy Analysis 2001, OECD, Paris.
OECD (2001e),Trends in International Migration – SOPEMI Annual Report 2000, OECD, Paris.
OECD (2001f),“Foreign Workers: Overview and Challenges for OECD Countries”, DEELSA/ELSA(2001)8, mimeo.
OECD (2001g),Communications Outlook 2001, OECD, Paris.
Oglivie, K. (2000),“Electronic Commerce in Canadian Universities”, Report from the Talent Pool e-Team of The Canadiane-Business Opportunities Roundtable, November, http://e-com.ic.gc.ca/eteam/
Romer, P. (2000),“Should the Government Subsidize Supply or Demand in the Market for Scientists and Engineers?”, NBERWorking Paper No. 7723, June, www.nber.org/papers/w7723
Roy R., H. Henson and C. Lavoie (1996),A Primer on Skill Shortages in Canada, R096-8E, Human Resources Development Canada.
Sangster, D. (1999),“Critical Skills in Five Canadian Industries: A Summary Report on Sectoral Interviews”, report prepared for theExpert Panel on Skills, http://acst-ccst.gc.ca/skills
Scarpetta, S., A. Bassanini, D. Pilat, and P. Schreyer (2000),“Economic Growth in the OECD Area: Recent Trends at the Aggregate and Sectoral Level”, OECD EconomicsDepartment Working Papers No. 248, June, www.oecd.org/eco/eco
Stager, D. (1999),“Labour Market Trends and Projections for Systems Analysts and Computer Programmers in Canada”, RE-99-4E,Human Resources Development Canada, www.hrdc-drhc.gc.ca/arb/publications/research/1999docs/abr-99-4e.shtml
Statistics Denmark (2001),Information Society Denmark – A Statistical Mosaic, Copenhagen.
Statistics Finland (1999),On the Road to the Finnish Information Society II, Helsinki.
Temple, J. (2000),“Growth Effects of Education and Social Capital in the OECD Countries”, OECD Economics Department WorkingPapers No. 263, October, www.oecd.org/eco/eco
United States Bureau of Labor Statistics (BLS) (2001),“Mass Layoff Statistics”, March, http://stats.bls.gov/mlshome.htm
United States Bureau of Labor Statistics (BLS) (2002),National Employment Matrix, February, www.bls.gov/emp/home.htm
United States Council on Competitiveness (1998),“Winning the Skills Race”, www.compete.org
United States Department of Commerce (DOC) (1999),“The Digital Workforce: Building Infotech Skills at the Speed of Innovation”, Technology Administration, Officeof Technology Policy, June, www.ta.doc.gov/otp/Reports.htm
© OECD 2002

OECD Information Technology Outlook 2002
186
United States Department of Commerce (2000a),The Digital Workforce: Update, Office of Technology Policy, August.
United States Department of Commerce (2000b),“Digital Economy 2000”, Economics and Statistics Administration, June, www.esa.doc.gov/de2k.htm
United States Department of Commerce (2002),“Digital Economy 2002”, Economics and Statistics Administration, February, www.esa.doc.gov/508/esa/DIGITALECONOMY2002.htm
United States Department of Commerce, US Department of Education, US Department of Labor, National Instituteof Literacy, Small Business Administration (1999),“21st Century Skills for 21st Century Jobs”, January, www.vpskillsummit.org
United States Immigration and Naturalization Service (INS) (2000a),“Characteristics of Specialty Occupation Workers (H-1B): October 1999 to February 2000”, June, www.ins.gov
United States Immigration and Naturalization Service (INS) (2000b),“Leading Employers of Specialty Occupation Workers (H-1B): October 1999 to February 2000”, June, www.ins.gov
United States National Research Council (NRC) (2001),Building a Workforce for the Information Economy, National Academy Press, Washington, DC, www.books.nap.edu/html/building_workforce/
United States National Science Foundation (NSF) (2000a),Science and Engineering Indicators 2000, National Science Board, Arlington VA, www.nsf.gov/sbe/srs/seind00/start.htm
United States National Science Foundation (NSF) (2000b),Women, Minorities and Persons with Disabilities in Science and Engineering 2000, Arlington, Virginia.
Weinstein, E. (1999),“How and Why Government, Universities and Industry Create Domestic Labor Shortages of Scientists andHigh-Tech Workers”, National Bureau of Economic Research (NBER), http://nber.nber.org/~peat/PapersFolder/Papers/SG/NSF.html
Wilson, R. (2000),Skills Survey 2000, Institute of Directors (IoD), IoD Research Paper, London, November.
World Information Technology and Services Alliance (WITSA) (2001),WITSA Inventory on IT Skills and Workforce Initiatives, Interim Compilation, 3 April.
© OECD 2002

187
Chapter 6
ICT DIFFUSION AND THE DIGITAL DIVIDE
The term “digital divide” is frequently used to describe the gap between individuals, households,businesses and geographical areas at different socio-economic levels, with regard to their opportunitiesto access and use information and communication technologies (ICTs) such as computers and theInternet. This gap varies significantly between advanced and developing economies, but also across theOECD area and within OECD countries.
This chapter examines relevant national and international data and addresses the digital dividebetween and within OECD countries. It does not address digital divide issues for developingeconomies or the North/South divide. It focuses on the following issues:
– What are the indicators of the digital divide?
– What does the digital divide look like? How is it captured in national statistics in terms of social,business and demographic characteristics?
– How rapidly is the divide changing and in what directions?
This chapter explores indicators of ICT access and use, the differences between leaders andlaggards in terms of access and use and measures of changes in access. Chapter 7 addresses thedevelopment of alternative Internet access paths and Chapter 8 describes government policies toreduce the digital divide in OECD countries.
Indicators of ICT access and use
The ICTs most commonly considered when measuring the extent of the digital divide aretelecommunications infrastructure, PCs and the Internet. This section summarises available indicatorson infrastructure readiness, ICT penetration rate and ICT use.1
Infrastructure readiness
Infrastructure readiness indicators show the general extent of the digital divide between countries(see OECD, 2001a). The number of telecommunication access lines per 100 inhabitants is the leadingindicator for the level of telecommunications service and a fundamental measure of the internationaldigital divide. The number of Internet hosts is a good indicator of the relative development of Internetinfrastructure. The number of secure servers is a key indicator for the development of electroniccommerce.
Telecommunication access lines
Most OECD countries have a similar number of fixed telecommunication access lines (traditionalaccess lines and ISDN lines) per 100 inhabitants. The OECD average is around 60 per 100 inhabitants(Figure 1). The appearance of ISDN channels is one reason why growth of fixed networks was slightlyhigher in the second half of the 1990s than in the first half. Fixed networks in countries that beganthe 1990s with low telecommunication penetration rates also grew significantly in the 1990s. The CzechRepublic, Hungary, Poland and Turkey all increased their respective public switched telephonenetworks (PSTNs), with double-digit compound annual growth rates (CAGR).
© OECD 2002

OECD Information Technology Outlook 2002
188
In the 1990s, the rise in wireless communication users far exceeded that for fixed networksubscribers. While the average annual expansion for fixed networks over 1995-99 was just 4%, mobilenetworks grew at a CAGR of 49.1%. Taken together, the total number of fixed and mobile access paths inOECD countries stood at 933 million at the end of 1999 and surpassed 1 billion in 2000. Recent datafrom ITU (2002) show that access levels are similar for 1999 and 2001.
Internet hosts
The United States has by far the largest number of Internet hosts, with more than 75 million inJuly 2001, some 67% of all hosts in the OECD region. Japan has the second largest number, with 6.1 million(5.4% of the OECD total). Other OECD countries with more than a million hosts in July 2001 includedCanada (5.6 million), the United Kingdom (4.1 million), Germany (4.1 million), Italy (2.3 million), theNetherlands (1.9 million), Australia (1.7 million), France (1.6 million), Sweden (1.6 million), and Spain(1.0 million).2
Between July 2000 and July 2001, the number of Internet hosts grew by 36.3% in the OECD area andby 58.8% in the European Union. Between 1999 and 2000, growth in hosts was fastest in countries withlower Internet host penetration (Italy, Mexico, Turkey), but from 2000 to 2001 these countries hadsubstantially lower growth rates (with the exception of Poland, which had the highest growth rate).From 2000 to 2001, growth rates were higher in countries with medium to higher Internet hostpenetration (Sweden, Germany, Spain, Austria, Japan).
Figure 1. Fixed telecommunication access channels in OECD countriesPer 100 inhabitants, 1990, 1995 and 1999
Source: OECD (2001a).
90
1990 1995 1999
80
70
60
50
40
30
20
10
0
90
80
70
60
50
40
30
20
10
0
Luxe
mbo
urg
Access channels per 100 inhabitants Access channels per 100 inhabitants
Norway
United
Sta
tes
Switzer
land
Denm
ark
Icelan
d
Canad
a
Germ
any
Nethe
rland
s
Austra
lia
Fran
ce
Greec
e
United
King
dom
Japa
n
OECDKor
ea
Belgium
Finlan
d
Irelan
d
Portu
gal
Hunga
ry
Austri
aSpa
in
New Z
ealan
dIta
ly
Czech
Rep
ublic
Turke
y
Sweden
Poland
Mex
ico
90
1990 1995 1999
80
70
60
50
40
30
20
10
0
90
80
70
60
50
40
30
20
10
0
Luxe
mbo
urg
Access channels per 100 inhabitants Access channels per 100 inhabitants
Norway
United
Sta
tes
Switzer
land
Denm
ark
Icelan
d
Canad
a
Germ
any
Nethe
rland
s
Austra
lia
Fran
ce
Greec
e
United
King
dom
Japa
n
OECDKor
ea
Belgium
Finlan
d
Irelan
d
Portu
gal
Hunga
ry
Austri
aSpa
in
New Z
ealan
dIta
ly
Czech
Rep
ublic
Turke
y
Sweden
Poland
Mex
ico
© OECD 2002

ICT Diffusion and the Digital Divide
189
Hosts per 1 000 population gives a better indication of the relative intensity of development of theInternet infrastructure in various countries (Figure 2). The United States is far ahead of other OECDcountries, with more than 273 hosts per 1 000 inhabitants in July 2001.
Secure servers
Electronic commerce requires secure ways of conducting buying and selling transactions over theInternet and other networks. Netcraft’s Secure Socket Layer (SSL) surveys provide one of the bestindicators of the growth and diffusion of e-commerce. The Netcraft survey can be used to explore thegrowth of e-commerce by country since it queries certificates to find the business address of theoriginator. The July 2000 survey showed that 95% of all secure servers were registered to addresses inOECD countries.
The United States is far ahead of other countries in developing secure (SSL) servers fore-commerce. In July 2001, the United States reported 86 025 secure servers with valid third-partycertificates – almost 65% of all secure servers in the OECD area. Japan reported the second largestnumber with 7 952 secure servers, followed closely by the United Kingdom at 7 916 (both representingapproximately 6% of the OECD total). Other countries with a high number of secure servers includedGermany with 6 442, Canada with 6 050 and Australia with 3 704.
Over the two years to July 2001, there was a 300% increase in the number of secure servers in OECDcountries, an indication of the rapid development of e-commerce infrastructure. Growth rates were high
Figure 2. Internet hosts in OECD countries per 1 000 inhabitants, July 2001gTLD adjusted
Source: OECD, from Netsizer (www.netsizer.com).
300
250
200
150
100
50
0
300
250
200
150
100
50
0
United
Sta
tes
Finlan
d
Canad
a
Icelan
d
Norway
Nethe
rland
s
New Z
ealan
d
OECD
Denm
ark
Austra
lia
Austri
a
Switzer
land
United
King
dom
Belgium EU
Germ
any
Japa
nIta
ly
Irelan
d
Fran
ceSpa
in
Hunga
ry
Greec
e
Czech
Rep
ublic
Poland
Portu
gal
Korea
Sweden
Slovak
Rep
ublic
Turke
y
Mex
ico
300
250
200
150
100
50
0
300
250
200
150
100
50
0
United
Sta
tes
Finlan
d
Canad
a
Icelan
d
Norway
Nethe
rland
s
New Z
ealan
d
OECD
Denm
ark
Austra
lia
Austri
a
Switzer
land
United
King
dom
Belgium EU
Germ
any
Japa
nIta
ly
Irelan
d
Fran
ceSpa
in
Hunga
ry
Greec
e
Czech
Rep
ublic
Poland
Portu
gal
Korea
Sweden
Slovak
Rep
ublic
Turke
y
Mex
ico
© OECD 2002

OECD Information Technology Outlook 2002
190
in countries with a relatively low base, such as Poland, Hungary, Turkey and Mexico. Growth was alsohigh in some countries that already extensively use secure servers, such as Japan, the United Kingdomand Germany.
The number of secure servers per million inhabitants is an indicator of the relative intensity of useof e-commerce (OECD, 2001a). In July 2001, Iceland and the United States recorded the most intensivedevelopment of secure servers at more than 300 per million inhabitants (Figure 3). Other countries withmore than 150 per million inhabitants were New Zealand (204), Canada (198), Australia (195),Switzerland (192), and Luxembourg (157).
ICT penetration
Rates of ICT access and use are among the most informative indicators of ICT penetration. However.care is needed when making cross-country comparisons owing to differences in the data collected.Access must be clearly distinguished from the extent and kind of use (see below). Access rates candiffer widely among households and individuals, and comparable national sets of data for each of thesevariables and kinds of user are not available for all OECD countries.3
Figure 3. Secure servers per million inhabitants, July 2001
Source: OECD (www.oecd.org/sti/telecom) based on Netcraft (www.netcraft.com).
350
300
250
200
150
100
50
0
350
300
250
200
150
100
50
0
Secure servers per one million inhabitants Secure servers per one million inhabitants
July 1999 July 2000 July 2001
Icelan
d
United
Sta
tes
New Z
ealan
d
Canad
a
Switzer
land
Luxe
mbo
urg
Sweden
United
King
dom
Finlan
d
Irelan
d
OECD
Norway
Austri
a
Denm
ark
Germ
any
Nethe
rland
s
Japa
n
Belgium
Czech
Rep
ublic
Fran
ceSpa
inIta
ly
Slovak
Rep
ublic
Portu
gal
Greec
e
Hunga
ry
Poland
Austra
lia
Korea
Mex
ico
Turke
y
350
300
250
200
150
100
50
0
350
300
250
200
150
100
50
0
Secure servers per one million inhabitants Secure servers per one million inhabitants
July 1999 July 2000 July 2001
Icelan
d
United
Sta
tes
New Z
ealan
d
Canad
a
Switzer
land
Luxe
mbo
urg
Sweden
United
King
dom
Finlan
d
Irelan
d
OECD
Norway
Austri
a
Denm
ark
Germ
any
Nethe
rland
s
Japa
n
Belgium
Czech
Rep
ublic
Fran
ceSpa
inIta
ly
Slovak
Rep
ublic
Portu
gal
Greec
e
Hunga
ry
Poland
Austra
lia
Korea
Mex
ico
Turke
y
© OECD 2002
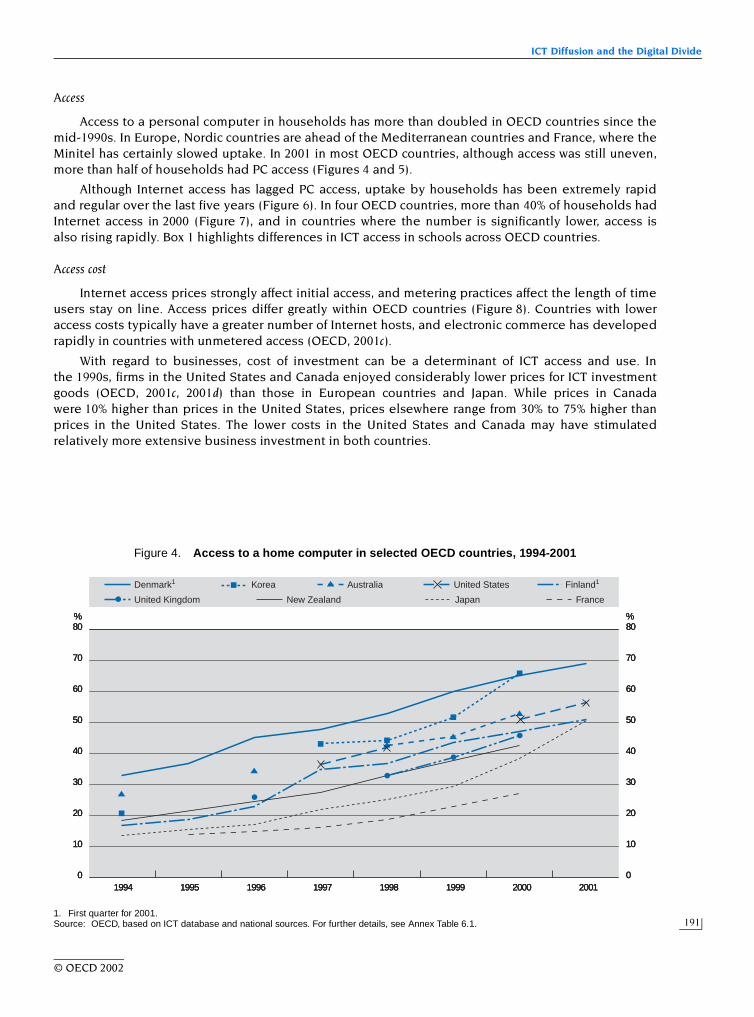
ICT Diffusion and the Digital Divide
191
Access
Access to a personal computer in households has more than doubled in OECD countries since themid-1990s. In Europe, Nordic countries are ahead of the Mediterranean countries and France, where theMinitel has certainly slowed uptake. In 2001 in most OECD countries, although access was still uneven,more than half of households had PC access (Figures 4 and 5).
Although Internet access has lagged PC access, uptake by households has been extremely rapidand regular over the last five years (Figure 6). In four OECD countries, more than 40% of households hadInternet access in 2000 (Figure 7), and in countries where the number is significantly lower, access isalso rising rapidly. Box 1 highlights differences in ICT access in schools across OECD countries.
Access cost
Internet access prices strongly affect initial access, and metering practices affect the length of timeusers stay on line. Access prices differ greatly within OECD countries (Figure 8). Countries with loweraccess costs typically have a greater number of Internet hosts, and electronic commerce has developedrapidly in countries with unmetered access (OECD, 2001c).
With regard to businesses, cost of investment can be a determinant of ICT access and use. Inthe 1990s, firms in the United States and Canada enjoyed considerably lower prices for ICT investmentgoods (OECD, 2001c, 2001d) than those in European countries and Japan. While prices in Canadawere 10% higher than prices in the United States, prices elsewhere range from 30% to 75% higher thanprices in the United States. The lower costs in the United States and Canada may have stimulatedrelatively more extensive business investment in both countries.
Figure 4. Access to a home computer in selected OECD countries, 1994-2001
1. First quarter for 2001.Source: OECD, based on ICT database and national sources. For further details, see Annex Table 6.1.
80% %
70
60
50
40
30
20
10
0
80
70
60
50
40
30
20
10
01994 1995 1996 1997 1998 1999 2000 2001
Denmark1 Finland1
New Zealand Japan
Korea
United Kingdom
Australia United States
France
80% %
70
60
50
40
30
20
10
0
80
70
60
50
40
30
20
10
01994 1995 1996 1997 1998 1999 2000 2001
Denmark1 Finland1
New Zealand Japan
Korea
United Kingdom
Australia United States
France
80% %
70
60
50
40
30
20
10
0
80
70
60
50
40
30
20
10
01994 1995 1996 1997 1998 1999 2000 2001
Denmark1 Finland1
New Zealand Japan
Korea
United Kingdom
Australia United States
France
© OECD 2002

OECD Information Technology Outlook 2002
192
Figure 5. Households with access to a home computer, 2000 and 2001
Source: OECD, based on ICT database and national sources. For further details, see Annex Table 6.1.
2000 2001
0 10 20 30 40 50 60 70%
Sweden
Korea
Denmark
Norway
Australia
United States
Germany
Finland
United Kingdom
New Zealand
Japan
Austria
Ireland
Spain
Italy
France
Turkey
2000 2001
0 10 20 30 40 50 60 70%
Sweden
Korea
Denmark
Norway
Australia
United States
Germany
Finland
United Kingdom
New Zealand
Japan
Austria
Ireland
Spain
Italy
France
Turkey
2000 2001
0 10 20 30 40 50 60 70%
Sweden
Korea
Denmark
Norway
Australia
United States
Germany
Finland
United Kingdom
New Zealand
Japan
Austria
Ireland
Spain
Italy
France
Turkey
Figure 6. Household access to Internet in selected OECD countries, 1996-2001
Note: For Denmark, Internet access via a home computer; for other countries access via any device (computer, phone, TV, etc.).Source: OECD, based on ICT database and national sources. For further details, see Annex Table 6.2.
70% %
60
50
40
30
20
10
0
70
60
50
40
30
20
10
01996 1997 1998 1999 2000 2001
JapanFinlandAustraliaCanadaUnited StatesDenmarkSweden
70% %
60
50
40
30
20
10
0
70
60
50
40
30
20
10
01996 1997 1998 1999 2000 2001
JapanFinlandAustraliaCanadaUnited StatesDenmarkSweden
70% %
60
50
40
30
20
10
0
70
60
50
40
30
20
10
01996 1997 1998 1999 2000 2001
JapanFinlandAustraliaCanadaUnited StatesDenmarkSweden
© OECD 2002

ICT Diffusion and the Digital Divide
193
Determinants of use
Various factors affect ICT use. As noted above, investment and access costs are important forhouseholds but there are other, more qualitative, hurdles to more widespread use. For PC use, forexample, many say they “don’t want” a PC. In Australia, two-thirds of households without a PC said thatthey had no need for or no interest in having one. Only one-quarter without a PC said that the costswere too high. For the Internet, lack of interest is generally ranked as the primary reason for non-use byhouseholds, while cost is generally ranked second (OECD ICT database). This holds true in Australia,France, the United Kingdom and the United States. Lack of a computer was also very important inFrance and the United Kingdom. In France, services being too complicated was also cited as important(SESSI, 2001) and in the United Kingdom lack of confidence and lack of skills were also important.
While access means that the technology is available, rate of use is lower than rate of access. Evenwhen connected, not all those with access to technology actually use it. In the United States (inOctober 2000), only 76% of people who had Internet access at home actually used the Internet at home(US Department of Commerce, 2000b). Similarly, in Australia, Italy and Sweden more people haveaccess to the Internet than use it (OECD ICT database).
With regard to businesses, common obstacles to electronic commerce include strategic issues suchas the belief that electronic commerce is not relevant or applicable, and lack of familiarity with newbusiness models. Other obstacles include worries about security, cost, coverage and skills. Forexample, in Canada, the most common obstacle to electronic commerce (for both Internet users and
Figure 7. Households with access to Internet, 2000 and 20011
Note: For Denmark, Ireland and the United Kingdom, access to the Internet via a home computer; for the other countries access to the Internetthrough any device (e.g. computer, phone, TV, etc.)
1. 2001 for selected countries only.Source: OECD, based on ICT database and national sources. For further details, see Annex Table 6.2.
2000 2001
0 10 20 30 40 50 60 70%
Sweden
Norway
Denmark
United States
Canada
Australia
United Kingdom
Finland
Ireland
Japan
Austria
Italy
Germany
France
Turkey
2000 2001
0 10 20 30 40 50 60 70%
Sweden
Norway
Denmark
United States
Canada
Australia
United Kingdom
Finland
Ireland
Japan
Austria
Italy
Germany
France
Turkey
2000 2001
0 10 20 30 40 50 60 70%
Sweden
Norway
Denmark
United States
Canada
Australia
United Kingdom
Finland
Ireland
Japan
Austria
Italy
Germany
France
Turkey
© OECD 2002

OECD Information Technology Outlook 2002
194
Box 1. ICT access in schools
Access to ICTs in schools and their use in education are viewed as extremely important for raising ICTawareness and developing and diffusing the ICT skill base (see Chapter 5 on ICT skills and Chapter 8 onpolicies). Information technology is now widespread in the education system in most OECD countries.The figure below shows the average number of PCs per 100 students in OECD countries in 1992 and 2001.
Diffusion of information technology in the education system, 1992-2001Average number of PCs per 100 students1
1. Average number of PCs per 100 full-time enrolled students. For 2001, 1999 student figures were used.2. 1993 instead of 1992.3. Estimates for 1992. OECD excluding Portugal, the Slovak Republic and Luxembourg.4. Estimates for 1992. EU excluding Portugal and Luxembourg.Source: OECD, based on World Information Technology and Services Alliance (WITSA)/International Data Corporation (IDC), 2002.
1992 2001
0 5 10 15 20 25 30
Sweden
United States
Netherlands
New Zealand
Australia2
Finland
Norway
Canada
United Kingdom
Switzerland
Denmark
OECD3
Japan
EU4
Austria
Belgium
Italy
Ireland
Germany
France
Korea2
Czech Republic
Greece
Hungary
Spain
Poland
Mexico2
Turkey
1992 2001
0 5 10 15 20 25 30
Sweden
United States
Netherlands
New Zealand
Australia2
Finland
Norway
Canada
United Kingdom
Switzerland
Denmark
OECD3
Japan
EU4
Austria
Belgium
Italy
Ireland
Germany
France
Korea2
Czech Republic
Greece
Hungary
Spain
Poland
Mexico2
Turkey
1992 2001
0 5 10 15 20 25 30
Sweden
United States
Netherlands
New Zealand
Australia2
Finland
Norway
Canada
United Kingdom
Switzerland
Denmark
OECD3
Japan
EU4
Austria
Belgium
Italy
Ireland
Germany
France
Korea2
Czech Republic
Greece
Hungary
Spain
Poland
Mexico2
Turkey
© OECD 2002

ICT Diffusion and the Digital Divide
195
non-users) is that “goods do not lend themselves to electronic transactions”. The share of this responseranged from 41% for public administration to 76% for health care and social assistance. The second mostimportant barrier was “prefer to maintain current business model” (from 11% for public administrationto 46% for retail trade). “Security concerns” had high priority for the public administration (27%,) and“cost of development and maintenance too high” and “lack of skilled employees” were also importantbarriers for many sectors (Statistics Canada, 2000).
Box 1. ICT access in schools (cont.)
Internet access in schools is growing rapidly although it lags PC access. For example, theUnited States had a 35% public school penetration rate in 1994, which rose to 78% in 1997 and 98% in 2000(NCES, 2001). In Japan, schools with access rose from 9.8% in 1997 to 57.4% in 2000 (Ministry of Education,2000). Lower school levels lag higher ones. In France in 2001, all middle schools had either a multimediaroom or a technology equipment room and 95% had both, but at the primary level 30% still had noInternet connection and 20% had only one machine connected.
Figure 8. Internet access basket for 40 hours at peak times using discounted PSTN rates, August 2001USD, PPP, including VAT
Note: Internet access costs differ substantially among OECD countries, primarily owing to differences in variable telephone charges and the costsof Internet service providers. Previous OECD studies show that these differences are primarily due to the state of competition in differentMember countries.
Source: OECD.
180
160
140
120
100
80
60
40
20
0
180
160
140
120
100
80
60
40
20
0
United
Sta
tes
Internet service provider Telephone usage charge Fixed telephone charge
Korea
Turke
y
Canad
a
Austra
lia
Finlan
d
United
King
dom
Germ
any
New Z
ealan
d
Mex
ico
Denm
ark
Japa
n
Norway
Icelan
d
Fran
ce
Greec
eIta
ly EU
Austri
a
Switzer
land
OECDSpa
in
Sweden
Irelan
d
Nethe
rland
s
Portu
gal
Poland
Luxe
mbo
urg
Belgium
Czech
Rep
ublic
Hunga
ry
180
160
140
120
100
80
60
40
20
0
180
160
140
120
100
80
60
40
20
0
United
Sta
tes
Internet service provider Telephone usage charge Fixed telephone charge
Korea
Turke
y
Canad
a
Austra
lia
Finlan
d
United
King
dom
Germ
any
New Z
ealan
d
Mex
ico
Denm
ark
Japa
n
Norway
Icelan
d
Fran
ce
Greec
eIta
ly EU
Austri
a
Switzer
land
OECDSpa
in
Sweden
Irelan
d
Nethe
rland
s
Portu
gal
Poland
Luxe
mbo
urg
Belgium
Czech
Rep
ublic
Hunga
ry
© OECD 2002

OECD Information Technology Outlook 2002
196
Patterns of use
Major differences in patterns of use are evident in the large variations in frequency, location (home,workplace, public access), and purpose of use.
Frequency
Internet use has increased in terms of frequency of access and time spent on line as well as in thenumber of users. In Norway, only 20% of Internet users used Internet on a daily basis in 1996. In 2001,the number of daily users increased to 60% (Taylor Nelson Sofres Norway, 2002). In Finland, regularInternet use on a daily or weekly basis has increased, and the relative gap between daily andoccasional use has narrowed as daily use has grown faster (Table 1). In Australia, regular and frequentuse is also increasing as a share of on-line activities (Australian Bureau of Statistics), although in allcountries, as in Italy (ISTAT, 2000), occasional use is still considerably higher than daily use.
Location
Different locations of Internet use lead to different on-line activities, and there are manyadvantages to home access. In addition to being able to access information at any time day or night, aperson may be less likely to access, for example, personal health information from a library or otherpublic terminal than from home.
In the United States, use of all locations is rising. The share of people who use the Internet fromboth home and some other location is growing particularly rapidly, and use at work increases thepropensity to use the Internet at home. In the United Kingdom, use at home has increased and exceedsuse at work (Table 2). Italian data show that access only at home is highest, followed by access both athome and elsewhere. Access from only outside the home is lowest (ISTAT, 2001).
Purpose
In most countries, regular home users use the Internet most frequently for e-mail and informationsearch. In Italy, for example, 63% of Internet users use it for e-mail, followed by information search (60%).Services, chat and shopping were considerably further behind (22.5%, 20%, and 6%, respectively). In theUnited Kingdom, uses other than e-mail are increasing significantly, and, as of July 2000, the Internetwas used slightly more for finding information than for e-mail (70% and 69%, respectively). Purchases
Table 1. Internet usage in Finland, 1996-2001
Source: Table 10.5, p. 245, of “Finnish Mass Media 2000”, Statistics Finland (original source: Taloustutkimus, Internet Tracking), and updated for 2001from Taloustutkimus Web site, Internet Tracking, www.toy.fi/tuotteet/internet/inet5e.htm, site visited 20 December 2001.
Internet use…
% of population aged 15-75October-November of each year, except for 2001, July-August
1996 1997 1998 1999 2000 2001
At least sometimes 19.6 29.0 38.5 50.6 75.8 86.0At least once a week 10.9 18.4 28.1 38.3 60.6 68.4Daily basis 4.5 8.1 13.2 17.4 34.0 41.9
Weekly from home 4.7 7.6 13.9 21.4 38.8 45.7Weekly from workplace 5.3 8.1 13.2 17.4 29.1 36.5Weekly from place of study 4.8 7.0 8.5 9.0 10.9 11.9
For other purposes besides e-mail 17.6 24.9 33.9 43.0 69.1 77.5
© OECD 2002

ICT Diffusion and the Digital Divide
197
and banking and investment accounted for 28% and 21%, respectively. In the United States, e-mail andinformation search remain the most common purposes by far, but other uses such as news, weather andsports are increasing (Figure 9). In Canada, one-third of regular home Internet use is for electronicbanking. Use for formal education/training rose from 32% in 1999 to 47% in 2000. In Norway, while generalinformation search and e-mail remain the most frequent uses, 59% of regular users pay their bills via theInternet (Taylor Nelson Sofres Norway 2002). In addition, studies show that Internet use is becomingmore directed, and “open” or “aimless” Internet-surfing is decreasing as users gain experience in theuse of the Internet (Ivar Frønes, Digitale skiller/Norwegian Gallup 2002).
Table 2. Locations used by adults to access the Internet for personal use in the United Kingdom, July 2000 and 2001
Note: Respondents may give more than one answer.1. Post offices were not included in July 2000.Source: UK National Statistics, July 2001.
Places used to access the Internet July 2000 (%) July 2001 (%)
Respondent’s own home 70 78Another person’s home 33 33Respondent’s workplace 32 36A school, college, university or other educational institution 25 24A public library 7 8An Internet cafe or shop 6 8A community or voluntary organisation 1 1A government office 1 0A post office1 – 0Somewhere else 3 2
Figure 9. On-line activities of individuals, United States, 2001As a percentage of Internet users, persons aged 3+
1. For these on-line activities, only individuals aged 15 and over were surveyed.2. All respondents were asked about this activity. If the response is restricted to individuals enrolled in school, the share of Internet users completing
school assignments would increase to 77.5%.Source: US Department of Commerce (2002), based on NTIA and ESA, US Department of Commerce, using US Bureau of the Census Current
Population Survey Supplements.
84.0
0 10 20 30 40 50 60 70 80 90
67.3
61.8
42.1
39.1
34.9
30.9
24.8
18.8
17.3
17.9
16.4
8.8
5.2
3.5
%
Product/service information search
News, weather, sports
Playing games
Product/service purchases
Health services or practices info. search1
Government services search1
Complete school assignment2
View TV/movies, listen to radio
Chat rooms or listservs
On-line banking1
Job search1
Trade stocks, bonds, mutual funds1
Make phone calls
On-line education course
© OECD 2002

OECD Information Technology Outlook 2002
198
In the 1998 survey on working conditions in France (Cezard and Vinck, 1998), 7% of wage earnersused a PC at home (excluding laptops) for their professional activities, though there are considerabledifferences by profession. When laptops are included, the percentages are much higher (DARES, 1998).
Leaders and laggards: households and individuals
People have varying reasons for using ICTs. Those not using may not be able to afford access, theymay not be able to benefit from ICTs (for example, if they are poorly educated or disabled), or they mayhave no interest in the Internet or not have been exposed to the benefits of ICTs. It is worth noting thatuse in the home is substantially influenced by use at work. This section examines differences in accessand use of new ICTs according to various socio-economic indicators.
Income
Income is a strong determinant of household PC and Internet access in all countries for whichinformation is available. High-income groups have more disposable income to spend on thesetechnologies than lower income groups. Because of differences in the income brackets used in nationalstatistics, most data across countries are not directly comparable, although distribution patterns aresimilar. In Australia (2000), for example, households in the highest income bracket had a PC penetrationrate of 85% and an Internet penetration rate of 69%, while those in the lowest income bracket had a PCpenetration rate of 24% and an Internet penetration rate of 10%. Annex Table 6.3 gives further details fornine OECD countries. Lower rates of Internet access, and larger relative differences between incomegroups suggest that in the early stages of new technology diffusion income distribution is an importantdeterminant of diffusion. But it is also substantially influenced by use at work (see below).
It is impossible to make cross-country comparisons regarding the size of the income digital dividewhen countries provide data by different income brackets. However, seven OECD countries alsoprovided data by income quartile for the year 2000 (Figure 10). The standard use of income quartile
Figure 10. Internet home access among households by income level, 2000Percentages
Note: For Denmark and the United Kingdom, access to the Internet via a home computer; for the other countries access to the Internet through anydevice (e.g. computer, phone, TV, etc.). Household data may be different from quartile data.
1. First quarter 2001.2. Households in urban areas only.3. Last quarter 2000 for household Internet access, financial year 1999/2000 for quartile data.Source: OECD 2001b and national sources. For details see Annex Table 6.4.
100100% %
80
60
40
20
0
80
60
40
20
0Australia Canada Denmark1 Finland Turkey2 United Kingdom3 United States
Household Internet access First income quartile Fourth income quartile
100100% %
80
60
40
20
0
80
60
40
20
0Australia Canada Denmark1 Finland Turkey2 United Kingdom3 United States
Household Internet access First income quartile Fourth income quartile
100100% %
80
60
40
20
0
80
60
40
20
0Australia Canada Denmark1 Finland Turkey2 United Kingdom3 United States
Household Internet access First income quartile Fourth income quartile
© OECD 2002

ICT Diffusion and the Digital Divide
199
means that the data can be used for cross-country comparisons regarding the size of the digital dividein selected OECD countries.
In frequency distributions, a commonly used statistical measure of inequality is the Gini coefficient(Kendall and Stuart, 1969). The Gini coefficient is widely used to measure inter-population inequality inincome and wealth; it can also be used to measure the digital divide (US Department of Commerce,2002). For household PC and Internet distributions, a Gini coefficient of “0” means that distributionamong households is equal, a Gini coefficient of “1” means that one household, or one group ofhouseholds, has all the access. With regard to the distribution of computers and the Internet by income,Gini coefficients typically vary between 0.200 and 0.500. Among OECD countries for which data areavailable, Canada and the United States have the most equally dispersed use of computers and theInternet. France and the United Kingdom have relatively greater differences. Figures 11 and 12 give theGini coefficients for PC and Internet dispersion by income level in selected OECD countries.
Education
In general, the higher their level of education, the more likely individuals are to access and use ICTsboth at home and at work. The US Department of Commerce (2000b) found this to be at least partlyindependent of income. For example, schoolteachers are highly educated and have high rates of ICT use,but are generally not included in high-income brackets. In Norway, the more highly educated (universitydegree or equivalent) use the Internet more frequently than other educational groups, and this helpsexplain why the lowest income group (which has a high share of students) has the highest Internet use.
There are large differences in PC penetration between those with tertiary-level education andthose at the lowest education levels (i.e. those lacking a high-school diploma or its equivalent). Thesedifferences vary from about a factor of two in the Netherlands to about a factor of six in theUnited States (OECD, 2000c). Although these differences have persisted over time, access by lesseducated groups is growing at more rapid rates albeit from a low base.
Figure 11. Gini coefficients: distribution of computers by household income, 2000
Source: OECD from national sources. For additional details, see Annex Table 6.5.
0.362
0.400
0.300
0.250
0.200
0.150
0.100
0.050
0
0.400
0.300
0.250
0.200
0.150
0.100
0.050
0
0.264 0.259
0.350 0.350
France Australia United States
0.362
0.400
0.300
0.250
0.200
0.150
0.100
0.050
0
0.400
0.300
0.250
0.200
0.150
0.100
0.050
0
0.264 0.259
0.350 0.350
France Australia United States
0.362
0.400
0.300
0.250
0.200
0.150
0.100
0.050
0
0.400
0.300
0.250
0.200
0.150
0.100
0.050
0
0.264 0.259
0.350 0.350
France Australia United States
© OECD 2002

OECD Information Technology Outlook 2002
200
Education is also reflected in Internet access patterns. Differences between those with tertiary-level education and those at the lowest education levels are large. In the early stages of diffusion,differences in access by educational attainment appear to be stronger for the Internet than for PCs.Differences vary by a factor of three in the Netherlands to a factor of over nine in the United States(according to the most recent data available; OECD, 2000c). Canada appears in an intermediateposition, with differences varying by a factor of around seven. These differences have persisted overtime (OECD, 2000b).
Household size and type
For the countries for which data are available, PC penetration appears to increase monotonicallywith household size and tends to be growing faster in larger households. Data for earlier yearssuggested that PC penetration rates increased until household size reached three to four people andthen flattened out.4
Families with children have the highest PC and Internet access of all households.5 Married coupleswith children under 18 are more likely to have a PC and Internet access than families with single headsof households or without children. Both of these types of households have approximately double therate of PC and Internet use of singles or single person heads of household (Figure 13).
In the United States, data for 2001 show that married couples with children have the highesthousehold penetration rates for both computers and the Internet, followed by family householdswithout children. Male and female households with children have lower penetration levels, and non-family households have the lowest penetration (see Table 3).
Figure 12. Gini coefficients: distribution of Internet access by household income, 2000
Source: OECD from national sources. For further details, see Annex Table 6.6.
0.459
0.500
0.350
0.300
0.250
0.200
0.150
0.100
0.050
0
0.413
0.378
0.450
0.400
0.500
0.350
0.300
0.250
0.200
0.150
0.100
0.050
0
0.450
0.400
0.309
0.254
France United Kingdom United StatesAustralia Canada
0.459
0.500
0.350
0.300
0.250
0.200
0.150
0.100
0.050
0
0.413
0.378
0.450
0.400
0.500
0.350
0.300
0.250
0.200
0.150
0.100
0.050
0
0.450
0.400
0.309
0.254
France United Kingdom United StatesAustralia Canada
0.459
0.500
0.350
0.300
0.250
0.200
0.150
0.100
0.050
0
0.413
0.378
0.450
0.400
0.500
0.350
0.300
0.250
0.200
0.150
0.100
0.050
0
0.450
0.400
0.309
0.254
France United Kingdom United StatesAustralia Canada
© OECD 2002

ICT Diffusion and the Digital Divide
201
Age
In general, older people have lower rates of access to PCs and the Internet than younger andmiddle-aged groups. Patterns of use by age are similar across countries; however, cross-countrycomparisons by age groups are imprecise because of the use of different age groups in variouscountries. Figure 14 shows diffusion rates for Australia, France and the United States, but similarpatterns apply to Canada, Denmark, Japan, the Netherlands and the United Kingdom.
Australian surveys for three consecutive years (1998-2000) indicate that younger age groups go online more rapidly once the technology has started to diffuse, and the relative advance in access by theyoungest age group has grown rapidly (Australian Bureau of Statistics).
In France, nine people out of ten aged 65 or more do not expect to be connected in the comingyears, either because they do not see the use, do not have a computer or assume that using theInternet is too complex (SESSI, 2001). Privacy concerns also tend to rise with age. In Norway, 70% have
Figure 13. PC and Internet access by type of household
Note: In France, data on households with children refer to those with two children. In the United Kingdom, data refer to households with two ormore children.
Source: OECD from national sources.
90
80
70
60
50
40
30
20
10
0
90
80
70
60
50
40
30
20
10
0Australia
(May 2000)Canada(2000)
Denmark(2000)
France(2000)
Netherlands(1999)
United Kingdom(1999/2000)
United States(2000)
Internet without childrenInternet with childrenPC without childrenPC with children
90
80
70
60
50
40
30
20
10
0
90
80
70
60
50
40
30
20
10
0Australia
(May 2000)Canada(2000)
Denmark(2000)
France(2000)
Netherlands(1999)
United Kingdom(1999/2000)
United States(2000)
Internet without childrenInternet with childrenPC without childrenPC with children
90
80
70
60
50
40
30
20
10
0
90
80
70
60
50
40
30
20
10
0Australia
(May 2000)Canada(2000)
Denmark(2000)
France(2000)
Netherlands(1999)
United Kingdom(1999/2000)
United States(2000)
Internet without childrenInternet with childrenPC without childrenPC with children
Table 3. Households with a PC and Internet access, United States, 2001Percentages
Source: US Department of Commerce (2002) on-line household supplement.
PC Internet
Married couple with child under 18 78.9 71.6Family household without child 58.8 53.2Male household with child under 18 55.1 44.9Female household with child under 18 49.2 40.0Non-family household 39.2 35.0
© OECD 2002

OECD Information Technology Outlook 2002
202
Figure 14. PC and Internet penetration rate by agePercentages
Note: Access in Australia and France. Use in the United States. Age of head of household in France, access from home. Age of individual inAustralia and the United States, and includes adults accessing/using the Internet from any site.
Source: OECD from national sources.
100% %
90
80
70
60
50
40
30
20
10
0
100
90
80
70
60
50
40
30
20
10
0
100% %
90
80
70
60
50
40
30
20
10
0
100
90
80
70
60
50
40
30
20
10
0
100% %
90
80
70
60
50
40
30
20
10
0
100
90
80
70
60
50
40
30
20
10
00 5 10 15 20 25 30 35 40 45 50 55 60 65 70 75 80
PC Internet
Age 18-24
PC Internet
Under 30
Computer use Internet use
Australia (2000)
France (2000)
United States (2001)
Age 25-34 Age 35-44 Age 45-54 Age 55-64 Age 65+
30-39 40-49 50-59 60-69 70-80 80+
100% %
90
80
70
60
50
40
30
20
10
0
100
90
80
70
60
50
40
30
20
10
0
100% %
90
80
70
60
50
40
30
20
10
0
100
90
80
70
60
50
40
30
20
10
0
100% %
90
80
70
60
50
40
30
20
10
0
100
90
80
70
60
50
40
30
20
10
00 5 10 15 20 25 30 35 40 45 50 55 60 65 70 75 80
PC Internet
Age 18-24
PC Internet
Under 30
Computer use Internet use
Australia (2000)
France (2000)
United States (2001)
Age 25-34 Age 35-44 Age 45-54 Age 55-64 Age 65+
30-39 40-49 50-59 60-69 70-80 80+
© OECD 2002
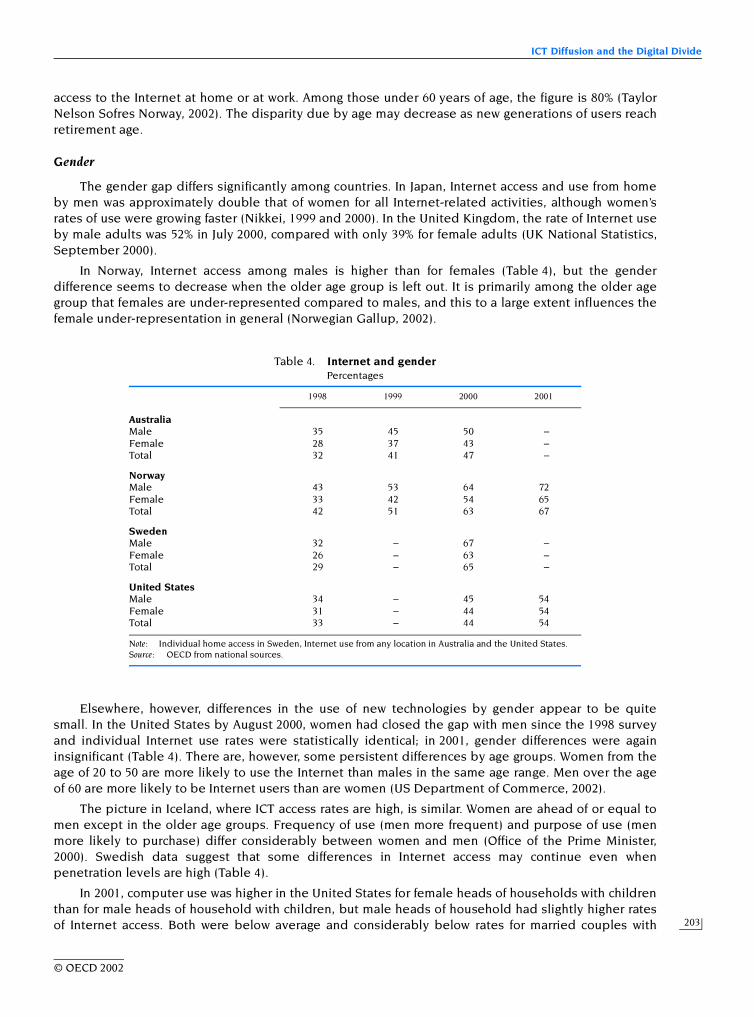
ICT Diffusion and the Digital Divide
203
access to the Internet at home or at work. Among those under 60 years of age, the figure is 80% (TaylorNelson Sofres Norway, 2002). The disparity due by age may decrease as new generations of users reachretirement age.
Gender
The gender gap differs significantly among countries. In Japan, Internet access and use from homeby men was approximately double that of women for all Internet-related activities, although women’srates of use were growing faster (Nikkei, 1999 and 2000). In the United Kingdom, the rate of Internet useby male adults was 52% in July 2000, compared with only 39% for female adults (UK National Statistics,September 2000).
In Norway, Internet access among males is higher than for females (Table 4), but the genderdifference seems to decrease when the older age group is left out. It is primarily among the older agegroup that females are under-represented compared to males, and this to a large extent influences thefemale under-representation in general (Norwegian Gallup, 2002).
Elsewhere, however, differences in the use of new technologies by gender appear to be quitesmall. In the United States by August 2000, women had closed the gap with men since the 1998 surveyand individual Internet use rates were statistically identical; in 2001, gender differences were againinsignificant (Table 4). There are, however, some persistent differences by age groups. Women from theage of 20 to 50 are more likely to use the Internet than males in the same age range. Men over the ageof 60 are more likely to be Internet users than are women (US Department of Commerce, 2002).
The picture in Iceland, where ICT access rates are high, is similar. Women are ahead of or equal tomen except in the older age groups. Frequency of use (men more frequent) and purpose of use (menmore likely to purchase) differ considerably between women and men (Office of the Prime Minister,2000). Swedish data suggest that some differences in Internet access may continue even whenpenetration levels are high (Table 4).
In 2001, computer use was higher in the United States for female heads of households with childrenthan for male heads of household with children, but male heads of household had slightly higher ratesof Internet access. Both were below average and considerably below rates for married couples with
Table 4. Internet and genderPercentages
Note: Individual home access in Sweden, Internet use from any location in Australia and the United States.Source: OECD from national sources.
1998 1999 2000 2001
AustraliaMale 35 45 50 –Female 28 37 43 –Total 32 41 47 –
NorwayMale 43 53 64 72Female 33 42 54 65Total 42 51 63 67
SwedenMale 32 – 67 –Female 26 – 63 –Total 29 – 65 –
United StatesMale 34 – 45 54Female 31 – 44 54Total 33 – 44 54
© OECD 2002

OECD Information Technology Outlook 2002
204
children, although use by female heads of household was growing relatively faster (US Department ofCommerce, 2002). In the Netherlands, men living alone were much more likely to have Internet accessat home than women living alone, although both were less likely than couples with children (CentralBureau of Statistics, 2000).
Disability
A number of visual, aural and physical impediments hinder the disabled from using ICTs. AdaptingICT tools to make them accessible to the disabled can be difficult, and special equipment may beneeded. In addition, many Internet sites are inaccessible to the disabled; recent studies show thatbetween 95% and 99% of Web sites are inaccessible to those with visual, hearing and/or mobilityimpairments.6 For example, in the United States in 2000, people with a disability enjoyed about halfthe Internet access at home as those with no disability (21.6% versus 42.1%) (US Department ofCommerce, 2000b).
Location (rural or urban)
Analysis by geographical location shows considerable differences in access and use of PCs andparticularly the Internet. The greater divide with regard to the Internet can be partially attributed to thefact that the Internet requires network infrastructure and services that PCs do not (OECD, 2000a).
Internet access in urban areas is everywhere greater than in rural and peripheral regions (Figure 15)and is especially high in main cities and highly industrialised and developed regions (Table 5). Tworeasons are usually advanced for these differences: i) in rural areas, cost of access tends to be higherand quality of service lower, despite some countries’ efforts to ensure standardised pricing and quality;ii) incomes tend to be lower in rural areas, and ICT costs are relatively higher for low-income groups.Moreover, members of households in urban areas are more likely to have occupations where computersand the Internet are part of their work environment. However, recent 2001 data from the United Statesshows that the gap has been closing rapidly, and rural areas are moving towards the national average.
Figure 15. Urban homes are more connected than rural onesInternet access among rural and urban households
Note: For the Netherlands, “rural” is defined as a low degree of urbanisation, and “urban” a high degree. For Japan, “rural” is defined as “villagesand towns” and “urban” as “cities”. For both countries, the highest categories were not taken into account. For Canada, urban refers to thetop 15 metropolitan areas and rural refers to other areas.
Source: OECD, based on national statistical sources.
1999 2000 2001
60
50
40
30
20
10
0
60
50
40
30
20
10
0
13.6
17.722.7
28.733.6
44.4
48.7 51.1
Rural Urban Rural Urban Rural Urban Rural UrbanJapan Netherlands Canada United States
1999 2000 2001
60
50
40
30
20
10
0
60
50
40
30
20
10
0
13.6
17.722.7
28.733.6
44.4
48.7 51.1
Rural Urban Rural Urban Rural Urban Rural UrbanJapan Netherlands Canada United States
1999 2000 2001
60
50
40
30
20
10
0
60
50
40
30
20
10
0
13.6
17.722.7
28.733.6
44.4
48.7 51.1
Rural Urban Rural Urban Rural Urban Rural UrbanJapan Netherlands Canada United States
© OECD 2002

ICT Diffusion and the Digital Divide
205
Leading regions tend to have higher concentrations of more technologically developed businessesand academic and research institutions which are likely to have high levels of uptake and use of newtechnologies. Firm size tends to be smaller in more remote areas, accentuating divides. Agglomerationeffects, positive externalities and clustering of advanced firms reinforce divides.
In the Netherlands, however, while highly urbanised areas had lower penetration rates thanmoderately urbanised ones, the densest urban areas had appreciably lower rates of penetration thannon-urban areas. The pattern has been similar in the United States, where recent data show that ruralInternet use is approaching the US national average, but that Internet use in central cities lags otherareas (US Department of Commerce, 2002). In the United States, the central cities frequently have loweraverage income and education levels.
Language
English is overwhelmingly the language of e-commerce. In July 2000, more than 94% of links (almost2.9 million) to pages on secure servers were in English (Figure 16). The only other languages to accountfor more than 1% of detected links to secure servers were German (31 785 links) and French(30 954 links), although Spanish (26 512 links) and Japanese (22 852 links) came close. This suggests thatindividuals and businesses that are not proficient in English are at a considerable disadvantage withregard to commercial activities on the Internet.
Table 5. Urban regions have better access than rural onesICT equipment and Internet access in leading and lagging regions
Source: OECD, based on national sources.
Leading regions Lagging regions
Canada 2000 British Columbia, Ontario Quebec, Saskatchewan, Newfoundland
France 1999 Paris region [for SME access]Paris region [Web]
South-east, WestCentre
Italy 2000 North-east South
Norway 1999 Oslo, counties with developed regional centres Peripheral counties without developed centres
Figure 16. English is the main language of e-commerceLinks to secure servers by language, July 2000
Source: Netcraft.
English94.45%
Other5.5%
Korean 0.48%
Swedish 0.35%
Portuguese 0.35%
Italian 0.21%Dutch 0.13%Finnish 0.12%Norwegian 0.07%
Czech 0.05%Polish 0.03%Danish 0.03%Icelandic 0.01%Greek 0.01 %Hungarian 0.01%
German1.05%
French1.02%
Spanish0.87%
Japanese0.75%
English94.45%
Other5.5%
Korean 0.48%
Swedish 0.35%
Portuguese 0.35%
Italian 0.21%Dutch 0.13%Finnish 0.12%Norwegian 0.07%
Czech 0.05%Polish 0.03%Danish 0.03%Icelandic 0.01%Greek 0.01 %Hungarian 0.01%
German1.05%
French1.02%
Spanish0.87%
Japanese0.75%
English94.45%
Other5.5%
Korean 0.48%
Swedish 0.35%
Portuguese 0.35%
Italian 0.21%Dutch 0.13%Finnish 0.12%Norwegian 0.07%
Czech 0.05%Polish 0.03%Danish 0.03%Icelandic 0.01%Greek 0.01 %Hungarian 0.01%
German1.05%
French1.02%
Spanish0.87%
Japanese0.75%
© OECD 2002

OECD Information Technology Outlook 2002
206
Employment status
The employed have the highest rates of access, followed by people in the workforce but currentlyunemployed (the Internet may be very useful for on-line job searches). People not in the labour forcehad far lower rates of access, perhaps because they include people taking care of the home and retireeswho may not have been exposed to computers and the Internet at work or in an educational setting. Forexample, in Australia in 2000, the Internet was accessed by 56% of employed Australians, as comparedto 40% of unemployed persons. Only 16% of those not in the labour force used the Internet.7
Use in the workplace
The most recent study in the United States shows that ICT use by individuals is strongly affected byuse in the workplace. Not only are individuals who work in certain occupational areas more likely to usea computer and the Internet, but exposure in the workplace makes an individual substantially morelikely to use a computer and the Internet at home. For example, 78% of households in which at least onefamily member uses a computer at work have a computer at home. In contrast, only 36% of householdsin which no family member uses a computer at work have a computer at home (US Department ofCommerce, 2002). A similar pattern exists for Internet access (Table 6).
A US Department of Commerce analysis of 2001 data suggests that the presence in a household ofsomeone who uses the Internet on the job may be a key factor in whether a household has an Internetsubscription. As Figure 17 shows, once the “use on the job” variable is factored in, the importance ofincome as a factor in Internet use is substantially diminished. This same pattern holds true forcomputers. This suggests that familiarity with the technology outside of the home helps to explaindifferences in technology adoption among various demographic groups.
How are access patterns changing?
The digital divide may be said to be both growing and shrinking. When examined in terms ofaccess gap (difference in absolute percentage points), the gap appears to be widening. When examinedin terms of growth rate, the digital divide appears to be closing. Gini coefficients for PC and Internetaccess by income have been getting smaller in most OECD countries, suggesting that inequality isdecreasing.
Access gap
The access gap is measured by the absolute difference between the percentage of access of twogroups. This measure is used to see which groups are gaining the most new members relative to theirgroup. If one looks at the access gap between different groups for PCs and the Internet from one year tothe next, the digital divide in terms of income appears to be widening. The absolute percentage pointincrease in ICT users is greater for members of higher income brackets than for members of lower onesfor both PCs and Internet access. For example, in 1997 the highest level income group in Canada had
Table 6. Use of a computer and the Internet at work affects use at homeUnited States, 2001
Source: US Department of Commerce, 2002.
Percentage of US households with a computer (2001)
Percentage of US households with Internet access (2001)
Does any household member use at work?Yes 77.9 76.8No 35.9 34.8
© OECD 2002

ICT Diffusion and the Digital Divide
207
Internet access rates of 33% while the lowest income group had access rates of 6%, a difference of27 percentage points. In 2000, the highest income group had Internet access rates of 65% while thelowest had rates of 17%, a difference of 48 percentage points. A comparison of the two years wouldsuggest that by this measure, the digital divide is getting wider. Although income brackets differ amongOECD countries and data are not directly comparable, other countries have similar patterns (see AnnexTable 6.3).
Growth rate
When considered in terms of growth rate, the digital divide appears to be getting smaller. Even aspercentage point differences are widening, lagging groups are increasing their use of ICTs at a far fasterrate than the highest income groups, particularly for the Internet. Internet access is growing faster thanPC access, largely because the necessary infrastructure (PCs) is already in place.
Annual growth in penetration is greater for low-income groups than for high-income groups inalmost all countries. Differences among low-income groups in different countries may be due tocountry-specific factors that determine rates of uptake in different income groups early in the diffusionof the Internet. In contrast to the general pattern, Internet penetration in the Netherlands was higher forthe highest income group, which grew by 53% from 1998, compared to a growth rate of only 45% for thelowest income bracket. As income brackets differ across countries, data are not directly comparable.Annex Table 6.7 gives details of growth rates in nine OECD countries.
Gini coefficients
The Gini coefficients measuring differences in household access to PCs and the Internet by incomebracket have been decreasing over time in almost all OECD countries for which data are available,suggesting that the digital divide is getting smaller (Figures 18 and 19). The only exception is France,
Figure 17. Household Internet access by family income, United States, 2001Percentage of all households
Source: US Department of Commerce, 2002, based on NTIA and ESA, US Department of Commerce and US Bureau of the Census CurrentPopulation Survey Supplements.
100
90
80
70
60
50
40
30
20
10
0
100
90
80
70
60
50
40
30
20
10
0
No one in the household uses the Internet at work Someone in the household uses the Internet at work
All households
Under$15 000
$15 000-24 999
$25 000-34 999
$35 000-49 999
$50 000-74 999
$75 000and over
100
90
80
70
60
50
40
30
20
10
0
100
90
80
70
60
50
40
30
20
10
0
No one in the household uses the Internet at work Someone in the household uses the Internet at work
All households
Under$15 000
$15 000-24 999
$25 000-34 999
$35 000-49 999
$50 000-74 999
$75 000and over
100
90
80
70
60
50
40
30
20
10
0
100
90
80
70
60
50
40
30
20
10
0
No one in the household uses the Internet at work Someone in the household uses the Internet at work
All households
Under$15 000
$15 000-24 999
$25 000-34 999
$35 000-49 999
$50 000-74 999
$75 000and over
© OECD 2002

OECD Information Technology Outlook 2002
208
Figure 18. Gini coefficients for household access to a computer by income
Source: OECD, based on national sources. For further details, see Annex Table 6.5.
0.450
0.350
0.300
0.250
0.200
0.150
0.100
0.050
0
0.450
0.350
0.300
0.250
0.200
0.150
0.100
0.050
0
0.400 0.400
1997 1998 1999 2000 2001
United StatesAustralia France
0.450
0.350
0.300
0.250
0.200
0.150
0.100
0.050
0
0.450
0.350
0.300
0.250
0.200
0.150
0.100
0.050
0
0.400 0.400
1997 1998 1999 2000 2001
United StatesAustralia France
0.450
0.350
0.300
0.250
0.200
0.150
0.100
0.050
0
0.450
0.350
0.300
0.250
0.200
0.150
0.100
0.050
0
0.400 0.400
1997 1998 1999 2000 2001
United StatesAustralia France
Figure 19. Gini coefficients for household access to the Internet by income
Source: OECD, based on national sources. For further details, see Annex Table 6.6.
0.500
0.350
0.300
0.250
0.200
0.150
0.100
0.050
0
0.500
0.350
0.300
0.250
0.200
0.150
0.100
0.050
0
0.400 0.400
1997 1998 1999 2000 2001
0.450 0.450
Australia France United StatesCanada United Kingdom
0.500
0.350
0.300
0.250
0.200
0.150
0.100
0.050
0
0.500
0.350
0.300
0.250
0.200
0.150
0.100
0.050
0
0.400 0.400
1997 1998 1999 2000 2001
0.450 0.450
Australia France United StatesCanada United Kingdom
0.500
0.350
0.300
0.250
0.200
0.150
0.100
0.050
0
0.500
0.350
0.300
0.250
0.200
0.150
0.100
0.050
0
0.400 0.400
1997 1998 1999 2000 2001
0.450 0.450
Australia France United StatesCanada United Kingdom
© OECD 2002

ICT Diffusion and the Digital Divide
209
where the Gini coefficient for Internet access by income did not decrease between 1999 and 2000.Decreasing Gini coefficients suggest that despite widespread differences in access, distribution isbecoming more equal over time.
Leaders and laggards: business and government
The digital divide is not limited to households and individuals, but also affects businesses and thepublic sector.
Businesses
Most firms are now equipped with PCs (OECD, 2001c, 2001d), and the digital divide now largelyconcerns differences in Internet use. Patterns of Internet and e-commerce access and use by country,sector and firm size can help to understand how the information economy is evolving. Results of theElectronic Commerce Business Impacts Project (EBIP) (OECD, 2001e) clearly show that the Internet andrelated e-commerce strategies are transforming businesses, and that much of this transformation is inactivities such as the preparation of transactions (advertising, catalogues, information services) andsupport (information management and market development) (OECD, 2001f, and Box 2 in Chapter 4).
The share of businesses with their own Web site can also be used as an indicator of some aspectsof the digital divide. Firms with Internet connections increasingly have their own Web site, and for firmswith ten or more employees with an Internet connection, the share with a Web site was over 50% andreached almost 100% in the United Kingdom (Figure 20).
Industry sector
Internet access varies by sector; in most countries for which detailed data are available, the highestInternet penetration rates are in information-intensive services (business and property services,communications, finance and insurance). The lowest penetration rates are for transport and storage,retail trade and accommodation and food services (Figure 21).
Figure 20. Businesses with Internet and Web sites, 2000Percentage of businesses with ten or more employees
1. The Internet and other computer-mediated networks. Reference period, 1st quarter 2001.2. Expectations for 2000.3. 1999-2000.Source: OECD (2001b).
100100% %
80
60
40
20
0
80
60
40
20
0
Internet access Web or home page
Finland Sweden Denmark Netherlands1 Norway2 Australia3 United Kingdom
100100% %
80
60
40
20
0
80
60
40
20
0
Internet access Web or home page
Finland Sweden Denmark Netherlands1 Norway2 Australia3 United Kingdom
100100% %
80
60
40
20
0
80
60
40
20
0
Internet access Web or home page
Finland Sweden Denmark Netherlands1 Norway2 Australia3 United Kingdom
© OECD 2002

OECD Information Technology Outlook 2002
210
Figure 21. Internet penetration by industry, 2000Percentage of businesses using the Internet
1. 1999-2000.2. All businesses with five or more employees.3. The figure refers to the Internet and other computer-mediated networks. Expectations for 1st quarter 2001.4. Expectations for 2000.5. All businesses with ten or more employees.Source: OECD (2001b).
0 20 40 60 100%
80
Retail trade
Transport
Manufacturing
Wholesale trade
Finance and insurance
Business services
Retail trade
Transport
Wholesale trade
Finance and insurance
Manufacturing
Retail trade
Transport
Manufacturing
Business services
Wholesale trade
Retail trade
Transport
Manufacturing
Wholesale trade
Business services
Transport
Retail trade
Manufacturing
Wholesale trade
Business services
Finance and insurance
Retail trade
Transport
Manufacturing
Business services
Wholesale trade
Transport
Manufacturing
Business services
Finance and insurance
Retail trade
Transport
Manufacturing
Wholesale trade
Business services
Finance and insurance
Australia1
Canada
Denmark2
Finland2
Netherlands2, 3
Norway4, 5
Sweden5
United Kingdom5
© OECD 2002

ICT Diffusion and the Digital Divide
211
Differences among industry sectors are more striking than differences in penetration rates in thesame sector but in different countries. This suggests that the sectoral distribution of the business sector isan important determinant of national rates of uptake. Economies with larger shares of some servicesactivities and more advanced ICT manufacturing will have higher rates of uptake, other things being equal.
Firm size
In business, ICT penetration and Internet access are a function of firm size (see also Chapter 4).Smaller business units are less likely to have invested in new technologies or use the Internet.Figure 22 shows the pattern of Internet access by firm size for certain OECD countries. In 2000, 80-90% ofbusinesses with more than ten employees had Internet access, while firms with fewer than tenemployees had access rates of 50-75% depending on the country. Cross-country differences are higherfor small firms than for larger ones.
Differences by firm size have tended to diminish over time, mainly owing to the almost completerates of access for large business units. However, rates in larger units are still twice those of the smallestunits. Larger units are more likely to undertake more complex and more advanced transaction andbusiness processes than smaller ones.
Figure 22. Internet access in the business sector by firm sizePercentage of business using the Internet
1. Internet and other computer-mediated networks. Expectations for 1st quarter of 2001.2. 1999-2000.3. Expectations for 2000.4. 1-19 employees.5. 50-199 employees.6. 100-299 employees.7. 250 and more employees.8. 300-499 employees.Source: OECD (2001b).
1999 2000 2001
100% %
90
80
70
60
50
40
30
20
10
0
100
90
80
70
60
50
40
30
20
10
0
Finlan
d
5-9 employees 10-19 employees 50-249 employees 250-999 employees
Denm
ark
Nethe
rland
s1
Austra
lia2
Finlan
d
Sweden
Denm
ark
Nethe
rland
s1
Austra
lia2
Norway
3
Canad
a4
Denm
ark
Finlan
d
Austra
lia2
Nethe
rland
s1,
5
Japa
n3,
6
United
King
dom
Denm
ark
Finlan
d7
Austra
lia2
Japa
n3,
8
United
King
dom
© OECD 2002
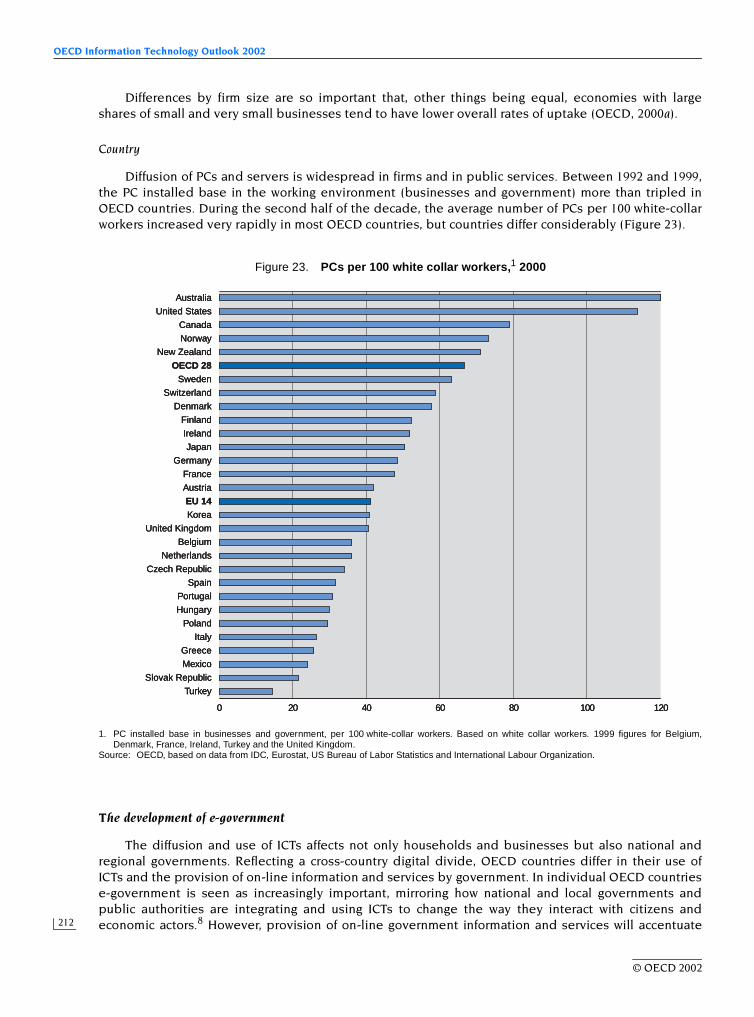
OECD Information Technology Outlook 2002
212
Differences by firm size are so important that, other things being equal, economies with largeshares of small and very small businesses tend to have lower overall rates of uptake (OECD, 2000a).
Country
Diffusion of PCs and servers is widespread in firms and in public services. Between 1992 and 1999,the PC installed base in the working environment (businesses and government) more than tripled inOECD countries. During the second half of the decade, the average number of PCs per 100 white-collarworkers increased very rapidly in most OECD countries, but countries differ considerably (Figure 23).
The development of e-government
The diffusion and use of ICTs affects not only households and businesses but also national andregional governments. Reflecting a cross-country digital divide, OECD countries differ in their use ofICTs and the provision of on-line information and services by government. In individual OECD countriese-government is seen as increasingly important, mirroring how national and local governments andpublic authorities are integrating and using ICTs to change the way they interact with citizens andeconomic actors.8 However, provision of on-line government information and services will accentuate
Figure 23. PCs per 100 white collar workers,1 2000
1. PC installed base in businesses and government, per 100 white-collar workers. Based on white collar workers. 1999 figures for Belgium,Denmark, France, Ireland, Turkey and the United Kingdom.
Source: OECD, based on data from IDC, Eurostat, US Bureau of Labor Statistics and International Labour Organization.
0 20 40 60 80 100 120
Australia
United States
Canada
Norway
New Zealand
OECD 28Sweden
Switzerland
Denmark
Finland
Ireland
Japan
Germany
France
Austria
EU 14Korea
United Kingdom
Belgium
Netherlands
Czech Republic
Spain
Portugal
Hungary
Poland
Italy
Greece
Mexico
Slovak Republic
Turkey
0 20 40 60 80 100 120
Australia
United States
Canada
Norway
New Zealand
OECD 28Sweden
Switzerland
Denmark
Finland
Ireland
Japan
Germany
France
Austria
EU 14Korea
United Kingdom
Belgium
Netherlands
Czech Republic
Spain
Portugal
Hungary
Poland
Italy
Greece
Mexico
Slovak Republic
Turkey
0 20 40 60 80 100 120
Australia
United States
Canada
Norway
New Zealand
OECD 28Sweden
Switzerland
Denmark
Finland
Ireland
Japan
Germany
France
Austria
EU 14Korea
United Kingdom
Belgium
Netherlands
Czech Republic
Spain
Portugal
Hungary
Poland
Italy
Greece
Mexico
Slovak Republic
Turkey
© OECD 2002

ICT Diffusion and the Digital Divide
213
the digital divide and differences in uptake of ICTs in different socio-economic groups; it will alsoprovide demonstration effects and incentives for citizens and businesses to go on line.
The benefits of on-line government activities include:
– Improved government efficiency and transparency, enabling administrative modernisation, restructuringand reform and encouraging good governance.9
– Expanded provision of information and services, enhanced delivery of services by providing better accessand creating new information sources and services for citizens, businesses and other institutions.
– Enabling greater input into policy and political processes, enhancing citizen input through on-lineconsultation and e-democracy approaches.
– Demonstration effects, to provide models for service delivery, spread awareness of the potential foron-line delivery and interaction, expand infrastructure provision and use (e.g. broadband) andprovide incentives for content development in related areas.
Implementation of e-government will interact with and help to shape service delivery objectives,improve levels of service and lower some of the costs associated with delivering services of increasingcomplexity (Figure 24) (OECD, 2001h).
The transition to e-government may radically alter public administration and raises a host ofICT-related issues. These include changing the dimensions and reach of public authorities as theyinteract directly with citizens; changing the content and impact of delivering government services,health and education; issues related to data security, protection and privacy; and structural and skillissues related to ICT access, diffusion and use.
Figure 24. E-government services and delivery objectives
Source: OECD, based on OECD (2001g) and Robben (2001).
Service maturity
Governmentagenciespublish
informationon the Web
Ensure oversight and control
InformationLevel 1
User cancommunicateelectronicallywith single
governmentagencies, butagencies don’t
necessarilycommunicateelectronicallywith the user
InteractionLevel 2
Cross-agencyinformation andtransactions are
available viaintention based
portals
Back officesare integratedand business
processesare
re-engineered
IntegrationLevel 4
User cancommunicateelectronicallywith single
governmentagencies, andapplications
of the agenciesrespond
electronicallyto the user
TransactionLevel 3
Adapt to changes
Tailoring services
Provide integrated services
Ensure privacy and security
Improve the quality of services
Incorporate citizens feedback
Reduce costs to administration
Reduce administrative burdens
Improve access
© OECD 2002
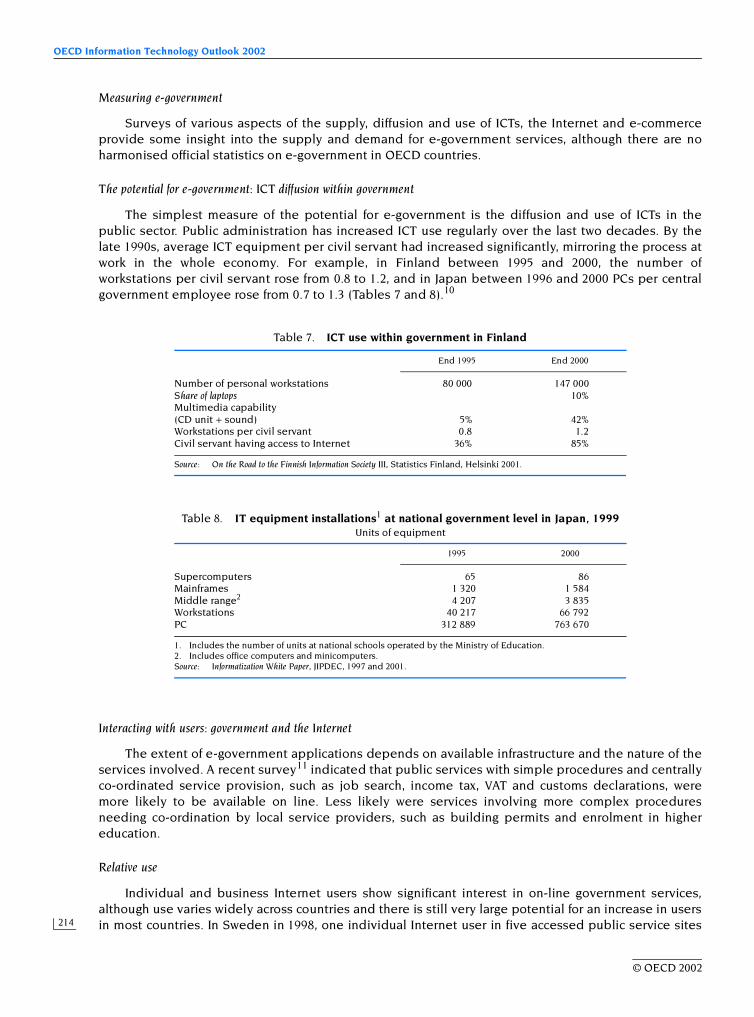
OECD Information Technology Outlook 2002
214
Measuring e-government
Surveys of various aspects of the supply, diffusion and use of ICTs, the Internet and e-commerceprovide some insight into the supply and demand for e-government services, although there are noharmonised official statistics on e-government in OECD countries.
The potential for e-government: ICT diffusion within government
The simplest measure of the potential for e-government is the diffusion and use of ICTs in thepublic sector. Public administration has increased ICT use regularly over the last two decades. By thelate 1990s, average ICT equipment per civil servant had increased significantly, mirroring the process atwork in the whole economy. For example, in Finland between 1995 and 2000, the number ofworkstations per civil servant rose from 0.8 to 1.2, and in Japan between 1996 and 2000 PCs per centralgovernment employee rose from 0.7 to 1.3 (Tables 7 and 8).10
Interacting with users: government and the Internet
The extent of e-government applications depends on available infrastructure and the nature of theservices involved. A recent survey11 indicated that public services with simple procedures and centrallyco-ordinated service provision, such as job search, income tax, VAT and customs declarations, weremore likely to be available on line. Less likely were services involving more complex proceduresneeding co-ordination by local service providers, such as building permits and enrolment in highereducation.
Relative use
Individual and business Internet users show significant interest in on-line government services,although use varies widely across countries and there is still very large potential for an increase in usersin most countries. In Sweden in 1998, one individual Internet user in five accessed public service sites
Table 7. ICT use within government in Finland
Source: On the Road to the Finnish Information Society III, Statistics Finland, Helsinki 2001.
End 1995 End 2000
Number of personal workstations 80 000 147 000Share of laptops 10%Multimedia capability(CD unit + sound) 5% 42%Workstations per civil servant 0.8 1.2Civil servant having access to Internet 36% 85%
Table 8. IT equipment installations1 at national government level in Japan, 1999Units of equipment
1. Includes the number of units at national schools operated by the Ministry of Education.2. Includes office computers and minicomputers.Source: Informatization White Paper, JIPDEC, 1997 and 2001.
1995 2000
Supercomputers 65 86Mainframes 1 320 1 584Middle range2 4 207 3 835Workstations 40 217 66 792PC 312 889 763 670
© OECD 2002
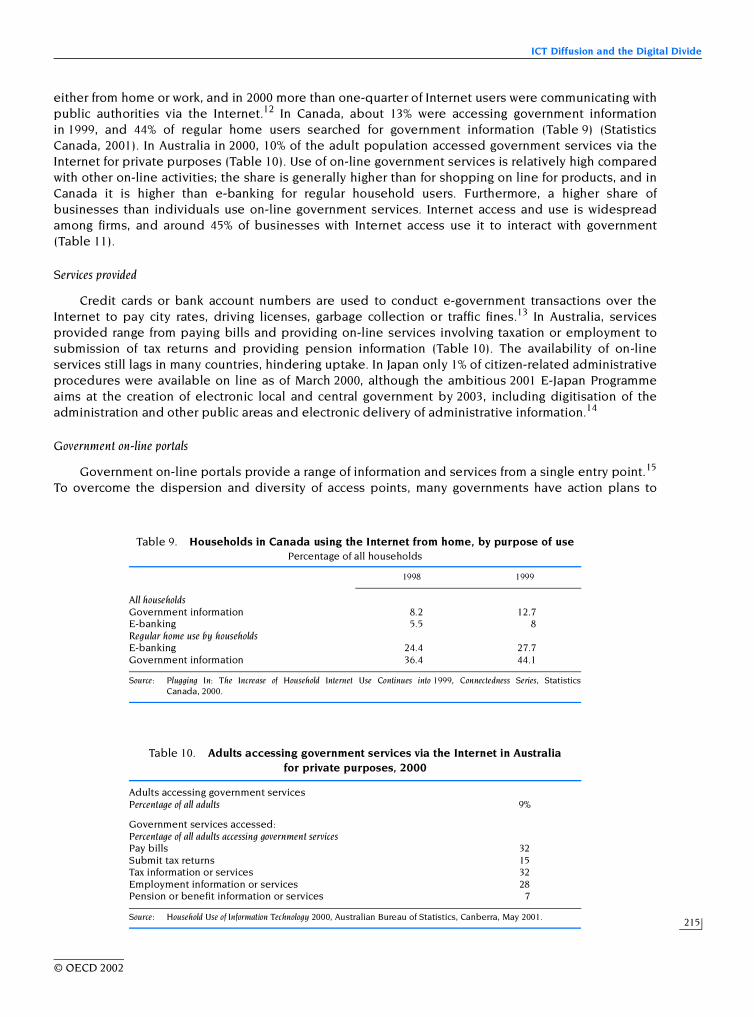
ICT Diffusion and the Digital Divide
215
either from home or work, and in 2000 more than one-quarter of Internet users were communicating withpublic authorities via the Internet.12 In Canada, about 13% were accessing government informationin 1999, and 44% of regular home users searched for government information (Table 9) (StatisticsCanada, 2001). In Australia in 2000, 10% of the adult population accessed government services via theInternet for private purposes (Table 10). Use of on-line government services is relatively high comparedwith other on-line activities; the share is generally higher than for shopping on line for products, and inCanada it is higher than e-banking for regular household users. Furthermore, a higher share ofbusinesses than individuals use on-line government services. Internet access and use is widespreadamong firms, and around 45% of businesses with Internet access use it to interact with government(Table 11).
Services provided
Credit cards or bank account numbers are used to conduct e-government transactions over theInternet to pay city rates, driving licenses, garbage collection or traffic fines.13 In Australia, servicesprovided range from paying bills and providing on-line services involving taxation or employment tosubmission of tax returns and providing pension information (Table 10). The availability of on-lineservices still lags in many countries, hindering uptake. In Japan only 1% of citizen-related administrativeprocedures were available on line as of March 2000, although the ambitious 2001 E-Japan Programmeaims at the creation of electronic local and central government by 2003, including digitisation of theadministration and other public areas and electronic delivery of administrative information.14
Government on-line portals
Government on-line portals provide a range of information and services from a single entry point.15
To overcome the dispersion and diversity of access points, many governments have action plans to
Table 9. Households in Canada using the Internet from home, by purpose of usePercentage of all households
Source: Plugging In: The Increase of Household Internet Use Continues into 1999, Connectedness Series, StatisticsCanada, 2000.
1998 1999
All householdsGovernment information 8.2 12.7E-banking 5.5 8Regular home use by householdsE-banking 24.4 27.7Government information 36.4 44.1
Table 10. Adults accessing government services via the Internet in Australia for private purposes, 2000
Source: Household Use of Information Technology 2000, Australian Bureau of Statistics, Canberra, May 2001.
Adults accessing government servicesPercentage of all adults 9%
Government services accessed:Percentage of all adults accessing government servicesPay bills 32Submit tax returns 15Tax information or services 32Employment information or services 28Pension or benefit information or services 7
© OECD 2002

OECD Information Technology Outlook 2002
216
provide a single entry point for information and services over the next three to five years. Portals arealready available in some countries which offer service pages to businesses and citizens (in Denmarkand the United Kingdom, information is presented in a “life stages” format), as well as access to publicsector documentation.16
Conclusion
Differences in access to ICTs such as computers and the Internet, create a “digital divide” betweenthose that can benefit from the opportunities provided by ICTs and those that cannot. Access to anddevelopment of the information and communication resources that these technologies enable isincreasingly viewed as crucial for economic and social development, and network economics mean thatthe more the participants in ICTs the greater the value to all.
Differences in diffusion and use of ICTs and electronic commerce may create new kinds of socialdivides and accentuate existing divides within countries related to income, education, age and familytype and particular sub-national regions. It may also be creating new kinds of business divides, relatedto sectoral composition and firm size, as well as regional concentration of particular kinds of firms andindustries.
This study finds that there are particularly striking differences in PC and Internet access byhousehold income and education. The digital divide could be said to be growing as the access gapbetween those with the highest and lowest levels of ICT access increases. Conversely, the digital dividecould also be said to be shrinking, as rates of growth are faster for lagging groups. There are alsoconsiderable differences by business sector and firm size, and government use of ICT is increasinglyimportant in OECD countries.
Table 11. Importance of government services over the Internet in Australia...
Source: Business Use of Information Technology 1999-2000, Australian Bureau of Statistics, Canberra, December 2000.
… and in Finland
1. Businesses with at least five employees.Source: Internet Use and E-commerce in Enterprises 2001, Statistics Finland, Helsinki, 2001.
1999-2000 (%)
Businesses with Internet access 28
Share of businesses with Internet access conducting selected Internet activitiesAccessing government services 44
2000 (%)
Businesses with Internet access1 84
Share of businesses with Internet use conducting selected Internet activities:Dealing with public authorities 45
© OECD 2002

ICT Diffusion and the Digital Divide
217
NOTES
1. A project to explore the development of indicators for making compatible cross-country comparisons is underway, and Italy has been working with Canada, Finland, Germany and Norway on developing a Digital DivideIndex that could be used to measure the extent of the digital divide across countries.
2. Hosts are located by their top level domain (TLD) addresses and generic top level domain (gTLD) addresses,which are distributed by country of location, as indicated in the Internet Protocol address. Data provided byTelcordia Technologies.
3. Statistical work is currently under way at the OECD to develop compatible cross-country definitions andguidelines for the collection of statistics on ICT use by business, households and government.
4. Information from Statistics Netherlands, Statistics Finland and INSEE France.
5. Information from Statistics Canada, INSEE France, Statistics Netherlands, Australian Bureau of Statistics, USDepartment of Commerce.
6. ZDNet, “Blind Spots”, 9 April 2000.
7. In the 12 months leading up to and including February 2000, see www.noie.gov.au
8. The OECD has launched a comprehensive study of e-government and its impacts. See OECD (2001g).
9. See for example “Implementation Plan for the BundOnline 2005 e-government Initiative”, Otto Schily, FederalMinister of the Interior, Germany, statement at the Federal Press Conference, 11 December 2001, available at:www.bundonline2005.de/en/bilanz/umsetzung/data/statement.pdf (viewed 14 January 2002).
10. Ratio for Japan includes national universities. Taken from “Number of Employees per PC in the CentralGovernment (FY1996-2000)”, Table 29, in Ministry of Public Management, Home Affairs, Posts andTelecommunications (2001).
11. Part of the e-Europe programme: “Summary Report: Web-based Survey on Electronic Public Services”, Resultsof the first measurement, October 2001, European Commission and Cap Gemini Ernst and Young, available at:http://europa.eu.int/information_society/eeurope/egovconf/documents/pdf/eeurope.pdf (viewed 14 January 2002).
12. Statistics Sweden/Swedish Agency for Public Management, in “The Teldok Yearbook 2001”, Chapter 2, availableat: www.teldok.org/tdy2001/view.htm; and “IT at Home and in the Enterprise, A Statistical Description of Sweden”,Statistics Sweden, 2001, available at: www.scb.se/eng/publkat/transporter/it/it.pdf (both viewed 16 January 2002).
13. See: “Government Online, An International Perspective, 2001 Benchmarking Research Study”, Taylor NelsonSofres. November 2001, available at: www.sofres.com/etudes/pol/091101_egouv_uk_full.pdf (viewed 14 January 2002).
14. See “Number of Administrative Procedures to which Citizens Can Apply”, Table 31, in “IT Indicators in Japan,2001”, Statistics Bureau, Ministry of Public Management, Home Affairs, Posts and Telecommunications,available at: www.stat.go.jp/english/data/it/zuhyou/e31.xls; “e-Japan 2002 Program: Basic Guidelines Concerning the ITPriority Policies in FY2002”, Prime Minister’s Office, 26 June 2001, available at: www.kantei.go.jp/foreign/it/network/0626_e.html (both viewed 16 January 2002).
15. See “Global E-government Survey”, World Market Research Center, September 2001, available at:www.worldmarketsanalysis.com/pdf/e-govreport.pdf (viewed 16 January 2002). See also “The Unexpected eEurope”,Accenture, Paris, October 2001, available at: www.accenture.com/eEurope2001 (viewed 14 January 2002).
16. See Chapter 8. For selected e-government Web sites see: europa.eu.int/information_society/eeurope/egovconf/links/index_en.htm (viewed 16 January 2002).
© OECD 2002

OECD Information Technology Outlook 2002
218
REFERENCES
Central Bureau of Statistics, Netherlands (2000, 2001),POLS Survey 1999 and 2000.
Cézard, M. and L. Vinck (1998),“En 1998, plus d’un salarié sur deux utilise l’informatique dans son travail”, Premières synthèses, No. 53.2,December.
DARES, ministère de l’Emploi et de la Solidarité,Enquête Conditions de travail de 1998, premières synthèses, Paris. Available at: www.travail.gouv.fr/publications/p_detailPublication.asp?idTitre=316
ISTAT (2000),Official Sources for Data and Indicators on ICT and Electronic Commerce, July, Rome.
ISTAT (2001),Annual Report 2001: Data for Enterprises, Rome.
International Telecommunication Union (ITU) (2002),World Telecommunication Development Report 2002, March, Geneva.
Kendall, M.G. and A. Stuart (1966),The Advanced Theory of Statistics, Charles Griffin, London.
Ministry of Education, Japan (2000),Survey of current state of information education in public schools, years 1996-2000.
Ministry of Public Management, Home Affairs, Posts and Telecommunications (2001),IT Indicators in Japan, 2001, Statistics Bureau, available at: www.stat.go.jp/english/data/it/zuhyou/e29.xls (viewed16 January 2002).
National Center for Educational Statistics (NCES) (2001),Internet Access in US Public Schools and Classrooms: 1994–2000, Washington, DC.
Nikkei Research (1999, 2000),Home IT study 2000, available at: www.nikkei-r.co.jp/mm/homepc/index2.htm
OECD (2000a),Information and Communication Technologies and Rural Development, OECD, Paris.
OECD (2000b),Learning to Bridge the Digital Divide, OECD, Paris.
OECD (2000c),“The Digital Divide: Diffusion and Use of ICTs”, forthcoming, and OECD (2001), Understanding the Digital Divide,OECD, 2001, Paris.
OECD (2001a),Communications Outlook 2001, OECD Paris.
OECD (2001b),Science, Technology and Industry Scoreboard: Towards a Knowledge-based Economy, OECD, Paris.
OECD (2001c),Science, Technology and Industry Outlook. Drivers of Growth: Information Technology, Innovation and Entrepreneurship, OECD,Paris.
OECD (2001d),The New Economy: Beyond the Hype, Paris.
OECD (2001e),“The Electronic Commerce Business Impacts Project (EBIP)”, forthcoming.
OECD (2001f),Business and Industry Policy Forum on the Internet and Business Performance, OECD, Paris.
© OECD 2002

ICT Diffusion and the Digital Divide
219
OECD (2001g),“Project on the Impact of e-Government”, PUMA(2001)10/Rev2, available at: www.oecd.org/oecd/pages/home/displaygeneral/0,3380,EN-home-301-nodirectorate-no-no-no-11,FF.html
OECD (2001h),“From In-line to On-line: Delivering Better Services”, PUMA internal working document, December, OECD.
Office of the Prime Minister (Iceland) (2000),Internet Survey, PricewaterhouseCoopers, October.
SESSI (2001),“L’internet : les Français se hâtent lentement”, ministère de l’Économie, des Finances et de l’Industrie DiGITIP,Les 4 Pages des statistiques industrielles, No. 152, August; also available at: www.industrie.gouv.fr/biblioth/docu/4pages/pdf/4p152.pdf
Statistics Canada (2000),Information and Communications Technologies and Electronic Commerce in Canadian Industry, 1999, available at:www.statcan.ca/english/research/88F0006XIB/88F0006XIB00004.pdf
Statistics Canada (2001),Changing our Ways: Why and How Canadians Use the Internet, Catalogue No. 56F0006XIE, available at:www.statcan.ca/english/IPS/Data/56F0006XIE.htm
Statistics Norway (2000),“Use of ICT in Enterprises. Electronic Commerce 1999”, available at: www.ssb.no/iktbrukn_en/
Swedish Institute for Transport and Communications Analysis (SIKA) (2000),“Informations- och kommunikationsteknik i Sverige”, En lägesanalys 2000, 2000:8, available at: www.sika-institute.se/english_fr.html
Taylor Nelson Sofres Norway (2002).
UK National Statistics (2000),“Internet Access, 1st Quarter 2000”, 10 July; “Internet Access”, 26 September, available at: www.statistics.gov.uk/pdfdir/inter0700.pdf and www.statistics.gov.uk/pdfdir/inter0900.pdf
US Department of Commerce (2000a),Digital Economy 2000, Washington DC, available at: www.esa.doc.gov/de2k.htm; see also US Department of Commerce(2002), Digital Economy 2002, Washington DC.
US Department of Commerce (2000b),Falling through the Net: Towards Digital Inclusion, Washington, DC (Report IV) and “Falling through the Net I, II, III”,available at: www.digitaldivide.gov
US Department of Commerce (2002),A Nation Online: How Americans are Expanding their Use of the Internet, Washington, DC, available at: www.esa.doc.gov/508/esa/USEconomy.htm
World Information Technology and Services Alliance (WITSA)/International Data Corporation (IDC) (2002),Digital Planet 2002: The Global Information Economy”, Arlington, VA, available at: www.witsa.org
© OECD 2002

221
Chapter 7
TECHNOLOGY TRENDS IN THE ICT SECTOR
This chapter discusses IT-related developments, their impact on the economy and society andpossible implications for governments.
Innovation is crucial to economic growth (OECD, 2001a). In the information and communicationtechnology (ICT) sector, with its relatively short product and service cycles, innovation is very rapid.Among instances of such advances are the following:
– Rapidly increasing processor and memory performance (according to Moore’s Law, the number oftransistor circuits on a computer chip doubles every 18 months, increasing memory andprocessing power tenfold every five years).1
– Declining memory costs (the price of storing 1 megabit DRAM declined by a factor of 10 000 fromthe mid-1970s to the mid-1990s).
– Expanding communications capabilities (until recently, multiplexing, data compression andamplification tripled total bandwidth annually in the United States).
These advances improve computing capabilities, expand communication capacity and result inenhanced knowledge creation, greater access to information and knowledge and expanded capabilitiesfor co-ordinating and applying information across a widening range of applications and uses.2
Rapid and ongoing innovation in ICT is the source of new products in both the ICT and othersectors and contributes significantly to future efficiency gains, productivity growth and relatedeconomic and social returns across the economy. ICTs are particularly important because of the positivenetwork effects and externalities associated with their use. The greater the number of ICT users, thegreater the benefits to all (Metcalfe’s Law3 states that the combined user value of the network increaseswith the square of the number of users). The rapid spread of ICTs throughout the world of work andsociety has made familiarity with and use of ICTs important to ensure the participation and inclusion ofindividuals and businesses. ICTs are increasingly vital in education, health and government services, allof which have public good characteristics and large externalities.4
The future impact of new technologies depends on their technological potential, the commercialexploitation of these technologies and their socio-economic acceptance and use. Because the finalcourse of technological development depends on complex interactions among these three, intersectingfactors, it is difficult to do more than summarise the potential of various technologies and point to thequestions that they raise for government policy. In particular, the following discussion focuses on areaswhere the conditions for the development of competitive markets are changing and where establishedregulatory frameworks may require adjusting to new realities, for example in areas such as intellectualproperty protection, security and privacy.
Current technological trends
As computing power increases, unit price and size decrease and communication capabilitiesexpand. These trends are likely to have widespread impacts:
– More devices are fitted with computing power and communication capabilities.
© OECD 2002
OECD Information Technology Outlook 2002
222
– Improved computing and communication capabilities and devices are allowing newfunctionalities.
– There are more channels of communication. People increasingly communicate with each otherand with applications, and applications increasingly communicate directly.
– New kinds of communication channels are being developed.
Such trends are part of a shift away from using ICTs for their computational power and towardsusing them for audio-visual media and entertainment. Different combinations of trends manifestthemselves in many new technologies. This section examines five innovations that are affecting theeconomy and society: ubiquitous computing, open source, IPv6, wireless communications and peer-to-peer exchange:
– Driven by rapid innovation, declining costs and decreasing unit size, computing capabilities areincreasingly ubiquitous. Computing spreads throughout the economy and determines whichbenefits are reaped.
– Open source provides an alternative platform for software innovation which allows for theconstant improvement of software. It is a positive force which affects the nature and direction ofinnovation in computing and the future development of the Internet and other software.
– The Internet is based on an open and relatively simple architecture and is a vital infrastructurefor communication, collaboration and information sharing. It contributes to efficiencyimprovements and productivity gains. Updating elements of the Internet’s architecture (Ipv6) willprovide additional benefits in future.
– The development and rapid diffusion of new communications technologies has the potential tosignificantly increase the economic benefits of ICTs across society and diversify the nature ofthose benefits. New kinds of wireless communication are altering communications structures,providing possibilities for further economic and social gains, notably through greater networkeffects.
– Finally, efficient and more effective information exchange is a major aim of informationtechnology (IT) innovation. With increasingly ubiquitous computing power and communicationscapacity, the dominant model of information exchange is shifting from a centralised andhierarchical model to one that is decentralised, horizontal and more equally distributed anddemocratic. Peer-to-peer is an important example of the shift in the structure and nature ofinformation exchange. The potential of peer-to-peer to encourage decentralised informationflows is only just beginning to be realised, and it has already profoundly affected establishedhierarchical structures.
Ubiquitous computing
Ubiquitous computing is not a specific technology, but a scenario in which computers becomemore numerous and fade into the background, providing information to human users and embeddingintelligence and computing capabilities in seemingly ordinary everyday objects. The term was firstcoined by Mark Weiser who championed the concept at Xerox PARC (Weiser, 1991, 1993). It has sincebeen extended, with terms such as pervasive and invisible computing (Norman, 1998), to describe theincorporation of information technology in many devices and applications (CSTB, 2001a). Computers arenow not only on desktops and in handheld devices such as mobile phones, but are also in microwaveovens, antilock brakes and air bags. Such devices use integrated computing power for betterperformance without direct human intervention.
Some call ubiquitous computing the “third wave” of computing (Weiser, 1996). The first wasmainframe computing (one computer, many people), the second personal computing (one person, onecomputer) and now ubiquitous computing (one person, many computers). Moore’s Law has madecontinued reductions in the cost of computing capabilities possible, thereby allowing the production ofrelatively low-cost computing devices. Advances in storage, speech recognition and wired and wirelessnetworking will further increase the capability of IT devices and their proliferation (Buderi, 2001).
© OECD 2002

Technology Trends in the ICT Sector
223
Under a ubiquitous computing scenario, multiple computing devices delivering abundantcomputation and communication power can be connected, and computers are so ubiquitous that manyare no longer thought of as computers. Developments in ubiquitous computing can take various forms;several examples are given below.
Achieving ubiquitous computing requires continuing research into a number of technologies thatinvolve human-computer interaction and interfaces. To develop “humancentric” computing, it isnecessary to identify research directions that may produce useful technologies. The aim ofhumancentric computing is to allow people to interact more naturally with progressively less intrusivetechnology. It includes new ways of communicating with computers, for example through speech,handwriting and visual signals. MIT’s Project Oxygen is one humancentric computing project. It seeks todevelop a platform that will respond to human needs, by using a microphone, speaker, view screen,camera and antenna to see and hear human input for broadband and narrowband communication.
Embedded tags allow small computer chips (or “tags”) to be embedded in small devices, and useradio frequencies to communicate information stored on them. For example, an embedded tag can beused to call up information such as the price, history and ownership of a given object. Sensors added tothese tags could allow the devices to take in information from their surroundings and use theinformation to react and respond (such as a heater which senses that one has left a room and sends amessage to the controller which then shuts it off).
For example, the Active Badge system, deployed at Xerox PARC, AT&T, MIT Media Lab and a numberof European universities, uses embedded tags and sensors in a personal badge to locate individualswithin a building by determining the location of their Active Badge. These sensors make it possible to findthe current location of a badge, provide information about other badges in the immediate area, notify aperson through his/her badge in order to deliver a message, etc. When this system was initially tried atOlivetti Research Ltd, staff disliked the idea of being tracked. However, after a two-week period, the staffaccepted the system and were willing to continue wearing badges (Want et al., 1992).
Other small, powerful, inexpensive computing devices perform a variety of embedded functions insmart houses, smart offices, smart buildings, smart automobiles and on smart highways. For example,while a car is generally not thought of as a computer, cars built in 2001 had between 20 and80 microprocessors controlling everything from running of the engine and the brake system to thedeployment of airbags, control of windshield wipers, door locks and entertainment systems (CSTB, 2001a).The number of microprocessors is expected to grow dramatically as automobile manufacturers look forways to translate electro-mechanical control systems into electronic ones. Future drivers will be informedabout safety and maintenance and be able to get directions on demand to anywhere (including locationssuch as restaurants and parking spaces), as well as video or audio material.
In addition, many home-networking technologies are under development. For example, theMediaCup is a coffee cup augmented with computer technology embedded in the base (Beigl et al.,2001). This cup uses integrated sensors to capture movement and temperature; it can beep if the coffeeis too hot or send a signal to a coffee machine to brew more coffee when the cup is empty. In anotherexample, Telia, the Swedish telephone company, is developing an electronic probe that can be used toidentify the ingredients in prepared foods, for example to detect those that might cause allergies. Theprobe can also be used when preparing meals, downloading recipes from the Internet and offeringguidance on the cooking process (TIME Europe, 2000).
In a further but different example of potential ubiquity, Tim Berners-Lee, the principal researcherbehind the development of the original World Wide Web, and other researchers are combining tags andsoftware agents or bots5 in the development of a Semantic Web. Most of today’s Web content isdesigned for people to read; computers are unable to interpret or manipulate the data. Based oneXtensible Markup Language (XML), the Semantic Web represents a technique for constructing Webcontent that is readable both by humans and by computer programmes. Bots will be able to access andinterpret any information or data available on the Semantic Web. For example, a handheld agent couldconnect to the Web and check available appointment time and location for a prescribed doctor’s visit(Berners-Lee et al., 2001). However, there is some scepticism about this project.
© OECD 2002
OECD Information Technology Outlook 2002
224
Emerging issues
The growth of ubiquitous computing raises many issues of confidence and trust, including privacy,security, reliability, usability and safety (CSTB, 2001a). While such issues are not new, customerprofiling, the possibility of permanent tracking and reliability issues have raised awareness of them.Consumers are concerned about who controls their information, how secure it is, who has access to itand how it may be used.
Ubiquitous computing presents new and vastly expanded ways of gathering information and thusraises new individual privacy issues. Some ubiquitous computing devices may be used to track peopleand monitor their activities without their knowledge. Privacy policy statements and third-party seals,which promise a certain level of privacy at a Web site, may be helpful for Web browsing but are notsufficient. Privacy issues in a ubiquitous computing environment include the kinds of data that may becollected (e.g. data about physical location and activities), how much might be collected (not only datathat has been supplied, but also data that has been observed), and how it might be used (as a means ofsurveying and/or regulating everyday actions). For example, many automobiles are already equippedwith devices that collect information about location and driving habits, such as driving speed,acceleration or engine speed. This information can be used to improve safety and analyse accidents; itcould be used to learn whether an automobile was operated in an unsafe manner so as to disallow aclaim (CSTB, 2001a). It could also be used to profile the drivers or to follow their movements.
The OECD Privacy Guidelines include eight basic principles that represent the internationalconsensus on how to collect and process personal data.6 These principles are based on openness,proportionality, awareness, choice, data security and customer access. In a ubiquitous computingenvironment, it is far easier to monitor individual activity than it is to apply these principles, as manydifferent types of data are being collected, links may be made between different aspects of anindividual’s life and data may be associated with real identities. The many technological possibilitiesraise questions as to how policy can continue to ensure privacy in a ubiquitous computing environment.The approach taken by the OECD aims at helping to address this issue by promoting theimplementation of a mix of solutions based on regulation and self-regulation, including privacystatements and trustmarks, as mentioned above, but also government oversight or use of privacy-enhancing technologies, and by fostering awareness of both privacy issues and solutions.
Security issues concern the level of protection of information from undesirable observation,alteration or use. They take as their basis an assumption that an unauthorised party is trying to accesssuch information. It is particularly difficult to achieve high levels of security in ubiquitous computingenvironments because there are many more potential points of entry and intrusions at any individualnode are harder to detect in widely dispersed systems. Network access policies and controls,enforcement of security policies, defence of critical infrastructure, prevention of attempts to denyservice and energy security are areas that need to be continually reviewed and updated.
Reliability is the capacity of a system to perform over a given time. Low-power ubiquitouscomputing networks cannot be subjected to the same verification procedures as more traditionalnetworks. Reliability may be harder to verify, and it is not clear how best to ensure it. Usability is thecapacity of a device to meet user expectations. However, for ubiquitous computing, this takes on aslightly different appearance, as individuals should be less aware of the technology. Humancentriccomputing is addressing certain aspects of human-machine interaction, but this is a rapidly evolvingarea, and there may be, for example, unintended health or ergonomic issues related to the increasedpervasiveness of computing power.
Computing devices are increasingly used in safety-critical systems to complement human action andminimise error. However, because machines also make errors and fail, this is a source of concern in aubiquitous computing environment. For example, aircraft are highly automated, but accidents resultingfrom a pilot’s confusion are generally blamed on pilot error rather than on system or automation design(Leveson et al., 1997). Regarding the safety of automated systems, many risk and safety issues raise thequestion of government support for research in designing for safety and identifying features that lead tohuman error and of government participation in hazard analysis and system safety verification.
© OECD 2002

Technology Trends in the ICT Sector
225
As ubiquitous computing develops, much research still needs to be done, and many paths tocommercial exploitation and social acceptance are being explored and tested. Commercial interest ishigh, and government policies impinge on the development of ubiquitous computing in areas such asnetwork regulation, R&D (in areas such as human-machine interaction), diffusion, governmentprocurement for own use and standards and IPRs. These are in addition to issues of privacy, securityand user and consumer safety, where public and commercial interests may not necessarily coincide.Regulatory frameworks are likely to require continuous review.
The ubiquity of computing devices also leads to new ways for humans to access the Internet.However uses are likely to be different (see Box 1).
Open source
Open source software (software whose source code is publicly available)7 is likely to have majorimpacts on the software industry. With open source, anybody can modify or improve a computerprogramme’s source code, and anyone using the modified software can benefit from the improvements.Many of the early protocols and software for the Internet were open source because the Internet wasgovernment-funded and sponsoring agencies encouraged sharing. Open source aided initialdevelopment of the Internet and contributed to the more general development of software. However,as the locus of innovation in Internet-related technology shifted to profit-minded corporations,proprietary source codes (protected by IPRs) gained share over open source.
The rapid spread of the Internet and the urgent need for interconnection and compatibilitybetween different software and hardware platforms have reopened the debate over whether or notsource codes should be proprietary. There is currently a move towards more widespread use andmainstream acceptance of open-source software. Examples of open source programmes with wideacceptance are Linux (see Box 2), Apache, Sendmail and Perl. Apache, an open source Web (http)server, has about 55% of the market for Web servers. Sendmail, an open source Internet mail transferagent, currently handles about 80% of Internet mail traffic. Perl, an open source programming languagethat is used for system administration, is estimated to have 1 million users (Lerner and Tirole, 2000).
In addition, established ICT firms have started to adopt open source. For example, Apple isadopting an open source Unix system with its new Mac OS X. It has developed the Apple Public SourceLicense, and has released a complete open source operating system, called Darwin. The Netscapeopen source license, Mozilla, was developed in 1998 to allow different standards for different parts ofthe code, and differentiates between repair and maintenance and new code.
However, commercial interests may feel open source is not a viable long-term business model. Onthe one hand, the decentralised organisation of open source projects means they cannot readily havenarrowly strategic goal or product orientation (Lessig, 2001). Furthermore, vendors have had difficultyfinding ways to develop viable business models for open source (Lerner et al., 2000). Companies eithergive away the software and sell services and support; they may also charge for the software itself, forexample in packaged, easy-to-use form. In contrast, the proprietary business model of Microsoft hasproposed a “Shared Source Philosophy” under which Microsoft shares source code with customers andpartners while maintaining all of the property rights.8
Open source has potentially positive impacts on innovation and competition. Open source projectshelp avoid unnecessary duplication, and, because advances are made available to all, newdevelopments diffuse rapidly. Rapid diffusion of innovation and decentralised organisational modelsare important features of systems based on open source. For example, the open source Gnutella, whichprovides peer-to-peer file trading services similar to Napster, lends itself to ongoing modification toprovide enhanced and widely available file exchange (see section on peer-to-peer).
Emerging issues
Open source software raises many policy issues, from government encouragement and support forsoftware R&D, and government development and procurement for own use, through to standards and
© OECD 2002

OECD Information Technology Outlook 2002
226
Box 1. The development of alternative Internet access routes
Because of wide diffusion, low cost and ease and familiarity of use, interactive TV receivers andmobile telephones have great potential as alternative routes to the Internet. However, even with stronggrowth, the uses of alternative Internet access routes are likely to be different from those of the PC-Internet model, because of their different technical capabilities, commercial exploitation and social uses(Table 1).
Mobile Internet users were estimated at over 21 million worldwide at the end of 2000: 81% in Japan(60% i-mode, 21% WAP); 12% in Korea (WAP); 5% in Europe (WAP); 1% in the United States (Palm)(Eurotechnology, 2000). Surveys suggest that messaging (e-mail, fax), location and miscellaneous servicesare most commonly used. Mobile phones have great potential because of wide diffusion, mobility andfast power-up; desktop computers have greater bandwidth capabilities, service variety and reliability.While there may be competition between mobile and PC Internet services, uses will also becomplementary.
Hopes for mobile Internet are linked to the development of third-generation (3G) platforms, orIMT-2000, with frequencies around 2000 MHz. Although 3G is a possible route for broadband access,European consumers will have to wait three to four years for widespread, accessible services atconvenient and affordable speeds, although the timetable may vary by a year or so in different OECDcountries. While high-speed mobile access has advantages, it will significantly lag speeds over fixednetworks in the immediate future (see OECD, 2001d).
There were 1.46 billion TV receivers worldwide in 1998, of which 637 million in OECD countries,mostly colour (ITU, 2000). A number of devices can be used to turn a television set into an Internetconnection, but most of these devices have had little impact (e.g. WebTV). The most successful andwidespread means of accessing the Internet through a television is via digital TV receivers. However,penetration levels are low; in mid-2000, 56 million households worldwide subscribed to digital televisionservices. According to Strategy Analytics, penetration was highest in the United Kingdom, where 29% ofhomes had digital TV, followed by the United States (24%) and France and Spain (15%) (StrategyAnalytics, 2000).
Table 1. Capabilities of different access technologies
Source: OECD.
Non-Internet communicationsAlternative Internet access
routesStandard Internet
access routes
Television Post TelephoneMobile
tel./InternetInternet via TV
PC with narrowband
PC with broadband
Spoken correspondence High High Limited LimitedWritten correspondence High Medium Medium High HighSimple information gathering Limited Limited Medium Medium Medium High HighComplex research Limited Limited Limited Medium HighSimple business transactions Limited High High High High HighComplex business transactions Limited Medium Medium Medium HighJob searches Limited Limited Limited Limited High HighInteractive job applications Medium HighDistance learning Medium Medium Medium High
Not readily available.
Limited capabilities.
Medium capabilities.
High capabilities.
© OECD 2002

Technology Trends in the ICT Sector
227
Box 1. The development of alternative Internet access routes (cont.)
Internet via TV has potential owing to the large installed base, ease of use, bandwidth capabilitiesvia cable and low cost. However, there are difficulties. The PC-type keyboard, mouse, printer or otherattachments are often not included in the service. Standard screens are not adapted for reading text overextended periods. Consumers may be unwilling to pay for interactive services, and service providershave focused on commercial sales and entertainment rather than Web services. Finally, desktopcomputers have far more network connections (246 million worldwide in 1999 versus 56 million digital TVsubscriptions) and more complete services, and current Internet access tools are designed for PCs.
Digital TV is largely used for entertainment (sport, films), and many digital subscribers take no extraservices. In Europe, of 12.2 million digital TV subscribers in 2000, less than one-half had e-mail and lessthan 10% had Web services (TV International, 2000). For UK users, the most popular functions areelectronic programme guides (73%) and the favourites function (46%). The most popular on-line activity isdownloading/playing games (44%), which is more than twice as popular as on-line shopping (18%). E-mail(13%), Internet browsing (9%) and banking (6%) are less used. The most common reasons for not usinginteractive digital TV were: services do not appeal and use of other Internet access routes (32% ofsubscribers in each case).
Alternative Internet access routes are expanding, but will be used differently from the PC-Internetmodel in the foreseeable future. Even with a dramatic increase in use of the most common alternativeInternet services (e-mail, entertainment, news, location services), opportunities to access more complexservices such as on-line education are limited, and such services may not be offered in the near future.
Box 2. Linux
Linux is a Unix-based operating system originally created in 1991 by Finnish graduate student LinusTorvalds. It has since been modified and improved by thousands of developers worldwide. It initially hada reputation for poor quality and difficulty of use and thus minimal success. However, as the code wasdeveloped, Linux gained a reputation for reliability superior to that of other operating systems. For thisreason, Linux has been increasingly used for Internet servers, networked systems and other operationsthat require reliability. It can be downloaded directly from the Web at no cost or purchased at relativelylow cost in commercial versions.
Linux property rights are held in the GNU General Public License, which states that its source code,and any modifications made and distributed, must remain free and available to the general public. Thelicense, which applies to any programme including parts of another programme under the GNU GeneralPublic License, states that “any patent must be licensed for everyone’s free use or not licensed at all”.
Linux’s market share for servers increased from 8% in 1997 to 27% in 2000 (Microsoft’s share was 41%in 1999).* It is estimated that the largest hosting companies are Linux and Solaris (Netcraft, 2000). In 1999,Compaq was the leading Linux vendor, claiming 25% of all Linux server units, followed by IBM with 10%.On the other hand, Linux has a low share in the PC operating system market, estimated by IDC at only 4%of the 99 million operating systems shipped worldwide in 1999 (less than the Macintosh OS and far lessthan Windows), largely because of a lack of applications software and difficulty of use. However, thecomplexity of Linux OS makes support and training services a good business opportunity, and estimatedgrowth rates for these services have been high.
The increasing demand for ubiquitous Internet connections may also help its installed base to grow ifLinux continues to provide viable solutions for application devices connecting to the Internet.
* IDC estimates, in “Software Survey”. The Economist, 12 April 2001.
© OECD 2002

OECD Information Technology Outlook 2002
228
IPR issues. Receiving particular attention are the interrelationships between open and proprietarystandards and between non-patented and patented software.
The Internet, the World Wide Web and related protocols were originally based on open standardsand non-patented software which anyone could build on. As new capabilities are added to the Internetand new standards/protocols are introduced, researchers and standards bodies must address the issueof the incorporation of proprietary standards and patented software in Internet and WWW structures.While many of early Internet protocols/standards were developed with government funding and were inthe public domain, government funding of software research is now relatively less important. Theprivate sector is largely driving Internet-related and software innovation and recognises this as animportant commercial resource, so that proprietary standards and IPR issues remain of ongoingimportance.
For example, the standard-setting World Wide Web Consortium (W3C) has proposed a reasonableand non-discriminatory (RAND) licensing model, where not all Web licenses would be royalty-free. Thusproprietary code could become part of World Wide Web standards. While this is not new – the InternetEngineering Task Force (IETF) uses a similar licensing model9 – the open source community isconcerned about the possibility of having to pay to develop or use the Web and the risk that Webdevelopment will stagnate as a result.
More generally, this debate overlaps with that on the co-existence of open source and proprietarysoftware code. Depending on the open source license, incorporation of open source code intoproprietary software may be feasible. While some open source licenses (such as GPL) do not allow forcombining with proprietary code, other licenses (such as BSD) do. Proprietary software can beincorporated into an open source project if the license permits (as with Mozilla). However, copyrightand patent holders can prevent their code from being incorporated into open source, and thedistributed nature of open source makes negotiating proprietary licenses (as is commonly done forproprietary software) difficult. Intellectual property rights thus pose major challenges for the futuredevelopment of open source (Lessig, 2001). Property rights and standards crystallise the differencesbetween the two philosophies on how to develop the Internet and the World Wide Web, public goodsof enormous importance.
Finally, government funding of software R&D will continue to influence some aspects of softwaredevelopment, including open source. Choices within government are likely to be influential in thefuture development of open source, for example software procurement and development forgovernment use take into account the potential benefits of sharing code and continually improvingsoftware.
IPv6
The Internet’s architecture determines how different components of the networks that compose theInternet interrelate. The principles guiding the early builders of the Internet architecture have beendescribed as follows (NRC, 2001b):
– Hourglass architecture. The Internet is designed to operate over different underlyingcommunications technologies, including technologies yet to be introduced, and to supportmultiple and evolving applications and services.
– End-to-end principle. The network provides a communication fabric connecting the many devices atits ends but only offers a very basic level of service and data transport. The intelligence andinformation processing needed for applications is located in or close to devices attached to theedge of the network.
– Scalability. The Internet’s design enables it to support a growing number of users andcommunications.
– Distributed design and decentralised control. Control of the network is largely distributed; no singleentity controls the Internet.
© OECD 2002
Technology Trends in the ICT Sector
229
The network is a vehicle for a vast array of client/server and peer-to-peer computing applicationsand electronic commerce. However, rapidly expanding use of the Internet threatens to overload itsunderlying protocols, and there has been increasing concern that growing demand will outstrip thenumber of Internet Protocol (IP) addresses.10
The IETF concerns itself with immediate technical challenges facing the Internet. In 1992, the IETFrecognised the shortage of IP addresses and other technical development obstacles. The InternetProtocol next generation (IPng) project was started to resolve these issues and made recommendationsin 1994. Subsequently, end-user organisations, standards groups and network vendors agreed on theIETF’s Internet Protocol version 6 (IPv6) as the final IPng proposal. Until it has been completelyadopted, IPv6 will work alongside the current IPv4.11 IPv6 provides more addresses and takes intoaccount performance, network route structure and management issues, scalability, ease ofconfiguration, quality of service and security issues.
IPv6 dramatically increases the number of Internet addresses by using a 128-bit address spacerather than the 32-bits of IPv4.12 IPv6 provides enough addresses for foreseeable growth, including theproliferation of devices connecting to the Internet such as personal data assistants, mobile phones,set-top boxes and household appliances.
IPv6 allows for a flexible, scalable, open-ended and more efficient global network routing hierarchy.Additionally, IPv6 introduces advanced autoconfiguration features, allowing new devices to be addedwithout reconfiguring the network. Computing stations will be able to configure their own addresseswith the help of a local IPv6 router. This facilitates mobility, as devices will automatically receive a validIP address that is independent of the location at which they connect to the network.
IPv6 uses flow labels to identify network streams of packets requiring special handling, and theselabels could be used to give traffic flows a specific level of security, delay or cost. This new architecturepaves the way for improved quality of service (QoS) for interoperable applications, such as real-timevoice and video, where performance criteria such as available bandwidth and timing are not ensured.
IPv6 also incorporates low-level encryption and authentication features. The proprietary securityextensions used for IPv4 have been less robust, largely owing to problems of interoperability. Byincorporating security into the backbone of IPv6, these problems can be reduced. A standard headerextension of IPv6 can be used to provide end-to-end encryption at the network layer. The header canbe used directly between hosts, or in conjunction with a specialised security gateway that uses its ownpacket signing and encryption methods to add an additional level of security. An authentication headerextension to IPv6 verifies that a data packet actually comes from the host indicated in its sourceaddress, thereby safeguarding against packets generated with forged source addresses.
Emerging issues
When and whether IPv6 will be deployed will depend on whether looming infrastructure shortageswill outweigh the switching costs associated with the new technology. Switching from IPv4 toIPv6 requires expensive investment in infrastructure and new technology and few applications havebeen written for IPv6. There are, however, two sources of demand for IPv6. The first is the eventual lackof allocable addresses in high-use regions which would require the adoption of a larger capacity system.The second is adoption of IPv6 in regions with fewer IPv4 addresses and hence lower sunk costs andlower switching costs for moving to the new technology. North America has approximately 74% of IPaddresses, Europe has 17% and the Asia-Pacific region has 9% (ZDNet, 2001); demand for IPv6 has so farbeen largely in Asia.
Owing to various quality and security advances associated with IPv6, some governments havechosen to boost the deployment of IPv6. For example, the European Commission has assigned a taskforce to investigate the transition to IPv6. The Japanese government has gone further, imposing adeadline of 2005 for upgrading all information technology sectors to IPv6 in order to stimulateapplication development and network upgrades.
© OECD 2002

OECD Information Technology Outlook 2002
230
Wireless
More devices are being fitted with wireless capabilities, and new wireless communication channelsare being developed. Wireless devices are making it possible to connect anytime and anywhere toother users and other devices, and are part of the movement towards communications portability, alongwith mobile phones (see Box 1), handheld devices and laptop PCs. Wireless technologies are also aprerequisite for the development of ubiquitous computing. They can be used to extend traditionalinfrastructure in two ways: into areas where wires are a hindrance, such as many small appliances in aroom, and into dispersed areas such as rural regions not served by traditional infrastructure. A numberof examples of developments in wireless technologies are given below.
802.11
802.11 is an Ethernet standard based on radio signals that can be used for wireless networking. It wasapproved in 1997 and extended and updated in September 1999. There are a number of versionsof 802.11 (also known as WiFi or wireless Ethernet) capable of speeds of up to 11 Mbps. 802.11b is themost common and works within a radius of 100 meters from a base station.13 One base station can servemany users at the same time; this is particularly attractive for shared local networks as it avoids the cost ofrunning wiring into every room. 802.11b has become the wireless standard for enterprise networking and isemerging as a de facto standard for all high-speed wireless connections to the Internet, particularly in theUnited States.14 It is already available in certain airports, hotels and cafés, and there is high uptake byuniversities. An 802.11b-ready computer (with an antenna and a card) can connect easily in all of theseareas with no individual charge. Internet service providers (ISPs), however, may be wary of attempts bycustomers to create community networks by putting 802.11b stations in/near public places. This mayviolate some customer agreements, which limit personal ISP accounts to individual users or households.
Another version of the 802.11 standard, 802.11g, attempts to boost speeds from 11 to 22 Mbpswithout altering other factors. 802.11a uses a higher-frequency 5 GHz band and has a greater bandwidthallotment; it can provide speeds of up to 54 Mbps. However, these versions are considerably moreexpensive than 802.11b, and while they may act as upgrades, they are unlikely to replace 802.11b as themost widely used in the near future. Obstacles to greater uptake of 802.11 include security issues (amajor problem), congestion, interference and a lack of billing or roaming infrastructure.
Bluetooth
Many discussions of wireless in Europe have focused on “Bluetooth” technology, an open standardfor wireless networking.15 Bluetooth is a short-range radio technology that allows devices within tenmeters of each other to communicate wirelessly. The Bluetooth radio chip is one square centimetre insize and two millimetres thick, small enough to embed in small mobile phones, attach to clothing orembed in retail products. Because it only works at very short range and with narrowband capabilities of1 Mbps, Bluetooth may be best used as a replacement technology which could also make possible newdevelopments such as connected houses.
At USD 8-10 per chip, Bluetooth technology is far cheaper than many wireless devices, but it is stilltoo expensive for low-cost applications. However, Cambridge Silicon Radio, the world’s leadingmanufacturer of Bluetooth chips, has announced plans to have chips on sale at below USD 5 by 2003(AP Informatique, 2001). As of late 2001, Bluetooth was used mostly in more expensive products such asmobile phones, laptop computers, printers and video cameras, but as the price comes down thetechnology may be integrated into less-expensive devices.
Advantages of Bluetooth compared to other wireless technologies include price and low powerconsumption, which make the technology ideal for mobile devices. However, compared to 802.11,Bluetooth speeds are very slow and the range is very short. This makes it a poorer choice for humannetworking (though these capabilities may be adequate for machine-to-machine communications). Onthe other hand, Bluetooth and 802.11b may be highly complementary, with Bluetooth linking consumerdevices and 802.11 linking to the Internet. Obstacles to greater uptake include interoperability,interference with other radio signals and perceived security risks.
© OECD 2002
Technology Trends in the ICT Sector
231
Satellite
Satellite transmission has been extremely successful in bringing television broadcasts to remoteand developing areas. While there are hopes of using satellites to bring the Internet to such areas,various obstacles must be overcome. Common satellite broadcasting systems (such as television andradio) are one-way; a user receives a signal, but does not send information back. In contrast, theInternet is fundamentally two-way. One-way satellite television signals use distant geo-stationarysatellites for transmission, but this gives a delayed and prohibitively slow signal for Internet signals.Another option, low Earth-orbit satellites, helps solve the problem of delay but raises others, such ascoverage. A number of projects are under way to provide Internet access via low Earth-orbit satellites,but broadband services are not expected to be in place until at least 2004.16 Current services areconsiderably slower, with maximum speeds of 400 kbps.
Spread spectrum
Spread spectrum radio (also called “wideband”) uses intelligent receivers to enable radio signalsto switch optimally without interference among frequencies, carriers and networks. Software-definedradio protocols regulate different signals with the end-to-end principle, just as Internet protocolsgovern the use of the Internet. Ultra-wideband (UWB) is one example of spread spectrum technology. Ittransmits information via extremely short pulses (half a billionth of a second). Because the pulses are soshort, they do not interfere with receivers listening for transmissions, as these generally perceive theUWB signals as mere background noise. UWB would use extremely low-power radio pulses(50-70 millionths of a watt) extending from 1 to 4 Ghz, a large portion of the spectrum. The low powerusage makes it ideal for battery-powered devices. In the United States, approval from the FederalCommunications Commission was granted in early 2002. While this technology is in its infancy, somesupporters believe that it has the potential to compete with both 802.11 and Bluetooth. The speed iscurrently 10 Mbps, which is comparable to that of 802.11, with a range of up to 50 meters. However,spread spectrum raises a number of policy and regulatory issues (see below).
Emerging issues
Apart from network security risks, congestion, interference and interoperability problems, a majorissue for wireless is the deployment of spectrum to allow wireless adoption and applications. There is alimited amount of wireless broadcast spectrum – most commercial activity takes place between 30 MHzand 30 GHz. As a general rule, the lower the frequency, the better the signal penetrates obstacles andthe farther it can travel, but higher frequencies are better suited for broadband. When manytechnologies use the same band for networking, there is risk of interference and degradation. Forexample, wireless technologies using the 900 MHz band risk interference from household microwaveovens. Such degradation is especially a problem for streaming video signals and could inhibit adoption.
National governments allocate bandwidth, licensing the use of specific parts of the spectrum inspecific ways in specific geographic areas. These licenses generally go to the highest bidder, although incertain cases smaller companies are given an advantage. There is no international procedure forharmonisation of spectrum assignments, and spectrum may be used for different purposes in differentcountries. This can cause serious obstacles for companies trying to develop a multinational technology.
Governments are large users of spectrum. For example, in the United States, the federalgovernment is the single largest user, using spectrum for law enforcement, air traffic control, nationaldefence, weather services and environmental monitoring. Most governments do not concernthemselves with interference within a privately held band; this is mostly left to trade groups. Bluetoothand 802.11b share the 2.4 GHz band and need to find ways to co-exist so they do not undermine eachother.
The issue of spectrum assignment has been further complicated by technologies developed in thepast few years, in particular spread spectrum radio (Lessig, 2001). Spread spectrum technologiesundermine the current regulatory structure for spectrum allocation, as they do not use a definable band
© OECD 2002

OECD Information Technology Outlook 2002
232
of spectrum but extend across a range of bands. While regulators do not want to stem new, innovativetechnologies, there is concern that widespread use of spread spectrum could create enoughinterference to hinder mission-critical applications such as air traffic control.
Security poses a particular problem for new, untested technologies, and security failures haveoccurred in many wireless technologies, including 802.11 and Bluetooth. Wireless networks areparticularly hard to protect because connections are made through the air which is available to all.
Peer-to-peer
Peer-to-peer is a communication structure in which individuals interact directly, without goingthrough a centralised system or hierarchy. It is an example of network power and commercialexploitation through decentralised information exchange as opposed to centralised information control.With peer-to-peer technology, users may share information, contribute to shared projects or transferfiles (O’Reilly, 2001). Large numbers of users provide computing resources (disk space and processortime), creativity, administrative effort and even legal liability. Examples of peer-to-peer include filetransfer, data caching, database generation, distributed computing and grid technology.
The original Internet design was peer-to-peer. Independent individuals connected to each anotherto share information, and any two nodes could send packets to one another. However, as the Internetbecame more popular, a shortage of IP addresses appeared and the need for network securityincreased. In the mid-1990s, dynamic IP addresses, network address translation (NAT) and firewallswere developed to address these problems, but they also made parts of the Internet harder to reach.Peer-to-peer applications such as file sharing and instant messaging need to work hard to circumventthese developments.17 Peer-to-peer communication also declined because of the emergence ofdominant Internet-based applications/services that mediate communications and Internet transactions(most people go to a Web site to locate and download files rather than use peer-to-peer techniques).However, peer-to-peer has recently been regaining popularity, most visibly through Napster and similarprogrammes (see Box 3).
Most current peer-to-peer applications are not 100% peer-to-peer, but hybrids that make some useof central servers, which can be used to ensure accountability and/or quality. For example, while instantmessaging appears to be peer-to-peer, in fact a server facilitates communication between nodes.
Box 3. Napster
Napster was created in 1999 by 19-year old Shawn Fanning, and is the best-known example of peer-to-peer file transfer. It allows users to share MP3 files over the Internet. Users log on, and query theNapster server for a song or artist. The Napster server replies with a list of all relevant files currentlyavailable on other hard drives. The user then downloads directly from another user. The existence of thecentral server makes Napster a hybrid peer-to-peer application and more efficient than if it was purelypeer-to-peer. The directory uses little bandwidth and file sharing takes place directly between users.
In late 1999, the Recording Industry Association of America (RIAA) filed a lawsuit against Napster forviolating music copyright. In a preliminary injunction in July 2000, a US federal judge ruled that Napstermust stop trading copyrighted works through the service. However, Napster appealed to a higher court, andthe application continued to be used. Publicity stemming from the court case caused use of Napster to soar– an estimated 2.79 billion files were traded in February 2001. But in the same month a panel ruled thatwhile the original injunction had been overly broad, Napster must block copyrighted material if thecopyright holders identified it. Napster installed filters that slashed MP3 files available, and usage droppeddramatically. By May 2001, only 360 million files were being traded (Webnoize). A full trial is still ahead.
© OECD 2002

Technology Trends in the ICT Sector
233
Since Napster has been restricted, projects such as the open source Gnutella are becoming morewidely used. Unlike Napster, Gnutella does not have a central directory server – users connect directlyto other nodes within the immediate vicinity and request a file. If the nearby nodes do not have the file,they ask the nodes in their immediate vicinity, and so on. When the file is found, it is routed back to theinquirer (Kan, 2001).
Other types of peer-to-peer application, distributed computing and grid technology, are recentdecentralised applications that involve direct interaction. Distributed computing harnesses unusedcomputer power to create a linked network of computers, multiplying computing power. Linkedcomputer power is being used for cancer research, solving difficult mathematical problems andcomplicated modelling such as evolutionary research. Some large IT companies are developing thistechnology for business customers in order to avoid buying high-end mainframe computer systems.There are also applications in supply chain management and collaboration.
Grid technology goes one step beyond distributed computing, via an infrastructure for dynamic,co-ordinated multi-institutional resource sharing and problem solving. It was initially designed foradvanced science and engineering projects but is now considered for business applications. A numberof private and public sector efforts are under way. One example is the DataGrid project, funded by theEuropean Union, which aims to be functional by 2005. Its goal is to further scientific exploration thatrequires intensive computation and analysis through the large-scale use of shared computational powerand databases across widely distributed scientific communities.18
Emerging issues
Peer-to-peer technologies raise important issues for IPR and copyright, trust, accountability,security and enforcement, largely owing to their structure, which does not use centralised servers. IPRsare designed to encourage innovation and promote social welfare by giving creators full exploitationand distribution rights for a defined period while divulging a certain amount of information on theprotected product. The digital age challenges the established application of intellectual property, astechnological innovation and new distribution channels have dramatically lowered the costs ofreplicating and distributing digital goods. With readily available tools anyone can copy and forwardprotected property, thus becoming an individual publisher of information they did not author. Thereproduction and sharing of copyright-protected music files over Napster created extensive legalproblems due to the difficulty of measuring and controlling flows of commercially valuable products.
Peer-to-peer raises a number of issues relating to the development and enforcement of manytypes of regulation (including intellectual property, on-line pornography, tax collection, etc.). Becauseindividuals transfer files directly, central servers or regulators cannot control the information being sent.However, code can be used to help regulate peer-to-peer, as it can be embedded in the digitalinformation that is shared. Some analysts argue that code is a more efficient means of protecting digitalproperty than law, and that ideally the two should be combined to provide the right balance ofprotection (Lessig, 1999).
Trust in peer-to-peer is an ongoing issue. Users are unlikely to use peer-to-peer systems if they donot trust them, and users typically ask (Waldman et al., 2001):
– Will this product really do what it says?
– Will the company sell my private information to other companies?
– Are my actions available for observers to see?
Peer-to-peer situations are especially challenging because users frequently use files orcomputations provided by (perhaps unknown) individuals who may be hard to contact later. In additionto building trust through information and reputation, there are a number of technical means ofaddressing these issues. For example, public key cryptography and digital signatures can be used toensure that the person one contacts is the person he/she says he/she is, and that there is a way tocontact that person if there is a problem. However, international harmonisation of Public KeyInfrastructure has not yet been achieved (OECD, 1998).
© OECD 2002

OECD Information Technology Outlook 2002
234
Accountability in a network is important to ensure social responsibility. Peers can abuse theprotocols and rules of a peer-to-peer system by (Dingledine et al., 2001):
– Providing corrupted or low-quality information.
– Reneging on promises to store data.
– Going down during periods when they are needed.
– Claiming falsely that other peers have abused the system in these ways.
Restricting access and maintaining a reputation for every user are two methods of improvingaccountability. Future systems may be designed with incentives and controls to encourage properbehaviour.
Security poses additional challenges in a peer-to-peer situation, because common security toolssuch as firewalls are potential obstacles to peer-to-peer, and may be circumvented in order to use peer-to-peer applications, thus eliminating the most common form of protection. However, common securityalgorithms and protocols such as PKI can usually still be applied in peer-to-peer contexts, and securityguarantees can be given. For example, Groove Networks is an Internet-based platform that deliversbasic support for collaboration. It guarantees that strong security is always in force: all shared-spacedata are confidential, no group member can impersonate another group member or tamper with thecontents of any group message, a lost message can be recovered from any member with assurance of itsintegrity and proof of its true originator and no non-member or former member who has beendismissed from the group can eavesdrop on or tamper with group communication (Udell et al., 2001).
Conclusion
The development of new technologies is driven by the interplay of technological potential,commercial exploitation and socio-economic acceptance. Government policy touches in many ways oneach of these areas (for a discussion of specific policies, see Chapter 8). The challenge for governmentis to foster innovation and technological development while paying attention to equity considerations(e.g. digital divide issues related to new technologies) and negative impacts (e.g. system vulnerability,illegal activities). Technological developments are moving very fast and it is difficult to anticipate futurepolicy impacts in detail. Broad approaches to policies in emerging areas include:
– Technology-neutrality in legislation and regulation to avoid closing off promising options.
– Flexibility within broad regulatory frameworks and adaptation of current laws to a digital world.
– Involvement of all stakeholders in regulatory processes.
– Performance requirements rather than technical specifications when procuring new technologies.
– Increasingly looking to international co-operation to harmonise approaches to transborderissues.
Ubiquitous computing, open source software, IPv6, wireless and peer-to-peer are already affectingbusiness and society by promising, and providing, new computing and networking capabilities. At thesame time, these new technological trends raise important issues for example, for privacy, consumerprotection and others areas of regulation and enforcement. Further technological developments willbring relevant policy issues to the fore, and governments may find it useful to apply broad policyapproaches rather than focusing on specific technologies individually.
© OECD 2002
Technology Trends in the ICT Sector
235
NOTES
1. Moore’s Law states that the number of elements on a single integrated circuit doubles approximately every18 months, owing to increased chip size and decreased transistor/element size, thus boosting speed andcapability. It has roughly held true since the 1960s. Moore has been unwilling to extend the time scale too farinto the future, and there are some indications that it may lose its relevance owing to lower physical size limitson electron-based technologies. Nonetheless, most experts believe that it will hold true for at least anotherfive to ten years. Optical computing is likely to extend the horizon.
2. See Chapter 1 on the growth of the ICT supply side and capabilities and the impact of ICTs on the economy andsociety.
3. Metcalfe’s Law predicts that the value of a network increases in proportion to the square of the number ofpeople connected to the network (Metcalfe, 1995).
4. Details on the impact of the production, diffusion and use of ICTs can be found in Chapter 1. See also OECD,2001a, 2001b, 2001c.
5. Software agents, or “bots”, act on behalf of people looking for information, negotiating and aggregatingdifferent, dispersed services into larger co-ordinated actions. In future, they may be used to conduct searches,make reservations and compare alternatives. Bots already under development or available includeapplications to filter e-mail, phone calls and news alerts (see OECD, 2000).
6. The eight OECD privacy principles cover: collection limitation; data quality; purpose specification; uselimitation; security safeguards; openness; individual participation and accountability.
7. For a more complete definition, see DiBona et al., 1999, Appendix B, The Open Source Definition, Version 1.0.8. In his remarks to the New York University Stern School of Business, Microsoft’s Senior Vice President Craig
Mundie stated that “A common trait of many of the companies that failed is that they gave away for free or at aloss the very thing they produced that was of greatest value – in the hope that somehow they’d make moneyselling something else” (Mundie, 2001).
9. The IETF’s Internet Standards Process (Revision 3), RFC 2026, Section 10.3.2 states: “(C) Where the IESG knowsof rights, or claimed rights under (A), the IETF Executive Director shall attempt to obtain from the claimant ofsuch rights, a written assurance that upon approval by the IESG of the relevant Internet standards trackspecification(s), any party will be able to obtain the right to implement, use and distribute the technology orworks when implementing, using or distributing technology based upon the specific specification(s) underopenly specified, reasonable, non-discriminatory terms. The Working Group proposing the use of thetechnology with respect to which the proprietary rights are claimed may assist the IETF Executive Director inthis effort.” See http://portal.etsi.org/directives/
10. Internet protocols are standards governing the interchange of data and enable communication within andamong networks. There is considerable lack of certainty about when/if current address space will run short.Only one-quarter of total addresses are observed to be in use; however, about half of these have beendelegated to Internet service providers and other organisations (CSTB, 2001b).
11. IPv5 was experimental and was never used.12. A 32-bit address space provides a theoretical limit of 232 unique addresses; 128 bits gives 2128 (CSTB, 2001b).13. With a direct line of sight and directional dish antennae the signal can travel much farther.14. HomeRF is a competing standard, also using the 2.4 GHz band. HomeRF is less expensive than 802.11, but is
slower, with a maximum speed of 2 Mbps. Supporters maintain that HomeRF is better suited for home usebecause it is more resistant to interference from devices such as cordless phones and microwave ovens. It isalso better suited for voice transmission. However, HomeRF has been losing market share.
15. Bluetooth was named after the 10th century Viking King Herald Bluetooth, who united Nordic nations underone religion.
16. Examples include Teledesic, Alcatel’s SkyBridge and Hughes Space Way.17. For example, port 80 is the port that HTTP traffic uses for browsing the Web. While firewalls may filter many
types of traffic, they usually allow unrestricted access to port 80 in order to allow users to surf the Web at ease.Precisely because port 80 is less strictly controlled, most peer-to-peer applications have developed a way touse port 80 and circumvent network security policies.
18. See www.eu-datagrid.org
© OECD 2002

OECD Information Technology Outlook 2002
236
REFERENCES
AP Informatique (2001),“Le prix des processeurs à la norme Bluetooth baissera en 2003”, 15 September, available at: www.ap-informatique.com
Beigl, M., H.W. Gellersen and A. Schmidt (2001),“MediaCups: Experience with Design and Use of Computer-Augmented Everyday Objects”, Computer Networks:Special Issue on Pervasive Computing, Elsevier, forthcoming; available at: http://mediacup.teco.edu/research/engl/research.html
Berners-Lee, T., J. Hendler and O. Lassila (2001),“The Semantic Web”, Scientific American, May.
Boston Consulting Group (2000),“Mobile Commerce: Winning the On-Air Consumer”, available at: www.bcg.com/media_center/media_press_release_subpage31.asp
Bunderi, R. (2001),“Computing Goes Everywhere”, Technology Review, January/February.
Computer Science and Telecommunications Board (CSTB),National Research Council (2001a), Embedded Everywhere, National Academy Press, Washington, DC.
Computer Science and Telecommunications Board (CSTB),National Research Council (2001b), The Internet’s Coming of Age, National Academy Press, Washington, DC.
DiBona, C., S. Ockman and M. Stone (1999),Open Sources, O’Reilly and Associates, Cambridge.
Dingledine, R., M.J. Freedman and D. Molnar (2001),“Accountability”, in A. Oram (ed.) (2001), Peer-to-Peer: Harnessing the Power of Disruptive Technologies, O’Reilly andAssociates, Cambridge.
Eurotechnology Japan (2000),available at www.eurotechnology.com/imode/
Evans, P. and T. Wurster (2000),Blown to Bits: How the Economics of Information Transform Strategy, Harvard Business School Press, Boston,Massachusetts.
IDC (2001),“Teaching Penguins to Fly”, IDC Newsletter, IT Forecaster, 13 February.
Kan, G. (2001),“Gnutella”, in A. Oram (ed.) (2001), Peer-to-Peer: Harnessing the Power of Disruptive Technologies, O’Reillyand Associates, Cambridge.
Lerner, J. and J. Tirole (2000),“The Simple Economics of Open Source”, NBER Working Paper 7600, National Bureau of Economic Research,Washington, DC.
Lessig, L. (1999),Code and Other Laws of Cyberspace, Basic Books, New York.
Lessig, L. (2001),The Future of Ideas: The Fate of the Commons in a Connected World, Random House, New York.
Leveson, N.G., J.D. Reese, S. Koga, L.D. Pinnel and S.D. Sandys (1997),“Analyzing Requirements Specifications for Mode Confusion Errors”, paper presented at the Workshop onHuman Error, Safety, and System Development, Glasgow.
Metcalfe, R. (1995),“From the Ether: A Network Becomes More Valuable as it Reaches More Users”, InfoWorld Magazine, 2 October.
© OECD 2002

Technology Trends in the ICT Sector
237
Mundie, C. (2001),“The Commercial Software Model”, prepared text of remarks by Craig Mundie, Microsoft Senior Vice President,at the New York University Stern School of Business, 3 May, available at: www.microsoft.com/presspass/exec/craig/05-03sharedsource.asp
Netcraft (2000),“Netcraft Web Survey”, March, available at: www.netcraft.com/survey
Newsbytes (2001),“DoCoMo I-Mode Subscribers Top 30 Million Mark”, A. Creed, 26 December, available at: www.newsbytes.com
Norman, D.A. (1998),The Invisible Computer, MIT Press, Cambridge, Massachusetts.
OECD (1998),Cryptography Policy: The Guidelines and the Issues, OECD, Paris.
OECD (2000),OECD Information Technology Outlook: ICTs, E-commerce and the Information Society, OECD, Paris.
OECD (2001a),Science, Technology and Industry Outlook, Drivers of Growth: Information Technology, Innovation and Entrepreneurship, OECD,Paris.
OECD (2001b),“The New Economy: Beyond the Hype”, OECD, Paris
OECD (2001c),“The Electronic Commerce Business Impacts Project (EBIP)”, forthcoming.
OECD (2001d),“The Development of Broadband in OECD Countries”, DSTI/ICCP/TISP(2001)2/FINAL.
Oftel (2000),“Consumers’ Use of Digital TV”, Oftel Residential Survey, July 2000, available at: www.oftel.gov.uk/research/digi0800.htm
Oram, A. (ed.) (2001),Peer-to-Peer: Harnessing the Power of Disruptive Technologies, O’Reilly and Associates, Cambridge.
Smetannikov, M., Interactive Week (2001),“IPv6: So Far, Few Takers”, 22 May, available at: www.zdnet.com/zdnn
Strategy Analytics (2000),“Interactive Digital Television: World-wide Market Forecasts”, available at: www.strategyanalytics.com/press/PRDM21.htm
Time Europe (2000),“Not Very PC: A New Generation Is Moving Computing Power off the Desktop and into Everyday Items”,28 February, Vol. 155, No. 8.
TV International (2000),“Europe’s Digital TV Platforms Look beyond Interactivity to Commerce Riches”, 2 October.
Udell, J.N. Asthagiri and W. Tuvell (2001),“Security”, in A. Oram (ed.) (2001), Peer-to-Peer: Harnessing the Power of Disruptive Technologies, O’Reilly andAssociates, Cambridge.
Waldman, M., L.F. Cranor and A. Rubin (2001),“Trust”, in A. Oram (ed.) (2001), Peer-to-Peer: Harnessing the Power of Disruptive Technologies, O’Reilly and Associates,Cambridge.
Want, R., A. Hopper, V. Falcao and J. Gibbons (1992),“The Active Badge Location System”, Olivetti Research Ltd, Cambridge, available at: www.ubiq.com/want/papers/ab-tois-jan92.pdf
Weiser, M. (1991),“The Computer for the Twenty-First Century”, Scientific American, pp. 94-10, September.
Weiser, M. (1993),“Some Computer Science Problems in Ubiquitous Computing”, Communications of the ACM, July (reprinted as“Ubiquitous Computing”, Nikkei Electronics, 6 December, pp. 137-143).
Weiser, M. (1996),“Ubiquitous Computing” available at: www.ubiq.com/hypertext/weiser/UbiHome.html
Young, R. (1999),“Giving it Away”, in C. DiBona, S. Ockman and M. Stone (eds.), Open Source, O’Reilly and Associates, Cambridge.
© OECD 2002

239
Chapter 8
IT POLICIES
This chapter summarises information technology (IT) and related policies that affect thedevelopment, diffusion and use of IT in OECD countries.1 First, an overview discusses responses to theIT Outlook policy questionnaire. The following sections explore areas of high current policy interest: ICTskills and the digital divide.
Overview of IT policies
Since the publication of the IT Outlook 2000, uptake and use of ICTs, and particularly the Internet, havecontinued to increase in OECD economies, although in 2001 and early 2002 nominal ICT investmentexpenditure declined and the rate of increase in the ICT capital stock slowed. OECD governments haveadopted broad policy frameworks and detailed measures that encourage the development, diffusion anduse of ICTs. Government policy has focused on ICTs not only because of the economic importance of thevery dynamic ICT-producing sector itself, but also because of the wider impact of ICT investment and useon the economy and society. Areas of particular attention include:
– The impact of ICTs on firm-level competitiveness (OECD, 2002a).
– The potential for economy-wide output, employment and productivity gains, which are nowbeing quantified (see Chapters 1 and 5 and OECD, 2001a and 2001b).
– Issues of social equality and the digital divide (see Chapter 6 and OECD, 2002b).
– The potential for improving government efficiency and the delivery of government services (seeChapter 6).
Almost all OECD countries have well-developed and clearly enunciated broad strategies and actionplans for IT and an overarching policy approach to the information society. These usually cover technologydevelopment, technology diffusion, improving the IT environment and the global diffusion anddistribution of ICTs with increasing accent on ICT demand and use. The potential cost-effectiveness ofpublic-private partnerships in promoting the development and use of ICTs is also increasingly recognised.
Table 1 summarises the broad patterns of policies in 21 responding OECD countries. A briefdiscussion of the general policy areas follows.2
Policy environment and broad policy vision
The development of a broad IT policy vision has been an important feature of policy in almost allOECD countries. IT policy visions most commonly stress the importance of universal access to ICTs. Inthe European Union, the principal goal of the e-Europe initiative is an “Information Society for All”,Mexico promotes greater access to new technologies and Switzerland emphasises “access for all” and“empowerment of all”. Certain countries also stress broadband access: Norway has an Action Plan onBroadband Communication, and Canada plans to have broadband access available in all communitiesby 2004. Countries with less-developed ICT infrastructure and use emphasise the potential of ICTs foreconomic development. Poland anticipates that ICTs will help improve living standards and Hungarythat the National Information Society Strategy could lead to a substantial improvement in the country’sinternational ranking.
© OECD 2002

OECD Information Technology Outlook 2002
240
In addition, a number of countries have ambitious plans to become world players in variousaspects of IT and the knowledge economy and to improve their relative position. The Australian federalgovernment wishes to “build a leading role for Australia in the global information economy”. Canada hasthe goal of becoming “the world’s most connected country … and one of the top five countries forresearch and development by 2010”. Japan hopes to be “the world’s most advanced IT nation within fiveyears”, and the United Kingdom is working to ensure its position as a “world leader in the knowledgeeconomy revolution”.
Technology development
OECD countries view technology development as important, but ICT-specific policies in this areaare rarer than those for technology demand, diffusion and use. For technology development, OECDcountries identify four policy areas: R&D, government procurement, ICT for government use andventure finance. They see government support for R&D as a means to spur innovation that will havelarge spillover effects. Many see partnerships between government research centres, universities,industry and the private sector as an important way to increase the efficiency and effectiveness of R&Dand government support to R&D. Government procurement and development of ICTs for governmentuse receive somewhat less attention but are considered important for improving the provision ofgovernment services (e.g. electronic identity cards, electronic signatures, customer-focused services,on-line procurement). Finally, a number of countries emphasise developing adequate venture financesystems, most often to support ICT innovation in SMEs.
R&D
Most OECD countries have programmes to promote R&D in the ICT sector, but these are often part ofmore general programmes. For example, Austria does not explicitly promote R&D on ICT, but the amountof general R&D support allocated to ICT-related industries increased by 37% from 1999 to 2000, much
Table 1. Summary of OECD country IT policy responses
Note: Only policies listed in responses to the IT Outlook policy questionnaire are included. Other policiesmay also exist. The table does not suggest the relative importance of policies, either in terms ofgovernment direct expenditures, tax expenditures or their impact. The response from the EuropeanCommission is not included.
Source: OECD, based on responses from 21 OECD countries to the IT Outlook Policy Questionnaire.
Total number of country responses
General policies 20Policy environment and broad policy visions 20
Technology development 20R&D programmes 19Development of ICTs for government use 12Government procurement 11Venture finance 9
Technology diffusion 21Diffusion to individuals and households 20Diffusion to businesses 20Government services online 19SMEs 18Programmes to demonstrate benefits of IT use 17
IT environment 20Electronic settlement, authentication and security 19Intellectual property rights 14Standards 11
Globalisation 18International co-operation 17Trade and foreign direct investment 8
© OECD 2002
IT Policies
241
faster than overall business R&D funding. France raised by 50% funding for ICT in national science (Fondsnational de la science) and technological research (Fonds de la recherche technologique) programmes in 2001.
Countries are also implementing programmes to strengthen R&D through universities and othereducational and research institutions. Sweden has taken steps to foster co-operation betweenuniversities, industrial research institutes and businesses. Poland and Portugal stress the development/improvement of a high-speed computing and communications backbone for research institutions.Australia’s Innovation Plan includes the establishment of an ICT Centre of Excellence to build a criticalmass of first-class ICT research capability with high-quality ICT research skills at the postgraduate leveland from overseas and to improve commercial exploitation of ICTs and develop ICT networks and clusters.
Various ICT R&D programmes mention specific technologies: development of telecommunications(Slovak Republic), digital television applications (Belgium), electronic support for health services(Greece), teaching technologies (Italy), information-related home electric appliances (Japan), software(Switzerland) and nanotechnologies (United States).
Government procurement
Government procurement programmes seek either to develop ICT supply capabilities and procureICT goods at lower prices or to procure products on line to improve efficiency and transparency(e-procurement). Responding countries specifically mention procurement of ICT goods to developindustry capability and achieve lower prices for public sector IT purchases. Under the Procurement Act,Spain regulates government purchase of IT equipment, software and services. Since 1983 an inter-ministerial commission has overseen all aspects of government IT and computer-related purchases.
Among countries aiming to improve on-line government procurement, Italy has an e-procurementproject for rationalising expenditure which covers central and regional government administration. Mostresponding countries have programmes to overcome legal and security obstacles to e-procurementsystems, and pilot projects are under way in several countries.
Development of ICTs for government use
In the area of development for government use, most responding countries have programmes todevelop secure electronic identity, which could be used for e-commerce and for health and othergovernment service applications. Finland will introduce an electronic identity card so that people cando business with the civil service reliably and safely.
The development of electronic tax filing systems, especially for value-added tax, and better on-linetechnologies to serve citizens are also mentioned. In Greece, the Ministry of Finance and the GeneralSecretariat of Information Systems have promoted the development of electronic exchange of receiptsand, in particular, the electronic filing of value-added tax and personal tax statements.
Venture finance
Nine responding countries mention venture finance programmes, most commonly for funding ofsmall and medium-sized enterprise (SMEs). Australia has initiatives to improve access to equity capitalfor developing ICT SMEs. The Korean government operates the IT Venture Investment Mart to matchventure capital for promising ICT sector SMEs. In Mexico, the Foreign Commerce National Bankparticipates in risk capital funds for SMEs, and the Economic Secretary has developed commercialincubator organisations. In Belgium, the Walloon Region facilitates contacts between ICT companiesand risk capital. Countries also help to match SMEs and research institutions/universities with investors.France has a programme to improve partnerships between public research institutions and enterprisesthrough the sharing of information.
Technology diffusion
Technology diffusion receives most attention, particularly in terms of diffusion to individuals andhouseholds and to businesses, in order to increase ICT demand and use and spread network benefitsand externalities more widely. There is also a push for uptake of e-commerce in businesses and for
© OECD 2002
OECD Information Technology Outlook 2002
242
awareness and training programmes for SMEs. Programmes to demonstrate the benefits of IT use arealso important. These mostly involve connecting the government administration and providinginformation on the benefits of IT use. Government on-line services generally move towards makingmore services available, often with the aim of providing a single government portal to access allservices. Important reasons for governments to go on-line include a more customer-focused approach,more transparency, greater connectivity to citizens and putting tax procedures on line to increaseefficiency (see Chapter 6).
Diffusion to individuals and households
Most responding OECD countries mentioned policies for diffusion to individuals and households,often to increase access for particular groups: lower income, the young and elderly and minorities.Twelve countries mentioned programmes for community access centres, with examples such as tele-houses and communal establishments offering access to information, technological office equipment,computers, the Internet and related services. In Hungary, participation in the Tele-cottage Movement isstrong and gives people in small villages an opportunity to use ICTs. Programmes for Internet access inschools are also popular. In Switzerland, the “Public Private Partnership – School on the Web” project isdesigned to furnish Internet access in all primary and secondary schools and to train teaching staff touse ICTs adequately in everyday classroom work.
There are programmes to decrease the cost of equipment by fixing a maximum price, as in Spain,or by providing the equipment, as in the UK “Computers within Reach” initiative, which aims to provideup to 100 000 low-income families with recycled computers. Belgium seeks to raise demand for ICTsthrough dissemination of information.
Scandinavian countries tend to emphasise market mechanisms and private-sector initiatives tomeet the demand for and distribution of ICTs. Finland states that “the Finnish government does notdistribute directly or provide subsidies for purchase of technological equipment to individuals orhouseholds”. In Sweden, instead, policy emphasis focuses on developing broadband infrastructure forremote and rural areas that may not be served through market mechanisms.
Diffusion to businesses
Most OECD countries have ICT diffusion programmes to help improve business efficiency andcompetitiveness. They rely on provision of information and promotion of e-commerce (nine countrieseach). Several countries have also considered public-private partnerships. The Czech governmentemphasises such co-operation via the State Information Policy. Financial assistance for ICT use (in theform of subsidies or fiscal incentives) is considerably less common.
SMEs
Most countries have specific policies for diffusion to SMEs, although these are less common thanthose for diffusion to individuals and households and to businesses. The principal priorities areproviding information and advice regarding ICTs. The United Kingdom has a wide range of awareness-raising activities to encourage businesses to consider the implications of ICTs and to offer advice. InNorway, the VeRDI programme aims to increase awareness of and motivation for the adoption of ICTs, toprovide professional development knowledge (best practice) and to promote joint ventures andinfrastructure development.
Programmes to demonstrate benefits of ICT use
The most common programmes for demonstrating the benefits of ICT use involve government as amodel user, through the use of ICTs within government administrations. In Austria, the governmentplans to introduce electronic files in all ministries by 2003. In the Slovak Republic, central bodies of thestate administration already use Govnet, the government network, and there are plans to extend this
© OECD 2002

IT Policies
243
network to other public administrations and institutions. A smaller number of countries haveprogrammes for trial and demonstration of new applications, development of e-marketplaces andawareness programmes, such as the sharing of success stories.
Government services on line
The provision of government services on line has high priority in many OECD countries andcommonly passes through three stages of policy development. The first focuses on standardisation andco-ordination and makes some information and services available through on-line portals. In thesecond stage, governments provide a greater number of services on line and improve co-ordination ofinformation and services, for example through a single portal. Finally, all services are available througha single, easy-to-use government portal (see also Chapter 6).
In the Slovak Republic, the central bodies of the state administration and some publicadministrations have their own portals and provide information online. The Belgian BRIGIS projectshares geographical information online. In Switzerland, local, regional and federal administrations areworking to offer their services via a common portal, with services available as of early 2002. Thegovernment of Japan helps local governments to create local public networks by subsidising thebuilding of infrastructure for local intranets to improve local public services. The US Office ofManagement and Budget released its E-government Strategy, an action plan to make it easy for citizensand businesses to interact with the government, to save taxpayer money and to streamline business-to-government transactions. In Canada, the goal is for all Canadians be able to access all governmentinformation and services on line at the time and place of their choosing by 2004.
IT environment
All responding OECD countries have initiatives to foster a reliable and trustworthy environment forelectronic transactions and exchange, including measures for electronic settlement, authentication (seeBox 1), security, privacy protection and consumer protection, and currently the OECD Guidelines for theSecurity of Information Systems are being updated. Payment cards receive a fair amount of attentionand building trust is considered important. As the commercial value of ICT goods and services isrecognised, intellectual property rights are increasingly viewed as of key importance, and manycountries are reviewing their efforts in the areas of intellectual property rights and standards.
Electronic settlement, authentication, security, privacy protection and consumer protection
Of the 19 countries that gave examples of programmes for electronic settlement, authentication andsecurity, 14 cited legal and/or legislative initiatives. Laws on electronic signatures and certification weremost common. For example, in Japan, the Law Concerning Electronic Signatures entered into force in 2001and provides the legal basis for using electronic signatures as the equivalent of hand-written signatures.
Stakeholders in OECD Member countries have been active in developing initiatives to enhanceconsumer trust online, building on the principles articulated in the 1999 OECD Guidelines for ConsumerProtection in the Context of Electronic Commerce.
Eleven responding countries mentioned technical solutions for electronic settlement, authenticationand security. Austrian companies have introduced prepaid cards, which can be used anonymously, areindependent of a banking account and can be used for micro-payments on the Internet.
Slightly less common are programmes for developing trust, reassuring the public and other“soft trust” issues. In the United Kingdom, the Internet Watch Foundation was set up to reassure thepublic and business that the Internet can be a safe and secure place to work, learn and play. “Soft trust”programmes are most often combined with legal and/or technical programmes.
Intellectual property rights
Fourteen countries stressed the importance of intellectual property rights for encouraging thedevelopment and commercial exploitation of ICTs and enhancing the diffusion of knowledge regarding
© OECD 2002

OECD Information Technology Outlook 2002
244
Box 1. The Ottawa Declaration on Authentication for Electronic Commerce
The Declaration on Authentication for Electronic Commerce adopted by Ministers at the OttawaMinisterial Conference on 7-9 October 1998* recognised the importance of authentication for electroniccommerce. It outlined a number of actions to promote the development and use of electronicauthentication technologies and mechanisms, including continuing work at the international level,together with business, industry and user representatives.
In the Declaration, Ministers declared their determination to:– Take a non-discriminatory approach to electronic authentication from other countries.– Encourage efforts to develop authentication technologies and mechanisms, and facilitate the use
of those technologies and mechanisms for electronic commerce.– Amend, where appropriate, technology or media-specific requirements in current laws or policies
that may impede the use of information and communication technologies and electronicauthentication mechanisms, giving favourable consideration to the relevant provisions of theModel Law on Electronic Commerce adopted by the United Nations Commission on InternationalTrade Law (UNCITRAL) in 1996.
– Proceed with the application of electronic authentication technologies to enhance the delivery ofgovernment services and programmes to the public.
– Continue work at international level, together with business, industry and user representatives, onauthentication technologies and mechanisms to facilitate global electronic commerce.
Since the Ottawa Declaration, there has been progress on authentication for electronic commerce.Regarding the legal recognition of electronic signatures, 17 Member countries have amended technology-or media-specific requirements in current laws or policies, where appropriate, and have given legalrecognition to electronic signatures. Most other Member countries either have drafts of amendmentsready or work is under way. Continuing efforts in countries that are preparing legislation should beencouraged. Outreach in this area might also be provided to non-member countries.
Clauses of the UNCITRAL Model Law, such as those on “legal recognition”, “variation by agreement”and “court admissibility”, are commonly reflected in amendments of national legislation or regulations.Continuing efforts in countries that are preparing legislation should be encouraged. Outreach toencourage adoption of the Model Law in this area might also be provided to non-member countries.
Governments either express a non-discrimination policy or remain silent about nationality ofauthentication, and this is interpreted as being a non-discriminatory approach to foreign authentication.However, differences among countries in standards or schemes cause some concern for theinteroperability of electronic signatures and cross-certification of certification authorities (CAs). Thereseems to be a need for compatible approaches and policies among OECD Member governments andbusiness initiatives in order to ensure interoperability of electronic authentication systems in theinternational marketplace. To this end, Member governments may wish to consider how to developglobal, seamless authentication and certification mechanisms.
“Form requirements” are types of requirements in law that information, including signatures, bepresented in certain forms such as in writing or by use of a paper document. Form requirements are stillfound in many aspects of commercial activities and pose challenges for governments.
Developments in the application of authentication technologies to the delivery of governmentservices are encouraging, as almost all Member governments either have started initiatives to introduceelectronic measures for use in government services or plan to do so. Governments use electronicsignatures in their own services once they have enacted legislation giving legal recognition to electronicsignatures. While governments share the common goal of delivering government services electronically,the process of achieving that goal may differ, depending on the countries’ legal systems. Even thoughparty autonomy is ensured in commercial contracts, transactions with governments would most likelyrequire the use of “secure” electronic signatures or other legally specified signatures. Some governmentsreport their intention to accept only “secure” electronic signatures in transactions with government. Thismay not cause specific problems for the objective of promoting electronic services but may justify furtherefforts to establish the international interoperability of electronic authentication. Governments should beaware that even if laws do not explicitly reject the acceptance of electronic documents, the lack of properfacilities, equipment or other items may hinder use of electronic means.
In many Member countries, the legal basis for promoting the use of electronic means is still beingdeveloped. Work is continuing at international level to gather and exchange information and encourageefforts in this area.
* OECD Ministerial Conference “A Borderless World: Realising the Potential of Global Electronic Commerce”,7-9 October 1998 SG/EC(98)14/FINAL, available at: www.olis.oecd.org/olis/1998doc.nsf/linkto/sg-ec(98)14-final
Source: OECD 2001c.
© OECD 2002

IT Policies
245
inventions. The most common recent initiatives have been legislation for the protection of computerprogrammes and databases. In Japan and the United States, computer programmes and software,including business methods, can be patented. Software is not currently patentable in European Unioncountries, awaiting the results of a Commission proposal. A Polish act on copyright protection andrelated laws (1994) has a chapter protecting computer programmes as literary works, and in 2001 theparliament adopted a law on the protection of databases.
Several countries have attempted to increase incentives for ICT development, for example bypermitting researchers in universities and other institutions to receive revenue from their inventions. InItaly, modifications of the general regulations for industrial inventions aim to promote research byrecognising university inventors and giving them copyright and property rights linked to their inventionand a percentage of the proceeds from its industrial use.
Australia and Korea both have legislation that permits, yet limits, the reverse analysis of softwarein certain circumstances. Australia’s Copyright Act was amended to allow the reproduction of computersoftware in certain circumstances for the purposes of developing interoperable products, testingsecurity systems or correcting errors. Reproduction for the purpose of creating an interoperable productis only allowed where interface specifications are not readily available. More recent changes to theCopyright Act allow users to obtain, in certain circumstances, devices or services to circumventtechnology that would otherwise prevent the legitimate reproduction of software. The CopyrightAmendment Act 2000 entered into force in March 2001 and clarified the rights and responsibilities ofcopyright users and owners in the digital environment.
Other programmes mention measures to resolve domain name disputes, crackdowns on illegalcopying and public awareness and education.
Standards
Most responding OECD countries place high priority on the adoption of international standards.Australia states that “wherever possible, international standards are preferred” and “when there is nointernational standard, then a regional standard is preferred”. Only when there is no international orregional standard is a national standard developed. Canada and Finland, where ICTs are widely used,take an active interest in the formulation of international standards. Several countries mentionstandardisation programmes to enhance communication within the national government. InSwitzerland, the Reference Model for the IT Architecture of the Confederation serves as a basis for theelaboration and application of IT architecture and related standards. Architectural grids can be used asa planning aid and ensure compatibility within and between federal departments.
Globalisation and international co-operation
Fewer responses mention policies for globalisation, and the focus varies. Promotion of exports ismore common than programmes for foreign direct investment (FDI), and international regulatoryframeworks are also discussed.
Trade and foreign direct investment
Among programmes for trade and FDI, initiatives to promote exports focus on the provision ofinformation and participation in international expositions. Poland’s Communication Technology Systemof Export Promotion will integrate dispersed business information resources for Polish exporters andwill make them available through an Internet portal and a network of regional and local institutions.Australia operates an international network of offices in 108 cities in 63 countries and co-ordinatesAustralian national stands at more than 100 international trade exhibitions each year.
Promotion of ICT investment is also considered important. The Korean government has made a greateffort to attract foreign investment by dispatching investment missions, holding investment road showsand building up a database on foreign investment guidelines. It has also revised the TelecommunicationsBusiness Law to increase the limit on foreign investment in backbone telecommunications to 49%, and thegovernment-designated business market is now completely open to foreign investment.
© OECD 2002
OECD Information Technology Outlook 2002
246
International co-operation
Initiatives for international co-operation most often include multilateral agreements andparticipation in international organisations such as the World Trade Organisation (WTO), theInternational Telecommunication Union (ITU) and the Global Business Dialogue. European countriesgenerally mention participation in EU or e-Europe+ programmes. Other countries mention participationin the Asia-Pacific Economic co-operation (APEC) Forum and the Free Trade Area of the Americas(FTAA). A smaller number of countries mention programmes for bilateral co-operation.
Other areas
Countries were asked about areas of IT policy not covered by the questionnaire. Several countriescited programmes for benchmarking (United Kingdom) and minimising sector-specific legislation(i.e. leaning more and more on general competition and consumer protection legislation) andtechnological neutrality (Finland). Broadband policies were covered extensively (see Box 2), and policiesfor the software sector are also important (see Box 3).
Box 2. Broadband policies
The development of broadband access to the Internet is gaining increasing prominence in fields thatgo well beyond communications policy. One reason is the role advanced communication capabilitiesplay in generating higher growth in productivity rates, as well as new network-based economic activities.If new communication tools such as the Internet and wireless networks boosted growth in the latter half ofthe 1990s (see Chapter 1), then the next steps toward broadband access are of critical importance.
The limitations of local access networks are the current bottleneck to growth in the communicationssector and electronic commerce. These limitations are not only technological and are linked to theheritage of many decades of monopoly provision of access networks. Much can be done in manycountries to increase the pace at which broadband access becomes available and the quality of serviceoffered (not all broadband is equally broad) and to reduce prices.
Most OECD countries are working towards household and business access to network infrastructurewith high transfer capacity (broadband). While broadband policies were not explicitly mentioned in theOECD policy questionnaire, 14 out of 21 responding countries specifically refer to broadbandinfrastructure (supply) and applications (demand and use).
For example, a number of these countries mention action plans to address a wide range ofbroadband issues at national scale. The Canadian “National Broadband Task Force” was designed todevise a strategy to ensure the availability of broadband access in all Canadian communities by 2004.The Italian “Broadband Task Force” aims to evaluate the present situation of broadband developmentand to develop a government strategy to ensure its rapid growth. The Norwegian “Action Plan onBroadband Communication” encourages market competition and strengthens public demand forbroadband networks and services. The aim is to obtain favourable offers for making broadband availablein all parts of the country. In addition, all Norwegian primary schools, public libraries and local authorityadministrations should be offered broadband connections at competitive prices by the end of 2005, allsecondary schools by 2003 and all hospitals by the end of 2002. The Norwegian government will considerimplementing special measures in areas where market failures make broadband deployment impossibleat reasonable prices and within reasonable time. The government is also taking initiatives to promotecontent development and thus stimulate broadband demand.
Other countries emphasise stimulating competition, the development of broadband applicationsand the development of broadband infrastructure for the public sector, universities and research centres.
Source: OECD (2001d) and responses to the IT Outlook Policy Questionnaire.
© OECD 2002
IT Policies
247
Box 3. Policies for the software sector
The increasing ubiquity of ICT and the rapid growth of the software sector have led to increasinginterest in policies to support software production and use in OECD countries. Government policyinterest has been spurred by the rapid and dynamic growth of this sector and the impact of softwareinvestment and use on firm-level competitiveness and on its potential to produce economy-wideproductivity gains.
Since the very beginning of the industry, government software-sector policies have played animportant role, initially via defence procurement. Besides collaboration between defence and civilianresearch efforts in software and in computer science generally, co-operation between industry andacademia was also an important driver of early developments in the US software industry. For othercountries, it has been suggested that the lack of collaboration between military and civilian researchers inthe United Kingdom in the early post-war computer industry, and the modest role played by universitiesin computer science and software-related research activities in Japan may have significantly affected theevolution of their software sectors (Mowery, 1996).
Current government policies that address software may be viewed as supply side, as demand side oras affecting the general business environment. They may be domestic (education, R&D support) orinternational (trade-related) in scope.
Examples of software policies include those to promote software innovation and to leverageprocurement. For example, in Japan, the Ministry of Economy, Trade and Industry (METI) is encouragingsoftware developers to provide good programmes in important fields by commissioning developmentwork and holding public contests for creative software.
In Spain, the Government Procurement Act regulates government purchase of software, services andIT equipment from private sources. Since 1983 there has been an Inter-ministerial Commission for theAcquisition of Computer Goods and Services (CIABSI) which covers all technical aspects of government ITpurchases. CIABSI also defines government IT procurement policies and evaluates costs related totechnical assistance, maintenance and other variables. Framework contracts are widely used forprocurement of IT goods and services in the Swedish public sector. An agency buying services fortelecommunications, electronic commerce or equipment such as software or PCs that are covered by aframework contract can avoid the full procurement process by selecting a supplier from the availableframework contracts.
Because of interoperability and conversion difficulties, technical standards are very important to thesoftware industry. An increasing number of governments develop policies regarding such standards. InTurkey, the National Standards Institute, R&D institutes and some non-governmental organisationsmonitor the software area of the IT sector.
In Canada, the Telecommunications Standards Advisory Council of Canada (TSACC) is an industry-government partnership formed in May 1991 to develop strategic directions for standardisation ininformation technology and telecommunications. As such, it plays a central role in the design andimplementation of electronic commerce standards in Canada and internationally. TSACC working groupshave prepared the “Electronic Commerce Applications Roadmap” which addresses technology-enablingbusiness functions and related software.
Because most software is originally produced in English, English has come to be the de facto languagestandard for the sector. Some countries now have policies encouraging the development of software intheir native language. The Portuguese government has taken steps to launch an R&D programme onsystems processing of the Portuguese language. This programme is to be developed in partnership withPortuguese and foreign entities and will design and publish software for handling Portuguese in writtenand spoken form for use worldwide.
Source: OECD, based on responses to the IT Outlook Policy Questionnaire.
Software policies
Supply-side policies Demand-side policies Policies affecting the business environment
Research and development Government procurement Trade and foreign direct investmentIntellectual property rights Incentives for private sector use Competition policyStandards Training, information and awarenessIT professional skills
© OECD 2002
OECD Information Technology Outlook 2002
248
Policies for ICT skills
All OECD countries acknowledge the importance of a skilled workforce. While professional ICTskills are important for growth of industry in general, they are also increasingly needed throughout theeconomy (see Chapter 5). ICT skills have become a new type of “general” skill, like literacy or numeracy.Governments are implementing an array of policies targeting different segments of the population inorder to promote basic and advanced ICT skills (see Appendix Table A8.1). In some cases, governmentpolicies do not specifically target the development of IT skills but imply the need for them(e.g. e-learning, on-line job search).
Professional IT skills
A variety of programmes aim at strengthening the skills of current IT workers and/or developingfuture IT skills (with a particular focus on higher education). This also includes various programmes forincreasing the availability of IT professionals through other means, such as immigration.
General programmes
Some OECD countries have developed general programmes to co-ordinate their overall policy forprofessional IT skills. Examples include: overall co-ordinating mechanisms such as those found inAustralia (IT Skills Hub, ICT Taskforce) and Canada (Software Human Resource Council – SHRC);information portals such as the Australian IT Skills Hub; and surveys and other studies on skills shortages.
Programmes targeting current or potential IT workers
Governments currently focus on three main areas: certification, reskilling/training and immigrationpolicy.
Different certification programme schemes are being implemented in Portugal, Korea (with both apublic and a private system and currently about 1 million certificate holders); Mexico (NationalCouncil of Accreditation in Informatics and Computers – CONAIC); Austria (Public Employment ServiceAustria – AMS); and Japan (IT Engineers Examination, IT Co-ordinator certification). In addition, variousOECD countries are adopting programmes to classify and define specific sets of ICT skills: Australia,Poland, Canada (Employability Skills 2000+) and Japan (Skill Standard).
There are continuing education and training courses for ICT professionals in Spain, Belgium, Italy(financed by payroll taxes), Sweden (SwIT), Finland, the United Kingdom (University for Industry – UfI),and Austria (tele.soft). Other programmes focus on retraining, skills updating and lifelong learning: Italy,Norway, Poland (Strengthening the Lifelong Education System), Austria and Greece. In Belgium(Walloon Region), an “E-business management” accreditation scheme has been set up. Sweden has anIT competence-enhancing programme for SMEs. Belgium (Brussels Regional Office for Employment,ORBEM), Australia and Canada (SkillNet) have schemes for employment assistance and labour marketinformation.
As shown in Chapter 5, OECD countries use a variety of immigration-related policies to attractskilled foreign IT professionals. Australia has policies directed towards foreign students, priority to ICTprofessionals seeking immigration status and ICT occupations recognised as “key”, while Norway hassimplified the recruitment of IT professionals from outside the European Economic Area (EEA).
Programmes targeting students
The main goals of programmes targeting students are to provide financial support to students orschools specialising in IT, to increase the pool of IT students and to establish stronger links betweenindustry and learning institutions.
These programmes may take the form of scholarship/loan programmes for post-secondary andtertiary education, as in Portugal, Australia (the Postgraduate Education Loans Scheme – PELS) andKorea (overseas scholarship programme). They may also take the form of financial support toeducational institutions specialising in ICT, as in Korea. Increasing participation in IT courses is also
© OECD 2002
IT Policies
249
considered important, and Sweden, Finland, and Austria (IT4U) have such programmes. Belgiumencourages female participation through its “Electronica” project. There is also emphasis on buildingcloser school/industry links, especially in Australia (Science Lectureship Initiative), Canada (National ITYouth Internship programme, e-commerce research centres at universities) and Spain (adaptingcurricula to industry requirements).
Basic IT skills
General programmes
A wide range of tools are used to develop basic IT skills (“IT literacy”) across the population.Formal IT certification is the most widespread mechanism for recognising basic and intermediate ITskills. The European Computer Driving License (ECDL) and the International Computer Driving License(ICDL) promote industry-standard IT skills and are granted in more than two-thirds of all OECDcountries (www.ecdl.com). Similar programmes exist in Portugal (Basic IT Skills Diploma), Spain, Belgiumand Hungary (promoting participation in the ECDL), Finland (where 100 000 persons have passed theA-level examination of the Computer Driving License), Austria (supporting the ECDL), Canada(CanConnect Skills Certificate for K-12 youth) and Greece (through Operational Programme InformationSociety – OPIS).
Focus on schools
The development of basic IT skills through schools is especially emphasised. Governmentsidentify three main objectives for IT in schools: increasing the availability of IT equipment, promoting ITtraining/certification for teachers and expanding the teaching of IT in the school curriculum.
Many countries have programmes for expanding infrastructure/access in schools: Spain, Belgium(PC/KD in Flanders, “cyberschool” in the Walloon region), Sweden (National Action Programme for ICTin Schools – ITiS), Finland (through the National Board of Education), Australia (“Computers for Schools”for channelling surplus Commonwealth computers to schools), the United Kingdom, Poland(Inter@klasa), Hungary (Sulinet programme), Mexico (RedEscolar) and Austria (pilot project “NotebookClass”). In addition, Belgium (Belgacom I-Line), Sweden (ITiS), France and Australia have schemes forproviding schools with low-cost Internet access.
IT training programmes for teachers are in place in Italy, Sweden, Finland (the OPE.FI project withthree ICT skill levels), Norway, Australia (DETYA), Poland (Inter@klasa), Portugal, France and Austria.Australia also offers IT certification for teachers (ICT Competency Standards for Teachers).
Spain, Finland, France and Korea (“Guidelines for ICT Utilisation in Elementary and MiddleSchools”) have programmes for increasing the teaching of ICT skills in school curricula.
Other initiatives
This section notes initiatives in which developing IT skills is not necessarily the primary goal, butnonetheless constitutes an important component of the programme. The first set comprises thosetargeting specific social groups, while the second includes those which use ICT as a tool to promoteother socio-economic goals.
Targeting specific social groups
A number of programmes target specific social groups, such as: women (efforts to increaseenrolment in S&T higher education in Norway); citizens with special needs/disabilities (Portugal,Sweden); young people (such as the Portuguese Millennium Generation Programme targeting childrenaged 10-18); and senior citizens (such as the “ICT week for seniors” in Belgium or the NorwegianSeniornett association).
© OECD 2002

OECD Information Technology Outlook 2002
250
Other programmes focus on: the unemployed (an Italian programme aimed at young persons in theSouth with a focus on new technology literacy, a Swedish programme emphasising raising IT skills withinadult education programmes, training programmes by the National Labour Market Board and Computer/Activity Centres); socially disadvantaged students (such as the Australian “Effective Use of ICT”programme); and indigenous populations (such as the Australian Indigenous Online Network – ION).
As for public servants, Portugal offers courses at the National Institute of Administration whichtarget local government, Italy focuses on assessing the training needs of local and regionaladministrations, the United Kingdom directs attention to skills for e-government and Austria promotesthe ECDL among civil servants.
In addition, a number of programmes promote overall diffusion. The Spanish “Internet Access forCitizens” programme promotes access for the handicapped and rural communities. The Norwegianprogramme “ICT for Everybody” also promotes overall diffusion. Community learning centres, such asthe Hungarian “MultiCentres” also have this goal.
Using ICT tools to promote other goals
ICT can also be used as a tool to promote goals such as employment, education and research. It canalso be used to raise general awareness of the benefits of ICTs.
For example, in Belgium a database with job vacancies is maintained by the Flemish Service forEmployment and Vocational Training, and job training is provided by the Public Service forEmployment – Forem. There are programmes for e-learning in Belgium (Technifutur in the Walloonregion), Finland (virtual schools), the United Kingdom (National Grid for Learning, learndirect), Hungary(Internet tele-teaching), Korea, Mexico, Canada (Advisory Committee for Online Learning) and Greece(tele-training). Austria has developed an education portal. ICTs are being used to improve Universityresearch networks in Belgium (“VirtUE” – Virtual University for Europe) and Hungary (UNIWORLDnetwork).
Policies to address the digital divide
Most OECD countries have sought to address the digital divide in order to spread the benefits ofICT use more widely. There are a number of ways to help turn the digital divide into a digitalopportunity. While fostering a healthy ICT environment will help allow national ICT industries toflourish, both general and specific policies are needed to target specific groups and goals. Internationalinitiatives allow countries to learn from the experience of others.
Policies and programmes to reduce the digital divide
A healthy environment for ICT investment and use is necessary (including competitive networkinfrastructure, competition policy, consumer protection, security and privacy, protection of IPR andtechnical standards), but it may not suffice to bridge the digital divide. The rationale for more specificprogrammes and policies is the social benefits to be gained from the wide diffusion of ICTs throughoutthe economy and society owing to efficiency gains, large spillovers and positive externalities,improvements to the skill base and equity considerations. Furthermore, because of the large networkeffects associated with ICTs, general efficiency and multiplier effects are associated with diffusing ICTsmore widely and raising ICT skills throughout the economy.
Countries have identified six areas of particular importance for reducing the digital divide: networkinfrastructure, diffusion to individuals and households, diffusion to businesses, IT education andtraining initiatives, government projects and international co-operation. Table 2 summarises the broadpattern of policies in 22 OECD countries.
Network infrastructure policies aim mainly at enhancing competition, but development of basicand broadband infrastructure are also considered important. All responding countries have policies fordiffusion to individuals and households and to businesses. Government projects are important,
© OECD 2002

IT Policies
251
particularly as model users of IT and through provision of government services on line. Internationalco-operation is emphasised somewhat less, with multilateral co-operation significantly more importantthan bilateral programmes (OECD, 2002b).
Policy emphasis across countries
The high response rate and very high quality of responses to the digital divide questionnaire allowfor additional analysis. This section divides OECD countries into five groups (English-speaking,northern European, European, Asian and other) in order to examine common patterns. While mostcountries have policies covering most or all policy areas, the emphasis differs among the groups.Table 3 summarises these differences, and examples are given in Appendix Table A8.2 (for furtherdetails, see OECD, 2002b).
Table 2. Summary of OECD country digital divide policy responses1
1. The table is not exhaustive; additional policies may exist but may not have been included in the response.The table does not measure the relative importance of policies, either in terms of direct governmentexpenditure, tax expenditures or policy impact. The response of the European Commission is not included.
Source: OECD, based on country responses to the Digital Divide Policy Questionnaire.
Total number of country responses
Network infrastructure 21Regulatory initiatives to enhance competition 20Basic infrastructure development 14Broadband infrastructure development 14
Diffusion to individuals and households 22Access through schools 20Access through other public institutions 19Access in rural/low income areas 16IT for the elderly/disabled 14Content creation to stimulate use of Internet 12Diffusion of IT equipment to individuals 11Other programmes to lower costs of IT 10Demonstration and awareness programmes 9Programmes to increase demand for IT 8Subsidies of IT equipment and/or services 7
Diffusion to businesses 22Support and training for SMEs 20Diffusion of information 17Assistance to regions and rural areas 13Encouragement of high-tech start-ups 12
IT education and training initiatives 22IT education in schools 22Vocational training 21Teacher training 19Lifelong learning 15Distance learning 13IT certification 13
Government projects 20Government provision of services on line 18Governments as model users of IT 18Foster R&D and applications to improve access 9
International co-operation 16Multilateral co-operation [EC, UN] 16Bilateral programmes 7
© OECD 2002

OECD Information Technology Outlook 2002
252
English-speaking
English-speaking countries (Australia, Canada, the United Kingdom, the United States) haverelatively high ICT penetration rates and focus relatively more on market mechanisms to bridge thedigital divide. Government initiatives are sometimes also employed to increase access to ICTs whenmarket mechanisms do not appear sufficient. For example, remote and rural areas may need assistanceif they are to attract investment in ICT infrastructure. Governments in these countries have usede-government initiatives to improve government’s efficiency at delivering information and services tocitizens and to demonstrate use of the technology.
Europe
These countries strongly stress equality of access to ICTs. They emphasise IT training andeducation and support for SMEs to improve economy-wide, egalitarian access. These countries can befurther divided into countries with higher and lower levels of IT penetration. Countries with higher ITpenetration in northern Europe (Finland, the Netherlands, Norway, Sweden) focus in addition onencouraging high-technology start-ups and, like the market-led approach, emphasise regulatoryinitiatives to enhance competition. In contrast, countries with somewhat lower penetration (Austria,Belgium, France, Italy, Switzerland) focus relatively more on access through schools and other publicinstitutions.
Asia
Responses from Asian countries (Japan, Korea) put policy emphasis on ICTs for the disabled andelderly, as well as on education and training and access through schools and other public institutions, tocomplement the firm-based approach to economic adjustment for workers and businesses. Disabledand elderly individuals find it particularly difficult to take advantage of new technologies, as they aregenerally excluded from the firm-based adjustment processes. More recently, Japan and Korea havesystematically implemented broad strategies for IT policies.3 New priorities include promotion of high-speed Internet infrastructure, digitalisation of school education and reinforcement of human resources,enhancement of network content, promotion of electronic government and reinforcement ofinternational activities.
Other countries
“Other” countries generally have lower IT penetration and use rates, although almost all haveadopted pro-competitive liberalisation policies for network infrastructure. Among OECD countries, onlyHungary, Poland, the Slovak Republic and Turkey were still planning or had not yet fully liberalisednetwork infrastructure as of early 2001 (OECD, 2001d). Responding countries in this group (the
Table 3. Comparative policy emphasis by groups of OECD economies
Note: Most countries have policies covering most or all policy areas, the table shows relative emphasis.Source: OECD, based on responses to the Digital Divide Policy Questionnaire.
English speaking
Northern Europe
Europe Asia Other
E-government initiatives, widespread XInfrastructure development in disadvantaged areas XCompetition X XSMEs X XEducation and training X X X XAccess through schools and other public institutions X XAccess for the elderly/disabled XGovernment network coordination/Early on-line X
© OECD 2002

IT Policies
253
Czech Republic, Greece, Hungary, Mexico, Portugal, Spain, Turkey) focus largely on education and onon-line provision of selected government services to help provide a wider base for ICT use. Manyaspects of education are considered essential, with particular emphasis on vocational training andtraining in schools. Programmes also include efforts to consolidate government administration andprovision of government services in one network.
International initiatives
In addition to national initiatives, international initiatives seek to ensure more universal access toICTs and reduce the digital divide. These include work by APEC, the G8 DOT Force initiative, theCommonwealth, Summit of the Americas, the UN System and especially its high-level ICT Task Force,the World Bank, the Digital Bridges Task Force (GBDe) and the Global Digital Divide Task Force (WEF).The OECD has been and remains involved in a number of these initiatives, in part through outreach toshare widely the lessons learned in OECD countries.
Conclusion
OECD countries increasingly view IT policy as a means to enhance and spread economic growth.Almost all responding OECD countries have a broad policy vision for IT, and all have a mix of specificpolicies and programmes for addressing aspects of IT development, IT diffusion, the IT environmentand/or globalisation with increasing emphasis on demand and diffusion policies. Additionally, a largenumber of countries emphasise improvement of IT skills and the digital divide.
© OECD 2002

OE
CD
Inform
atio
n Tech
nolog
y Ou
tlook 20
02
254
© O
EC
D 2002
ills
Other policies/immigration
C ment ard skill ns
asurement tools
Expand model of temporary workers from software to other sectors
the acquisition tial skills
Facilitate hiring of foreign nationals to faculty positionsInvolve industry sector councils in implementation of new approach to selection and recruitment of foreign workers
E
chool curricula ays of learning
Ts
G
H
I
APPENDIX
Table A8.1. Examples of policy actions and recommendations for building ICT sk
Body Report/programme TargetSkills
IT professional Basic IT General
anada Expert Panel on Skills
Stepping Up: Skills and Opportunities in the Knowledge Economy
Government Developof standdefinitioand me
Educational institutions
Review apprenticeship programmes with industry partners
Ensure current teachers have up-to-date skills
Measureof essen
Industry
uropean Union European Commission
e-Europe 2000: An Information Society for All
Government European diploma for basic IT skills
Educational institutions
Connecting schools, incentives for teachers to use IT
Adapt sto new wusing IC
Industry Accelerate development of e-commerce
Promote IT training
reece Government Operational Programme Information Society
Close the skills gap by combining advanced ICT skills training and “on-the-job” training for 10 000 persons (2001-02)
Certification of qualifications in basic IT skills for 40 000 people (2001-02), focusing on unemployed
ungary Government Sulinet (Schoolnet) programme
Providing primary and secondary schools with Internet access and making IT an important feature of teacher training
reland Expert Group on Future Skills Needs
Report on e-business skills
Government Work with educational institutions to develop e-business programmes
Educational institutions
Promote e-business degrees
Update skills of business school faculty
Industry Promote a second level of common ICT skills

IT P
olicie
s
© O
EC
Table A8.1. Examples of policy actions and recommendations for building ICT skills (cont.)
Other policies/immigrationGeneral
Use of ICTs to promote job opportunities in Ireland to non-residents
More flexible working arrangements and non-pay incentives
Revise regulations to simplify the recruitment of skilled workers from countries outside the EEA
255
D 2002
Body Report/programme TargetSkills
IT professional Basic IT
Expert Group on Future Skills Needs
Second Report Government Monitor recommendations of First Report (1998)
Educational institutions
Increase numbers in accelerated technician programmes in computer science
Awareness campaigns
Industry Support to train workers
Norway Ministry of Education, Research and Church Affairs
ICT in Norwegian Education: Plan for 2000-03
Government and educational institutions
Report has been commissioned on the need for ICT competencies in the years to come
Funding of the Seniornett programme to provide older people with opportunities to develop ICT skills
Government All stakeholders
Within the Competence Reform framework (for lifelong learning), a project on “ICT for Everybody” will be established
Spain Ministry of Labour and Social Affairs
Government and industry associations
Training programmes for IT workers
Ministry of Science and Technology
FORINTEL Continuing education courses for ICT sector workers
Encourage acquisition of basic IT skills by all citizens, focusing on disadvantaged groups (handicapped, immigrants, long-term unemployed)
Sweden Government Bill 1999/2000:86 (in Ministry of Industry, Employment and Communications, 2000)
Government Analysis of women’s use of IT
Educational institutions
Royal Institute of Technology to launch an IT University, development of a competence centre for Internet technology
Continue special IT programme for schools (ITiS)
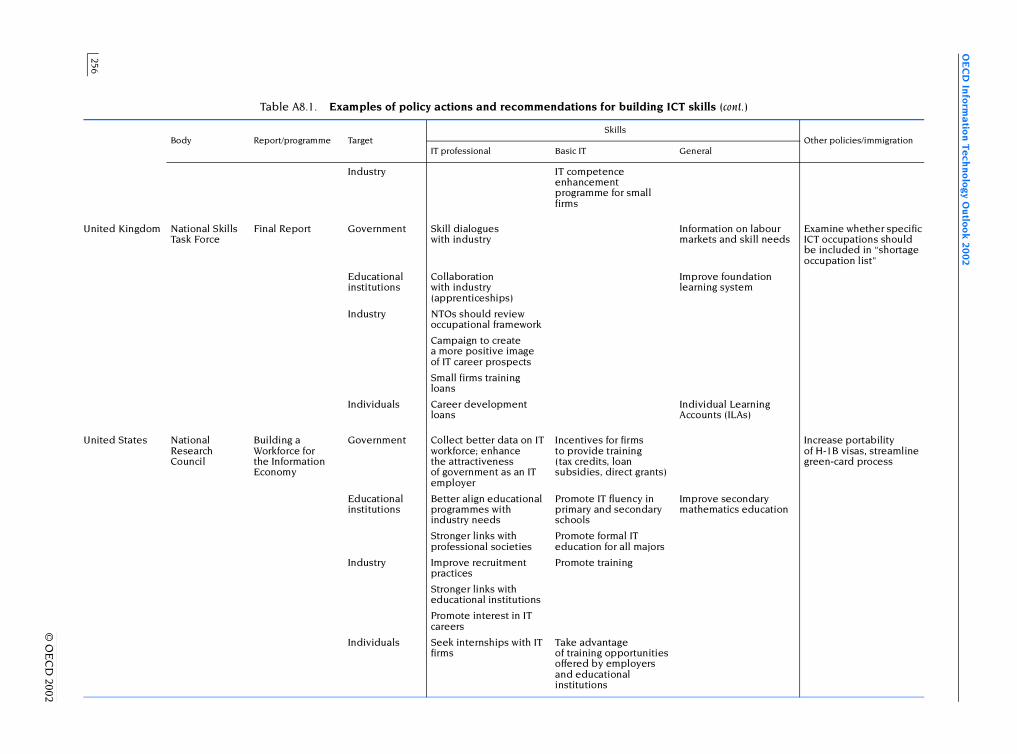
OE
CD
Inform
atio
n Tech
nolog
y Ou
tlook 20
02
256
© O
EC
D 2002
(cont.)
Other policies/immigration
U tion on labour and skill needs
Examine whether specific ICT occupations should be included in “shortage occupation list"
foundation system
al Learning s (ILAs)
U Increase portability of H-1B visas, streamline green-card process
secondary atics education
Table A8.1. Examples of policy actions and recommendations for building ICT skills
Body Report/programme TargetSkills
IT professional Basic IT General
Industry IT competence enhancement programme for small firms
nited Kingdom National Skills Task Force
Final Report Government Skill dialogues with industry
Informamarkets
Educational institutions
Collaboration with industry (apprenticeships)
Improvelearning
Industry NTOs should review occupational framework
Campaign to create a more positive image of IT career prospects
Small firms training loans
Individuals Career development loans
IndividuAccount
nited States National Research Council
Building a Workforce for the Information Economy
Government Collect better data on IT workforce; enhance the attractiveness of government as an IT employer
Incentives for firms to provide training (tax credits, loan subsidies, direct grants)
Educational institutions
Better align educational programmes with industry needs
Promote IT fluency in primary and secondary schools
Improvemathem
Stronger links with professional societies
Promote formal IT education for all majors
Industry Improve recruitment practices
Promote training
Stronger links with educational institutions
Promote interest in IT careers
Individuals Seek internships with IT firms
Take advantage of training opportunities offered by employers and educational institutions

IT P
olicie
s
© O
EC
Table A8.1. Examples of policy actions and recommendations for building ICT skills (cont.)
Other policies/immigrationGeneral
Facilitate transition of students applying for H-1B visas; raise employer fees for visa petitions (which are then used for education and training programmes)
257
D 2002
Source: OECD based on replies to Information Technology Outlook 2002 policy questionnaire and other sources.
Body Report/programme TargetSkills
IT professional Basic IT
21st Century Workforce Commission
A Nation of Opportunity
Government Implement tax credit for IT skills training for firms
Educational institutions
Making IT curriculum more relevant to industry needs
Offer teachers work experience opportunities in IT firms
Industry Partnerships with teaching institutions

OECD Information Technology Outlook 2002
258
Table A8.2. Digital divide policy examples by groups of OECD economies
General models and countries Emphasis Examples
English speaking countries (Australia, Canada, United Kingdom, United States)
Regulatory initiatives to enhance competition
In Canada, Internet access is provided through a variety of technologies– wireline, wireless, and high-speed cable modems. Pro-competitivepolicy and regulatory frameworks have clearly helped lower pricesand increased choice.The United Kingdom gives highest importance to regulatory initiativesto enhance competition. This includes progress on local loopunbundling to increase competition in the DSL market, actionon competitiveness of dial-up access to the Internet and currentconsultation on competition for leased lines.The United States promotes greater access to telecommunicationsand information technology tools through policies promotingcompetition among telecommunications and information servicesproviders. Competition among telecommunications service providersand hardware and software manufacturers has generated lower pricesand spurred innovation, resulting in greater access to computers andthe Internet.
Infrastructure development in rural, remote and low-income areas
The Australian Networking the Nation (NTN) initiative is anAUD 421 million programme designed to assist the economic and socialdevelopment of non-metropolitan Australia by funding projects thatenhance telecommunications infrastructure and services, by promotingservices and access to the network, and by reducing disparities inaccess to services and facilities.In June 2001 the Canadian National Broadband Task Force released itsreport, The New National Dream: Networking the Nation for Broadband Accessand provided recommendations to the Government of Canada on howbest to make high-speed broadband and Internet services availableto all Canadian communities by the year 2004.In the United Kingdom, measures include a fund for RegionalDevelopment Agencies and devolved administrations to help roll outthe broadband in rural/less commercially attractive areas.The United States Rural Utilities Service Telecommunications Program(RUS) provides funding for advanced telecommunications infrastructurein rural America. RUS finances local exchange, mobile and broadbandservices.
E-government initiatives The Australian government has a commitment that the Commonwealthwill bring all appropriate services on line via the Internet by 2001. The“Government Online” strategy outlines a whole-of-governmentapproach to moving information and services on line based on agencyaction plans and reporting framework.Canada’s “Government Online” initiative hopes to make the Canadiangovernment the most electronically connected to its citizensin the world by 2004, with Canadians able to access federal informationand services on line when and where they choose.The United Kingdom aims to have all government services on lineby 2005 (42% of services are already on line). The UK on-line citizensportal is a one-stop portal for all on-line government services, packagingservices around “life events” such as moving house or having a baby.The United States “E-government” initiative is a government-wideproject aimed at revolutionising how the public interacts withgovernment as well as streamlining the way government conductsits business. Federal agencies will help citizens gain one-stop, on-lineaccess to existing government information and services, and providebetter, more efficient government services through new technology.
© OECD 2002

IT Policies
259
Table A8.2. Digital divide policy examples by groups of OECD economies (cont.)
General models and countries Emphasis Examples
Northern European countries (Finland, Netherlands, Norway, Sweden)
Regulatory initiatives to enhance competition
One key element of the Finnish government’s policy to preventalienation has been to promote competition in the information industry.The government has liberalised telecommunication markets since themid-1980s. This has supported both the fast growth of the ICT sector andlower prices of telecommunication services for consumers.A primary measure to reduce the digital divide in the Netherlandsinvolves the accelerated liberalisation of network telecommunicationsectors. This includes unbundling of the local loop.Measures to foster competition have high priority in Norway.The Norwegian government believes that it is essential to developbroadband networks and that a basic prerequisite for these networks isthat the market players must be responsible for developingthe necessary infrastructure. The government is therefore preparing tostimulate competition through measures that create suitable conditions.This is expected to lead to lower prices and the development of moreand better products for users. Measures include the implementation ofsuitable regulations with the aim of rapidly establishing a digital TVnetwork, review of the access to Telnor’s network, including currentpractice regarding the delivery of dark fibres, the awarding of licensesfor third-generation mobile systems, and the publishing of reports onprice and competition factors in the market, including an index showingprice developments in the area of infrastructure.
Support and training for small and medium-sized enterprises (SMEs) and high-technology start-ups
The Finnish Information Society Advisory Board has proposedcounselling and support measures to emphasise the readiness of SMEsto utilise information and communications technology in developingtheir operations.The Netherlands gives priority to the creation of a favourable climate forstart-ups and the development of innovative companies, particularlySMEs. There are initiatives to stimulate enterprise in education, removeconstraints for fast-growth companies, and reform bankruptcy law. Thereis a programme for knowledge transfer to SMEs, and a 0.15% reduction incapital tax.Norway has launched a national programme focusing on SMEs (VeRDI).The programme, launched in March 2001, will strengthen thecompetitiveness and profitability of SMEs by increasing awareness andknowledge/understanding of e-commerce. SMEs, industries and valuechains (i.e. meeting new market conditions), women (into e-business)and districts are target groups. The Swedish SVEA programme provides information to SMEs, an ITcompetence enhancement programme for small businesses, and manyregional and local projects. Through technical parks and universities,there is also encouragement of high-tech start-ups.
Education and training In Finland, the development of hardware, software and networkconnections in educational institutions will continue.In the Netherlands, a number of education and training initiatives areaimed at living and working in the information society. These includeinitiatives to increase the annual per capita investment in humancapital, improve starting qualifications for 18-24 year olds, theconversion of education and training institutes into local learningcentres, initiatives for lifelong learning, and increased mobilityfor students, teachers and researchers.Norway has a large number of programmes for IT education and training.These include pilot projects in some counties in order to gainbroadband experience, the development of multimedia-based teachingaids, information and knowledge bases and multimedia-basededucational opportunities, developing teachers’ IT competence and anational learning network for the education sector. The CompetenceReform is the prime policy framework for lifelong learning. Within thereform, a separate project is to be established under the working title“ICT for Everybody”. The project aims at raising the general awarenessand knowledge of ICT among adults and avoiding new divides betweenthose who use ICT and those who do not. Introduction to writingand arithmetic are essential elements along with a guide tothe utilisation of Internet-based services such as on-line banking. ACD-ROM will be produced and distributed through the public librarysystem.The 1998/1999 SITE study showed that teachers thought they hadsufficient basic IT, but seemed to lag behind in terms of their teachingpractice.Sweden has a number of IT education and training initiatives, includingspecial IT-programmes for schools, IT training for the unemployed,development of IT competence in working life, and municipal initiativesfor schools in rural areas.
© OECD 2002
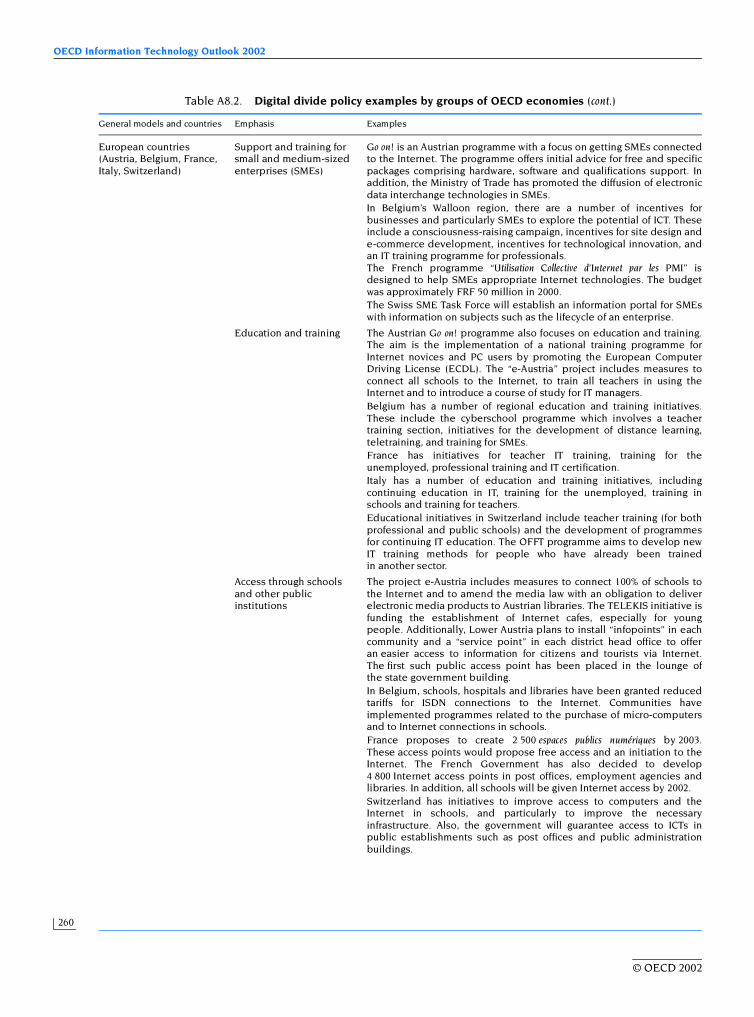
OECD Information Technology Outlook 2002
260
Table A8.2. Digital divide policy examples by groups of OECD economies (cont.)
General models and countries Emphasis Examples
European countries (Austria, Belgium, France, Italy, Switzerland)
Support and training for small and medium-sized enterprises (SMEs)
Go on! is an Austrian programme with a focus on getting SMEs connectedto the Internet. The programme offers initial advice for free and specificpackages comprising hardware, software and qualifications support. Inaddition, the Ministry of Trade has promoted the diffusion of electronicdata interchange technologies in SMEs.In Belgium’s Walloon region, there are a number of incentives forbusinesses and particularly SMEs to explore the potential of ICT. Theseinclude a consciousness-raising campaign, incentives for site design ande-commerce development, incentives for technological innovation, andan IT training programme for professionals.The French programme “Utilisation Collective d’Internet par les PMI” isdesigned to help SMEs appropriate Internet technologies. The budgetwas approximately FRF 50 million in 2000.The Swiss SME Task Force will establish an information portal for SMEswith information on subjects such as the lifecycle of an enterprise.
Education and training The Austrian Go on! programme also focuses on education and training.The aim is the implementation of a national training programme forInternet novices and PC users by promoting the European ComputerDriving License (ECDL). The “e-Austria” project includes measures toconnect all schools to the Internet, to train all teachers in using theInternet and to introduce a course of study for IT managers.Belgium has a number of regional education and training initiatives.These include the cyberschool programme which involves a teachertraining section, initiatives for the development of distance learning,teletraining, and training for SMEs. France has initiatives for teacher IT training, training for theunemployed, professional training and IT certification.Italy has a number of education and training initiatives, includingcontinuing education in IT, training for the unemployed, training inschools and training for teachers.Educational initiatives in Switzerland include teacher training (for bothprofessional and public schools) and the development of programmesfor continuing IT education. The OFFT programme aims to develop newIT training methods for people who have already been trainedin another sector.
Access through schools and other public institutions
The project e-Austria includes measures to connect 100% of schools tothe Internet and to amend the media law with an obligation to deliverelectronic media products to Austrian libraries. The TELEKIS initiative isfunding the establishment of Internet cafes, especially for youngpeople. Additionally, Lower Austria plans to install “infopoints” in eachcommunity and a “service point” in each district head office to offeran easier access to information for citizens and tourists via Internet.The first such public access point has been placed in the lounge ofthe state government building.In Belgium, schools, hospitals and libraries have been granted reducedtariffs for ISDN connections to the Internet. Communities haveimplemented programmes related to the purchase of micro-computersand to Internet connections in schools.France proposes to create 2 500 espaces publics numériques by 2003.These access points would propose free access and an initiation to theInternet. The French Government has also decided to develop4 800 Internet access points in post offices, employment agencies andlibraries. In addition, all schools will be given Internet access by 2002.Switzerland has initiatives to improve access to computers and theInternet in schools, and particularly to improve the necessaryinfrastructure. Also, the government will guarantee access to ICTs inpublic establishments such as post offices and public administrationbuildings.
© OECD 2002

IT Policies
261
Table A8.2. Digital divide policy examples by groups of OECD economies (cont.)
General models and countries Emphasis Examples
Asian countries (Korea, Japan)
IT for the elderly and disabled
In October 1998, the Japanese Ministry of Posts andTelecommunications established a set of guidelines for accessibilityto telecommunications equipment for the elderly and people withdisabilities. These guidelines address functions required oftelecommunications equipment in order for the elderly and disabled tobe able to use telecommunications services smoothly.Korea has a number of projects for the development and diffusion oftechnologies for the disabled. This includes KRW 20 billion for thedevelopment of digital TV for the blind and deaf, KRW 700 million forthe development of a personal digital assistant for the blind,KRW 300 million for the development of a Web site portal for the blind,and KRW 200 million for the development of a screen keyboard forthe physically handicapped.
Other countries (Czech Republic, Greece, Hungary, Mexico, Portugal, Spain, Turkey)
Government network co-ordination and early on-line services
The Czech Republic has plans for the implementation of a publicinformation system, and the electronic launching of selected stateadministration services by the year 2002.In Greece the important programme named ARIADNI (2000-06) focuseson the improvement of public administration services in the regionaland central municipalities, including the use of Internet for mosttransactions and communication with the central services. “ASTERIAS” isa part of “ARIADNI” for the islands and has been completed. On the siteof the Ministry of the Aegean (www.ypai.aegean.gr), 207 proceduresinvolving the public administration are already provided. The Ministryof the Interior, Public Administration and Decentralisation is making300 more available.The Hungarian Division of e-government is developing projects onelectronic service delivery to the citizens and modernising the workprocedures of the public administration. A number of Mexican government services are now available on line,including an electronic system for government purchases, an electronicdeclaration of patrimonial goods for public servants and a Mexicanenterprise information system.The Portuguese Internet Initiative comprises a series of measuresregarding the use of the Internet by the public administration and bythe citizens in their interface with the public services. The goals are tohave all official forms available on the Internet in 2002, to makeelectronic submission of all official forms possible in 2003 and to haveall public services on line by 2005.There are a number of programmes to increase the presence of thegovernment services on the Internet in Spain. Efforts are being directedto developing a single portal for the administration and to implementcommon Web procedures for all ministries. The priorities are:development of a single portal for the administration, a single point ofaccess to public services, an on-line public health system, developmentof legislation regarding new technologies and on-line information ontourism and the country’s image.In Turkey, all legislative and executive actions and all public tenders arebeing published on the “Official Journal Information System” and areavailable to the public via the Internet. In the project “Informationsystem of current laws” all Turkish laws are updated and publishedelectronically and are available via the Internet.
© OECD 2002
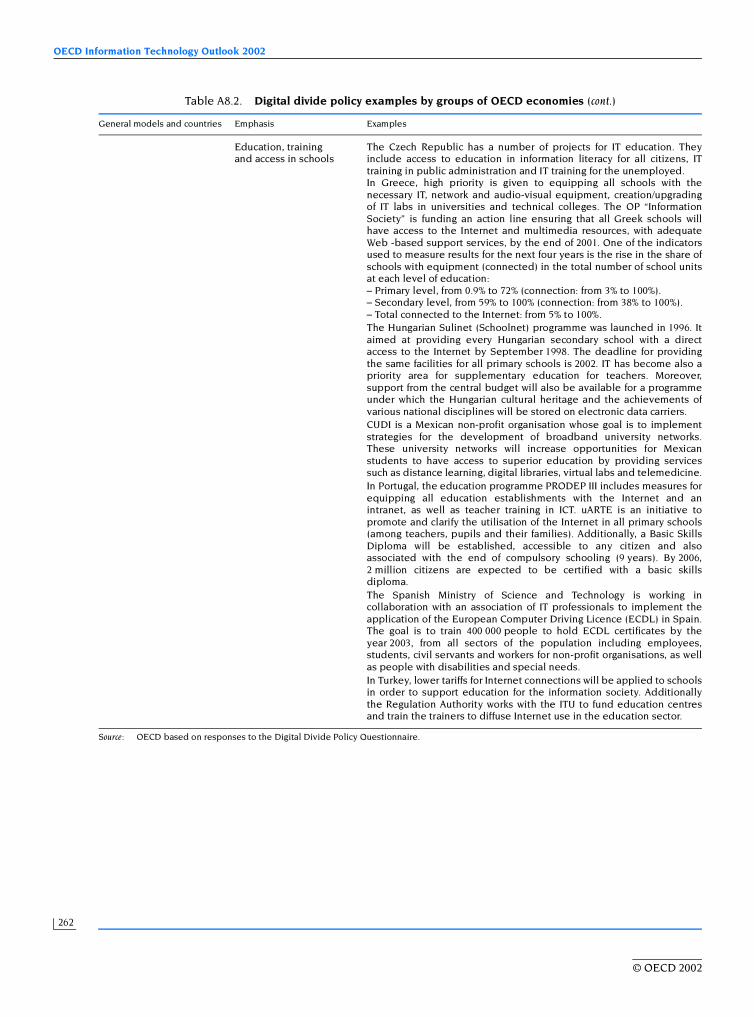
OECD Information Technology Outlook 2002
262
Table A8.2. Digital divide policy examples by groups of OECD economies (cont.)
Source: OECD based on responses to the Digital Divide Policy Questionnaire.
General models and countries Emphasis Examples
Education, training and access in schools
The Czech Republic has a number of projects for IT education. Theyinclude access to education in information literacy for all citizens, ITtraining in public administration and IT training for the unemployed.In Greece, high priority is given to equipping all schools with thenecessary IT, network and audio-visual equipment, creation/upgradingof IT labs in universities and technical colleges. The OP “InformationSociety” is funding an action line ensuring that all Greek schools willhave access to the Internet and multimedia resources, with adequateWeb -based support services, by the end of 2001. One of the indicatorsused to measure results for the next four years is the rise in the share ofschools with equipment (connected) in the total number of school unitsat each level of education:– Primary level, from 0.9% to 72% (connection: from 3% to 100%).– Secondary level, from 59% to 100% (connection: from 38% to 100%).– Total connected to the Internet: from 5% to 100%.The Hungarian Sulinet (Schoolnet) programme was launched in 1996. Itaimed at providing every Hungarian secondary school with a directaccess to the Internet by September 1998. The deadline for providingthe same facilities for all primary schools is 2002. IT has become also apriority area for supplementary education for teachers. Moreover,support from the central budget will also be available for a programmeunder which the Hungarian cultural heritage and the achievements ofvarious national disciplines will be stored on electronic data carriers.CUDI is a Mexican non-profit organisation whose goal is to implementstrategies for the development of broadband university networks.These university networks will increase opportunities for Mexicanstudents to have access to superior education by providing servicessuch as distance learning, digital libraries, virtual labs and telemedicine.In Portugal, the education programme PRODEP III includes measures forequipping all education establishments with the Internet and anintranet, as well as teacher training in ICT. uARTE is an initiative topromote and clarify the utilisation of the Internet in all primary schools(among teachers, pupils and their families). Additionally, a Basic SkillsDiploma will be established, accessible to any citizen and alsoassociated with the end of compulsory schooling (9 years). By 2006,2 million citizens are expected to be certified with a basic skillsdiploma.The Spanish Ministry of Science and Technology is working incollaboration with an association of IT professionals to implement theapplication of the European Computer Driving Licence (ECDL) in Spain.The goal is to train 400 000 people to hold ECDL certificates by theyear 2003, from all sectors of the population including employees,students, civil servants and workers for non-profit organisations, as wellas people with disabilities and special needs.In Turkey, lower tariffs for Internet connections will be applied to schoolsin order to support education for the information society. Additionallythe Regulation Authority works with the ITU to fund education centresand train the trainers to diffuse Internet use in the education sector.
© OECD 2002

IT Policies
263
NOTES
1. Individual country responses will be available on the OECD Web site.
2. A more detailed summary will be available on the OECD Web site.
3. For example, the e-Japan Strategy (2001) and the e-Japan Priority Policy Programme (2001), available at:www.kantei.go.jp/jp/it/index.html
© OECD 2002
OECD Information Technology Outlook 2002
264
REFERENCES
Mowery, D. et al. (eds.) (1996),The International Computer Software Industry, Oxford University Press, Oxford and New York.
OECD (1998),Technology, Productivity and Job Creation: Best Policy Practices, OECD, Paris.
OECD (2001a),Science, Technology and Industry Outlook. Drivers of Growth: ICTs, Innovation and Entrepreneurship, OECD, Paris.
OECD (2001b),The New Economy: Beyond the Hype, OECD, Paris.
OECD (2001c),“Progress achieved by OECD Member Countries in Furtherance of the Ottawa Declaration on Authentication forElectronic Commerce”.
OECD (2001d),OECD Communications Outlook, OECD, Paris.
OECD (2001e),The Development of Broadband Access in OECD Countries, OECD, Paris.
OECD (2002a),“The Electronic Commerce Business Impacts Project (EBIP): Synthesis Report”, forthcoming.
OECD (2002b),“The Digital Divide: Diffusion and Use of ICTs”, forthcoming.
© OECD 2002
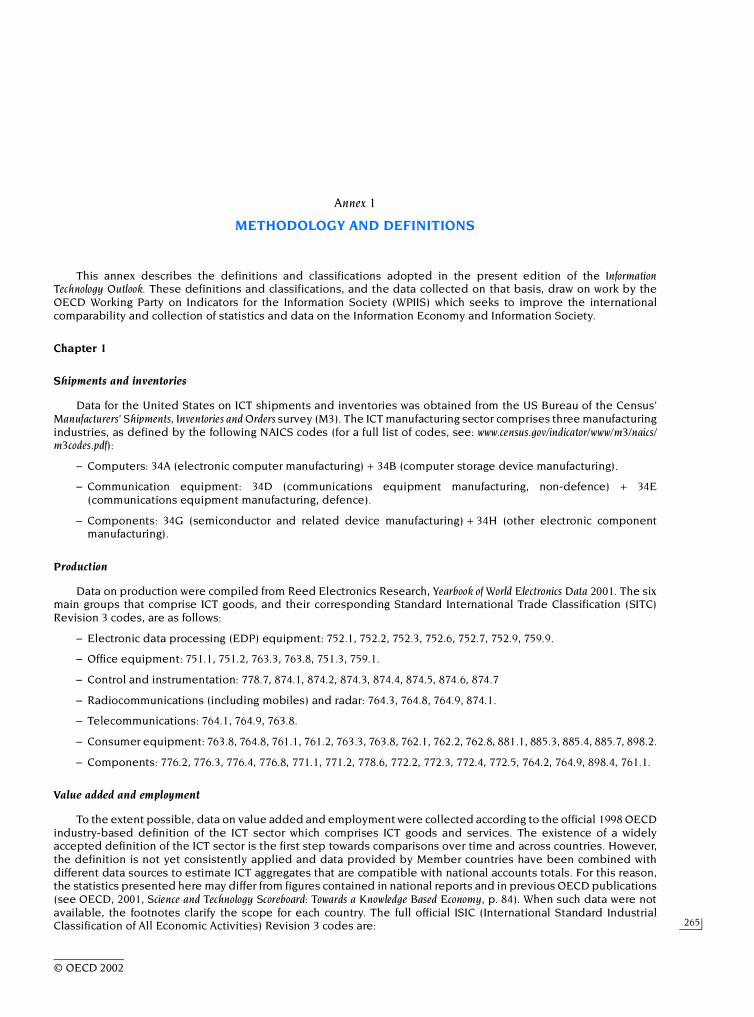
265
Annex 1
METHODOLOGY AND DEFINITIONS
This annex describes the definitions and classifications adopted in the present edition of the InformationTechnology Outlook. These definitions and classifications, and the data collected on that basis, draw on work by theOECD Working Party on Indicators for the Information Society (WPIIS) which seeks to improve the internationalcomparability and collection of statistics and data on the Information Economy and Information Society.
Chapter 1
Shipments and inventories
Data for the United States on ICT shipments and inventories was obtained from the US Bureau of the Census’Manufacturers’ Shipments, Inventories and Orders survey (M3). The ICT manufacturing sector comprises three manufacturingindustries, as defined by the following NAICS codes (for a full list of codes, see: www.census.gov/indicator/www/m3/naics/m3codes.pdf):
– Computers: 34A (electronic computer manufacturing) + 34B (computer storage device manufacturing).
– Communication equipment: 34D (communications equipment manufacturing, non-defence) + 34E(communications equipment manufacturing, defence).
– Components: 34G (semiconductor and related device manufacturing) + 34H (other electronic componentmanufacturing).
Production
Data on production were compiled from Reed Electronics Research, Yearbook of World Electronics Data 2001. The sixmain groups that comprise ICT goods, and their corresponding Standard International Trade Classification (SITC)Revision 3 codes, are as follows:
– Electronic data processing (EDP) equipment: 752.1, 752.2, 752.3, 752.6, 752.7, 752.9, 759.9.
– Office equipment: 751.1, 751.2, 763.3, 763.8, 751.3, 759.1.
– Control and instrumentation: 778.7, 874.1, 874.2, 874.3, 874.4, 874.5, 874.6, 874.7
– Radiocommunications (including mobiles) and radar: 764.3, 764.8, 764.9, 874.1.
– Telecommunications: 764.1, 764.9, 763.8.
– Consumer equipment: 763.8, 764.8, 761.1, 761.2, 763.3, 763.8, 762.1, 762.2, 762.8, 881.1, 885.3, 885.4, 885.7, 898.2.
– Components: 776.2, 776.3, 776.4, 776.8, 771.1, 771.2, 778.6, 772.2, 772.3, 772.4, 772.5, 764.2, 764.9, 898.4, 761.1.
Value added and employment
To the extent possible, data on value added and employment were collected according to the official 1998 OECDindustry-based definition of the ICT sector which comprises ICT goods and services. The existence of a widelyaccepted definition of the ICT sector is the first step towards comparisons over time and across countries. However,the definition is not yet consistently applied and data provided by Member countries have been combined withdifferent data sources to estimate ICT aggregates that are compatible with national accounts totals. For this reason,the statistics presented here may differ from figures contained in national reports and in previous OECD publications(see OECD, 2001, Science and Technology Scoreboard: Towards a Knowledge Based Economy, p. 84). When such data were notavailable, the footnotes clarify the scope for each country. The full official ISIC (International Standard IndustrialClassification of All Economic Activities) Revision 3 codes are:
© OECD 2002
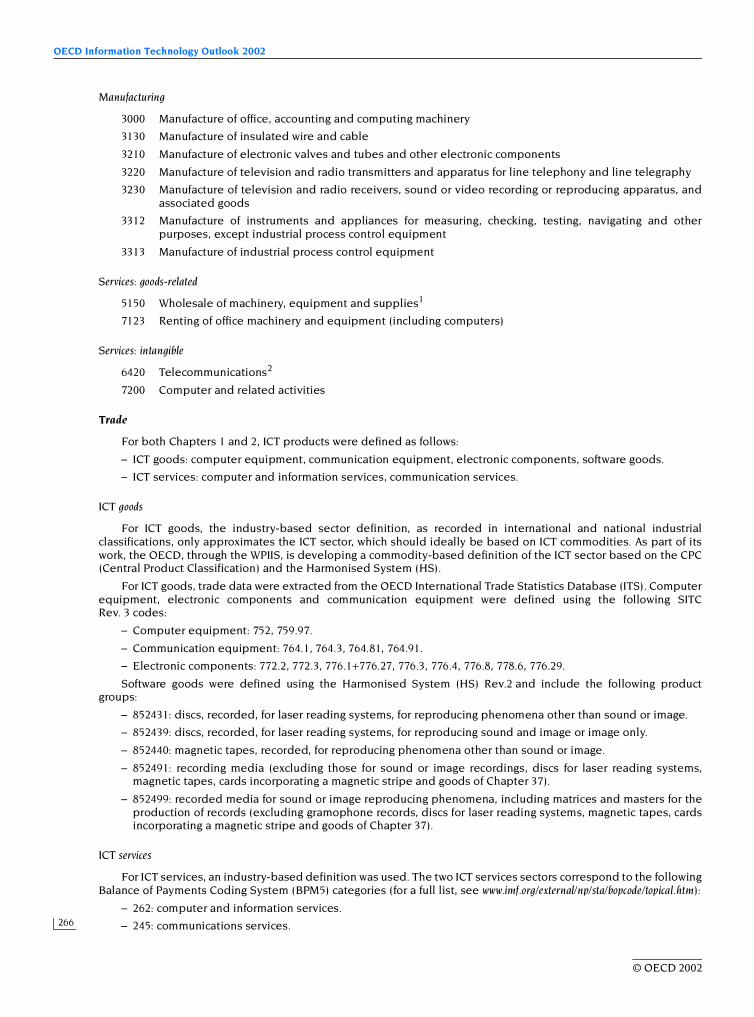
OECD Information Technology Outlook 2002
266
Manufacturing
3000 Manufacture of office, accounting and computing machinery
3130 Manufacture of insulated wire and cable
3210 Manufacture of electronic valves and tubes and other electronic components
3220 Manufacture of television and radio transmitters and apparatus for line telephony and line telegraphy
3230 Manufacture of television and radio receivers, sound or video recording or reproducing apparatus, andassociated goods
3312 Manufacture of instruments and appliances for measuring, checking, testing, navigating and otherpurposes, except industrial process control equipment
3313 Manufacture of industrial process control equipment
Services: goods-related
5150 Wholesale of machinery, equipment and supplies1
7123 Renting of office machinery and equipment (including computers)
Services: intangible
6420 Telecommunications2
7200 Computer and related activities
Trade
For both Chapters 1 and 2, ICT products were defined as follows:
– ICT goods: computer equipment, communication equipment, electronic components, software goods.
– ICT services: computer and information services, communication services.
ICT goods
For ICT goods, the industry-based sector definition, as recorded in international and national industrialclassifications, only approximates the ICT sector, which should ideally be based on ICT commodities. As part of itswork, the OECD, through the WPIIS, is developing a commodity-based definition of the ICT sector based on the CPC(Central Product Classification) and the Harmonised System (HS).
For ICT goods, trade data were extracted from the OECD International Trade Statistics Database (ITS). Computerequipment, electronic components and communication equipment were defined using the following SITCRev. 3 codes:
– Computer equipment: 752, 759.97.
– Communication equipment: 764.1, 764.3, 764.81, 764.91.
– Electronic components: 772.2, 772.3, 776.1+776.27, 776.3, 776.4, 776.8, 778.6, 776.29.
Software goods were defined using the Harmonised System (HS) Rev.2 and include the following productgroups:
– 852431: discs, recorded, for laser reading systems, for reproducing phenomena other than sound or image.
– 852439: discs, recorded, for laser reading systems, for reproducing sound and image or image only.
– 852440: magnetic tapes, recorded, for reproducing phenomena other than sound or image.
– 852491: recording media (excluding those for sound or image recordings, discs for laser reading systems,magnetic tapes, cards incorporating a magnetic stripe and goods of Chapter 37).
– 852499: recorded media for sound or image reproducing phenomena, including matrices and masters for theproduction of records (excluding gramophone records, discs for laser reading systems, magnetic tapes, cardsincorporating a magnetic stripe and goods of Chapter 37).
ICT services
For ICT services, an industry-based definition was used. The two ICT services sectors correspond to the followingBalance of Payments Coding System (BPM5) categories (for a full list, see www.imf.org/external/np/sta/bopcode/topical.htm):
– 262: computer and information services.
– 245: communications services.
© OECD 2002

Annex 1
267
R&D data
To the extent possible, data on R&D expenditure in the ICT sector were collected according to the official OECDindustry-based definition. Country footnotes explain actual coverage.
Patents
ICT patents comprise the following IPC (International Patent Classification) classes:
– G06: computing, calculating, counting devices.
– G11: information storage equipment.
– H04: electrical communication systems.
ICT markets
Data on markets were compiled from the 2002 World Information Technology and Services Alliance (WITSA)report, Digital Planet 2002, and from data provided directly by International Data Corporation (IDC), Framingham,Massachusetts. As the WITSA study uses data from IDC, IDC is the main primary source of data on ICT markets. Forour purposes, the report defines information and communication technology (ICT) markets as revenue paid bybusinesses, households, government agencies and educational institutions to vendors for the following four main ICTsegments:
1. IT hardware: servers, personal computers (PCs), workstations, data communications equipment and add-onspurchased from an external agent or corporation, including:
– Computer system central units: basic CPU or central electronic complex, with initial memory, processorupgrades, cooling as necessary, etc., including multi-user systems (servers) and single-user systems (PCsand workstations).
– Storage devices: including those sold initially with systems and those incorporated later as add-ons, forboth multi-user and single-user systems.
– Printers: both for multi-user systems and for PC/workstations.
– Bundled operating systems: within system values, both single-user and multi-user.
– Data communications equipment: LAN hardware and other data communication equipment.
2. IT software: purchases of all software products and external customisation of computer programmes. Thisexcludes expenses related to the internal (e.g. wages, rent) customisation of computer programmes andincludes systems software and utilities, application tools and application solutions.
3. IT services: in this report, this includes IT services as defined by IDC as well as internal spending:
– IT services provided to a corporation by an external agent, above and beyond the services provided by aninternal information systems (IS) team. Includes IT consulting, implementation services, operationsmanagement, IT training and education, processing services and IT support services.
– Internal IT spending which comprises the internal portion of the information system operating budgets,internally customised software, capital depreciation and any other expense related to IT that cannot be tiedto a vendor.
4. Telecommunications: expenditure on public network equipment (such as switching, transmission and mobilecommunications infrastructure), private network equipment (such as telephone sets, PBXs and key systems,mobile and other equipment) and telecommunications services (such as fixed and mobile telephony,switched data, leased lines and cable TV services).
Semiconductors
Data are provided by the World Semiconductor Trade Statistics (WSTS), an industrial association of about70 semiconductor manufacturers representing about 90% of the market in terms of value of production. WSTS collectsrevenue statistics directly from its members. The figures provided cover only the “commercial” (merchant)semiconductor market and not internal or “captive” consumption (www.wsts.org).
© OECD 2002

OECD Information Technology Outlook 2002
268
Chapter 2
Trade performance indicators
Revealed comparative advantage
where stands for exports for industry i from country j, stands for total
manufacturing exports from country j, and denotes total OECD exports for industry i.
Grubel-Lloyd Index
where Mi and Xi stand for imports and exports for industry i respectively.
FDI flows
FDI data from the OECD International Direct Investment Statistics Yearbook cover the following ICT-related sectors (thecorresponding ISIC Rev. 3 codes are in parentheses):
– Office machinery, computers, radio, TV and communication equipment (30, 32).
– Telecommunication services (642).
Mergers and acquisitions/strategic alliances
Data on M&As and strategic alliances were obtained from Thomson Financial. For this purpose, the ICT sectorincludes the following activities:
– Computer and office equipment manufacturing.
– Electronic equipment and components manufacturing.
– Computer and related services.
– Telecommunication services.
– ICT wholesaling.
– (ICT-related) media and content industries.
Chapter 4
ICT use in businesses and households/by individuals and e-commerce statistics
To the extent possible, data on ICT use in businesses and households/by individuals, including e-commercestatistics, are drawn from the OECD ICT database, which is under development. This database compiles comparableofficial core indicators developed according to common OECD definitions and methodological guidelines (inparticular, the OECD model questionnaire on ICT use in business, 2001, and the OECD electronic commercetransactions definitions, 2000). For further methodological details, see Chapter 4.
Chapter 6
Gini coefficient
The Gini coefficient used to measure inequalities in access to PCs and the Internet was calculated according tothe following formula:
where Xi denotes the cumulative share of households in group i and below, sorted by
increasing income brackets (e.g. X1 denotes the share of households in the lowest income bracket, and XN = 1),
Yi denotes the corresponding share of households with PCs (or those using Internet), N denotes the number of
income brackets and ( ).
Other chapters
For other chapters, footnotes define coverage for individual figures and tables.
=
OT
Oi
jT
ji
ji
XX
XX
RCAjiX j
TX
OiX
[ ])/(1 iiiii XMXMGLI +−−=
( )∑=
∆−=N
iiii XYXG
12
1−−=∆ iii XXX 0=oX
© OECD 2002
Annex 1
269
NOTES
1. Where available, countries should only include those subsectors of this industry that directly provide ICTwholesaling services. This will avoid the inclusion of extraneous wholesaling activity. For example, using theNACE nomenclature, only NACE categories 5143, 5164 and 5165 should be included.
2. In those instances where countries include telecommunication activities as part of radio and televisionactivities (ISIC 9213), radio and television activities (9213) should be included in this definition. Otherwise,they should not be included.
© OECD 2002

Annex 2
ANNEX TABLES

OECD Information Technology Outlook 2002
272
Annex Table 1.1. Worldwide production of ICT goods, 1999Value in millions of current USD and percentage growth
EDP Officeequipment
Control andinstrumentation
Radio comm.(incl. mobiles)
& radar
Telecom-munications Consumer Components Total ICT 1995-99
CAGR1990-99CAGR
United States 91 392 4 776 35 944 59 736 43 549 6 612 78 831 320 840 4.4 5.8
Canada 3 691 107 1 007 2 349 3 758 172 558 11 642 1.4 4.0
Japan 60 553 5 751 8 033 20 237 19 324 18 314 88 516 220 728 -4.0 2.3
Korea 10 984 328 221 10 069 1 910 4 159 29 926 57 597 4.2 10.8
Australia 839 34 490 839 748 259 395 3 604 2.3 3.0
Austria 565 27 348 125 475 481 1 509 3 530 -4.5 0.0
Belgium 1 955 73 478 697 808 888 1 029 5 928 -3.5 0.8
Denmark 117 15 485 576 246 187 725 2 351 3.3 3.6
Finland 796 2 527 3 477 2 244 8 1 454 8 508 11.9 13.4
France 6 737 362 2 763 11 282 5 195 2 038 7 334 35 711 0.9 1.9
Germany 9 678 679 10 848 6 734 5 974 1 942 11 690 47 545 -0.6 0.5
Greece 118 44 40 91 131 73 36 533 7.7 ..
Ireland 9 189 93 295 365 1 865 74 4 600 16 481 17.0 12.8
Italy 5 669 203 2 949 2 130 3 379 515 3 594 18 439 -2.1 -1.5
Netherlands 3 285 902 1 797 713 618 296 1 931 9 542 -3.8 1.2
Norway 267 0 347 306 288 10 159 1 377 -2.7 -0.9
Portugal 420 17 64 170 191 871 711 2 444 3.4 ..
Spain 1 592 115 262 342 2 802 1 591 1 077 7 781 4.9 0.5
Sweden 228 12 1 131 6 090 3 778 306 1 562 13 107 15.0 8.8
Switzerland 660 77 1 927 255 503 2 888 1 386 7 696 -3.3 1.3
United Kingdom 15 000 815 4 540 12 081 3 145 2 795 9 361 47 737 6.9 6.2
OECD-21 223 735 14 432 74 496 138 664 100 931 44 479 246 384 843 121 1.4 4.2
China 17 750 1 712 1 610 3 910 4 480 16 200 14 076 59 738 20.1 19.8
Hong Kong,China
1 731 297 88 380 490 2 189 2 558 7 733 -4.8 -0.4
Malaysia 14 474 134 342 1 053 1 605 5 749 15 599 38 956 9.0 20.1
Singapore 22 059 255 471 1 294 494 1 336 14 846 40 755 0.7 11.9
Chinese Taipei 23 079 23 124 836 1 808 783 14 326 40 979 9.0 12.7
Thailand 7 937 340 138 423 661 2 034 4 704 16 237 6.9 17.0
India 580 73 348 487 441 1 886 1 026 4 841 -0.3 0.4
Indonesia 1 390 60 110 507 400 1 496 2 114 6 077 6.5 19.4
Philippines 2 200 37 50 500 300 456 5 740 9 283 22.0 18.4
Brazil 5 900 190 550 1 200 1 300 1 909 2 435 13 484 -5.0 1.3
Israel 1 150 11 550 850 2 400 77 1 273 6 311 11.2 14.6
South Africa 180 6 79 172 376 161 50 1 024 -61.9 -2.5
Total 322 165 17 570 78 956 150 276 115 686 78 755 325 131 1 088 539 1.4 5.6
Source: Reed Electronics Research (2001).
© OECD 2002

Annex 2
273
Annex Table 1.2. Exports and imports of ICT equipment, 1990-2000Value in millions of current USD and percentage growth
Exports Imports
1990 1995 2000CAGR
1990-00(%)
1990 1995 2000CAGR
1990-00(%)
Australia 605 1 624 1 389 8.7 3 151 6 432 8 409 10.3
Austria 1 621 1 956 3 468 7.9 2 772 3 298 5 260 6.6
Belgium .. 4 113 7 799 .. .. 5 027 9 204 ..
Canada 5 576 9 761 19 595 13.4 9 083 17 062 26 654 11.4
Czech Republic .. 212 1 497 .. .. 1 330 2 909 ..
Denmark 884 1 638 2 552 11.2 1 791 3 292 4 372 9.3
Finland 1 132 3 978 9 228 23.3 1 629 3 233 4 458 10.6
France 9 079 16 817 27 596 11.8 12 878 19 028 29 645 8.7
Germany 15 830 26 872 41 047 10.0 20 112 34 870 50 100 9.6
Greece 24 83 188 23.1 382 742 1 481 14.5
Hungary .. 240 5 236 .. .. 849 5 285 ..
Iceland 1 0 2 4.9 55 85 174 12.2
Ireland 5 115 11 095 24 833 17.1 2 459 7 904 15 791 20.4
Italy 6 252 9 212 9 117 3.8 9 376 12 628 17 112 6.2
Japan 39 146 79 696 86 012 8.2 9 386 30 979 52 644 18.8
Korea .. 25 830 49 983 .. 14 381 31 943 ..
Mexico 530 6 518 24 136 46.5 1 380 8 497 27 354 34.8
Netherlands 7 706 15 937 33 766 15.9 9 649 16 173 35 631 14.0
New Zealand 28 98 122 15.8 618 1 117 1 228 7.1
Norway 540 759 833 4.4 1 293 2 337 2 648 7.4
Poland .. 271 459 .. 1 364 3 685 ..
Portugal 391 607 749 6.7 990 1 693 2 324 8.9
Slovak Republic .. .. 235 .. .. .. 582 ..
Spain 1 321 2 763 3 718 10.9 4 544 5 386 9 998 8.2
Sweden 3 449 5 592 11 837 13.1 3 538 5 814 8 117 8.7
Switzerland 1 111 1 989 2 787 9.6 3 507 5 310 6 993 7.1
Turkey 36 48 163 16.2 989 1 413 4 739 17.0
United Kingdom 13 187 28 629 45 017 13.1 17 553 31 598 54 753 12.0
United States 40 894 73 076 145 366 13.5 45 083 112 306 178 305 14.7
OECD 154 458 329 416 558 732 13.7 162 217 354 150 601 798 14.0
EU 65 990 129 292 220 728 12.8 87 674 150 688 246 765 10.9
Note: .. = data not available. OECD and EU are partial totals from available data. 1999 instead of 2000 for Greece and theSlovak Republic.Source: OECD, ITS database, January 2002.
© OECD 2002
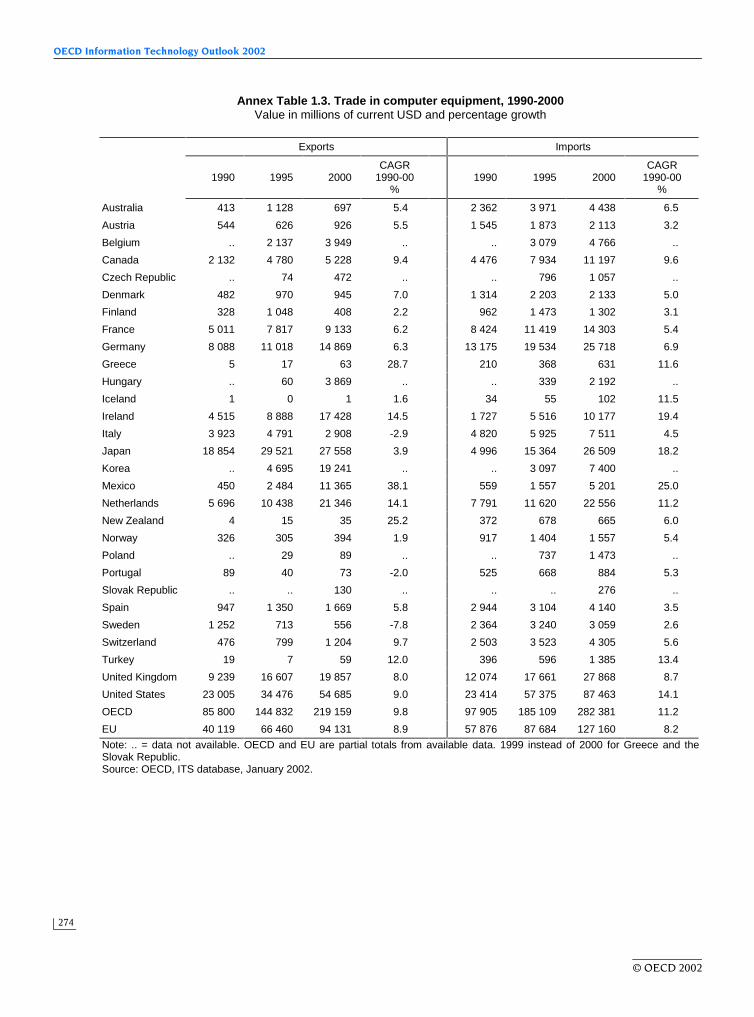
OECD Information Technology Outlook 2002
274
Annex Table 1.3. Trade in computer equipment, 1990-2000Value in millions of current USD and percentage growth
Exports Imports
1990 1995 2000CAGR
1990-00%
1990 1995 2000CAGR
1990-00%
Australia 413 1 128 697 5.4 2 362 3 971 4 438 6.5
Austria 544 626 926 5.5 1 545 1 873 2 113 3.2
Belgium .. 2 137 3 949 .. .. 3 079 4 766 ..
Canada 2 132 4 780 5 228 9.4 4 476 7 934 11 197 9.6
Czech Republic .. 74 472 .. .. 796 1 057 ..
Denmark 482 970 945 7.0 1 314 2 203 2 133 5.0
Finland 328 1 048 408 2.2 962 1 473 1 302 3.1
France 5 011 7 817 9 133 6.2 8 424 11 419 14 303 5.4
Germany 8 088 11 018 14 869 6.3 13 175 19 534 25 718 6.9
Greece 5 17 63 28.7 210 368 631 11.6
Hungary .. 60 3 869 .. .. 339 2 192 ..
Iceland 1 0 1 1.6 34 55 102 11.5
Ireland 4 515 8 888 17 428 14.5 1 727 5 516 10 177 19.4
Italy 3 923 4 791 2 908 -2.9 4 820 5 925 7 511 4.5
Japan 18 854 29 521 27 558 3.9 4 996 15 364 26 509 18.2
Korea .. 4 695 19 241 .. .. 3 097 7 400 ..
Mexico 450 2 484 11 365 38.1 559 1 557 5 201 25.0
Netherlands 5 696 10 438 21 346 14.1 7 791 11 620 22 556 11.2
New Zealand 4 15 35 25.2 372 678 665 6.0
Norway 326 305 394 1.9 917 1 404 1 557 5.4
Poland .. 29 89 .. .. 737 1 473 ..
Portugal 89 40 73 -2.0 525 668 884 5.3
Slovak Republic .. .. 130 .. .. .. 276 ..
Spain 947 1 350 1 669 5.8 2 944 3 104 4 140 3.5
Sweden 1 252 713 556 -7.8 2 364 3 240 3 059 2.6
Switzerland 476 799 1 204 9.7 2 503 3 523 4 305 5.6
Turkey 19 7 59 12.0 396 596 1 385 13.4
United Kingdom 9 239 16 607 19 857 8.0 12 074 17 661 27 868 8.7
United States 23 005 34 476 54 685 9.0 23 414 57 375 87 463 14.1
OECD 85 800 144 832 219 159 9.8 97 905 185 109 282 381 11.2
EU 40 119 66 460 94 131 8.9 57 876 87 684 127 160 8.2
Note: .. = data not available. OECD and EU are partial totals from available data. 1999 instead of 2000 for Greece and theSlovak Republic.Source: OECD, ITS database, January 2002.
© OECD 2002

Annex 2
275
Annex Table 1.4. Trade in communication equipment, 1990-2000Value in millions of current USD and percentage growth
Exports Imports
1990 1995 2000CAGR
1990-00(%)
1990 1995 2000CAGR
1990-00(%)
Australia 164 385 537 12.6 453 1 373 3 029 20.9
Austria 188 129 617 12.7 309 466 1 549 17.5
Belgium .. 1 124 2 226 .. .. 905 2 039 ..
Canada 1 144 2 581 10 438 24.7 844 1 938 5 497 20.6
Czech Republic .. 25 156 .. .. 365 723 ..
Denmark 284 428 1 282 16.3 230 625 1 438 20.1
Finland 703 2 750 8 254 27.9 312 354 1 175 14.2
France 1 409 3 078 9 860 21.5 694 1 731 5 025 21.9
Germany 2 267 6 586 11 517 17.6 1 217 4 024 7 597 20.1
Greece 15 60 116 22.6 104 318 730 21.5
Hungary .. 21 788 .. .. 239 603 ..
Iceland 0 0 0 37.4 18 28 64 13.4
Ireland 211 580 2 799 29.5 187 258 1 841 25.7
Italy 534 1 296 2 676 17.5 1 056 1 815 5 048 16.9
Japan 5 614 6 904 8 106 3.7 805 3 023 5 165 20.4
Korea .. 1 594 6 543 .. .. 1 274 2 984 ..
Mexico 24 1 237 8 093 79.3 596 782 4 475 22.3
Netherlands 495 1 217 4 386 24.4 701 1 400 5 823 23.6
New Zealand 22 73 70 12.2 215 341 454 7.7
Norway 199 417 397 7.2 215 650 808 14.2
Poland .. 29 88 .. .. 352 1 353 ..
Portugal 51 58 52 0.3 180 310 685 14.3
Slovak Republic .. .. 36 .. .. .. 134 ..
Spain 118 916 1 168 25.8 864 1 189 4 072 16.8
Sweden 1 841 4 345 10 199 18.7 540 1 036 2 262 15.4
Switzerland 288 538 642 8.3 457 815 1 510 12.7
Turkey 14 31 83 19.5 166 402 2 355 30.4
United Kingdom 1 426 3 872 14 027 25.7 1 628 3 764 12 733 22.8
United States 4 063 10 933 20 680 17.7 6 016 10 649 34 652 19.1
OECD 21 071 51 207 125 837 19.6 17 807 40 425 115 822 20.6
EU 9 541 26 440 69 179 21.9 8 022 18 194 52 017 20.6
Note: .. = data not available. OECD and EU are partial totals from available data. 1999 instead of 2000 for Greece and theSlovak Republic.Source: OECD, ITS database, January 2002.
© OECD 2002

OECD Information Technology Outlook 2002
276
Annex Table 1.5. Trade in electronic components, 1990-2000Value in millions of current USD and percentage growth
Exports Imports
1990 1995 2000CAGR
1990-00(%)
1990 1995 2000CAGR
1990-00(%)
Australia 28 112 155 18.7 336 1 088 941 10.8
Austria 889 1 201 1 925 8.0 917 959 1 598 5.7
Belgium .. 852 4 235 974 .. .. 1 043 2 399 ..
Canada 2 300 2 400 3 928 5.5 3 762 7 190 9 959 10.2
Czech Republic .. 112 869 .. .. 170 1 129 ..
Denmark 118 240 326 10.7 247 464 802 12.5
Finland 102 179 566 18.7 355 1 406 1 981 18.8
France 2 659 5 922 8 603 12.5 3 760 5 878 10 318 10.6
Germany 5 474 9 267 14 660 10.4 5 720 11 313 16 786 11.4
Greece 3 6 9 10.7 67 56 120 5.9
Hungary .. 159 579 .. .. 271 2 490 ..
Iceland 0 0 0 .. 2 3 8 14.0
Ireland 388 1 628 4 606 28.1 545 2 130 3 773 21.3
Italy 1 795 3 125 3 533 7.0 3 500 4 888 4 553 2.7
Japan 14 678 43 270 50 348 13.1 3 585 12 592 20 970 19.3
Korea .. 19 541 24 199 .. .. 10 009 21 559 ..
Mexico 56 2 797 4 678 55.6 225 6 158 17 679 54.7
Netherlands 1 516 4 282 8 034 18.1 1 157 3 153 7 252 20.1
New Zealand 2 11 17 21.7 31 98 109 13.6
Norway 15 37 42 11.1 161 283 284 5.9
Poland .. 213 282 .. .. 275 860 ..
Portugal 251 509 624 9.6 285 714 754 10.2
Slovak Republic .. .. 69 .. .. .. 172 ..
Spain 256 497 881 13.1 737 1 093 1 787 9.3
Sweden 356 534 1 082 11.8 634 1 538 2 796 16.0
Switzerland 348 652 942 10.5 547 972 1 178 8.0
Turkey 3 10 21 20.1 428 414 998 8.8
United Kingdom 2 522 8 150 11 133 16.0 3 851 10 174 14 151 13.9
United States 13 826 27 668 70 001 17.6 15 653 44 283 56 190 13.6
OECD 47 587 133 376 4 448 084 57.4 46 505 128 615 203 596 15.9
EU 16 330 36 393 4 291 955 74.6 21 776 44 810 69 070 12.2
Note: .. = data not available. OECD and EU are partial totals from available data. 1999 instead of 2000 for Greece and theSlovak Republic.Source: OECD, ITS database, January 2002.
© OECD 2002

Annex 2
277
Annex Table 1.6. Trade in software products, 1996-2000Value in millions of current USD and percentage growth
Exports Imports
1996 1998 2000CAGR
1996-00(%)
1996 1998 2000CAGR
1996-00(%)
Australia 22 67 54 25.6 197 464 400 19.3
Austria 213 845 780 38.4 152 254 269 15.2
Belgium 173 198 308 15.6 323 352 354 2.3
Canada 295 163 241 -4.9 829 1 028 1 054 6.2
Czech Republic 143 23 24 -36.2 72 74 107 10.4
Denmark 115 106 156 7.8 179 209 246 8.2
Finland 30 39 76 25.8 115 122 140 5.2
France 428 431 483 3.1 980 1 052 959 -0.5
Germany 734 661 702 -1.1 946 1 294 988 1.1
Greece 24 27 20 -4.8 43 92 96 22.4
Hungary 15 23 25 13.4 9 91 94 79.2
Iceland 0.1 0.1 0.4 54.3 9 13 21 25.0
Ireland 3 567 3 363 3 819 1.7 636 293 315 -16.1
Italy 89 70 72 -5.1 558 718 815 9.9
Japan 254 292 317 5.7 560 385 629 3.0
Korea 27 36 120 45.7 438 213 527 4.7
Mexico 36 22 26 -7.4 178 196 347 18.1
Netherlands 569 714 1 079 17.3 521 396 567 2.1
New Zealand 8 6 4 -19.5 74 75 55 -7.1
Norway 20 21 26 6.6 149 172 184 5.4
Poland 38 55 26 -9.2 16 32 59 37.9
Portugal 4 2 7 15.0 62 93 108 14.8
Slovak Republic .. 5 5 .. .. 32 22 ..
Spain 53 54 63 4.1 267 297 281 1.3
Sweden 87 91 159 16.3 266 237 255 -1.1
Switzerland 305 123 179 -12.5 487 537 823 14.0
Turkey 11 5 5 -20.4 43 60 158 38.7
United Kingdom 1 102 1 079 895 -5.1 1 137 1 604 1 592 8.8
United States 3 002 3 325 3 382 3.0 714 822 956 7.6
OECD 11 363 11 847 13 051 3.5 9 959 11 208 12 418 5.7
EU 7 188 7 681 8 618 4.6 6 185 7 014 6 984 3.1
Note: .. = data not available. OECD and EU are partial totals from available data. 1999 instead of 2000 for Greece and theSlovak Republic.Source: OECD, ITS database, January 2002.
© OECD 2002

OECD Information Technology Outlook 2002
278
Annex Table 1.7. Communication and computer and information services, 2000Value in millions of USD and share in percentage
Communication services
Exporters USD millions Share (%) Importers USD millions Share (%)
United States 4 090 18 United States 5 800 22
United Kingdom 2 505 11 Germany 3 150 12
Belgium-Luxembourg 1 861 8 United Kingdom 2 310 9
Germany 1 436 6 Italy 1 935 7
Netherlands 1 426 6 Netherlands 1 426 5
France 1 322 6 Canada 1 254 5
Italy 1 274 6 Japan 1 150 4
Canada 1 215 5 France 1 143 4
Mexico 1 213 5 Australia 1 095 4
Switzerland 891 4 Belgium-Luxembourg 958 4
OECD 23 055 100 OECD 26 022 100
Computer and information services
Exporters USD millions Share (%) Importers USD millions Share (%)
Ireland 5 479 19 Germany 4 836 25
United States 4 900 17 Japan 3 066 16
Germany 3 716 13 Belgium-Luxembourg 1 320 7
United Kingdom 3 684 12 Spain 1 226 6
Spain 2 041 7 Netherlands 1 187 6
Belgium-Luxembourg 1 721 6 United Kingdom 1 150 6
Japan 1 569 5 Sweden 1 067 5
Canada 1 345 5 United States 1 040 5
Sweden 1 191 4 Italy 926 5
Netherlands 1 152 4 Canada 791 4
OECD 29 495 100 OECD 19 617 100
Source: OECD/Eurostat (2001), Statistics on International Trade in Services; and IMF (2001), Balance of Payments StatisticsYearbook 2001; and CD-ROM, Balance of Payments Statistics, 2001.
© OECD 2002

Annex 2
279
Annex Table 2.1. Compound annual growth in electronics equipment trade and production in Europe andother regions, 1992-99
Compound annual growth (%)
Electronic dataprocessing Radio Communications Telecommunications Other electronics Total
Europe
Imports 9.8 20.2 17.4 4.9 8.4
Exports 11.6 22.8 17.2 6.5 10.6
Trade 10.5 21.7 17.3 5.6 9.4
Production 3.9 10.4 1.6 3.2 4.2
Other regions
Imports 14.3 16.2 15.5 10.8 12.4
Exports 10.1 10.9 12.5 8.8 9.5
Trade 12.0 13.3 13.8 9.7 10.8
Production 8.3 5.8 8.8 5.2 6.5
Note: Europe includes Austria, Belgium, Denmark, Finland, France, Germany, Greece, Ireland, Italy, the Netherlands, Norway,Portugal, Spain, Sweden, Switzerland and the United Kingdom. Other regions includes Australia, Brazil, Canada, ChineseTaipei, Hong Kong (China), India, Indonesia, Israel, Japan, Malaysia, Philippines, Singapore, South Africa, Korea, Thailand andthe United States.Source: Reed Electronics Research, 1994 and 2001.
© OECD 2002

OECD Information Technology Outlook 2002
280
Annex Table 2.2. Grubel-Lloyd index for ICT equipment trade, 1990-2000
1990 1995 2000
Australia 0.32 0.40 0.28
Austria 0.74 0.74 0.79
Belgium .. 0.90 0.92
Canada 0.76 0.73 0.85
Czech Republic .. 0.27 0.68
Denmark 0.66 0.66 0.74
Finland 0.82 0.90 0.65
France 0.83 0.94 0.96
Germany 0.88 0.87 0.90
Greece 0.12 0.20 0.23
Hungary .. 0.44 1.00
Iceland 0.03 0.01 0.02
Ireland 0.65 0.83 0.78
Italy 0.80 0.84 0.70
Japan 0.39 0.56 0.76
Korea .. 0.72 0.78
Mexico 0.56 0.87 0.94
Netherlands 0.89 0.99 0.97
New Zealand 0.09 0.16 0.18
Norway 0.59 0.49 0.48
Poland .. 0.33 0.22
Portugal 0.57 0.53 0.49
Slovak Republic .. .. 0.58
Spain 0.45 0.68 0.54
Sweden 0.99 0.98 0.81
Switzerland 0.48 0.54 0.57
Turkey 0.07 0.07 0.07
United Kingdom 0.86 0.95 0.90
United States 0.95 0.79 0.90
Note: 1999 instead of 2000 for Greece and the Slovak Republic.Source: OECD, ITS database, January 2002.
Annex Table 2.3. US intra-firm trade by region, 2000USD millions and percentage shares
US imports US exports
Totalimports
Relatedparty trade Share Total
exportsRelated
party trade Share
North America 363 794 189 758 52.2 255 286 106 478 41.7
Western Europe 238 743 122 437 51.3 167 677 48 300 28.8
Eastern Europe 16 157 5 142 31.8 5 866 946 16.1
South and Central America 71 347 18 438 25.8 55 849 10 381 18.6
Other countries 515 298 227 309 44.1 294 946 79 758 27.0
Total 1 205 339 563 084 46.7 779 624 245 863 31.5
Source: US Department of Commerce, June 2001.
© OECD 2002

Annex 2
281
Annex Table 2.4. World FDI, cross-border M&As and activities of affiliates, 1990-2000USD billions in current prices, numbers of employees and percentages
1990 2000CAGR
1990-2000(%)
FDI inflows 202 1 271 52.92
FDI outflows 235 1 150 38.94
FDI inward stock 1 889 6 314 23.43
FDI outward stock 1 717 5 976 24.80
Cross border M&As 151 1 144 65.76
Sales of foreign affiliates 5 467 15 680 18.68
Gross product of foreign affiliates 1 420 3 167 12.30
Total assets of foreign affiliates 5 744 21 102 26.74
Exports of foreign affiliates 1 166 3 572 20.63
Employment by foreign affiliates (thousands) 23 721 45 587 9.22
GDP at factor cost 21 475 31 895 4.85
Gross fixed capital formation (GFCF) 4 501 6 466 4.37
Royalties & fees receipts 27 66 14.44
Exports of goods and non-factor services 4 381 7 036 6.06
FDI inward flows as a percentage of GFCF 4.0 19.7 -
FDI outward flows as a percentage of GFCF 4.7 17.8 -
FDI inward stock as a percentage of GDP 8.3 19.8 -
FDI outward stock as a percentage of GDP 8.1 18.7 -
Source: UNCTAD (2001), World Investment Report.
© OECD 2002

OECD Information Technology Outlook 2002
282
Annex Table 2.5. World FDI flows and stocks in ICT-related industries, 1988 and 1997Millions of USD in current prices and percentage shares
1988USD millions
Share(%)
1997USD millions
Share(%)
CAGR1988-97
(%)
FDI inflows
All industries 119 837 100.0 360 408 100.0 22.3
All manufacturing 52 776 44.0 151 470 42.0 20.8
All services 46 653 38.9 172 032 47.7 29.9
ICT manufacturing 9 701 8.1 18 643 5.2 10.2
Electrical machinery 4 850 4.0 9 322 2.6 10.2
Office accounting and computer 2 082 1.7 1 522 0.4 -3.0
Electrical machinery 2 084 1.7 4 791 1.3 14.4
Radio, TV and communication 685 0.6 3 008 0.8 37.7
ICT services
Computer and related services 586 0.5 1 127 0.3 10.3
FDI inward stock
All industries 839 186 100.0 2 840 590 100.0 26.5
All manufacturing 347 412 41.4 1 206 688 42.5 27.5
All services 354 805 42.3 1 376 911 48.5 32.0
ICT manufacturing 77 059 9.2 182 867 6.4 15.3
Electrical machinery 38 530 4.6 91 408 3.2 15.2
Office accounting and computer 12 220 1.5 22 025 0.8 8.9
Electrical machinery 15 086 1.8 42 440 1.5 20.1
Radio, TV and communication 11 223 1.3 26 994 1.0 15.6
ICT services
Computer and related services 846 0.1 3 156 0.1 30.3
Source: UNCTAD (1999), World Investment Report 1999.
© OECD 2002

Annex 2
283
Annex Table 2.6. FDI flows into ICT and office machinery manufacturing, 1990-99Millions of current USD
1990 1991 1992 1993 1994 1995 1996 1997 1998 1999
Denmark In 65 484 116 15 189 71 -310 106 134 100
Out 32 16 -17 15 -16 -36 0 0 15 186
Finland In .. .. 124 89 -34 212 176 150 256 264
Out .. .. 194 -125 370 432 211 938 .. ..
France In -63 208 1 753 118 168 495 343 -162 .. -356
Out 1 952 1 887 3 253 1 080 1 354 511 -218 -472 .. 1 041
Germany In 215 -1 160 -253 481 2 290 -1 865 321 178 156
Out 2 383 839 1 330 1 011 895 370 202 864 484 251
Italy In .. .. 5 177 -219 916 255 667 574 15
Out .. .. -122 174 67 168 108 223 157 -4 047
Mexico In 55 321 163 46 165 319 571 655 651 921
Out .. .. .. .. .. .. .. .. .. ..
Netherlands In .. 409 516 55 245 234 734 1 815 10 716 1 297
Out .. 2 041 1 579 -939 776 1 272 2 670 1 150 3 575 2 772
Poland In .. .. 29 45 47 54 53 29
Out .. .. .. .. 0 0 0 0 .. ..
Spain In .. 180 223 293 211 129 96 72 293 -408
Out .. 188 6 38 48 5 9 141 273 -171
Sweden In .. .. .. .. .. .. .. 2 70 -76
Out .. .. .. .. .. .. .. -67 1 282 806
United Kingdom In -913 506 1 051 357 568 1 479 1 720 54 -409 9 861
Out -879 56 -298 23 205 -142 350 523 -613 -291
United States In 271 1 837 110 1 400 2 685 2 046 1 515 6 041 9 001 15 996
Out 1 241 353 526 1 052 2 316 7 060 3 440 2 727 1 866 6 231
Note: .. = no data.Source: OECD International Direct Investment Statistics Yearbook 2000.
© OECD 2002

OECD Information Technology Outlook 2002
284
Annex Table 2.8. Activities of affiliates worldwide, 1990-2000Billions of USD in current prices, number of employees and percentages
1990 2000CAGR
1990-2000(%)
Sales of foreign affiliates 5 467 15 680 11.1
Gross product of foreign affiliates 1 420 3 167 8.4
Total assets of foreign affiliates 5 744 21 102 13.9
Exports of foreign affiliates 1 166 3 572 11.8
Employment by foreign affiliates (thousands) 23 721 45 587 6.8
GDP at factor cost 21 475 31 895 4.0
Gross fixed capital formation 4 501 6 466 3.7
Royalties & fees receipts 27 66 9.3
Exports of goods and non-factor services 4 381 7 036 4.9
Source: UNCTAD, World Investment Report 2001.
Annex Table 2.7. FDI flows into telecommunications, 1990-99Millions of current USD
1990 1991 1992 1993 1994 1995 1996 1997 1998 1999
Denmark In .. .. .. .. .. .. 86 151 3 704 201
Out .. .. .. .. .. .. 966 545 -15 974
Finland In .. .. . .. .. .. .. .. .. ..
Out .. .. .. .. 50 .. .. .. .. ..
France In 0 3 7 13 42 77 347 477 1 892 -423
Out 47 12 11 19 86 91 415 848 1 200 1 072
Germany In .. .. .. .. .. -275 -4 479 450 221 97
Out .. .. .. .. .. 1 109 920 78 -598 16 845
Italy In -110 24 16 -1 9 36 188 76 55 455
Out 158 102 442 -45 41 14 1 -658 70 265
Mexico In 129 295 1 767 1 055 1 014 349 426 351 351 269
Out .. .. .. .. .. .. .. .. .. ..
Netherlands In .. .. 64 96 38 317 162 660 1 157 1 692
Out .. 16 4 76 103 997 1 123 919 -596 1 485
Poland In .. .. .. .. 13 7 133 25 7 1 790
Out .. .. .. .. 0 0 0 0 .. -3
Spain In .. .. .. 20 2 12 66 49 124 324
Out .. .. .. 0 1 519 96 189 1 126 5 064 4 174
Sweden In .. .. .. .. ... .. .. 129 129 418
Out .. .. .. .. .. .. .. 97 341 939
United Kingdom In .. .. .. 345 18 -139 -623 -429 1 811 13 255
Out .. .. .. 0 -1 249 2 181 2 442 4 226 492 80 341
United States In 9 -273 16 76 3 821 527 6 814 3 720 -3 136 76 056
Out 2 505 1 517 920 1 814 2 887 3 253 1 211 1 413 2 298 -66
Note: .. = no data.Source: OECD International Direct Investment Statistics Yearbook 2000.
© OECD 2002
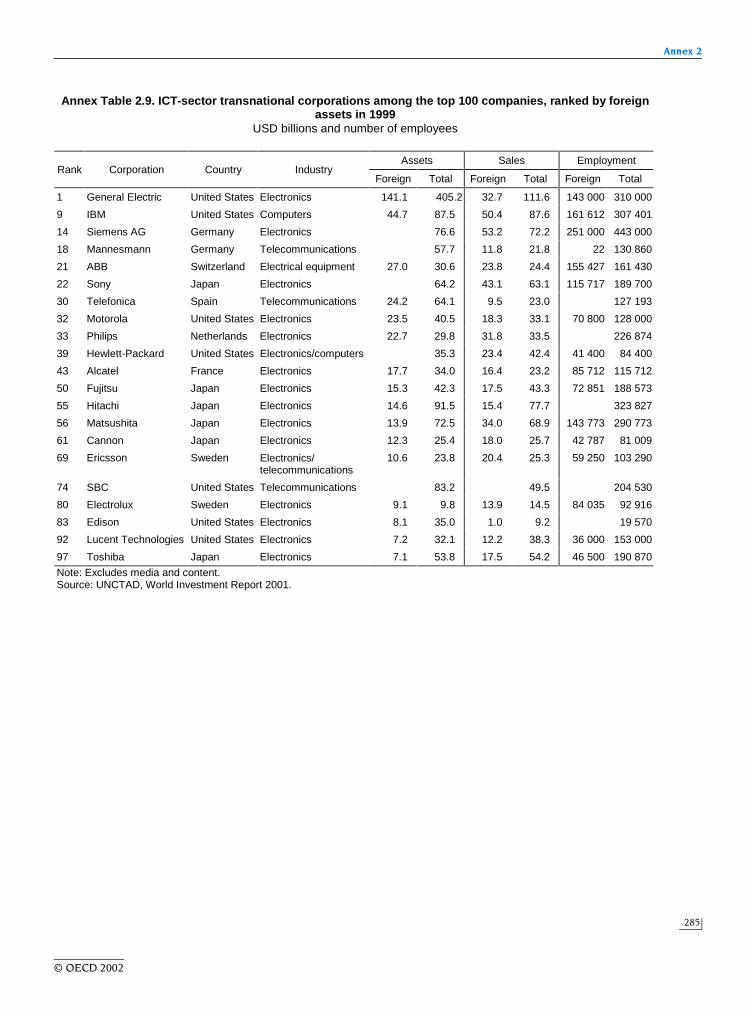
Annex 2
285
Annex Table 2.9. ICT-sector transnational corporations among the top 100 companies, ranked by foreignassets in 1999
USD billions and number of employees
Assets Sales EmploymentRank Corporation Country Industry
Foreign Total Foreign Total Foreign Total
1 General Electric United States Electronics 141.1 405.2 32.7 111.6 143 000 310 000
9 IBM United States Computers 44.7 87.5 50.4 87.6 161 612 307 401
14 Siemens AG Germany Electronics 76.6 53.2 72.2 251 000 443 000
18 Mannesmann Germany Telecommunications 57.7 11.8 21.8 22 130 860
21 ABB Switzerland Electrical equipment 27.0 30.6 23.8 24.4 155 427 161 430
22 Sony Japan Electronics 64.2 43.1 63.1 115 717 189 700
30 Telefonica Spain Telecommunications 24.2 64.1 9.5 23.0 127 193
32 Motorola United States Electronics 23.5 40.5 18.3 33.1 70 800 128 000
33 Philips Netherlands Electronics 22.7 29.8 31.8 33.5 226 874
39 Hewlett-Packard United States Electronics/computers 35.3 23.4 42.4 41 400 84 400
43 Alcatel France Electronics 17.7 34.0 16.4 23.2 85 712 115 712
50 Fujitsu Japan Electronics 15.3 42.3 17.5 43.3 72 851 188 573
55 Hitachi Japan Electronics 14.6 91.5 15.4 77.7 323 827
56 Matsushita Japan Electronics 13.9 72.5 34.0 68.9 143 773 290 773
61 Cannon Japan Electronics 12.3 25.4 18.0 25.7 42 787 81 009
69 Ericsson Sweden Electronics/telecommunications
10.6 23.8 20.4 25.3 59 250 103 290
74 SBC United States Telecommunications 83.2 49.5 204 530
80 Electrolux Sweden Electronics 9.1 9.8 13.9 14.5 84 035 92 916
83 Edison United States Electronics 8.1 35.0 1.0 9.2 19 570
92 Lucent Technologies United States Electronics 7.2 32.1 12.2 38.3 36 000 153 000
97 Toshiba Japan Electronics 7.1 53.8 17.5 54.2 46 500 190 870
Note: Excludes media and content.Source: UNCTAD, World Investment Report 2001.
© OECD 2002

OECD Information Technology Outlook 2002
286
Annex Table 2.10. ICT-sector affiliates under majority controlNumber of enterprises
ITequipment
Communicationequipment
Telecommunicationservices
Computerservices
Allindustries
1990 1998 1990 1998 1990 1998 1990 1998 1990 1998
Canada .. .. 39 57 .. .. .. .. 6 593 7 501
Czech Republic .. .. .. 50 .. .. .. .. .. 12 096
Finland .. 2 .. 14 .. .. .. .. .. 1 491
France .. 22 .. 77 .. .. .. .. .. ..
Germany 29 23 .. 53 .. .. .. .. 7 832 8 343
Hungary .. 33 .. 113 .. .. .. .. .. 25 992
Ireland .. 32 .. 29 .. .. .. .. .. ..
Italy 6 10 32 40 .. .. .. .. .. ..
Japan 3 6 48 25 .. .. .. .. 948 1 082
Luxembourg .. .. .. .. .. .. .. .. .. ..
Mexico 37 .. 144 .. .. .. .. .. 4 019 ..
Netherlands .. 5 .. 5 .. .. .. .. .. 3 132
Norway 2 0 6 10 .. .. .. .. .. ..
Poland .. 5 .. 32 .. .. .. .. .. 4 055
Sweden 6 6 8 11 .. .. .. .. 2 302 3 954
Turkey 0 0 3 5 .. .. .. .. .. ..
United Kingdom 42 40 102 108 .. .. .. .. .. ..
United States 87 74 188 191 14 .. 86 147 10 282 9 738
Note: .. data not available. 1997 instead of 1998 for Canada, 1991 and 1999 for Italy, Japan and Norway, 1993 instead of 1990for Mexico, 1999 for Poland, 1992 and 1998 for Turkey, 1993 and 1998 for the United Kingdom. Affiliates are enterprises,except for Turkey, Norway and Ireland which report establishments. All countries report majority-owned, except the UnitedStates which reports both majority-owned and minority-owned affiliates.Source: OECD, AFA database, September 2001.
© OECD 2002
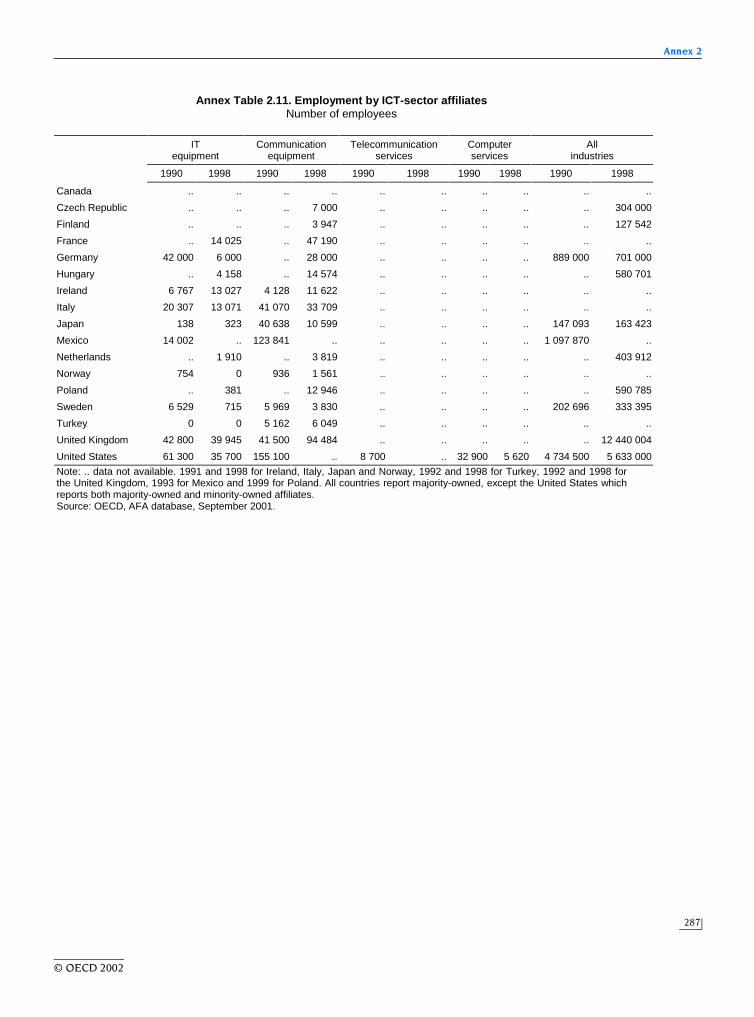
Annex 2
287
Annex Table 2.11. Employment by ICT-sector affiliatesNumber of employees
ITequipment
Communicationequipment
Telecommunicationservices
Computerservices
Allindustries
1990 1998 1990 1998 1990 1998 1990 1998 1990 1998
Canada .. .. .. .. .. .. .. .. .. ..
Czech Republic .. .. .. 7 000 .. .. .. .. .. 304 000
Finland .. .. .. 3 947 .. .. .. .. .. 127 542
France .. 14 025 .. 47 190 .. .. .. .. .. ..
Germany 42 000 6 000 .. 28 000 .. .. .. .. 889 000 701 000
Hungary .. 4 158 .. 14 574 .. .. .. .. .. 580 701
Ireland 6 767 13 027 4 128 11 622 .. .. .. .. .. ..
Italy 20 307 13 071 41 070 33 709 .. .. .. .. .. ..
Japan 138 323 40 638 10 599 .. .. .. .. 147 093 163 423
Mexico 14 002 .. 123 841 .. .. .. .. .. 1 097 870 ..
Netherlands .. 1 910 .. 3 819 .. .. .. .. .. 403 912
Norway 754 0 936 1 561 .. .. .. .. .. ..
Poland .. 381 .. 12 946 .. .. .. .. .. 590 785
Sweden 6 529 715 5 969 3 830 .. .. .. .. 202 696 333 395
Turkey 0 0 5 162 6 049 .. .. .. .. .. ..
United Kingdom 42 800 39 945 41 500 94 484 .. .. .. .. .. 12 440 004
United States 61 300 35 700 155 100 .. 8 700 .. 32 900 5 620 4 734 500 5 633 000
Note: .. data not available. 1991 and 1998 for Ireland, Italy, Japan and Norway, 1992 and 1998 for Turkey, 1992 and 1998 forthe United Kingdom, 1993 for Mexico and 1999 for Poland. All countries report majority-owned, except the United States whichreports both majority-owned and minority-owned affiliates.Source: OECD, AFA database, September 2001.
© OECD 2002

OECD Information Technology Outlook 2002
288
Annex Table 2.12. Value added for ICT sector affiliatesUSD millions
ITequipment
Communicationequipment
Telecommunicationservices
Computerservices
Allindustries
1990 1998 1990 1998 1990 1998 1990 1998 1990 1998
Canada .. .. .. .. .. .. .. .. .. ..
Czech Republic .. .. .. 80 .. .. .. .. .. 6 151
Finland .. 36 .. 440 .. .. .. .. .. 9 111
France .. 1 429 .. 3 094 .. .. .. .. .. ..
Germany .. .. .. .. .. .. .. .. .. ..
Hungary .. 0 .. 0 .. .. .. .. .. 11
Ireland 1 600 3 516 329 1 454 .. .. .. .. .. ..
Italy .. .. .. .. .. .. .. .. .. ..
Japan .. 22 .. 1 035 .. .. .. .. .. 14 894
Mexico 387 .. 1 408 .. .. .. .. .. 24 364 ..
Netherlands .. 260 .. 273 .. .. .. .. .. 30 495
Norway .. 0 50 156 .. .. .. .. .. ..
Poland .. .. .. .. .. .. .. .. .. ..
Sweden 681 93 297 210 .. .. .. .. 10 590 21 540
Switzerland .. .. .. .. .. .. .. .. .. ..
Turkey 0 0 661 0 .. .. .. .. .. ..
United Kingdom 3 606 3 673 3 230 7 907 .. .. .. .. .. 668 574
United States .. 1 552 .. .. .. .. .. 4 635 239 279 418 138
Note: .. no data. 1991 and 1998 for Ireland, 1992 and 1998 for Turkey, 1993 and 1998 for the United Kingdom, 1993 for Mexico.All countries report majority-owned, except the United States which reports both majority-owned and minority-owned affiliates.Source: OECD, AFA database, September 2001.
© OECD 2002

Annex 2
289
Annex Table 2.13. Exports of ICT-sector affiliatesUSD millions
ITequipment
Communicationequipment
Telecommunicationservices
Computerservices
Allindustries
1990 1998 1990 1998 1990 1998 1990 1998 1990 1998
Canada .. .. 733 676 .. .. .. .. 64 869 88 049
Czech Republic .. .. .. .. .. .. .. .. .. ..
Finland .. 275 .. 674 .. .. .. .. .. ..
France .. 4 599 .. 8 009 .. .. .. .. .. ..
Germany .. .. .. .. .. .. .. .. .. ..
Hungary .. .. .. .. .. .. .. .. .. ..
Ireland .. .. .. .. .. .. .. .. .. ..
Italy .. .. .. .. .. .. .. .. .. ..
Japan 2 9 3 261 1 236 .. .. .. .. 11 141 13 666
Mexico 287 .. 153 .. .. .. .. .. 3 977 ..
Netherlands .. 1 710 .. 412 .. .. .. .. .. 70 530
Norway .. .. .. .. .. .. .. .. .. ..
Poland .. .. .. .. .. .. .. .. .. ..
Sweden 953 149 641 333 .. .. .. .. 12 459 22 482
Switzerland .. .. .. .. .. .. .. .. .. ..
Turkey .. .. .. .. .. .. .. .. .. ..
United Kingdom .. .. .. .. .. .. .. .. .. ..
United States 1 747 1 489 5 395 .. 1 .. 122 109 92 308 150 836
Note: .. data not available. 1990 and 1995 for Canada, 1993 for Mexico. All countries report majority-owned, except the UnitedStates which reports both majority-owned and minority-owned affiliates.Source: OECD, AFA database, September 2001.
© OECD 2002

OECD Information Technology Outlook 2002
290
Annex Table 2.14. R&D expenditure by ICT-sector affiliatesUSD millions
ITequipment
Communicationequipment
Telecommunicationservices
Computerservices
Allindustries
1990 1998 1990 1998 1990 1998 1990 1998 1990 1998
Canada 180 146 215 338 .. .. .. .. 1 391 2 107
Czech Republic .. 0 .. 1 .. .. .. .. .. 12
Finland .. .. .. 49 .. .. .. .. .. 331
France .. 191 .. 913 .. .. .. .. .. 3 211
Germany .. .. .. .. .. .. .. .. .. ..
Hungary .. .. .. .. .. .. .. .. .. ..
Ireland 9 35 12 85 .. .. .. .. 189 500
Italy 202 .. 711 .. .. .. .. .. .. ..
Japan 0 0 92 84 .. .. .. .. 606 1 386
Mexico .. .. .. .. .. .. .. .. .. ..
Netherlands .. 1 .. 107 .. .. .. .. .. 878
Norway .. .. .. .. .. .. .. .. .. ..
Poland .. 3 .. 11 .. .. .. .. .. ..
Sweden 21 9 87 17 .. .. .. .. 684 1 353
Switzerland .. .. .. .. .. .. .. .. .. ..
Turkey 0 0 3 0 .. .. .. .. .. 0
United Kingdom 477 107 468 305 .. .. 504 490 4 596 5 137
United States 622 250 1 106 3 118 .. .. 69 .. 9 465 19 260
Note: .. data not available. 1988 and 1998 for Canada, 1991 and 1997 for Ireland, 1992 for Italy, 1991 and 1998 for Japan, 1994and 1998 for the United Kingdom, 1990 and 1997 for the United States. All countries report majority-owned, except the UnitesStates which reports both majority-owned and minority-owned affiliates.Source: OECD AFA database, September 2001.
Annex Table 2.15. Sales by foreign affiliates in the United States, by country, 1998USD millions
World Europe Japan
All industries 1 881 865 1 080 158 453 381
Computers and electronic products 97 391 32 585 44 630
Computers and peripheral equipment 17 303 879 10 805
Communications equipment 26 685 6 619 8 212
Audio and video equipment - - -
Semiconductors and other electronic components 20 718 13 874 4 925
Navigational measuring and other instruments - 6 105 840
Magnetic and optical media 2 887 - -
Telecommunications 24 123 - 103
Information services and data processing services 3 439 - -
Computer systems design and related services 7 481 5 079 1 544
Total ICT sector 132 434 - -
Source: US Department of Commerce, 2001.
© OECD 2002
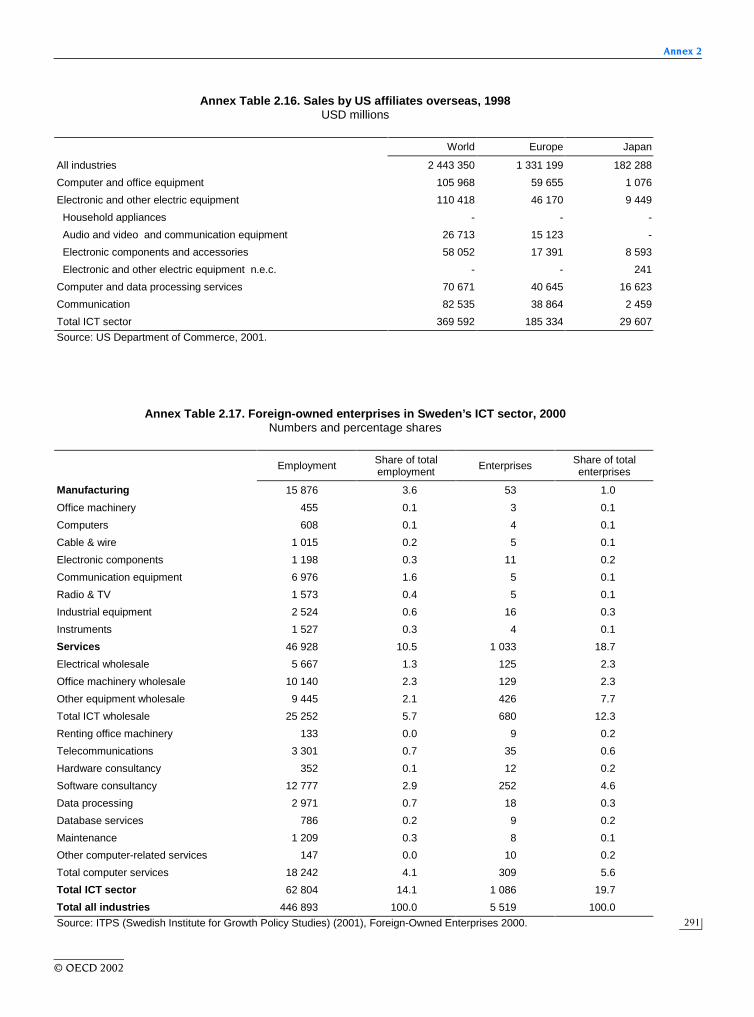
Annex 2
291
Annex Table 2.16. Sales by US affiliates overseas, 1998USD millions
World Europe Japan
All industries 2 443 350 1 331 199 182 288
Computer and office equipment 105 968 59 655 1 076
Electronic and other electric equipment 110 418 46 170 9 449
Household appliances - - -
Audio and video and communication equipment 26 713 15 123 -
Electronic components and accessories 58 052 17 391 8 593
Electronic and other electric equipment n.e.c. - - 241
Computer and data processing services 70 671 40 645 16 623
Communication 82 535 38 864 2 459
Total ICT sector 369 592 185 334 29 607
Source: US Department of Commerce, 2001.
Annex Table 2.17. Foreign-owned enterprises in Sweden’s ICT sector, 2000Numbers and percentage shares
Employment Share of totalemployment
Enterprises Share of totalenterprises
Manufacturing 15 876 3.6 53 1.0
Office machinery 455 0.1 3 0.1
Computers 608 0.1 4 0.1
Cable & wire 1 015 0.2 5 0.1
Electronic components 1 198 0.3 11 0.2
Communication equipment 6 976 1.6 5 0.1
Radio & TV 1 573 0.4 5 0.1
Industrial equipment 2 524 0.6 16 0.3
Instruments 1 527 0.3 4 0.1
Services 46 928 10.5 1 033 18.7
Electrical wholesale 5 667 1.3 125 2.3
Office machinery wholesale 10 140 2.3 129 2.3
Other equipment wholesale 9 445 2.1 426 7.7
Total ICT wholesale 25 252 5.7 680 12.3
Renting office machinery 133 0.0 9 0.2
Telecommunications 3 301 0.7 35 0.6
Hardware consultancy 352 0.1 12 0.2
Software consultancy 12 777 2.9 252 4.6
Data processing 2 971 0.7 18 0.3
Database services 786 0.2 9 0.2
Maintenance 1 209 0.3 8 0.1
Other computer-related services 147 0.0 10 0.2
Total computer services 18 242 4.1 309 5.6
Total ICT sector 62 804 14.1 1 086 19.7
Total all industries 446 893 100.0 5 519 100.0
Source: ITPS (Swedish Institute for Growth Policy Studies) (2001), Foreign-Owned Enterprises 2000.
© OECD 2002
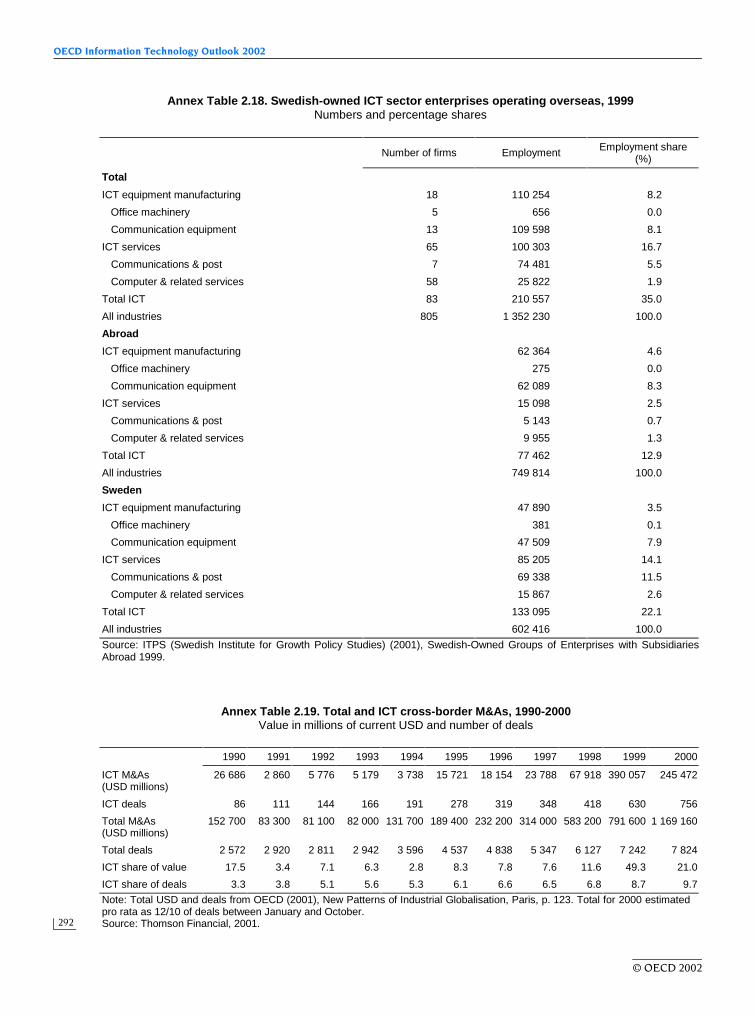
OECD Information Technology Outlook 2002
292
Annex Table 2.18. Swedish-owned ICT sector enterprises operating overseas, 1999Numbers and percentage shares
Number of firms Employment Employment share(%)
Total
ICT equipment manufacturing 18 110 254 8.2
Office machinery 5 656 0.0
Communication equipment 13 109 598 8.1
ICT services 65 100 303 16.7
Communications & post 7 74 481 5.5
Computer & related services 58 25 822 1.9
Total ICT 83 210 557 35.0
All industries 805 1 352 230 100.0
Abroad
ICT equipment manufacturing 62 364 4.6
Office machinery 275 0.0
Communication equipment 62 089 8.3
ICT services 15 098 2.5
Communications & post 5 143 0.7
Computer & related services 9 955 1.3
Total ICT 77 462 12.9
All industries 749 814 100.0
Sweden
ICT equipment manufacturing 47 890 3.5
Office machinery 381 0.1
Communication equipment 47 509 7.9
ICT services 85 205 14.1
Communications & post 69 338 11.5
Computer & related services 15 867 2.6
Total ICT 133 095 22.1
All industries 602 416 100.0
Source: ITPS (Swedish Institute for Growth Policy Studies) (2001), Swedish-Owned Groups of Enterprises with SubsidiariesAbroad 1999.
Annex Table 2.19. Total and ICT cross-border M&As, 1990-2000Value in millions of current USD and number of deals
1990 1991 1992 1993 1994 1995 1996 1997 1998 1999 2000
ICT M&As(USD millions)
26 686 2 860 5 776 5 179 3 738 15 721 18 154 23 788 67 918 390 057 245 472
ICT deals 86 111 144 166 191 278 319 348 418 630 756
Total M&As(USD millions)
152 700 83 300 81 100 82 000 131 700 189 400 232 200 314 000 583 200 791 600 1 169 160
Total deals 2 572 2 920 2 811 2 942 3 596 4 537 4 838 5 347 6 127 7 242 7 824
ICT share of value 17.5 3.4 7.1 6.3 2.8 8.3 7.8 7.6 11.6 49.3 21.0
ICT share of deals 3.3 3.8 5.1 5.6 5.3 6.1 6.6 6.5 6.8 8.7 9.7
Note: Total USD and deals from OECD (2001), New Patterns of Industrial Globalisation, Paris, p. 123. Total for 2000 estimatedpro rata as 12/10 of deals between January and October.Source: Thomson Financial, 2001.
© OECD 2002

Annex 2
293
Annex Table 2.20. Top 25 ICT M&A deals, 1990-2000Value of deals in millions of current USD
Year Target name Acquirer name Acquirer nation Target nationValue of
transaction(USD millions)
1999 Mannesmann AG Vodafone AirTouch PLC United Kingdom Germany 202 785
1999 AirTouch Communications Inc Vodafone Group PLC United Kingdom United States 60 287
2000 Orange PLC (Mannesmann AG) France Telecom SA (France) France United Kingdom 45 967
2000 Seagram Co Ltd Vivendi SA France Canada 40 428
1999 Orange PLC Mannesmann AG Germany United Kingdom 32 595
2000 Airtel SA Vodafone AirTouch PLC United Kingdom Spain 14 365
1999 One 2 One Deutsche Telekom AG Germany United Kingdom 13 629
1998 PolyGram NV (Philips Electrn) Universal Studios Inc United States Netherlands 10 236
2000 Telecommunicacoes de Sao Paulo Telefonica SA Spain Brazil 10 213
1999 Frontier Corp Global Crossing Ltd Bermuda United States 10 063
1999 E-Plus Mobilfunk GmbH (Otelo) BellSouth GmbH (KPN, BellSouth) Netherlands Germany 9 400
1998 Bay Networks Inc Nortel Networks Corp Canada United States 9 269
1990 MCA Inc Matsushita Electric Industrial Japan United States 7 406
2000 Newbridge Networks Corp Alcatel SA France Canada 7 058
2000 Alteon Websystems Inc Nortel Networks Corp Canada United States 7 057
1998 Excel Communications Inc Teleglobe Inc Canada United States 6 407
2000 Lycos Inc Terra Networks (Telefonica SA) Spain United States 6 188
1995 MCA Inc (Matsushita Electric) Seagram Co Ltd Canada United States 5 704
2000 Verio Inc NTT Communications Corp Japan United States 5 694
1998 MediaOne Grp-Wireless & Cable AirTouch Communications Inc United States United States 5 676
2000 Pearson Television (Pearson) CLT-UFA (Cie Luxembourgeoise) Luxembourg United Kingdom 5 337
2000 World Online International NV Tiscali SpA Italy Netherlands 4 931
1998 DSC Communications Corp Alcatel Alsthom CGE France United States 4 685
2000 Endemol Entertainment NV Telefonica SA Spain Netherlands 4 612
2000 Global One Co France Telecom SA (France) France United States 4 350
Source: Thomson Financial, 2001.
© OECD 2002

OECD Information Technology Outlook 2002
294
Annex Table 2.21. Cross-border M&As by ICT industry, 1990-2000Value in millions of current USD and number of deals
1990 1991 1992 1993 1994 1995 1996 1997 1998 1999 2000 CAGR(%)
Total ICT (value) 26 686 2 860 5 776 5 179 3 738 15 721 18 154 23 788 67 918 390 057 245 472 24.8
Total ICT (number of deals) 86 111 144 166 191 278 319 348 418 630 756 24.3
Primary target
Manufacturing 3 666 355 3 934 1 961 1 225 2 810 2 555 6 772 21 253 22 973 34 636 25.2
Office & computer equip. 585 162 50 40 87 1 031 1 178 2 654 10 504 4 905 6 014 26.2
Communication equip. 2 540 165 3 799 865 482 568 937 1 056 5 928 5 986 12 852 17.6
Electronic components 541 28 85 1 056 656 1 212 440 3 061 4 821 12 081 15 770 40.1
ICT media (content) 9 120 953 74 353 55 5 847 304 1 377 10 554 80 47 477 17.9
Services 13 400 782 1 393 1 725 2 224 5 633 10 104 12 516 33 623 364 034 157 775 28.0
Computer & related 2 297 367 586 1 042 1 659 2 896 1 592 3 578 6 622 17 516 49 714 36.0
Telecommunication 8 466 262 618 648 526 2 622 8 383 8 304 26 138 346 300 108 004 29.0
Wholesale 2 638 153 189 35 38 115 129 634 863 218 57 -31.9
Other non-primary ICT 501 770 376 1 140 235 1 430 5 191 3 124 2 488 2 969 5 584 27.3
Primary acquirer
Manufacturing 14 671 668 4 087 2 159 918 2 541 4 258 6 160 22 488 25 697 32 088 8.1
Office & computer equip. 498 174 153 519 261 869 791 2 612 413 932 1 646 12.7
Communication equip. 12 254 125 3 674 444 545 554 626 1 594 20 727 17 230 26 761 8.1
Electronic components 1 918 370 260 1 195 112 1 118 2 841 1 954 1 349 7 535 3 680 6.7
ICT media (content) 1 714 934 54 405 220 55 47 464 10 635 87 3 227 6.5
Services 4 459 440 1 046 1 086 1 095 5 485 7 036 9 330 26 798 352 304 154 635 42.6
Computer & related 1 035 365 571 662 500 1 514 1 331 3 554 3 532 7 389 27 995 39.1
Telecommunication 3 424 55 465 394 493 3 842 5 609 5 531 22 192 344 639 126 192 43.4
Wholesale 0 20 10 30 102 128 95 246 1 075 276 448 n.a.
Other non-primary ICT 7 556 1 732 633 1 904 1 623 7 567 6 765 8 052 17 556 11 780 58 302 22.7
Source: Thomson Financial, 2001.
© OECD 2002

Annex 2
295
Annex Table 2.22. Cross-border M&As by ICT industry target, 1990-2000Value in millions of current USD and number of deals
1990 1991 1992 1993 1994 1995 1996 1997 1998 1999 2000 CAGR(%)
Total
Total ICT (value) 26 686 2 860 5 776 5 179 3 738 15 721 18 154 23 788 67 918 390 057 245 472 82.0 805 349
Total ICT (number ofdeals)
86 111 144 166 191 278 319 348 418 630 756 77.9 3 447
Value
Target (primary)
Manufacturing 3 666 355 3 934 1 961 1 225 2 810 2 555 6 772 21 253 22 973 34 636 84.5 102 140
Communication 2 540 165 3 799 865 482 568 937 1 056 5 928 5 986 12 852 40.6 35 179
Office & computer 585 162 50 40 87 1 031 1 178 2 654 10 504 4 905 6 014 92.7 27 210
Components & other 541 28 85 1 056 656 1 212 440 3 061 4 821 12 081 15 770 281.8 39 752
Other ICT media 9 120 953 74 353 55 5 847 304 1 377 10 554 80 47 477 42.1 76 194
Services 13 400 782 1 393 1 725 2 224 5 633 10 104 12 516 33 623 364 034 157 775 107.7 603 208
Computer & related 2 297 367 586 1 042 1 659 2 896 1 592 3 578 6 622 17 516 49 714 206.4 87 869
Telecommunications 8 466 262 618 648 526 2 622 8 383 8 304 26 138 346 300 108 004 117.6 510 270
Wholesale 2 638 153 189 35 38 115 129 634 863 218 57 -9.8 5 069
Other 501 770 376 1 140 235 1 430 5 191 3 124 2 488 2 969 5 584 101.5 23 808
Number of deals
Target (primary)
Manufacturing 38 34 54 56 60 80 78 78 92 97 105 17.6 772
Communication 8 7 18 22 23 26 25 26 28 33 25 21.3 241
Office & computer 12 15 16 13 16 25 13 22 20 15 21 7.5 188
Components & other 18 12 20 21 21 29 40 30 44 49 59 22.8 343
Other ICT media 5 9 8 7 9 16 15 15 14 21 31 52.0 150
Services 22 46 58 73 95 126 166 185 254 433 516 224.5 1 974
Computer & related 8 28 28 41 54 70 97 85 150 310 377 461.3 1 248
Telecommunications 11 12 20 21 31 46 52 72 83 104 125 103.6 577
Wholesale 3 6 10 11 10 10 17 28 21 19 14 36.7 149
Other 21 22 24 30 27 56 60 70 58 79 104 39.5 551
Source: Thomson Financial, 2001.
© OECD 2002

OECD Information Technology Outlook 2002
296
Annex Table 2.23. Cross-border M&As by ICT-industry acquirer, 1990-2000Value in millions of current USD and number of deals
1990 1991 1992 1993 1994 1995 1996 1997 1998 1999 2000 CAGR%
Total
Total ICT (value) 26 686 2 860 5 776 5 179 3 738 15 721 18 154 23 788 67 918 390 057 245 472 82.0 805 349
Total ICT(number of deals)
86 111 144 166 191 278 319 348 418 630 756 77.9 3 447
Value
Acquirer (primary)
Manufacturing 14 671 668 4 087 2 159 918 2 541 4 258 6 160 22 488 25 697 32 088 11.9 115 734
Communication 12 254 125 3 674 444 545 554 626 1 594 20 727 17 230 26 761 11.8 84 535
Office & computer 498 174 153 519 261 869 791 2 612 413 932 1 646 23.0 8 869
Components & other 1 918 370 260 1 195 112 1 118 2 841 1 954 1 349 7 535 3 680 9.2 22 330
Other ICT media 1 714 934 54 405 220 55 47 464 10 635 87 3 227 8.8 17 841
Services 4 459 440 1 046 1 086 1 095 5 485 7 036 9 330 26 798 352 304 154 635 336.8 563 714
Computer & related 1 035 365 571 662 500 1 514 1 331 3 554 3 532 7 389 27 995 260.5 48 448
Telecommunications 3 424 55 465 394 493 3 842 5 609 5 531 22 192 344 639 126 192 358.5 512 837
Wholesale 0 20 10 30 102 128 95 246 1 075 276 448 2 430
Other 7 556 1 732 633 1 904 1 623 7 567 6 765 8 052 17 556 11 780 58 302 67.2 123 471
Number of deals
Acquirer (primary)
Manufacturing 38 39 52 57 58 88 82 89 90 110 113 19.7 816
Communication 11 11 18 20 21 28 25 30 35 36 36 22.7 271
Office & computer 12 14 17 17 20 20 23 24 25 28 27 12.5 227
Components & other 15 14 17 20 17 40 34 35 30 46 50 23.3 318
Other ICT media 3 7 3 5 6 13 11 16 21 19 29 86.7 133
Services 21 36 55 62 65 107 147 151 214 373 434 196.7 1 665
Computer & related 12 22 29 32 40 54 86 87 116 241 280 223.3 999
Telecommunications 9 9 21 24 20 41 43 52 78 119 140 145.6 556
Wholesale 0 5 5 6 5 12 18 12 20 13 14 110
Other 24 29 34 42 62 70 79 92 93 128 180 65.0 833
Source: Thomson Financial, 2001.
© OECD 2002

Annex 2
297
Annex Table 2.24. Cross-border ICT M&As (outflows), 1990-2000Value in millions of current USD
1990 1991 1992 1993 1994 1995 1996 1997 1998 1999 2000
Value USD millions 26 686 2 860 5 776 5 179 3 738 15 721 18 154 23 788 67 918 390 057 245 472
No. of deals 86 111 144 166 191 278 319 348 418 630 756
Acquirer/outflow
Australia 166 .. 8 564 105 345 4 242 1 971 38 1 851 216
Austria .. .. .. .. .. .. .. .. .. 10 32
Belgium .. .. .. .. .. .. .. 51 63 535 1 642
Canada 2 637 35 102 128 588 6 004 434 2 284 19 766 5 435 13 593
Czech Republic .. .. .. .. .. .. .. .. .. .. 765
Denmark .. 1 .. 2 39 .. 92 355 18 387 2 110
Finland 18 .. .. 28 .. .. .. 120 267 1 2 198
France 3 150 499 3 749 458 5 17 1 563 1 157 6 932 4 890 104 953
Germany 170 219 22 264 267 491 1 152 762 270 46 631 6 727
Greece .. .. .. .. .. .. .. 143 .. .. ..
Hungary .. .. .. .. .. .. .. .. .. .. 5
Iceland .. .. .. .. .. .. .. .. .. .. ..
Ireland .. .. .. .. 7 .. 8 6 2 1 28
Italy 2 873 .. .. .. .. .. 161 103 140 .. 7 242
Japan 9 035 80 61 103 91 430 1 073 1 420 304 283 5 984
Korea 4 .. .. .. 18 1 254 .. 503 112 335 ..
Luxembourg .. .. .. 42 12 .. .. 239 5 462
Mexico .. .. 208 .. .. .. 1 22 12 58 153
Netherlands 389 37 309 326 33 894 272 764 1 460 17 592 2 824
New Zealand .. .. .. .. .. .. .. 4 784 296
Norway .. .. .. .. 10 .. .. 243 89 101 2 267
Poland .. .. .. .. .. .. .. .. .. .. ..
Portugal .. .. .. .. .. .. .. .. .. 5 475
Slovak Republic .. .. .. .. .. .. .. .. .. .. ..
Spain 3 016 15 142 37 .. .. .. .. 41 653 28 623
Sweden 24 87 .. .. .. 44 8 80 732 203 4 680
Switzerland 140 114 13 .. 215 .. .. .. 313 2 143 149
Turkey .. .. .. .. .. .. .. .. .. .. ..
United Kingdom 175 247 409 131 562 600 3 870 3 124 4 190 273 796 31 353
United States 4 576 1 468 547 1 766 1 595 5 378 4 765 8 894 31 847 17 340 17 327
OECD 26 373 2 802 5 570 3 849 3 547 15 457 17 641 22 245 66 596 373 034 239 104
OECD share of world 98.8 98.0 96.4 74.3 94.9 98.3 97.2 93.5 98.1 95.6 97.4
Non-OECD 313 58 206 1 330 191 264 513 1 543 1 322 17 023 6 368
Source: Thomson Financial, 2001.
© OECD 2002

OECD Information Technology Outlook 2002
298
Annex Table 2.25. Cross-border ICT M&As (inflows), 1990-2000Value in millions of current USD
1990 1991 1992 1993 1994 1995 1996 1997 1998 1999 2000
Value USD millions 26 686 2 860 5 776 5 179 3 738 15 721 18 154 23 788 67 918 390 057 245 472
No. of deals 86 111 144 166 191 278 319 348 418 630 756
Target/inflow
Australia 107 .. .. 110 .. 80 1 783 460 603 894 544
Austria 166 .. .. 47 .. .. 15 126 157 .. 155
Belgium .. 276 9 86 40 3 17 2 143
Canada 5 24 3 334 247 2 362 628 643 4 720 6 496 51 372
Czech Republic .. .. .. .. .. 5 4 .. .. 339 855
Denmark 63 .. 12 2 .. .. .. 29 339 115 2 029
Finland .. .. 2 149 18 2 41 .. 31 105 ..
France 10 .. 174 634 170 610 878 145 186 1 591 4 500
Germany 535 574 45 28 12 204 94 804 1 100 216 207 6 627
Greece .. .. .. .. .. .. .. .. .. .. ..
Hungary .. .. .. .. .. 852 85 .. 27 77 68
Iceland .. .. .. .. .. .. .. .. .. .. ..
Ireland .. 61 .. .. .. .. 79 90 62 802 2 586
Italy 2 163 17 15 861 7 27 469 592 22 172 4 459
Japan .. .. 37 52 18 177 386 1 11 1 765 356
Korea .. .. .. .. .. .. .. .. .. .. 170
Luxembourg .. .. .. .. .. .. 984 11 19 1 789
Mexico 22 .. .. .. .. 39 .. 612 3 17 ..
Netherlands 13 56 3 588 61 382 .. 1 591 844 10 938 2 378 14 714
New Zealand 2 445 59 .. .. .. .. 287 138 410 14 58
Norway .. .. 239 24 .. .. .. 288 157 158 3 645
Poland .. 28 .. 76 .. 25 31 18 85 63 ..
Portugal .. .. .. .. .. 7 .. .. .. 13 20
Slovak Republic .. .. .. .. .. .. .. .. .. 41 2
Spain .. 43 186 .. .. 147 4 2 120 336 14 528
Sweden .. 114 95 162 14 69 65 390 35 476 3 960
Switzerland .. .. .. .. .. 5 21 2 .. 97 913
Turkey 18 .. .. .. .. .. .. .. 23 .. ..
United Kingdom 5 335 769 453 152 628 1 648 1 572 3 933 7 842 50 423 57 938
United States 9 701 945 410 860 1 478 7 168 8 688 12 399 36 694 99 065 50 573
OECD 20 583 2 690 5 535 3 561 2 974 13 513 17 745 21 519 63 593 381 663 224 004
OECD share of world 77.1 94.1 95.8 68.8 79.6 86.0 97.7 90.5 93.6 97.8 91.3
Non-OECD 6 103 170 241 1 618 764 2 208 409 2 269 4 325 8 394 21 468
Source: Thomson Financial, 2001.
© OECD 2002

Annex 2
299
Annex Table 2.26. Top 20 M&A deals targeting communication equipment manufacturing, 1990-2000Value in millions of current USD
Year Name of target Name of acquirer Nation ofacquirer Nation of target
Value oftransaction
(USD millions)
2000 Newbridge Networks Corp Alcatel SA France Canada 7 058
1998 DSC Communications Corp Alcatel Alsthom CGE France United States 4 685
1992 Alcatel NV (Alcatel Alsthom) Alcatel Alsthom CGE France Netherlands 3 580
1990 Telettra SpA (Fiat SpA) Alcatel Alsthom CGE France Italy 2 163
1999 Reltec Corp GEC PLC United Kingdom United States 2 102
2000 CoreTek Inc Nortel Networks Corp Canada United States 1 915
1999 XYLAN Corp Alcatel SA France United States 1 822
2000 Across Wireless AB Sonera Corp Finland Sweden 840
2000 Sunrise Communications AG TeleDanmark A/S Denmark Switzerland 808
2000 Italiana Telecomunicazioni SpA Investor Group United States Italy 761
1997 Satelites Mexicanos SA Investor Group United States Mexico 554
2000 Exalink Ltd Comverse Technology Inc United States Israel 480
1999 Netcom Systems Inc Bowthorpe PLC United Kingdom United States 479
1999 Stanford Telecommunications Newbridge Networks Corp Canada United States 469
2000 NGI Nokia Oy AB Finland Brazil 415
1999 Periphonics Corp Nortel Networks Corp Canada United States 399
1993 Telematics International Inc ECI Telecom Ltd Israel United States 279
1998 VTR Hipercable United International Holdings United States Chile 237
1999 Krone AG (Jenoptik AG) Gentek Inc United States Germany 218
1994 Ateliers des Charmilles SA Alcatel STR (Alcatel-Alsthom) Switzerland Switzerland 215
Source: Thomson Financial, 2001.
© OECD 2002

OECD Information Technology Outlook 2002
300
Annex Table 2.27. Top 20 M&A deals targeting computer and office equipment manufacturing, 1990-2000Value in millions of current USD
Year Name of target Name of acquirer Nation of acquirer Nation of targetValue of
transaction(USD millions)
1998 Bay Networks Inc Nortel Networks Corp Canada United States 9 269
1999 FORE Systems Inc GEC PLC United Kingdom United States 4 190
2000 National Computer Systems Inc Pearson PLC United Kingdom United States 2 521
2000 Racal Electronics PLC Thomson-CSF France United Kingdom 2 174
1996 Kingston Technology Corp Softbank Corp Japan United States 1 071
2000 Dictaphone Corp Lernout & Hauspie Speech Belgium United States 936
1997 Amdahl Corp Fujitsu Ltd Japan United States 925
1997 AST Research Inc Samsung Electronics Co Ltd Korea United States 496
1999 Kingston Technology (Softbank) Investor Group Macau United States 450
1998 Rubicon Group PLC Applied Power Inc United States United Kingdom 346
2000 GemStone Systems Inc Brokat Infosystems AG Germany United States 300
1997 Packard Bell NEC Inc NEC Corp Japan United States 285
1998 Emtec Magnetics GmbH (Kohap) Investor Group United States Germany 260
1990 Mannesmann Kienzle-Operations Digital Equipment Corp United States Germany 236
1995 Maxtor Corp Hyundai Electronics Industries South Korea United States 228
1998 Packard Bell NEC Inc NEC Corp Japan United States 225
1995 Lannet Data Communications Ltd Madge Networks (Madge NV) United States Israel 224
1997 Tech Pacific Holdings Ltd Hagemeyer NV Netherlands Australia 219
1995 Pyramid Technology Corp Siemens Nixdorf Info AG Germany United States 205
1997 Quantum-Recording-Head Bus Matsushita Kotobuki Japan United States 200
Source: Thomson Financial, 2001.
© OECD 2002

Annex 2
301
Annex Table 2.28. Top 20 M&A deals targeting electronic equipment and components manufacturing,1990-2000
Value in millions of current USD
Year Name of target Name of acquirer Nation of acquirer Nation of targetValue of
transaction(USD millions)
2000 Alteon Websystems Inc Nortel Networks Corp Canada United States 7 057
2000 Pirelli SpA-Optical Components Corning Inc United States Italy 3 580
1999 JDS Fitel (Furukawa Elec Co) Uniphase Corp United States Canada 3 058
1999 DII Group Flextronics International Ltd Singapore United States 2 591
1998 Berg Electronics Corp Framatome Connectors Intl France United States 1 877
1999 LG Electronics-Crystal Display Koninklijke Philips Electronic Netherlands South Korea 1 600
1999 Siemens AG-Optical Fiber,Cable Corning Inc United States Germany 1 400
1998 Tracor Inc GEC PLC United Kingdom United States 1 323
1999 VLSI Technology Inc Koninklijke Philips Electronic Netherlands United States 1 163
2000 Altitun AB (ADC Telecommun Inc) ADC Telecommunications Inc United States Sweden 872
1995 Modern Advanced Electronics Samsung Group South Korea China 840
1997 Philips Car Systems Mannesmann VDO AG(Mannesmann)
Germany United States 754
1993 Nuovo Pignone General Electric Co United States Italy 661
1999 AFC Cable Systems Inc Tyco International Ltd Bermuda United States 596
2000 Element 14 Ltd Broadcom Corp United States United Kingdom 594
2000 Proxima ASA In Focus Systems Inc United States Norway 478
2000 World-wide Fiber Inc 360Networks Inc Canada United States 420
2000 Zarak Systems Corp Spirent PLC United Kingdom United States 410
1997 Life Sciences Intl PLC Thermo Instrument Systems Inc United States United Kingdom 392
1997 Techem AG Investor Group United Kingdom Germany 370
Source: Thomson Financial, 2001.
© OECD 2002
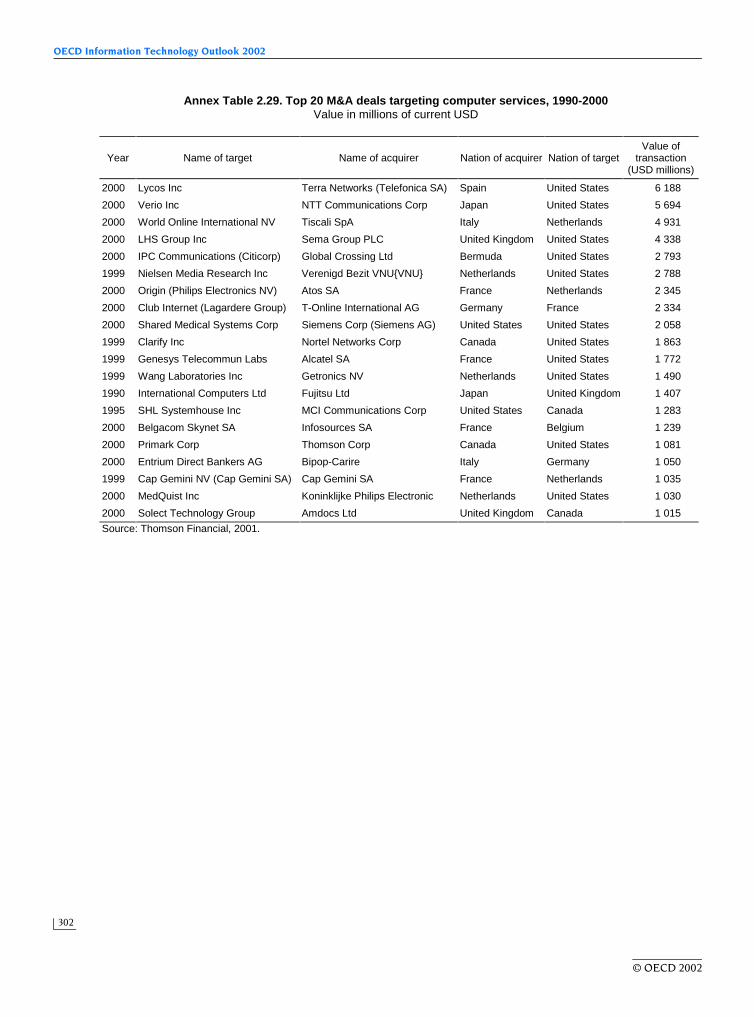
OECD Information Technology Outlook 2002
302
Annex Table 2.29. Top 20 M&A deals targeting computer services, 1990-2000Value in millions of current USD
Year Name of target Name of acquirer Nation of acquirer Nation of targetValue of
transaction(USD millions)
2000 Lycos Inc Terra Networks (Telefonica SA) Spain United States 6 188
2000 Verio Inc NTT Communications Corp Japan United States 5 694
2000 World Online International NV Tiscali SpA Italy Netherlands 4 931
2000 LHS Group Inc Sema Group PLC United Kingdom United States 4 338
2000 IPC Communications (Citicorp) Global Crossing Ltd Bermuda United States 2 793
1999 Nielsen Media Research Inc Verenigd Bezit VNU{VNU} Netherlands United States 2 788
2000 Origin (Philips Electronics NV) Atos SA France Netherlands 2 345
2000 Club Internet (Lagardere Group) T-Online International AG Germany France 2 334
2000 Shared Medical Systems Corp Siemens Corp (Siemens AG) United States United States 2 058
1999 Clarify Inc Nortel Networks Corp Canada United States 1 863
1999 Genesys Telecommun Labs Alcatel SA France United States 1 772
1999 Wang Laboratories Inc Getronics NV Netherlands United States 1 490
1990 International Computers Ltd Fujitsu Ltd Japan United Kingdom 1 407
1995 SHL Systemhouse Inc MCI Communications Corp United States Canada 1 283
2000 Belgacom Skynet SA Infosources SA France Belgium 1 239
2000 Primark Corp Thomson Corp Canada United States 1 081
2000 Entrium Direct Bankers AG Bipop-Carire Italy Germany 1 050
1999 Cap Gemini NV (Cap Gemini SA) Cap Gemini SA France Netherlands 1 035
2000 MedQuist Inc Koninklijke Philips Electronic Netherlands United States 1 030
2000 Solect Technology Group Amdocs Ltd United Kingdom Canada 1 015
Source: Thomson Financial, 2001.
© OECD 2002

Annex 2
303
Annex Table 2.30. Top 20 M&A deals targeting communications services, 1990-2000Value in millions of current USD
Year Name of target Name of acquirer Nation ofacquirer Nation of target
Value oftransaction
(USD millions)
1999 Mannesmann AG Vodafone AirTouch PLC United Kingdom Germany 202 785
1999 AirTouch Communications Inc Vodafone Group PLC United Kingdom United States 60 287
2000 Orange PLC (Mannesmann AG) France Telecom SA (France) France United Kingdom 45 967
1999 Orange PLC Mannesmann AG Germany United Kingdom 32 595
2000 Airtel SA Vodafone AirTouch PLC United Kingdom Spain 14 365
1999 One 2 One Deutsche Telekom AG Germany United Kingdom 13 629
2000 Telecommunicacoes de Sao Paulo Telefonica SA Spain Brazil 10 213
1999 Frontier Corp Global Crossing Ltd Bermuda United States 10 063
1999 E-Plus Mobilfunk GmbH (Otelo) BellSouth GmbH (KPN,BellSouth) Netherlands Germany 9 400
1998 Excel Communications Inc Teleglobe Inc Canada United States 6 407
1998 MediaOne Grp-Wireless & Cable AirTouch Communications Inc United States United States 5 676
2000 Pearson Television (Pearson) CLT-UFA (Cie Luxembourgeoise) Luxembourg United Kingdom 5 337
2000 Global One Co France Telecom SA (France) France United States 4 350
1998 Telus Corp BC Telecom (Anglo-CA Telephone) Canada Canada 3 107
1990 Telefonica de Argentina SA Cointel Spain Argentina 3 016
2000 Deutsche Telekom AG-North Investor Group United States Germany 2 785
2000 Cointel Telefonica Internacional SA Spain Argentina 2 743
1990 Telecom Argentina STET-France Nortel Inversora SA Italy Argentina 2 578
1990 Telecom Corp of New Zealand Investor Group United States New Zealand 2 444
2000 Telesudeste Celular Telefonica SA Spain Brazil 2 432
Source: Thomson Financial, 2001.
© OECD 2002

OECD Information Technology Outlook 2002
304
Annex Table 2.31. Top 20 M&A deals targeting ICT wholesaling, 1990-2000Value in millions of current USD
Year Name of target Name of acquirer Nation ofacquirer Nation of target
Value oftransaction
(USD millions)
1990 STC PLC Nortel Networks Corp Canada United Kingdom 2 636
1998 Computer 2000 AG (Kloeckner) Tech Data Corp United States Germany 384
1997 Datacraft Ltd Dimension Data Australia Pty Australia Australia 229
1998 Westcon Group Inc Datatec Ltd South Africa United States 171
1997 Peak Technologies Group Inc Moore Corp Ltd Canada United States 170
1991 MEMEC PLC Raab Karcher (UK) Ltd (VEBA AG) United Kingdom United Kingdom 136
1998 Computer 2000 AG (Tech Data) Tech Data Corp United States Germany 136
1997 Santech Micro Group ASA CHS Electronics Inc United States Sweden 118
1998 Macrotron AG (Tech Data) Ingram Micro Inc United States Germany 100
1992 Technology PLC International Computers Ltd United Kingdom United Kingdom 76
1992 Edata Scandinavia AB Storage Technology Corp United States Sweden 75
1999 Acer Computer Intl (Acer Inc) Acer Inc Chinese Taipei Singapore 74
1999 ilion Group PLC Landis Holdings (UK) Ltd United Kingdom United Kingdom 64
1995 GBC Technologies Inc Globelle Corp Canada United States 62
1996 Summit Systems Misys PLC United Kingdom United States 61
1998 RBR Group Ltd Datatec Ltd South Africa United Kingdom 56
1997 Logical Networks (Datatec Ltd) Datatec Ltd South Africa United Kingdom 53
1997 Macrotron AG (Tech Data) Tech Data Corp United States Germany 35
1995 Financiere Top Log SA Persona Group PLC United Kingdom France 32
2000 Infopoint SA Econocom Group SA Belgium France 26
Source: Thomson Financial, 2001.
© OECD 2002

Annex 2
305
Annex Table 2.32. Top 20 M&A deals targeting media and content, 1990-2000Value in millions of current USD
Year Name of target Name of acquirer Nation ofacquirer Nation of target
Value oftransaction
(USD millions)
2000 Seagram Co Ltd Vivendi SA France Canada 40 428
1998 PolyGram NV (Philips Electrn) Universal Studios Inc United States Netherlands 10 236
1990 MCA Inc Matsushita Electric Industrial Japan United States 7 406
1995 MCA Inc (Matsushita Electric) Seagram Co Ltd Canada United States 5 704
2000 Endemol Entertainment NV Telefonica SA Spain Netherlands 4 612
1990 MGM/UA Communications Co Pathe Communications Corp United States United States 1 709
2000 SLEC Holdings Ltd EM.TV & Merchandising AG Germany United Kingdom 1 631
2000 Jim Henson Productions Inc EM.TV & Merchandising AG Germany United States 680
1997 All American Communications Pearson PLC United Kingdom United States 500
1997 Cineplex Odeon Corp Sony Retail Ent (Sony Corp) United States Canada 434
1991 SBK Record Productions Inc EMI Music Inc (Thorn EMI PLC) United States United States 431
1991 RCA Columbia Home Video Columbia Pictures Entmnt United States United States 350
1993 Motown Records PolyGram NV (Philips Electrn) Netherlands United States 301
1997 Priority Records (Capitol) Capitol Records Inc (EMI Group) United States United States 300
1996 Trema SA (MACIF) Hines Interests LP United States France 295
1998 Nimbus CD International Inc Carlton Communications PLC United Kingdom United States 265
1991 Cityvision PLC Blockbuster Entertainment Corp United States United Kingdom 135
1997 Stone Diamond Music Corp EMI Music Inc (Thorn EMI PLC) United States United States 132
1995 Carolco Pictures Inc Twentieth Century Fox Film United States United States 50
2000 Trimark Holdings Inc Lions Gate Entertainment Corp Canada United States 49
Source: Thomson Financial, 2001.
© OECD 2002

OECD Information Technology Outlook 2002
306
Annex Table 2.33. Cross-border strategic alliances in the ICT sector, 1990-2000 Number of alliances and percentage shares
1990 1991 1992 1993 1994 1995 1996 1997 1998 1999 2000
ICT alliances 41 89 410 324 353 291 140 223 197 137 130
Total alliances1 2 531 4 116 3 521 4 370 5 391 5 809 3 250 4 013 4 429 4 532 5 304
ICT share (%) 1.6 2.2 11.6 7.4 6.5 5.0 4.3 5.6 4.4 3.0 2.5
Number of deals
Manufacturing 21 42 174 155 159 102 40 64 62 18 6
Communication 4 9 51 62 50 45 16 25 28 5 2
Office & computer 6 11 36 28 46 21 8 14 13 3 0
Components & other 11 22 87 65 63 36 16 25 21 10 4
Other industries 7 2 31 15 14 10 8 12 17 21 24
Media 1 3 5 7 6 12 5 6 9 5 5
Services 12 42 200 147 174 167 87 141 109 93 95
Computer 8 20 80 75 107 97 49 84 79 72 75
Telecommunications 3 14 38 29 30 40 23 39 29 18 16
Wholesale 1 8 82 43 37 30 15 18 1 3 4
Share of deals
Manufacturing 51.2 47.2 42.4 47.8 45.0 35.1 28.6 28.7 31.5 13.1 4.6
Communication 9.8 10.1 12.4 19.1 14.2 15.5 11.4 11.2 14.2 3.6 1.5
Office & computer 14.6 12.4 8.8 8.6 13.0 7.2 5.7 6.3 6.6 2.2 0.0
Components & other 26.8 24.7 21.2 20.1 17.8 12.4 11.4 11.2 10.7 7.3 3.1
Other industries 17.1 2.2 7.6 4.6 4.0 3.4 5.7 5.4 8.6 15.3 18.5
Media 2.4 3.4 1.2 2.2 1.7 4.1 3.6 2.7 4.6 3.6 3.8
Services 29.3 47.2 48.8 45.4 49.3 57.4 62.1 63.2 55.3 67.9 73.1
Computer 19.5 22.5 19.5 23.1 30.3 33.3 35.0 37.7 40.1 52.6 57.7
Telecommunications 7.3 15.7 9.3 9.0 8.5 13.7 16.4 17.5 14.7 13.1 12.3
Wholesale 2.4 9.0 20.0 13.3 10.5 10.3 10.7 8.1 0.5 2.2 3.1
Note: Includes only cross-border alliances that are listed as completed, recorded by year of announcement and based on theprimary SIC code of the alliance.1. Total includes those not completed.Source: Thomson Financial, 2001.
© OECD 2002

Annex 2
307
Annex Table 2.34. Cross-border joint ventures and strategic alliances in the ICT sector, 1990-2000 Number of deals
1990 1991 1992 1993 1994 1995 1996 1997 1998 1999 2000
Total joint ventures (JV) 1 474 2 469 1 472 2 358 3 344 4 219 2 143 2 490 1 975 1 946 2 057
Total other strategicalliances(SA)
1 058 1 648 2 048 2 012 2 018 1 588 1 108 1 524 2 451 2 573 3 164
ICT share (JV) 0.9 1.1 6.3 2.9 2.0 1.8 2.0 2.4 2.0 1.0 0.7
ICT share (SA) 2.6 3.7 15.5 12.7 14.1 13.4 8.8 10.7 6.4 4.5 3.7
Joint ventures 13 28 93 68 68 78 42 60 39 20 14
Manufacturing 3 11 48 31 30 21 9 18 14 4 0
Communication 2 4 22 17 19 11 4 3 3 1 0
Office & computer 0 1 8 2 2 2 0 6 6 0 0
Components & other 1 6 18 12 9 8 5 9 5 3 0
Other industries 4 1 5 4 2 2 2 5 4 0 4
Media 1 1 4 3 2 9 3 4 4 1 2
Services 5 15 36 30 34 46 28 33 17 15 8
Computer 2 7 12 11 16 17 9 11 6 12 6
Telecommunications 3 8 22 15 16 23 13 18 11 2 2
Wholesale 0 0 2 4 2 6 6 4 0 1 0
Other strategicalliances
28 61 317 256 285 213 98 163 158 117 116
Manufacturing 18 31 126 124 129 81 31 46 48 14 6
Communication 2 5 29 45 31 34 12 22 25 4 2
Office & computer 6 10 28 26 44 19 8 8 7 3 0
Components & other 10 16 69 53 54 28 11 16 16 7 4
Other industries 3 1 26 11 12 8 6 7 13 21 20
Media 0 2 1 4 4 3 2 2 5 4 3
Services 7 27 164 117 140 121 59 108 92 78 87
Computer 6 13 68 64 91 80 40 73 73 60 69
Telecommunications 1 6 16 14 14 17 10 21 18 16 14
Wholesale 0 8 80 39 35 24 9 14 1 2 4
Note: Includes only cross-border alliances that are listed as completed, recorded by year of announcement and based on theprimary SIC code of the alliance.Source: Thomson Financial, 2001.
Annex Table 2.35. Basis of cross-border strategic alliances in the ICT sector, 1990-2000Number of deals
1990 1991 1992 1993 1994 1995 1996 1997 1998 1999 2000 Total
Joint ventures 13 28 93 68 68 78 42 60 39 20 14 523
Other strategic alliances 28 61 317 256 285 213 98 163 158 117 116 1 812
Licensing 13 20 64 46 48 57 43 58 60 18 7 434
Manufacturing 15 22 83 86 49 56 15 31 48 22 3 430
Marketing 16 40 219 154 143 128 47 58 49 15 13 882
R&D 14 35 173 149 204 148 35 46 12 6 12 834
Technology 13 30 154 83 63 54 35 43 58 5 1 539
Supply 2 7 26 22 16 14 3 1 5 0 1 97
Total 41 89 410 324 353 291 140 223 197 137 130 2 335
Source: Thomson Financial, 2001.
© OECD 2002

OECD Information Technology Outlook 2002
308
Annex Table 2.36. ICT sector cross-border strategic alliances by OECD countries, 1990-2000Number of deals by nation of alliance
Primary Secondary Total
Australia 40 41 81
Austria 0 5 5
Belgium 8 24 32
Canada 105 153 258
Czech Republic 2 2 4
Denmark 6 9 15
Finland 13 12 25
France 60 36 96
Germany 64 133 197
Greece 2 5 7
Hungary 1 6 7
Iceland 0 2 2
Ireland 5 16 21
Italy 24 43 67
Japan 289 449 738
Korea 31 87 118
Luxembourg 1 10 11
Mexico 9 19 28
Netherlands 28 59 87
New Zealand 1 23 24
Norway 5 13 18
Poland 3 5 8
Portugal 3 7 10
Slovak Republic 0 3 3
Spain 8 25 33
Sweden 22 23 45
Switzerland 8 14 22
Turkey 2 1 3
United Kingdom 108 139 247
United States 1 172 434 1 606
Source: Thomson Financial, 2001.
© OECD 2002

Annex 2
309
Annex Table 2.37. Cross-border R&D strategic alliances in the ICT sector, 1990-2000Number of deals
1990-95 1996-2000 Total
Number of strategic alliances 723 111 834
Joint ventures 105 11 116
Other strategic alliances 618 100 718
Industry
Manufacturing 374 41 415
Communication 114 14 128
Office & computer 92 9 101
Components & other 168 18 186
Other industries 43 13 56
Media 2 0 2
Services 304 57 361
Computer 248 48 296
Telecommunications 39 5 44
Wholesale 17 4 21
Source: Thomson Financial, 2001.
© OECD 2002

OECD Information Technology Outlook 2002
310
Annex Table 3.1. Value added in computer and related activities in selected OECD countries, 1993-2000Millions of USD
1993 1994 1995 1996 1997 1998 1999 2000
Canada 3 232 3 294 4 125 4 809 4 604 5 670
Mexico 224 311 270 309 369 384 445
United States 80 795 92 692 106 585 125 923 147 630 178 256 205 484 235 837
Australia 2 887
Japan 31 31 29 36 44
Korea 1 541 2 669
Austria 1 472 1 516 1 401 1 485 1 540
Belgium 1 654 1 631 2 162
Czech Republic 243 287 356 367 471 544 523
Denmark 1 465 1 671 2 130 1 387 1 744 1 832 1 939 1 844
Finland 713 836 1 044 1 101 1 159 1 528 1 669 1 627
France 15 075 15 835 18 733 19 622 19 085 22 374 24 245
Germany 24 117 25 727 25 021 30 147 30 512
Greece 84 70 76 69 72
Hungary 191 210 203 229 332 411
Iceland 28 31 33 40 54
Italy 13 359 13 189 14 035 16 563 15 833 17 034 18 354 17 348
Netherlands 2 439 2 958 3 652 4 353 4 944 6 038 6 901
Norway 644 671 801 923 1 004
Portugal 265 332 400
Slovak Republic 57 115 187 138 142
Spain 3 378 3 782 3 683
Sweden 2 018 2 354 3 005 3 843 3 916 4 806
Switzerland 2 815 3 126
Turkey 42 30 35 41 65 51
United Kingdom 10 053 11 391 12 851 14 608 19 580 24 843
Note: Computer and related activities (ISIC Rev. 3, Div. 72) largely comprises software-producing activities.Source: OECD, based on data from STAN database, Services Statistics on Value Added and Employment, 2000 Edition,national accounts, and official national sources.
© OECD 2002
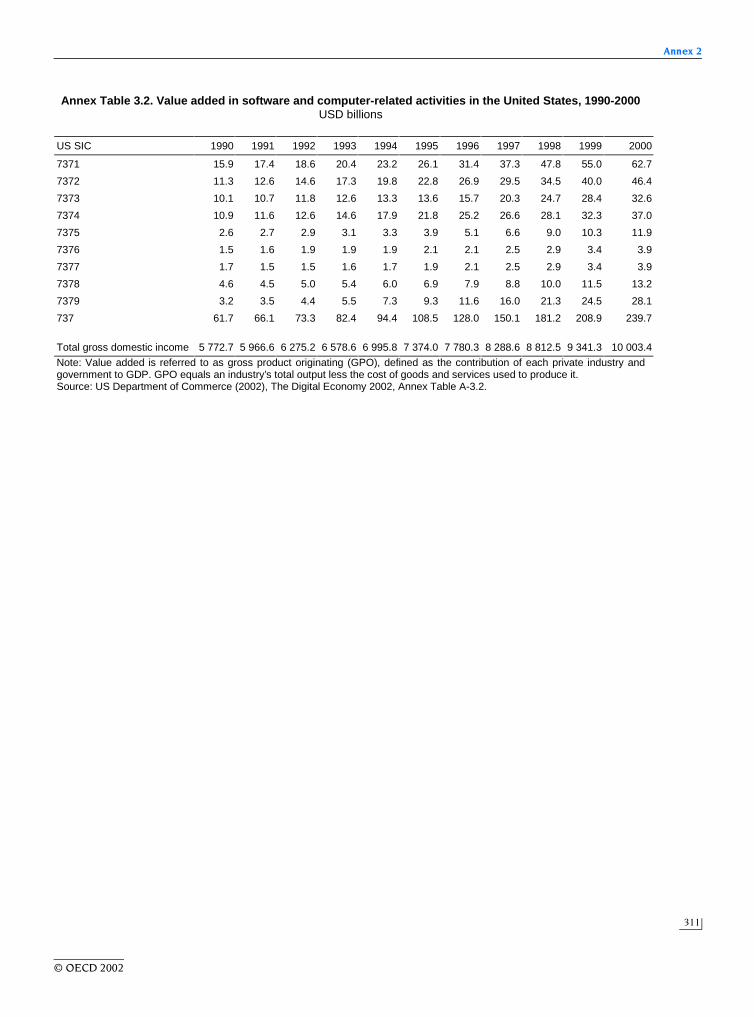
Annex 2
311
Annex Table 3.2. Value added in software and computer-related activities in the United States, 1990-2000USD billions
US SIC 1990 1991 1992 1993 1994 1995 1996 1997 1998 1999 2000
7371 15.9 17.4 18.6 20.4 23.2 26.1 31.4 37.3 47.8 55.0 62.7
7372 11.3 12.6 14.6 17.3 19.8 22.8 26.9 29.5 34.5 40.0 46.4
7373 10.1 10.7 11.8 12.6 13.3 13.6 15.7 20.3 24.7 28.4 32.6
7374 10.9 11.6 12.6 14.6 17.9 21.8 25.2 26.6 28.1 32.3 37.0
7375 2.6 2.7 2.9 3.1 3.3 3.9 5.1 6.6 9.0 10.3 11.9
7376 1.5 1.6 1.9 1.9 1.9 2.1 2.1 2.5 2.9 3.4 3.9
7377 1.7 1.5 1.5 1.6 1.7 1.9 2.1 2.5 2.9 3.4 3.9
7378 4.6 4.5 5.0 5.4 6.0 6.9 7.9 8.8 10.0 11.5 13.2
7379 3.2 3.5 4.4 5.5 7.3 9.3 11.6 16.0 21.3 24.5 28.1
737 61.7 66.1 73.3 82.4 94.4 108.5 128.0 150.1 181.2 208.9 239.7
Total gross domestic income 5 772.7 5 966.6 6 275.2 6 578.6 6 995.8 7 374.0 7 780.3 8 288.6 8 812.5 9 341.3 10 003.4
Note: Value added is referred to as gross product originating (GPO), defined as the contribution of each private industry andgovernment to GDP. GPO equals an industry’s total output less the cost of goods and services used to produce it.Source: US Department of Commerce (2002), The Digital Economy 2002, Annex Table A-3.2.
© OECD 2002

OECD Information Technology Outlook 2002
312
Annex Table 3.3. Employment in computer and related activities in selected OECD countries, 1993-2000 Thousands
1993 1994 1995 1996 1997 1998 1999 2000
Canada1 96.6 103.9 117.9 132.2 162.2 189.6
United States 884.6 950.1 1 080.5 1 217.1 1 397.4 1 601.6 1 861.8 2 082.4
Australia 75.5
Japan 630.3 706.2
Korea 45.2 51.1 58.2
Austria 15.8 17.1 19.8 23.9 30.0
Belgium 24.1 26.5 31.7
Czech Republic1 10.4 10.7 14.6 15.2 16.8
Denmark 21.2 22.3 21.9 15.8 21.8 23.6 25.4 27.6
Finland 16.7 16.3 17.0 18.7 20.8 25.9 31.2 35.3
France 184.8 187.0 194.6 195.7 217.7 249.8 282.5
Germany 231.0 242.0 252.0 262.0 272.0 302.0 349.0
Greece 3.4 3.2 3.5 3.8 3.9
Hungary 10.7 12.1 14.8
Iceland 0.4 0.7 0.7 0.8 1.0
Ireland 9.7
Italy 279.0 294.9 296.9 314.4 333.2 362.3
Netherlands 42.0 42.0 50.0 52.0 66.9 80.9 95.7
Norway 10.5 10.2 10.5 11.1 11.5 12.9 15.0
Portugal 9.4 11.8 12.2
Spain 63.1 68.8 74.6 74.6
Sweden 35.6 36.7 41.5 43.9 48.8 55.8 62.8
Switzerland 29.8 32.8
Turkey1 1.1 1.2 1.2 2.0 2.4 2.7
United Kingdom1 227.0 235.0 259.0 293.0 340.0 388.0 427.0
1. Self-employed not included.Source: OECD, based on data from STAN database, Services Statistics on Value Added and Employment, 2000 Edition,national accounts, and national official sources.
Annex Table 3.4. US employment in software and computer services, 1990-2001Thousands
US SIC 1990 1991 1992 1993 1994 1995 1996 1997 1998 1999 2000 2001
7371 151 157 169 188 210 245 276 322 379 455 519 538
7372 113 124 131 145 157 181 201 225 247 270 300 320
7373 98 99 103 110 116 130 144 161 182 211 224 235
7374 197 198 204 207 210 223 230 243 254 276 285 298
7375 48 45 45 46 48 57 70 83 103 158 243 257
7378 40 43 43 42 45 49 53 58 58 58 54 56
7376,7,9 127 131 141 155 173 205 254 318 393 447 471 489
Total 737 772 797 836 893 959 1 090 1 228 1 409 1 615 1 875 2 095 2 193
Total privateemployment
91 098 89 847 89 956 91 872 95 036 97 885 100 189 103 133 106 042 108 709 111 079 111 339
Note: Data for 2001 is provisional.Source: OECD, based on data from US Bureau of Labor Statistics.
© OECD 2002

Annex 2
313
Annex Table 3.5. BERD in computer and related activities as a share of total BERD, 1990-2000Percentages
1990 1991 1992 1993 1994 1995 1996 1997 1998 1999 2000
Canada 4.43 4.32 4.88 4.95 6.65 6.79 6.87 6.79 6.78 6.26 6.25
Mexico 1.38 1.58
United States 5.48 8.60 9.08 8.72
Australia 5.90 7.59 7.75 7.56 9.07 8.34 9.27 8.74 10.46 12.59
Japan 1.76 1.63 3.04 2.58
Korea 2.30 2.78
New Zealand 10.32 8.87 9.07 8.90 6.65 4.49 7.86
Austria 2.43 1.53
Belgium 4.29 4.54 4.35 4.35 4.86 5.46 6.04 6.46 7.05
Czech Republic 0.23 0.30 1.40 1.22 1.84 2.68
Denmark 3.77 4.11 6.73 7.60 8.52 9.26 11.67 9.42
Finland 4.79 2.88 1.90 2.18 2.53 3.56
France 2.46 2.62 2.47 2.54 2.30 2.33 2.13 2.49
Germany 0.41 1.72 2.57
Greece 23.04 22.69 13.06 16.17 15.77 12.86
Hungary 0.54 1.39 0.35 1.00 1.89 2.68 2.68 2.63
Iceland 17.70 17.70 18.00 19.30 19.31 14.72
Ireland 3.87 3.87 4.48 5.36
Italy 1.56 1.19 1.24 1.25 0.89 1.29 1.25 2.30 3.13 2.51 2.25
Netherlands 0.93 2.50 2.99 2.59 2.52
Norway 5.42 9.85 6.28 13.26 13.72
Poland 1.08 0.36 0.12 0.35 0.01 0.01 0.20
Portugal 2.22 3.06 8.95
Slovak Republic 2.12
Spain 1.05 1.50 2.54 3.13 2.47 3.13 2.81 2.66 2.76 3.53
Sweden 1.98 3.24 6.40
Turkey 4.94 1.95 2.30 2.29 2.89 1.86 1.44
United Kingdom 5.23 6.07 6.54 7.00 8.08 7.29 7.94 7.02 6.70 6.31
Source: OECD, based on R&D database, January 2002.
© OECD 2002

OECD Information Technology Outlook 2002
314
Annex Table 3.6. Share of BERD in computer and related activities funded by government, 1990-99Percentages
1990 1991 1992 1993 1994 1995 1996 1997 1998 1999
Australia 1.9 2.6 1.8 1.4 1.0 1.8 3.7 4.3
Austria 13.8 7.1
Canada 11.8 10.7 10.6 6.3
Czech Republic 0.0 13.1 3.6 2.8 9.2
Denmark 5.3 3.1 1.4 2.0 1.8 1.2
Finland 10.1 9.3 11.3 7.5
France 10.1 6.2 8.2 4.4 4.2 4.9 3.4 4.3
Germany 13.7 5.4 3.3
Iceland 0.0 2.4 2.0
Ireland 11.4
Japan 0.6 1.4 0.7 0.3
Korea 21.0
Norway 1.6 4.4 4.7 0.8 2.9
Poland 14.3 30.0 0.0 0.0 0.0 0.0
Portugal 0.3 13.5 8.8
Spain 13.7 14.6 9.4 10.4 5.2 7.0 9.5 10.7 10.7
Sweden 1.2 0.7 5.9
Turkey 0.7 0.5 0.3 0.5
United Kingdom 8.5 8.4
United States 23.5 20.0 12.0
Source: OECD, based on R&D database, January 2002.
© OECD 2002
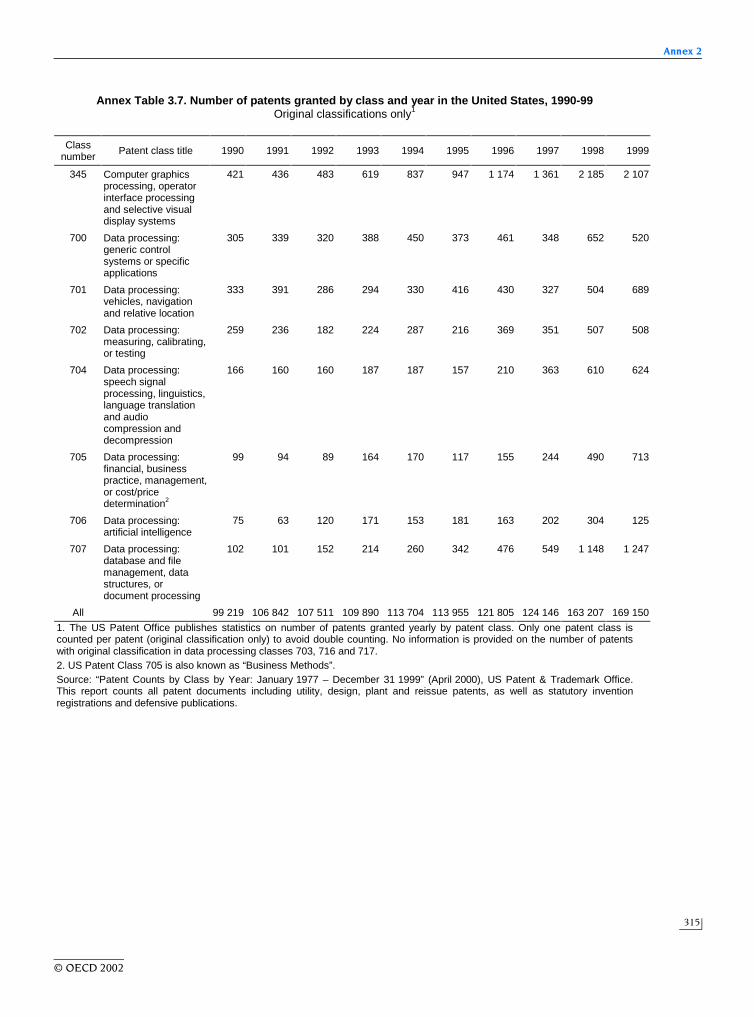
Annex 2
315
Annex Table 3.7. Number of patents granted by class and year in the United States, 1990-99Original classifications only1
Classnumber
Patent class title 1990 1991 1992 1993 1994 1995 1996 1997 1998 1999
345 Computer graphicsprocessing, operatorinterface processingand selective visualdisplay systems
421 436 483 619 837 947 1 174 1 361 2 185 2 107
700 Data processing:generic controlsystems or specificapplications
305 339 320 388 450 373 461 348 652 520
701 Data processing:vehicles, navigationand relative location
333 391 286 294 330 416 430 327 504 689
702 Data processing:measuring, calibrating,or testing
259 236 182 224 287 216 369 351 507 508
704 Data processing:speech signalprocessing, linguistics,language translationand audiocompression anddecompression
166 160 160 187 187 157 210 363 610 624
705 Data processing:financial, businesspractice, management,or cost/pricedetermination2
99 94 89 164 170 117 155 244 490 713
706 Data processing:artificial intelligence
75 63 120 171 153 181 163 202 304 125
707 Data processing:database and filemanagement, datastructures, ordocument processing
102 101 152 214 260 342 476 549 1 148 1 247
All 99 219 106 842 107 511 109 890 113 704 113 955 121 805 124 146 163 207 169 150
1. The US Patent Office publishes statistics on number of patents granted yearly by patent class. Only one patent class iscounted per patent (original classification only) to avoid double counting. No information is provided on the number of patentswith original classification in data processing classes 703, 716 and 717.2. US Patent Class 705 is also known as “Business Methods”.Source: “Patent Counts by Class by Year: January 1977 – December 31 1999” (April 2000), US Patent & Trademark Office.This report counts all patent documents including utility, design, plant and reissue patents, as well as statutory inventionregistrations and defensive publications.
© OECD 2002
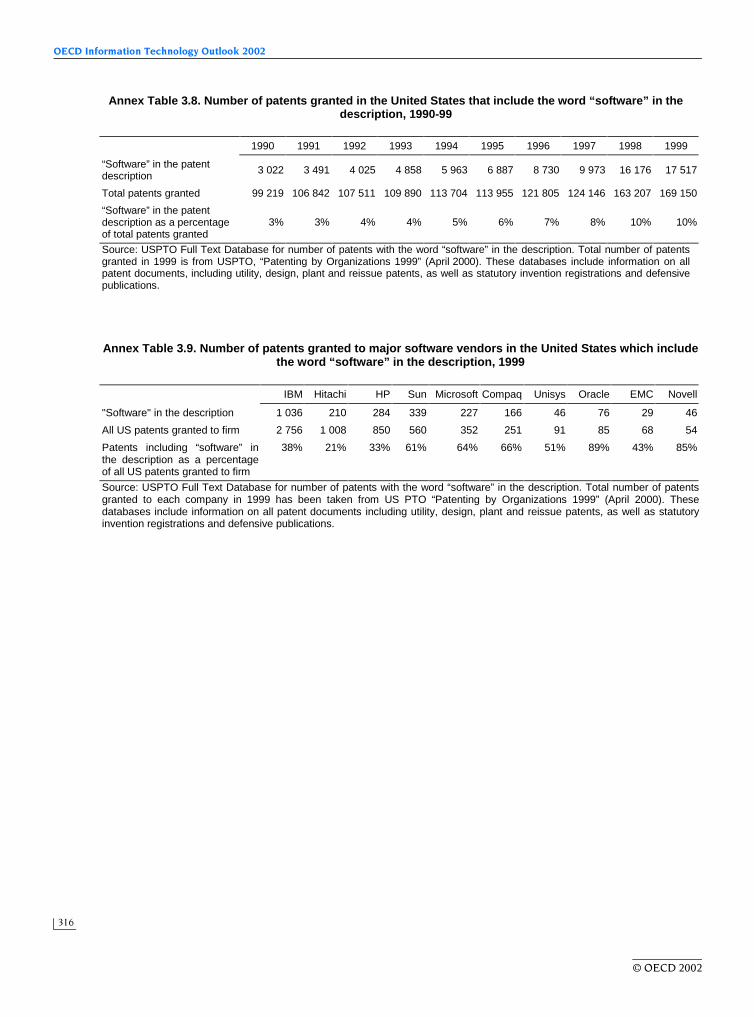
OECD Information Technology Outlook 2002
316
Annex Table 3.8. Number of patents granted in the United States that include the word “software” in thedescription, 1990-99
1990 1991 1992 1993 1994 1995 1996 1997 1998 1999
“Software” in the patentdescription 3 022 3 491 4 025 4 858 5 963 6 887 8 730 9 973 16 176 17 517
Total patents granted 99 219 106 842 107 511 109 890 113 704 113 955 121 805 124 146 163 207 169 150
“Software” in the patentdescription as a percentageof total patents granted
3% 3% 4% 4% 5% 6% 7% 8% 10% 10%
Source: USPTO Full Text Database for number of patents with the word “software” in the description. Total number of patentsgranted in 1999 is from USPTO, “Patenting by Organizations 1999” (April 2000). These databases include information on allpatent documents, including utility, design, plant and reissue patents, as well as statutory invention registrations and defensivepublications.
Annex Table 3.9. Number of patents granted to major software vendors in the United States which includethe word “software” in the description, 1999
IBM Hitachi HP Sun Microsoft Compaq Unisys Oracle EMC Novell
"Software" in the description 1 036 210 284 339 227 166 46 76 29 46
All US patents granted to firm 2 756 1 008 850 560 352 251 91 85 68 54
Patents including “software” inthe description as a percentageof all US patents granted to firm
38% 21% 33% 61% 64% 66% 51% 89% 43% 85%
Source: USPTO Full Text Database for number of patents with the word “software” in the description. Total number of patentsgranted to each company in 1999 has been taken from US PTO “Patenting by Organizations 1999” (April 2000). Thesedatabases include information on all patent documents including utility, design, plant and reissue patents, as well as statutoryinvention registrations and defensive publications.
© OECD 2002

Annex 2
317
Annex Table 3.10. Trade in computer and information services, 1999USD millions and percentage shares
Computer services(USD millions)
Computer and informationservices (USD millions)
Computer and information servicesas a percentage of total trade in
services
Imports Exports Imports Exports Imports Exports
Canada 432 1 159 791 1 345 1.9 3.6
United States 840 2 470 1 040 4 900 0.5 1.7
Australia1 250 380 261 421 1.4 2.3
Japan .. .. 3 066 1 569 2.6 2.3
Korea .. .. 92 11 0.3 0.0
New Zealand2 87 69 100 79 2.2 1.8
Austria .. .. 212 135 0.7 0.4
Belgium - Luxembourg 1 254 1 605 1 320 1 721 3.4 3.9
Czech Republic .. .. 83 95 1.4 1.3
Finland 266 177 281 181 3.4 3.0
France2 515 628 742 807 1.2 1.0
Germany 4 465 3 716 4 836 3 716 3.6 4.4
Hungary .. .. 127 122 2.8 1.9
Iceland .. .. 2 31 0.1 2.9
Ireland3 275 5 479 275 5 479 1.0 32.6
Italy 898 429 926 448 1.6 0.8
Netherlands2 708 755 1 187 1 152 2.2 2.2
Norway 243 92 243 92 1.7 0.6
Poland 172 41 218 60 2.4 0.6
Portugal 140 71 160 75 2.4 0.9
Slovak Republic .. .. 56 52 3.1 2.3
Spain 650 449 1 226 2 041 3.9 3.8
Sweden 866 1 049 1 067 1 191 4.6 5.9
United Kingdom2 725 2 794 1 150 3 684 1.2 3.1
G7 .. .. 12 550 16 469 1.7 2.2
EU-14 .. .. 13 538 20 718 2.3 3.6
Total OECD4 12 945 21 503 19 617 29 495 1.9 2.7
Note: .. = data not available.1. For computer services, data from Australian Bureau of Statistics and 1999-2000 instead of 2000.2. For computer services, 1999 instead of 2000.3. Trade in computer services accounts for 100% of trade in computer and information services. Trade in information serviceswas below the statistical threshold significance (Irish Central Statistics Office).4. Calculated for available countries.Source: OECD/Eurostat (2001), Statistics on International Trade in Services; and IMF (2001), Balance of Payments StatisticsYearbook 2001; and CD-ROM, Balance of Payments Statistics, 2001.
© OECD 2002

OECD Information Technology Outlook 2002
318
Annex Table 3.11. US affiliates in computer and related activities abroad, 1993 and 1998
Employment(thousands)
Turnover(millions of current USD)
Compensation of employees(millions of current USD)
1993 1998 1993 1998 1993 1998
All countries 90 250 18 060 70 671 4 947 15 610
Canada 5.6 5.2 4.3 3.0 4.1 4.6
Europe1 64.4 50.8 66.9 57.5 71.6 53.8
France 11.1 5.2 9.3 4.3 13.3 6.2
Germany2 7.8 7.2 10.3 6.2 9.8 9.2
United Kingdom3 21.1 17.2 15.3 13.6 18.7 17.9
Netherlands3 3.3 3.2 8.9 9.0 3.8 3.5
Asia 24.4 30.8 24.2 32.2 19.9 33.2
Japan 8.9 16.8 12.4 23.5 11.2 22.2
1. Including eastern European countries.2. 1994 instead of 1993 for turnover.3. 1995 instead of 1993 for turnover.Source: OECD, FATS database, October 2000.
Annex Table 3.12. Foreign affiliates in computer and related activities in the United States, 1990 and 1996
Employment(thousands)
Turnover(millions of current USD)
Compensation of employees(millions of current USD)
1990 1996 1990 1996 1990 1996
All countries 33 40 4 441 8 736 1 697 2 868
Canada 7.0 12.5 5.8 11.1 6.2 8.9
Europe1 76.0 60.0 80.2 64.7 77.5 63.8
France 17.3 10.0 12.1 6.4 19.3 11.5
Germany2 2.4 2.3 2.5 .. 2.8 3.5
United Kingdom 12.8 22.5 15.2 21.3 11.5 20.2
Netherlands .. .. .. 0.2 .. 0.3
Asia .. 22.5 2.9 22.3 .. 24.6
Japan3 3.7 20.0 2.1 20.2 4.2 21.9
1. Including eastern European countries.2. 1995 instead of 1996 for compensation of employees.3. 1991 instead of 1990 for employment and compensation of employees.Source: OECD, FATS database, October 2000.
© OECD 2002

Annex 2
319
Annex Table 3.13. Foreign-owned enterprises in computer and related activities in Sweden, 2000
Businesses % Employees %
By sub-sector
Hardware consultancy 12 3.9 352 1.9
Software consultancy & supply 252 81.6 12 777 70.0
Data processing 18 5.8 2 971 16.3
Database activities 9 2.9 786 4.3
Maintenance & repair 8 2.6 1 209 6.6
Other computer-related activities 10 3.2 147 0.8
Total computer and related services 309 100 18 242 100
By country of origin
United States 70 22.7 4 013 22.0
United Kingdom 40 12.9 3 295 18.1
Finland 59 19.1 2 526 13.8
France 6 1.9 2 328 12.8
Switzerland 6 1.9 1 287 7.1
Netherlands 22 7.1 1 187 6.5
Norway 34 11.0 1 488 8.2
Other countries 72 23.3 2 118 11.6
Total computer and related services 309 100 18 242 100
Source: ITPS (Swedish Institute for Growth Policy Studies) (2001), Foreign-Owned Enterprises 2000. Software sector isequivalent to computer and related activities (NACE 72 equivalent to ISIC 72).
© OECD 2002

OECD Information Technology Outlook 2002
320
Annex Table 3.14. The market for packaged software and IT services, 2001
Packaged software IT services
2001 CAGR 1992-2001 2001 CAGR 1992-2001
USD millions % USD millions %
Canada 5 958 13.7 39 630 5.2
Mexico 597 7.9 8 405 7.3
United States 96 556 14.0 546 681 7.7
Australia 2 726 13.2 19 289 6.4
Japan 13 729 8.4 188 012 2.8
Korea 1 027 19.8 16 174 9.0
New Zealand 298 4.2 3 381 5.5
Austria 1 332 12.2 8 892 5.7
Belgium 1 617 4.4 11 956 4.6
Czech Republic 364 18.2 2 722 8.9
Denmark 1 407 12.6 10 258 6.2
Finland 1 086 16.5 6 630 8.0
France 10 524 12.4 81 221 5.5
Germany 14 697 11.4 98 260 5.1
Greece 323 20.6 2 381 12.3
Hungary 325 14.5 1 958 9.0
Ireland 442 17.5 3 365 10.0
Italy 4 650 3.8 32 450 3.7
Netherlands 4 436 14.2 23 988 6.2
Norway 1 145 11.8 7 626 6.7
Poland 511 22.9 4 031 15.9
Portugal 452 14.6 3 270 10.4
Slovakia 101 16.0 684 8.9
Spain 2 243 6.4 15 180 4.1
Sweden 2 307 11.8 17 487 4.8
Switzerland 2 561 10.0 17 025 4.9
Turkey 241 14.3 1 955 3.5
United Kingdom 13 798 12.2 91 356 7.1
OECD 28 185 453 12.3 1 264 268 6.0
World 196 237 12.5 1 377 221 6.4
Source: OECD, based on IDC data.
© OECD 2002

Annex 2
321
Annex Table 3.15. Changes in product leadership in PC software, 1974-97
Introductiondate
Leadershipstart date1
Years toleadership
Years spentas leader
Word processors (1979-97)
MicroPro WordStar (8-bit) 1979 1980 1 7
WordPerfect Corp. WordPerfect (16-bit)2 1980 1987 7 6
Microsoft MS Word (32-bit) 1983 1993 10 5+
Spreadsheets (1979-97)
Personal Software3 VisiCalc 1979 1979 0 5
Lotus Corp4 Lotus 1-2-3 1983 1984 1 9
Microsoft MS Excel 1985 1993 8 5+
Database (1981-97)
Ashton-Tate5 DBASE 1981 1981 0 12
Borland6 Paradox 1985 1993 8 1
Microsoft MS Access 1992 1994 2 4+
Personal finance (1985, 1989-97)
MECA Software7 Managing Your Money 1984 n.a. n.a. n.a.
Monogram Dollars and Sense 1983 n.a. n.a. n.a.
Intuit8 Quicken 1984 ±1987 3+ 11+
Operating systems (1977-97)
Digital Research CP/M (8-bit)9 1974 1977 n.a. 7
Microsoft MS-DOS/PC-DOS (16-bit) 1981 1984 3 9
Microsoft Windows (16-bit) 1985 1993 8 3
Microsoft Windows 95 (32-bit) 1995 1996 1 2+
1. A category leader is defined as the product with the highest share of shipments and at least 25% market share (see source).2. WordPerfect was released for Data General minicomputers in 1980 and for Windows in 1987.3. VisiCorp (former Personal Software, publishers of VisiCalc) sued Software Arts (writers of the programme) in 1983, and asettlement was later reached. Software Arts was sold to Lotus Development Corp in 1985, which decided not to continuepublishing VisiCalc. (www.bricklin.com/history).4. Lotus was acquired by IBM in 1995 (www.lotus.com and www.ibm.com ).5. Excel was released for Macintosh in 1985 and for Windows in 1987.6. Dbase is currently published by dBase.Inc (See www.borland.com and www.dbase.com ).7. www.borland.com.8. US competition authorities blocked the merger between Intuit and Microsoft in 1995.9. CP/M was developed around 1974, but its first major OEM (original equipment manufacturing) deals were in 1977.Source: D. S. Evans, A. L. Nichols and B. J. Reddy (1999), “The Rise And Fall Of Leaders In Personal Computer Software”,mimeo, National Economic Research Associates Inc., January (based on data from International Data Corporation and pressreleases), plus information from several company Web sites.
© OECD 2002
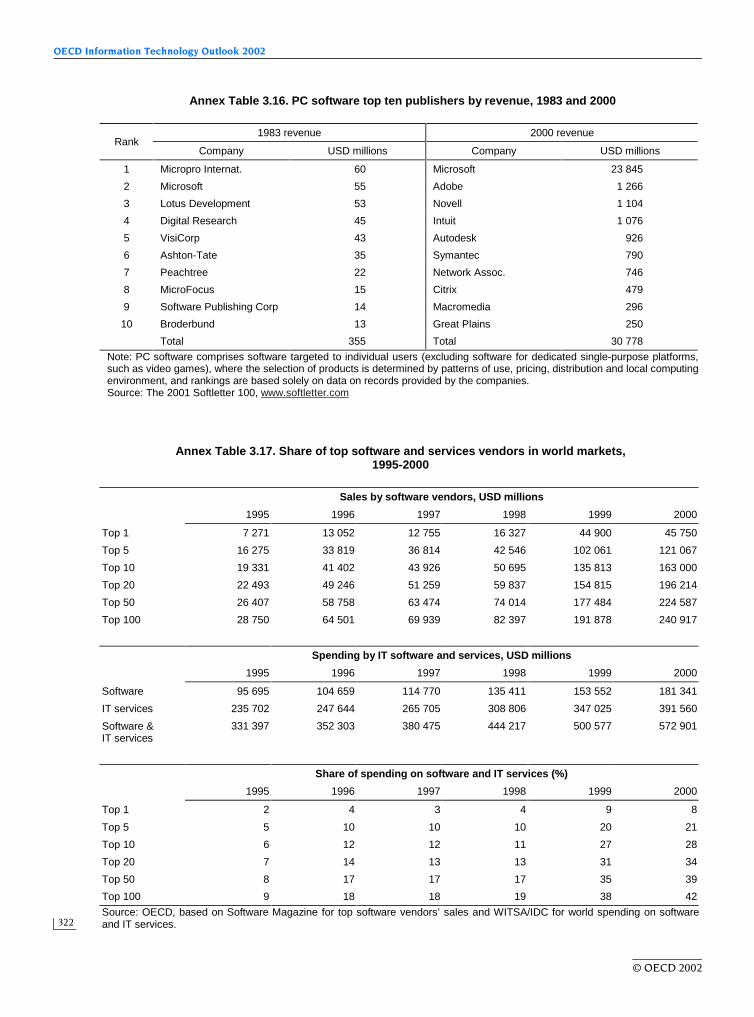
OECD Information Technology Outlook 2002
322
Annex Table 3.16. PC software top ten publishers by revenue, 1983 and 2000
1983 revenue 2000 revenueRank
Company USD millions Company USD millions
1 Micropro Internat. 60 Microsoft 23 845
2 Microsoft 55 Adobe 1 266
3 Lotus Development 53 Novell 1 104
4 Digital Research 45 Intuit 1 076
5 VisiCorp 43 Autodesk 926
6 Ashton-Tate 35 Symantec 790
7 Peachtree 22 Network Assoc. 746
8 MicroFocus 15 Citrix 479
9 Software Publishing Corp 14 Macromedia 296
10 Broderbund 13 Great Plains 250
Total 355 Total 30 778
Note: PC software comprises software targeted to individual users (excluding software for dedicated single-purpose platforms,such as video games), where the selection of products is determined by patterns of use, pricing, distribution and local computingenvironment, and rankings are based solely on data on records provided by the companies.Source: The 2001 Softletter 100, www.softletter.com
Annex Table 3.17. Share of top software and services vendors in world markets,1995-2000
Sales by software vendors, USD millions
1995 1996 1997 1998 1999 2000
Top 1 7 271 13 052 12 755 16 327 44 900 45 750
Top 5 16 275 33 819 36 814 42 546 102 061 121 067
Top 10 19 331 41 402 43 926 50 695 135 813 163 000
Top 20 22 493 49 246 51 259 59 837 154 815 196 214
Top 50 26 407 58 758 63 474 74 014 177 484 224 587
Top 100 28 750 64 501 69 939 82 397 191 878 240 917
Spending by IT software and services, USD millions
1995 1996 1997 1998 1999 2000
Software 95 695 104 659 114 770 135 411 153 552 181 341
IT services 235 702 247 644 265 705 308 806 347 025 391 560
Software &IT services
331 397 352 303 380 475 444 217 500 577 572 901
Share of spending on software and IT services (%)
1995 1996 1997 1998 1999 2000
Top 1 2 4 3 4 9 8
Top 5 5 10 10 10 20 21
Top 10 6 12 12 11 27 28
Top 20 7 14 13 13 31 34
Top 50 8 17 17 17 35 39
Top 100 9 18 18 19 38 42
Source: OECD, based on Software Magazine for top software vendors’ sales and WITSA/IDC for world spending on softwareand IT services.
© OECD 2002

Annex 2
323
Annex Table 3.18. Software industry leader’s share in selected European countries: 1990-2000
Industry Leader’s Share
1990 1991 1992 1993 1994 1995 1996 1997 1998 1999 2000
Austria 0.6 0.8 1.7 2.8 6.0 6.9 7.9 12.4 .. .. ..
Belgium/Luxembourg 2.0 2.1 4.1 3.1 3.1 3.6 3.9 7.0 .. .. ..
Denmark 2.2 2.3 3.6 2.9 7.4 7.7 7.8 13.7 .. .. ..
Finland 11.3 9.0 4.7 5.6 7.7 8.3 7.3 12.9 .. .. ..
France 6.0 6.8 6.7 7.1 7.4 7.4 7.4 11.5 9.7 8.9 6.0
Germany 3.3 3.4 4.3 5.9 6.4 6.5 5.2 8.9 9.2 9.6 8.0
Italy 2.5 2.3 2.1 2.5 4.6 5.0 7.0 12.8 12.3 17.9 12.2
Netherlands 3.2 2.3 1.8 4.2 2.9 3.1 3.0 4.2 .. .. ..
Norway 3.0 4.2 4.2 31.0 11.1 10.5 10.1 13.9 .. .. ..
Spain 4.8 3.7 4.8 6.4 12.2 16.9 18.1 19.1 17.3 11.6 9.9
Sweden 5.8 2.5 2.8 2.7 9.9 20.7 23.7 24.9 .. .. ..
Switzerland 0.1 0.6 1.6 2.9 6.7 6.7 7.1 11.4 .. .. ..
United Kingdom 3.2 4.9 4.3 5.4 5.1 4.8 5.8 8.5 14.0 17.5 12.9
Note: .. = data not available. The market share of the software industry leader is obtained by considering the relative position ofsoftware suppliers for whom software revenue is identifiable.Source: OECD, compiled from European Information Technology Observatory Yearbook, various editions.
© OECD 2002

OECD Information Technology Outlook 2002
324
Annex Table 6.1. Households and individuals with access to a home computer in selected OECDcountries, 1986-2001
Percentages
1986 1987 1988 1989 1990 1991 1992 1993 1994 1995 1996 1997 1998 1999 2000 2001
Households
Australia1 26.9 34.7 42.6 45.3 53.0
Austria 34.0
Belgium 45.4
Canada2 10.3 16.2 18.5 20.0 23.0 25.0 28.8 31.6
Canada3 36.4 40.6 50.0
Denmark 15.0 27.0 33.0 37.0 45.0 48.0 53.0 60.0 65.0 69.0
Finland 8.0 17.0 19.0 23.0 35.0 37.0 43.4 47.0 50.9
France4 7.0 8.2 11.0 14.3 15.0 16.0 19.0 23.0 27.0
Germany 44.9 47.3
Ireland 32.4
Italy5 29.5 28.1
Japan6 11.7 9.7 11.6 10.6 11.5 12.2 11.9 13.9 15.6 17.3 22.1 25.2 29.5 38.6 50.5
Japan7 22.3 28.8 32.6 37.7
Korea 20.7 43.2 44.5 51.8 66.0
Mexico8 11.1
New Zealand9 6.7 8.6 9.6 11.5 11.6 13.3 15.9 17.1 18.6 21.7 24.8 27.6 32.9 37.5 42.8 46.6
Spain10 27.2 30.4
Sweden 65.0 69.0
Turkey11 12.3
United Kingdom12 26.0 33.0 39.0 46.0
United States13 14.4 15.2 24.1 36.6 42.1 51.0 56.5
Individuals
Netherlands14 10.0 11.0 14.0 18.0 21.0 25.0 29.0 31.0 34.0 39.0 43.0 47.0 55.0
Netherlands15 55.0 59.2 66.0 70.0 74.0
Norway 33.0 39.0 43.0 50.0 57.0 67.0 71.0
Portugal 24.1 29.0
1. February of each year, except for 2000, average of the year.2. May of each year. Household Facilities and Equipment Survey.3. Survey of Household Spending.4. June of each year.5. For 1999, Multipurpose Statistical Survey on Households: Everyday Life Aspects. For 2000, Multipurpose Statistical Surveyon Households: The Citizens and their Leisure - Year 2000. ISTAT provisional data.6. Fiscal year ending in March. Economic and Planning Agency.7. Fiscal year ending in March. Ministry of Posts and Telecommunications, Communications Usage Trend Survey.8. Households in urban areas with more than 15 000 inhabitants only.9. March of each year. 1999 and 2000 are projections.10. Provisional data.11. Households in urban areas only.12. Last quarter 2000.13. November of each year, except August for 2000 and September for 2001.14. From CBS, Sociaal-economish panelonderzoek.15. From CBS, POLS survey.Source: OECD, ICCP, compiled from national statistical offices or national official sources.
© OECD 2002

Annex 2
325
Annex Table 6.2. Households and individuals with access to Internet1 in selected OECD countries,1996-2001
Percentages
1996 1997 1998 1999 2000 2001
Households
Australia 4.3 15.9 22.0 33.0
Austria 19.0
Belgium 14
Canada2 16.0 23.0 29.0 40.0
Denmark 5.0 10.0 22.0 33.0 46.0
Finland 24.7 30.0 34.6
France3 7.0 12.0
Germany 11.0 16.0
Ireland 20.4
Italy4 7.7 18.8
Japan5 3.3 6.4 11.0 19.1 34.0
Mexico 3.0
Sweden 42.3 48.2 65.0
Turkey6 7.0
United Kingdom7 20.0 33.0 36.0
United States8 26.2 41.5 50.5
Individuals
Netherlands9 16.0 26.5 45.0 57.0
1. For Denmark, Ireland, the Netherlands and the United Kingdom, access to the Internet via a home computer; for the othercountries access to the Internet through any device (e.g. computer, phone, TV, etc.).2. November of each year. Regular users.3. June of each year.4. Percentage of households with home Internet access, not necessarily only from a PC. Provisional data for Italy.5. Fiscal year ending in March.6. Households in urban areas only.7. Fourth quarter for 1999 and 2000, third quarter for 2001.8. November 1998, August 2000, September 2001.9. Fall of each year.Source: OECD, compiled from national statistical offices or national official sources.
© OECD 2002

OECD Information Technology Outlook 2002
326
Annex Table 6.3. Households and individuals with Internet access by income bracketPercentages
1997 1998 1999 2000 2001 2002
Households
Australia Lowest 5.0 6.0 10.0
Highest 44.0 52.0 69.0
Canada Lowest 5.5 7.1 10.9 16.5
Highest 32.5 44.9 53.5 65.4
Denmark Lowest 26.0
Highest 67.8
Finland Lowest 4.0 9.6 11.6 15.0 20.0
Highest 36.8 50.2 64.0 69.2 69.4
France Lowest 2.1 3.5
Highest 32.1 51.1
Japan Lowest 5.5 21.1
Highest 36.7 58.8
Norway Lowest 22.0
Highest 77.0
United Kingdom Lowest 1.0 5.0 8.0
Highest 32.0 62.0 78.0
Individuals
Netherlands Lowest 4.9 7.0
Highest 37.5 57.2
United States Lowest 9.2 13.7 18.9 25.0
Highest 44.5 58.9 70.1 78.9
Note: Income brackets are defined as follows:Australia: Lowest income bracket: less than AUD 25 000; highest income bracket: more than AUD 100 000.Canada: Lowest income bracket: first income quartile; highest income bracket: fourth income quartile.Denmark: Lowest income bracket: DKR 100.000-199.999; highest income bracket: DKR 400.000. or more.Finland: Lowest income bracket: first income quartile; highest income bracket: fourth income quartile.France: Lowest income bracket: less than FRF 80 000; highest income bracket: more than FRF 450 000.Japan: Lowest income bracket: less than JPY 4 million; highest income bracket: more than JPY 20 million for 1999, more thanJPY 10 million for 2000.Norway: Lowest income bracket: less than NOK 259 000; highest income bracket: more than NOK 600 000.United Kingdom: Lowest income bracket: second decile of income; highest income bracket: tenth income decile.Netherlands: Lowest income bracket: second income decile; highest income bracket: tenth income decile.United States: Lowest income bracket: less than USD 15 000; highest income bracket: more than USD 75 000.Source: OECD ICT database (March 2002), and US Department of Commerce, A Nation Online, 2002
© OECD 2002
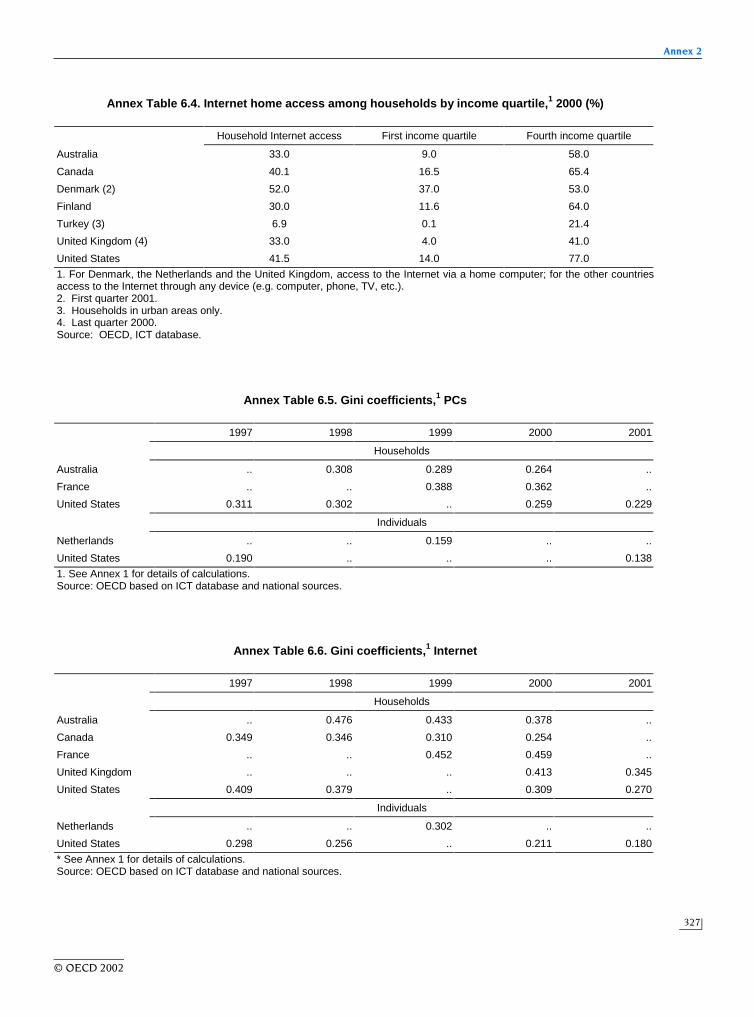
Annex 2
327
Annex Table 6.4. Internet home access among households by income quartile,1 2000 (%)
Household Internet access First income quartile Fourth income quartile
Australia 33.0 9.0 58.0
Canada 40.1 16.5 65.4
Denmark (2) 52.0 37.0 53.0
Finland 30.0 11.6 64.0
Turkey (3) 6.9 0.1 21.4
United Kingdom (4) 33.0 4.0 41.0
United States 41.5 14.0 77.0
1. For Denmark, the Netherlands and the United Kingdom, access to the Internet via a home computer; for the other countriesaccess to the Internet through any device (e.g. computer, phone, TV, etc.).2. First quarter 2001.3. Households in urban areas only.4. Last quarter 2000.Source: OECD, ICT database.
Annex Table 6.5. Gini coefficients,1 PCs
1997 1998 1999 2000 2001
Households
Australia .. 0.308 0.289 0.264 ..
France .. .. 0.388 0.362 ..
United States 0.311 0.302 .. 0.259 0.229
Individuals
Netherlands .. .. 0.159 .. ..
United States 0.190 .. .. .. 0.138
1. See Annex 1 for details of calculations.Source: OECD based on ICT database and national sources.
Annex Table 6.6. Gini coefficients,1 Internet
1997 1998 1999 2000 2001
Households
Australia .. 0.476 0.433 0.378 ..
Canada 0.349 0.346 0.310 0.254 ..
France .. .. 0.452 0.459 ..
United Kingdom .. .. .. 0.413 0.345
United States 0.409 0.379 .. 0.309 0.270
Individuals
Netherlands .. .. 0.302 .. ..
United States 0.298 0.256 .. 0.211 0.180
* See Annex 1 for details of calculations.Source: OECD based on ICT database and national sources.
© OECD 2002

OECD Information Technology Outlook 2002
328
Annex Table 6.7. Growth rates for households and individuals with Internet access by income bracketPercentages
1997-1998 1998-1999 1999-2000 2000-2001
Households
Australia Lowest 20 67
Highest 18 33
Canada Lowest 29 54 51
Highest 38 19 22
Denmark Lowest
Highest
Finland Lowest 140 21 29
Highest 36 27 8
France Lowest 67
Highest 59
Japan Lowest 284
Highest 60
United Kingdom Lowest 400 60
Highest 94 26
Individuals
Netherlands Lowest 44
Highest 53
United States Lowest 49 32
Highest 32 13
Note: Income brackets are defined as follows:Australia: Lowest income bracket: less than AUD 25 000; highest income bracket: more than AUD 100 000.Canada: Lowest income bracket: first income quartile; highest income bracket: fourth income quartile.Denmark: Lowest income bracket: DKR 100.000-199.999; highest income bracket: DKR 400.000, or more.Finland: Lowest income bracket: first income quartile; highest income bracket: fourth income quartile.France: Lowest income bracket: less than FRF 80 000; highest income bracket: more than FRF 450 000.Japan: Lowest income bracket: less than JPY 4 million; highest income bracket: more than JPY 20 million for 1999, more thanJPY 10 million for 2000.United Kingdom: Lowest income bracket: second decile of income; highest income bracket: tenth income decile.Netherlands: Lowest income bracket: second income decile; highest income bracket: tenth income decile.United States: Lowest income bracket: less than USD 15 000; highest income bracket: more than USD 75 000.Source: OECD ICT database (March 2002), and US Department of Commerce, A Nation Online, 2002.
© OECD 2002

OECD PUBLICATIONS, 2, rue André-Pascal, 75775 PARIS CEDEX 16
PRINTED IN FRANCE
(93 2002 02 1 P) ISBN 92-64-19754-0 – No. 52477 2002