
OECD Economic Surveys NEW ZEALAND
63
OECD Economic Surveys NEW ZEALAND JUNE 2015 OVERVIEW
Transcript of OECD Economic Surveys NEW ZEALAND

OECD Economic Surveys NEW ZEALAND JUNE 2015
OVERVIEW


OECD Economic Surveys: New Zealand
© OECD 2015
Executive summary
● Main findings
● Key recommendations
11
© OECD 2015 1
kurzweg_d
Rectangle
kurzweg_d
Rectangle

EXECUTIVE SUMMARY
Main findingsEconomic growth has been faster in New Zealand than in most other OECD countries
in recent years. Inflation and inflation expectations are well anchored, but the current
account has been in sizeable deficit for some time. Strong fiscal and monetary policy
frameworks and a healthy financial sector have yielded macroeconomic stability,
underpinning growth. Employment is high, in large part thanks to flexible labour markets
and ample immigration, business investment is robust, and households and firms are
optimistic. Well-being is high, although a considerable income gap with the top half of the
OECD remains. However, bottlenecks in housing, urban infrastructure and skills,
inequalities in living standards, and rising environmental pressures all pose risks for
sustaining growth. The government is moving to deal with these weaknesses.
Removing bottlenecks to sustain the economic expansion. Businesses have reported
increasing difficulties in finding skilled labour. However, wage pressures remain subdued
thanks to immigration, policies to improve labour market matching (e.g. the Canterbury
Skills and Employment Hub which has matched demand and labour supply in the
post-earthquake rebuild) and skills training. Rapid population growth and a low
responsiveness of supply have led to housing and urban infrastructure constraints. In
particular, house prices have risen sharply in Auckland, the largest city, eroding affordability
and raising financial-stability risks. Efforts to speed the housing supply response have been
made, although community resistance to rezoning and densification may limit
development. Environmental regulations also appear to be relatively burdensome for
economic activity, including for residential investment. Finally, the foreign debt position,
which reflects low private saving, has been large for some time and is an ongoing
vulnerability. It calls for a continued solid fiscal position, as New Zealand faces potentially
large macroeconomic shocks and longer-run pension and health spending pressures.
Reducing greenhouse gas emissions and water pollution. New Zealand faces difficult
climate change challenges because of the high share of its greenhouse gas (GHG) emissions
coming from agriculture, where there are few cost-effective abatement possibilities, and
because three quarters of electricity already comes from renewable sources, meaning there
are fewer potential gains in generation. The effectiveness of the NZ Emissions Trading
Scheme, New Zealand’s main climate change policy instrument, is being limited by an
exemption for biological emissions from agriculture and transitional arrangements that
effectively halve the carbon price faced by covered emitters. Water quality in some regions
has suffered from the steady expansion of intensive dairy farming. The industry and
government have responded, but it is not yet clear if these measures will prove sufficient.
Making economic growth more inclusive. Income inequality, reflecting in part unequal
employment prospects, is above the OECD average. Recent welfare reforms facilitate the
transition of beneficiaries into employment, but a greater focus is needed on improving the
long-term outcomes of the most disadvantaged New Zealanders across the public sector.
The government is taking steps to ease shortages of affordable and social housing but will
need to go further to make significant headway in rolling back the large increase in the
burden of housing costs on low-income households in recent decades. Obesity, cigarette
smoking and poor access to health care have contributed to bad health outcomes for some
groups. While educational achievement is high, children from disadvantaged backgrounds
are less school-ready and more likely to leave school without qualifications. Reforms are
underway to increase student attainment by improving the school readiness of these groups,
enhancing teaching quality and increasing collaboration across schools.
OECD ECONOMIC SURVEYS: NEW ZEALAND © OECD 201512
© OECD 2015 2
kurzweg_d
Rectangle

EXECUTIVE SUMMARY
Key recommendations
Removing bottlenecks to sustain the economic expansion
● Implement fiscal consolidation measures to reduce net debt, as planned, while continuing
efforts to improve the well-being of the most vulnerable members of society. Allow the
automatic stabilisers to operate fully.
● Provide guidance to regional authorities in the implementation of environmental and
planning regulations, including the Resource Management Act. Reduce their economic
costs and the scope for vested interests to limit competition or thwart rezoning and
development that would be in the wider public interest.
● Implement infrastructure demand management strategies to reduce urban road congestion,
notably congestion charging. Consider diversifying revenue sources for infrastructure
funding, such as sharing in a revenue base linked to local economic activity or taxing the
windfall gains that accrue to landowners from rezoning land for urban use.
● Draw lessons from the Canterbury Skills and Employment Hub (a labour-market matching
scheme), trial it elsewhere and, subject to positive results, roll it out country-wide.
● More frequently update immigration skill shortage categories to reduce labour market
bottlenecks.
Strengthen policies to reduce GHG emissions and water pollution
● Terminate the transitional arrangements that halve the number of emission permits
(and hence their price) needed by emitters in the NZ Emissions Trading Scheme. Develop
a strategy to cut agricultural GHG emissions efficiently through a combination of pricing,
regulation and R&D.
● Monitor the implementation of the 2014 National Policy Statement for Freshwater
Management in regional plans to ensure water quality meets goals. Provide clearer
technical guidance for regional councils. Ensure that information on environmental
quality is comparable and reliable, in part by passing the Environmental Reporting Bill.
Implement co-ordinated reforms to make economic growth more inclusive
● Complement the recent welfare reform by following up people going off benefit, as planned,
to ensure satisfactory outcomes. Strengthen the focus of social spending on lifting the
long-term outcomes of the disadvantaged, including by improving coordination across
the public sector.
● Raise the supply of social housing for low-income households. Increase targeted housing
subsidies for low-income households that are not in social housing.
● Adopt a comprehensive approach to reducing obesity, covering personal actions, factors
that influence physical activity and nutritional practices, and improved obesity
management through primary care.
● Meet the 98% participation target for early childhood education. Ensure that the education
provided is of high quality, includes programmes to enhance the involvement of parents
and focuses more on the outcomes of children with disadvantaged backgrounds.
OECD ECONOMIC SURVEYS: NEW ZEALAND © OECD 2015 13
© OECD 2015 3
kurzweg_d
Rectangle

© OECD 2015 4

OECD Economic Surveys: New Zealand
© OECD 2015
Assessment and recommendations
● New Zealand is enjoying a strong, broad-based economic expansion
● Policies to sustain the economic expansion
● Policies to enhance environmental sustainability
● Making economic growth more inclusive
The statistical data for Israel are supplied by and under the responsibility of the relevant Israeliauthorities. The use of such data by the OECD is without prejudice to the status of the Golan Heights,East Jerusalem and Israeli settlements in the West Bank under the terms of international law.
15
© OECD 2015 5
kurzweg_d
Rectangle
kurzweg_d
Rectangle
kurzweg_d
Rectangle

ASSESSMENT AND RECOMMENDATIONS
New Zealand has one of the highest living standards in the OECD, with all but one of the
components of the Better Life Index above the OECD average (Figure 1). It stands out on
health status, social connections as well as civic engagement and governance. Up until the
mid-1970s, GDP per capita was also relatively high (Figure 2). However, the economy was
ill-adapted to cope with the oil shocks and the loss of its major export market for agricultural
products when the United Kingdom joined the European Union. Economic performance
deteriorated further at that point and then worsened even more between the mid-1980s and
early 1990s following a tightening of macroeconomic policies to reduce government budget
deficits and debt and deep structural reforms designed to enhance long-term economic
performance. Since then, New Zealand’s per capita income has broadly stabilised in relation
to the OECD average. Unemployment and government debt are low by international
comparison. The budget is near balance and is expected to be in surplus over the coming
years. The financial system is solid, and the supply of credit is supporting economic activity.
A key challenge is to extend the expansion in a sustainable way, thereby contributing
to progress in closing the income gap. The main issues are: addressing shortages of skills
and housing and infrastructure challenges in land transport; limiting financial risks
emanating from housing; and ensuring that government finances remain sound to
preserve room for manoeuvre in the event of negative shocks and to sustain national
saving.
Another challenge is to lift the economic and social prospects of New Zealanders who
have been persistently on low incomes and face material deprivation and multiple barriers
to economic and social participation. The ranks of this group grew sharply between the
mid-1980s and mid-1990s but have declined somewhat since then. The link between
parents’ socio-economic status and a child’s educational and health outcomes is relatively
close on some measures. A higher proportion of Māori and Pasifika live in chronic poverty,
underperform in employment and education, are overrepresented in prison and as victims
of crime, and have poorer health and access to care.
While New Zealand generally scores well on environmental outcomes, it faces
considerable challenges in reducing greenhouse gas emissions owing to the predominance
of agricultural emissions, which are difficult to mitigate. Nevertheless, there is scope to
enhance the effectiveness of the main abatement policy instrument, the NZ Emissions
Trading Scheme, and to remove barriers to the deployment of electric vehicles. Water
quality has also deteriorated, mainly because of the expansion of dairy farming.
The key messages of this Survey are therefore that:
● Measures are needed to deal with shortages of skills and housing and land transport
infrastructure challenges, and to sustain ongoing increases in prosperity.
● Policies should focus on improving incomes, housing, health and education for
New Zealanders lagging behind – the poor, Māori and Pasifika.
● Environmental policies should ensure reduced water pollution and GHG emissions.
OECD ECONOMIC SURVEYS: NEW ZEALAND © OECD 201516
© OECD 2015 6
kurzweg_d
Rectangle

ASSESSMENT AND RECOMMENDATIONS
ors aredicatorension, whichaland.eir BLI
219962
2
3
4
5
6
7
8
9
Figure 1. Better Life Index,1 2015 edition2
1. Each better life dimension is measured by one to four indicators from the OECD Better Life Index (BLI) set. Normalised indicataveraged with equal weights. Indicators are normalised to range between 10 (best) and 0 according to the following formula: (invalue – minimum value)/(maximum value – minimum value) 10. Wealth has been dropped from the income and wealth dimin the standard BLI because household net financial assets were used to proxy household net wealth in the standard measurecan be highly misleading, and because national accounts data on household net financial assets are not available for New ZeThe OECD aggregate is weighted by population. Please note that the OECD does not officially rank countries in terms of thperformance.
2. Data are for the most recent year available in 2015. For income, the reference year is 2012.Source: OECD (2015), OECD Better Life Index, www.oecdbetterlifeindex.org.
1 2 http://dx.doi.org/10.1787/888933
2
3
4
5
6
7
8
9
ME
X
TU
R
CH
L
GR
C
PR
T
HU
N
ES
T
KO
R
SV
K
PO
L
ISR
ITA
CZ
E
JPN
SV
N
ES
P
OE
CD
FR
A
AU
T
GB
R
BE
L
IRL
NLD
DE
U
LUX
ISL
US
A
FIN
NZ
L
CA
N
CH
E
DN
K
SW
E
AU
S
NO
R
ME
X
TU
R
CH
L
GR
C
PR
T
HU
N
ES
T
KO
R
SV
K
PO
L
ISR
ITA
CZ
E
JPN
SV
N
ES
P
OE
CD
FR
A
AU
T
GB
R
BE
L
IRL
NLD
DE
U
LUX
ISL
US
A
FIN
NZ
L
CA
N
CH
E
DN
K
SW
E
AU
S
NO
R
A. Index summary
Income
Jobs and earnings
Housing
Work and life balance
Health status
Education and skillsSocial connections
Civic engagement and governance
Environmental quality
Personal security
Subjective well-being
0
2
4
6
8
10
New Zealand
OECD
B. Index components
OECD ECONOMIC SURVEYS: NEW ZEALAND © OECD 2015 17
© OECD 2015 7
kurzweg_d
Rectangle

ASSESSMENT AND RECOMMENDATIONS
219972
0
2
4
6
8
10D PPPs
0
10
20
30
40
50D PPPs
0
20
40
60
80
100D PPPs
New Zealand is enjoying a strong, broad-based economic expansionEconomic growth has been around 3% over the past three years (except when a
drought temporarily depressed growth in 2013) (Table 1).
● This expansion has been driven mainly by a large increase in the terms of trade, the
post-2011 earthquake reconstruction in Canterbury, and construction activity in
Auckland (Figure 3).
● Net immigration has increased to record rates of around 1.1% of the total population per
year, easing labour-market tensions but exacerbating housing shortages in Auckland.
Figure 2. GDP per capita1
1. Nominal GDP per capita converted to USD at current PPPs. The OECD aggregate is weighted by the population.Source: OECD, National Accounts Database.
1 2 http://dx.doi.org/10.1787/888933
0
2
4
6
8
10Thousand USD PPPs
Thousand US
KO
R
TU
R
ME
X
PR
T
IRL
ES
P
JPN
GR
C
OE
CD
GB
R
ITA
FIN
NO
R
FR
A
DE
U
NZ
L
AU
T
DN
K
BE
L
NLD IS
L
AU
S
CA
N
SW
E
US
A
LUX
CH
E
A. 1975
0
10
20
30
40
50Thousand USD PPPs
Thousand US
ES
T
TU
R
ME
X
CH
L
PO
L
SV
K
HU
N
SV
N
KO
R
PR
T
CZ
E
GR
C
ES
P
NZ
L
IRL
FIN
ISR
OE
CD
FR
A
GB
R
ITA
AU
S
SW
E
BE
L
NLD
JPN
DE
U
CA
N
DN
K
AU
T
ISL
NO
R
US
A
CH
E
LUX
B. 1995
0
20
40
60
80
100Thousand USD PPPs
Thousand US
ME
X
TU
R
CH
L
HU
N
PO
L
GR
C
ES
T
SV
K
PR
T
CZ
E
SV
N
ISR
KO
R
ES
P
ITA
NZ
L
JPN
FR
A
OE
CD
GB
R
FIN
BE
L
ISL
CA
N
DE
U
DN
K
SW
E
AU
S
AU
T
IRL
NLD
US
A
CH
E
NO
R
LUX
C. 2013
OECD ECONOMIC SURVEYS: NEW ZEALAND © OECD 201518
© OECD 2015 8
kurzweg_d
Rectangle

ASSESSMENT AND RECOMMENDATIONS
● The increase in the terms of trade was mainly attributable to earlier price rises for dairy
products, the nation’s largest export (representing one-quarter of goods and services
exports). However, dairy prices have fallen by nearly one-half since the peak in
February 2014. This decline has been only partly offset by oil price declines.
● The growth effect of the Canterbury rebuild is expected to wane by 2016. Infrastructure
and residential construction activity are growing strongly in Auckland in response to
rapid population increases and past shortages and are likely to continue to do so for the
next few years.
● In per capita terms, increases in real GDP and real Gross National Income reached almost 2%
and 3%, respectively, in 2014. These rates are higher than in most other OECD countries.
Table 1. Macroeconomic indicators and projectionsAnnual percentage change unless specified, volume (2009/10 prices)
2011
2012 2013 2014 2015 2016Current prices(billion NZD)
GDP 208.5 2.9 2.5 3.1 3.4 3.0
Private consumption 120.8 2.8 2.9 3.2 3.7 2.8
Government consumption 41.3 -0.9 1.9 3.6 1.4 0.3
Gross fixed capital formation 41.5 7.9 8.6 8.6 7.5 6.1
Housing 8.7 14.8 16.5 16.5 12.9 8.2
Business 20.7 13.5 5.8 8.4 8.8 5.8
Government 12.1 -6.7 7.4 1.5 -0.5 4.0
Final domestic demand 203.6 3.1 3.9 4.5 4.2 3.1
Stockbuilding1 0.6 0.0 0.1 0.2 0.0 0.0
Total domestic demand 204.1 3.1 3.9 4.7 4.1 3.1
Exports of goods and services 65.1 1.7 1.1 2.7 3.0 3.9
Imports of goods and services 60.7 2.7 6.3 7.9 5.6 4.2
Net exports1 4.4 -0.2 -1.5 -1.4 -0.7 -0.1
Other indicators
Potential GDP 2.2 2.3 2.6 2.8 2.9
Output gap2 -1.1 -0.9 -0.5 0.1 0.2
Employment 0.3 1.5 3.5 2.9 1.5
Working-age population3 1.2 1.2 1.1 1.0 1.1
Labour force 0.7 0.8 3.0 2.7 1.1
Unemployment rate (%) 6.9 6.2 5.8 5.6 5.3
GDP deflator -0.4 2.8 2.5 -0.8 1.5
Consumer price index 1.1 1.1 1.2 0.4 1.7
Core consumer prices 1.0 1.2 1.4 1.1 1.7
Terms of trade -4.3 7.2 6.0 -4.1 -0.1
Household saving ratio, net4 2.3 2.2 3.0 3.0 3.0
Current account balance5 -4.0 -3.2 -3.3 -5.4 -5.7
General government financial balance5 -1.6 0.3 1.4 1.9 2.3
Underlying government primary balance2 0.6 1.7 2.0 2.3 2.5
General government gross debt5 41.8 40.8 39.5 37.2 34.7
General government net debt5 6.7 6.3 5.9 3.0 0.5
Three-month money market rate, average (%) 2.7 2.7 3.4 3.6 3.6
Ten-year government bond yield, average (%) 3.7 4.1 4.3 3.5 4.0
1. Contribution to changes in real GDP (percentage points).2. As a percentage of potential GDP.3. Persons aged over 15.4. As a percentage of household disposable income.5. As a percentage of GDP.Source: OECD, Economic Outlook 97 Database.
OECD ECONOMIC SURVEYS: NEW ZEALAND © OECD 2015 19
© OECD 2015 9
kurzweg_d
Rectangle

ASSESSMENT AND RECOMMENDATIONS
Outlook
219981
80
100
120
140
160
180
200
220
2405 = 100
-0.4
-0.2
0.0
0.2
0.4
0.6
0.8
1.0
1.2er cent
The increase in the terms of trade until mid-2014 underpinned a large rise in the real
exchange rate (Figure 4). Increases in commodity prices and farm export volumes
contributed to a reduction in the current account deficit from a peak of 7.3% of GDP in 2008
to 3.3% of GDP in 2014, as did a fall in the net income deficit, which was driven by lower
interest and dividend payments abroad. Following the dairy price reversal, the current
account deficit has started to widen again, and the currency has weakened. The real
exchange rate was recently estimated to be overvalued by 5-15% (IMF, 2014). Continued
current account deficits have led to New Zealand’s sizeable net international liabilities
position, which has fluctuated around 70% of GDP for the past 25 years.
Figure 3. Factors driving the economic expansion
1. USD series.2. Total excluding RBNZ estimates of the direct impact of the rebuild on construction expenditure.3. Cumulative net immigration data for the past four quarters.Source: Reserve Bank of New Zealand (2015), Monetary Policy Statement, March; ANZ Bank; Statistics New Zealand; OECD, EconomicDatabase.
1 2 http://dx.doi.org/10.1787/888933
2000 2002 2004 2006 2008 2010 2012 2014-2
-1
0
1
2
3
4
5Per cent
GDPTerms of trade
A. Growth in GDP and the terms of tradeThree-year moving averages
2006 2008 2010 2012 2014
Index 200
Aggregate commodity priceMeat priceDairy priceForestry priceTerms of trade
B. Export commodity prices¹ and the terms of trade
2000 2002 2004 2006 2008 2010 2012 2014 20167
8
9
10
11
12
13% of potential output
Total constructionExcl. rebuild²
C. The Canterbury rebuild
2000 2002 2004 2006 2008 2010 2012 2014-20
-10
0
10
20
30
40
50
60
70Thousands
P
Level, thousandsShare of total population
D. Net immigration³
OECD ECONOMIC SURVEYS: NEW ZEALAND © OECD 201520
© OECD 2015 10
kurzweg_d
Rectangle

ASSESSMENT AND RECOMMENDATIONS
as the
219999
70
80
90
100
110
120
130
1402 = 100
5-90
-80
-70
-60
-50
-40
-30
-20
-10
0 of GDP
House prices have risen markedly over the past few years and, relative to long-run
averages, are high relative to income and rents by OECD standards (Figure 5). The largest
increases have been in Auckland, where prices are high relative to median incomes by
international comparison (Demographia, 2015). Moreover, housing affordability in
Auckland is poor by historical standards, despite relatively low interest rates (Massey
University, 2015). In addition, house price appreciation has boosted household debt to high
levels relative to incomes (Figure 6). Housing poses some risks to the otherwise sound
financial sector. The banking system is well capitalised, and funding and liquidity buffers
are above required minima. Non-performing loans are below 1% of total lending
(RBNZ, 2015).
Figure 4. External sector indicators
1. Export performance is measured by the evolution of the ratio of exports of goods and services to export market (definedtrade-weighted average of trading partners’ imports) volumes.
2. Year ending in March.Source: Statistics New Zealand; OECD, Economic Outlook Database.
1 2 http://dx.doi.org/10.1787/888933
2000 2002 2004 2006 2008 2010 2012 201470
80
90
100
110
120
130
140
150Index 2007 Q2 = 100
Terms of tradeReal effective exchange rateExport performance¹
A. The terms of trade, real exchange rate and export performance
2000 2002 2004 2006 2008 2010 2012 2014
Index 2007 Q
All pastoral and dairy productsNon-food manufactured goodsServicesGoods & services
B. Export growth by product category
1990 1995 2000 2005 2010 2015-8
-7
-6
-5
-4
-3
-2
-1
0% of GDP
C. Current account balance
1990 1995 2000 2005 2010 201
%
D. Net international investment position²
OECD ECONOMIC SURVEYS: NEW ZEALAND © OECD 2015 21
© OECD 2015 11
kurzweg_d
Rectangle

ASSESSMENT AND RECOMMENDATIONS
Figure 5. House prices
1. Nominal house prices deflated by the private consumption deflator.2. Deviation of the ratio of nominal house prices/nominal disposable income per capita (or /rent prices) over the
long-term average. Q4 2014 or latest available quarter.3. The affordability index defined by the Massey University Real Estate Analysis Unit takes the ratio of the weighted
mortgage interest rate as a percentage of median selling price to the average wage. The lower the index, the moreaffordable the housing.
Source: OECD, Housing Prices Database; Real Estate Institute of New Zealand; and Massey University Real EstateAnalysis Unit, Home Affordability Report, various quarterly reports, www.masseynews.massey.ac.nz; Demographia (2015),11th Annual Demographia International Housing Affordability Survey: 2015.
1 2 http://dx.doi.org/10.1787/888933220009
1990 1992 1994 1996 1998 2000 2002 2004 2006 2008 2010 2012 201475
100
125
150
175
200
225
250
275Index 1990 = 100
75
100
125
150
175
200
225
250
275Index 1990 = 100
New ZealandAustraliaCanada
United StatesOECD average
A. Evolution of real house prices¹
-40
-20
0
20
40
60
80
100Per cent
-40
-20
0
20
40
60
80
100Per cent
KO
R
JPN
GR
C
PR
T
HU
N
SV
K
SV
N
US
A
ES
T
DE
U
CH
E
FIN
CZ
E
IRL
ITA
LUX
ES
P
AU
T
DN
K
NLD
FR
A
NO
R
SW
E
GB
R
NZ
L
CA
N
AU
S
BE
L
House price-to-income ratioHouse price-to-rent ratio
B. House prices are high relative to long-run averages, Q4 2014²
0
2
4
6
8Per cent
0
10
20
30
40Per cent
Haw
ke’s
Bay
Sou
thla
nd
Nor
thla
nd
Man
awat
u/W
anga
nui
Nel
son/
Mar
lbor
ough
Wel
lingt
on
Cen
tral
O
tago
Lak
es
Ota
go
Wai
kato
/B
ay o
f Ple
nty
Tar
anak
i
New
Zea
lan
d
Can
terb
ury/
Wes
tland
Auc
klan
d
Average annual median house price growth, 2010-14Housing affordability³
C. Regional house prices and affordability
0
3
6
9
12
15
18
0
3
6
9
12
15
18
Hon
g K
ong
Van
couv
er
Syd
ney
San
Fra
ncis
co
Mel
bour
ne
Lond
on
San
Die
go
Auc
klan
d
Los
Ang
eles
Tor
onto
New
Yor
k
Chr
istc
hurc
h
Bos
ton
Wel
lingt
on
Sin
gapo
re
Tok
yo
Dub
lin
Osa
ka
D. Median house price relative to median household income, Q3 2014
OECD ECONOMIC SURVEYS: NEW ZEALAND © OECD 201522
© OECD 2015 12
kurzweg_d
Rectangle

ASSESSMENT AND RECOMMENDATIONS
ks – S2
220015
0
50
100
150
200
250
300er cent
40
60
80
100
120
140
160
180er cent
28
30
32
34
36
38
40
42er cent
Business investment has grown strongly during the current expansion, buoyed by
diminishing spare capacity, high levels of business confidence and the low cost of capital.
It is now 10% above the pre-recession peak, similar to the gain in the United States and
Canada, but more than in most other OECD countries. The increase is broad based,
although growth in machinery and equipment investment has lagged behind.
Figure 6. Household debt and funding
1. 2014 for New Zealand and 2012 for Korea and Switzerland.2. Including rental properties for New Zealand.3. A measure of the flow of offshore funding.Source: OECD, Financial Indicators Database; Reserve Bank of New Zealand, Statistics on Households, March 2015 and Registered BanBanks: Funding by Maturity, May 2015.
1 2 http://dx.doi.org/10.1787/888933
0
50
100
150
200
250
300Per cent P
HU
N
SV
N
SV
K
CZ
E
ES
T
ITA
AU
T
DE
U
BE
L
FR
A
GR
C
US
A
FIN
JPN
ES
P
PR
T
GB
R
KO
R
CA
N
NZ
L²
AU
S
CH
E
IRL
NLD
DN
K
A. Household debt-to-disposable-income ratios, 2013¹
1999 2000 2001 2002 2003 2004 2005 2006 2007 2008 2009 2010 2011 2012 2013 201440
60
80
100
120
140
160
180Per cent
P
Debt, % of disposable incomeDebt, % of GDP
B. Household debt² in New Zealand
2004 2005 2006 2007 2008 2009 2010 2011 2012 2013 201428
30
32
34
36
38
40
42Per cent
P
C. Bank non-resident funding³ has declined in New ZealandShare of non-resident funding relative to total funding
OECD ECONOMIC SURVEYS: NEW ZEALAND © OECD 2015 23
© OECD 2015 13
kurzweg_d
Rectangle

ASSESSMENT AND RECOMMENDATIONS
ents.
220027
62
64
66
68
70
72
74
76
78
80
82er cent
0
1
2
3
4
5
6e y-o-y
Labour market performance has been solid, with both labour force participation and
the employment rate at the high end of the OECD country span (Figure 7). Following a soft
patch in 2011-12, robust employment growth resumed, and the unemployment rate has
fallen from 7 to 5¾ per cent recently, although this is still about 2 percentage points higher
than the pre-recession trough. The share of long-term unemployment (27 weeks or more)
has not yet fallen from the post-recession range of 25-30%, which is far higher than the
lows reached in the mid-2000s. Nominal wage growth remains subdued, with annual
increases in the Labour Cost Index (LCI) of private-sector wages running at less than 3%
(below 2% after adjusting for productivity growth), slightly below the average since the
global financial crisis.
Figure 7. Labour market developments
1. Population aged 15 and over.2. Population between 15-64 years old.3. Labour Cost Index of private sector wages. The adjusted LCI excludes increases in wages attributable to productivity improvemSource: Statistics New Zealand, Work, Income, and Spending and OECD, Labour Force Statistics Database.
1 2 http://dx.doi.org/10.1787/888933
2000 2002 2004 2006 2008 2010 2012 201460
62
64
66
68
70Per cent
3
4
5
6
7
8Per cent
Employment rateUnemployment rate
A. Employment and unemployment rates¹
Employment rate LF participation rate
P
New ZealandOECD unweighted average
B. Employment and labour force participation rates,² 2013
2000 2002 2004 2006 2008 2010 2012 201410
15
20
25
30
35
40% of total unemployment
C. Share of long-term unemployment¹Unemployed for 27 weeks or longer
2007 2008 2009 2010 2011 2012 2013 2014
% chang
LCI³LCI³ (adjusted)Average hourly earnings
D. Nominal wage growth
OECD ECONOMIC SURVEYS: NEW ZEALAND © OECD 201524
© OECD 2015 14
kurzweg_d
Rectangle

ASSESSMENT AND RECOMMENDATIONS
es that
tabase.220033
0
1
2
3
4
5
6e y-o-y
2
3
4
5
6
7
8
9
10er cent
Consumer price inflation has been low since 2012 and, following the plunge in global
oil prices, has fallen to near zero (Figure 8). Annual inflation for tradable goods and
services has been negative since 2012 but, abstracting from temporary factors,
non-tradables inflation has been around 2½ per cent since 2012. Non-tradables inflation
has persistently undershot the Reserve Bank’s (RBNZ’s) projections, raising questions
about whether there is more spare capacity than the central bank and the OECD estimate
or whether actual inflation expectations are lower than the main measures suggest
(RBNZ, 2014).
Figure 8. Inflation and its determinants
1. The summary measure is the first principle component of nine survey measures of inflation expectations.2. QSBO: Quarterly Survey Business Opinion. The QSBO principal component indicator is a summary measure of 50 capacity seri
has been fitted to a historical estimate of the output gap.Source: Statistics New Zealand; Reserve Bank of New Zealand (2015), Monetary Policy Statement, March; OECD, Economic Outlook 97 Da
1 2 http://dx.doi.org/10.1787/888933
2007 2008 2009 2010 2011 2012 2013 2014-3
-2
-1
0
1
2
3
4
5
6
7% change y-o-y
CPITradablesNon-tradables
A. CPI inflation and its components
2000 2002 2004 2006 2008 2010 2012 2014
% chang
CPIRBNZ - 2yearSummary measure¹
B. CPI and measures of inflation expectations
2000 2002 2004 2006 2008 2010 2012 2014-4
-3
-2
-1
0
1
2
3
4% of potential output
Output gap - OECD estimateOutput gap - RBNZ estimateQSBO cyclical indicator²
C. Output gap and QSBO cyclical indicator
2007 2008 2009 2010 2011 2012 2013 2014
P
Official cash rateShort-term interest rateLong-term interest rate
D. Interest rates
OECD ECONOMIC SURVEYS: NEW ZEALAND © OECD 2015 25
© OECD 2015 15
kurzweg_d
Rectangle

ASSESSMENT AND RECOMMENDATIONS
The RBNZ increased the Official Cash Rate (OCR) from a historical low of 2.5% in
March 2014 to 3.5% in July 2014. In the face of continued low inflation and the sharp decline
in dairy prices, the RBNZ has announced that it would be appropriate to lower the OCR if
demand weakens and wage and price-setting outcomes settle at levels lower than is
consistent with the inflation target. Tradables inflation (particularly oil prices), house price
increases and the extent to which dairy farmers smooth their spending following the large
recent decline in incomes could all affect inflation dynamics (RBNZ, 2014). The RBNZ’s
approach seems consistent with its mandate to keep inflation within a range of 1-3% on
average over the medium term.
The central government is planning some fiscal consolidation to reduce “net core
crown debt” (a measure of net debt) to 20% of GDP by 2020 from just above 25% now,
through lower expenditures and higher revenues as a percentage of GDP (New Zealand
Treasury, 2014a) (Table 2). Expenditure is expected to grow more slowly than GDP, falling to
29% of GDP in FY 2018/19 from 30.5% in 2013/14. To ensure fiscal sustainability beyond 2020,
additional measures to address long-term pension and health-care costs will be required,
such as raising the age of pension eligibility in line with increases in life expectancy or
indexing pension benefits solely to prices rather than to wages, as recommended in
previous Surveys. Improving the government’s fiscal position in the medium term as
planned is appropriate, subject to allowing the full operation of automatic stabilisers, since
New Zealand faces potentially large macroeconomic shocks, as a commodity-exporting
small open economy, and long-term pension and health-care spending pressures. Planned
increases in public savings will also help to mitigate upward pressure on interest and
exchange rates and reduce risks associated with New Zealand’s elevated level of external
liabilities (Figure 9).
However, care needs to be taken to ensure that consolidation does not impede efforts
to improve the well-being of the most vulnerable members of society. The current
government aims to do so primarily by using existing resources more effectively and
efficiently. Nevertheless, some tax bases could be used to raise revenues: examples are
environmental, land and capital gains taxes.
Economic growth is projected to decline from an annualised rate of over 4% in the
second half of 2014 to 3% in 2016 as the boost from the Canterbury rebuild wanes, the drag
from lower terms of trade takes effect and immigration comes down (Table 1). With
slowing growth in incomes and wealth and net immigration easing from its very high
recent rates, private consumption should decelerate significantly. Growth in business
investment, on the other hand, should remain high as firms seek to ease capacity
constraints in a context of solid profitability and a low cost of capital. Employment gains
are also set to slow but the unemployment rate is projected to fall further to near 5%. Wage
growth is projected to rise only modestly and inflation is projected to pick up to 1.8%, just
below the midpoint of the inflation target range, by late 2016. The current account deficit
is set to increase to 5¾ per cent of GDP, less than the peak during the past business cycle
but still higher than the 3¾ per cent ratio that the IMF (2014) estimates would stabilise net
external liabilities as a share of GDP in the medium term.
OECD ECONOMIC SURVEYS: NEW ZEALAND © OECD 201526
© OECD 2015 16
kurzweg_d
Rectangle

ASSESSMENT AND RECOMMENDATIONS
8/19
0.4
9.0
9.5
5.0
0.0
1.4
1.4
0.1
0.5
0.4
0.4
2.5
8.8
2.1
3.5
2.0
5.1
ealand
220043
-100
-50
0
50
100
150
Table 2. Fiscal consolidation is to continueIn per cent of GDP (unless otherwise noted)
Actual1 Projections
2013/14 2014/15 2015/16 2016/17 2017/18 201
Core crown revenue 28.7 29.9 29.8 29.8 30.1 3
Core crown expenditure 30.5 30.5 29.7 28.9 29.1 2
of which: Social assistance 10.0 10.0 9.7 9.5 9.5
Social assistance related to NZ Super 4.7 4.8 4.8 4.8 4.9
Canterbury rebuild 0.4 0.2 0.1 0.1 0.0
Core crown balance2 -1.3 -0.2 0.2 1.0 1.1
Cyclically adjusted balance -1.0 -0.2 0.0 0.9 1.0
Cyclically adjusted balance (with terms of trade at 20-year average) -3.4 -1.5 -1.3 -0.7 -0.6 -
Fiscal impulse (core crown) -0.3 -1.3 -0.2 -1.0 0.0 -
Fiscal impulse (core crown plus crown entities) 0.0 0.3 -0.1 -1.9 -0.3 -
Fiscal impulse (core crown plus crown entities)excluding EQC and southern response pay-outs
-0.2 -0.1 -0.2 -1.2 -0.2 -
Net core crown debt 25.6 26.5 26.5 25.2 24.0 2
Gross core crown debt 35.0 33.6 33.4 34.3 31.4 2
Memorandum items:
Real GDP growth (production based) 3.5 3.4 3.3 2.7 2.3
Nominal GDP growth (expenditure based) 7.9 2.1 5.8 5.2 4.0
CPI (annual per cent change) 1.5 1.2 1.9 2.1 2.0
Ten-year government bond (per cent) 4.5 4.1 4.2 4.7 5.0
1. Fiscal years end in June.2. Based on operating balance before gains and losses.Source: New Zealand Treasury (2014), Half Year Economic and Fiscal Update, December and OECD calculations.
Figure 9. Net international investment positionAverage 2009-13, as a percentage of GDP
Source: IMF, International Investment Position Database for net international investment position data for all countries except New Z(Statistics New Zealand for net international investment position and OECD, Economic Outlook 96 Database for GDP data).
1 2 http://dx.doi.org/10.1787/888933
-100
-50
0
50
100
150
IRL
ES
P
NZ
L
PO
L
AU
S
TU
R
ME
X
ITA
US
A
GB
R
CA
N
SW
E
FR
A
KO
R
AU
T
FIN
DN
K
DE
U
NLD
BE
L
JPN
NO
R
CH
E
LUX
OECD ECONOMIC SURVEYS: NEW ZEALAND © OECD 2015 27
© OECD 2015 17
kurzweg_d
Rectangle

ASSESSMENT AND RECOMMENDATIONS
There are both upside and downside risks, although some downside risks would have
large potential effects if they materialised. The main downside risk is that China, which is
a key export market for both New Zealand and Australia (New Zealand’s other main export
market), slows more sharply than projected. This would reduce global commodity and
asset prices and demand for New Zealand’s exports. The path of world dairy prices is
particularly important for New Zealand. If they fall further, lower incomes would cause
financial distress among highly leveraged dairy producers. Another downside risk is that
financial volatility and global interest rates could rise faster than expected, increasing the
cost of funds and the current account deficit. This would be especially problematic, given
New Zealand’s heavy foreign debt position. If unemployment were to rise sharply, the
increased difficulty in servicing high household debt could push house prices down,
further dampening demand and causing loan write-downs.
If, on the other hand, dairy prices recover – and China’s demand for dairy products
should rise as it urbanises and rebalances towards private consumption – then domestic
incomes and growth would be boosted. Another upside risk is that net immigration may
not decline as much as assumed, which would boost both demand and productive
potential. Oil prices could turn out either higher or lower than the assumed USD 65 per
barrel. If they fall further, it would boost activity both directly by increasing real disposable
incomes and indirectly through similar effects in trading-partner economies and reduced
transport costs, which would enhance the attractiveness of New Zealand as a tourist
destination; an increase would have the opposite effects.
Policies to sustain the economic expansion
Overcoming skills shortages through migration and training
Given robust activity, labour markets have begun to tighten. Skilled labour has become
steadily more difficult to find, with a rising net number of firms reporting hiring difficulties
since mid-2010 (MBIE, 2014; Statistics New Zealand, 2015). Labour demand has been
particularly strong in the construction sector, reflecting rebuilding following the
Canterbury earthquakes and strong residential building activity in Auckland. Skills
shortages have developed in construction, management occupations and in some
specialised ICT and engineering disciplines. Despite widespread employment gains and
rising vacancies, wage pressures have been subdued. This suggests that, even with
tightening labour markets, skills shortages appear to have been fairly well contained,
probably reflecting migration and targeted policy responses. Surging net permanent and
long-term migration, especially to Auckland and Canterbury, has coincided with more
arrivals with work visas, easing labour shortages.
The authorities have also put programmes in place to strengthen labour market
matching in the Canterbury area, notably the Canterbury Skills and Employment Hub,
which matches NZ jobseekers with employers having vacancies and, in the absence of a
suitable candidate, fast tracks visa applications. Extending the lessons of the Hub to the
national level could improve labour market matching, easing constraints as labour markets
tighten. Recent official assessments suggest that it has had favourable effects, and the
government is considering trials in other regions.
The government has also made strides in skills development by linking individual
career decisions and tertiary education and training to industry needs. For instance, the
Ministry of Business, Innovation and Employment’s Occupational Outlook provides
OECD ECONOMIC SURVEYS: NEW ZEALAND © OECD 201528
© OECD 2015 18
kurzweg_d
Rectangle

ASSESSMENT AND RECOMMENDATIONS
information on career paths, employment prospects and educational requirements to
prospective students. And the Vocational Pathways programme provides clearer
information about employment prospects and more diverse ways of obtaining foundation
skills to move into employment. Funding for positions in high demand, such as in
engineering, has been prioritised, and ICT graduate schools are being developed. There
have also been regional initiatives to provide greater information to vocational education
providers regarding medium-term skills needs. A good example is Skills for Canterbury,
which focuses on skills gaps for the rebuild. Continuing to develop these linkages will aid
in meeting skills needs.
Migration has played a key role in labour market adjustments. Permanent work-related
and temporary migration are both high as a share of the population. The free movement of
labour between Australia and New Zealand has buffered the gap between labour supply and
demand, but immigration from other sources has also been important. Until recently, the net
outflow of New Zealanders, including skilled workers, seeking higher wages in Australia has
been offset by skilled immigration from other sources. More recently, there have been fewer
departures of skilled NZ citizens, which, together with numerous arrivals of skilled
non-citizens, may bring longer-run benefits by complementing local labour market skills
(Docquier et al, 2014). In addition, net immigration is leading to a larger economy, resulting
in scale and agglomeration effects and increased international connectedness, though the
size of these effects in New Zealand is much debated (Fry, 2014). However, high levels of net
immigration add to demand for housing and infrastructure, where strains are already
apparent in Auckland, the main destination for new arrivals.
Since the 2003 immigration reforms, New Zealand’s immigration system has placed a
large weight on skills shortages, employment and work experience, probably contributing
to the very good record of integrating immigrants into labour markets and society. There is
evidence of lower returns on skills paid to immigrants upon arrival compared with their NZ
counterparts, but these gaps become insignificant after 10 years (Maré and Stillman, 2009).
To further improve labour market integration there may be a need to increase the weight
given to English-language proficiency in the immigrant selection process or to provide
further support and monitoring of language training completions (OECD, 2014). Recent
changes in student visas, which now provide work rights, are likely to aid in building soft
skills, potentially further improving students’ eventual labour market outcomes. Increased
monitoring of skills shortage categories, which may require more frequent updating and
refinement of categories, could better ensure the attraction of the right number of people
with appropriate skills.
In addition, New Zealand’s demand-driven model could potentially benefit from more
regular updating of the immigration targets, as in Australia and Canada, and from wider
tolerance ranges for the three-year immigration targets or a higher cap to allow more
flexibility based on economic conditions. The current system may limit needed
immigration during sustained expansions and may induce cyclical constraints on
admittance. Under buoyant labour market conditions it may be more difficult to immigrate
than under less favourable conditions, when pass marks for permanent migration could be
adjusted downward to meet targets (OECD, 2014). However, improving the responsiveness
of housing supply would be necessary before materially raising migration targets.
OECD ECONOMIC SURVEYS: NEW ZEALAND © OECD 2015 29
© OECD 2015 19
kurzweg_d
Rectangle

ASSESSMENT AND RECOMMENDATIONS
Boosting housing supply
Large net immigration has bolstered the economy’s productive capacity but has also
added to regional housing pressures. As highlighted in the 2011 Survey (OECD, 2011;
Cheung, 2011), this issue is essentially confined to Auckland (Figure 10, Panel A), where the
house price boom reflects, at least in part, the failure of housing supply to keep pace with
demand. The responsiveness of supply to rising house prices is around average for
OECD countries, but only half that of the best performing countries (Caldera and
Johansson, 2013). This is problematic, as population growth has been stronger than
average and somewhat more variable. Constrained supply may reduce Auckland’s ability to
achieve agglomeration economies by restricting labour mobility and reducing incentives
for firms to locate in Auckland.
Restrictive land-use and planning regulations are a key factor behind lagging supply
and the resulting high house prices (Glaeser et al., 2008; Gyourko and Molloy, 2014; Grimes
and Aitkens, 2010). In addition, land-use planning has become more complex and costly
over time, involving considerations of infrastructure provision, environmental
sustainability and economic resilience (New Zealand Productivity Commission, 2012).
These regulations, including the Resource Management Act (RMA), are highly devolved, so
more central guidance would be beneficial to ensure consistency with environmental
goals, as well as to reduce scope for vested interests to limit competition or thwart
rezoning and development that would be in the wider public interest. The perceived
quality of local planning and regulation is low relative to other factors affecting the
business climate (Figure 10, Panel B).
In general, economic costs of environmental regulations are relatively high in
New Zealand (Koźluk, 2014), which reflects comparatively heavy administrative burdens
associated with permitting and licencing. This probably falls disproportionately on the
building sector, as the majority of permits issued through the RMA are for land-use
changes (New Zealand Productivity Commission, 2014). Current regulations, including
land-use and planning rules, may have added between NZD 32 500 and 60 000 per dwelling
in subdivisions and between NZD 65 000 and 110 000 per apartment, increasing
construction times and reducing the likelihood of development, particularly of affordable
housing (Grimes and Mitchell, 2015).
Efforts to improve supply responsiveness have been made in Auckland. The Auckland
Housing Accord between the national housing minister and the mayor established Special
Housing Areas that release new land for development, reducing consenting times and
limiting appeals. The creation of Auckland Council’s Housing Project Office has been
instrumental in pulling together skilled planners, infrastructure and environmental
specialists to speed up housing development and has permitted more integrated spatial
planning, a recommendation from the 2011 Survey. However, skills shortages probably
limit the scope to scale up this model further in Auckland and more broadly. Therefore,
there may be a need to better equip local councils through improved training and increased
resources to undertake the planning process and to provide more opportunities for
integrated planning. The sizeable shortfall of 20 000 to 30 000 dwellings will probably
continue to put upward pressure on house prices (Auckland Council, 2012). Indeed,
projected annual demographic housing demand in Auckland is roughly double the pace of
recent building permit issuance (Figure 10, Panel C). Beyond expanding the Metropolitan
Urban Limits in Auckland, extending beyond the Special Housing Areas the limitation of
OECD ECONOMIC SURVEYS: NEW ZEALAND © OECD 201530
© OECD 2015 20
kurzweg_d
Rectangle

ASSESSMENT AND RECOMMENDATIONS
nesses
y 2015;
220054
2.35
2.40
2.45
2.50
2.55
2.60Ratio
-20
-10
0
10
20
30
40
50
60er cent
0
2
4
6
8
10
12
14usands
appeals to those directly affected could augment the housing supply response. As a large
share of planned residential development in Auckland is to continue to occur within
previous city limits, it will be important to find ways to increase community support for
densification. A greater central role in dealing with local objections might take some
pressure off municipal governments. Freeing up public land could also make way for
further developments, particularly of affordable dwellings.
Figure 10. Local planning and building permits
1. Last financial year refers to the last financial year for which businesses had results available in August. Financial years for busifinish on 31 March in New Zealand.
2. Twelve-month moving average of annualised monthly building permits.3. Auckland Council’s average annual projected demand over the next 30 years.Source: Auckland Council (2012), Housing Action Plan – Stage 1, December; Reserve Bank of New Zealand, Financial Stability Report, MaStatistics New Zealand, Business Operations Survey: 2014 and Industry Sectors – Building Consents Statistics.
1 2 http://dx.doi.org/10.1787/888933
1996 1997 1998 1999 2000 2001 2002 2003 2004 2005 2006 2007 2008 2009 2010 2011 2012 2013 20142.80
2.85
2.90
2.95
3.00
3.05Ratio
AucklandCanterburyRest of New Zealand
A. Population-to-dwelling ratio
-20
-10
0
10
20
30
40
50
60Per cent
P
Skilled labour Local planning and regulation
Transport Unskilled labour ICT Water & waste
Business networks
Construction firmsAll firms
B. Firms’ rating of infrastructure and the business climateBalance of opinion (% good - % bad), last financial year at August 2014¹
2004 2005 2006 2007 2008 2009 2010 2011 2012 2013 20140
2
4
6
8
10
12
14Thousands
Tho
Permits²Projected demand³
C. Auckland building permits and projected demand
OECD ECONOMIC SURVEYS: NEW ZEALAND © OECD 2015 31
© OECD 2015 21
kurzweg_d
Rectangle

ASSESSMENT AND RECOMMENDATIONS
Rising house prices have boosted household debt levels, which are high compared
with income by OECD standards, thus increasing financial-stability risks (Figure 6,
Panel A). In October 2013 the RBNZ introduced macro-prudential measures that
temporarily place a 10% limit on new mortgages with loan-to-value (LTV) ratios greater
than 80% during any three-month period and increased the amount of capital banks must
hold against these high-LTV-ratio mortgages. In their first 12 months of operation these
measures proved effective in reducing house price inflation and credit growth (Price, 2014).
Following a resurgence in Auckland house prices beginning in late-2014, the RBNZ
announced in May 2015 that from October 2015 banks will be required to hold more capital
against loans secured on residential property that is not owner-occupied and is consulting
on proposals that investors using bank loans to purchase such property will be required to
have a deposit of at least 30% in the Auckland Council area. Such macro-prudential
instruments are preferable to interest rate changes because they are more tightly targeted
on financial stability objectives. They also avoid putting unnecessary upward pressure on
the exchange rate, which would harm the tradables sector. Also from this time, the
government plans to tax gains on residential property sold within two years of purchase
(bought on or after 1 October 2015), unless the property is a primary residence, inherited or
is part of a relationship property settlement, and to require non-resident purchasers to
have an Inland Revenue Department tax number and a NZ bank account. These measures
will strengthen enforcement of the tax code in relation to the taxation of trading gains on
property and provide information on non-residents’ property transactions.
Diversifying infrastructure funding and improving infrastructure demand management
The quality of NZ infrastructure is perceived to be low relative to local expectations
(Figure 11, Panel A), and NZ firms surveyed continue to report an inadequate supply of
infrastructure as the most important barrier to doing business (World Economic
Forum, 2014). In the city of Auckland, while road congestion has declined, it remains
significant, particularly at peak periods. Based on the TomTom traffic index (TomTom, 2015),
Auckland and Wellington are considered to be the second and third most congested cities in
Australasia, just behind Sydney, although the Beca Travel Time survey (2014) may paint a
different picture. Congestion is estimated to cost the Auckland region NZD 1.25 billion
annually compared to free flow conditions (Wallis and Lupton, 2013). New Zealand has had
relatively low investment in road infrastructure as a proportion of GDP (Panel C). However,
the level of investment in road projects has increased, which may alleviate shortages.
Beyond transport, required water infrastructure upgrades may be constraining needed
housing supply by holding back densification opportunities in Auckland.
With the central government concerned to reduce its debt, meeting these infrastructure
needs will have to focus on diversifying funding sources. Local and national roads could
make greater use of tolls, and Public-Private Partnerships could make more efficient use of
resources. For core water infrastructure, long-run marginal cost pricing would ensure funding
for capacity expansion and future upgrades but would require increasing water prices,
which might be politically difficult. Local councils could also consider greater use of debt
financing of their infrastructure needs, since the benefits extend over several generations.
However, this would require increasing debt-servicing capacity. Options that could be
considered include: i) sharing in a revenue base linked to local economic activity; and
ii) taxing the windfall gains that accrue to landowners from rezoning land for urban use.
OECD ECONOMIC SURVEYS: NEW ZEALAND © OECD 201532
© OECD 2015 22
kurzweg_d
Rectangle

ASSESSMENT AND RECOMMENDATIONS
t Forum
220062
1
2
3
4
5
6
7
1
2
3
4
5
6
7
0.0
0.5
1.0
1.5
While additional investments in road infrastructure will probably continue to provide
net benefits (New Zealand Treasury, 2014b), there are ways to better manage demand.
Charging higher road tolls at peak times could spread road use towards non-peak hours.
Funding additional public transport infrastructure would provide other options for
commuters, reduce road congestion and help lower greenhouse gas emissions.
Figure 11. Infrastructure provision and quality
1. Or of the last 10 years available.Source: World Economic Forum (2014), The Global Competitiveness Report 2014-15 for Panels A and B; and OECD, International TransporDatabase for Panel C.
1 2 http://dx.doi.org/10.1787/888933
1
2
3
4
5
6
7
PO
L
SV
K
ME
X
ISR
GR
C
ITA
CH
L
HU
N
CZ
E
IRL
AU
S
SV
N
TU
R
NZ
L
ES
T
NO
R
GB
R
OE
CD
KO
R
CA
N
SW
E
BE
L
US
A
DN
K
LUX
ES
P
PR
T
DE
U
FR
A
JPN
ISL
AU
T
NLD FIN
CH
E
A. Perceived quality of overall infrastructureScore from 1 to 7 (best)
1
2
3
4
5
6
7
PO
L
SV
K
CZ
E
NO
R
HU
N
ITA
GR
C
ES
T
ME
X
ISR
AU
S
TU
R
ISL
SV
N
NZ
L
CH
L
OE
CD
GB
R
BE
L
IRL
CA
N
DN
K
SW
E
KO
R
US
A
LUX
FIN
DE
U
ES
P
JPN
CH
E
NLD
FR
A
AU
T
PR
T
B. Perceived quality of road infrastructureScore from 1 to 7 (best)
0.0
0.5
1.0
1.5
AU
T
GB
R
ME
X
DN
K
NLD FIN
BE
L
SW
E
DE
U
TU
R
NZ
L
LUX
ITA
FR
A
NO
R
SV
K
OE
CD
CA
N
ES
T
ES
P
CH
E
HU
N
PR
T
CZ
E
AU
S
JPN
PO
L
ISL
SV
N
C. Investment in road infrastructureAverage of 2002-11,¹ per cent of GDP
OECD ECONOMIC SURVEYS: NEW ZEALAND © OECD 2015 33
© OECD 2015 23
kurzweg_d
Rectangle

ASSESSMENT AND RECOMMENDATIONS
Policies to enhance environmental sustainability
Reducing greenhouse gas emissions
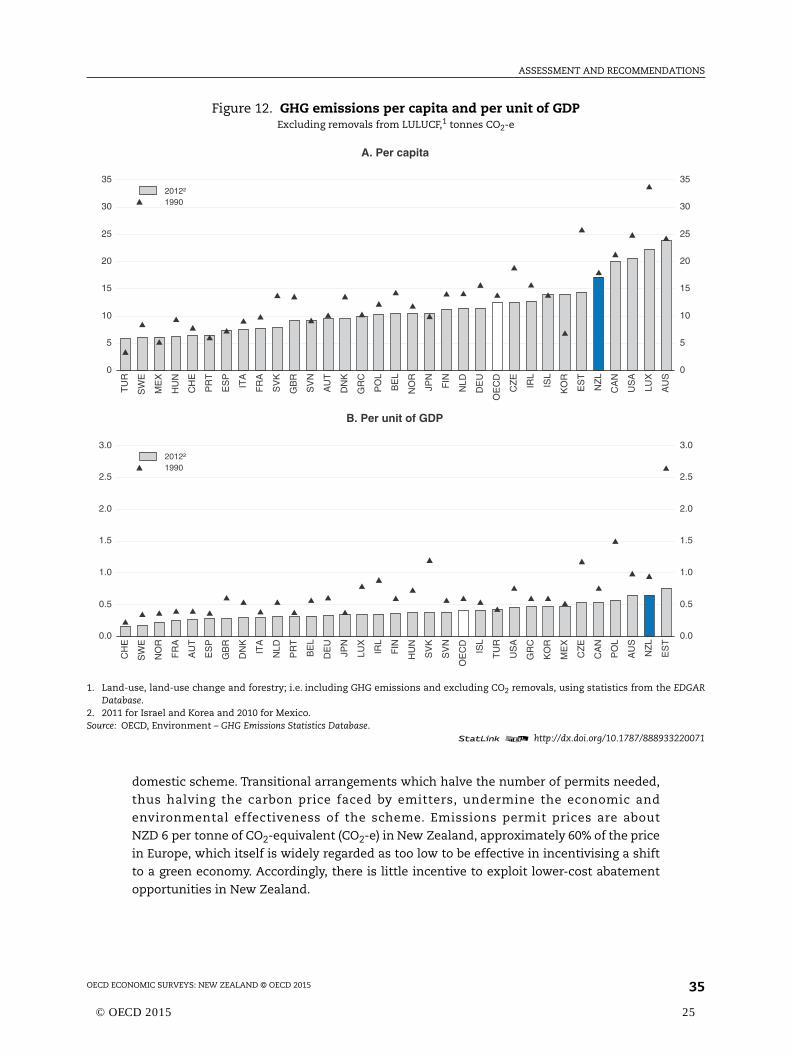
New Zealand’s greenhouse gas (GHG) emissions per capita and per unit of GDP are
high by international comparison but have fallen since 1990, albeit more slowly than in
most other advanced countries (Figure 12). Moreover, the emissions profile is unusual for
an advanced country in that nearly half of emissions come from agriculture, where there
are currently limited cost-effective abatement possibilities (Figure 13). Around
three-quarters of electricity already comes from renewable sources, and although progress
could be made by reducing emissions from New Zealand’s single coal-fired power station
and further increasing the use of low-carbon energy sources such as wind power, the
prospects are otherwise somewhat limited. On the other hand, transport emission
intensities are high (International Transport Forum, 2010), reflecting low use of public
transport and poor average vehicle fuel economy. New Zealand is expected to over-achieve
its Kyoto Protocol commitment to reduce net GHG emissions (including land use, land use
change and forestry) to the 1990 level over 2008-12 and is on track to meet its unilateral
reduction target of 5% from the 1990 level by 2020, taking into account the surplus achieved
during the first commitment period (Figure 14). New Zealand aims to reduce net GHG
emissions to 50% below the 1990 level by 2050.
Climate change policy in New Zealand is facing uncertainty while the government
waits for clearer signals about intended action in major countries to reduce emissions. As
New Zealand did not make a second-period commitment (2013-20) under the Kyoto Protocol,
it has been excluded from international trade in Kyoto Protocol GHG units from 2015
(although New Zealand is still able to purchase units from the Clean Development
Mechanism Registry). This limits the potential of the NZ Emissions Trading Scheme (ETS),
the major instrument to reduce emissions, to achieve its intended aim of minimising
abatement costs through trade in emission permits. In effect, the ETS has become a purely
Recommendations to sustain the economic expansion
● Implement fiscal consolidation measures to reduce net debt, as planned, while continuingefforts to improve the well-being of the most vulnerable members of society. Allow theautomatic stabilisers to operate fully.
● Provide guidance to regional authorities in the implementation of environmental andplanning regulations, including the Resource Management Act. Reduce their economiccosts and the scope for vested interests to limit competition or thwart rezoning anddevelopment that would be in the wider public interest.
● Implement infrastructure demand management strategies to reduce urban roadcongestion, notably congestion charging. Consider diversifying revenue sources forinfrastructure funding, such as sharing in a revenue base linked to local economicactivity or taxing the windfall gains that accrue to landowners from rezoning land forurban use.
● Draw lessons from the Canterbury Skills and Employment Hub (a labour-market matchingscheme), trial it elsewhere and, subject to positive results, roll it out country-wide.
● More frequently update immigration skills shortage categories to reduce labour marketbottlenecks.
OECD ECONOMIC SURVEYS: NEW ZEALAND © OECD 201534
© OECD 2015 24
kurzweg_d
Rectangle
ASSESSMENT AND RECOMMENDATIONS
EDGAR
220071
0
5
10
15
20
25
30
35
0.0
0.5
1.0
1.5
2.0
2.5
3.0
domestic scheme. Transitional arrangements which halve the number of permits needed,
thus halving the carbon price faced by emitters, undermine the economic and
environmental effectiveness of the scheme. Emissions permit prices are about
NZD 6 per tonne of CO2-equivalent (CO2-e) in New Zealand, approximately 60% of the price
in Europe, which itself is widely regarded as too low to be effective in incentivising a shift
to a green economy. Accordingly, there is little incentive to exploit lower-cost abatement
opportunities in New Zealand.
Figure 12. GHG emissions per capita and per unit of GDPExcluding removals from LULUCF,1 tonnes CO2-e
1. Land-use, land-use change and forestry; i.e. including GHG emissions and excluding CO2 removals, using statistics from theDatabase.
2. 2011 for Israel and Korea and 2010 for Mexico.Source: OECD, Environment – GHG Emissions Statistics Database.
1 2 http://dx.doi.org/10.1787/888933
0
5
10
15
20
25
30
35
TU
R
SW
E
ME
X
HU
N
CH
E
PR
T
ES
P
ITA
FR
A
SV
K
GB
R
SV
N
AU
T
DN
K
GR
C
PO
L
BE
L
NO
R
JPN
FIN
NLD
DE
U
OE
CD
CZ
E
IRL
ISL
KO
R
ES
T
NZ
L
CA
N
US
A
LUX
AU
S
2012²1990
A. Per capita
0.0
0.5
1.0
1.5
2.0
2.5
3.0
CH
E
SW
E
NO
R
FR
A
AU
T
ES
P
GB
R
DN
K
ITA
NLD
PR
T
BE
L
DE
U
JPN
LUX
IRL
FIN
HU
N
SV
K
SV
N
OE
CD
ISL
TU
R
US
A
GR
C
KO
R
ME
X
CZ
E
CA
N
PO
L
AU
S
NZ
L
ES
T
2012²1990
B. Per unit of GDP
OECD ECONOMIC SURVEYS: NEW ZEALAND © OECD 2015 35
© OECD 2015 25
kurzweg_d
Rectangle

ASSESSMENT AND RECOMMENDATIONS
220084
Based on a modelling assumption that the NZ ETS yields a carbon price of NZD 5 per
tonne of CO2-e over the next 15 years (i.e. transitional arrangements remain in place), it
and other quantifiable policy measures are projected to reduce gross emissions by only
0.4% in 2030 from a business-as-usual baseline and to reduce net emissions (i.e. taking into
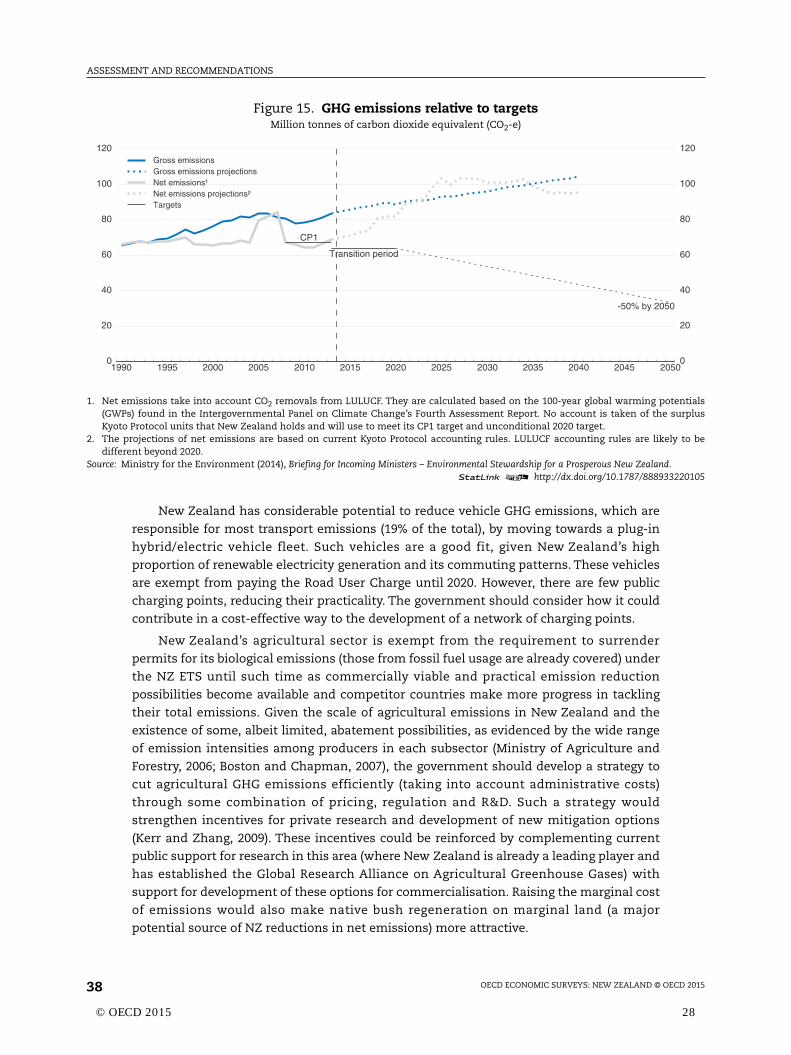
account CO2 removals by forests) by 4.1% (Table 3). Net emissions are projected to grow
substantially over coming decades, which will necessitate the purchase of international
units to meet official targets (Figure 15). The transitional arrangements that halve carbon
prices should be terminated to provide businesses and consumers with greater certainty
about the future path of carbon prices. This would reduce the risk of losses from stranded
emissions-intensive investments.
Figure 13. GHG emissions and energy mix
1. OECD average excludes Chile, Israel, Mexico and Turkey.Source: OECD, Environment Statistics Database and IEA, World Energy Balances Database.
1 2 http://dx.doi.org/10.1787/888933
Agriculture 46.1%
Energy 24.2%
Transport 18.1%
Industrial processes 6.9%Waste 4.7%
A. GHG emissions by sectorPercentage share of total GHG emissions excluding LULUCF, 2012
New Zealand
Agriculture 8.6%
Energy 59.8%
Transport 23.2%
Industrial processes 5.9%
Waste 2.3%OECD
Coal 7.0%
Oil 33.7%
Gas 21.3%
Nuclear 0.0%
Renewables 38.1%
B. Energy mixPercentage share of total primary energy supply, 2013
New Zealand
Coal 21.6%Oil 39.9%
Gas 28.7%Nuclear 10.8%
Renewables 9.8%
OECD¹
OECD ECONOMIC SURVEYS: NEW ZEALAND © OECD 201536
© OECD 2015 26
kurzweg_d
Rectangle

ASSESSMENT AND RECOMMENDATIONS
ovt.nz/
aland’sluding
220099
Figure 14. GHG emissions and Kyoto units for 2008-12Million tonnes of carbon dioxide equivalent (CO2-e), as at April 2014
1. Commitment for the first commitment period (CP1) under the Kyoto Protocol.Source: Ministry for the Environment (2014), “Latest Update on New Zealand’s Net Position under the Kyoto Protocol”, www.mfe.gclimate-change/reporting-greenhouse-gas-emissions/nzs-net-position-under-kyoto-protocol/latest.
How to read this figure: Total gross emissions over 2008-12 were 372.8 million tonnes of CO2-e (Mt), which exceeds New ZeCP1 commitment of 309.6 Mt. However, after allowing for forestry removal units, New Zealand meets its commitment and, incInternational Kyoto Units that it holds, has a surplus of 90.8 Mt of Kyoto Units to carry forward.
1 2 http://dx.doi.org/10.1787/888933
0
100
200
300
400
500
Commitment 309.6¹
Surplus 90.8
Total Emissions
372.8
Assigned Amount Units (AAUs)
302.1
International Kyoto Units
through NZ ETS 90.0
Removal Units (RMUs) from
Art.3.3 forestry 71.6
Total Emissions Kyoto Units Available
Table 3. Projected emissions in 2030 with and without measures1
Sector
Withoutmeasures
Withmeasures
Absolutedifference Percentage
differenceCO2-e, thousands of metric tonnes
Energy 18 360 18 311 -49 -0.3
Transport 15 904 15 900 -5 0.0
Industrial processes 6 121 6 121 0 0.0
Agriculture 39 599 39 599 0 0.0
Forestry 5 908 2 588 -3 320 -56.2
Waste 2 565 2 315 -251 -9.8
Total gross emissions (excluding LULUCF) 82 548 82 244 -304 -0.4
Total net emissions (including LULUCF) 88 456 84 832 -3 624 -4.1
1. Emissions projections under a “with measures” scenario include: the modelled impacts of the NZ ETS for theenergy, industrial processes, waste and forestry sectors, including changes to the scheme passed into law inNovember 2012; government afforestation grant schemes; and the national Environmental Standard to controlmethane emissions from landfills. The international carbon price is assumed to be NZD 10 per tonne of CO2-e,which corresponds to an effective price of NZD 5 per tonne of CO2-e now that only one permit is required pertwo tonnes of emissions.
Source: Ministry for the Environment (2013), New Zealand’s Sixth National Communication under the United NationsFramework Convention on Climate Change and the Kyoto Protocol.
OECD ECONOMIC SURVEYS: NEW ZEALAND © OECD 2015 37
© OECD 2015 27
kurzweg_d
Rectangle
ASSESSMENT AND RECOMMENDATIONS
entialsurplus
y to be
220105
00
20
40
60
80
100
120
New Zealand has considerable potential to reduce vehicle GHG emissions, which are
responsible for most transport emissions (19% of the total), by moving towards a plug-in
hybrid/electric vehicle fleet. Such vehicles are a good fit, given New Zealand’s high
proportion of renewable electricity generation and its commuting patterns. These vehicles
are exempt from paying the Road User Charge until 2020. However, there are few public
charging points, reducing their practicality. The government should consider how it could
contribute in a cost-effective way to the development of a network of charging points.
New Zealand’s agricultural sector is exempt from the requirement to surrender
permits for its biological emissions (those from fossil fuel usage are already covered) under
the NZ ETS until such time as commercially viable and practical emission reduction
possibilities become available and competitor countries make more progress in tackling
their total emissions. Given the scale of agricultural emissions in New Zealand and the
existence of some, albeit limited, abatement possibilities, as evidenced by the wide range
of emission intensities among producers in each subsector (Ministry of Agriculture and
Forestry, 2006; Boston and Chapman, 2007), the government should develop a strategy to
cut agricultural GHG emissions efficiently (taking into account administrative costs)
through some combination of pricing, regulation and R&D. Such a strategy would
strengthen incentives for private research and development of new mitigation options
(Kerr and Zhang, 2009). These incentives could be reinforced by complementing current
public support for research in this area (where New Zealand is already a leading player and
has established the Global Research Alliance on Agricultural Greenhouse Gases) with
support for development of these options for commercialisation. Raising the marginal cost
of emissions would also make native bush regeneration on marginal land (a major
potential source of NZ reductions in net emissions) more attractive.
Figure 15. GHG emissions relative to targetsMillion tonnes of carbon dioxide equivalent (CO2-e)
1. Net emissions take into account CO2 removals from LULUCF. They are calculated based on the 100-year global warming pot(GWPs) found in the Intergovernmental Panel on Climate Change’s Fourth Assessment Report. No account is taken of the sKyoto Protocol units that New Zealand holds and will use to meet its CP1 target and unconditional 2020 target.
2. The projections of net emissions are based on current Kyoto Protocol accounting rules. LULUCF accounting rules are likeldifferent beyond 2020.
Source: Ministry for the Environment (2014), Briefing for Incoming Ministers – Environmental Stewardship for a Prosperous New Zealand.1 2 http://dx.doi.org/10.1787/888933
1990 1995 2000 2005 2010 2015 2020 2025 2030 2035 2040 2045 2050
20
40
60
80
100
120
CP1
Transition period
-50% by 2050
Gross emissionsGross emissions projectionsNet emissions¹Net emissions projections²Targets
OECD ECONOMIC SURVEYS: NEW ZEALAND © OECD 201538
© OECD 2015 28
kurzweg_d
Rectangle
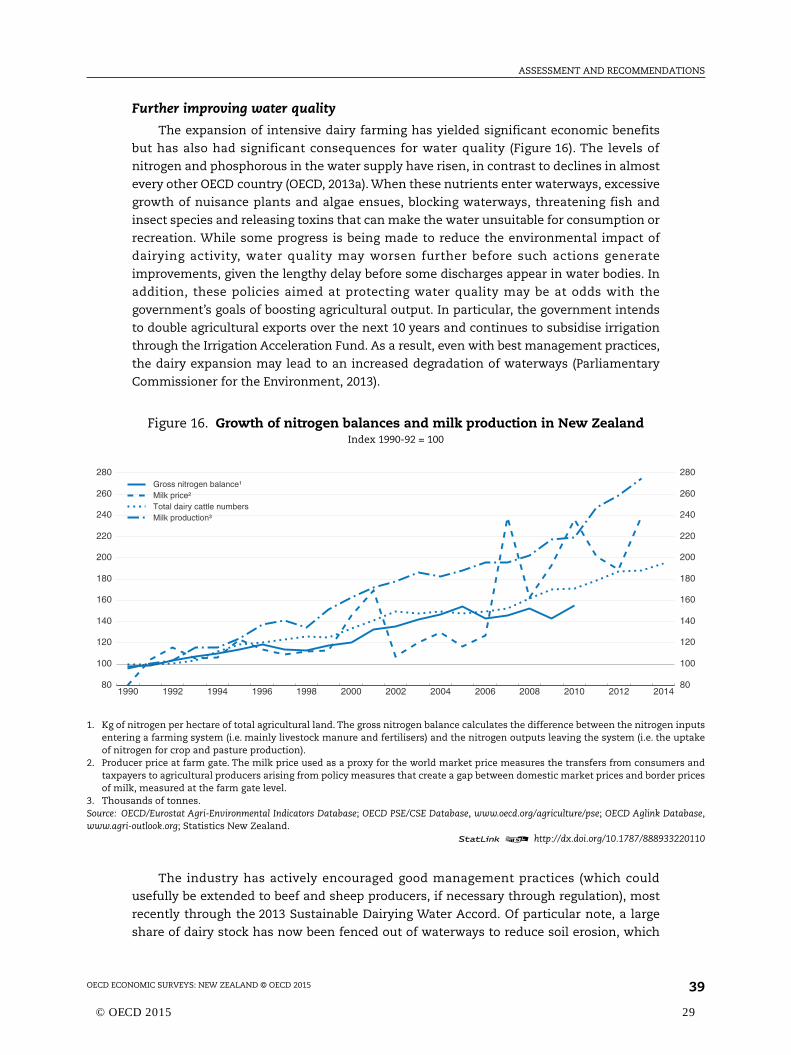
ASSESSMENT AND RECOMMENDATIONS
inputsuptake
rs andprices
tabase,
220110
80
100
120
140
160
180
200
220
240
260
280
Further improving water quality
The expansion of intensive dairy farming has yielded significant economic benefits
but has also had significant consequences for water quality (Figure 16). The levels of
nitrogen and phosphorous in the water supply have risen, in contrast to declines in almost
every other OECD country (OECD, 2013a). When these nutrients enter waterways, excessive
growth of nuisance plants and algae ensues, blocking waterways, threatening fish and
insect species and releasing toxins that can make the water unsuitable for consumption or
recreation. While some progress is being made to reduce the environmental impact of
dairying activity, water quality may worsen further before such actions generate
improvements, given the lengthy delay before some discharges appear in water bodies. In
addition, these policies aimed at protecting water quality may be at odds with the
government’s goals of boosting agricultural output. In particular, the government intends
to double agricultural exports over the next 10 years and continues to subsidise irrigation
through the Irrigation Acceleration Fund. As a result, even with best management practices,
the dairy expansion may lead to an increased degradation of waterways (Parliamentary
Commissioner for the Environment, 2013).
The industry has actively encouraged good management practices (which could
usefully be extended to beef and sheep producers, if necessary through regulation), most
recently through the 2013 Sustainable Dairying Water Accord. Of particular note, a large
share of dairy stock has now been fenced out of waterways to reduce soil erosion, which
Figure 16. Growth of nitrogen balances and milk production in New ZealandIndex 1990-92 = 100
1. Kg of nitrogen per hectare of total agricultural land. The gross nitrogen balance calculates the difference between the nitrogenentering a farming system (i.e. mainly livestock manure and fertilisers) and the nitrogen outputs leaving the system (i.e. theof nitrogen for crop and pasture production).
2. Producer price at farm gate. The milk price used as a proxy for the world market price measures the transfers from consumetaxpayers to agricultural producers arising from policy measures that create a gap between domestic market prices and borderof milk, measured at the farm gate level.
3. Thousands of tonnes.Source: OECD/Eurostat Agri-Environmental Indicators Database; OECD PSE/CSE Database, www.oecd.org/agriculture/pse; OECD Aglink Dawww.agri-outlook.org; Statistics New Zealand.
1 2 http://dx.doi.org/10.1787/888933
1990 1992 1994 1996 1998 2000 2002 2004 2006 2008 2010 2012 201480
100
120
140
160
180
200
220
240
260
280Gross nitrogen balance¹Milk price²Total dairy cattle numbersMilk production³
OECD ECONOMIC SURVEYS: NEW ZEALAND © OECD 2015 39
© OECD 2015 29
kurzweg_d
Rectangle

ASSESSMENT AND RECOMMENDATIONS
releases phosphorous, and the government intends to have all dairy cattle excluded by
1 July 2017. However, the Accord’s requirement that dairy conversions subscribe to good
management practices is likely to prove insufficient to offset the increased nutrient
leaching resulting from conversions.
A broad consensus has formed that water quality challenges need to be addressed.
Significant strides have been made in developing a collaborative process to tackle these
issues. In particular, the Land and Water Forum was established in 2009. It is composed of
representatives of primary industries, electricity generators, recreational groups,
environmental organisations, Māori tribes and academia and has focused on informing the
future direction of water management. Following its recommendations (Land and Water
Forum, 2010, 2012a, 2012b), the government established the National Policy Statement for
Freshwater Management in 2011 which requires regional councils to maintain or improve
overall water quality at the regional level. A 2014 amendment provided a process to set
freshwater objectives and limits on water resources (discharges to water and water
extractions) for all freshwater management units (FMUs) (comprised of part, one or several
water bodies). Regions set goals for each FMU (swimming, wading, etc.), and the National
Objectives Framework provides levels (eg. nitrate concentrations) required to achieve those
goals. Goals for each FMU must be set above a specified minimum level required to ensure
ecosystem and human health. The attribution of responsibilities to the regional level
provides flexibility to allow degradation of a particular water body (e.g. for economic
reasons), provided there are offsetting improvements elsewhere.
This system has just recently been implemented, and it is thus too early to judge its
effectiveness. However, it may be difficult for regional councils to assess offsetting
improvements. Therefore, the government should monitor regional implementation to
ensure consistency with improving water quality. Depending on the outcome, it may have
to clarify how different water quality measures and FMUs should be weighted in assessing
overall regional water quality. It may also have to provide further guidance concerning FMU
delineation to avoid water bodies falling below national minimum standards. If the current
system fails to produce sufficient progress, the government should consider enforcing a
“maintain or improve” condition, subject to achieving minimum standards at the level of
individual water bodies or FMUs, with exemptions agreed at the central level.
With updates to the National Objectives Framework envisaged in 2016 and 2019, the
government should continue to expand the range of attributes included. It should also
develop limits on a broader range of urban contaminants, such as heavy metals, and
broader measures of ecosystem health, such as the Macroinvertebrate Community Index,
which proxies water bodies’ life-supporting capacity (Stark and Maxted, 2007). Further
investment is needed in gathering data, standardising sampling and modelling water
quality. This could be supported at the national level by passing the Environmental
Reporting Bill, which aims to make information on environmental indicators available
nationally on a more systematic and reliable basis. As these policies will probably limit
dairy farming or at least impose costs associated with obtaining permits, bank lending to
the dairy sector should be monitored to ensure that these potential developments are
being taken into account when assessing the ability of farmers to repay debt.
OECD ECONOMIC SURVEYS: NEW ZEALAND © OECD 201540
© OECD 2015 30
kurzweg_d
Rectangle

ASSESSMENT AND RECOMMENDATIONS
Making economic growth more inclusiveNew Zealand has generally done well in enabling economic and social participation of
its people. Yet, as in many other countries, income inequality and poverty have increased,
rising housing costs have hit the poor hardest, and the rate of improvement in many health
outcomes has been slower for disadvantaged groups than for others. Gaps in education
attainment have narrowed, but the influence of socio-economic background on education
achievement has increased. Of particular concern are those New Zealanders who face
persistently low incomes, material hardship and multiple barriers to economic and social
participation. This includes children in welfare beneficiary households, who have the
highest risk of material hardship and poor long-term outcomes across a range of
dimensions. While Māori and Pasifika are less than a quarter of the population, they are
significantly overrepresented in these groups.
NZ governments have made improving outcomes in key areas that affect well-being
(income, housing, health and education) for low socio-economic households, including
many Māori and Pasifika people, a top priority. Because the same individuals tend to have
poor outcomes across the various dimensions of well-being, a co-ordinated multi-pronged
approach is needed. In particular, there is a need to better use data and evidence to target
and tailor interventions across the public sector to more effectively improve the long-term
outcomes of the most disadvantaged New Zealanders. The reforms recommended here are
not comprehensive but fit with the government’s focus on more tailored and targeted
social investment to lift the contribution of social services to long-term outcomes.
Reducing income inequality and poverty
Income inequality increased substantially between the mid-1980s and mid-1990s, when
major structural reforms occurred and government budget deficits and inflation were
reduced, but it has stabilised and even declined slightly since then. On average, those with
low incomes after taxes and transfers experienced slow income growth, as in many other
countries, while high income earners enjoyed very rapid gains (Figure 17). However, between
the 1990s and 2000s growth was greater in low-income households. Disposable income
inequality increased from below the OECD average in the mid-1980s to above it now
(Figure 18), largely due to increases in the inequality of market incomes, but in part because
redistribution through taxes and transfers declined. This reflected reforms that reduced the
progressivity of the tax system and lowered benefit replacement rates (Figure 19).
Recommendations to enhance environmental sustainability
● Terminate the transitional arrangements that halve the number of emission permits(and hence their price) needed by emitters in the NZ Emissions Trading Scheme (ETS).Develop a strategy to cut agricultural GHG emissions efficiently through a combinationof pricing, regulation and R&D.
● Monitor the implementation of the 2014 National Policy Statement for FreshwaterManagement in regional plans to ensure water quality meets goals. Provide clearertechnical guidance for regional councils. Ensure that information on environmentalquality is comparable and reliable, in part by passing the Environmental Reporting Bill.
OECD ECONOMIC SURVEYS: NEW ZEALAND © OECD 2015 41
© OECD 2015 31
kurzweg_d
Rectangle

ASSESSMENT AND RECOMMENDATIONS
seholdkinsone, zeroes and
gdom.to data
ample,sed by
220123
-5
0
5
10
15
20
25
30
35
40
45er cent
6
Figure 17. Growth in real household disposable income1 across the distributionTotal population, percentage income growth
1. Equivalised household incomes (i.e. adjusted for household size – total household income is divided by the square root of housize) across the distribution are measured by the full range of bottom to top income standards, as determined by the Atinequality aversion parameter (a low value corresponding to high inequality aversion). A low value corresponds to low incomto median income and a high value to high income. Data are for deciles and expressed in USD 1 000, at constant pricconstant 2010 purchasing power parities for households’ consumption.
2. EU countries include Denmark, Finland, France, Germany, Italy, Luxembourg, the Netherlands, Sweden and the United KinOther English-speaking countries include Canada, the United Kingdom and the United States, but exclude Australia owingunavailability in the mid-1980s and Ireland due to a break in the series. Country averages are population weighted.
3. 2011 or nearest available year.Source: Calculations from the OECD Income Distribution Database, via www.oecd.org/social/income-distribution-database.htm.
How to read this figure: Each curve represents cumulative income growth at different points of the income distribution. For exlow real incomes in New Zealand grew by 13% between the mid-1980s and 2011 (Panel C) while high real incomes increa44%, indicating that income inequality widened.
1 2 http://dx.doi.org/10.1787/888933
-20
-15
-10
-5
0
5
10
15
20
25
30Per cent
Median income
Low income High income-16 -12 -8 -4 0 4 8 12 16
New ZealandOther English-speaking countries²EU countries²
A. Between mid-1980s and mid-1990sP
Median income
Low income High income-16 -12 -8 -4 0 4 8 12 1
New ZealandOther English-speaking countries²EU countries²
B. Between mid-1990s and 2011³
0
5
10
15
20
25
30
35
40
45
50Per cent
0
5
10
15
20
25
30
35
40
45
50Per cent
Median income
Low income High income-16 -12 -8 -4 0 4 8 12 16
New ZealandOther English-speaking countries²EU countries²
C. Between mid-1980s and 2011³
OECD ECONOMIC SURVEYS: NEW ZEALAND © OECD 201542
© OECD 2015 32
kurzweg_d
Rectangle

ASSESSMENT AND RECOMMENDATIONS
mplete
220135
220141
0.20
0.25
0.30
0.35
0.40
0.45
0.50
0.55
CH
L
0
e²
Figure 18. Inequality in household disposable incomeGini coefficient,1 total population
1. The Gini coefficient is a measure of income inequality that ranges from 0 (where all households have the same income, or coequality) to 1 (where one household has all the income).
2. Mid-80s corresponds to the interval 1983-87, mid-90s to 1993-96 and 2011 refers to the latest available year.3. Unweighted average of countries available for each period.Source: Calculations from the OECD Income Distribution Database, via www.oecd.org/social/income-distribution-database.htm.
1 2 http://dx.doi.org/10.1787/888933
Figure 19. Reduction of market income inequality through taxes and transfers1
Working-age population
1. Difference between market- and disposable-income Gini coefficients, as a percentage of the market-income Gini coefficient.2. Unweighted average of countries available for each period.3. Or latest year available.Source: Calculations from the OECD Income Distribution Database, via www.oecd.org/social/income-distribution-database.htm.
1 2 http://dx.doi.org/10.1787/888933
0.20
0.25
0.30
0.35
0.40
0.45
0.50
0.55
2011²
Mid-90s²Mid-80s²
SV
N
NO
R
ISL
DN
K
CZ
E
FIN
SV
K
BE
L
SW
E
LUX
NLD
AU
T
CH
E
HU
N
DE
U
IRL
PO
L
KO
R
FR
A
OE
CD
³
CA
N
ITA
ES
T
NZ
L
AU
S
GR
C
JPN
PR
T
ES
P
GB
R
ISR
US
A
TU
R
ME
X
0 5 10 15 20 25 3
Mid-1980s
Mid-1990s
Mid-2000s
Late-2000s
Around 2010
2011³
OECD averag
New Zealand
Percentage reduction in inequality (measured by the change in Gini coefficients)
OECD ECONOMIC SURVEYS: NEW ZEALAND © OECD 2015 43
© OECD 2015 33
kurzweg_d
Rectangle

ASSESSMENT AND RECOMMENDATIONS
eshold
at the
Social
220154
4
6
8
10
12
14
16
18
20
22
24er cent
5
10
15
20
25
30
35er cent
Poverty rates after housing costs also increased in the decade to the mid-1990s,
especially for children, but have been broadly stable since then if the poverty line is
expressed as a percentage of median income, and have even declined somewhat if it is
expressed as a percentage of real median income in a reference year (Figure 20). Increases
in poverty rates before housing costs have been smaller, reflecting the rising burden of
housing costs on low-income households (Figure 21), and the rate is currently around the
OECD average. Poor housing affordability for low-income households has been aggravated
by the shift in new housing supply from affordable to high-end housing. This may be linked
to rising land prices, which make the building of affordable housing uneconomic
(New Zealand Productivity Commission, 2012).
Figure 20. Poverty ratesPercentage below selected thresholds after housing costs1
1. After housing costs (AHC) thresholds are calculated by deducting 25% from the corresponding before housing costs (BHC) thras an allowance for housing costs. Each household’s AHC is then assessed against the chosen threshold.
2. Constant value (CV) or “anchored” thresholds are based on the BHC median in a reference year, currently 2007.3. The moving line or “relative” approach sets the poverty line as a proportion of the median income from each survey, so th
threshold changes in step with the incomes of those in the middle of the income distribution.Source: B. Perry (2014), Household Incomes in New Zealand: Trends in Indicators of Inequality and Hardship 1982 to 2013, Ministry ofDevelopment, Wellington, July, Tables F.4 and F.7.
1 2 http://dx.doi.org/10.1787/888933
1982 1984 1986 1988 1990 1992 1994 1996 1998 2000 2002 2004 2006 2008 2010 20124
6
8
10
12
14
16
18
20
22
24Per cent P
60% 1998 CV²60% 2007 CV²50% relative³60% relative³
A. Whole population
1982 1984 1986 1988 1990 1992 1994 1996 1998 2000 2002 2004 2006 2008 2010 20125
10
15
20
25
30
35Per cent P
60% 1998 CV²60% 2007 CV²50% relative³60% relative³
B. Dependent children
OECD ECONOMIC SURVEYS: NEW ZEALAND © OECD 201544
© OECD 2015 34
kurzweg_d
Rectangle

ASSESSMENT AND RECOMMENDATIONS
t havehare of
Social
220167
0
10
20
30
40
50er cent
0
10
20
30
40
50
60er cent
Poverty and hardship rates are much higher for entirely jobless households than for
those with someone in work (Table 4; Figure 22). Accordingly, the government has
reformed the welfare system to facilitate the transition to work. The centrepiece of the
reform is the “investment approach” to setting priorities for the Ministry of Social
Development’s Work and Income (W&I) service. Under this approach, the agency is asked
to prioritise their employment-related interventions to where they are most likely to
reduce long-term benefit dependency and long-term welfare costs. While the ultimate
objective is to lift the long-term outcomes of beneficiaries, this narrower approach is used
as a proxy for these wider economic and social benefits and, as an accountability tool, is
better aligned with what W&I can control. Accordingly, priority for employment-related
Figure 21. Housing costs and price distribution of new housing investment
1. The construction data only include life-style, stand-alone and attached residential dwellings – apartments, which do noindividual entrances from the exterior and are typically in high-rise buildings, are excluded. For each year, the data show the snew houses that are valued within each quartile of the value distribution for the existing housing stock.
Source: B. Perry (2014), Household Incomes in New Zealand: Trends in Indicators of Inequality and Hardship 1982 to 2013, Ministry ofDevelopment, Wellington, July, Table C.3 for Panel A; Productivity Commission calculation using Corelogic data for Panel B.
1 2 http://dx.doi.org/10.1787/888933
1988 1990 1992 1994 1996 1998 2000 2002 2004 2006 2008 2010 20120
10
20
30
40
50Per cent
P
All quintilesQ1 (bottom)Q2
Q3Q4Q5 (top)
A. Proportion of households with housing-cost-to-income ratios greater than 30%By income quintile
1960 1965 1970 1975 1980 1985 1990 1995 2000 2005 20100
10
20
30
40
50
60Per cent P
0 - lower quartileLower quartile - medianMedian - upper quartileUpper quartile
B. New housing investmentHigh-, medium- and low-price shares¹
OECD ECONOMIC SURVEYS: NEW ZEALAND © OECD 2015 45
© OECD 2015 35
kurzweg_d
Rectangle
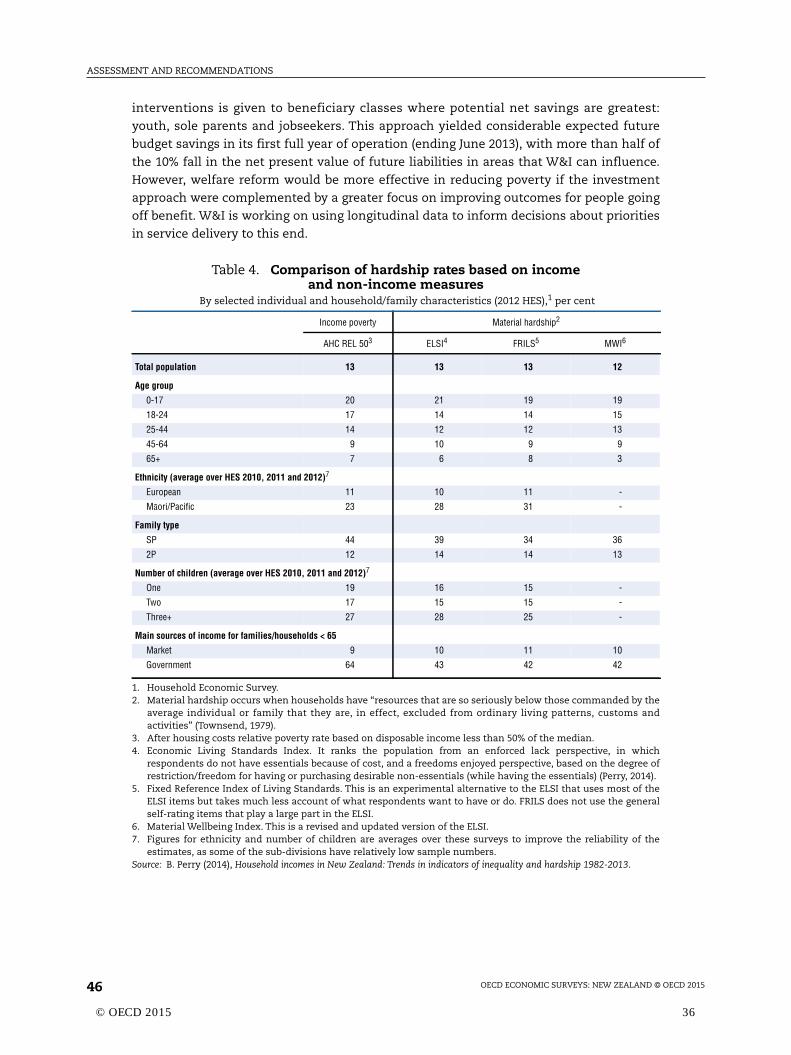
ASSESSMENT AND RECOMMENDATIONS
interventions is given to beneficiary classes where potential net savings are greatest:
youth, sole parents and jobseekers. This approach yielded considerable expected future
budget savings in its first full year of operation (ending June 2013), with more than half of
the 10% fall in the net present value of future liabilities in areas that W&I can influence.
However, welfare reform would be more effective in reducing poverty if the investment
approach were complemented by a greater focus on improving outcomes for people going
off benefit. W&I is working on using longitudinal data to inform decisions about priorities
in service delivery to this end.
Table 4. Comparison of hardship rates based on incomeand non-income measures
By selected individual and household/family characteristics (2012 HES),1 per cent
Income poverty Material hardship2
AHC REL 503 ELSI4 FRILS5 MWI6
Total population 13 13 13 12
Age group
0-17 20 21 19 19
18-24 17 14 14 15
25-44 14 12 12 13
45-64 9 10 9 9
65+ 7 6 8 3
Ethnicity (average over HES 2010, 2011 and 2012)7
European 11 10 11 -
Māori/Pacific 23 28 31 -
Family type
SP 44 39 34 36
2P 12 14 14 13
Number of children (average over HES 2010, 2011 and 2012)7
One 19 16 15 -
Two 17 15 15 -
Three+ 27 28 25 -
Main sources of income for families/households < 65
Market 9 10 11 10
Government 64 43 42 42
1. Household Economic Survey.2. Material hardship occurs when households have “resources that are so seriously below those commanded by the
average individual or family that they are, in effect, excluded from ordinary living patterns, customs andactivities” (Townsend, 1979).
3. After housing costs relative poverty rate based on disposable income less than 50% of the median.4. Economic Living Standards Index. It ranks the population from an enforced lack perspective, in which
respondents do not have essentials because of cost, and a freedoms enjoyed perspective, based on the degree ofrestriction/freedom for having or purchasing desirable non-essentials (while having the essentials) (Perry, 2014).
5. Fixed Reference Index of Living Standards. This is an experimental alternative to the ELSI that uses most of theELSI items but takes much less account of what respondents want to have or do. FRILS does not use the generalself-rating items that play a large part in the ELSI.
6. Material Wellbeing Index. This is a revised and updated version of the ELSI.7. Figures for ethnicity and number of children are averages over these surveys to improve the reliability of the
estimates, as some of the sub-divisions have relatively low sample numbers.Source: B. Perry (2014), Household incomes in New Zealand: Trends in indicators of inequality and hardship 1982-2013.
OECD ECONOMIC SURVEYS: NEW ZEALAND © OECD 201546
© OECD 2015 36
kurzweg_d
Rectangle

ASSESSMENT AND RECOMMENDATIONS
ediane headorkers
220173
0
10
20
30
40
50
60
70
80er cent
0
2
4
6
8
10
12
14
16
18
20er cent
The investment approach may have contributed to an increase in sole-parent
employment rates. The proportion of sole parents with dependent children employed
increased by 10.3 percentage points during the three years ending in 2014, considerably
more than the 2.4 percentage points increase in the previous three-year period (to the
September quarter of 2007) with a similar economy-wide employment growth rate.
However, whereas there was a large increase (12 percentage points) in the proportion of
such households in full-time employment in the earlier period, this share actually fell in
the most recent period, with the result that there was a smaller rise in hours worked. This
reflects the impact of policy settings that create strong incentives for sole parents, and
Figure 22. Jobless and in-work poverty rates,1 20112
1. Poverty rates correspond to the percentage of individuals living in households whose disposable income falls under half the mvalue of disposable income in their country. Poverty rates are calculated for all persons living in a household with a working-agand at least one worker (in-work poverty rate), and for all persons living in a household with a working-age head and no w(poverty rate among jobless households).
2. Or nearest year available.3. OECD unweighted average.Source: Calculations from the OECD Income Distribution Database, via www.oecd.org/social/income-distribution-database.htm.
1 2 http://dx.doi.org/10.1787/888933
0
10
20
30
40
50
60
70
80Per cent
P
FR
A
LUX
HU
N
DN
K
CZ
E
AU
T
GB
R
ISL
PO
L
TU
R
IRL
SV
N
DE
U
FIN
NO
R
GR
C
SV
K
NLD
BE
L
ITA
OE
CD
³
PR
T
JPN
ES
P
ME
X
ES
T
SW
E
US
A
AU
S
CA
N
NZ
L
CH
L
ISR
A. Jobless poverty
0
2
4
6
8
10
12
14
16
18
20Per cent
P
DE
U
FIN IRL
DN
K
CZ
E
AU
S
BE
L
NZ
L
ISL
GB
R
SV
N
SV
K
SW
E
NO
R
NLD
AU
T
FR
A
HU
N
LUX
OE
CD
³
ES
T
CA
N
PR
T
PO
L
ITA
US
A
ES
P
JPN
GR
C
CH
L
ISR
TU
R
ME
X
B. In-work poverty
OECD ECONOMIC SURVEYS: NEW ZEALAND © OECD 2015 47
© OECD 2015 37
kurzweg_d
Rectangle

ASSESSMENT AND RECOMMENDATIONS
220183
0
20
40
60
80
100
120
arnings ew job
others on low incomes, to work 20 hours a week but little or none to work more. The
introduction of Working for Families (WFF, a means tested benefit for households with
children) has mitigated the impact of benefit abatement for working 20 hours a week since
it became fully operational in 2007.
However, rates at which benefits are withdrawn as income rises are very high for
people working more than 20 hours. This is reinforced by the steep abatement of childcare
subsidies beyond 20 hours per week for three and four year-old children. As a result, a sole
parent taking up full-time, low-wage employment faces an average effective tax rate of
over 80%, a third of which reflects childcare costs (Figure 23). This impact is despite the
availability of income-tested subsidies, in addition to the 20 hours subsidies, for
low-income families (which cover almost 70% of the cost of childcare for those on the
lowest incomes). These costs are higher than the OECD average, accounting for
New Zealand’s higher overall effective tax rate. W&I has also identified non-flexible
childcare hours as a barrier to work and is experimenting with flexible hours for sole
parents. There is a need to review policy settings to strengthen the incentives for those on
low incomes to work more than 20 hours a week, which would include a review of benefit
and WFF abatement rates, as well as reducing childcare costs.
Poverty rates could also be cut by increasing social benefits, which have been falling
relative to wages as they are indexed to the Consumers Price Index (Figure 24). In addition
to these main benefits, most beneficiaries receive supplementary benefits (a variety of
means-tested benefits available to both beneficiary and working households) targeted at
vulnerable families. However, increases in supplementary benefit payments have been
smaller for beneficiary households than for low-income working households owing to the
introduction of Working for Families, which provides greater benefits to low-income
working households than beneficiaries. In view of the high child-poverty rate in beneficiary
households, priority should be given to raising income by increasing benefits and/or
Figure 23. Effective tax rate for a sole parent moving to low-paid full-time workMoving into full-time employment with earnings of 67% of average earnings, including childcare costs,1 2012
1. Effect of childcare costs for a sole parent with two children, aged two and three.Source: OECD, Tax-Benefit Models Database, www.oecd.org/els/social/workincentives.
1 2 http://dx.doi.org/10.1787/888933
0
20
40
60
80
100
120
% of gross earnings in new job
% of gross ein n
GR
C
PR
T
HU
N
SV
K
ES
T
ES
P
KO
R
SW
E
FR
A
NO
R
PO
L
AU
S
OE
CD
NLD FIN
LUX
GB
R
CZ
E
NZ
L
BE
L
ISR
ISL
DE
U
JPN
SV
N
DN
K
CH
E
AU
T
US
A
CA
N
IRL
Effective tax burden without childcare costsContributions of childcare costs to total effective tax burden
OECD ECONOMIC SURVEYS: NEW ZEALAND © OECD 201548
© OECD 2015 38
kurzweg_d
Rectangle

ASSESSMENT AND RECOMMENDATIONS
ir totalinly to
ure 4.220193
.Social
220206
0.20
0.25
0.30
0.35
0.40
0.45Ratio
0.0
0.5
1.0
1.5
2.0
2.5
3.0
3.5
4.0sk ratio
supplementary benefits for welfare beneficiaries with dependent children. This would help
to reduce the high relative poverty risk for sole-parent households (Figure 25), more than
half of whom rely on benefits as their main source of income. Increasing main (basic)
benefits and indexing them to median wages would reduce poverty across all beneficiary
classes, including single-person households (below age 65), who have the second-highest
relative risk of poverty.
Figure 24. Ratio of main benefit payments to net average wage1
1. As most beneficiaries also receive supplementary benefits, such as the Accommodation Supplement and family tax credits, theincome is likely to be higher than shown in this figure. However, increases in family tax credits have been targeted malow-income working households rather than beneficiaries.
Source: New Zealand Treasury (2013), Working-Age (Non-NZS) Welfare – Draft Paper for the Long-Term Fiscal External Panel, January, Fig1 2 http://dx.doi.org/10.1787/888933
Figure 25. Poverty risk ratios by household type1
Based on a constant value poverty line of 60% of median income after housing costs
1. The poverty risk ratio is the ratio of the poverty rate for a particular group divided by the poverty rate of the whole populationSource: B. Perry (2014), Household Incomes in New Zealand: Trends in Indicators of Inequality and Hardship 1982 to 2013, Ministry ofDevelopment, Wellington, July, Table G.8.
1 2 http://dx.doi.org/10.1787/888933
1970 1975 1980 1985 1990 1995 2000 2005 20100.20
0.25
0.30
0.35
0.40
0.45Ratio
Sickness benefitUnemployment benefit
Invalidity benefitDomestic purposes benefit
0.0
0.5
1.0
1.5
2.0
2.5
3.0
3.5
4.0Poverty risk ratio
Poverty ri
Single 65+ Couple 65+ Single <65 Couple <65 Sole parent with children
Two parent with children
Other fam. HHs with children
Other fam. HHs, adults only <65
1984 1994 2004 2013
OECD ECONOMIC SURVEYS: NEW ZEALAND © OECD 2015 49
© OECD 2015 39
kurzweg_d
Rectangle

ASSESSMENT AND RECOMMENDATIONS
m. The
220216
0
10
20
30
40
50
60
70
The downside of higher benefits is weaker work incentives. To counter this effect, the
government should step up job-search support and activation programmes for
beneficiaries for whom work is a feasible option, spending on which is low by international
standards and falling (Figure 26). Increasing resources for job-search and activation
programmes is one of few structural reforms identified in a recent OECD study
(Causa et al., 2014) that would both increase economic growth and reduce income
inequality.
Lowering the burden of high housing costs on low-income households
Reforms that reduce housing costs for low-income households have considerable
potential to improve their lot. Increasing the supply of affordable housing in Auckland
would benefit low-income households by reducing its prices. In addition to the land-use
changes discussed above, the government and Auckland Council are working to increase
the supply of affordable housing through Special Housing Areas and redeveloping social
housing estates.
Social housing plays a vital role in alleviating poverty. It is more effective than
Accommodation Supplement, the other main subsidy to reduce low-income households’
housing costs, reflecting the much higher subsidy rates for social housing, where rents are
limited to 25% of household income. The downside of income-related rents, however, is that
they reduce incentives to take up employment. Jobseeker Support recipients who are social
housing tenants are less likely to take up employment (only 9% did so over a recent
six-month period) than non-social-housing tenants (22%). Further analysis of this
difference is required to determine the extent to which it is attributable to income-related
Figure 26. Public expenditure on active labour market policies per unemployed1
As a percentage of GDP per capita
1. The latest available year is 2011 for Australia, Ireland, Israel, Luxembourg, Poland and Spain; and 2009 for the United KingdoOECD average excludes Greece, Iceland and Turkey. For 2007, data refer to 2008 for Chile.
Source: OECD, Public Expenditure and Participant Stocks on Labour Market Participants and Economic Outlook Databases.1 2 http://dx.doi.org/10.1787/888933
0
10
20
30
40
50
60
70
ME
X
US
A
CH
L
SV
K
ISR
ES
T
PR
T
CA
N
SV
N
CZ
E
NZ
L
ES
P
JPN
PO
L
ITA
GB
R
AU
S
IRL
HU
N
OE
CD
KO
R
FR
A
BE
L
CH
E
LUX
DE
U
FIN
SW
E
NO
R
NLD
AU
T
DN
K
20072012
OECD ECONOMIC SURVEYS: NEW ZEALAND © OECD 201550
© OECD 2015 40
kurzweg_d
Rectangle

ASSESSMENT AND RECOMMENDATIONS
rents as opposed to other factors, such as social-housing tenants typically having greater
barriers to employment and/or less valuable skills than private-sector tenants. Insofar as
income-related rents are discouraging transitions into employment, case management of
social housing tenants should be reinforced.
The government is committed to strengthening the contribution of social housing to
improving well-being and reducing poverty. Housing New Zealand (HNZ), the Crown
owned entity that operates most social housing, is adjusting its housing stock to bring it
more into line with demographic and geographical demand. Existing tenancies are being
reviewed to move people paying market rents out of social housing to make room for those
with greater needs.
The government has also launched a Social Housing Reform Programme, which will
transfer part of the Crown’s social housing stock to community providers in order to
provide better service to tenants and improve the effectiveness of related public
expenditure. The government believes that such providers will be more client-focused and
innovative than HNZ. It will be important to closely monitor the implementation of this
reform and the tenancy reviews and to assess their results in terms of: housing and social
outcomes for tenants who move out of social housing; efficiency in improving outcomes
for social housing tenants; and adequacy of protections to prevent private operators from
taking excessive financial risks, as occurred in the Netherlands, which could result in
additional fiscal costs.
The government has also committed to increasing the number of social housing units
funded by the income-related rent subsidy from around 62 000 currently – 5% of the total
dwelling stock, which is low compared with double-digit shares in most European
countries – to 65 000 in 2017/18. This expansion is to be achieved through new supply, more
efficient providers, better asset utilisation and configuration, and tenancy reviews. The
government should also increase public support so that a more significant increase in the
social housing stock can be achieved. Subsidising housing costs for low-income
households through expanding the supply and eligibility for social housing rather than
through the Accommodation Supplement (AS) has the advantage that none of the subsidy
is passed through into higher rents and thus capitalised into higher land values. As the
increased supply of social housing will not accommodate all low-income households, it
would make sense to increase AS and reprioritise it to benefit the poorest households
living in high-cost areas, provided that most of the benefits accrue to tenants rather than
landlords. An empirical evaluation of AS should be undertaken to estimate its incidence on
rents.
Poor housing quality for low-income households contributes to high rates of infectious
diseases, such as rheumatic fever, and poor educational achievement. To reduce the
incidence of rheumatic fever, people who are deemed most at risk have been given priority
for social housing since 2014. The government has also been subsidising housing
insulation, a programme that should be prolonged and for which the rate of take-up by
landlords should be raised. The government should also oblige new tenancies to meet
progressively higher quality standards, such as those required to get a pass on the Healthy
Housing Index (see Chapter 2).
OECD ECONOMIC SURVEYS: NEW ZEALAND © OECD 2015 51
© OECD 2015 41
kurzweg_d
Rectangle

ASSESSMENT AND RECOMMENDATIONS
Improving health outcomes for disadvantaged groups
Health outcomes are generally worse for Māori, Pasifika and low socio-economic
groups (Ministry of Health, 2014). In some dimensions, such as access to immunisation,
inequality is diminishing; in others, such as mortality, improvements for Māori, Pasifika
and low-income individuals have not been as rapid as for others (Figure 27). The causes of
these differential outcomes are complex but include differences in access, use and
experience of health services as well as in exposure to risk factors. Resolving these issues
is a focus for the health system and government.
The higher prevalence of obesity and smoking are key risk factors for excess mortality
among Māori, Pasifika and those with low-incomes (Ministry of Health, 2013). To reduce
obesity, a comprehensive programme of multiple interventions is likely to be required
(McKinsey Global Institute, 2014). Education and encouraging personal responsibility need
to be complemented by changing the environment to encourage physical activity and
better nutrition, thereby facilitating healthy behaviour. In this regard, there is scope for
primary care to make a greater contribution through improved obesity management.
Currently, less than half of obese adults had their weight checked at their usual medical
centre in the past year, and only a quarter received advice about their weight, diet or
physical activity (Ministry of Health, 2014). Healthy Families NZ, which was recently
implemented in ten communities, aims to reduce lifestyle risk factors. To discourage
cigarette smoking, tobacco taxes have been progressively increased by 70% since 2010,
reaching the OECD average in 2011 and the highest rate in the OECD in 2015, with a further
10% rise scheduled for 2016 (TobaccoAtlas.org); each 10% increase in taxes is estimated to
reduce the number of smokers by 5-7% (Isaac, 2012; Chaloupka et al., 2012). The government
is also considering regulation to permit only plain, undifferentiated packets, as in
Australia.
Amenable mortality (i.e. deaths from diseases that are potentially preventable given
timely and effective health care) rates have declined across all groups but are substantially
higher for Māori, Pasifika and low-income individuals (Ministry of Health, 2010). These
differences appear to be attributable to lower health literacy and less access to primary
care related to social disparities, including cost. The cost barrier could be reduced by
further targeting the Very-Low-Cost-Access scheme, which provides extra funding for
medical practices that keep fees below certain thresholds in high-need communities.
Considerable progress has also recently been made in improving the prioritisation system
for elective surgery, in line with OECD (2013b) recommendations, resulting in more services
being provided to disadvantaged groups (Controller and Auditor-General, 2013).
Improving education outcomes for individuals in disadvantaged groups
Average PISA scores in New Zealand are above the OECD mean but have been
declining (Figure 28). However, scores for Māori and Pasifika students are well below
average and have also been falling. Moreover, the impact of socio-economic background on
PISA scores is greater and has increased by more in New Zealand than the OECD average
(Figure 29). While attainment has been rising for all groups, rates remain considerably
lower for people from lower socio-economic backgrounds and/or of Māori or Pasifika
ethnicity (Figure 30). Increasing educational attainment is very important for equality of
opportunity in the long term, because parental attainment, especially of mothers, has a
strong influence on how well their children do in education.
OECD ECONOMIC SURVEYS: NEW ZEALAND © OECD 201552
© OECD 2015 42
kurzweg_d
Rectangle

ASSESSMENT AND RECOMMENDATIONS
o.ac.nz/
220228
0
5
0
5
0
5
0
5
0
5
0
0
5
0
5
0
5
0
0
5
0
5
0
5
Figure 27. Mortality ratios for disadvantaged vs advantaged groupsBy cause of death, 1-74 years old
Source: OECD calculations based on data extracted from the New Zealand Census Mortality Study WebTable Results, www.otagNZCMSWebTable/.
1 2 http://dx.doi.org/10.1787/888933
0.0
0.5
1.0
1.5
2.0
2.5
3.0
3.5
4.0
4.5
5.0
1981-84 1986-89 1991-94 1996-99 2001-04
All causesCardiovascularCancerLung cancer
Male - Maori/European
0.
0.
1.
1.
2.
2.
3.
3.
4.
4.
5.
1981-84 1986-89 1991-94 1996-99 2001-04
All causesCardiovascularCancerLung cancer
Female - Maori/European
0.0
0.5
1.0
1.5
2.0
2.5
3.0
1981-84 1986-89 1991-94 1996-99 2001-04
All causesCardiovascularCancerLung cancer
Male - Pasifika/European
0.
0.
1.
1.
2.
2.
3.
1981-84 1986-89 1991-94 1996-99 2001-04
All causesCardiovascularCancer
Female - Pasifika/European
0.0
0.5
1.0
1.5
2.0
2.5
1981-84 1986-89 1991-94 1996-99 2001-04
All causesCardiovascularCancerLung cancer
Male - Low/High income
0.
0.
1.
1.
2.
2.
1981-84 1986-89 1991-94 1996-99 2001-04
All causesCardiovascularCancerLung cancer
Female - Low/High income
OECD ECONOMIC SURVEYS: NEW ZEALAND © OECD 2015 53
© OECD 2015 43
kurzweg_d
Rectangle
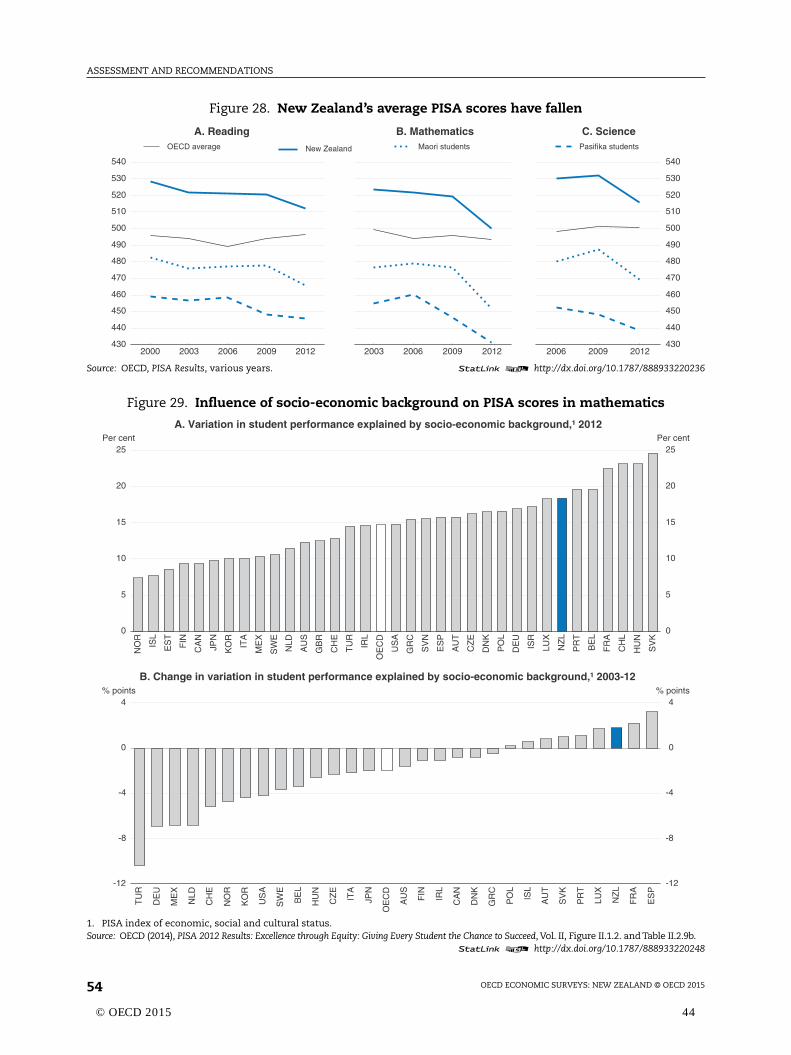
ASSESSMENT AND RECOMMENDATIONS
220236
.2.9b.220248
0
0
0
0
0
0
0
0
0
0
0
0
cent
2
ints
Figure 28. New Zealand’s average PISA scores have fallen
Source: OECD, PISA Results, various years. 1 2 http://dx.doi.org/10.1787/888933
Figure 29. Influence of socio-economic background on PISA scores in mathematics
1. PISA index of economic, social and cultural status.Source: OECD (2014), PISA 2012 Results: Excellence through Equity: Giving Every Student the Chance to Succeed, Vol. II, Figure II.1.2. and Table II
1 2 http://dx.doi.org/10.1787/888933
430
440
450
460
470
480
490
500
510
520
530
540
New Zealand
2000 2003 2006 2009 2012
OECD average
A. Reading
2003 2006 2009 2012
Maori students
B. Mathematics
43
44
45
46
47
48
49
50
51
52
53
54
2006 2009 2012
Pasifika students
C. Science
0
5
10
15
20
25Per cent
0
5
10
15
20
25Per
NO
R
ISL
ES
T
FIN
CA
N
JPN
KO
R
ITA
ME
X
SW
E
NLD
AU
S
GB
R
CH
E
TU
R
IRL
OE
CD
US
A
GR
C
SV
N
ES
P
AU
T
CZ
E
DN
K
PO
L
DE
U
ISR
LUX
NZ
L
PR
T
BE
L
FR
A
CH
L
HU
N
SV
K
A. Variation in student performance explained by socio-economic background,¹ 2012
-12
-8
-4
0
4% points
-1
-8
-4
0
4% po
TU
R
DE
U
ME
X
NLD
CH
E
NO
R
KO
R
US
A
SW
E
BE
L
HU
N
CZ
E
ITA
JPN
OE
CD
AU
S
FIN IRL
CA
N
DN
K
GR
C
PO
L
ISL
AU
T
SV
K
PR
T
LUX
NZ
L
FR
A
ES
P
B. Change in variation in student performance explained by socio-economic background,¹ 2003-12
OECD ECONOMIC SURVEYS: NEW ZEALAND © OECD 201554
© OECD 2015 44
kurzweg_d
Rectangle

ASSESSMENT AND RECOMMENDATIONS
ave the
vers2.220255
0
10
20
30
40
50
60
70
80
90
100er cent
0
10
20
30
40
50
60
70er cent
Improving outcomes for those in disadvantaged groups is complex and requires a
multifaceted approach. The main elements of the New Zealand government’s current
approach are:
● Increasing participation of disadvantaged groups in early childhood education (ECE)
(Figure 31) and improving ECE quality. While significant progress has been made, the
official 98% participation target by 2017 remains challenging. The government will also
need to monitor outcomes for disadvantaged individuals and, if necessary, move to
ensure that increased participation is delivering improved education outcomes for them.
Programmes that combine good-quality ECE with parenting support and education, such
as Engaging Priority Families, should be expanded, as they are highly beneficial
(Karoly et al., 2005).
Figure 30. Educational attainment
1. National Certificate of Educational Achievement.2. Socio-economic school district rankings. Quintile 1 schools have the lowest socio-economic ranking while quintile 5 schools h
highest.Source: Ministry of Education (2015), Education Counts, www.educationcounts.govt.nz/statistics/schooling/senior-student-attainment/school-lea
1 2 http://dx.doi.org/10.1787/888933
2011 2012 20130
20
40
60
80
100
120Per cent
All groupsMaoriPasifikaEuropeanOther
A. Share of 18-year-olds with NCEA¹ Level 2 or above, by ethnic group
P
Quintile 1 Quintile 2 Quintile 3 Quintile 4 Quintile 5
B. Share of 18-year-olds with NCEA¹ Level 2 or above, by socio-economic category,² 2013
1992 1994 1996 1998 2000 2002 2004 2006 2008 2010 20120
10
20
30
40
50
60
70Per cent
P
All groupsMaoriPasifikaEuropeanOther
C. Share of the population aged 25-34 with NCEA¹ Level 4 or above
OECD ECONOMIC SURVEYS: NEW ZEALAND © OECD 2015 55
© OECD 2015 45
kurzweg_d
Rectangle

ASSESSMENT AND RECOMMENDATIONS
ecile 1chools
220268
0
2
4
6
8
10
12
14er cent
● Encouraging students to stay in school longer by improving pathways to further learning
and work through the Youth Guarantee. These initiatives provide new routes to National
Certificate of Educational Achievement (NCEA) Level 2 qualifications. This has increased
retention in education to age 17 and attainment of such qualifications by age 18
(Ministry of Education, 2014), but these initiatives need to be evaluated for their long
term effectiveness.
● Raising teaching quality, which has the greatest benefit for student learning of all factors
(Alton-Lee, 2003; Hattie, 2009). A range of initiatives are underway to improve the quality
of teaching, consistent with OECD work suggesting a high-quality teaching workforce is
a result of deliberate policy choices carefully implemented over time. One area that
could be further explored is providing increased financial support to schools with high
concentrations of children at risk of under-achievement to recruit and retain effective
teachers. Communities of schools are also being created to increase collaboration and
improve their teaching and leadership expertise, including those with high concentrations
of students from low socio-economic backgrounds. As part of this programme, a new
“principal recruitment allowance” has been created to attract high quality principals to
schools with the greatest achievement challenges. Improved allowances are available to
schools that establish these roles to support leadership that improves school
performance and achievement. Greater collaboration through communities of schools
should improve teaching. These reforms are consistent with OECD recommendations
(Schleicher, 2011) and will be more effective if current efforts to ensure that teachers and
schools have the skills to collect, analyse and interpret data in order to support improved
student outcomes are strengthened over time (Nusche et al., 2012).
Figure 31. Early childhood education non-participation ratesfor children starting school
By school decile1 and ethnic group, December 2014
1. All schools are given a decile rating depending on the socio-economic status of the community their students come from. Dschools are the 10% of schools with the highest proportion of students from low socio-economic communities while decile 10 shave the lowest.
Source: Ministry of Education (2015), Education Counts website – Early Childhood Education Participation Statistics.1 2 http://dx.doi.org/10.1787/888933
1 2 3 4 5 6 7 8 9 100
2
4
6
8
10
12
14Per cent
P
European/PakehaMaoriPasifikaAsianOther ethnic groups
OECD ECONOMIC SURVEYS: NEW ZEALAND © OECD 201556
© OECD 2015 46
kurzweg_d
Rectangle

ASSESSMENT AND RECOMMENDATIONS
Māori medium schools, which provide teaching and learning in Te Reo Māori (the
Māori language) within Māori cultural settings, are also helping to increase Māori student
achievement rates. This success seems to be based on a number of factors, including
strong family and Māori community and learner engagement, high community and
teacher expectations of learners, as well as affirmation of the learner’s culture and identity.
Adjusted for socio-economic background, 74-84% of school leavers achieve NCEA Level 2
qualifications or higher in such schools compared with only 56% in other schools.
Unfortunately, for a variety of reasons, only a small minority of Māori students attend these
schools, especially at upper secondary levels. These reasons include accessibility (not all
regions have Māori medium schools) and shortages of Māori language teaching resources
and qualified teachers who are fluent in Māori (with an associated relatively narrow range
of subject choices). While teacher shortages may be expected to ease over time as some of
the graduates from these schools themselves become teachers, further steps may be
needed to facilitate a faster increase of quality and supply. New Zealand’s Māori medium
education programme is supporting improvement in quality of provision and the breadth
of education pathways available to students in Māori medium education.
Recommendations to make growth more inclusive
Key recommendations
● Complement the recent welfare reform by following up people going off benefit, asplanned, to ensure satisfactory outcomes. Strengthen the focus of social spending onlifting the long-term outcomes of the disadvantaged, including by improvingcoordination across the public sector.
● Raise the supply of social housing for low-income households. Increase targetedhousing subsidies for low-income households that are not in social housing.
● Adopt a comprehensive approach to reducing obesity, covering personal actions, factorsthat influence physical activity and nutritional practices, and improved obesitymanagement through primary care.
● Meet the 98% participation target for early childhood education. Ensure that the educationprovided is of high quality, includes programmes to enhance the involvement of parentsand focuses more on the outcomes of children with disadvantaged backgrounds.
Other recommendations
● Increase welfare benefits for beneficiary households with children, and step-upjob-search and activation investments, especially for jobseeker beneficiaries who aresocial housing tenants.
● Review policy settings to strengthen the incentives for those on low incomes to work morethan 20 hours a week, including benefit abatement rates and childcare costs. Reducefurther the costs (including transport and childcare) of access to primary health care forthe poor.
● Provide more financial support to assist with the recruitment and retention of effectiveteachers and school leaders for schools with high concentrations of children at risk ofunder-achievement.
● Continue to strengthen existing measures to help school boards, principals and teachersuse student achievement data to ensure that all students are performing well.
OECD ECONOMIC SURVEYS: NEW ZEALAND © OECD 2015 57
© OECD 2015 47
kurzweg_d
Rectangle

ASSESSMENT AND RECOMMENDATIONS
Bibliography
Alton-Lee, A. (2003), Quality teaching for diverse students in schooling: Best evidence Synthesis, Ministry ofEducation, Wellington June.
Auckland Council (2012), Housing Action Plan – Stage 1, December.
Boston, J. and R. Chapman (2007), “The social implications of decarbonising the New Zealandeconomy”, Social Journal Policy of New Zealand, 31, 104-136.
Caldera, A. and A. Johansson (2013), “The Price Responsiveness of Housing Supply in OECD Countries”,Journal of Housing Economics, Vol. 22. No. 3, September.
Causa, O., A. de Serres and N. Ruiz (2014), “Can pro-growth policies lift all boats? An analysis based onhousehold disposable income”, OECD Economics Department Working Papers, No. 1180, OECDPublishing, Paris.
Chaloupka, F.J., A. Yurekli and G.T. Fong (2012), “Tobacco taxes as a tobacco control strategy”, TobaccoControl, 21, 172-180.
Cheung, C. (2011), “Policies to Rebalance Housing Markets in New Zealand”, OECD EconomicsDepartment Working Papers, No. 878, OECD Publishing, Paris.
Controller and Auditor-General (2013), Delivering scheduled services to patients – Progress in responding tothe Auditor-General’s recommendations, Delivering scheduled services to patients – Office of theAuditor-General New Zealand.
Demographia (2015), 11th Annual International Housing Affordability Survey: 2015.
Docquier, F., Ç. Ozden and G. Peri (2014), “The Labour Market Effects of Immigration and Emigration inOECD Countries”, The Economic Journal, Vol. 124, September.
Fry, J. (2014), “Migration and Macroeconomic Performance in New Zealand: Theory and Evidence?”,New Zealand Treasury Working Paper 14/10, April.
Glaeser, E., J. Gyourko and A. Saiz (2008), “Housing Supply and Housing Bubbles”, NBER Working Paper,No. 14193, July.
Grimes, A. and A. Aitkens (2010), “Housing Supply, Land Costs and Price Adjustment”, Real EstateEconomics, Vol. 38, No. 2, Summer.
Grimes, A. and I. Mitchell (2015), “Impacts of Planning Rules, Regulations, Uncertainty and Delay onResidential Property Development”, Motu Working Paper, No. 15-02, Wellington, January.
Gyourko, J. and R. Molloy (2014), “Regulation and Housing Supply”, NBER Working Paper, No. 20536,October.
Hattie, J. (2009), Visible learning: A synthesis of over 800 meta-analyses relating to achievement, Routledge,United Kingdom.
IMF (2014), “New Zealand: 2014 Article IV Consultation”, IMF Country Report, No. 14/158, June.
International Transport Forum (2010), Reducing Transport Greenhouse Gas Emissions, Trends and data 2010,OECD/ITF 2010.
Issac, R. (2012), “Regulatory Impact Statement – Increase in tobacco excise and equivalent duties”,Wellington: The Treasury.
Karoly, L., M. Kilburn and J. Cannon (2005), Early Childhood Intervention: Proven Results, Future Promise,RAND Labor and Population, Division of RAND Corporation, USA.
Kerr, S. and W. Zhang (2009), “Allocation of New Zealand units within agriculture in the New Zealandemissions trading system”, Motu Working Paper, 09-16.
Koźluk, T. (2014), “The Indicators of the Economic Burdens of Environmental Policy Design: Resultsfrom the OECD Questionnaire”, OECD Economics Department Working Papers, No. 1178, OECDPublishing, Paris.
Land and Water Forum (LAWF) (2010), Report of the Land and Water Forum: A Fresh Start for Fresh Water,Wellington.
Land and Water Forum (LAWF) (2012a), Second report of the Land and Water Forum: Setting Limits for WaterQuality and Quantity and Fresh Water Policy – and Plan-Making through Collaboration, Wellington.
Land and Water Forum (LAWF) (2012b), Third Report of the Land and Water Forum: Managing Water Qualityand Allocating Water, Wellington.
OECD ECONOMIC SURVEYS: NEW ZEALAND © OECD 201558
© OECD 2015 48
kurzweg_d
Rectangle

ASSESSMENT AND RECOMMENDATIONS
Maré, D. and S. Stillman (2009), “The Impact of Immigration on the Labour Market Outcomes ofNew Zealanders”, Department of Labour, Commissioned by the Economic Impacts of Immigrationresearch programme of the Department of Labour, Wellington.
Massey University (2015), Home Affordability Report, March.
McKinsey Global Institute (2014), Overcoming obesity: An initial economic analysis, November.
Ministry of Agriculture and Forestry (2006), Sustainable land management and climate change: Options for aplan of action, Wellington: Ministry of Agriculture and Forestry.
Ministry of Business, Innovation and Employment (MBIE) (2014), Quarterly Canterbury Job-MatchingReport, Wellington, September.
Ministry of Education (2014), Education Counts, Ministry of Education, Wellington.
Ministry of Health (2010), Saving Lives, Amenable Mortality in New Zealand, 1996-2006, Ministry of Health,Wellington. www.health.govt.nz/system/files/documents/publications/saving-lives-amenable-mortality-in-nz-v2_0.pdf.
Ministry of Health (2013), New Zealand Health Survey: Annual update of key findings 2012/13, Ministry ofHealth, Wellington, December.
Ministry of Health (2014), Health and Independence Report 2014, Health and Independence Report 2014 |Ministry of Health NZ.
New Zealand Productivity Commission (2012), Housing Affordability Inquiry, March.
New Zealand Productivity Commission (2014), Using Land for Housing Issues Paper, November.
New Zealand Treasury (2014a), Fiscal Strategy Report 2014, Wellington.
New Zealand Treasury (2014b), Holding On and Letting Go, Wellington.
Nusche, D., D. Leveault, J. MacBeath and P. Santiago (2012), OECD Reviews of Policy Evaluation andAssessment in Education: New Zealand 2011, OECD Publishing, Paris.
OECD (2011), OECD Economic Surveys New Zealand, OECD Publishing, Paris, http://dx.doi.org/10.1787/eco_surveys-nzl-2011-en.
OECD (2013a), OECD Compendium of Agri-environmental Indicators, OECD Publishing, Paris.
OECD (2013b), Waiting Time Policies in the Health Sector, OECD Publishing, Paris, http://dx.doi.org/10.1787/9789264179080-en.
OECD (2014), Recruiting Immigrant Workers New Zealand, OECD Publishing, Paris, http://dx.doi.org/10.1787/9789264215658-en.
Parliamentary Commissioner for the Environment (2013), Water Quality in New Zealand: Land Use andNutrient Pollution, November.
Price, G. (2014), “How Has the LVR Restriction Affected the Housing Market: A CounterfactualAnalysis”, Reserve Bank of New Zealand Analytical Note Series, 2014/03, May.
Reserve Bank of New Zealand (RBNZ) (2014), Monetary Policy Statement, December.
Reserve Bank of New Zealand (RBNZ) (2015). Financial Stability Report, May.
Schleicher, A. (2011), Building a high-quality teaching profession: Lessons from around the world,OECD Publishing, Paris, www.oecd-ilibrary.org/education/building-a-high-quality-teaching-profession_9789264113046-en.
Stark, J. and J. Maxted (2007). A User Guide for the Macroinvertebrate Community Index, prepared for theMinistry for the Environment, Cawthron Report No.1166, Nelson, April.
Statistics New Zealand (2015), Business Operations Survey: 2014, Wellington.
TobaccoAtlas.org (2011), The Tobacco Atlas, Fourth Edition, www.tobaccoatlas.org/solutions/tobacco_taxes/excise_tax/
TomTom (2015), TomTom Traffic Index, www.tomtom.com/en_nz/trafficindex/, 4 May 2015.
Wallis, I and D. Lupton (2013). “The Cost of Congestion Reappraised”, NZ Transport Agency ResearchReport 489, February.
World Economic Forum (2014), The Global Competitiveness Report: 2014-20.
OECD ECONOMIC SURVEYS: NEW ZEALAND © OECD 2015 59
© OECD 2015 49
kurzweg_d
Rectangle

© OECD 2015 50

OECD Economic Surveys: New Zealand
© OECD 2015
ANNEX
Progress in structural reform
This Annex reviews actions taken on recommendations from previous Surveys.Recommendations that are new in this Survey are listed at the end of the relevantchapter.
61
© OECD 2015 51
kurzweg_d
Rectangle
kurzweg_d
Rectangle
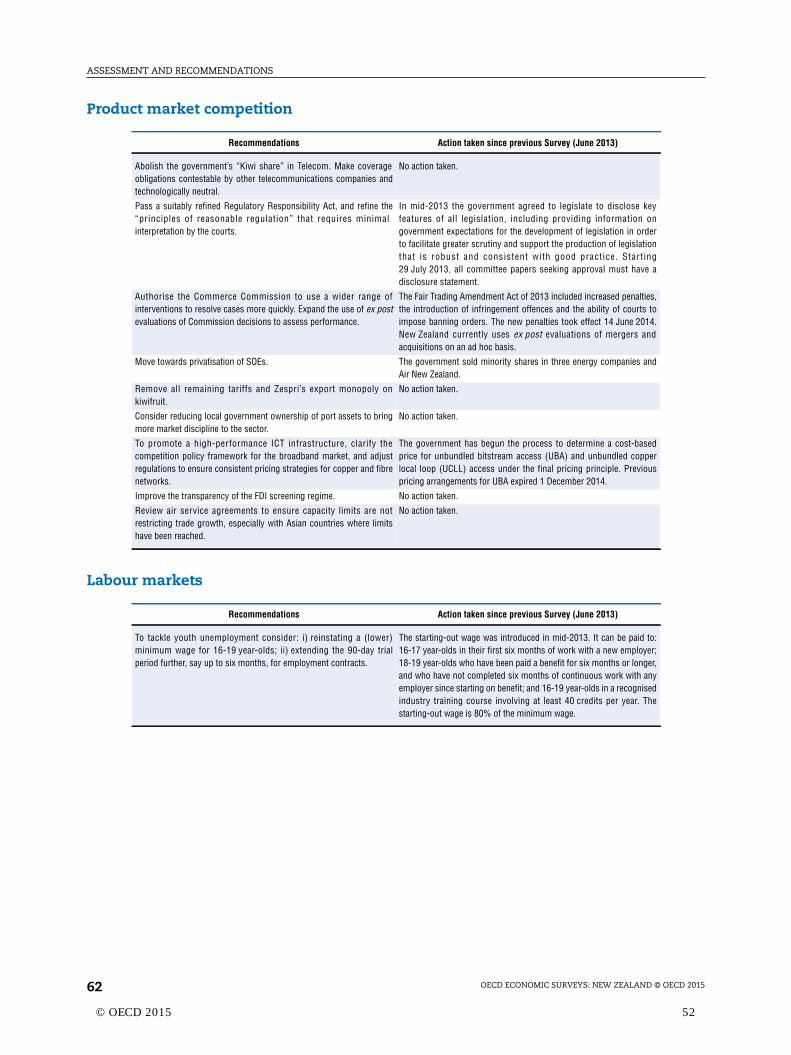
ASSESSMENT AND RECOMMENDATIONS
Product market competition
Labour markets
Recommendations Action taken since previous Survey (June 2013)
Abolish the government’s “Kiwi share” in Telecom. Make coverageobligations contestable by other telecommunications companies andtechnologically neutral.
No action taken.
Pass a suitably refined Regulatory Responsibility Act, and refine the“principles of reasonable regulation” that requires minimalinterpretation by the courts.
In mid-2013 the government agreed to legislate to disclose keyfeatures of all legislation, including providing information ongovernment expectations for the development of legislation in orderto facilitate greater scrutiny and support the production of legislationthat is robust and consistent with good practice. Starting29 July 2013, all committee papers seeking approval must have adisclosure statement.
Authorise the Commerce Commission to use a wider range ofinterventions to resolve cases more quickly. Expand the use of ex postevaluations of Commission decisions to assess performance.
The Fair Trading Amendment Act of 2013 included increased penalties,the introduction of infringement offences and the ability of courts toimpose banning orders. The new penalties took effect 14 June 2014.New Zealand currently uses ex post evaluations of mergers andacquisitions on an ad hoc basis.
Move towards privatisation of SOEs. The government sold minority shares in three energy companies andAir New Zealand.
Remove all remaining tariffs and Zespri’s export monopoly onkiwifruit.
No action taken.
Consider reducing local government ownership of port assets to bringmore market discipline to the sector.
No action taken.
To promote a high-performance ICT infrastructure, clarify thecompetition policy framework for the broadband market, and adjustregulations to ensure consistent pricing strategies for copper and fibrenetworks.
The government has begun the process to determine a cost-basedprice for unbundled bitstream access (UBA) and unbundled copperlocal loop (UCLL) access under the final pricing principle. Previouspricing arrangements for UBA expired 1 December 2014.
Improve the transparency of the FDI screening regime. No action taken.
Review air service agreements to ensure capacity limits are notrestricting trade growth, especially with Asian countries where limitshave been reached.
No action taken.
Recommendations Action taken since previous Survey (June 2013)
To tackle youth unemployment consider: i) reinstating a (lower)minimum wage for 16-19 year-olds; ii) extending the 90-day trialperiod further, say up to six months, for employment contracts.
The starting-out wage was introduced in mid-2013. It can be paid to:16-17 year-olds in their first six months of work with a new employer;18-19 year-olds who have been paid a benefit for six months or longer,and who have not completed six months of continuous work with anyemployer since starting on benefit; and 16-19 year-olds in a recognisedindustry training course involving at least 40 credits per year. Thestarting-out wage is 80% of the minimum wage.
OECD ECONOMIC SURVEYS: NEW ZEALAND © OECD 201562
© OECD 2015 52
kurzweg_d
Rectangle

ASSESSMENT AND RECOMMENDATIONS
Financial markets
Housing markets
Recommendations Action taken since previous Survey (June 2013)
Ensure there is a streamlined regulatory framework that requires firmsoffering collective investment instruments to have appropriategovernance structures with sufficiently stringent requirements fortrustees to make sure that they are capable of discharging their duties.
The several Acts defining governance requirements for managedinvestment schemes were replaced with a single governance regime,the Financial Markets Conduct Act 2013, for retail managed investmentschemes. It will require a licensed external supervisor and licensedmanagers of managed investment schemes.
Adopt a more rigorous approach to disclosure requirements for feesand expenses for collective investment instruments so as to enhancetransparency and allow for easier comparability across products.
The KiwiSaver (Periodic Disclosure) Regulations 2013 requiredschemes to provide periodic reports on fund performance, fees, assetallocation, conflicts of interest and other matters using standardisedcalculation methods and disclosure statement templates by1 July 2013. The Financial Markets Conduct Act 2013 requiresmanaged investment schemes to produce shorter and simplerdisclosures for investors that ease comparisons between products.
While recognising the current strength of the financial system, containemerging risks to financial system stability with tighter prudentialpolicy settings, including the deployment of new macro-prudentialpolicy instruments. Consider implementing bank leverage ratios,permanent deposit insurance and higher capital requirements fortoo-big-to-fail banks.
Temporary limits on the new issuance of high loan-to-value (LTV) ratiomortgages (80% or greater) were implemented in October 2013, alongwith requirements for banks to hold a higher level of capital againsthigh LTV ratio mortgages. Only 10% of new mortgage lending within a3-month period may be in this form; however, 15% is planned to bepermitted outside of the Auckland area as of 1 October 2015, reflectingmore subdued housing conditions in these regions, pendingconsultation.The Reserve Bank also plans to establish a new asset class forresidential property lending to investors (defined as any retail mortgagesecured on a residential property that is not owner-occupied), as of1 October 2015. Banks will be required to hold more capital against thisasset class and from 1 October 2015 investors using bank loans topurchase residential property will be required to have a deposit of atleast 30% in the Auckland Council area.The Reserve Bank has decided against implementing a leverage ratioand a charge on systemically important financial institution for now.However, capital requirements for all banks are under review.
Recommendations Action taken since previous Survey (June 2013)
Adopt spatial planning systems for all urban areas, and reform theResource Management Act (RMA) to better incorporate urbandevelopment needs.
The RMA was amended in September 2013. Changes includedmodifications to improve consenting times, introducing a streamlinedprocess for Auckland’s unitary plan, the introduction of a 6-month timelimit for processing consents on medium-sized projects, easier referralto the Environmental Court for major regional projects, and strongerrequirements for councils to use cost-benefit analysis in planningdecisions.
Establish a comprehensive framework to value land based on cost-benefitanalyses of alternative uses. Increase use of pricing mechanisms toinfluence the location of development (e.g. financial contributions, roaduser charges, congestion tolls), and improve public transit services.
No significant action taken. Some investments are being undertaken toimprove public transit services. The government has reformed thedevelopment contributions regime to ensure that its policy principles(recovery of the costs of growth) are being met.
Distribute the cost of infrastructure through higher user fees on thosebenefitting from its services.
No significant action taken. Development contributions have beentightened so as to exclude the ability to pay for infrastructure that is notneeded to service residential developments (Local Government 2002Amendment Act 2014).
Treat KiwiSaver withdrawals for f i rst-home purchases asinterest-bearing loans or limit them to low-income members.
No action taken. Larger KiwiSaver withdrawals are now permitted. Themember tax credits can now be withdrawn, and house price limits haveincreased in most areas (as of 1 April 2015). In addition, increasedcash grants (subsidies) are offered for newly built first homes with theamount related to the purchaser’s years of contributions to KiwiSaver.
OECD ECONOMIC SURVEYS: NEW ZEALAND © OECD 2015 63
© OECD 2015 53
kurzweg_d
Rectangle

ASSESSMENT AND RECOMMENDATIONS
Innovation and business creation
Begin regular tenancy re-assessments for all occupants of statehousing, accompanied by increased efforts to help tenants achievefinancial independence and self-sufficiency.
Tenancies are now being reviewed for social housing for tenants payingmarket rents for more than one year, and with weekly incomes greaterthan $500 (the income threshold varies according to the averagehousing costs in the region), building on the reform of 3-yearreviewable tenancies for all new social housing tenants since 2011. Thereview is intended to ensure that social housing is available for thepeople who need it the most for the duration of that need.
Evaluate whether state housing tenants requiring more permanenthousing provision such as the elderly and disabled may benefit fromplacement in specialised long-term housing facilities better adapted totheir needs.
One of the key objectives of the Social Housing Reform Programme is toensure that people who need housing support can access it and receivesocial services that meet their needs The programme provides anopportunity to grow specialist community providers who provide housingand other services for particular groups of people. The government hasalso provided funding to registered charities that provide supportedhousing options for older New Zealanders. Local authorities are also activein the provision of social housing for older people (pensioner housing).
Remove water rate subsidies to tenants paying market rents. No action taken.
Recommendations Action taken since previous Survey (June 2013)
Tie public R&D funding to private-sector funding. Ensure businessR&D incentives work in concert with different R&D supportprogrammes.
The Callaghan Innovation programmes provide a range of R&D supportmeasures from support for small and start-up companies to mediumand large sized enterprises. The programme’s R&D Growth Grants tiepublic R&D funding to private-sector funding.
Expand foreign-credentials recognition to a larger number of countries,and facilitate residency acquisition for foreign students aftergraduation. Foster a closer integration of education, immigration andlabour-market policies with innovation policies.
As of December 2013, changes to international student visarequirements allow more English-language students studying athigh-quality institutions to work part-time. The changes also providefull-time work rights during all scheduled holidays to internationalstudents and give unlimited work rights to international PhD andMasters-by-research students. Immigration New Zealand also trialledan industry partnership initiative with education providers in 2014.Providers that are part of the initiative will be able to offer streamlinedand prioritised visa processing and in return will be accountable for theimmigration outcomes of their international students. Plans are to rollout the partnership model more broadly in 2015.
To address equity financing gaps, shift the allocation of the NZ VentureInvestment Fund to provide greater support for early-expansion stagefirms. Clarify the tax treatment of venture capital investments.
No action taken.
To improve the conditions for intangible asset investments, adjust thetax treatment of patent sales to be consistent with that of other assets.Consider allowing accelerated depreciation of patent assets. Redesignthe Technology Development Grants to simplify the approval criteriaand ensure access to small, innovative start-ups, and continue tomonitor its effectiveness.
The Technology Development Grants were replaced in mid-2013 byCallaghan Innovation grants, comprising R&D Growth Grants, R&DProject Grants and R&D Students Grants and increased funding byNZD 98 million, amounting to NZD 566 million available over fouryears. The new grants include simplified approval criteria, with the newGrowth Grants aimed at medium- and large-sized firms, and include anexpanded funding cap. R&D Project Grants are aimed at smallercompanies and those that are new to R&D, while incubator supportprogrammes assist start-up businesses. The Accelerator Programmealso provides support to early stage ICT and digital technologystart-ups.
Recommendations Action taken since previous Survey (June 2013)
OECD ECONOMIC SURVEYS: NEW ZEALAND © OECD 201564
© OECD 2015 54
kurzweg_d
Rectangle
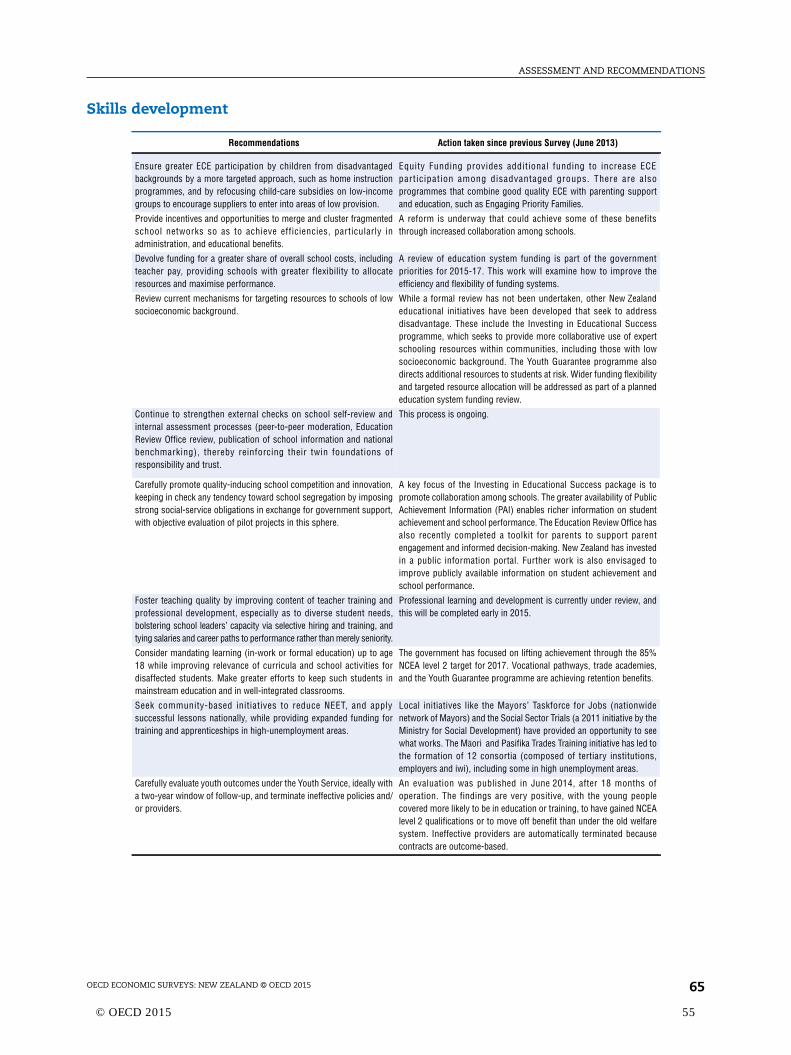
ASSESSMENT AND RECOMMENDATIONS
Skills development
Recommendations Action taken since previous Survey (June 2013)
Ensure greater ECE participation by children from disadvantagedbackgrounds by a more targeted approach, such as home instructionprogrammes, and by refocusing child-care subsidies on low-incomegroups to encourage suppliers to enter into areas of low provision.
Equity Funding provides additional funding to increase ECEparticipation among disadvantaged groups. There are alsoprogrammes that combine good quality ECE with parenting supportand education, such as Engaging Priority Families.
Provide incentives and opportunities to merge and cluster fragmentedschool networks so as to achieve efficiencies, particularly inadministration, and educational benefits.
A reform is underway that could achieve some of these benefitsthrough increased collaboration among schools.
Devolve funding for a greater share of overall school costs, includingteacher pay, providing schools with greater flexibility to allocateresources and maximise performance.
A review of education system funding is part of the governmentpriorities for 2015-17. This work will examine how to improve theefficiency and flexibility of funding systems.
Review current mechanisms for targeting resources to schools of lowsocioeconomic background.
While a formal review has not been undertaken, other New Zealandeducational initiatives have been developed that seek to addressdisadvantage. These include the Investing in Educational Successprogramme, which seeks to provide more collaborative use of expertschooling resources within communities, including those with lowsocioeconomic background. The Youth Guarantee programme alsodirects additional resources to students at risk. Wider funding flexibilityand targeted resource allocation will be addressed as part of a plannededucation system funding review.
Continue to strengthen external checks on school self-review andinternal assessment processes (peer-to-peer moderation, EducationReview Office review, publication of school information and nationalbenchmarking), thereby reinforcing their twin foundations ofresponsibility and trust.
This process is ongoing.
Carefully promote quality-inducing school competition and innovation,keeping in check any tendency toward school segregation by imposingstrong social-service obligations in exchange for government support,with objective evaluation of pilot projects in this sphere.
A key focus of the Investing in Educational Success package is topromote collaboration among schools. The greater availability of PublicAchievement Information (PAI) enables richer information on studentachievement and school performance. The Education Review Office hasalso recently completed a toolkit for parents to support parentengagement and informed decision-making. New Zealand has investedin a public information portal. Further work is also envisaged toimprove publicly available information on student achievement andschool performance.
Foster teaching quality by improving content of teacher training andprofessional development, especially as to diverse student needs,bolstering school leaders’ capacity via selective hiring and training, andtying salaries and career paths to performance rather than merely seniority.
Professional learning and development is currently under review, andthis will be completed early in 2015.
Consider mandating learning (in-work or formal education) up to age18 while improving relevance of curricula and school activities fordisaffected students. Make greater efforts to keep such students inmainstream education and in well-integrated classrooms.
The government has focused on lifting achievement through the 85%NCEA level 2 target for 2017. Vocational pathways, trade academies,and the Youth Guarantee programme are achieving retention benefits.
Seek community-based initiatives to reduce NEET, and applysuccessful lessons nationally, while providing expanded funding fortraining and apprenticeships in high-unemployment areas.
Local initiatives like the Mayors’ Taskforce for Jobs (nationwidenetwork of Mayors) and the Social Sector Trials (a 2011 initiative by theMinistry for Social Development) have provided an opportunity to seewhat works. The Māori and Pasifika Trades Training initiative has led tothe formation of 12 consortia (composed of tertiary institutions,employers and iwi), including some in high unemployment areas.
Carefully evaluate youth outcomes under the Youth Service, ideally witha two-year window of follow-up, and terminate ineffective policies and/or providers.
An evaluation was published in June 2014, after 18 months ofoperation. The findings are very positive, with the young peoplecovered more likely to be in education or training, to have gained NCEAlevel 2 qualifications or to move off benefit than under the old welfaresystem. Ineffective providers are automatically terminated becausecontracts are outcome-based.
OECD ECONOMIC SURVEYS: NEW ZEALAND © OECD 2015 65
© OECD 2015 55
kurzweg_d
Rectangle

ASSESSMENT AND RECOMMENDATIONS
Health care
Strengthen the quality of apprenticeships to offer straighter paths intojobs, signal business skills needs and provide strong incentives forapprenticeship completions. Facilitate participation by disadvantagedyouth, improving quality assurance, and ensuring funding adequacyand enhanced accountability for outcomes. Provide training contentthat is not too focused on specific skills or sectors and providecontractual and other safeguards for apprentices and employers alike.Further strengthen capacities of Industry Training Organisations (ITOs)as intermediaries charged with apprenticeship programmeadministration and skills leadership, including by means of adequateflexibility in meeting performance targets. Encourage the expansion ofpilot group training schemes to help contain funding costs. Study themerits of funding the employer subsidy, in whole or in part, via modestsector levies.
As of 1 January 2014, the Modern Apprenticeship scheme and otherapprenticeship-type training were replaced with the New ZealandApprenticeship scheme. Under this new scheme all people over the age of16 are eligible, whereas previously applicants had to be 16-21. Under theold scheme, apprentices had to work towards at least a NCEA level 3qualification, whereas now they must work towards a NCEA level 4qualification. In addition, the limit on the number of applicants who couldqualify for funding under the Apprenticeship Reboot scheme was removed.The reform programme has also strengthened ITOs, the number ofwhich has been reduced from 33 to 12 through mergers. In addition,employers now have the option of managing industry training fundsdirectly instead of working with ITOs. Four pilot programmes have beenagreed to date. Māori and Pacific Trade Training developments alsohelp support improved participation in vocational education.
Continue to make education more job relevant by: i) provision of betterinformation to students about labour market outcomes to enable themto make study choices via high-quality and relevant professionalcareers education at secondary and tertiary levels; and ii) increasingtransparency and accountability in the system about programmequality and outcomes (completion rates; employment outcomes).
The New Zealand government has developed an Occupational OutlookApp, released in 2014, which aims to make information on labour marketdemand more readily available to prospective students. The governmenthas also established an Outcomes of Tertiary Education programme whichshould be helpful in publicising outcomes information. VocationalPathways work has been assisting students to choose coherent coursesthrough clear information about employment prospects.
Increase tertiary-sector responsiveness to labour market needs byformalising linkages between providers and employers, and directingfunding to projected areas of skills shortfall, including better targetingof course offerings by providers and merit- and needs-basedscholarships.
The new Tertiary Education Strategy (TES) 2014-19 focuses on increasingrelevance and linking to labour market needs. The TES is used to guidegovernment investment in tertiary education. The government has alsoestablished a number of new ICT Graduate Schools, providing betterlinkages between the ICT community, industry and employers, andimproving the alignment and relevance of tertiary provision.
Consider boosting practical training components within engineeringdegrees through support for tertiary education institutions located nearengineering clusters.
No significant action taken. In mid-2013 the Tertiary EducationCommission released a study on the initiatives that engineering tertiaryeducation providers are undertaking to grow the number of studentsand link with industry.
Collaborate with Australian tax authorities to enforce the samerepayment obligations of NZ student debt-holders working there asthose who remain at home.
An agreement on an information-sharing arrangement betweenAustralia and New Zealand government authorities for the recovery ofstudent loans has been finalised and will come into operation in 2016.
Recommendations Action taken since previous Survey (June 2013)
Give sufficient spending autonomy to District Health Boards (DHBs),including responsibility for maternity and disability spending.Decentralise wage bargaining to allow the DHBs the flexibility toinnovate.
The Ministry of Health retains responsibility for most maternity anddisability support spending. Some primary health organisations havebeen given budget responsibi l i t ies for addit ional services(e.g. community radiology). DHBs as employers determine their wagebargaining approach within state-sector guidelines.
Evaluate whether government ownership of public hospitals, oroutsourcing hospital management to an independent agency mighthelp resolve DHB confl icts of interest and st imulate costconsciousness, efficiency and competition in the hospital sector.
No action taken.
Allow capitation payments to better “follow the patient”, eliminatingrestrictions on access to such payments by individual physicians andpractices.
No action taken.
Consider a role for wider private health-insurance coverage, withappropriate regulation and/or taxation.
No action taken.
Determine doctors’ salaries within the budget envelope for hospitals setby the output-based payment system.
No action taken.
Recommendations Action taken since previous Survey (June 2013)
OECD ECONOMIC SURVEYS: NEW ZEALAND © OECD 201566
© OECD 2015 56
kurzweg_d
Rectangle

ASSESSMENT AND RECOMMENDATIONS
Fiscal policy
Taxation
Green growth
Recommendations Action taken since previous Survey (June 2013)
Raise the pension eligibility age in line with longevity. Considerincreasing further the KiwiSaver minimum contribution rates andindexing NZ Super benefits wholly or partly to the CPI.
No action taken.
Focus on engaging private partners in productivity-enhancinginvestments and practices, especially in health care and education, withcareful cost benefit analysis to ensure that this leads to greaterefficiencies.
No action taken in health care and education.
Target the Working for Families programme more tightly on theworking poor by lowering upper income thresholds and increasingabatement rates.
No action taken.
Recommendations Action taken since previous Survey (June 2013)
Eliminate the double-taxation of trans-Tasman profits distributed toshareholders by continuing to work towards agreement with Australiaon mutual recognition of imputation and franking credits for foreigninvestment.
In May 2014 the Australian and NZ governments responded to the jointAustralian-NZ Productivity Commissions study on the trans-Tasmanrelationship, which included the mutual recognition of imputationcredits. The two governments agreed the issue will be considered inAustralia’s Tax Reform White Paper.
Realign corporate, capital and top marginal income tax rates, or reducecapital income tax rates.
No action taken.
Limit the tax deductibility of losses from rental property investments byonly allowing them to be offset against future rental income.
No action taken.
Implement a capital gains tax and boost environmental and property orland taxes to facilitate a more efficient and equitable tax structure.
No action taken.
Consider limiting the KiwiSaver tax credits to only low-incomemembers. Extend automatic enrolment to all existing employees.Change the investment strategy for default funds to a life-cycleapproach that is adapted to the member’s age.
No action taken.
Recommendations Action taken since previous Survey (June 2013)
Improve horizontal and vertical co-ordination of sustainabledevelopment policy. Central government should set nationalenvironmental standards and provide national policy statements andtechnical training for local authorities.
The 2011 National Policy Statement for Freshwater Management(NPS-FM) was amended in 2014 to provide greater direction andsupport to help regional councils, including the National ObjectivesFramework to set freshwater objectives with compulsory nationalbottom lines for human and ecosystem health.
Improve the measurement of water abstraction and quality via evolvingnational guidelines. Implement water charging for domestic, industrialand agricultural uses.
The recent amendments to the NPS-FM require councils to setenvironmental flows and/or levels for all freshwater management unitsin their regions to give effect to established water objectives. Thisincludes implementing a water quality and quantity accounting systemand identifying methods to encourage its efficient use and reduce itsover-allocation.
Continue to encourage the development of market-based mechanismswhere possible to manage the supply and quality of fresh water. Allowwater consents to be tradable. Apply pollution-rights trading to addresswater and air pollution, with no free rights for newcomers.
The 2014 amendments to the NPS-FM require councils to identifymethods to encourage efficient use of water.
Strengthen price signals within the Emissions Trading Scheme (ETS)by phasing out transition provisions. In the meantime cap and auctiondomestic allocations.
No action taken.
Discontinue free emissions permit allocations to new entrants intoprotected energy-intensive, trade-exposed sectors.
No action taken.
Maintain afforestation grant schemes. The Afforestation Grants Scheme has been allocated NZD 22.5 millionover the next five years.
OECD ECONOMIC SURVEYS: NEW ZEALAND © OECD 2015 67
© OECD 2015 57
kurzweg_d
Rectangle

ASSESSMENT AND RECOMMENDATIONS
Investigate and promote innovations (e.g. smart metering, pastoralemissions mitigation technology) proven to enhance responsiveness toETS price signals.
The work programme exploring complementary measures, in additionto the ETS, to promote long-term emissions reductions is proceeding.
Remove the preferential tax treatment for petroleum explorationexpenditures and the income tax exemption on offshore oil and gasactivities for non-resident companies. For the petroleum sector,eliminate the revenue-based royalties and move to a pure profit-basedregime; if significant discoveries are made, switch to a rent-basedsystem. To ensure that proceeds are shared with future generations,clearly designate them for debt repayment or, if significant discoveriesare made, for sovereign wealth fund contributions.
No action taken. The income tax exemptions which were to expire at theend of 2014 were extended until the end of 2019. The exemption nowexcludes operators of drilling rigs of modular construction that areinstalled on an existing offshore platform and includes operators ofelectromagnetic surveying vessels.
Recommendations Action taken since previous Survey (June 2013)
OECD ECONOMIC SURVEYS: NEW ZEALAND © OECD 201568
© OECD 2015 58
kurzweg_d
Rectangle

© OECD 2015 59

ā
© OECD 2015 60