OECD Economic Surveys ITALY OECD Economic … · February 2015 OECD Economic Surveys ITALY SPECIAL...
119
OECD Economic Surveys ITALY FEBRUARY 2015
Transcript of OECD Economic Surveys ITALY OECD Economic … · February 2015 OECD Economic Surveys ITALY SPECIAL...
February 2015
OECD Economic Surveys
ITALY SPECIAL FEATURES: LABOUR MARKET REFORM; MORE AND BETTER QUALITY JOBS
Most recent editions
Volu
me 2015/6
ITALY
OE
CD
Eco
nom
ic Su
rveys
Volume 2015/6February 2015
Australia, December 2014Austria, July 2013Belgium, February 2015Brazil, October 2013Canada, June 2014Chile, October 2013China, March 2013Colombia, January 2015Czech Republic, March 2014Denmark, January 2014Estonia, January 2015Euro area, April 2014European Union, April 2014Finland, February 2014France, March 2013Germany, May 2014Greece, November 2013Hungary, January 2014Iceland, June 2013India, November 2014Indonesia, September 2012Ireland, September 2013
Israel, December 2013Italy, February 2015Japan, April 2013Korea, June 2014Latvia, February 2015Luxembourg, December 2012Mexico, January 2015Netherlands, April 2014New Zealand, June 2013Norway, March 2014Poland, March 2014Portugal, October 2014Russian Federation, January 2014Slovak Republic, November 2014Slovenia, April 2013South Africa, March 2013Spain, September 2014Sweden, December 2012Switzerland, November 2013Turkey, July 2014United Kingdom, February 2015United States, June 2014
Consult this publication on line at http://dx.doi.org/10.1787/eco_surveys-ita-2015-en.
This work is published on the OECD iLibrary, which gathers all OECD books, periodicals and statistical databases.Visit www.oecd-ilibrary.org for more information.
ISBN 978-92-64-22875-710 2015 05 1 P
ISSN 0376-64382015 SUBSCRIPTION
(18 ISSUES)
9HSTCQE*ccihfh+
OECD Economic SurveysITALY
FEBRUARY 2015

OECD Economic Surveys:Italy2015
This document and any map included herein are without prejudice to the status of or
sovereignty over any territory, to the delimitation of international frontiers and boundaries
and to the name of any territory, city or area.
ISBN 978-92-64-22875-7 (print)ISBN 978-92-64-22876-4 (PDF)
Series: OECD Economic SurveysISSN 0376-6438 (print)ISSN 1609-7513 (online)
OECD Economic Surveys: ItalyISSN 1995-3283 (print)ISSN 1999-0340 (online)
The statistical data for Israel are supplied by and under the responsibility of the relevant Israeli authorities. The useof such data by the OECD is without prejudice to the status of the Golan Heights, East Jerusalem and Israelisettlements in the West Bank under the terms of international law.
Photo credits: Cover © iStockphoto/Btrenkel.
Corrigenda to OECD publications may be found on line at: www.oecd.org/about/publishing/corrigenda.htm.
© OECD 2015
You can copy, download or print OECD content for your own use, and you can include excerpts from OECD publications, databases and
multimedia products in your own documents, presentations, blogs, websites and teaching materials, provided that suitable
acknowledgement of OECD as source and copyright owner is given. All requests for public or commercial use and translation rights should
be submitted to [email protected]. Requests for permission to photocopy portions of this material for public or commercial use shall be
addressed directly to the Copyright Clearance Center (CCC) at [email protected] or the Centre français d’exploitation du droit de copie (CFC)
Please cite this publication as:OECD (2015), OECD Economic Surveys: Italy 2015, OECD Publishing, Paris.http://dx.doi.org/10.1787/eco_surveys-ita-2015-en
TABLE OF CONTENTS
Table of contents
Basic statistics of Italy, 2013 . . . . . . . . . . . . . . . . . . . . . . . . . . . . . . . . . . . . . . . . . . . . . . . . . 7
Executive summary . . . . . . . . . . . . . . . . . . . . . . . . . . . . . . . . . . . . . . . . . . . . . . . . . . . . . . . . . 9
Main findings. . . . . . . . . . . . . . . . . . . . . . . . . . . . . . . . . . . . . . . . . . . . . . . . . . . . . . . . . . . 10
Key recommendations . . . . . . . . . . . . . . . . . . . . . . . . . . . . . . . . . . . . . . . . . . . . . . . . . . . 11
Assessment and recommendations . . . . . . . . . . . . . . . . . . . . . . . . . . . . . . . . . . . . . . . . . . . 13
A prolonged recession and uncertain prospects . . . . . . . . . . . . . . . . . . . . . . . . . . . . . 17
Institutional reforms can be the basis for better policymaking and stronger
implementation . . . . . . . . . . . . . . . . . . . . . . . . . . . . . . . . . . . . . . . . . . . . . . . . . . . . . . . . 21
Recommendations to boost efficiency through institutional reform . . . . . . . . . . . . . . . . . 26
Labour market and competition reforms to improve productivity
and well-being. . . . . . . . . . . . . . . . . . . . . . . . . . . . . . . . . . . . . . . . . . . . . . . . . . . . . . . . . . 26
Policy recommendations for the labour market and competition . . . . . . . . . . . . . . . . . . . 34
Addressing fiscal and financial challenges. . . . . . . . . . . . . . . . . . . . . . . . . . . . . . . . . . 35
Recommendations for fiscal and financial policies . . . . . . . . . . . . . . . . . . . . . . . . . . . . . . 40
References . . . . . . . . . . . . . . . . . . . . . . . . . . . . . . . . . . . . . . . . . . . . . . . . . . . . . . . . . . . . . 41
Annex. Taking stock of structural reforms . . . . . . . . . . . . . . . . . . . . . . . . . . . . . . . . . . . . . . 43
Thematic chapters
Chapter 1. Labour market reform for more and better quality jobs. . . . . . . . . . . . . . . . . 51
The labour market suffers from structural problems . . . . . . . . . . . . . . . . . . . . . . . . . 53
The government’s labour market reform package: Will it work?. . . . . . . . . . . . . . . . 59
More and better quality jobs in a dynamic and inclusive economy . . . . . . . . . . . . . 73
Policy recommendations for job creation and job quality . . . . . . . . . . . . . . . . . . . . . . . . . 87
References . . . . . . . . . . . . . . . . . . . . . . . . . . . . . . . . . . . . . . . . . . . . . . . . . . . . . . . . . . . . . 88
Chapter 2. Maintaining fiscal sustainability: Structural fiscal issues . . . . . . . . . . . . . . . 91
Taxation . . . . . . . . . . . . . . . . . . . . . . . . . . . . . . . . . . . . . . . . . . . . . . . . . . . . . . . . . . . . . . . 92
Spending control. . . . . . . . . . . . . . . . . . . . . . . . . . . . . . . . . . . . . . . . . . . . . . . . . . . . . . . . 100
Recommendations for structural fiscal policy. . . . . . . . . . . . . . . . . . . . . . . . . . . . . . . . . . 114
References . . . . . . . . . . . . . . . . . . . . . . . . . . . . . . . . . . . . . . . . . . . . . . . . . . . . . . . . . . . . . 114
Boxes1. Recent government measures to increase “Finance for Growth” . . . . . . . . . . . . 21
1.1. The new OECD modelling framework for estimating structural
unemployment. . . . . . . . . . . . . . . . . . . . . . . . . . . . . . . . . . . . . . . . . . . . . . . . . . . . . . 56
1.2. Employment protection legislation for different employment contracts
before the reform . . . . . . . . . . . . . . . . . . . . . . . . . . . . . . . . . . . . . . . . . . . . . . . . . . . . 61
OECD ECONOMIC SURVEYS: ITALY © OECD 2015 3
TABLE OF CONTENTS
1.3. Unemployment and social benefit system in transition . . . . . . . . . . . . . . . . . . . 66
1.4. Structure of authorities/institutions and ALMPs. . . . . . . . . . . . . . . . . . . . . . . . . . 69
1.5. Gender gaps in paid and unpaid work . . . . . . . . . . . . . . . . . . . . . . . . . . . . . . . . . . 77
1.6. Research and development: Tax credits and the patent box . . . . . . . . . . . . . . . . 84
1.7. Supply and demand for skills at the local level. . . . . . . . . . . . . . . . . . . . . . . . . . . 86
2.1. The enabling law for tax reform. . . . . . . . . . . . . . . . . . . . . . . . . . . . . . . . . . . . . . . . 96
Tables1. Reform impacts on the level of GDP in the medium and long runs . . . . . . . . . . 17
2. The Economic Outlook to 2016. . . . . . . . . . . . . . . . . . . . . . . . . . . . . . . . . . . . . . . . . . . 18
3. Progress on structural reforms. . . . . . . . . . . . . . . . . . . . . . . . . . . . . . . . . . . . . . . . . 24
4. Recent reforms easing regulation on labour market contracts
in selected countries . . . . . . . . . . . . . . . . . . . . . . . . . . . . . . . . . . . . . . . . . . . . . . . . . 27
5. Fiscal consolidation in successive budgets . . . . . . . . . . . . . . . . . . . . . . . . . . . . . . 36
6. Public debt, arrears and contingent liabilities, 2013 . . . . . . . . . . . . . . . . . . . . . . . 37
1.1. Stocktaking of recent and current labour market reforms . . . . . . . . . . . . . . . . . 53
1.2. Recent reforms easing regulation on labour market contracts
in selected countries . . . . . . . . . . . . . . . . . . . . . . . . . . . . . . . . . . . . . . . . . . . . . . . . . 64
1.3. Broad outcome measures of job quality and their subcomponents. . . . . . . . . . 87
2.1. Cost to companies of dealing with the tax system. . . . . . . . . . . . . . . . . . . . . . . . 96
2.2. Components of public spending . . . . . . . . . . . . . . . . . . . . . . . . . . . . . . . . . . . . . . . 102
2.3. Sub-national government spending, 2013 . . . . . . . . . . . . . . . . . . . . . . . . . . . . . . . 109
Figures1. Lack of growth is linked to low scores on well-being . . . . . . . . . . . . . . . . . . . . . . 14
2. Low productivity has led to poor competitiveness, high unemployment
and rising debt . . . . . . . . . . . . . . . . . . . . . . . . . . . . . . . . . . . . . . . . . . . . . . . . . . . . . . 15
3. Recession has widened the regional divide . . . . . . . . . . . . . . . . . . . . . . . . . . . . . . 19
4. Bank lending has been declining, while interest rates remain high
for private borrowers . . . . . . . . . . . . . . . . . . . . . . . . . . . . . . . . . . . . . . . . . . . . . . . . . 20
5. ALMP spending is relatively low and concentrated on some categories . . . . . . 29
6. The tax wedge for low-income workers is high. . . . . . . . . . . . . . . . . . . . . . . . . . . 31
7. Low gas prices, high electricity prices . . . . . . . . . . . . . . . . . . . . . . . . . . . . . . . . . . 33
8. Carbon intensity index of the energy mix . . . . . . . . . . . . . . . . . . . . . . . . . . . . . . . 34
9. The underlying primary budget surplus is now large. . . . . . . . . . . . . . . . . . . . . . 35
10. Debt will decline if the budget remains balanced. . . . . . . . . . . . . . . . . . . . . . . . . 37
11. VAT Gap estimates in the EU26 countries, 2012. . . . . . . . . . . . . . . . . . . . . . . . . . . 39
1.1. Italy’s potential output has stagnated mostly due to weak productivity . . . . . 54
1.2. Unemployment is high and increasing especially among youth . . . . . . . . . . . . 54
1.3. Labour force participation is low especially among women
and older people. . . . . . . . . . . . . . . . . . . . . . . . . . . . . . . . . . . . . . . . . . . . . . . . . . . . . 55
1.4. Large differences in activity and unemployment across regions . . . . . . . . . . . . 55
1.5. OECD estimates of structural unemployment and the output gap differ
from the European Commission . . . . . . . . . . . . . . . . . . . . . . . . . . . . . . . . . . . . . . . 57
1.6. Limited employment prospects for temporary workers . . . . . . . . . . . . . . . . . . . 58
1.7. Both earnings and household income inequality have increased . . . . . . . . . . . 59
1.8. Social transfers are currently poorly targeted . . . . . . . . . . . . . . . . . . . . . . . . . . . . 60
OECD ECONOMIC SURVEYS: ITALY © OECD 20154
TABLE OF CONTENTS
1.9. Employment protection legislation for permanent workers has been
restrictive . . . . . . . . . . . . . . . . . . . . . . . . . . . . . . . . . . . . . . . . . . . . . . . . . . . . . . . . . . 62
1.10. Allocation of labour to the most productive firms is limited . . . . . . . . . . . . . . . 63
1.11. Job mismatch and under-qualification are significant in Italy . . . . . . . . . . . . . . 64
1.12. Income support for the long-term unemployed is very weak in Italy . . . . . . . . 67
1.13. ALMP spending is relatively low and concentrated on some categories . . . . . . 69
1.14. Labour market institutions affect wages for different categories. . . . . . . . . . . . 72
1.15. Wages are more elastic for new hires than incumbent workers. . . . . . . . . . . . . 73
1.16. Tax wedge is high in Italy especially among low-income earners . . . . . . . . . . . 75
1.17. Women do more unpaid work than men . . . . . . . . . . . . . . . . . . . . . . . . . . . . . . . . 77
1.18. Educational attainment is low . . . . . . . . . . . . . . . . . . . . . . . . . . . . . . . . . . . . . . . . . 79
1.19. Returns from education are low . . . . . . . . . . . . . . . . . . . . . . . . . . . . . . . . . . . . . . . 80
1.20. Number of start-ups is limited and declining . . . . . . . . . . . . . . . . . . . . . . . . . . . . 81
1.21. Many start-ups do not grow much . . . . . . . . . . . . . . . . . . . . . . . . . . . . . . . . . . . . . 82
1.22. Resources do not flow to more innovative firms. . . . . . . . . . . . . . . . . . . . . . . . . . 83
1.23. Skills supply and demand, Italian sub-regions, 2009 . . . . . . . . . . . . . . . . . . . . . . 86
2.1. Public spending is relatively high in Italy. . . . . . . . . . . . . . . . . . . . . . . . . . . . . . . . 93
2.2. VAT Gap estimates in the EU26 countries, 2012. . . . . . . . . . . . . . . . . . . . . . . . . . . 94
2.3. Tax expenditures are expensive. . . . . . . . . . . . . . . . . . . . . . . . . . . . . . . . . . . . . . . . 97
2.4. Unpredictable property taxation . . . . . . . . . . . . . . . . . . . . . . . . . . . . . . . . . . . . . . . 99
2.5. Cuts in total discretionary spending, while other spending rises . . . . . . . . . . . 100
2.6. Low public investment . . . . . . . . . . . . . . . . . . . . . . . . . . . . . . . . . . . . . . . . . . . . . . . 101
2.7. High pay for some civil servants . . . . . . . . . . . . . . . . . . . . . . . . . . . . . . . . . . . . . . . 106
2.8. The share of sub-national spending is below the overall OECD average . . . . . . 109
OECD ECONOMIC SURVEYS: ITALY © OECD 2015 5
This Survey is published on the responsibility of the Economic andDevelopment Review Committee of the OECD, which is charged with theexamination of the economic situation of member countries.
The Economic situation and policies of Italy were reviewed by the Committeeon 12 January 2015. The draft was revised in the light of the discussions and givenfinal approval as the agreed report of the whole Committee on 30 January 2015.
The Secretariat’s draft report was prepared for the Committee by Paul O’Brienand Yosuke Jin under the supervision of Patrick Lenain. Hermes Morgavi andJosette Rabesona provided statistical research assistance, and Brigitte Beyelerprovided administrative support. The Survey also benefited from contributionsby Willem Adema, Jonathan Barr, Ivana Capozza, Chiara Criscuolo andFederica Maiorano.
The previous Survey of Italy was issued in May 2013.
Look for the StatLinks2at the bottom of the tables or graphs in this book.
To download the matching Excel® spreadsheet, just type the link into your
Internet browser, starting with the http://dx.doi.org prefix, or click on the link from
the e-book edition.
Follow OECD Publications on:
This book has... StatLinks2A service that delivers Excel files from the printed page! ®
http://twitter.com/OECD_Pubs
http://www.facebook.com/OECDPublications
http://www.linkedin.com/groups/OECD-Publications-4645871
http://www.youtube.com/oecdilibrary
http://www.oecd.org/oecddirect/ OECD
Alerts
(34.7)
(80.2)
(77.5)
(82.9)
2013
(2.6)
(26.9)
(70.5)
(110.2)
(69.9)
(7.9)
(16.1)
(2.7)
(32.2)
(2.4)
(9.7)
(0.5)
(496)
(494)
(501)
(26.8)
(0.37)
where
gency,
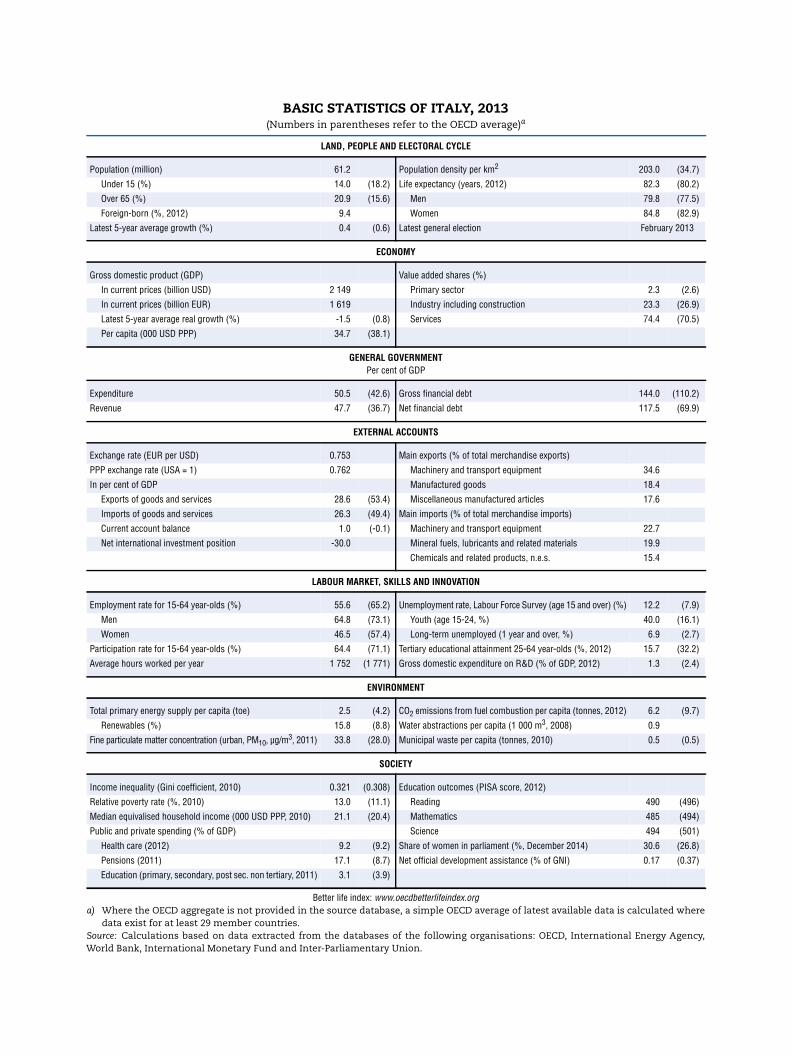
BASIC STATISTICS OF ITALY, 2013(Numbers in parentheses refer to the OECD average)a
LAND, PEOPLE AND ELECTORAL CYCLE
Population (million) 61.2 Population density per km2 203.0
Under 15 (%) 14.0 (18.2) Life expectancy (years, 2012) 82.3
Over 65 (%) 20.9 (15.6) Men 79.8
Foreign-born (%, 2012) 9.4 Women 84.8
Latest 5-year average growth (%) 0.4 (0.6) Latest general election February
ECONOMY
Gross domestic product (GDP) Value added shares (%)
In current prices (billion USD) 2 149 Primary sector 2.3
In current prices (billion EUR) 1 619 Industry including construction 23.3
Latest 5-year average real growth (%) -1.5 (0.8) Services 74.4
Per capita (000 USD PPP) 34.7 (38.1)
GENERAL GOVERNMENTPer cent of GDP
Expenditure 50.5 (42.6) Gross financial debt 144.0
Revenue 47.7 (36.7) Net financial debt 117.5
EXTERNAL ACCOUNTS
Exchange rate (EUR per USD) 0.753 Main exports (% of total merchandise exports)
PPP exchange rate (USA = 1) 0.762 Machinery and transport equipment 34.6
In per cent of GDP Manufactured goods 18.4
Exports of goods and services 28.6 (53.4) Miscellaneous manufactured articles 17.6
Imports of goods and services 26.3 (49.4) Main imports (% of total merchandise imports)
Current account balance 1.0 (-0.1) Machinery and transport equipment 22.7
Net international investment position -30.0 Mineral fuels, lubricants and related materials 19.9
Chemicals and related products, n.e.s. 15.4
LABOUR MARKET, SKILLS AND INNOVATION
Employment rate for 15-64 year-olds (%) 55.6 (65.2) Unemployment rate, Labour Force Survey (age 15 and over) (%) 12.2
Men 64.8 (73.1) Youth (age 15-24, %) 40.0
Women 46.5 (57.4) Long-term unemployed (1 year and over, %) 6.9
Participation rate for 15-64 year-olds (%) 64.4 (71.1) Tertiary educational attainment 25-64 year-olds (%, 2012) 15.7
Average hours worked per year 1 752 (1 771) Gross domestic expenditure on R&D (% of GDP, 2012) 1.3
ENVIRONMENT
Total primary energy supply per capita (toe) 2.5 (4.2) CO2 emissions from fuel combustion per capita (tonnes, 2012) 6.2
Renewables (%) 15.8 (8.8) Water abstractions per capita (1 000 m3, 2008) 0.9
Fine particulate matter concentration (urban, PM10, µg/m3, 2011) 33.8 (28.0) Municipal waste per capita (tonnes, 2010) 0.5
SOCIETY
Income inequality (Gini coefficient, 2010) 0.321 (0.308) Education outcomes (PISA score, 2012)
Relative poverty rate (%, 2010) 13.0 (11.1) Reading 490
Median equivalised household income (000 USD PPP, 2010) 21.1 (20.4) Mathematics 485
Public and private spending (% of GDP) Science 494
Health care (2012) 9.2 (9.2) Share of women in parliament (%, December 2014) 30.6
Pensions (2011) 17.1 (8.7) Net official development assistance (% of GNI) 0.17
Education (primary, secondary, post sec. non tertiary, 2011) 3.1 (3.9)
Better life index: www.oecdbetterlifeindex.orga) Where the OECD aggregate is not provided in the source database, a simple OECD average of latest available data is calculated
data exist for at least 29 member countries.Source: Calculations based on data extracted from the databases of the following organisations: OECD, International Energy AWorld Bank, International Monetary Fund and Inter-Parliamentary Union.

OECD Economic Surveys: Italy
© OECD 2015
Executive summary
● Main findings
● Key recommendations
9
EXECUTIVE SUMMARY
184639
015000
17000
19000
21000
23000
25000
27000
29000
31000
prices
Main findings
Ambitious institutional reforms are under way
After a long period of stagnation that left the economy vulnerable when the financial
crisis hit, Italy is undertaking broad-based and ambitious reforms to boost growth, taking
advantage of synergies across policies. In the past, many good reform projects were not
fully implemented, depriving the economy of their full benefits. The government is
therefore focusing on changes in the political and institutional frameworks and judicial
system to remove previous impediments to full implementation of reforms.
Labour market reforms and improved competition to boost productivity growth
The key challenges going forward are to make the economy more productive, more
competitive, and more adaptable, thereby raising the living standards and well-being of all
Italians. The immediate priority is to reform the labour market, where much rigidity
prevents job creation and efficient matching of skills; the government intends to complete
this task by mid-2015. For example, it intends to transfer the responsibility for active labour
market policy from local governments to the central government, so as to increase
effectiveness. There are structural weaknesses in other areas, notably competition and
regulation, which the government intends to tackle with broad-based reforms over the
next two years. These steps are needed to reverse past declines in productivity and put the
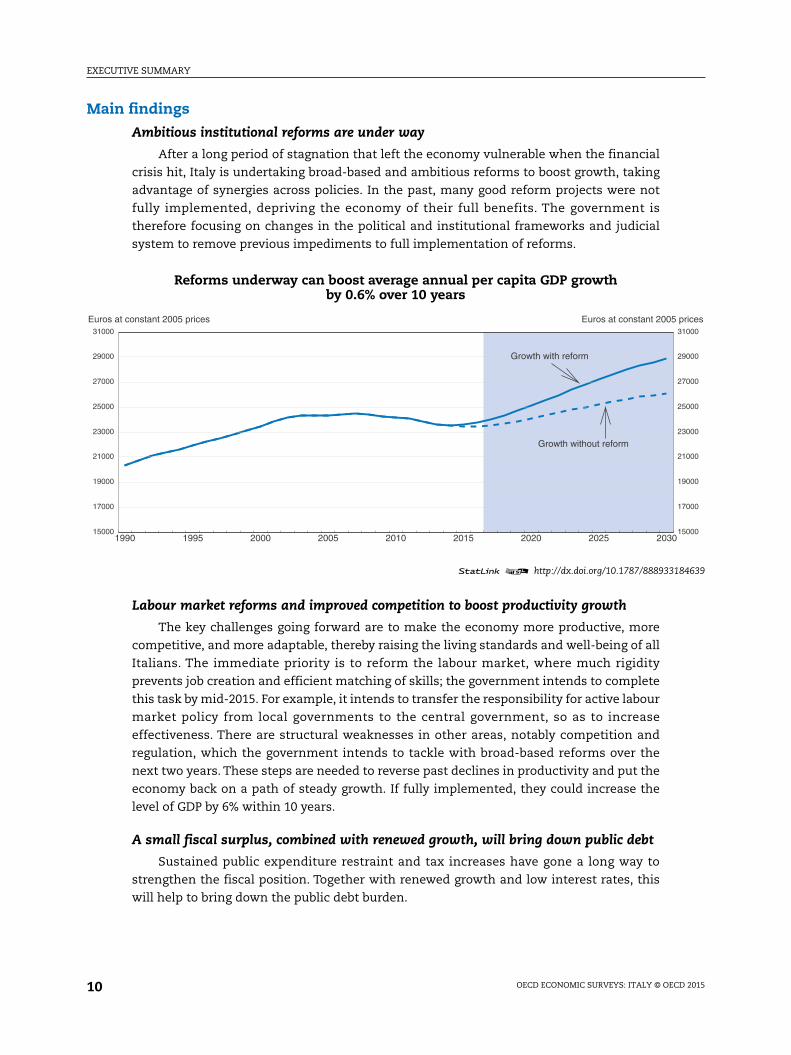
economy back on a path of steady growth. If fully implemented, they could increase the
level of GDP by 6% within 10 years.
A small fiscal surplus, combined with renewed growth, will bring down public debt
Sustained public expenditure restraint and tax increases have gone a long way to
strengthen the fiscal position. Together with renewed growth and low interest rates, this
will help to bring down the public debt burden.
Reforms underway can boost average annual per capita GDP growthby 0.6% over 10 years
1 2 http://dx.doi.org/10.1787/888933
1990 1995 2000 2005 2010 2015 2020 2025 20315000
17000
19000
21000
23000
25000
27000
29000
31000
Euros at constant 2005 prices Euros at constant 2005
Growth with reform
Growth without reform
OECD ECONOMIC SURVEYS: ITALY © OECD 201510
EXECUTIVE SUMMARY
Key recommendations
Fully implement the institutional reforms
● Follow through the reform of parliament and the re-assignment and clarification of
competences between the central and sub-national governments.
● Ensure that legislation is clear, unambiguous and supported by improved public
administration, including through reduced use of emergency decrees.
● Further streamline the court system, with more specialisation where appropriate;
increase the use of mediation; enhance monitoring of court performance.
● Consider establishing a Productivity Commission with the mandate to provide advice to
the government on matters related to productivity, promote public understanding of
reforms, and engage in a dialogue with stakeholders.
● Reducing corruption and improving trust must remain a priority. For this, the new
anti-corruption agency ANAC needs stability and continuity as well as support at all
political levels.
Give full priority to labour-market reforms to boost productivity growth and jobs
● Fully roll-out the new standard contract for new hires, with employment protection
rising with job tenure, while grandfathering existing contracts.
● Change the composition of spending on active labour-market policy: limit training
programmes to those who need them most; tailor assistance to job seekers according to
their specific situation.
● Encourage female labour force participation with more flexible working-hours
arrangements, and promote wider provision of good quality care for children and the
elderly.
● Fully implement the unified unemployment benefit system. Require recipients to
actively seek work, and to accept employment or training when offered.
● Encourage social partners to allow modification of national wage agreements at the firm
level, through agreement with representatives of a majority of the firm’s employees.
● Adopt a competition law following the recommendations of the competition authority to
introduce competition into local public services, improve competition in insurance,
banking, network industries, the regulated professions and retail trade.
Fiscal and financial challenges
● Stick to the planned fiscal strategy so as to bring the debt-to-GDP ratio onto a declining
path.
● Promote greater use of centralised procurement, cost information systems and
benchmarking.
● Urgently take action to achieve a lower level of non-performing loans in the banking sector,
including through enhancing the insolvency regime applied to distressed borrowers.
● Continue efforts to reduce tax evasion through more effective enforcement and increase
tax compliance through simplified collection procedures. Broaden tax bases, in particular
by cutting the number of tax expenditures, and simplify the tax system.
OECD ECONOMIC SURVEYS: ITALY © OECD 2015 11

OECD Economic Surveys: Italy
© OECD 2015
Assessment and recommendations
● A prolonged recession and uncertain prospects
● Institutional reforms can be the basis for better policymaking and strongerimplementation
● Labour market and competition reforms to improve productivity and well-being
● Addressing fiscal and financial challenges
13
ASSESSMENT AND RECOMMENDATIONS
t score
184642
-3
-2
-1
0
1
2
3
4
5hanges
36
31
26
21
16
11
6
1
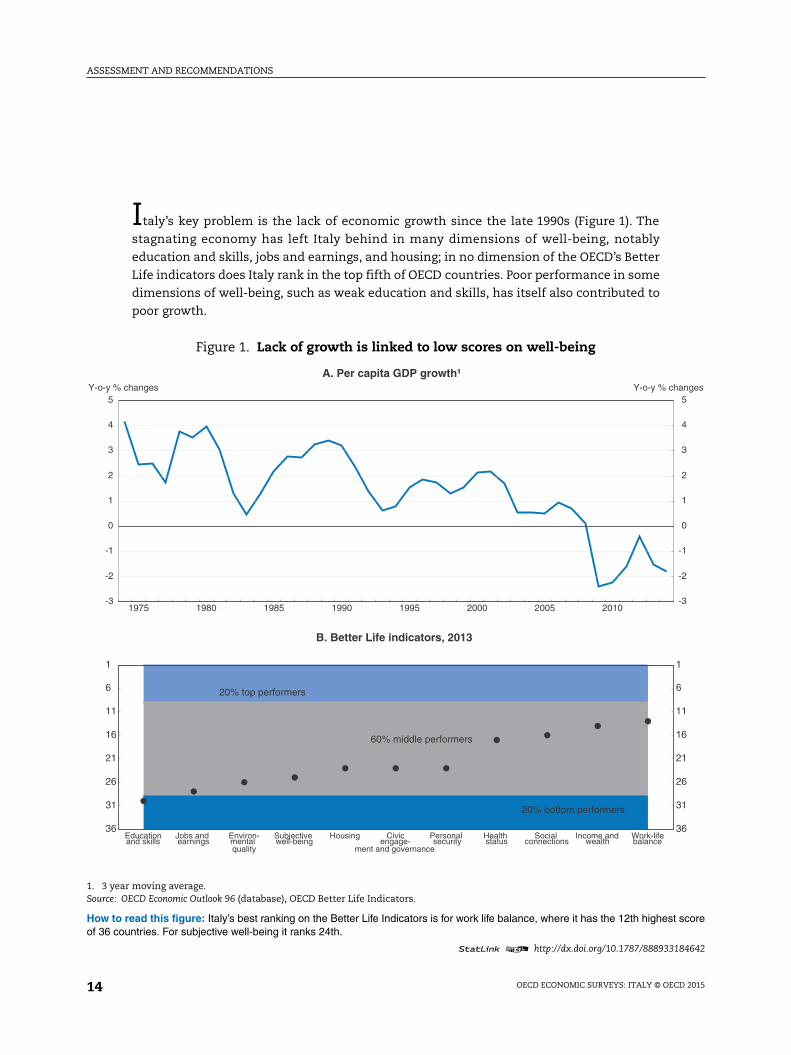
Italy’s key problem is the lack of economic growth since the late 1990s (Figure 1). The
stagnating economy has left Italy behind in many dimensions of well-being, notably
education and skills, jobs and earnings, and housing; in no dimension of the OECD’s Better
Life indicators does Italy rank in the top fifth of OECD countries. Poor performance in some
dimensions of well-being, such as weak education and skills, has itself also contributed to
poor growth.
Figure 1. Lack of growth is linked to low scores on well-being
1. 3 year moving average.Source: OECD Economic Outlook 96 (database), OECD Better Life Indicators.
How to read this figure: Italy’s best ranking on the Better Life Indicators is for work life balance, where it has the 12th highesof 36 countries. For subjective well-being it ranks 24th.
1 2 http://dx.doi.org/10.1787/888933
1975 1980 1985 1990 1995 2000 2005 2010-3
-2
-1
0
1
2
3
4
5Y-o-y % changes
Y-o-y % c
A. Per capita GDP growth¹
Educationand skills
Jobs and earnings
Environ-mental quality
Subjective well-being
Housing Civicengage-
ment and governance
Personal security
Health status
Social connections
Income andwealth
Work-lifebalance
20% bottom performers
60% middle performers
20% top performers
36
31
26
21
16
11
6
1
B. Better Life indicators, 2013
OECD ECONOMIC SURVEYS: ITALY © OECD 201514
ASSESSMENT AND RECOMMENDATIONS
debt
184659
4
5
6
7
8
9
10
11
12
13%
0
20
40
60
80
100
120
140
160of GDP
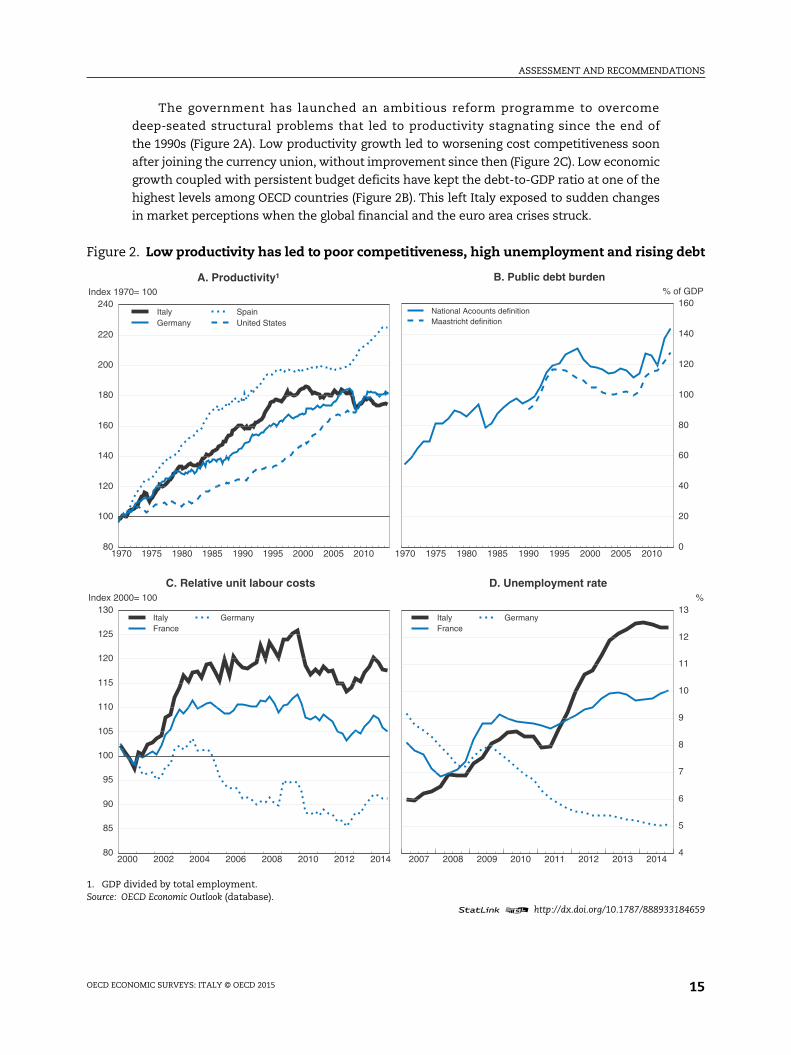
The government has launched an ambitious reform programme to overcome
deep-seated structural problems that led to productivity stagnating since the end of
the 1990s (Figure 2A). Low productivity growth led to worsening cost competitiveness soon
after joining the currency union, without improvement since then (Figure 2C). Low economic
growth coupled with persistent budget deficits have kept the debt-to-GDP ratio at one of the
highest levels among OECD countries (Figure 2B). This left Italy exposed to sudden changes
in market perceptions when the global financial and the euro area crises struck.
Figure 2. Low productivity has led to poor competitiveness, high unemployment and rising
1. GDP divided by total employment.Source: OECD Economic Outlook (database).
1 2 http://dx.doi.org/10.1787/888933
2000 2002 2004 2006 2008 2010 2012 201480
85
90
95
100
105
110
115
120
125
130Index 2000= 100
ItalyFrance
Germany
C. Relative unit labour costs
2007 2008 2009 2010 2011 2012 2013 2014
ItalyFrance
Germany
D. Unemployment rate
1970 1975 1980 1985 1990 1995 2000 2005 201080
100
120
140
160
180
200
220
240Index 1970= 100
ItalyGermany
SpainUnited States
A. Productivity¹
1970 1975 1980 1985 1990 1995 2000 2005 2010
%
National Acoounts definitionMaastricht definition
B. Public debt burden
OECD ECONOMIC SURVEYS: ITALY © OECD 2015 15
ASSESSMENT AND RECOMMENDATIONS
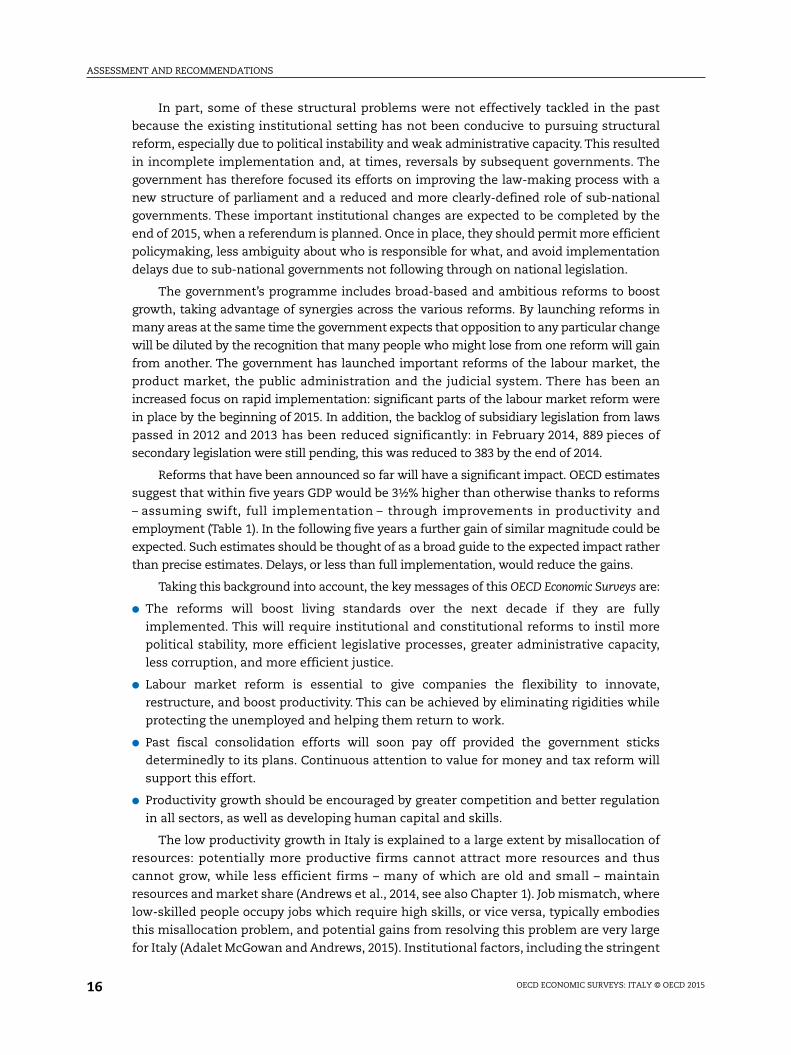
In part, some of these structural problems were not effectively tackled in the past
because the existing institutional setting has not been conducive to pursuing structural
reform, especially due to political instability and weak administrative capacity. This resulted
in incomplete implementation and, at times, reversals by subsequent governments. The
government has therefore focused its efforts on improving the law-making process with a
new structure of parliament and a reduced and more clearly-defined role of sub-national
governments. These important institutional changes are expected to be completed by the
end of 2015, when a referendum is planned. Once in place, they should permit more efficient
policymaking, less ambiguity about who is responsible for what, and avoid implementation
delays due to sub-national governments not following through on national legislation.
The government’s programme includes broad-based and ambitious reforms to boost
growth, taking advantage of synergies across the various reforms. By launching reforms in
many areas at the same time the government expects that opposition to any particular change
will be diluted by the recognition that many people who might lose from one reform will gain
from another. The government has launched important reforms of the labour market, the
product market, the public administration and the judicial system. There has been an
increased focus on rapid implementation: significant parts of the labour market reform were
in place by the beginning of 2015. In addition, the backlog of subsidiary legislation from laws
passed in 2012 and 2013 has been reduced significantly: in February 2014, 889 pieces of
secondary legislation were still pending, this was reduced to 383 by the end of 2014.
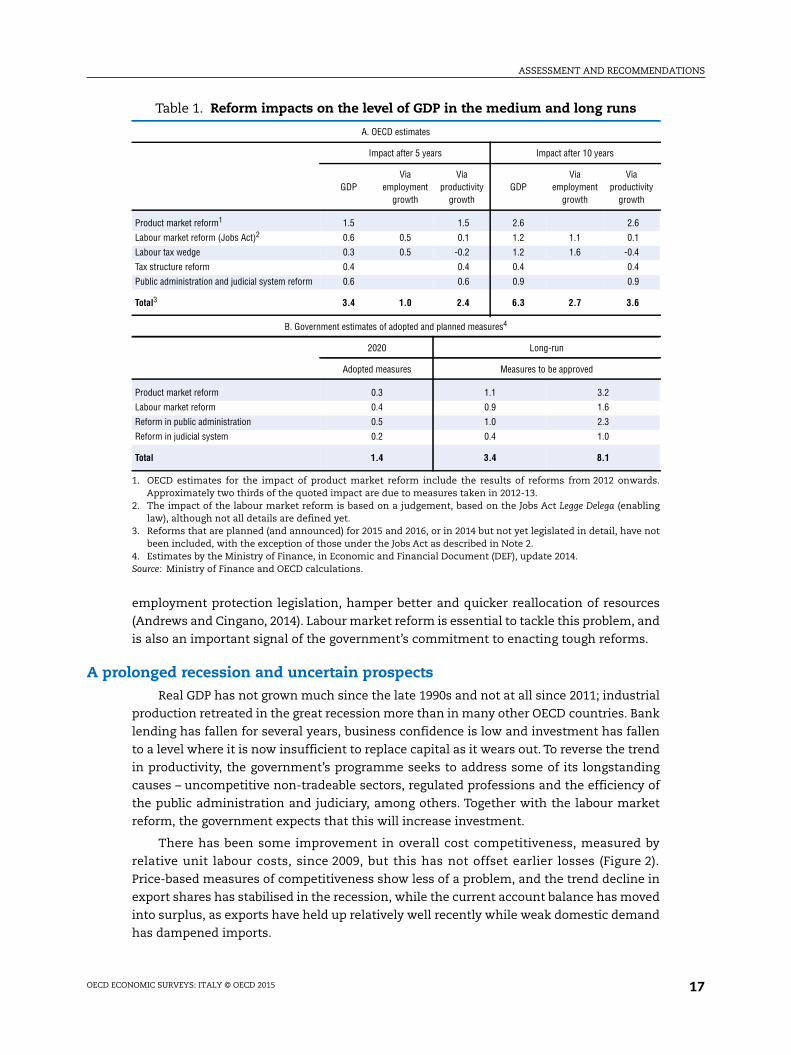
Reforms that have been announced so far will have a significant impact. OECD estimates
suggest that within five years GDP would be 3½% higher than otherwise thanks to reforms
– assuming swift, full implementation – through improvements in productivity and
employment (Table 1). In the following five years a further gain of similar magnitude could be
expected. Such estimates should be thought of as a broad guide to the expected impact rather
than precise estimates. Delays, or less than full implementation, would reduce the gains.
Taking this background into account, the key messages of this OECD Economic Surveys are:
● The reforms will boost living standards over the next decade if they are fully
implemented. This will require institutional and constitutional reforms to instil more
political stability, more efficient legislative processes, greater administrative capacity,
less corruption, and more efficient justice.
● Labour market reform is essential to give companies the flexibility to innovate,
restructure, and boost productivity. This can be achieved by eliminating rigidities while
protecting the unemployed and helping them return to work.
● Past fiscal consolidation efforts will soon pay off provided the government sticks
determinedly to its plans. Continuous attention to value for money and tax reform will
support this effort.
● Productivity growth should be encouraged by greater competition and better regulation
in all sectors, as well as developing human capital and skills.
The low productivity growth in Italy is explained to a large extent by misallocation of
resources: potentially more productive firms cannot attract more resources and thus
cannot grow, while less efficient firms – many of which are old and small – maintain
resources and market share (Andrews et al., 2014, see also Chapter 1). Job mismatch, where
low-skilled people occupy jobs which require high skills, or vice versa, typically embodies
this misallocation problem, and potential gains from resolving this problem are very large
for Italy (Adalet McGowan and Andrews, 2015). Institutional factors, including the stringent
OECD ECONOMIC SURVEYS: ITALY © OECD 201516
ASSESSMENT AND RECOMMENDATIONS
employment protection legislation, hamper better and quicker reallocation of resources
(Andrews and Cingano, 2014). Labour market reform is essential to tackle this problem, and
is also an important signal of the government’s commitment to enacting tough reforms.
A prolonged recession and uncertain prospectsReal GDP has not grown much since the late 1990s and not at all since 2011; industrial
production retreated in the great recession more than in many other OECD countries. Bank
lending has fallen for several years, business confidence is low and investment has fallen
to a level where it is now insufficient to replace capital as it wears out. To reverse the trend
in productivity, the government’s programme seeks to address some of its longstanding
causes – uncompetitive non-tradeable sectors, regulated professions and the efficiency of
the public administration and judiciary, among others. Together with the labour market
reform, the government expects that this will increase investment.
There has been some improvement in overall cost competitiveness, measured by
relative unit labour costs, since 2009, but this has not offset earlier losses (Figure 2).
Price-based measures of competitiveness show less of a problem, and the trend decline in
export shares has stabilised in the recession, while the current account balance has moved
into surplus, as exports have held up relatively well recently while weak domestic demand
has dampened imports.
Table 1. Reform impacts on the level of GDP in the medium and long runs
A. OECD estimates
Impact after 5 years Impact after 10 years
GDPVia
employmentgrowth
Viaproductivity
growthGDP
Viaemployment
growth
Viaproductivity
growth
Product market reform1 1.5 1.5 2.6 2.6
Labour market reform (Jobs Act)2 0.6 0.5 0.1 1.2 1.1 0.1
Labour tax wedge 0.3 0.5 -0.2 1.2 1.6 -0.4
Tax structure reform 0.4 0.4 0.4 0.4
Public administration and judicial system reform 0.6 0.6 0.9 0.9
Total3 3.4 1.0 2.4 6.3 2.7 3.6
B. Government estimates of adopted and planned measures4
2020 Long-run
Adopted measures Measures to be approved
Product market reform 0.3 1.1 3.2
Labour market reform 0.4 0.9 1.6
Reform in public administration 0.5 1.0 2.3
Reform in judicial system 0.2 0.4 1.0
Total 1.4 3.4 8.1
1. OECD estimates for the impact of product market reform include the results of reforms from 2012 onwards.Approximately two thirds of the quoted impact are due to measures taken in 2012-13.
2. The impact of the labour market reform is based on a judgement, based on the Jobs Act Legge Delega (enablinglaw), although not all details are defined yet.
3. Reforms that are planned (and announced) for 2015 and 2016, or in 2014 but not yet legislated in detail, have notbeen included, with the exception of those under the Jobs Act as described in Note 2.
4. Estimates by the Ministry of Finance, in Economic and Financial Document (DEF), update 2014.Source: Ministry of Finance and OECD calculations.
OECD ECONOMIC SURVEYS: ITALY © OECD 2015 17
ASSESSMENT AND RECOMMENDATIONS
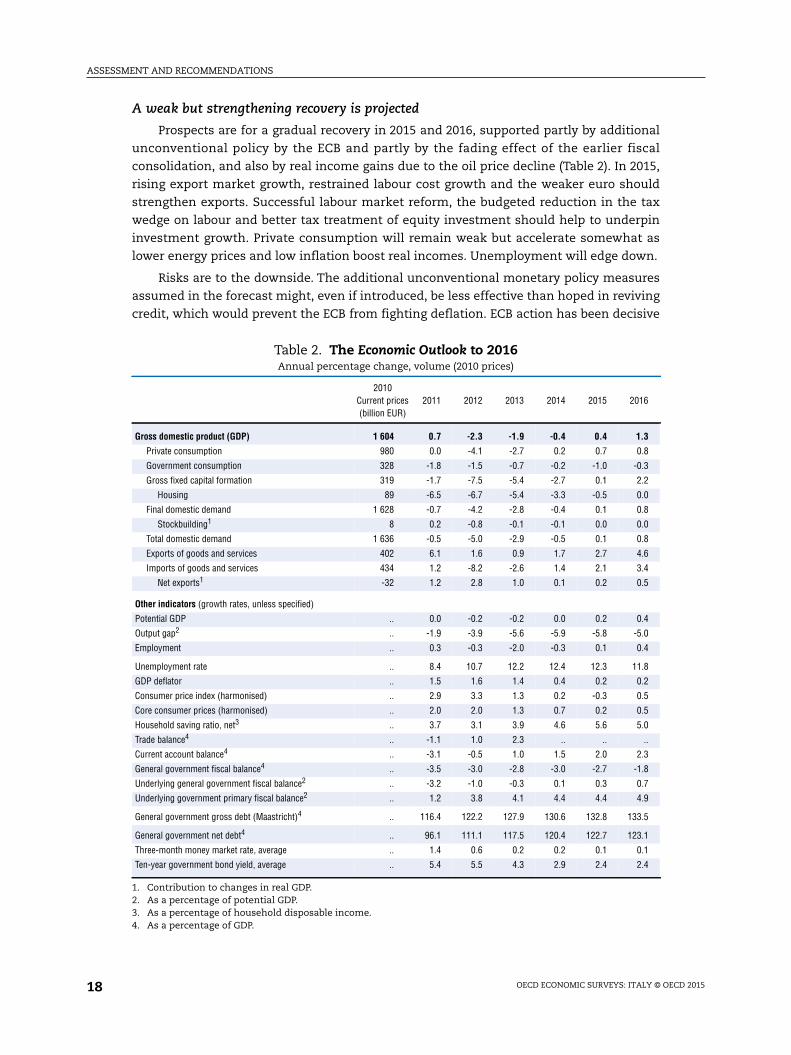
A weak but strengthening recovery is projected
Prospects are for a gradual recovery in 2015 and 2016, supported partly by additional
unconventional policy by the ECB and partly by the fading effect of the earlier fiscal
consolidation, and also by real income gains due to the oil price decline (Table 2). In 2015,
rising export market growth, restrained labour cost growth and the weaker euro should
strengthen exports. Successful labour market reform, the budgeted reduction in the tax
wedge on labour and better tax treatment of equity investment should help to underpin
investment growth. Private consumption will remain weak but accelerate somewhat as
lower energy prices and low inflation boost real incomes. Unemployment will edge down.
Risks are to the downside. The additional unconventional monetary policy measures
assumed in the forecast might, even if introduced, be less effective than hoped in reviving
credit, which would prevent the ECB from fighting deflation. ECB action has been decisive
Table 2. The Economic Outlook to 2016Annual percentage change, volume (2010 prices)
2010Current prices(billion EUR)
2011 2012 2013 2014 2015 2016
Gross domestic product (GDP) 1 604 0.7 -2.3 -1.9 -0.4 0.4 1.3
Private consumption 980 0.0 -4.1 -2.7 0.2 0.7 0.8
Government consumption 328 -1.8 -1.5 -0.7 -0.2 -1.0 -0.3
Gross fixed capital formation 319 -1.7 -7.5 -5.4 -2.7 0.1 2.2
Housing 89 -6.5 -6.7 -5.4 -3.3 -0.5 0.0
Final domestic demand 1 628 -0.7 -4.2 -2.8 -0.4 0.1 0.8
Stockbuilding1 8 0.2 -0.8 -0.1 -0.1 0.0 0.0
Total domestic demand 1 636 -0.5 -5.0 -2.9 -0.5 0.1 0.8
Exports of goods and services 402 6.1 1.6 0.9 1.7 2.7 4.6
Imports of goods and services 434 1.2 -8.2 -2.6 1.4 2.1 3.4
Net exports1 -32 1.2 2.8 1.0 0.1 0.2 0.5
Other indicators (growth rates, unless specified)
Potential GDP .. 0.0 -0.2 -0.2 0.0 0.2 0.4
Output gap2 .. -1.9 -3.9 -5.6 -5.9 -5.8 -5.0
Employment .. 0.3 -0.3 -2.0 -0.3 0.1 0.4
Unemployment rate .. 8.4 10.7 12.2 12.4 12.3 11.8
GDP deflator .. 1.5 1.6 1.4 0.4 0.2 0.2
Consumer price index (harmonised) .. 2.9 3.3 1.3 0.2 -0.3 0.5
Core consumer prices (harmonised) .. 2.0 2.0 1.3 0.7 0.2 0.5
Household saving ratio, net3 .. 3.7 3.1 3.9 4.6 5.6 5.0
Trade balance4 .. -1.1 1.0 2.3 .. .. ..
Current account balance4 .. -3.1 -0.5 1.0 1.5 2.0 2.3
General government fiscal balance4 .. -3.5 -3.0 -2.8 -3.0 -2.7 -1.8
Underlying general government fiscal balance2 .. -3.2 -1.0 -0.3 0.1 0.3 0.7
Underlying government primary fiscal balance2 .. 1.2 3.8 4.1 4.4 4.4 4.9
General government gross debt (Maastricht)4 .. 116.4 122.2 127.9 130.6 132.8 133.5
General government net debt4 .. 96.1 111.1 117.5 120.4 122.7 123.1
Three-month money market rate, average .. 1.4 0.6 0.2 0.2 0.1 0.1
Ten-year government bond yield, average .. 5.4 5.5 4.3 2.9 2.4 2.4
1. Contribution to changes in real GDP.2. As a percentage of potential GDP.3. As a percentage of household disposable income.4. As a percentage of GDP.
OECD ECONOMIC SURVEYS: ITALY © OECD 201518
ASSESSMENT AND RECOMMENDATIONS
n over
184665
85
90
95
100
105
1101= 100
in sustaining market confidence in Italian debt, but market sentiment could turn against
Italy with its history of low growth and high debt, especially in the absence of other
measures to sustain aggregate demand in the euro area. The general level of interest rates
and the risk spread against Germany could rise, further delaying the point at which public
debt will fall significantly. Containing this risk will require continued political commitment
to steady debt reduction. More prolonged weakness in other euro area countries would
undermine the hopes of stronger net exports, while a key internal risk is that the ambitious
reform programme is somehow derailed or the political commitment to reform fades. This
would damage confidence and the prospects for economic recovery.
On the upside, investment tends to be quite volatile in recoveries and, having fallen so
much, it could rise more quickly with a return of confidence and available finance.
Furthermore, the weakening euro could give a stronger boost to net trade, while lower
energy prices benefit Italy directly as a major energy importer but also through the effects
on effective demand of increased real incomes in important trading partners.
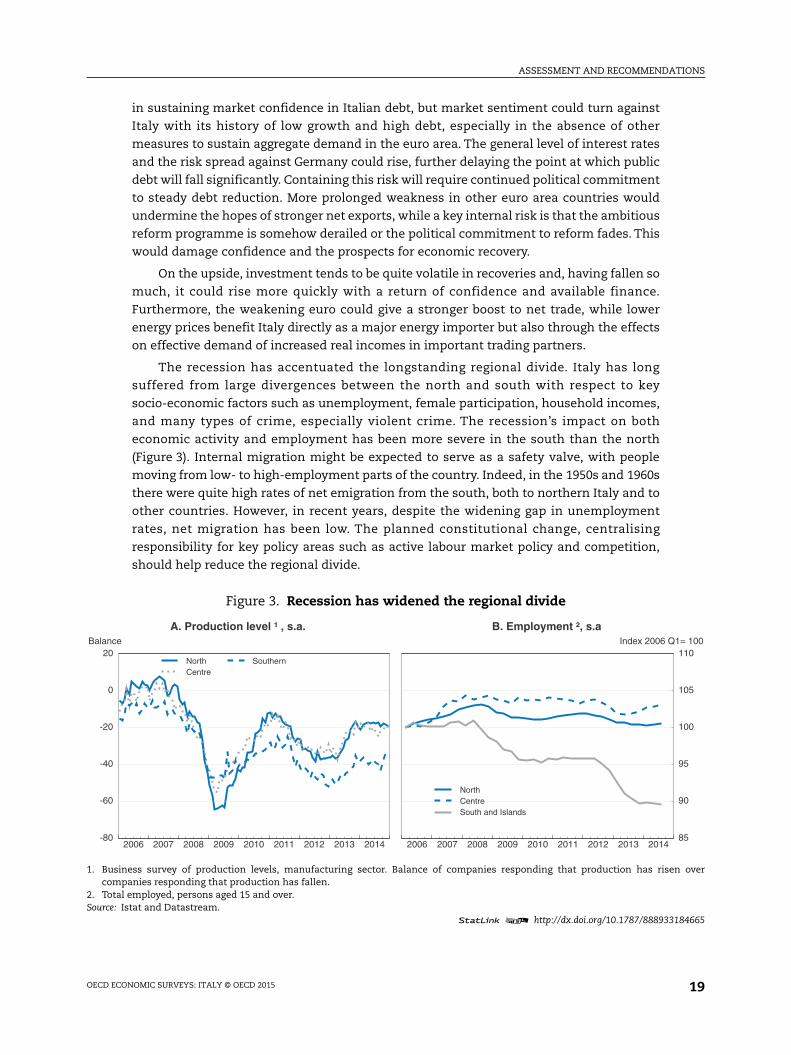
The recession has accentuated the longstanding regional divide. Italy has long
suffered from large divergences between the north and south with respect to key
socio-economic factors such as unemployment, female participation, household incomes,
and many types of crime, especially violent crime. The recession’s impact on both
economic activity and employment has been more severe in the south than the north
(Figure 3). Internal migration might be expected to serve as a safety valve, with people
moving from low- to high-employment parts of the country. Indeed, in the 1950s and 1960s
there were quite high rates of net emigration from the south, both to northern Italy and to
other countries. However, in recent years, despite the widening gap in unemployment
rates, net migration has been low. The planned constitutional change, centralising
responsibility for key policy areas such as active labour market policy and competition,
should help reduce the regional divide.
Figure 3. Recession has widened the regional divide
1. Business survey of production levels, manufacturing sector. Balance of companies responding that production has risecompanies responding that production has fallen.
2. Total employed, persons aged 15 and over.Source: Istat and Datastream.
1 2 http://dx.doi.org/10.1787/888933
2006 2007 2008 2009 2010 2011 2012 2013 2014-80
-60
-40
-20
0
20Balance
NorthCentre
Southern
A. Production level ¹ , s.a.
2006 2007 2008 2009 2010 2011 2012 2013 2014
Index 2006 Q
NorthCentreSouth and Islands
B. Employment ², s.a
OECD ECONOMIC SURVEYS: ITALY © OECD 2015 19
ASSESSMENT AND RECOMMENDATIONS
184678
0
1
2
3
4
5
6
7
8%
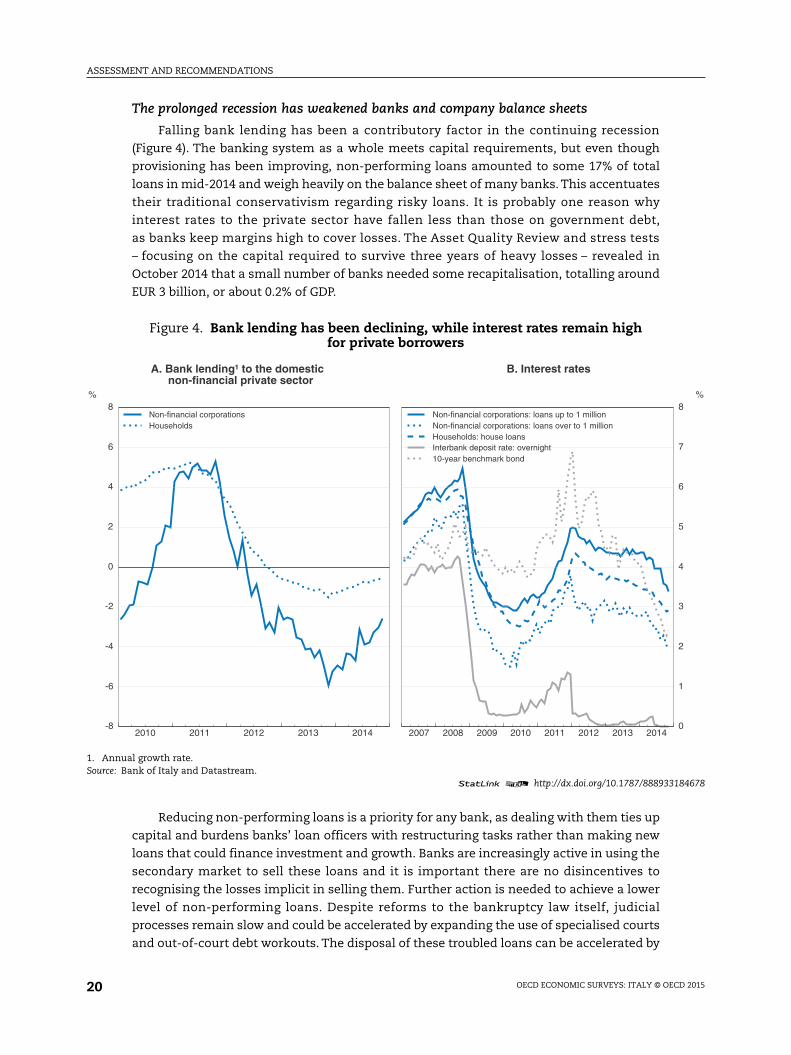
The prolonged recession has weakened banks and company balance sheets
Falling bank lending has been a contributory factor in the continuing recession
(Figure 4). The banking system as a whole meets capital requirements, but even though
provisioning has been improving, non-performing loans amounted to some 17% of total
loans in mid-2014 and weigh heavily on the balance sheet of many banks. This accentuates
their traditional conservativism regarding risky loans. It is probably one reason why
interest rates to the private sector have fallen less than those on government debt,
as banks keep margins high to cover losses. The Asset Quality Review and stress tests
– focusing on the capital required to survive three years of heavy losses – revealed in
October 2014 that a small number of banks needed some recapitalisation, totalling around
EUR 3 billion, or about 0.2% of GDP.
Reducing non-performing loans is a priority for any bank, as dealing with them ties up
capital and burdens banks’ loan officers with restructuring tasks rather than making new
loans that could finance investment and growth. Banks are increasingly active in using the
secondary market to sell these loans and it is important there are no disincentives to
recognising the losses implicit in selling them. Further action is needed to achieve a lower
level of non-performing loans. Despite reforms to the bankruptcy law itself, judicial
processes remain slow and could be accelerated by expanding the use of specialised courts
and out-of-court debt workouts. The disposal of these troubled loans can be accelerated by
Figure 4. Bank lending has been declining, while interest rates remain highfor private borrowers
1. Annual growth rate.Source: Bank of Italy and Datastream.
1 2 http://dx.doi.org/10.1787/888933
2010 2011 2012 2013 2014-8
-6
-4
-2
0
2
4
6
8%
Non-financial corporationsHouseholds
A. Bank lending¹ to the domesticnon-financial private sector
2007 2008 2009 2010 2011 2012 2013 2014
Non-financial corporations: loans up to 1 millionNon-financial corporations: loans over to 1 millionHouseholds: house loansInterbank deposit rate: overnight10-year benchmark bond
B. Interest rates
OECD ECONOMIC SURVEYS: ITALY © OECD 201520
ASSESSMENT AND RECOMMENDATIONS
setting up specialised asset management companies (“bad banks”) that would acquire
them with appropriate haircuts (Gandrud and Halleberg, 2014); this process is already
underway in the private sector, but at a slow pace. Some euro-area countries have
successfully set up public bad banks. If progress remains slow, the establishment of a
public bad bank could be envisaged in Italy. Meanwhile, together with changing the tax
treatment of loan-loss-provisions, the government has taken a number of measures to
improve the flow of finance to companies from non-bank sources, in its “Finance for
growth” measures (Box 1).
Institutional reforms can be the basis for better policymaking and strongerimplementation
The government has launched constitutional reforms in two important areas: the
structure of parliament and the division of responsibility between central and sub-national
governments. The reform of parliament will transform the Senate into a second-tier body.
Since 1946 the two houses of parliament, the Senate and the Chamber of Deputies, have
had equal powers and prerogatives in terms of drafting legislation, though they are elected
Box 1. Recent government measures to increase “Finance for Growth”
The government has taken a number of measures to make it easier or cheaper forfinance to flow to small companies or infrastructure projects and investment in general, aswell as encouraging wider stock market listing to improve access to equity finance.
Easier access to credit. Some institutions previously prohibited from lending directly tocompanies, such as credit funds, securitisation companies and insurance companies, maynow lend directly to firms. The withholding tax for EU investors on medium-long termfinancing, unlisted bonds and certain other securities is removed. The endowment of theCentral Guarantee Fund has been increased and the scope of the Fund widened byincluding guarantees for mini-bonds issued by SMEs.
Fiscal and other incentives for investment. Measures recently enacted Include atemporary tax credit for companies increasing their level of investment and a subsidytargeting loans to small and medium-sized enterprises for the purchase of machinery,equipment, capital goods and for investment in IT. A tax credit for incremental investmentsin R&D in the 2015-19 period has been introduced. A favourable “patent box” taxation onincome deriving from direct/indirect use of intellectual property, patents and trademarkshas been also been introduced (see also Criscuolo and Appelt, 2015). Project bonds forinfrastructure investment have been made cheaper and simpler to issue. Regulationsgoverning the involvement of institutional investors in real estate have been relaxed.
Encouraging the supply of equity finance. The allowance for corporate equity has beenincreased and can also now be set off against regional corporate taxes (IRAP). Measures tosimplify public listings by SMEs and by family companies include the possibility ofmultiple-voting shares, reduced minimum capital requirements, variable thresholds forcompulsory takeover and an increased threshold for compulsory communication ofholdings or admissible cross-shareholdings. The allowance for corporate equity is to beincreased by 40% for newly-listed companies (Super ACE).
Early results are encouraging. Within the first few months additional lending SMEsfrom the “Sabatini law” fund was EUR 2 billion, and 26 new companies raised EUR 1 billionin bond issues.
OECD ECONOMIC SURVEYS: ITALY © OECD 2015 21
ASSESSMENT AND RECOMMENDATIONS
on different bases. Legislation can be passed from one to the other for modification. This
can mean long and protracted negotiations, many amendments, and complicated
legislation. Under the proposed constitutional change, which has already been voted by the
Senate itself and the constitutional commission of the Chamber of Deputies, the Senate
would have an equal legislative function to the Chamber of Deputies only for a narrow
range of issues. For all other matters, the Senate would have the power only to propose
modifications to drafts from the Chamber of Deputies. The Senate will also participate in
monitoring the public administration and policy implementation. Reduced from 315 to
about 100 members, it would be composed of a number of representatives for each region,
drawn from members of the regional councils and mayors, and up to five notables
nominated by the president of the republic.
The reform of centre-sub-national relations, which would reverse some of the changes
introduced in a 2001 constitutional reform, would recentralise a number of devolved
functions and eliminate concurrent competences. A number of OECD studies have drawn
attention to the difficulties the current structure has generated in regulation and
environmental policy (OECD, 2009b, 2013a, 2013c). Policy regarding energy and most
infrastructure would revert to national level. The change would also convert the de facto
abolition of the 110 provinces, which was achieved in 2014 through legislation and
administrative measures, into a constitutional fact. One underlying principle will remain,
with more limited scope of application: all matters that are not expressly reserved for
central government will be regional competences. Regions with a balanced budget will be
given more autonomy for as long as they keep their budget balanced. In addition, the
public functions financing of all regions and municipalities will be based on standard
indicators of costs and needs (which are already available on-line).
This important constitutional reform is expected to be completed by the end of 2015,
when a referendum is planned. Once in place, the reform should permit more efficient
policymaking, reduce ambiguity about who is responsible for what, avoid implementation
delays due to sub-national government not following through on national legislation, and
improve the coherence of the domestic market by reducing the extent of regulatory
variation between regions.
The 2013 OECD Economic Survey noted that policy implementation appears to be a
weakness (OECD, 2013a; O’Brien, 2013). Effective policy implementation needs
well-designed and well-written (i.e. in clear and unambiguous language) legislation,
effective public administration (ranging from prompt introduction of implementing
regulations to effective enforcement of their specific provisions) and an efficient legal
system to back up enforcement and prevent corruption.
Poor policy implementation can arise from various sources. For example, legislation
has sometimes been unclear, or imposed unreasonable deadlines (Allio and Rangone,
2015). This can lead to non-compliance occurring inadvertently, but may also cover
deliberate non-compliance and make it seem normal. Another problem can be
institutional instability. If the structure or mandate of a body is changed too frequently, its
ability to focus on its key tasks may be reduced. For instance, the anti-corruption agency
created in 2004 was modified four times before its abolition in 2008. Its successor, ANAC,
created in 2012, has had its mandate changed twice since then.
OECD ECONOMIC SURVEYS: ITALY © OECD 201522
ASSESSMENT AND RECOMMENDATIONS
The language of legislation itself can be important. An OECD study on international
investment agreements notes that French, UK and German agreements, covering several
decades, used unchanged phrasing to refer to the period of validity of the agreement (Pohl,
2013). The equivalent Italian documents use at least a dozen different formulations.
Unjustified variations in language (many of which were noted in Italian legislation by
Clarich and Mattarella, 2010) can create unnecessary waste of time and, potentially, legal
ambiguity. The ongoing process of regulatory simplification and codification of existing
laws and regulations can also improve the transparency of legislation and should continue.
Difficulties with policy implementation have arisen from potential conflicts or
overlapping responsibilities between levels of government. One example where this can
occur is with environmental policy, where policy design is a central government
responsibility, but implementation is delegated to the regions (OECD, 2013c). Energy
planning and retail regulation are other examples where several levels of government have
powers or responsibilities. The government’s intention to clarify the division of
responsibility between centre and regions, as well as the phasing out of the provincial level
of government, could yield more decisive action.
Other difficulties with implementation can arise because legislation is introduced
hurriedly, with the corresponding risk of insufficient attention to detail or poor assessment
of possible alternative policies. For this reason the 2013 OECD Economic Survey
recommended that less use be made of decree laws. The constitution reserves the use of
decree laws for “urgent” measures. Given the long time scale over which structural reform
takes effect, taking time to get the measures right, and to get effective parliamentary
consent and “ownership” to improve the durability of the measures, will often be more
important than “urgent” action. The reformed structure of parliament should allow
legislation to be agreed more quickly without the use of decree laws; the time saved should
be used to improve all aspects of the process, including drafting but also use of impact
assessments and other processes designed to subject policy choices to scrutiny for
efficiency and effectiveness. A proposed constitutional change will limit the use of
“urgent” decrees to a specific list of issues, and also introduces the possibility of time-
limited debate (imposing a vote by a definite date) in the Chamber of Deputies.
An inefficient public administration can be a barrier to effective implementation of
reforms. Weaknesses in the Italian public administration have included absenteeism, low
skills, mismatch, lack of transparency and cronyism (Department of Public Administration,
2008; Commission on corruption in public administration, 2012). Past reforms have tackled
many of these areas, though progress has been slow. The government needs to continue its
efforts to pursue more performance-oriented management and improve skill levels. The
revision to public employment regulations that allows them to be reassigned more easily
should improve both flexibility and skill-matching, if used by a management system that
focuses on performance. Transparency has improved, and is an important tool in the fight
to avoid waste and corruption, but more could be done. An example is to move to a more
general freedom of information provision, where all information held by the public
administration should be available on request to the public, except to protect privacy or
security. This would contrast with the current duty to publish only information that is
specified by law, although this covers a wide range of areas.
OECD ECONOMIC SURVEYS: ITALY © OECD 2015 23
ASSESSMENT AND RECOMMENDATIONS
Monitoring and ongoing policy assessment is important
The current government is aware of policy implementation problems. It maintains a
record, developed under the two predecessor governments, of the extent to which
subsidiary legislation has been completed. This shows that much work in implementing
legislation from both 2013 and 2012 remained to be done even in early 2014. By the end
of 2014 about half the backlog had been cleared, though 383 specific pieces of subsidiary
legislation were still needed to complete legislation from 2012 and 2013. Some policy
changes were introduced rather hurriedly in 2014, such as changing the effective status of
provinces in advance of considering the details of the constitutional law, which will not
come into force until 2015 at the earliest. A number of measures introduced in 2012, for
example the labour market changes, included provision for monitoring their impact so as
to have concrete evidence on which to assess their effectiveness. This is a good idea which
should be continued.
The government’s approach of setting its reform programme within a broad three year
timetable, together with broad consultation on proposals in the main reform areas (public
administration, education, justice), is an important step in the direction of a more
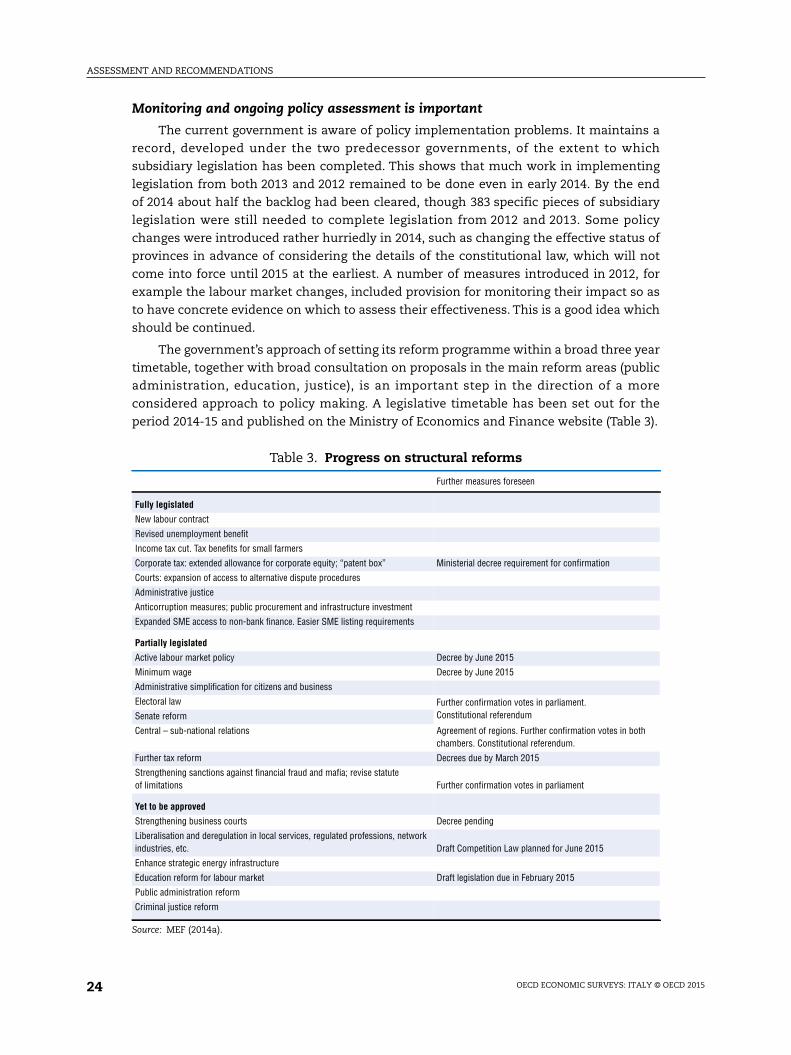
considered approach to policy making. A legislative timetable has been set out for the
period 2014-15 and published on the Ministry of Economics and Finance website (Table 3).
Table 3. Progress on structural reforms
Further measures foreseen
Fully legislated
New labour contract
Revised unemployment benefit
Income tax cut. Tax benefits for small farmers
Corporate tax: extended allowance for corporate equity; “patent box” Ministerial decree requirement for confirmation
Courts: expansion of access to alternative dispute procedures
Administrative justice
Anticorruption measures; public procurement and infrastructure investment
Expanded SME access to non-bank finance. Easier SME listing requirements
Partially legislated
Active labour market policy Decree by June 2015
Minimum wage Decree by June 2015
Administrative simplification for citizens and business
Electoral law Further confirmation votes in parliament.Constitutional referendumSenate reform
Central – sub-national relations Agreement of regions. Further confirmation votes in bothchambers. Constitutional referendum.
Further tax reform Decrees due by March 2015
Strengthening sanctions against financial fraud and mafia; revise statuteof limitations Further confirmation votes in parliament
Yet to be approved
Strengthening business courts Decree pending
Liberalisation and deregulation in local services, regulated professions, networkindustries, etc. Draft Competition Law planned for June 2015
Enhance strategic energy infrastructure
Education reform for labour market Draft legislation due in February 2015
Public administration reform
Criminal justice reform
Source: MEF (2014a).
OECD ECONOMIC SURVEYS: ITALY © OECD 201524
ASSESSMENT AND RECOMMENDATIONS
Policies to improve productivity can cover a wide range of policy areas, in many
different ministries, each with their own specific mandates. Generating comprehensive
reform programmes across disparate ministries can be difficult. Some countries have
found it useful to have an independent permanent productivity commission to investigate
and advise on what structural reforms are needed and to advocate reform. Australia has
had an effective commission for a long time. New Zealand and Mexico recently introduced
similar bodies, while Norway instituted a commission with a two-year mandate. Early
signs suggest that they are working well. In Mexico, success has led to moves to integrate
the commission more systematically into the legislative process, including a requirement
that the government publically respond to its policy recommendations. Productivity
commissions have been found to play a useful role in the public debate when they provide
advice that is independent from political considerations and based on sound research,
which both enhance credibility (Banks, 2011). Such a commission, with a mandate to
provide advice to the government on matters related to productivity, to promote public
understanding of reforms, and to engage in a dialogue with stakeholders, would be useful
in Italy. Its recommendations would be able to take account of analysis by international
institutions but could be better tailored to specific country characteristics.
A more efficient judicial system and efforts to tackle corruption
Important steps have been taken to improve efficiency in the judicial system. Measures
to gain economies of scope and scale through amalgamation of small courts, thus allowing
some specialisation by judges as recommended in previous OECD work (OECD, 2013a;
Palumbo et al., 2013), are being implemented, for example in labour law. The planned
establishment of specialised business courts should be swiftly implemented. Another OECD
recommendation, to modify the application of the statute of limitations to reduce the
incentive to prevarication, has also been implemented. Other steps, including consideration
of measures to limit the very high rate of appeal, could further improve efficiency.
Reducing corruption and improving trust in Italy must also remain a priority (OECD,
2013d). The new anti-corruption agency ANAC needs stability and continuity as well as
support at all political levels if it is to effectively monitor the public administration and
providers of public services and infrastructure. Following revelation of major waste of
public funds, at least partly due to corruption, in important public infrastructure projects,
the national agency formerly responsible for overseeing public works projects (AVCP) was
absorbed into ANAC. The government’s view was that the task of ensuring value for money
and preventing corruption can be mutually reinforcing given that much corruption in
public administration affects public procurement. In the longer run, it might be efficient to
have a separate agency like AVCP to concentrate on value for money, while ANAC focuses
on ensuring that measures to avoid corruption are in place. Until recently, ANAC, unlike
other “authorities” in Italy such as the competition authority, has been essentially a
monitoring and reporting institution, focusing mainly on anti-corruption and transparency
procedures and practices in public agencies rather than specific instances of corruption. It
has now been given some additional powers, however. ANAC can submit files for court
proceedings to the judicial authorities and can also request that the local Prefect put firms,
or parts of firms, suspected of being involved in corrupt behaviour with regard to public
procurement into compulsory administration.
OECD ECONOMIC SURVEYS: ITALY © OECD 2015 25
ASSESSMENT AND RECOMMENDATIONS
Labour market and competition reforms to improve productivityand well-being
If successful, the reform programme could make Italy a place where families can live
better lives. While life is already enjoyable for many, especially in terms of work-life
balance, some dimensions of well-being rank low relative to other OECD countries (see
Figure 1). Some of these, such as low scores on education and skills, civic engagement and
governance, contribute to the economy’s poor performance. Large gender gaps between
men and women in terms of well-being, labour-market participation and wages deprive
the country of an important source of dynamism.
Inefficient labour market institutions contribute to low labour utilisation. The crisis
aggravated weaknesses in the labour market: low participation, high structural
unemployment and increasing duality. The unemployment rate has been between 12% and
13% since mid-2013 with large regional disparities: it is as high as 20% in the south. High
structural unemployment and low participation rates leave many people out of
employment. The proportion of young people neither in education nor employment (NEET)
has risen by over 6 percentage points since the onset of the crisis, reaching nearly 23% by
the end of 2013, the second highest share in the OECD. Stringent laws and weak
employment prospects also encourage developments in the underground economy: the
Italian National Statistical Institute, Istat, estimates the number of workers in the
underground economy is equivalent to 12% of total employment.
Protecting individuals rather than specific jobs
Current legislation provides very strong protection for employees in larger firms (over
15 employees) with indefinite employment contracts, accounting for about 50% of total
employment, with less protection for those in small companies and very little security for
the rest. Under the existing legislation, dismissed workers can file a case in court claiming
Recommendations to boost efficiency through institutional reform
Key recommendations
● Follow through the reforms of parliament and the re-assignment and clarification ofpolicy competences between the centre and sub-national government.
● Ensure that legislation is clear, unambiguous and supported by improved publicadministration, including through reduced use of emergency decrees.
● Further streamline the court system, with more specialisation where appropriate;increase the use of mediation; enhance monitoring of court performance.
● Consider establishing a Productivity Commission with the mandate to provide advice tothe government on matters related to productivity, promote public understanding ofreforms, and engage in a dialogue with stakeholders.
● Reducing corruption and improving trust must remain a priority. For this, the new anti-corruption agency ANAC needs stability, continuity as well as support at all politicallevels.
Other recommendations
● Support active and independent action by the anti-corruption agency, complementingthe pursuit of increased efficiency in the judicial system.
OECD ECONOMIC SURVEYS: ITALY © OECD 201526
ASSESSMENT AND RECOMMENDATIONS
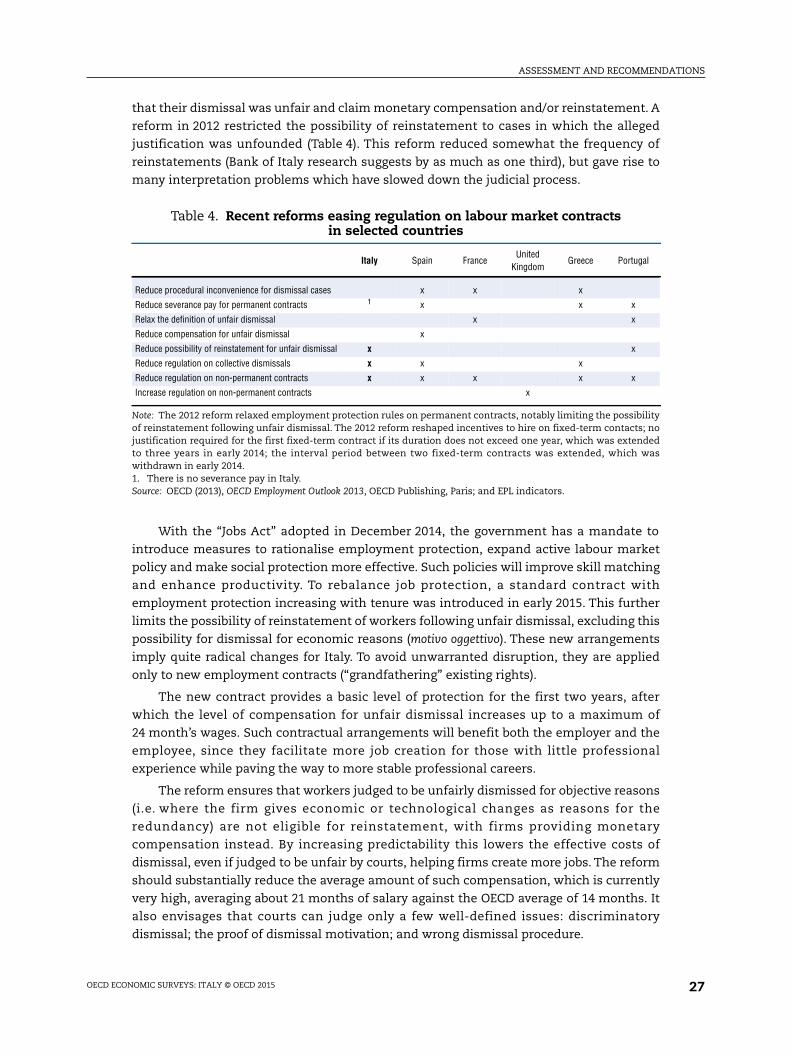
that their dismissal was unfair and claim monetary compensation and/or reinstatement. A
reform in 2012 restricted the possibility of reinstatement to cases in which the alleged
justification was unfounded (Table 4). This reform reduced somewhat the frequency of
reinstatements (Bank of Italy research suggests by as much as one third), but gave rise to
many interpretation problems which have slowed down the judicial process.
With the “Jobs Act” adopted in December 2014, the government has a mandate to
introduce measures to rationalise employment protection, expand active labour market
policy and make social protection more effective. Such policies will improve skill matching
and enhance productivity. To rebalance job protection, a standard contract with
employment protection increasing with tenure was introduced in early 2015. This further
limits the possibility of reinstatement of workers following unfair dismissal, excluding this
possibility for dismissal for economic reasons (motivo oggettivo). These new arrangements
imply quite radical changes for Italy. To avoid unwarranted disruption, they are applied
only to new employment contracts (“grandfathering” existing rights).
The new contract provides a basic level of protection for the first two years, after
which the level of compensation for unfair dismissal increases up to a maximum of
24 month’s wages. Such contractual arrangements will benefit both the employer and the
employee, since they facilitate more job creation for those with little professional
experience while paving the way to more stable professional careers.
The reform ensures that workers judged to be unfairly dismissed for objective reasons
(i.e. where the firm gives economic or technological changes as reasons for the
redundancy) are not eligible for reinstatement, with firms providing monetary
compensation instead. By increasing predictability this lowers the effective costs of
dismissal, even if judged to be unfair by courts, helping firms create more jobs. The reform
should substantially reduce the average amount of such compensation, which is currently
very high, averaging about 21 months of salary against the OECD average of 14 months. It
also envisages that courts can judge only a few well-defined issues: discriminatory
dismissal; the proof of dismissal motivation; and wrong dismissal procedure.
Table 4. Recent reforms easing regulation on labour market contractsin selected countries
Italy Spain FranceUnited
KingdomGreece Portugal
Reduce procedural inconvenience for dismissal cases x x x
Reduce severance pay for permanent contracts 1 x x x
Relax the definition of unfair dismissal x x
Reduce compensation for unfair dismissal x
Reduce possibility of reinstatement for unfair dismissal x x
Reduce regulation on collective dismissals x x x
Reduce regulation on non-permanent contracts x x x x x
Increase regulation on non-permanent contracts x
Note: The 2012 reform relaxed employment protection rules on permanent contracts, notably limiting the possibilityof reinstatement following unfair dismissal. The 2012 reform reshaped incentives to hire on fixed-term contacts; nojustification required for the first fixed-term contract if its duration does not exceed one year, which was extendedto three years in early 2014; the interval period between two fixed-term contracts was extended, which waswithdrawn in early 2014.1. There is no severance pay in Italy.Source: OECD (2013), OECD Employment Outlook 2013, OECD Publishing, Paris; and EPL indicators.
OECD ECONOMIC SURVEYS: ITALY © OECD 2015 27
ASSESSMENT AND RECOMMENDATIONS
The Jobs Act also introduces a new form of out-of-court procedure, according to which
the employer can pay the worker an indemnity equal to 1 monthly wage per year of service
(a minimum amount equivalent to 2 monthly wages and a maximum amount equivalent
to 18 monthly wages). This compensation could be considered as similar in some respects
to severance pay. The acceptance of this transaction prevents any further dispute by the
worker, that is, appealing to courts for a dismissal to be unfair or not. Both parties have a
strong incentive to settle the dispute through this procedure, since the sum paid is not
subject to social contributions or taxation. The government should monitor the
developments on this new procedure and, if necessary, it should consider alternative
measures to reduce uncertainty on court decision.
All of these reforms, if fully rolled-out, will go a long way towards making Italy’s labour
market institutions more efficient, thus improving the allocation of labour resources and
increasing productivity. They will reduce legal risk and financial costs associated with
dismissal provisions, which have been identified as the most burdensome and affecting job
creation (OECD, 2013b). Less frequent recourse to the courts and more rapid court decisions
will reduce the difficulties faced by employers, thus encouraging more job creation.
Altogether, this will improve turnover on the labour market, resulting in better skill
matching and, therefore, greater ability of firms to adapt the skill profile of their workforce
to their changing environment.
Increasing job-matching efficiency and workers’ skills
The government identifies active labour market policy (ALMP) as a priority. The EU
Youth Guarantee scheme has been in force since mid-2014. The Youth Guarantee
programme targets those who are 15-29 years old within four months after leaving school
or being laid off. This programme offers a range of activities which facilitate school to work
transition for young people, including guidance, training, apprenticeship or traineeship
places, and incentives for firms to hire young people.
The Jobs Act further strengthens ALMPs and creates a National Employment Agency.
The Agency will be responsible for co-ordinating ALMP policy, currently the responsibility of
local governments, including co-ordination with social benefit providers. OECD studies show
that different people need different kinds of measures and that profiling their needs can help
to determine who is job-ready and who should receive more comprehensive help (OECD,
2013b; Jin et al., 2015). For example, most displaced workers find jobs needing similar skills
to their previous employment; in such cases, measures facilitating job matching such as
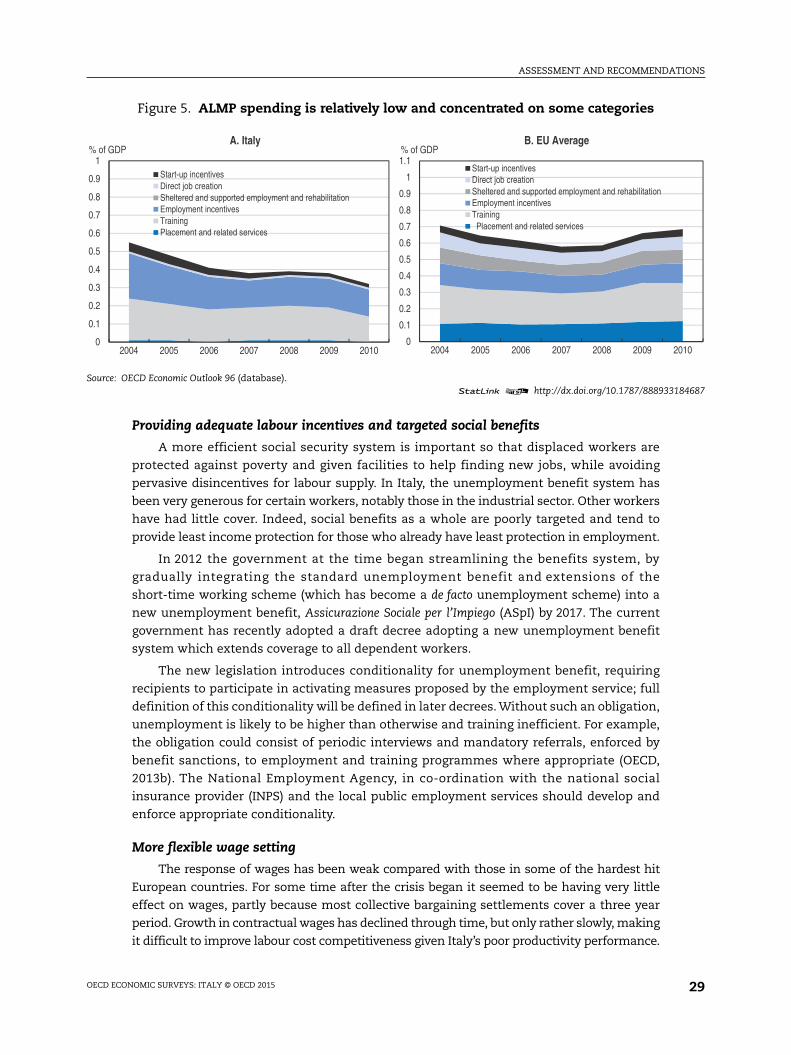
career orientation and placement services are important. Currently ALMP spending is
concentrated on job training (Figure 5). Employment training is expensive and should be
targeted at specific groups such as the long-term unemployed and low educated people,
provided they show that they are motivated to seek work (OECD, 2013b).
Labour market policy improving workers’ existing skills and matching them with
available jobs needs to be supported by an education system that provides initial
knowledge and skills needed in the labour market. Both PISA (Programme for International
Student Assessment) data on school student performance and new PIAAC (Programme for
the International Assessment of Adult Competencies) data on adult skills show that Italy
lags many countries in this regard. Education policy has been constrained by funding cuts,
but needs to continue its effort to improve its performance, including the development of
post-secondary technical schools and improving vocational schools, in co-ordination with
industry’s needs.
OECD ECONOMIC SURVEYS: ITALY © OECD 201528
ASSESSMENT AND RECOMMENDATIONS
184687
2010
Providing adequate labour incentives and targeted social benefits
A more efficient social security system is important so that displaced workers are
protected against poverty and given facilities to help finding new jobs, while avoiding
pervasive disincentives for labour supply. In Italy, the unemployment benefit system has
been very generous for certain workers, notably those in the industrial sector. Other workers
have had little cover. Indeed, social benefits as a whole are poorly targeted and tend to
provide least income protection for those who already have least protection in employment.
In 2012 the government at the time began streamlining the benefits system, by
gradually integrating the standard unemployment benefit and extensions of the
short-time working scheme (which has become a de facto unemployment scheme) into a
new unemployment benefit, Assicurazione Sociale per l’Impiego (ASpI) by 2017. The current
government has recently adopted a draft decree adopting a new unemployment benefit
system which extends coverage to all dependent workers.
The new legislation introduces conditionality for unemployment benefit, requiring
recipients to participate in activating measures proposed by the employment service; full
definition of this conditionality will be defined in later decrees. Without such an obligation,
unemployment is likely to be higher than otherwise and training inefficient. For example,
the obligation could consist of periodic interviews and mandatory referrals, enforced by
benefit sanctions, to employment and training programmes where appropriate (OECD,
2013b). The National Employment Agency, in co-ordination with the national social
insurance provider (INPS) and the local public employment services should develop and
enforce appropriate conditionality.
More flexible wage setting
The response of wages has been weak compared with those in some of the hardest hit
European countries. For some time after the crisis began it seemed to be having very little
effect on wages, partly because most collective bargaining settlements cover a three year
period. Growth in contractual wages has declined through time, but only rather slowly, making
it difficult to improve labour cost competitiveness given Italy’s poor productivity performance.
Figure 5. ALMP spending is relatively low and concentrated on some categories
Source: OECD Economic Outlook 96 (database).1 2 http://dx.doi.org/10.1787/888933
0
0.1
0.2
0.3
0.4
0.5
0.6
0.7
0.8
0.9
1
2004 2005 2006 2007 2008 2009 2010
% of GDPA. Italy
Start-up incentivesDirect job creationSheltered and supported employment and rehabilitationEmployment incentivesTrainingPlacement and related services
0
0.1
0.2
0.3
0.4
0.5
0.6
0.7
0.8
0.9
1
1.1
2004 2005 2006 2007 2008 2009
% of GDPB. EU Average
Start-up incentivesDirect job creationSheltered and supported employment and rehabilitationEmployment incentivesTraining Placement and related services
OECD ECONOMIC SURVEYS: ITALY © OECD 2015 29
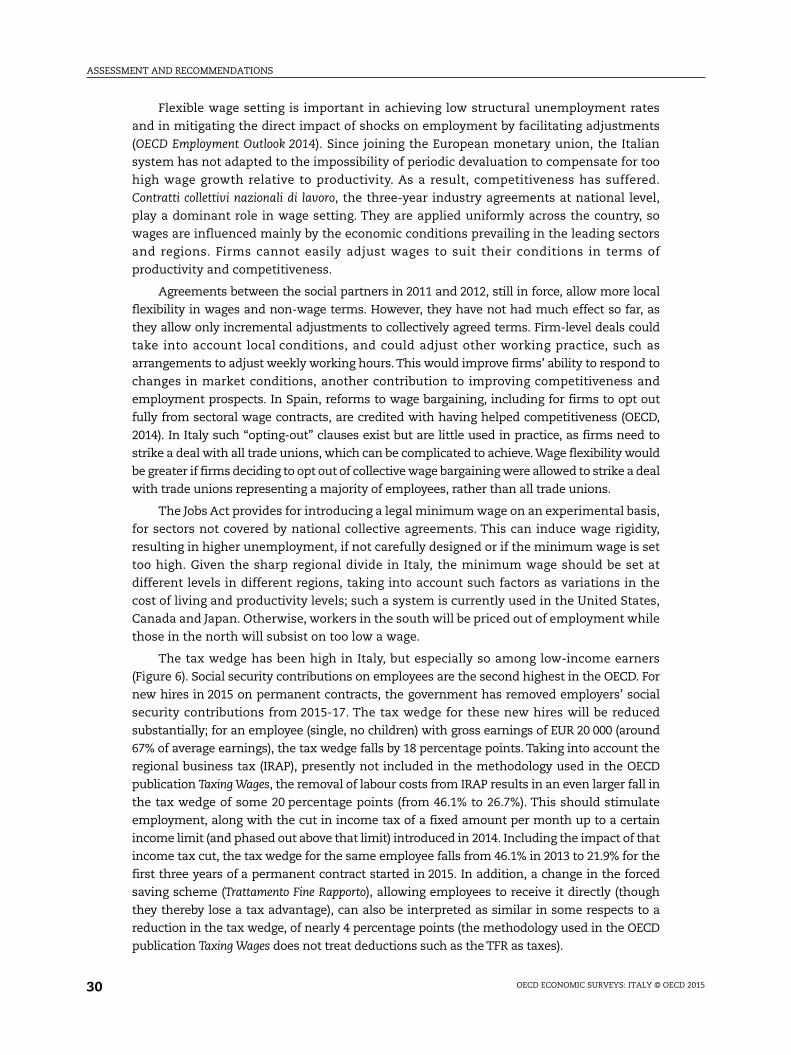
ASSESSMENT AND RECOMMENDATIONS
Flexible wage setting is important in achieving low structural unemployment rates
and in mitigating the direct impact of shocks on employment by facilitating adjustments
(OECD Employment Outlook 2014). Since joining the European monetary union, the Italian
system has not adapted to the impossibility of periodic devaluation to compensate for too
high wage growth relative to productivity. As a result, competitiveness has suffered.
Contratti collettivi nazionali di lavoro, the three-year industry agreements at national level,
play a dominant role in wage setting. They are applied uniformly across the country, so
wages are influenced mainly by the economic conditions prevailing in the leading sectors
and regions. Firms cannot easily adjust wages to suit their conditions in terms of
productivity and competitiveness.
Agreements between the social partners in 2011 and 2012, still in force, allow more local
flexibility in wages and non-wage terms. However, they have not had much effect so far, as
they allow only incremental adjustments to collectively agreed terms. Firm-level deals could
take into account local conditions, and could adjust other working practice, such as
arrangements to adjust weekly working hours. This would improve firms’ ability to respond to
changes in market conditions, another contribution to improving competitiveness and
employment prospects. In Spain, reforms to wage bargaining, including for firms to opt out
fully from sectoral wage contracts, are credited with having helped competitiveness (OECD,
2014). In Italy such “opting-out” clauses exist but are little used in practice, as firms need to
strike a deal with all trade unions, which can be complicated to achieve. Wage flexibility would
be greater if firms deciding to opt out of collective wage bargaining were allowed to strike a deal
with trade unions representing a majority of employees, rather than all trade unions.
The Jobs Act provides for introducing a legal minimum wage on an experimental basis,
for sectors not covered by national collective agreements. This can induce wage rigidity,
resulting in higher unemployment, if not carefully designed or if the minimum wage is set
too high. Given the sharp regional divide in Italy, the minimum wage should be set at
different levels in different regions, taking into account such factors as variations in the
cost of living and productivity levels; such a system is currently used in the United States,
Canada and Japan. Otherwise, workers in the south will be priced out of employment while
those in the north will subsist on too low a wage.
The tax wedge has been high in Italy, but especially so among low-income earners
(Figure 6). Social security contributions on employees are the second highest in the OECD. For
new hires in 2015 on permanent contracts, the government has removed employers’ social
security contributions from 2015-17. The tax wedge for these new hires will be reduced
substantially; for an employee (single, no children) with gross earnings of EUR 20 000 (around
67% of average earnings), the tax wedge falls by 18 percentage points. Taking into account the
regional business tax (IRAP), presently not included in the methodology used in the OECD
publication Taxing Wages, the removal of labour costs from IRAP results in an even larger fall in
the tax wedge of some 20 percentage points (from 46.1% to 26.7%). This should stimulate
employment, along with the cut in income tax of a fixed amount per month up to a certain
income limit (and phased out above that limit) introduced in 2014. Including the impact of that
income tax cut, the tax wedge for the same employee falls from 46.1% in 2013 to 21.9% for the
first three years of a permanent contract started in 2015. In addition, a change in the forced
saving scheme (Trattamento Fine Rapporto), allowing employees to receive it directly (though
they thereby lose a tax advantage), can also be interpreted as similar in some respects to a
reduction in the tax wedge, of nearly 4 percentage points (the methodology used in the OECD
publication Taxing Wages does not treat deductions such as the TFR as taxes).
OECD ECONOMIC SURVEYS: ITALY © OECD 201530
ASSESSMENT AND RECOMMENDATIONS
184695
New
Zea
land
Encouraging participation
Italy has very low labour force participation. This is especially true among women and
in the south. To some extent, the large informal sector may make up for this, but by no
means entirely. In the past, the pension system imposed a high implicit tax on continuing
work, explaining low participation among older age groups. With the acceleration of the
phasing-in of the reformed system and rises in the retirement age, participation among
older age groups has begun to rise noticeably. Participation by 55-64 year olds rose
from 46% in 2008 to 57% in 2013 and has begun to catch up with that in other countries,
though still remains below most. The pensionable age is now set to rise in line with life
expectancy, so further increases in participation can be expected.
The female labour force participation rate is among the lowest in the OECD: 54.4%
against the OECD average of 62.6% in 2013. This is strongly influenced by social norms,
including responsibility for caring for children or older family members. Availability of
child care facilities is very limited in Italy. Only 24% of Italian children up to three years old
are enrolled in formal childcare, against the OECD average of 33%, and some 8% of women
withdraw from the labour market for family care reasons. The birth rate is very low, so
child care provision might have less impact on female employment than elsewhere, but the
traditional female role as carer for elderly parents is probably just as important. The
government intends to support female labour force participation by increasing child care
facilities and introducing a tax credit for low- and medium-income families with children.
Liberalising services and improving competition
In addition to reform specifically targeted at the labour market, policies in product
markets can also boost job creation, if well-designed. This concerns particularly markets
that remain closed to entry, preventing new firms from bringing new competition and
raising activity. Previous OECD Economic Surveys and Reviews of Regulatory Reform have made
recommendations on liberalising services and improving competition. Reforms launched
in 2012 made progress in a number of areas, including some liberalisation of the regulated
professions (such as lawyers, accountants, architects, pharmacists, etc.), and better
Figure 6. The tax wedge for low-income workers is high
Source: OECD, Taxing Wages, OECD Tax and Wages Model.1 2 http://dx.doi.org/10.1787/888933
0
10
20
30
40
50
60
Belg
ium
Fran
ce
Ger
man
y
Italy
Aust
ria
Swed
en
Finl
and
Spai
n
Gre
ece
Den
mar
k
Portu
gal
Nor
way
Net
herla
nds
Japa
n
Luxe
mbo
urg
Uni
ted
Stat
es
Icel
and
Uni
ted
King
dom
Can
ada
Aust
ralia
Irela
nd
Switz
erla
nd
% of gross wage earnings Single person, at 67% of average earnings
Average tax wedge Average rate of employer's ssc
OECD ECONOMIC SURVEYS: ITALY © OECD 2015 31
ASSESSMENT AND RECOMMENDATIONS
regulation of water and transport. It remains particularly important to promote more
effective competition, especially in network industries, local services, regulated
professions and the retail sector. There are still barriers to entry that need to be reduced or
eliminated; failure to do this in the area of taxi and legal services illustrates the political
difficulties involved.
Local public services (such as public transport, water treatment and supply, waste
management) are in many areas dominated by monopolies assigned to companies either
owned directly by, or closely related to, local government. Public tenders are normally
required but seem to be frequently manipulated and can be dispensed with under some
conditions. Local authorities have to publish on their websites reports on the tendering of
local services and justify the choice on a specific method of contract award. In addition,
they have to send this report to the observatory of local public services at the Ministry of
Economic Development. Since 2012, the competition authority has had powers to question
some actions by local authorities; and there are new transparency measures for local
public expenditure that should make it clearer how public money is being spent. New
regulators have been set up, in line with earlier recommendations, for water and transport.
They must now be assured of the opportunity and resources to carry out their mandate
independently. These measures should be made to work together to improve value for
money through a combination of increased competition in the market. Where there are
natural monopolies, competition “for the market” can be employed through competitive
tendering for the right to run services for a certain number of years. In some cases,
privatisation of existing public entities may be an essential step towards increasing
competition. The 2015 budget law allows revenue from such privatisation to be excluded
from the provisions of the internal stability pact.
At the national level, high energy prices have been a cost disadvantage for Italian
companies. Italy has few indigenous low-cost energy sources other than significant
hydro-electric power in the north, so somewhat higher prices than neighbours can be
expected. However, high prices have also reflected inadequate infrastructure links with the
rest of Europe, though connections have improved in recent years. The gas market shows
how deregulation and links with the European market can bring down costs. Until 2012
spot wholesale prices for gas could be 20% or more higher than other European countries
(GME, 2014). This gap has now completely closed following liberalisation of the spot market
and ownership unbundling, an illustration of how some measures can have rapid effects
(Figure 7). Electricity prices remain well above other countries, however, although some
liberalisation has occurred. This is partly due to raw material costs and the impact of the
dash for renewables, but better transmission infrastructure, further liberalisation and
effective regulation would reduce the gap, as in the case of gas.
In addition to reforms to increase productivity and output, important reforms are
needed to reduce losses to living standards through pollution and other environmental
damage. The recent OECD Environmental Performance Review has many recommendations
in this area, which could both improve environmental outcomes and reduce the associated
costs (OECD, 2013c). These include streamlining energy efficiency incentive measures and
ensuring that multiple incentives do not entail excessive costs. The use of price-based
mechanisms should be extended, such as pollution and congestion charges, to reduce
emissions from vehicle use in urban areas, and vehicle taxation should be restructured to
include components reflecting CO2 emissions and other environmental externalities.
OECD ECONOMIC SURVEYS: ITALY © OECD 201532
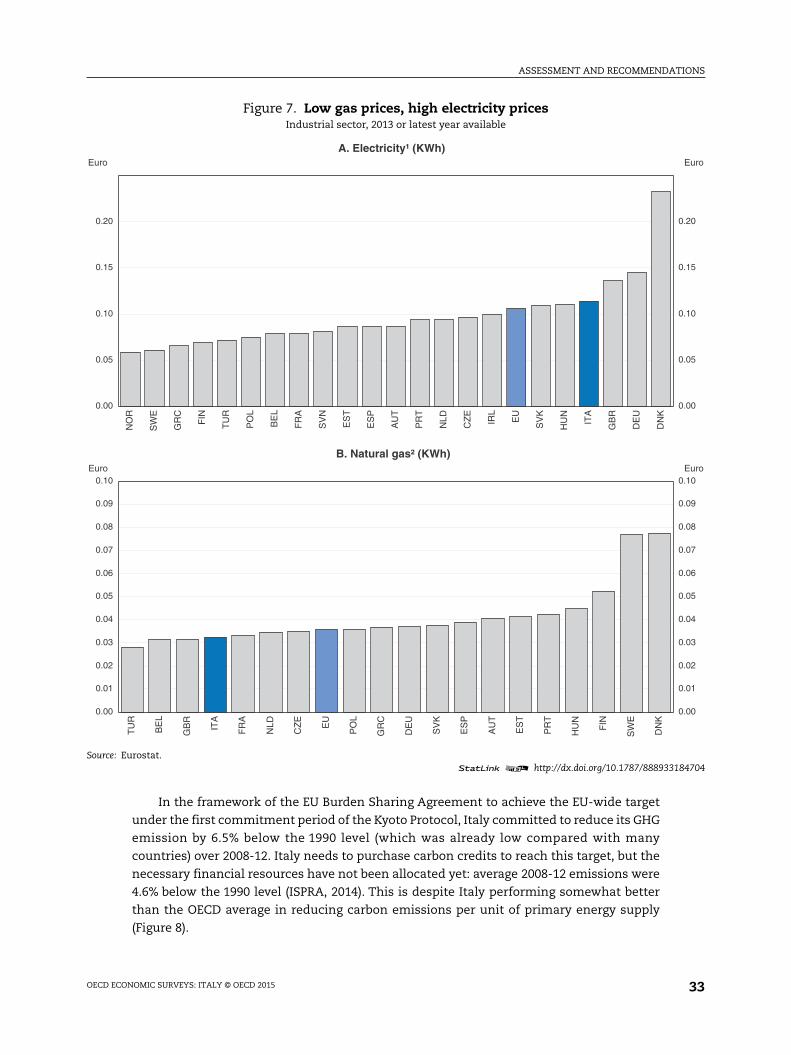
ASSESSMENT AND RECOMMENDATIONS
184704
0.00
0.05
0.10
0.15
0.20
Euro
0.00
0.01
0.02
0.03
0.04
0.05
0.06
0.07
0.08
0.09
0.10Euro
In the framework of the EU Burden Sharing Agreement to achieve the EU-wide target
under the first commitment period of the Kyoto Protocol, Italy committed to reduce its GHG
emission by 6.5% below the 1990 level (which was already low compared with many
countries) over 2008-12. Italy needs to purchase carbon credits to reach this target, but the
necessary financial resources have not been allocated yet: average 2008-12 emissions were
4.6% below the 1990 level (ISPRA, 2014). This is despite Italy performing somewhat better
than the OECD average in reducing carbon emissions per unit of primary energy supply
(Figure 8).
Figure 7. Low gas prices, high electricity pricesIndustrial sector, 2013 or latest year available
Source: Eurostat.1 2 http://dx.doi.org/10.1787/888933
0.00
0.05
0.10
0.15
0.20
Euro
NO
R
SW
E
GR
C
FIN
TU
R
PO
L
BE
L
FR
A
SV
N
ES
T
ES
P
AU
T
PR
T
NLD
CZ
E
IRL
EU
SV
K
HU
N
ITA
GB
R
DE
U
DN
K
A. Electricity¹ (KWh)
0.00
0.01
0.02
0.03
0.04
0.05
0.06
0.07
0.08
0.09
0.10Euro
TU
R
BE
L
GB
R
ITA
FR
A
NLD
CZ
E
EU
PO
L
GR
C
DE
U
SV
K
ES
P
AU
T
ES
T
PR
T
HU
N
FIN
SW
E
DN
K
B. Natural gas² (KWh)
OECD ECONOMIC SURVEYS: ITALY © OECD 2015 33
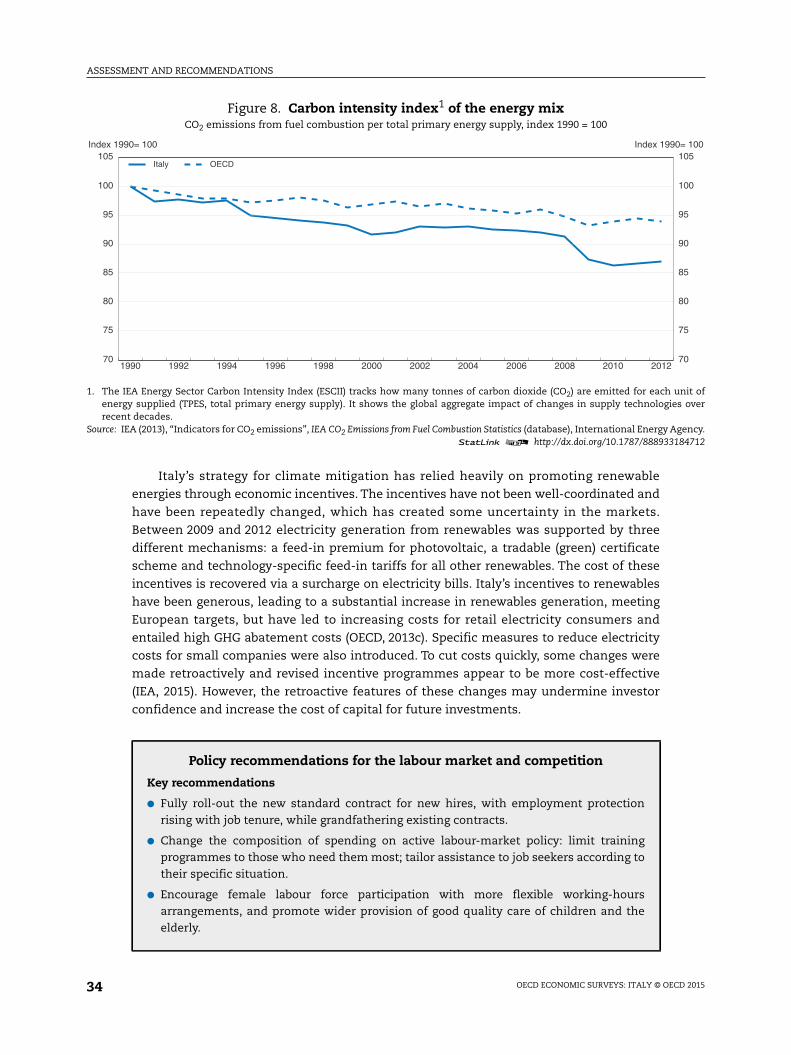
ASSESSMENT AND RECOMMENDATIONS
unit ofes over
gency.184712
70
75
80
85
90
95
100
1050= 100
Italy’s strategy for climate mitigation has relied heavily on promoting renewable
energies through economic incentives. The incentives have not been well-coordinated and
have been repeatedly changed, which has created some uncertainty in the markets.
Between 2009 and 2012 electricity generation from renewables was supported by three
different mechanisms: a feed-in premium for photovoltaic, a tradable (green) certificate
scheme and technology-specific feed-in tariffs for all other renewables. The cost of these
incentives is recovered via a surcharge on electricity bills. Italy’s incentives to renewables
have been generous, leading to a substantial increase in renewables generation, meeting
European targets, but have led to increasing costs for retail electricity consumers and
entailed high GHG abatement costs (OECD, 2013c). Specific measures to reduce electricity
costs for small companies were also introduced. To cut costs quickly, some changes were
made retroactively and revised incentive programmes appear to be more cost-effective
(IEA, 2015). However, the retroactive features of these changes may undermine investor
confidence and increase the cost of capital for future investments.
Figure 8. Carbon intensity index1 of the energy mixCO2 emissions from fuel combustion per total primary energy supply, index 1990 = 100
1. The IEA Energy Sector Carbon Intensity Index (ESCII) tracks how many tonnes of carbon dioxide (CO2) are emitted for eachenergy supplied (TPES, total primary energy supply). It shows the global aggregate impact of changes in supply technologirecent decades.
Source: IEA (2013), “Indicators for CO2 emissions”, IEA CO2 Emissions from Fuel Combustion Statistics (database), International Energy A1 2 http://dx.doi.org/10.1787/888933
1990 1992 1994 1996 1998 2000 2002 2004 2006 2008 2010 201270
75
80
85
90
95
100
105Index 1990= 100
Index 199
Italy OECD
Policy recommendations for the labour market and competition
Key recommendations
● Fully roll-out the new standard contract for new hires, with employment protectionrising with job tenure, while grandfathering existing contracts.
● Change the composition of spending on active labour-market policy: limit trainingprogrammes to those who need them most; tailor assistance to job seekers according totheir specific situation.
● Encourage female labour force participation with more flexible working-hoursarrangements, and promote wider provision of good quality care of children and theelderly.
OECD ECONOMIC SURVEYS: ITALY © OECD 201534
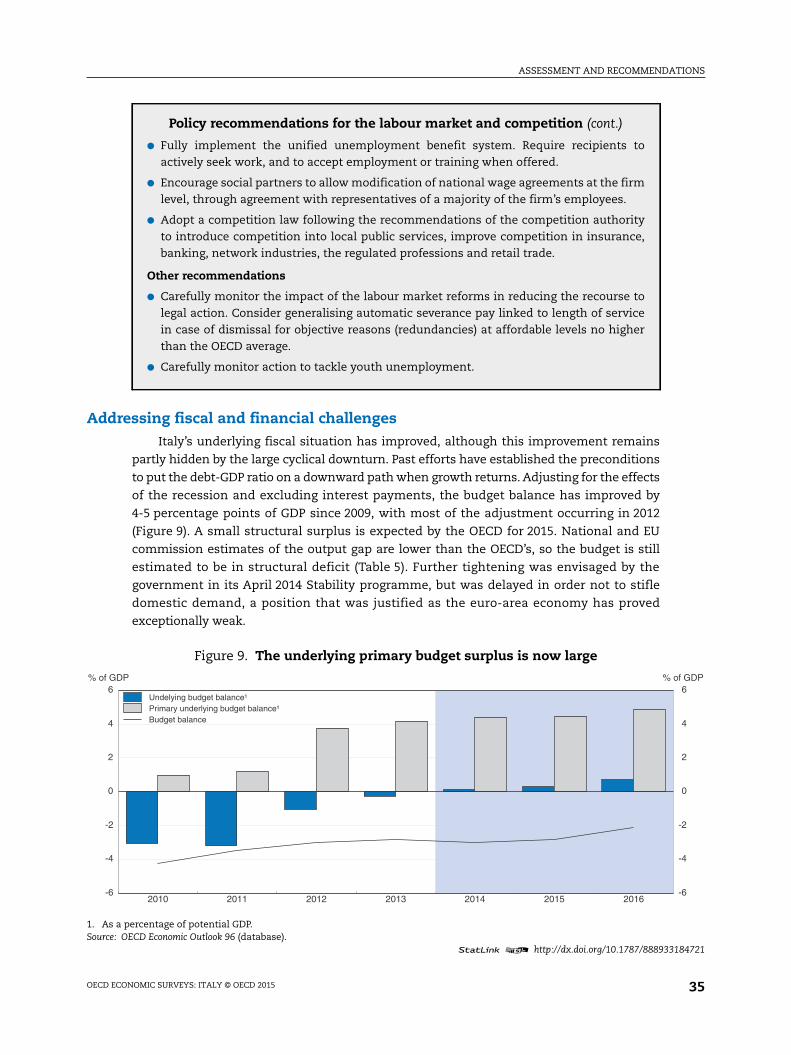
ASSESSMENT AND RECOMMENDATIONS
184721
-6
-4
-2
0
2
4
6of GDP
Addressing fiscal and financial challengesItaly’s underlying fiscal situation has improved, although this improvement remains
partly hidden by the large cyclical downturn. Past efforts have established the preconditions
to put the debt-GDP ratio on a downward path when growth returns. Adjusting for the effects
of the recession and excluding interest payments, the budget balance has improved by
4-5 percentage points of GDP since 2009, with most of the adjustment occurring in 2012
(Figure 9). A small structural surplus is expected by the OECD for 2015. National and EU
commission estimates of the output gap are lower than the OECD’s, so the budget is still
estimated to be in structural deficit (Table 5). Further tightening was envisaged by the
government in its April 2014 Stability programme, but was delayed in order not to stifle
domestic demand, a position that was justified as the euro-area economy has proved
exceptionally weak.
Policy recommendations for the labour market and competition (cont.)
● Fully implement the unified unemployment benefit system. Require recipients toactively seek work, and to accept employment or training when offered.
● Encourage social partners to allow modification of national wage agreements at the firmlevel, through agreement with representatives of a majority of the firm’s employees.
● Adopt a competition law following the recommendations of the competition authorityto introduce competition into local public services, improve competition in insurance,banking, network industries, the regulated professions and retail trade.
Other recommendations
● Carefully monitor the impact of the labour market reforms in reducing the recourse tolegal action. Consider generalising automatic severance pay linked to length of servicein case of dismissal for objective reasons (redundancies) at affordable levels no higherthan the OECD average.
● Carefully monitor action to tackle youth unemployment.
Figure 9. The underlying primary budget surplus is now large
1. As a percentage of potential GDP.Source: OECD Economic Outlook 96 (database).
1 2 http://dx.doi.org/10.1787/888933
2010 2011 2012 2013 2014 2015 2016-6
-4
-2
0
2
4
6% of GDP %
Undelying budget balance¹Primary underlying budget balance¹Budget balance
OECD ECONOMIC SURVEYS: ITALY © OECD 2015 35
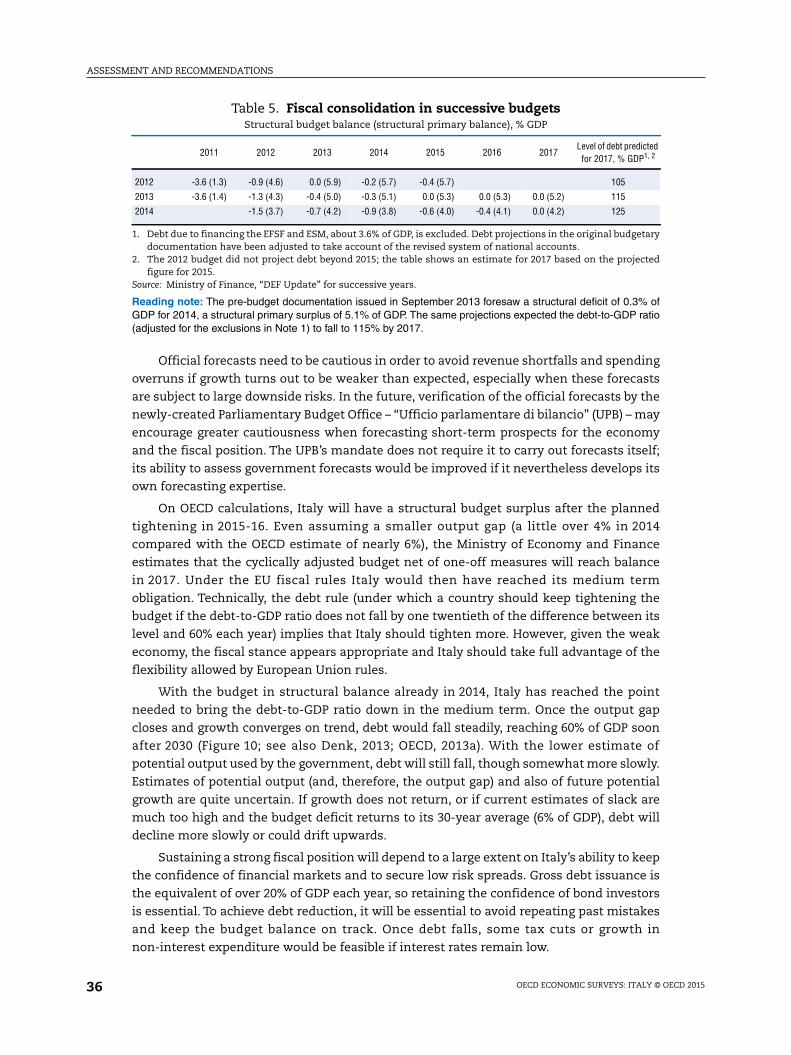
ASSESSMENT AND RECOMMENDATIONS
Official forecasts need to be cautious in order to avoid revenue shortfalls and spending
overruns if growth turns out to be weaker than expected, especially when these forecasts
are subject to large downside risks. In the future, verification of the official forecasts by the
newly-created Parliamentary Budget Office – “Ufficio parlamentare di bilancio” (UPB) – may
encourage greater cautiousness when forecasting short-term prospects for the economy
and the fiscal position. The UPB’s mandate does not require it to carry out forecasts itself;
its ability to assess government forecasts would be improved if it nevertheless develops its
own forecasting expertise.
On OECD calculations, Italy will have a structural budget surplus after the planned
tightening in 2015-16. Even assuming a smaller output gap (a little over 4% in 2014
compared with the OECD estimate of nearly 6%), the Ministry of Economy and Finance
estimates that the cyclically adjusted budget net of one-off measures will reach balance
in 2017. Under the EU fiscal rules Italy would then have reached its medium term
obligation. Technically, the debt rule (under which a country should keep tightening the
budget if the debt-to-GDP ratio does not fall by one twentieth of the difference between its
level and 60% each year) implies that Italy should tighten more. However, given the weak
economy, the fiscal stance appears appropriate and Italy should take full advantage of the
flexibility allowed by European Union rules.
With the budget in structural balance already in 2014, Italy has reached the point
needed to bring the debt-to-GDP ratio down in the medium term. Once the output gap
closes and growth converges on trend, debt would fall steadily, reaching 60% of GDP soon
after 2030 (Figure 10; see also Denk, 2013; OECD, 2013a). With the lower estimate of
potential output used by the government, debt will still fall, though somewhat more slowly.
Estimates of potential output (and, therefore, the output gap) and also of future potential
growth are quite uncertain. If growth does not return, or if current estimates of slack are
much too high and the budget deficit returns to its 30-year average (6% of GDP), debt will
decline more slowly or could drift upwards.
Sustaining a strong fiscal position will depend to a large extent on Italy’s ability to keep
the confidence of financial markets and to secure low risk spreads. Gross debt issuance is
the equivalent of over 20% of GDP each year, so retaining the confidence of bond investors
is essential. To achieve debt reduction, it will be essential to avoid repeating past mistakes
and keep the budget balance on track. Once debt falls, some tax cuts or growth in
non-interest expenditure would be feasible if interest rates remain low.
Table 5. Fiscal consolidation in successive budgetsStructural budget balance (structural primary balance), % GDP
2011 2012 2013 2014 2015 2016 2017Level of debt predictedfor 2017, % GDP1, 2
2012 -3.6 (1.3) -0.9 (4.6) 0.0 (5.9) -0.2 (5.7) -0.4 (5.7) 105
2013 -3.6 (1.4) -1.3 (4.3) -0.4 (5.0) -0.3 (5.1) 0.0 (5.3) 0.0 (5.3) 0.0 (5.2) 115
2014 -1.5 (3.7) -0.7 (4.2) -0.9 (3.8) -0.6 (4.0) -0.4 (4.1) 0.0 (4.2) 125
1. Debt due to financing the EFSF and ESM, about 3.6% of GDP, is excluded. Debt projections in the original budgetarydocumentation have been adjusted to take account of the revised system of national accounts.
2. The 2012 budget did not project debt beyond 2015; the table shows an estimate for 2017 based on the projectedfigure for 2015.
Source: Ministry of Finance, “DEF Update” for successive years.
Reading note: The pre-budget documentation issued in September 2013 foresaw a structural deficit of 0.3% ofGDP for 2014, a structural primary surplus of 5.1% of GDP. The same projections expected the debt-to-GDP ratio(adjusted for the exclusions in Note 1) to fall to 115% by 2017.
OECD ECONOMIC SURVEYS: ITALY © OECD 201536
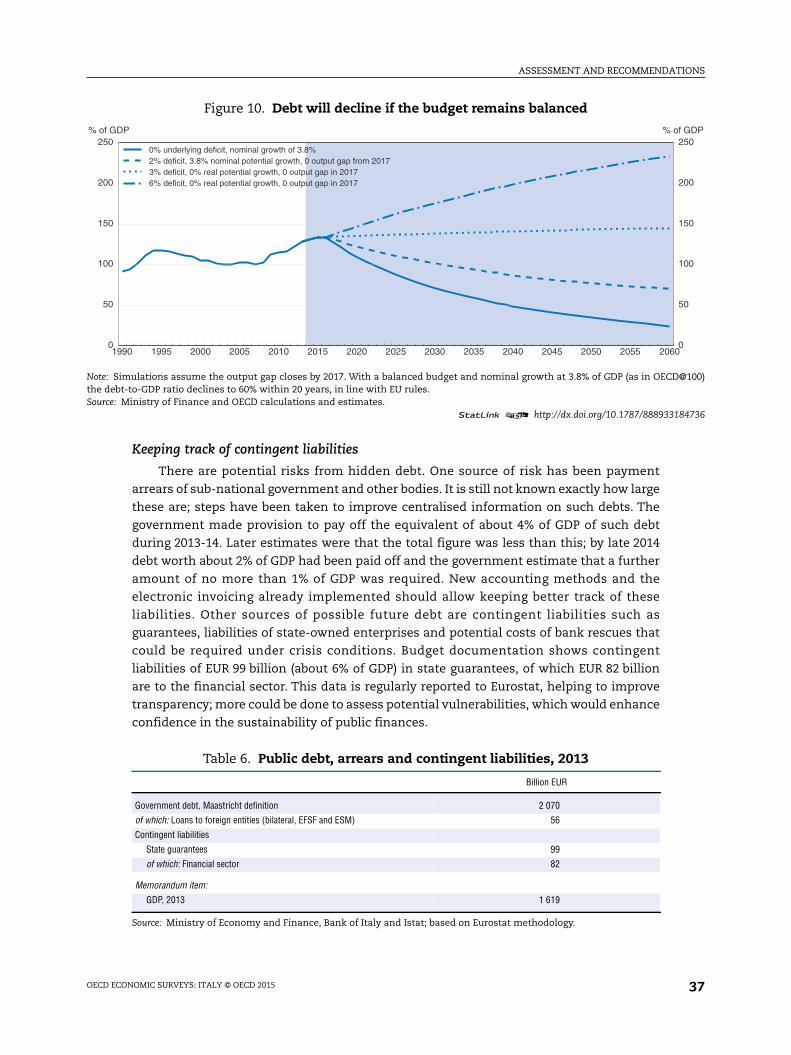
ASSESSMENT AND RECOMMENDATIONS
D@100)
184736
00
50
100
150
200
250of GDP
Keeping track of contingent liabilities
There are potential risks from hidden debt. One source of risk has been payment
arrears of sub-national government and other bodies. It is still not known exactly how large
these are; steps have been taken to improve centralised information on such debts. The
government made provision to pay off the equivalent of about 4% of GDP of such debt
during 2013-14. Later estimates were that the total figure was less than this; by late 2014
debt worth about 2% of GDP had been paid off and the government estimate that a further
amount of no more than 1% of GDP was required. New accounting methods and the
electronic invoicing already implemented should allow keeping better track of these
liabilities. Other sources of possible future debt are contingent liabilities such as
guarantees, liabilities of state-owned enterprises and potential costs of bank rescues that
could be required under crisis conditions. Budget documentation shows contingent
liabilities of EUR 99 billion (about 6% of GDP) in state guarantees, of which EUR 82 billion
are to the financial sector. This data is regularly reported to Eurostat, helping to improve
transparency; more could be done to assess potential vulnerabilities, which would enhance
confidence in the sustainability of public finances.
Figure 10. Debt will decline if the budget remains balanced
Note: Simulations assume the output gap closes by 2017. With a balanced budget and nominal growth at 3.8% of GDP (as in OECthe debt-to-GDP ratio declines to 60% within 20 years, in line with EU rules.Source: Ministry of Finance and OECD calculations and estimates.
1 2 http://dx.doi.org/10.1787/888933
1990 1995 2000 2005 2010 2015 2020 2025 2030 2035 2040 2045 2050 2055 2060
50
100
150
200
250% of GDP
%
0% underlying deficit, nominal growth of 3.8%2% deficit, 3.8% nominal potential growth, 0 output gap from 20173% deficit, 0% real potential growth, 0 output gap in 20176% deficit, 0% real potential growth, 0 output gap in 2017
Table 6. Public debt, arrears and contingent liabilities, 2013
Billion EUR
Government debt, Maastricht definition 2 070
of which: Loans to foreign entities (bilateral, EFSF and ESM) 56
Contingent liabilities
State guarantees 99
of which: Financial sector 82
Memorandum item:
GDP, 2013 1 619
Source: Ministry of Economy and Finance, Bank of Italy and Istat; based on Eurostat methodology.
OECD ECONOMIC SURVEYS: ITALY © OECD 2015 37
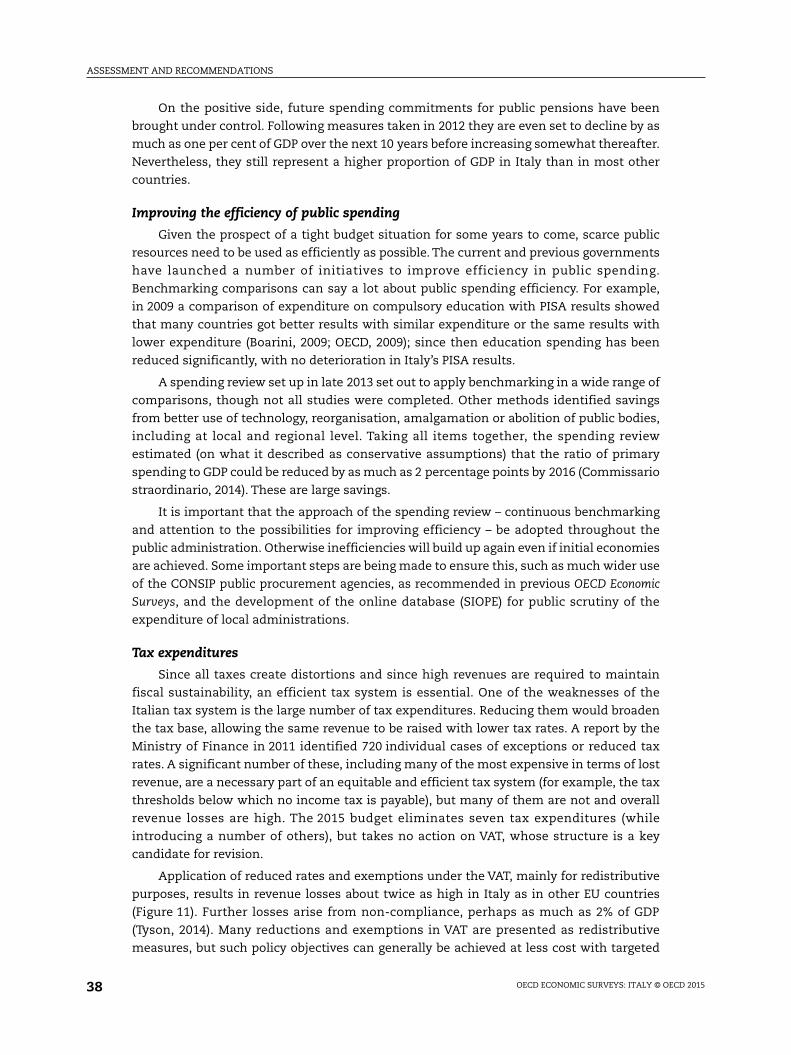
ASSESSMENT AND RECOMMENDATIONS
On the positive side, future spending commitments for public pensions have been
brought under control. Following measures taken in 2012 they are even set to decline by as
much as one per cent of GDP over the next 10 years before increasing somewhat thereafter.
Nevertheless, they still represent a higher proportion of GDP in Italy than in most other
countries.
Improving the efficiency of public spending
Given the prospect of a tight budget situation for some years to come, scarce public
resources need to be used as efficiently as possible. The current and previous governments
have launched a number of initiatives to improve efficiency in public spending.
Benchmarking comparisons can say a lot about public spending efficiency. For example,
in 2009 a comparison of expenditure on compulsory education with PISA results showed
that many countries got better results with similar expenditure or the same results with
lower expenditure (Boarini, 2009; OECD, 2009); since then education spending has been
reduced significantly, with no deterioration in Italy’s PISA results.
A spending review set up in late 2013 set out to apply benchmarking in a wide range of
comparisons, though not all studies were completed. Other methods identified savings
from better use of technology, reorganisation, amalgamation or abolition of public bodies,
including at local and regional level. Taking all items together, the spending review
estimated (on what it described as conservative assumptions) that the ratio of primary
spending to GDP could be reduced by as much as 2 percentage points by 2016 (Commissario
straordinario, 2014). These are large savings.
It is important that the approach of the spending review – continuous benchmarking
and attention to the possibilities for improving efficiency – be adopted throughout the
public administration. Otherwise inefficiencies will build up again even if initial economies
are achieved. Some important steps are being made to ensure this, such as much wider use
of the CONSIP public procurement agencies, as recommended in previous OECD Economic
Surveys, and the development of the online database (SIOPE) for public scrutiny of the
expenditure of local administrations.
Tax expenditures
Since all taxes create distortions and since high revenues are required to maintain
fiscal sustainability, an efficient tax system is essential. One of the weaknesses of the
Italian tax system is the large number of tax expenditures. Reducing them would broaden
the tax base, allowing the same revenue to be raised with lower tax rates. A report by the
Ministry of Finance in 2011 identified 720 individual cases of exceptions or reduced tax
rates. A significant number of these, including many of the most expensive in terms of lost
revenue, are a necessary part of an equitable and efficient tax system (for example, the tax
thresholds below which no income tax is payable), but many of them are not and overall
revenue losses are high. The 2015 budget eliminates seven tax expenditures (while
introducing a number of others), but takes no action on VAT, whose structure is a key
candidate for revision.
Application of reduced rates and exemptions under the VAT, mainly for redistributive
purposes, results in revenue losses about twice as high in Italy as in other EU countries
(Figure 11). Further losses arise from non-compliance, perhaps as much as 2% of GDP
(Tyson, 2014). Many reductions and exemptions in VAT are presented as redistributive
measures, but such policy objectives can generally be achieved at less cost with targeted
OECD ECONOMIC SURVEYS: ITALY © OECD 201538
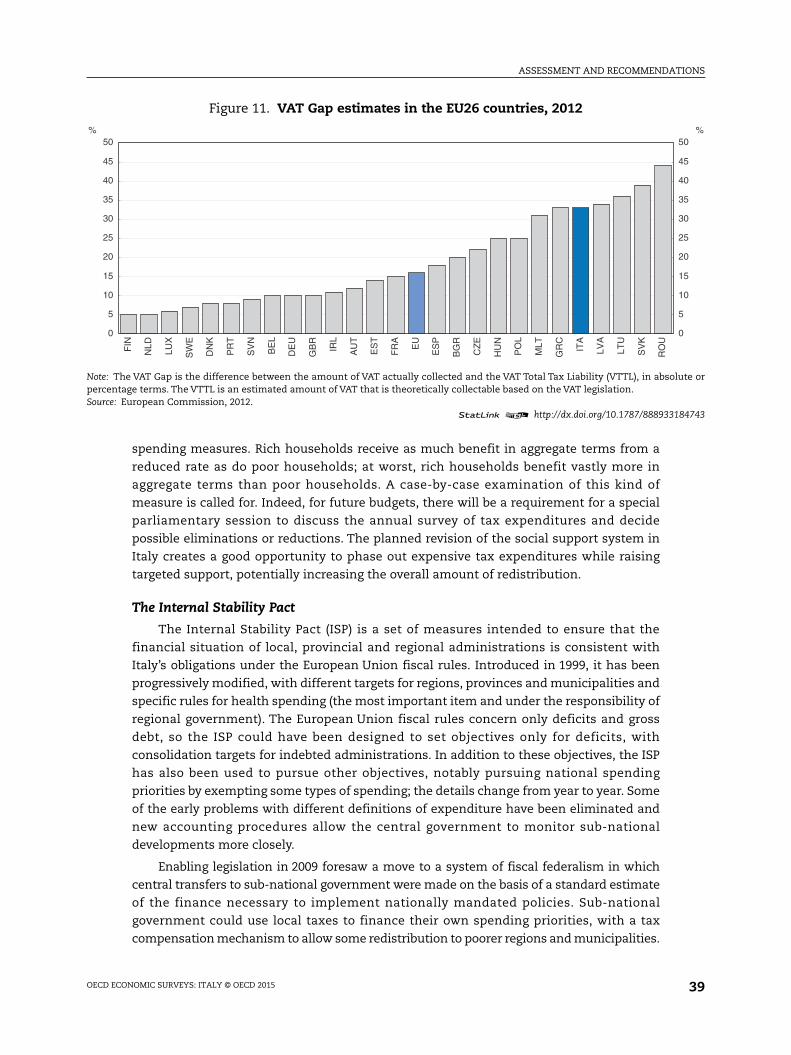
ASSESSMENT AND RECOMMENDATIONS
lute or
184743
0
5
10
15
20
25
30
35
40
45
50%
spending measures. Rich households receive as much benefit in aggregate terms from a
reduced rate as do poor households; at worst, rich households benefit vastly more in
aggregate terms than poor households. A case-by-case examination of this kind of
measure is called for. Indeed, for future budgets, there will be a requirement for a special
parliamentary session to discuss the annual survey of tax expenditures and decide
possible eliminations or reductions. The planned revision of the social support system in
Italy creates a good opportunity to phase out expensive tax expenditures while raising
targeted support, potentially increasing the overall amount of redistribution.
The Internal Stability Pact
The Internal Stability Pact (ISP) is a set of measures intended to ensure that the
financial situation of local, provincial and regional administrations is consistent with
Italy’s obligations under the European Union fiscal rules. Introduced in 1999, it has been
progressively modified, with different targets for regions, provinces and municipalities and
specific rules for health spending (the most important item and under the responsibility of
regional government). The European Union fiscal rules concern only deficits and gross
debt, so the ISP could have been designed to set objectives only for deficits, with
consolidation targets for indebted administrations. In addition to these objectives, the ISP
has also been used to pursue other objectives, notably pursuing national spending
priorities by exempting some types of spending; the details change from year to year. Some
of the early problems with different definitions of expenditure have been eliminated and
new accounting procedures allow the central government to monitor sub-national
developments more closely.
Enabling legislation in 2009 foresaw a move to a system of fiscal federalism in which
central transfers to sub-national government were made on the basis of a standard estimate
of the finance necessary to implement nationally mandated policies. Sub-national
government could use local taxes to finance their own spending priorities, with a tax
compensation mechanism to allow some redistribution to poorer regions and municipalities.
Figure 11. VAT Gap estimates in the EU26 countries, 2012
Note: The VAT Gap is the difference between the amount of VAT actually collected and the VAT Total Tax Liability (VTTL), in absopercentage terms. The VTTL is an estimated amount of VAT that is theoretically collectable based on the VAT legislation.Source: European Commission, 2012.
1 2 http://dx.doi.org/10.1787/888933
0
5
10
15
20
25
30
35
40
45
50%
FIN
NLD
LUX
SW
E
DN
K
PR
T
SV
N
BE
L
DE
U
GB
R
IRL
AU
T
ES
T
FR
A
EU
ES
P
BG
R
CZ
E
HU
N
PO
L
MLT
GR
C
ITA
LVA
LTU
SV
K
RO
U
OECD ECONOMIC SURVEYS: ITALY © OECD 2015 39
ASSESSMENT AND RECOMMENDATIONS
Some of the provisions of the 2009 law have been implemented. Standard costs now apply to
health and an increasing range of other expenditure. But central transfers to sub-national
government are still strongly influenced by historical spending rather than needs. The
constitutional reform provides for financing sub-national government on the basis of
standard costs.
Once the new constitutional arrangements are in place and fiscal federalism
institutions are in place along the model of the 2009 enabling law, adjusted to be in line
with the new structure of sub-national government, it should be possible to simplify the
Internal Stability Pact. With well-defined sub-national taxation powers and expenditure
responsibilities, there should be no need for central government to interfere in any detail.
A simpler ISP should be able to focus largely on deficits, and debt reduction where
necessary, rather than expenditure ceilings, and without special exemptions. A 2012 law
foresees a balanced budget rule for local government as from 2016; the 2015 budget law
imposes a balanced budget on ordinary regions already for 2015.
Recommendations for fiscal and financial policies
Key recommendations
● Stick to the planned fiscal strategy so as to bring the debt-to-GDP ratio safely onto adeclining path.
● Promote greater use of centralised procurement, cost information systems andbenchmarking.
● Urgently take action to achieve a lower level of non-performing loans in the bankingsector, including through enhancing the insolvency regime applied to distressedborrowers.
● Continue efforts to reduce tax evasion through more effective enforcement and increasetax compliance through simplified collection procedures. Broaden tax bases, inparticular by cutting the number of tax expenditures, and simplify the tax system.
Other recommendations
● Continue to assess the magnitude of budgetary contingent liabilities, including thevulnerability of public finances to risks associated with the financial sector.
● Make taxation more environmentally-friendly by reducing the gap between duties ondiesel and petrol.
● Shift the tax burden from electricity to the energy products used to generate it, with therespective rates set to reflect the carbon emissions and other pollutants associated witheach fuel.
● Implement the planned reform of the Internal Stability Pact to regulate only overallborrowing of sub-national government, with consolidation targets for indebtedadministrations. Replace its detailed provisions with a fiscal federalism structure thatreflects the desired degree of decentralisation.
● If progress in reducing nonperforming loans remains slow, consider setting up a publicspecialised asset management company (“bad bank”) to accelerate the process, with dueregard for state aid rules.
OECD ECONOMIC SURVEYS: ITALY © OECD 201540
ASSESSMENT AND RECOMMENDATIONS
References
Adalet McGowan, M. and D. Andrews (2015), “Skill Mismatch and Public Policy in OECD Countries”,OECD Economics Department Working Papers, forthcoming.
Allio, L. and N. Rangone (2015), “Anti-corruption and transparency initiatives for a more accountableand efficient public administration in Italy”, OECD Economics Department Working Papers,forthcoming.
Andrews, D. and F. Cingano (2014), “Public Policy and Resource Allocation: Evidence from Firms inOECD Countries”, Economic Policy, Vol. 29(78), pp. 253-296.
Andrews, D., C. Criscuolo and C. Menon (2014), “Do Resources Flow to Patenting Firms? Cross-CountryEvidence from Firm Level Data”, OECD Economics Department Working Papers, No. 1127, OECD Publishing,Paris.
Banks, G. (2011), “Ïndependent Policy Advice and the Productivity Commission”, Swinburne UniversityChancellor’s Lecture, September, Canberra.
Boarini, R. (2009), “Towards better schools and more equal opportunities for learning in Italy”, OECDEconomics Department Working Papers, No. 727, OECD Publishing, Paris.
Commission on Corruption in public administration (2012), “La corruzione in Italia. Per una politica diprevenzione, rapporto della Commissione per lo studio e l’elaborazione di proposte in tema ditransparenza e prevenzione della corruzione nella pubblica amministrazione”, Rome.
Commissario straordinario per la revisione della spesa (2014), “Proposte per una revisione della spesapubblica (2014-16)”, unpublished.
Clarich, M. and B.G. Mattarella (2010) “Leggi più amichevoli: sei proposte per rilanciare la crescita”,Scenari economici, No. 8, Centro Studi Confindustria, June.
Denk, O. (2013), “Italy and the euro area crisis: Securing fiscal sustainability and financial stability”,OECD Economics Department Working Papers, No. 1065, OECD Publishing, Paris.
Department of Public Administration, Commission against corruption (2008), “Il Fenomeno dellaCorruzione in Italia: prima mappa dell’Alto Commissario Anticorruzione”.
European Commission (2012), “Update Report to the Study to quantify and analyse the VAT Gap in theEU-27 Member States, TAXUD/2013/DE/321”.
Gandrud, G. and M. Halleberg (2014), “Bad banks in the EU: The impact of Eurostat rules”, BruegelWorking Paper, No. 2014/15.
GME (2014), Newsletter del GME, Gestore Mercati Energetici Newsletter, No. 75, October.
IEA (2015), Energy Policies of IEA Countries: Italy 2015, OECD Publishing, Paris, forthcoming.
IMF (2013), “The dog that didn’t bark: Has inflation been muzzled or was it just sleeping”, WorldEconomic Outlook, International Monetary Fund, April.
Jin, Y., R. Fukahori and H. Morgavi (2015), “Identifying the Most Cost Effective Active Labour MarketPolicies for Different Job Seekers”, OECD Economics Department Working Papers, forthcoming.
Johansson, Å, C. Heady, J. Arnold, B. Brys and L. Vartia (2008), “Taxation and Economic Growth”, OECDEconomics Department Working Papers, No. 620, OECD Publishing, Paris.
MEF (2007), “Rapporto intermedio sulla revisione della spesa”, Ministry of Economy and Finance,Commissione Tecnica per la Finanza Pubblica.
MEF (2008), “La revisione della spesa: rapporto 2008”, Ministry of Economy and Finance, CommissioneTecnica per la Finanza Pubblica.
MEF (2011), “Gruppo di lavoro sull’erosione fiscale, Relazione Finale”, Ministry of Economy andFinance, November.
MEF (2014a), “Italy’s Structural Reforms”, Ministry of Economy and Finance, September.
MEF (2014b), “Rapporto sulla realizzazione delle strategie di contrasto all’evasione fiscal”, Ministry ofEconomy and Finance, www.mef.gov.it/documenti-allegati/2014/Rapporto_art6_dl66_13_luglio.pdf.
O’Brien, P.S. (2013), “Policy implementation in Italy: Legislation, public administration and the rule oflaw”, OECD Economics Department Working Papers, No. 1064, OECD Publishing, Paris.
OECD (2009a), OECD Economic Surveys: Italy 2009, OECD Publishing, Paris.
OECD ECONOMIC SURVEYS: ITALY © OECD 2015 41
ASSESSMENT AND RECOMMENDATIONS
OECD (2009b), OECD Regulatory Reform: Italy 2009 – Better Regulation to Strengthen Market Dynamics, OECDPublishing, Paris.
OECD (2013a), OECD Economic Surveys: Italy 2013, OECD Publishing, Paris.
OECD (2013b), OECD Employment Outlook 2013, OECD Publishing, Paris.
OECD (2013c), OECD Environmental Performance Reviews: Italy 2013, OECD Publishing, Paris.
OECD (2013d), Reinforcing Public Sector Integrity, Restoring Trust for Sustainable Growth, OECD IntegrityReview of Italy, OECD Publishing, Paris.
OECD (2014a), OECD Economic Surveys: Spain 2014, OECD Publishing, Paris.
OECD (2014b), The Distributional Effects of Consumption Taxes in OECD Countries: Update Report,CTPA/CFA/WP9(2014)14.
Palumbo, G., G. Giupponi, L. Nunziata and J. Mora Sanguinetti (2013), “The Economics of Civil Justice:NewCcross-country Data and Empirics”, OECD Economics Department Working Papers, No. 1060, OECDPublishing, Paris.
Pohl, J. (2013), “Temporal Validity of International Investment Agreements: A Large Sample Survey ofTreaty Provisions”, OECD Working Papers on International Investment, No. 2013/04, OECD Publishing,Paris.
Tyson, J. (2014), “Reforming Tax Expenditures in Italy: What, Why, and How?”, IMF Working Paper,No. WP/14/7.
OECD ECONOMIC SURVEYS: ITALY © OECD 201542
OECD Economic Surveys: Italy
© OECD 2015
ANNEX
Taking stock of structural reforms
This table summarises recommendations from previous OECD Economic Surveysand notes significant measures that have been taken since the previous OECDEconomic Surveys (May 2013).
43
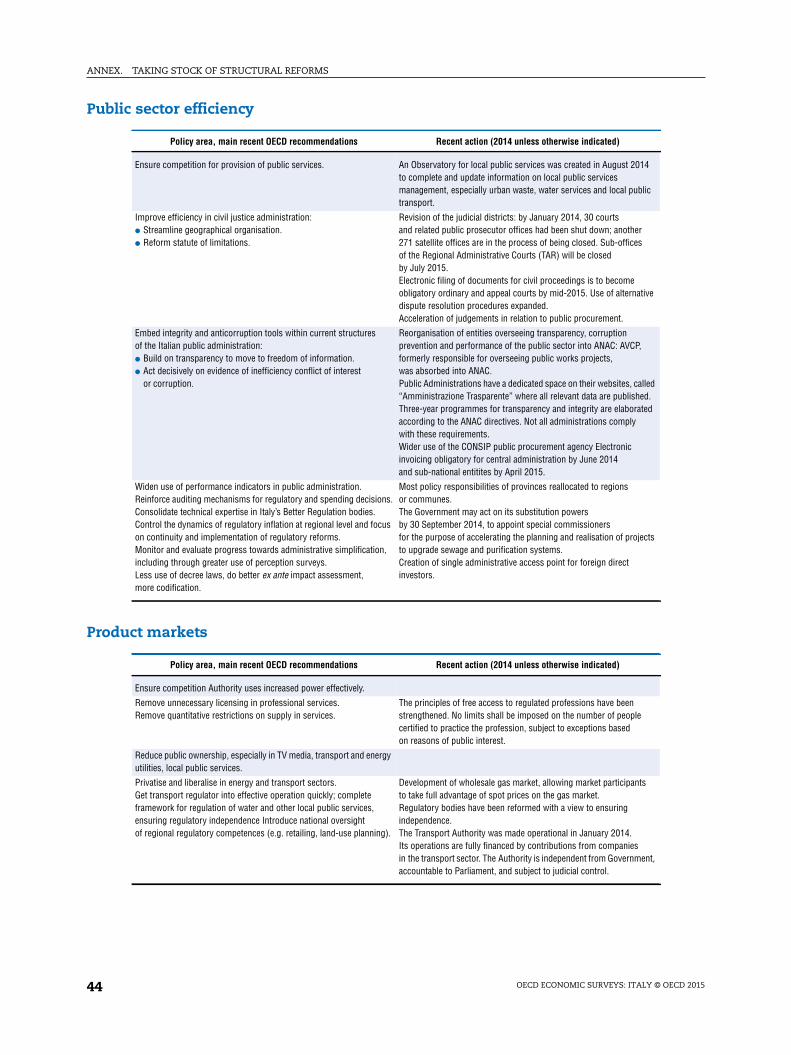
ANNEX. TAKING STOCK OF STRUCTURAL REFORMS
Public sector efficiency
Product markets
Policy area, main recent OECD recommendations Recent action (2014 unless otherwise indicated)
Ensure competition for provision of public services. An Observatory for local public services was created in August 2014to complete and update information on local public servicesmanagement, especially urban waste, water services and local publictransport.
Improve efficiency in civil justice administration:● Streamline geographical organisation.● Reform statute of limitations.
Revision of the judicial districts: by January 2014, 30 courtsand related public prosecutor offices had been shut down; another271 satellite offices are in the process of being closed. Sub-officesof the Regional Administrative Courts (TAR) will be closedby July 2015.Electronic filing of documents for civil proceedings is to becomeobligatory ordinary and appeal courts by mid-2015. Use of alternativedispute resolution procedures expanded.Acceleration of judgements in relation to public procurement.
Embed integrity and anticorruption tools within current structuresof the Italian public administration:● Build on transparency to move to freedom of information.● Act decisively on evidence of inefficiency conflict of interest
or corruption.
Reorganisation of entities overseeing transparency, corruptionprevention and performance of the public sector into ANAC: AVCP,formerly responsible for overseeing public works projects,was absorbed into ANAC.Public Administrations have a dedicated space on their websites, called“Amministrazione Trasparente” where all relevant data are published.Three-year programmes for transparency and integrity are elaboratedaccording to the ANAC directives. Not all administrations complywith these requirements.Wider use of the CONSIP public procurement agency Electronicinvoicing obligatory for central administration by June 2014and sub-national entitites by April 2015.
Widen use of performance indicators in public administration.Reinforce auditing mechanisms for regulatory and spending decisions.Consolidate technical expertise in Italy’s Better Regulation bodies.Control the dynamics of regulatory inflation at regional level and focuson continuity and implementation of regulatory reforms.Monitor and evaluate progress towards administrative simplification,including through greater use of perception surveys.Less use of decree laws, do better ex ante impact assessment,more codification.
Most policy responsibilities of provinces reallocated to regionsor communes.The Government may act on its substitution powersby 30 September 2014, to appoint special commissionersfor the purpose of accelerating the planning and realisation of projectsto upgrade sewage and purification systems.Creation of single administrative access point for foreign directinvestors.
Policy area, main recent OECD recommendations Recent action (2014 unless otherwise indicated)
Ensure competition Authority uses increased power effectively.
Remove unnecessary licensing in professional services.Remove quantitative restrictions on supply in services.
The principles of free access to regulated professions have beenstrengthened. No limits shall be imposed on the number of peoplecertified to practice the profession, subject to exceptions basedon reasons of public interest.
Reduce public ownership, especially in TV media, transport and energyutilities, local public services.
Privatise and liberalise in energy and transport sectors.Get transport regulator into effective operation quickly; completeframework for regulation of water and other local public services,ensuring regulatory independence Introduce national oversightof regional regulatory competences (e.g. retailing, land-use planning).
Development of wholesale gas market, allowing market participantsto take full advantage of spot prices on the gas market.Regulatory bodies have been reformed with a view to ensuringindependence.The Transport Authority was made operational in January 2014.Its operations are fully financed by contributions from companiesin the transport sector. The Authority is independent from Government,accountable to Parliament, and subject to judicial control.
OECD ECONOMIC SURVEYS: ITALY © OECD 201544
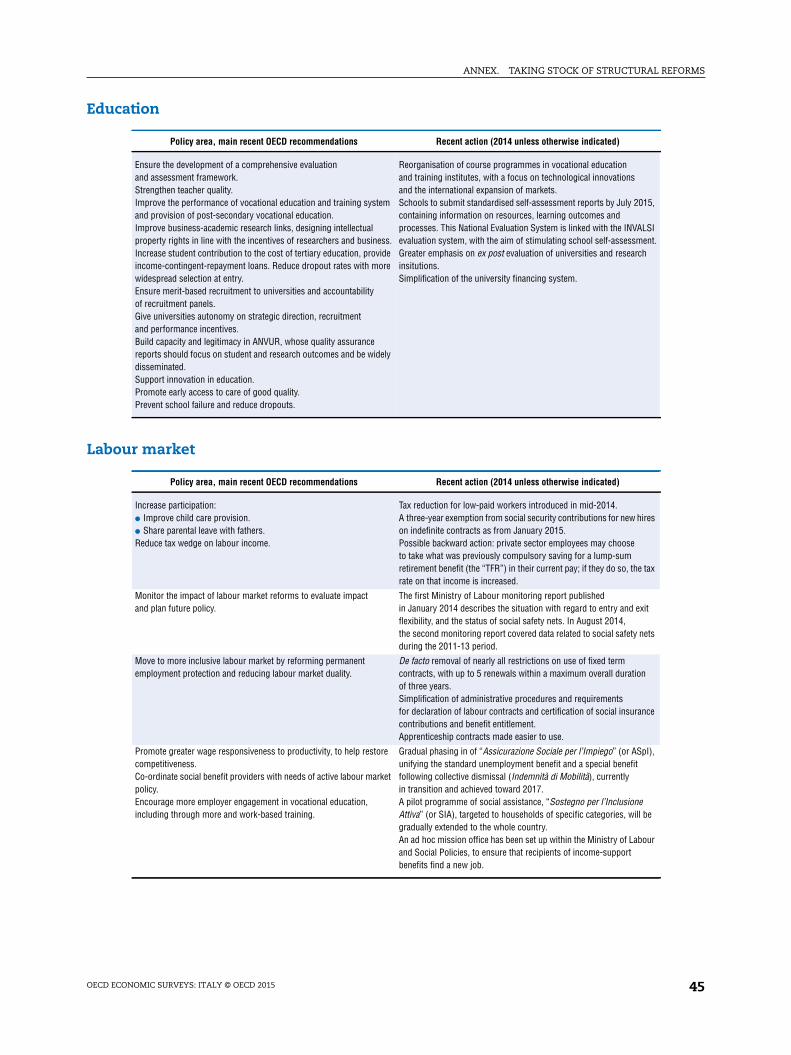
ANNEX. TAKING STOCK OF STRUCTURAL REFORMS
Education
Labour market
Policy area, main recent OECD recommendations Recent action (2014 unless otherwise indicated)
Ensure the development of a comprehensive evaluationand assessment framework.Strengthen teacher quality.Improve the performance of vocational education and training systemand provision of post-secondary vocational education.Improve business-academic research links, designing intellectualproperty rights in line with the incentives of researchers and business.Increase student contribution to the cost of tertiary education, provideincome-contingent-repayment loans. Reduce dropout rates with morewidespread selection at entry.Ensure merit-based recruitment to universities and accountabilityof recruitment panels.Give universities autonomy on strategic direction, recruitmentand performance incentives.Build capacity and legitimacy in ANVUR, whose quality assurancereports should focus on student and research outcomes and be widelydisseminated.Support innovation in education.Promote early access to care of good quality.Prevent school failure and reduce dropouts.
Reorganisation of course programmes in vocational educationand training institutes, with a focus on technological innovationsand the international expansion of markets.Schools to submit standardised self-assessment reports by July 2015,containing information on resources, learning outcomes andprocesses. This National Evaluation System is linked with the INVALSIevaluation system, with the aim of stimulating school self-assessment.Greater emphasis on ex post evaluation of universities and researchinsitutions.Simplification of the university financing system.
Policy area, main recent OECD recommendations Recent action (2014 unless otherwise indicated)
Increase participation:● Improve child care provision.● Share parental leave with fathers.Reduce tax wedge on labour income.
Tax reduction for low-paid workers introduced in mid-2014.A three-year exemption from social security contributions for new hireson indefinite contracts as from January 2015.Possible backward action: private sector employees may chooseto take what was previously compulsory saving for a lump-sumretirement benefit (the “TFR”) in their current pay; if they do so, the taxrate on that income is increased.
Monitor the impact of labour market reforms to evaluate impactand plan future policy.
The first Ministry of Labour monitoring report publishedin January 2014 describes the situation with regard to entry and exitflexibility, and the status of social safety nets. In August 2014,the second monitoring report covered data related to social safety netsduring the 2011-13 period.
Move to more inclusive labour market by reforming permanentemployment protection and reducing labour market duality.
De facto removal of nearly all restrictions on use of fixed termcontracts, with up to 5 renewals within a maximum overall durationof three years.Simplification of administrative procedures and requirementsfor declaration of labour contracts and certification of social insurancecontributions and benefit entitlement.Apprenticeship contracts made easier to use.
Promote greater wage responsiveness to productivity, to help restorecompetitiveness.Co-ordinate social benefit providers with needs of active labour marketpolicy.Encourage more employer engagement in vocational education,including through more and work-based training.
Gradual phasing in of “Assicurazione Sociale per l’Impiego” (or ASpI),unifying the standard unemployment benefit and a special benefitfollowing collective dismissal (Indemnità di Mobilità), currentlyin transition and achieved toward 2017.A pilot programme of social assistance, “Sostegno per l’InclusioneAttiva” (or SIA), targeted to households of specific categories, will begradually extended to the whole country.An ad hoc mission office has been set up within the Ministry of Labourand Social Policies, to ensure that recipients of income-supportbenefits find a new job.
OECD ECONOMIC SURVEYS: ITALY © OECD 2015 45
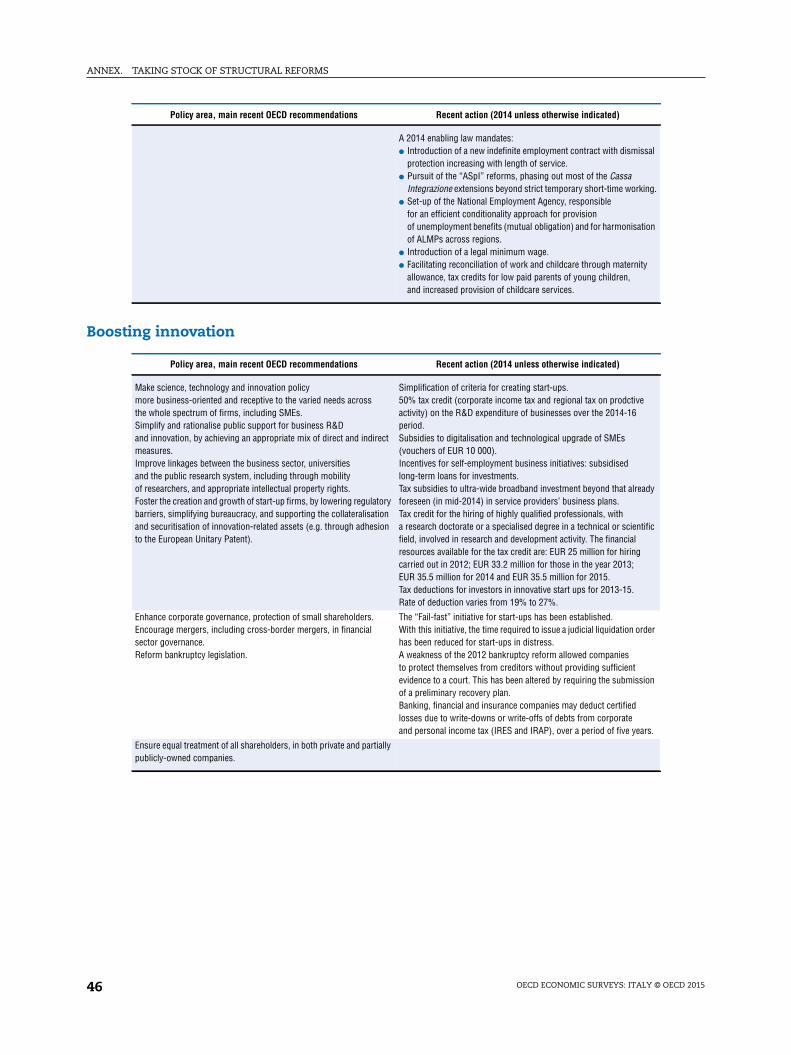
ANNEX. TAKING STOCK OF STRUCTURAL REFORMS
Boosting innovation
A 2014 enabling law mandates:● Introduction of a new indefinite employment contract with dismissal
protection increasing with length of service.● Pursuit of the “ASpI” reforms, phasing out most of the Cassa
Integrazione extensions beyond strict temporary short-time working.● Set-up of the National Employment Agency, responsible
for an efficient conditionality approach for provisionof unemployment benefits (mutual obligation) and for harmonisationof ALMPs across regions.
● Introduction of a legal minimum wage.● Facilitating reconciliation of work and childcare through maternity
allowance, tax credits for low paid parents of young children,and increased provision of childcare services.
Policy area, main recent OECD recommendations Recent action (2014 unless otherwise indicated)
Make science, technology and innovation policymore business-oriented and receptive to the varied needs acrossthe whole spectrum of firms, including SMEs.Simplify and rationalise public support for business R&Dand innovation, by achieving an appropriate mix of direct and indirectmeasures.Improve linkages between the business sector, universitiesand the public research system, including through mobilityof researchers, and appropriate intellectual property rights.Foster the creation and growth of start-up firms, by lowering regulatorybarriers, simplifying bureaucracy, and supporting the collateralisationand securitisation of innovation-related assets (e.g. through adhesionto the European Unitary Patent).
Simplification of criteria for creating start-ups.50% tax credit (corporate income tax and regional tax on prodctiveactivity) on the R&D expenditure of businesses over the 2014-16period.Subsidies to digitalisation and technological upgrade of SMEs(vouchers of EUR 10 000).Incentives for self-employment business initiatives: subsidisedlong-term loans for investments.Tax subsidies to ultra-wide broadband investment beyond that alreadyforeseen (in mid-2014) in service providers’ business plans.Tax credit for the hiring of highly qualified professionals, witha research doctorate or a specialised degree in a technical or scientificfield, involved in research and development activity. The financialresources available for the tax credit are: EUR 25 million for hiringcarried out in 2012; EUR 33.2 million for those in the year 2013;EUR 35.5 million for 2014 and EUR 35.5 million for 2015.Tax deductions for investors in innovative start ups for 2013-15.Rate of deduction varies from 19% to 27%.
Enhance corporate governance, protection of small shareholders.Encourage mergers, including cross-border mergers, in financialsector governance.Reform bankruptcy legislation.
The “Fail-fast” initiative for start-ups has been established.With this initiative, the time required to issue a judicial liquidation orderhas been reduced for start-ups in distress.A weakness of the 2012 bankruptcy reform allowed companiesto protect themselves from creditors without providing sufficientevidence to a court. This has been altered by requiring the submissionof a preliminary recovery plan.Banking, financial and insurance companies may deduct certifiedlosses due to write-downs or write-offs of debts from corporateand personal income tax (IRES and IRAP), over a period of five years.
Ensure equal treatment of all shareholders, in both private and partiallypublicly-owned companies.
Policy area, main recent OECD recommendations Recent action (2014 unless otherwise indicated)
OECD ECONOMIC SURVEYS: ITALY © OECD 201546
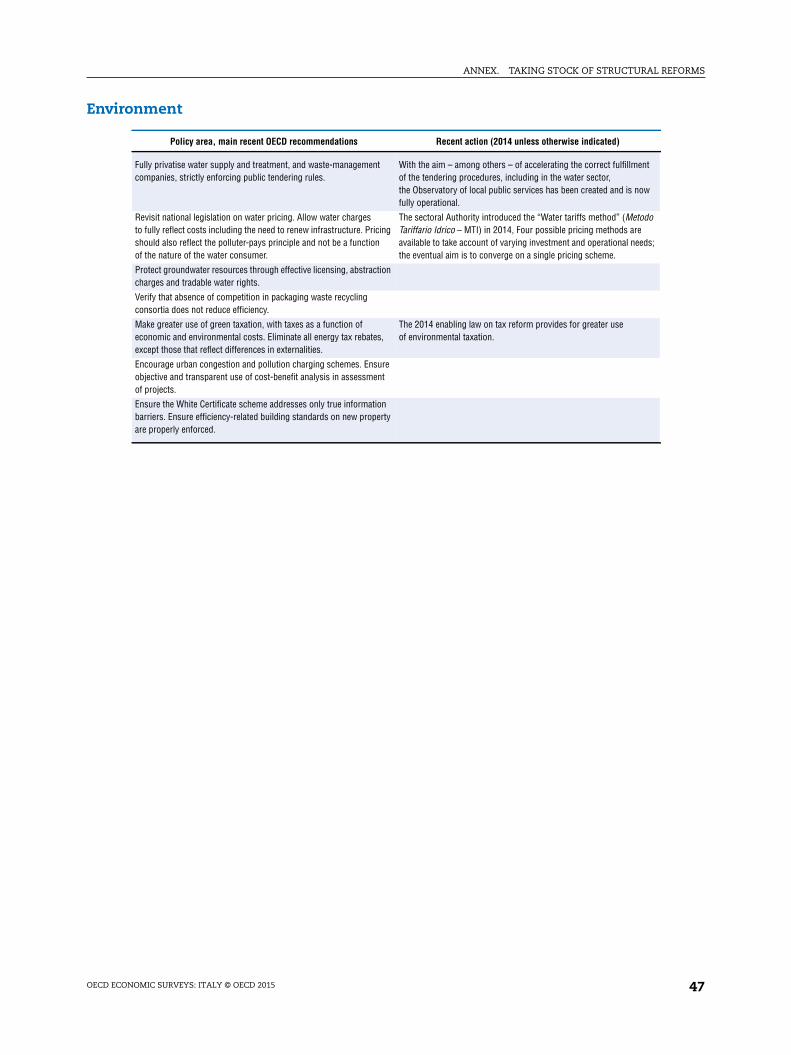
ANNEX. TAKING STOCK OF STRUCTURAL REFORMS
Environment
Policy area, main recent OECD recommendations Recent action (2014 unless otherwise indicated)
Fully privatise water supply and treatment, and waste-managementcompanies, strictly enforcing public tendering rules.
With the aim – among others – of accelerating the correct fulfillmentof the tendering procedures, including in the water sector,the Observatory of local public services has been created and is nowfully operational.
Revisit national legislation on water pricing. Allow water chargesto fully reflect costs including the need to renew infrastructure. Pricingshould also reflect the polluter-pays principle and not be a functionof the nature of the water consumer.
The sectoral Authority introduced the “Water tariffs method” (MetodoTariffario Idrico – MTI) in 2014, Four possible pricing methods areavailable to take account of varying investment and operational needs;the eventual aim is to converge on a single pricing scheme.
Protect groundwater resources through effective licensing, abstractioncharges and tradable water rights.
Verify that absence of competition in packaging waste recyclingconsortia does not reduce efficiency.
Make greater use of green taxation, with taxes as a function ofeconomic and environmental costs. Eliminate all energy tax rebates,except those that reflect differences in externalities.
The 2014 enabling law on tax reform provides for greater useof environmental taxation.
Encourage urban congestion and pollution charging schemes. Ensureobjective and transparent use of cost-benefit analysis in assessmentof projects.
Ensure the White Certificate scheme addresses only true informationbarriers. Ensure efficiency-related building standards on new propertyare properly enforced.
OECD ECONOMIC SURVEYS: ITALY © OECD 2015 47


Thematic chapters
OECD ECONOMIC SURVEYS: ITALY © OECD 2015

OECD Economic Surveys: Italy
© OECD 2015
Chapter 1
Labour market reform for moreand better quality jobs
A well-functioning labour market is indispensable to promote job creation, increaseliving standards, and develop a cohesive society. In Italy, the various deficiencies ofthe labour market have resulted in high unemployment, low labour forceparticipation and job-skill mismatch. These deficiencies have contributed to theproblem of allocation of resources, income distribution, and low productivity,reducing people’s well-being. The current government, following on pastgovernments’ reforms, is introducing a package of labour market reforms – the JobsAct – to improve the labour market in a consistent way. The reform will make thelabour market more flexible and inclusive, and reduce duality. The long-lastingproblem of effective enforcement will need to be overcome, with an increased focuson rapid implementation by the current government. A set of well-designedinstitutions, not only labour market policies but also the education system andproduct market regulation, would encourage higher labour force participation,especially among women, and produce more and better quality jobs in a moreskill-intensive economy.
The statistical data for Israel are supplied by and under the responsibility of the relevant Israeliauthorities. The use of such data by the OECD is without prejudice to the status of the Golan Heights,East Jerusalem and Israeli settlements in the West Bank under the terms of international law.
51
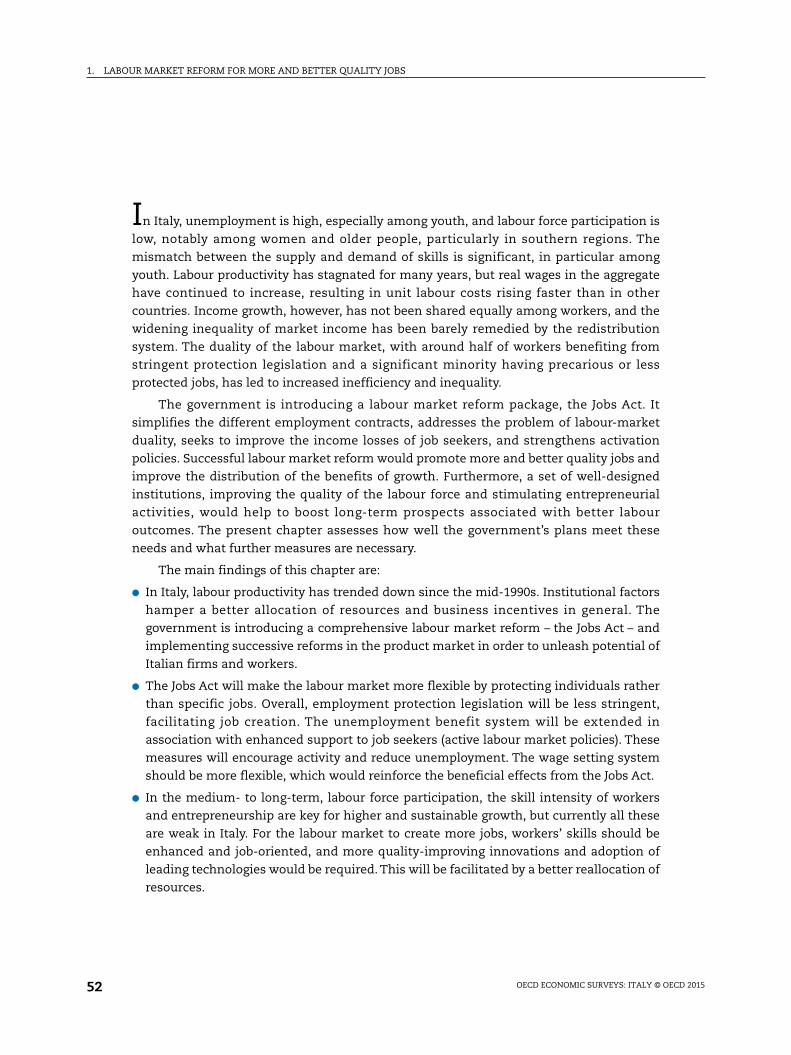
1. LABOUR MARKET REFORM FOR MORE AND BETTER QUALITY JOBS
In Italy, unemployment is high, especially among youth, and labour force participation is
low, notably among women and older people, particularly in southern regions. The
mismatch between the supply and demand of skills is significant, in particular among
youth. Labour productivity has stagnated for many years, but real wages in the aggregate
have continued to increase, resulting in unit labour costs rising faster than in other
countries. Income growth, however, has not been shared equally among workers, and the
widening inequality of market income has been barely remedied by the redistribution
system. The duality of the labour market, with around half of workers benefiting from
stringent protection legislation and a significant minority having precarious or less
protected jobs, has led to increased inefficiency and inequality.
The government is introducing a labour market reform package, the Jobs Act. It
simplifies the different employment contracts, addresses the problem of labour-market
duality, seeks to improve the income losses of job seekers, and strengthens activation
policies. Successful labour market reform would promote more and better quality jobs and
improve the distribution of the benefits of growth. Furthermore, a set of well-designed
institutions, improving the quality of the labour force and stimulating entrepreneurial
activities, would help to boost long-term prospects associated with better labour
outcomes. The present chapter assesses how well the government’s plans meet these
needs and what further measures are necessary.
The main findings of this chapter are:
● In Italy, labour productivity has trended down since the mid-1990s. Institutional factors
hamper a better allocation of resources and business incentives in general. The
government is introducing a comprehensive labour market reform – the Jobs Act – and
implementing successive reforms in the product market in order to unleash potential of
Italian firms and workers.
● The Jobs Act will make the labour market more flexible by protecting individuals rather
than specific jobs. Overall, employment protection legislation will be less stringent,
facilitating job creation. The unemployment benefit system will be extended in
association with enhanced support to job seekers (active labour market policies). These
measures will encourage activity and reduce unemployment. The wage setting system
should be more flexible, which would reinforce the beneficial effects from the Jobs Act.
● In the medium- to long-term, labour force participation, the skill intensity of workers
and entrepreneurship are key for higher and sustainable growth, but currently all these
are weak in Italy. For the labour market to create more jobs, workers’ skills should be
enhanced and job-oriented, and more quality-improving innovations and adoption of
leading technologies would be required. This will be facilitated by a better reallocation of
resources.
OECD ECONOMIC SURVEYS: ITALY © OECD 201552
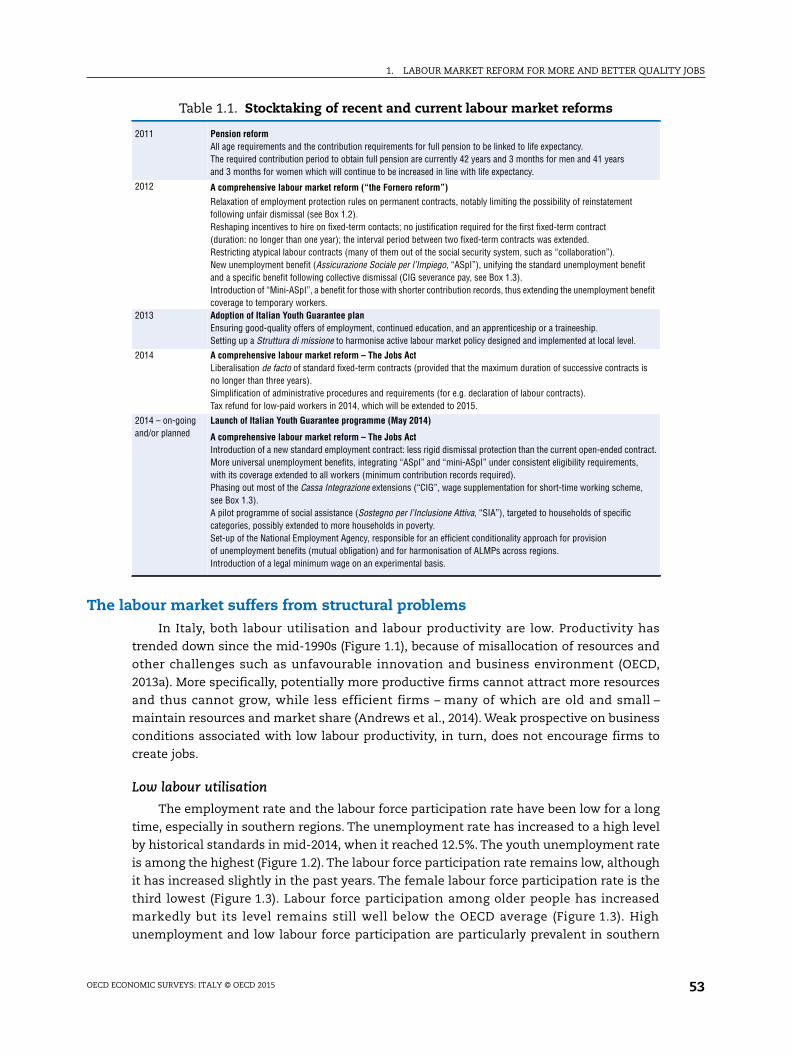
1. LABOUR MARKET REFORM FOR MORE AND BETTER QUALITY JOBS
The labour market suffers from structural problemsIn Italy, both labour utilisation and labour productivity are low. Productivity has
trended down since the mid-1990s (Figure 1.1), because of misallocation of resources and
other challenges such as unfavourable innovation and business environment (OECD,
2013a). More specifically, potentially more productive firms cannot attract more resources
and thus cannot grow, while less efficient firms – many of which are old and small –
maintain resources and market share (Andrews et al., 2014). Weak prospective on business
conditions associated with low labour productivity, in turn, does not encourage firms to
create jobs.
Low labour utilisation
The employment rate and the labour force participation rate have been low for a long
time, especially in southern regions. The unemployment rate has increased to a high level
by historical standards in mid-2014, when it reached 12.5%. The youth unemployment rate
is among the highest (Figure 1.2). The labour force participation rate remains low, although
it has increased slightly in the past years. The female labour force participation rate is the
third lowest (Figure 1.3). Labour force participation among older people has increased
markedly but its level remains still well below the OECD average (Figure 1.3). High
unemployment and low labour force participation are particularly prevalent in southern
Table 1.1. Stocktaking of recent and current labour market reforms
2011 Pension reformAll age requirements and the contribution requirements for full pension to be linked to life expectancy.The required contribution period to obtain full pension are currently 42 years and 3 months for men and 41 yearsand 3 months for women which will continue to be increased in line with life expectancy.
2012 A comprehensive labour market reform (“the Fornero reform”)Relaxation of employment protection rules on permanent contracts, notably limiting the possibility of reinstatementfollowing unfair dismissal (see Box 1.2).Reshaping incentives to hire on fixed-term contacts; no justification required for the first fixed-term contract(duration: no longer than one year); the interval period between two fixed-term contracts was extended.Restricting atypical labour contracts (many of them out of the social security system, such as “collaboration”).New unemployment benefit (Assicurazione Sociale per l’Impiego, “ASpI”), unifying the standard unemployment benefitand a specific benefit following collective dismissal (CIG severance pay, see Box 1.3).Introduction of “Mini-ASpI”, a benefit for those with shorter contribution records, thus extending the unemployment benefitcoverage to temporary workers.
2013 Adoption of Italian Youth Guarantee planEnsuring good-quality offers of employment, continued education, and an apprenticeship or a traineeship.Setting up a Struttura di missione to harmonise active labour market policy designed and implemented at local level.
2014 A comprehensive labour market reform – The Jobs ActLiberalisation de facto of standard fixed-term contracts (provided that the maximum duration of successive contracts isno longer than three years).Simplification of administrative procedures and requirements (for e.g. declaration of labour contracts).Tax refund for low-paid workers in 2014, which will be extended to 2015.
2014 – on-goingand/or planned
Launch of Italian Youth Guarantee programme (May 2014)
A comprehensive labour market reform – The Jobs ActIntroduction of a new standard employment contract: less rigid dismissal protection than the current open-ended contract.More universal unemployment benefits, integrating “ASpI” and “mini-ASpI” under consistent eligibility requirements,with its coverage extended to all workers (minimum contribution records required).Phasing out most of the Cassa Integrazione extensions (“CIG”, wage supplementation for short-time working scheme,see Box 1.3).A pilot programme of social assistance (Sostegno per l’Inclusione Attiva, “SIA”), targeted to households of specificcategories, possibly extended to more households in poverty.Set-up of the National Employment Agency, responsible for an efficient conditionality approach for provisionof unemployment benefits (mutual obligation) and for harmonisation of ALMPs across regions.Introduction of a legal minimum wage on an experimental basis.
OECD ECONOMIC SURVEYS: ITALY © OECD 2015 53
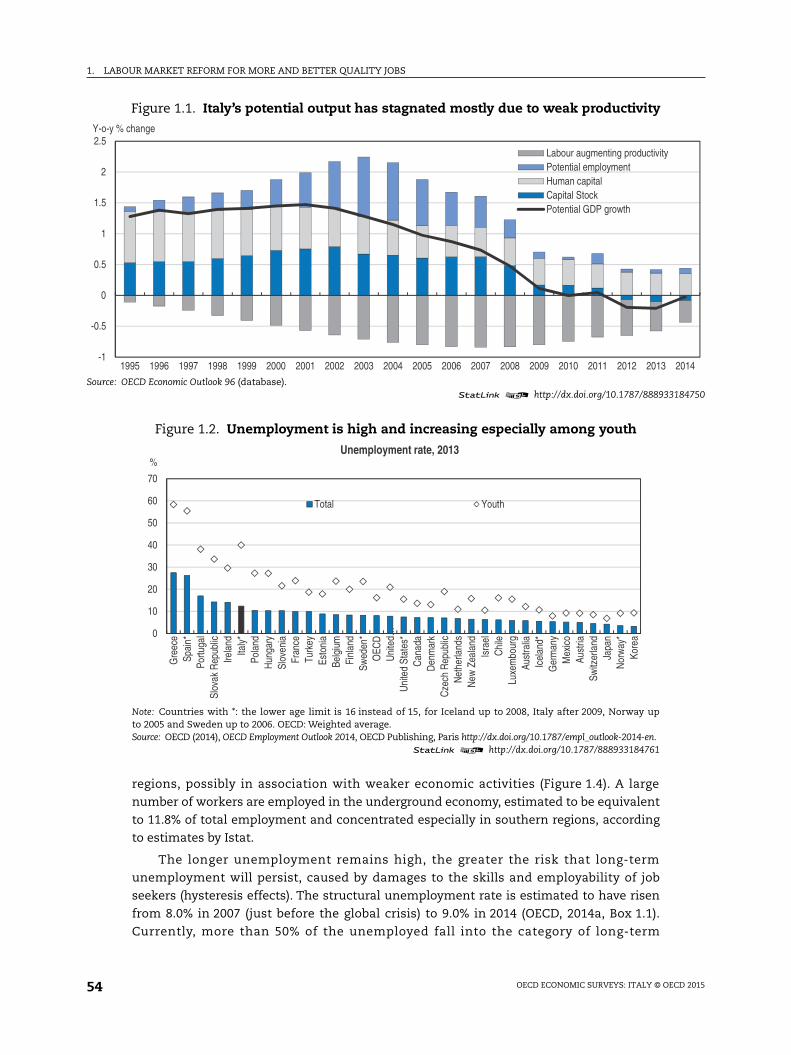
1. LABOUR MARKET REFORM FOR MORE AND BETTER QUALITY JOBS
184750
2014
regions, possibly in association with weaker economic activities (Figure 1.4). A large
number of workers are employed in the underground economy, estimated to be equivalent
to 11.8% of total employment and concentrated especially in southern regions, according
to estimates by Istat.
The longer unemployment remains high, the greater the risk that long-term
unemployment will persist, caused by damages to the skills and employability of job
seekers (hysteresis effects). The structural unemployment rate is estimated to have risen
from 8.0% in 2007 (just before the global crisis) to 9.0% in 2014 (OECD, 2014a, Box 1.1).
Currently, more than 50% of the unemployed fall into the category of long-term
Figure 1.1. Italy’s potential output has stagnated mostly due to weak productivity
Source: OECD Economic Outlook 96 (database).1 2 http://dx.doi.org/10.1787/888933
-1
-0.5
0
0.5
1
1.5
2
2.5
1995 1996 1997 1998 1999 2000 2001 2002 2003 2004 2005 2006 2007 2008 2009 2010 2011 2012 2013
Y-o-y % change
Labour augmenting productivityPotential employmentHuman capitalCapital StockPotential GDP growth
Figure 1.2. Unemployment is high and increasing especially among youth
Note: Countries with *: the lower age limit is 16 instead of 15, for Iceland up to 2008, Italy after 2009, Norway upto 2005 and Sweden up to 2006. OECD: Weighted average.Source: OECD (2014), OECD Employment Outlook 2014, OECD Publishing, Paris http://dx.doi.org/10.1787/empl_outlook-2014-en.
1 2 http://dx.doi.org/10.1787/888933184761
0
10
20
30
40
50
60
70
Gre
ece
Spai
n*Po
rtuga
lSl
ovak
Rep
ublic
Irela
ndIta
ly*
Pola
ndH
unga
rySl
oven
iaFr
ance
Turk
eyEs
toni
aBe
lgiu
mFi
nlan
dSw
eden
*O
ECD
Uni
ted…
Uni
ted
Stat
es*
Can
ada
Den
mar
kC
zech
Rep
ublic
Net
herla
nds
New
Zea
land
Isra
elC
hile
Luxe
mbo
urg
Aust
ralia
Icel
and*
Ger
man
yM
exic
oAu
stria
Switz
erla
ndJa
pan
Nor
way
*Ko
rea
%Unemployment rate, 2013
Total Youth
OECD ECONOMIC SURVEYS: ITALY © OECD 201554
1. LABOUR MARKET REFORM FOR MORE AND BETTER QUALITY JOBS
den up
184778
Figure 1.3. Labour force participation is low especially among women and older people
Note: Countries with *: the lower age limit is 16 instead of 15, for Iceland up to 2008, Italy after 2009, Norway up to 2005 and Sweto 2006. OECD: Weighted average.Source: OECD (2014), OECD Employment Outlook 2014, OECD Publishing, Paris, http://dx.doi.org/10.1787/empl_outlook-2014-en.
1 2 http://dx.doi.org/10.1787/888933
0
10
20
30
40
50
60
70
80
90
100%
0
10
20
30
40
50
60
70
80
90
100%
TU
R
ME
X
ITA
HU
N
CH
L
KO
R
PO
L
BE
L
GR
C
SV
K
LUX
IRL
SV
N
OE
CD
FR
A
ISR
US
A*
CZ
E
PR
T
FIN
JPN
ES
T
ES
P*
AU
T
AU
S
GB
R*
DE
U
CA
N
DN
K
NZ
L
NO
R
NLD
SW
E
CH
E
ISL
Total Older workers
A. Labour force participation, 2013
0
10
20
30
40
50
60
70
80
90
100%
0
10
20
30
40
50
60
70
80
90
100%
TU
R
ME
X
ITA
HU
N
CH
L
KO
R
PO
L
BE
L
GR
C
SV
K
LUX
IRL
SV
N
OE
CD
FR
A
ISR
US
A*
CZ
E
PR
T
FIN
JPN
ES
T
ES
P*
AU
T
AU
S
GB
R*
DE
U
CA
N
DN
K
NZ
L
NO
R
NLD
SW
E
CH
E
ISL
Total Women
B. Labour force participation, 2013
Figure 1.4. Large differences in activity and unemployment across regions
Source: Regional Accounts, Istat.1 2 http://dx.doi.org/10.1787/888933184787
0
5
10
15
20
25
0
10 000
20 000
30 000
40 000
50 000
60 000
70 000
Cal
abria
Mol
ise
Basi
licat
a
Pugl
ia
Sard
egna
Sici
lia
Um
bria
Cam
pani
a
Mar
che
Abru
zzo
Tosc
ana
Vene
to
Piem
onte
Friu
li-Ve
nezi
a G
iulia
Emilia
-Rom
agna
Prov
inci
a…
Ligu
ria
Tren
tino
Alto
Adi
ge
Valle
d'A
osta
Prov
inci
a…
Lazi
o
Lom
bard
ia
%Euros
Productivity per worker, 2012 Unemployment rate, 2012 (RHS)
OECD ECONOMIC SURVEYS: ITALY © OECD 2015 55
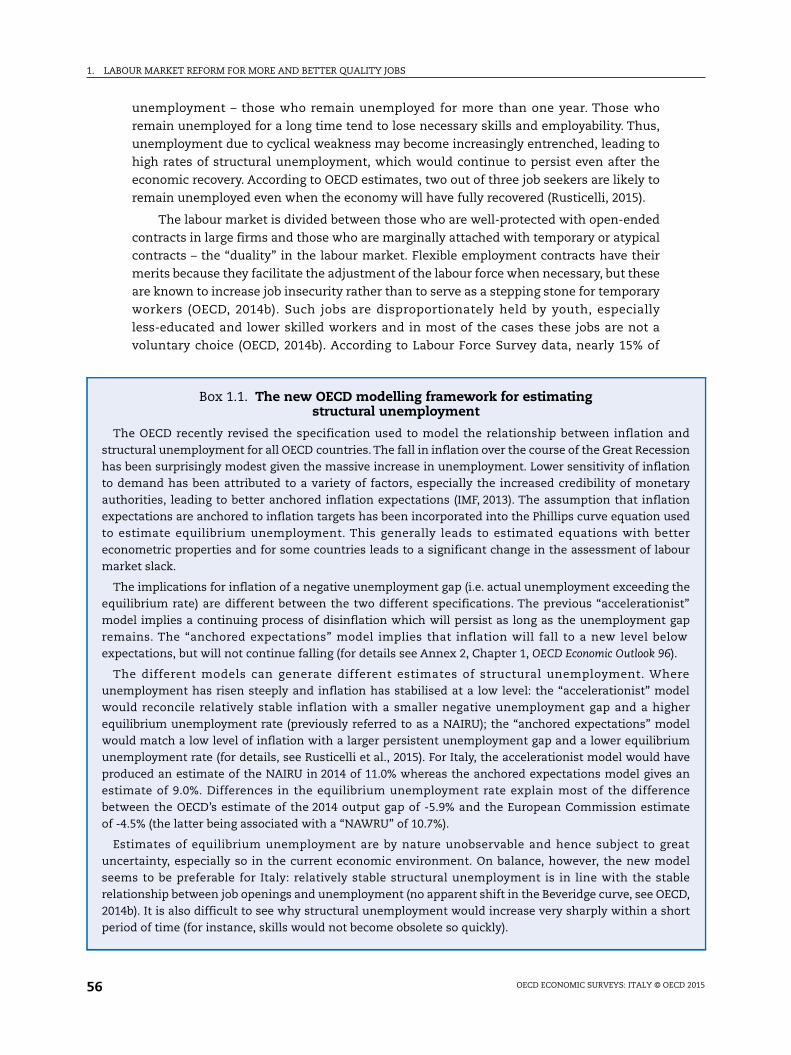
1. LABOUR MARKET REFORM FOR MORE AND BETTER QUALITY JOBS
ndionionaryionedterur
thest”apw
.
redeler
delmveance
ate
atdelbleD,
ort
unemployment – those who remain unemployed for more than one year. Those who
remain unemployed for a long time tend to lose necessary skills and employability. Thus,
unemployment due to cyclical weakness may become increasingly entrenched, leading to
high rates of structural unemployment, which would continue to persist even after the
economic recovery. According to OECD estimates, two out of three job seekers are likely to
remain unemployed even when the economy will have fully recovered (Rusticelli, 2015).
The labour market is divided between those who are well-protected with open-ended
contracts in large firms and those who are marginally attached with temporary or atypical
contracts – the “duality” in the labour market. Flexible employment contracts have their
merits because they facilitate the adjustment of the labour force when necessary, but these
are known to increase job insecurity rather than to serve as a stepping stone for temporary
workers (OECD, 2014b). Such jobs are disproportionately held by youth, especially
less-educated and lower skilled workers and in most of the cases these jobs are not a
voluntary choice (OECD, 2014b). According to Labour Force Survey data, nearly 15% of
Box 1.1. The new OECD modelling framework for estimatingstructural unemployment
The OECD recently revised the specification used to model the relationship between inflation astructural unemployment for all OECD countries. The fall in inflation over the course of the Great Recesshas been surprisingly modest given the massive increase in unemployment. Lower sensitivity of inflatto demand has been attributed to a variety of factors, especially the increased credibility of monetauthorities, leading to better anchored inflation expectations (IMF, 2013). The assumption that inflatexpectations are anchored to inflation targets has been incorporated into the Phillips curve equation usto estimate equilibrium unemployment. This generally leads to estimated equations with beteconometric properties and for some countries leads to a significant change in the assessment of labomarket slack.
The implications for inflation of a negative unemployment gap (i.e. actual unemployment exceedingequilibrium rate) are different between the two different specifications. The previous “accelerationimodel implies a continuing process of disinflation which will persist as long as the unemployment gremains. The “anchored expectations” model implies that inflation will fall to a new level beloexpectations, but will not continue falling (for details see Annex 2, Chapter 1, OECD Economic Outlook 96)
The different models can generate different estimates of structural unemployment. Wheunemployment has risen steeply and inflation has stabilised at a low level: the “accelerationist” mowould reconcile relatively stable inflation with a smaller negative unemployment gap and a highequilibrium unemployment rate (previously referred to as a NAIRU); the “anchored expectations” mowould match a low level of inflation with a larger persistent unemployment gap and a lower equilibriuunemployment rate (for details, see Rusticelli et al., 2015). For Italy, the accelerationist model would haproduced an estimate of the NAIRU in 2014 of 11.0% whereas the anchored expectations model givesestimate of 9.0%. Differences in the equilibrium unemployment rate explain most of the differenbetween the OECD’s estimate of the 2014 output gap of -5.9% and the European Commission estimof -4.5% (the latter being associated with a “NAWRU” of 10.7%).
Estimates of equilibrium unemployment are by nature unobservable and hence subject to greuncertainty, especially so in the current economic environment. On balance, however, the new moseems to be preferable for Italy: relatively stable structural unemployment is in line with the starelationship between job openings and unemployment (no apparent shift in the Beveridge curve, see OEC2014b). It is also difficult to see why structural unemployment would increase very sharply within a shperiod of time (for instance, skills would not become obsolete so quickly).
OECD ECONOMIC SURVEYS: ITALY © OECD 201556
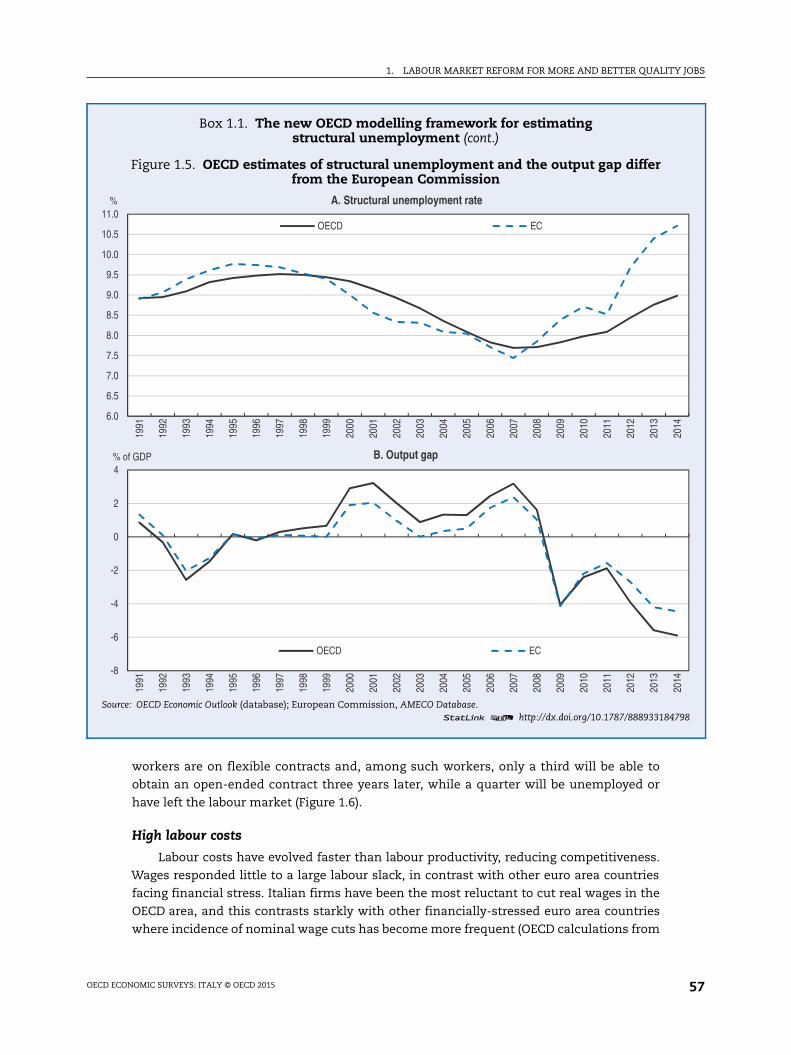
1. LABOUR MARKET REFORM FOR MORE AND BETTER QUALITY JOBS
798
2014
2014
workers are on flexible contracts and, among such workers, only a third will be able to
obtain an open-ended contract three years later, while a quarter will be unemployed or
have left the labour market (Figure 1.6).
High labour costs
Labour costs have evolved faster than labour productivity, reducing competitiveness.
Wages responded little to a large labour slack, in contrast with other euro area countries
facing financial stress. Italian firms have been the most reluctant to cut real wages in the
OECD area, and this contrasts starkly with other financially-stressed euro area countries
where incidence of nominal wage cuts has become more frequent (OECD calculations from
Box 1.1. The new OECD modelling framework for estimatingstructural unemployment (cont.)
Figure 1.5. OECD estimates of structural unemployment and the output gap differfrom the European Commission
Source: OECD Economic Outlook (database); European Commission, AMECO Database.1 2 http://dx.doi.org/10.1787/888933184
6.0
6.5
7.0
7.5
8.0
8.5
9.0
9.5
10.0
10.5
11.0
1991
1992
1993
1994
1995
1996
1997
1998
1999
2000
2001
2002
2003
2004
2005
2006
2007
2008
2009
2010
2011
2012
2013
% A. Structural unemployment rate
OECD EC
-8
-6
-4
-2
0
2
4
1991
1992
1993
1994
1995
1996
1997
1998
1999
2000
2001
2002
2003
2004
2005
2006
2007
2008
2009
2010
2011
2012
2013
% of GDP B. Output gap
OECD EC
OECD ECONOMIC SURVEYS: ITALY © OECD 2015 57
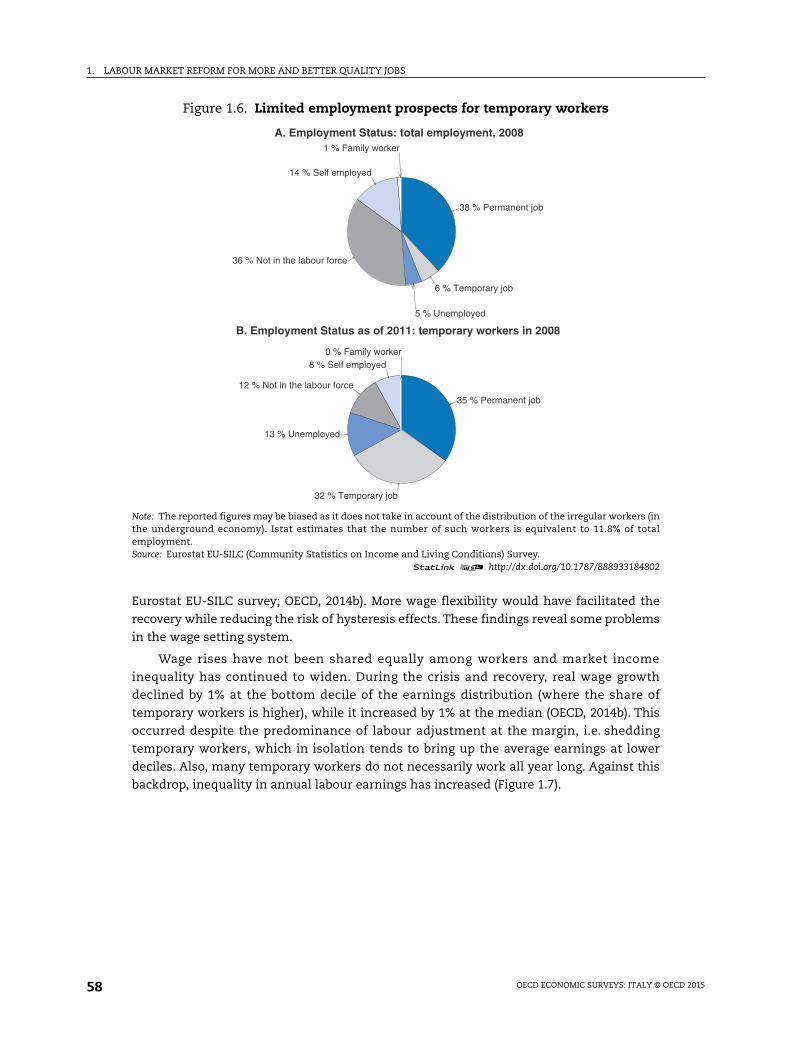
1. LABOUR MARKET REFORM FOR MORE AND BETTER QUALITY JOBS
Eurostat EU-SILC survey; OECD, 2014b). More wage flexibility would have facilitated the
recovery while reducing the risk of hysteresis effects. These findings reveal some problems
in the wage setting system.
Wage rises have not been shared equally among workers and market income
inequality has continued to widen. During the crisis and recovery, real wage growth
declined by 1% at the bottom decile of the earnings distribution (where the share of
temporary workers is higher), while it increased by 1% at the median (OECD, 2014b). This
occurred despite the predominance of labour adjustment at the margin, i.e. shedding
temporary workers, which in isolation tends to bring up the average earnings at lower
deciles. Also, many temporary workers do not necessarily work all year long. Against this
backdrop, inequality in annual labour earnings has increased (Figure 1.7).
Figure 1.6. Limited employment prospects for temporary workers
Note: The reported figures may be biased as it does not take in account of the distribution of the irregular workers (inthe underground economy). Istat estimates that the number of such workers is equivalent to 11.8% of totalemployment.Source: Eurostat EU-SILC (Community Statistics on Income and Living Conditions) Survey.
1 2 http://dx.doi.org/10.1787/888933184802
38 % Permanent job
6 % Temporary job
5 % Unemployed
36 % Not in the labour force
14 % Self employed
1 % Family worker
A. Employment Status: total employment, 2008
35 % Permanent job
32 % Temporary job
13 % Unemployed
12 % Not in the labour force
8 % Self employed0 % Family worker
B. Employment Status as of 2011: temporary workers in 2008
OECD ECONOMIC SURVEYS: ITALY © OECD 201558
1. LABOUR MARKET REFORM FOR MORE AND BETTER QUALITY JOBS
r Chilenstead
Income
184816
t incomes
7
7
Household income inequality
Net household income inequality has increased and the redistribution system has not
been well designed to remedy it. As identified by a comprehensive OECD study on inequality
(OECD, 2011a), labour earnings inequality as well as longer jobless spells contributed
significantly to the overall inequality. In Italy, rising household income inequality has not
been contained through the redistribution system. The unemployment benefit system has
not been universal, excluding de facto workers with flexible employment contracts due to
short tenure, and any non-contributory benefit (on account solely of low income) did not
exist. Overall, Italy’s social safety net is currently not well designed (Figure 1.8), though the
needs for social assistance are increasing with the weak economic situation.
The government’s labour market reform package: Will it work?The government’s programme for the labour market and social policy is broadly set
out in the Jobs Act. The Act seeks to outline a number of broad objectives for the labour
market, which the government will be entrusted to implement. It aims to go further than
earlier reforms. Its broad orientation seems to be adequate and consistent: reforming
employment protection legislation and its dualism, which would allow more efficient
turnover, and extending social safety nets as well as strengthening activation policies,
which would help people attached to the labour market.
Figure 1.7. Both earnings and household income inequality have increased
Note: Gini coefficients refer to 2009 for Hungary, New Zealand, Japan and Turkey, and 2011 for Chile instead of 2010, and to 2006 foand Japan, 2008 for Australia, Finland, France, Germany, Israel, Mexico, New Zealand, Norway, Sweden and the United States iof 2007. Data for Switzerland are not available for 2007.Source: OECD (2014), Society at a Glance 2014, Chapter 5, OECD Publishing, Paris, www.oecd.org/social/societyataglance.htm; OECDDistribution Database, www.oecd.org/social/inequality.htm.
1 2 http://dx.doi.org/10.1787/888933
IcelandSloveniaNorway
DenmarkCzech Republic
FinlandSlovak Republic
BelgiumAustriaSweden
LuxembourgHungaryGermany
NetherlandsSwitzerland
FrancePolandIrelandKoreaOECD
New ZealandItaly
EstoniaCanadaAustralia
JapanGreeceSpain
United KingdomPortugal
IsraelUnited States
TurkeyMexicoChile
Panel A. Gini coefficient of household disposable income and gap between richest and poorest 10% in 2010
Panel B. Percentage point change in the Gini coefficient at disposable and markebetween 2007 and 2010
0.24
0.25
0.25
0.25
0.26
0.26
0.26
0.26
0.27
0.27
0.27
0.27
0.29
0.29
0.30
0.30
0.31
0.31
0.31
0.31
0.32
0.32
0.32
0.32
0.33
0.34
0.34
0.34
0.34
0.34
0.38
0.38
0.41
0.47
0.50
051015202530
0.200.250.300.350.400.450.50
Gini coefficient ( , top scale) S90/S10 income decile share (bottom scale)
-4 -3 -2 -1 0 1 2 3 4 5 6
-4 -3 -2 -1 0 1 2 3 4 5 6
Disposable income inequality Market income inequality
OECD ECONOMIC SURVEYS: ITALY © OECD 2015 59
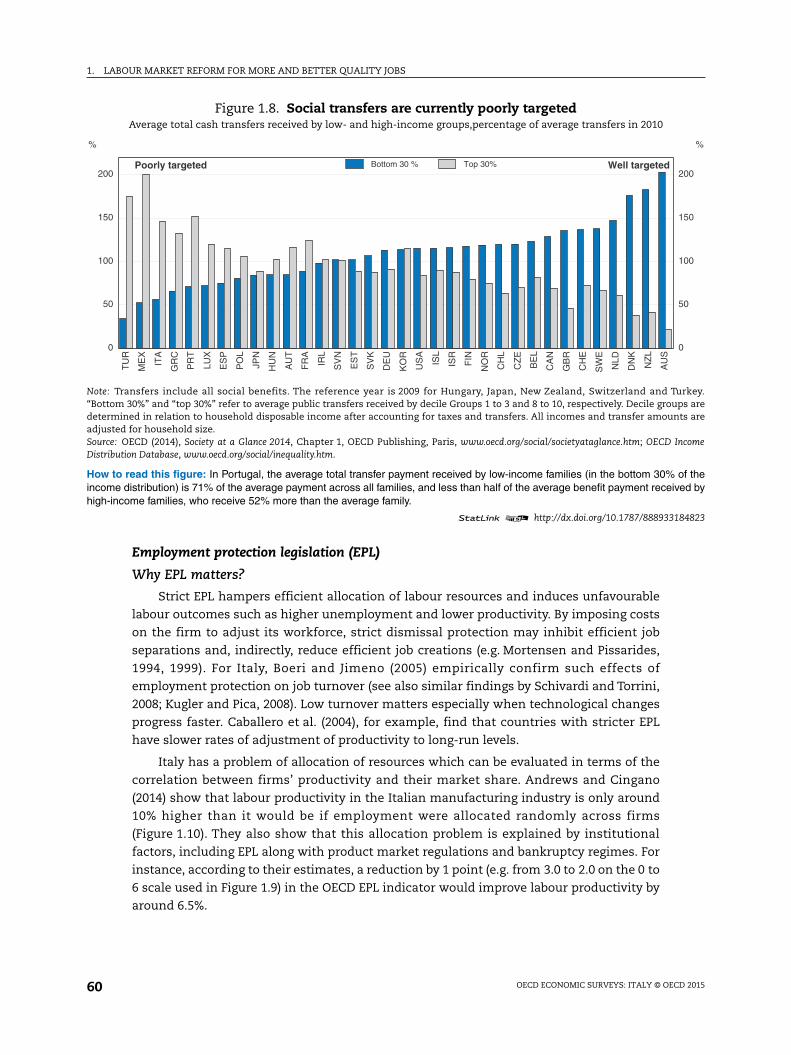
1. LABOUR MARKET REFORM FOR MORE AND BETTER QUALITY JOBS
urkey.ps are
nts are
Income
of theived by
184823
0
50
100
150
200
%
Employment protection legislation (EPL)
Why EPL matters?
Strict EPL hampers efficient allocation of labour resources and induces unfavourable
labour outcomes such as higher unemployment and lower productivity. By imposing costs
on the firm to adjust its workforce, strict dismissal protection may inhibit efficient job
separations and, indirectly, reduce efficient job creations (e.g. Mortensen and Pissarides,
1994, 1999). For Italy, Boeri and Jimeno (2005) empirically confirm such effects of
employment protection on job turnover (see also similar findings by Schivardi and Torrini,
2008; Kugler and Pica, 2008). Low turnover matters especially when technological changes
progress faster. Caballero et al. (2004), for example, find that countries with stricter EPL
have slower rates of adjustment of productivity to long-run levels.
Italy has a problem of allocation of resources which can be evaluated in terms of the
correlation between firms’ productivity and their market share. Andrews and Cingano
(2014) show that labour productivity in the Italian manufacturing industry is only around
10% higher than it would be if employment were allocated randomly across firms
(Figure 1.10). They also show that this allocation problem is explained by institutional
factors, including EPL along with product market regulations and bankruptcy regimes. For
instance, according to their estimates, a reduction by 1 point (e.g. from 3.0 to 2.0 on the 0 to
6 scale used in Figure 1.9) in the OECD EPL indicator would improve labour productivity by
around 6.5%.
Figure 1.8. Social transfers are currently poorly targetedAverage total cash transfers received by low- and high-income groups,percentage of average transfers in 2010
Note: Transfers include all social benefits. The reference year is 2009 for Hungary, Japan, New Zealand, Switzerland and T“Bottom 30%” and “top 30%” refer to average public transfers received by decile Groups 1 to 3 and 8 to 10, respectively. Decile groudetermined in relation to household disposable income after accounting for taxes and transfers. All incomes and transfer amouadjusted for household size.Source: OECD (2014), Society at a Glance 2014, Chapter 1, OECD Publishing, Paris, www.oecd.org/social/societyataglance.htm; OECDDistribution Database, www.oecd.org/social/inequality.htm.
How to read this figure: In Portugal, the average total transfer payment received by low-income families (in the bottom 30%income distribution) is 71% of the average payment across all families, and less than half of the average benefit payment recehigh-income families, who receive 52% more than the average family.
1 2 http://dx.doi.org/10.1787/888933
0
50
100
150
200
%
TU
R
ME
X
ITA
GR
C
PR
T
LUX
ES
P
PO
L
JPN
HU
N
AU
T
FR
A
IRL
SV
N
ES
T
SV
K
DE
U
KO
R
US
A
ISL
ISR
FIN
NO
R
CH
L
CZ
E
BE
L
CA
N
GB
R
CH
E
SW
E
NLD
DN
K
NZ
L
AU
S
Poorly targeted Well targetedBottom 30 % Top 30%
OECD ECONOMIC SURVEYS: ITALY © OECD 201560
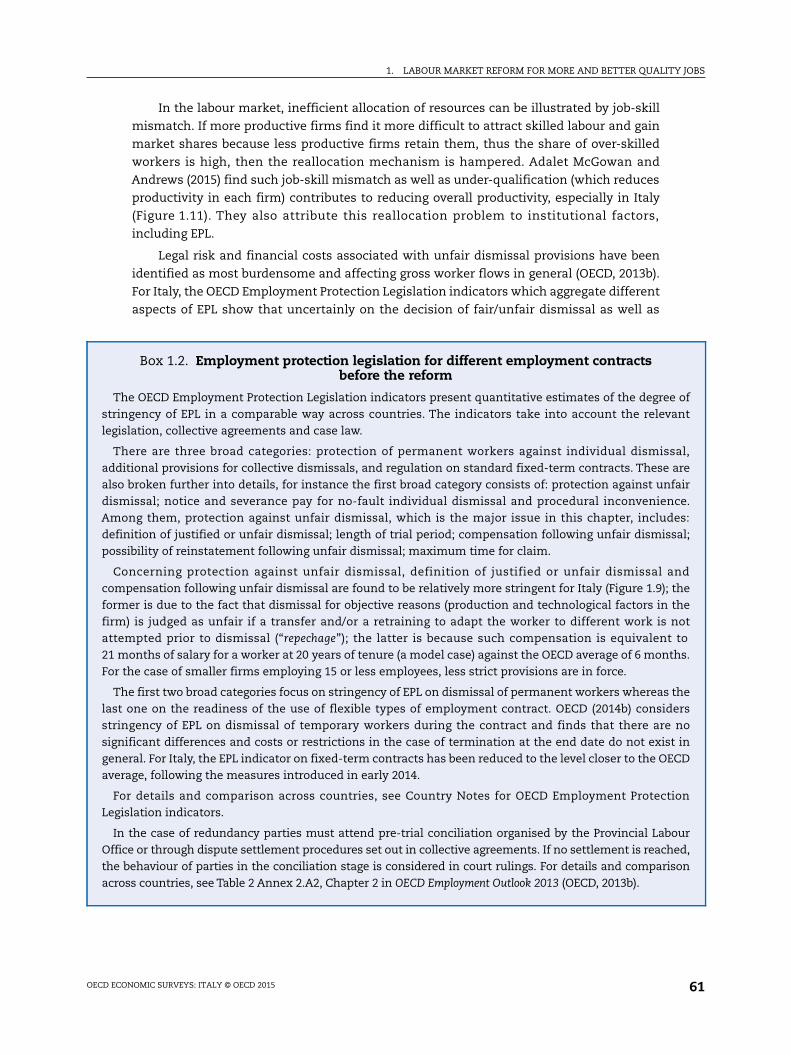
1. LABOUR MARKET REFORM FOR MORE AND BETTER QUALITY JOBS
ofnt
al,areairce.es:al;
ndthethe
ottohs.
theersnoin
CD
on
ured,on
In the labour market, inefficient allocation of resources can be illustrated by job-skill
mismatch. If more productive firms find it more difficult to attract skilled labour and gain
market shares because less productive firms retain them, thus the share of over-skilled
workers is high, then the reallocation mechanism is hampered. Adalet McGowan and
Andrews (2015) find such job-skill mismatch as well as under-qualification (which reduces
productivity in each firm) contributes to reducing overall productivity, especially in Italy
(Figure 1.11). They also attribute this reallocation problem to institutional factors,
including EPL.
Legal risk and financial costs associated with unfair dismissal provisions have been
identified as most burdensome and affecting gross worker flows in general (OECD, 2013b).
For Italy, the OECD Employment Protection Legislation indicators which aggregate different
aspects of EPL show that uncertainly on the decision of fair/unfair dismissal as well as
Box 1.2. Employment protection legislation for different employment contractsbefore the reform
The OECD Employment Protection Legislation indicators present quantitative estimates of the degreestringency of EPL in a comparable way across countries. The indicators take into account the relevalegislation, collective agreements and case law.
There are three broad categories: protection of permanent workers against individual dismissadditional provisions for collective dismissals, and regulation on standard fixed-term contracts. Thesealso broken further into details, for instance the first broad category consists of: protection against unfdismissal; notice and severance pay for no-fault individual dismissal and procedural inconvenienAmong them, protection against unfair dismissal, which is the major issue in this chapter, includdefinition of justified or unfair dismissal; length of trial period; compensation following unfair dismisspossibility of reinstatement following unfair dismissal; maximum time for claim.
Concerning protection against unfair dismissal, definition of justified or unfair dismissal acompensation following unfair dismissal are found to be relatively more stringent for Italy (Figure 1.9);former is due to the fact that dismissal for objective reasons (production and technological factors infirm) is judged as unfair if a transfer and/or a retraining to adapt the worker to different work is nattempted prior to dismissal (“repechage”); the latter is because such compensation is equivalent21 months of salary for a worker at 20 years of tenure (a model case) against the OECD average of 6 montFor the case of smaller firms employing 15 or less employees, less strict provisions are in force.
The first two broad categories focus on stringency of EPL on dismissal of permanent workers whereaslast one on the readiness of the use of flexible types of employment contract. OECD (2014b) considstringency of EPL on dismissal of temporary workers during the contract and finds that there aresignificant differences and costs or restrictions in the case of termination at the end date do not existgeneral. For Italy, the EPL indicator on fixed-term contracts has been reduced to the level closer to the OEaverage, following the measures introduced in early 2014.
For details and comparison across countries, see Country Notes for OECD Employment ProtectiLegislation indicators.
In the case of redundancy parties must attend pre-trial conciliation organised by the Provincial LaboOffice or through dispute settlement procedures set out in collective agreements. If no settlement is reachthe behaviour of parties in the conciliation stage is considered in court rulings. For details and comparisacross countries, see Table 2 Annex 2.A2, Chapter 2 in OECD Employment Outlook 2013 (OECD, 2013b).
OECD ECONOMIC SURVEYS: ITALY © OECD 2015 61
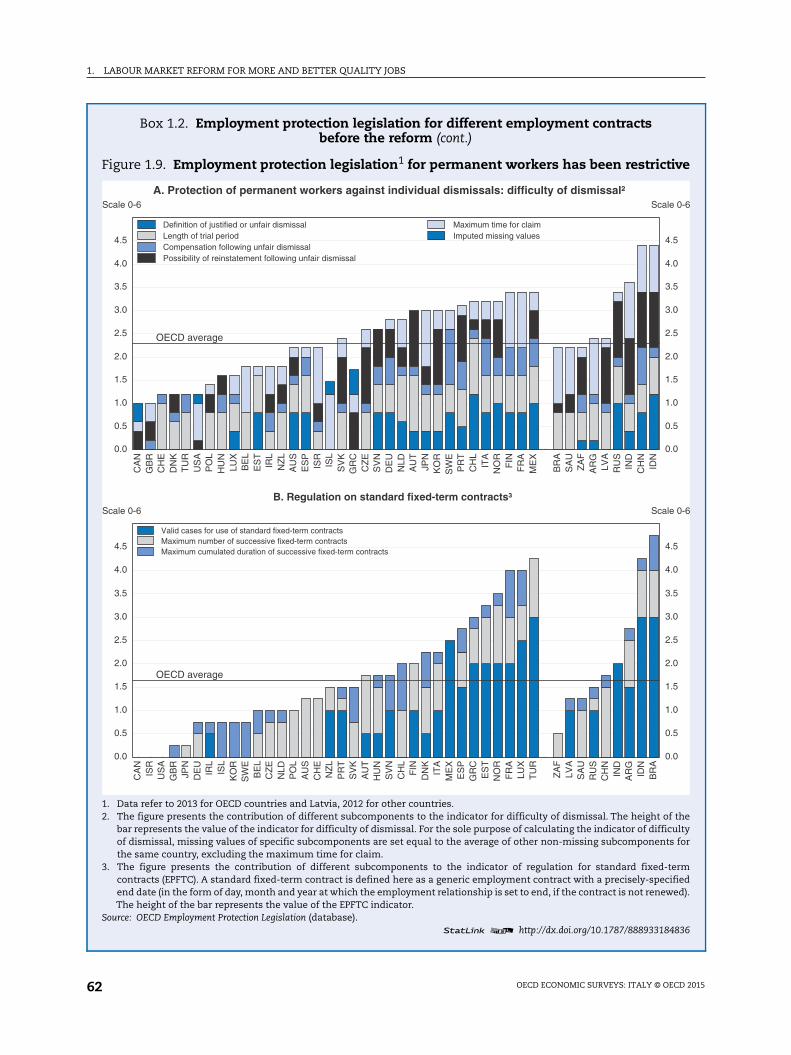
1. LABOUR MARKET REFORM FOR MORE AND BETTER QUALITY JOBS
ve
theultyfor
rmfieded).
836
0
5
0
5
0
5
0
5
0
5
0-6
0
5
0
5
0
5
0
5
0
5
0-6
Box 1.2. Employment protection legislation for different employment contractsbefore the reform (cont.)
Figure 1.9. Employment protection legislation1 for permanent workers has been restricti
1. Data refer to 2013 for OECD countries and Latvia, 2012 for other countries.2. The figure presents the contribution of different subcomponents to the indicator for difficulty of dismissal. The height of
bar represents the value of the indicator for difficulty of dismissal. For the sole purpose of calculating the indicator of difficof dismissal, missing values of specific subcomponents are set equal to the average of other non-missing subcomponentsthe same country, excluding the maximum time for claim.
3. The figure presents the contribution of different subcomponents to the indicator of regulation for standard fixed-tecontracts (EPFTC). A standard fixed-term contract is defined here as a generic employment contract with a precisely-speciend date (in the form of day, month and year at which the employment relationship is set to end, if the contract is not renewThe height of the bar represents the value of the EPFTC indicator.
Source: OECD Employment Protection Legislation (database).1 2 http://dx.doi.org/10.1787/888933184
0.0
0.5
1.0
1.5
2.0
2.5
3.0
3.5
4.0
4.5
Scale 0-6
0.
0.
1.
1.
2.
2.
3.
3.
4.
4.
Scale
CA
NG
BR
CH
ED
NK
TU
RU
SA
PO
LH
UN
LUX
BE
LE
ST
IRL
NZ
LA
US
ES
PIS
RIS
LS
VK
GR
CC
ZE
SV
ND
EU
NLD
AU
TJP
NK
OR
SW
EP
RT
CH
LIT
AN
OR
FIN
FR
AM
EX
BR
AS
AU
ZA
FA
RG
LVA
RU
SIN
DC
HN
IDN
OECD average
Definition of justified or unfair dismissalLength of trial periodCompensation following unfair dismissalPossibility of reinstatement following unfair dismissal
Maximum time for claimImputed missing values
A. Protection of permanent workers against individual dismissals: difficulty of dismissal²
0.0
0.5
1.0
1.5
2.0
2.5
3.0
3.5
4.0
4.5
Scale 0-6
0.
0.
1.
1.
2.
2.
3.
3.
4.
4.
Scale
CA
NIS
RU
SA
GB
RJP
ND
EU
IRL
ISL
KO
RS
WE
BE
LC
ZE
NLD
PO
LA
US
CH
EN
ZL
PR
TS
VK
AU
TH
UN
SV
NC
HL
FIN
DN
KIT
AM
EX
ES
PG
RC
ES
TN
OR
FR
ALU
XT
UR
ZA
FLV
AS
AU
RU
SC
HN
IND
AR
GID
NB
RA
OECD average
Valid cases for use of standard fixed-term contractsMaximum number of successive fixed-term contractsMaximum cumulated duration of successive fixed-term contracts
B. Regulation on standard fixed-term contracts³
OECD ECONOMIC SURVEYS: ITALY © OECD 201562
1. LABOUR MARKET REFORM FOR MORE AND BETTER QUALITY JOBS
shares.tion ofs firmstates isFrance,ned by
onomic
n
monetary compensation following unfair dismissal are key problems (Box 1.2). The EPL
indicators also show that regulation on fixed-term contracts is close to the OECD average,
pointing to the remaining duality in the Italian labour market.
A recent reform attempted to reduce dualism
The government in place during 2011-13 introduced a wide-ranging reform to achieve
a better balance of employment protection between permanent and temporary/atypical
workers. It relaxed the protection of permanent workers, restricting the possibility of
reinstatement following unfair dismissal (Table 1.2). It also introduced mandatory
conciliation mechanism before lodging a complaint with courts, aiming at simplifying
procedures for dismissal cases.
As a result, the difficulty of dismissal procedures seems to have eased, although this
has not so far provided the intended result of encouraging hiring of permanent workers.
The frequency of reinstatement in case of unfair dismissal has been reduced as far as
dismissal for objective reasons (motivo oggettivo, i.e. due to production and technological
Figure 1.10. Allocation of labour to the most productive firms is limitedCovariance across firms between firm size and labour productivity; log points;
manufacturing sector in selected OECD countries in 2005
Notes: The estimates show the extent to which the firms with higher than average labour productivity have larger employmentIn most countries, the covariance between productivity and employment share is positive, suggesting that the actual allocaemployment boosts manufacturing labour productivity, compared to a situation where resources were allocated randomly acros(this metric would equal zero if labour was allocated randomly). For example, manufacturing labour productivity in the United Sboosted by around 50% due to the rational allocation of resources. Europe-14 includes: Austria, Belgium, the Czech Republic,Greece, Germany, Hungary, Italy, the Netherlands, Portugal, Poland, Spain, the Slovak Republic and Switzerland, and is obtaiaggregating the respective allocative efficiency indicators by each countries share in manufacturing sector employment.Source: Andrews, D. and F. Cingano (2014), “Public Policy and Resource Allocation: Evidence from Firms in OECD Countries”, EcPolicy, Vol. 29(78), pp. 253-296.
-0.7
-0.5
-0.3
-0.1
0.1
0.3
0.5
0.7
0.9
More productive firms are on average larger thaless productive firrms
More productive firms have less resources than if resources were randomly allocated
OECD ECONOMIC SURVEYS: ITALY © OECD 2015 63
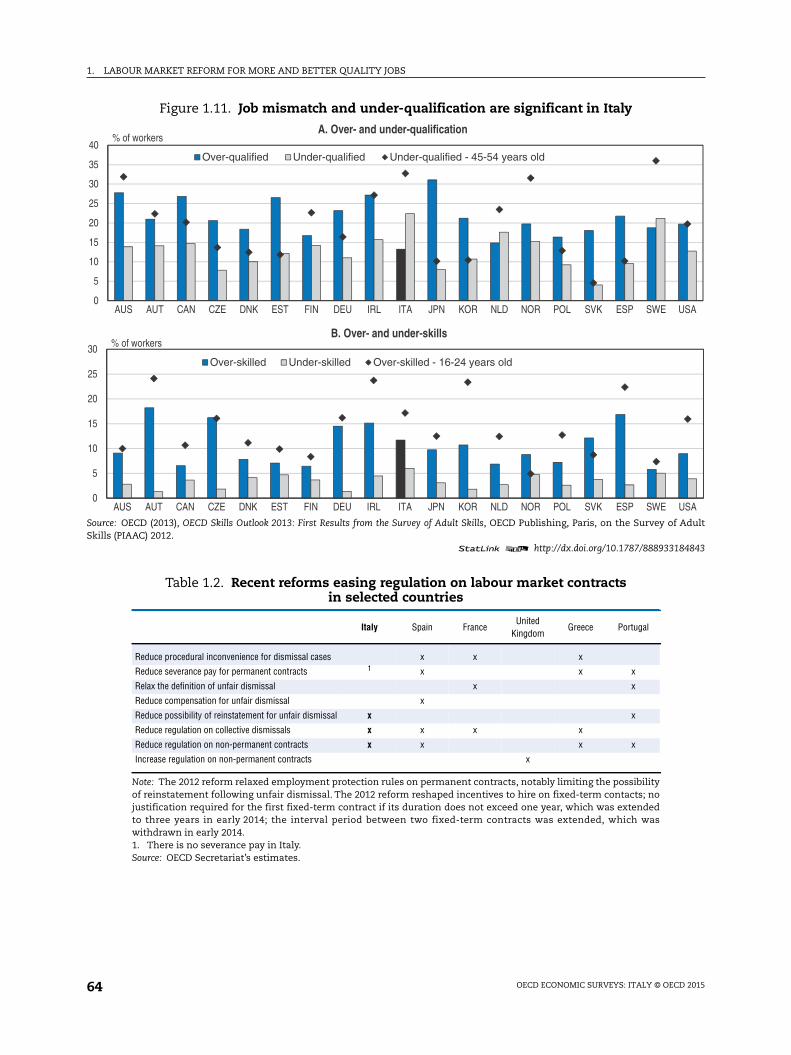
1. LABOUR MARKET REFORM FOR MORE AND BETTER QUALITY JOBS
f Adult
184843
USA
USA
Figure 1.11. Job mismatch and under-qualification are significant in Italy
Source: OECD (2013), OECD Skills Outlook 2013: First Results from the Survey of Adult Skills, OECD Publishing, Paris, on the Survey oSkills (PIAAC) 2012.
1 2 http://dx.doi.org/10.1787/888933
0
5
10
15
20
25
30
35
40
AUS AUT CAN CZE DNK EST FIN DEU IRL ITA JPN KOR NLD NOR POL SVK ESP SWE
% of workersA. Over- and under-qualification
Over-qualified Under-qualified Under-qualified - 45-54 years old
0
5
10
15
20
25
30
AUS AUT CAN CZE DNK EST FIN DEU IRL ITA JPN KOR NLD NOR POL SVK ESP SWE
% of workersB. Over- and under-skills
Over-skilled Under-skilled Over-skilled - 16-24 years old
Table 1.2. Recent reforms easing regulation on labour market contractsin selected countries
Italy Spain FranceUnited
KingdomGreece Portugal
Reduce procedural inconvenience for dismissal cases x x x
Reduce severance pay for permanent contracts 1 x x x
Relax the definition of unfair dismissal x x
Reduce compensation for unfair dismissal x
Reduce possibility of reinstatement for unfair dismissal x x
Reduce regulation on collective dismissals x x x x
Reduce regulation on non-permanent contracts x x x x
Increase regulation on non-permanent contracts x
Note: The 2012 reform relaxed employment protection rules on permanent contracts, notably limiting the possibilityof reinstatement following unfair dismissal. The 2012 reform reshaped incentives to hire on fixed-term contacts; nojustification required for the first fixed-term contract if its duration does not exceed one year, which was extendedto three years in early 2014; the interval period between two fixed-term contracts was extended, which waswithdrawn in early 2014.1. There is no severance pay in Italy.Source: OECD Secretariat’s estimates.
OECD ECONOMIC SURVEYS: ITALY © OECD 201564
1. LABOUR MARKET REFORM FOR MORE AND BETTER QUALITY JOBS
factors in the firm) is concerned. However, this has not yet resulted in encouraging firms to
use open-ended contracts more widely: the number of new open-ended contracts has been
decreasing while fixed-term contracts continue to account for a large share of labour
turnover. The reduction in the use of atypical contracts has been the only visible outcome
so far (Ministry of Labour, 2014).
The Jobs Act streamlines labour contracts further
The Jobs Act aims at simplifying and streamlining dismissal rules further. A substantial
part of the Jobs Act will be introduced through the enabling law which passed through
Parliament late 2014. A new standard contract with employment protection increasing with
tenure was swiftly introduced after the adoption of the Law in late December 2014. The Jobs
Act also limits further the possibility of reinstatement of workers following unfair dismissal,
excluding this possibility for dismissal for objective reasons. It preserves access to courts in
case of invalid and discriminatory dismissals (because of race, gender, religion or disability)
and for very specific cases of unfair disciplinary dismissals, though courts will be requested
to ascertain only the existence of alleged facts and not the proportionality between worker’s
misconduct and dismissal. These new arrangements will imply quite radical changes for
Italy. To avoid unwarranted disruption, the new dismissal procedures will be applied only to
new employment contracts (“grandfathering” existing rights).
According to the Jobs Act, workers unfairly dismissed for objective reasons will receive
monetary compensation increasing with the tenure, instead of being reinstated. The
monetary compensation will be equal to 2 monthly wages per year of service (a minimum
amount equivalent to 4 months and a maximum amount equivalent to 24 monthly wages).
By increasing predictability the Jobs Act lowers the effective costs of dismissal, even if
judged to be unfair by courts, helping firms create more jobs. The amount of such
compensation could be reconsidered, however; it is currently very high, considering the
OECD average of 14 months at 20 years of tenure (see OECD, 2013b).
The Jobs Act also introduces a new form of out-of-court procedure, according to which
the employer can pay the worker an indemnity equal to 1 monthly wage per year of service
(a minimum amount equivalent to 2 monthly wages and a maximum amount equivalent
to 18 monthly wages). This compensation could be considered as similar in some respects
to severance pay. The acceptance of this transaction prevents any further dispute by the
worker, that is, appealing to courts for a dismissal to be unfair or not. Both parties have a
strong incentive to settle the dispute through this procedure, since the sum paid is not
subject to social contribution or fiscal taxation. The government is committed to monitor
the developments on this new procedure and, if necessary, it should consider alternative
measures to reduce uncertainty on court decision.
Unemployment benefits and social assistance
The problems with the unemployment benefit system
Unemployment benefits help to improve the labour market if well-designed. However,
if too generous, especially in terms of income replacement, they may have pervasive
effects on labour supply incentives. The replacement income offered by unemployment
benefits improves the outside option of workers and raises the reservation wage above
which workers generally accept to work. This generates upward pressure on the average
wage and raises the unemployment rate (Pissarides, 2000). If unemployment benefits are
OECD ECONOMIC SURVEYS: ITALY © OECD 2015 65
1. LABOUR MARKET REFORM FOR MORE AND BETTER QUALITY JOBS
entneed,he
ion
heat
osso at is
the
orsus
gellyityor
o aiesion
is/or
ifverO.
generous only for those with permanent contracts, and not for new entrants with
temporary contracts, then they generate wage premium for the former, though at a higher
risk of job destruction for them, resulting in a higher unemployment rate in an economy as
a whole (Boeri, 2011).
In Italy, the unemployment benefit system provides generous benefits for those with
permanent contracts, while its coverage for non-regular workers has been very low (Box 1.3).
The standard unemployment benefit (UB) had a replacement rate close to the OECD average,
but with a relatively short duration. At the same time, additional benefits (notably Cassa
Integrazione Ordinaria, CIG-O; Cassa Integrazione Straordinaria, CIG-S; Indennità di Mobilità, IM;
see Box 1.3) have been provided for workers in specific sectors under certain circumstances.
These benefits are generous in terms of both the replacement rate and duration.
Box 1.3. Unemployment and social benefit system in transition
The 2012 reform overhauled the unemployment benefit system. The previous ordinary unemploymbenefit will have been gradually replaced by the Assicurazione Sociale per l’Impiego (ASpI), integrated with oof the special benefits (IM, see below), by 2017. The eligibility condition for the ASpI remains unchangrequiring two years of contributions, of which 52 weeks have been accumulated in the last 2 years. Tso-called “mini-ASpI” is made available for those not qualifying for the ASpI, with a minimum contributof 12 weeks in the last 52.
ASpI (EUR 2.725 million, 960 000 beneficiaries in 2013) is paid to workers individually laid off in tprivate sector or collectively laid off but not eligible for other benefits who have paid contributions forleast 52 weeks during the two-year period prior to unemployment. The benefit is 75% of the average grearnings received over the last 3 months for the first 6 months following unemployment, subject tthreshold (EUR 1 180 as of 2013) above which this ratio is reduced. After 6 months, the benefit amounreduced to 60%. The benefit duration is 8 months (for those over 50 years old, it is 12 months).
Mini-ASpI (EUR 1 447 million, 380 000 beneficiaries in 2013) has the same amount payable as that forfull ASpI. The duration is limited to 50% of the contribution record for the past 12 months.
There are also special benefits which are provided in a sequential way to workers in specific sectunder certain circumstances. When added up, these benefits accounted for much more than the previoordinary unemployment benefit.
Cassa Integrazione Ordinaria, CIG-O (EUR 1 132 million, estimated 90 000 beneficiaries in 2013), wasupplementation for short-time working scheme (thus not exactly an unemployment benefit), is usuapaid for 13 weeks but it is possible to obtain some prorogation if the firm remains in a reduction of activfor a longer period. In any case, CIG-O cannot be paid for more than 12 months, whether consecutivenon-consecutive, over a period of 2 years. The replacement ratio is 80% of the previous salary subject tmonthly ceiling (EUR 1 166 as of 2013). The beneficiaries are those who work in the firms where activitare reduced or suspended due to cyclical weakness or unforeseen events in the industry and constructsectors (where the social security contribution rate is higher by some 2%).
Cassa Integrazione Straordinaria, CIG-S (EUR 1 952 million, estimated 140 000 beneficiaries in 2013)normally paid for 12 up to 24 months. The beneficiaries are those who work in firms facing crisis andrestructuring in the industry sector or other designated sectors. It is possible to obtain prorogationrestructuring lasts more than 24 months. In any case, CIG-S cannot be paid for more than 36 months o5 years. The replacement ratio is 80% of the previous salary subject to the same monthly ceiling as CIG-
OECD ECONOMIC SURVEYS: ITALY © OECD 201566
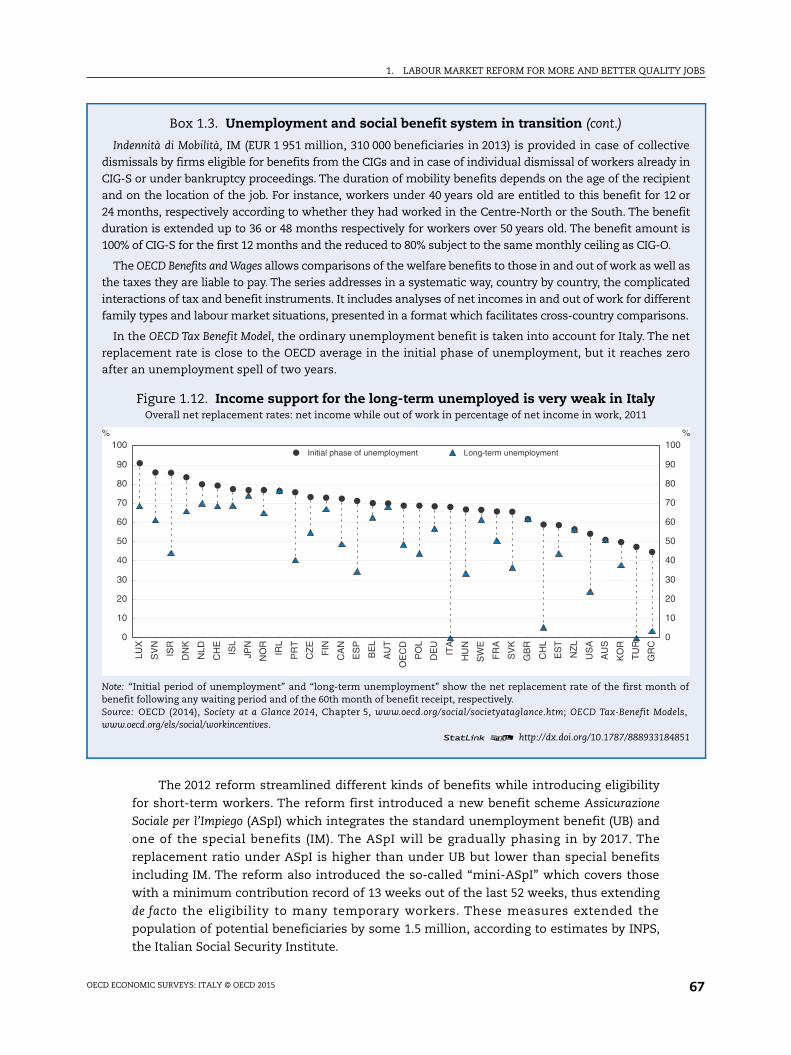
1. LABOUR MARKET REFORM FOR MORE AND BETTER QUALITY JOBS
ivein
entor
efitt is
l astedentns.
netero
of
els,
851
0%
The 2012 reform streamlined different kinds of benefits while introducing eligibility
for short-term workers. The reform first introduced a new benefit scheme Assicurazione
Sociale per l’Impiego (ASpI) which integrates the standard unemployment benefit (UB) and
one of the special benefits (IM). The ASpI will be gradually phasing in by 2017. The
replacement ratio under ASpI is higher than under UB but lower than special benefits
including IM. The reform also introduced the so-called “mini-ASpI” which covers those
with a minimum contribution record of 13 weeks out of the last 52 weeks, thus extending
de facto the eligibility to many temporary workers. These measures extended the
population of potential beneficiaries by some 1.5 million, according to estimates by INPS,
the Italian Social Security Institute.
Box 1.3. Unemployment and social benefit system in transition (cont.)
Indennità di Mobilità, IM (EUR 1 951 million, 310 000 beneficiaries in 2013) is provided in case of collectdismissals by firms eligible for benefits from the CIGs and in case of individual dismissal of workers alreadyCIG-S or under bankruptcy proceedings. The duration of mobility benefits depends on the age of the recipiand on the location of the job. For instance, workers under 40 years old are entitled to this benefit for 1224 months, respectively according to whether they had worked in the Centre-North or the South. The benduration is extended up to 36 or 48 months respectively for workers over 50 years old. The benefit amoun100% of CIG-S for the first 12 months and the reduced to 80% subject to the same monthly ceiling as CIG-O.
The OECD Benefits and Wages allows comparisons of the welfare benefits to those in and out of work as welthe taxes they are liable to pay. The series addresses in a systematic way, country by country, the complicainteractions of tax and benefit instruments. It includes analyses of net incomes in and out of work for differfamily types and labour market situations, presented in a format which facilitates cross-country compariso
In the OECD Tax Benefit Model, the ordinary unemployment benefit is taken into account for Italy. Thereplacement rate is close to the OECD average in the initial phase of unemployment, but it reaches zafter an unemployment spell of two years.
Figure 1.12. Income support for the long-term unemployed is very weak in ItalyOverall net replacement rates: net income while out of work in percentage of net income in work, 2011
Note: “Initial period of unemployment” and “long-term unemployment” show the net replacement rate of the first monthbenefit following any waiting period and of the 60th month of benefit receipt, respectively.Source: OECD (2014), Society at a Glance 2014, Chapter 5, www.oecd.org/social/societyataglance.htm; OECD Tax-Benefit Modwww.oecd.org/els/social/workincentives.
1 2 http://dx.doi.org/10.1787/888933184
0
10
20
30
40
50
60
70
80
90
100%
0
10
20
30
40
50
60
70
80
90
10
LUX
SV
N
ISR
DN
K
NLD
CH
E
ISL
JPN
NO
R
IRL
PR
T
CZ
E
FIN
CA
N
ES
P
BE
L
AU
T
OE
CD
PO
L
DE
U
ITA
HU
N
SW
E
FR
A
SV
K
GB
R
CH
L
ES
T
NZ
L
US
A
AU
S
KO
R
TU
R
GR
C
Initial phase of unemployment Long-term unemployment
OECD ECONOMIC SURVEYS: ITALY © OECD 2015 67
1. LABOUR MARKET REFORM FOR MORE AND BETTER QUALITY JOBS
The Jobs Act integrates the benefit system
The Jobs Act further extends the coverage of unemployment benefits, consistent with
easing EPL, thus bringing Italy closer to a “flexicurity” approach. The Jobs Act integrates
ASpI and mini-ASpI, thus harmonising their different eligibility requirements and
durations. The “new ASpI” will be paid for a duration reflecting the number of weeks of
contributions over a longer reference period and it will be extended – on an experimental
basis – to around 350 000 project workers (currently excluded from the protection).
The Jobs Act will also more closely associate the provision of unemployment benefits
with individual efforts made to return to work. The implementation of such “mutual
obligation” approach depends on detailed criteria, such as the types of jobs that an
unemployed person must accept, the degree of geographical mobility that is required and
requirements concerning job referrals and active job search (OECD, 2013b). In addition, this
may include the obligation to enter into employment and training programmes enforced
by benefit sanctions, (OECD, 2013b).
The Jobs Act will reform the social assistance provided to vulnerable people attached
to the labour market. In Italy, non-contributory benefits (on account solely of low income)
have not existed. The government introduced a new pilot programme, Sostegno per
l’Inclusione Attiva (SIA) to support the population in poverty. SIA targets households with
children and a working-age member out of employment for at least three years. It aims at
closing the gap between the household income and the absolute poverty level. In return,
beneficiaries must commit to an activation plan. The Jobs Act plans to extend the coverage
of SIA, but it will fall short of financing all the population in poverty. SIA should be
prioritised so that it extends its coverage as much as public finance would allow, while
avoiding perverse effects on labour incentives.
Active labour market policies (ALMPs)
What can be expected from ALMPs?
ALMPs aim to strengthen matching efficiency in the labour market, reducing frictions
in the vacancy filling process by assisting job seekers. ALMPs act on recruitment costs
(through job counselling, placement services, etc.) as well as on after-tax wages (making
work pay). Such measures encourage firms to open new vacancies and unemployed
workers to accept a job. Thus, both parties are better off from a job matching, the profit of
which is shared depending on their bargaining power (Boeri, 2011). ALMPs are targeted to
new job matches by definition and they are opportune when the new standard contract
imposes some disadvantage on newly hired workers.
In Italy, ALMPs have been under-developed and their implementation has been
dispersed across regions. The budget allocated to ALMPs has been much lower than the EU
average (Figure 1.13). Local authorities manage the implementation and design of ALMPs.
They take into account regional-specific economic and social situations, thus possibly
pursuing different efficiency goals. Provision of social benefits, on the other hand, has been
managed at the central level by INPS with virtually no direct link between passive and
active policies.
The previous government began strengthening ALMPs in 2013 while designing the
national plan for the EU Youth Guarantee programme. That government launched a new
Struttura di missione in the Ministry of Labour, to co-ordinate and promote active policies:
collecting data on public employment services (PESs); defining national guidelines for
OECD ECONOMIC SURVEYS: ITALY © OECD 201568
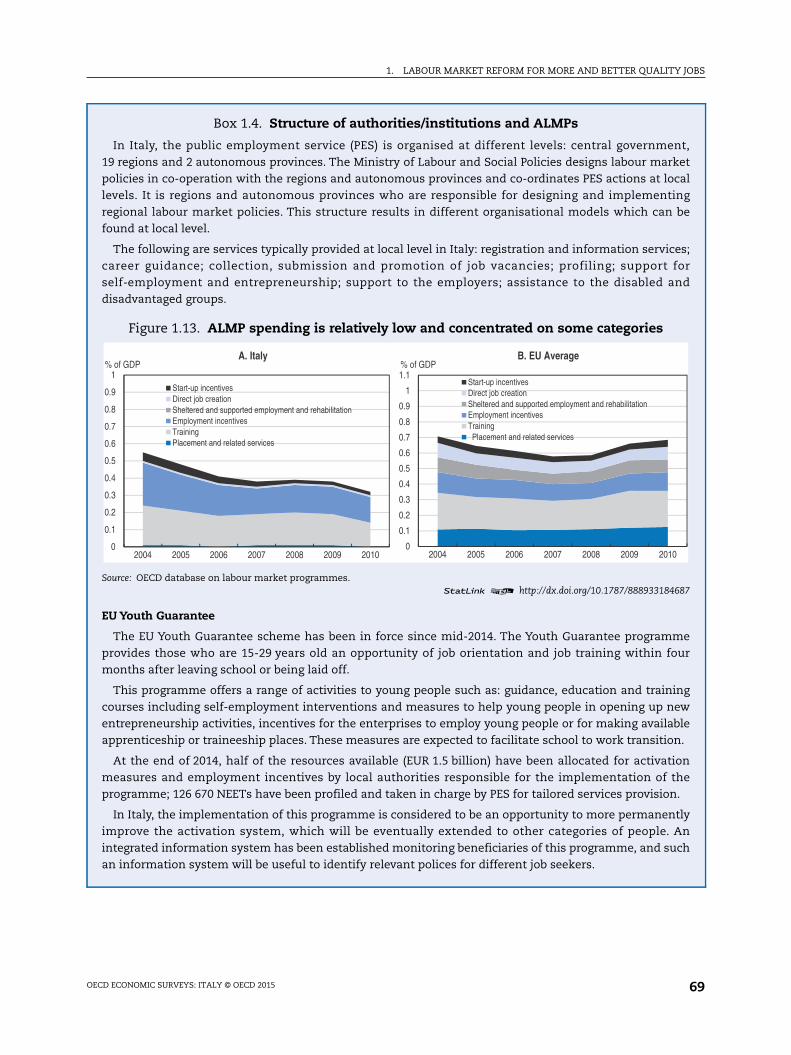
1. LABOUR MARKET REFORM FOR MORE AND BETTER QUALITY JOBS
nt,ketcalingbe
es;fornd
687
meur
ingewblen.
ionhe.
tlyAnch
0
Box 1.4. Structure of authorities/institutions and ALMPs
In Italy, the public employment service (PES) is organised at different levels: central governme19 regions and 2 autonomous provinces. The Ministry of Labour and Social Policies designs labour marpolicies in co-operation with the regions and autonomous provinces and co-ordinates PES actions at lolevels. It is regions and autonomous provinces who are responsible for designing and implementregional labour market policies. This structure results in different organisational models which canfound at local level.
The following are services typically provided at local level in Italy: registration and information serviccareer guidance; collection, submission and promotion of job vacancies; profiling; supportself-employment and entrepreneurship; support to the employers; assistance to the disabled adisadvantaged groups.
Figure 1.13. ALMP spending is relatively low and concentrated on some categories
Source: OECD database on labour market programmes.1 2 http://dx.doi.org/10.1787/888933184
EU Youth Guarantee
The EU Youth Guarantee scheme has been in force since mid-2014. The Youth Guarantee programprovides those who are 15-29 years old an opportunity of job orientation and job training within fomonths after leaving school or being laid off.
This programme offers a range of activities to young people such as: guidance, education and traincourses including self-employment interventions and measures to help young people in opening up nentrepreneurship activities, incentives for the enterprises to employ young people or for making availaapprenticeship or traineeship places. These measures are expected to facilitate school to work transitio
At the end of 2014, half of the resources available (EUR 1.5 billion) have been allocated for activatmeasures and employment incentives by local authorities responsible for the implementation of tprogramme; 126 670 NEETs have been profiled and taken in charge by PES for tailored services provision
In Italy, the implementation of this programme is considered to be an opportunity to more permanenimprove the activation system, which will be eventually extended to other categories of people.integrated information system has been established monitoring beneficiaries of this programme, and suan information system will be useful to identify relevant polices for different job seekers.
0
0.1
0.2
0.3
0.4
0.5
0.6
0.7
0.8
0.9
1
2004 2005 2006 2007 2008 2009 2010
% of GDPA. Italy
Start-up incentivesDirect job creationSheltered and supported employment and rehabilitationEmployment incentivesTrainingPlacement and related services
0
0.1
0.2
0.3
0.4
0.5
0.6
0.7
0.8
0.9
1
1.1
2004 2005 2006 2007 2008 2009 201
% of GDPB. EU Average
Start-up incentivesDirect job creationSheltered and supported employment and rehabilitationEmployment incentivesTraining Placement and related services
OECD ECONOMIC SURVEYS: ITALY © OECD 2015 69
1. LABOUR MARKET REFORM FOR MORE AND BETTER QUALITY JOBS
ALMPs; assessing PES performances. It also took measures to strengthen the role for PESs,
in particular their capacity to provide career orientation services. The national Youth
Guarantee scheme planned by the previous government has been in place since May 2014
(Box 1.4).
The Jobs Act aims at efficient implementation of ALMPs
The Jobs Act aims to strengthen effective implementation of ALMPs by creating
Agenzia Nazionale per l’Impiego, the National Employment Agency. The Agency will
be responsible for assuring an efficient conditionality approach for provision of
unemployment benefits. This is an essential point, but its enforcement may be difficult: a
conditionality approach was foreseen by the 2003 law but has never really been enforced
because of difficulties in co-ordinating the different institutions involved. The institutional
reform this time would hopefully overcome such difficulties, since the constitutional
reform attributes ALMPs to the exclusive competence of the central government avoiding
fragmentation and assuring a coherent framework. However, the details on conditionality
are unclear at this stage and should be clarified.
The Agency, which will be also responsible for co-ordinating ALMPs across regions,
should identify the appropriate measures for different job seekers and in different regions
(Box 1.4 and Jin et al., 2015). In general, profiling is necessary to determine who is job-ready
and who should be involved in more comprehensive programmes. Those who are job-
ready need to quickly return to work before skills are lost. Most of displaced workers find
jobs that use similar skills to their pre-displacement jobs, even if they move to a new
occupation or industry (OECD, 2013b). In such cases, measures facilitating job matching
such as career orientation and placement services seem to suffice. Job training
programmes are costly and should be targeted to some identified groups, such as the long-
term unemployed, lower educated people, and job seekers in southern regions. The
government has installed an integrated information system monitoring beneficiaries of
ALMPs and this system will enable policy makers to identify relevant policies in the future.
Wage setting system
Wage setting is a decisive factor which contributes to both structural performance and
labour market resilience. Flexible wage setting is important in achieving low structural
unemployment rates and in mitigating the direct impact of shocks on employment by
facilitating adjustments (OECD, 2014b). In general, the wage bargaining system has an
essential role in wage setting, especially when there is no legal minimum wage, as in Italy.
What characterises Italy’s wage bargaining system?
In Italy, Contratto collettivo nazionale di lavoro (CCNL), plays a determinant role in wage
formation. CCNL is an industry agreement reached between business associations and
labour unions in each industry. This agreement is applied uniformly within the same
sector across the country, through the functional equivalent to administrative extension:
the terms and conditions of collective contracts are extended to the total workforce,
whether unionised or not, since a clause in the Constitution guarantees a binding
character of collective contracts (OECD, 2004). This system of collective bargaining has
contributed to reducing labour conflicts.
OECD ECONOMIC SURVEYS: ITALY © OECD 201570
1. LABOUR MARKET REFORM FOR MORE AND BETTER QUALITY JOBS
However, the wage bargaining system in Italy has many characteristics which have
been thought as less efficient in terms of wage setting. Bargaining at industry level is less
efficient than centralised bargaining, which takes into account macroeconomic effects of
wage settlement, and firm-level bargaining, where unions exercise relatively little
monopoly power (Calmfors and Driffill, 1988). Higher bargaining coverage through
administrative extension is generally found to be performing worse (for e.g. higher
unemployment, see Aidt and Tzannatos, 2008). Among recent studies, Bassanini and Duval
(2009) empirically confirm the negative effects of this institutional setting.
In Italy, wages have not been reactive enough to macroeconomic developments. CCNL
basically links contractual wages to the CPI forecast (excluding energy) over the following
three years. Once committed, adjustments can be made only at the next round of
negotiation, thus three years later. Sluggish wage adjustment is reflected in the evolution
of contractual wages: nationally negotiated wages have increased on average by 2.7% per
year in the industry sector excluding construction and by 2.3% in the private service sector,
both in the 2001-07 period and in the 2008-13 period, according to Confindustria.
What are other factors influencing wage setting?
Wage setting is also interrelated with other labour market institutions such as EPL and
its dualism. For Italy, Leonardi and Pica (2013) find that EPL affects the wages of those with
long job tenures, but they found no such impact on entry wages, reflecting the duality in
the labour market. According to OECD estimates, the wage penalty for temporary workers
is 7-10% in full-time equivalence all else equal (i.e. controlled by age, education, regions,
etc., see Figure 1.14).
Wage adjustment against cyclical weakness has been borne disproportionately by new
entrants. OECD (2014b) finds that in EU countries an increase of one percentage point in the
unemployment rate generates a decline in earnings of -0.5% and -3.0% for job stayers and
job movers, respectively (Figure 1.15). This suggests that adjustments have been largely
made at the margin both internally (labour costs) and externally (employment quantity).
These findings indicate the need to reform employment protection legislation and wage
setting process in a co-ordinated way.
How the wage bargaining system can be improved?
The wage setting mechanism should be made more flexible, so as to take into account
firm-specific conditions such as productivity. The three-party pacts in 2011 and 2012 by the
government, business associations, and trade unions increased, in theory, the role of
firm-level negotiations. However, their role is still very limited (subject to the fields
specified in collective agreements) and generally allowed for incremental adjustments,
linked to productivity, to collectively agreed terms. Consequently, firm-level negotiations
currently remain of little importance. Alternatively, wage flexibility would be made greater
if firms deciding to opt out of collective bargaining were allowed to strike a deal with trade
unions representing only a majority of employees, and not all trade unions as currently is
the case. In Spain, provision for firms to opt out fully from national contracts to achieve
lower costs is credited with having helped competitiveness (OECD, 2014c).
Such an arrangement in the wage bargaining system would also alleviate regional
disparities in labour outcomes and economic performance. Insufficient wage adjustment
at the regional level may be partly responsible for the persistence of employment
disparities. In general, regional disparities in employment are positively correlated with
OECD ECONOMIC SURVEYS: ITALY © OECD 2015 71
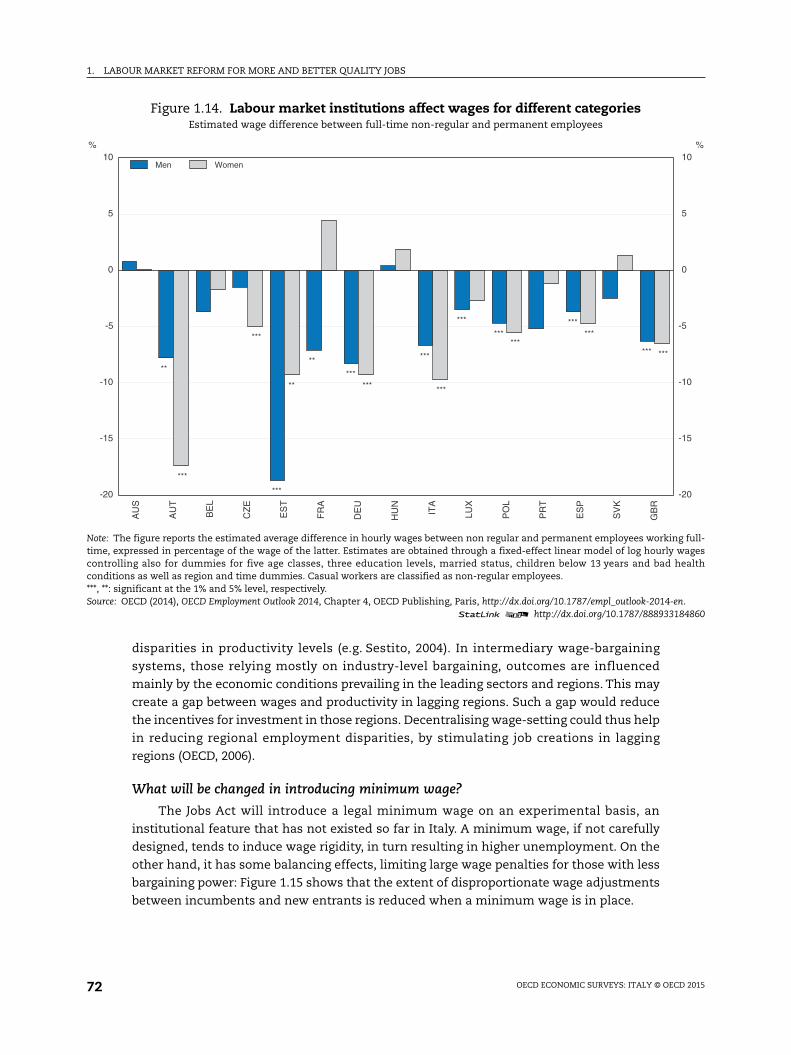
1. LABOUR MARKET REFORM FOR MORE AND BETTER QUALITY JOBS
ng full-wageshealth
en.184860
-20
-15
-10
-5
0
5
10%
disparities in productivity levels (e.g. Sestito, 2004). In intermediary wage-bargaining
systems, those relying mostly on industry-level bargaining, outcomes are influenced
mainly by the economic conditions prevailing in the leading sectors and regions. This may
create a gap between wages and productivity in lagging regions. Such a gap would reduce
the incentives for investment in those regions. Decentralising wage-setting could thus help
in reducing regional employment disparities, by stimulating job creations in lagging
regions (OECD, 2006).
What will be changed in introducing minimum wage?
The Jobs Act will introduce a legal minimum wage on an experimental basis, an
institutional feature that has not existed so far in Italy. A minimum wage, if not carefully
designed, tends to induce wage rigidity, in turn resulting in higher unemployment. On the
other hand, it has some balancing effects, limiting large wage penalties for those with less
bargaining power: Figure 1.15 shows that the extent of disproportionate wage adjustments
between incumbents and new entrants is reduced when a minimum wage is in place.
Figure 1.14. Labour market institutions affect wages for different categoriesEstimated wage difference between full-time non-regular and permanent employees
Note: The figure reports the estimated average difference in hourly wages between non regular and permanent employees workitime, expressed in percentage of the wage of the latter. Estimates are obtained through a fixed-effect linear model of log hourlycontrolling also for dummies for five age classes, three education levels, married status, children below 13 years and badconditions as well as region and time dummies. Casual workers are classified as non-regular employees.***, **: significant at the 1% and 5% level, respectively.Source: OECD (2014), OECD Employment Outlook 2014, Chapter 4, OECD Publishing, Paris, http://dx.doi.org/10.1787/empl_outlook-2014-
1 2 http://dx.doi.org/10.1787/888933
-20
-15
-10
-5
0
5
10%
AU
S
AU
T
BE
L
CZ
E
ES
T
FR
A
DE
U
HU
N
ITA
LUX
PO
L
PR
T
ES
P
SV
K
GB
R
***
***
***
***
******
***
***
***
*** ***
******
***
**
**
**
Men Women
OECD ECONOMIC SURVEYS: ITALY © OECD 201572
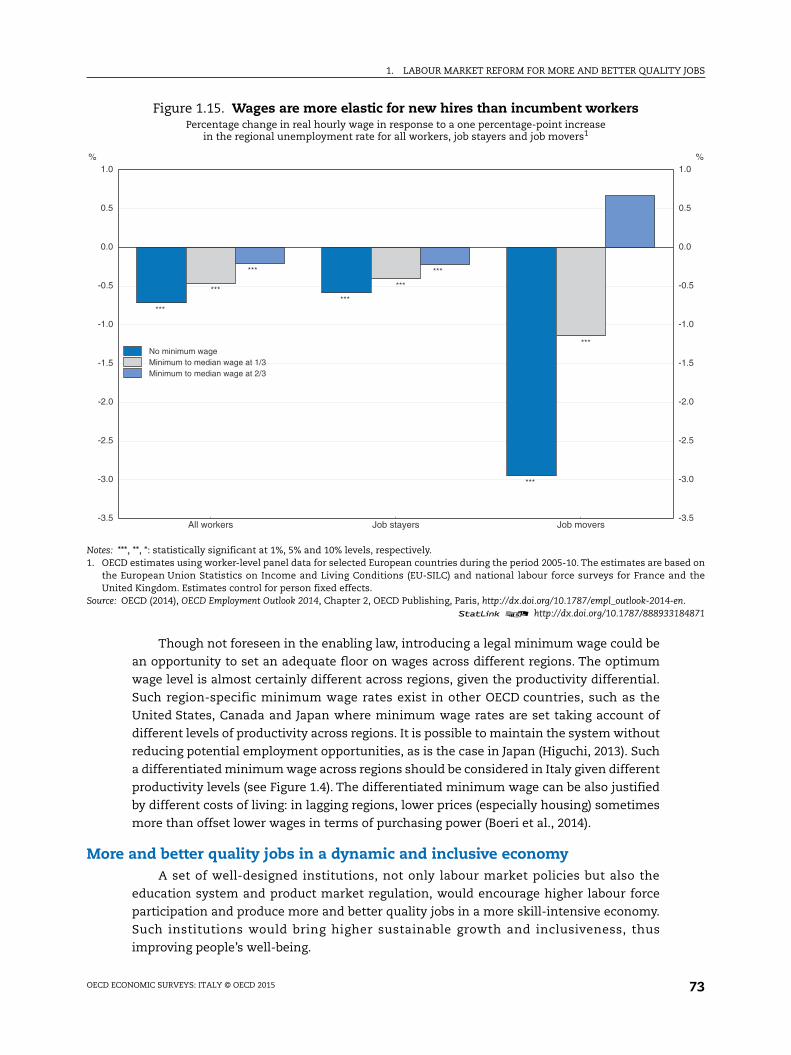
1. LABOUR MARKET REFORM FOR MORE AND BETTER QUALITY JOBS
sed onnd the
en.184871
-3.5
-3.0
-2.5
-2.0
-1.5
-1.0
-0.5
0.0
0.5
1.0%
Though not foreseen in the enabling law, introducing a legal minimum wage could be
an opportunity to set an adequate floor on wages across different regions. The optimum
wage level is almost certainly different across regions, given the productivity differential.
Such region-specific minimum wage rates exist in other OECD countries, such as the
United States, Canada and Japan where minimum wage rates are set taking account of
different levels of productivity across regions. It is possible to maintain the system without
reducing potential employment opportunities, as is the case in Japan (Higuchi, 2013). Such
a differentiated minimum wage across regions should be considered in Italy given different
productivity levels (see Figure 1.4). The differentiated minimum wage can be also justified
by different costs of living: in lagging regions, lower prices (especially housing) sometimes
more than offset lower wages in terms of purchasing power (Boeri et al., 2014).
More and better quality jobs in a dynamic and inclusive economyA set of well-designed institutions, not only labour market policies but also the
education system and product market regulation, would encourage higher labour force
participation and produce more and better quality jobs in a more skill-intensive economy.
Such institutions would bring higher sustainable growth and inclusiveness, thus
improving people’s well-being.
Figure 1.15. Wages are more elastic for new hires than incumbent workersPercentage change in real hourly wage in response to a one percentage-point increase
in the regional unemployment rate for all workers, job stayers and job movers1
Notes: ***, **, *: statistically significant at 1%, 5% and 10% levels, respectively.1. OECD estimates using worker-level panel data for selected European countries during the period 2005-10. The estimates are ba
the European Union Statistics on Income and Living Conditions (EU-SILC) and national labour force surveys for France aUnited Kingdom. Estimates control for person fixed effects.
Source: OECD (2014), OECD Employment Outlook 2014, Chapter 2, OECD Publishing, Paris, http://dx.doi.org/10.1787/empl_outlook-2014-1 2 http://dx.doi.org/10.1787/888933
All workers Job stayers Job movers-3.5
-3.0
-2.5
-2.0
-1.5
-1.0
-0.5
0.0
0.5
1.0%
***
******
***
***
***
*** ***
No minimum wageMinimum to median wage at 1/3Minimum to median wage at 2/3
OECD ECONOMIC SURVEYS: ITALY © OECD 2015 73
1. LABOUR MARKET REFORM FOR MORE AND BETTER QUALITY JOBS
Labour force participation
A further increase in labour force participation shifts up the trajectory of potential
output. This is especially important for Italy, since the working age population will soon
begin to diminish due to demographic factors, while immigration is expected to have very
limited influence over the long run according to Eurostat’s estimates. Overall, downward
pressure in the labour force participation rate will become stronger due to the aging
society. The current policy stance linking the average duration of active life to life
expectancy will only moderately offset the negative impacts from diminishing working age
population. Instead, the policy should aim at further reducing the gap between the
effective working life in Italy and that in other countries, as potential gains are very large
for Italy (OECD, 2014d).
Institutions can distort incentives to work
Low labour force participation can result from disincentives to work due to the fiscal
system and labour market institution. These include high and/or ill-targeted labour taxation
and implicit tax on continuing work which has encouraged de facto early retirement.
After the 2011 pension reform, all age requirements and the contribution requirements
for a full pension will be increased in line with life expectancy. In order to obtain a full
pension, the required contribution period is 42 years and 3 months for men and 41 years and
3 months for women as of 2014. Those who are under the statutory retirement age, up to a
maximum of three years, can also retire earlier, with a reduced pension, as long as they have
a record of more than 20 years of contributions (and if their pension is higher than a certain
threshold). The reform has restrained exits from the labour market and the labour force
participation rate among older people has visibly increased since then (from 46.3%
to 56.7% in the five years to 2013).
The tax wedge is generally high in Italy, and especially so among low-income earners.
The high overall tax burden is the mixture of high taxation on labour income and of even
higher social security contribution by the employer (Figure 1.16). Such high taxation induces
lower labour demand and/or disincentives to work. An across-the-board tax reduction would
be expensive so such a tax cut should be targeted to low-income workers, given the relatively
high taxation on them compared with other OECD countries. If a tax cut is targeted to certain
income levels, then the authorities should carefully avoid trapping workers to the same
income levels (i.e. avoiding high and abrupt marginal tax rates).
In 2014, the government introduced a EUR 10 billion overall tax reduction benefitting
low-income dependent workers with an annual labour income of less than EUR 26 000. A
lump sum tax reduction equivalent to EUR 80 per month is paid on incomes up to
EUR 24 000, and gradually phased out as labour income attains EUR 26 000. This tax
reduction is estimated to benefit about 10 million employees (those with a take-home pay
of less than EUR 1 500 per month). The government has financed this measure broadly
in a finance-neutral way. This measure is extended to the year 2015 and will become
permanent.
The government will temporarily remove employers’ social security contributions for
new hires on permanent contracts during the period 2015-17, for low income workers
earning up to EUR 25 000. Along with the cut in income tax of a fixed amount per month up
to a certain income limit introduced in 2014, this should stimulate job creations with the
new standard contract: including the impact of the income tax cut, the tax wedge for the
OECD ECONOMIC SURVEYS: ITALY © OECD 201574
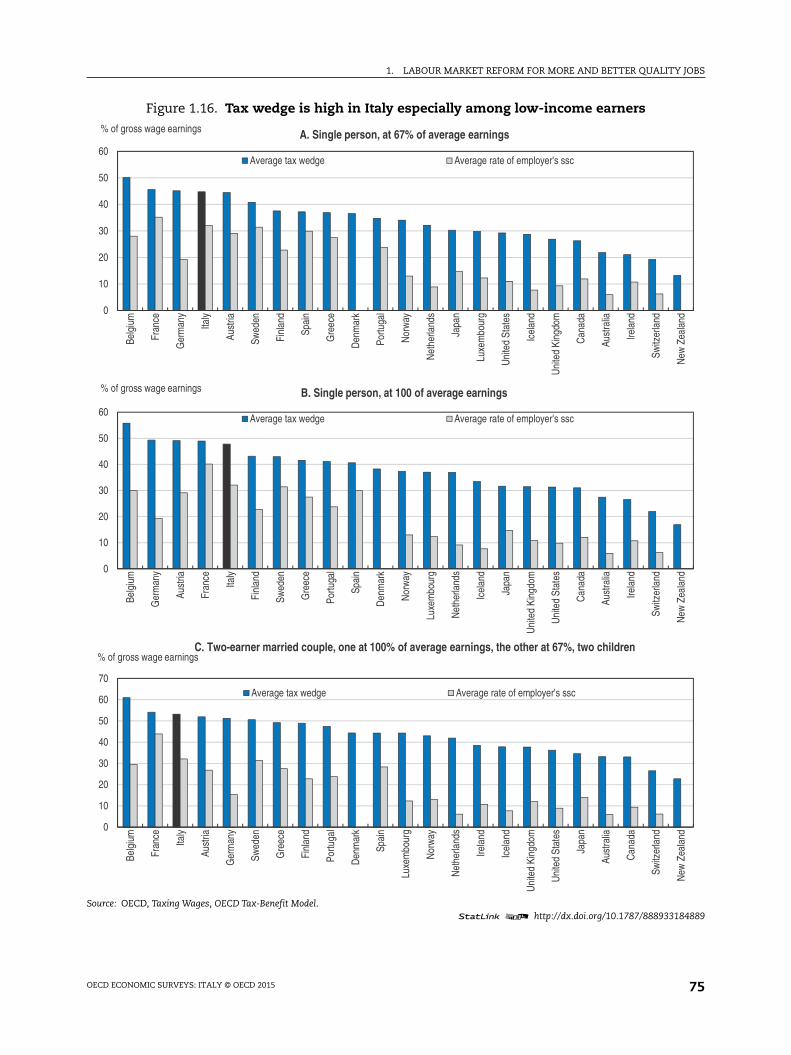
1. LABOUR MARKET REFORM FOR MORE AND BETTER QUALITY JOBS
184889
New
Zea
land
New
Zea
land
New
Zea
land
Figure 1.16. Tax wedge is high in Italy especially among low-income earners
Source: OECD, Taxing Wages, OECD Tax-Benefit Model.1 2 http://dx.doi.org/10.1787/888933
0
10
20
30
40
50
60
Belg
ium
Fran
ce
Ger
man
y
Italy
Aust
ria
Swed
en
Finl
and
Spai
n
Gre
ece
Den
mar
k
Portu
gal
Nor
way
Net
herla
nds
Japa
n
Luxe
mbo
urg
Uni
ted
Stat
es
Icel
and
Uni
ted
King
dom
Can
ada
Aust
ralia
Irela
nd
Switz
erla
nd
% of gross wage earnings A. Single person, at 67% of average earnings
Average tax wedge Average rate of employer's ssc
0
10
20
30
40
50
60
Belg
ium
Ger
man
y
Aust
ria
Fran
ce
Italy
Finl
and
Swed
en
Gre
ece
Portu
gal
Spai
n
Den
mar
k
Nor
way
Luxe
mbo
urg
Net
herla
nds
Icel
and
Japa
n
Uni
ted
King
dom
Uni
ted
Stat
es
Can
ada
Aust
ralia
Irela
nd
Switz
erla
nd
% of gross wage earnings B. Single person, at 100 of average earnings
Average tax wedge Average rate of employer's ssc
0
10
20
30
40
50
60
70
Belg
ium
Fran
ce
Italy
Aust
ria
Ger
man
y
Swed
en
Gre
ece
Finl
and
Portu
gal
Den
mar
k
Spai
n
Luxe
mbo
urg
Nor
way
Net
herla
nds
Irela
nd
Icel
and
Uni
ted
King
dom
Uni
ted
Stat
es
Japa
n
Aust
ralia
Can
ada
Switz
erla
nd% of gross wage earnings
C. Two-earner married couple, one at 100% of average earnings, the other at 67%, two children
Average tax wedge Average rate of employer's ssc
OECD ECONOMIC SURVEYS: ITALY © OECD 2015 75
1. LABOUR MARKET REFORM FOR MORE AND BETTER QUALITY JOBS
same employee falls from 46% in 2013 to 21%. This measure is expected to be extended in
the following years. The government may consider avoiding high marginal tax rates: firms
will be penalised in increasing wages above EUR 25 000 by the standard rate of social
security contribution of 32.08%.
Reconciling work/family life
Low female labour force participation is not necessarily a result of unconstrained
choice. It is influenced by responsibility for caring for children or older family members,
and also possibly by the tax system for families. The female labour force participation rate
has been increasing steadily, due to the cohort effect reflecting higher educational
attainment of the current generation, and is expected to continue to do so. However, its
level still remains well below the OECD average. If the gender gap in labour force
participation were to be halved by 2030 this is projected to lead to an annual increase in
growth of GDP per capita of 0.5 percentage points – about twice the OECD average
(Thévenon et al., 2013; see OECD, 2012; and OECD et al., 2014, for recent OECD initiatives to
tackle the gender gap).
The government plans to encourage female labour force participation by
strengthening financial incentives to work for women. The average tax wedge for a
two-earner married couple (with or without children) is generally very high in Italy
(Figure 1.16). For instance, for a couple with two children, one is earning 100% of the
average earnings and the other at 67% – typical model case –, the tax wedge is 42.9% which
is among the highest in the OECD countries. The government introduces a tax credit for
low- and medium-income families with children while reshaping tax deductions for a
dependent spouse. This enhances their work incentives.
In Italy, fewer children below three years of age are enrolled in formal childcare than
the OECD average (24% against 33%). At 2% of GDP, public spending on family benefits is
below average in Italy and most of it concerns cash benefits and/or tax measures. Public
spending on family services (including on early education and childcare for little children)
is also low in international comparison. Access criteria to childcare facilities are rigid,
but these are also related to capacity constraints. In this regard, the integration of
access criteria and tariffs between public and private childcare services should help
optimise access, as should an integration of employer-based childcare services with the
public-private system. The government introduces a “baby bonus”, a yearly cheque of
EUR 960 for each child born or adopted from 2015 to 2017 for medium- to low- income
families. In view of the range of benefits such support has it may be advisable to use the
available funds for additional investment in childcare facilities.
In addition to childcare supports, flexible working arrangements such as flexibility in
working hours as well as teleworking can help parents to reconcile work and care
responsibilities. Such arrangements are usually decided by collective bargaining. Social
partners may be encouraged to prioritise a change in this area. The government could also
consider legislation to support access to flexible workplace measures for workers with very
young children, as exist in different OECD countries (OECD, 2011b).
Education and skills
Human capital accumulation is in itself favourable for labour augmenting productivity
(OECD, 2014d). Demand for highly educated workers will rise as the economy becomes more
skill-intensive.This will raise in turn demand for tertiary education, driven by high economic
OECD ECONOMIC SURVEYS: ITALY © OECD 201576
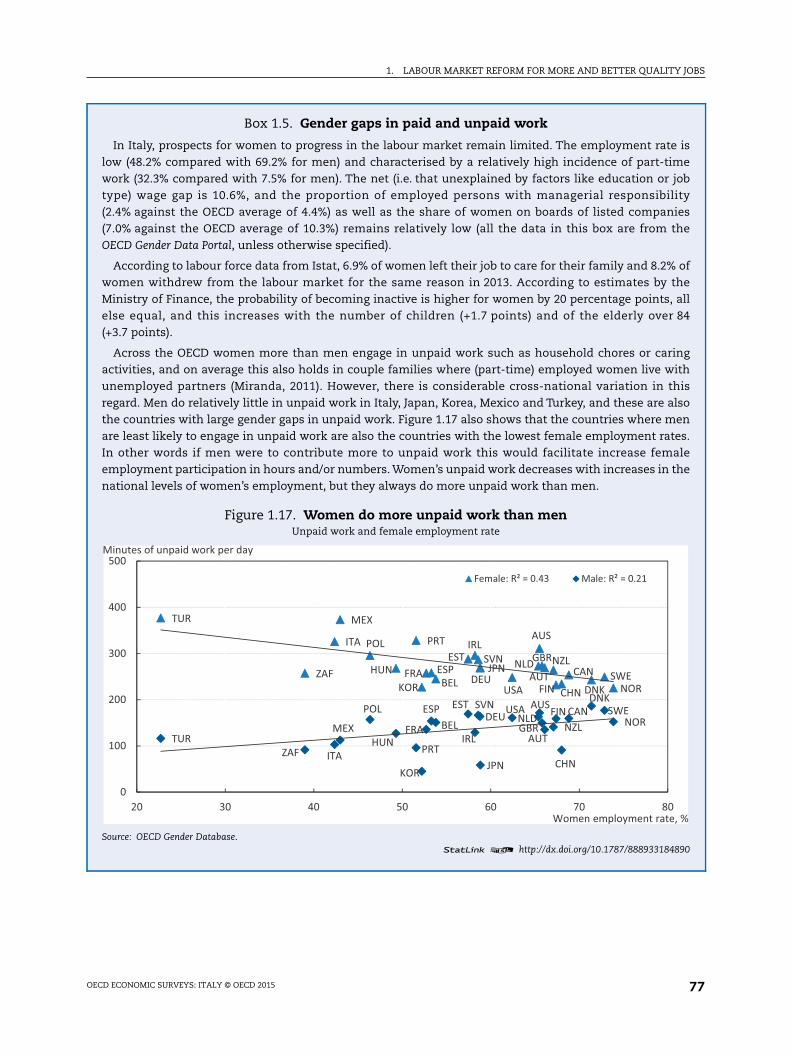
1. LABOUR MARKET REFORM FOR MORE AND BETTER QUALITY JOBS
ismejobityieshe
ofheall84
ingithhislsoenes.alethe
890
, %
Box 1.5. Gender gaps in paid and unpaid work
In Italy, prospects for women to progress in the labour market remain limited. The employment ratelow (48.2% compared with 69.2% for men) and characterised by a relatively high incidence of part-tiwork (32.3% compared with 7.5% for men). The net (i.e. that unexplained by factors like education ortype) wage gap is 10.6%, and the proportion of employed persons with managerial responsibil(2.4% against the OECD average of 4.4%) as well as the share of women on boards of listed compan(7.0% against the OECD average of 10.3%) remains relatively low (all the data in this box are from tOECD Gender Data Portal, unless otherwise specified).
According to labour force data from Istat, 6.9% of women left their job to care for their family and 8.2%women withdrew from the labour market for the same reason in 2013. According to estimates by tMinistry of Finance, the probability of becoming inactive is higher for women by 20 percentage points,else equal, and this increases with the number of children (+1.7 points) and of the elderly over(+3.7 points).
Across the OECD women more than men engage in unpaid work such as household chores or caractivities, and on average this also holds in couple families where (part-time) employed women live wunemployed partners (Miranda, 2011). However, there is considerable cross-national variation in tregard. Men do relatively little in unpaid work in Italy, Japan, Korea, Mexico and Turkey, and these are athe countries with large gender gaps in unpaid work. Figure 1.17 also shows that the countries where mare least likely to engage in unpaid work are also the countries with the lowest female employment ratIn other words if men were to contribute more to unpaid work this would facilitate increase fememployment participation in hours and/or numbers. Women’s unpaid work decreases with increases innational levels of women’s employment, but they always do more unpaid work than men.
Figure 1.17. Women do more unpaid work than menUnpaid work and female employment rate
Source: OECD Gender Database.1 2 http://dx.doi.org/10.1787/888933184
AUS
AUTBELCAN
CHN DNK
EST
FINFRA DEU
HUN
IRLITA
JPN
KOR
MEX
NLD NZL
NOR
POL PRTSVN
ZAF ESP SWE
TUR
GBR
USAAUS
AUTBEL
CAN
CHN
DNKEST FINFRA
DEU
HUN IRLITA
JPNKOR
MEXNLD
NZL NORPOL
PRT
SVN
ZAF
ESP SWE
TURGBR
USA
0
100
200
300
400
500
20 30 40 50 60 70 80Women employment rate
Minutes of unpaid work per day
Female: R² = 0.43 Male: R² = 0.21
OECD ECONOMIC SURVEYS: ITALY © OECD 2015 77
1. LABOUR MARKET REFORM FOR MORE AND BETTER QUALITY JOBS
vetal
mementat
t aomted
ld
ial
returns and better employment prospects for graduates. Simultaneously, an increase in the
supply of highly educated workers would diminish wage premiums, alleviating the upward
trend in inequality. Indeed, more and the right kinds of education and skills are needed to
keep up with the changing industrial structure and skill-biased technological progress.
Educational attainment should be increased
The average level of educational attainment is currently low in Italy (Figure 1.18), which is
related to worse labour outcomes for youth. Low educational attainment is largely explained
by early school leaving. Dropout is concentrated in the first cycle of secondary school as well as
in technical and professional institutes. Such a phenomenon is more pronounced in
socio-economically difficult regions (OECD, 2009). Those who dropped out without a
recognisable diploma tend to compound difficulties in the labour market insertion and easily
end up becoming not in Employment, Education or Training (NEETs) (OECD, 2010). The NEET
rate among youth is around 20%, the highest among European countries. Standard ALMPs are
known to be inefficient for this category of people and preventive measures (such as
outreaching students whose risk of dropping out is high) are found to be effective (OECD, 2010).
How to increase returns from education?
Returns to education are lower in Italy than other OECD countries (Figure 1.19), which
is attributed both to the education system and to the labour market. Educational
attainment and specific skills related to field of study have a strong effect on wages, which
is especially important for youth (OECD, 2014b). Figure 1.19 shows that returns to education
are among the lowest in Italy and they are even lower once skills are controlled, which
essentially singles out additional returns generated by specific skills related to field of
study (once skills acquired through education are directly taken into account). This is
another illustration of inadequate matching between field of study and occupational
requirements in Italy.
The evidence on job mismatch suggests a need for better orientation of students in
their field of study. ISFOL, a public body for vocational training, studies the total
occupational needs over a five-year horizon, forecast for 28 sectors and 129 occupations at
national level and at regional level. In addition, employment supply and demand are
Box 1.5. Gender gaps in paid and unpaid work (cont.)
Thus policies that reduce differences between mothers’ and fathers’ labour market behaviour also haconsiderable potential for narrowing gender gaps in paid and unpaid work. One such a policy is parenleave, but entitlements are more often used by women than men. To increase take-up among fathers, socountries grant the exclusive right to parts of the parental-leave entitlement and/or associated incosupport to fathers. Iceland has the proportionally most gender-equal paid parental leave arrangemebecause one-third of the parental-leave period is reserved for men (13 weeks). Italy too has legislation thencourages fathers to take leave: when a father takes at least 3 months of paid parental leave (areplacement rate of 30% up to a maximum) then the household entitlement to paid leave increases fr10 to 11 months (Addabbo et al., 2014). However, this arrangement is little known and so far has had limieffect. Increasing awareness and making the bonus month available after a shorter initial spell coucontribute to making this policy more effective.
This box draws on work by the Social Policy Division, Directorate for Employment, Labour and SocAffairs, OECD.
OECD ECONOMIC SURVEYS: ITALY © OECD 201578
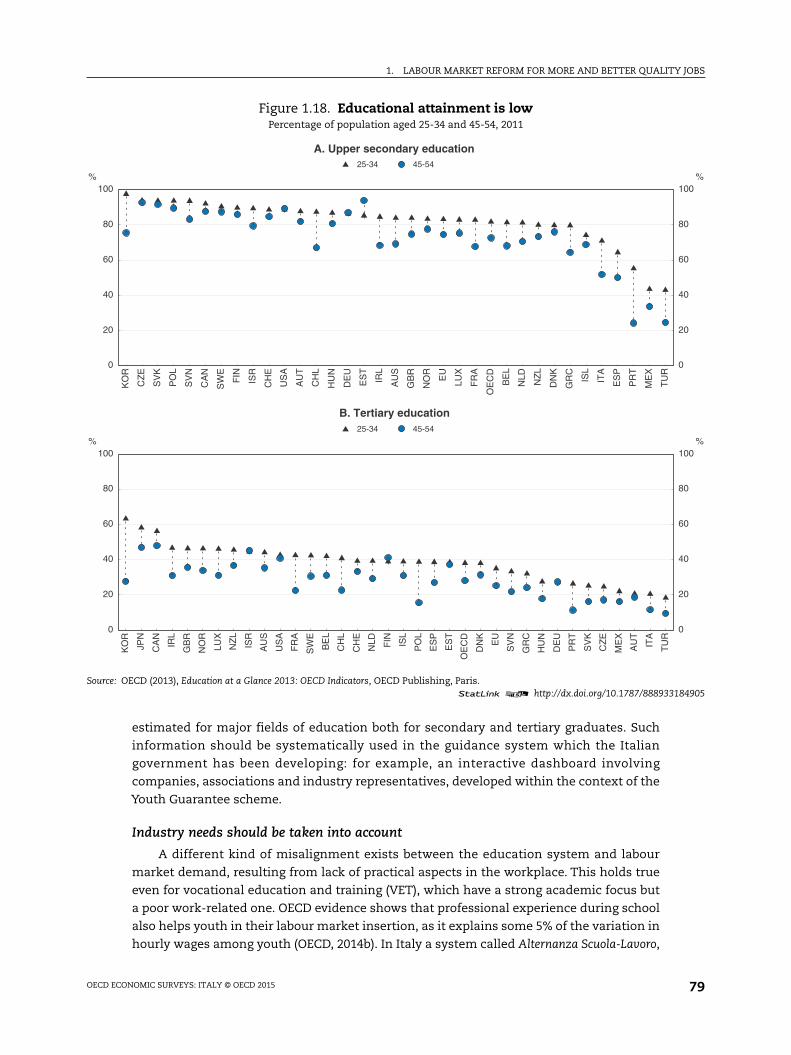
1. LABOUR MARKET REFORM FOR MORE AND BETTER QUALITY JOBS
184905
0
20
40
60
80
100%
0
20
40
60
80
100%
estimated for major fields of education both for secondary and tertiary graduates. Such
information should be systematically used in the guidance system which the Italian
government has been developing: for example, an interactive dashboard involving
companies, associations and industry representatives, developed within the context of the
Youth Guarantee scheme.
Industry needs should be taken into account
A different kind of misalignment exists between the education system and labour
market demand, resulting from lack of practical aspects in the workplace. This holds true
even for vocational education and training (VET), which have a strong academic focus but
a poor work-related one. OECD evidence shows that professional experience during school
also helps youth in their labour market insertion, as it explains some 5% of the variation in
hourly wages among youth (OECD, 2014b). In Italy a system called Alternanza Scuola-Lavoro,
Figure 1.18. Educational attainment is lowPercentage of population aged 25-34 and 45-54, 2011
Source: OECD (2013), Education at a Glance 2013: OECD Indicators, OECD Publishing, Paris.1 2 http://dx.doi.org/10.1787/888933
0
20
40
60
80
100%
KO
R
CZ
E
SV
K
PO
L
SV
N
CA
N
SW
E
FIN
ISR
CH
E
US
A
AU
T
CH
L
HU
N
DE
U
ES
T
IRL
AU
S
GB
R
NO
R
EU
LUX
FR
A
OE
CD
BE
L
NLD
NZ
L
DN
K
GR
C
ISL
ITA
ES
P
PR
T
ME
X
TU
R
25-34 45-54
A. Upper secondary education
0
20
40
60
80
100%
KO
R
JPN
CA
N
IRL
GB
R
NO
R
LUX
NZ
L
ISR
AU
S
US
A
FR
A
SW
E
BE
L
CH
L
CH
E
NLD FIN ISL
PO
L
ES
P
ES
T
OE
CD
DN
K
EU
SV
N
GR
C
HU
N
DE
U
PR
T
SV
K
CZ
E
ME
X
AU
T
ITA
TU
R
25-34 45-54
B. Tertiary education
OECD ECONOMIC SURVEYS: ITALY © OECD 2015 79
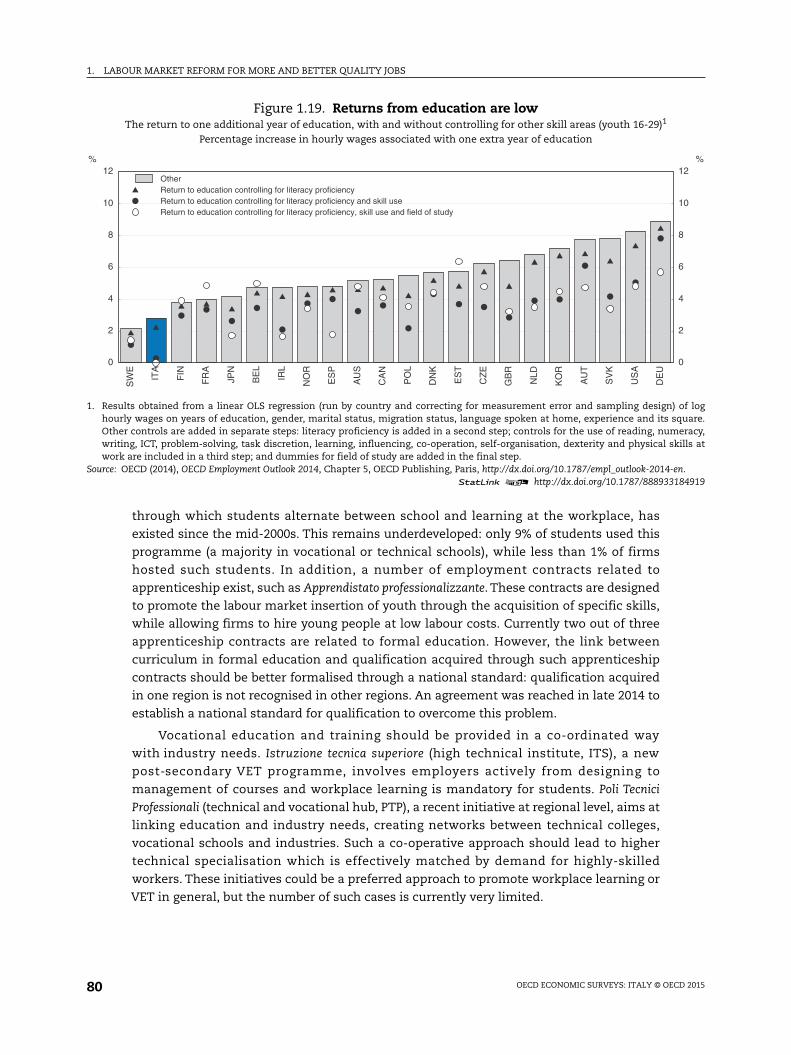
1. LABOUR MARKET REFORM FOR MORE AND BETTER QUALITY JOBS
) of logsquare.
eracy,kills at
en.184919
0
2
4
6
8
10
12%
through which students alternate between school and learning at the workplace, has
existed since the mid-2000s. This remains underdeveloped: only 9% of students used this
programme (a majority in vocational or technical schools), while less than 1% of firms
hosted such students. In addition, a number of employment contracts related to
apprenticeship exist, such as Apprendistato professionalizzante. These contracts are designed
to promote the labour market insertion of youth through the acquisition of specific skills,
while allowing firms to hire young people at low labour costs. Currently two out of three
apprenticeship contracts are related to formal education. However, the link between
curriculum in formal education and qualification acquired through such apprenticeship
contracts should be better formalised through a national standard: qualification acquired
in one region is not recognised in other regions. An agreement was reached in late 2014 to
establish a national standard for qualification to overcome this problem.
Vocational education and training should be provided in a co-ordinated way
with industry needs. Istruzione tecnica superiore (high technical institute, ITS), a new
post-secondary VET programme, involves employers actively from designing to
management of courses and workplace learning is mandatory for students. Poli Tecnici
Professionali (technical and vocational hub, PTP), a recent initiative at regional level, aims at
linking education and industry needs, creating networks between technical colleges,
vocational schools and industries. Such a co-operative approach should lead to higher
technical specialisation which is effectively matched by demand for highly-skilled
workers. These initiatives could be a preferred approach to promote workplace learning or
VET in general, but the number of such cases is currently very limited.
Figure 1.19. Returns from education are lowThe return to one additional year of education, with and without controlling for other skill areas (youth 16-29)1
Percentage increase in hourly wages associated with one extra year of education
1. Results obtained from a linear OLS regression (run by country and correcting for measurement error and sampling designhourly wages on years of education, gender, marital status, migration status, language spoken at home, experience and itsOther controls are added in separate steps: literacy proficiency is added in a second step; controls for the use of reading, numwriting, ICT, problem-solving, task discretion, learning, influencing, co-operation, self-organisation, dexterity and physical swork are included in a third step; and dummies for field of study are added in the final step.
Source: OECD (2014), OECD Employment Outlook 2014, Chapter 5, OECD Publishing, Paris, http://dx.doi.org/10.1787/empl_outlook-2014-1 2 http://dx.doi.org/10.1787/888933
0
2
4
6
8
10
12%
SW
E
ITA
FIN
FR
A
JPN
BE
L
IRL
NO
R
ES
P
AU
S
CA
N
PO
L
DN
K
ES
T
CZ
E
GB
R
NLD
KO
R
AU
T
SV
K
US
A
DE
U
OtherReturn to education controlling for literacy proficiencyReturn to education controlling for literacy proficiency and skill useReturn to education controlling for literacy proficiency, skill use and field of study
OECD ECONOMIC SURVEYS: ITALY © OECD 201580
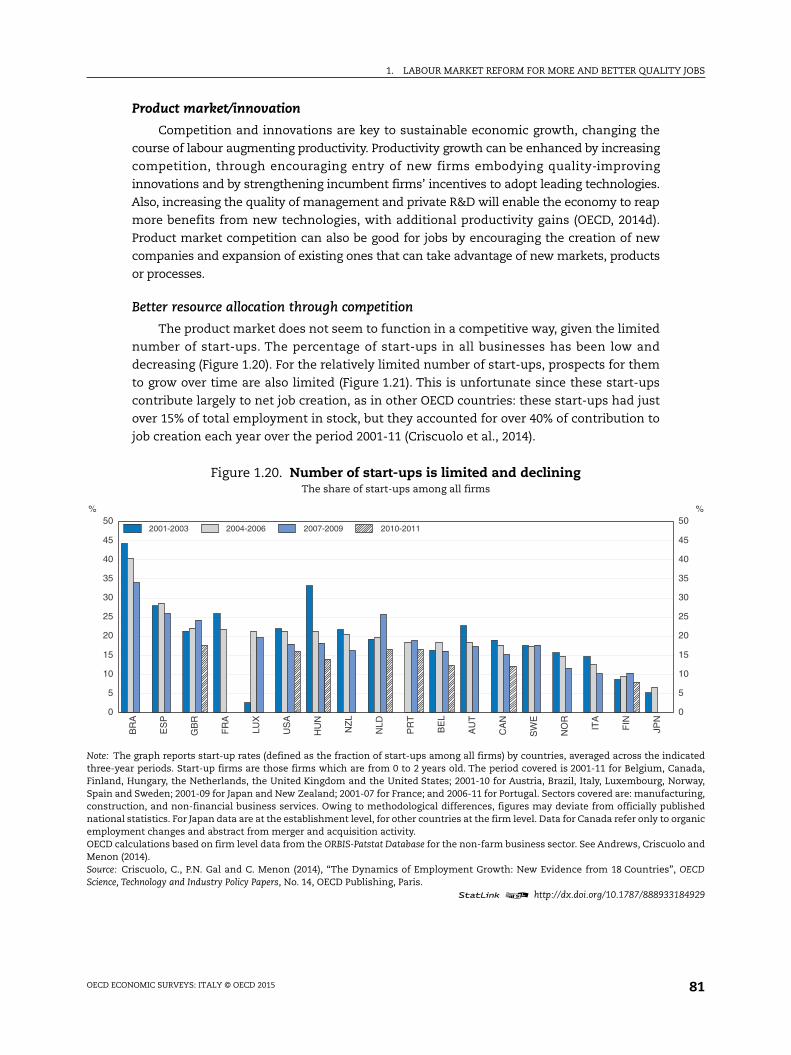
1. LABOUR MARKET REFORM FOR MORE AND BETTER QUALITY JOBS
icatedanada,orway,turing,
blishedrganic
lo and
, OECD
184929
0
5
10
15
20
25
30
35
40
45
50%
Product market/innovation
Competition and innovations are key to sustainable economic growth, changing the
course of labour augmenting productivity. Productivity growth can be enhanced by increasing
competition, through encouraging entry of new firms embodying quality-improving
innovations and by strengthening incumbent firms’ incentives to adopt leading technologies.
Also, increasing the quality of management and private R&D will enable the economy to reap
more benefits from new technologies, with additional productivity gains (OECD, 2014d).
Product market competition can also be good for jobs by encouraging the creation of new
companies and expansion of existing ones that can take advantage of new markets, products
or processes.
Better resource allocation through competition
The product market does not seem to function in a competitive way, given the limited
number of start-ups. The percentage of start-ups in all businesses has been low and
decreasing (Figure 1.20). For the relatively limited number of start-ups, prospects for them
to grow over time are also limited (Figure 1.21). This is unfortunate since these start-ups
contribute largely to net job creation, as in other OECD countries: these start-ups had just
over 15% of total employment in stock, but they accounted for over 40% of contribution to
job creation each year over the period 2001-11 (Criscuolo et al., 2014).
Figure 1.20. Number of start-ups is limited and decliningThe share of start-ups among all firms
Note: The graph reports start-up rates (defined as the fraction of start-ups among all firms) by countries, averaged across the indthree-year periods. Start-up firms are those firms which are from 0 to 2 years old. The period covered is 2001-11 for Belgium, CFinland, Hungary, the Netherlands, the United Kingdom and the United States; 2001-10 for Austria, Brazil, Italy, Luxembourg, NSpain and Sweden; 2001-09 for Japan and New Zealand; 2001-07 for France; and 2006-11 for Portugal. Sectors covered are: manufacconstruction, and non-financial business services. Owing to methodological differences, figures may deviate from officially punational statistics. For Japan data are at the establishment level, for other countries at the firm level. Data for Canada refer only to oemployment changes and abstract from merger and acquisition activity.OECD calculations based on firm level data from the ORBIS-Patstat Database for the non-farm business sector. See Andrews, CriscuoMenon (2014).Source: Criscuolo, C., P.N. Gal and C. Menon (2014), “The Dynamics of Employment Growth: New Evidence from 18 Countries”Science, Technology and Industry Policy Papers, No. 14, OECD Publishing, Paris.
1 2 http://dx.doi.org/10.1787/888933
0
5
10
15
20
25
30
35
40
45
50%
BR
A
ES
P
GB
R
FR
A
LUX
US
A
HU
N
NZ
L
NLD
PR
T
BE
L
AU
T
CA
N
SW
E
NO
R
ITA
FIN
JPN
2001-2003 2004-2006 2007-2009 2010-2011
OECD ECONOMIC SURVEYS: ITALY © OECD 2015 81
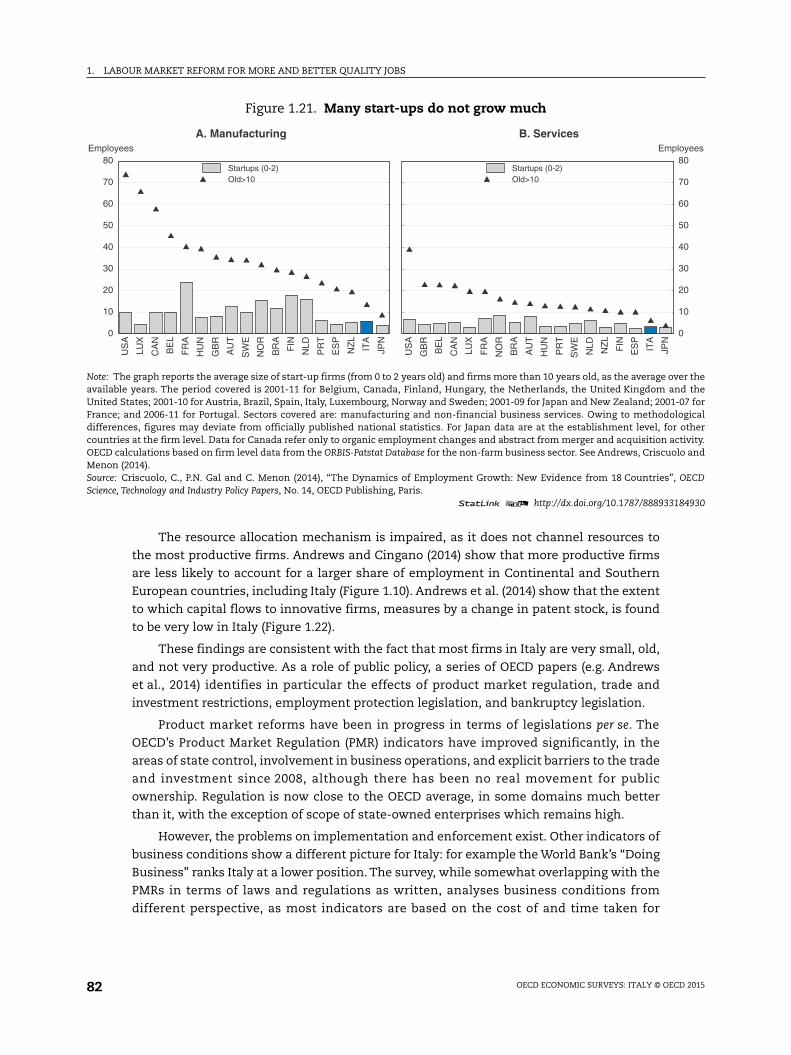
1. LABOUR MARKET REFORM FOR MORE AND BETTER QUALITY JOBS
ver thend the-07 forlogicalr otherctivity.lo and
, OECD
184930
0
10
20
30
40
50
60
70
80ployees
The resource allocation mechanism is impaired, as it does not channel resources to
the most productive firms. Andrews and Cingano (2014) show that more productive firms
are less likely to account for a larger share of employment in Continental and Southern
European countries, including Italy (Figure 1.10). Andrews et al. (2014) show that the extent
to which capital flows to innovative firms, measures by a change in patent stock, is found
to be very low in Italy (Figure 1.22).
These findings are consistent with the fact that most firms in Italy are very small, old,
and not very productive. As a role of public policy, a series of OECD papers (e.g. Andrews
et al., 2014) identifies in particular the effects of product market regulation, trade and
investment restrictions, employment protection legislation, and bankruptcy legislation.
Product market reforms have been in progress in terms of legislations per se. The
OECD’s Product Market Regulation (PMR) indicators have improved significantly, in the
areas of state control, involvement in business operations, and explicit barriers to the trade
and investment since 2008, although there has been no real movement for public
ownership. Regulation is now close to the OECD average, in some domains much better
than it, with the exception of scope of state-owned enterprises which remains high.
However, the problems on implementation and enforcement exist. Other indicators of
business conditions show a different picture for Italy: for example the World Bank’s “Doing
Business” ranks Italy at a lower position. The survey, while somewhat overlapping with the
PMRs in terms of laws and regulations as written, analyses business conditions from
different perspective, as most indicators are based on the cost of and time taken for
Figure 1.21. Many start-ups do not grow much
Note: The graph reports the average size of start-up firms (from 0 to 2 years old) and firms more than 10 years old, as the average oavailable years. The period covered is 2001-11 for Belgium, Canada, Finland, Hungary, the Netherlands, the United Kingdom aUnited States; 2001-10 for Austria, Brazil, Spain, Italy, Luxembourg, Norway and Sweden; 2001-09 for Japan and New Zealand; 2001France; and 2006-11 for Portugal. Sectors covered are: manufacturing and non-financial business services. Owing to methododifferences, figures may deviate from officially published national statistics. For Japan data are at the establishment level, focountries at the firm level. Data for Canada refer only to organic employment changes and abstract from merger and acquisition aOECD calculations based on firm level data from the ORBIS-Patstat Database for the non-farm business sector. See Andrews, CriscuoMenon (2014).Source: Criscuolo, C., P.N. Gal and C. Menon (2014), “The Dynamics of Employment Growth: New Evidence from 18 Countries”Science, Technology and Industry Policy Papers, No. 14, OECD Publishing, Paris.
1 2 http://dx.doi.org/10.1787/888933
0
10
20
30
40
50
60
70
80Employees
US
A
LUX
CA
N
BE
L
FR
A
HU
N
GB
R
AU
T
SW
E
NO
R
BR
A
FIN
NLD
PR
T
ES
P
NZ
L
ITA
JPN
Startups (0-2)Old>10
A. Manufacturing
Em
US
A
GB
R
BE
L
CA
N
LUX
FR
A
NO
R
BR
A
AU
T
HU
N
PR
T
SW
E
NLD
NZ
L
FIN
ES
P
ITA
JPN
Startups (0-2)Old>10
B. Services
OECD ECONOMIC SURVEYS: ITALY © OECD 201582
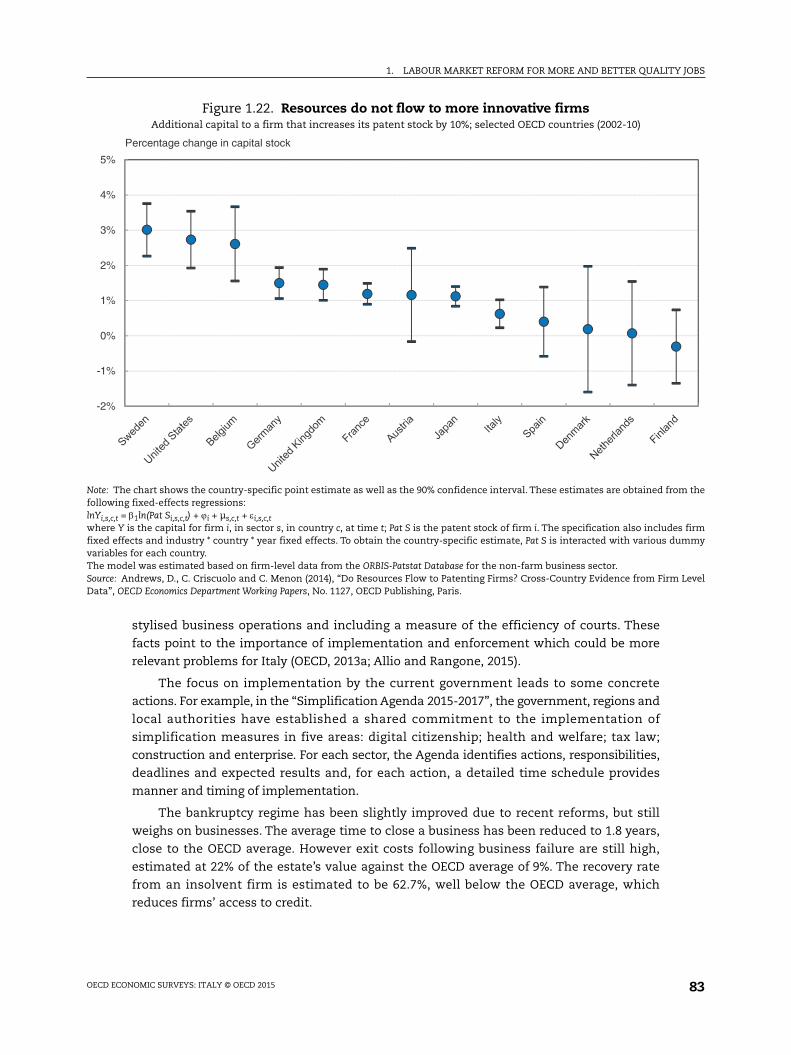
1. LABOUR MARKET REFORM FOR MORE AND BETTER QUALITY JOBS
om the
es firmummy
Level
stylised business operations and including a measure of the efficiency of courts. These
facts point to the importance of implementation and enforcement which could be more
relevant problems for Italy (OECD, 2013a; Allio and Rangone, 2015).
The focus on implementation by the current government leads to some concrete
actions. For example, in the “Simplification Agenda 2015-2017”, the government, regions and
local authorities have established a shared commitment to the implementation of
simplification measures in five areas: digital citizenship; health and welfare; tax law;
construction and enterprise. For each sector, the Agenda identifies actions, responsibilities,
deadlines and expected results and, for each action, a detailed time schedule provides
manner and timing of implementation.
The bankruptcy regime has been slightly improved due to recent reforms, but still
weighs on businesses. The average time to close a business has been reduced to 1.8 years,
close to the OECD average. However exit costs following business failure are still high,
estimated at 22% of the estate’s value against the OECD average of 9%. The recovery rate
from an insolvent firm is estimated to be 62.7%, well below the OECD average, which
reduces firms’ access to credit.
Figure 1.22. Resources do not flow to more innovative firmsAdditional capital to a firm that increases its patent stock by 10%; selected OECD countries (2002-10)
Note: The chart shows the country-specific point estimate as well as the 90% confidence interval. These estimates are obtained frfollowing fixed-effects regressions:lnYi,s,c,t = 1ln(Pat Si,s,c,t) + i + µs,c,t + i,s,c,twhere Y is the capital for firm i, in sector s, in country c, at time t; Pat S is the patent stock of firm i. The specification also includfixed effects and industry * country * year fixed effects. To obtain the country-specific estimate, Pat S is interacted with various dvariables for each country.The model was estimated based on firm-level data from the ORBIS-Patstat Database for the non-farm business sector.Source: Andrews, D., C. Criscuolo and C. Menon (2014), “Do Resources Flow to Patenting Firms? Cross-Country Evidence from FirmData”, OECD Economics Department Working Papers, No. 1127, OECD Publishing, Paris.
-2%
-1%
0%
1%
2%
3%
4%
5%
Percentage change in capital stock
OECD ECONOMIC SURVEYS: ITALY © OECD 2015 83
1. LABOUR MARKET REFORM FOR MORE AND BETTER QUALITY JOBS
More favourable environment for innovation
The current state of corporate finance is overall not favourable for firms’ growth and
innovation in particular. The very low share of equity capital in firms’ financing is itself a
problem for potentially productive firms currently facing financial constraints. This
problem is more relevant for R&D activities. Firms’ internal resources are the primary
source of R&D financing, due to the high degree of risk and the information asymmetries
associated with innovative activity. Over 80% of R&D spending by firms is internally funded
in all four large European countries, according to the Bruegel Institute. In Italy the second
biggest source of financing is bank loans (slightly less than 10% of R&D spending), whereas
in the United Kingdom, this proportion is much lower (1%) and equity plays a more
important role. The role of venture capital funds – investor that provide early-stage
Box 1.6. Research and development: Tax credits and the patent box
Innovation is a key driver of economic growth and investments in R&D are among thefactors that drive innovation. In Italy, the share of business enterprise expenditure on R&Dhas been amongst the lowest amongst OECD economies (OECD, 2014e). Many governmentssupport business investment in R&D, with the aim of alleviating the problem of fullappropriability of returns from investment and the problem of access to credit oftenassociated with investment in R&D. The Italian government included in the Legge diStabilità 2015 two measures for supporting firms investment in R&D: 1) an R&D tax credit;and 2) a “patent box” regime.
The tax credit regime offers a 25% incremental-based tax credit, with a more generous rateof 50% if the R&D project is conducted in collaboration with universities and public researchinstitutions or by innovative start-ups and to cover expenditures related to highly qualifiedR&D staff. The R&D tax credit can be used to offset tax and social contributions liabilities,which means that even loss-making firms might benefit from the incentives. This isimportant to avoid favouring firms in a profit making position at the expense of firmsmaking losses as is often the case for young dynamic firms. However, the incremental natureof the scheme might raise compliance costs especially for small firms and discourageparticipation. More generally, in the last decade the R&D tax credit system has seenrecurrent changes and uncertainty about the design, the implementation and the fundingfor the instrument. These are likely to lower its uptake and effectiveness and might have anegative impact on the level of R&D investment.
The patent box allows businesses to benefit from lower effective tax rates (13.75% asof 2017) on profits derived from intellectual assets (copyrights; patents; trademarks whichare functionally equivalent to patents and know-how exploited through licenses with theaim of incentivising the location of intellectual assets currently held abroad, avoiding theirrelocation and more generally supporting investment in R&D. Italy is not the first countrythat has introduced a patent box: for example France introduced such a scheme in 2000,Hungary in 2003, the Netherlands and Belgium in 2007, followed by Spain and Luxembourgin 2008. Finally the UK that introduced the scheme in 2013 just announced its phasing outbetween 2016 and 2021. The Italian scheme requires coupling of the intellectual assets tounderlying research conducted in Italy in line with BEPS recommendations. However,recent research suggests that might are prone to spur a tax competition that entails a raceto the bottom which ultimately results in a fall in tax revenues for all countries concerned(Griffith et al., 2012) might not necessarily be the most cost-effective suitable measure totackle the fundamental market failures of investment in innovation.
This box is based on Criscuolo and Appelt (2015).
OECD ECONOMIC SURVEYS: ITALY © OECD 201584
1. LABOUR MARKET REFORM FOR MORE AND BETTER QUALITY JOBS
financing as well as consulting for firms in high growth potential sectors – or business
angels, private investors operating on a smaller scale with respect to venture capital funds,
is extremely limited in Italy.
Financial incentives for innovation should be reshaped, since the tax credit system seems
to over-subsidise incumbent firms at the expense of dynamic young firms (Box 1.6). In Italy,
R&D tax credits are neither refundable nor contain carry-over provisions. The design of such
schemes may provide less assistance to young firms which are typically in a loss position in
the early years of an R&D project, reducing effective rate of the tax subsidy to R&D (Elschner
et al., 2011). Also, R&D tax credits should be more closely tied to the most productive sources
of innovation to improve targeting of government subsidies. Thus, more emphasis could be
put on selective subsidies through grants, loans and prises, based on competitive, objective
and transparent selection. Colombo et al. (2011) shows that selective subsidies are likely to be
more beneficial to new technology-based firms than automatic ones.
Institutions and job quality
A recent OECD study sheds light on job quality from the view point of well-being
(OECD, 2014b). The study defines job quality along the three aspects: earnings quality,
labour market security, and quality of the working environment (Table 1.3). The results
show that those countries which are ranked high in terms of the quantity of employment
tend to be ranked high also in terms of job quality. According to these criteria, the reforms
in process are expected to improve job quality overall:
● Reduction in EPL as well as PMR leads to higher earnings level in the aggregate through
higher productivity.
● Tackling dualism contributes to reducing earnings inequality.
● A EPL reform usually results in higher probability of unemployment and but also
shortens unemployment spells, due to higher probability of re-employment, and the
anxiety on long unemployment spells seems to dominate in general (OECD, 2014b).
● Extended unemployment benefit coverage would help to reduce labour market insecurity.
● Flexible wage may result in widening earnings disparity, reflecting differences in skills or
innate ability, but it would be better than the situation where inequality is embedded
due to institutional factors, that is, high wage for those who protected at the expense of
those who stay at the margins of the labour market.
Economic performance as well as job satisfaction can be improved by designing better
institutions. It is well-known that the set of institutions interact with shocks, which
generates different economic and labour outcomes (Blanchard and Wolfers, 2000; Nickell
et al., 2003). The allocation of the factors of production and the distribution of income can
be hampered by worse performing institutions, which is often embedded by vested
interests of certain groups. Instead, a set of better institutions facilitate the economy to
reap more benefits from business opportunities; firms react more promptly to quality-
improving innovations and adoption of leading technologies, while workers depend less on
wealth and/or social benefits, otherwise costly for businesses as the reservation wage
becomes higher all else equal (Phelps, 1994; Fitoussi et al., 2000). Phelps and Zoega (2013)
also find that job satisfaction is higher where a set of institutions fostering equality of
opportunities and upward mobility provide better economic performance. More and better
quality jobs would be produced in such a truly inclusive environment, conducive to higher
living standards.
OECD ECONOMIC SURVEYS: ITALY © OECD 2015 85
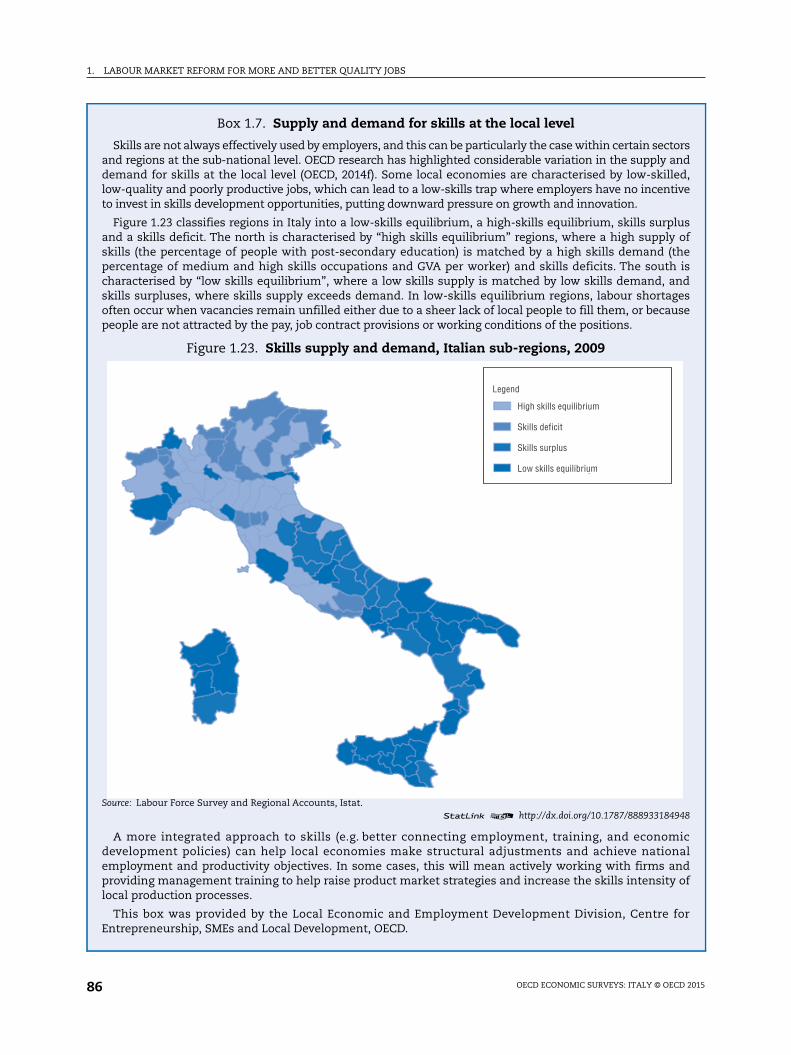
1. LABOUR MARKET REFORM FOR MORE AND BETTER QUALITY JOBS
orsnded,ive
lusof
theis
ndges
se
948
icnalndof
for
Box 1.7. Supply and demand for skills at the local level
Skills are not always effectively used by employers, and this can be particularly the case within certain sectand regions at the sub-national level. OECD research has highlighted considerable variation in the supply ademand for skills at the local level (OECD, 2014f). Some local economies are characterised by low-skilllow-quality and poorly productive jobs, which can lead to a low-skills trap where employers have no incentto invest in skills development opportunities, putting downward pressure on growth and innovation.
Figure 1.23 classifies regions in Italy into a low-skills equilibrium, a high-skills equilibrium, skills surpand a skills deficit. The north is characterised by “high skills equilibrium” regions, where a high supplyskills (the percentage of people with post-secondary education) is matched by a high skills demand (percentage of medium and high skills occupations and GVA per worker) and skills deficits. The southcharacterised by “low skills equilibrium”, where a low skills supply is matched by low skills demand, askills surpluses, where skills supply exceeds demand. In low-skills equilibrium regions, labour shortaoften occur when vacancies remain unfilled either due to a sheer lack of local people to fill them, or becaupeople are not attracted by the pay, job contract provisions or working conditions of the positions.
Figure 1.23. Skills supply and demand, Italian sub-regions, 2009
Source: Labour Force Survey and Regional Accounts, Istat.1 2 http://dx.doi.org/10.1787/888933184
A more integrated approach to skills (e.g. better connecting employment, training, and economdevelopment policies) can help local economies make structural adjustments and achieve natioemployment and productivity objectives. In some cases, this will mean actively working with firms aproviding management training to help raise product market strategies and increase the skills intensitylocal production processes.
This box was provided by the Local Economic and Employment Development Division, CentreEntrepreneurship, SMEs and Local Development, OECD.
Legend
High skills equilibrium
Skills deficit
Skills surplus
Low skills equilibrium
OECD ECONOMIC SURVEYS: ITALY © OECD 201586
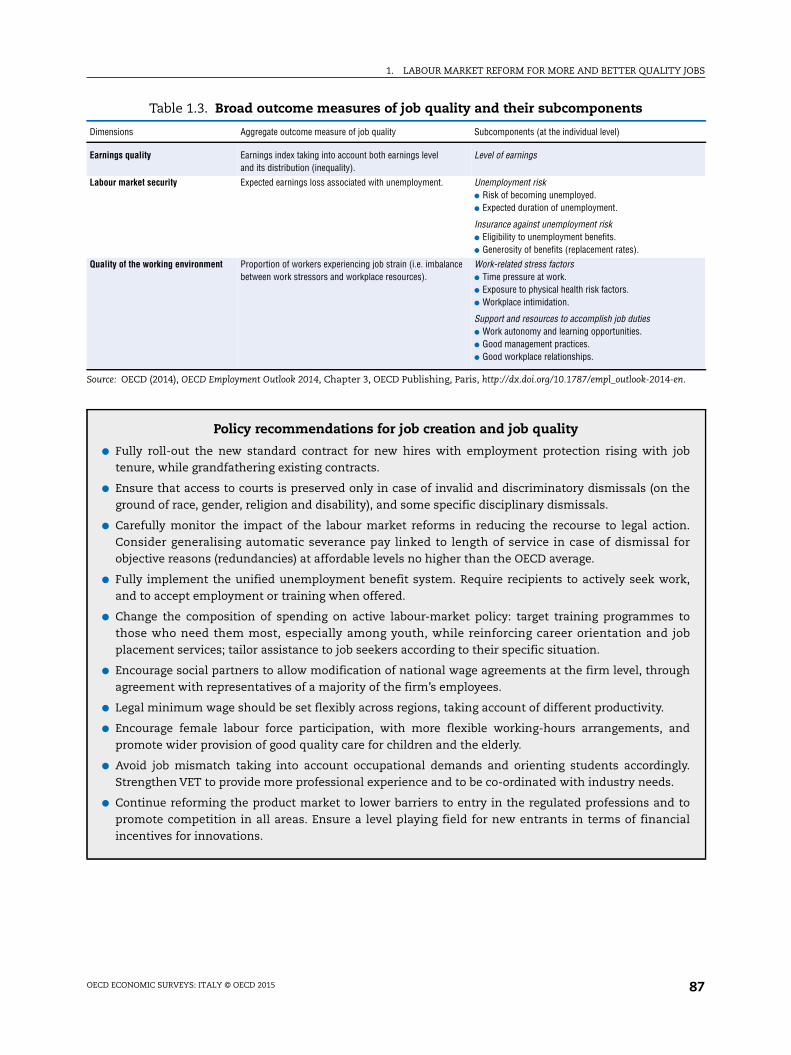
1. LABOUR MARKET REFORM FOR MORE AND BETTER QUALITY JOBS
en.
job
the
on.for
rk,
tojob
gh
nd
gly.
toial
Table 1.3. Broad outcome measures of job quality and their subcomponents
Dimensions Aggregate outcome measure of job quality Subcomponents (at the individual level)
Earnings quality Earnings index taking into account both earnings leveland its distribution (inequality).
Level of earnings
Labour market security Expected earnings loss associated with unemployment. Unemployment risk● Risk of becoming unemployed.● Expected duration of unemployment.
Insurance against unemployment risk● Eligibility to unemployment benefits.● Generosity of benefits (replacement rates).
Quality of the working environment Proportion of workers experiencing job strain (i.e. imbalancebetween work stressors and workplace resources).
Work-related stress factors● Time pressure at work.● Exposure to physical health risk factors.● Workplace intimidation.
Support and resources to accomplish job duties● Work autonomy and learning opportunities.● Good management practices.● Good workplace relationships.
Source: OECD (2014), OECD Employment Outlook 2014, Chapter 3, OECD Publishing, Paris, http://dx.doi.org/10.1787/empl_outlook-2014-
Policy recommendations for job creation and job quality
● Fully roll-out the new standard contract for new hires with employment protection rising withtenure, while grandfathering existing contracts.
● Ensure that access to courts is preserved only in case of invalid and discriminatory dismissals (onground of race, gender, religion and disability), and some specific disciplinary dismissals.
● Carefully monitor the impact of the labour market reforms in reducing the recourse to legal actiConsider generalising automatic severance pay linked to length of service in case of dismissalobjective reasons (redundancies) at affordable levels no higher than the OECD average.
● Fully implement the unified unemployment benefit system. Require recipients to actively seek woand to accept employment or training when offered.
● Change the composition of spending on active labour-market policy: target training programmesthose who need them most, especially among youth, while reinforcing career orientation andplacement services; tailor assistance to job seekers according to their specific situation.
● Encourage social partners to allow modification of national wage agreements at the firm level, throuagreement with representatives of a majority of the firm’s employees.
● Legal minimum wage should be set flexibly across regions, taking account of different productivity.
● Encourage female labour force participation, with more flexible working-hours arrangements, apromote wider provision of good quality care for children and the elderly.
● Avoid job mismatch taking into account occupational demands and orienting students accordinStrengthen VET to provide more professional experience and to be co-ordinated with industry needs.
● Continue reforming the product market to lower barriers to entry in the regulated professions andpromote competition in all areas. Ensure a level playing field for new entrants in terms of financincentives for innovations.
OECD ECONOMIC SURVEYS: ITALY © OECD 2015 87
1. LABOUR MARKET REFORM FOR MORE AND BETTER QUALITY JOBS
References
Adalet McGowan, M. and D. Andrews (2015), “Skill Mismatch and Public Policy in OECD Countries”,OECD Economics Department Working Papers, forthcoming.
Addabbo, T., D. Giovannini and S. Mazzucchelli (2014), “Italy country note”, in P. Moss (ed.), InternationalReview of Leave Policies and Research 2014.
Aidt, T.S. and Z. Tzannatos (2008), “Trade Unions, Collective Bargaining and MacroeconomicPerformance: A Review”, Industrial Relations Journal, Vol. 39, No. 4, pp. 258-295.
Allio, L. and N. Rangone (2015), “Anti-corruption and transparency initiatives for a more accountable andefficient public administration in Italy”, OECD Economics Department Working Papers, forthcoming.
Andrews, D. and F. Cingano (2014), “Public Policy and Resource Allocation: Evidence from Firms inOECD Countries”, Economic Policy, Vol. 29(78), pp. 253-296.
Andrews, D., C. Criscuolo and C. Menon (2014), “Do Resources Flow to Patenting Firms? Cross-CountryEvidence from Firm Level Data”, OECD Economics Department Working Papers, No. 1127, OECDPublishing, Paris.
Bassanini, A. and R. Duval (2009), “Unemployment, Institutions, and Reform Complementarities:Reassessing the Aggregate Evidence for OECD Countries”, Oxford Review of Economic Policy, Vol. 25,pp. 40-59.
Blanchard, O. and J. Wolfers (2000), “The Role of Shocks and Institutions in the Rise of EuropeanUnemployment: The Aggregate Evidence”, The Economic Journal, No. 110, pp. C1-33.
Boeri, T. (2011), “Institutional Reforms and Dualism in European Labor Markets”, in O. Ashenfelter andD. Card (eds.), Handbook of Labor Economics, Vol. 4b, North Holland, Amsterdam.
Boeri, T., A. Ichino and E. Moretti (2014), “Housing, Real Inequality and Mobility”, Presentation atXVI Annual Conference of the Fondazione Rodolfo De Benedetti.
Boeri, T. and J. Jimeno (2005), “The Effects of Employment Protection: Learning from VariableEnforcement”, European Economic Review, Vol. 49, pp. 2057-77.
Caballero, R.J., K.N. Cowan, E.M.R.A. Engel and A. Micco (2004), “Effective Labor Regulation andMicroeconomic Flexibility”, Cowles Foundation Discussion Papers, No. 1480.
Calmfors, L. and J. Driffill (1988), “Bargaining Structure, Corporatism and Macroeconomic Performance”,Economic Policy, Vol. 3, No. 6, pp. 13-62.
Colombo, M.G., L. Grilli and S. Murtinu (2011), “R&D Subsidies and the Performance of High-TechStartups”, Economics Letters, Vol. 112(1), pp. 97-99.
Criscuolo, C. and S. Appelt (2015), “Italy’s innovation policies in review: The new R&D tax credit andPatent Box”, Science, Technology and Industry Policy Brief.
Criscuolo, C., P.N. Gal and C. Menon (2014), “The Dynamics of Employment Growth: New Evidence from18 Countries”, OECD Science, Technology and Industry Policy Papers, No. 14, OECD Publishing, Paris.
Elschner, C., C. Ernst, G. Licht and C. Spengel (2011), “What the Design of an R&D Tax Incentive TellsAbout is Effectiveness: A Simulation of R&D Tax Incentives in the European Union”, Journal ofTechnological Transfer, Vol. 36, pp. 233-256.
Fitoussi, J.P., D. Jestaz, E.S. Phelps and G. Zoega (2000), “Roots of the Recent Recoveries: Labor Reformsor Private Sector Forces?”, Brookings Papers on Economic Activity, Vol. 2000(1), pp. 237-91.
Griffith, R., H. Miller and M. O’Connell (2012), “Corporate taxes and the location of intellectualproperty”, CEPR Discussion Paper, No. 8424.
Higuchi, Y. (2013), “The Dynamics of Poverty and the Promotion of Transition from Non-Regular toRegular Employment in Japan: Economic Effects of Minimum Wage Revision and Job TrainingSupport”, Japanese Economic Review, Vol. 64(2), pp. 147-200.
IMF (2013), “The dog that didn’t bark: Has inflation been muzzled or was it just sleeping”, WorldEconomic Outlook, International Monetary Fund, April.
Jin, Y., R. Fukahori and H. Morgavi (2015), “Identifying the Most Cost Effective Active Labour MarketPolicies for Different Job Seekers”, OECD Economics Department Working Papers, forthcoming.
Kugler, A. and G. Pica (2008), “Effects of Employment Protection on Worker and Job Flows: Evidencefrom the 1990 Italian Reform”, Labour Economics, Vol. 15, pp. 78-95.
OECD ECONOMIC SURVEYS: ITALY © OECD 201588
1. LABOUR MARKET REFORM FOR MORE AND BETTER QUALITY JOBS
Leonardi, M. and G. Pica (2013), “Who Pays for It? The Heterogeneous Wage Effects of EmploymentProtection Legislation”, Economic Journal, Vol. 123, pp. 1236-1278.
Ministry of Labour (2014), Il primo anno di applicazione della legge, No. 92/2012.
Miranda, V. (2011), “Cooking, Caring and Volunteering: Unpaid Work around the World”, OECD Social,Employment and Migration Working Papers, No. 116, OECD Publishing, Paris.
Mortensen, D.T. and C.A. Pissarides (1994), “Job Creation and Job Destruction in the Theory ofUnemployment”, Review of Economic Studies, Vol. 61, pp. 397-415.
Mortensen, D.T. and C.A. Pissarides (1999), “Unemployment Responses to ‘Skill Biased’ Shocks:TheRole of Labor Market Policy”, Economic Journal, No. 109, pp. 242-265.
Nickell, S., L. Nunziata, W. Ochel and G. Quintini (2003), “The Beveridge Curve, Unemployment, andWages in the OECD from the 1960s to the 1990s”, in P. Aghion, R. Frydman, J. Stiglitz, M. Woodford(eds.), Knowledge, Information, and Expectations in Modern Macroeconomics, Princeton: PrincetonUniversity Press.
OECD (2004), OECD Employment Outlook 2004, OECD Publishing, Paris.
OECD (2006), OECD Employment Outlook 2006: Boosting Jobs and Incomes, OECD Publishing, Paris.
OECD (2009), OECD Economic Surveys: Italy 2009, OECD Publishing, Paris.
OECD (2010), Jobs for Youth: Off to a Good Start?, OECD Publishing, Paris.
OECD (2011a), Divided We Stand: Why Inequality Keeps Rising, OECD Publishing, Paris.
OECD (2011b), Doing Better for Families, OECD Publishing, Paris.
OECD (2012), Closing the Gender Gap: Act Now, OECD Publishing, Paris.
OECD (2013a), OECD Economic Surveys: Italy 2013, OECD Publishing, Paris.
OECD (2013b), OECD Employment Outlook 2013, OECD Publishing, Paris.
OECD (2014a), OECD Economic Outlook, November 2014, OECD Publishing, Paris.
OECD (2014b), OECD Employment Outlook 2014, OECD Publishing, Paris, http://dx.doi.org/10.1787/empl_outlook-2014-en.
OECD (2014c), OECD Economic Surveys: Spain 2014, OECD Publishing, Paris.
OECD (2014d), “Policy Challenges for the Next 50 Years”, OECD Economic Policy Papers, No. 9, OECDPublishing, Paris, July 2014.
OECD (2014e), OECD Science, Technology and Industry Outlook, OECD Publishing, Paris.
OECD (2014f), Job Creation and Local Economic Development, OECD Publishing, Paris.
OECD, ILO, IMF and World Bank (2014), “Achieving stronger growth by promoting a more gender-balancedeconomy”, Report prepared for the G20 Labour and Employment Ministerial Meeting Melbourne,Australia, 10-11 September 2014.
Pissarides, C.A. (2000), Equilibrium Unemployment Theory, second edition, The MIT Press.
Phelps, E.S. (1994), Structural Slumps, Harvard University Press, Cambridge, Massachusetts, and London.
Phelps, E.S. and G. Zoega (2013), “Corporatism and Job Satisfaction”, Journal of Comparative Economics,Vol. 41, pp. 35-47.
Rusticelli, E. (2015) “Rescuing the Phillips Curve: Making Use of Long-term Unemployment in theMeasurement of the NAIRU”, in OECD Journal: Economics Studies, forthcoming.
Rusticelli, E., D. Turner and M.C. Cavalleri (2015), “Incorporating Anchored Inflation Expectations in thePhillips Curve and in the Derivation of Measures of OECD Equilibrium Unemployment”, OECDEconomics Department Working Papers, forthcoming.
Schivardi, F. and R. Torrini (2008), “Identifying the Effects of Firing Restrictions Through Size-ContingentDifferences in Regulation”, Labour Economics, Vol. 15, pp. 482-511.
Sestito, P. (2004), “Economic Convergence across and within Europe: is there a puzzle”, presentation atthe 2004 Brussels Economic Forum, 22-23 April.
Thévenon, O., N. Ali, W. Adema and A. Salvi del Pero (2012), “Effects of Reducing Gender Gaps inEducation and Labour Force Participation on Economic Growth in the OECD”, OECD Social, Employmentand Migration Working Papers, No. 138, OECD Publishing, Paris.
OECD ECONOMIC SURVEYS: ITALY © OECD 2015 89


OECD Economic Surveys: Italy
© OECD 2015
Chapter 2
Maintaining fiscal sustainability:Structural fiscal issues
Major progress has been made in moving towards fiscal sustainability, thanks tosubstantial consolidation on both spending and revenue sides. Further structuralimprovements can build on these gains and, more fundamentally, support thegovernment’s reform programme aimed at improving productivity and growth. Taxcompliance is more expensive for companies in Italy than in most OECD countries,while tax expenditures are very numerous. Simplifying the tax system can raiseinvestment and growth, as well reducing costs in the tax agency and improvingcompliance. Value for money in public spending is always important butparticularly so in a situation of tight budgets. Ad hoc spending reviews have beenundertaken, but a systematic approach is needed. Some existing tools to promotevalue for money can be improved, while reform of public administration, includingbetter use of transparency and anti-corruption measures, can support their effectiveuse. The Internal Stability Pact (ISP) has been a necessary domestic counterpart ofEuropean fiscal rules, but has imposed a number of constraints on sub-nationaladministration that go beyond what is needed for EU purposes. Constitutionalreforms, balanced budget rules for sub-national administrations and finalimplementation of long-awaited rules on fiscal federalism provide an opportunity toconsiderably simplify or eliminate the ISP.
The statistical data for Israel are supplied by and under the responsibility of the relevant Israeliauthorities. The use of such data by the OECD is without prejudice to the status of the Golan Heights,East Jerusalem and Israeli settlements in the West Bank under the terms of international law.
91
2. MAINTAINING FISCAL SUSTAINABILITY: STRUCTURAL FISCAL ISSUES
Italy has made much progress in strengthening its fiscal policy, reducing the structural
budget deficit by around four percentage points between 2009 and 2012, with some further
tightening since. The headline deficit is now below 3% of GDP. However, the debt-to-GDP
ratio is still rising as the economy has contracted and inflation fallen. The manner in which
the necessarily tight budget targets are achieved can be as important as the level of the
targets themselves.
The effort to contain the deficit and to undertake significant fiscal consolidation in
difficult circumstances has led to tensions: in relations between central and sub-national
government; in public spending control; and in taxation. For example, central government
transfers to regions, provinces and municipalities have fallen substantially with little
reduction in their statutory obligations; civil servant salaries and recruitment have been
largely frozen for four years; and already high levels of taxation have been increased.
Successive governments have aimed to deal with these problems. A 2009 framework
law set out the basic lines for fiscal federalism, but the working of the Internal Stability
Pact, designed to make local government finances compatible with the European Union
standards and constraints, has not always worked smoothly. Two successive governments
have started Spending Reviews aimed at finding cost-efficient ways to cut spending. The
government is implementing changes to the tax system changes under a framework law
passed in the spring of 2014.
This chapter explores tax policy and spending control to suggest ways in which
improvements in these areas can help to meet the macro constraints on overall fiscal policy
more efficiently. The next section looks at how changes to some aspects of the taxation
system could meet policy objectives at less cost and be made more growth-friendly. The
subsequent section discusses how government have met spending targets, notably through
the Spending Review, and what is needed to ensure effective spending control in the future.
The final section looks at the Internal Stability Pact and evolving fiscal federalism, in the
context of a continuing, perhaps growing, regional divide.
TaxationTotal public spending is relatively high in Italy (Figure 2.1). High taxation is needed to
finance it. The distortionary effect of taxation is amplified by a number of factors. Two of
the most important are tax evasion and complexity. Other problems are often related to
these two – frequently changing tax rules, difficulty in understanding what the rules are,
and an invasive tax administration, for example.
Tax compliance
Tax evasion is a major problem in Italy and, although its full extent is not known
accurately, it is considered to be higher than in most OECD countries. Tax evasion is likely
one of the main reasons that the underground economy is relatively large in Italy. Prior the
latest revision of national accounts methodology, the national statistics institute, Istat,
OECD ECONOMIC SURVEYS: ITALY © OECD 201592
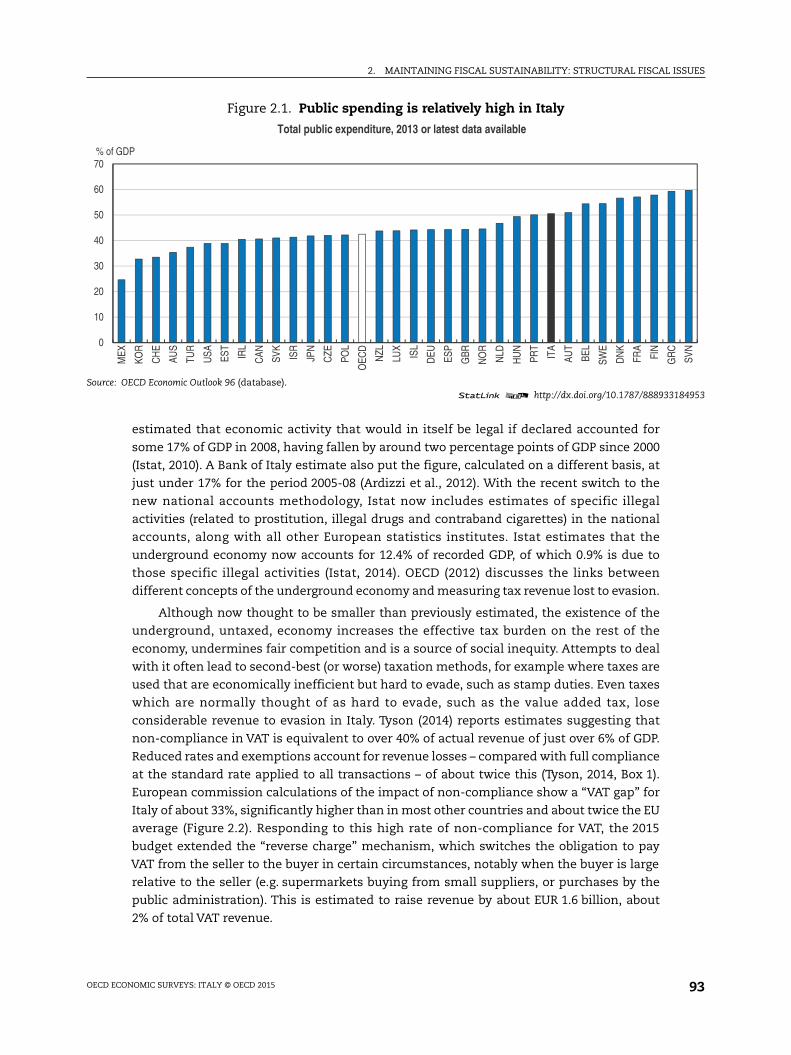
2. MAINTAINING FISCAL SUSTAINABILITY: STRUCTURAL FISCAL ISSUES
184953
GR
C
SVN
estimated that economic activity that would in itself be legal if declared accounted for
some 17% of GDP in 2008, having fallen by around two percentage points of GDP since 2000
(Istat, 2010). A Bank of Italy estimate also put the figure, calculated on a different basis, at
just under 17% for the period 2005-08 (Ardizzi et al., 2012). With the recent switch to the
new national accounts methodology, Istat now includes estimates of specific illegal
activities (related to prostitution, illegal drugs and contraband cigarettes) in the national
accounts, along with all other European statistics institutes. Istat estimates that the
underground economy now accounts for 12.4% of recorded GDP, of which 0.9% is due to
those specific illegal activities (Istat, 2014). OECD (2012) discusses the links between
different concepts of the underground economy and measuring tax revenue lost to evasion.
Although now thought to be smaller than previously estimated, the existence of the
underground, untaxed, economy increases the effective tax burden on the rest of the
economy, undermines fair competition and is a source of social inequity. Attempts to deal
with it often lead to second-best (or worse) taxation methods, for example where taxes are
used that are economically inefficient but hard to evade, such as stamp duties. Even taxes
which are normally thought of as hard to evade, such as the value added tax, lose
considerable revenue to evasion in Italy. Tyson (2014) reports estimates suggesting that
non-compliance in VAT is equivalent to over 40% of actual revenue of just over 6% of GDP.
Reduced rates and exemptions account for revenue losses – compared with full compliance
at the standard rate applied to all transactions – of about twice this (Tyson, 2014, Box 1).
European commission calculations of the impact of non-compliance show a “VAT gap” for
Italy of about 33%, significantly higher than in most other countries and about twice the EU
average (Figure 2.2). Responding to this high rate of non-compliance for VAT, the 2015
budget extended the “reverse charge” mechanism, which switches the obligation to pay
VAT from the seller to the buyer in certain circumstances, notably when the buyer is large
relative to the seller (e.g. supermarkets buying from small suppliers, or purchases by the
public administration). This is estimated to raise revenue by about EUR 1.6 billion, about
2% of total VAT revenue.
Figure 2.1. Public spending is relatively high in Italy
Source: OECD Economic Outlook 96 (database).1 2 http://dx.doi.org/10.1787/888933
0
10
20
30
40
50
60
70
MEX
KOR
CH
E
AUS
TUR
USA ES
T
IRL
CAN SV
K
ISR
JPN
CZE
POL
OEC
D
NZL
LUX
ISL
DEU ES
P
GBR
NO
R
NLD
HU
N
PRT
ITA
AUT
BEL
SWE
DN
K
FRA
FIN
% of GDP
Total public expenditure, 2013 or latest data available
OECD ECONOMIC SURVEYS: ITALY © OECD 2015 93
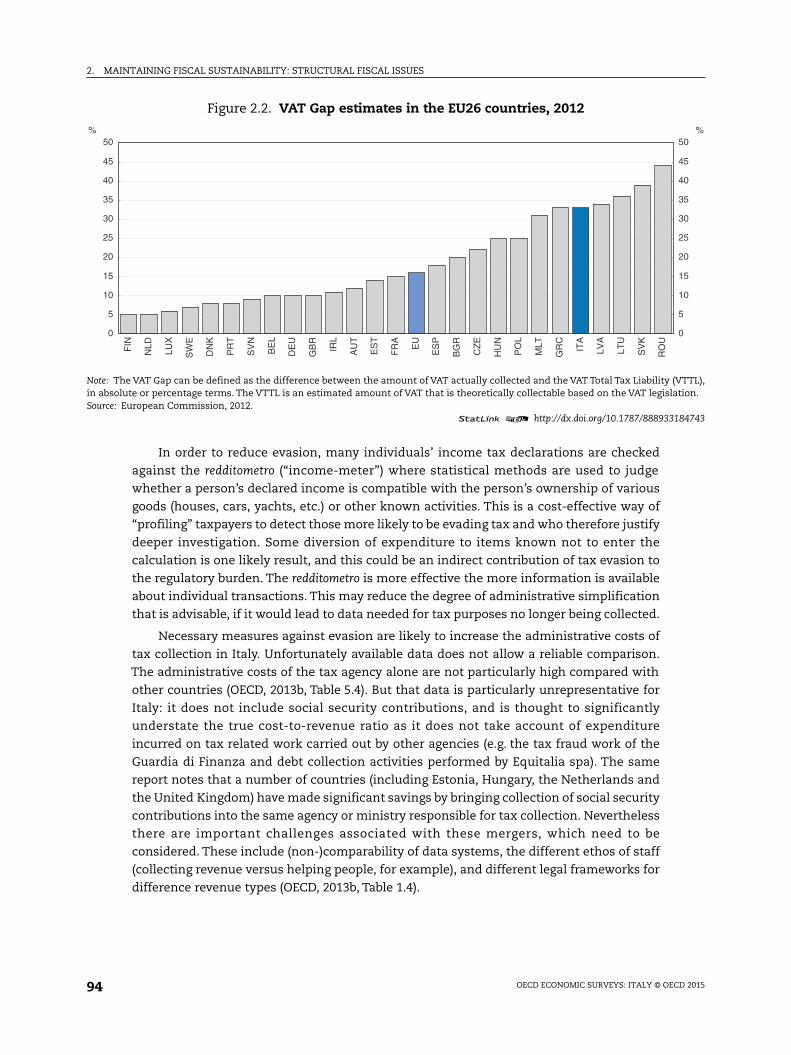
2. MAINTAINING FISCAL SUSTAINABILITY: STRUCTURAL FISCAL ISSUES
(VTTL),ation.
184743
0
5
10
15
20
25
30
35
40
45
50%
In order to reduce evasion, many individuals’ income tax declarations are checked
against the redditometro (“income-meter”) where statistical methods are used to judge
whether a person’s declared income is compatible with the person’s ownership of various
goods (houses, cars, yachts, etc.) or other known activities. This is a cost-effective way of
“profiling” taxpayers to detect those more likely to be evading tax and who therefore justify
deeper investigation. Some diversion of expenditure to items known not to enter the
calculation is one likely result, and this could be an indirect contribution of tax evasion to
the regulatory burden. The redditometro is more effective the more information is available
about individual transactions. This may reduce the degree of administrative simplification
that is advisable, if it would lead to data needed for tax purposes no longer being collected.
Necessary measures against evasion are likely to increase the administrative costs of
tax collection in Italy. Unfortunately available data does not allow a reliable comparison.
The administrative costs of the tax agency alone are not particularly high compared with
other countries (OECD, 2013b, Table 5.4). But that data is particularly unrepresentative for
Italy: it does not include social security contributions, and is thought to significantly
understate the true cost-to-revenue ratio as it does not take account of expenditure
incurred on tax related work carried out by other agencies (e.g. the tax fraud work of the
Guardia di Finanza and debt collection activities performed by Equitalia spa). The same
report notes that a number of countries (including Estonia, Hungary, the Netherlands and
the United Kingdom) have made significant savings by bringing collection of social security
contributions into the same agency or ministry responsible for tax collection. Nevertheless
there are important challenges associated with these mergers, which need to be
considered. These include (non-)comparability of data systems, the different ethos of staff
(collecting revenue versus helping people, for example), and different legal frameworks for
difference revenue types (OECD, 2013b, Table 1.4).
Figure 2.2. VAT Gap estimates in the EU26 countries, 2012
Note: The VAT Gap can be defined as the difference between the amount of VAT actually collected and the VAT Total Tax Liabilityin absolute or percentage terms. The VTTL is an estimated amount of VAT that is theoretically collectable based on the VAT legislSource: European Commission, 2012.
1 2 http://dx.doi.org/10.1787/888933
0
5
10
15
20
25
30
35
40
45
50%
FIN
NLD
LUX
SW
E
DN
K
PR
T
SV
N
BE
L
DE
U
GB
R
IRL
AU
T
ES
T
FR
A
EU
ES
P
BG
R
CZ
E
HU
N
PO
L
MLT
GR
C
ITA
LVA
LTU
SV
K
RO
U
OECD ECONOMIC SURVEYS: ITALY © OECD 201594
2. MAINTAINING FISCAL SUSTAINABILITY: STRUCTURAL FISCAL ISSUES
Tax amnesties and incentives to disclosure
A Ministry of Finance study into evasion makes two important points, first that there
is a cultural element in tax evasion; and second that tax amnesties have played an
important part in maintaining this culture (MEF, 2014b). MEF (2014b) states quite clearly
that the government has no intention of renewing the tradition of tax amnesties.
Amnesties, in which the punishment provided by law is reduced or removed for all (or
some categories of) outstanding offences, in order either to clear a judicial backlog, to start
a new policy with a clean slate, or in some cases to support other policies, have been
prevalent in Italy.* According to MEF (2014b) there have been 80 tax amnesties (condoni
tributari) in the 150 years of the Italian state. Amnesties are not restricted to taxes, but have
also been used frequently in immigration policy where they could be thought of as
establishing a de facto path to immigration through an employability test (OECD, 2005).
Amnesties used also to be de facto quite frequent in urban planning for individual
violations of construction permit requirements, but are much less frequent now as the rule
of law has become better established. Nevertheless in recent years the central government
has on occasion suspended or altered planning restrictions (which are in principle reserved
to sub-national government) in order to boost the construction industry.
The line between an amnesty and measures to encourage voluntary declaration can be
thin. Most countries reduce the penalty on unpaid taxation on assets held abroad when
there is voluntary disclosure and the standard Italian provisions for this are similar to
many countries (OECD, 2010a). However an additional “one-off” measure was taken
in 2008, reducing the penalties to a very low level (50% tax rate on imputed returns of
2% per annum); this was not referred to as an amnesty (it was called a tax “shield”), but,
since the penalties were very low, in practice it was very similar. This measure raised a
significant amount of revenue in 2009 but likely at the cost of encouraging further evasion.
The March 2014 tax reform enabling law provides for measures to improve relations
between taxpayers and the authorities, including simplification measures such as pre-filled
tax forms for individuals (Box 2.1). These are good steps. The law also provides for measures
such as reduced penalties to encourage voluntary disclosure. An OECD report in 2013
suggested that in some countries incentives for voluntary disclosure are underused, though
Italy was at that time one of a minority of countries reporting that it already had such
provision (OECD, 2013b). Incentives for voluntary disclosure can be a useful way to improve
compliance but they have to strike a difficult balance between generosity that can be
exploited by deliberate evaders and too-strong penalties in other cases. In December 2014
the government proposed new rules for dealing with voluntary disclosure, both of capital
held abroad and of domestic undeclared activities. Penalties for evasion are reduced in the
case of voluntary disclosure, but not eliminated, and full payment of outstanding taxes and
interest is required. Criminal sanctions will be retained only for the most serious offences,
essentially when evasion is part of an operation to recycle gains from illicit activities. The
government subsequently announced it would publish revised proposals in February 2015.
* MEF (2014b) reports that the largest recorded tax amnesty was implemented in the year A.D. 118,when tax arrears of about 900 million sesterces, equivalent to almost one year’s imperial revenue,were cancelled by the emperor Hadrian. See MEF (2014b) Footnote 91.
OECD ECONOMIC SURVEYS: ITALY © OECD 2015 95
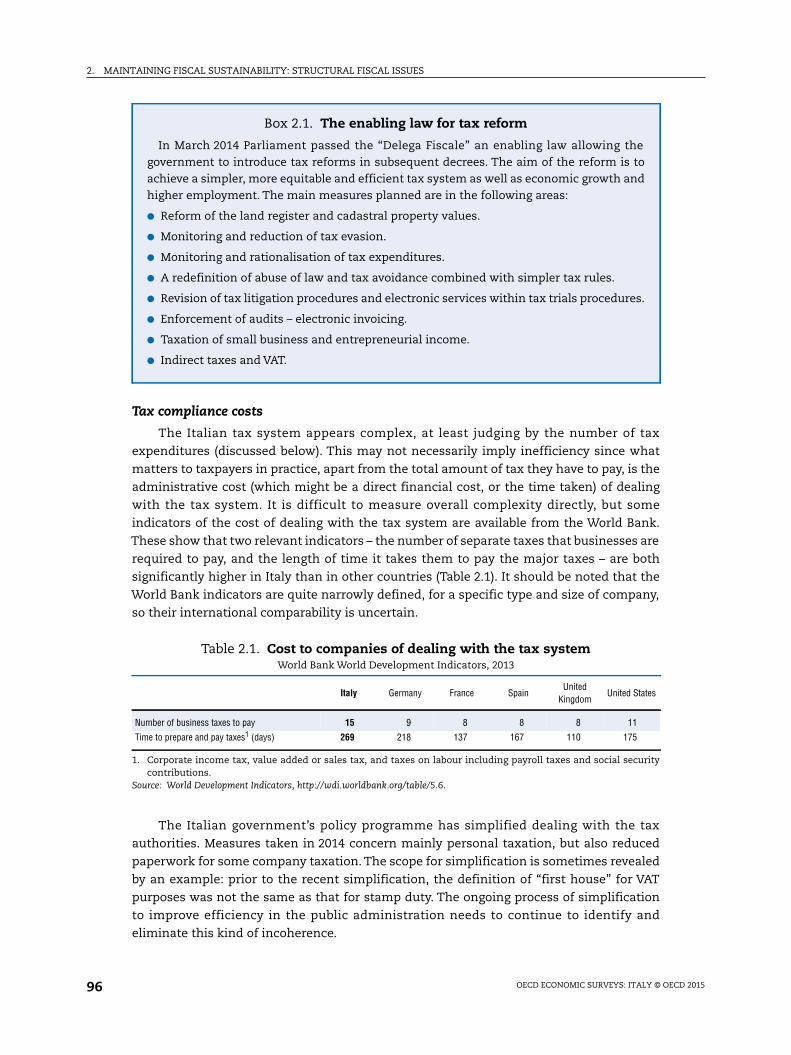
2. MAINTAINING FISCAL SUSTAINABILITY: STRUCTURAL FISCAL ISSUES
Tax compliance costs
The Italian tax system appears complex, at least judging by the number of tax
expenditures (discussed below). This may not necessarily imply inefficiency since what
matters to taxpayers in practice, apart from the total amount of tax they have to pay, is the
administrative cost (which might be a direct financial cost, or the time taken) of dealing
with the tax system. It is difficult to measure overall complexity directly, but some
indicators of the cost of dealing with the tax system are available from the World Bank.
These show that two relevant indicators – the number of separate taxes that businesses are
required to pay, and the length of time it takes them to pay the major taxes – are both
significantly higher in Italy than in other countries (Table 2.1). It should be noted that the
World Bank indicators are quite narrowly defined, for a specific type and size of company,
so their international comparability is uncertain.
The Italian government’s policy programme has simplified dealing with the tax
authorities. Measures taken in 2014 concern mainly personal taxation, but also reduced
paperwork for some company taxation. The scope for simplification is sometimes revealed
by an example: prior to the recent simplification, the definition of “first house” for VAT
purposes was not the same as that for stamp duty. The ongoing process of simplification
to improve efficiency in the public administration needs to continue to identify and
eliminate this kind of incoherence.
Box 2.1. The enabling law for tax reform
In March 2014 Parliament passed the “Delega Fiscale” an enabling law allowing thegovernment to introduce tax reforms in subsequent decrees. The aim of the reform is toachieve a simpler, more equitable and efficient tax system as well as economic growth andhigher employment. The main measures planned are in the following areas:
● Reform of the land register and cadastral property values.
● Monitoring and reduction of tax evasion.
● Monitoring and rationalisation of tax expenditures.
● A redefinition of abuse of law and tax avoidance combined with simpler tax rules.
● Revision of tax litigation procedures and electronic services within tax trials procedures.
● Enforcement of audits – electronic invoicing.
● Taxation of small business and entrepreneurial income.
● Indirect taxes and VAT.
Table 2.1. Cost to companies of dealing with the tax systemWorld Bank World Development Indicators, 2013
Italy Germany France SpainUnited
KingdomUnited States
Number of business taxes to pay 15 9 8 8 8 11
Time to prepare and pay taxes1 (days) 269 218 137 167 110 175
1. Corporate income tax, value added or sales tax, and taxes on labour including payroll taxes and social securitycontributions.
Source: World Development Indicators, http://wdi.worldbank.org/table/5.6.
OECD ECONOMIC SURVEYS: ITALY © OECD 201596
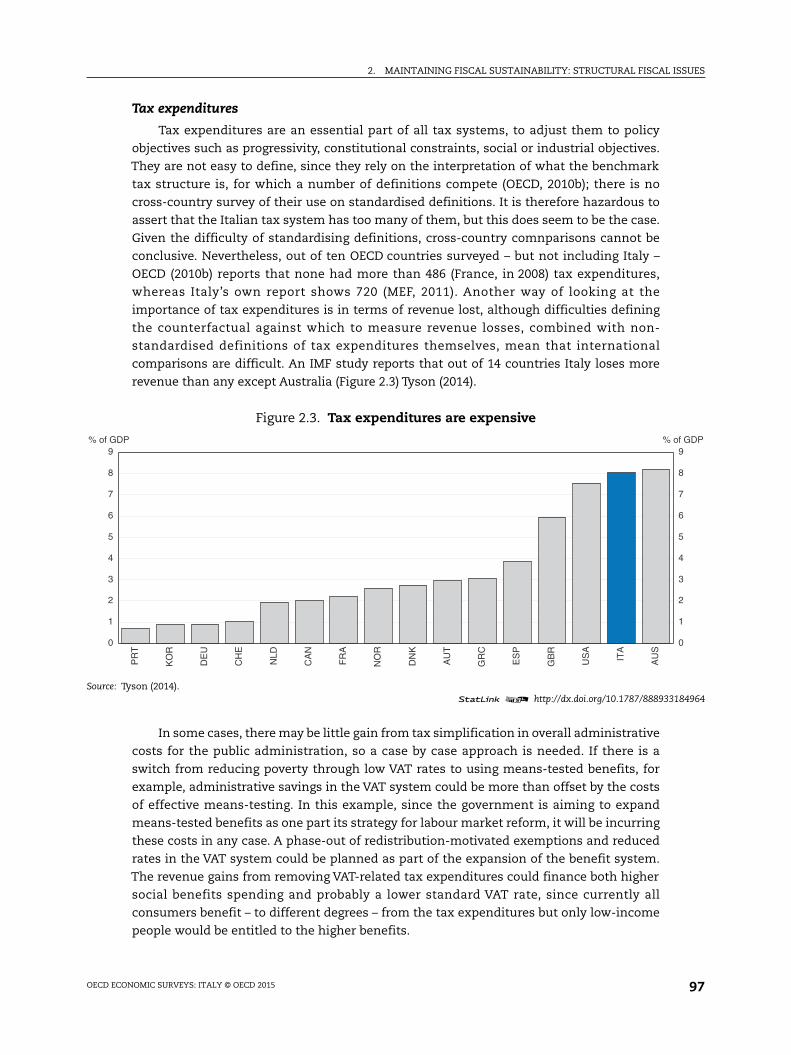
2. MAINTAINING FISCAL SUSTAINABILITY: STRUCTURAL FISCAL ISSUES
184964
0
1
2
3
4
5
6
7
8
9of GDP
Tax expenditures
Tax expenditures are an essential part of all tax systems, to adjust them to policy
objectives such as progressivity, constitutional constraints, social or industrial objectives.
They are not easy to define, since they rely on the interpretation of what the benchmark
tax structure is, for which a number of definitions compete (OECD, 2010b); there is no
cross-country survey of their use on standardised definitions. It is therefore hazardous to
assert that the Italian tax system has too many of them, but this does seem to be the case.
Given the difficulty of standardising definitions, cross-country comnparisons cannot be
conclusive. Nevertheless, out of ten OECD countries surveyed – but not including Italy –
OECD (2010b) reports that none had more than 486 (France, in 2008) tax expenditures,
whereas Italy’s own report shows 720 (MEF, 2011). Another way of looking at the
importance of tax expenditures is in terms of revenue lost, although difficulties defining
the counterfactual against which to measure revenue losses, combined with non-
standardised definitions of tax expenditures themselves, mean that international
comparisons are difficult. An IMF study reports that out of 14 countries Italy loses more
revenue than any except Australia (Figure 2.3) Tyson (2014).
In some cases, there may be little gain from tax simplification in overall administrative
costs for the public administration, so a case by case approach is needed. If there is a
switch from reducing poverty through low VAT rates to using means-tested benefits, for
example, administrative savings in the VAT system could be more than offset by the costs
of effective means-testing. In this example, since the government is aiming to expand
means-tested benefits as one part its strategy for labour market reform, it will be incurring
these costs in any case. A phase-out of redistribution-motivated exemptions and reduced
rates in the VAT system could be planned as part of the expansion of the benefit system.
The revenue gains from removing VAT-related tax expenditures could finance both higher
social benefits spending and probably a lower standard VAT rate, since currently all
consumers benefit – to different degrees – from the tax expenditures but only low-income
people would be entitled to the higher benefits.
Figure 2.3. Tax expenditures are expensive
Source: Tyson (2014).1 2 http://dx.doi.org/10.1787/888933
0
1
2
3
4
5
6
7
8
9% of GDP
%
PR
T
KO
R
DE
U
CH
E
NLD
CA
N
FR
A
NO
R
DN
K
AU
T
GR
C
ES
P
GB
R
US
A
ITA
AU
S
OECD ECONOMIC SURVEYS: ITALY © OECD 2015 97
2. MAINTAINING FISCAL SUSTAINABILITY: STRUCTURAL FISCAL ISSUES
A small number of tax expenditures were eliminated in 2014. Of the seven items
eliminated, 5 were tax credits to encourage specific activities by specific types of firms or
in specific areas. Two concerned specific fuel tax reductions: these were very minor
compared with the major tax expenditure in this area, such as on road-transport fuel,
which, apart from any administrative costs, are environmentally counter-productive.
Transactions taxes – stamp duties
Transactions taxes, especially those associated with change of ownership of land or
buildings attract a significant number of tax expenditures. These reveal problems with the
taxes themselves, as the tax expenditures attempt to attenuate the worst of the distortions
that they create. Most of these taxes come under the heading of stamp duty (imposta di
registro). The related transactions (including those where no payment is made) are subject
to a variety of taxes, some are fixed charges, while others are related to the value of the
property transferred. In the latter case, the imposta di registro, there are two basic rates
(9% and 12%) applied in different cases, but in addition a number of exemptions or
reductions are applied. For example, on the purchase of a first house the imposta di registro
is reduced from 9% to 2% and two other taxes are applied as a fixed charge instead of a
proportionate charge. The loss of revenue was estimated at around EUR 1 billion in 2011
(MEF, 2011, p. 365). Another example is a reduction of a similar nature applied to transfers
of small tracts of agricultural land. In this case the reduction is much greater (from taxes
totalling 12% to a rate of 1%) but the revenue loss is much smaller (EUR 44 million) because
there are far fewer transactions, and the total tax paid is limited to EUR 1 000. Other cases
concern different rates according to the land’s designation for planning purposes. Other
minor exemptions and reduced rates exist. In the past there were very many more; most of
them were abolished in 2011.
A different kind of transaction, but facing similar taxation, concerns contracts. Rental
contracts are also subject to the imposta di registro. Where these apply to rental
accommodation contracts, a reduced rate is applied. Mortgage contracts are also subject to
this tax, except for residential loans whose exemption counts as a tax expenditure. The
exemption of insurance policies also counts as a tax expenditure.
In general, taxes on transactions are easy to collect but it is hard to make them
proportionate to standard criteria of ability to pay or some negative externality. For
instance, a residential property that generates income (either actual or imputed) can be
taxed on that income. A wealth tax might also fit some social objectives (though likely to
distort savings-investment decisions). But there is no obvious reason in either case why the
tax should be a function of how often ownership changes. While charges related to the
actual administrative costs for the registry are appropriate, transactions taxes tend to
reduce economic efficiency, by making it more expensive to shift resources from one use,
or user, to another. In the case of taxes on house purchase, for example, they can inhibit
geographical mobility in the labour market.
In the case of the imposte di registro, therefore, many of the related tax expenditures are
needed to avoid their worst distortionary effects. The policy aim should be to remove these
taxes altogether (except those directly covering administrative costs) rather than to reduce
the tax expenditures. In the short run, this would be difficult because of revenue losses. In
fact their high levels in the first place are partly due to tax evasion elsewhere: taxes on
transfers of property are very difficult to evade if legal title to a property is to be claimed. A
OECD ECONOMIC SURVEYS: ITALY © OECD 201598
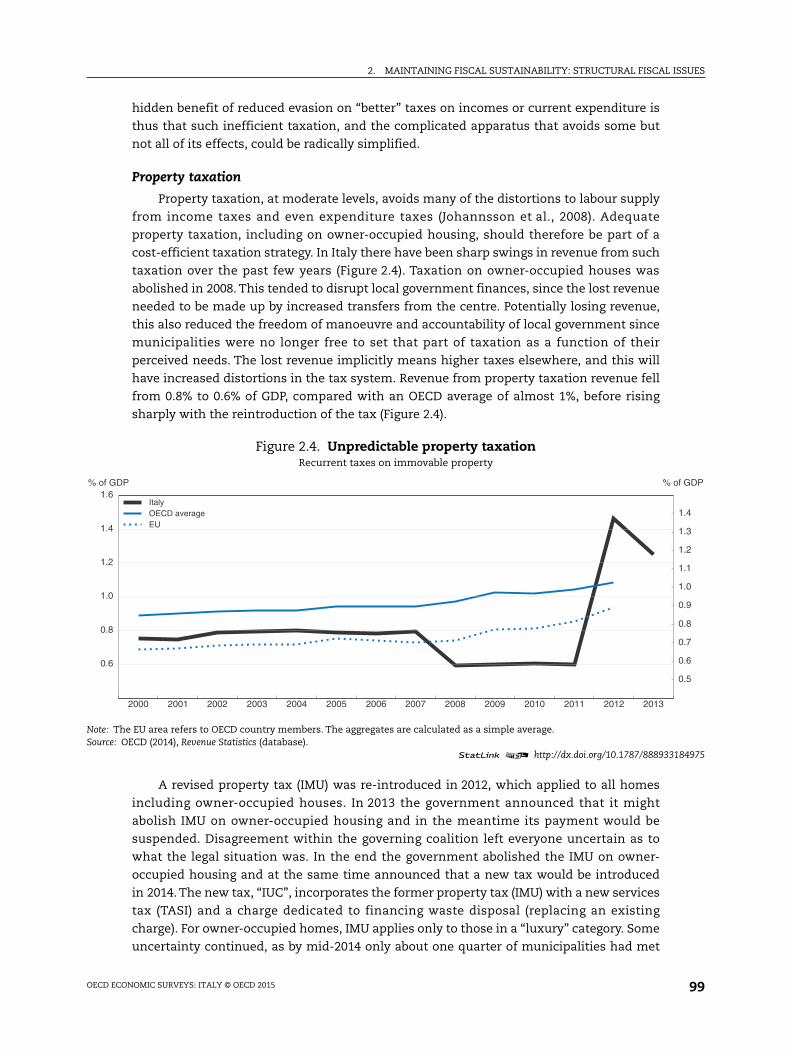
2. MAINTAINING FISCAL SUSTAINABILITY: STRUCTURAL FISCAL ISSUES
184975
0.5
0.6
0.7
0.8
0.9
1.0
1.1
1.2
1.3
1.4
of GDP
hidden benefit of reduced evasion on “better” taxes on incomes or current expenditure is
thus that such inefficient taxation, and the complicated apparatus that avoids some but
not all of its effects, could be radically simplified.
Property taxation
Property taxation, at moderate levels, avoids many of the distortions to labour supply
from income taxes and even expenditure taxes (Johannsson et al., 2008). Adequate
property taxation, including on owner-occupied housing, should therefore be part of a
cost-efficient taxation strategy. In Italy there have been sharp swings in revenue from such
taxation over the past few years (Figure 2.4). Taxation on owner-occupied houses was
abolished in 2008. This tended to disrupt local government finances, since the lost revenue
needed to be made up by increased transfers from the centre. Potentially losing revenue,
this also reduced the freedom of manoeuvre and accountability of local government since
municipalities were no longer free to set that part of taxation as a function of their
perceived needs. The lost revenue implicitly means higher taxes elsewhere, and this will
have increased distortions in the tax system. Revenue from property taxation revenue fell
from 0.8% to 0.6% of GDP, compared with an OECD average of almost 1%, before rising
sharply with the reintroduction of the tax (Figure 2.4).
A revised property tax (IMU) was re-introduced in 2012, which applied to all homes
including owner-occupied houses. In 2013 the government announced that it might
abolish IMU on owner-occupied housing and in the meantime its payment would be
suspended. Disagreement within the governing coalition left everyone uncertain as to
what the legal situation was. In the end the government abolished the IMU on owner-
occupied housing and at the same time announced that a new tax would be introduced
in 2014. The new tax, “IUC”, incorporates the former property tax (IMU) with a new services
tax (TASI) and a charge dedicated to financing waste disposal (replacing an existing
charge). For owner-occupied homes, IMU applies only to those in a “luxury” category. Some
uncertainty continued, as by mid-2014 only about one quarter of municipalities had met
Figure 2.4. Unpredictable property taxationRecurrent taxes on immovable property
Note: The EU area refers to OECD country members. The aggregates are calculated as a simple average.Source: OECD (2014), Revenue Statistics (database).
1 2 http://dx.doi.org/10.1787/888933
2000 2001 2002 2003 2004 2005 2006 2007 2008 2009 2010 2011 2012 2013
0.6
0.8
1.0
1.2
1.4
1.6% of GDP %
ItalyOECD averageEU
OECD ECONOMIC SURVEYS: ITALY © OECD 2015 99
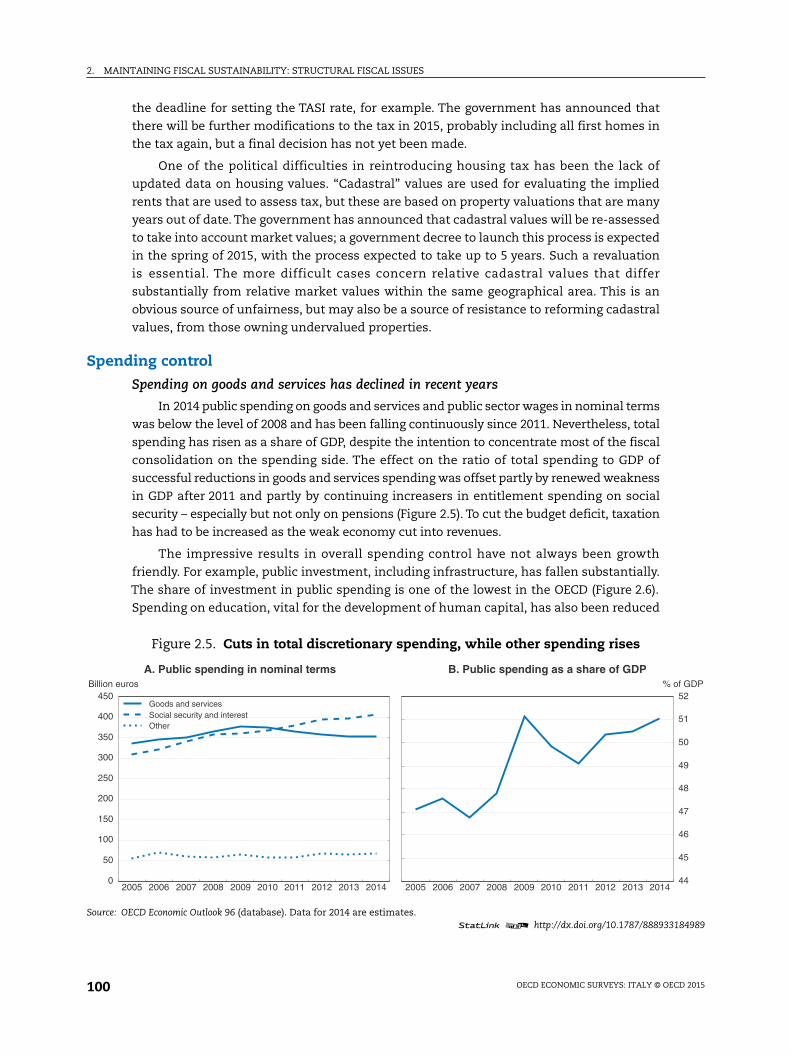
2. MAINTAINING FISCAL SUSTAINABILITY: STRUCTURAL FISCAL ISSUES
184989
44
45
46
47
48
49
50
51
52of GDP
the deadline for setting the TASI rate, for example. The government has announced that
there will be further modifications to the tax in 2015, probably including all first homes in
the tax again, but a final decision has not yet been made.
One of the political difficulties in reintroducing housing tax has been the lack of
updated data on housing values. “Cadastral” values are used for evaluating the implied
rents that are used to assess tax, but these are based on property valuations that are many
years out of date. The government has announced that cadastral values will be re-assessed
to take into account market values; a government decree to launch this process is expected
in the spring of 2015, with the process expected to take up to 5 years. Such a revaluation
is essential. The more difficult cases concern relative cadastral values that differ
substantially from relative market values within the same geographical area. This is an
obvious source of unfairness, but may also be a source of resistance to reforming cadastral
values, from those owning undervalued properties.
Spending control
Spending on goods and services has declined in recent years
In 2014 public spending on goods and services and public sector wages in nominal terms
was below the level of 2008 and has been falling continuously since 2011. Nevertheless, total
spending has risen as a share of GDP, despite the intention to concentrate most of the fiscal
consolidation on the spending side. The effect on the ratio of total spending to GDP of
successful reductions in goods and services spending was offset partly by renewed weakness
in GDP after 2011 and partly by continuing increasers in entitlement spending on social
security – especially but not only on pensions (Figure 2.5). To cut the budget deficit, taxation
has had to be increased as the weak economy cut into revenues.
The impressive results in overall spending control have not always been growth
friendly. For example, public investment, including infrastructure, has fallen substantially.
The share of investment in public spending is one of the lowest in the OECD (Figure 2.6).
Spending on education, vital for the development of human capital, has also been reduced
Figure 2.5. Cuts in total discretionary spending, while other spending rises
Source: OECD Economic Outlook 96 (database). Data for 2014 are estimates.1 2 http://dx.doi.org/10.1787/888933
2005 2006 2007 2008 2009 2010 2011 2012 2013 20140
50
100
150
200
250
300
350
400
450Billion euros
Goods and servicesSocial security and interestOther
A. Public spending in nominal terms
2005 2006 2007 2008 2009 2010 2011 2012 2013 2014
%
B. Public spending as a share of GDP
OECD ECONOMIC SURVEYS: ITALY © OECD 2015100
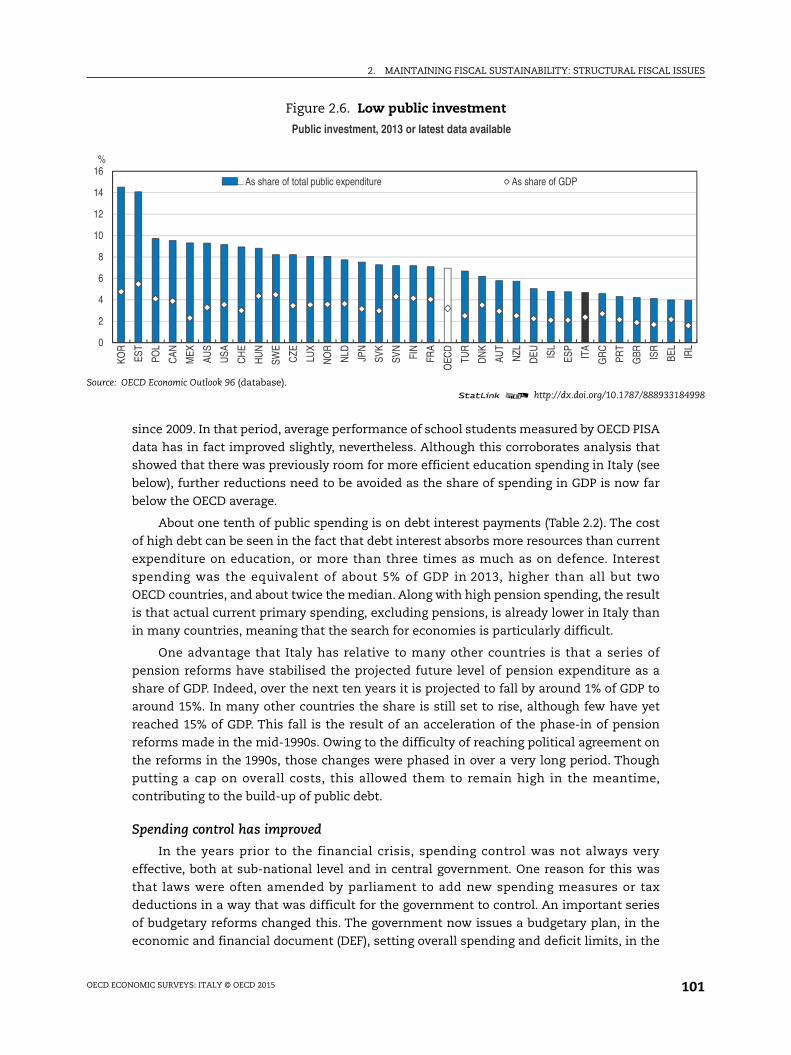
2. MAINTAINING FISCAL SUSTAINABILITY: STRUCTURAL FISCAL ISSUES
184998
BEL
IRL
since 2009. In that period, average performance of school students measured by OECD PISA
data has in fact improved slightly, nevertheless. Although this corroborates analysis that
showed that there was previously room for more efficient education spending in Italy (see
below), further reductions need to be avoided as the share of spending in GDP is now far
below the OECD average.
About one tenth of public spending is on debt interest payments (Table 2.2). The cost
of high debt can be seen in the fact that debt interest absorbs more resources than current
expenditure on education, or more than three times as much as on defence. Interest
spending was the equivalent of about 5% of GDP in 2013, higher than all but two
OECD countries, and about twice the median. Along with high pension spending, the result
is that actual current primary spending, excluding pensions, is already lower in Italy than
in many countries, meaning that the search for economies is particularly difficult.
One advantage that Italy has relative to many other countries is that a series of
pension reforms have stabilised the projected future level of pension expenditure as a
share of GDP. Indeed, over the next ten years it is projected to fall by around 1% of GDP to
around 15%. In many other countries the share is still set to rise, although few have yet
reached 15% of GDP. This fall is the result of an acceleration of the phase-in of pension
reforms made in the mid-1990s. Owing to the difficulty of reaching political agreement on
the reforms in the 1990s, those changes were phased in over a very long period. Though
putting a cap on overall costs, this allowed them to remain high in the meantime,
contributing to the build-up of public debt.
Spending control has improved
In the years prior to the financial crisis, spending control was not always very
effective, both at sub-national level and in central government. One reason for this was
that laws were often amended by parliament to add new spending measures or tax
deductions in a way that was difficult for the government to control. An important series
of budgetary reforms changed this. The government now issues a budgetary plan, in the
economic and financial document (DEF), setting overall spending and deficit limits, in the
Figure 2.6. Low public investment
Source: OECD Economic Outlook 96 (database).1 2 http://dx.doi.org/10.1787/888933
0
2
4
6
8
10
12
14
16
KOR
EST
POL
CAN
MEX
AUS
USA
CH
E
HU
N
SWE
CZE LU
X
NO
R
NLD JP
N
SVK
SVN
FIN
FRA
OEC
D
TUR
DN
K
AUT
NZL
DEU IS
L
ESP
ITA
GR
C
PRT
GBR IS
R
%
Public investment, 2013 or latest data available
As share of total public expenditure As share of GDP
OECD ECONOMIC SURVEYS: ITALY © OECD 2015 101
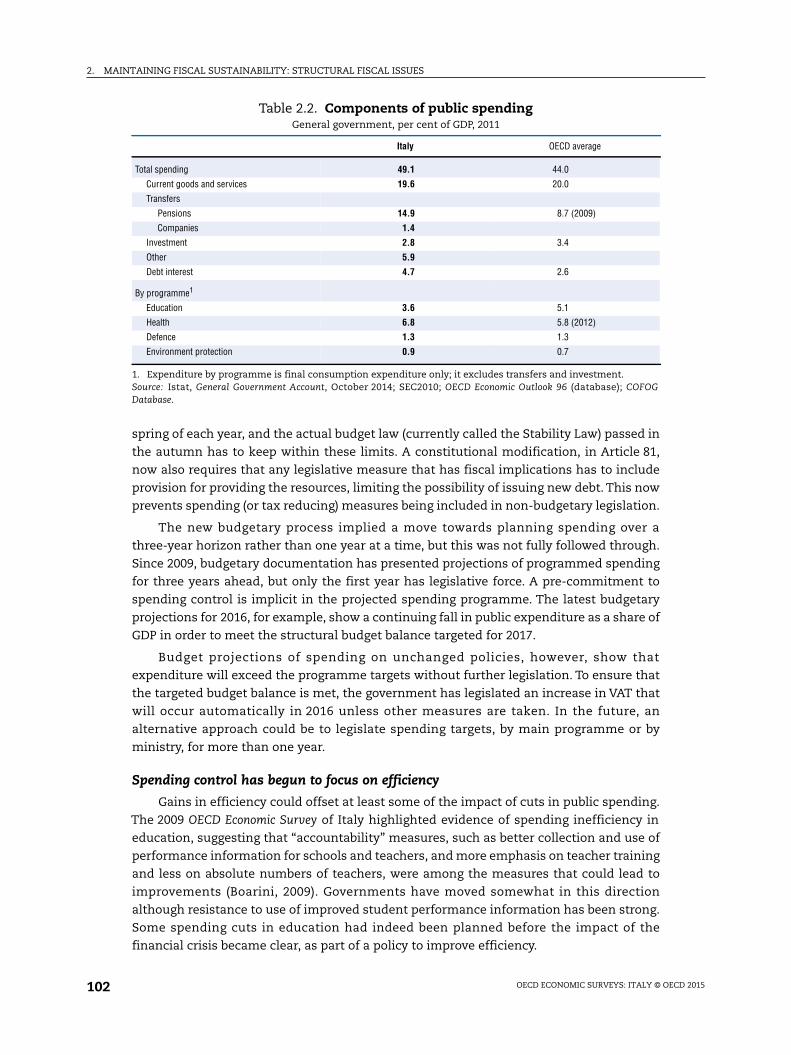
2. MAINTAINING FISCAL SUSTAINABILITY: STRUCTURAL FISCAL ISSUES
spring of each year, and the actual budget law (currently called the Stability Law) passed in
the autumn has to keep within these limits. A constitutional modification, in Article 81,
now also requires that any legislative measure that has fiscal implications has to include
provision for providing the resources, limiting the possibility of issuing new debt. This now
prevents spending (or tax reducing) measures being included in non-budgetary legislation.
The new budgetary process implied a move towards planning spending over a
three-year horizon rather than one year at a time, but this was not fully followed through.
Since 2009, budgetary documentation has presented projections of programmed spending
for three years ahead, but only the first year has legislative force. A pre-commitment to
spending control is implicit in the projected spending programme. The latest budgetary
projections for 2016, for example, show a continuing fall in public expenditure as a share of
GDP in order to meet the structural budget balance targeted for 2017.
Budget projections of spending on unchanged policies, however, show that
expenditure will exceed the programme targets without further legislation. To ensure that
the targeted budget balance is met, the government has legislated an increase in VAT that
will occur automatically in 2016 unless other measures are taken. In the future, an
alternative approach could be to legislate spending targets, by main programme or by
ministry, for more than one year.
Spending control has begun to focus on efficiency
Gains in efficiency could offset at least some of the impact of cuts in public spending.
The 2009 OECD Economic Survey of Italy highlighted evidence of spending inefficiency in
education, suggesting that “accountability” measures, such as better collection and use of
performance information for schools and teachers, and more emphasis on teacher training
and less on absolute numbers of teachers, were among the measures that could lead to
improvements (Boarini, 2009). Governments have moved somewhat in this direction
although resistance to use of improved student performance information has been strong.
Some spending cuts in education had indeed been planned before the impact of the
financial crisis became clear, as part of a policy to improve efficiency.
Table 2.2. Components of public spendingGeneral government, per cent of GDP, 2011
Italy OECD average
Total spending 49.1 44.0
Current goods and services 19.6 20.0
Transfers
Pensions 14.9 8.7 (2009)
Companies 1.4
Investment 2.8 3.4
Other 5.9
Debt interest 4.7 2.6
By programme1
Education 3.6 5.1
Health 6.8 5.8 (2012)
Defence 1.3 1.3
Environment protection 0.9 0.7
1. Expenditure by programme is final consumption expenditure only; it excludes transfers and investment.Source: Istat, General Government Account, October 2014; SEC2010; OECD Economic Outlook 96 (database); COFOGDatabase.
OECD ECONOMIC SURVEYS: ITALY © OECD 2015102
2. MAINTAINING FISCAL SUSTAINABILITY: STRUCTURAL FISCAL ISSUES
Despite the cuts in nominal expenditure on education, and limited progress on
improving accountability, average student performance at age 15 as measured by PISA data
has been improving. Between 2003 and 2011 average performance in mathematics
increased in Italy by more than in most OECD countries, though it is still below average.
Student performance would not be affected very quickly by policy changes, so these
improvements may be related to trends apparent before the spending reduction; for
example there was a substantial increase in teacher’s salaries between 2000 and 2010.
Nevertheless, the improvement in PISA results at a time of spending cuts at least suggests
that efficiency improvements were indeed possible.
Few other spending programmes were subjected to such significant cuts as education.
Cuts in expenditure on buildings and equipment could have an impact over a long period,
so the government has rightly decided to try to protect education spending from any
further budgetary consolidation measures. It should push forward with the programme to
develop accountability, however, especially with strenuous efforts to develop systematic
information on student performance that can be of practical help to teachers in improving
results, to demonstrate that accountability measures are ways to improve overall
performance, not to penalise individual teachers or schools.
Spending reviews
Previous OECD Economic Surveys have drawn attention to the need to develop spending
review processes within the public administration and pointed out that a good start had
already been made in 2007-8 with the work of the Technical Committee for Public Finance
which was part of a spending review process launched in 2007, but not fully followed through
(OECD, 2009, 2011, 2013c). Many of the accountability measures mentioned for education,
and the identification of areas where education spending could be reduced with least
damage, were suggested in the work of that Technical Committee. Its suggestions in other
areas have been taken up much more slowly or not at all. Its preliminary report in 2008
suggested a number of reforms in the judicial sector, for example (MEF, 2008). These began to
be taken up in 2012, and are now being further developed under the current government.
In 2012 and again in 2013-14, successive governments called in outside experts
to conduct ad hoc spending reviews to identify where spending cuts could be achieved
with least impact. The 2012 spending review looked at public investment in general.
Between 2008 and 2014 general government capital spending has fallen by about 20% in
nominal terms, similar to the fall in private investment, and more than current spending.
One of the government’s priorities is to boost capital spending especially on important
infrastructure projects such as broadband network access and key transport links. But
public investment spending appears to be relatively inefficient in Italy. Studies highlight
higher unit costs and slower delivery on road and rail projects, adjusting for objective
differences, than in other European countries (Bank of Italy, 2012). This report locates the
problem in certain key areas: overlapping responsibilities between levels of government,
insufficient attention to cost-effectiveness both in selection of projects and in
implementation, and lack of technical capacity in evaluation and implementation. A boost
to investment is one of the means planned to strengthen Europe’s economy, but unless
cost-effectiveness is improved in Italy, at best it will be less useful than in other countries
and at worst it could waste large amounts of resources.
OECD ECONOMIC SURVEYS: ITALY © OECD 2015 103
2. MAINTAINING FISCAL SUSTAINABILITY: STRUCTURAL FISCAL ISSUES
The spending review launched in 2013 took a further step forward, directing its efforts
towards identifying specific candidates for spending reductions. A summary presentation
of the review’s preliminary results was leaked and is widely available on the web
(Commissario Straordinario, 2014), but no full report has been published so it is difficult to
know whether it has useful lessons beyond some of the practical examples it highlighted.
A key approach was to use whatever data was available to benchmark types of spending
either within the country or comparing Italy with other countries. For example, there is an
allowance payable to disabled people for them to get help in the home. The number of such
allowances paid per head of population is nearly twice as high in some regions as in others.
The review concludes that part of this difference is due to over-generous allocations in
some regions, so that savings can be achieved through reinforced controls. Another
example is that transfers to support rail transport are 30% higher per kilometre of network
in Italy than in Germany, France or the UK (though much lower than in Belgium and the
Netherlands). The spending review recommends reducing transfers towards to the
European average, on the grounds that the excess represents potential efficiency savings.
Identifying likely efficiency savings in this way is one thing, and studies like those
carried out in the spending reviews are valuable and should be continued and refined. But
obtaining value for money needs to be an integrated part of policymaking and
administration, not something that requires recourse to ad hoc commissions.
Obtaining value for money
While strategic policy choices can have important budgetary implications, so can less
high profile matters such as public procurement. The 2013 spending review attributed cost
inflation in the provision of public services to a number of problems, particularly pervasive
gaps in management capacity, wages policy and public procurement systems (Council of
Ministers, 2013, p. 14). There are many signs of inadequacies in cost control at this level
and it has proven difficult for previous governments to deal with them. As long ago as 1993,
budget legislation included provisions intended to reduce variation in public procurement
costs across the country and Consip (originally “Concessionaria Servizi Informativi Pubblici”,
established to manage IT development in the then Treasury Ministry) was eventually given
a role in providing procurement services for central government ministries so as to ensure
all ministries get the best value for money.
Consip reports that in areas where it has taken over responsibility for procurement,
ministries can make savings of 22% on average. Despite these apparent benefits, Consip is
still used directly for only 3% of total public administration expenditure. Consip estimates
that its reference prices or framework contracts are used for something like 5% of total
expenditure. This seems a small proportion, partly because most of government spending
is either transfers or wages and salaries. When these are excluded, Consip covers
something like 20% of relevant expenditure. It is not clear, however, that effective follow-up
procedures exist to ensure that actual contracts or purchases make the implied savings.
Much public procurement occurs at sub-national level, for which Consip is not
currently responsible. The 2013-14 spending review proposed that the number of
purchasing centres nationwide be reduced from an estimated 32 000 to less than 40 – as far
as expenditure above a certain threshold would be concerned. These would cover the
regions and major cities as well as Consip for the central administration. In April 2014,
OECD ECONOMIC SURVEYS: ITALY © OECD 2015104
2. MAINTAINING FISCAL SUSTAINABILITY: STRUCTURAL FISCAL ISSUES
several provisions were introduced to increase the role of purchasing centres for new
procurement, to aggregate demand and obtain better prices and increased control over the
public procurement system.
In parallel with Consip, which provides procurement services, ANAC, the national
anti-corruption agency, has a section responsible for monitoring value for money in public
procurement. Prior to a re-organisation in mid-2014 this was a separate agency, AVCP. Not
all major public investment projects were automatically subject to monitoring by AVCP.
The emergence of major cost over-runs and suspected corruption at a high level in two key
construction projects, the 2015 International Exhibition in Milan, and the construction of
the “Mose” the anti-flood gates to protect the Venice lagoon, prompted the government to
incorporate it into the anti-corruption agency.
ANAC itself was previously part of the agency responsible for measuring and
evaluating performance in the public administration, CiVIT, but was separated from it
in 2014. This separation was recommended in the 2013 OECD Economic Surveys on the
grounds that anti-corruption and performance management were very different things, so
that combining them could potentially lead to conflicts of interest without any potential
gains in efficiency or economies of scope. From that point of view, incorporating the former
AVCP into the anti-corruption agency might not have the anticipated results. On the other
hand, since it is fairly clear that the construction industry in general, especially public
works, is one of the major activities penetrated by organised crime as well as being
vulnerable to “normal” corruption, it could be a rational step. The anti-corruption agency’s
mandate was initially mainly concerned with developing and promoting procedures in the
public administration to avoid and detect corruption, rather than taking legal or other
action against actual cases of corruption. It has now been given somewhat stronger
powers; these include the power to recommend that prefects force the replacement of
executive officers involved in corruption practices in companies, as well as special
investigating powers over the biggest public contracts, such as the Milan Expo 2015. It
might nevertheless have made more sense to look further into why those particular
contracts had escaped AVCP monitoring, and into what other measures that should
normally avoid cost-overruns or prevent corruption did not work, before modifying ANAC’s
mandate yet again.
Improved public administration is essential
As mentioned, measures to improve cost-efficiency in public spending have been
sought for at least 20 years. Plans to improve efficiency in the public administration also
date back at least to the late 1990s. In two key areas – performance management and
transparency – there has been progress but also evidence that the process is slow.
Performance management
The development of performance management techniques has been one constant
objective of reforms, especially since the “Brunetta reform” of 2008. But for the moment
performance evaluations are applied essentially only for managerial staff, while almost all
managers are evaluated as meeting at least 90% of the maximum scores (ANAC, 2014).
Earlier reforms changed the employment status of public servants, removing the
theoretical right to a job for life, but in practice barriers to mobility within the public
administration have remained an obstacle, whether for providing incentives or for
managing reorganisations. For example, only in 2014, as part of an emergency decree on
OECD ECONOMIC SURVEYS: ITALY © OECD 2015 105
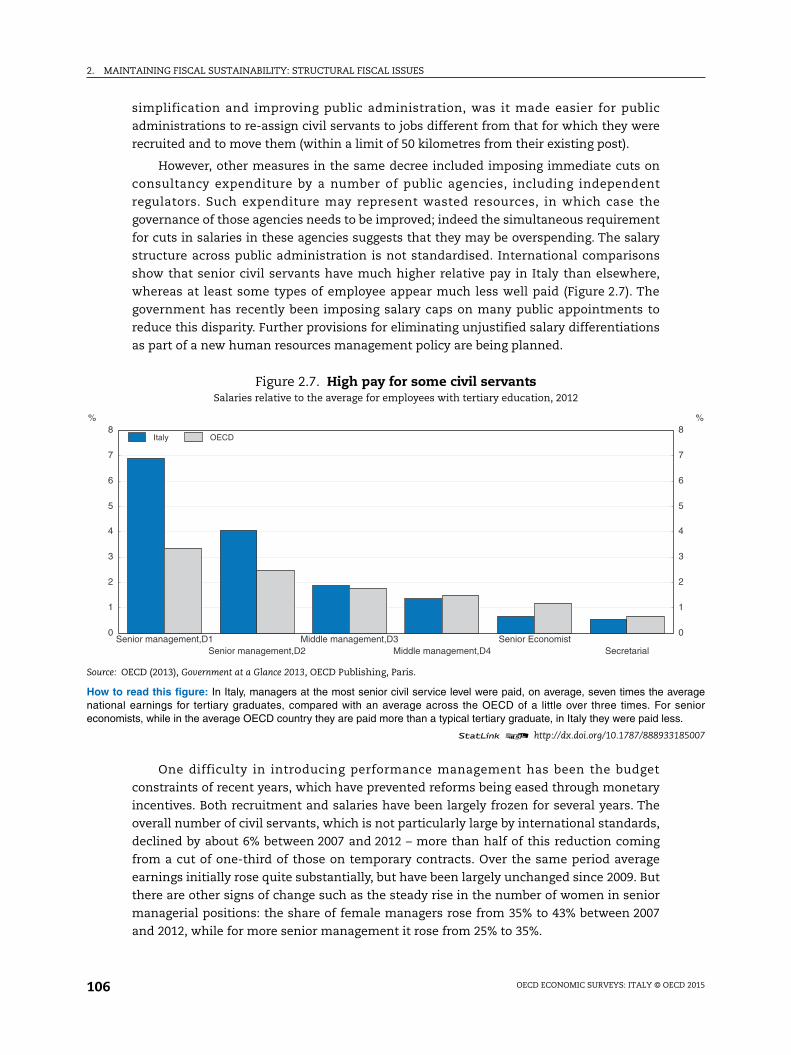
2. MAINTAINING FISCAL SUSTAINABILITY: STRUCTURAL FISCAL ISSUES
verageseniors.
185007
0
1
2
3
4
5
6
7
8%
simplification and improving public administration, was it made easier for public
administrations to re-assign civil servants to jobs different from that for which they were
recruited and to move them (within a limit of 50 kilometres from their existing post).
However, other measures in the same decree included imposing immediate cuts on
consultancy expenditure by a number of public agencies, including independent
regulators. Such expenditure may represent wasted resources, in which case the
governance of those agencies needs to be improved; indeed the simultaneous requirement
for cuts in salaries in these agencies suggests that they may be overspending. The salary
structure across public administration is not standardised. International comparisons
show that senior civil servants have much higher relative pay in Italy than elsewhere,
whereas at least some types of employee appear much less well paid (Figure 2.7). The
government has recently been imposing salary caps on many public appointments to
reduce this disparity. Further provisions for eliminating unjustified salary differentiations
as part of a new human resources management policy are being planned.
One difficulty in introducing performance management has been the budget
constraints of recent years, which have prevented reforms being eased through monetary
incentives. Both recruitment and salaries have been largely frozen for several years. The
overall number of civil servants, which is not particularly large by international standards,
declined by about 6% between 2007 and 2012 – more than half of this reduction coming
from a cut of one-third of those on temporary contracts. Over the same period average
earnings initially rose quite substantially, but have been largely unchanged since 2009. But
there are other signs of change such as the steady rise in the number of women in senior
managerial positions: the share of female managers rose from 35% to 43% between 2007
and 2012, while for more senior management it rose from 25% to 35%.
Figure 2.7. High pay for some civil servantsSalaries relative to the average for employees with tertiary education, 2012
Source: OECD (2013), Government at a Glance 2013, OECD Publishing, Paris.
How to read this figure: In Italy, managers at the most senior civil service level were paid, on average, seven times the anational earnings for tertiary graduates, compared with an average across the OECD of a little over three times. Foreconomists, while in the average OECD country they are paid more than a typical tertiary graduate, in Italy they were paid les
1 2 http://dx.doi.org/10.1787/888933
Senior management,D1 Middle management,D3 Senior EconomistSenior management,D2 Middle management,D4 Secretarial
0
1
2
3
4
5
6
7
8%
Italy OECD
OECD ECONOMIC SURVEYS: ITALY © OECD 2015106
2. MAINTAINING FISCAL SUSTAINABILITY: STRUCTURAL FISCAL ISSUES
In the future, the increasing numbers of staff retiring and the impact of the last few
years of frozen recruitment, will allow recruitment to accelerate somewhat. The government
have spoken of the opportunity for generational change that this represents. Generational
change does not guarantee behavioural change if incentives are not improved, although it is
important to allow the recruitment of employees with the skills required for modernising
and digitalising public administration. An important focus, also common to most of the
programmes to improve public administration over the years is transparency.
Transparency
According to Allio and Rangone (2015), the tradition of public administration in Italy was
more oriented towards secrecy than transparency until the late twentieth century; secrecy
was the norm and access to information the exception (De Pretis, 2010, cited in Allio and
Rangone, 2015). Factors such as complex procedures and requirements for repeated
presentation of documents both create and encourage lack of transparency. This results not
only in slow administrative processes but also in fertile ground for corruption. Measures to
improve transparency began in the 1990s and have continued to be developed. Often they
have been working in parallel with measures to simplify all aspects of public administration.
The 2013 OECD Economic Surveys suggested that transparency could be promoted by a
general freedom of information act, which a number of other countries, starting with the
United States, have already implemented. Italy is moving in this direction in intent, as its
transparency provisions have moved in the direction of a total disclosure principle (see
Allio and Rangone, 2015, for a detailed discussion of the evolution of transparency
provisions, and the link with improving public administration and reducing corruption).
Although there is a commitment to total disclosure it is often taken to mean full disclosure
of information that is specified in explicit instructions, with no implication for information
that is not covered. A freedom of information approach would require that all information
should in principle be publicly available, with nevertheless provision for withholding
information on grounds such as national security or privacy considerations, as well as on
grounds of disproportionate cost.
A significant example of transparency is provided in the case of environmental
information. Transposing EU Directive EC/90/313 introduced the obligation to provide
environmental information to anyone submitting a request, regardless of their legitimate
interest (Allio and Rangone, 2015). That this is possible in the environmental domain
should show that such freedom of information provision is compatible with the Italian
legal tradition.
Allio and Rangone (2015) also provide evidence that the development of anti-corruption
and transparency measures is subject to problems of poor planning and implementation. In
particular, transparency measures that are designed in part to improve public administration’s
compliance with policy intentions can themselves lead to automatic non-compliance.
Examples are the introduction of requirements for publication of salary and curriculum vitae
information for senior management (part of the Brunetta reforms) and the requirement of
the 2013 anti-corruption law that all public administrations publish their plans for preventing
and dealing with corruption. In both cases, the law laid down that administration should
publish the information much more quickly than was possible. As a result, by early 2014 only
a minority of public administrations had published an anti-corruption plan, much less had it
approved by ANAC. Such delays are probably unavoidable, in which case they should be taken
OECD ECONOMIC SURVEYS: ITALY © OECD 2015 107
2. MAINTAINING FISCAL SUSTAINABILITY: STRUCTURAL FISCAL ISSUES
into account in the originating legislation. If compliance is objectively difficult even when
administrations are well-intentioned, non-compliance risks seeming “normal” and becoming
a cover for deliberate non-compliance.
Allio and Rangone (2015) suggest a parallel between examples like those – of
quasi-automatic non-compliance – and the tendency for Italian legislation to assume that
regulation in itself solves problems. Despite significant efforts to simplify regulation, and the
creation some years ago of a “simplification unit” within the prime minister’s office, it seems
that there is still a tendency to introduce regulations without regard for their full impact. For
each rule abrogated, 1.2 new rules are drafted (Parliamentary Commission, 2014).
Nevertheless, transparency has improved. For example, information on earnings and
the curriculum vitae of public officials is now published online, helping to check whether
the right people are in the right jobs and whether they might have conflicts of interest.
Another example is the enabling law on tax reform, which provides for the tax collection
agency to change its approach towards actively helping taxpayers to comply rather than
concentrating on penalising evasion. A first step will be the that the tax administration will
issue taxpayers with income tax declarations already filled with information already
known to the authorities, leaving the taxpayer with a much simplified task. Developing this
kind of public-service approach in the public administration generally should help to
improve efficiency, whether it concerns improving tax compliance at least cost or
improving value for money in expenditure.
Simplification can improve transparency as well as reducing costs. Progress in
simplification has proceeded well in many areas; some are invisible to objective indicators
but some are reflected in OECD indicators of product market regulation. Just one example
is where reductions in the number of steps required to set up new firms has contributed to
improvement in Italy’s score on barriers to entry since 1998. Past complexity and the
continuing need for administrative reform is nevertheless revealed in recent measures:
the 2015-17 Agenda for Simplification included a specific measure to prevent the public
administration from requiring individuals to provide information that is already present in
the national population register. Yet the Brunetta reforms (from 2009) already included a
provision that offices of the public administration could no longer require a citizen to
provide a document which itself is produced by the public administration (whether the
same or another office). As the 2013 OECD Economic Survey of Italy noted, there were many
delays in this provision becoming effective (O’Brien, 2013). The need for the additional
measure in the 2015-17 Agenda shows that even if the letter of the 2009 reform may by now
fully operational, its principle – that the public administration should not require
duplication of information provision from citizens – had not been absorbed.
The Internal Stability Pact
Italy has a considerable high degree of decentralisation of government and public
spending responsibility for a non-federal state, though somewhat below the OECD average
in 2011 (Figure 2.8). This average would be somewhat lower if restricted to non-federal
countries. By 2013 the share had fallen to about one quarter of total public spending, as
some public spending restrictions have fallen particularly on sub-national spending
(Table 2.3). The sub-national share of spending excluding pensions and debt interest is
about 50%.
OECD ECONOMIC SURVEYS: ITALY © OECD 2015108
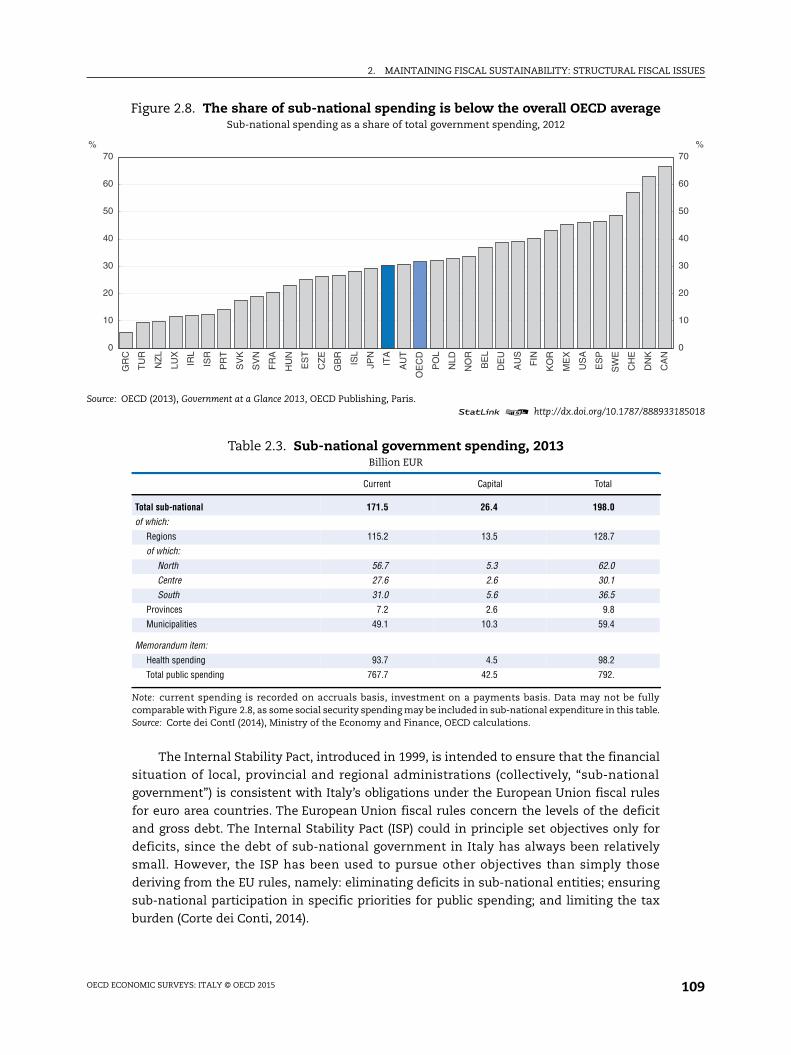
2. MAINTAINING FISCAL SUSTAINABILITY: STRUCTURAL FISCAL ISSUES
185018
0
10
20
30
40
50
60
70%
The Internal Stability Pact, introduced in 1999, is intended to ensure that the financial
situation of local, provincial and regional administrations (collectively, “sub-national
government”) is consistent with Italy’s obligations under the European Union fiscal rules
for euro area countries. The European Union fiscal rules concern the levels of the deficit
and gross debt. The Internal Stability Pact (ISP) could in principle set objectives only for
deficits, since the debt of sub-national government in Italy has always been relatively
small. However, the ISP has been used to pursue other objectives than simply those
deriving from the EU rules, namely: eliminating deficits in sub-national entities; ensuring
sub-national participation in specific priorities for public spending; and limiting the tax
burden (Corte dei Conti, 2014).
Figure 2.8. The share of sub-national spending is below the overall OECD averageSub-national spending as a share of total government spending, 2012
Source: OECD (2013), Government at a Glance 2013, OECD Publishing, Paris.1 2 http://dx.doi.org/10.1787/888933
0
10
20
30
40
50
60
70%
GR
C
TU
R
NZ
L
LUX
IRL
ISR
PR
T
SV
K
SV
N
FR
A
HU
N
ES
T
CZ
E
GB
R
ISL
JPN
ITA
AU
T
OE
CD
PO
L
NLD
NO
R
BE
L
DE
U
AU
S
FIN
KO
R
ME
X
US
A
ES
P
SW
E
CH
E
DN
K
CA
N
Table 2.3. Sub-national government spending, 2013Billion EUR
Current Capital Total
Total sub-national 171.5 26.4 198.0
of which:
Regions 115.2 13.5 128.7
of which:
North 56.7 5.3 62.0
Centre 27.6 2.6 30.1
South 31.0 5.6 36.5
Provinces 7.2 2.6 9.8
Municipalities 49.1 10.3 59.4
Memorandum item:
Health spending 93.7 4.5 98.2
Total public spending 767.7 42.5 792.
Note: current spending is recorded on accruals basis, investment on a payments basis. Data may not be fullycomparable with Figure 2.8, as some social security spending may be included in sub-national expenditure in this table.Source: Corte dei ContI (2014), Ministry of the Economy and Finance, OECD calculations.
OECD ECONOMIC SURVEYS: ITALY © OECD 2015 109
2. MAINTAINING FISCAL SUSTAINABILITY: STRUCTURAL FISCAL ISSUES
In 2001, the Italian government made significant changes to the constitution,
increasing the policy prerogatives of sub-national government and providing for a system
of fiscal federalism under which the tax and spending powers of sub-national governments
would be reinforced, and the rules determining fiscal transfers from the central state to
sub-national government revised to ensure more financial autonomy. An outline for the
rules of fiscal federalism was approved by parliament in 2009, but much of the detail
related to standard costs has yet to be agreed and the only part operating in practice is the
system for calculating central finance for health expenditure. Health expenditure indeed
accounts for around half of sub-national government spending. For regional
administrations it accounts for about 85% of spending.
The Internal Stability Pact, non-health spending
For provinces and municipalities with over one thousand inhabitants the ISP sets target
budget surpluses, as a certain percentage of expenditure. For regions, however, in addition to
restrictions on borrowing (sub-national governments must run balanced budgets, excluding
capital expenditure), the ISP imposed limits on total non-health spending. The national
government rightly prefers to pursue fiscal consolidation through controlling spending
rather than increasing tax, since overall taxation is already high. A significant part of central
government spending is accounted for by transfers to the regions, corresponding to about
half of total regional expenditure including health. Central government therefore includes
cuts in these transfers as part of budget consolidation measures and imposes spending
limits on regions in order to prevent them from responding by raising taxation.
The logic for imposing spending restrictions on the regions is therefore clear. But it
reveals a weakness in the current arrangements, which clearer definitions of national-
sub-national responsibilities and consistent rules for fiscal federalism should be able to
deal with. The planned constitutional reform will allow regions which run balanced
budgets to obtain further autonomy from central government.
The spending limits are negotiated annually between the central government and the
regions, and have been complicated by accounting definitions, and ad hoc exceptions.
They have continued to be largely based on historical patterns of expenditure, in the
absence of standard cost pricing for transfers that is beginning to be used for health
spending. Thus, regions that have traditionally spent more than others continue to do so,
while regions wishing to spend more have been prevented from doing so even if they
currently spend less than the average.
The Health Pact
The Internal Stability Pact strictly speaking covers only non-healthcare spending,
while health spending, financed centrally but administered by the regions, is subject to a
separate Healthcare Pact, introduced in 2006. The health pact, which was preceded by
attempts to limit spending such as a ceiling on pharmaceutical spending, is based on
controlling deficits. Some regions are operating under “re-entry plans” (piani de rientro) to
correct previous excessive deficits. In some cases the health authorities are under
compulsory administration (so-called “Commissariamento”) where external commissioners
are brought in, replacing the normal administration, to ensure compliance with national
policy. Between 2008 and 2010 six regions (Abruzzo, Calabria, Campania, Lazio, Molise
and Sicily) were brought under this process, as they had failed to comply with their
OECD ECONOMIC SURVEYS: ITALY © OECD 2015110
2. MAINTAINING FISCAL SUSTAINABILITY: STRUCTURAL FISCAL ISSUES
“adjustment plan” targets to eliminate deficits, which were set in 2007. These problems
have still not been resolved, as technical working groups seek to find a way for these
regions to eliminate their deficits during 2014-16.
Health is also the one area where fairly straightforward fiscal federalism rules for
expenditure are now in operation. This is the so-called “standard cost model”, where
central government transfers funds for health policy on the basis of a calculation of
spending needs which assumes a uniform cost for specific kinds of spending. This covers
mainly the health care interventions that are mandated by national laws. This results
on central transfers being allocated essentially on the basis of demographic indicators.
Per capita transfers (adjusted for demographic structure) are calculated on the basis of the
previous period’s expenditure in three of the five regions who perform best on costs.
Implementing this approach in health is an important achievement. In the past, serious
overspending on health, frequently accounted for by individual hospitals rather than being
generalised in any particular regions was a recurrent problem, plagued by self-fulfilling
expectations of central government bailouts.
The use of standard costs leaves regions free to spend more than standard costs, but
also to retain the savings if they are able to do better. To be durable, the system for
determining standard costs must encourage cost reduction without being too draconian.
While incentives to improve efficiency are present, it is clear that such corrections are
not achieved without cost. According to a survey about half the population in the regions
in “commissariamento” perceives the quality of the health service to be declining,
compared with about 30% in other regions (RbmSalute-Censis, 2014). According to the
same survey, health provision, such as measured by waiting times, varied widely across the
country, although not according to a simple north-side divide.
Problems of accounting and spending definitions
Accounting differences have been mainly related to those between accruals-based and
cash-based accounting and the fact that sub-national accounting conventions were
incompatible with national and European standards until 2012. It is still the case that
many sub-national governments have to calculate two different balances, one for ISP
purposes and one normal one. It is intended to move to a cash-based approach as from
1 January 2015 but this target may be hard to meet. In any case there are good reasons why
accruals-based accounts are needed, not least for predicting debt, so moving to cash
balances may leave some problems unresolved.
More persistent problems arise from using historical spending as a starting point for
deciding on the level of central transfers, rather than an assessment of need, and from the
ad hoc changes that happen each year reflecting varying central government priorities.
Use of EU structural funds, which are spent mostly by the regions, has also caused
some regions difficulties. EU finance is disbursed only once proof of the use of matching
funds has been provided. This has often meant that regions are unable to use EU finance
because the domestic share of expenditure required causes them to exceed the spending
limits imposed under the ISP, even though the expenditure directly covered by EU funds
does not count as net spending by the region itself for the purposes of the Pact. It is not
clear whether this is an inherent problem or one that can be managed with good
administration, since some regions, such as Puglia, managed to largely eliminate this as a
constraint on its use of EU funds, through improvements in capacity. In any case, allowing
OECD ECONOMIC SURVEYS: ITALY © OECD 2015 111
2. MAINTAINING FISCAL SUSTAINABILITY: STRUCTURAL FISCAL ISSUES
regions to run up debt providing it was covered by existing agreements on structural funds
would be an alternative solution providing somewhat more flexibility. The 2015 Stability
Law envisages that co-funding of regions will not be considered by the ISP in 2015, thus
providing some mitigation of the problem.
Constitutional changes and fiscal federalism: Inconsistencies and delays
Prior to 2001 problems of co-ordination of national and sub-national budgets were
much less important. Constitutional changes in 2001 delegated much wider areas of
budget and policy responsibility to the regions and provinces, but left two problems. One
was that of legislative overlap where several levels of government could claim competence,
such as tourism (where regions, provinces and municipalities have overlapping
responsibilities, in addition to central government), or inappropriate delegation of some
policies such as that which required every region to have its own energy plan rather than a
coherent national approach.
Many of these problems should be resolved by constitutional changes now going
through parliament. The government plans to put these changes to a referendum at the
end of 2015. These changes will abolish the provinces. Their administrative functions will
be absorbed into the regional or municipality levels. These changes are already under way
as measures taken in 2014 removed finance for elected officials and initiated the process
for transfer of functions. The constitutional changes will also recentralise some functions.
Central government will be responsible only for a specific list of policy areas, planned to be
wider than under current arrangements, leaving the regions as the default level for other
matters. But the national government will have a reserve power to legislate on matters that
may not be on that list, if it deems that important national interest are at stake.
The other problem generated by the 2001 constitutional changes was that fiscal
arrangements were never aligned with the changed constitutional powers of sub-national
government. The constitutional law of 2001 mandated the government to implement an
appropriate system of fiscal federalism, which might logically have delegated wide
taxation powers to sub-national government, given the range of their spending
responsibilities, and could perhaps have avoided some of the problems with the Internal
Stability Pact discussed earlier. But it was not until 2009 that a clear plan for a system of
fiscal federalism was legislated.
The fiscal federalism legislation passed in 2009 was in the form of enabling legislation,
requiring the government to develop rules to implement the guidelines in subsequent
decrees. The 2009 legislation side-stepped many difficult issues of implementation, but did
set out a rational structure for sub-national finances. On the revenue side, it specified that
certain taxes would be for use only by sub-national government, the local property tax and
a locally determined surcharge on personal income tax; there would be a system whereby
poorer regions were partially compensated for their low revenue-generating capacity by a
system of redistribution based on simple rules. The frequent changes in the structure of
local property taxation described earlier would have made this system very vulnerable had
it actually been in place. On the expenditure side, finance for expenditure that is mandated
by national legislation would be provided by transfers from central government, with the
level of such transfers set by reference to “standard costs” for meeting those expenditure
commitments.
OECD ECONOMIC SURVEYS: ITALY © OECD 2015112
2. MAINTAINING FISCAL SUSTAINABILITY: STRUCTURAL FISCAL ISSUES
Little of this structure is yet in place, especially as concerns taxation and the
equalisation system, so sub-national finances are still dominated by transfers from central
government. This is partly because there have been several changes of government
since 2009 and perhaps also because of the strong and persistent regional divide. This
divide could make it difficult to agree on the details of revenue-sharing and items such as
infrastructure spending, where southern regions are in need of investment but also suffer
from high costs and risk of corruption.
Although little is in place there has nevertheless been progress. Allocation of central
funds for health is now based on the standard cost approach: transfers are calculated on
the basis of calculations of need taking into account demographic and other characteristics
of the population, taking standard cost as the average of the three best-performing based
regions. Some progress has also been made in calculating standard costs for other types of
expenditure, but so far only for illustrative purposes.
Simplifying the Internal Stability Pact
The ISP has become more complex than is necessary to bring sub-national finances in
line with EU fiscal constraints. This has partly seemed necessary because there has not been
a good alignment between responsibility for tax and spending at different levels and the
constitutional division of policy responsibilities. Once the new constitutional arrangements
are in place and the balanced budget rule for sub-national government implemented
(foreseen for 2016), it should be possible to rapidly implement fiscal federalism in accordance
with the 2009 enabling law, adjusted to be in line with the new structure of sub-national
government. Sub-national government’s powers of taxation would be appropriately defined
and in line with their autonomous spending responsibilities (i.e. excluding national policies
which are delegated, for which central government finance is provided). This should allow
the ISP to be considerably simplified, concerning itself only with setting deficits and not with
the composition or level of spending. Appropriate accounting rules should be able to deal
with the difficulties that have sometimes occurred fitting the expenditure of matching EU
funds within the constraints. Once this is done, there should be no need for central
government to interfere in any detail.
A further step could be to define the ISP in terms of strict limits on debt rather than the
balance. This would provide some year-to-year flexibility (which could be withdrawn in the
case of persistent violations).
OECD ECONOMIC SURVEYS: ITALY © OECD 2015 113
2. MAINTAINING FISCAL SUSTAINABILITY: STRUCTURAL FISCAL ISSUES
References
Allio, L. and N. Rangone (2015), “Anti-corruption and transparency initiatives for a more accountable andefficient public administration in Italy”, OECD Economics Department Working Papers, forthcoming.
ANAC (2014), “Relazione annuale sull’attività svolta; Anno 2013”.
Ardizzi, G., C. Petraglia, M. Piacenza and G. Turati (2012), “Measuring the underground economy withthe currency demand approach: A reinterpretation of the methodology, with an application toItaly”, Working Papers, No. 864, Bank of Italy.
Bank of Italy (2012), “L’efficienza della spesa per infrastrutture”, papers presented at a workshop heldon 28 April 2011.
Bank of Italy (2014), “Economie regionali: L’economia delle regioni italiane nel 2013”.
Boarini, R. (2009), “Towards better schools and more equal opportunities for learning in Italy”, OECDEconomics Department Working Papers, No. 727, OECD Publishing, Paris.
Commissario Straordinario (2014), “Proposte per una revisione della spesa pubblica (2014-16)”, IlCommissario Straordinario per la revisione della spesa, unpublished.
Commissione tecnica paritetica per l’attuazione del federalism fiscale (Copaff), presentation to IMFDelegation, Ministry of Economics and Finance, July 2013, www.mef.gov.it/ministero/commissioni/copaff/documenti/Incontro_COPAFF-FMI_del_3.7.2013.pdf.
Corte dei Conti (2014), “Il patto di stabilita’ interno degli enti territoriali: Esercizio 2013”, report dated17 June 2014.
Council of Ministers (2013), “Analisi di alcuni settori di spesa pubblica”, Presidenza del Consiglio deiMinistri, Ministro per i rapporti con il Parlamento delegato per il programma di Governo, March.
Recommendations for structural fiscal policy
● Continue efforts to reduce tax evasion, through simplifying the tax code and collectionprocedures as well as through more effective enforcement.
● Simplify tax collection procedures so as to reduce the cost of compliance to companies.
● Avoid the use of tax amnesties.
● Broaden the tax base and simplify the tax system, in particular by cutting the number oftax expenditures.
● Eliminate ad valorem stamp duties in excess of the reasonable charges for administrativecosts.
● Extend the use of multi-year budgeting to include legislating spending limits forministries or major programmes over more than one year.
● Get better value for money in public spending through better use of centralisedprocurement, cost information systems and benchmarking, at all levels of government.
● Continue public administration reforms, including performance management,transparency and anti-corruption policy, to support moves to increase attention tocost-efficiency.
● Implement fiscal federalism arrangements in line with the 2009 enabling law. Thisimplies clear allocation of spending and taxation responsibilities, in line with the newconstitutional arrangements, a transparent revenue-compensation system, and centralgovernment transfers to sub-national government based fully on standard costs.
● With sub-national balanced budget rules and full fiscal federalism in place, replace thespending limits and ad hoc measures of the Internal Stability pact with simple rulesbased on keeping debt of sub-national administrations under control, as foreseen inthe 2012 constitutional reform.
OECD ECONOMIC SURVEYS: ITALY © OECD 2015114
2. MAINTAINING FISCAL SUSTAINABILITY: STRUCTURAL FISCAL ISSUES
De Pretis, D. (2010), “Italian Administrative Law Under the Influence of European Law”, in Italian Journalof Public Law, Vol. I/1.
Istat (2010), “La misura dell’economia sommersa secondo le statistiche ufficiali: Anni 2000-2008”.
Istat (2014), “L’economia illegale nei conti nazionali”, presentation to the Parliamentary Commissionon the mafia and other criminal associations by the president of Istat, 8 October.
Johansson, Å., C. Heady, J. Arnold, B. Brys and L. Vartia (2008), “Tax and economic growth”, OECDEconomics Department Working Papers, No. 620, OECD Publishing, Paris.
MEF (2008), “La revisione della spesa pubblica: Rapporto 2008”, Ministry of Economy and Finance,Commisione tecnica per le finanze pubbliche.
MEF (2011), “Relazione finale del gruppo di lavoro sull’erosione fiscal”, Ministry of Economy and Finance,22 November.
MEF (2014a), Programma di Stabiltà, Ministry of Economy and Finance, April.
MEF (2014b), “Rapporto sulla realizzazione delle strategie di contrasto all’evasione fiscale…”, Ministryof Economy and Finance, July.
OECD (2005), OECD Economic Surveys: Italy 2005, chapter on migration, OECD Publishing, Paris.
OECD (2009), OECD Economic Surveys: Italy 2009, OECD Publishing, Paris.
OECD (2011), OECD Economic Surveys: Italy 2011, OECD Publishing, Paris.
OECD (2010a), Offshore Voluntary Disclosure: Comparative Analysis, Guidance and Policy Advice, Centre forTax Policy and Administration.
OECD (2010b), Tax Expenditures in OECD Countries, OECD Publishing, Paris.
OECD (2012), “Reducing opportunities for tax non-compliance in the underground economy”,www.oecd.org/ctp/administration/reducingopportunitiesfortaxnon-complianceintheundergroundeconomy.htm.
OECD (2013a), Environmental Performance Review: Italy 2013, OECD Publishing, Paris.
OECD (2013b), Tax Administration 2013: Comparative information on OECD and Other Advanced and EmergingEconomies, OECD Publishing, Paris.
OECD (2013c), OECD Economic Surveys: Italy 2013, OECD Publishing, Paris.
Parliamentary Commission for Simplification (2014), “Indagine conoscitiva sulla semplificazionelegislative e amministrativa: esame del documento conclusivo”, 31 March.
Rbm Salute-Censis (2014) “Costruire la sanità integrative”, in collaborazione with Previmedical, reportpresented to the “Welfare Day” conference, Rome, 17 June 2014. [Full text of report not obtained.]
Tyson, J. (2014), “Reforming Tax Expenditures in Italy: What, Why, and How?”, IMF Working Paper,No. WP/14/7.
Viesti, G., G. Pellegrini and G. Iuzzolino (2012), “Convergence among Italian regions, 1861-2011”,Quaderni di Storia Economica, No. 22, Bank of Italy.
OECD ECONOMIC SURVEYS: ITALY © OECD 2015 115
l and
and
, the
tting
good
ublic,
orea,
enia,
ission
and
and
ORGANISATION FOR ECONOMIC CO-OPERATIONAND DEVELOPMENT
The OECD is a unique forum where governments work together to address the economic, socia
environmental challenges of globalisation. The OECD is also at the forefront of efforts to understand
to help governments respond to new developments and concerns, such as corporate governance
information economy and the challenges of an ageing population. The Organisation provides a se
where governments can compare policy experiences, seek answers to common problems, identify
practice and work to co-ordinate domestic and international policies.
The OECD member countries are: Australia, Austria, Belgium, Canada, Chile, the Czech Rep
Denmark, Estonia, Finland, France, Germany, Greece, Hungary, Iceland, Ireland, Israel, Italy, Japan, K
Luxembourg, Mexico, the Netherlands, New Zealand, Norway, Poland, Portugal, the Slovak Republic, Slov
Spain, Sweden, Switzerland, Turkey, the United Kingdom and the United States. The European Comm
takes part in the work of the OECD.
OECD Publishing disseminates widely the results of the Organisation’s statistics gathering
research on economic, social and environmental issues, as well as the conventions, guidelines
standards agreed by its members.
OECD PUBLISHING, 2, rue André-Pascal, 75775 PARIS CEDEX 16
(10 2015 05 1 P) ISBN 978-92-64-22875-7 – 2015
February 2015
OECD Economic Surveys
ITALY SPECIAL FEATURES: LABOUR MARKET REFORM; MORE AND BETTER QUALITY JOBS
Most recent editions
Volu
me 2015/6
ITALY
OE
CD
Eco
nom
ic Su
rveys
Volume 2015/6February 2015
Australia, December 2014Austria, July 2013Belgium, February 2015Brazil, October 2013Canada, June 2014Chile, October 2013China, March 2013Colombia, January 2015Czech Republic, March 2014Denmark, January 2014Estonia, January 2015Euro area, April 2014European Union, April 2014Finland, February 2014France, March 2013Germany, May 2014Greece, November 2013Hungary, January 2014Iceland, June 2013India, November 2014Indonesia, September 2012Ireland, September 2013
Israel, December 2013Italy, February 2015Japan, April 2013Korea, June 2014Latvia, February 2015Luxembourg, December 2012Mexico, January 2015Netherlands, April 2014New Zealand, June 2013Norway, March 2014Poland, March 2014Portugal, October 2014Russian Federation, January 2014Slovak Republic, November 2014Slovenia, April 2013South Africa, March 2013Spain, September 2014Sweden, December 2012Switzerland, November 2013Turkey, July 2014United Kingdom, February 2015United States, June 2014
Consult this publication on line at http://dx.doi.org/10.1787/eco_surveys-ita-2015-en.
This work is published on the OECD iLibrary, which gathers all OECD books, periodicals and statistical databases.Visit www.oecd-ilibrary.org for more information.
ISBN 978-92-64-22875-710 2015 05 1 P
ISSN 0376-64382015 SUBSCRIPTION
(18 ISSUES)
9HSTCQE*ccihfh+
OECD Economic SurveysITALY
FEBRUARY 2015