˜ e Condition of Forests in Europeicp-forests.org/pdf/ER2007.pdf · The ICP Forests and the...
36
International Co-operative Programme on Assessment and Monitoring of Air Pollution Effects and Forests (ICP Forests) e Condition of Forests in Europe Executive Report Prepared by: Federal Research Centre for Forestry and Forest Products (BFH) European Comission
Transcript of ˜ e Condition of Forests in Europeicp-forests.org/pdf/ER2007.pdf · The ICP Forests and the...
International Co-operative Programme on Assessment and Monitoring of Air Pollution Eff ects and Forests (ICP Forests)
� e Condition of Forests in Europe Executive Report
Prepared by: Federal Research Centre for Forestry and Forest Products (BFH)
European Comission
Waldschaden2007_Titel3.indd 3-4 22.10.2007 20:18:43

Hamburg and Brussels, 2007
Reproduction is authorized, except for commercial purposes, provided the source is acknowledged.
ISSN 1020-587XPrinted in Germany
The ICP Forests and the European Commission wish to express their appreciation to all persons and insti-tutions that have contributed to the preparation of the report:in particular the Federal Research Centre for Forestry and Forest Products - Programme Co-ordinating Centre of ICP Forests, the National Focal Centres for the supply of data
and the authorsRichard Fischer, Ovidiu Badea (Chapt 2 – Special Focus), Paolo Barbosa (Chapt 3.4), Annemarie Bastrup-Birk (Chapt 4), Georg Becher (Chapt 2.1; 4), Roberta Bertini (Chapt 1), Vicent
Calatayud (Chapt 3.3), Sigrid Coenen (Chapt 3.5), Wim de Vries (Chapt 3.2), Matthias Dobbertin (Chapt 3.2), Marco Ferretti (Chapt. 3.3), Oliver Granke (Chapt 3.1; 4), Roland Hiederer (Chapt 1), Tracy Houston-Durrant (Chapt 1), Michael Köhl (Chapt 5), Philipp Kraft (Chapt 3.1), Martin Lorenz (Chapt 2.1), Peter Meyer (Chapt 4), Hans-Dieter Nagel (Chapt 3.1), Pavel Pavlenda (Chapt 2 – Special Focus), Gert Jan Reinds (Chapt 3.2), Peter Roskams (Chapt 3.5), Maria Sanz (Chapt 3.3), Marcus Schaub (Chapt 3.3), Ernst Schulte (Chapt. 5), Walter Seidling (Chapt 4), Svein Solberg (Chapt 3.2), Silvia Stofer (Chapt 4),
as well asAndy Moffat (linguistic revision) and Cornelia Lübker (technical assis-tance).
Photo referencesD. Aamlid (p. 5, 25 left, 28/29), V. Calatayud (p. 14(A); 21(D)), R. Fischer (p. 6; 9; 10; 14, 24 right), O. Granke (p. 24 left), JRC (p. 22), Ministry for Agriculture, Slovak Republic (p. 4), P. Pavlenda (p. 12; 13), P. Roskams (p. 23 left, middle), G. Sanchez/P. Garcia (p.23 right), M. Schaub (p. 20(B), 21(C and bottom)), C. Scheidegger (p.25 right)
1
The Condition of Forests in Europe2007 Executive Report
United Nations Economic Commission for Europe,Convention on Long-range Transboundary Air Pollution,International Co-operative Programme on Assessment and Monitoring of Air Pollution Effects on Forests (ICP Forests)
European Commission
Acknowledgements

no reduction needed S or N reduction only S reduction needed only N reduction S and N reduction
57.781.11
0.56
32.787.78
Development of defoliation
Virgin forest in the Carpathian Mountains
Percentage of plots with deposition reduction needed in order to be below critical loads
Relative tree growth in relation nitrogen deposition
Preface.............................................................................................................4
1. A pan-European forest monitoring programme.....................................6The ICP Forests monitoring programme was established in 1985 un-der the auspices of the Convention on Long-range Transboundary Air Pollution. A close collaboration with the European Commission began in 1986. Today, 41 countries participate in the programme. Results are based on around 6 000 Level I and 800 Level II plots.
2. The state of forests in Europe
2.1 After some years of worsening, forest condition has stabilized in 2006 ............................................................................ 10
After a number of years with a general deterioration of forest condition across Europe, 2006 was characterized by clear improvements. In many regions this is interpreted as recovery from sustained drought effects. One fifth of all trees assessed were rated as damaged, though the situ-ation differs between the main tree species and regions of Europe.
Special Focus: Carpathian montane beech forests .................................. 12In the Carpathian mountains, beech forests with a natural composi-tion of tree species still cover large areas. A number of virgin forests still exist which serve as study areas for natural forest dynamics. Even though the health condition of beech is comparatively good, several factors including drought, ozone and exceedances of critical loads for acid deposition were demonstrated to affect crown condition.
3. Environmental influences and ecosystem reactions
3.1 Some improvements in deposition. Critical nitrogen loads are still exceeded .......................................................................... 14
Critical loads for nitrogen deposition were exceeded on two thirds of nearly 200 monitoring plots, mostly located in Central Europe. Deposition remained unchanged on 80 % of the plots between 1999 and 2004.
It is predicted that even if emission reductions are implemented according to the existing agreements the soil acidity status will not reach pre-industrialisation levels on most of the plots in the next few decades.
3.2 Nitrogen deposition and high temperatures accelerate forest tree growth ................................................................ 19
Nitrogen deposition was linked to increased tree growth for Scots pine, Norway spruce and beech trees. Continued high nitrogen deposition may in the long run have negative effects on forest ecosystems and cause declining tree growth or increased tree mortality. Tree growth was as well linked to deviations from long term mean temperatures.
Eur. + sess. oak Holm oak Beech Maritime pine
Scots pine Norway spruce All species
30
25
20
15
101990 1992 1994 1996 1998 2000 2002 2004 2006
%
N deposition (kg/ha/yr)0 10 20 30 40 50 60 70
350
250
150
50
Relat
ive tr
ee gr
owth
%
beech pine spruce
2
Summary and table of contents

Scots pine tree with stemrust infestation
Bilberry shrubs with autumn colouring
Mean ozone concentrations (Apr. - Sept.) 2000 - 2004
3.3 After an extreme year 2003, ozone concentrations were again lower in 2004 .......................................................................20
In 2004, monitored ozone concentrations on forest sites were compar-atively low. This is because the formation of ozone takes place under intensive solar radiation and 2004 was a rather cool year. In general, ozone concentrations are higher in the South and at higher altitudes
3.4 2006 was an unexceptional year for forest fires .................................22The summer fire season 2006 has been characterized by average fire danger conditions in the Mediterranean region. The largest forest fires occurred in Galicia, Spain.
3.5 Insects and fungi are important factors influencing tree condition .........................................................................................23
Many natural and anthropogenic factors influence the condition of for-est trees. A new and more detailed assessment method showed that oak and beech species had the largest proportions of trees with dam-age symptoms. Insects and fungi were the most commonly reported causes.
4. Biological diversity is under observation ..............................................24The programme has extended its activities in the field of forest biodi-versity monitoring in recent years. Relations between structure and thus forest management and the occurrence of epiphytic lichens and plants in the herb layer were identified, and high loads of sulphur and nitrogen deposition were related to low diversity of herbs and epiphyt-ic lichens on nearly 100 plots across Europe. Within the BioSoil dem-onstration project, large scale representative forest biodiversity infor-mation is presently collected on over 4 000 Level I plots.
5. Conclusions ..............................................................................................28
Annexes .........................................................................................................30
Further information:http://www.icp-forests.orghttp://ec.europa.eu/environment/index_en.htmhttp://forest.jrc.it
[ppb] 20-25 25-30 30-35 35-40 40-45 45-50 50-55 >55
3

Talking about European forests means talking about almost half of Europe´s land area. The annual increment of wood in Europe´s forests amounts to 2.287 million m3. This equals 73 cubic metres per second. About 12 % of the forest area is designated as protective forests - for protection of soil, water or other components and function of for-ests. But we can hardly measure, quan-tify and value the real benefits of non-commercial forests, especially their ecological functions. These large sta-tistics and crucial facts should make all decision makers and the public aware that we still have invalueable natural wealth and real fortune in Europe, and also that we have to understand it and to take care of this wealth.
In the early 1980´s, Europe was for the first time alarmed by the large-scale forest decline or deterioration of forest condition. In the meantime 51 parties have signed the Convention on Long-range Transboundary Air Pollution (CLRTAP, Geneva 1979). The CLRTAP was crucial for launching forest monitoring in the framework of the International Co-operative Programme on Assessment and Monitoring of Air Pollution on Forests (ICP Forests) in 1986. The fear of forest decline in Europe and the uncertain role of air pollutants were driving forces of forest moni-toring at that time. The monitoring was set up to assess the health status and development of European for-ests on a large scale and to regularly inform policy makers, scientists and the public on the results. The initia-tives of the European Union, from the first Regulations on crown condi-tion assessment during the 1980s un-til the Regulations on intensive mon-itoring of forest ecosystems starting in the 1990s, have created a complex forest monitoring system for the as-sessment of air pollution effects on forests. The results of ICP Forests provided not only a realistic pic-ture of the extent and development of forest damage, but increased our knowledge on the status of forest
ecosystems in Europe, on the effect of atmospheric deposition and other stress factors on forests and contrib-uted to the elucidation of the com-plex causes and effects involved. ICP Forests promotes the wide use of its data for scientific evaluation. Upon request and in agreement with the data owners, data are free for exter-nal users.
Forest condition and health are now perceived in a wider context, and the programme has developed into a unique multifunctional monitoring system. ICP Forests today provides a platform for information exchange for forest scientists, managers and politi-cians of 41 participating countries.
The considerable reduction of in-dustrial emissions, sulphur emis-sions in particular, and the resulting notable improvement of air qual-ity in Europe was partly achieved due to the successful work of ICP Forests and the other ICPs under the CLRTAP. However, further emission reductions are necessary in order to ensure soil status that provides long-term forest ecosystem stability. In contrast to the relatively fast react-ing soil solution, the chemistry of the soil solid phase, and even more the soil fauna and flora, react much more slowly. Here, recovery processes can take many decades.
New and old hazards are threat-ening and damaging European forest ecosystems. Among these factors, a relatively new threat is damage due to increased ground level ozone in many regions. The main cause is a large in-crease in the transport of people and goods by road with related nitrogen oxide emissions which contribute to the increase of tropospheric ozone. In addition, the increase in deposition of nitrogen to forest soils, at least partly due to the same cause, is threatening the integrity and functioning of for-est ecosystems.
Globally a major threat is climate change. According to most climate models, predicted changes in average temperature and precipitation will
Miroslav JureňaMinister of Agriculture of the Slovak Republic
4
Preface

strongly affect ecological conditions of forests and their plant communities. In addition, extreme weather events like storms, high temperatures, and long lasting droughts will probably oc-cur much more often in the future.
The environmental risks are reflect-ed in several international conven-tions and processes. The Framework Convention on Climate Change (FCCC), the Kyoto Protocol and the Convention on Biological Diversity (CBD) reflect, beside other obligations, a need for new and broadened data-sets about forests.
The Sixth Community Environment Action Programme of the European Union has defined key environmental priority areas such as climate change, nature and biodiversity, environmen-tal health and quality of life and nat-ural resources and wastes. Forestry can be considered a key sector in re-lation to all priority areas of the pro-gramme. A forestry-specific key pro-cess is the Ministerial Conference on the Protection of Forests in Europe (MCPFE).
In addition to the above men-tioned commitments and reporting obligations, the EU and its mem-ber states also have commitments to supply forest related data for the
UN-ECE/FAO Forest Resources Assessment (FRA).
As a result of the above mentioned obligations and processes, teams of experts have prepared lists of indica-tors relevant to these issues. The mul-tifunctional monitoring programme of the ICP Forests programme of-fers a very good tool to record the ex-tent and intensity of risk factors and to monitor and assess the reactions of the forest ecosystems. The high spa-tial coverage and long time series for many of the data make the monitor-ing system especially unique and the data can be further utilised for model-ling and prediction of future develop-ments. The evaluation of existing and newly collected data concerning ad-ditional indicators and parameters is an exceptional chance to obtain a clear picture of the state, risk and current change in forest ecosystems. On the other hand, some inevitable change is required in the current forest moni-toring programme in order to meet all these monitoring needs.
We have to keep in mind that besides the joint EU and ICP Forests monitor-ing activities there are National Forest Inventories and also specific or region-al environmental programmes in for-ests. The integration and combination
of information of all relevant monitor-ing systems seems to be the best and most effective solution.
Representative surveys (Level I monitoring) provide information on the current state and changes taking place in forests over extensive areas, while intensive monitoring (Level II Monitoring) investigates the ecolog-ical processes and cause-effect rela-tionships. National forest inventories provide the most representative in-formation also at national and region-al level. It is desirable to improve the coherency and efficiency of the exist-ing monitoring activities and networks under the umbrella of an European Forest Monitoring System, to improve reliability, comparability and accuracy of all forest related information, and last but not least, to increase the cost-effectiveness of data reporting on all forest related commitments at nation-al, European and international level.
Miroslav Jureňa
Forest and mountain landscape in the Slovak Republic.
5

Data for forest management, nature conservation and policyThroughout Europe, forests have many important functions. They are a basis for economic activity, and play a significant role in the development of rural areas and for recreational pur-poses. Forests also have major value for nature conservation and environ-mental protection and are significant carbon sinks, and thus relevant in the context of climate change. Forests also represent a controlling factor within the hydrological cycle. Sustainable forest management, as well as envi-ronmental policies, relies upon the sound scientific resource provided by long-term, large-scale and intensive monitoring of forest condition.
In 1985, the International Co-operative Programme on the Assessment and Monitoring of Air Pollution Effects on Forests (ICP Forests) was established under the UNECE Convention on Long-
range Transboundary Air Pollution (CLRTAP). In 1986 the European Union (EU) adopted the Scheme on the Protection of Forests against Atmospheric Pollution and with the Council Regulation (EEC) No. 3528/86, the legal basis for the co-financing of the assessments was provided. In 2003, this regulation was prolonged and modified through the “Forest Focus” Regulation (EC No 2152/2003) which expired in 2006. Since 2007 there is no more legal basis for obligatory for-est monitoring in the EU, even though under the “LIFE+” Regulation (EC No. 614/2007) co-financing for the fu-ture development of forest monitor-ing may be provided. ICP Forests and EU have been closely co-operating in monitoring the effects of air pollu-tion and other stress factors on for-ests. Today 41 countries participate in the ICP Forests which contributes to the implementation of clean air poli-cies at European and national level.
Embedded into a network of co-operationsThe data and results of the monitor-ing activities provide information for a number of criteria and indicators for sustainable forest management as defined by the Ministerial Conference on the Protection of Forests in Europe (MCPFE). Contributions to the Framework Convention on Climate Change (FCCC) and to the Convention on Biological Diversity (CBD) have been made as well. The programme also maintains close contacts with the Acid Deposition Monitoring Network in East Asia (EANET).
Newly established Level I plot with Pinus brutia in Turkey.
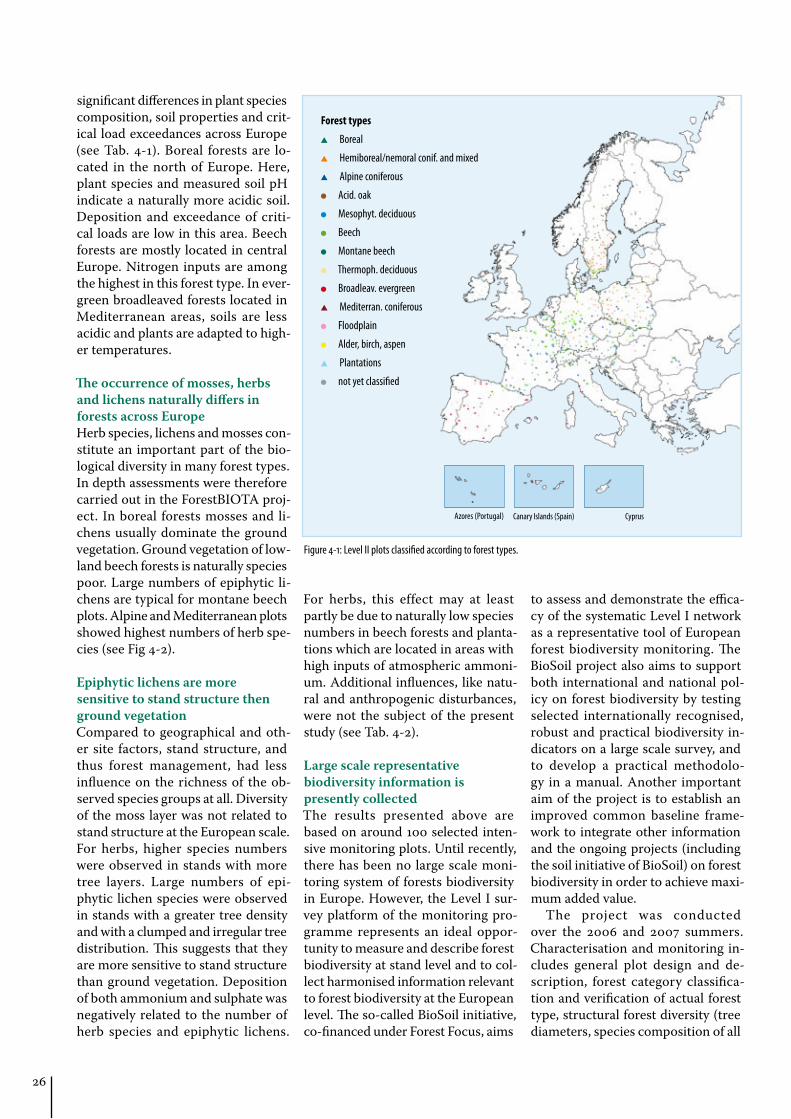
Figure 1-1: Level I plots classified according to forest types (National data validation is ongoing in the course of the
BioSoil project, see Chapt. 4).
6
1. A pan-European forest monitoring programme

Forest types
Boreal forests
Hemiboreal/nemoral, coniferous or mixed
Alpine coniferous
Acidophilous oak
Mesophytic deciduous
Beech
Montane beech
Thermophilous deciduous
Broadleaved evergreen
Coniferous Mediter./Anatol./Macaron.
Floodplain forest
Alder, birch, aspen
Plantations
Mire and swamp
not yet classified
Azores (Portugal) Canary Islands (Spain)
7

Frequency Number of plots
Number of plots data submission 2006:
Crown condition annually 6093 6045
Foliar chemistry once until now 1497
Soil chemistry
Once until now;(repetition launched in most of the EU countries within the BioSoil project)
5289(4000)
Tree growth demonstration pro ject ongoing (BioSoil) (4000)
Ground vegeta-tion
demonstration pro ject ongoing (BioSoil) (4000)
Stand structure, deadwood
demonstration pro ject ongoing (BioSoil) (4000)
Frequency Number of plots with data
Number of plots; data submission 2004
Crown condition annually 822 676
Foliar chemistry every 2 years 795 127
Soil chemistry every 10 years 742 1
Tree growth every 5 years 781 338
Ground vegetation every 5 years 757 105
Stand structure incl. deadwood once 90 -
Epiphytic lichens once 90 -
Soil solution chemistry continuously 262 221
Atmospheric deposition continuously 558 434
Ambient air quality continuously 100 98
Meteorology continuously 227 212
Phenology several times per year 145 145
Litterfall continuously 114 114
Remote sensing preferably at plot installation national data
Challenging objectives and a unique monitoring systemThe mandate of the ICP Forests is
to monitor effects of anthropogenic ·(in particular air pollution) and nat-ural stress factors on the condition and development of forest ecosys-tems in Europe, andto contribute to a better under- ·standing of cause-effect relation-ships in forest ecosystem function-ing in various parts of Europe.
Data are collected by the participating countries. Presently data are stored from over 6 000 permanent observa-tion plots called Level I (see Fig. 1-1). In addition, 805 plots have been se-lected in Turkey in 2006. Level I plots are located on a 16*16 km grid cover-ing 35 countries throughout Europe. In addition to annual crown condi-tion surveys, the BioSoil demonstra-tion project begun in 2006 under the Forest Focus Regulation allows a repeat of an original soil survey on Level I plots undertaken in 1994 in many European countries (Tab. 1-1, see Chapt 4).
In order to detect the influence of various stress factors on forest eco-systems, intensive monitoring is car-ried out in over 800 Level II plots. A larger number of surveys are carried out on these plots which are loca-ted in forests that represent the most important forest ecosystems of the Continent. (see Tab. 1-2). Due to the large annual data numbers and inten-sive data validation routines imple-mented within a new data platform, results from intensive monitoring plots can only be presented up to the year 2004 in this report.
Further information:http://www.icp-forests.orghttp://ec.europa.eu/environment/index_en.htmhttp://forest.jrc.it
Table 1-1: Surveys and number of plots on Level I.
Table 1-2: Surveys and number of plots on Level II (see Annex III for more details).
8

Within the monitoring programme 600-700 data files are submitted by the National Focal Centres each year, amounting to over three quarters of a million single data records annually.
Under the Forest Focus Regulation the European Commission Direc-torate General Joint Research Centre (DG JRC) has implemented a Forest Focus Monitoring Database System to manage the data. The system was developed and realized under con-tract by a Consortium, coordinated by I-MAGE Consult with Nouvelles Solutions Informatiques s.a. (NSI) as consortium partner and the Federal Research Centre for Forestry and Forest Products (BFH) as sub-con-tractor.
The database contains data from all Level I and Level II surveys.
Data are first checked for ad-herence to the format specifica-tions stipulated in the Technical Specifications of DG JRC. These tests are performed on-line and generate immediate feedback to the National Focal Centre submitting the data. The feedback report allows NFCs to check their data and if nec-essary make corrections before sub-mitting the survey.
To maintain a full audit trail of the process, all previously submitted files and reports remain within the system, but are flagged as obsolete if superseded by a new submission of the same survey. Data that pass the first suite of tests are then subjected to further evaluation. These checks are performed off-line because some of the tests require relatively intense processing and direct access to the data already stored within the data-base. Individual values are examined for plausibility either within expect-ed general ranges (single parameter), depending on values of other pa-rameters (multiple parameter), or depending on values from former years (multiple years). Data values that generate warning messages are reported to the originating National Focal Centre, who can then correct the data if necessary, or otherwise confirm the submitted values as val-id. Values confirmed in this way are flagged within the database system as extreme events.
All of the prior group of tests as-sess plot-specific conditions. The fi-nal stage in the validation process is intended to ascertain the suitabili-ty of the data for further temporal
and spatial analyses, and to identi-fy inconsistencies in the data that could not be found during any of the previous checks. This is done by comparing the data values with in-formation from other plots. These checks are more qualitative and con-stitute a first step into data evalua-tion. The results are presented as tables, graphs and maps, which re-quire expert interpretation and may also include comparisons with ex-ternal data as far as available. Data are stored within the database only after they pass all the tests or are confirmed extreme events.
The programme of verification of all submitted data from 2002 on-wards is ongoing and expected to be complete by the end of 2007. Until then, all results reported should be taken as provisional, as they include data that have not yet passed all the validation stages.
Further information:http://forestfocus.nsi-sa.be/
Significant data volumes require complex data base applications and quality checks
Forest types and environmental conditions differ greatly across Europe. Overgrazing can constitute a major pressure for open holm oak forests in Spain.
9

SummaryMean defoliation for all tree spe- ·cies has been fluctuating since 1990. However, there was a slight overall decrease in forest condition over the past 10 years. Only in 2006 was some recuperation recorded. Around one fifth of the trees assessed in 2006 were rated as damaged or dead.Whereas beech had shown some ·improvements in 2005 and a stable mean defoliation in 2006, deciduous oak species showed a marked recu-peration in the most recent assess-ments. For Scots pine and Norway spruce slight improvements were registered. Mean defoliation of holm oak and maritime pine remained unchanged in 2006.
Defoliation is an operational indicator designed for monitoring large areasThe health condition of forest trees in Europe is monitored over large ar-
eas by a survey of tree crown defolia-tion. Trees that are fully foliated are regarded as healthy. The Ministerial Conference on the Protection of Forests in Europe (MCPFE) uses de-foliation as one of four indicators for forest health and vitality.
In 2006, crown condition data were submitted from 6 045 plots in 32 countries. In all, 129 880 trees were assessed. Since the beginning of the 1990s, the number of surveyed plots and trees has increased. Larger sam-ples of trees are therefore available for the analysis of short and medium term changes, whereas the evalua-tion of long term changes is based on a smaller number of plots and coun-tries.
One fifth of all trees assessed were damagedIn 2006, 21.9 % of all trees assessed had a needle or leaf loss of more than 25 % and were thus classified as either
damaged or dead (see Fig. 2-1). In 2005, the respective share amounted to 23.2 %. Of the most frequent tree species, European and sessile oak had the highest share of damaged and dead trees, namely 34.9 %.
In the last year there were more improvements in crown condition than deteriorationOver the last ten years the develop-ment of crown condition has been mainly characterized by an increase in defoliation. This is not only reflect-ed by a rather constant increase of mean defoliation of all species be-tween 1997 and 2005 (see Fig. 2-2), but also by a much larger share of plots with increasing defoliation compared to plots with a decrease (see Fig. 2-3). In 2006, however, im-provements prevailed. Beech trees had already shown some recupera-tion from sustained drought effects in 2005. Mean defoliation of beech
2.1 After some years of worsening, forest condition has stabilized in 2006
Moderately defoliated tree crowns of maritime pine and Pyrenean oak in the Mediterranean. The main parameter assessed within the extensive forest condition survey is defoliation. This is an estimate of the lack of needles or leaves in comparison to a fully foliated reference tree. Defoliation responds to many stress factors and is reliably assessable over large areas.
10
2. State of forests in Europe

Canary Islands (Spain)
0 – 10 % none >10 – 25 % slight >25 – 60 % moderate >60 % severe 100 % dead
hardly changed in 2006 because some worsening in the Atlantic regions was balanced by improvements in moun-tainous regions of the Mediterranean. European, and sessile oaks showed a marked improvement in most re-gions in 2006. Defoliation in holm oak stabilised after a lengthy wors-ening trend and maritime pine did not show much change in compari-son to the previous year. There were slight overall improvements in the condition of Scots pine and Norway spruce. Exceptions were Scots pine in the mountainous regions in the Mediterranean and Norway spruce in the Boreal region.
Further information:Lorenz, M.; Fischer, R.; Becher, G.; Granke, O.; Riedel, T.; Roskams, P.; Nagel, H.-D.; Kraft, P. (2007) Forest Condition in Europe. 2007 Technical Report. BFH, Hamburg, 91pp, Annexes.http://www.icp-forests.org/RepTech.htm
EU Member States Total Europe
Definition class
Needle/leaf loss
Degree of defolation
All s
pecie
s
Conif
ers
Broa
dleav
es
Broa
dleav
es
Conif
ers
All s
pecie
s
Norw
ay
Spru
ce
Scot
s pine
Com
m. b
eech
Euro
p. an
d Se
ss. oa
k
% of trees100
0
1.9
20.8
43.0
33.4
0.91.5
18.5
41.7
37.6
0.72.5
23.9
44.6
27.8
1.21.8
19.2
42.7
35.4
0.91.4
17.1
42.2
38.6
0.72.4
21.9
43.5
31.1
1.11.9
21.8
33.3
42.6
0.40.9
12.3
47.1
39.1
0.61.4
21.1
42.3
34.1
1.12.3
31.8
45.5
19.6
0.8
Figure 2-1: Percentage of trees in different defoliation classes. Total Europe and EU, 2006. Sample size for total Europe is 129 880 trees and 109 085 trees for EU.
Figure 2-3: Plot wise development of defoliation for all tree species, 1997-2006. In some countries and regions of Europe shifts in plot locations hinder the calculation of plot wise changes.
Figure 2-2: Mean defoliation for the most frequent tree species and for the total of all tree species. Samples only in-clude countries with continuous data submission. Sample size for the selected main tree species varies between 3 166 and 31 790 trees per species and year. The time series starting in 1990 is available for a smaller number of countries and is based on between 41 484 and 49 712 trees depending on the year.
Eur. + sess. oak Holm oak Beech
Maritime pine Scots pine Norway spruce All species
30
25
20
15
101990 1991 1992 1993 1994 1995 1996 1997 1998 1999 2000 2001 2002 2003 2004 2005 2006
%
Significant decrease
No clear trend
Significant increase
of mean plot defolation
11
65.7 %
9.7 %
24.6 %

Spec
ial F
ocus
The natural range of Beech forests covers most of EuropeThe natural habitat of European beech (Fagus sylvatica) covers large areas of Europe, ranging from southern Scandinavia to Sicily and from the Iberian Peninsula to the East Carpathians. Throughout the wide geographic range the natural dominance of beech is mainly explained by its high shade tolerance and its ability to grow on a wide range of site types. In general, as one moves to the south, beech forests occupy increasingly higher altitudes, their limit being at 1 250 m in the West Carpathians and northern Alps, 1 500 m in the Pyrenees and 1 850 m in the Apennines. According to the “European Forest Types” classification (EEA Technical Report 9/2006), there are two main cat-egories with the dominance of beech: beech forests and montane beech for-ests. One of the forest types included under the latter category are Carpathian montane beech forests.
Carpathian montane beech forests adapt to differing site conditionsWith an area of about 210 000 km2, the Carpathian Mountains represent one of the most significant natural forest regions in Europe. They are more than 1 500 km long and are located in Czech Republic, Slovakia, Poland, Ukraine, and Romania. They still comprise over 300 000 ha of primary forests. Large parts of these are virgin beech forests. In the Carpathians, beech grows in pure stands or can be mixed with silver fir, Norway spruce or broadleaves like syc-amore, Scotch elm and rowan depending on the site type. Plant communities in this forest type can differ quite considerably, depending on site condition. A number of units are included in the EU Habitat Directive (92/43/EEC) like Luzulo-Fagetum beech forests on poor and acid soils and Asperulo-Fagetum beech forests on richer soils. Limestone beech forests of the Cephalanthero-Fagion occur exclusively on calcareous parent materials and often on steep stony slopes. Here, tree, shrub layer and herb layer are usually very diverse, in-cluding whitebeam (Sorbus aria), and in a few areas yew (Taxus baccata).
Sycamore maple and silver fir are characteristic admixtures in montane beech forests.
Carpathian Montane Beech
Forests
12
Remnants of primary forests are nuclei for larger protected areas and researchCarpathian montane beech forests have undergone less intensive ex-ploitation by humans and tree spe-cies composition is generally much less changed than in western Europe. Nevertheless, in the Carpathians the percentage of beech has decreased in favour of conifers due to the demand for softwood. At present, the forests are usually managed by different shel-terwood systems. In some cases clear-cutting is still used.
Semi-natural and natural Carpathian beech forests are dominant parts of natural parks, nature and biosphere reserves. Clusters of ”Carpathian Primeval Forests” in Slovakia and lat-er also ”Beech Primeval Forests of the Carpathians“ in Romania and Ukraine have been proposed to be added to the UNESCO World Natural Heritage List. Studies in primeval forests in the Carpathians have been crucial for the scientific study of the evolution of European virgin forests and have sig-nificantly influenced modern silvicul-tural techniques.
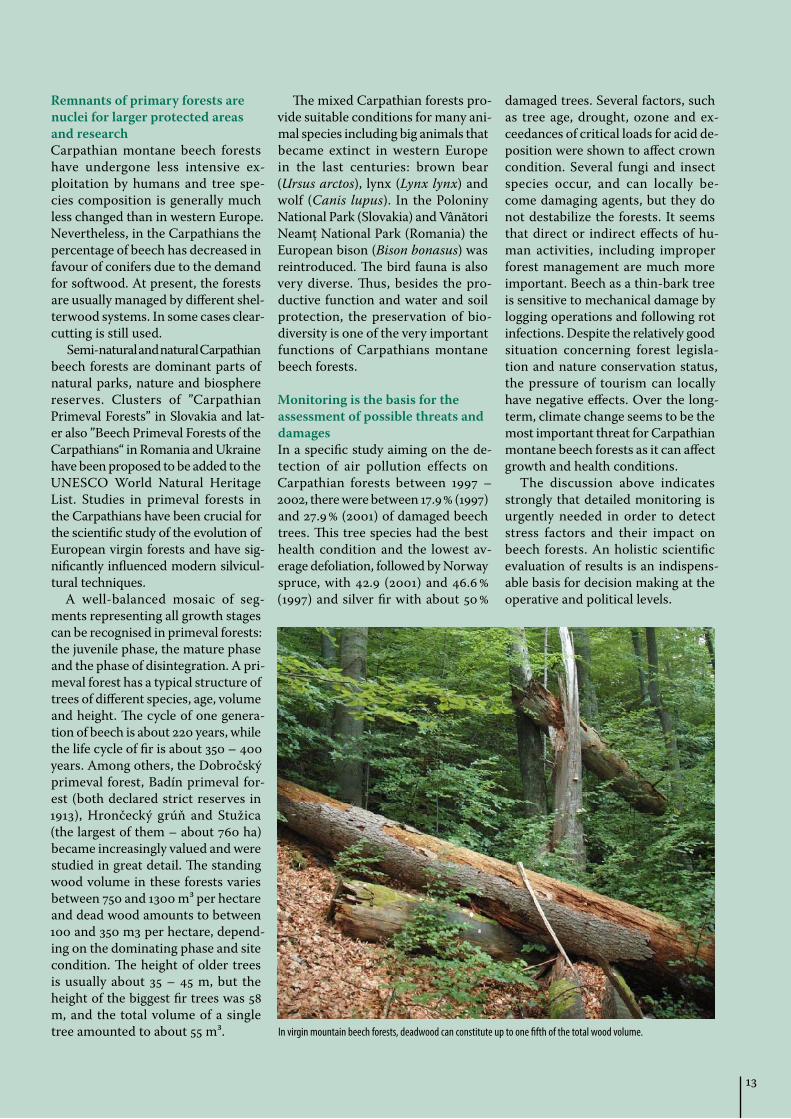
A well-balanced mosaic of seg-ments representing all growth stages can be recognised in primeval forests: the juvenile phase, the mature phase and the phase of disintegration. A pri-meval forest has a typical structure of trees of different species, age, volume and height. The cycle of one genera-tion of beech is about 220 years, while the life cycle of fir is about 350 – 400 years. Among others, the Dobročský primeval forest, Badín primeval for-est (both declared strict reserves in 1913), Hrončecký grúň and Stužica (the largest of them – about 760 ha) became increasingly valued and were studied in great detail. The standing wood volume in these forests varies between 750 and 1300 m3 per hectare and dead wood amounts to between 100 and 350 m3 per hectare, depend-ing on the dominating phase and site condition. The height of older trees is usually about 35 – 45 m, but the height of the biggest fir trees was 58 m, and the total volume of a single tree amounted to about 55 m3.
The mixed Carpathian forests pro-vide suitable conditions for many ani-mal species including big animals that became extinct in western Europe in the last centuries: brown bear (Ursus arctos), lynx (Lynx lynx) and wolf (Canis lupus). In the Poloniny National Park (Slovakia) and Vânători Neamţ National Park (Romania) the European bison (Bison bonasus) was reintroduced. The bird fauna is also very diverse. Thus, besides the pro-ductive function and water and soil protection, the preservation of bio-diversity is one of the very important functions of Carpathians montane beech forests.
Monitoring is the basis for the assessment of possible threats and damages In a specific study aiming on the de-tection of air pollution effects on Carpathian forests between 1997 – 2002, there were between 17.9 % (1997) and 27.9 % (2001) of damaged beech trees. This tree species had the best health condition and the lowest av-erage defoliation, followed by Norway spruce, with 42.9 (2001) and 46.6 % (1997) and silver fir with about 50 %
damaged trees. Several factors, such as tree age, drought, ozone and ex-ceedances of critical loads for acid de-position were shown to affect crown condition. Several fungi and insect species occur, and can locally be-come damaging agents, but they do not destabilize the forests. It seems that direct or indirect effects of hu-man activities, including improper forest management are much more important. Beech as a thin-bark tree is sensitive to mechanical damage by logging operations and following rot infections. Despite the relatively good situation concerning forest legisla-tion and nature conservation status, the pressure of tourism can locally have negative effects. Over the long-term, climate change seems to be the most important threat for Carpathian montane beech forests as it can affect growth and health conditions.
The discussion above indicates strongly that detailed monitoring is urgently needed in order to detect stress factors and their impact on beech forests. An holistic scientific evaluation of results is an indispens-able basis for decision making at the operative and political levels.
In virgin mountain beech forests, deadwood can constitute up to one fifth of the total wood volume.
13

SummaryNitrogen deposition is generally higher on plots in Central ·Europe compared to Northern and Southern regions. This leads to the exceedance of critical loads on two thirds of the plots mainly located in central Europe. Nitrogen de-position and the resulting nitrogen enrichment in the soil thus remain a widespread threat. Studies are based on nearly 200 monitoring plots.Model calculations show that on nearly 60 % of the plots, ·reduction of nitrogen deposition is needed in the coming years in order to be below critical loads. Between 1999 and 2004, however, nitrogen inputs remained unchanged on around 80 % of the plots.Critical loads for acidity were only exceeded on one third ·of the plots. However, it is predicted that even in 2050 the soil acidity status will not reach pre-industrialisation levels on most of the plots.The reduction of sulphur inputs and soil acidification ·show some real success of clean air policies. Plots with comparatively low sulphur inputs are mainly located in central Europe, in the far North and South-West of the Continent.
Changing importance of different air pollutantsWhen ICP Forests was founded more than 20 years ago, sulphur oxides, mainly deposited as sulphate (SO4), were an important focus for scientists, politicians and the public concerned with forest health and sustainability. However, additional compounds such as nitrate (NO3) and ammo-nium (NH4) have gained in importance. Sulphate and ni-trate deposition mainly originate from the combustion of
fossil fuels through vehicular traffic, and industry and do-mestic energy use. Ammonium deposition is largely re-lated to ammonia emissions from agricultural fertilizers and animal husbandry.
Central and Eastern European forest plots receive highest nitrogen inputsNitrogen deposition is comparatively high in central Europe. Plots with annual nitrate inputs above 6.3 kg per hectare and with ammonium deposition above 7.5 kg are concentrated in Central Europe.For sulphate, plots with annual deposition below 3.3 kg per hectare can be found in Alpine regions and in the north (see Figs. 3-1 – 3-3).
Plots in the Mediterranean and in the North are more sensitive to high nitrogen inputsCritical loads are calculated in order to estimate possible harmful effects of atmospheric deposition to forest eco-systems. Low critical nitrogen loads on many plots in Scandinavia, northern Germany, the Netherlands as well as in the Mediterranean (see Fig. 3-4) characterize ecosystems that are sensitive to high nitrogen inputs. In Scandinavia and Spain, this is due to slow growth rates and small wood volumes removed at harvest resulting in a small export of nitrogen from the ecosystem. In the Mediterranean there is also little export of nitrogen through leaching, due to low precipitation. Thus, more nitrogen is assumed to re-main in the ecosystem resulting in higher risks of harmful effects. On Alpine plots with high precipitation, more ni-trogen deposition is leached thus leading to higher critical
Intensive monitoring plot in Germany with permanent circumference measurement tapes (two oak trees in the foreground), throughfall samplers (three white round samplers in the middle) and stemflow collectors (green barrel).
3.1 Some improvements in deposition; critical nitrogen loads are still exceeded
14
3. Environmental influences and ecosystem reactions

Figure 3-6:Exceedance of critical loads for acidity in molcha-1a-1 by present deposition. *)
Figure 3-1: Mean throughfall deposition of nitrate (NO3-N) 2002-2004 on 219 plots.
Figure 3-2: Mean throughfall deposition of ammonium (NH4-N) 2002- 2004 on 219 plots.
Figure 3-3: Mean throughfall deposition of sulphate (SO4-S) 2002- 2004 on 219 plots.
Figure 3-4: Critical loads for nutrient nitrogen on 186 plots. The assessment of soil data necessary for critical load calculation was optional until recently. Data are avail-able for more plots; the submission from national data bases is still ongoing.
Figure 3-5: Exceedance of critical loads for nutrient nitrogen in molcha-1a-1 by pre-sent deposition. *)
*) The assessment of soil data necessary for critical load calculation was optional until recently. Data are available for more plots; the submission from national data bases is still ongoing.
mean annual deposition[kg/ha]
0.2-1.8 1.8-3.2 3.2-4.5 4.5-6.3 6.3-19.1
mean annual deposition[kg/ha]
0.2-1.6 1.6-3.3 3.3-5.1 5.1-7.5 7.5-23.8
mean annual deposition[kg/ha]
0.7-3.3 3.3-4.2 4.2-5.7 5.7-8.0 8.0-27.7
14.0 %8.89 %
1.67 %2.78 %
22.22 %
35.00 %
5.00 %
34.44 %
18.89 %
18.33 %
0.56 %5.56 %
8.89 %5.00 %
2.78 %
77.22 %
13.89 %9.44 %
29.44 %
19.1 % 22.7 %
24.7 %21.1 %
10.0 %21.5 %
24.3 %25.5 %
18.7 %
12.4 %
21.5 %
33.5 %17.9 %
13.1 %
CLnut(N) ≥ 250 250 - 500 500 - 750 750 - 1000 1000 - 1250 > 1250
No exceedance 1 - 200 201 - 500 501 - 1000 1001 - 1500 > 1500
No exceedance 1 - 200 201 - 500 501 - 1000 1001 - 1500 > 1500
15

N-NH4 (230 plots) S-SO4 (223 plots) N-NO3 (231 plots)
Alps (AU, CH) Northern Europe (NO, FI)
Western Europe (UK) Central Europe
(PL, DE, NL, BE; CZ, HU)
Southern Europe (ES, GR)
no reduction needed S or N reduction only S reduction needed only N reduction S and N reduction
loads. Critical load calculations only take into account ef-fects to the forest stands. Possible negative effects of nitro-gen leached into the ground water are not considered by the models. In Central Europe the model calculations as-sume higher nitrogen uptake by forest trees and thus a low-er sensitivity of the forest ecosystems.
Nitrogen deposition is above critical thresholds on almost all plots in central EuropeCritical loads for nitrogen inputs were exceeded on al-most all plots in central Europe and to a lesser extent on the Spanish plots (see Fig. 3-5). Nitrogen deposition, and the resulting nitrogen enrichment (eutrophication) in the soil, is a widespread risk. Negative effects of nitrogen deposition have to be expected in large parts of Europe. Accelerated tree growth can occur (see Chapt. 3.2), but there remains the possibility of destabilisation of forest stands and the loss of ability for the soil to buffer and help prevent water pollution, an important function of many forest soils. Shifts in ground vegetation composition can also be related to nitrogen deposition. There were only a few plots with exceedances in the Alps, in Scandinavia, United Kingdom and Greece.
Critical loads for acidity were exceeded on a much smaller proportion of the evaluated plots than critical loads for nitrogen (see Fig. 3-6). This is a result of clean air policies. However, the acidity status of many plots is still influenced by historical sulphur and nitrogen depo-sitions in the years 1960 – 2000 from which the forest soils have not yet recovered. Present exceedances of crit-ical acidity are caused by a combination of nitrogen and sulphur deposition.
In order to be below critical loads, nitrogen deposition needs to be reduced on nearly 60 % of the evaluated plots. Both nitrogen and sulphur deposition need to be reduced on around 8 % of the plots, whereas no reduction is need-ed on 33 % of the plots (see Fig. 3-7).
Sulphur deposition shows stronger decreases as compared to nitrogen inputsOn over 80 % of around 200 evaluated plots, no signifi-cant change in nitrogen deposition was observed between 1999 and 2004. On the remaining plots improvements pre-vailed. There were hardly any plots with increasing de-position (see Figs. 3-8, 3-9). Mean nitrate deposition de-creased from 6.0 kg nitrogen per hectare in 1999 to 4.7 kg
Figure 3-11: Development of measured mean plot troughfall deposition of sulphate (SO4-S), nitrate (NO3-N) and ammonium (NH4-N).
Figure 3-12: Development of modelled soil pH for 158 Level II plots located in 13 countries acidification. Low values indicate acid conditions.
kg/ha.a
57.781.11
0.56
32.78
7.78
mean defoliation (%)
Critical load exceedance (molc/ha/yr)
pH value
Figure 3-7: Required reduction to reach deposition below critical loads (S = sulphur, N = nitrogen).
Figure 3-16: Defoliation of beech at Level II plots related to exceedances of critical loads for nutrient nitrogen.
9
8
7
6
5
4
3
50
45
40
35
30
25
20
15
10
5
0
6.5
6
5.5
5
4.5
4
1999 2000 2001 2002 2003 2004
0 200 400 600 800 1000 1200 14001900 1925 1950 1975 2000 2025 2050
16

Significant decrease No significant change Significant increase
of deposition
*)The assessment of soil data necessary for pH modelling was optional until recently. Data are available for more plots; the submission from national data bases is still ongoing.
Figure 3-9: Trend of measured ammonium (NH4-N) throughfall deposition. 1999 – 2004 on 205 plots.
Figure 3-10: Trend of measured sulphate (SO4-S) throughfall deposition. 1999 – 2004 on 198 plots.
Figure 3-8: Trend of measured nitrate (NO3-N) throughfall deposition. 1999 – 2004 on 206 plots.
Figure 3-15: Modelled pH values at Level II plots for 2030.*)
Figure 3-13: Modelled pH values at Level II plots for 1950. The pH value is a common chemical indicator for acidification. Low values indicate acid conditions*).
Figure 3-14: Modelled pH values at Level II plots for 2000.*)
pH (1950) ≤ 3.8 3.8 - 4.0 4.0 - 4.2 4.2 - 4.5 4.5 - 5.0 5.0 - 6.0 6.0 - 7.0 >7.0
pH (2000) ≤ 3.8 3.8 - 4.0 4.0 - 4.2 4.2 - 4.5 4.5 - 5.0 5.0 - 6.0 6.0 - 7.0 >7.0
pH (2030) ≤ 3.8 3.8 - 4.0 4.0 - 4.2 4.2 - 4.5 4.5 - 5.0 5.0 - 6.0 6.0 - 7.0 >7.0
9.1 %
30.5 %
3.0 %
1.3 %
87.9 %
68.2 %
Significant decrease No significant change Significant increase
of deposition
Significant decrease No significant change Significant increase
of deposition
12.6 %3.0 %
84.4 %
17

in 2004 (see Fig. 3-11). Mean ammonium deposition de-creased from 5.7 kg nitrogen to 4.6 kg per hectare on the plots monitored in the same period. For sulphate deposi-tion there were stronger reductions observed, with around one third of the plots showing significantly decreasing sulphur inputs (see Fig. 3-10). The evaluated monitoring plots are mainly located in central Europe.
Reduced deposition leads to some recovery from soil acidificationDynamic models can help to evaluate forest ecosystem re-sponses to changing deposition scenarios. They take into account specific site and stand conditions at each plot and allow the study of future effects of today’s clean air policies. Results show that acidifying effects of the atmo-spheric deposition are widespread (see Figs. 3-13 to 3-15). Until the mid 1990s, decreasing soil pH indicates acidifi-cation of soil water in all regions studied. The reduction of sulphur and to a lesser extent nitrogen deposition has been shown for the Level II plots to lead to a recovery of pH on most of the plots. However, it is predicted that the original pH modelled for the beginning of the last cen-tury will not be reached again until 2050 (see Fig. 3-12). A full recovery of pH was only calculated for the plots in the United Kingdom. Due to prevailing calcareous parent materials, the pH on Spanish and Greek plots is generally higher. Industrialisation and thus soil acidification started later in these regions.
Beech trees show increased defoliation on plots with higher exceedances of critical loadsThe above mentioned exceedances of critical loads for acidity and nutrient nitrogen calculated for a given year were compared with defoliation of the main tree species as assessed in the same year on the same Level II plots. Of these species, only beech revealed a statistical rela-tionship between defoliation and the exceedance of criti-cal loads for nutrient nitrogen (see Fig 3-16). For the other species no such relations could be verified. The fact that nearly no relations to damage symptoms were substan-tiated on plots showing critical loads exceedances is not contradictory to the concept of critical loads. Forests are able to store nitrogen up to a certain degree, so that to-day’s exceedance of CL is not necessarily linked to direct and immediate damage to trees.
Further information:Lorenz, M.; Fischer, R.; Becher, G.; Granke, O.; Riedel, T.; Roskams, P.; Nagel, H.-D.; Kraft, P. (2007) Forest Condition in Europe. 2007 Technical Report. BFH, Hamburg, 91pp, Annexes.http://www.icp-forests.org/RepTech.htm
Deposition measurements are carried out within the for-est stands (throughfall deposition) and in nearby open fields (bulk deposition). In the forest canopy, some ele-ments can be leached from the foliage and increase the measured deposition load, whereas others are taken up by leaves and needles and are thus not detected in through-fall. Bulk deposition is not influenced by element fluxes in the canopy but is mostly lower because the forest can-opy filters additional deposition loads from the air. Thus, neither throughfall nor bulk deposition is equal to the to-tal deposition that is received by the forest stands. On the plots, samples are collected weekly, fortnightly or monthly and are analysed by national experts. After intensive qual-ity checks, annual mean depositions for the years 1999 to 2004 were calculated for plots with complete data sets. Slopes of plotwise linear regressions of deposition over time were tested for significance. Throughfall deposition was used to calculate exceedances of critical loads.
Dynamic soil chemistry models such as VSD (Very Simple Dynamic Model) show the effects of acid deposition and forestry measures on the soil water over time. The key pro-cesses included in the model are element fluxes in depo-sition, nutrient uptake by trees, nutrient cycling including mineralization, weathering processes for base cations and aluminium, and leaching of elements to groundwater. The
calculations rely on soil data from Level II. As chemical and physical soil properties change rather slowly, all data submitted since the beginning of the Intensive Monitoring Programme have been used. In addition, historical deposi-tion rates were available from the literature. Future deposi-tion scenarios based on the UNECE Gothenburg Protocol were applied as calculated by the International Institute for Applied Systems Analysis (IIASA). Dynamic models were applied to 158 Level II plots.
Critical loads define thresholds for the effects of air pollu-tion. If pollution is below the critical values, it is assumed that no environmental damage will occur and a long-term stability of the ecosystem is achieved. Critical loads are de-rived using the principal of a scale balance to compare the quantity of mainly anthropogenic pollutants as inputs on one side and the removal, acceptable storage and outputs of these substances on the other. The system remains in balance as long as critical loads are not exceeded. Any ad-ditional input of pollutants may cause harmful effects.
Acidity is given in molc.ha-1.yr-1 (“mol of charge per hectare per year”). Mols of charge allow comparisons of the deposi-tion of different substances. The simpler unit of kg.ha-1.yr-1 does not allow this comparison. 1000 molc is equivalent to 14 kg of nitrogen and 16 kg of sulphate sulphur.
18

SummaryResults suggest that nitrogen deposition leads to increased ·tree growth. On plots with high inputs, growth of pine, spruce and beech trees was consistently higher than ex-pected for given site conditions, stand age and density.Higher growth increase occurred on sites with a low origi- ·nal nitrogen status. These sites with limited nitrogen avail-ability are responding stronger to the atmospheric inputs, as expected. Further research will test whether prolonged high nitrogen deposition will have negative effects such as declining growth or increased tree mortality.Temperatures above the long term mean during the grow- ·ing season also correlated with increased tree growth.
Level II plots are a basis to investigate increased tree growthPrevious reports have suggested that forest growth in Europe has been increasing in recent decades. Data from Intensive Monitoring Plots over a five years period have been used to examine the influence of environmental fac-tors on forest growth (see Fig. 3-17). Evaluation focussed on the influence of nitrogen, sulphur and acid deposition, temperatures, precipitation and on a drought index calcu-lated as the deviation from the long-term mean. The study included the main tree species Norway spruce, Scots pine and common beech as well as European and sessile oak and was based on data from 363 plots.
Calculation of relative growthAs many other factors besides nitrogen and temperature influence tree growth, expected growth was modelled us-ing site productivity, stand age and a stand density index. Relative tree growth was then calculated as actual growth in % of expected growth. The model explained between 18 % and 39 % of the variance with site productivity being pos-itively related and age negatively related to actual growth. The site productivity was either taken from expert estimates or computed from site index curves.
Figure 3-17: Relative tree growth on Level II plots in Europe given as deviation of measured from modelled growth. Increased tree growth was more often observed on plots in central Europe (Dobbertin and Solberg 2007).
3.2 Nitrogen deposition and high tem peratures accelerate forest tree growth
Main tree species react to environmental influencesRelative growth of spruce and pine trees was significantly higher on plots with high nitrogen deposition. For beech trees there was also a positive relation with nitrogen depo-sition, but it was not statistically significant (see Fig. 3-18). On sites that were already nitrogen saturated this effect was smaller whereas a stronger influence of nitrogen de-position could be substantiated on sites with a low nitro-gen status. These results indicate an accelerating effect of nitrogen deposition on forest tree growth. On sites that were overexploited in the past and with a good supply of nutrients other than nitrogen, these inputs may compen-sate for former nitrogen losses. On other sites it is possible that, while nitrogen deposition increases growth at first, it may cause nutrient imbalance and may in the long-run lead to a destabilisation of forest stands. The appraisal of these findings is still ongoing.
Temperatures above the long term mean in the grow-ing season also correlated with higher relative growth for all three of the main tree species (see Fig. 3-19). However drought may offset the effects of increased temperature at least for pine and spruce at sites with low water availabili-ty. For oak with only 32 available plots results were neither consistent nor significant.
Temperature deviation May-Aug (°C)
Figure 3-19: Relative tree growth in relation to temperature deviation from the long term mean. A temperature deviation of 0.1°C accounted for an increase of between 2 to 4 % in growth. (Dobbertin and Solberg, 2007)
-0.50 0.00 0.50 1.00 1.50
350
300
250
200
150
100
50
0
Relat
ive tr
ee gr
owth
%
N deposition (kg/ha/yr)
Figure 3-18: Relative tree growth in relation to nitrogen deposition. Overall, an increase of 1 kg nitrogen deposition per hectare and year accounted for an increase of 1 % in stem growth. (Dobbertin and Solberg, 2007)
0 10 20 30 40 50 60 70
350
300
250
200
150
100
50
0
Relat
ive tr
ee gr
owth
%
beech pine spruce
beech pine spruce
<70 % 70-100 % 100-200 % >200 %
19

≥ 55 ppb 50-55 ppb 45-50 ppb 40-45 ppb 35-40 ppb 30-35 ppb 25-30 ppb 20-25 ppb
SummaryGround level ozone is the most im- ·portant toxic air pollutant for plants worldwide and contributes to glob-al warming.The passive samplers of the ICP ·Forests Level II monitoring network constitute the only transnation-al harmonized measurement cam-paign for a wide selection of remote forest areas in Europe.Over the measurement periods of ·2000-2004, concentrations were higher in 2003 and relatively low in 2004, probably due to contrasting weather conditions during the re-spective seasons. Critical ozone levels for sensitive for- ·est species (AOT 40) were frequent-ly exceeded during summer seasons in all years.Ozone flux to forests was successful- ·ly modelled based on the intensive monitoring data.
3.3 After an extreme year 2003, ozone concentrations were again lower in 2004.
A B
Figure 3-20: Mean ozone concentrations for April-September in 2000 – 2004. Due to the higher solar radiation, concentrations typically increase from North to South Europe.
Ground level ozone is toxic for plants and contributes to global warmingCurrent ground level (tropospheric) ozone (O3) concentrations are consid-ered to be by far the most important gaseous air pollutant for plants world-wide. In addition, tropospheric ozone has been recognized as an important greenhouse gas and is a significant contributor to the “global warming”. Elevated CO2 concentrations in the atmosphere stimulate plant growth and thus the carbon sink strength of plants, but these mitigating effects are potentially curtailed by ozone toxici-ty. The formation of ozone takes place under intensive solar radiation and elevated air temperatures and is en-hanced by the presence of pollutants such as nitrogen oxides and volatile organic compounds. Ozone concen-trations in remote areas are predicted
to remain high or even increase, un-derlining the need to continuing mon-itoring across Europe.
Passive samplers provide a cost effective monitoring method for remote areas‘Passive’ samplers used in the ICP Forests Level II monitoring network constitute the only transnational har-monized measurement campaign for a wide selection of remote forest ar-eas in Europe. This method provides data on ambient ozone levels and ex-posures across Europe which also play an important role for the validation of large-scale modeling for European forest ecosystems.
Ozone concentrations over the period 2000-2004The highest ozone concentrations in forest areas across Europe are typi-
Examples of different passive sampler devices exposed in Intensive Monitoring Plots across Europe. A) France, B,C) Switzerland, D) Spain. Passive samplers provide an accurate and inex-pensive method for measuring cumulative exposures of different air pollutants such as ozone and do not require any electric power. The ozone molecules diffuse into the sampler where they are absorbed. After the analysis in a laboratory they give a mean concentration value over time.
Figure 3-21: Shares of plots belonging to 8 classes of ozone concentrations based on the mean ozone values (April-September) 2000-2004. Only plots with at least 70 % data cover during the observation period were considered.
2000 2001 2002 2003 2004
100
80
60
40
20
02000-2004
% of plotsmean ozone concentration[ppb]
20-25 25-30 30-35 35-40 40-45 45-50 50-55 >55
20

Top Canopy, 17 m Below Canopy, 8 m Standard, 2 m
cally found in the South (see Fig 3-20). Over the period from 2000 to 2004 highest concentrations were mea-sured in 2003, a year with one of the hottest summers on record for Europe. The high air temperatures measured during the summer of 2001 are also reflected in the higher ozone levels during that year. In the five year study period, concentrations were lowest in 2004, due to the relatively low so-lar radiation recorded during April-September 2004 (see Fig 3-21).
Critical ozone levels for sensitive vegetation are frequently exceededData from passive sampling have been successfully used to model the AOT40 (Accumulated Over a Threshold of 40 ppb ozone), i.e. the index used to identify a possible risk for sensitive vegetation. A recent run of the model for 24 Italian plots over the period 2000-2004 revealed a con-tinuous exceedance of the UNECE Critical Level for sensitive vegeta-
tion under sensitive conditions (5000 ppb*h) on all plots. However, the ex-tent to which these exceedances lead to adverse effects on forest vegetation remains subject to further investiga-tion.
Ozone flux studies are an advanced approach to evaluate ozone effects on forest vegetationRecent research has focussed on how much of the gaseous pollutant is taken up by plants. This so-called ozone flux can be estimated by process models which are based on data from Level II intensive monitoring plots. The mod-els are data hungry (see Fig. 3-22) as they need to predict complex physi-ological processes which in turn de-pend on environmental factors such as climatic, soil and site conditions and forest structure including plant age, species composition and oth-er factors., The further development and validation of ozone flux mod-els is currently being undertaken in
collaboration with the International Cooperative Programme on Effects of Air Pollution on Natural Vegetation and Crops (ICP-Vegetation).
A standardized assessment approach is being developedTo evaluate the effects of ozone on forest ecosystems, the assessment of ozone-induced visible injury on nee-dles and leaves has been shown to be a useful and inexpensive method. In order to standardize the assessment of ozone visible injury and its flux-rel-evant onset, clones of an ozone sensi-tive poplar genotype (Populus x bero-linensis) are currently being tested for their suitability as bio-indicators at a subset of Level II sites. Such a bio-indicator approach provides valuable, standardized reference data for ozone effects which may be very useful for a better understanding of an ozone-risk assessment for forest ecosystems across Europe (e.g. determination of critical flux).
C D
Typical ozone-induced visible symptoms on a poplar leave.
Figure 3-22: Ozone concentration at different canopy heights at one Italian Level II plot be-tween March 2005 and March 2006 (Bussotti and Ferretti, 2007). In order to estimate the ozone uptake by forest trees very detailed and data intensive assessments are required.
24.3.05 23.5.05 22.7.05 20.9.05 19.11.05 18.1.06 19.3.06
100
80
60
40
20
0
Ozone, ppb
21

3.4 2006 was an unexceptional year for forest fires
SummaryThe 2006 summer fire season has been ·characterized by average fire danger conditions in the Mediterranean re-gion. The largest forest fires occurred in Galicia, Spain.The occurrence of forest fires large- ·ly depends on specific weather con-ditions. The Fire Weather Index as calculated by the European Commission is based on meteoro-logical data and can provide reli-able information on actual fire risk in different areas of Europe.
Fire risk can be calculated based on weather dataThrough the Fire Danger Forecast module of EFFIS the fire risk level is continuously analyzed and mapped. The Fire Weather Index (FWI) is used as fire risk indicator (see Fig. 3-23).
Satellite images are an important basis for the analysis of the forest fire situationThe mapping of fire burned for-est areas in Europe is carried out through the analysis of satellite im-ages (MODIS). This Rapid Damage Assessment corresponds only to the burnt areas of 50 ha or larger. Official statistics on the total burnt area and the number of fires, based on field in-formation, are released annually by Member States and are compiled in the fire reports published by the Joint Research Centre.
Spain had the largest area affected by forest firesThe European Forest Fire Information System (EFFIS) has been developed at the Joint Research Centre and pro-vides up to date information on the
forest fire situation in Europe. The 2006 summer fire season was char-acterized by average fire danger con-ditions in the Mediterranean region with localized high fire danger con-ditions during the month of August in North-west Spain and Northern Portugal. This resulted in a large num-ber of fires that led to an unusual large burned area in the region of Galicia, Spain. In Central and Northern Europe there were quite a few unusu-al periods of fire danger that led, for example, to an increase in the num-ber of fires in Norway and to excep-tionally large fires in Sweden (see Fig. 3-24).
Further information:http://effis.jrc.it/
Figure 3-23: Fire Weather Index (FWI) for Europe on the 8 of August 2006 as calculated by the European Forest Fire Information System of the Joint Research Centre. In 2006, the risk indicator correlated closely with the regions where fires actually occurred.
Slovenia
Croatia
Bulgaria
France
Sweden
Italy
Turkey
Greece
Portugal
Spain
106.5
50.2
10.58.57.12.31.61.51.00.5
Satellite image with visible burned areas showing the situation in Galicia, Spain by the 21 August 2006.
Figure 3-24: Burnt forest area in a number of countries in summer 2006 as mapped by the use of satellite images.
Fire Danger (1 day(s) forecast2006.08.08.)
Very low risk Low risk Moderate risk High risk Very high risk
120
100
80
60
40
20
0
area burnt (1.000 ha)
22

82
40
7482
4142
3.5 Insects and fungi are important factors influencing tree condition
SummaryA new system involving a more de- ·tailed assessment of influences on tree condition has been successfully implemented in the last two years.Oak and beech had the highest pro- ·portion of trees with damage symp-toms and had the highest mean defo-liation scores. Insects and fungi were the most commonly reported causes.When time series become longer the ·data will not only be an important basis for the interpretation of tree health but will contribute species in-formation to the ongoing biodiver-sity discussions, and will reflect eco-system reactions to climate change.
In addition to defoliation, many oth-er symptoms like discolouration of leaves, dead branches or stem wounds can provide information on tree health and vitality. Knowledge about their occurrence is essential for the study of cause-effect mechanisms. From the start of the ICP Forests, monitoring programme information
on the presence or absence of eight easily identifiable damage causes has been collected on Level I plots. In 2004, a new method for the assess-ment of damage causes was imple-mented, allowing for more detailed information to be collected.
Oak and beech trees had highest shares of trees with damage symptomsData from 2006 were evaluated from 80 093 trees on 4 464 Level I plots lo-cated in 19 countries. Oak and beech trees had the highest share of trees with observed symptoms (see Fig. 3-25). Defoliators were important for these symptoms in both tree species. This helps to explain the mean defo-liation values of these species which are higher than those of the conifers (see Fig. 2-2). For around half of the assessed symptoms damage causes could be identified. Insects and abi-otic factors like drought, snow and storm constituted the largest shares of observed damage causes (see Fig.
3-26). For oak species it is well known that a large number of insects natu-rally live and depend on them. Thus, the information on factors influenc-ing tree condition also reflects as-pects of biodiversity and the observed symptoms are not exclusively inter-preted as damage.
Baseline data for tree health, biodiversity and climate change aspectsThe new system of damage cause as-sessments has been successfully imple-mented and first evaluations have be-gun. Results so far indicate that only a few symptoms are common and their relative importance varies between tree species. Keeping records of dam-age symptoms and causal factors over the years will provide baseline data for quantifying their influence on tree health as well as their role in stand dynamics. The system will also con-tribute knowledge on aspects of bio-diversity and on reactions of forest ecosystems to climate change.
Stemrust infestation on a Scots pine tree.
Figure 3-25: Percentage of trees with recorded symptoms. Oak species and beech had the highest shares of trees with reported damage causes.
Larvae of the oak splendour beetle (Agrilus biguttatus) feeding on the wood beneath the bark of European oak.
Drought symptoms on holm oak in Spain.
Figure 3-26: Percentage of observed damage causes. Insects, fungi and weather influen-ces were most frequent.
insects
fungigame, grazin
gdrought, s
now, storm fire
direct actio
n of men
air pollutants
othersunidentifi
ed
100
80
60
40
20
0Scots pine
% of trees
Norway spruce European oak holm oak beech birch
35
30
25
20
15
10
5
0
drought decay &root rot canker borers defoliators other
% of observations
23

DeadwoodThe occurrence of deadwood is re-garded as a key parameter for forest biodiversity as it provides nutrition and habitats for many species, spe-cifically for insects, fungi, mosses and lichens. Its presence or absence is strongly related to forest manage-ment and timber harvesting.
Stand structureStructurally diverse forest stands contain more vertical tree and shrub layers and show a more ran-dom horizontal distribution tree pattern. It is assumed that a great-er range of habitat types is associat-ed with such stands. For example, a close relationship has been shown between forest stand structure and the occurrence of bird species.
Epiphytic lichensEpiphytic lichens grow on the bark of trees. Lichens are long-living or-ganisms with a high sensibility to environmental influences including air pollution. Lichen occurrence has been shown to depend on specific climatic parameters and on stand structure.
Ground vegetationMany plants depend on specific soils and site types. Plant species composition can be related to envi-ronmental conditions. Ground veg-etation assessments have been con-ducted since the beginning of the Intensive Monitoring Programme.
Indicators for BiodiversityBiological diversity is assessed by means of a number of indicators, as it is practically impossible to assess the diversity of all living organisms.
4. Biological diversity is under observation
SummaryCommunicating about European ·forests has to embrace the large di-versity of forest types across the con-tinent. A new forest type classifica-tion proved to be very valuable in this context.Forest type and site factors strongly ·determine the species richness of for-est vegetation. Stand structure and forest management also influence the occurrence of epiphytic lichens and to a lesser extent the plants in the herb layer.High loads of sulphur and nitrogen ·deposition are man-made impacts related to low diversity of herbs and epiphytic lichens on nearly 100 plots across Europe. However, this may at least be partly due to naturally low species numbers in beech and plan-tation forests located in areas with high deposition. Within the BioSoil demonstration ·project, large scale representative forest biodiversity information is presently collected on over 4 000 Level I plots.
Assessments of biodiversity gain importanceIn 2002, the environment ministers of Europe declared a halt to the loss of biodiversity by 2010. This ambitious
Deadwood in a central European lowland beech forest. Structured maritime pine stand with species rich shrub and herb layer in the Mediterranean region.
aim clearly needs to be supported by representative and reliable informa-tion on the biological state of forests in Europe. Within the European forest monitoring programme, some indica-tors related to biological diversity, such
as tree species and ground vegetation, have been assessed from its inception. With co-financing from the European Commission under the Forest Focus Regulation, a specific biodiversity test phase was completed on 96 Intensive
24

Monitoring Plots (ForestBIOTA). A re-lated demonstration project (BioSoil) on Level I plots was started in 2006. The application of a new forest type classification was an important basis for the evaluations (see Fig. 4-1).
Above all: a diversity in forest typesA regional perspective is essential in understanding, evaluating and report-ing indicators of sustainable forest management. Intensive monitoring
plots were thus assigned to a new for-est type classification proposed by the European Environment Agency (see Figs. 1-1 and 4-1). Means per forest type were calculated for a number of indices. As expected, results showed
Forest type Number of plots (varying per survey)
Tree species per plot
Soil pH
Plant acidity index*
Plant nitrogen index*
Plant temp. index*
Critical Load Exceed. nitrogen (molc.ha-1.a-1)
Deposition NH4 ** (kg.ha-1.a-1)
Deposition NO3 ** (kg.ha-1.a-1)
Boreal 17-136 2.1 3.6 2.8 2.8 4.0 0.01 0.7 0.8
Hemiboreal/ nemoral conif. and mixed
30-190 2.2 3.4 3.4 3.9 5.0 729.5 5.1 5.3
Alpine coniferous 34-196 3.1 3.8 4.6 4.6 4.4 439.0 5.5 6.3
Acid. oak 9-59 3.2 3.5 4.2 4.4 5.3 682.8 5.2 3.8
Mesophyt. deciduous
13-97 4.5 3.9 5.6 5.1 5.3 410.6 8.1 5.9
Beech 29-152 2.9 4.0 5.0 5.2 5.1 216.3 6.8 6.9
Montane beech 9-84 2.9 4.2 5.3 5.3 4.9 237.0 6.8 7.4
Thermoph. deciduous
13-29 2.1 5.3 6.3 4.6 6.0 - -
Broadleav. evergreen
21-32 2.3 5.2 5.7 3.6 6.3 - -
Mediterran. coniferous
7-30 1.3 5.4 5.8 3.5 6.2 196.4 2.7 5.7
Plantations 23-129 1.7 3.6 3.5 3.9 5.3 592.2 6.4 5.4
Table 4-1: Means of selected key parameters per forest type, calculated for intensive monitoring plots. Shaded boxes indicate higher values. All parameters differ significantly between forest types. A regional perspective is essential for monitoring and reporting for sustainable forest management.
* Mean Ellenberg indicator ** sum of throughfall and stemflow
Lichen species Hypogamnia physodes. Autumn colouring of bilberry shrubs in a typical combination with ground occurring li-chens in Scandinavia.
25
For herbs, this effect may at least partly be due to naturally low species numbers in beech forests and planta-tions which are located in areas with high inputs of atmospheric ammoni-um. Additional influences, like natu-ral and anthropogenic disturbances, were not the subject of the present study (see Tab. 4-2).
Large scale representative biodiversity information is presently collectedThe results presented above are based on around 100 selected inten-sive monitoring plots. Until recently, there has been no large scale moni-toring system of forests biodiversity in Europe. However, the Level I sur-vey platform of the monitoring pro-gramme represents an ideal oppor-tunity to measure and describe forest biodiversity at stand level and to col-lect harmonised information relevant to forest biodiversity at the European level. The so-called BioSoil initiative, co-financed under Forest Focus, aims
to assess and demonstrate the effica-cy of the systematic Level I network as a representative tool of European forest biodiversity monitoring. The BioSoil project also aims to support both international and national pol-icy on forest biodiversity by testing selected internationally recognised, robust and practical biodiversity in-dicators on a large scale survey, and to develop a practical methodolo-gy in a manual. Another important aim of the project is to establish an improved common baseline frame-work to integrate other information and the ongoing projects (including the soil initiative of BioSoil) on forest biodiversity in order to achieve maxi-mum added value.
The project was conducted over the 2006 and 2007 summers. Characterisation and monitoring in-cludes general plot design and de-scription, forest category classifica-tion and verification of actual forest type, structural forest diversity (tree diameters, species composition of all
significant differences in plant species composition, soil properties and crit-ical load exceedances across Europe (see Tab. 4-1). Boreal forests are lo-cated in the north of Europe. Here, plant species and measured soil pH indicate a naturally more acidic soil. Deposition and exceedance of criti-cal loads are low in this area. Beech forests are mostly located in central Europe. Nitrogen inputs are among the highest in this forest type. In ever-green broadleaved forests located in Mediterranean areas, soils are less acidic and plants are adapted to high-er temperatures.
The occurrence of mosses, herbs and lichens naturally differs in forests across EuropeHerb species, lichens and mosses con-stitute an important part of the bio-logical diversity in many forest types. In depth assessments were therefore carried out in the ForestBIOTA proj-ect. In boreal forests mosses and li-chens usually dominate the ground vegetation. Ground vegetation of low-land beech forests is naturally species poor. Large numbers of epiphytic li-chens are typical for montane beech plots. Alpine and Mediterranean plots showed highest numbers of herb spe-cies (see Fig 4-2).
Epiphytic lichens are more sensitive to stand structure then ground vegetationCompared to geographical and oth-er site factors, stand structure, and thus forest management, had less influence on the richness of the ob-served species groups at all. Diversity of the moss layer was not related to stand structure at the European scale. For herbs, higher species numbers were observed in stands with more tree layers. Large numbers of epi-phytic lichen species were observed in stands with a greater tree density and with a clumped and irregular tree distribution. This suggests that they are more sensitive to stand structure than ground vegetation. Deposition of both ammonium and sulphate was negatively related to the number of herb species and epiphytic lichens.
Figure 4-1: Level II plots classified according to forest types.
Forest types
Boreal
Hemiboreal/nemoral conif. and mixed
Alpine coniferous
Acid. oak
Mesophyt. deciduous
Beech
Montane beech
Thermoph. deciduous
Broadleav. evergreen
Mediterran. coniferous
Floodplain
Alder, birch, aspen
Plantations
not yet classified
Azores (Portugal) Canary Islands (Spain) Cyprus
26

Moss layer Herbs and shrubs Epiphytic lichens
Species number
Evenness Species number
Evenness Species number
Evenness
Geographic location
North/South gradient (°latitude)
++ -- -- --
East/West gradient (°longitude)
Altitude (m a.s.l.) ++ ++ ++
Site Soil pH (organic layer) -- ++ ++ ++
Stand structure
Number of tree layers ++
Number of trees per ha. ++
Area covered by tree stems (basal area)
--
Regularity of horizontal tree distribution (mean contagion)
++ ++
stand age
Density of tree crowns (canopy closure)
Atmosph deposition
Ammonium (NH4-N) -- --
Nitrate (NO3-N)
Sulphur (SO4-S) -- --
Table 4-2: Correlations between species diversity and different environmental and stand structural parameters (-- significant negative correlation; ++ significant positive correlation). On the European scale, geographic and site factors show more relations to species richness than stand structures. Epiphytic lichens were most sensitive to the evaluated environmental factors. Evenness describes whether a few species are dominant or whether species occur with similar frequencies.
Figure 4-2: Number of species on plots in different for-est types (in brackets: number of plots). Ground vegeta-tion was mostly sampled on areas of 400m2, epiphytic li-chens on 12 randomly selected trees. Different numbers of moss, herb and lichen species are typical for different for-est types.
woody plants, canopy closure, tree layering, and deadwood) and com-positional forest diversity as a vascu-lar plant species list. Twenty one EU countries are carrying out field as-sessments on more than 4 000 Level I plots. First results of a forest categor-isation based on the complete trans-national data set are available (see Fig 1-1). The data will be submitted to the Joint Research Centre and after vali-dation will be entered into the Forest Focus database.
Moss layer Herbs and shrubs Epiphytic lichens
0 5 10 15 20 25 30 35 40speciesnumber
Boreal (8)
Beech(14)
Montane beech (6)
Mesophyt. deciduous (5)
Acid. oak (4)
Fir / spruce (13)
Scots pine (4)
Plantations (5)
Alpine coniferous (3)
Mediterran. coniferous (3)
Broadleav. evergreen (7)
27
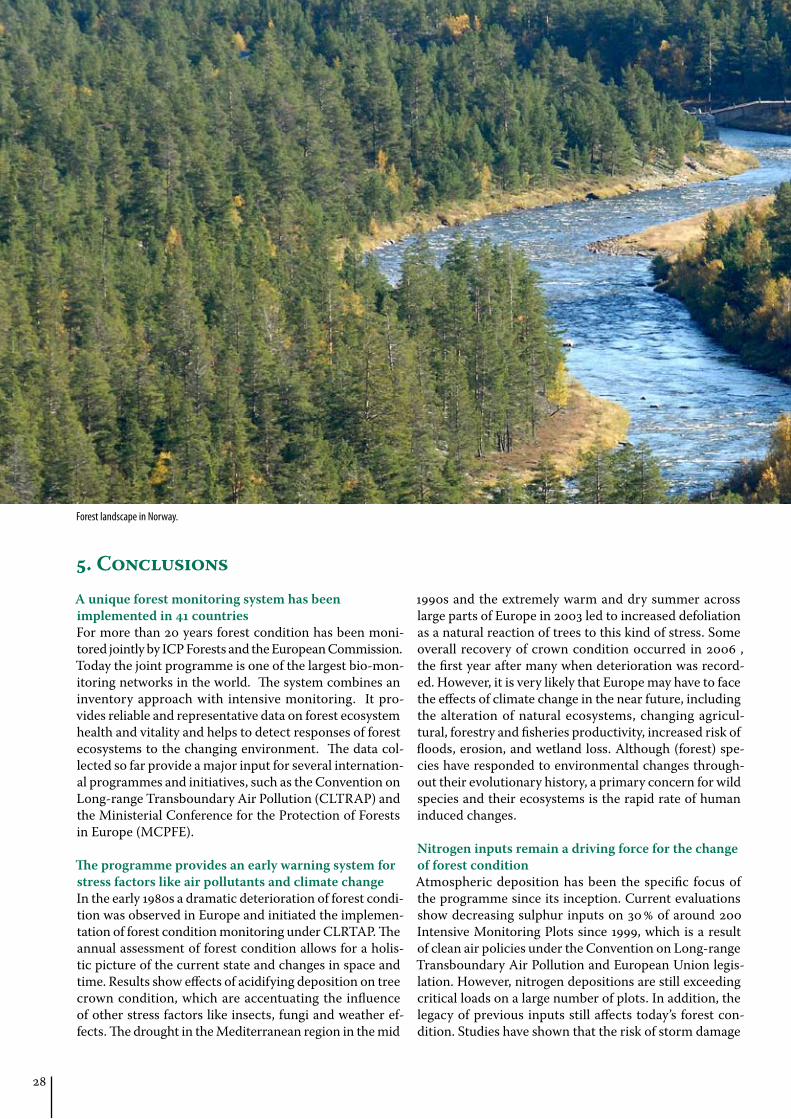
A unique forest monitoring system has been implemented in 41 countriesFor more than 20 years forest condition has been moni-tored jointly by ICP Forests and the European Commission. Today the joint programme is one of the largest bio-mon-itoring networks in the world. The system combines an inventory approach with intensive monitoring. It pro-vides reliable and representative data on forest ecosystem health and vitality and helps to detect responses of forest ecosystems to the changing environment. The data col-lected so far provide a major input for several internation-al programmes and initiatives, such as the Convention on Long-range Transboundary Air Pollution (CLTRAP) and the Ministerial Conference for the Protection of Forests in Europe (MCPFE).
The programme provides an early warning system for stress factors like air pollutants and climate change In the early 1980s a dramatic deterioration of forest condi-tion was observed in Europe and initiated the implemen-tation of forest condition monitoring under CLRTAP. The annual assessment of forest condition allows for a holis-tic picture of the current state and changes in space and time. Results show effects of acidifying deposition on tree crown condition, which are accentuating the influence of other stress factors like insects, fungi and weather ef-fects. The drought in the Mediterranean region in the mid
1990s and the extremely warm and dry summer across large parts of Europe in 2003 led to increased defoliation as a natural reaction of trees to this kind of stress. Some overall recovery of crown condition occurred in 2006 , the first year after many when deterioration was record-ed. However, it is very likely that Europe may have to face the effects of climate change in the near future, including the alteration of natural ecosystems, changing agricul-tural, forestry and fisheries productivity, increased risk of floods, erosion, and wetland loss. Although (forest) spe-cies have responded to environmental changes through-out their evolutionary history, a primary concern for wild species and their ecosystems is the rapid rate of human induced changes.
Nitrogen inputs remain a driving force for the change of forest conditionAtmospheric deposition has been the specific focus of the programme since its inception. Current evaluations show decreasing sulphur inputs on 30 % of around 200 Intensive Monitoring Plots since 1999, which is a result of clean air policies under the Convention on Long-range Transboundary Air Pollution and European Union legis-lation. However, nitrogen depositions are still exceeding critical loads on a large number of plots. In addition, the legacy of previous inputs still affects today’s forest con-dition. Studies have shown that the risk of storm damage
Forest landscape in Norway.
28
5. Conclusions

is increased on acidic soils. An effect of nitrogen deposi-tions on the abundance of herbal vegetation as well as on increased tree growth could be found on intensive moni-toring plots across Europe.
Biological diversity is among the most complex and challenging items to be monitoredRecently launched monitoring campaigns contribute information to policy processes under the Convention on Biological Diversity. A new forest type classifica-tion which was proposed by the European Environment Agency has been applied to Level I and Level II plots and might be considered in further reporting. Methods for the assessments of indicators such as deadwood, stand structure, ground vegetation and epiphytic lichens have been developed. Related assessments on around 4 000 Level I plots are presently ongoing within the EU-funded project “BioSoil” and constitute the first large scale monitoring approach for forest biodiversity in Europe. Relationships between stand structure and the diver-sity of species groups like epiphytic lichens, plants or mosses on the forest floor have been quantified. In or-der to facilitate the interpretation of the results an ex-pert group has started to elaborate methods for the ap-plication of the naturalness concept. Additional species groups like birds and beetles might be monitored on the programme’s plots in the future.
Cooperation remains important for the future development of the monitoring systemThe long cooperation of ICP Forests and the European Commission has enabled the implementation of a har-monized and operational monitoring system. Most coun-tries of the pan-European region participate in the pro-gramme, which became one of the main data providers for the Ministerial Conference for the Protection of Forests in Europe. Contributions to the Forest Resource Assessment, the Convention on Biological Diversity, and other interna-tional initiatives and programmes have been realised.
Currently activities are ongoing to link the Level I network with national forest inventories. A first joint workshop with the European National Forest Inventory Network (ENFIN) has been held.
Major keystones of the success of the programme are the strong national commitments, the engagement and commitment of national experts and their active involve-ment in Expert Panels and Working Groups, as well as the exemplary collaboration of ICP-Forests Programme Coordinating Centre and the European Commission ser-vices.
New challenges arising from air pollution, biodiver-sity loss and climate change effects on forests and the in-creasing importance of forests as a source for renewable resources render joint efforts necessary to maintain the programme and enhance it for future needs.
29

Participatingcountries
Forest area(× 1000 ha)
% of forest area
Grid Size (km × km)
No. of sample
plots
No. of sample
trees
Defoliation of all species by class (aggregates), national surveys
0 1 2-4Albania 1036 35.8 10x10 299 8970 44.0 45.0 11.0Andorra 17 16 x 16 3 74 18.9 58.1 23.0Austria 3878 46.2 16 x 16 135 3425 57.8 27.2 15.0Belarus 7812 37.8 16 x 16 398 9373 37.4 54.7 7.9Belgium 691 22.8 42 / 82 121 2841 33.1 49.0 17.9Bulgaria 4064 29.9 42/82/162 141 5069 17.3 45.3 37.4Croatia 2061 36.5 16 x 16 88 2108 41.6 33.6 24.8Cyprus 298 32.2 16x16 15 360 11.7 67.5 20.8Czech Republic 2630 33.4 82/162 135 5661 12.3 31.5 56.2Denmark 468 10.9 72/162 22 528 64.2 28.2 7.6Estonia 2264 49.4 16 x 16 92 2191 46.6 47.2 6.2Finland 20338 65.9 162 / 24x32 606 11506 55.3 35.1 9.6France 14591 26.6 16 x 16 498 9950 28.5 35.9 35.6Germany 11076 28.9 162 / 42 423 10327 31.8 40.6 27.6Greece 2512 19.5 no survey in 2006Hungary 1853 19.4 4 x 4 1220 28386 41.3 39.5 19.2Ireland 680 6.3 16 x 16 37 455 73.7 18.9 7.4Italy 8675 28.8 16 x 16 251 6941 30.8 38.7 30.5Latvia 2950 45.0 8 x 8 342 8116 19.4 67.2 13.4Liechtenstein 8 50.0 no survey in 2006Lithuania 2121 31.7 8x8/16x16 203 4872 15.3 72.7 12.0Luxembourg 89 34.4 no survey in 2006Rep. of Moldova 318 9.4 2x2/2x4 528 12729 44.3 28.1 27.6The Netherlands 334 9.6 16 x 16 11 230 64.0 17.0 19.0Norway 12000 37.1 32/92 1669 9004 39.8 36.9 23.3Poland 9200 29.4 16 x 16 376 7520 27.0 52.9 20.1Portugal 3234 36.4 16 x 16 Romania 6244 26.3 4 x 4 3879 97626 69.8 21.6 8.6Russian Fed. 8125 73.2 no survey in 2006Serbia 2360 16 x 16/4 x 4 130 2935 63.9 24.8 11.3Slovak Republic 1961 40.0 16 x 16 107 3975 13.9 58.0 28.1Slovenia 1099 54.2 16 x 16 45 1080 31.0 39.7 29.3Spain 11588 30.9 16 x 16 620 14880 17.2 61.2 21.6Sweden 23400 57.1 varying 4315 17326 45.6 35.0 19.4Switzerland 1186 28.7 16 x 16 48 1025 29.2 48.3 22.5Turkey 21188 27.2 no survey in 2006Ukraine 9400 15.4 16 x 16 1518 35900 68.3 25.1 6.6United Kingdom 2825 11.6 random 341 8184 26.1 48.0 25.9Total 203612 varying 18616 333567
Russian Federation: North-western and Central Euro pean parts only.Note that some differences in the level of damage across national borders may be at least partly due to differences in standards used. This restriction, however, does not affect the reliability of the trends over time.
30
Annex I: Forests and surveys and defoliation classes in European countries (2006)- Results of national surveys as submitted by National Focal Centres -

Participating countries
All species,defoliation classes 2-4
change %points
1995 1996 1997 1998 1999 2000 2001 2002 2003 2004 2005 2006 2005/2006Albania 9.8 9.9 10.1 10.2 13.1 12.2 11.1Andorra 36.1 23.0Austria 6.6 7.9 7.1 6.7 6.8 8.9 9.7 10.2 11.1 13.1 14.8 15.0 0.2Belarus 38.3 39.7 36.3 30.5 26.0 24.0 20.7 9.5 11.3 10.0 9.0 7.9 -1.1Belgium 24.5 21.2 17.4 17.0 17.7 19.0 17.9 17.8 17.3 19.4 19.9 17.9 -2.0Bulgaria 38.0 39.2 49.6 60.2 44.2 46.3 33.8 37.1 33.7 39.7 35.0 37.4 2.4Croatia 39.8 30.1 33.1 25.6 23.1 23.4 25.0 20.6 22.0 25.2 27.1 24.9 -2.2Cyprus 8.9 2.8 18.4 12.2 10.8 20.8 10.0Czech Rep. 58.5 71.9 68.6 48.8 50.4 51.7 52.1 53.4 54.4 57.3 57.1 56.2 -0.9Denmark 36.6 28.0 20.7 22.0 13.2 11.0 7.4 8.7 10.2 11.8 9.4 7.6 -1.8Estonia 13.6 14.2 11.2 8.7 8.7 7.4 8.5 7.6 7.6 5.3 5.4 6.2 0.8Finland 13.3 13.2 12.2 11.8 11.4 11.6 11.0 11.5 10.7 9.8 8.8 9.7 0.9France 12.5 17.8 25.2 23.3 19.7 18.3 20.3 21.9 28.4 31.7 34.2 35.6 1.4Germany 22.1 20.3 19.8 21.0 21.7 23.0 21.9 21.4 22.5 31.4 28.5 27.6 -0.9Greece 25.1 23.9 23.7 21.7 16.6 18.2 21.7 20.9 16.3 Hungary 20.0 19.2 19.4 19.0 18.2 20.8 21.2 21.2 22.5 21.5 21.0 19.2 -1.8Ireland 26.3 13.0 13.6 16.1 13.0 14.6 17.4 20.7 13.9 17.4 16.2 7.4 -8.8Italy 18.9 29.9 35.8 35.9 35.3 34.4 38.4 37.3 37.6 35.9 32.9 30.5 -2.4Latvia 20.0 21.2 19.2 16.6 18.9 20.7 15.6 13.8 12.5 12.5 13.1 13.4 0.3Liechtenstein Lithuania 24.9 12.6 14.5 15.7 11.6 13.9 11.7 12.8 14.7 13.9 11.0 12.0 1.0Luxembourg 38.3 37.5 29.9 25.3 19.2 23.4 Rep. of Moldova 40.4 41.2 29.1 36.9 42.5 42.4 34.0 26.5 27.6 1.1The Netherlands 32.0 34.1 34.6 31.0 12.9 21.8 19.9 21.7 18.0 27.5 30.2 19.5 -10.7Norway 28.8 29.4 30.7 30.6 28.6 24.3 27.2 25.5 22.9 20.7 21.6 23.3 1.7Poland 52.6 39.7 36.6 34.6 30.6 32.0 30.6 32.7 34.7 34.6 30.7 20.1 -10.6Portugal 9.1 7.3 8.3 10.2 11.1 10.3 10.1 9.6 13.0 16.6 24.3 Romania 21.2 16.9 15.6 12.3 12.7 14.3 13.3 13.5 12.6 11.7 8.1 8.6 0.5Russian Fed. 12.5 9.8 10.9 Serbia 3.6 7.7 8.4 11.2 8.4 14.0 3.9 22.8 14.3 16.4 11.3 -5.1Slovak Rep. 42.6 34.0 31.0 32.5 27.8 23.5 31.7 24.8 31.4 26.7 22.9 28.1 5.2Slovenia 24.7 19.0 25.7 27.6 29.1 24.8 28.9 28.1 27.5 29.3 30.6 29.4 -1.2Spain 23.5 19.4 13.7 13.6 12.9 13.8 13.0 16.4 16.6 15.0 21.3 21.5 0.2Sweden 14.2 17.4 14.9 14.2 13.2 13.7 17.5 16.8 19.2 16.5 18.4 19.4 1.0Switzerland 24.6 20.8 16.9 19.1 19.0 29.4 18.2 18.6 14.9 29.1 28.1 22.6 -5.5Turkey Ukraine 29.6 46.0 31.4 51.5 56.2 60.7 39.6 27.7 27.0 29.9 8.7 6.6 -2.1United Kingdom 13.6 14.3 19.0 21.1 21.4 21.6 21.1 27.3 24.7 26.5 24.8 25.9 1.1
Austria: From 2003 on, results are based on the 16×16 km transnational gridnet and must not be compared with previous years. Czech Republic: Only trees older than 60 years assessed until 1997. France: Due to method-ological changes, only the time series 1997-2006 are consistent. Italy: Due to methodological changes, only the time series 1995-96 and 1997-2006 are consistent, but not comparable to each other. Russian Federation: North-
western and Central European parts only. Ukraine: Due to a denser gridnet since 2005, results must not be compared with previous years.Note that some differences in the level of damage across national borders may be at least partly due to differences in standards used. This restriction, however, does not affect the reliability of the trends over time.
31
Annex II: Defoliation of all species (1994-2006)
- Results of national surveys as submitted by National Focal Centres -

For further information also contact:Federal Research Centre for Forestry and Forest ProductsPCC of ICP ForestsAttention: Dr. M. Lorenz, R. FischerLeuschnerstr. 91D-21031 HAMBURGGermany
Internet:http://www.icp-forests.orghttp://ec.europa.eu/environment/index_en.htmhttp://forest.jrc.it
Countryal
l
Cro
wn
cond
itio
n
Soil
Folia
r
Gro
wth
Dep
ositi
on
Met
eoro
l.
Soil
solu
tion
Gro
und
vege
tati
on
Phen
olog
y
Litt
erfa
ll
Ozo
ne
inju
ry
Air
qua
lity
Austria 20 20 20 20 20 20 2 2 20 Belgium 21 21 20 21 20 10 6 8 20 1 * Bulgaria 3 3 3 3 3 3 1 3 3Croatia 7 7 7 7 7 1 Cyprus 4 4 2 2 4 1Czech Republic 21 14 11 14 12 11 2 3 15 Denmark 22 22 16 20 15 18 4 22 15 8 5Estonia 8 8 7 8 8 6 2 7 Finland 31 31 31 31 31 24 12 16 32 France 100 100 100 100 100 25 25 15 99 89 94 16 25Germany 95 95 87 92 91 92 75 83 85 *Greece 4 4 4 4 3 4 4 2 4 2 1Hungary 15 14 14 15 14 15 11 15 * 9 Ireland 16 15 15 15 15 4 9 4 9 Italy 29 27 20 26 24 28 16 2 19 15 4 29Latvia 3 3 1 1 3 1 1 3 1 Lithuania 9 9 9 9 1 1 9 1 9 2Luxembourg 2 2 2 2 2 1 2 2 2 2 2Netherlands 14 14 14 14 14 14 14 14 Norway 19 19 17 19 19 19 2 19 12 Poland 150 150 150 148 148 150 148 Portugal 13 13 4 13 12 2 12 Romania 13 13 11 13 4 7 4 4 Russia 12 12 Slovak Republic 9 9 8 9 9 9 8 Slovenia 11 11 5 11 2 11 11 Spain 58 58 53 58 56 14 13 2 53 13 * 12 13Sweden 100 100 100 99 100 51 10 48 98 Switzerland 16 16 16 16 16 14 16 8 16 16 *United Kingdom 20 20 10 20 20 10 2 7 20 14 19 845 822 742 795 781 558 227 262 757 145 114 81 100
Note: Table shows total numbers of plots with data sub-mitted, irrespective year of data submission. Data base in-cludes abandoned plots as well.
*This survey is measured in this country but data are still undergoing validation. Some country totals may increase if they have recently set up surveys in new plots - the lat-est survey may still be undergoing validation.
Air quality counts plots with passive samplers and active stations separately. Where there is an active plot at the same place it is not counted again.Denmark and Bulgaria have only active samplers in the validated database.
32
Annex III: Numbers of Intensive Monitoring Plots in the Forest Focus / ICP Forests data base

Albania: Ministry of the Environment, Dep. of Biodiversity and Natural Resources Management, e-mail: [email protected], Rruga e Durresit Nr. 27, Tirana.
Andorra: Ministry of Agriculture and Environment, Environmental Department, Ms Anna Moles / Ms. Silvia Ferrer, e-mail: [email protected], C. Prat de la Creu, 62-64, Andorra la Vella
Austria: Bundesforschungs – und Ausbildungszentrum für Wald, Naturgefahren und Landschaft, Mr. Ferdinand Kristöfel, e-mail: [email protected], Seckendorff-Gudent-Weg 8, A-1131 Wien.
Belarus: Forest Inventory republican unitary company “Belgosles”, Mr. V. Kastsiukevich, e-mail: [email protected], 27, Zheleznodorozhnaja St., 220089 Minsk.
Belgium: Flanders, Research Institute for Nature and Forest, Mr. Peter Roskams, e-mail: [email protected], Gaverstraat 4, B-9500 Geraardsbergen.Wallonia, Ministère de la Région Wallonne, Div. de la Nature et des Forêts, Mr. C. Laurent, e-mail: [email protected], Avenue Prince de Liège, 15, B-5000 Namur.
Bulgaria: Ministry of Environment and Waters, Ms. Penka Stoichkova, e-mail: [email protected], 136, Tzar Boris III blvd., BG-1618 Sofia.
Canada: Natural Resources Canada, Ms Brend McAfee, e-mail: [email protected], 580 Booth Street – 7th Floor, CDN-Ottawa, ONT K1A 0E4. Quebec: Ministère des Ressources naturelles, Mr. Rock Ouimet, e-mail: [email protected], 2700, Einstein, CDN STE. FOY - Quebec G1P 3W8.
Croatia: Sumarski Institut, Mr. Joso Gracan, e-mail: josog@ sumins.hr, Cvjetno Naselje 41, 10450 Jastrebarsko.
Cyprus: Ministry of Agriculture, Natural Resources and Environment, Mr. Andreas K. Christou, e-mail: [email protected], CY-1414-Nikosia.
Czech Republic: Forestry and Game Management Research Institute (VULHM, v.v.i), Mr Bohumir Lomsky, e-mail: [email protected], Strnady 136, CZ-25202 Jiloviště.
Denmark: Centre of Forest Landscape and Planning, Mr. Lars Vesterdal, e-mail: [email protected], Hørsholm Kongevej 11, DK-2970 Hørsholm.
Estonia: Estonian Centre for Forest Protection and Silviculture, Mr. Kalle Karoles, [email protected], Rôômu tee 2, EE-51013 Tartu.
Finland: Finnish Forest Research Institute, Mr. John Derome, e-mail: [email protected], Rovaniemi Research Station, Eteläranta 55, FIN-96300 Rovaniemi.
France: Ministère de l’agriculture et de la pêche, Mr. Jean Luc Flot, e-mail: [email protected], 19, avenue du Maine, F-75732 Paris Cedex 15.
Germany: Bundesministerium für Ernährung, Landwirtschaft und Verbraucherschutz – Ref. 533, Ms Sigrid Strich, e-mail: [email protected], Postfach 140270, D-53107 Bonn.
Greece: Institute of Mediterranean Forest Ecosystems, Mr. George Baloutsos, Mr. Anastasios Economou, e-mail: [email protected], Terma Alkmanos, GR-11528 Athens-Ilissia.
Hungary: State Forest Service, Mr. Andras Szepesi, e-mail: [email protected], Széchenyi u. 14, H-1054 Budapest 5.
Ireland: Coillte Teoranta, Research and Development, Mr. Pat Neville, e-mail: [email protected], Newtownmountkennedy, IRL- CO. Wicklow.
Italy:Corpo Forestale dello Stato, CONECOFOR Office, Mr. Bruno Petriccione, e-mail: [email protected], via Carducci 5, I-00187 Roma.
Latvia: State Forest Service of Latvia, Ms Ieva Zadeika, e-mail: [email protected], 13. Janvara iela 15, LV-1932 Riga.
Liechtenstein: Amt für Wald, Natur und Landschaft, Mr. Felix Näscher, e-mail: [email protected], Dr. Grass-Strasse 10, FL-9490 Vaduz.
Lithuania: State Forest Survey Service, Mr. Andrius Kuliesis, e-mail: [email protected], Pramones ave. 11a, LT-3031 Kaunas.
Luxembourg: Administration des Eaux et Forêts, Claude Parini, e-mail: [email protected], 16, rue Eugène Ruppert, L-2453 Luxembourg-Ville (Cloche d’Or).
Moldova: State Forest Agency, Mr. Anatolie Popusoi, e-mail: [email protected], 124 bd. Stefan Cel Mare, MD-2012 Chisinau.
The Netherlands: Ministry of Agriculture, Nature and Food Quality, Mr. Gerald Grimberg, e-mail: [email protected], P.O. Box 482, NL-6710 BL Ede.
Norway: Norwegian Forest and Landscape Institute, Mr. Dan Aamlid, e-mail: [email protected], P.O. Box 115, N-1431 Ås.
Poland: Forest Research Institute, Mr. Jerzy Wawrzoniak, e-mail: [email protected], Bitwy Warszawskiej 1920 nr. 3, PL-00973 Warszawa.
Portugal: Ministerio da Agricultura, Desenvolvimento Rural e Pescas, Direcçao Geral dos Recursos Florestais, Ms Maria Barros, e-mail: [email protected], Av. Joao Crisostomo 28-6°, P-1069-040 Lisboa.
Former Yugoslav Republic of Macedonia: University “St. Kiril and Mtodij”, Mr. Nikola Nikolov, e-mail: [email protected], Aleksander Makedonski Boulevard, Skopje.
Romania: Forest Research and Management Institute, Mr. Romica Tomescu/ Mr. Ovidiu Badea, e-mail: [email protected], Sos. Stefanesti nr. 128 sector 2, RO-72904 Bukarest.
Russian Federation: Centre for Forest Ecology and Productivity, RAS, Ms Natalia Lukina, e-mail: [email protected] , Profsouznaya st., 84/32, 117997 Moscow.
Serbia: Institute for Forestry, Mr. Radovan Nevenic, e-mail: [email protected], Kneza Viseslava Street 3, YU-11000 Novi-Beograd.
Slovak Republic: National Forest Centre, Mr. Pavel Pavlenda, e-mail: [email protected], T.G. Masaryka 22, SK-96092 Zvolen.
Slovenia: Gozdarski Institut Slovenije, Ms Nike Krajnc, e-mail: [email protected], Vecna pot 2, SLO-1000 Ljubljana.
Spain: Dirección General para la Biodiversidad, Mr. Gerardo Sanchez, e-mail: [email protected], Gran Vía de San Francisco, 4, E-28005 Madrid.
Sweden: Swedish Forest Agency, Mr. Sture Wijk, e-mail: [email protected], Vallgatan 6, S-551 83 Jönköping.
Switzerland: Eidgenössische Forschungsanstalt für Wald, Schnee und Landschaft (WSL), Mr. Norbert Kräuchi, e-mail: [email protected], Zürcherstr. 111, CH-8903 Birmensdorf.
Turkey: General Directorate of Forestry, Orman Genel Müdürlügü, Mr. Ali Temerit, e-mail: [email protected], Gazi Tesisleri 7, Nolu Bina 3. Kat., TR-06560 Gazi-Ankara.
Ukraine: Ukrainian Research Institute of Forestry and Forest Melioration, Mr. Igor F. Buksha, e-mail: [email protected], Pushkinskaja 86, UKR-61024 Kharkiv.
United Kingdom: Forest Research Station, Alice Holt Lodge, Wrecclesham, Mr. Andrew J. Moffat, e-mail: andy.moffat@ forestry.gsi.gov.uk, UK-Farnham-Surrey GU10 4LH.
United States of America: USDA Forest Service, Pacific Southwest Research Station, Mr. Andrzej Bytnerowicz, e-mail: [email protected], 4955 Canyon Crest Drive, Riverside, CA 92507.
33
Participating countries and contacts

International Co-operative Programme on Assessment and Monitoring of Air Pollution Eff ects and Forests (ICP Forests)
� e Condition of Forests in Europe Executive Report
Prepared by: Federal Research Centre for Forestry and Forest Products (BFH)
European Comission
Waldschaden2007_Titel3.indd 3-4 22.10.2007 20:18:43