ODOUR IMPACT ASSESSMENT - NSW Environment & Heritage · A PEL Company ODOUR IMPACT ASSESSMENT...
32
A PEL Company ODOUR IMPACT ASSESSMENT PERISHER VALLEY WASTE TRANSFER STATION National Parks and Wildlife Group – NSW DECCW Job No: 5628 25 February 2011
Transcript of ODOUR IMPACT ASSESSMENT - NSW Environment & Heritage · A PEL Company ODOUR IMPACT ASSESSMENT...
A PEL Company
ODOUR IMPACT ASSESSMENT
PERISHER VALLEY WASTE TRANSFER STATION
National Parks and Wildlife Group – NSW DECCW
Job No: 5628
25 February 2011
5628_WTS_Perisher_FINAL_250211.docx ii
National Parks and Wildlife Group – NSW DECCW | PAEHolmes Job 5628
PROJECT TITLE: PERISHER VALLEY WASTE TRANSFER
STATION
JOB NUMBER: 5628
PREPARED FOR: Ryan Petrov
NATIONAL PARKS AND WILDLIFE GROUP
– NSW DECCW
PREPARED BY: K. Hill
QA PROCEDURES CHECKED BY: P. Henschke
APPROVED FOR RELEASE BY: A. Todoroski
DISCLAIMER & COPYRIGHT: This report is subject to the copyright
statement located at www.paeholmes.com ©
Queensland Environment Pty Ltd trading as
PAEHolmes ABN 86 127 101 642
DOCUMENT CONTROL
VERSION DATE PREPARED BY REVIEWED BY
DRAFT 01 23/02/11 K. Hill J. Barnett
FINAL 01 25/02/11 P. Henschke
Queensland Environment Pty Ltd trading as
PAEHolmes ABN 86 127 101 642
SYDNEY:
Suite 203, Level 2, Building D
240 Beecroft RD
Epping, NSW 2121
Ph: +61 2 9870 0900
Fax: +61 2 9870 0999
BRISBANE:
Level 1, La Melba, 59 Melbourne Street, South Brisbane, Qld 4101
PO Box 3306, South Brisbane, Qld 4101
Ph: +61 7 3004 6400
Fax: +61 7 3844 5858
ADELAIDE:
72 North Terrace, Littlehampton SA, 5250
PO Box 1230, Littlehampton SA, 5250
Ph: +61 8 8391 4032
Email: [email protected]
Website: www.paeholmes.com

5628_WTS_Perisher_FINAL_250211.docx iii
National Parks and Wildlife Group – NSW DECCW | PAEHolmes Job 5628
DISCLAIMER
PAEHolmes acts in all professional matters as a faithful advisor to the Client and exercises all
reasonable skill and care in the provision of its professional services.
Reports are commissioned by and prepared for the exclusive use of the Client. They are subject
to and issued in accordance with the agreement between the Client and PAEHolmes. PAEHolmes
is not responsible for any liability and accepts no responsibility whatsoever arising from the
misapplication or misinterpretation by third parties of the contents of its reports.
Except where expressly stated, PAEHolmes does not attempt to verify the accuracy, validity or
comprehensiveness of any information supplied to PAEHolmes for its reports.
Reports cannot be copied or reproduced in whole or part for any purpose without the prior written
agreement of PAEHolmes.
Where site inspections, testing or fieldwork have taken place, the report is based on the
information made available by the client or their nominees during the visit, visual observations
and any subsequent discussions with regulatory authorities. The validity and comprehensiveness
of supplied information has not been independently verified and, for the purposes of this report, it
is assumed that the information provided to PAEHolmes is both complete and accurate. It is
further assumed that normal activities were being undertaken at the site on the day of the site
visit(s), unless explicitly stated otherwise.
5628_WTS_Perisher_FINAL_250211.docx iv
National Parks and Wildlife Group – NSW DECCW | PAEHolmes Job 5628
TABLE OF CONTENTS
1 INTRODUCTION 1
2 PROJECT DESCRIPTION 1 2.1 Background 1 2.2 Proposed Operation 4
3 AIR QUALITY ISSUES 4 3.1 Measuring odour concentration 4 3.2 Odour criteria 5
4 CLIMATE AND METEOROLOGY 7 4.1 Climatic Conditions 7 4.2 Wind speed and direction 7 4.3 Atmospheric Stability 10
5 EMISSIONS TO AIR 10
6 APPROACH TO ASSESSMENT 11
7 MODELLING RESULTS 12
8 CONCLUSION 13
9 REFERENCES 14
APPENDIX A A-1
APPENDIX B B-1
APPENDIX C C-1
5628_WTS_Perisher_FINAL_250211.docx v
National Parks and Wildlife Group – NSW DECCW | PAEHolmes Job 5628
LIST OF TABLES
Table 3.1: Odour criteria ................................................................................................... 6
Table 4.1: Temperature, Humidity and Rainfall data for Perisher Valley Ski Centre ................... 7
Table 4.2: Summary of meteorological parameters used in this study ..................................... 8
Table 4.3: Frequency of occurrence of stability classes at Perisher Valley WTS (TAPM 2010) ... 10
Table 5.1: Summary of odour measurements from active tipping face, Eastern Creek Landfill. 10
Table 6.1: Source parameters and emission rates used for odour modelling .......................... 11
Table 7.1: Predicted odour concentrations at sensitive receptors .......................................... 12
LIST OF FIGURES
Figure 1: Location of existing site and nearest sensitive receptors .......................................... 2
Figure 2: Proposed site layout ........................................................................................... 3
Figure 3: Annual and Seasonal windroses ........................................................................... 9
Figure 4: Predicted 99th percentile nose-response average ground level odour concentrations . 13
5628_WTS_Perisher_FINAL_250211.docx 1
National Parks and Wildlife Group – NSW DECCW | PAEHolmes Job 5628
1 INTRODUCTION
This report has been prepared by PAEHolmes for the National Parks and Wildlife Service (NPWS)
of the Department of Environment, Climate Change and Water (DECCW). It presents an odour
impact assessment for the proposed Waste Transfer Station (WTS) to be constructed and
operated at Perisher Valley, NSW.
The report comprises the following components:
a description of the project;
discussion of air quality issues related to the project;
a description of the local meteorological conditions at the site;
a description of modelling parameters for proposed operations;
results of dispersion modelling; and
discussion of predicted impacts.
2 PROJECT DESCRIPTION
2.1 Background
As part of upgrades to the facilities at Perisher Valley, the NPWS will build a waste transfer
station (WTS) to replace the current waste disposal system for the surrounding villages of
Perisher Valley, Smiggin Holes and Charlotte Pass. The site will be located in the southeast
corner of the new Perisher Valley Services Precinct (see Figure 1).
The purpose of this facility is to replace the current waste disposal system of bins located
throughout the Perisher Valley, Smiggin Holes and Charlotte Pass resorts. The proposed facility
would enable a regular collection of rubbish from the surrounding businesses to be brought to
this site for sorting and transfer off-site. The proposed site is expected to accept approximately
1,500 tonnes of waste and recyclables per year.
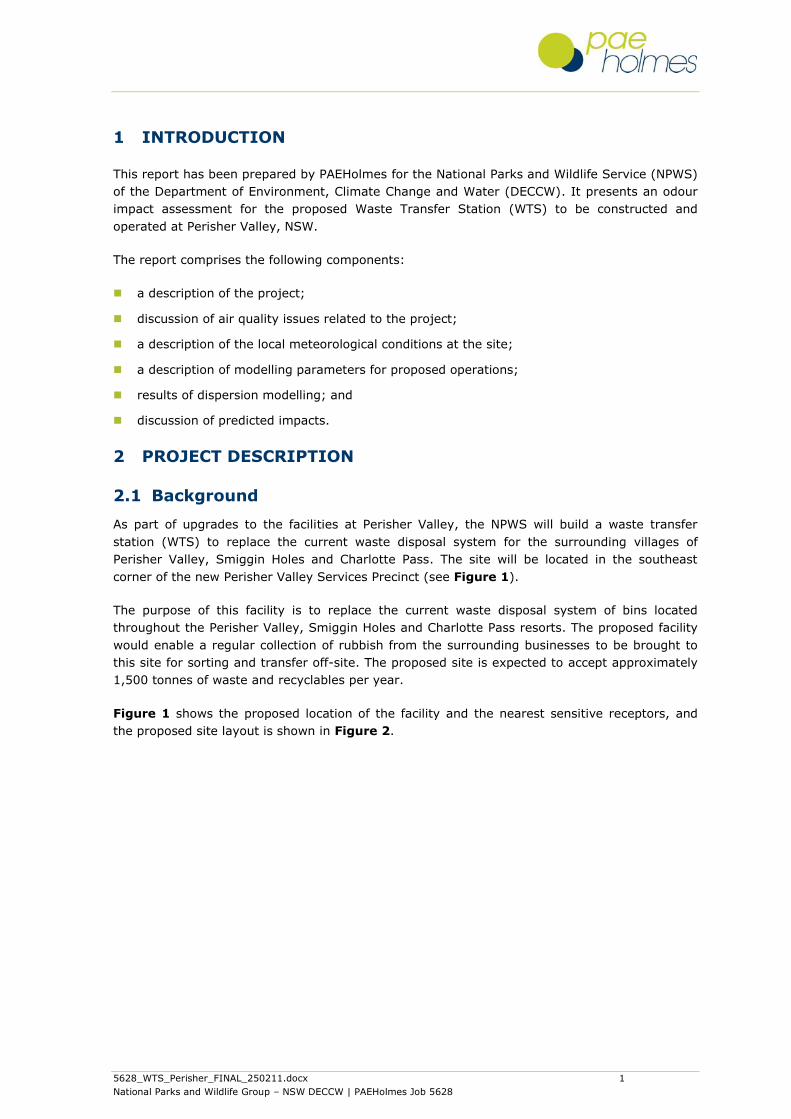
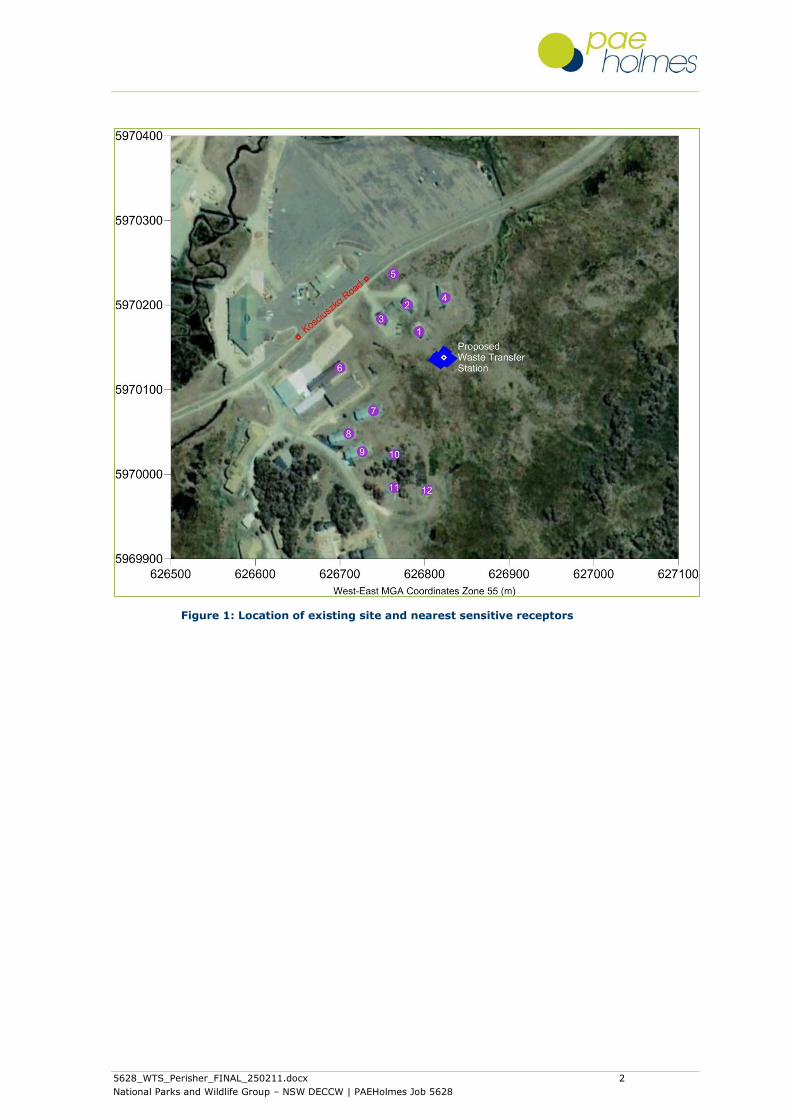
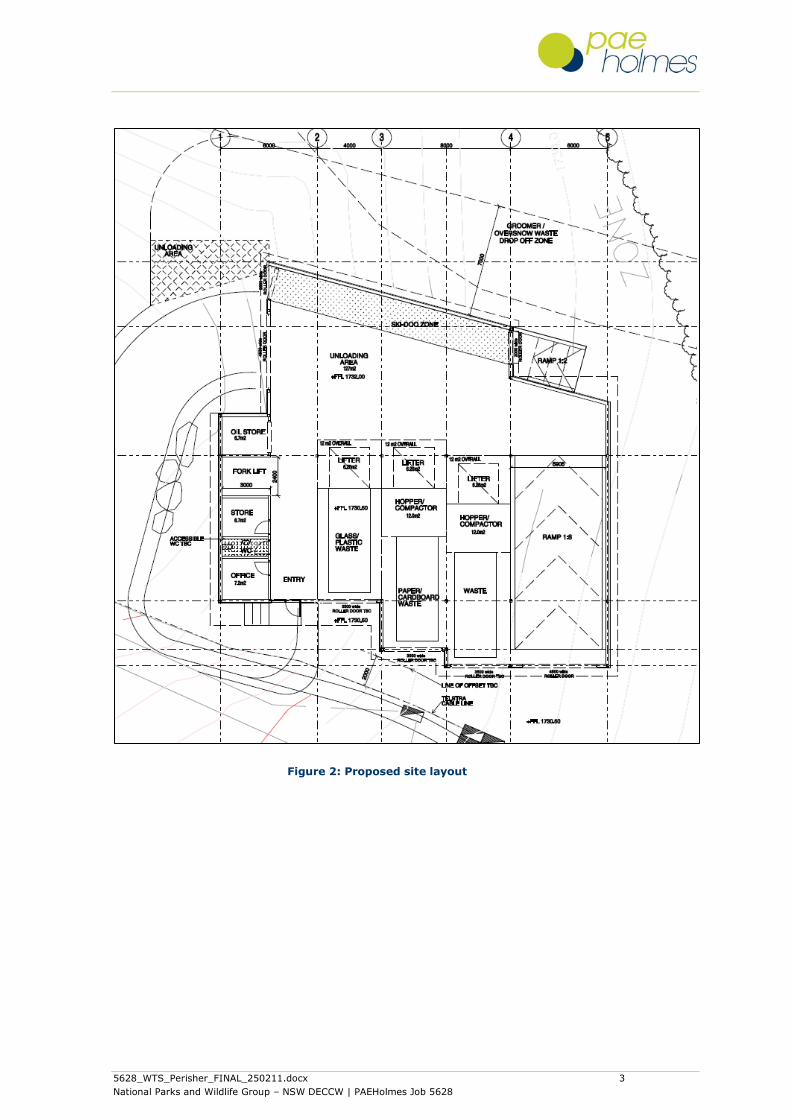
Figure 1 shows the proposed location of the facility and the nearest sensitive receptors, and
the proposed site layout is shown in Figure 2.
5628_WTS_Perisher_FINAL_250211.docx 2
National Parks and Wildlife Group – NSW DECCW | PAEHolmes Job 5628
Figure 1: Location of existing site and nearest sensitive receptors
5628_WTS_Perisher_FINAL_250211.docx 3
National Parks and Wildlife Group – NSW DECCW | PAEHolmes Job 5628
Figure 2: Proposed site layout
5628_WTS_Perisher_FINAL_250211.docx 4
National Parks and Wildlife Group – NSW DECCW | PAEHolmes Job 5628
2.2 Proposed Operation
The proposed WTS is estimated to accept up to 1,500 tonnes of waste and recyclables per year.
It is estimated there will never be more than 2,500 m3 of materials stored on-site at any one
time.
The materials received would primarily consist of putrescible waste and recycling which will be
sorted within the enclosed building. The operation will peak during the 16 week ski season from
June to October. Waste is expected to be accepted between 7:00am to 8:00am and 10:00am
to 7:00pm seven days a week, with potentially odour causing waste transferred out at least
every 2 days during peak season and up to every 20 days during off-peak.
3 AIR QUALITY ISSUES
3.1 Measuring odour concentration
There are no instrument-based methods that can measure an odour response in the same way
as the human nose. Therefore “dynamic olfactometry” is typically used as the basis of odour
management by regulatory authorities.
Dynamic olfactometry is the measurement of odour by presenting a sample of odorous air to a
panel of people with decreasing quantities of clean odour-free air. The panellists then note
when the smell becomes detectable. The correlations between the known dilution ratios and the
panellists‟ responses are then used to calculate the number of dilutions of the original sample
required to achieve the odour detection threshold. The units for odour measurement using
dynamic olfactometry are “odour units” (ou) which are dimensionless and are effectively
“dilutions to threshold”. The detectability of an odour (i.e. whether someone smells it or not) is
a sensory property that refers to the theoretical minimum concentration that produces an
olfactory response or sensation. The theoretical minimum concentration is referred to as the
“odour threshold” and is the definition of 1 odour unit (ou). Therefore, an odour concentration
of less than 1 ou would theoretically mean there is no odour.
Olfactometry can involve a “forced choice” end point where panellists identify from multiple
sniffing ports the one where odour is detected, regardless of whether they are sure they can
detect odour. There is also a “yes/no” or “free choice” endpoint where panellists are required to
say whether or not they can detect odour from one sniffing port. Forced choice olfactometry
generally detects lower odour levels than yes/no olfactometry and is the preferred method for
use in Australia.
In both cases, odorous air is presented to the panellists in increasing concentrations. For the
forced-choice method, where there are multiple ports for each panellist, the concentration is
increased until all panellists consistently distinguish the port with the sample from the blanks.
For a yes/no olfactometer (which has only one sniffing port) one method used is to increase the
concentration of odour in the sample until all panellists respond. The sample is then shut off
and once all panellists cease to respond, the sample is introduced again at random dilutions and
the panellists are asked whether they can detect the odour.
During the 1990s significant research was undertaken in Europe to refine the olfactometry
method. This led to considerable improvements in panellist management and standardisation
and, importantly, clear criteria for repeatability and reproducibility of results.
The draft Committé Européen de Normalisation (CEN) odour measurement standard (CEN,
1996) is a performance based standard with strict criteria for repeatability and reproducibility.
5628_WTS_Perisher_FINAL_250211.docx 5
National Parks and Wildlife Group – NSW DECCW | PAEHolmes Job 5628
The Australian standard (introduced in September 2001) (Standards Australia, 2001) is
based upon the CEN standard.
As with all sensory methods of identification there is variability between individuals.
Consequently the results of odour measurements depend on the way in which the panel is
selected and the way in which the panel responses are interpreted.
3.2 Odour criteria
The determination of air quality goals for odour and their use in the assessment of odour
impacts is recognised as a difficult topic in air pollution science. The topic has received
considerable attention in recent years and the procedures for assessing odour impacts using
dispersion models have been refined considerably. There is still considerable debate in the
scientific community about appropriate odour goals as determined by dispersion modelling.
The NSW Department of Environment and Climate Change and Water (DECCW) has developed
odour goals and the way in which they should be applied with dispersion models to assess the
likelihood of nuisance impact arising from the emission of odour.
There are two factors that need to be considered:
what "level of exposure" to odour is considered acceptable to meet current community
standards in NSW and
how can dispersion models be used to determine if a source of odour meets the goals which
are based on this acceptable level of exposure
The term "level of exposure" has been used to reflect the fact that odour impacts are
determined by several factors the most important of which are (the so-called FIDO factors):
the Frequency of the exposure
the Intensity of the odour
the Duration of the odour episodes and
the Offensiveness of the odour
In determining the offensiveness of an odour it needs to be recognised that for most odours the
context in which an odour is perceived is also relevant. Some odours, for example the smell of
sewage, hydrogen sulfide, butyric acid, landfill gas etc., are likely to be judged offensive
regardless of the context in which they occur. Other odours such as the smell of jet fuel may be
acceptable at an airport, but not in a house, and diesel exhaust may be acceptable near a busy
road, but not in a restaurant.
In summary, whether or not an individual considers an odour to be a nuisance will depend on the
FIDOL factors outlined above and although it is possible to derive formulae for assessing odour
annoyance in a community, the response of any individual to an odour is still unpredictable.
Odour goals need to take account of these factors.
The DECCW (formerly NSW DEC) Approved Methods (NSW DEC, 2005) include ground-level
concentration (glc) criterion for complex mixtures of odorous air pollutants. They have been
refined by the DECCW to take account of population density in the area. Table 3.1 lists the
odour glc criterion to be exceeded not more than 1% of the time, for different population
densities.
5628_WTS_Perisher_FINAL_250211.docx 6
National Parks and Wildlife Group – NSW DECCW | PAEHolmes Job 5628
The difference between odour goals is based on considerations of risk of odour impact rather
than differences in odour acceptability between urban and rural areas. For a given odour level
there will be a wide range of responses in the population exposed to the odour. In a densely
populated area there will therefore be a greater risk that some individuals within the community
will find the odour unacceptable than in a sparsely populated area.
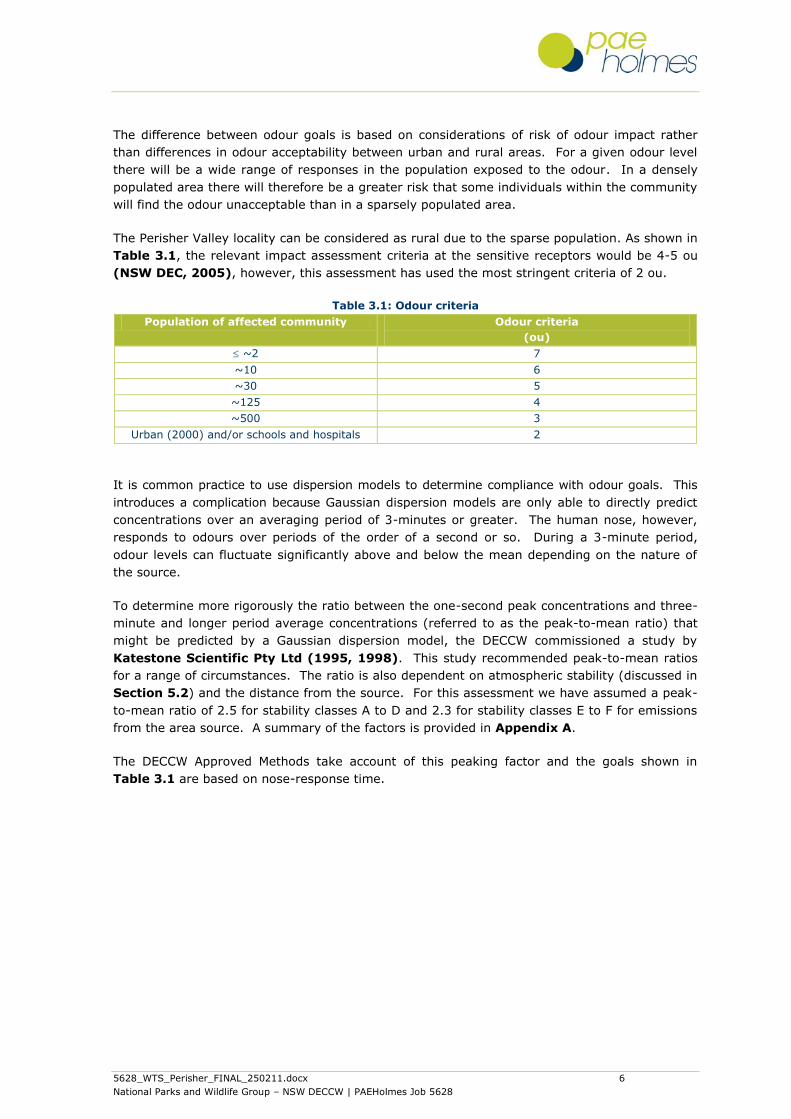
The Perisher Valley locality can be considered as rural due to the sparse population. As shown in
Table 3.1, the relevant impact assessment criteria at the sensitive receptors would be 4-5 ou
(NSW DEC, 2005), however, this assessment has used the most stringent criteria of 2 ou.
Table 3.1: Odour criteria
Population of affected community Odour criteria
(ou)
~2 7
~10 6
~30 5
~125 4
~500 3
Urban (2000) and/or schools and hospitals 2
It is common practice to use dispersion models to determine compliance with odour goals. This
introduces a complication because Gaussian dispersion models are only able to directly predict
concentrations over an averaging period of 3-minutes or greater. The human nose, however,
responds to odours over periods of the order of a second or so. During a 3-minute period,
odour levels can fluctuate significantly above and below the mean depending on the nature of
the source.
To determine more rigorously the ratio between the one-second peak concentrations and three-
minute and longer period average concentrations (referred to as the peak-to-mean ratio) that
might be predicted by a Gaussian dispersion model, the DECCW commissioned a study by
Katestone Scientific Pty Ltd (1995, 1998). This study recommended peak-to-mean ratios
for a range of circumstances. The ratio is also dependent on atmospheric stability (discussed in
Section 5.2) and the distance from the source. For this assessment we have assumed a peak-
to-mean ratio of 2.5 for stability classes A to D and 2.3 for stability classes E to F for emissions
from the area source. A summary of the factors is provided in Appendix A.
The DECCW Approved Methods take account of this peaking factor and the goals shown in
Table 3.1 are based on nose-response time.
5628_WTS_Perisher_FINAL_250211.docx 7
National Parks and Wildlife Group – NSW DECCW | PAEHolmes Job 5628
4 CLIMATE AND METEOROLOGY
This section describes the local dispersion and meteorological conditions in the study area.
Information is shown on climatic conditions, prevailing wind patterns and atmospheric stability.
4.1 Climatic Conditions
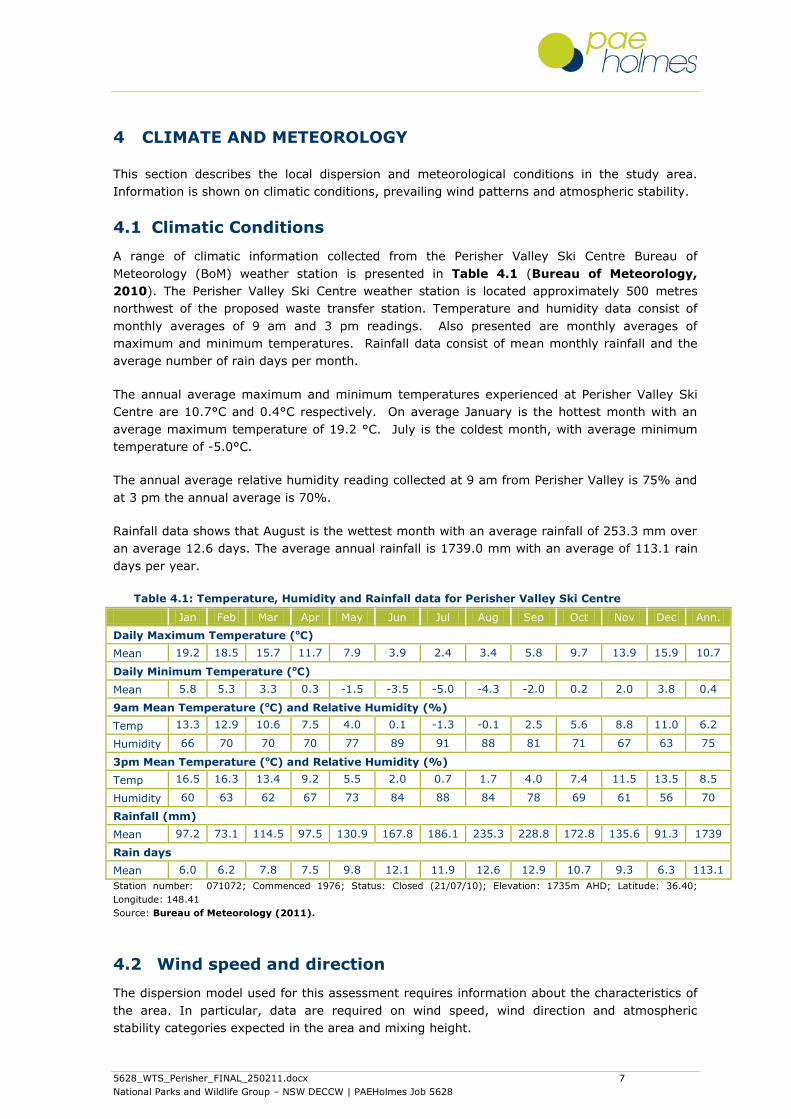
A range of climatic information collected from the Perisher Valley Ski Centre Bureau of
Meteorology (BoM) weather station is presented in Table 4.1 (Bureau of Meteorology,
2010). The Perisher Valley Ski Centre weather station is located approximately 500 metres
northwest of the proposed waste transfer station. Temperature and humidity data consist of
monthly averages of 9 am and 3 pm readings. Also presented are monthly averages of
maximum and minimum temperatures. Rainfall data consist of mean monthly rainfall and the
average number of rain days per month.
The annual average maximum and minimum temperatures experienced at Perisher Valley Ski
Centre are 10.7°C and 0.4°C respectively. On average January is the hottest month with an
average maximum temperature of 19.2 °C. July is the coldest month, with average minimum
temperature of -5.0°C.
The annual average relative humidity reading collected at 9 am from Perisher Valley is 75% and
at 3 pm the annual average is 70%.
Rainfall data shows that August is the wettest month with an average rainfall of 253.3 mm over
an average 12.6 days. The average annual rainfall is 1739.0 mm with an average of 113.1 rain
days per year.
Table 4.1: Temperature, Humidity and Rainfall data for Perisher Valley Ski Centre
Jan Feb Mar Apr May Jun Jul Aug Sep Oct Nov Dec Ann.
Daily Maximum Temperature (oC)
Mean 19.2 18.5 15.7 11.7 7.9 3.9 2.4 3.4 5.8 9.7 13.9 15.9 10.7
Daily Minimum Temperature (oC)
Mean 5.8 5.3 3.3 0.3 -1.5 -3.5 -5.0 -4.3 -2.0 0.2 2.0 3.8 0.4
9am Mean Temperature (oC) and Relative Humidity (%)
Temp 13.3 12.9 10.6 7.5 4.0 0.1 -1.3 -0.1 2.5 5.6 8.8 11.0 6.2
Humidity 66 70 70 70 77 89 91 88 81 71 67 63 75
3pm Mean Temperature (oC) and Relative Humidity (%)
Temp 16.5 16.3 13.4 9.2 5.5 2.0 0.7 1.7 4.0 7.4 11.5 13.5 8.5
Humidity 60 63 62 67 73 84 88 84 78 69 61 56 70
Rainfall (mm)
Mean 97.2 73.1 114.5 97.5 130.9 167.8 186.1 235.3 228.8 172.8 135.6 91.3 1739
Rain days
Mean 6.0 6.2 7.8 7.5 9.8 12.1 11.9 12.6 12.9 10.7 9.3 6.3 113.1
Station number: 071072; Commenced 1976; Status: Closed (21/07/10); Elevation: 1735m AHD; Latitude: 36.40;
Longitude: 148.41
Source: Bureau of Meteorology (2011).
4.2 Wind speed and direction
The dispersion model used for this assessment requires information about the characteristics of
the area. In particular, data are required on wind speed, wind direction and atmospheric
stability categories expected in the area and mixing height.
5628_WTS_Perisher_FINAL_250211.docx 8
National Parks and Wildlife Group – NSW DECCW | PAEHolmes Job 5628
Due to the unavailability of a complete year of local meteorological data, the approach taken in
this assessment was to create a set of site-specific synthetic meteorological data for the site
using The Air Pollution Model (TAPM) developed by CSIRO.
TAPM is a prognostic model which includes synoptic information determined from the six hourly
Limited Area Prediction System (LAPS) (Puri et al., 1997). The model is discussed further in
the user manual which accompanies the model (see Hurley, 1999).
A summary of the parameters used as part of the meteorological component of this study are
shown in Table 4.2.
Table 4.2: Summary of meteorological parameters used in this study
TAPM (v.4.0.4) Parameter values
Number of grids (spacing) 4 (30km, 10km, 3km, 1km)
Number of grid point 25 x 25 x 25
Year of analysis Jan 2010 to December 2010
Centre of analysis 36°44‟S 148°24‟E
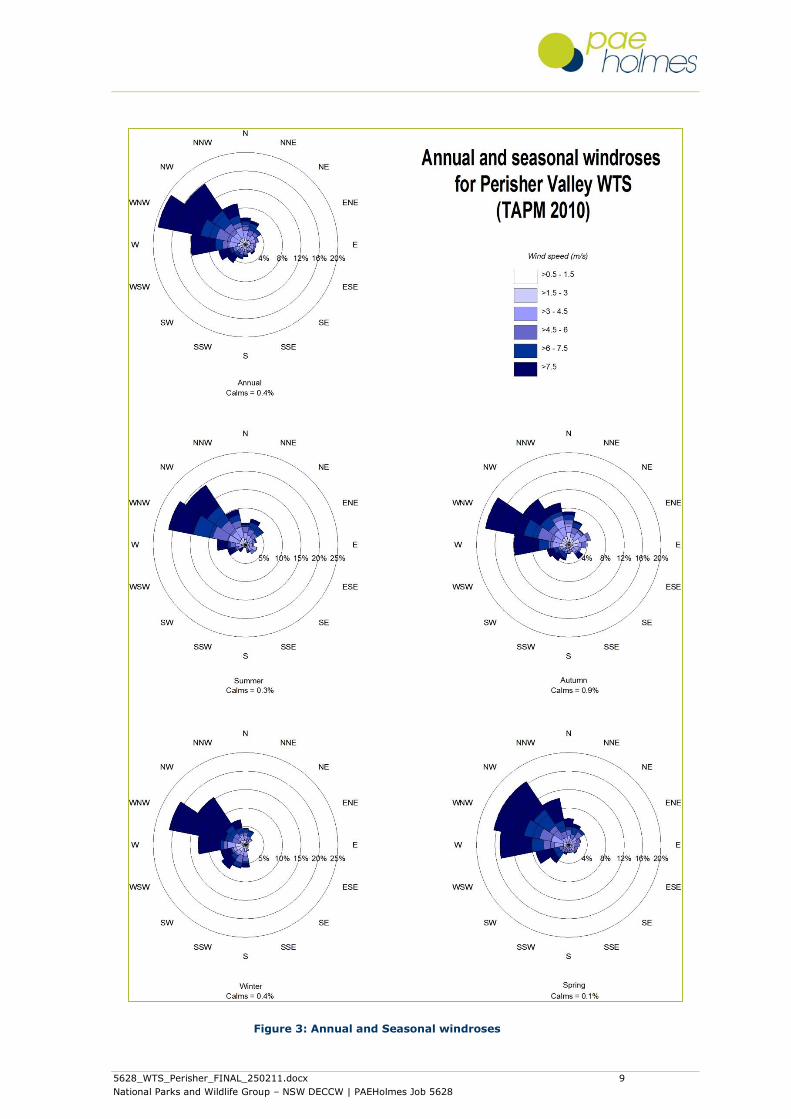
Windroses of data collected from the TAPM generated data for the period January 2010 to
December 2010 are presented in Figure 3. It is noted that TAPM prognostic data have the
tendency to underestimate the level of calm periods. However, given the elevated and
mountainous nature of the study area, it may be unlikely that there are a significant percentage
of calm periods in reality. The annual average wind speed for this data is 6.0 m/s, with calm
wind speeds of less than 0.5 m/s present 0.4% of the time.
The windroses show that on an annual basis winds are predominantly from the west-northwest,
northwest and west. This pattern is very similar for all seasons.
5628_WTS_Perisher_FINAL_250211.docx 9
National Parks and Wildlife Group – NSW DECCW | PAEHolmes Job 5628
Figure 3: Annual and Seasonal windroses
5628_WTS_Perisher_FINAL_250211.docx 10
National Parks and Wildlife Group – NSW DECCW | PAEHolmes Job 5628
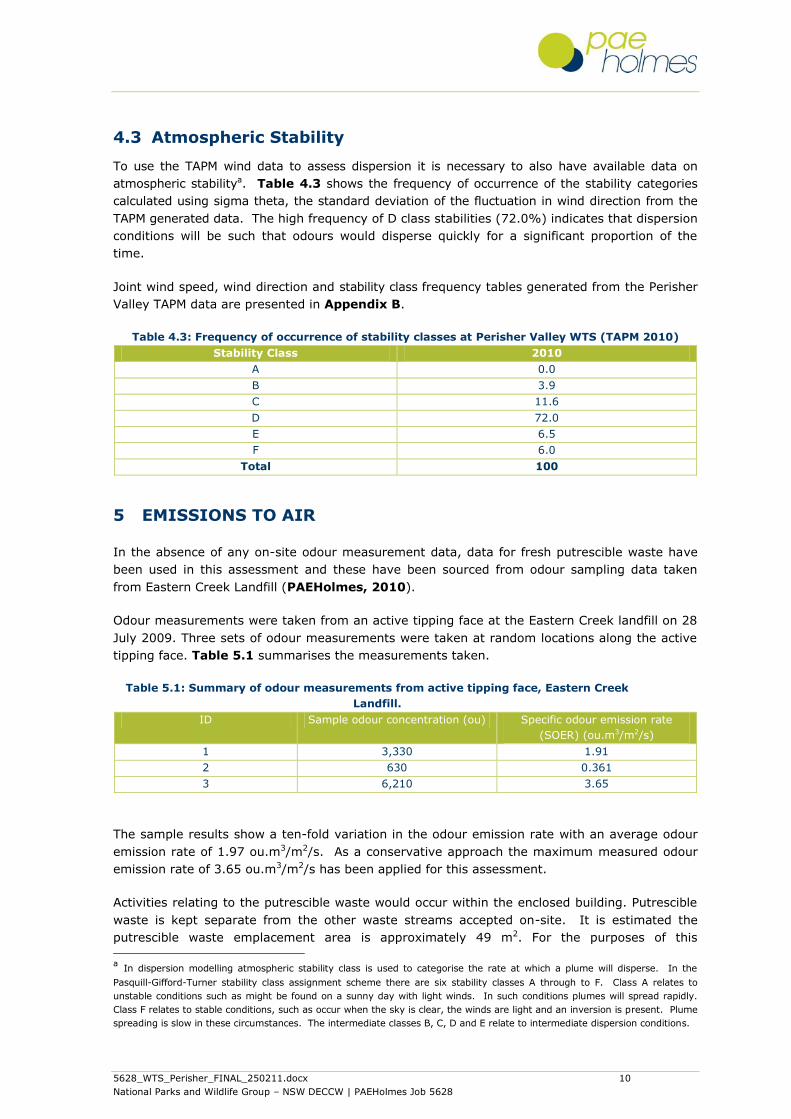
4.3 Atmospheric Stability
To use the TAPM wind data to assess dispersion it is necessary to also have available data on
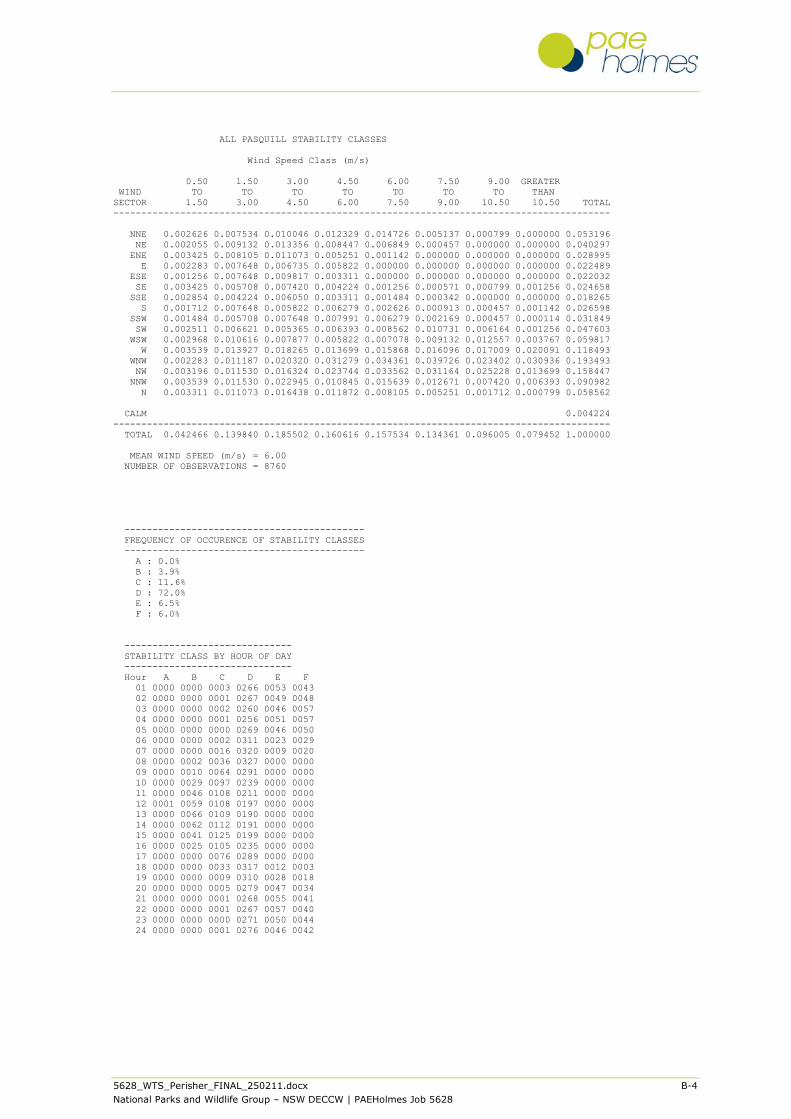
atmospheric stabilitya. Table 4.3 shows the frequency of occurrence of the stability categories
calculated using sigma theta, the standard deviation of the fluctuation in wind direction from the
TAPM generated data. The high frequency of D class stabilities (72.0%) indicates that dispersion
conditions will be such that odours would disperse quickly for a significant proportion of the
time.
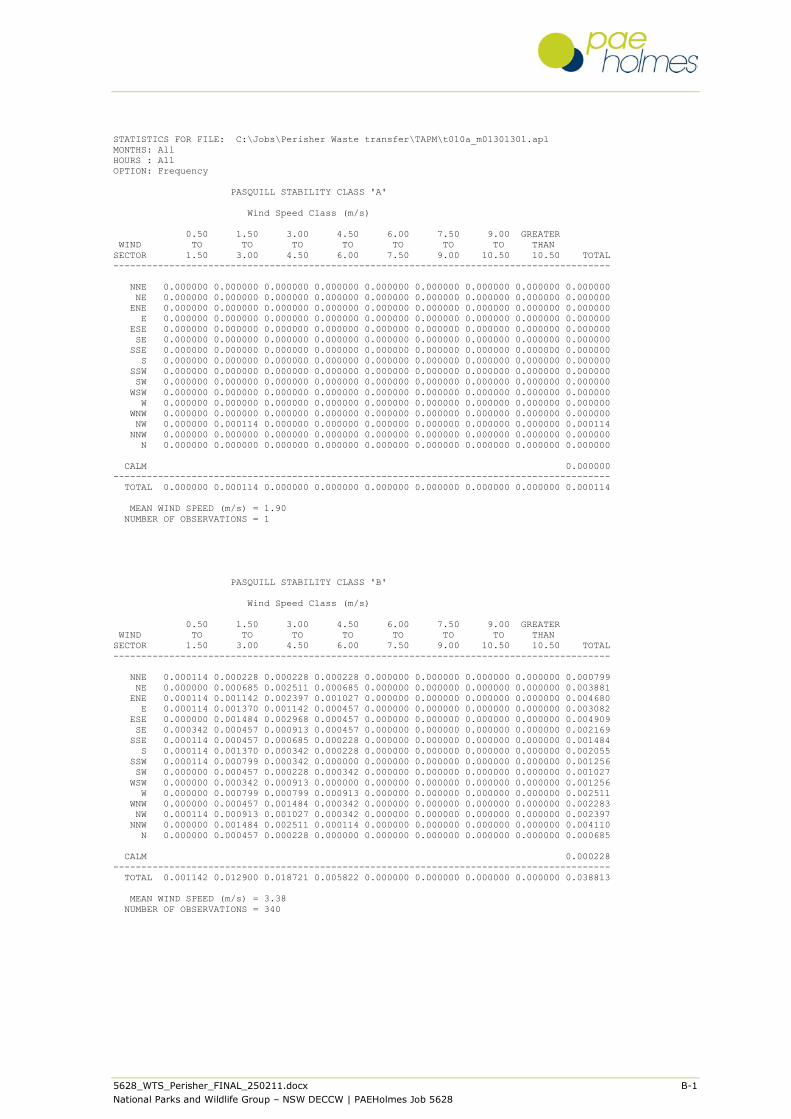
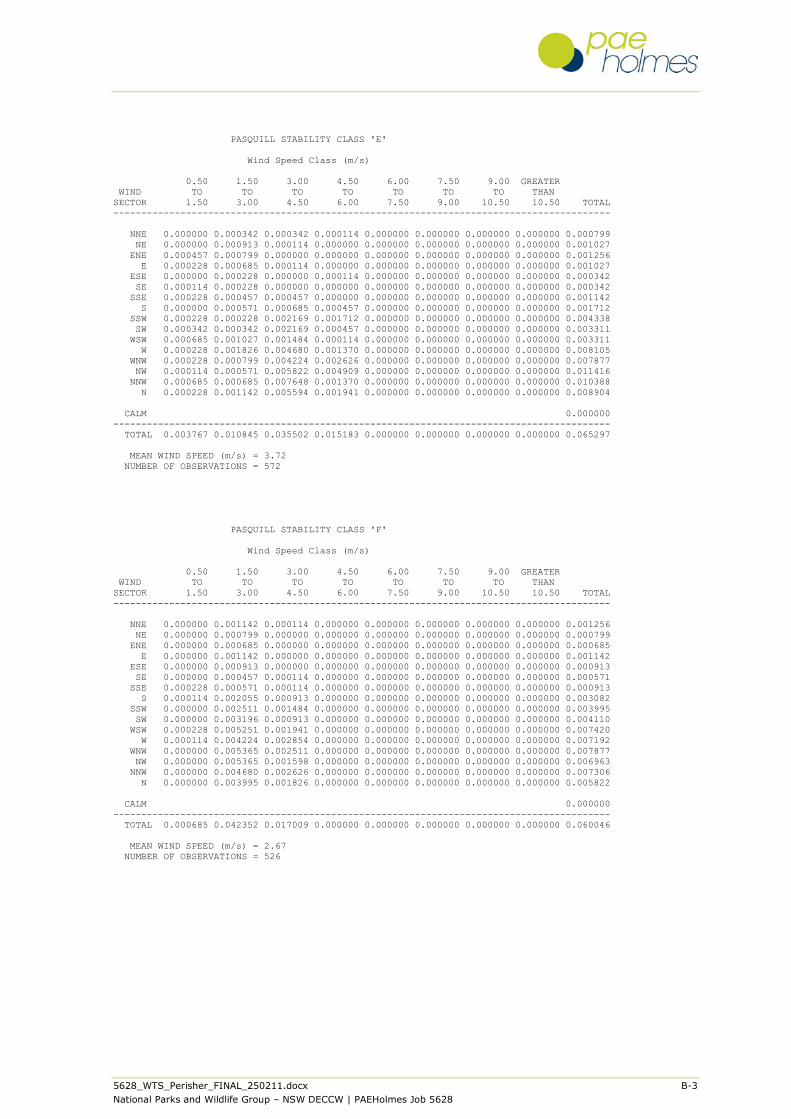
Joint wind speed, wind direction and stability class frequency tables generated from the Perisher
Valley TAPM data are presented in Appendix B.
Table 4.3: Frequency of occurrence of stability classes at Perisher Valley WTS (TAPM 2010)
Stability Class 2010
A 0.0
B 3.9
C 11.6
D 72.0
E 6.5
F 6.0
Total 100
5 EMISSIONS TO AIR
In the absence of any on-site odour measurement data, data for fresh putrescible waste have
been used in this assessment and these have been sourced from odour sampling data taken
from Eastern Creek Landfill (PAEHolmes, 2010).
Odour measurements were taken from an active tipping face at the Eastern Creek landfill on 28
July 2009. Three sets of odour measurements were taken at random locations along the active
tipping face. Table 5.1 summarises the measurements taken.
Table 5.1: Summary of odour measurements from active tipping face, Eastern Creek
Landfill.
ID Sample odour concentration (ou) Specific odour emission rate
(SOER) (ou.m3/m2/s)
1 3,330 1.91
2 630 0.361
3 6,210 3.65
The sample results show a ten-fold variation in the odour emission rate with an average odour
emission rate of 1.97 ou.m3/m2/s. As a conservative approach the maximum measured odour
emission rate of 3.65 ou.m3/m2/s has been applied for this assessment.
Activities relating to the putrescible waste would occur within the enclosed building. Putrescible
waste is kept separate from the other waste streams accepted on-site. It is estimated the
putrescible waste emplacement area is approximately 49 m2. For the purposes of this
a In dispersion modelling atmospheric stability class is used to categorise the rate at which a plume will disperse. In the
Pasquill-Gifford-Turner stability class assignment scheme there are six stability classes A through to F. Class A relates to
unstable conditions such as might be found on a sunny day with light winds. In such conditions plumes will spread rapidly.
Class F relates to stable conditions, such as occur when the sky is clear, the winds are light and an inversion is present. Plume
spreading is slow in these circumstances. The intermediate classes B, C, D and E relate to intermediate dispersion conditions.
5628_WTS_Perisher_FINAL_250211.docx 11
National Parks and Wildlife Group – NSW DECCW | PAEHolmes Job 5628
assessment we have modelled the odour emitted from the waste stockpile as an area source
emitting continuously for the modelling period and have not taken into account the building
enclosure.
6 APPROACH TO ASSESSMENT
Potential impacts have been assessed using AUSPLUME Version 6. AUSPLUME is a Gaussian
dispersion model developed on behalf of the Victorian EPA (VEPA, 1986) and is based on the
United States Environmental Protection Agency's Industrial Source Complex (ISC) model.
AUSPLUME has been used extensively for assessing odour impacts and is the recommended
model in the NSW DECCW guidelines for air quality impact assessments (NSW DEC, 2005).
Based on the estimated emissions, a constant emission rate of 3.65 ou.m2/m3/s was used with
a variable emission input file created for the AUSPLUME modelling to reflect the peak-to-mean
ratios of the area source for the different stability classes in the meteorological file. The 1-hour
average ground-level odour concentrations have been predicted at a set of receptors arranged
in a grid of 25 m spacing. Additional discrete receptors have been placed at the neighbouring
facilities to determine the impact more accurately at these locations.
Meteorological data generated by TAPM as described in Section 4 were used in conjunction with
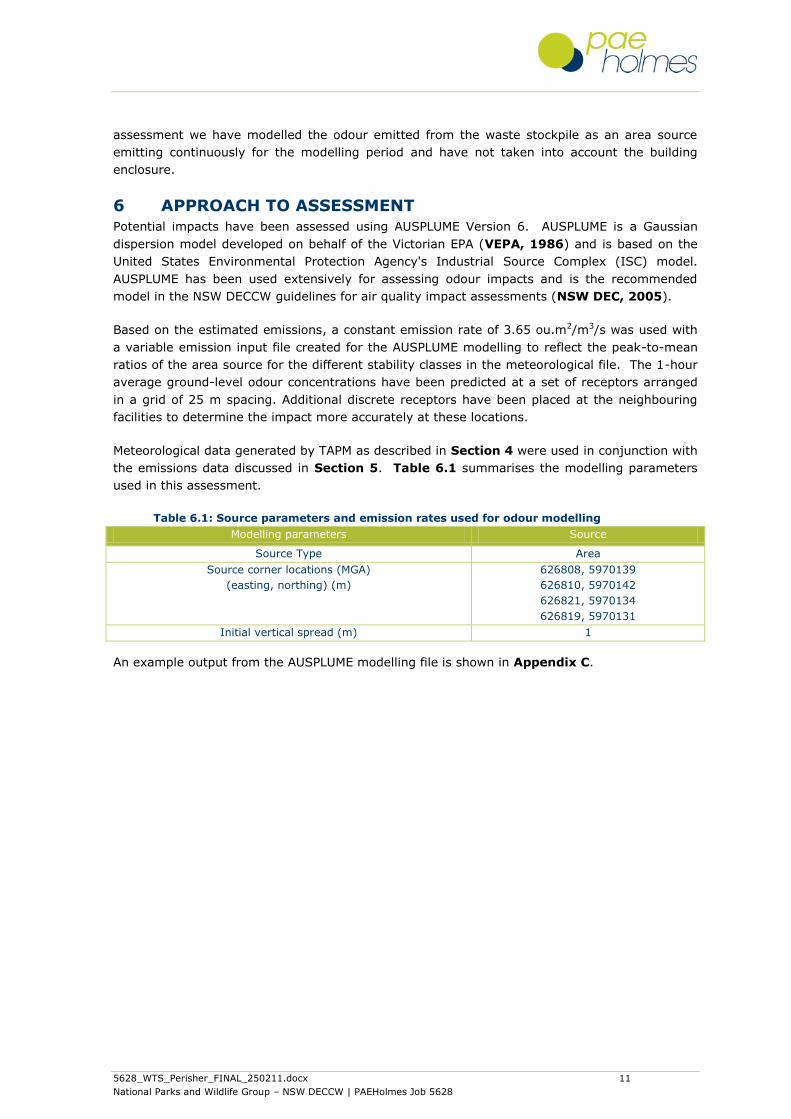
the emissions data discussed in Section 5. Table 6.1 summarises the modelling parameters
used in this assessment.
Table 6.1: Source parameters and emission rates used for odour modelling
Modelling parameters Source
Source Type Area
Source corner locations (MGA)
(easting, northing) (m)
626808, 5970139
626810, 5970142
626821, 5970134
626819, 5970131
Initial vertical spread (m) 1
An example output from the AUSPLUME modelling file is shown in Appendix C.
5628_WTS_Perisher_FINAL_250211.docx 12
National Parks and Wildlife Group – NSW DECCW | PAEHolmes Job 5628
7 MODELLING RESULTS
Table 7.1 presents the 99th percentile predicted nose-response average concentrations for the
sensitive receptors shown in Figure 1.
Table 7.1: Predicted odour concentrations at sensitive receptors
Discrete Receptor ID 99th percentile odour level (ou)
1 1
2 0
3 0
4 1
5 0
6 0
7 0
8 0
9 0
10 0
11 0
12 0
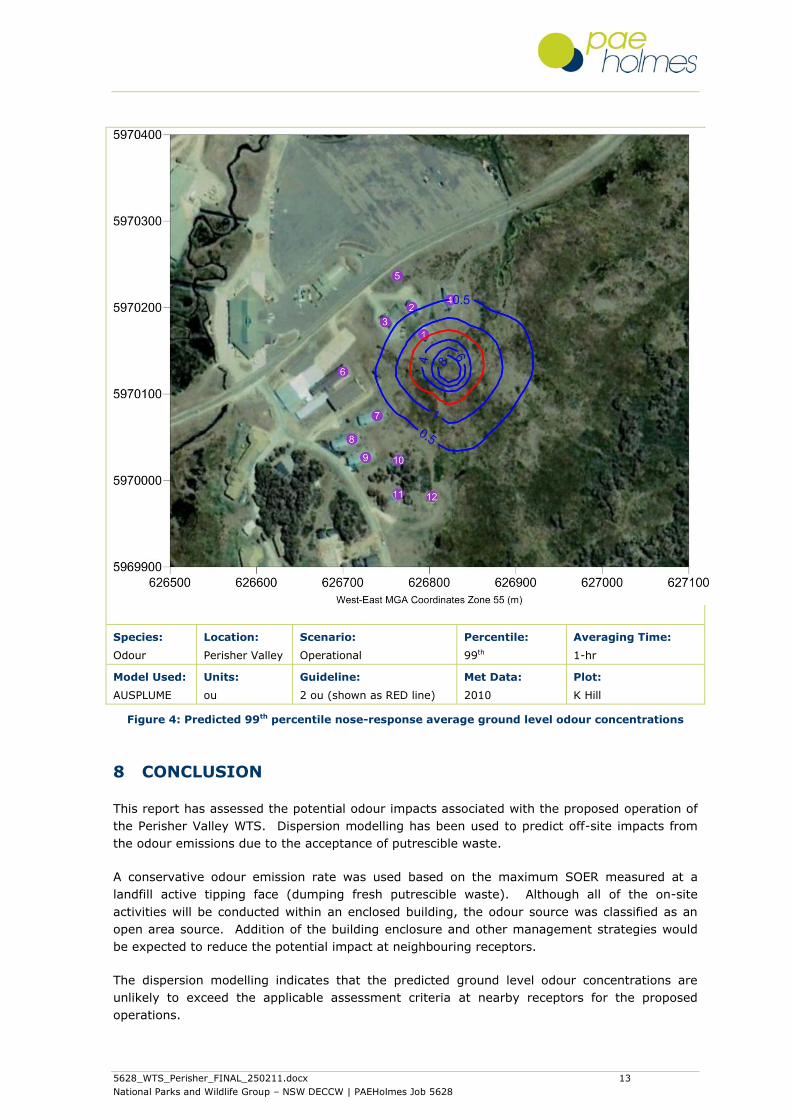
Figure 4 presents a contour plot of the 99th percentile nose-response average predicted ground
level odour concentrations.
The predicted 99th percentile nose-response average ground level odour concentrations show
that the 2 ou criterion is not exceeded at the nearby sensitive receptors.
As a conservative assessment, the model output has not considered the management strategies
that would be in practice at the facility. With these considerations in place the impact would be
further reduced.
Odour management strategies that would be implemented at the facility include;
keeping putrescible and non-putrescible waste stream(s) separate;
ensuring the floor area is cleaned daily;
keeping roller doors closed between deliveries if required to limit the escape of odour from
the building; and
minimising putrescible waste left on-site.
5628_WTS_Perisher_FINAL_250211.docx 13
National Parks and Wildlife Group – NSW DECCW | PAEHolmes Job 5628
Species:
Odour
Location:
Perisher Valley
Scenario:
Operational
Percentile:
99th
Averaging Time:
1-hr
Model Used:
AUSPLUME
Units:
ou
Guideline:
2 ou (shown as RED line)
Met Data:
2010
Plot:
K Hill
Figure 4: Predicted 99th percentile nose-response average ground level odour concentrations
8 CONCLUSION
This report has assessed the potential odour impacts associated with the proposed operation of
the Perisher Valley WTS. Dispersion modelling has been used to predict off-site impacts from
the odour emissions due to the acceptance of putrescible waste.
A conservative odour emission rate was used based on the maximum SOER measured at a
landfill active tipping face (dumping fresh putrescible waste). Although all of the on-site
activities will be conducted within an enclosed building, the odour source was classified as an
open area source. Addition of the building enclosure and other management strategies would
be expected to reduce the potential impact at neighbouring receptors.
The dispersion modelling indicates that the predicted ground level odour concentrations are
unlikely to exceed the applicable assessment criteria at nearby receptors for the proposed
operations.
5628_WTS_Perisher_FINAL_250211.docx 14
National Parks and Wildlife Group – NSW DECCW | PAEHolmes Job 5628
9 REFERENCES
Bureau of Meteorology (2010)
Climatic Averages Australia, Bureau of Meteorology website
http://www.bom.gov.au/climate/averages/
CEN (1996)
“Document 064/e – Draft European Standard – Odour Concentration Measurement by
Dynamic Olfactometry” CEN TC264/WG2 „Odours‟ Final WG2 Draft prEN”, Committé
Européen de Normalisation,Brussels.
Hurley, P. J (1999) „The Air Pollution Model (TAPM) Version 1: User Manual‟, CSIRO Research Internal Paper No. 12, October 1999.
Katestone Scientific Pty Ltd (1995)
"The evaluation of peak-to-mean ratios for odour assessments" Volume 1 - Main Report,
May 1995
Katestone Scientific Pty Ltd (1998)
“Peak-to-Mean Concentration Ratios for Odour Assessments”.
NSW DEC (2005)
“Approved Methods for the Modelling and Assessment of Air Pollutants in NSW”, August
2005
NSW DEC (2006)
“Assessment and management of odours from stationary sources in NSW”, November
2006
PAEHolmes (2010)
“Air Quality Assessment – Odour and Dust: Proposed Modification to the Northern
Extension Landfill at Eastern Creek”, Prepared by PAEHolmes for National Environmental
Consulting Services, March 2010.
Puri, et al. (1997)
‟The BMRC Limited Area Prediction System, LAPS‟. Aust. Met. Mag., 47, 203-223.
Standards Australia (2001)
“Stationary source emissions - Part 3: Determination of odour concentration by dynamic
olfactometry” First published as AS/NZS 4323.3:2001. Standards Australia International
Ltd, GPO Box 5420, Sydney, NSW 2001 and Standards New Zealand, Private Bag 2439,
Wellington 6020.
VEPA (1986)
"The Ausplume Gaussian Plume Dispersion Model", Environment Protection Authority,
Olderfleet Buildings, 477 Collins Street, Melbourne Victoria 3000, Publication Number 264.
5628_WTS_Perisher_FINAL_250211.docx A-1
National Parks and Wildlife Group – NSW DECCW | PAEHolmes Job 5628
APPENDIX A
Peak-to-mean ratios
5628_WTS_Perisher_FINAL_250211.docx A-2
National Parks and Wildlife Group – NSW DECCW | PAEHolmes Job 5628
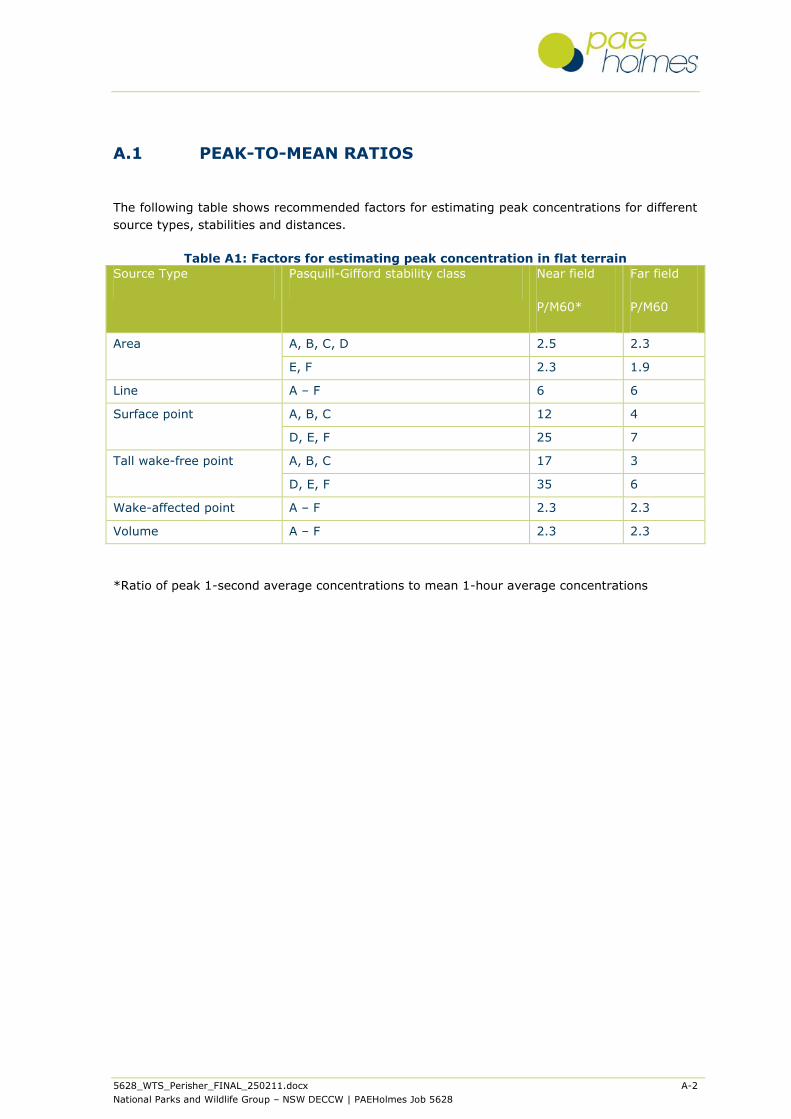
A.1 PEAK-TO-MEAN RATIOS
The following table shows recommended factors for estimating peak concentrations for different
source types, stabilities and distances.
Table A1: Factors for estimating peak concentration in flat terrain
Source Type Pasquill-Gifford stability class Near field
P/M60*
Far field
P/M60
Area A, B, C, D 2.5 2.3
E, F 2.3 1.9
Line A – F 6 6
Surface point A, B, C 12 4
D, E, F 25 7
Tall wake-free point A, B, C 17 3
D, E, F 35 6
Wake-affected point A – F 2.3 2.3
Volume A – F 2.3 2.3
*Ratio of peak 1-second average concentrations to mean 1-hour average concentrations
5628_WTS_Perisher_FINAL_250211.docx B-1
National Parks and Wildlife Group – NSW DECCW | PAEHolmes Job 5628
APPENDIX B
Joint wind speed, wind direction and stability class frequency tables
5628_WTS_Perisher_FINAL_250211.docx B-1
National Parks and Wildlife Group – NSW DECCW | PAEHolmes Job 5628
STATISTICS FOR FILE: C:\Jobs\Perisher Waste transfer\TAPM\t010a_m01301301.apl
MONTHS: All
HOURS : All
OPTION: Frequency
PASQUILL STABILITY CLASS 'A'
Wind Speed Class (m/s)
0.50 1.50 3.00 4.50 6.00 7.50 9.00 GREATER
WIND TO TO TO TO TO TO TO THAN
SECTOR 1.50 3.00 4.50 6.00 7.50 9.00 10.50 10.50 TOTAL
-----------------------------------------------------------------------------------------
NNE 0.000000 0.000000 0.000000 0.000000 0.000000 0.000000 0.000000 0.000000 0.000000
NE 0.000000 0.000000 0.000000 0.000000 0.000000 0.000000 0.000000 0.000000 0.000000
ENE 0.000000 0.000000 0.000000 0.000000 0.000000 0.000000 0.000000 0.000000 0.000000
E 0.000000 0.000000 0.000000 0.000000 0.000000 0.000000 0.000000 0.000000 0.000000
ESE 0.000000 0.000000 0.000000 0.000000 0.000000 0.000000 0.000000 0.000000 0.000000
SE 0.000000 0.000000 0.000000 0.000000 0.000000 0.000000 0.000000 0.000000 0.000000
SSE 0.000000 0.000000 0.000000 0.000000 0.000000 0.000000 0.000000 0.000000 0.000000
S 0.000000 0.000000 0.000000 0.000000 0.000000 0.000000 0.000000 0.000000 0.000000
SSW 0.000000 0.000000 0.000000 0.000000 0.000000 0.000000 0.000000 0.000000 0.000000
SW 0.000000 0.000000 0.000000 0.000000 0.000000 0.000000 0.000000 0.000000 0.000000
WSW 0.000000 0.000000 0.000000 0.000000 0.000000 0.000000 0.000000 0.000000 0.000000
W 0.000000 0.000000 0.000000 0.000000 0.000000 0.000000 0.000000 0.000000 0.000000
WNW 0.000000 0.000000 0.000000 0.000000 0.000000 0.000000 0.000000 0.000000 0.000000
NW 0.000000 0.000114 0.000000 0.000000 0.000000 0.000000 0.000000 0.000000 0.000114
NNW 0.000000 0.000000 0.000000 0.000000 0.000000 0.000000 0.000000 0.000000 0.000000
N 0.000000 0.000000 0.000000 0.000000 0.000000 0.000000 0.000000 0.000000 0.000000
CALM 0.000000
-----------------------------------------------------------------------------------------
TOTAL 0.000000 0.000114 0.000000 0.000000 0.000000 0.000000 0.000000 0.000000 0.000114
MEAN WIND SPEED (m/s) = 1.90
NUMBER OF OBSERVATIONS = 1
PASQUILL STABILITY CLASS 'B'
Wind Speed Class (m/s)
0.50 1.50 3.00 4.50 6.00 7.50 9.00 GREATER
WIND TO TO TO TO TO TO TO THAN
SECTOR 1.50 3.00 4.50 6.00 7.50 9.00 10.50 10.50 TOTAL
-----------------------------------------------------------------------------------------
NNE 0.000114 0.000228 0.000228 0.000228 0.000000 0.000000 0.000000 0.000000 0.000799
NE 0.000000 0.000685 0.002511 0.000685 0.000000 0.000000 0.000000 0.000000 0.003881
ENE 0.000114 0.001142 0.002397 0.001027 0.000000 0.000000 0.000000 0.000000 0.004680
E 0.000114 0.001370 0.001142 0.000457 0.000000 0.000000 0.000000 0.000000 0.003082
ESE 0.000000 0.001484 0.002968 0.000457 0.000000 0.000000 0.000000 0.000000 0.004909
SE 0.000342 0.000457 0.000913 0.000457 0.000000 0.000000 0.000000 0.000000 0.002169
SSE 0.000114 0.000457 0.000685 0.000228 0.000000 0.000000 0.000000 0.000000 0.001484
S 0.000114 0.001370 0.000342 0.000228 0.000000 0.000000 0.000000 0.000000 0.002055
SSW 0.000114 0.000799 0.000342 0.000000 0.000000 0.000000 0.000000 0.000000 0.001256
SW 0.000000 0.000457 0.000228 0.000342 0.000000 0.000000 0.000000 0.000000 0.001027
WSW 0.000000 0.000342 0.000913 0.000000 0.000000 0.000000 0.000000 0.000000 0.001256
W 0.000000 0.000799 0.000799 0.000913 0.000000 0.000000 0.000000 0.000000 0.002511
WNW 0.000000 0.000457 0.001484 0.000342 0.000000 0.000000 0.000000 0.000000 0.002283
NW 0.000114 0.000913 0.001027 0.000342 0.000000 0.000000 0.000000 0.000000 0.002397
NNW 0.000000 0.001484 0.002511 0.000114 0.000000 0.000000 0.000000 0.000000 0.004110
N 0.000000 0.000457 0.000228 0.000000 0.000000 0.000000 0.000000 0.000000 0.000685
CALM 0.000228
-----------------------------------------------------------------------------------------
TOTAL 0.001142 0.012900 0.018721 0.005822 0.000000 0.000000 0.000000 0.000000 0.038813
MEAN WIND SPEED (m/s) = 3.38
NUMBER OF OBSERVATIONS = 340

5628_WTS_Perisher_FINAL_250211.docx B-2
National Parks and Wildlife Group – NSW DECCW | PAEHolmes Job 5628
PASQUILL STABILITY CLASS 'C'
Wind Speed Class (m/s)
0.50 1.50 3.00 4.50 6.00 7.50 9.00 GREATER
WIND TO TO TO TO TO TO TO THAN
SECTOR 1.50 3.00 4.50 6.00 7.50 9.00 10.50 10.50 TOTAL
-----------------------------------------------------------------------------------------
NNE 0.000342 0.000685 0.001826 0.002511 0.000571 0.000342 0.000000 0.000000 0.006279
NE 0.000342 0.001712 0.001941 0.002169 0.000114 0.000000 0.000000 0.000000 0.006279
ENE 0.000342 0.001142 0.003539 0.001484 0.000571 0.000000 0.000000 0.000000 0.007078
E 0.000114 0.001712 0.002283 0.002169 0.000000 0.000000 0.000000 0.000000 0.006279
ESE 0.000457 0.001826 0.004224 0.001370 0.000000 0.000000 0.000000 0.000000 0.007877
SE 0.000685 0.002055 0.002854 0.001142 0.000000 0.000000 0.000000 0.000000 0.006735
SSE 0.000342 0.001598 0.002055 0.001142 0.000000 0.000000 0.000000 0.000000 0.005137
S 0.000342 0.001826 0.002511 0.001826 0.000342 0.000000 0.000000 0.000000 0.006849
SSW 0.000457 0.000571 0.001941 0.000799 0.000114 0.000114 0.000000 0.000000 0.003995
SW 0.000114 0.000571 0.000799 0.001256 0.001027 0.000000 0.000000 0.000000 0.003767
WSW 0.000457 0.000913 0.001826 0.002055 0.000114 0.000228 0.000000 0.000000 0.005594
W 0.000457 0.001712 0.003539 0.003311 0.000000 0.000342 0.000000 0.000000 0.009361
WNW 0.000571 0.000913 0.002854 0.006164 0.002511 0.001484 0.000000 0.000000 0.014498
NW 0.000457 0.000685 0.002397 0.004795 0.002740 0.000228 0.000000 0.000000 0.011301
NNW 0.000342 0.000457 0.003196 0.003196 0.000913 0.000114 0.000000 0.000000 0.008219
N 0.000913 0.000799 0.003425 0.001027 0.000114 0.000114 0.000000 0.000000 0.006393
CALM 0.000228
-----------------------------------------------------------------------------------------
TOTAL 0.006735 0.019178 0.041210 0.036416 0.009132 0.002968 0.000000 0.000000 0.115868
MEAN WIND SPEED (m/s) = 4.20
NUMBER OF OBSERVATIONS = 1015
PASQUILL STABILITY CLASS 'D'
Wind Speed Class (m/s)
0.50 1.50 3.00 4.50 6.00 7.50 9.00 GREATER
WIND TO TO TO TO TO TO TO THAN
SECTOR 1.50 3.00 4.50 6.00 7.50 9.00 10.50 10.50 TOTAL
-----------------------------------------------------------------------------------------
NNE 0.002169 0.005137 0.007534 0.009475 0.014155 0.004795 0.000799 0.000000 0.044064
NE 0.001712 0.005023 0.008790 0.005594 0.006735 0.000457 0.000000 0.000000 0.028311
ENE 0.002511 0.004338 0.005137 0.002740 0.000571 0.000000 0.000000 0.000000 0.015297
E 0.001826 0.002740 0.003196 0.003196 0.000000 0.000000 0.000000 0.000000 0.010959
ESE 0.000799 0.003196 0.002626 0.001370 0.000000 0.000000 0.000000 0.000000 0.007991
SE 0.002283 0.002511 0.003539 0.002626 0.001256 0.000571 0.000799 0.001256 0.014840
SSE 0.001941 0.001142 0.002740 0.001941 0.001484 0.000342 0.000000 0.000000 0.009589
S 0.001142 0.001826 0.001370 0.003767 0.002283 0.000913 0.000457 0.001142 0.012900
SSW 0.000685 0.001598 0.001712 0.005479 0.006164 0.002055 0.000457 0.000114 0.018265
SW 0.002055 0.002055 0.001256 0.004338 0.007534 0.010731 0.006164 0.001256 0.035388
WSW 0.001598 0.003082 0.001712 0.003653 0.006963 0.008904 0.012557 0.003767 0.042237
W 0.002740 0.005365 0.006393 0.008105 0.015868 0.015753 0.017009 0.020091 0.091324
WNW 0.001484 0.003653 0.009247 0.022146 0.031849 0.038242 0.023402 0.030936 0.160959
NW 0.002511 0.003881 0.005479 0.013699 0.030822 0.030936 0.025228 0.013699 0.126256
NNW 0.002511 0.004224 0.006963 0.006164 0.014726 0.012557 0.007420 0.006393 0.060959
N 0.002169 0.004680 0.005365 0.008904 0.007991 0.005137 0.001712 0.000799 0.036758
CALM 0.003767
-----------------------------------------------------------------------------------------
TOTAL 0.030137 0.054452 0.073059 0.103196 0.148402 0.131393 0.096005 0.079452 0.719863
MEAN WIND SPEED (m/s) = 6.92
NUMBER OF OBSERVATIONS = 6306
5628_WTS_Perisher_FINAL_250211.docx B-3
National Parks and Wildlife Group – NSW DECCW | PAEHolmes Job 5628
PASQUILL STABILITY CLASS 'E'
Wind Speed Class (m/s)
0.50 1.50 3.00 4.50 6.00 7.50 9.00 GREATER
WIND TO TO TO TO TO TO TO THAN
SECTOR 1.50 3.00 4.50 6.00 7.50 9.00 10.50 10.50 TOTAL
-----------------------------------------------------------------------------------------
NNE 0.000000 0.000342 0.000342 0.000114 0.000000 0.000000 0.000000 0.000000 0.000799
NE 0.000000 0.000913 0.000114 0.000000 0.000000 0.000000 0.000000 0.000000 0.001027
ENE 0.000457 0.000799 0.000000 0.000000 0.000000 0.000000 0.000000 0.000000 0.001256
E 0.000228 0.000685 0.000114 0.000000 0.000000 0.000000 0.000000 0.000000 0.001027
ESE 0.000000 0.000228 0.000000 0.000114 0.000000 0.000000 0.000000 0.000000 0.000342
SE 0.000114 0.000228 0.000000 0.000000 0.000000 0.000000 0.000000 0.000000 0.000342
SSE 0.000228 0.000457 0.000457 0.000000 0.000000 0.000000 0.000000 0.000000 0.001142
S 0.000000 0.000571 0.000685 0.000457 0.000000 0.000000 0.000000 0.000000 0.001712
SSW 0.000228 0.000228 0.002169 0.001712 0.000000 0.000000 0.000000 0.000000 0.004338
SW 0.000342 0.000342 0.002169 0.000457 0.000000 0.000000 0.000000 0.000000 0.003311
WSW 0.000685 0.001027 0.001484 0.000114 0.000000 0.000000 0.000000 0.000000 0.003311
W 0.000228 0.001826 0.004680 0.001370 0.000000 0.000000 0.000000 0.000000 0.008105
WNW 0.000228 0.000799 0.004224 0.002626 0.000000 0.000000 0.000000 0.000000 0.007877
NW 0.000114 0.000571 0.005822 0.004909 0.000000 0.000000 0.000000 0.000000 0.011416
NNW 0.000685 0.000685 0.007648 0.001370 0.000000 0.000000 0.000000 0.000000 0.010388
N 0.000228 0.001142 0.005594 0.001941 0.000000 0.000000 0.000000 0.000000 0.008904
CALM 0.000000
-----------------------------------------------------------------------------------------
TOTAL 0.003767 0.010845 0.035502 0.015183 0.000000 0.000000 0.000000 0.000000 0.065297
MEAN WIND SPEED (m/s) = 3.72
NUMBER OF OBSERVATIONS = 572
PASQUILL STABILITY CLASS 'F'
Wind Speed Class (m/s)
0.50 1.50 3.00 4.50 6.00 7.50 9.00 GREATER
WIND TO TO TO TO TO TO TO THAN
SECTOR 1.50 3.00 4.50 6.00 7.50 9.00 10.50 10.50 TOTAL
-----------------------------------------------------------------------------------------
NNE 0.000000 0.001142 0.000114 0.000000 0.000000 0.000000 0.000000 0.000000 0.001256
NE 0.000000 0.000799 0.000000 0.000000 0.000000 0.000000 0.000000 0.000000 0.000799
ENE 0.000000 0.000685 0.000000 0.000000 0.000000 0.000000 0.000000 0.000000 0.000685
E 0.000000 0.001142 0.000000 0.000000 0.000000 0.000000 0.000000 0.000000 0.001142
ESE 0.000000 0.000913 0.000000 0.000000 0.000000 0.000000 0.000000 0.000000 0.000913
SE 0.000000 0.000457 0.000114 0.000000 0.000000 0.000000 0.000000 0.000000 0.000571
SSE 0.000228 0.000571 0.000114 0.000000 0.000000 0.000000 0.000000 0.000000 0.000913
S 0.000114 0.002055 0.000913 0.000000 0.000000 0.000000 0.000000 0.000000 0.003082
SSW 0.000000 0.002511 0.001484 0.000000 0.000000 0.000000 0.000000 0.000000 0.003995
SW 0.000000 0.003196 0.000913 0.000000 0.000000 0.000000 0.000000 0.000000 0.004110
WSW 0.000228 0.005251 0.001941 0.000000 0.000000 0.000000 0.000000 0.000000 0.007420
W 0.000114 0.004224 0.002854 0.000000 0.000000 0.000000 0.000000 0.000000 0.007192
WNW 0.000000 0.005365 0.002511 0.000000 0.000000 0.000000 0.000000 0.000000 0.007877
NW 0.000000 0.005365 0.001598 0.000000 0.000000 0.000000 0.000000 0.000000 0.006963
NNW 0.000000 0.004680 0.002626 0.000000 0.000000 0.000000 0.000000 0.000000 0.007306
N 0.000000 0.003995 0.001826 0.000000 0.000000 0.000000 0.000000 0.000000 0.005822
CALM 0.000000
-----------------------------------------------------------------------------------------
TOTAL 0.000685 0.042352 0.017009 0.000000 0.000000 0.000000 0.000000 0.000000 0.060046
MEAN WIND SPEED (m/s) = 2.67
NUMBER OF OBSERVATIONS = 526
5628_WTS_Perisher_FINAL_250211.docx B-4
National Parks and Wildlife Group – NSW DECCW | PAEHolmes Job 5628
ALL PASQUILL STABILITY CLASSES
Wind Speed Class (m/s)
0.50 1.50 3.00 4.50 6.00 7.50 9.00 GREATER
WIND TO TO TO TO TO TO TO THAN
SECTOR 1.50 3.00 4.50 6.00 7.50 9.00 10.50 10.50 TOTAL
-----------------------------------------------------------------------------------------
NNE 0.002626 0.007534 0.010046 0.012329 0.014726 0.005137 0.000799 0.000000 0.053196
NE 0.002055 0.009132 0.013356 0.008447 0.006849 0.000457 0.000000 0.000000 0.040297
ENE 0.003425 0.008105 0.011073 0.005251 0.001142 0.000000 0.000000 0.000000 0.028995
E 0.002283 0.007648 0.006735 0.005822 0.000000 0.000000 0.000000 0.000000 0.022489
ESE 0.001256 0.007648 0.009817 0.003311 0.000000 0.000000 0.000000 0.000000 0.022032
SE 0.003425 0.005708 0.007420 0.004224 0.001256 0.000571 0.000799 0.001256 0.024658
SSE 0.002854 0.004224 0.006050 0.003311 0.001484 0.000342 0.000000 0.000000 0.018265
S 0.001712 0.007648 0.005822 0.006279 0.002626 0.000913 0.000457 0.001142 0.026598
SSW 0.001484 0.005708 0.007648 0.007991 0.006279 0.002169 0.000457 0.000114 0.031849
SW 0.002511 0.006621 0.005365 0.006393 0.008562 0.010731 0.006164 0.001256 0.047603
WSW 0.002968 0.010616 0.007877 0.005822 0.007078 0.009132 0.012557 0.003767 0.059817
W 0.003539 0.013927 0.018265 0.013699 0.015868 0.016096 0.017009 0.020091 0.118493
WNW 0.002283 0.011187 0.020320 0.031279 0.034361 0.039726 0.023402 0.030936 0.193493
NW 0.003196 0.011530 0.016324 0.023744 0.033562 0.031164 0.025228 0.013699 0.158447
NNW 0.003539 0.011530 0.022945 0.010845 0.015639 0.012671 0.007420 0.006393 0.090982
N 0.003311 0.011073 0.016438 0.011872 0.008105 0.005251 0.001712 0.000799 0.058562
CALM 0.004224
-----------------------------------------------------------------------------------------
TOTAL 0.042466 0.139840 0.185502 0.160616 0.157534 0.134361 0.096005 0.079452 1.000000
MEAN WIND SPEED (m/s) = 6.00
NUMBER OF OBSERVATIONS = 8760
-------------------------------------------
FREQUENCY OF OCCURENCE OF STABILITY CLASSES
-------------------------------------------
A : 0.0%
B : 3.9%
C : 11.6%
D : 72.0%
E : 6.5%
F : 6.0%
------------------------------
STABILITY CLASS BY HOUR OF DAY
------------------------------
Hour A B C D E F
01 0000 0000 0003 0266 0053 0043
02 0000 0000 0001 0267 0049 0048
03 0000 0000 0002 0260 0046 0057
04 0000 0000 0001 0256 0051 0057
05 0000 0000 0000 0269 0046 0050
06 0000 0000 0002 0311 0023 0029
07 0000 0000 0016 0320 0009 0020
08 0000 0002 0036 0327 0000 0000
09 0000 0010 0064 0291 0000 0000
10 0000 0029 0097 0239 0000 0000
11 0000 0046 0108 0211 0000 0000
12 0001 0059 0108 0197 0000 0000
13 0000 0066 0109 0190 0000 0000
14 0000 0062 0112 0191 0000 0000
15 0000 0041 0125 0199 0000 0000
16 0000 0025 0105 0235 0000 0000
17 0000 0000 0076 0289 0000 0000
18 0000 0000 0033 0317 0012 0003
19 0000 0000 0009 0310 0028 0018
20 0000 0000 0005 0279 0047 0034
21 0000 0000 0001 0268 0055 0041
22 0000 0000 0001 0267 0057 0040
23 0000 0000 0000 0271 0050 0044
24 0000 0000 0001 0276 0046 0042
5628_WTS_Perisher_FINAL_250211.docx B-5
National Parks and Wildlife Group – NSW DECCW | PAEHolmes Job 5628
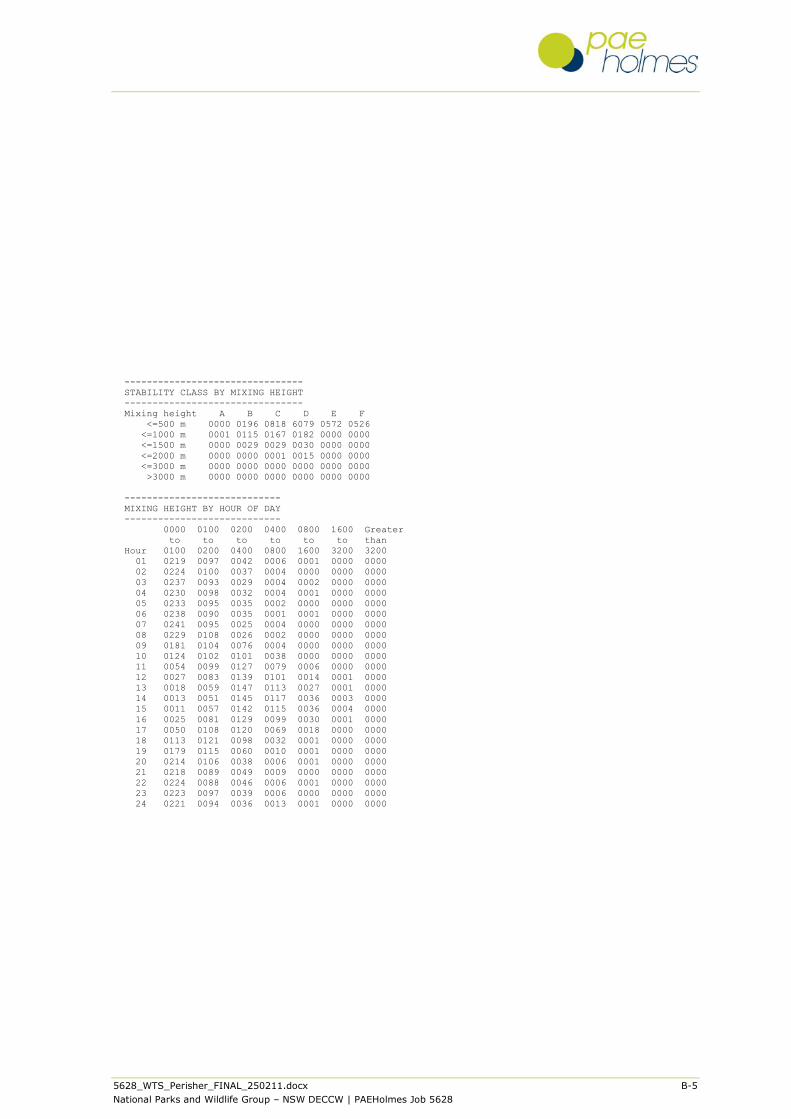
--------------------------------
STABILITY CLASS BY MIXING HEIGHT
--------------------------------
Mixing height A B C D E F
<=500 m 0000 0196 0818 6079 0572 0526
<=1000 m 0001 0115 0167 0182 0000 0000
<=1500 m 0000 0029 0029 0030 0000 0000
<=2000 m 0000 0000 0001 0015 0000 0000
<=3000 m 0000 0000 0000 0000 0000 0000
>3000 m 0000 0000 0000 0000 0000 0000
----------------------------
MIXING HEIGHT BY HOUR OF DAY
----------------------------
0000 0100 0200 0400 0800 1600 Greater
to to to to to to than
Hour 0100 0200 0400 0800 1600 3200 3200
01 0219 0097 0042 0006 0001 0000 0000
02 0224 0100 0037 0004 0000 0000 0000
03 0237 0093 0029 0004 0002 0000 0000
04 0230 0098 0032 0004 0001 0000 0000
05 0233 0095 0035 0002 0000 0000 0000
06 0238 0090 0035 0001 0001 0000 0000
07 0241 0095 0025 0004 0000 0000 0000
08 0229 0108 0026 0002 0000 0000 0000
09 0181 0104 0076 0004 0000 0000 0000
10 0124 0102 0101 0038 0000 0000 0000
11 0054 0099 0127 0079 0006 0000 0000
12 0027 0083 0139 0101 0014 0001 0000
13 0018 0059 0147 0113 0027 0001 0000
14 0013 0051 0145 0117 0036 0003 0000
15 0011 0057 0142 0115 0036 0004 0000
16 0025 0081 0129 0099 0030 0001 0000
17 0050 0108 0120 0069 0018 0000 0000
18 0113 0121 0098 0032 0001 0000 0000
19 0179 0115 0060 0010 0001 0000 0000
20 0214 0106 0038 0006 0001 0000 0000
21 0218 0089 0049 0009 0000 0000 0000
22 0224 0088 0046 0006 0001 0000 0000
23 0223 0097 0039 0006 0000 0000 0000
24 0221 0094 0036 0013 0001 0000 0000
5628_WTS_Perisher_FINAL_250211.docx C-1
National Parks and Wildlife Group – NSW DECCW | PAEHolmes Job 5628
APPENDIX C
AUSPLUME output file
5628_WTS_Perisher_FINAL_250211.docx C-2
National Parks and Wildlife Group – NSW DECCW | PAEHolmes Job 5628
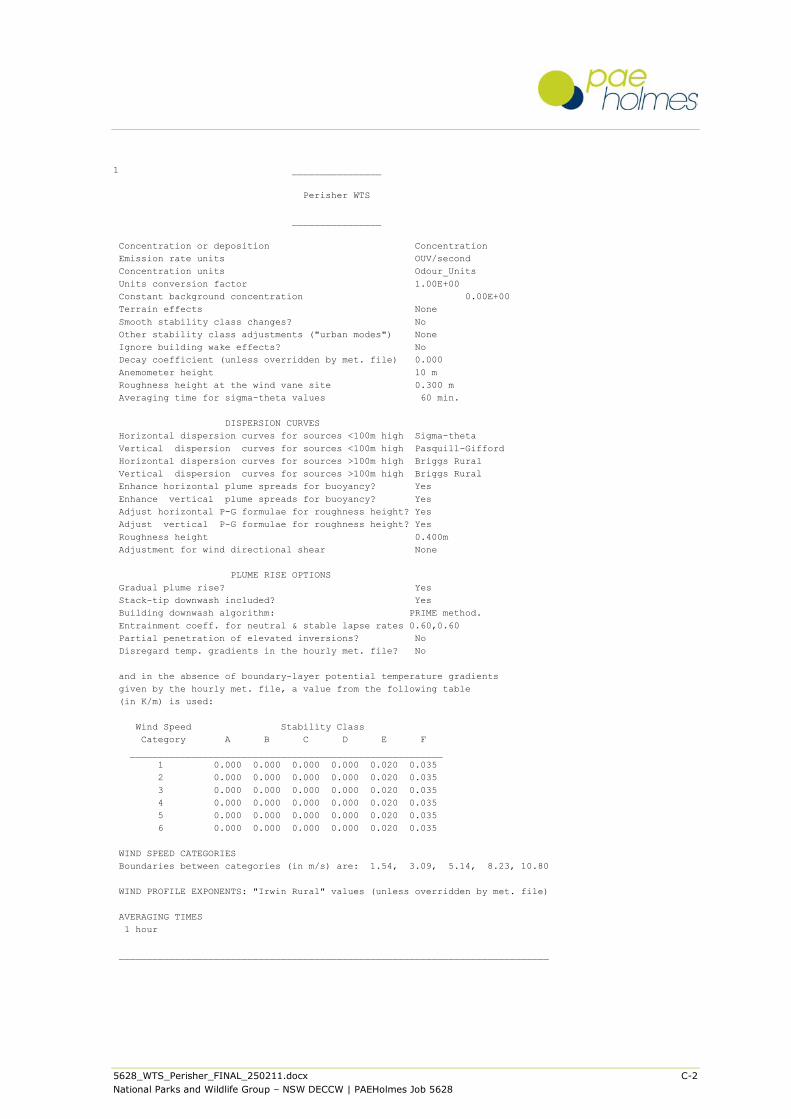
1 ________________
Perisher WTS
________________
Concentration or deposition Concentration
Emission rate units OUV/second
Concentration units Odour_Units
Units conversion factor 1.00E+00
Constant background concentration 0.00E+00
Terrain effects None
Smooth stability class changes? No
Other stability class adjustments ("urban modes") None
Ignore building wake effects? No
Decay coefficient (unless overridden by met. file) 0.000
Anemometer height 10 m
Roughness height at the wind vane site 0.300 m
Averaging time for sigma-theta values 60 min.
DISPERSION CURVES
Horizontal dispersion curves for sources <100m high Sigma-theta
Vertical dispersion curves for sources <100m high Pasquill-Gifford
Horizontal dispersion curves for sources >100m high Briggs Rural
Vertical dispersion curves for sources >100m high Briggs Rural
Enhance horizontal plume spreads for buoyancy? Yes
Enhance vertical plume spreads for buoyancy? Yes
Adjust horizontal P-G formulae for roughness height? Yes
Adjust vertical P-G formulae for roughness height? Yes
Roughness height 0.400m
Adjustment for wind directional shear None
PLUME RISE OPTIONS
Gradual plume rise? Yes
Stack-tip downwash included? Yes
Building downwash algorithm: PRIME method.
Entrainment coeff. for neutral & stable lapse rates 0.60,0.60
Partial penetration of elevated inversions? No
Disregard temp. gradients in the hourly met. file? No
and in the absence of boundary-layer potential temperature gradients
given by the hourly met. file, a value from the following table
(in K/m) is used:
Wind Speed Stability Class
Category A B C D E F
________________________________________________________
1 0.000 0.000 0.000 0.000 0.020 0.035
2 0.000 0.000 0.000 0.000 0.020 0.035
3 0.000 0.000 0.000 0.000 0.020 0.035
4 0.000 0.000 0.000 0.000 0.020 0.035
5 0.000 0.000 0.000 0.000 0.020 0.035
6 0.000 0.000 0.000 0.000 0.020 0.035
WIND SPEED CATEGORIES
Boundaries between categories (in m/s) are: 1.54, 3.09, 5.14, 8.23, 10.80
WIND PROFILE EXPONENTS: "Irwin Rural" values (unless overridden by met. file)
AVERAGING TIMES
1 hour
_____________________________________________________________________________
5628_WTS_Perisher_FINAL_250211.docx C-3
National Parks and Wildlife Group – NSW DECCW | PAEHolmes Job 5628
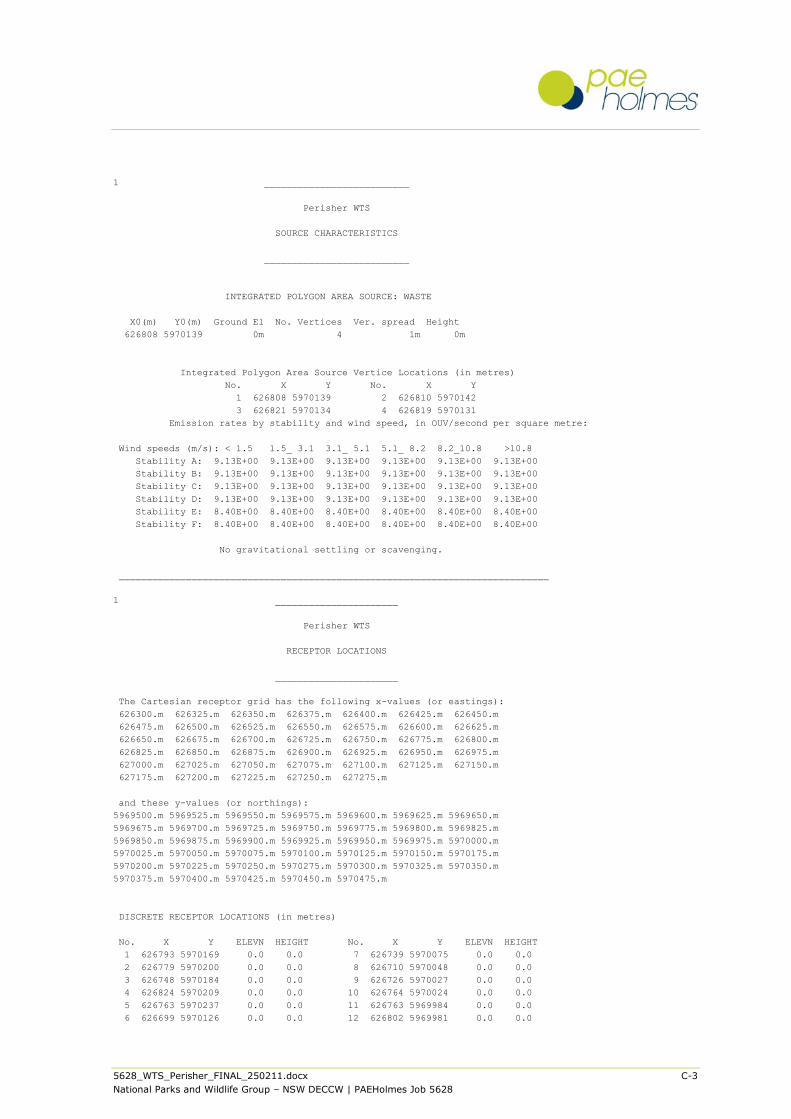
1 __________________________
Perisher WTS
SOURCE CHARACTERISTICS
__________________________
INTEGRATED POLYGON AREA SOURCE: WASTE
X0(m) Y0(m) Ground El No. Vertices Ver. spread Height
626808 5970139 0m 4 1m 0m
Integrated Polygon Area Source Vertice Locations (in metres)
No. X Y No. X Y
1 626808 5970139 2 626810 5970142
3 626821 5970134 4 626819 5970131
Emission rates by stability and wind speed, in OUV/second per square metre:
Wind speeds (m/s): < 1.5 1.5_ 3.1 3.1_ 5.1 5.1_ 8.2 8.2_10.8 >10.8
Stability A: 9.13E+00 9.13E+00 9.13E+00 9.13E+00 9.13E+00 9.13E+00
Stability B: 9.13E+00 9.13E+00 9.13E+00 9.13E+00 9.13E+00 9.13E+00
Stability C: 9.13E+00 9.13E+00 9.13E+00 9.13E+00 9.13E+00 9.13E+00
Stability D: 9.13E+00 9.13E+00 9.13E+00 9.13E+00 9.13E+00 9.13E+00
Stability E: 8.40E+00 8.40E+00 8.40E+00 8.40E+00 8.40E+00 8.40E+00
Stability F: 8.40E+00 8.40E+00 8.40E+00 8.40E+00 8.40E+00 8.40E+00
No gravitational settling or scavenging.
_____________________________________________________________________________
1 ______________________
Perisher WTS
RECEPTOR LOCATIONS
______________________
The Cartesian receptor grid has the following x-values (or eastings):
626300.m 626325.m 626350.m 626375.m 626400.m 626425.m 626450.m
626475.m 626500.m 626525.m 626550.m 626575.m 626600.m 626625.m
626650.m 626675.m 626700.m 626725.m 626750.m 626775.m 626800.m
626825.m 626850.m 626875.m 626900.m 626925.m 626950.m 626975.m
627000.m 627025.m 627050.m 627075.m 627100.m 627125.m 627150.m
627175.m 627200.m 627225.m 627250.m 627275.m
and these y-values (or northings):
5969500.m 5969525.m 5969550.m 5969575.m 5969600.m 5969625.m 5969650.m
5969675.m 5969700.m 5969725.m 5969750.m 5969775.m 5969800.m 5969825.m
5969850.m 5969875.m 5969900.m 5969925.m 5969950.m 5969975.m 5970000.m
5970025.m 5970050.m 5970075.m 5970100.m 5970125.m 5970150.m 5970175.m
5970200.m 5970225.m 5970250.m 5970275.m 5970300.m 5970325.m 5970350.m
5970375.m 5970400.m 5970425.m 5970450.m 5970475.m
DISCRETE RECEPTOR LOCATIONS (in metres)
No. X Y ELEVN HEIGHT No. X Y ELEVN HEIGHT
1 626793 5970169 0.0 0.0 7 626739 5970075 0.0 0.0
2 626779 5970200 0.0 0.0 8 626710 5970048 0.0 0.0
3 626748 5970184 0.0 0.0 9 626726 5970027 0.0 0.0
4 626824 5970209 0.0 0.0 10 626764 5970024 0.0 0.0
5 626763 5970237 0.0 0.0 11 626763 5969984 0.0 0.0
6 626699 5970126 0.0 0.0 12 626802 5969981 0.0 0.0
5628_WTS_Perisher_FINAL_250211.docx C-4
National Parks and Wildlife Group – NSW DECCW | PAEHolmes Job 5628
_____________________________________________________________________________
METEOROLOGICAL DATA : AUSPLUME METFILE
_____________________________________________________________________________
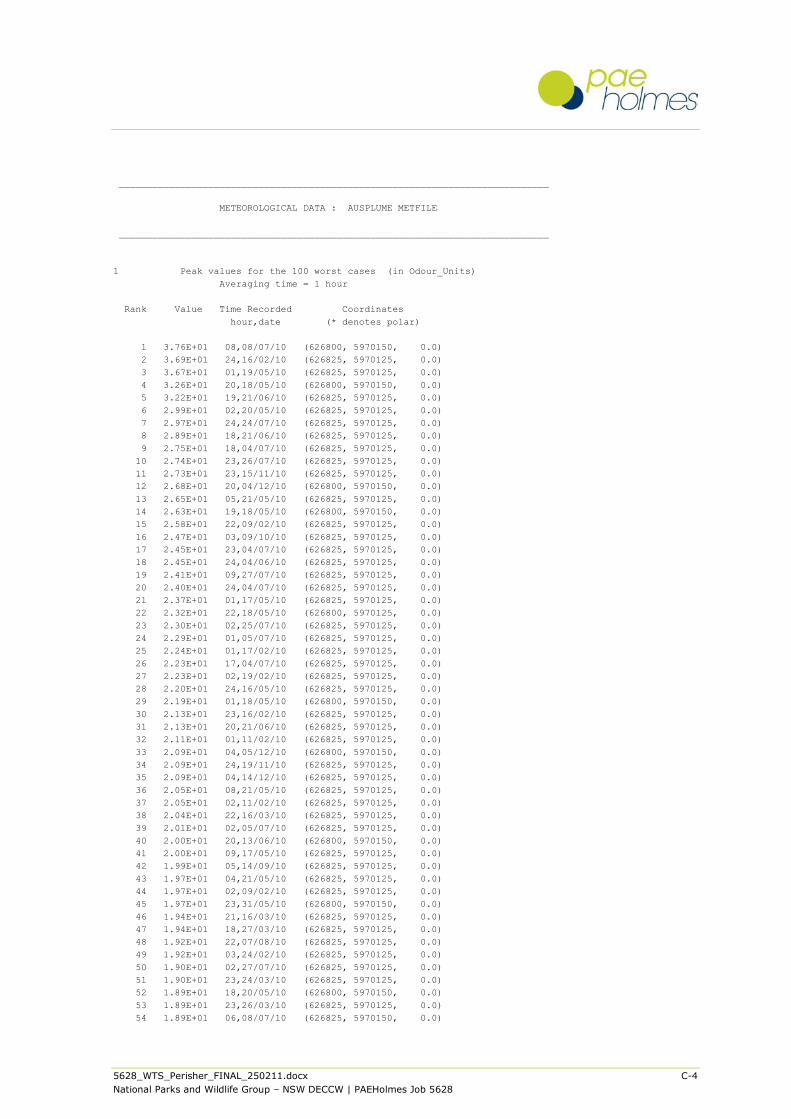
1 Peak values for the 100 worst cases (in Odour_Units)
Averaging time = 1 hour
Rank Value Time Recorded Coordinates
hour,date (* denotes polar)
1 3.76E+01 08,08/07/10 (626800, 5970150, 0.0)
2 3.69E+01 24,16/02/10 (626825, 5970125, 0.0)
3 3.67E+01 01,19/05/10 (626825, 5970125, 0.0)
4 3.26E+01 20,18/05/10 (626800, 5970150, 0.0)
5 3.22E+01 19,21/06/10 (626825, 5970125, 0.0)
6 2.99E+01 02,20/05/10 (626825, 5970125, 0.0)
7 2.97E+01 24,24/07/10 (626825, 5970125, 0.0)
8 2.89E+01 18,21/06/10 (626825, 5970125, 0.0)
9 2.75E+01 18,04/07/10 (626825, 5970125, 0.0)
10 2.74E+01 23,26/07/10 (626825, 5970125, 0.0)
11 2.73E+01 23,15/11/10 (626825, 5970125, 0.0)
12 2.68E+01 20,04/12/10 (626800, 5970150, 0.0)
13 2.65E+01 05,21/05/10 (626825, 5970125, 0.0)
14 2.63E+01 19,18/05/10 (626800, 5970150, 0.0)
15 2.58E+01 22,09/02/10 (626825, 5970125, 0.0)
16 2.47E+01 03,09/10/10 (626825, 5970125, 0.0)
17 2.45E+01 23,04/07/10 (626825, 5970125, 0.0)
18 2.45E+01 24,04/06/10 (626825, 5970125, 0.0)
19 2.41E+01 09,27/07/10 (626825, 5970125, 0.0)
20 2.40E+01 24,04/07/10 (626825, 5970125, 0.0)
21 2.37E+01 01,17/05/10 (626825, 5970125, 0.0)
22 2.32E+01 22,18/05/10 (626800, 5970125, 0.0)
23 2.30E+01 02,25/07/10 (626825, 5970125, 0.0)
24 2.29E+01 01,05/07/10 (626825, 5970125, 0.0)
25 2.24E+01 01,17/02/10 (626825, 5970125, 0.0)
26 2.23E+01 17,04/07/10 (626825, 5970125, 0.0)
27 2.23E+01 02,19/02/10 (626825, 5970125, 0.0)
28 2.20E+01 24,16/05/10 (626825, 5970125, 0.0)
29 2.19E+01 01,18/05/10 (626800, 5970150, 0.0)
30 2.13E+01 23,16/02/10 (626825, 5970125, 0.0)
31 2.13E+01 20,21/06/10 (626825, 5970125, 0.0)
32 2.11E+01 01,11/02/10 (626825, 5970125, 0.0)
33 2.09E+01 04,05/12/10 (626800, 5970150, 0.0)
34 2.09E+01 24,19/11/10 (626825, 5970125, 0.0)
35 2.09E+01 04,14/12/10 (626825, 5970125, 0.0)
36 2.05E+01 08,21/05/10 (626825, 5970125, 0.0)
37 2.05E+01 02,11/02/10 (626825, 5970125, 0.0)
38 2.04E+01 22,16/03/10 (626825, 5970125, 0.0)
39 2.01E+01 02,05/07/10 (626825, 5970125, 0.0)
40 2.00E+01 20,13/06/10 (626800, 5970150, 0.0)
41 2.00E+01 09,17/05/10 (626825, 5970125, 0.0)
42 1.99E+01 05,14/09/10 (626825, 5970125, 0.0)
43 1.97E+01 04,21/05/10 (626825, 5970125, 0.0)
44 1.97E+01 02,09/02/10 (626825, 5970125, 0.0)
45 1.97E+01 23,31/05/10 (626800, 5970150, 0.0)
46 1.94E+01 21,16/03/10 (626825, 5970125, 0.0)
47 1.94E+01 18,27/03/10 (626825, 5970125, 0.0)
48 1.92E+01 22,07/08/10 (626825, 5970125, 0.0)
49 1.92E+01 03,24/02/10 (626825, 5970125, 0.0)
50 1.90E+01 02,27/07/10 (626825, 5970125, 0.0)
51 1.90E+01 23,24/03/10 (626825, 5970125, 0.0)
52 1.89E+01 18,20/05/10 (626800, 5970150, 0.0)
53 1.89E+01 23,26/03/10 (626825, 5970125, 0.0)
54 1.89E+01 06,08/07/10 (626825, 5970150, 0.0)
5628_WTS_Perisher_FINAL_250211.docx C-5
National Parks and Wildlife Group – NSW DECCW | PAEHolmes Job 5628
55 1.88E+01 01,13/01/10 (626825, 5970125, 0.0)
56 1.87E+01 21,31/03/10 (626825, 5970125, 0.0)
57 1.87E+01 24,26/03/10 (626825, 5970125, 0.0)
58 1.84E+01 21,04/07/10 (626825, 5970125, 0.0)
59 1.82E+01 02,01/02/10 (626825, 5970125, 0.0)
60 1.80E+01 19,20/05/10 (626800, 5970150, 0.0)
61 1.80E+01 05,28/12/10 (626825, 5970125, 0.0)
62 1.79E+01 20,20/11/10 (626825, 5970125, 0.0)
63 1.76E+01 19,20/04/10 (626825, 5970125, 0.0)
64 1.75E+01 22,23/07/10 (626825, 5970150, 0.0)
65 1.74E+01 24,15/11/10 (626825, 5970125, 0.0)
66 1.74E+01 01,27/03/10 (626825, 5970125, 0.0)
67 1.74E+01 02,19/05/10 (626825, 5970125, 0.0)
68 1.74E+01 23,07/07/10 (626800, 5970150, 0.0)
69 1.69E+01 02,17/02/10 (626825, 5970125, 0.0)
70 1.69E+01 04,05/04/10 (626825, 5970125, 0.0)
71 1.67E+01 01,25/07/10 (626825, 5970125, 0.0)
72 1.67E+01 23,07/08/10 (626825, 5970125, 0.0)
73 1.66E+01 20,20/04/10 (626825, 5970125, 0.0)
74 1.66E+01 02,17/05/10 (626825, 5970125, 0.0)
75 1.65E+01 03,05/04/10 (626825, 5970125, 0.0)
76 1.63E+01 02,27/03/10 (626825, 5970125, 0.0)
77 1.62E+01 16,12/02/10 (626825, 5970125, 0.0)
78 1.60E+01 24,07/07/10 (626800, 5970150, 0.0)
79 1.60E+01 23,09/02/10 (626825, 5970125, 0.0)
80 1.59E+01 02,05/12/10 (626800, 5970125, 0.0)
81 1.56E+01 23,19/10/10 (626825, 5970150, 0.0)
82 1.56E+01 18,18/05/10 (626800, 5970150, 0.0)
83 1.55E+01 01,19/02/10 (626825, 5970125, 0.0)
84 1.55E+01 20,19/05/10 (626800, 5970125, 0.0)
85 1.54E+01 17,27/03/10 (626825, 5970125, 0.0)
86 1.53E+01 20,04/07/10 (626825, 5970125, 0.0)
87 1.53E+01 03,05/07/10 (626825, 5970125, 0.0)
88 1.51E+01 21,19/05/10 (626800, 5970125, 0.0)
89 1.50E+01 01,01/02/10 (626825, 5970125, 0.0)
90 1.50E+01 03,19/02/10 (626825, 5970125, 0.0)
91 1.50E+01 03,01/11/10 (626825, 5970125, 0.0)
92 1.49E+01 01,09/02/10 (626825, 5970125, 0.0)
93 1.49E+01 04,24/02/10 (626825, 5970125, 0.0)
94 1.49E+01 22,04/12/10 (626800, 5970125, 0.0)
95 1.48E+01 04,30/03/10 (626825, 5970125, 0.0)
96 1.48E+01 04,01/11/10 (626825, 5970125, 0.0)
97 1.47E+01 23,09/01/10 (626800, 5970150, 0.0)
98 1.45E+01 22,24/03/10 (626825, 5970125, 0.0)
99 1.44E+01 23,09/05/10 (626825, 5970125, 0.0)
100 1.44E+01 06,18/04/10 (626825, 5970125, 0.0)


![Panasonic...Durian odour 6 Natural reduction 60tmin.] Sweat odour Nonanoic acid Natural reduction 120[min.] Garbage odour Methylmercaptan Natural reduction 601minJ Scalp odour Panasonic](https://static.fdocuments.in/doc/165x107/60d72199474aa2073d394000/panasonic-durian-odour-6-natural-reduction-60tmin-sweat-odour-nonanoic-acid.jpg)