October 2014 Trends - Alaska Dept of Laborlabor.alaska.gov/trends/oct14.pdf6 OCTOBER 2014 ALASKA...
19
Transcript of October 2014 Trends - Alaska Dept of Laborlabor.alaska.gov/trends/oct14.pdf6 OCTOBER 2014 ALASKA...
2 ALASKA ECONOMIC TRENDSOCTOBER 2014
OCTOBER 2014Volume 34 Number 10
ISSN 0160-3345
INDUSTRY FORECAST OCCUPATIONAL FORECAST
Alaska Economic Trends is a monthly publica on dealing with a wide variety of economic issues in the state. Its purpose is to inform the public about those issues. Trends is funded by the Employment Security Division of the Alaska Department of Labor and Workforce Development. It’s published by the Research and Analysis Sec on. Trends is printed and distributed by Assets, Inc., a voca onal training and employment program, at a cost of $1.37 per copy. Material in this publica on is public informa on, and with appropriate credit may be reproduced without permission.
Sam DapcevichCover Ar st
Sara WhitneyEditor
To request a free electronic or print subscrip on, e-mail [email protected] or call (907) 465-4500.Trends is on the Web at labor.alaska.gov/trends.
Dan RobinsonChief, Research and Analysis
Sean Parnell,Governor
Dianne Blumer,Commissioner
ON THE COVER:
Sunrise over the Gas neau Channel between Juneau and Douglas Island. Photo by Sam Dapcevich
By PAUL MARTZ
ALASKA DEPARTMENT of LABOR
and WORKFORCEDEVELOPMENT
PAGE 4
PAGE 11
ByBy PAUUL MARTZ
PA
2012 to 2022
3ALASKA ECONOMIC TRENDS OCTOBER 2014
Workforce investment priori es align with job projec ons
By Dianne BlumerCommissioner
Alaska remains a state of opportunity.
This issue of Trends details industry and occupational forecasts for Alaska — what occupations will need to be fi lled and which industries will grow the most — between 2012 and 2022. The news continues to be good with business growth, new economic oppor-tunities, and more jobs on the horizon.
Alaska is expected to gain more than 36,000 jobs by 2022, increasing the state’s total job count to more than 370,000. Our employers will also need to fi ll an additional 95,000 replacement openings as workers retire or change careers.
Alaska added almost 1,700 jobs from the fi rst quarter of 2013 to the fi rst quarter of 2014. More information is available online at labor.alaska.gov/news/2014/news14-38.pdf. The Parnell Administration has helped Alaska add 16,000 jobs since 2009.
Demand for health care and social assistance workers remains strong, with projected increases of about 25 percent. Mining jobs are projected to increase 24.8 percent, with oil and gas extraction increasing 15.3 percent.
The increased exploration and produc-tion we’re seeing in Alaska’s oil fi elds and construction of a natural gas pipeline will create even more high-paying jobs.
Alaska’s Top Jobs list identifi es those occupations where wages are in the top 50 percent of all occupations with projected growth of at least 75 jobs, or where projected openings are in the top 50. This list is an excellent tool for stu-dents, parents, educators and training providers, and those seeking a career change. Our administration is focused on ensuring Alaska’s workforce in-vestments are aligned with education, job training, and employment oppor-tunities. By working together, we can better use our resources to ensure we
are producing a workforce to meet the needs of employers and keep Alaska competitive.
The Alaska Department of Labor’s Business Partnerships Division recently launched a new Web page to help track the state’s investment in our workforce system. Alaskans can see these invest-ments by fund and grantee, including programs for young Alaskans, adult workers, and training institutions. Users can fi nd the information at labor.alaska.gov/bp/workforce_investments/.
A recent investment involved help-ing wounded warriors and veterans bridge the gap to civilian employment as carpenters, pipefi tters, and welders on Alaska’s North Slope. Under a State Training and Employment Grant to Alaska Healing Hearts, 16 transitioning service members trained at Northern In-dustrial Training and have secured craft positions on the Point Thomson Project.
The outcome of our partnership with CH2M HILL Alaska, NIT, Hero2Hired, and Alaska Healing Hearts doesn’t get any better as this training program hit the bull’s eye on three critical compo-nents: Alaska hire, veteran hire, and 100 percent job placement.
That’s what investing in Alaska’s talent pipeline is all about.
We also continue to focus on connect-ing job seekers and Alaska employers through our Alaska Job Center Network and Business Connections with work-shops, recruitments, and fairs.
One of our most popular events is the annual Alaska Veterans Job Fair. On Friday, Nov. 7 at the University Center in Anchorage, more than 100 employers will have the opportunity to visit with more than 1,000 veterans, transitioning soldiers, and their families. For more details about the event, including con-tact information, go to jobs.alaska.gov/jobfairs/.
Follow the Alaska Department of Labor and Workforce Development on Facebook (facebook.com/alaskalabor) and Twi er (twi er.com/alaskalabor) for the latest news about jobs, workplace safety, and workforce development.
4 ALASKA ECONOMIC TRENDSOCTOBER 2014
By PAUL MARTZ
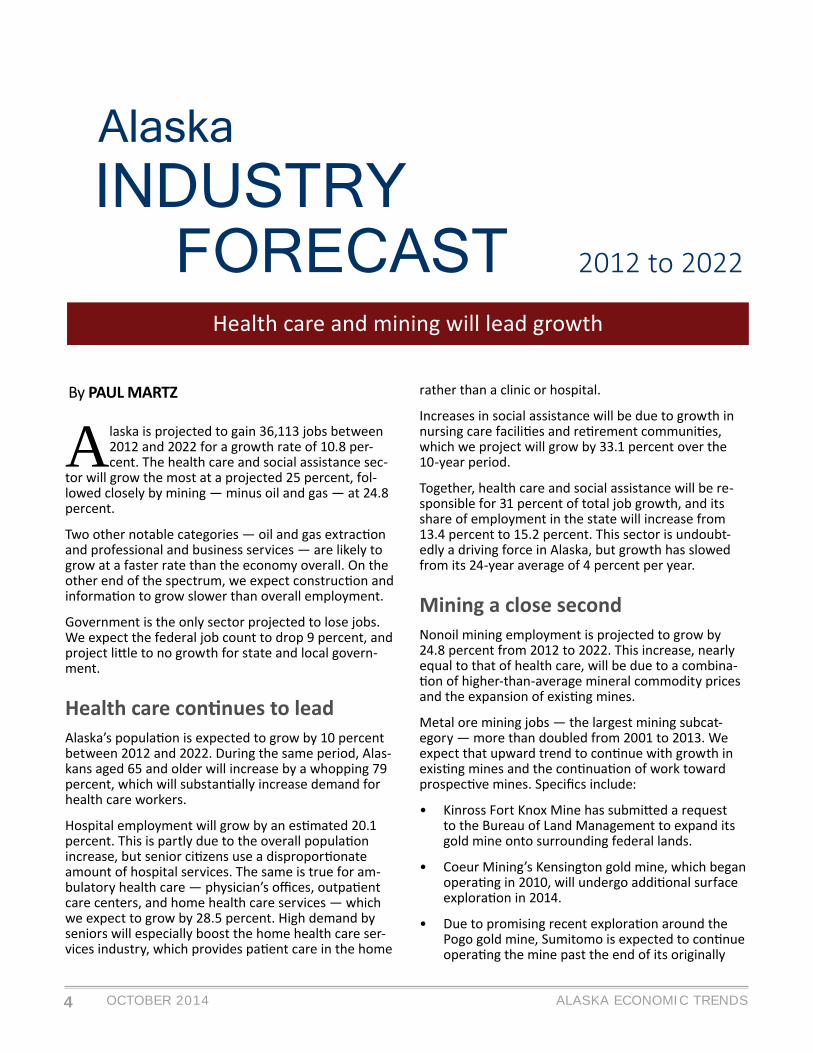
Health care and mining will lead growth
Alaska INDUSTRY FORECAST 2012 to 2022
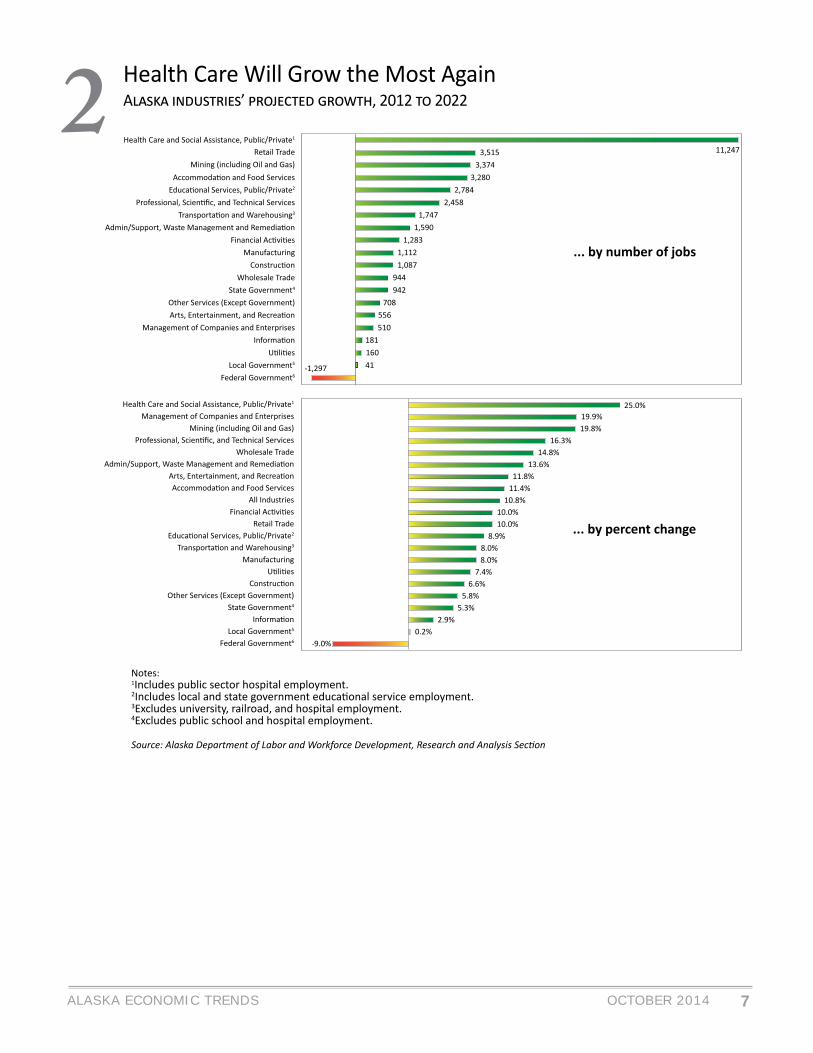
Alaska is projected to gain 36,113 jobs between 2012 and 2022 for a growth rate of 10.8 per-cent. The health care and social assistance sec-
tor will grow the most at a projected 25 percent, fol-lowed closely by mining — minus oil and gas — at 24.8 percent.
Two other notable categories — oil and gas extrac on and professional and business services — are likely to grow at a faster rate than the economy overall. On the other end of the spectrum, we expect construc on and informa on to grow slower than overall employment.
Government is the only sector projected to lose jobs. We expect the federal job count to drop 9 percent, and project li le to no growth for state and local govern-ment.
Health care con nues to lead Alaska’s popula on is expected to grow by 10 percent between 2012 and 2022. During the same period, Alas-kans aged 65 and older will increase by a whopping 79 percent, which will substan ally increase demand for health care workers.
Hospital employment will grow by an es mated 20.1 percent. This is partly due to the overall popula on increase, but senior ci zens use a dispropor onate amount of hospital services. The same is true for am-bulatory health care — physician’s offi ces, outpa ent care centers, and home health care services — which we expect to grow by 28.5 percent. High demand by seniors will especially boost the home health care ser-vices industry, which provides pa ent care in the home
rather than a clinic or hospital.
Increases in social assistance will be due to growth in nursing care facili es and re rement communi es, which we project will grow by 33.1 percent over the 10-year period.
Together, health care and social assistance will be re-sponsible for 31 percent of total job growth, and its share of employment in the state will increase from 13.4 percent to 15.2 percent. This sector is undoubt-edly a driving force in Alaska, but growth has slowed from its 24-year average of 4 percent per year.
Mining a close second
Nonoil mining employment is projected to grow by 24.8 percent from 2012 to 2022. This increase, nearly equal to that of health care, will be due to a combina- on of higher-than-average mineral commodity prices
and the expansion of exis ng mines.
Metal ore mining jobs — the largest mining subcat-egory — more than doubled from 2001 to 2013. We expect that upward trend to con nue with growth in exis ng mines and the con nua on of work toward prospec ve mines. Specifi cs include:
• Kinross Fort Knox Mine has submi ed a request to the Bureau of Land Management to expand its gold mine onto surrounding federal lands.
• Coeur Mining’s Kensington gold mine, which began opera ng in 2010, will undergo addi onal surface explora on in 2014.
• Due to promising recent explora on around the Pogo gold mine, Sumitomo is expected to con nue opera ng the mine past the end of its originally
5ALASKA ECONOMIC TRENDS OCTOBER 2014
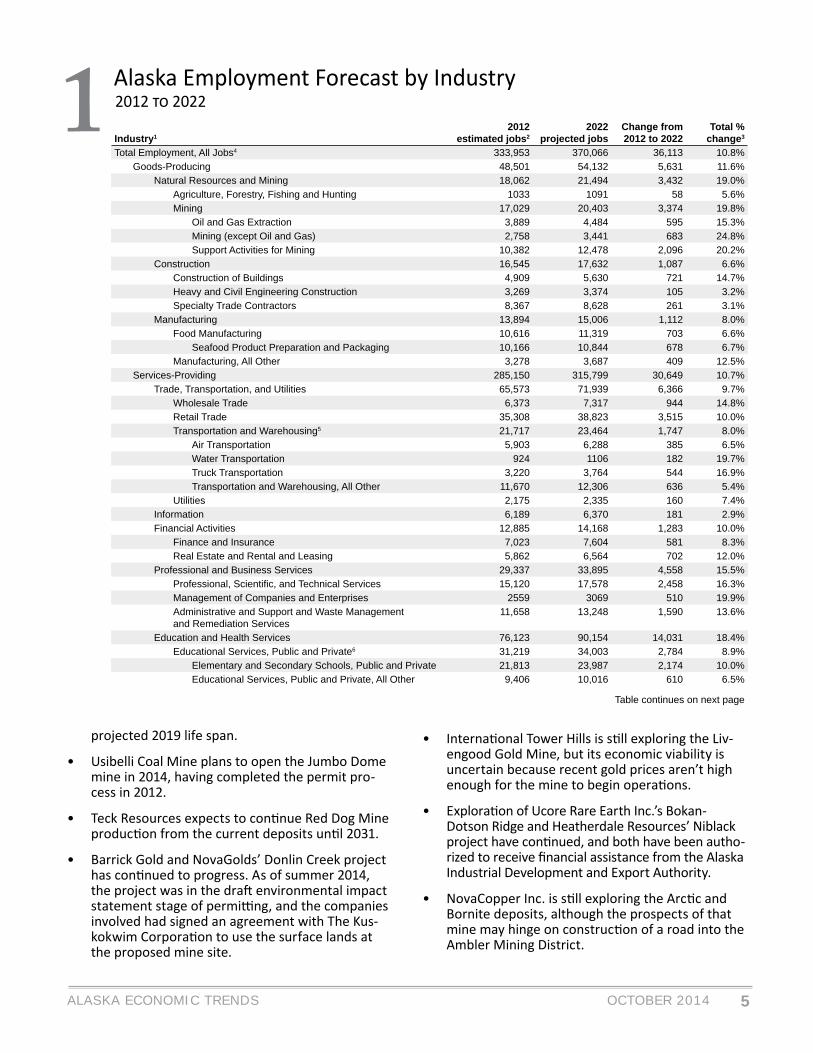
Alaska Employment Forecast by Industry 1 2012 2022
Industry12012
estimated jobs22022
projected jobsChange from 2012 to 2022
Total % change3
Total Employment, All Jobs4 333,953 370,066 36,113 10.8%Goods-Producing 48,501 54,132 5,631 11.6%
Natural Resources and Mining 18,062 21,494 3,432 19.0%Agriculture, Forestry, Fishing and Hunting 1033 1091 58 5.6%Mining 17,029 20,403 3,374 19.8%
Oil and Gas Extraction 3,889 4,484 595 15.3%Mining (except Oil and Gas) 2,758 3,441 683 24.8%Support Activities for Mining 10,382 12,478 2,096 20.2%
Construction 16,545 17,632 1,087 6.6%Construction of Buildings 4,909 5,630 721 14.7%Heavy and Civil Engineering Construction 3,269 3,374 105 3.2%Specialty Trade Contractors 8,367 8,628 261 3.1%
Manufacturing 13,894 15,006 1,112 8.0%Food Manufacturing 10,616 11,319 703 6.6%
Seafood Product Preparation and Packaging 10,166 10,844 678 6.7%Manufacturing, All Other 3,278 3,687 409 12.5%
Services-Providing 285,150 315,799 30,649 10.7%Trade, Transportation, and Utilities 65,573 71,939 6,366 9.7%
Wholesale Trade 6,373 7,317 944 14.8%Retail Trade 35,308 38,823 3,515 10.0%Transportation and Warehousing5 21,717 23,464 1,747 8.0%
Air Transportation 5,903 6,288 385 6.5%Water Transportation 924 1106 182 19.7%Truck Transportation 3,220 3,764 544 16.9%Transportation and Warehousing, All Other 11,670 12,306 636 5.4%
Utilities 2,175 2,335 160 7.4%Information 6,189 6,370 181 2.9%Financial Activities 12,885 14,168 1,283 10.0%
Finance and Insurance 7,023 7,604 581 8.3%Real Estate and Rental and Leasing 5,862 6,564 702 12.0%
Professional and Business Services 29,337 33,895 4,558 15.5%Professional, Scientifi c, and Technical Services 15,120 17,578 2,458 16.3%Management of Companies and Enterprises 2559 3069 510 19.9%Administrative and Support and Waste Managementand Remediation Services
11,658 13,248 1,590 13.6%
Education and Health Services 76,123 90,154 14,031 18.4%Educational Services, Public and Private6 31,219 34,003 2,784 8.9%
Elementary and Secondary Schools, Public and Private 21,813 23,987 2,174 10.0%Educational Services, Public and Private, All Other 9,406 10,016 610 6.5%
Table continues on next page
projected 2019 life span.
• Usibelli Coal Mine plans to open the Jumbo Dome mine in 2014, having completed the permit pro-cess in 2012.
• Teck Resources expects to con nue Red Dog Mine produc on from the current deposits un l 2031.
• Barrick Gold and NovaGolds’ Donlin Creek project has con nued to progress. As of summer 2014, the project was in the dra environmental impact statement stage of permi ng, and the companies involved had signed an agreement with The Kus-kokwim Corpora on to use the surface lands at the proposed mine site.
• Interna onal Tower Hills is s ll exploring the Liv-engood Gold Mine, but its economic viability is uncertain because recent gold prices aren’t high enough for the mine to begin opera ons.
• Explora on of Ucore Rare Earth Inc.’s Bokan-Dotson Ridge and Heatherdale Resources’ Niblack project have con nued, and both have been autho-rized to receive fi nancial assistance from the Alaska Industrial Development and Export Authority.
• NovaCopper Inc. is s ll exploring the Arc c and Bornite deposits, although the prospects of that mine may hinge on construc on of a road into the Ambler Mining District.
6 ALASKA ECONOMIC TRENDSOCTOBER 2014
Alaska Employment Forecast by Industry, con nued 1 2012 2022
Industry12012
estimated jobs22022
projected jobsChange from 2012 to 2022
Total % change3
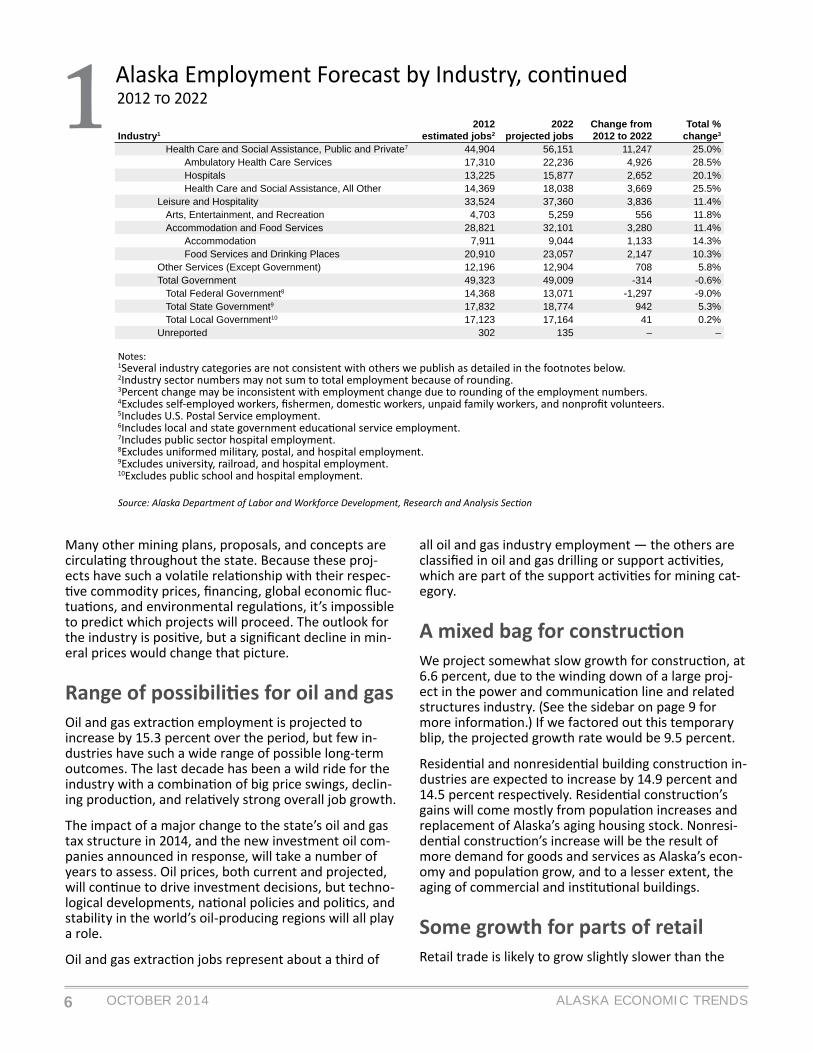
Health Care and Social Assistance, Public and Private7 44,904 56,151 11,247 25.0%Ambulatory Health Care Services 17,310 22,236 4,926 28.5%Hospitals 13,225 15,877 2,652 20.1%Health Care and Social Assistance, All Other 14,369 18,038 3,669 25.5%
Leisure and Hospitality 33,524 37,360 3,836 11.4%Arts, Entertainment, and Recreation 4,703 5,259 556 11.8%Accommodation and Food Services 28,821 32,101 3,280 11.4%
Accommodation 7,911 9,044 1,133 14.3%Food Services and Drinking Places 20,910 23,057 2,147 10.3%
Other Services (Except Government) 12,196 12,904 708 5.8%Total Government 49,323 49,009 -314 -0.6%
Total Federal Government8 14,368 13,071 -1,297 -9.0%Total State Government9 17,832 18,774 942 5.3%Total Local Government10 17,123 17,164 41 0.2%
Unreported 302 135 – –
Notes:1Several industry categories are not consistent with others we publish as detailed in the footnotes below.2Industry sector numbers may not sum to total employment because of rounding.3Percent change may be inconsistent with employment change due to rounding of the employment numbers.4Excludes self-employed workers, fi shermen, domes c workers, unpaid family workers, and nonprofi t volunteers.5Includes U.S. Postal Service employment.6Includes local and state government educa onal service employment.7Includes public sector hospital employment.8Excludes uniformed military, postal, and hospital employment.9Excludes university, railroad, and hospital employment.10Excludes public school and hospital employment.
Source: Alaska Department of Labor and Workforce Development, Research and Analysis Sec on
Many other mining plans, proposals, and concepts are circula ng throughout the state. Because these proj-ects have such a vola le rela onship with their respec- ve commodity prices, fi nancing, global economic fl uc-
tua ons, and environmental regula ons, it’s impossible to predict which projects will proceed. The outlook for the industry is posi ve, but a signifi cant decline in min-eral prices would change that picture.
Range of possibili es for oil and gas
Oil and gas extrac on employment is projected to increase by 15.3 percent over the period, but few in-dustries have such a wide range of possible long-term outcomes. The last decade has been a wild ride for the industry with a combina on of big price swings, declin-ing produc on, and rela vely strong overall job growth.
The impact of a major change to the state’s oil and gas tax structure in 2014, and the new investment oil com-panies announced in response, will take a number of years to assess. Oil prices, both current and projected, will con nue to drive investment decisions, but techno-logical developments, na onal policies and poli cs, and stability in the world’s oil-producing regions will all play a role.
Oil and gas extrac on jobs represent about a third of
all oil and gas industry employment — the others are classifi ed in oil and gas drilling or support ac vi es, which are part of the support ac vi es for mining cat-egory.
A mixed bag for construc onWe project somewhat slow growth for construc on, at 6.6 percent, due to the winding down of a large proj-ect in the power and communica on line and related structures industry. (See the sidebar on page 9 for more informa on.) If we factored out this temporary blip, the projected growth rate would be 9.5 percent.
Residen al and nonresiden al building construc on in-dustries are expected to increase by 14.9 percent and 14.5 percent respec vely. Residen al construc on’s gains will come mostly from popula on increases and replacement of Alaska’s aging housing stock. Nonresi-den al construc on’s increase will be the result of more demand for goods and services as Alaska’s econ-omy and popula on grow, and to a lesser extent, the aging of commercial and ins tu onal buildings.
Some growth for parts of retailRetail trade is likely to grow slightly slower than the
7ALASKA ECONOMIC TRENDS OCTOBER 2014
Health Care Will Grow the Most AgainA ’ , 2012 20222
Notes: 1Includes public sector hospital employment.2Includes local and state government educa onal service employment.3Excludes university, railroad, and hospital employment.4Excludes public school and hospital employment.
Source: Alaska Department of Labor and Workforce Development, Research and Analysis Sec on
Federal Government6
Local Government5
State Government4
3
2
1
-9.0%0.2%
2.9%5.3%
5.8%6.6%
7.4%8.0%8.0%
8.9%10.0%10.0%
10.8%11.4%11.8%
13.6%14.8%
16.3%19.8%19.9%
25.0%
Federal Government6
Local Government5
State Government4
3
2
1
... by number of jobs
... by percent change
41160181
510556
708942944
8 ALASKA ECONOMIC TRENDSOCTOBER 2014
overall economy, at 10 percent over the 10-year peri-od. Changing consumer behavior suggests sales will lag at electronics and appliance stores as well as book, pe-riodical, and music stores. Clothing and clothing acces-sory stores are also likely to weigh down job growth, as they haven’t rebounded since losing approximately 200 jobs in 2009.
On the growth side, we expect health and personal care stores to add 374 jobs due to an aging popula on and more demand for over-the-counter health care supplies and medica ons.
This industry has already begun to expand in Alaska with Walgreen’s opening stores in the Anchorage/Matanuska-Susitna area in 2009. Two more stores are scheduled to open in Fairbanks in 2014. And as we’ve seen in other industries, once a na onal chain opens in Alaska, its compe on soon follows.
Growth in motor vehicle and parts dealers, along with department stores, will likely top 16 percent. The re-cession hit automo ve industries hard, but job growth has accelerated as consumers regain confi dence. De-partment store employment has been rela vely fl at
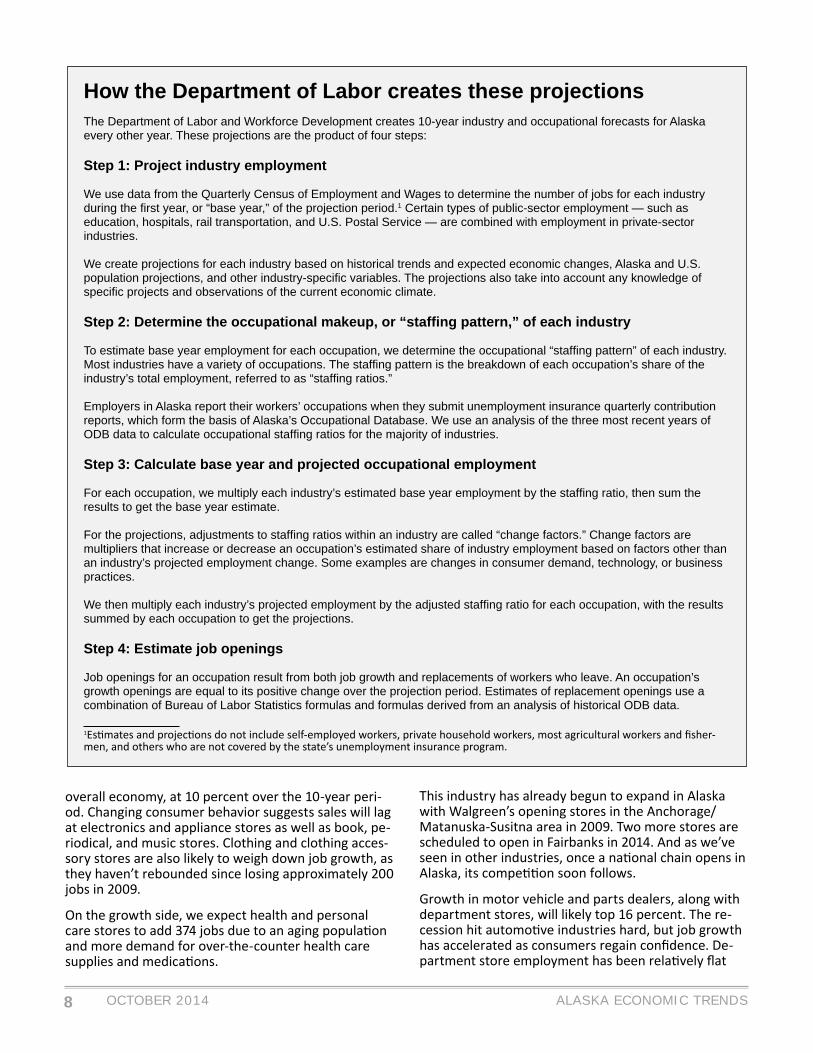
How the Department of Labor creates these projectionsThe Department of Labor and Workforce Development creates 10-year industry and occupational forecasts for Alaska every other year. These projections are the product of four steps:
Step 1: Project industry employment
We use data from the Quarterly Census of Employment and Wages to determine the number of jobs for each industry during the fi rst year, or “base year,” of the projection period.1 Certain types of public-sector employment — such as education, hospitals, rail transportation, and U.S. Postal Service — are combined with employment in private-sector industries.
We create projections for each industry based on historical trends and expected economic changes, Alaska and U.S. population projections, and other industry-specifi c variables. The projections also take into account any knowledge of specifi c projects and observations of the current economic climate.
Step 2: Determine the occupational makeup, or “staffi ng pattern,” of each industry
To estimate base year employment for each occupation, we determine the occupational “staffi ng pattern” of each industry. Most industries have a variety of occupations. The staffi ng pattern is the breakdown of each occupation’s share of the industry’s total employment, referred to as “staffi ng ratios.”
Employers in Alaska report their workers’ occupations when they submit unemployment insurance quarterly contribution reports, which form the basis of Alaska’s Occupational Database. We use an analysis of the three most recent years of ODB data to calculate occupational staffi ng ratios for the majority of industries.
Step 3: Calculate base year and projected occupational employment
For each occupation, we multiply each industry’s estimated base year employment by the staffi ng ratio, then sum the results to get the base year estimate.
For the projections, adjustments to staffi ng ratios within an industry are called “change factors.” Change factors are multipliers that increase or decrease an occupation’s estimated share of industry employment based on factors other than an industry’s projected employment change. Some examples are changes in consumer demand, technology, or business practices.
We then multiply each industry’s projected employment by the adjusted staffi ng ratio for each occupation, with the results summed by each occupation to get the projections.
Step 4: Estimate job openings
Job openings for an occupation result from both job growth and replacements of workers who leave. An occupation’s growth openings are equal to its positive change over the projection period. Estimates of replacement openings use a combination of Bureau of Labor Statistics formulas and formulas derived from an analysis of historical ODB data.
1Es mates and projec ons do not include self-employed workers, private household workers, most agricultural workers and fi sher-men, and others who are not covered by the state’s unemployment insurance program.
9ALASKA ECONOMIC TRENDS OCTOBER 2014
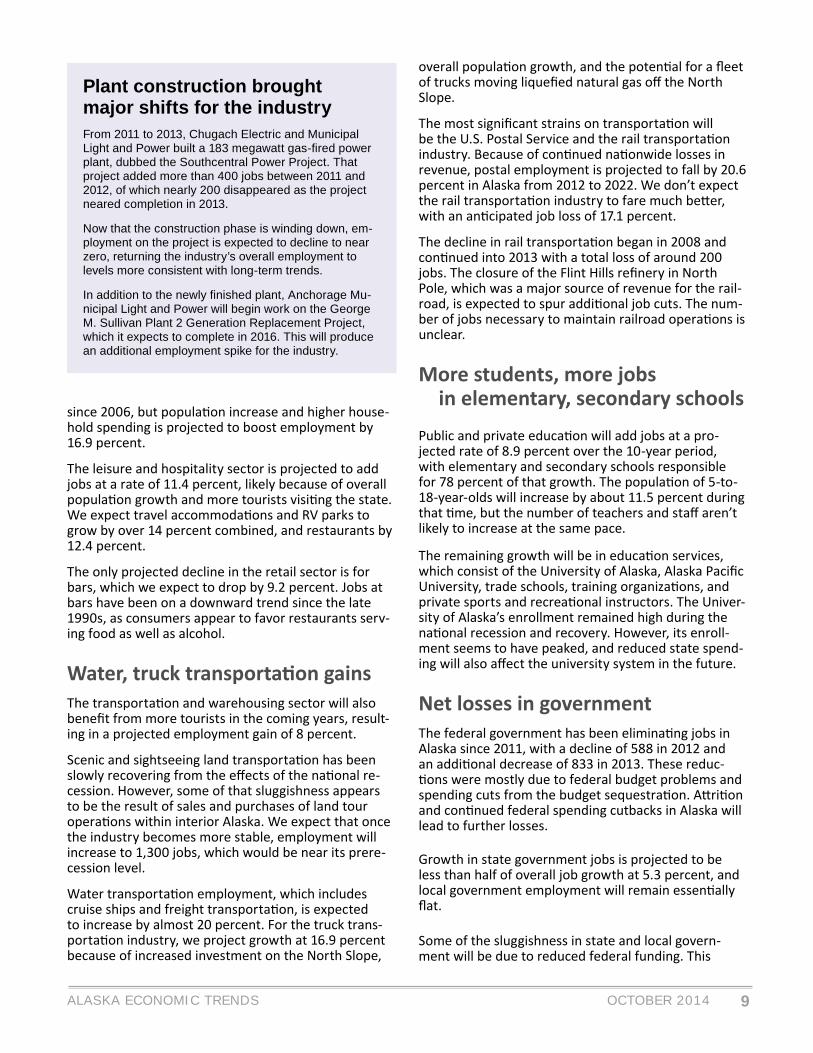
Plant construction broughtmajor shifts for the industryFrom 2011 to 2013, Chugach Electric and Municipal Light and Power built a 183 megawatt gas-fi red power plant, dubbed the Southcentral Power Project. That project added more than 400 jobs between 2011 and 2012, of which nearly 200 disappeared as the project neared completion in 2013.
Now that the construction phase is winding down, em-ployment on the project is expected to decline to near zero, returning the industry’s overall employment to levels more consistent with long-term trends.
In addition to the newly fi nished plant, Anchorage Mu-nicipal Light and Power will begin work on the George M. Sullivan Plant 2 Generation Replacement Project, which it expects to complete in 2016. This will produce an additional employment spike for the industry.
since 2006, but popula on increase and higher house-hold spending is projected to boost employment by 16.9 percent.
The leisure and hospitality sector is projected to add jobs at a rate of 11.4 percent, likely because of overall popula on growth and more tourists visi ng the state. We expect travel accommoda ons and RV parks to grow by over 14 percent combined, and restaurants by 12.4 percent.
The only projected decline in the retail sector is for bars, which we expect to drop by 9.2 percent. Jobs at bars have been on a downward trend since the late 1990s, as consumers appear to favor restaurants serv-ing food as well as alcohol.
Water, truck transporta on gainsThe transporta on and warehousing sector will also benefi t from more tourists in the coming years, result-ing in a projected employment gain of 8 percent.
Scenic and sightseeing land transporta on has been slowly recovering from the eff ects of the na onal re-cession. However, some of that sluggishness appears to be the result of sales and purchases of land tour opera ons within interior Alaska. We expect that once the industry becomes more stable, employment will increase to 1,300 jobs, which would be near its prere-cession level.
Water transporta on employment, which includes cruise ships and freight transporta on, is expected to increase by almost 20 percent. For the truck trans-porta on industry, we project growth at 16.9 percent because of increased investment on the North Slope,
overall popula on growth, and the poten al for a fl eet of trucks moving liquefi ed natural gas off the North Slope.
The most signifi cant strains on transporta on will be the U.S. Postal Service and the rail transporta on industry. Because of con nued na onwide losses in revenue, postal employment is projected to fall by 20.6 percent in Alaska from 2012 to 2022. We don’t expect the rail transporta on industry to fare much be er, with an an cipated job loss of 17.1 percent.
The decline in rail transporta on began in 2008 and con nued into 2013 with a total loss of around 200 jobs. The closure of the Flint Hills refi nery in North Pole, which was a major source of revenue for the rail-road, is expected to spur addi onal job cuts. The num-ber of jobs necessary to maintain railroad opera ons is unclear.
More students, more jobs in elementary, secondary schoolsPublic and private educa on will add jobs at a pro-jected rate of 8.9 percent over the 10-year period, with elementary and secondary schools responsible for 78 percent of that growth. The popula on of 5-to-18-year-olds will increase by about 11.5 percent during that me, but the number of teachers and staff aren’t likely to increase at the same pace.
The remaining growth will be in educa on services, which consist of the University of Alaska, Alaska Pacifi c University, trade schools, training organiza ons, and private sports and recrea onal instructors. The Univer-sity of Alaska’s enrollment remained high during the na onal recession and recovery. However, its enroll-ment seems to have peaked, and reduced state spend-ing will also aff ect the university system in the future.
Net losses in governmentThe federal government has been elimina ng jobs in Alaska since 2011, with a decline of 588 in 2012 and an addi onal decrease of 833 in 2013. These reduc- ons were mostly due to federal budget problems and
spending cuts from the budget sequestra on. A ri on and con nued federal spending cutbacks in Alaska will lead to further losses.
Growth in state government jobs is projected to be less than half of overall job growth at 5.3 percent, and local government employment will remain essen ally fl at.
Some of the sluggishness in state and local govern-ment will be due to reduced federal funding. This
10 ALASKA ECONOMIC TRENDSOCTOBER 2014
downward pressure will be compounded by budget pressure at the state and local levels.
Tradi onal media will con nue to declineThe informa on sector is expected to grow by about 3 percent, but employment in tradi onal media will shrink. Newspaper, periodical, book, and directory publishers will cut jobs by 9.8 percent over the 10-year period. Broadcas ng, excluding Internet, will also con- nue to decline, with projected losses near 12 percent.
Though we’ve seen some telecommunica ons losses in the past few years, Verizon’s arrival in the state will likely prop up employment numbers for a projected growth rate of 3.4 percent. We expect the largest in-crease in data processing and hos ng employment, which will nearly double.
Professional, scien fi c, and technical servicesThe projected growth rate for the professional, sci-en fi c, and technical services sector is 16.3 percent, with above-average growth in 10 of its 17 sectors. Only legal services is likely to decline, at a projected job loss of 11.8 percent.
We project the largest total job growth for the engi-neering and dra ing services industry, at 740 jobs. In terms of the largest percentage, the research and development industry will gain a projected 80 jobs, a growth rate of 51.5 percent.
Most of the industries in this sector grew considerably over the previous decade, which will con nue with an an cipated increase in expenditures on the North Slope as well as addi onal expenditures toward devel-opment of an in-state natural gas pipeline.
11ALASKA ECONOMIC TRENDS OCTOBER 2014
By PAUL MARTZ
Most ‘top jobs’ connected to an aging popula on
Alaska OCCUPATIONAL FORECAST 2012 to 2022
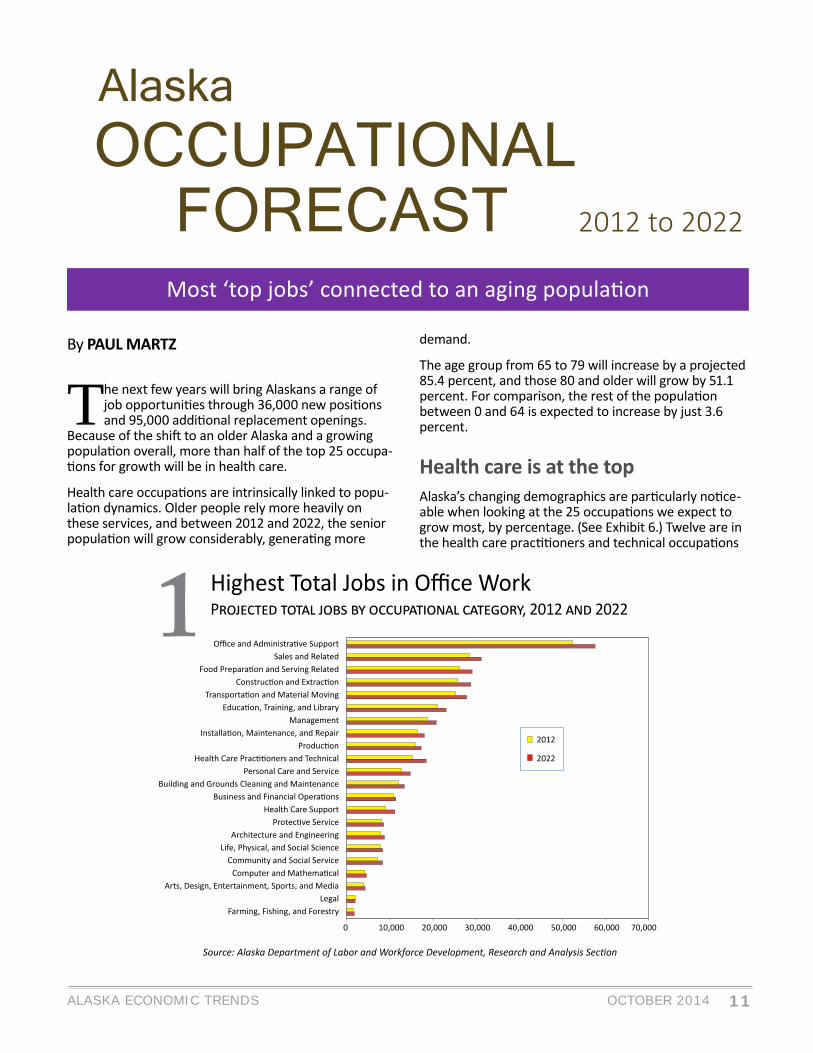
1 Highest Total Jobs in Offi ce WorkP , 2012 2022
Source: Alaska Department of Labor and Workforce Development, Research and Analysis Sec on
0 10,000 20,000 30,000 40,000 50,000 60,000 70,000
Farming, Fishing, and ForestryLegal
Arts, Design, Entertainment, Sports, and Media
Health Care Support
Management
2012
2022
The next few years will bring Alaskans a range of job opportuni es through 36,000 new posi ons and 95,000 addi onal replacement openings.
Because of the shi to an older Alaska and a growing popula on overall, more than half of the top 25 occupa- ons for growth will be in health care.
Health care occupa ons are intrinsically linked to popu-la on dynamics. Older people rely more heavily on these services, and between 2012 and 2022, the senior popula on will grow considerably, genera ng more
demand.
The age group from 65 to 79 will increase by a projected 85.4 percent, and those 80 and older will grow by 51.1 percent. For comparison, the rest of the popula on between 0 and 64 is expected to increase by just 3.6 percent.
Health care is at the topAlaska’s changing demographics are par cularly no ce-able when looking at the 25 occupa ons we expect to grow most, by percentage. (See Exhibit 6.) Twelve are in the health care prac oners and technical occupa ons
12 ALASKA ECONOMIC TRENDSOCTOBER 2014
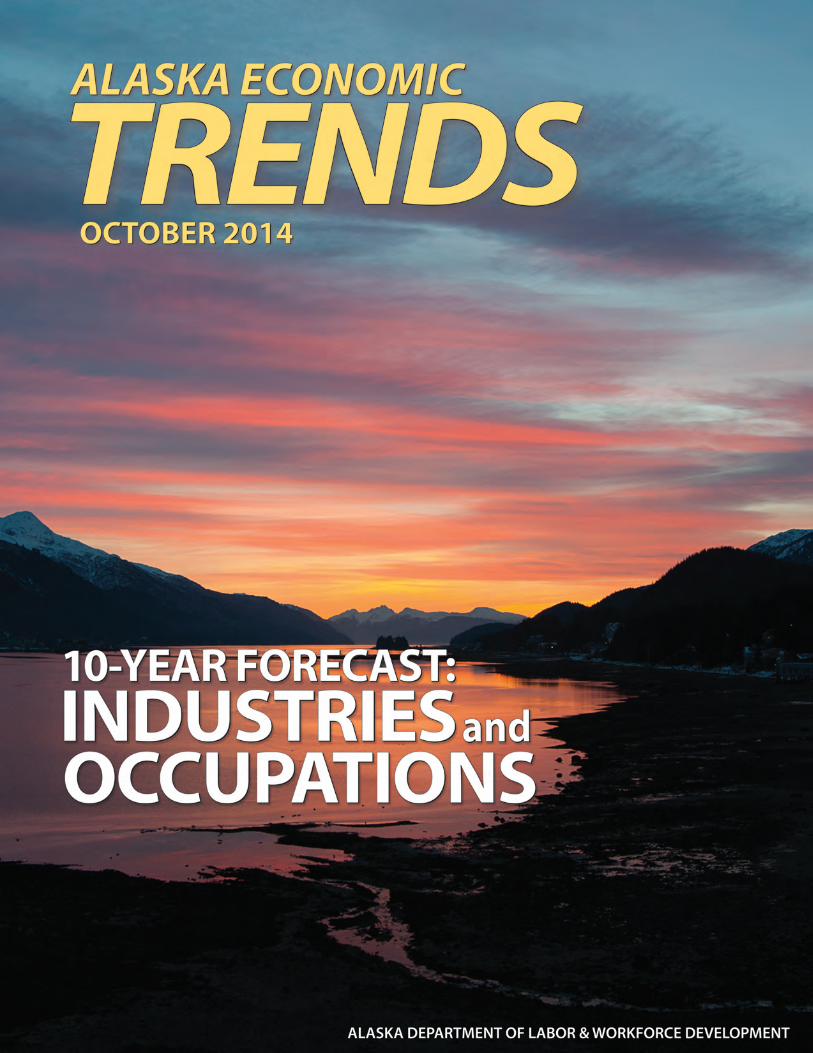
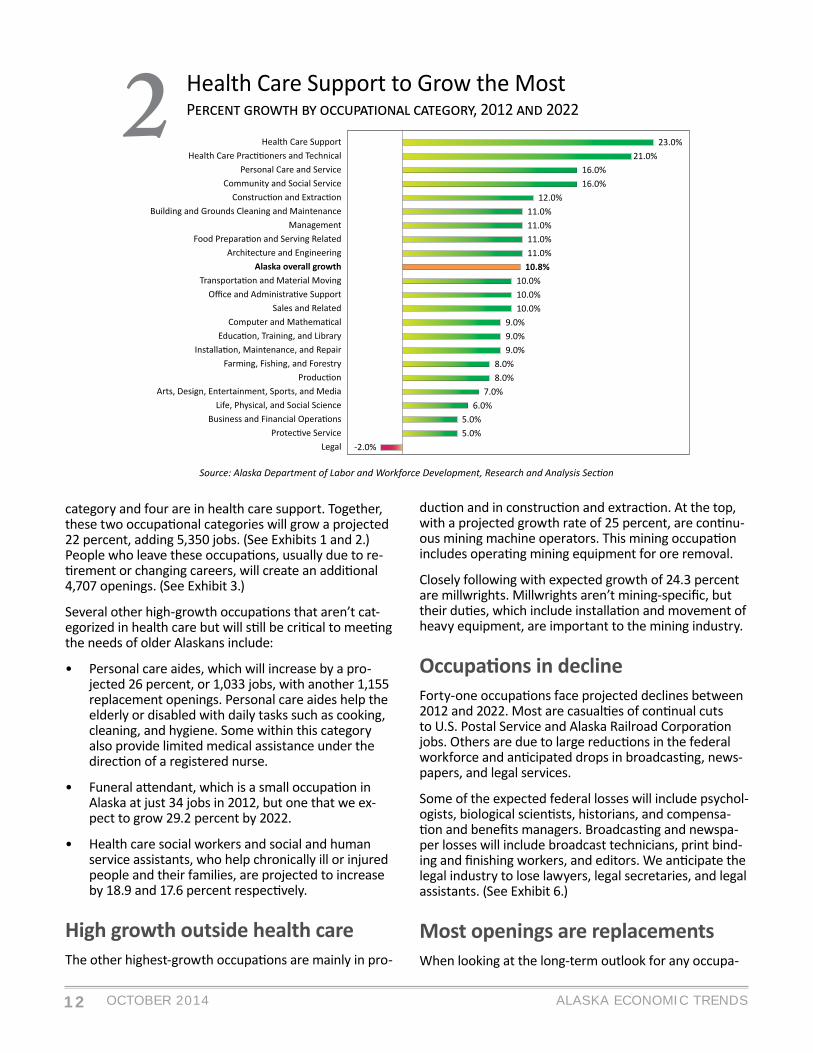
2 Health Care Support to Grow the MostP , 2012 2022
Source: Alaska Department of Labor and Workforce Development, Research and Analysis Sec on
-2.0%5.0%5.0%
6.0%7.0%
8.0%8.0%
9.0%9.0%9.0%
10.0%10.0%10.0%
10.8%11.0%11.0%11.0%11.0%
12.0%16.0%16.0%
21.0%23.0%
Legal
Alaska overall growth
category and four are in health care support. Together, these two occupa onal categories will grow a projected 22 percent, adding 5,350 jobs. (See Exhibits 1 and 2.) People who leave these occupa ons, usually due to re- rement or changing careers, will create an addi onal
4,707 openings. (See Exhibit 3.)
Several other high-growth occupa ons that aren’t cat-egorized in health care but will s ll be cri cal to mee ng the needs of older Alaskans include:
• Personal care aides, which will increase by a pro-jected 26 percent, or 1,033 jobs, with another 1,155 replacement openings. Personal care aides help the elderly or disabled with daily tasks such as cooking, cleaning, and hygiene. Some within this category also provide limited medical assistance under the direc on of a registered nurse.
• Funeral a endant, which is a small occupa on in Alaska at just 34 jobs in 2012, but one that we ex-pect to grow 29.2 percent by 2022.
• Health care social workers and social and human service assistants, who help chronically ill or injured people and their families, are projected to increase by 18.9 and 17.6 percent respec vely.
High growth outside health careThe other highest-growth occupa ons are mainly in pro-
duc on and in construc on and extrac on. At the top, with a projected growth rate of 25 percent, are con nu-ous mining machine operators. This mining occupa on includes opera ng mining equipment for ore removal.
Closely following with expected growth of 24.3 percent are millwrights. Millwrights aren’t mining-specifi c, but their du es, which include installa on and movement of heavy equipment, are important to the mining industry.
Occupa ons in declineForty-one occupa ons face projected declines between 2012 and 2022. Most are casual es of con nual cuts to U.S. Postal Service and Alaska Railroad Corpora on jobs. Others are due to large reduc ons in the federal workforce and an cipated drops in broadcas ng, news-papers, and legal services.
Some of the expected federal losses will include psychol-ogists, biological scien sts, historians, and compensa- on and benefi ts managers. Broadcas ng and newspa-
per losses will include broadcast technicians, print bind-ing and fi nishing workers, and editors. We an cipate the legal industry to lose lawyers, legal secretaries, and legal assistants. (See Exhibit 6.)
Most openings are replacementsWhen looking at the long-term outlook for any occupa-
13ALASKA ECONOMIC TRENDS OCTOBER 2014
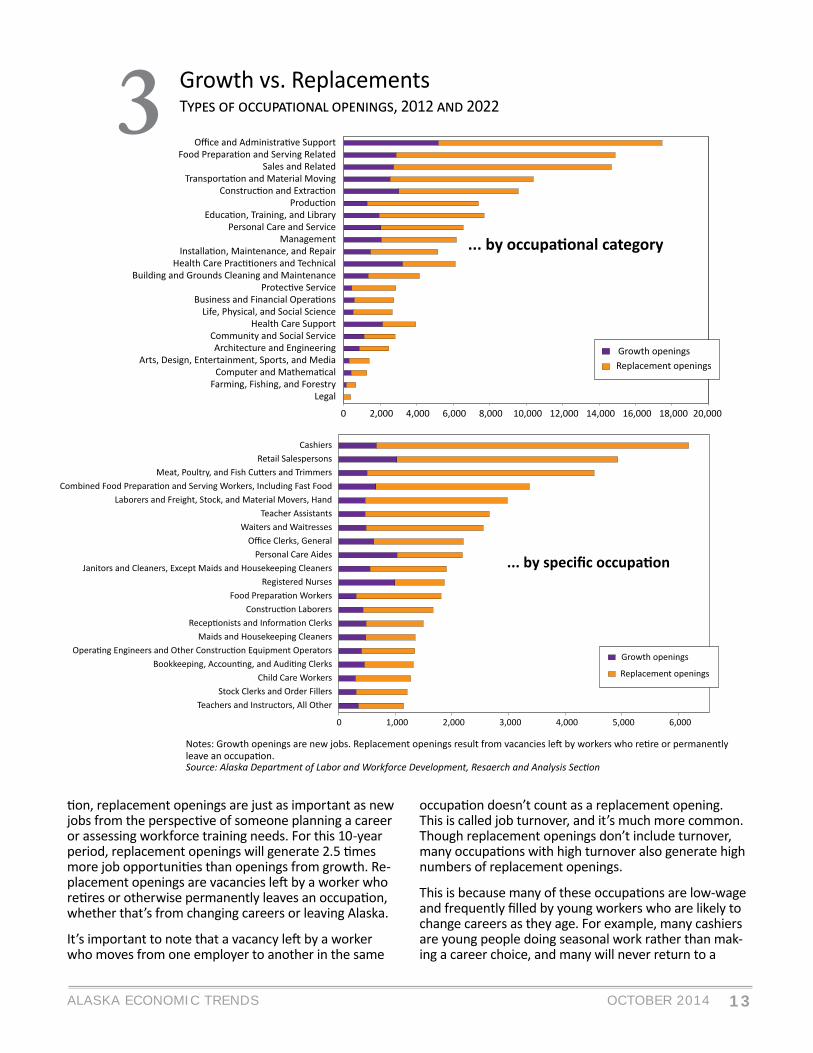
3 Growth vs. Replacements T , 2012 2022
0 2,000 4,000 6,000 8,000 10,000 12,000 14,000 16,000 18,000 20,000
LegalFarming, Fishing, and Forestry
Arts, Design, Entertainment, Sports, and Media
Health Care Support
Management
Growth openings
Notes: Growth openings are new jobs. Replacement openings result from vacancies le by workers who re re or permanently leave an occupa on.Source: Alaska Department of Labor and Workforce Development, Resaerch and Analysis Sec on
0 1,000 2,000 3,000 4,000 5,000 6,000
Teachers and Instructors, All OtherStock Clerks and Order Fillers
Child Care Workers
Maids and Housekeeping Cleaners
Registered Nurses
Personal Care Aides
Waiters and WaitressesTeacher Assistants
Retail SalespersonsCashiers
on, replacement openings are just as important as new jobs from the perspec ve of someone planning a career or assessing workforce training needs. For this 10-year period, replacement openings will generate 2.5 mes more job opportuni es than openings from growth. Re-placement openings are vacancies le by a worker who re res or otherwise permanently leaves an occupa on, whether that’s from changing careers or leaving Alaska.
It’s important to note that a vacancy le by a worker who moves from one employer to another in the same
occupa on doesn’t count as a replacement opening. This is called job turnover, and it’s much more common. Though replacement openings don’t include turnover, many occupa ons with high turnover also generate high numbers of replacement openings.
This is because many of these occupa ons are low-wage and frequently fi lled by young workers who are likely to change careers as they age. For example, many cashiers are young people doing seasonal work rather than mak-ing a career choice, and many will never return to a
14 ALASKA ECONOMIC TRENDSOCTOBER 2014
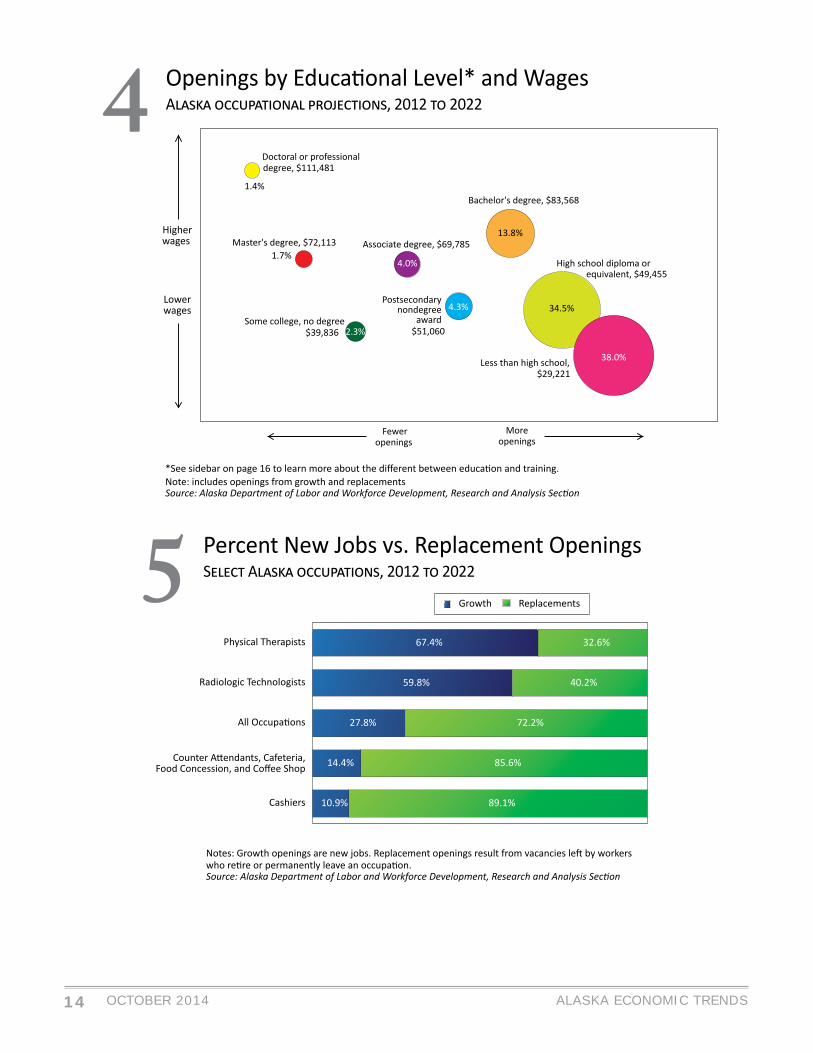
4 Openings by Educa onal Level* and WagesA , 2012 2022
*See sidebar on page 16 to learn more about the diff erent between educa on and training.Note: includes openings from growth and replacementsSource: Alaska Department of Labor and Workforce Development, Research and Analysis Sec on
Doctoral or professional degree, $111,481
1.4%
Master's degree, $72,113 1.7%
Some college, no degree $39,836 2.3%
Associate degree, $69,785
4.0%
Postsecondarynondegree
award$51,060
4.3%
Bachelor's degree, $83,568
13.8%
High school diploma or equivalent, $49,455
34.5%
Less than high school, $29,221
38.0%
Moreopenings
Feweropenings
Higherwages
Lowerwages
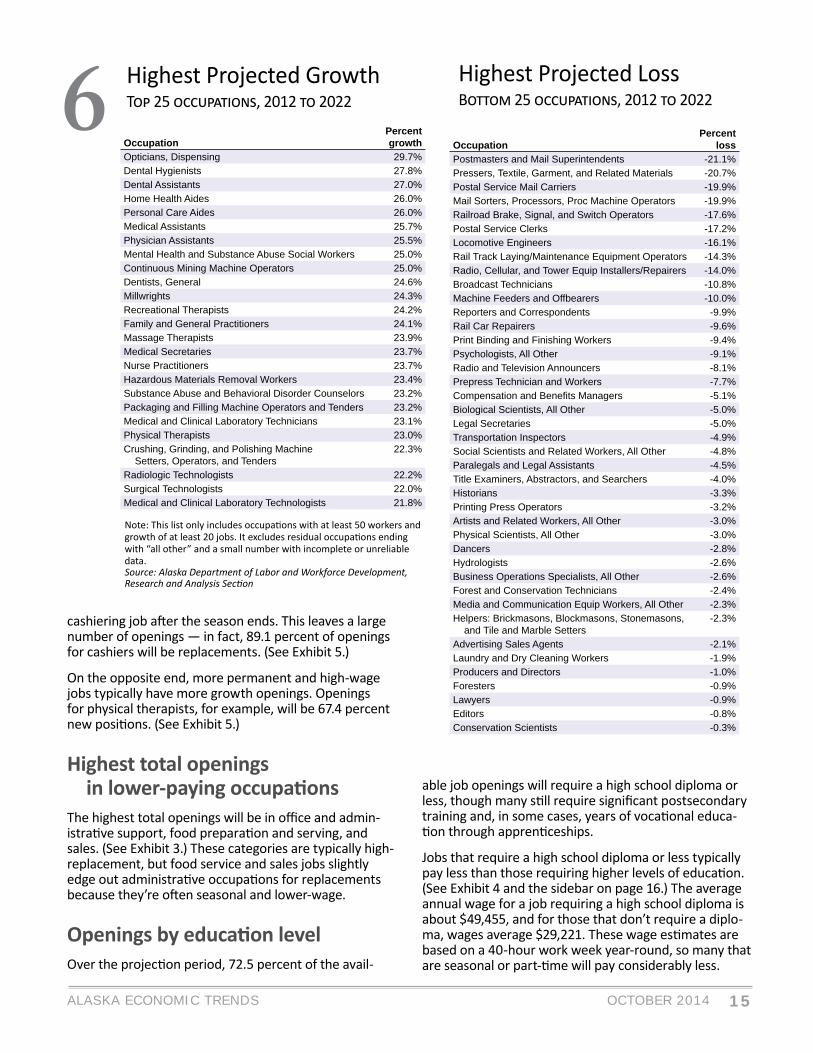
5 Percent New Jobs vs. Replacement Openings S A , 2012 2022
10.9%
14.4%
27.8%
59.8%
67.4%
89.1%
85.6%
72.2%
40.2%
32.6%
Cashiers
Growth
Notes: Growth openings are new jobs. Replacement openings result from vacancies le by workers who re re or permanently leave an occupa on.Source: Alaska Department of Labor and Workforce Development, Research and Analysis Sec on
15ALASKA ECONOMIC TRENDS OCTOBER 2014
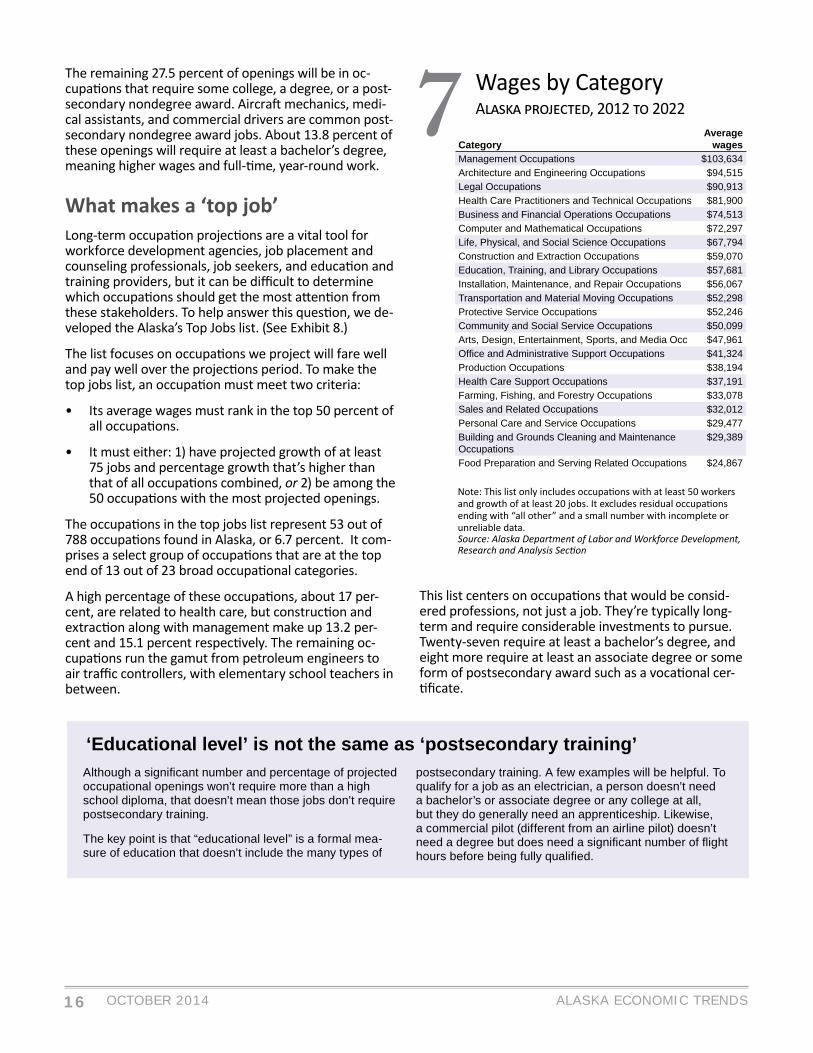
Highest Projected GrowthT 25 , 2012 20226
OccupationPercent growth
Opticians, Dispensing 29.7%Dental Hygienists 27.8%Dental Assistants 27.0%Home Health Aides 26.0%Personal Care Aides 26.0%Medical Assistants 25.7%Physician Assistants 25.5%Mental Health and Substance Abuse Social Workers 25.0%Continuous Mining Machine Operators 25.0%Dentists, General 24.6%Millwrights 24.3%Recreational Therapists 24.2%Family and General Practitioners 24.1%Massage Therapists 23.9%Medical Secretaries 23.7%Nurse Practitioners 23.7%Hazardous Materials Removal Workers 23.4%Substance Abuse and Behavioral Disorder Counselors 23.2%Packaging and Filling Machine Operators and Tenders 23.2%Medical and Clinical Laboratory Technicians 23.1%Physical Therapists 23.0%Crushing, Grinding, and Polishing Machine Setters, Operators, and Tenders
22.3%
Radiologic Technologists 22.2%Surgical Technologists 22.0%Medical and Clinical Laboratory Technologists 21.8%
Note: This list only includes occupa ons with at least 50 workers and growth of at least 20 jobs. It excludes residual occupa ons ending with “all other” and a small number with incomplete or unreliable data. Source: Alaska Department of Labor and Workforce Development, Research and Analysis Sec on
OccupationPercent
lossPostmasters and Mail Superintendents -21.1%Pressers, Textile, Garment, and Related Materials -20.7%Postal Service Mail Carriers -19.9%Mail Sorters, Processors, Proc Machine Operators -19.9%Railroad Brake, Signal, and Switch Operators -17.6%Postal Service Clerks -17.2%Locomotive Engineers -16.1%Rail Track Laying/Maintenance Equipment Operators -14.3%Radio, Cellular, and Tower Equip Installers/Repairers -14.0%Broadcast Technicians -10.8%Machine Feeders and Offbearers -10.0%Reporters and Correspondents -9.9%Rail Car Repairers -9.6%Print Binding and Finishing Workers -9.4%Psychologists, All Other -9.1%Radio and Television Announcers -8.1%Prepress Technician and Workers -7.7%Compensation and Benefi ts Managers -5.1%Biological Scientists, All Other -5.0%Legal Secretaries -5.0%Transportation Inspectors -4.9%Social Scientists and Related Workers, All Other -4.8%Paralegals and Legal Assistants -4.5%Title Examiners, Abstractors, and Searchers -4.0%Historians -3.3%Printing Press Operators -3.2%Artists and Related Workers, All Other -3.0%Physical Scientists, All Other -3.0%Dancers -2.8%Hydrologists -2.6%Business Operations Specialists, All Other -2.6%Forest and Conservation Technicians -2.4%Media and Communication Equip Workers, All Other -2.3%Helpers: Brickmasons, Blockmasons, Stonemasons, and Tile and Marble Setters
-2.3%
Advertising Sales Agents -2.1%Laundry and Dry Cleaning Workers -1.9%Producers and Directors -1.0%Foresters -0.9%Lawyers -0.9%Editors -0.8%Conservation Scientists -0.3%
Highest Projected LossB 25 , 2012 2022
cashiering job a er the season ends. This leaves a large number of openings — in fact, 89.1 percent of openings for cashiers will be replacements. (See Exhibit 5.)
On the opposite end, more permanent and high-wage jobs typically have more growth openings. Openings for physical therapists, for example, will be 67.4 percent new posi ons. (See Exhibit 5.)
Highest total openings in lower-paying occupa onsThe highest total openings will be in offi ce and admin-istra ve support, food prepara on and serving, and sales. (See Exhibit 3.) These categories are typically high-replacement, but food service and sales jobs slightly edge out administra ve occupa ons for replacements because they’re o en seasonal and lower-wage.
Openings by educa on levelOver the projec on period, 72.5 percent of the avail-
able job openings will require a high school diploma or less, though many s ll require signifi cant postsecondary training and, in some cases, years of voca onal educa- on through appren ceships.
Jobs that require a high school diploma or less typically pay less than those requiring higher levels of educa on. (See Exhibit 4 and the sidebar on page 16.) The average annual wage for a job requiring a high school diploma is about $49,455, and for those that don’t require a diplo-ma, wages average $29,221. These wage es mates are based on a 40-hour work week year-round, so many that are seasonal or part- me will pay considerably less.
16 ALASKA ECONOMIC TRENDSOCTOBER 2014
Wages by CategoryA , 2012 20227
CategoryAverage
wagesManagement Occupations $103,634Architecture and Engineering Occupations $94,515Legal Occupations $90,913Health Care Practitioners and Technical Occupations $81,900Business and Financial Operations Occupations $74,513Computer and Mathematical Occupations $72,297Life, Physical, and Social Science Occupations $67,794Construction and Extraction Occupations $59,070Education, Training, and Library Occupations $57,681Installation, Maintenance, and Repair Occupations $56,067Transportation and Material Moving Occupations $52,298Protective Service Occupations $52,246Community and Social Service Occupations $50,099Arts, Design, Entertainment, Sports, and Media Occ $47,961Offi ce and Administrative Support Occupations $41,324Production Occupations $38,194Health Care Support Occupations $37,191Farming, Fishing, and Forestry Occupations $33,078Sales and Related Occupations $32,012Personal Care and Service Occupations $29,477Building and Grounds Cleaning and Maintenance Occupations
$29,389
Food Preparation and Serving Related Occupations $24,867
The remaining 27.5 percent of openings will be in oc-cupa ons that require some college, a degree, or a post-secondary nondegree award. Aircra mechanics, medi-cal assistants, and commercial drivers are common post-secondary nondegree award jobs. About 13.8 percent of these openings will require at least a bachelor’s degree, meaning higher wages and full- me, year-round work.
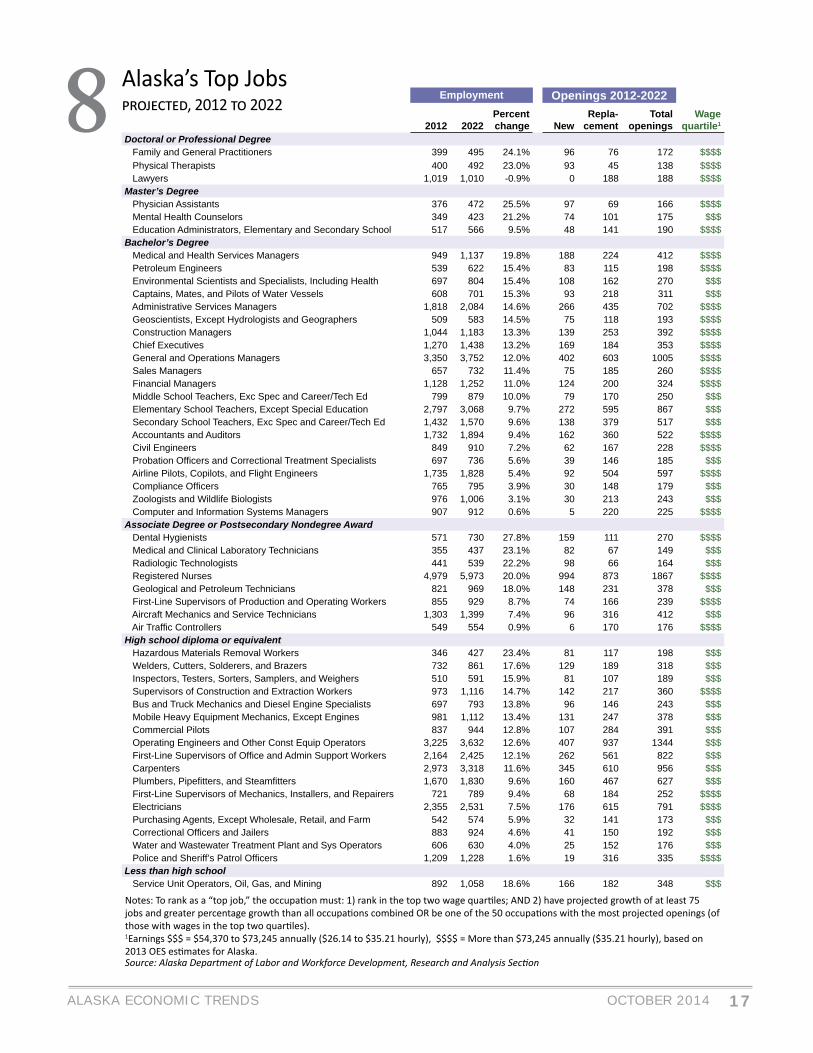
What makes a ‘top job’Long-term occupa on projec ons are a vital tool for workforce development agencies, job placement and counseling professionals, job seekers, and educa on and training providers, but it can be diffi cult to determine which occupa ons should get the most a en on from these stakeholders. To help answer this ques on, we de-veloped the Alaska’s Top Jobs list. (See Exhibit 8.)
The list focuses on occupa ons we project will fare well and pay well over the projec ons period. To make the top jobs list, an occupa on must meet two criteria:
• Its average wages must rank in the top 50 percent of all occupa ons.
• It must either: 1) have projected growth of at least 75 jobs and percentage growth that’s higher than that of all occupa ons combined, or 2) be among the 50 occupa ons with the most projected openings.
The occupa ons in the top jobs list represent 53 out of 788 occupa ons found in Alaska, or 6.7 percent. It com-prises a select group of occupa ons that are at the top end of 13 out of 23 broad occupa onal categories.
A high percentage of these occupa ons, about 17 per-cent, are related to health care, but construc on and extrac on along with management make up 13.2 per-cent and 15.1 percent respec vely. The remaining oc-cupa ons run the gamut from petroleum engineers to air traffi c controllers, with elementary school teachers in between.
This list centers on occupa ons that would be consid-ered professions, not just a job. They’re typically long-term and require considerable investments to pursue. Twenty-seven require at least a bachelor’s degree, and eight more require at least an associate degree or some form of postsecondary award such as a voca onal cer- fi cate.
Note: This list only includes occupa ons with at least 50 workers and growth of at least 20 jobs. It excludes residual occupa ons ending with “all other” and a small number with incomplete or unreliable data. Source: Alaska Department of Labor and Workforce Development, Research and Analysis Sec on
Although a signifi cant number and percentage of projected occupational openings won’t require more than a high school diploma, that doesn’t mean those jobs don’t require postsecondary training.
The key point is that “educational level” is a formal mea-sure of education that doesn’t include the many types of
postsecondary training. A few examples will be helpful. To qualify for a job as an electrician, a person doesn’t need a bachelor’s or associate degree or any college at all, but they do generally need an apprenticeship. Likewise, a commercial pilot (different from an airline pilot) doesn’t need a degree but does need a signifi cant number of fl ight hours before being fully qualifi ed.
‘Educational level’ is not the same as ‘postsecondary training’
17ALASKA ECONOMIC TRENDS OCTOBER 2014
Employment Openings 2012-2022
2012 2022Percent change New
Repla-cement
Total openings
Wage quartile1
Doctoral or Professional Degree Family and General Practitioners 399 495 24.1% 96 76 172 $$$$ Physical Therapists 400 492 23.0% 93 45 138 $$$$ Lawyers 1,019 1,010 -0.9% 0 188 188 $$$$Master’s Degree Physician Assistants 376 472 25.5% 97 69 166 $$$$ Mental Health Counselors 349 423 21.2% 74 101 175 $$$ Education Administrators, Elementary and Secondary School 517 566 9.5% 48 141 190 $$$$Bachelor’s Degree Medical and Health Services Managers 949 1,137 19.8% 188 224 412 $$$$ Petroleum Engineers 539 622 15.4% 83 115 198 $$$$ Environmental Scientists and Specialists, Including Health 697 804 15.4% 108 162 270 $$$ Captains, Mates, and Pilots of Water Vessels 608 701 15.3% 93 218 311 $$$ Administrative Services Managers 1,818 2,084 14.6% 266 435 702 $$$$ Geoscientists, Except Hydrologists and Geographers 509 583 14.5% 75 118 193 $$$$ Construction Managers 1,044 1,183 13.3% 139 253 392 $$$$ Chief Executives 1,270 1,438 13.2% 169 184 353 $$$$ General and Operations Managers 3,350 3,752 12.0% 402 603 1005 $$$$ Sales Managers 657 732 11.4% 75 185 260 $$$$ Financial Managers 1,128 1,252 11.0% 124 200 324 $$$$ Middle School Teachers, Exc Spec and Career/Tech Ed 799 879 10.0% 79 170 250 $$$ Elementary School Teachers, Except Special Education 2,797 3,068 9.7% 272 595 867 $$$ Secondary School Teachers, Exc Spec and Career/Tech Ed 1,432 1,570 9.6% 138 379 517 $$$ Accountants and Auditors 1,732 1,894 9.4% 162 360 522 $$$$ Civil Engineers 849 910 7.2% 62 167 228 $$$$ Probation Offi cers and Correctional Treatment Specialists 697 736 5.6% 39 146 185 $$$ Airline Pilots, Copilots, and Flight Engineers 1,735 1,828 5.4% 92 504 597 $$$$ Compliance Offi cers 765 795 3.9% 30 148 179 $$$ Zoologists and Wildlife Biologists 976 1,006 3.1% 30 213 243 $$$ Computer and Information Systems Managers 907 912 0.6% 5 220 225 $$$$Associate Degree or Postsecondary Nondegree Award Dental Hygienists 571 730 27.8% 159 111 270 $$$$ Medical and Clinical Laboratory Technicians 355 437 23.1% 82 67 149 $$$ Radiologic Technologists 441 539 22.2% 98 66 164 $$$ Registered Nurses 4,979 5,973 20.0% 994 873 1867 $$$$ Geological and Petroleum Technicians 821 969 18.0% 148 231 378 $$$ First-Line Supervisors of Production and Operating Workers 855 929 8.7% 74 166 239 $$$$ Aircraft Mechanics and Service Technicians 1,303 1,399 7.4% 96 316 412 $$$ Air Traffi c Controllers 549 554 0.9% 6 170 176 $$$$High school diploma or equivalent Hazardous Materials Removal Workers 346 427 23.4% 81 117 198 $$$ Welders, Cutters, Solderers, and Brazers 732 861 17.6% 129 189 318 $$$ Inspectors, Testers, Sorters, Samplers, and Weighers 510 591 15.9% 81 107 189 $$$ Supervisors of Construction and Extraction Workers 973 1,116 14.7% 142 217 360 $$$$ Bus and Truck Mechanics and Diesel Engine Specialists 697 793 13.8% 96 146 243 $$$ Mobile Heavy Equipment Mechanics, Except Engines 981 1,112 13.4% 131 247 378 $$$ Commercial Pilots 837 944 12.8% 107 284 391 $$$ Operating Engineers and Other Const Equip Operators 3,225 3,632 12.6% 407 937 1344 $$$ First-Line Supervisors of Offi ce and Admin Support Workers 2,164 2,425 12.1% 262 561 822 $$$ Carpenters 2,973 3,318 11.6% 345 610 956 $$$ Plumbers, Pipefi tters, and Steamfi tters 1,670 1,830 9.6% 160 467 627 $$$ First-Line Supervisors of Mechanics, Installers, and Repairers 721 789 9.4% 68 184 252 $$$$ Electricians 2,355 2,531 7.5% 176 615 791 $$$$ Purchasing Agents, Except Wholesale, Retail, and Farm 542 574 5.9% 32 141 173 $$$ Correctional Offi cers and Jailers 883 924 4.6% 41 150 192 $$$ Water and Wastewater Treatment Plant and Sys Operators 606 630 4.0% 25 152 176 $$$ Police and Sheriff’s Patrol Offi cers 1,209 1,228 1.6% 19 316 335 $$$$Less than high school Service Unit Operators, Oil, Gas, and Mining 892 1,058 18.6% 166 182 348 $$$
Notes: To rank as a “top job,” the occupa on must: 1) rank in the top two wage quar les; AND 2) have projected growth of at least 75 jobs and greater percentage growth than all occupa ons combined OR be one of the 50 occupa ons with the most projected openings (of those with wages in the top two quar les). 1Earnings $$$ = $54,370 to $73,245 annually ($26.14 to $35.21 hourly), $$$$ = More than $73,245 annually ($35.21 hourly), based on 2013 OES es mates for Alaska. Source: Alaska Department of Labor and Workforce Development, Research and Analysis Sec on
Alaska’s Top Jobs, 2012 20228

18 ALASKA ECONOMIC TRENDSOCTOBER 2014
Employment Scene
Prelim. RevisedSEASONALLY ADJUSTED 8/14 6/14 8/13United States 6.1 6.2 7.2Alaska Statewide 6.8 6.5 6.7NOT SEASONALLY ADJUSTEDUnited States 6.3 6.5 7.3Alaska Statewide 6.3 6.1 5.8Anchorage/Mat-Su Region 5.6 5.5 5.2 Municipality of Anchorage 5.3 5.1 4.9 Matanuska-Susitna Borough 6.7 6.9 6.2Gulf Coast Region 6.2 6.0 5.7 Kenai Peninsula Borough 6.6 6.2 6.1 Kodiak Island Borough 4.9 5.3 4.4 Valdez-Cordova Census Area 5.9 5.9 5.7Interior Region 6.2 6.1 5.8 Denali Borough 2.9 2.9 3.4 Fairbanks North Star Borough 5.6 5.5 5.2 Southeast Fairbanks Census Area 9.7 10.0 9.3 Yukon-Koyukuk Census Area 13.2 13.5 13.2Northern Region 9.8 9.9 9.7 Nome Census Area 12.6 13.1 12.0 North Slope Borough 4.7 4.4 5.2 Northwest Arctic Borough 14.8 15.2 14.4Southeast Region 5.3 5.2 4.8 Haines Borough 4.5 4.6 4.5 Hoonah-Angoon Census Area 9.2 8.4 8.1 Juneau, City and Borough 4.5 4.3 4.1 Ketchikan Gateway Borough 5.0 4.7 4.3 Petersburg Census Area 7.7 6.8 5.5 Prince of Wales-Hyder CA 11.9 12.3 10.0 Sitka, City and Borough 4.1 4.1 4.0 Skagway, Municipality 1.3 2.4 2.4 Wrangell, City and Borough 6.5 5.9 6.5 Yakutat, City and Borough 7.9 6.5 6.1Southwest Region 12.4 11.0 11.8 Aleutians East Borough 8.1 6.6 8.8 Aleutians West Census Area 6.1 5.9 6.8 Bethel Census Area 16.0 15.5 15.2 Bristol Bay Borough 2.0 1.0 2.1 Dillingham Census Area 8.6 7.3 7.8 Lake and Peninsula Borough 7.6 5.8 5.8 Wade Hampton Census Area 22.8 25.8 21.1
2 Unemployment RatesB
Unemployment RatesJ 2003 J 20141
Sources: Alaska Department of Labor and Workforce Development, Research and Analysis; and U.S. Bureau of Labor Sta s cs
Sources: Alaska Department of Labor and Workforce Develop-ment, Research and Analysis; and U.S. Bureau of Labor Sta s cs
2004 2005 2006 2007 2008 2009 2010 2011 2012
U.S.
Alaska
Seasonally adjusted
4%
6%
8%
10%
12%
2003 2013 2014
Overall, Alaska had the highest aver-age annual pay of all states in 1984. At
$28,806, it was 57 percent greater than the U.S. average of $18,350. South Dakota had the lowest average annual pay at $13,532. However, Alaska
had the lowest rate of growth in pay from 1983 to 1984, at only 0.2 percent. It was the
only state with less than 1 percent growth in pay. The national average was 4.6 percent, and the state with the highest rate of growth in pay was Michigan at 6.3 percent.
Alaska was no different from most other states in that mining had the highest average annual pay of all industries. For Alaska, in 1984, it was $56,444.
Though Alaska’s average annual pay is well above the national average, all other states, and the Dis-trict of Columbia, when government is excluded from the computation, average annual pay for the state declined by 1 percent. This indicates a general slowdown of industrial activity, especially in con-struction.
The Department of Labor and Workforce Development has published Alaska Economic Trends as far back as 1961 and other labor market summaries since the late 1940s. Historical Trends ar cles are available at labor.alaska.gov/trends as far back as 1978, and complete issues are available from 1994.
This month in Trends history
AUGUST 1984
19ALASKA ECONOMIC TRENDS OCTOBER 2014
Safety MinuteHow to recognize and prevent falls at construction sitesFalls are one of the leading causes of worker injury and death on residential construction work sites, and while the result of a fall is clear, the circumstances under which they occur may not be. Of the 89 residential construction deaths in the United States in 2012, 49 were caused by a fall.
To prevent these tragedies, employers and employees must take several steps to recognize hazards and imple-ment the proper protection or prevention:
• Recognize and anticipate a fall hazard at the job site. It may be something easy to spot, like a steep sloping roof, an open stairwell, or an exposed leading edge on a deck more than six feet from the ground. Fall hazards can also be inconspicuous like an uncov-ered skylight, a fi berglass ladder with structural stress damage, or a scaffold system that isn’t set up properly.
• Select a protection method or course of action, including standard fall protection. In residential construction, standard fall protection may include a guardrail, a scaffold platform, or a personal fall arrest/restraint system. It may also be necessary to remove damaged equipment from service, such as broken lad-ders or poorly maintained aerial lifts.
• Train or brief employees. Topics may include how to use a fall protection device or how to mitigate the haz-ard. If this includes a series of actions and systems, ensure everyone at the work site is clear on what they are and understand their individual roles.
• Implement the system or device with qualifi ed supervision. This is especially important with compli-cated systems such as a horizontal lifeline or specialty fall arrest anchoring system.
After the system or procedure is established, inspect ev-erything to confi rm it’s been done properly and make sure there are no new hazards. It’s important to remember that any working surface six feet or more above the ground needs to have some form of fall protection.
For additional information on how to eliminate fall hazards at your job site, visit the federal OSHA Web site at www.osha.gov or contact the Alaska Occupational Safety and Health Consultation and Training program at (800) 656-4972.
Safety Minute is wri en by the Labor Standards and Safety Divi-sion of the Alaska Department of Labor and Workforce Develop-ment.
Employer ResourcesHow Alaska job fairs benefi t employers and job seekersThe Alaska Job Center Network has been holding job fairs for many years to connect job seekers with employers look-ing for skilled workers. Employers in cities around Alaska will often host these recruitment events, sometimes for multiple employers in varying industries.
Job fairs provide a convenient, centralized location where workers can submit an application or resume directly to a hiring manager. This allows the managers to interview at the same time and place.
These fairs are also an opportunity for job seekers to meet hiring managers from various companies and build relation-ships, creating the potential to connect for future openings.
Job center staff members throughout the state are trained to assist employers with major programs that cover the core, intensive, and training categories defi ned in the Work-force Investment Act. These include employment services,
veteran services, job training services, Youth First, Mature Alaskans Seeking Skills Training, and work services. Job center staff can also connect Alaskans with partner agen-cies that can help them meet their employment goals.
The success rate of a job fair is evidenced by the turnout. The job fair for veterans and military spouses that was recently held in Anchorage attracted 127 employers and about 1,700 attendees. That single event produced 396 hires.
For more information on how you can participate, please go to jobs.alaska.gov/jobfairs/index.html or contact the business connection staff for your area at jobs.alaska.gov/employer.htm.
Employer Resources is wri en by the Employment Security Divi-son of the Alaska Department of Labor and Workforce Develop-ment.