April 2010 Alaska Economic Trends - Alaska Department of
23
Transcript of April 2010 Alaska Economic Trends - Alaska Department of
2 ALASKA ECONOMIC TRENDS APRIL 2010
Sean Parnell, Governor of AlaskaCommissioner Click BishopApril 2010
Volume 30Number 4
ISSN 0160-3345
To contact us for more information, a free subscription,
mailing list changes or back copies, email Trends@alaska.
gov or call (907) 465-4500.
Alaska Economic Trends is a monthly publication dealing
with a wide variety of economic-related issues in the state. Its
purpose is to inform the public about those issues.
Alaska Economic Trends is funded by the Employment Security Division within the
Alaska Department of Labor and Workforce Development. It’s
published by the Department of Labor.
Alaska Economic Trends is
printed and distributed by Assets, Inc., a vocational training and
employment program, at a cost of $1.33 per copy.
Material in this publication is public information, and, with
appropriate credit, may be reproduced without permission.
Cover: Pete Karras Sr., 83, sportfi shes for salmon in Sitka
Sound in June 2005. Karras helped his stepfather take a
26-foot double-ender salmon troller from Washington to Sitka
– it took them six weeks – in February 1947. Karras spent
four years on boats, helping the federal government map Alaska coastlines, then married and in
1953 settled in Sitka. Karras and his wife Bertha raised six kids,
and he was a cook for 29 years at what is now Mt. Edgecumbe
Hospital. (Bertha Karras says she still can’t fi gure out why
they decided to make the trip in February.) Photo courtesy of
SitkaPhotos.com
Brynn Keith, ChiefResearch and Analysis
Susan Erben, EditorSam Dapcevich, Graphic Artist
To contact Trends authors or request a free subscription,email [email protected] or call (907) 465-4500. Trends is on the Web at laborstats.alaska.gov.
Trends Authors
State Demographer Gregory Williams is with the Department of Labor in Juneau. To reach him, call (907) 465-6029 or email him at [email protected].
Alaska’s 2009 Population 4 State and local estimates
The Kenai Peninsula Borough 11 Oil and gas jobs, tourism and retirees
Alaska’s Unemployment Insurance Trust Fund 16 How is Alaska’s trust fund faring?
Employment Scene Unemployment rate at 8.5 percent in February 21
Alyssa Shanks, a Department of Labor economist in Anchor-age, specializes in the employment and wages of the Interior, Gulf Coast, North-ern and Southwest economic regions. To reach her, call (907) 269-4863 or email her at [email protected].
Dean Rasmussen is a Department of Labor economist in Juneau and is Research and Analysis’ federal pro-grams supervisor. To reach him, call (907) 465-6035 or email him at [email protected].
Elisabeth Mercer is a demographer with the Alaska Depart-ment of Labor and Workforce Develop-ment in Juneau. To reach her, call (907) 465-5970 or email her at [email protected].
James Wilson is a Department of Labor economist in Juneau. He’s the actuary of Alaska’s unemploy-ment insurance system. To reach him, call (907) 465-4520 or email him at [email protected].
3ALASKA ECONOMIC TRENDS APRIL 2010
More Alaskans than Ever By Commissioner Click Bishop
Alaska’s major population changes are the products of big events – the discovery of gold, World War II, the Korean War, trans-Alaska oil pipeline construction, the oil “bust” of the 1980s. All these events have contributed positively or negatively to the Alaska economy. It’s no surprise that during a booming economy we’ve grown, or when our economy has struggled people leave.
In 1946, at the end of World War II, there were just 103,000 of us. By statehood in 1959 we had more than doubled in population to 224,000.
During the past decade, our state’s population grew by about 10 percent to 692,314. By comparison, the U.S. population overall increased 8.8 percent. Alaska remains 47th in population, larger than North Dakota, Vermont, Wyoming and the District of Columbia.
If you’ve recently driven the crowded streets of Anchorage or the Glenn Highway into the Mat-Su Borough, it’s probably no surprise that most of that growth is concentrated in two areas. Since 2000, the Mat-Su has grown by more than 42 percent, while Anchorage has grown more than 11 percent.
Eleven of our boroughs grew during the past decade, while nearly twice as many declined. Some areas, like Southeast Alaska, have declined signifi cantly.
Population counts are used for allocating funds for schools and roads, planning for social services, and helping businesses deciding where to locate. And during natural disasters like fl oods, volcanic eruptions or earthquakes, census numbers help rescuers determine how many people will need help.
That’s why ensuring we have an accurate count of all Alaskans in the 2010 Census is so critical. Census counting will continue through at least July – so if you haven’t already, it’s not too late to mail in your form.
Since 1981, the Alaska Department of Labor and Workforce Development’s Research and Analysis Section, which works closely with the U.S. Census Bureau, has played a key role in Alaska census planning. Research and Analysis is the lead agency for the Census and Geographic Information Network, a group of 10 affi liate state agencies and local government planning offi ces.
Elsewhere in this month’s Trends, we have good news for Alaskans about our state’s unemployment insurance program. While many states are struggling to keep their unemployment insurance trust funds afl oat, or are already in default, our state’s program remains strong, and ready to help Alaska workers if needed.
Our program is rock solid, despite a signifi cant increase in unemployment insurance payments. Because of the design of our UI trust fund, with tax rates adjusted to current trends, we should remain ahead of any future needs.
In this issue we also look at the Kenai Peninsula Borough. The borough has a diverse economy, with no one industry dominating its mix of government, leisure, energy and fi shing.
Planned, sustainable growth is good. Alaska’s future will continue to be tied to resource, energy and economic development, and that will continue to provide jobs for our growing population.

4 ALASKA ECONOMIC TRENDS APRIL 2010
The state as a whole
Population change is measured by natural in-crease and net migration. These two measures are made up of four main components: births, deaths, in-migration and out-migration. The im-pact these components have on Alaska’s growth vary by year and decade, depending on certain economic and social factors.
Alaska’s growth from 2000 to 2009 came from natural increase (births minus deaths), which added 66,149 people. The state lost 1,368 people through net-migration (in-migration minus out-migration). On average, 92,000 people migrate to and from Alaska each year, with nearly equal in-migration and out-migra-tion.
Natural increase was also the main contribu-tor to Alaska’s population growth from 2008 to 2009, adding 8,076 people. Yet, unlike in the 2000 to 2009 period, in-migration overtook out-migration, adding 2,261 people.
When breaking down net migration into in-ternational and domestic migration, the gain of 2,261 migrants between 2008 and 2009 comes out to be a gain of 1,239 domestic mi-grants and 1,022 international migrants. (See Exhibit 1.)
The net in-migration that occurred in 2008 to 2009 hasn’t occurred since 2003 to 2004.
The increase in migrants can be explained by the increase in military movement into Alaska. Due to the fact that Alaska Department of La-bor population estimates capture the resident population, all troops are counted as living in the state regardless of their deployment status. Therefore, boroughs and census areas with a
By Elisabeth Mercer, Demographer, and Gregory Williams, State DemographerAlaska’s 2009 Population
laska’s population increased 10.3 per-cent, or 64,781 people, from 2000 to 2009, bringing the state’s popula-tion to 692,314, based on estimates
released in January by the Alaska Department of Labor and Workforce Development.
With only a year left in the decade, Alaska’s population has so far been growing at a slower average annual rate in the 2000s (1.1 per-cent) than in the 1990s (1.3 percent). Despite the trend of slow growth, Alaska’s population grew at an above-average rate from 2008 to 2009, increasing about 1.5 percent or 10,337 people.
Compared to the United States as a whole, however, Alaska has grown at a signifi cantly faster rate since 2000. The U.S. population in-creased 8.8 percent during the 2000 to 2009 period, versus Alaska’s 10.3 percent. Alaska is still the 47th most populous state. It has more population than North Dakota, Vermont, Wyo-ming and the District of Columbia.
The Alaska Department of Labor creates its es-timates using the U.S. Census Bureau’s annual state level estimates and decennial census1 num-bers, Alaska Permanent Fund dividend applica-tions, vital statistics, as well as military and other surveys. Using those population indicators, the Alaska Department of Labor creates a detailed account of Alaska’s population by size, composi-tion and geographical distribution.
The 2009 estimates are provisional. All popula-tion estimates in this article are as of July 1 of a particular year – the average annual population for that year – unless indicated otherwise.
1 The decennial census is a count of the U.S. population conducted every 10 years by the Census Bureau in years ending in zero.
A
State and local estimates
5ALASKA ECONOMIC TRENDS APRIL 2010
large military pres-ence may have populations lower than the estimates, depending on current deploy-ments. The Fair-banks North Star Borough and the Municipality of Anchorage are the most affected by this method of es-timation.
Economic re-gions, boroughs and censusareas
Between the 2000 Census and the 2009 estimate,2 only 11 of Alaska’s 29 boroughs and census areas gained population. Seven of those 11 areas had signifi -cant population increases: the Municipality of Anchorage (+30,305), Matanuska-Susitna Bor-ough (+24,992), Fairbanks North Star Borough (+10,939), Kenai Peninsula Borough (+3,887), Southeast Fairbanks Census Area (+1,069), Bethel Census Area (+951) and Wade Hampton Census Area (+666). (See Exhibits 2 and 3.)
While 11 of the 29 boroughs increased in num-ber of people from 2000 to 2009, only three of the 11 had increases in the proportion of Alaska’s total population. The three – the Mat-Su Borough, Anchorage Municipality and Fair-banks North Star Borough – accounted for 90.3 percent of the growth in the 11 boroughs and census areas. The Municipality of Anchorage made up 41.3 percent of the growth, and the Mat-Su Borough and Fairbanks North Star Bor-ough made up 34.1 percent and 14.9 percent, respectively.
2 The remainder of this article analyzes data from the 2000 Census only, not the July 1, 2000, estimate.
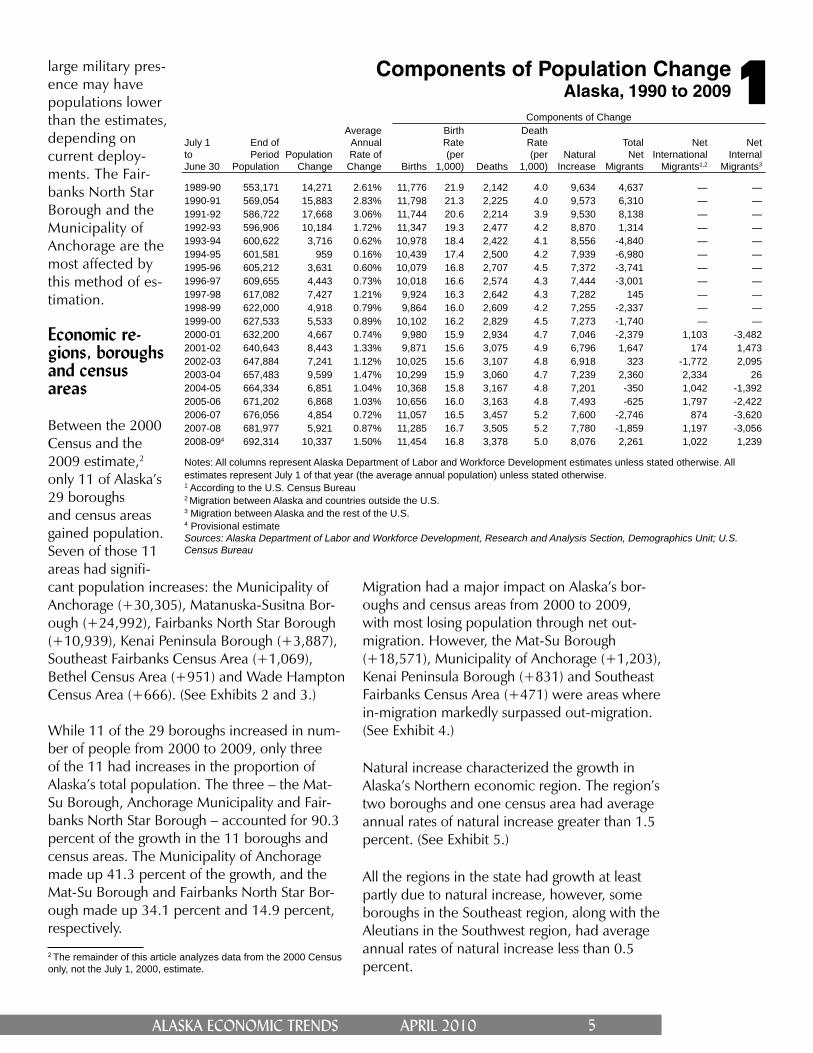
Components of Population ChangeAlaska, 1990 to 20091
Components of Change
July 1toJune 30
End ofPeriod
PopulationPopulation
Change
Average AnnualRate of
Change Births
BirthRate(per
1,000) Deaths
DeathRate(per
1,000)Natural
Increase
TotalNet
Migrants
NetInternational
Migrants1,2
NetInternal
Migrants3
1989-90 553,171 14,271 2.61% 11,776 21.9 2,142 4.0 9,634 4,637 — —1990-91 569,054 15,883 2.83% 11,798 21.3 2,225 4.0 9,573 6,310 — —1991-92 586,722 17,668 3.06% 11,744 20.6 2,214 3.9 9,530 8,138 — —1992-93 596,906 10,184 1.72% 11,347 19.3 2,477 4.2 8,870 1,314 — —1993-94 600,622 3,716 0.62% 10,978 18.4 2,422 4.1 8,556 -4,840 — —1994-95 601,581 959 0.16% 10,439 17.4 2,500 4.2 7,939 -6,980 — —1995-96 605,212 3,631 0.60% 10,079 16.8 2,707 4.5 7,372 -3,741 — —1996-97 609,655 4,443 0.73% 10,018 16.6 2,574 4.3 7,444 -3,001 — —1997-98 617,082 7,427 1.21% 9,924 16.3 2,642 4.3 7,282 145 — —1998-99 622,000 4,918 0.79% 9,864 16.0 2,609 4.2 7,255 -2,337 — —1999-00 627,533 5,533 0.89% 10,102 16.2 2,829 4.5 7,273 -1,740 — —2000-01 632,200 4,667 0.74% 9,980 15.9 2,934 4.7 7,046 -2,379 1,103 -3,4822001-02 640,643 8,443 1.33% 9,871 15.6 3,075 4.9 6,796 1,647 174 1,4732002-03 647,884 7,241 1.12% 10,025 15.6 3,107 4.8 6,918 323 -1,772 2,0952003-04 657,483 9,599 1.47% 10,299 15.9 3,060 4.7 7,239 2,360 2,334 262004-05 664,334 6,851 1.04% 10,368 15.8 3,167 4.8 7,201 -350 1,042 -1,3922005-06 671,202 6,868 1.03% 10,656 16.0 3,163 4.8 7,493 -625 1,797 -2,4222006-07 676,056 4,854 0.72% 11,057 16.5 3,457 5.2 7,600 -2,746 874 -3,6202007-08 681,977 5,921 0.87% 11,285 16.7 3,505 5.2 7,780 -1,859 1,197 -3,0562008-094 692,314 10,337 1.50% 11,454 16.8 3,378 5.0 8,076 2,261 1,022 1,239
Notes: All columns represent Alaska Department of Labor and Workforce Development estimates unless stated otherwise. All estimates represent July 1 of that year (the average annual population) unless stated otherwise.1 According to the U.S. Census Bureau2 Migration between Alaska and countries outside the U.S. 3 Migration between Alaska and the rest of the U.S.4 Provisional estimate Sources: Alaska Department of Labor and Workforce Development, Research and Analysis Section, Demographics Unit; U.S. Census Bureau
Migration had a major impact on Alaska’s bor-oughs and census areas from 2000 to 2009, with most losing population through net out-migration. However, the Mat-Su Borough (+18,571), Municipality of Anchorage (+1,203), Kenai Peninsula Borough (+831) and Southeast Fairbanks Census Area (+471) were areas where in-migration markedly surpassed out-migration. (See Exhibit 4.)
Natural increase characterized the growth in Alaska’s Northern economic region. The region’s two boroughs and one census area had average annual rates of natural increase greater than 1.5 percent. (See Exhibit 5.)
All the regions in the state had growth at least partly due to natural increase, however, some boroughs in the Southeast region, along with the Aleutians in the Southwest region, had average annual rates of natural increase less than 0.5 percent.
6 ALASKA ECONOMIC TRENDS APRIL 2010
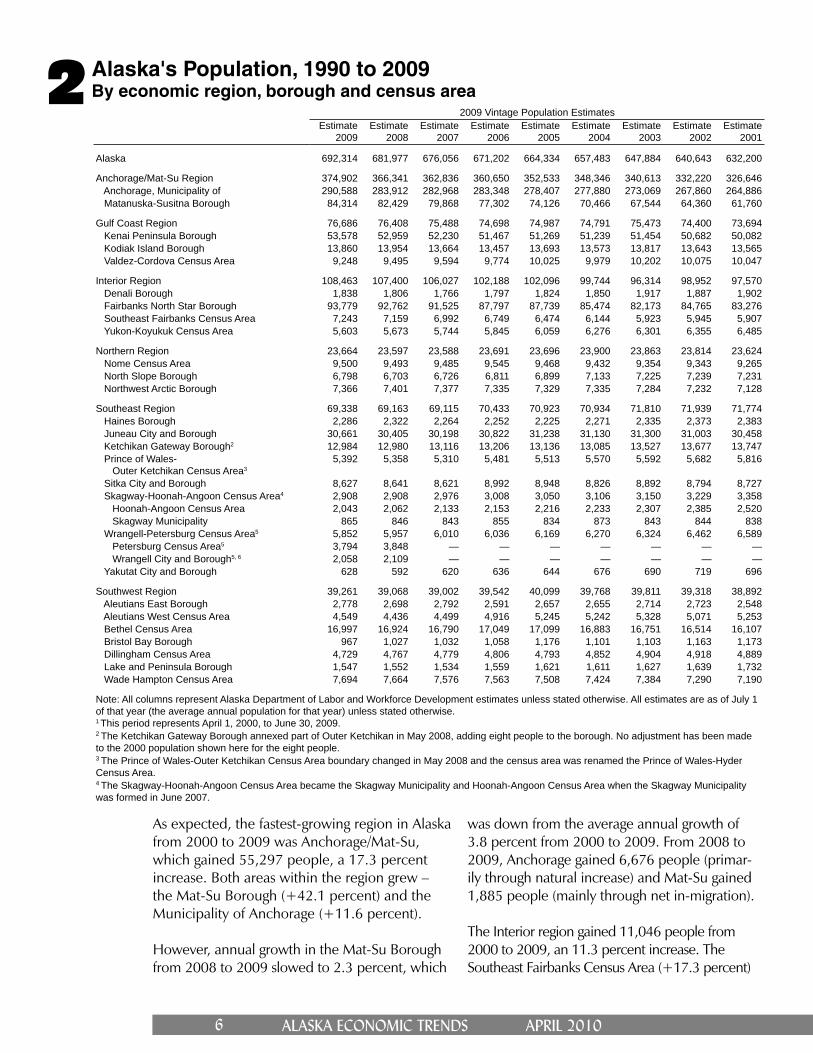
As expected, the fastest-growing region in Alaska from 2000 to 2009 was Anchorage/Mat-Su, which gained 55,297 people, a 17.3 percent increase. Both areas within the region grew – the Mat-Su Borough (+42.1 percent) and the Municipality of Anchorage (+11.6 percent).
However, annual growth in the Mat-Su Borough from 2008 to 2009 slowed to 2.3 percent, which
was down from the average annual growth of 3.8 percent from 2000 to 2009. From 2008 to 2009, Anchorage gained 6,676 people (primar-ily through natural increase) and Mat-Su gained 1,885 people (mainly through net in-migration).
The Interior region gained 11,046 people from 2000 to 2009, an 11.3 percent increase. The Southeast Fairbanks Census Area (+17.3 percent)
Alaska's Population, 1990 to 2009By economic region, borough and census area2
2009 Vintage Population EstimatesEstimate
2009Estimate
2008Estimate
2007Estimate
2006Estimate
2005Estimate
2004Estimate
2003Estimate
2002Estimate
2001
Alaska 692,314 681,977 676,056 671,202 664,334 657,483 647,884 640,643 632,200
Anchorage/Mat-Su Region 374,902 366,341 362,836 360,650 352,533 348,346 340,613 332,220 326,646 Anchorage, Municipality of 290,588 283,912 282,968 283,348 278,407 277,880 273,069 267,860 264,886 Matanuska-Susitna Borough 84,314 82,429 79,868 77,302 74,126 70,466 67,544 64,360 61,760
Gulf Coast Region 76,686 76,408 75,488 74,698 74,987 74,791 75,473 74,400 73,694 Kenai Peninsula Borough 53,578 52,959 52,230 51,467 51,269 51,239 51,454 50,682 50,082 Kodiak Island Borough 13,860 13,954 13,664 13,457 13,693 13,573 13,817 13,643 13,565 Valdez-Cordova Census Area 9,248 9,495 9,594 9,774 10,025 9,979 10,202 10,075 10,047
Interior Region 108,463 107,400 106,027 102,188 102,096 99,744 96,314 98,952 97,570 Denali Borough 1,838 1,806 1,766 1,797 1,824 1,850 1,917 1,887 1,902 Fairbanks North Star Borough 93,779 92,762 91,525 87,797 87,739 85,474 82,173 84,765 83,276 Southeast Fairbanks Census Area 7,243 7,159 6,992 6,749 6,474 6,144 5,923 5,945 5,907 Yukon-Koyukuk Census Area 5,603 5,673 5,744 5,845 6,059 6,276 6,301 6,355 6,485
Northern Region 23,664 23,597 23,588 23,691 23,696 23,900 23,863 23,814 23,624 Nome Census Area 9,500 9,493 9,485 9,545 9,468 9,432 9,354 9,343 9,265 North Slope Borough 6,798 6,703 6,726 6,811 6,899 7,133 7,225 7,239 7,231 Northwest Arctic Borough 7,366 7,401 7,377 7,335 7,329 7,335 7,284 7,232 7,128
Southeast Region 69,338 69,163 69,115 70,433 70,923 70,934 71,810 71,939 71,774 Haines Borough 2,286 2,322 2,264 2,252 2,225 2,271 2,335 2,373 2,383 Juneau City and Borough 30,661 30,405 30,198 30,822 31,238 31,130 31,300 31,003 30,458 Ketchikan Gateway Borough2 12,984 12,980 13,116 13,206 13,136 13,085 13,527 13,677 13,747 Prince of Wales- Outer Ketchikan Census Area3
5,392 5,358 5,310 5,481 5,513 5,570 5,592 5,682 5,816
Sitka City and Borough 8,627 8,641 8,621 8,992 8,948 8,826 8,892 8,794 8,727 Skagway-Hoonah-Angoon Census Area4 2,908 2,908 2,976 3,008 3,050 3,106 3,150 3,229 3,358 Hoonah-Angoon Census Area 2,043 2,062 2,133 2,153 2,216 2,233 2,307 2,385 2,520 Skagway Municipality 865 846 843 855 834 873 843 844 838 Wrangell-Petersburg Census Area5 5,852 5,957 6,010 6,036 6,169 6,270 6,324 6,462 6,589 Petersburg Census Area5 3,794 3,848 — — — — — — — Wrangell City and Borough5, 6 2,058 2,109 — — — — — — — Yakutat City and Borough 628 592 620 636 644 676 690 719 696
Southwest Region 39,261 39,068 39,002 39,542 40,099 39,768 39,811 39,318 38,892 Aleutians East Borough 2,778 2,698 2,792 2,591 2,657 2,655 2,714 2,723 2,548 Aleutians West Census Area 4,549 4,436 4,499 4,916 5,245 5,242 5,328 5,071 5,253 Bethel Census Area 16,997 16,924 16,790 17,049 17,099 16,883 16,751 16,514 16,107 Bristol Bay Borough 967 1,027 1,032 1,058 1,176 1,101 1,103 1,163 1,173 Dillingham Census Area 4,729 4,767 4,779 4,806 4,793 4,852 4,904 4,918 4,889 Lake and Peninsula Borough 1,547 1,552 1,534 1,559 1,621 1,611 1,627 1,639 1,732 Wade Hampton Census Area 7,694 7,664 7,576 7,563 7,508 7,424 7,384 7,290 7,190
Note: All columns represent Alaska Department of Labor and Workforce Development estimates unless stated otherwise. All estimates are as of July 1 of that year (the average annual population for that year) unless stated otherwise.1 This period represents April 1, 2000, to June 30, 2009.2 The Ketchikan Gateway Borough annexed part of Outer Ketchikan in May 2008, adding eight people to the borough. No adjustment has been made to the 2000 population shown here for the eight people.3 The Prince of Wales-Outer Ketchikan Census Area boundary changed in May 2008 and the census area was renamed the Prince of Wales-Hyder Census Area.4 The Skagway-Hoonah-Angoon Census Area became the Skagway Municipality and Hoonah-Angoon Census Area when the Skagway Municipality was formed in June 2007.
7ALASKA ECONOMIC TRENDS APRIL 2010
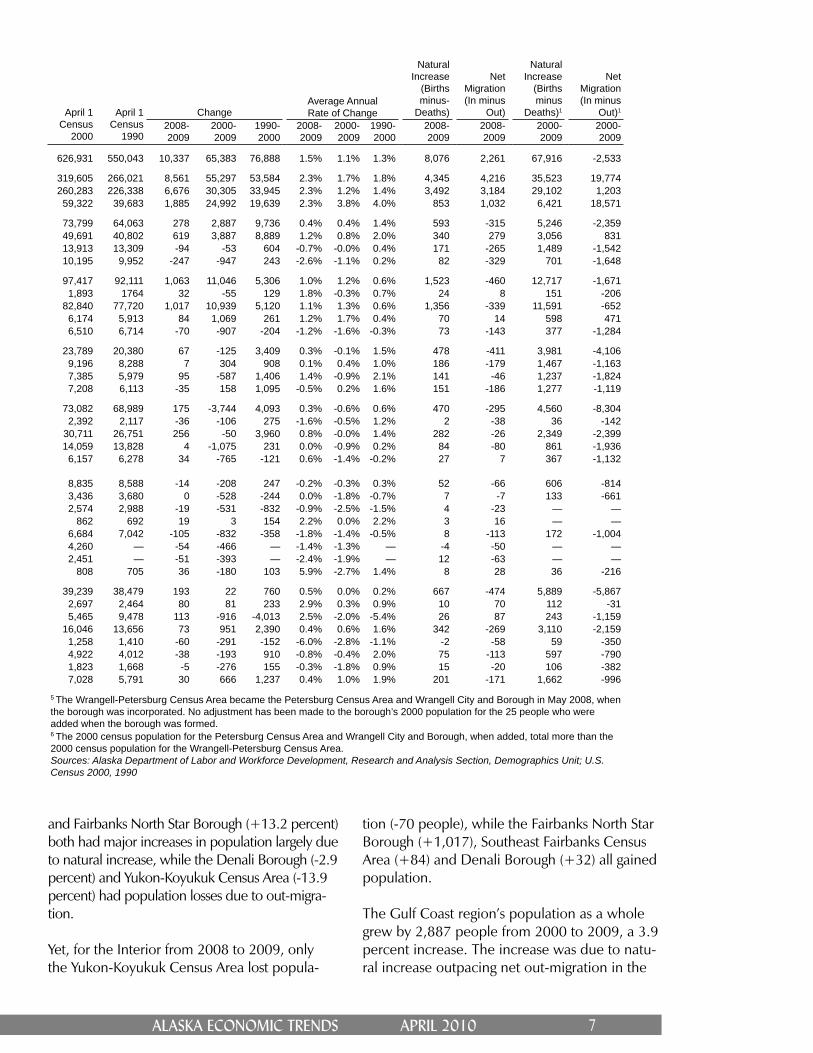
and Fairbanks North Star Borough (+13.2 percent) both had major increases in population largely due to natural increase, while the Denali Borough (-2.9 percent) and Yukon-Koyukuk Census Area (-13.9 percent) had population losses due to out-migra-tion.
Yet, for the Interior from 2008 to 2009, only the Yukon-Koyukuk Census Area lost popula-
tion (-70 people), while the Fairbanks North Star Borough (+1,017), Southeast Fairbanks Census Area (+84) and Denali Borough (+32) all gained population.
The Gulf Coast region’s population as a whole grew by 2,887 people from 2000 to 2009, a 3.9 percent increase. The increase was due to natu-ral increase outpacing net out-migration in the
April 1Census
2000
April 1Census
1990
Change
Natural Increase
(Births minus-
Deaths)
Net Migration (In minus
Out)
Natural Increase
(Births minus
Deaths)1
Net Migration (In minus
Out)1Average AnnualRate of Change
2008-2009
2000-2009
1990-2000
2008-2009
2000-2009
1990-2000
2008-2009
2008-2009
2000-2009
2000-2009
626,931 550,043 10,337 65,383 76,888 1.5% 1.1% 1.3% 8,076 2,261 67,916 -2,533
319,605 266,021 8,561 55,297 53,584 2.3% 1.7% 1.8% 4,345 4,216 35,523 19,774260,283 226,338 6,676 30,305 33,945 2.3% 1.2% 1.4% 3,492 3,184 29,102 1,203
59,322 39,683 1,885 24,992 19,639 2.3% 3.8% 4.0% 853 1,032 6,421 18,571
73,799 64,063 278 2,887 9,736 0.4% 0.4% 1.4% 593 -315 5,246 -2,35949,691 40,802 619 3,887 8,889 1.2% 0.8% 2.0% 340 279 3,056 83113,913 13,309 -94 -53 604 -0.7% -0.0% 0.4% 171 -265 1,489 -1,54210,195 9,952 -247 -947 243 -2.6% -1.1% 0.2% 82 -329 701 -1,648
97,417 92,111 1,063 11,046 5,306 1.0% 1.2% 0.6% 1,523 -460 12,717 -1,6711,893 1764 32 -55 129 1.8% -0.3% 0.7% 24 8 151 -206
82,840 77,720 1,017 10,939 5,120 1.1% 1.3% 0.6% 1,356 -339 11,591 -6526,174 5,913 84 1,069 261 1.2% 1.7% 0.4% 70 14 598 4716,510 6,714 -70 -907 -204 -1.2% -1.6% -0.3% 73 -143 377 -1,284
23,789 20,380 67 -125 3,409 0.3% -0.1% 1.5% 478 -411 3,981 -4,1069,196 8,288 7 304 908 0.1% 0.4% 1.0% 186 -179 1,467 -1,1637,385 5,979 95 -587 1,406 1.4% -0.9% 2.1% 141 -46 1,237 -1,8247,208 6,113 -35 158 1,095 -0.5% 0.2% 1.6% 151 -186 1,277 -1,119
73,082 68,989 175 -3,744 4,093 0.3% -0.6% 0.6% 470 -295 4,560 -8,3042,392 2,117 -36 -106 275 -1.6% -0.5% 1.2% 2 -38 36 -142
30,711 26,751 256 -50 3,960 0.8% -0.0% 1.4% 282 -26 2,349 -2,39914,059 13,828 4 -1,075 231 0.0% -0.9% 0.2% 84 -80 861 -1,936
6,157 6,278 34 -765 -121 0.6% -1.4% -0.2% 27 7 367 -1,132
8,835 8,588 -14 -208 247 -0.2% -0.3% 0.3% 52 -66 606 -8143,436 3,680 0 -528 -244 0.0% -1.8% -0.7% 7 -7 133 -6612,574 2,988 -19 -531 -832 -0.9% -2.5% -1.5% 4 -23 — —
862 692 19 3 154 2.2% 0.0% 2.2% 3 16 — —6,684 7,042 -105 -832 -358 -1.8% -1.4% -0.5% 8 -113 172 -1,0044,260 — -54 -466 — -1.4% -1.3% — -4 -50 — —2,451 — -51 -393 — -2.4% -1.9% — 12 -63 — —
808 705 36 -180 103 5.9% -2.7% 1.4% 8 28 36 -216
39,239 38,479 193 22 760 0.5% 0.0% 0.2% 667 -474 5,889 -5,8672,697 2,464 80 81 233 2.9% 0.3% 0.9% 10 70 112 -315,465 9,478 113 -916 -4,013 2.5% -2.0% -5.4% 26 87 243 -1,159
16,046 13,656 73 951 2,390 0.4% 0.6% 1.6% 342 -269 3,110 -2,1591,258 1,410 -60 -291 -152 -6.0% -2.8% -1.1% -2 -58 59 -3504,922 4,012 -38 -193 910 -0.8% -0.4% 2.0% 75 -113 597 -7901,823 1,668 -5 -276 155 -0.3% -1.8% 0.9% 15 -20 106 -3827,028 5,791 30 666 1,237 0.4% 1.0% 1.9% 201 -171 1,662 -996
5 The Wrangell-Petersburg Census Area became the Petersburg Census Area and Wrangell City and Borough in May 2008, when the borough was incorporated. No adjustment has been made to the borough’s 2000 population for the 25 people who were added when the borough was formed. 6 The 2000 census population for the Petersburg Census Area and Wrangell City and Borough, when added, total more than the 2000 census population for the Wrangell-Petersburg Census Area. Sources: Alaska Department of Labor and Workforce Development, Research and Analysis Section, Demographics Unit; U.S. Census 2000, 1990
8 ALASKA ECONOMIC TRENDS APRIL 2010
(+5,889) just surpassing net out-migration (-5,867). Only three of Southwest’s seven boroughs and census areas grew – the Wade Hampton Census Area (+9.5 percent), Bethel Census Area (+5.9 percent) and Aleutians East Borough (+3.0 percent) – and the growth was due to natural increase.
That trend was similar dur-ing the 2008 to 2009 peri-od, with the Aleutians West Census Area (+113 people), Aleutians East Borough (+80), Bethel Census Area (+73) and Wade Hampton Census Area (+30) growing. The remainder of the region declined in population due to net-out migration.
The Northern region de-clined slightly from 2000 to 2009, losing 125 people, a 0.5 percent decrease, due to out-migration overtaking natural increase. The region’s Nome Census Area (+3.3 percent) and Northwest Arc-tic Borough (+2.2 percent) increased in population. The North Slope Borough lost a signifi cant portion of its population (-7.9 percent)
through out-migration.
That trend changed in 2008 to 2009, with the North Slope Borough gaining the most people (+95) due to natural increase. The Nome Cen-sus Area only gained seven people; the North-west Arctic Borough lost 35 people due to net out-migration.
Finally, the region with the greatest decline as a whole from 2000 to 2009 was Southeast. It lost 3,744 people, a 5.1 percent decline, due to net out-migration. Only the Skagway Municipality gained population (+0.3 percent), though not
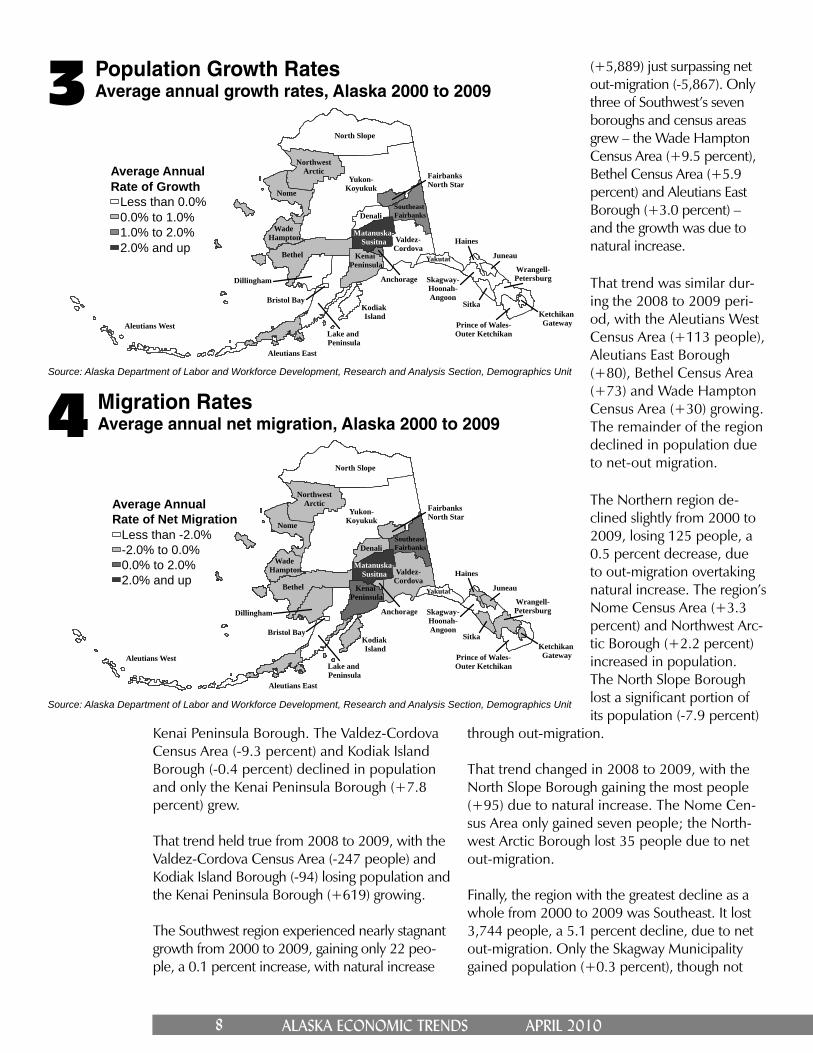
Population Growth RatesAverage annual growth rates, Alaska 2000 to 20093
Source: Alaska Department of Labor and Workforce Development, Research and Analysis Section, Demographics Unit
Kenai Peninsula Borough. The Valdez-Cordova Census Area (-9.3 percent) and Kodiak Island Borough (-0.4 percent) declined in population and only the Kenai Peninsula Borough (+7.8 percent) grew.
That trend held true from 2008 to 2009, with the Valdez-Cordova Census Area (-247 people) and Kodiak Island Borough (-94) losing population and the Kenai Peninsula Borough (+619) growing.
The Southwest region experienced nearly stagnant growth from 2000 to 2009, gaining only 22 peo-ple, a 0.1 percent increase, with natural increase
Migration RatesAverage annual net migration, Alaska 2000 to 20094
Source: Alaska Department of Labor and Workforce Development, Research and Analysis Section, Demographics Unit
Yukon-Koyukuk
North Slope
Bethel
Nome
Denali
Valdez-Cordova
NorthwestArctic
Dillingham
Lake and Peninsula
Kenai Peninsula
Matanuska-Susitna
Wade Hampton
Southeast Fairbanks
Yakutat
Sitka
Aleutians East
Kodiak Island
Juneau
Prince of Wales-Outer Ketchikan
Wrangell-PetersburgSkagway-
Hoonah-Angoon
Haines
Fairbanks North Star
Aleutians West
Anchorage
Bristol Bay
Ketchikan Gateway
Average AnnualRate of Net Migration
Less than -2.0%-2.0% to 0.0%0.0% to 2.0%2.0% and up
Yukon-Koyukuk
North Slope
Bethel
Nome
Denali
Valdez-Cordova
NorthwestArctic
Dillingham
Lake and Peninsula
Kenai Peninsula
Matanuska-Susitna
Wade Hampton
Southeast Fairbanks
Yakutat
Sitka
Aleutians East
Kodiak Island
Juneau
Prince of Wales-Outer Ketchikan
Wrangell-PetersburgSkagway-
Hoonah-Angoon
Haines
Fairbanks North Star
Aleutians West
Anchorage
Bristol Bay
Ketchikan Gateway
Average AnnualRate of Growth
Less than 0.0%0.0% to 1.0%1.0% to 2.0%2.0% and up

9ALASKA ECONOMIC TRENDS APRIL 2010
enough to be considered signifi cant.
However, from 2008 to 2009, Juneau (+256 people), Yakutat (+36), the Prince of Wales-Outer Ketchikan Census Area (+34), Skagway (+19) and the Ketchikan Gateway Borough (+4) had popula-tion gains. Out-migration was the driver behind the declining population throughout the remainder of the region, partly due to an aging population.
Places
The lowest level of population estimates released by the Alaska Department of Labor for 2009 is place estimates. A place is an incorporated city (municipalities and city-boroughs fall into this category), Census Designated Place (a closely settled unincorporated population center) or an Alaska Native Village Statistical Area (the settled area associated with each Alaska Native Village).
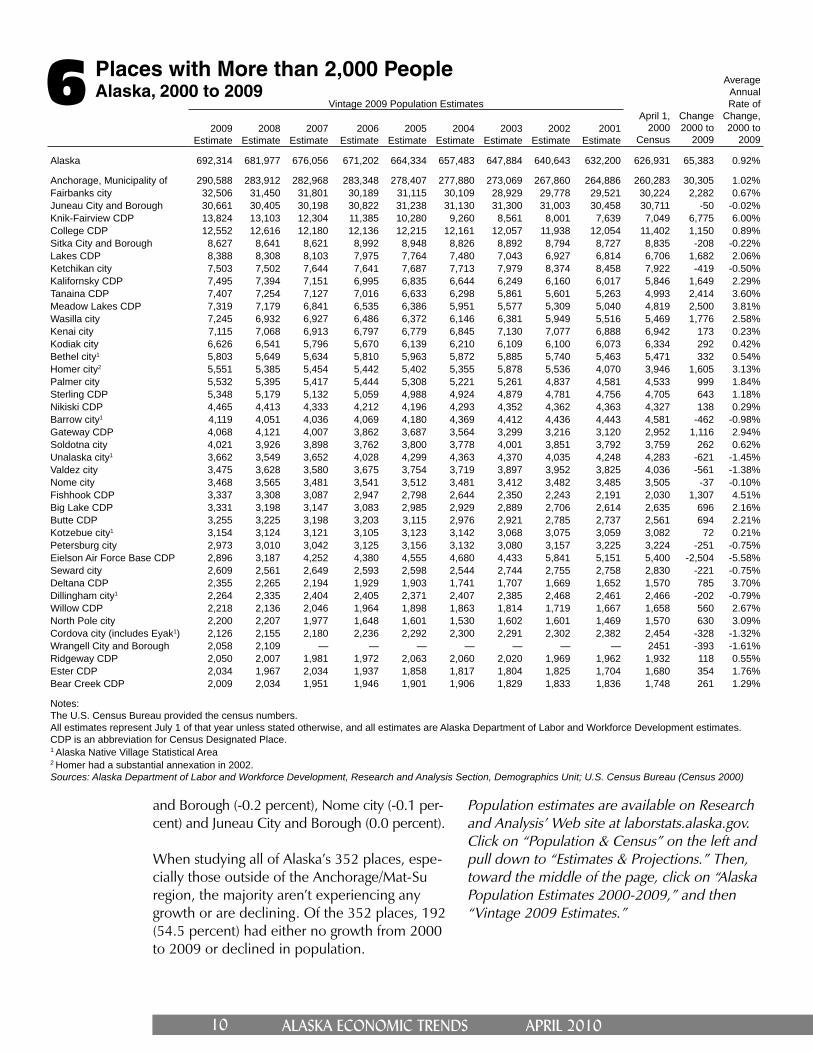
Looking at the number of places with populations of more than 2,000, there were fi ve more on the list in 2009 (41 total) than in 2000 (36 total). Twenty-three were incorporated as of 2009. (See Exhibit 6.)
In 2009, 54.2 percent of the state’s population was in the Anchorage/Mat-Su region (374,902), up from 51.0 percent in 2000. Not surprisingly, half the state’s dozen most-populous places were in the Anchorage-Mat-Su region – the Mu-nicipality of Anchorage (290,588), Knik-Fairview CDP (13,824), Lakes CDP (8,388), Tanaina CDP (7,407), Meadow Lakes CDP (7,319) and Wasilla city (7,245). If they were incorporated, four places in the Mat-Su Borough would be larger than Wasilla city, and Knik-Fairview would become the fourth-largest city in the state.
Fourteen places with populations of more than 2,000 had average annual growth rates above 2.0 percent for the 2000 to 2009 period: the Knik-Fairview CDP (+6.0 percent), Fishhook CDP
(+4.5 percent), Meadow Lakes CDP (+3.8 per-cent), Deltana CDP (+3.7 percent), Tanaina CDP (+3.6 percent), Homer city (+3.1 percent), North Pole city (+3.1 percent), Gateway CDP (+2.9 percent), Wil low CDP (+2.7 percent), Wasilla city (+2.6 percent), Kalifornsky CDP (+2.3 percent), Butte CDP (+2.2 percent) , Big Lake CDP (+2.2 percent) and Lakes CDP (+2.1 percent).
All but four of the 14 rapidly growing places are in the Mat-Su Borough. The remaining four are throughout the state – the Kalifornsky CDP and Homer city are in the Kenai Peninsula Borough, the Deltana CDP is in the Southeast Fairbanks Census Area and North Pole city is in the Fair-banks North Star Borough. While most of the four are growing due to natural increase, net in-migration or both, Homer experienced a large increase in population mostly due to the 2002 annexation of signifi cant portions of the Dia-mond Ridge CDP and Miller Landing CDP.
Thirteen places with populations greater than 2,000 had either stagnant or negative average an-nual growth rates for the 2000 to 2009 period. They include Eielson Air Force Base CDP (-5.6 percent), Wrangell City and Borough (-1.6 per-cent), Unalaska city (-1.5 percent), Valdez city (-1.4 percent), Cordova city (-1.3 percent), Barrow city (-1.0 percent), Dillingham city (-0.8 percent), Seward city (-0.8 percent), Petersburg city (-0.7 percent), Ketchikan city (-0.5 percent), Sitka City
Natural IncreaseAverage annual rates of natural increase, Alaska 2000 to 20095
Source: Alaska Department of Labor and Workforce Development, Research and Analysis Section, Demographics Unit
Yukon-Koyukuk
North Slope
Bethel
Nome
Denali
Valdez-Cordova
NorthwestArctic
Dillingham
Lake and Peninsula
Kenai Peninsula
Matanuska-Susitna
Wade Hampton
Southeast Fairbanks
Yakutat
Sitka
Aleutians East
Kodiak Island
Juneau
Prince of Wales-Outer Ketchikan
Wrangell-PetersburgSkagway-
Hoonah-Angoon
Haines
Fairbanks North Star
Aleutians West
Anchorage
Bristol Bay
Ketchikan Gateway
Average AnnualRate of Natural Increase
0.0% to 0.5%0.5% to 1.0%1.0% to 1.5%1.5% to 2.5%
10 ALASKA ECONOMIC TRENDS APRIL 2010
Places with More than 2,000 People Alaska, 2000 to 20096
and Borough (-0.2 percent), Nome city (-0.1 per-cent) and Juneau City and Borough (0.0 percent).
When studying all of Alaska’s 352 places, espe-cially those outside of the Anchorage/Mat-Su region, the majority aren’t experiencing any growth or are declining. Of the 352 places, 192 (54.5 percent) had either no growth from 2000 to 2009 or declined in population.
Population estimates are available on Research and Analysis’ Web site at laborstats.alaska.gov. Click on “Popu lation & Census” on the left and pull down to “Estimates & Projections.” Then, toward the middle of the page, click on “Alaska Population Estimates 2000-2009,” and then “Vintage 2009 Estimates.”
Vintage 2009 Population EstimatesApril 1,
2000 Census
Change2000 to
2009
Average Annual Rate of
Change, 2000 to
20092009
Estimate2008
Estimate2007
Estimate2006
Estimate2005
Estimate2004
Estimate2003
Estimate2002
Estimate2001
Estimate
Alaska 692,314 681,977 676,056 671,202 664,334 657,483 647,884 640,643 632,200 626,931 65,383 0.92%
Anchorage, Municipality of 290,588 283,912 282,968 283,348 278,407 277,880 273,069 267,860 264,886 260,283 30,305 1.02%Fairbanks city 32,506 31,450 31,801 30,189 31,115 30,109 28,929 29,778 29,521 30,224 2,282 0.67%Juneau City and Borough 30,661 30,405 30,198 30,822 31,238 31,130 31,300 31,003 30,458 30,711 -50 -0.02%Knik-Fairview CDP 13,824 13,103 12,304 11,385 10,280 9,260 8,561 8,001 7,639 7,049 6,775 6.00%College CDP 12,552 12,616 12,180 12,136 12,215 12,161 12,057 11,938 12,054 11,402 1,150 0.89%Sitka City and Borough 8,627 8,641 8,621 8,992 8,948 8,826 8,892 8,794 8,727 8,835 -208 -0.22%Lakes CDP 8,388 8,308 8,103 7,975 7,764 7,480 7,043 6,927 6,814 6,706 1,682 2.06%Ketchikan city 7,503 7,502 7,644 7,641 7,687 7,713 7,979 8,374 8,458 7,922 -419 -0.50%Kalifornsky CDP 7,495 7,394 7,151 6,995 6,835 6,644 6,249 6,160 6,017 5,846 1,649 2.29%Tanaina CDP 7,407 7,254 7,127 7,016 6,633 6,298 5,861 5,601 5,263 4,993 2,414 3.60%Meadow Lakes CDP 7,319 7,179 6,841 6,535 6,386 5,951 5,577 5,309 5,040 4,819 2,500 3.81%Wasilla city 7,245 6,932 6,927 6,486 6,372 6,146 6,381 5,949 5,516 5,469 1,776 2.58%Kenai city 7,115 7,068 6,913 6,797 6,779 6,845 7,130 7,077 6,888 6,942 173 0.23%Kodiak city 6,626 6,541 5,796 5,670 6,139 6,210 6,109 6,100 6,073 6,334 292 0.42%Bethel city1 5,803 5,649 5,634 5,810 5,963 5,872 5,885 5,740 5,463 5,471 332 0.54%Homer city2 5,551 5,385 5,454 5,442 5,402 5,355 5,878 5,536 4,070 3,946 1,605 3.13%Palmer city 5,532 5,395 5,417 5,444 5,308 5,221 5,261 4,837 4,581 4,533 999 1.84%Sterling CDP 5,348 5,179 5,132 5,059 4,988 4,924 4,879 4,781 4,756 4,705 643 1.18%Nikiski CDP 4,465 4,413 4,333 4,212 4,196 4,293 4,352 4,362 4,363 4,327 138 0.29%Barrow city1 4,119 4,051 4,036 4,069 4,180 4,369 4,412 4,436 4,443 4,581 -462 -0.98%Gateway CDP 4,068 4,121 4,007 3,862 3,687 3,564 3,299 3,216 3,120 2,952 1,116 2.94%Soldotna city 4,021 3,926 3,898 3,762 3,800 3,778 4,001 3,851 3,792 3,759 262 0.62%Unalaska city1 3,662 3,549 3,652 4,028 4,299 4,363 4,370 4,035 4,248 4,283 -621 -1.45%Valdez city 3,475 3,628 3,580 3,675 3,754 3,719 3,897 3,952 3,825 4,036 -561 -1.38%Nome city 3,468 3,565 3,481 3,541 3,512 3,481 3,412 3,482 3,485 3,505 -37 -0.10%Fishhook CDP 3,337 3,308 3,087 2,947 2,798 2,644 2,350 2,243 2,191 2,030 1,307 4.51%Big Lake CDP 3,331 3,198 3,147 3,083 2,985 2,929 2,889 2,706 2,614 2,635 696 2.16%Butte CDP 3,255 3,225 3,198 3,203 3,115 2,976 2,921 2,785 2,737 2,561 694 2.21%Kotzebue city1 3,154 3,124 3,121 3,105 3,123 3,142 3,068 3,075 3,059 3,082 72 0.21%Petersburg city 2,973 3,010 3,042 3,125 3,156 3,132 3,080 3,157 3,225 3,224 -251 -0.75%Eielson Air Force Base CDP 2,896 3,187 4,252 4,380 4,555 4,680 4,433 5,841 5,151 5,400 -2,504 -5.58%Seward city 2,609 2,561 2,649 2,593 2,598 2,544 2,744 2,755 2,758 2,830 -221 -0.75%Deltana CDP 2,355 2,265 2,194 1,929 1,903 1,741 1,707 1,669 1,652 1,570 785 3.70%Dillingham city1 2,264 2,335 2,404 2,405 2,371 2,407 2,385 2,468 2,461 2,466 -202 -0.79%Willow CDP 2,218 2,136 2,046 1,964 1,898 1,863 1,814 1,719 1,667 1,658 560 2.67%North Pole city 2,200 2,207 1,977 1,648 1,601 1,530 1,602 1,601 1,469 1,570 630 3.09%Cordova city (includes Eyak1) 2,126 2,155 2,180 2,236 2,292 2,300 2,291 2,302 2,382 2,454 -328 -1.32%Wrangell City and Borough 2,058 2,109 — — — — — — — 2451 -393 -1.61%Ridgeway CDP 2,050 2,007 1,981 1,972 2,063 2,060 2,020 1,969 1,962 1,932 118 0.55%Ester CDP 2,034 1,967 2,034 1,937 1,858 1,817 1,804 1,825 1,704 1,680 354 1.76%Bear Creek CDP 2,009 2,034 1,951 1,946 1,901 1,906 1,829 1,833 1,836 1,748 261 1.29%
Notes:The U.S. Census Bureau provided the census numbers.All estimates represent July 1 of that year unless stated otherwise, and all estimates are Alaska Department of Labor and Workforce Development estimates.CDP is an abbreviation for Census Designated Place.1 Alaska Native Village Statistical Area2 Homer had a substantial annexation in 2002.Sources: Alaska Department of Labor and Workforce Development, Research and Analysis Section, Demographics Unit; U.S. Census Bureau (Census 2000)
11ALASKA ECONOMIC TRENDS APRIL 2010
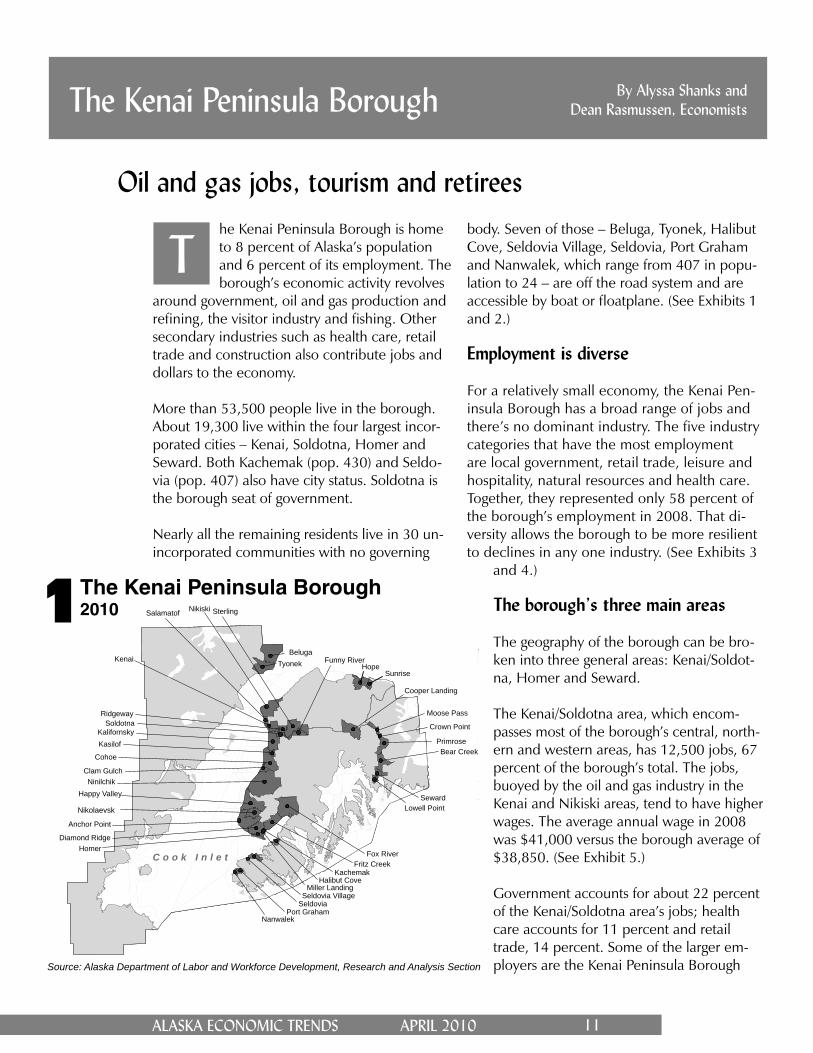
By Alyssa Shanks and Dean Rasmussen, EconomistsThe Kenai Peninsula Borough
Oil and gas jobs, tourism and retireeshe Kenai Peninsula Borough is home to 8 percent of Alaska’s population and 6 percent of its employment. The borough’s economic activity revolves
around government, oil and gas production and refi ning, the visitor industry and fi shing. Other secondary industries such as health care, retail trade and construction also contribute jobs and dollars to the economy.
More than 53,500 people live in the borough. About 19,300 live within the four largest incor-porated cities – Kenai, Soldotna, Homer and Seward. Both Kachemak (pop. 430) and Seldo-via (pop. 407) also have city status. Soldotna is the borough seat of government.
Nearly all the remaining residents live in 30 un-incorporated communities with no governing
Tbody. Seven of those – Beluga, Tyonek, Halibut Cove, Seldovia Village, Seldovia, Port Graham and Nanwalek, which range from 407 in popu-lation to 24 – are off the road system and are accessible by boat or fl oatplane. (See Exhibits 1 and 2.)
Employment is diverse
For a relatively small economy, the Kenai Pen-insula Borough has a broad range of jobs and there’s no dominant industry. The fi ve industry categories that have the most employment are local government, retail trade, leisure and hospitality, natural resources and health care. Together, they represented only 58 percent of the borough’s employment in 2008. That di-versity allows the borough to be more resilient to declines in any one industry. (See Exhibits 3
and 4.)
The borough’s three main areas
The geography of the borough can be bro-ken into three general areas: Kenai/Soldot-na, Homer and Seward.
The Kenai/Soldotna area, which encom-passes most of the borough’s central, north-ern and western areas, has 12,500 jobs, 67 percent of the borough’s total. The jobs, buoyed by the oil and gas industry in the Kenai and Nikiski areas, tend to have higher wages. The average annual wage in 2008 was $41,000 versus the borough average of $38,850. (See Exhibit 5.)
Government accounts for about 22 percent of the Kenai/Soldotna area’s jobs; health care accounts for 11 percent and retail trade, 14 percent. Some of the larger em-ployers are the Kenai Peninsula Borough
The Kenai Peninsula Borough20101
Source: Alaska Department of Labor and Workforce Development, Research and Analysis Section
C o o k I n l e t
Nikolaevsk
Hope
Cohoe
Kenai
Homer
BelugaTyonek
Seward
Kasilof
Sunrise
Nikiski
Ridgeway
Primrose
Nanwalek
Soldotna
Seldovia
Fox River
Ninilchik
Salamatof
Clam Gulch
Moose Pass
Bear Creek
Fritz Creek
KalifornskyCrown Point
Port Graham
Happy Valley
Lowell Point
Halibut Cove
Anchor Point
Diamond Ridge
Miller Landing
Sterling
Kachemak
Funny River
Cooper Landing
Seldovia Village
12 ALASKA ECONOMIC TRENDS APRIL 2010
School District, Central Peninsula General Hos-pital, Fred Meyer, Safeway, State of Alaska and ASRC Energy Services.
The Homer area, which covers from Ninilchik southward to Homer and Seldovia, has 20 percent of the borough’s employment – about 3,800 jobs. Those jobs average $34,300 a year, compared to the borough’s $38,850. The top employers are government (21 percent), health care (16 percent), leisure and hospitality (15 percent) and retail trade (14 percent).
The Homer area’s largest employers are the Kenai Peninsula Borough School District, South Peninsula Hospital, Safeway and South Penin-sula Behavioral Health Services.
The Seward area – from Crown Point south to Lowell Point – has 2,300 jobs. The top employ-ers are government (29 percent of the jobs), lei-sure and hospitality (22 percent) and health care (6 percent). The largest employers are Spring Creek Correctional Facility, Icicle Seafoods and the Seward Association for the Advancement of Marine Science.
Many people don’t know that the borough’s western border runs across Cook Inlet and on to the mainland, so the borough includes more than just the Kenai Peninsula. Except for three people on Kalgin Island and a few seasonal lodg-es, people live in Beluga (pop. 24) and Tyonek (pop. 166) on the mainland.
Government jobs are important
About 23 percent of the borough’s wage and salary jobs are in local, state or federal govern-ment. Five of the borough’s top-10 largest em-ployers are government entities, and most of those are in local government.
Government jobs are typically important to smaller economies such as the borough’s be-cause they provide stability and have relatively high pay and comprehensive benefi ts.
The Kenai Peninsula Borough School District is the largest single government employer. It oversees the education of 9,368 students in 44
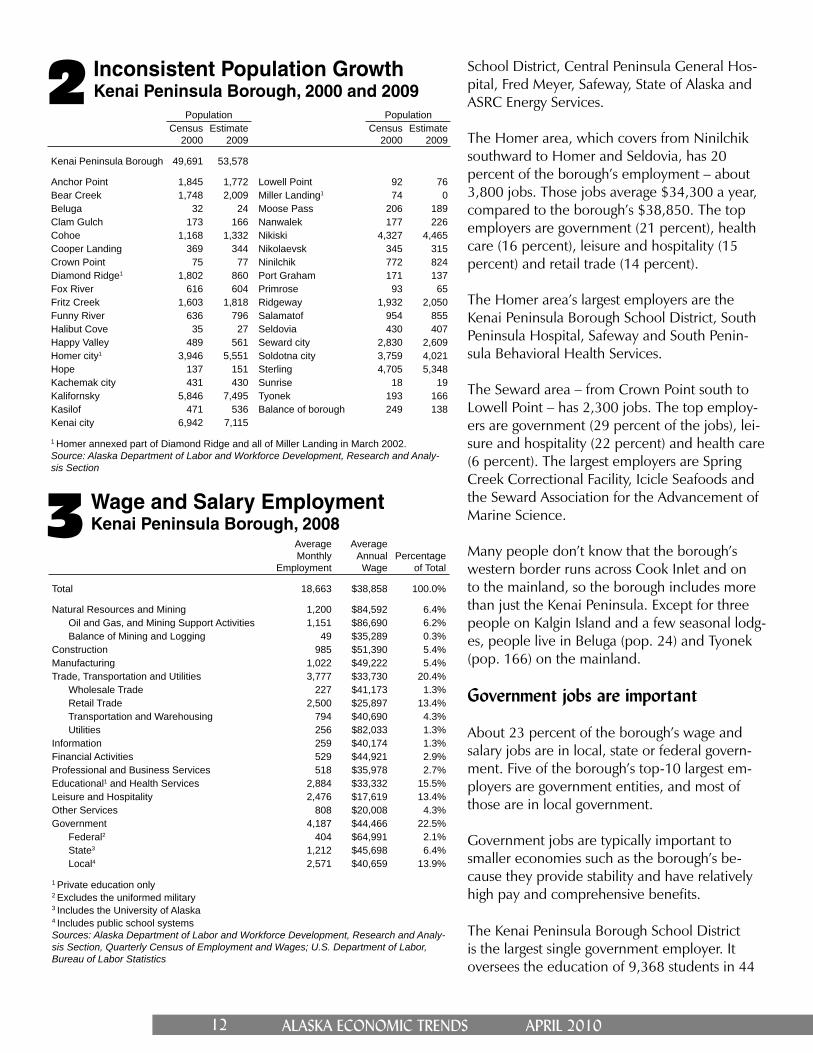
Inconsistent Population GrowthKenai Peninsula Borough, 2000 and 20092
Population PopulationCensus
2000Estimate
2009Census
2000Estimate
2009
Kenai Peninsula Borough 49,691 53,578
Anchor Point 1,845 1,772 Lowell Point 92 76Bear Creek 1,748 2,009 Miller Landing1 74 0Beluga 32 24 Moose Pass 206 189Clam Gulch 173 166 Nanwalek 177 226Cohoe 1,168 1,332 Nikiski 4,327 4,465Cooper Landing 369 344 Nikolaevsk 345 315Crown Point 75 77 Ninilchik 772 824Diamond Ridge1 1,802 860 Port Graham 171 137Fox River 616 604 Primrose 93 65Fritz Creek 1,603 1,818 Ridgeway 1,932 2,050Funny River 636 796 Salamatof 954 855Halibut Cove 35 27 Seldovia 430 407Happy Valley 489 561 Seward city 2,830 2,609Homer city1 3,946 5,551 Soldotna city 3,759 4,021Hope 137 151 Sterling 4,705 5,348Kachemak city 431 430 Sunrise 18 19Kalifornsky 5,846 7,495 Tyonek 193 166Kasilof 471 536 Balance of borough 249 138Kenai city 6,942 7,115
1 Homer annexed part of Diamond Ridge and all of Miller Landing in March 2002.Source: Alaska Department of Labor and Workforce Development, Research and Analy-sis Section
Wage and Salary EmploymentKenai Peninsula Borough, 20083
AverageMonthly
Employment
AverageAnnualWage
Percentageof Total
Total 18,663 $38,858 100.0%
Natural Resources and Mining 1,200 $84,592 6.4% Oil and Gas, and Mining Support Activities 1,151 $86,690 6.2% Balance of Mining and Logging 49 $35,289 0.3%Construction 985 $51,390 5.4%Manufacturing 1,022 $49,222 5.4%Trade, Transportation and Utilities 3,777 $33,730 20.4% Wholesale Trade 227 $41,173 1.3% Retail Trade 2,500 $25,897 13.4% Transportation and Warehousing 794 $40,690 4.3% Utilities 256 $82,033 1.3%Information 259 $40,174 1.3%Financial Activities 529 $44,921 2.9%Professional and Business Services 518 $35,978 2.7%Educational1 and Health Services 2,884 $33,332 15.5%Leisure and Hospitality 2,476 $17,619 13.4%Other Services 808 $20,008 4.3%Government 4,187 $44,466 22.5% Federal2 404 $64,991 2.1% State3 1,212 $45,698 6.4% Local4 2,571 $40,659 13.9%
1 Private education only2 Excludes the uniformed military3 Includes the University of Alaska4 Includes public school systemsSources: Alaska Department of Labor and Workforce Development, Research and Analy-sis Section, Quarterly Census of Employment and Wages; U.S. Department of Labor, Bureau of Labor Statistics

13ALASKA ECONOMIC TRENDS APRIL 2010
facilities.1 Though the borough owns Soldotna’s 46-bed Central Peninsula Hospital and Homer’s 22-bed South Peninsula Hospital, the hospitals are operated by nonprofi t corporations.
The Alaska Department of Corrections operates two prisons in the borough. The 500-inmate Spring Creek Correctional Center, across Resur-rection Bay from Seward, has about 200 em-ployees. The 360-inmate Wildwood Correctional Complex, three miles north of Kenai, has about 100 employees.
The borough’s state government jobs are also in post-secondary institutions – the Alaska Vocation-al Technical Center, or AVTEC, in Seward, which is operated by the State of Alaska, and the Kenai Peninsula College system. The latter is part of the University of Alaska Anchorage and has three campuses: the Kenai River Campus in Soldotna, Kachemak Bay Campus in Homer and the Resur-rection Bay Extension Site at Seward High School.
The federal government has a much smaller presence in the borough than both local and state government. The Federal Aviation Administration and federal natural resource agencies employ most of the borough’s federal workers.
High wages and hydrocarbons
Almost all natural resources jobs are in the oil and gas industry, and most of those earn high wages and are in the Kenai/Soldotna area. Oil and gas jobs accounted for about 6 percent of the borough’s employment in 2008 and 14 per-cent of its wages. The average annual wage was $86,700 in 2008, far above the borough’s aver-age of $38,850.
Most producing oil and gas fi elds in the Cook Inlet Basin are mature fi elds past their expected peak production volumes. Oil production has declined since the 1970s, when Cook Inlet pro-duced 140,000 barrels a day. The decline was fairly consistent until 1991 when the last major oil discoveries, the McArthur River and Sunfi sh oil fi elds, were made. Production stabilized until
1 According to the Alaska Department of Education and Early Devel-opment, as of Oct. 1
1 This exhibit shows wage and salary workers only; it doesn’t include the self-employed, fi shermen and other agricultural workers, and private household workers.Source: Alaska Department of Labor and Workforce Development, Research and Analysis Section
The Borough's Jobs are DiverseJobs by industry, 200814
Oil and Gas6%
Construction5%
All Other19%
Manufacturing5%
Retail13%
Health Care 11%
Leisure and Hospitality13%
Transportation and Warehousing
4%
Government22%
Where the Jobs AreKenai Peninsula Borough, 200815
1 This exhibit shows wage and salary workers only; it doesn’t include the self-em-ployed, fi shermen and other agricultural workers, and private household workers.Source: Alaska Department of Labor and Workforce Development, Research and Analysis Section
Kenai-Soldotna12,507 jobs
67% of borough total
Homer3,818 jobs
20% of borough total
Seward2,338 jobs
13% of borough total
Average Annual Employment and Wages by Region
$40,950 $35,100
$34,300
1996, then began declining again. From 1978 to 2008, oil production declined by 129,000 bar-rels a day.
Gas production hit a peak of 270 million cubic feet per day in 2005 and it has declined since. The 270 million cubic feet was the highest level since at least 1990, when production reached 203.9 million cubic feet a day.
The slowdown in activity is refl ected in the employment numbers. The oil and gas industry lost 150 jobs from 2002 to 2008 – it went from 1,350 jobs to 1,200.
Although 150 jobs isn’t a large number in the greater scheme of things, those jobs support oth-er high-paying jobs in the borough’s economy. A
14 ALASKA ECONOMIC TRENDS APRIL 2010
signifi cant portion of Cook Inlet’s unprocessed oil and gas goes to Tesoro’s oil refi nery, which produces jet fuel, gasoline and other products, and to ConocoPhillips’ LNG2 plant. Both are large employers.
The March eruption of the Mt. Redoubt vol-cano closed several oil platforms and temporar-ily stopped oil production on the west side of Cook Inlet. Despite those setbacks, the oil and gas industry lost only a few jobs through the third quarter of 2009 compared to third quarter 2008.
Visitors are important to the economy
The borough, famous for its scenic beauty and outdoor recreation, attracts both out-of-state and in-state visitors throughout the year. It’s relatively close to Anchorage, where 42 per-cent of the state’s population lives. The drive to Seward is roughly 2½ hours; to Homer it’s about 4½.
Like most of Alaska, summer is the main tour-ist season. August 2008 peaked at nearly 5,000 jobs above the seasonal low in January.
The Kenai River, renowned for its world-record king salmon, is a very popular destination. Fish-ing of all types – independent, sport fi shing and
2 Liquifi ed natural gas
commercial – brings thousands of people to the Kenai Peninsula every year.
Seward has the Alaska SeaLife Center, the state’s only public aquarium and ocean wildlife rescue center. Nearly 163,000 people visited the center in 2008. The $56 million center opened to the public in 1998; it focuses on research, rehabili-tation, education and exhibits. The out-of-state visitors are both independent travelers and cruise ship passengers. Indepen-dent travelers typically come from Anchorage. Cruise ship passengers embark or disembark at the Port of Seward. As part of their trip, they of-ten travel to or from Anchorage, Denali National Park and Fairbanks via tour bus or the Alaska Railroad.
Summer employment can be twice as high or more than winter levels. Looking at 2008, for instance, the winter low in the leisure and hos-pitality sector was 1,790 jobs; the high point that summer was 3,700. Average annual em-ployment for the sector from 2004 to 2008 was consistently about 2,500 – 13 percent of the borough’s total employment.
For the second quarter 2009, the Kenai Penin-sula Borough reported that both gross sales and sales tax revenue were down compared the same time the year before. The decline in gross sales indicates that the recession is having a negative impact on sales. And a nine-month tax exemption for non-prepared food caused part of the decline in sales tax revenue.
The most noticeable effect of the recession outside of sales was in the decrease in tourism. There were 2,900 fewer cruise ship passengers in 2009 compared to 2008.3
Tourism impacts most sectors of the economy either directly or indirectly. The leisure and hos-pitality, transportation and retail sectors are di-rectly impacted by tourism. But some less obvi-ous sectors are indirectly affected – construction, local government, utilities and others – sectors that accommodate tourists, but not exclusively.
3 According to the Cruise Line Agencies of Alaska
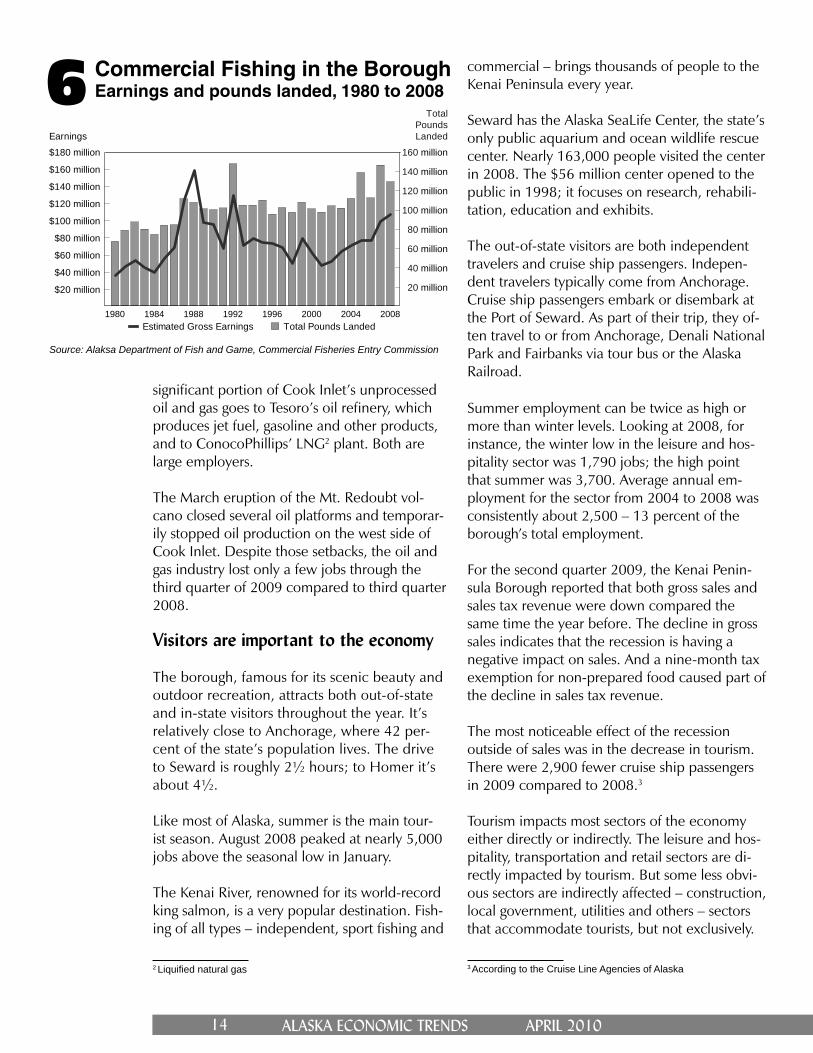
Commercial Fishing in the BoroughEarnings and pounds landed, 1980 to 20086
Source: Alaksa Department of Fish and Game, Commercial Fisheries Entry Commission
1980 1984 1988 1992 1996 2000 2004 2008
$20 million
$40 million
$60 million
$80 million
$100 million
$120 million
$140 million
$160 million
$180 million
Earnings
20 million
40 million
60 million
80 million
100 million
120 million
140 million
160 million
TotalPoundsLanded
Total Pounds LandedEstimated Gross Earnings

15ALASKA ECONOMIC TRENDS APRIL 2010
Commercial fishing keeps on going
The Kenai Peninsula Borough has a long history of commercial fi shing and seafood processing.
Nearly 1,400 borough residents hold commer-cial fi shing permits. Most of the permits are for salmon and most of the permit holders live in the Kenai/Soldotna and Homer areas.
Most of the permits in the Homer area are for halibut, herring and groundfi sh (primarily Pacifi c cod and pollock). In Seward, the number of per-mits for halibut and salmon are almost equal.
During the 1990s, the number of permit hold-ers in the borough decreased by 28 percent, but since then the number has been relatively stable.
The borough’s commercial fi shing harvest value peaked in 19884 at $158.1 million. Since then, conditions haven’t always been good. There were rocky years of low harvest values in 1980, 1984, 1998 and 2001. Harvest values, though, have grown since 2002; earnings pushed past the $100 million mark in 2008. (See Exhibit 6.)
As expected, high levels of commercial fi shing usually coincide with high levels of fi sh process-ing. Fish processing occurs in Nikiski, Kenai, Soldotna, Sterling, Kasilof, Ninilchik, Homer, Seldova and Seward. Processing employment made up 52 percent of the borough’s manufac-turing jobs in 2008.
An older population with less diversity
The borough’s population was older than the state’s as a whole and considerably less racially diverse.
The borough’s median age was 39.4 in residents in 2009, versus 33.5 for the state overall. (See Exhibit 7.) The borough’s median age was the eighth oldest out of the state’s 27 borough and census areas. Eleven percent of the borough’s residents were over 65 in 2009, compared to 8 percent statewide.
4 The earliest year for which data are available is 1980.
As far as race, 86.5 percent of borough residents are white, compared to 72.0 percent statewide, and 10.0 percent are Alaska Natives and Ameri-can Indians, versus 17.9 percent statewide, ac-cording to 2008 estimates.
Only 64.8 percent of the borough’s population was in the labor force in 2009 – working at a paid job or looking for work – compared to 70.1 percent statewide.
The Florida of Alaska
Kenai Peninsula Borough residents get the high-est percentage of their income from retirement and disability insurance benefi ts – 4.9 percent in 2007 – out of all Alaska’s boroughs and census areas. The Haines Borough, which also has a reputation as an Alaska retirement haven, had 4.4 percent.
The Kenai Peninsula Borough’s Homer is also at-tractive for retirees, as more than 10 percent of residents there were over 65 in 2000.5
5 The most recent year for which census data at this level are avail-able
Notes:The percentage over 65 and median age use 2009 data.The retirement as a share of income uses 2007 data (the most recent available). It is the percentage of the total income that is from retirement or disability income payments.Sources: Alaska Department of Labor and Workforce Development, Research and Analysis Section; U.S. Department of Commerce, Bureau of Economic Analysis
An Older PopulationAlaska7
14%
11%
9%
8%
8%
8%
7%
6%
5%
Haines Borough
Kenai Peninsula Borough
Bristol Bay Borough
Juneau Borough
Mat-Su Borough
Alaska
Anchorage Municipality
Fairbanks North Star Borough
Wade Hampton Census Area
46.4
39.4
42.0
38.0
34.5
33.5
33.1
31.0
19.4
Percentage Over 65Median
Age
Retirementas a Shareof Income
4.4%
4.9%
3.5%
2.8%
3.6%
2.9%
2.4%
2.7%
3.6%

16 ALASKA ECONOMIC TRENDS APRIL 2010
How is Alaska’s trust fund faring?laska’s unemployed workers de-pend on a healthy unemployment insurance trust fund to weather bad economic times. Alaska’s employers
depend on a healthy trust fund to keep employ-ment taxes low. Given the poor national econ-omy, and the fact that many states’ trust funds have become insolvent, it’s fair to ask, “How is Alaska’s trust fund doing?”1
By design, the fi nancing structure of Alaska’s trust fund – where tax revenue is held, to pay unemployment insurance benefi ts – allows for adjustments to the tax rates in response to changing economic conditions. The structure replenishes the fund as needed, seeks tax stabil-ity and minimizes the tax burden.
The depressed U.S. economy, in recession since December 2007,2 and Alaska’s slowing economy have both contributed to the state’s increased unemployment rolls. Even so, Alaska’s trust fund is healthy and will remain healthy even under much more stressful economic conditions. It would take an unprecedented in-crease in unemployment and a decline in total wages paid to drive Alaska’s unemployment in-surance trust fund into the insolvency that other states are facing.
Congress creates an emergency program
Congress created a new federal program in July 2008, plus a series of extensions, to meet the 1 One of the primary duties of the Alaska Department of Labor and Workforce Development is to pay unemployment benefi ts. The department is charged with continuously evaluating the health of Alaska’s unemployment insurance system and identifying where it can be improved. Throughout this article, all references to the Department of Labor are to the Alaska Department of Labor.2 According to the National Bureau of Economic Research, a private group of economists charged with dating the start and end of national economic downturns
Aspike in unemployment insurance claims caused by the recession: the Emergency Unemployment Insurance program, or EUC08. Congress paid for the program with federal money, so there’s no direct cost to the states, but claimants must de-plete their state-funded regular benefi ts fi rst.3
State trust funds – the financialbad news
Many states that could handle an ordinary re-cession were simply unprepared for the severity of the current recession. Thirty-four states as of April 5 had exhausted their funds and were bor-rowing money from the federal government to pay unemployment insurance benefi ts to claim-ants.
How Alaska’s fund stands
Alaska employers pay unemployment insurance taxes based on their tax rate. Then a solvency tax is on top of that: a solvency tax credit, sol-vency tax or “zero solvency tax,” when nothing is added or subtracted, all based on how the trust fund is doing.4 The tax rate, plus the sol-vency credit or tax, is then the fi nal tax rate that employers pay.
In the fall of 2008, when the national economic crisis was unfolding, the 2008 unemployment insurance tax rates for Alaska employers already included a solvency tax credit – lowering rates – because the trust fund had been slightly over-funded. The solvency tax credit was increased for 2009 because the fund was still overfunded, giving employers record-low tax rates.
3 Throughout this article, all references to benefi ts and claims are to the state-funded regular benefi ts.4 How the trust fund is doing, based on its solvency, is measured by the reserve rate, which is discussed later.
By James Wilson, Economist
Alaska’s Unemployment Insurance Trust Fund
17ALASKA ECONOMIC TRENDS APRIL 2010
Alaska’s UI fi nancing history goes back to 1937.7 There were changes in methodologies along the way, primarily in 1960, in 1974, and most importantly in 1981. At times, the state had one tax rate for all employers; other times it used various rate schedules. Later, it had fi xed rates for all employees. During all the different rate methodologies, though, Alaska had a fi xed tax-able wage base on employees’ earnings that changed infrequently.
Finally, in 1981, Alaska left behind the set-in-stone approaches and started its present system, which is driven by an economic formula. It was fortuitous timing, because only fi ve years later the price of oil crashed and the state went through the severe 1986-1987 recession. Now, nationally, more than half the state systems are bankrupt. Alaska’s system, meanwhile, is busy paying claims but is fi nancially sound.
A good design or just luck?
The success of Alaska’s unemployment insur-ance fi nancing system in meeting the annual fi nancial demands, maintaining solvency and stabilizing tax rates, is due to good design and has little to do with luck.
Yet Alaska has been fortunate that its system hasn’t been put under the same severe stress as some states such as California and Michigan.
7 Alaska authorized its fi rst benefi t payments to workers on Jan. 1, 1939.
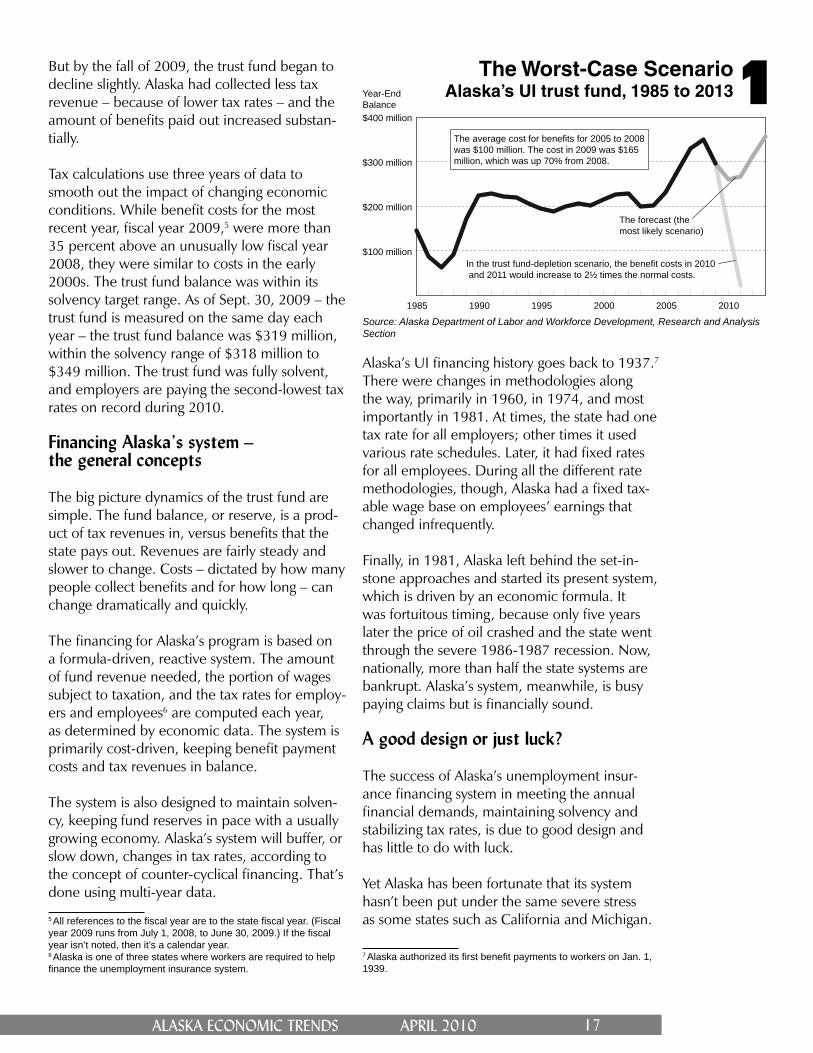
The Worst-Case ScenarioAlaska’s UI trust fund, 1985 to 20131
Source: Alaska Department of Labor and Workforce Development, Research and Analysis Section
But by the fall of 2009, the trust fund began to decline slightly. Alaska had collected less tax revenue – because of lower tax rates – and the amount of benefi ts paid out increased substan-tially.
Tax calculations use three years of data to smooth out the impact of changing economic conditions. While benefi t costs for the most recent year, fi scal year 2009,5 were more than 35 percent above an unusually low fi scal year 2008, they were similar to costs in the early 2000s. The trust fund balance was within its solvency target range. As of Sept. 30, 2009 – the trust fund is measured on the same day each year – the trust fund balance was $319 million, within the solvency range of $318 million to $349 million. The trust fund was fully solvent, and employers are paying the second-lowest tax rates on record during 2010.
Financing Alaska’s system –the general concepts
The big picture dynamics of the trust fund are simple. The fund balance, or reserve, is a prod-uct of tax revenues in, versus benefi ts that the state pays out. Revenues are fairly steady and slower to change. Costs – dictated by how many people collect benefi ts and for how long – can change dramatically and quickly.
The fi nancing for Alaska’s program is based on a formula-driven, reactive system. The amount of fund revenue needed, the portion of wages subject to taxation, and the tax rates for employ-ers and employees6 are computed each year, as determined by economic data. The system is primarily cost-driven, keeping benefi t payment costs and tax revenues in balance.
The system is also designed to maintain solven-cy, keeping fund reserves in pace with a usually growing economy. Alaska’s system will buffer, or slow down, changes in tax rates, according to the concept of counter-cyclical fi nancing. That’s done using multi-year data.
5 All references to the fi scal year are to the state fi scal year. (Fiscal year 2009 runs from July 1, 2008, to June 30, 2009.) If the fi scal year isn’t noted, then it’s a calendar year.6 Alaska is one of three states where workers are required to help fi nance the unemployment insurance system.
1985 1990 1995 2000 2005 2010
$100 million
$200 million
$300 million
$400 million
Year-End Balance
In the trust fund-depletion scenario, the benefit costs in 2010 and 2011 would increase to 2½ times the normal costs.
The average cost for benefits for 2005 to 2008 was $100 million. The cost in 2009 was $165 million, which was up 70% from 2008.
The forecast (the most likely scenario)

18 ALASKA ECONOMIC TRENDS APRIL 2010
Alaska’s economy isn’t dependent on an infl ated housing market, a declining manufacturing sec-tor or an ailing fi nancial industry, but it is de-pendent on the price and quantity of oil that it produces.
Keeping enough on reserve
All state unemployment insurance systems are designed to cover their ongoing costs,8 and all states have some method of experience rating their employers in order to assign tax rates.
Experience rating is used to fairly allocate the share of tax burden among employers based on each employer’s experience with unemploy-ment benefi ts. There are four experience-rating systems used in the U.S. They’re all designed to measure direct costs, or approximate costs.
The real issue of solvency is having enough reserves in each state system to meet the chal-lenge of a severe recession. Each state has its own defi ned measure, or target level, for its trust fund, and some response in place that’s used when a benchmark is met. The current national recession is an acid test. Many states will have to re-examine their idea of adequate reserves and their provisions for them.
The details of Alaska’s solvency system
Maintaining an adequate reserve, in sync with a growing economy, is a critical part of Alaska’s fi nancing system. The state’s solvency measure is the reserve rate – simply the trust fund balance as a percentage of the total wages of covered employment.9
Alaska’s solvency is examined each year, accord-ing to an economic formula, and an adjustment is made if needed.
The state has a target range; the midpoint is roughly 3.15 percent. If the reserve rate is at
8 State unemployment insurance taxes can only be used to pay benefi ts, not administrative costs. The federal government pays for the administration of each state’s unemployment program.9 The majority of Alaska workers who are paid wages are covered by the state’s unemployment insurance laws. Those who aren’t covered include the self-employed, business owners, fi shermen, unpaid volunteers or family workers and private household workers. Federal workers are also not covered.
least 3.0 percent but less than 3.3 percent, then a zero solvency tax is in effect. If the reserve rate drops below 3.0 percent then a solvency tax, ranging from 0.1 percent to 1.1 percent, is ap-plied. If the reserve rate is 3.3 percent or higher, then tax credits ranging from 0.1 percent to 0.4 percent are applied, lowering the fi nal tax rates of employers.
The solvency adjustment may not change by more than 0.3 percent in a single year. For example, the trust fund balance on Sept. 30, 2009, was $319 million and the reserve rate was 3.007 percent. Therefore, for 2010, there’s no solvency tax in effect.
The solvency tax expectation for 2011
Alaska’s Sept. 30, 2009, reserve rate was at the bottom of the range for no solvency tax; it barely avoided having the smallest solvency tax in effect for 2010. Because of persisting benefi t claim levels in the fall and early winter of 2009, a solvency tax is looking more likely for 2011. Due to the rise in tax rates, the Department of Labor expects that during 2010 the system will receive more revenue into the fund than during 2009. That revenue, however, may not offset the higher levels of benefi t payments.
If Alaska were proportionately repeating what happened in the 1986-1987 recession in 2009, its trust fund balance would have been about $220 million for the new tax calculation for 2010, and it would have been headed to a low point of roughly $128 million. Instead, the De-partment of Labor’s expectation is that by fall 2010, there will be a moderate decline from 2009’s $319 million mark, even with higher tax revenue, and persisting higher – but hopefully lessening – benefi t payments.
The current picture
Although the current Alaska employment pro-jections are for a modest reduction in jobs this year, the Department of Labor also anticipates a reduction in total benefi t payments in the last half of 2010. Even with an anticipated increase in unemployment insurance tax revenues, high-er benefi t costs in the early part of the year will
19ALASKA ECONOMIC TRENDS APRIL 2010
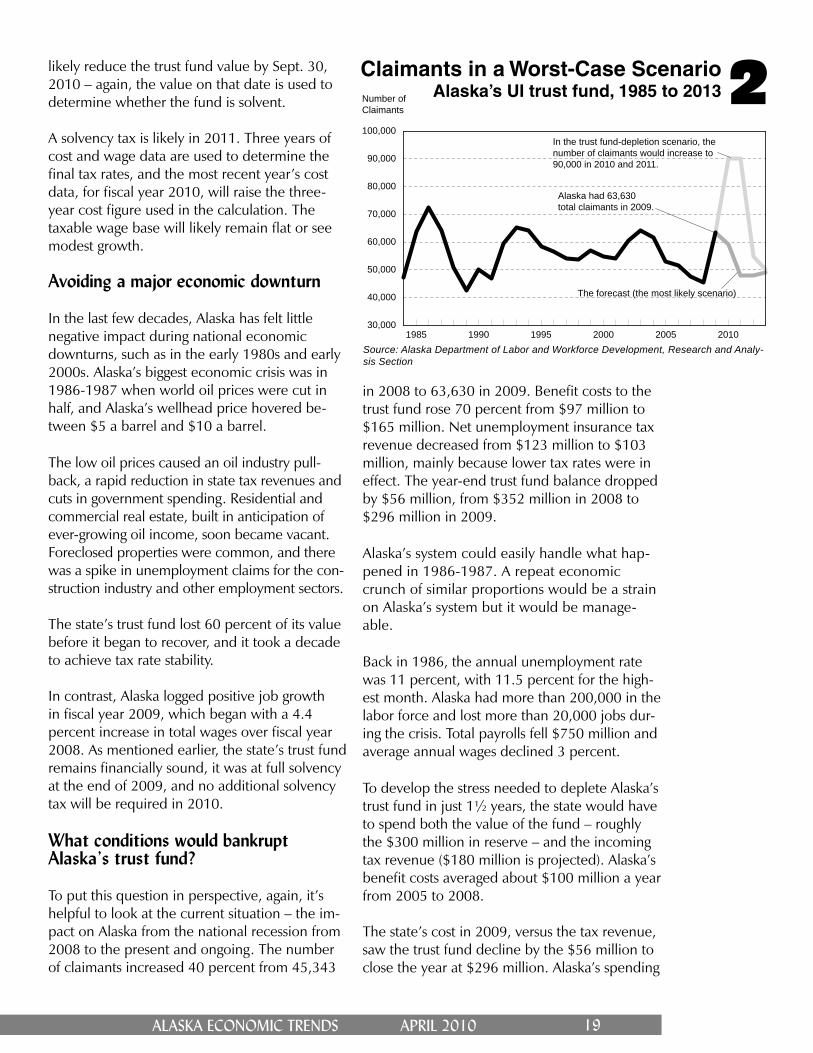
Claimants in a Worst-Case ScenarioAlaska’s UI trust fund, 1985 to 20132
Source: Alaska Department of Labor and Workforce Development, Research and Analy-sis Section
1985 1990 1995 2000 2005 201030,000
40,000
50,000
60,000
70,000
80,000
90,000
100,000
Number of Claimants
Alaska had 63,630 total claimants in 2009.
In the trust fund-depletion scenario, the number of claimants would increase to 90,000 in 2010 and 2011.
The forecast (the most likely scenario)
in 2008 to 63,630 in 2009. Benefi t costs to the trust fund rose 70 percent from $97 million to $165 million. Net unemployment insurance tax revenue decreased from $123 million to $103 million, mainly because lower tax rates were in effect. The year-end trust fund balance dropped by $56 million, from $352 million in 2008 to $296 million in 2009.
Alaska’s system could easily handle what hap-pened in 1986-1987. A repeat economic crunch of similar proportions would be a strain on Alaska’s system but it would be manage-able.
Back in 1986, the annual unemployment rate was 11 percent, with 11.5 percent for the high-est month. Alaska had more than 200,000 in the labor force and lost more than 20,000 jobs dur-ing the crisis. Total payrolls fell $750 million and average annual wages declined 3 percent.
To develop the stress needed to deplete Alaska’s trust fund in just 1½ years, the state would have to spend both the value of the fund – roughly the $300 million in reserve – and the incoming tax revenue ($180 million is projected). Alaska’s benefi t costs averaged about $100 million a year from 2005 to 2008.
The state’s cost in 2009, versus the tax revenue, saw the trust fund decline by the $56 million to close the year at $296 million. Alaska’s spending
likely reduce the trust fund value by Sept. 30, 2010 – again, the value on that date is used to determine whether the fund is solvent.
A solvency tax is likely in 2011. Three years of cost and wage data are used to determine the fi nal tax rates, and the most recent year’s cost data, for fi scal year 2010, will raise the three-year cost fi gure used in the calculation. The taxable wage base will likely remain fl at or see modest growth.
Avoiding a major economic downturn
In the last few decades, Alaska has felt little negative impact during national economic downturns, such as in the early 1980s and early 2000s. Alaska’s biggest economic crisis was in 1986-1987 when world oil prices were cut in half, and Alaska’s wellhead price hovered be-tween $5 a barrel and $10 a barrel.
The low oil prices caused an oil industry pull-back, a rapid reduction in state tax revenues and cuts in government spending. Residential and commercial real estate, built in anticipation of ever-growing oil income, soon became vacant. Foreclosed properties were common, and there was a spike in unemployment claims for the con-struction industry and other employment sectors.
The state’s trust fund lost 60 percent of its value before it began to recover, and it took a decade to achieve tax rate stability.
In contrast, Alaska logged positive job growth in fi scal year 2009, which began with a 4.4 percent increase in total wages over fi scal year 2008. As mentioned earlier, the state’s trust fund remains fi nancially sound, it was at full solvency at the end of 2009, and no additional solvency tax will be required in 2010.
What conditions would bankruptAlaska’s trust fund?
To put this question in perspective, again, it’s helpful to look at the current situation – the im-pact on Alaska from the national recession from 2008 to the present and ongoing. The number of claimants increased 40 percent from 45,343
20 ALASKA ECONOMIC TRENDS APRIL 2010
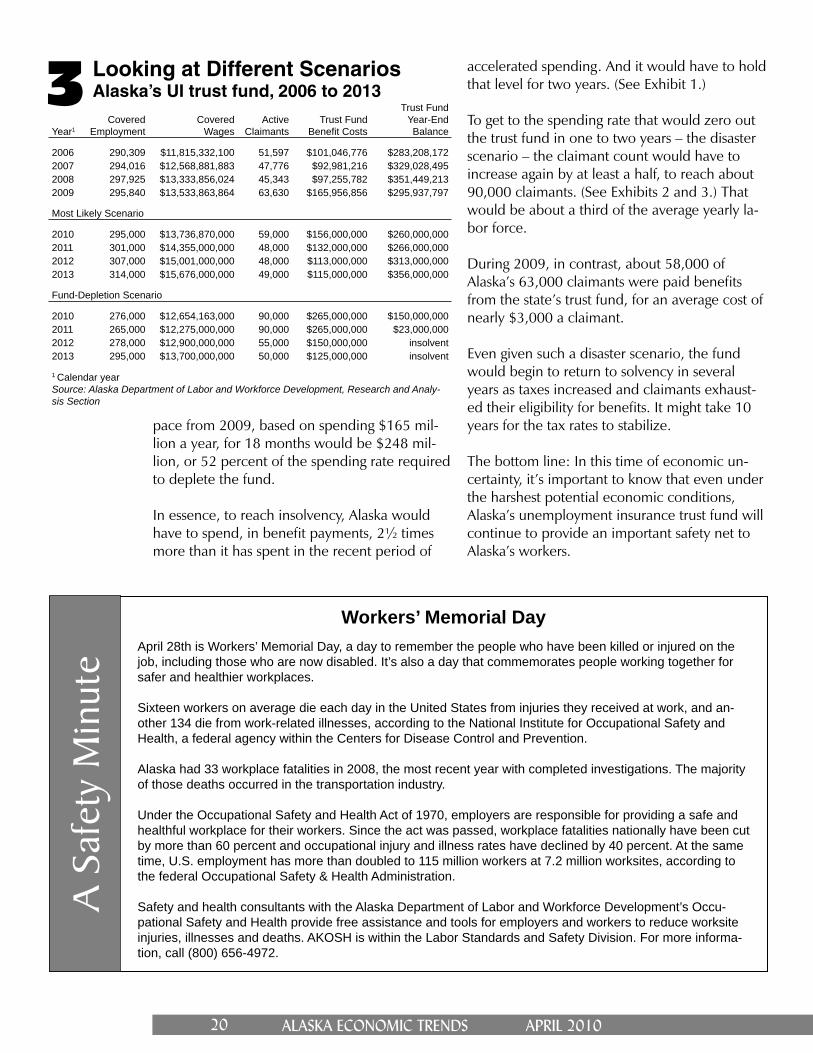
Looking at Different ScenariosAlaska’s UI trust fund, 2006 to 20133
Year1Covered
EmploymentCovered
WagesActive
ClaimantsTrust Fund
Benefi t Costs
Trust FundYear-End Balance
2006 290,309 $11,815,332,100 51,597 $101,046,776 $283,208,1722007 294,016 $12,568,881,883 47,776 $92,981,216 $329,028,4952008 297,925 $13,333,856,024 45,343 $97,255,782 $351,449,2132009 295,840 $13,533,863,864 63,630 $165,956,856 $295,937,797
Most Likely Scenario
2010 295,000 $13,736,870,000 59,000 $156,000,000 $260,000,0002011 301,000 $14,355,000,000 48,000 $132,000,000 $266,000,0002012 307,000 $15,001,000,000 48,000 $113,000,000 $313,000,0002013 314,000 $15,676,000,000 49,000 $115,000,000 $356,000,000
Fund-Depletion Scenario
2010 276,000 $12,654,163,000 90,000 $265,000,000 $150,000,0002011 265,000 $12,275,000,000 90,000 $265,000,000 $23,000,0002012 278,000 $12,900,000,000 55,000 $150,000,000 insolvent2013 295,000 $13,700,000,000 50,000 $125,000,000 insolvent
1 Calendar yearSource: Alaska Department of Labor and Workforce Development, Research and Analy-sis Section
pace from 2009, based on spending $165 mil-lion a year, for 18 months would be $248 mil-lion, or 52 percent of the spending rate required to deplete the fund.
In essence, to reach insolvency, Alaska would have to spend, in benefi t payments, 2½ times more than it has spent in the recent period of
accelerated spending. And it would have to hold that level for two years. (See Exhibit 1.)
To get to the spending rate that would zero out the trust fund in one to two years – the disaster scenario – the claimant count would have to increase again by at least a half, to reach about 90,000 claimants. (See Exhibits 2 and 3.) That would be about a third of the average yearly la-bor force.
During 2009, in contrast, about 58,000 of Alaska’s 63,000 claimants were paid benefi ts from the state’s trust fund, for an average cost of nearly $3,000 a claimant.
Even given such a disaster scenario, the fund would begin to return to solvency in several years as taxes increased and claimants exhaust-ed their eligibility for benefi ts. It might take 10 years for the tax rates to stabilize.
The bottom line: In this time of economic un-certainty, it’s important to know that even under the harshest potential economic conditions, Alaska’s unemployment insurance trust fund will continue to provide an important safety net to Alaska’s workers.
Workers’ Memorial DayApril 28th is Workers’ Memorial Day, a day to remember the people who have been killed or injured on the job, including those who are now disabled. It’s also a day that commemorates people working together for safer and healthier workplaces.
Sixteen workers on average die each day in the United States from injuries they received at work, and an-other 134 die from work-related illnesses, according to the National Institute for Occupational Safety and Health, a federal agency within the Centers for Disease Control and Prevention.
Alaska had 33 workplace fatalities in 2008, the most recent year with completed investigations. The majority of those deaths occurred in the transportation industry.
Under the Occupational Safety and Health Act of 1970, employers are responsible for providing a safe and healthful workplace for their workers. Since the act was passed, workplace fatalities nationally have been cut by more than 60 percent and occupational injury and illness rates have declined by 40 percent. At the same time, U.S. employment has more than doubled to 115 million workers at 7.2 million worksites, according to the federal Occupational Safety & Health Administration.
Safety and health consultants with the Alaska Department of Labor and Workforce Development’s Occu-pational Safety and Health provide free assistance and tools for employers and workers to reduce worksite injuries, illnesses and deaths. AKOSH is within the Labor Standards and Safety Division. For more informa-tion, call (800) 656-4972.
A S
afet
y M
inut
e
21ALASKA ECONOMIC TRENDS APRIL 2010
By Neal Fried, EconomistEmployment Scene
Unemployment rate at 8.5 percent in February
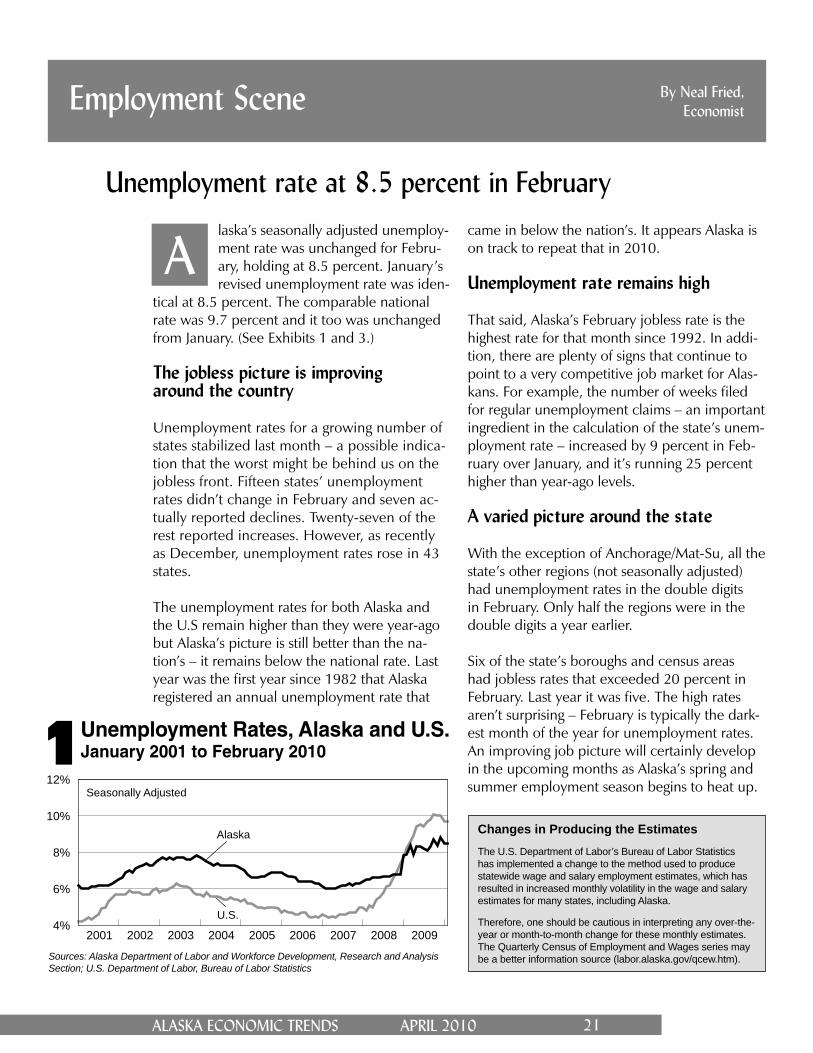
Unemployment Rates, Alaska and U.S.January 2001 to February 2010
Sources: Alaska Department of Labor and Workforce Development, Research and Analysis Section; U.S. Department of Labor, Bureau of Labor Statistics
laska’s seasonally adjusted unemploy-ment rate was unchanged for Febru-ary, holding at 8.5 percent. January’s revised unemployment rate was iden-
tical at 8.5 percent. The comparable national rate was 9.7 percent and it too was unchanged from January. (See Exhibits 1 and 3.)
The jobless picture is improvingaround the country
Unemployment rates for a growing number of states stabilized last month – a possible indica-tion that the worst might be behind us on the jobless front. Fifteen states’ unemployment rates didn’t change in February and seven ac-tually reported declines. Twenty-seven of the rest reported increases. However, as recently as December, unemployment rates rose in 43 states. The unemployment rates for both Alaska and the U.S remain higher than they were year-ago but Alaska’s picture is still better than the na-tion’s – it remains below the national rate. Last year was the fi rst year since 1982 that Alaska registered an annual unemployment rate that
A
1
came in below the nation’s. It appears Alaska is on track to repeat that in 2010. Unemployment rate remains high
That said, Alaska’s February jobless rate is the highest rate for that month since 1992. In addi-tion, there are plenty of signs that continue to point to a very competitive job market for Alas-kans. For example, the number of weeks fi led for regular unemployment claims – an important ingredient in the calculation of the state’s unem-ployment rate – increased by 9 percent in Feb-ruary over January, and it’s running 25 percent higher than year-ago levels.
A varied picture around the state
With the exception of Anchorage/Mat-Su, all the state’s other regions (not seasonally adjusted) had unemployment rates in the double digits in February. Only half the regions were in the double digits a year earlier.
Six of the state’s boroughs and census areas had jobless rates that exceeded 20 percent in February. Last year it was fi ve. The high rates aren’t surprising – February is typically the dark-est month of the year for unemployment rates. An improving job picture will certainly develop in the upcoming months as Alaska’s spring and summer employment season begins to heat up.Seasonally Adjusted
Alaska
U.S.
2001 2002 2003 2004 2005 2006 2007 2008 20094%
6%
8%
10%
12%
Changes in Producing the EstimatesThe U.S. Department of Labor’s Bureau of Labor Statistics has implemented a change to the method used to produce statewide wage and salary employment estimates, which has resulted in increased monthly volatility in the wage and salary estimates for many states, including Alaska.
Therefore, one should be cautious in interpreting any over-the-year or month-to-month change for these monthly estimates. The Quarterly Census of Employment and Wages series may be a better information source (labor.alaska.gov/qcew.htm).

22 ALASKA ECONOMIC TRENDS APRIL 2010
Prelim. RevisedSEASONALLY ADJUSTED 2/10 1/10 2/09United States 9.7 9.7 8.2Alaska Statewide 8.5 8.5 7.3
NOT SEASONALLY ADJUSTEDUnited States 10.4 10.6 8.9Alaska Statewide 9.8 9.4 8.5Anchorage/Mat-Su Region 8.6 8.2 7.3 Anchorage Municipality 7.8 7.4 6.5 Mat-Su Borough 11.5 11.1 10.2Gulf Coast Region 12.5 11.9 10.8 Kenai Peninsula Borough 13.5 12.9 11.5 Kodiak Island Borough 7.9 7.3 6.4 Valdez-Cordova Census Area 13.7 12.7 13.1Interior Region 10.0 10.0 8.9 Denali Borough 25.6 23.5 20.1 Fairbanks North Star Borough 8.8 8.9 7.8 Southeast Fairbanks CA 14.0 13.5 12.3 Yukon-Koyukuk Census Area 20.2 19.3 18.0Northern Region 11.0 9.9 8.9 Nome Census Area 14.7 13.2 12.4 North Slope Borough 5.5 5.2 4.4 Northwest Arctic Borough 15.6 13.7 12.7Southeast Region 10.6 10.5 10.1 Haines Borough 14.7 14.5 16.2 Hoonah-Angoon Census Area1 31.3 29.5 31.1 Juneau Borough 7.4 7.2 6.7 Ketchikan Gateway Borough1 10.8 10.7 9.9 Prince of Wales-Outer Ketchikan CA1 20.3 20.2 21.3 Sitka Borough 8.4 8.5 7.6 Skagway Municipality1 24.3 22.6 23.4 Wrangell-Petersburg CA1 14.8 15.5 14.1 Yakutat Borough 16.4 16.3 16.2Southwest Region 13.7 13.5 12.6 Aleutians East Borough 8.1 8.7 7.2 Aleutians West Census Area 4.6 6.4 4.3 Bethel Census Area 16.6 15.3 15.1 Bristol Bay Borough 13.6 13.2 15.1 Dillingham Census Area 12.5 11.5 11.6 Lake and Peninsula Borough 15.3 14.2 13.4 Wade Hampton Census Area 22.6 21.1 21.61 Because of the creation of new boroughs, this borough or census area has been changed or no longer exists. Data for the Skagway Municipality and Hoonah-Angoon Census Area (previ-ously Skagway-Hoonah-Angoon Census Area) became available in 2010. Data for the Wrangell Borough, and Petersburg and Prince of Wales-Hyder census areas will be available in 2011. Until then, data will continue to be published for the old areas.
2 Statewide EmploymentNonfarm wage and salary
Revised Year-Over-Year Change
Alaska 2/10 1/10 2/09 2/0990% Confi dence
Interval
Total Nonfarm Wage and Salary 1 308,500 306,900 307,700 800 -6,583 8,183Goods-Producing 2 41,400 38,700 40,700 700 -2,184 3,584Service-Providing 3 267,100 268,200 267,000 100 – –Mining and Logging 14,600 14,300 15,600 -1,000 -1,793 -207 Logging 100 100 100 0 – – Mining 14,400 14,200 15,500 -1,100 – – Oil and Gas 12,400 12,200 13,600 -1,200 – –Construction 13,300 12,300 13,300 0 -2,583 2,583Manufacturing 13,500 12,100 11,800 1,700 706 2,694 Wood Product Manufacturing 200 300 300 -100 – – Seafood Processing 8,900 8,100 8,300 600 – –Trade, Transportation, Utilities 58,900 60,600 59,500 -600 -2,972 1,772 Wholesale Trade 5,900 6,000 6,100 -200 -756 356 Retail Trade 33,600 34,900 33,600 0 -2,028 2,028 Food and Beverage Stores 6,200 6,300 6,100 100 – – General Merchandise Stores 9,400 9,900 9,400 0 – – Transportation, Warehousing, Utilities 19,400 19,700 19,800 -400 -1,438 638 Air Transportation 6,000 6,100 5,800 200 – – Truck Transportation 2,800 2,900 2,900 -100 – –Information 6,300 6,400 6,800 -500 -1,081 81 Telecommunications 4,200 4,200 4,400 -200 – –Financial Activities 14,000 14,100 14,300 -300 -2,243 1,643Professional and Business Services 24,700 23,600 25,500 -800 -2,593 993Educational 4 and Health Services 39,700 40,100 38,300 1,400 132 2,668 Health Care 28,700 29,000 27,600 1,100 – –Leisure and Hospitality 26,100 27,500 27,100 -1,000 -3,037 1,037 Accommodations 5,700 6,100 6,100 -400 – – Food Services and Drinking Places 16,600 17,600 17,200 -600 – –Other Services 11,200 11,500 11,300 -100 -3,276 3,076Government 86,200 84,400 84,200 2,000 – – Federal Government 5 16,500 16,300 16,200 300 – – State Government 26,100 25,000 25,500 600 – – State Government Education 6 8,000 7,000 8,000 0 – – Local Government 43,600 43,100 42,500 1,100 – – Local Government Education 7 25,300 24,600 24,600 700 – – Tribal Government 3,700 3,500 3,400 300 – –
Notes for Exhibits 2 and 4:A dash indicates that confi dence intervals aren’t available at this level.1 Excludes the self-employed, fi shermen and other agricultural workers, and private household workers; for estimates of fi sh harvesting employment, and other fi sheries data, go to labor.alaska.gov/research/seafood/seafood.htm2 Goods-producing sectors include natural resources and mining, construction and manufacturing.3 Service-providing sectors include all others not listed as goods-producing sectors.4 Private education only5 Excludes uniformed military6 Includes the University of Alaska7 Includes public school systems8 Fairbanks North Star BoroughSources for Exhibits 2 and 3: Alaska Department of Labor and Workforce Development, Research and Analysis Section; U.S. Department of Labor, Bureau of Labor StatisticsSources for Exhibit 4: Alaska Department of Labor and Workforce Development, Research and Analysis Section; also the U.S. Department of Labor, Bureau of Labor Statistics, for Anchorage/Mat-Su and Fairbanks
4 Regional EmploymentNonfarm wage and salary
Revised Changes from Percent Change 2/10 1/10 2/09 1/10 2/09 1/10 2/09
Anch/Mat-Su 166,800 165,700 166,500 1,100 300 0.7% 0.2% Anchorage 147,600 146,300 147,800 1,300 -200 0.9% -0.1%Gulf Coast 26,400 26,350 26,450 50 -50 0.2% -0.2%Interior 42,200 41,200 42,100 1,000 100 2.4% 0.2% Fairbanks 8 36,400 35,400 36,500 1,000 -100 2.8% -0.3%Northern 19,850 19,700 20,500 150 -650 0.8% -3.2%Southeast 32,100 31,750 32,450 350 -350 1.1% -1.1%Southwest 19,300 18,150 19,550 1,150 -250 6.3% -1.3%
For more current state and regional employment and unemployment data, visit our Web site:
laborstats.alaska.gov
3Unemployment RatesBorough and census area
23ALASKA ECONOMIC TRENDS APRIL 2010
Employer ResourcesThe Business Connection
What’s the best part about the employer services offered through the Alaska Department of Labor and Workforce Development’s Business Connection? Employers often say it’s the customer service, the fact that it’s free – and that they talk to real people, not an automated phone system.
Business Connection staff can tell employers about how they could benefi t from on-the-job training opportunities, apprenticeship programs and Alaska-hire. They can tell employers about other department programs and services, ranging from work permits and tax credits to job center workshops.
The staff can explain to employers about how to use ALEXsys, Alaska’s online job bank: how to advertise a job opening online, search for potential employees and look at their resumes, recruit veterans and search for job seek-ers with certain training certifi cations or academic degrees. The staff can help employers tailor recruitment plans to meet employers’ needs, refer qualifi ed applicants to employ-ers and arrange for employers to use job center conference and interview rooms for recruiting.
They can also host job fairs and other recruitment events for employers – events where employers can meet job seekers face to face, providing access to a large number of potential candidates in a short amount of time.
“We recently had over 300 job seekers attend our recruitment event in one day,” said Nelson San Juan, a seafood employment specialist with the department’s Anchorage Midtown Job Center. “Three major employers were seeking at-sea processors and we had so many people looking for work, we had to use every conference room in the build-ing. It was exciting.”
To reach the Business Connection staff, call (877) 724-2539, 8 a.m. to 5 p.m., Monday through Friday. The Business Connection Web site is at jobs.alaska.gov/employer.htm.
The Business Connection Web site has a link to the Alaska Employer Resource Manual, which was updated this month. The manual gives a detailed overview of the employer services available through the department (including those through the Business Connection), and provides employers with a working knowledge of state and federal requirements.
Another popular employer service is TaxWeb, the department’s online unemployment insurance tax system, where employers can pay their unemployment insurance taxes and fi le their quarterly contribution reports.
“Employers love it for all sorts of reasons,” said Virginia Calloway, chief of the department’s Unemployment Insur-ance Tax program. “I’d say we get the most comments from people that they really like having all their information available to them online, they can fi le their taxes in the middle of the night if they want to, and that the UI staff is very responsive.”
TaxWeb helps people save time because the system automatically fi lls in each employee’s tax information each month. It allows employers to create a fi le in Quickbooks that can be downloaded to TaxWeb. Employers can also view their previous contribution reports.
People can learn more about TaxWeb on the Web by going to labor.alaska.gov/estax, or by calling (888) 448-3527. In Juneau, call (907) 465-2757.