OCS Oil & Gas Onshore / Coastal Infrastructure
67
OCS Oil & Gas OCS Oil & Gas Onshore / Coastal Infrastructure Onshore / Coastal Infrastructure Presentation to the North Carolina Presentation to the North Carolina Advisory Subcommittee on Advisory Subcommittee on Offshore Energy Exploration Offshore Energy Exploration Raleigh, North Carolina Raleigh, North Carolina February 23, 2010 February 23, 2010 Minerals Management Service Minerals Management Service – Gulf of Mexico Region Gulf of Mexico Region Fred Jacobs Fred Jacobs – Chief, Production Measurement Section Chief, Production Measurement Section Kristen Strellec Kristen Strellec – Economist, Social Science Unit Economist, Social Science Unit
Transcript of OCS Oil & Gas Onshore / Coastal Infrastructure
OCS Oil & Gas OCS Oil & Gas Onshore / Coastal InfrastructureOnshore / Coastal Infrastructure
Presentation to the North Carolina Presentation to the North Carolina Advisory Subcommittee on Advisory Subcommittee on
Offshore Energy ExplorationOffshore Energy Exploration
Raleigh, North CarolinaRaleigh, North CarolinaFebruary 23, 2010February 23, 2010
Minerals Management Service Minerals Management Service –– Gulf of Mexico RegionGulf of Mexico RegionFred Jacobs Fred Jacobs –– Chief, Production Measurement SectionChief, Production Measurement Section
Kristen Strellec Kristen Strellec –– Economist, Social Science UnitEconomist, Social Science Unit

Outer Continental Shelf
MMS regulates oil & gas activity on Federal OCS.
OCS: submerged lands lying beyond the seaward extent of the States jurisdiction out to Federal boundary

Offshore Platform Schematic
Fixed platform used in water depths typically less than 1000 ft.
Moored floating structures are typically used in water depths greater than 1000 ft.
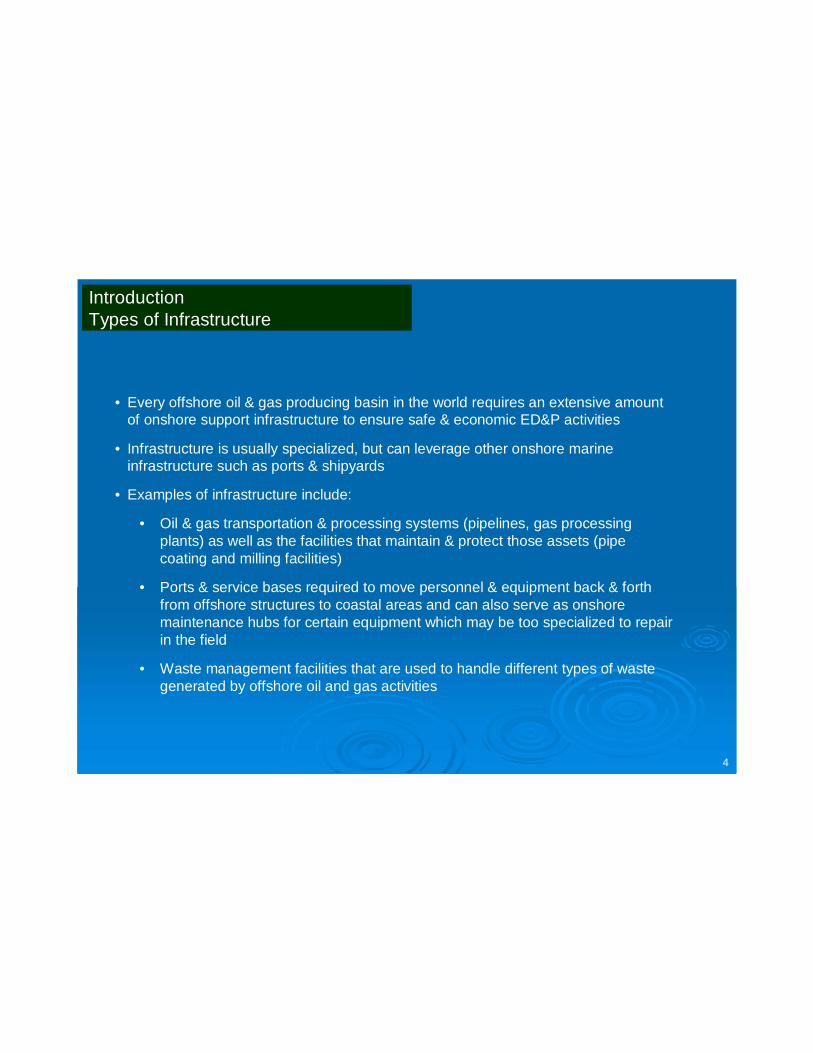
IntroductionTypes of Infrastructure
4
• Every offshore oil & gas producing basin in the world requires an extensive amount of onshore support infrastructure to ensure safe & economic ED&P activities
• Infrastructure is usually specialized, but can leverage other onshore marine infrastructure such as ports & shipyards
• Examples of infrastructure include:
• Oil & gas transportation & processing systems (pipelines, gas processing plants) as well as the facilities that maintain & protect those assets (pipe coating and milling facilities)
• Ports & service bases required to move personnel & equipment back & forth from offshore structures to coastal areas and can also serve as onshore maintenance hubs for certain equipment which may be too specialized to repair in the field
• Waste management facilities that are used to handle different types of waste generated by offshore oil and gas activities

5
IntroductionOffshore Operations
Offshore oil & gas operations differ considerably from most onshore activities
• Equipment more expensive to install since it has to be transported over water or through the air; also operates in a more hostile environment.
• Costs for repair and maintenance considerably higher due to the transportation costs to the offshore facility; also additional costs for the transportation of waste.
• Workers tend to be more experienced & skilled (given the complexity of the operations & the value of the equipment). Thus, they commandhigher wages.

6
IntroductionCurrent Study
• MMS routinely examines the onshore support network that supports offshore oil & gas development.
• Current study titled “Oil & Gas Infrastructure in the Mid-Atlantic (GM-09-08)” will describe each infrastructure type & inventory & will analyze capacities; review industry trends, outlooks, & potential issues for each infrastructure type; & analyze what new infrastructure is likely to be needed as well as potential changes to existing infrastructure to adapt to new development needs. The final report expected in June 2011.
• This presentation provides background information on many of these infrastructure types. Many pictures are of facilities/assets that support the extensive O&G development in the GOM. Thus, the scope & size of many of these assets are significant & may not approximate the scale of onshore assets that may be developed to support a single Atlantic lease sale, or limited Atlantic development.
• MMS has no permitting authority for any onshore infrastructure. Individual states will make their own permitting and siting decisions.

Pipelines
7

PipelinesNatural Gas
• Roughly 305,000 miles of interstate & intrastate transmission pipelines in the U.S.
• Highly integrated transmission & distribution grid can transport natural gas to & from nearly any location in the lower 48 States
• Interstate network comprised of long-distance, wide-diameter (20-42 inch), high-capacity trunklines; carries most of the natural gas transported
• Intrastate natural gas pipelines operate within State borders & link natural gas producers to local markets and to the interstate pipeline network
• Smaller diameter pipelines are used to by local distribution companies (LDC’s) to deliver natural gas to commercial and residential end-users
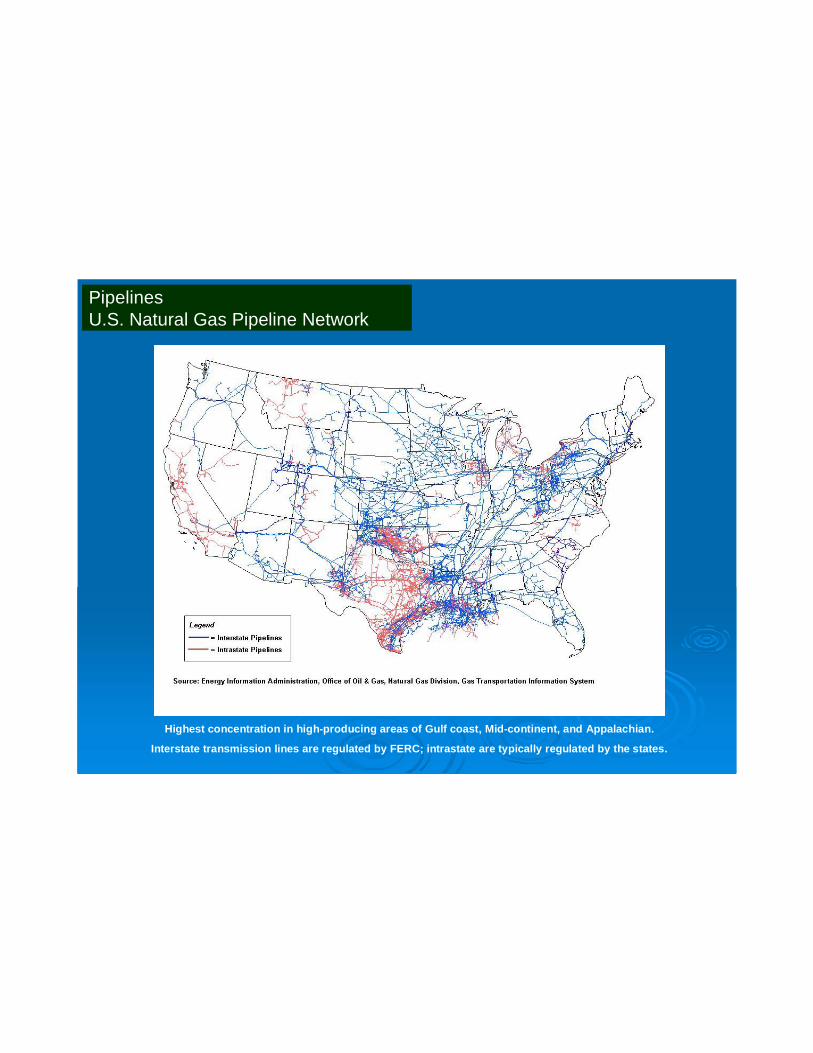
Pipelines U.S. Natural Gas Pipeline Network
Highest concentration in high-producing areas of Gulf coast, Mid-continent, and Appalachian.
Interstate transmission lines are regulated by FERC; intrastate are typically regulated by the states.

PipelinesTransportation Corridors
Most of the major transportation routes can be categorized into 11 distinct corridors or flow patterns. Five major routes extend from the producing areas of the South; four enter the
U.S. from Canada; and two start in the Rocky Mountain area.
Examples of potential access points for Atlantic offshore production

Natural Gas Pipelines Major Mid-Atlantic Transco Pipeline
11
Williams’ Transco Pipeline has a system design capacity of 8.1 Bcf per day and serves markets in the Southeast, Mid-Atlantic, and Northeast
Source: Williams Energy, Internet website: http://www.williams.com/gas_pipeline/gp_assetMap.aspx
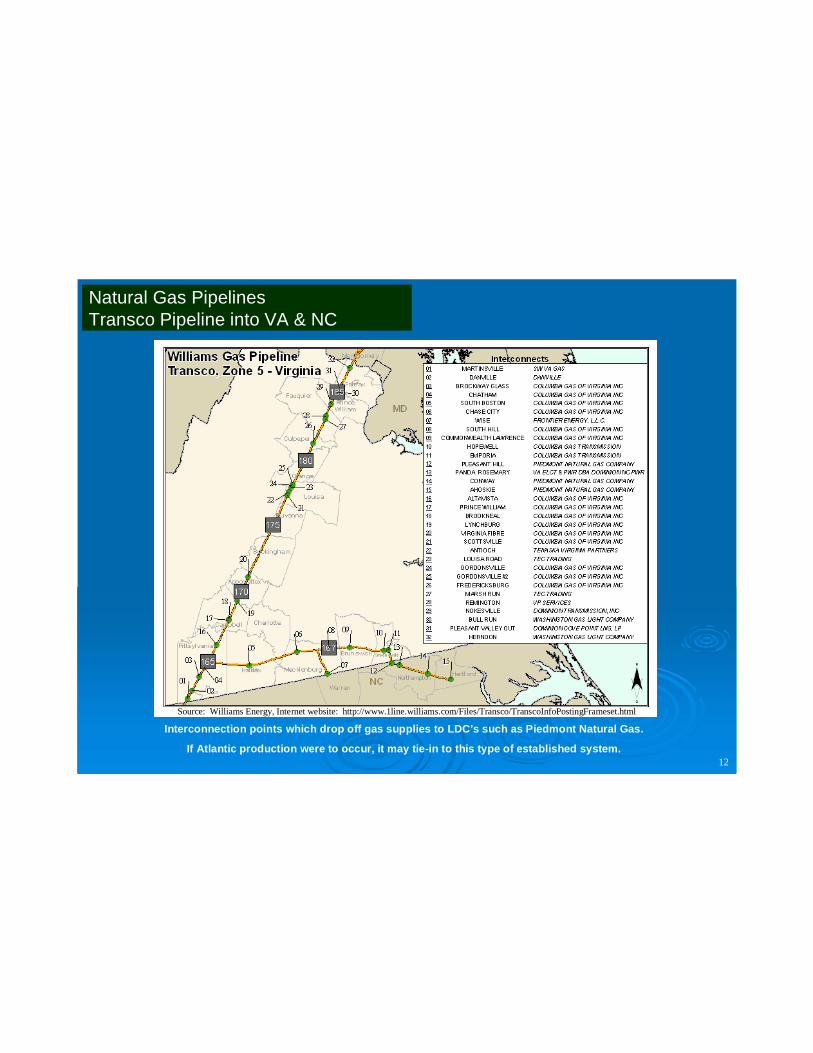
Natural Gas Pipelines Transco Pipeline into VA & NC
12
Source: Williams Energy, Internet website: http://www.1line.williams.com/Files/Transco/TranscoInfoPostingFrameset.html
Interconnection points which drop off gas supplies to LDC’s such as Piedmont Natural Gas.
If Atlantic production were to occur, it may tie-in to this type of established system.
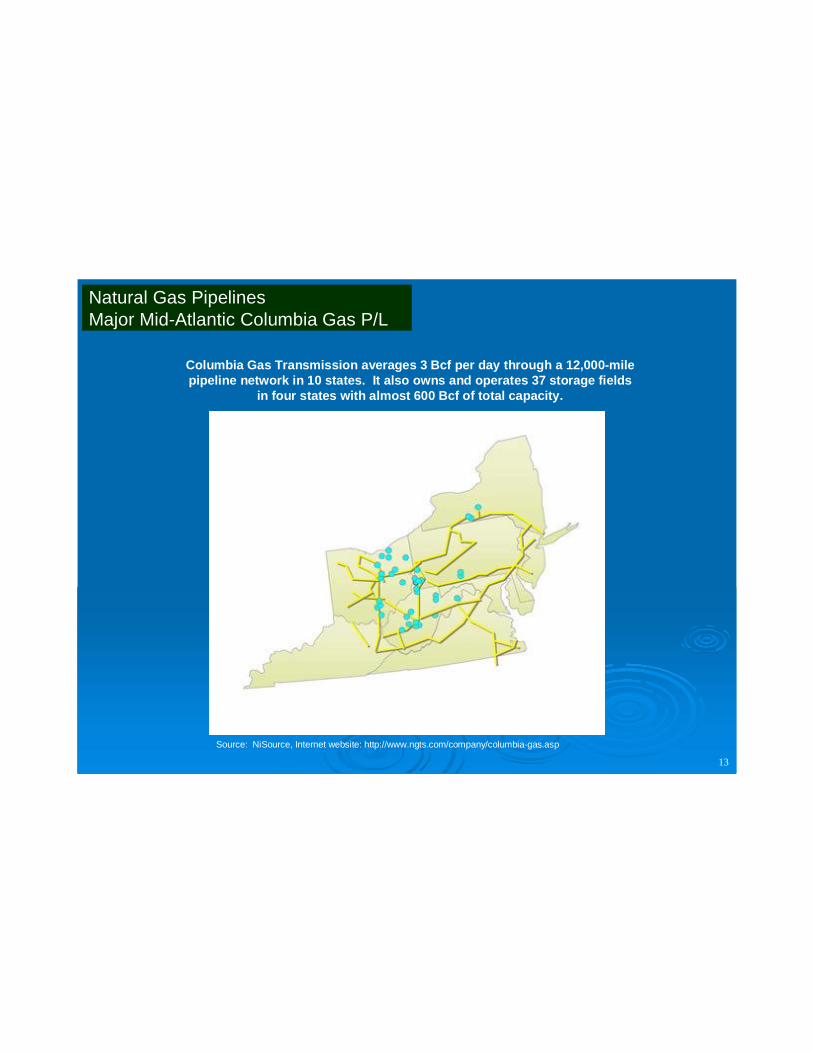
Natural Gas Pipelines Major Mid-Atlantic Columbia Gas P/L
13
Columbia Gas Transmission averages 3 Bcf per day through a 12,000-mile pipeline network in 10 states. It also owns and operates 37 storage fields
in four states with almost 600 Bcf of total capacity.
Source: NiSource, Internet website: http://www.ngts.com/company/columbia-gas.asp

Natural Gas Pipelines Major Mid-Atlantic Dominion P/L
14
Source: Dominion Transmission; Internet website: http://escript.dom.com/jsp/info_post.jsp?&company=dti.
Dominion Transmission maintains 7,800 miles of pipeline in six states: OH, WV, PA, NY, MD, and VA. Dominion also operates one of the largest underground storage systems in the U.S. with links to other major pipelines and markets in the Midwest, Mid-Atlantic and Northeast regions.
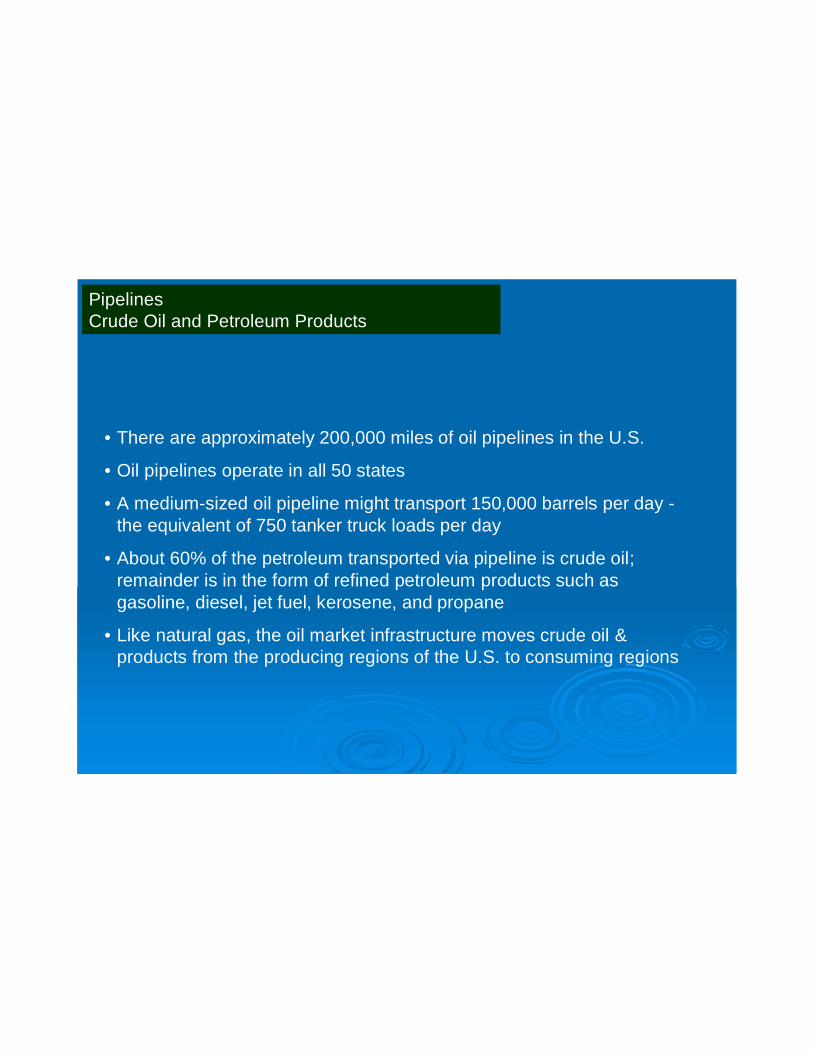
Pipelines Crude Oil and Petroleum Products
• There are approximately 200,000 miles of oil pipelines in the U.S.
• Oil pipelines operate in all 50 states
• A medium-sized oil pipeline might transport 150,000 barrels per day -the equivalent of 750 tanker truck loads per day
• About 60% of the petroleum transported via pipeline is crude oil; remainder is in the form of refined petroleum products such as gasoline, diesel, jet fuel, kerosene, and propane
• Like natural gas, the oil market infrastructure moves crude oil & products from the producing regions of the U.S. to consuming regions
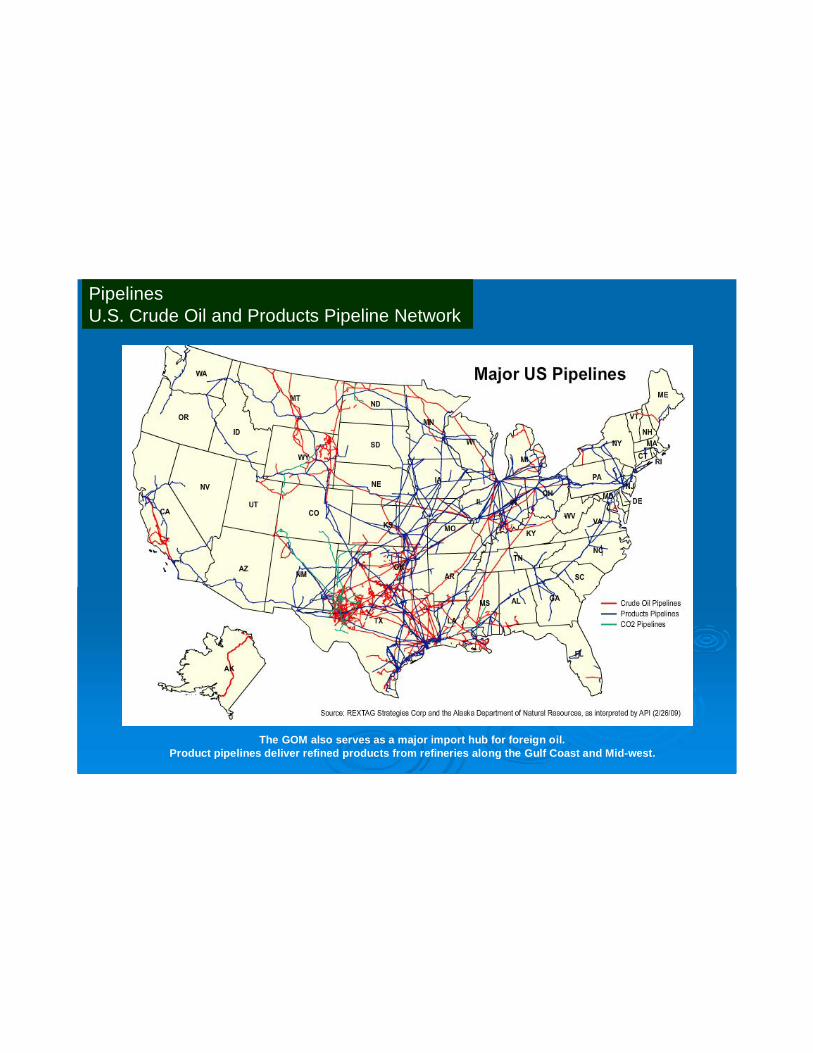
Pipelines U.S. Crude Oil and Products Pipeline Network
The GOM also serves as a major import hub for foreign oil. Product pipelines deliver refined products from refineries along the Gulf Coast and Mid-west.
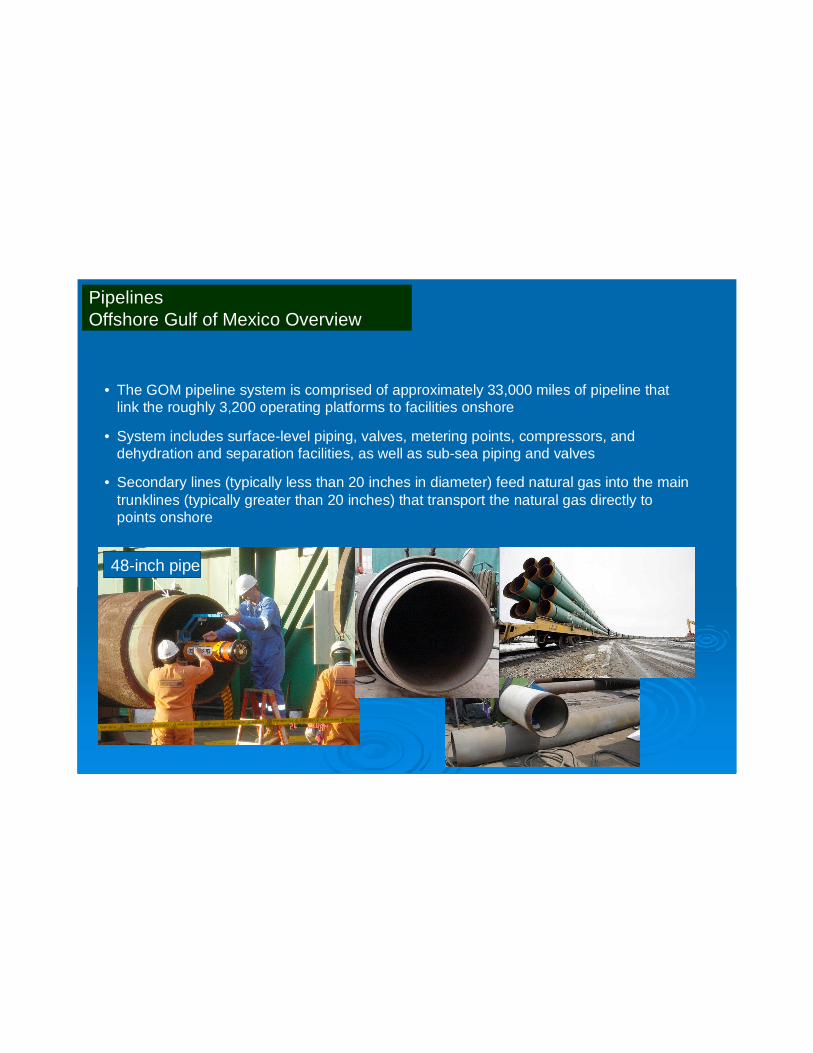
Pipelines Offshore Gulf of Mexico Overview
• The GOM pipeline system is comprised of approximately 33,000 miles of pipeline that link the roughly 3,200 operating platforms to facilities onshore
• System includes surface-level piping, valves, metering points, compressors, and dehydration and separation facilities, as well as sub-sea piping and valves
• Secondary lines (typically less than 20 inches in diameter) feed natural gas into the main trunklines (typically greater than 20 inches) that transport the natural gas directly to points onshore
48-inch pipe
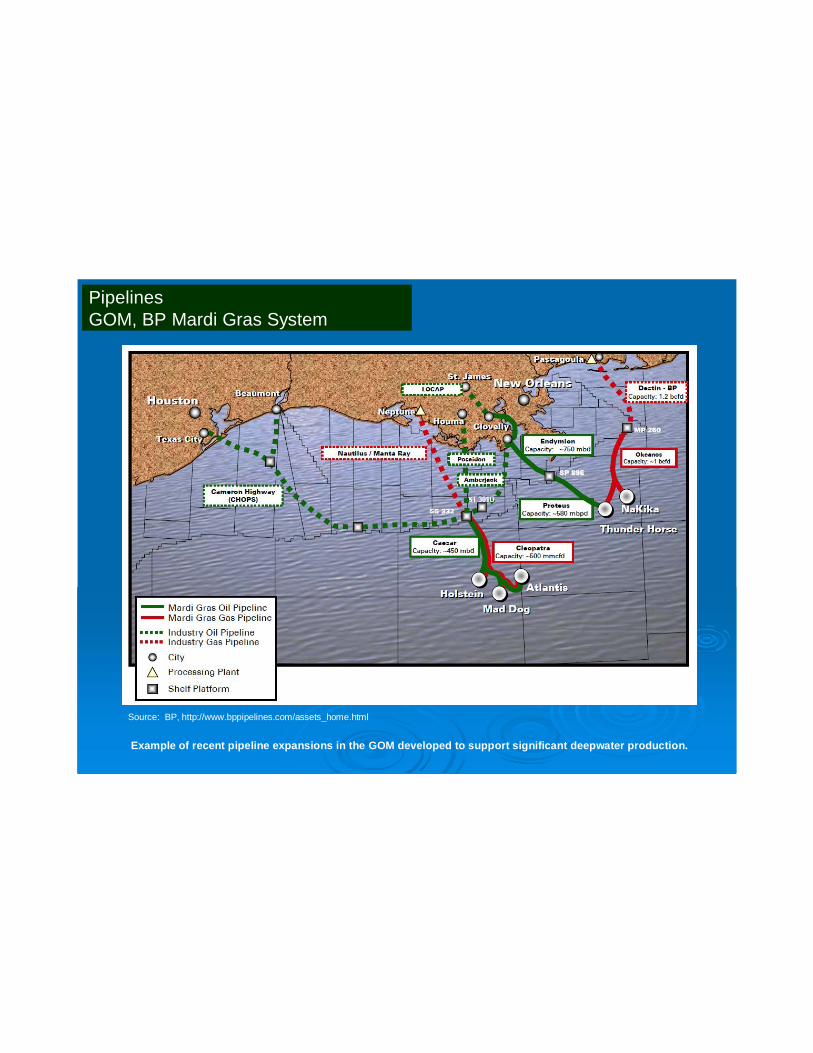
Pipelines GOM, BP Mardi Gras System
Source: BP, http://www.bppipelines.com/assets_home.html
Example of recent pipeline expansions in the GOM developed to support significant deepwater production.

Pipelines GOM, Pelican Gas Gathering System
System delivers natural gas and condensate to the Cameron Commingling Facility for processing.

PipelinesEmployment – Annual Operations
Position DescriptionPosition Description Salary RangeSalary RangeBusiness/MarketingBusiness/Marketing $75,000 to $110,00$75,000 to $110,00
Engineers (C.E., M.E)Engineers (C.E., M.E) $100,000 to $120,000$100,000 to $120,000Technicians/OperationsTechnicians/Operations $75,000 to $95,000$75,000 to $95,000
Support/MaintenanceSupport/Maintenance $45,000 to $75,000$45,000 to $75,000
Misc. Local Contract SupportMisc. Local Contract SupportVaries by Trade/Craft but Varies by Trade/Craft but averages around $90,000averages around $90,000
Employment levels & staffing will be a function of pipeline development levels and activities. Below are some of the potential positions that may support limited field operations.
Significant offshore Atlantic development could give rise to a larger regional presence by a major pipeline company. A regional operations center could lead to significant payroll across numerous business, marketing, management, engineering and operations positions.

Natural Gas Processing
21

• Natural gas is processed to:
1. Prepare gas for residential and commercial use by removing impurities and separating the gas into useful components
2. Obtain an uplift in value in the gas stream
• Impurities can include water, hydrogen sulfide, carbon dioxide, nitrogen and helium
• There are 535 natural gas processing plants in the U.S.
• Most of the existing processing capacity is located in 6 states: Texas, Louisiana, Oklahoma, Colorado, Wyoming, & California
Natural Gas ProcessingOverview
22

Source: Canadian Centre for Energy Information. What is natural gas? Internet website: http://www.centreforenergy.com
Natural Gas ProcessingCommon Components of Natural Gas
23Primary component of natural gas is methane which is used for retail customer use.Other components which are processed out of the stream are referred to as natural gas liquids.
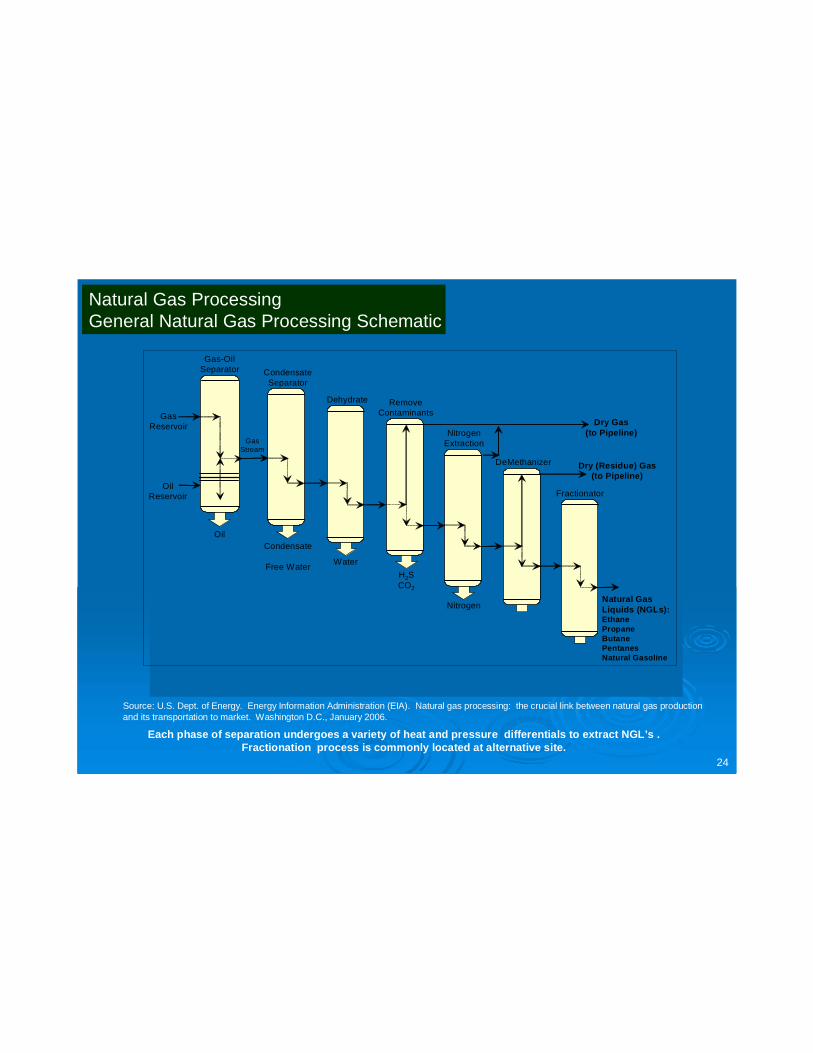
Natural Gas ProcessingGeneral Natural Gas Processing Schematic
Source: U.S. Dept. of Energy. Energy Information Administration (EIA). Natural gas processing: the crucial link between natural gas production and its transportation to market. Washington D.C., January 2006.
Gas-OilSeparator
Oil
GasReservoir
OilReservoir
GasStream
CondensateSeparator
Condensate
Free Water
Dehydrate
Water
RemoveContaminants
H2SCO2
Dry Gas(to Pipeline)Nitrogen
Extraction
Nitrogen
DeMethanizer Dry (Residue) Gas(to Pipeline)
Fractionator
Natural Gas Liquids (NGLs):EthanePropaneButanePentanesNatural Gasoline
24
Each phase of separation undergoes a variety of heat and pressure differentials to extract NGL’s .Fractionation process is commonly located at alternative site.

Natural Gas ProcessingConcentration of Processing Plants
Source: U.S. Dept. of Energy. Energy Information Administration (EIA). Natural gas processing: the crucial link between natural gas production and its transportation to market. U.S. Department of Energy, Energy Information Administration, Office of Oil and Gas, Washington D.C., January 2006. 25
Existing Mid-Atlantic gas processing is limited to the moderate levels of gas production in the Appalachian basin. Processing plants are located in the western regions of PA & WV.

Natural Gas ProcessingBridgeport Processing Plant
Devon Energy’s Bridgeport natural gas processing plant serves hundreds of gas wells in the Barnett Shale field in north Texas
Source: Devon Energy, Internet website: http://www.devonenergy.com/Newsroom/Pages/media_resources.aspx#terms?disclaimer=yes 26
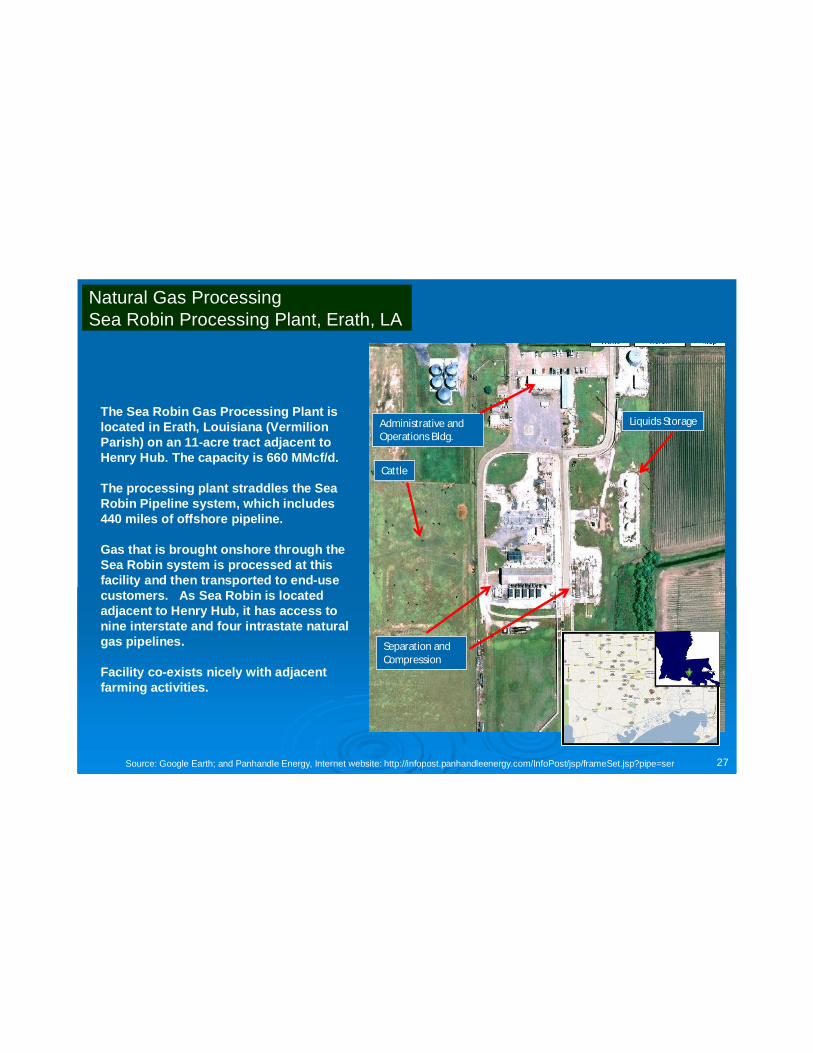
Natural Gas ProcessingSea Robin Processing Plant, Erath, LA
Source: Google Earth; and Panhandle Energy, Internet website: http://infopost.panhandleenergy.com/InfoPost/jsp/frameSet.jsp?pipe=ser
The Sea Robin Gas Processing Plant is located in Erath, Louisiana (Vermilion Parish) on an 11-acre tract adjacent to Henry Hub. The capacity is 660 MMcf/d.
The processing plant straddles the Sea Robin Pipeline system, which includes 440 miles of offshore pipeline.
Gas that is brought onshore through the Sea Robin system is processed at this facility and then transported to end-use customers. As Sea Robin is located adjacent to Henry Hub, it has access to nine interstate and four intrastate natural gas pipelines.
Facility co-exists nicely with adjacent farming activities.
27
Administrative and Operations Bldg.
Liquids Storage
Separation and Compression
Cattle

Natural Gas ProcessingTypical Staffing & Salaries
28
Number of Number of PositionsPositions
Position Position DescriptionDescription Salary RangeSalary Range
3 to 53 to 5Engineers (C.E., Engineers (C.E.,
M.E)M.E)$75,000 to $75,000 to $110,000$110,000
7 to 127 to 12 TechniciansTechnicians $75,000 to $95,000$75,000 to $95,000
5 to 105 to 10Support and Support and MaintenanceMaintenance
$45,000 to $45,000 to $75,000$75,000
VariesVariesMisc. Local Misc. Local
Contract SupportContract Support
Varies by Varies by Trade/Craft and Trade/Craft and
location location –– averages averages around $89,000around $89,000
Staffing and salary levels are approximate and can vary with size of facility and location.
Most Company employees at gas processing facilities receive health, retirement, and other corporate benefits.

Pipe Coating

Pipe Coating Overview
• Exterior of oil & gas pipelines are coated to protect against corrosion / other damage
• May coat inside to protect against corrosion & improve the flow of hydrocarbons
• For offshore, may be coated with a concrete layer to increase weight (ensure line stays on the seabed)
• Threats to pipeline integrity include third-party damage, geological activity & corrosion
• To be effective, coating for hydrocarbon pipelines must satisfy several properties:
– Easy to apply– Adheres well to pipe– Resists impact– Flexible– Resists soil stress– Resistant to water– Resistant to electricity– Chemically and structurally stable– Resists bacteria, marine organisms and corrosion.

Pipe Coating Pipe Coating Operations
In the GOM, pipe coating mills are usually located adjacent to the pipe mill, so line pipe moves directly from the pipe manufacturer to the coating facility
Or onshore pipe can be coated in the field, once the pipe is in place
Source: BSS, http://www.bss.com.cn; Consolidated Pipe Coatings, http:// expert-pipe-coaters.com; Shandong Xunda Anticorrosion, http://www. xundatape.com
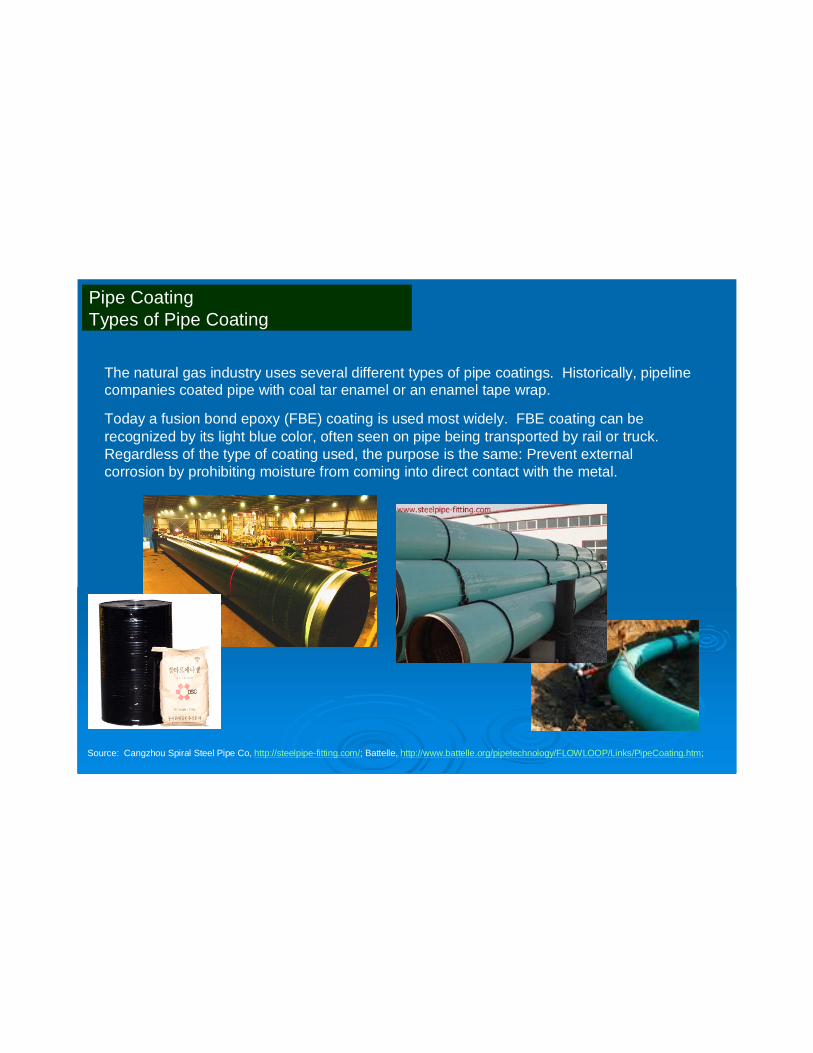
Pipe CoatingTypes of Pipe Coating
The natural gas industry uses several different types of pipe coatings. Historically, pipeline companies coated pipe with coal tar enamel or an enamel tape wrap.
Today a fusion bond epoxy (FBE) coating is used most widely. FBE coating can be recognized by its light blue color, often seen on pipe being transported by rail or truck. Regardless of the type of coating used, the purpose is the same: Prevent external corrosion by prohibiting moisture from coming into direct contact with the metal.
Source: Cangzhou Spiral Steel Pipe Co, http://steelpipe-fitting.com/; Battelle, http://www.battelle.org/pipetechnology/FLOWLOOP/Links/PipeCoating.htm;

Pipe CoatingThe Bayou Companies, New Iberia, LA
Source: http://www.bayoucompanies.com.
Stacked, coated pipe

Pipe CoatingThe Bayou Companies, Baton Rouge, LA
Source: http://www.bayoucompanies.com.
The Bayou Companies’ Baton Rouge facility is located adjacent to the Stupp Corporation Pipe Mill. The facility has access to the CN railroad and is in close
proximity to the port of Greater Baton Rouge.

Pipe CoatingBredero Shaw, Pearland, TX
Source: http://www.brederoshaw.com/
Bredero Shaw’s pipe coating facility in Pearland, Texas is accessible by truck,
rail and through the Houston/ Galveston ports.
Stacked, coated pipe
Milling and Coating Buildings
Rail spur

Pipe CoatingMid-Atlantic Pipe Coating Facilities
Company City State
1 Liberty Coating Company Morrisville PA2 Dura-Bond Coating Inc Export PA3 Dura-Bond Coating Inc McKeesport PA4 Dura-Bond Coating Inc Steelton PA5 IPSCO Tubulars Inc Ambridge PA6 Rohm and Haas Chemicals LLC Reading PA7 Rohm and Haas Chemicals LLC Wytheville VA

Pipe CoatingMid-Atlantic Pipe Coating Facilities
Liberty Coating Company
Dura-Bond Coating, Inc
Source: Dura-Bond Coating Inc., http://www.dura-bond.com/facilities.html; Liberty Coating Company, http://www.libertycoating.com/specifications.html

Pipe Coating, Milling, and YardsEmployment – Annual Operations
Position DescriptionPosition Description Salary RangeSalary RangeBusiness/ManagementBusiness/Management $100,000 to $120,000$100,000 to $120,000
Business/MarketingBusiness/Marketing $70,000 to $110,000$70,000 to $110,000Engineers (C.E., M.E)Engineers (C.E., M.E) $100,000 to $120,000$100,000 to $120,000
Technicians/OperationsTechnicians/Operations $75,000 to $95,000$75,000 to $95,000Support/MaintenanceSupport/Maintenance $45,000 to $75,000$45,000 to $75,000
Support/BusinessSupport/Business--ClericalClerical $35,000 to $45,000$35,000 to $45,000Misc. Local Contract Misc. Local Contract
SupportSupportVaries by Trade/Craft but Varies by Trade/Craft but averages around $89,000averages around $89,000
Employment levels & staffing will be a function of scope of the activities at the pipeyard. A full service facility, with milling activities, a wide range of coating activities, and business operations could employ several hundred direct employees and contract labor. Below are some of the potential positions that may support limited field operations.
Ports and Service Bases
Ports and Service BasesOverview
• Ports provide a vital link to the offshore oil and gas industry
• Ports house the service bases from which the “vehicles” (mainly ships and helicopters)that support offshore platforms are based and maintained
• Ports & service bases take delivery of, transfer, & serve as launching points for the structures, equipment, supplies & crew that serve the offshore industry
• Support activities include providing products & services (e.g. engine & turbine construction & repair, generators, gears, tools, pumps, compressors)
• Additionally, drilling muds, chemicals, & fluids are necessary daily inputs that have to betransported to offshore structures from onshore support facilities
40

Ports and Service BasesHornbeck Marine, Golden Meadow, LA
Source: Hornbeck Marine, http://www.hornbeckoffshore.com/vessel_overview.html
Offshore service vessels (“OSVs”) serve exploratory drilling rigs and production facilities and support offshore and subsea construction, installation, maintenance and repair activities. In
addition to transporting deck cargo, such as pipe or drummed material and equipment, OSVs also transport liquid mud, potable and drilling water, diesel fuel, dry bulk cement and personnel
between shore bases and offshore rigs and production facilities.
41
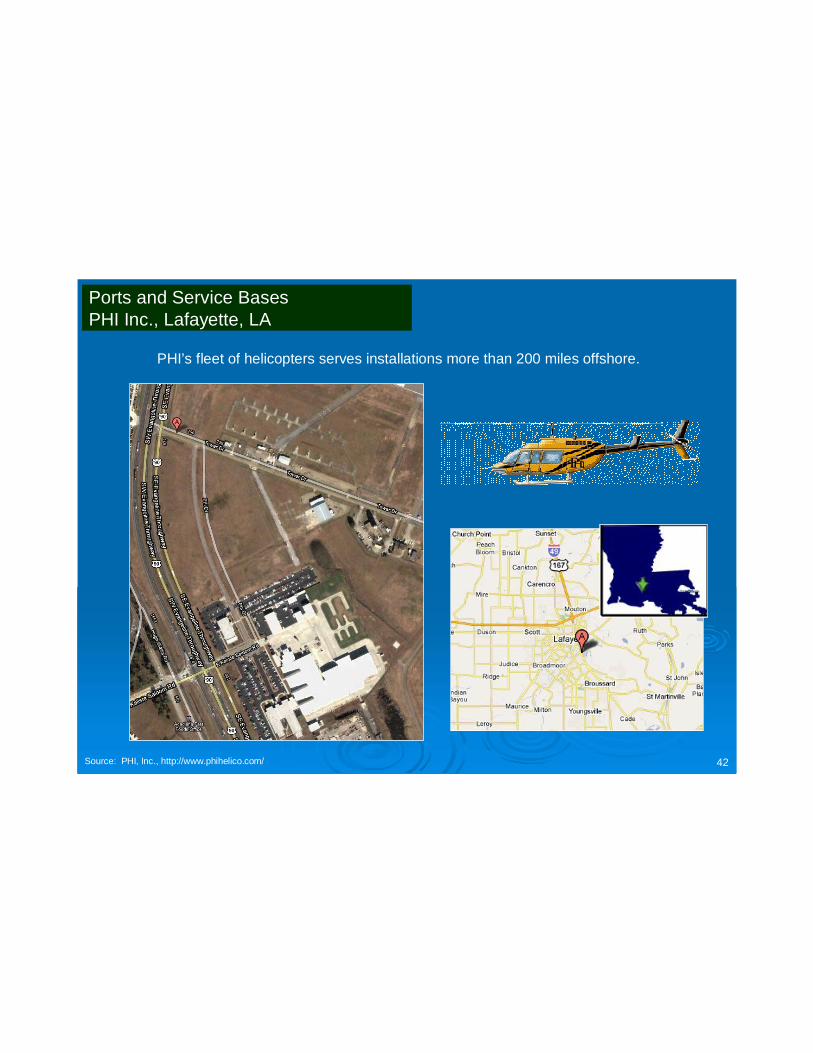
Ports and Service BasesPHI Inc., Lafayette, LA
PHI’s fleet of helicopters serves installations more than 200 miles offshore.
Source: PHI, Inc., http://www.phihelico.com/ 42
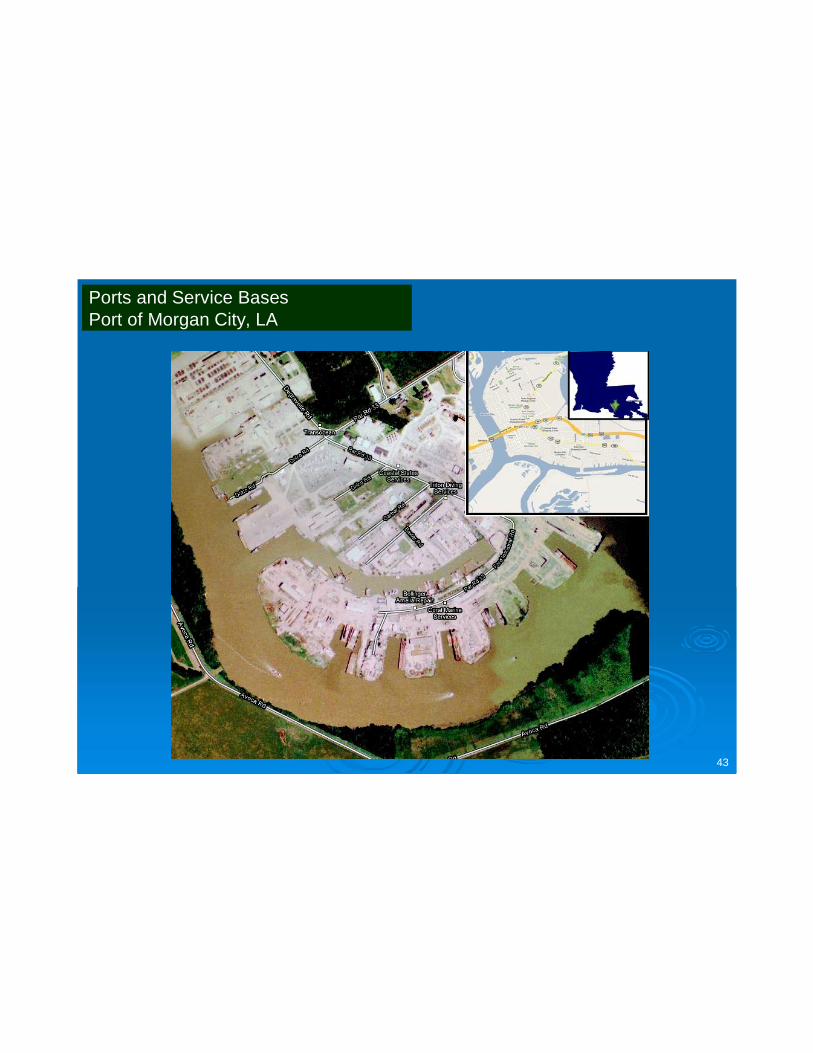
Ports and Service BasesPort of Morgan City, LA
43

Ports and Service BasesPort of Venice, LA
44
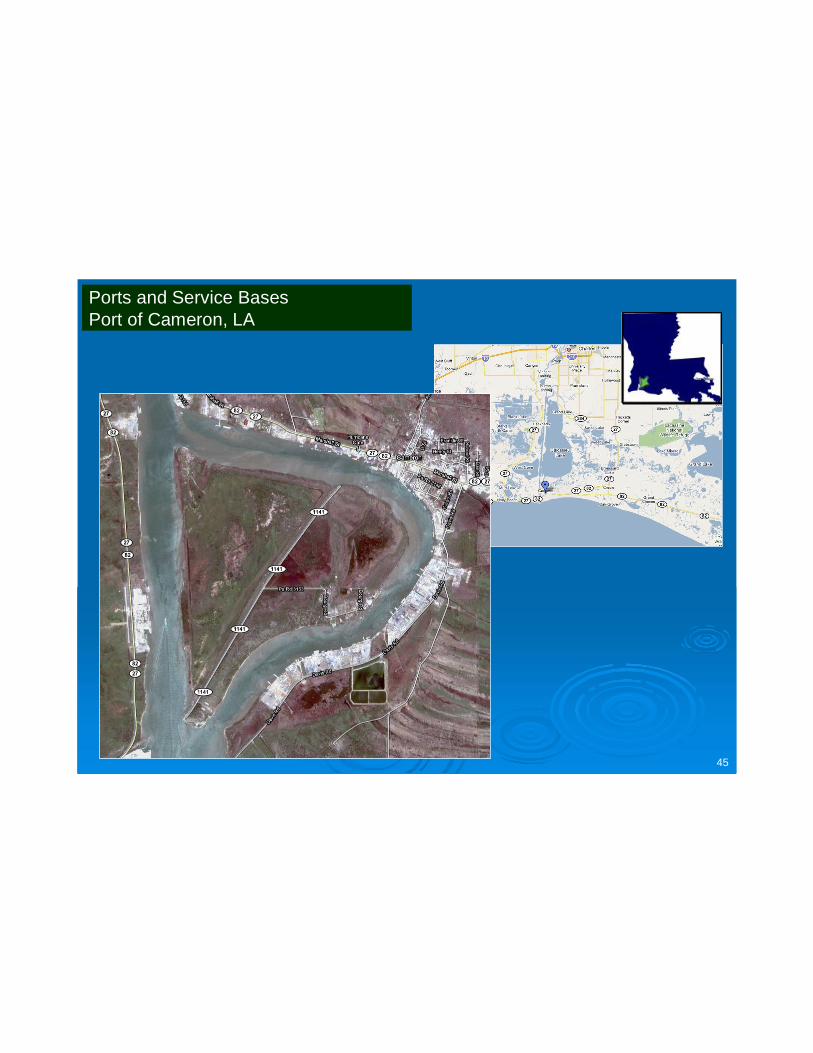
Ports and Service BasesPort of Cameron, LA
45

Ports and Service BasesGOM, Intracoastal City Shore Base, LA

Mid-Atlantic Ports
• The Atlantic Coast between Newark, NJ and Brunswick, GA is home to 35 port terminals
• 26 of the 35 terminals are major terminals
• 9 of the 35 terminals are minor or covered piers
• The largest port by acreage is Port Newark in Port Newark, New Jersey with 2,230 acres of space and 41,000 linear feet of berthing space for ships
• New York/New Jersey; Norfolk, VA; and Charleston, SC each have at least three local ports
• The mean low water depth at dock of Atlantic Coast Ports is 40 ft
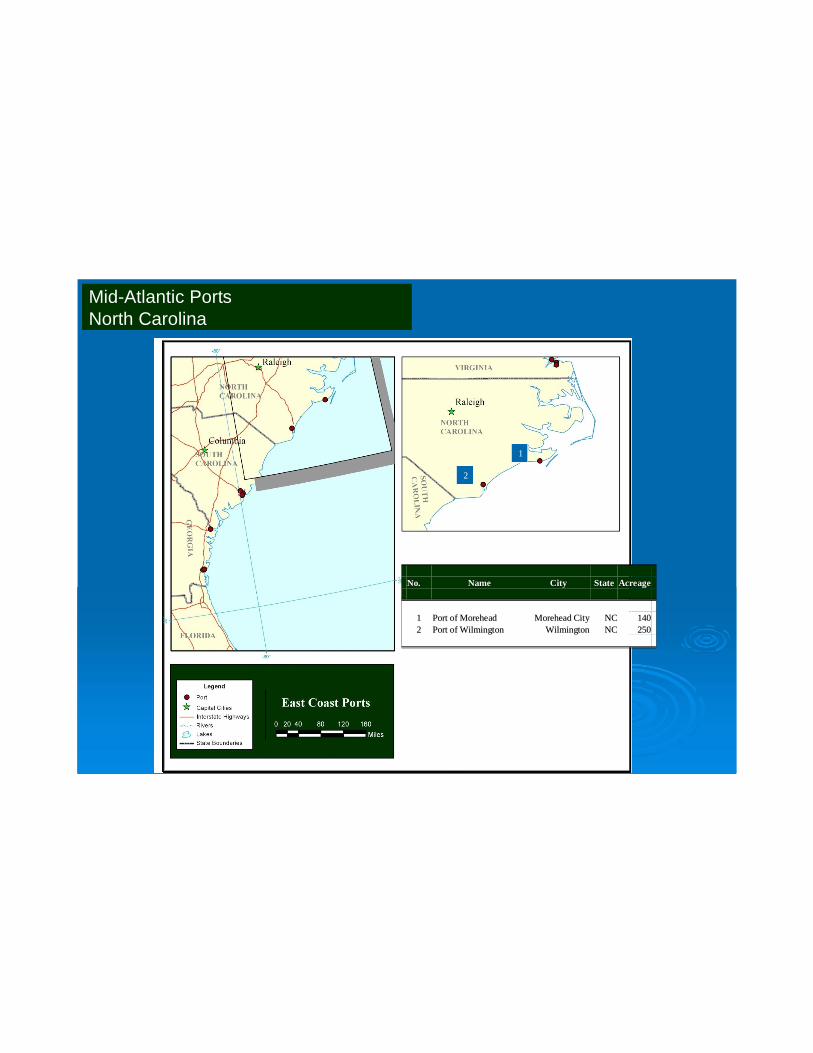
• North Carolina has two ports - Port of Morehead and Port of Wilmington
Note: For this analysis, a port is considered major if it had at least 20 acres of lay down area and wasn’t a covered pier, otherwise it is considered minor.

No. No. NameName CityCity StateState Acreage Acreage
11 APM TerminalAPM Terminal ElizabethElizabeth NJNJ 35035022 Global Marine TerminalGlobal Marine Terminal Jersey CityJersey City NJNJ 989833 Maher TerminalMaher Terminal ElizabethElizabeth NJNJ 44544544 Port Newark / ElizabethPort Newark / Elizabeth Port NewarkPort Newark NJNJ 2,2302,23055 Port Newark Container TerminalPort Newark Container Terminal Port NewarkPort Newark NJNJ 18018066 South Jersey Port Corp South Jersey Port Corp ---- Beckett Street TerminalBeckett Street Terminal CamdenCamden NJNJ 12512577 South Jersey Port Corp South Jersey Port Corp ---- Broadway TerminalBroadway Terminal CamdenCamden NJNJ 18018088 Port of Philadelphia Port of Philadelphia -- Packer Avenue Marine TerminalPacker Avenue Marine Terminal PhiladelphiaPhiladelphia PAPA 11211299 Port of Philadelphia Port of Philadelphia -- Pier 84Pier 84 PhiladelphiaPhiladelphia PAPA 14141010 Port of Philadelphia Port of Philadelphia -- Piers 38 & 40Piers 38 & 40 PhiladelphiaPhiladelphia PAPA 12121111 Port of Philadelphia Port of Philadelphia -- Piers 78 & 80Piers 78 & 80 PhiladelphiaPhiladelphia PAPA 44441212 Port of Philadelphia Port of Philadelphia -- Piers 96 & 98 AnnexPiers 96 & 98 Annex PhiladelphiaPhiladelphia PAPA 55551313 Port of Philadelphia Port of Philadelphia -- Tioga Marine TerminalTioga Marine Terminal PhiladelphiaPhiladelphia PAPA 1161161414 Penn TerminalsPenn Terminals EddystoneEddystone PAPA 80801515 Port of Delaware CityPort of Delaware City Delaware CityDelaware City DEDE1616 Port of WilmingtonPort of Wilmington WilmingtonWilmington DEDE 308308
Ports 1 - 5
Ports 6 - 14
Ports 15 - 16
Mid-Atlantic PortsNew York, New Jersey, Pennsylvania and Delaware
12
34
5
No.No. NameName CityCity StateState Acreage Acreage
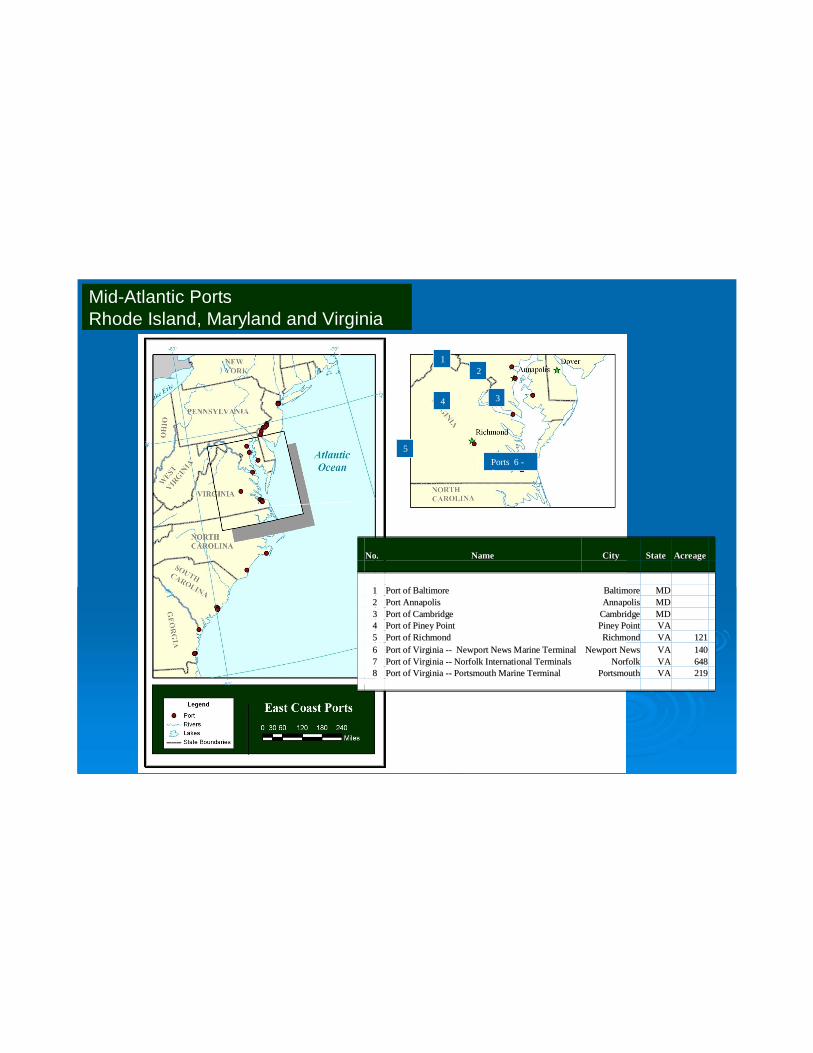
11 Port of BaltimorePort of Baltimore BaltimoreBaltimore MDMD22 Port AnnapolisPort Annapolis AnnapolisAnnapolis MDMD33 Port of CambridgePort of Cambridge CambridgeCambridge MDMD44 Port of Piney PointPort of Piney Point Piney PointPiney Point VAVA55 Port of RichmondPort of Richmond RichmondRichmond VAVA 12112166 Port of Virginia Port of Virginia ---- Newport News Marine TerminalNewport News Marine Terminal Newport NewsNewport News VAVA 14014077 Port of Virginia Port of Virginia ---- Norfolk International TerminalsNorfolk International Terminals NorfolkNorfolk VAVA 64864888 Port of Virginia Port of Virginia ---- Portsmouth Marine TerminalPortsmouth Marine Terminal PortsmouthPortsmouth VAVA 219219
Ports 6 -8
Mid-Atlantic PortsRhode Island, Maryland and Virginia
2
No.No. NameName CityCity StateState Acreage Acreage
11 Port of MoreheadPort of Morehead Morehead CityMorehead City NCNC 14014022 Port of WilmingtonPort of Wilmington WilmingtonWilmington NCNC 250250
Mid-Atlantic PortsNorth Carolina
1
No.No. NameName CityCity StateState Acreage Acreage
11 Port of MoreheadPort of Morehead MoreheadMorehead NC NC 140 140 22 Port of WilmingtonPort of Wilmington WilmingtonWilmington NCNC 25025033 Port of Charleston Port of Charleston ---- Columbus Street TerminalColumbus Street Terminal CharlestonCharleston SCSC
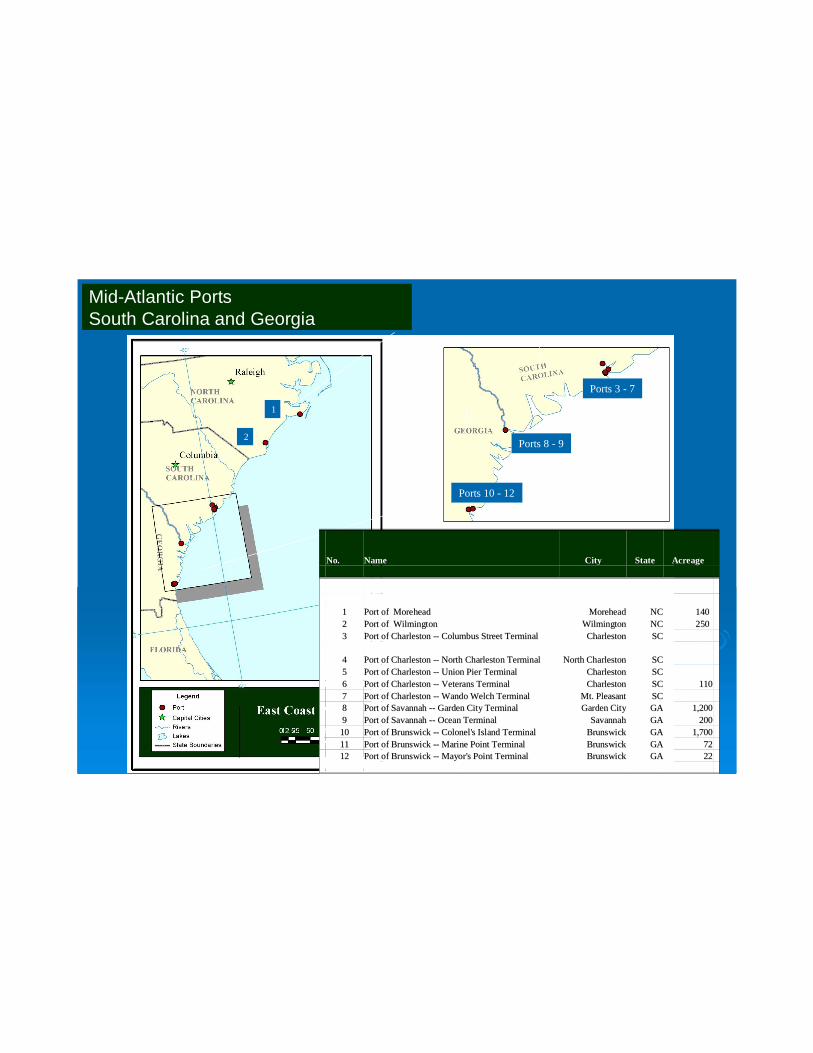
44 Port of Charleston Port of Charleston ---- North Charleston TerminalNorth Charleston Terminal North CharlestonNorth Charleston SCSC55 Port of Charleston Port of Charleston ---- Union Pier TerminalUnion Pier Terminal CharlestonCharleston SCSC66 Port of Charleston Port of Charleston ---- Veterans TerminalVeterans Terminal CharlestonCharleston SCSC 11011077 Port of Charleston Port of Charleston ---- Wando Welch TerminalWando Welch Terminal Mt. PleasantMt. Pleasant SCSC88 Port of Savannah Port of Savannah ---- Garden City TerminalGarden City Terminal Garden CityGarden City GAGA 1,2001,20099 Port of Savannah Port of Savannah ---- Ocean TerminalOcean Terminal SavannahSavannah GAGA 2002001010 Port of Brunswick Port of Brunswick ---- Colonel's Island TerminalColonel's Island Terminal BrunswickBrunswick GAGA 1,7001,7001111 Port of Brunswick Port of Brunswick ---- Marine Point TerminalMarine Point Terminal BrunswickBrunswick GAGA 72721212 Port of Brunswick Port of Brunswick ---- Mayor's Point TerminalMayor's Point Terminal BrunswickBrunswick GAGA 2222
Ports 3 - 7
Ports 8 - 9
Ports 10 - 12
1
2
Mid-Atlantic PortsSouth Carolina and Georgia
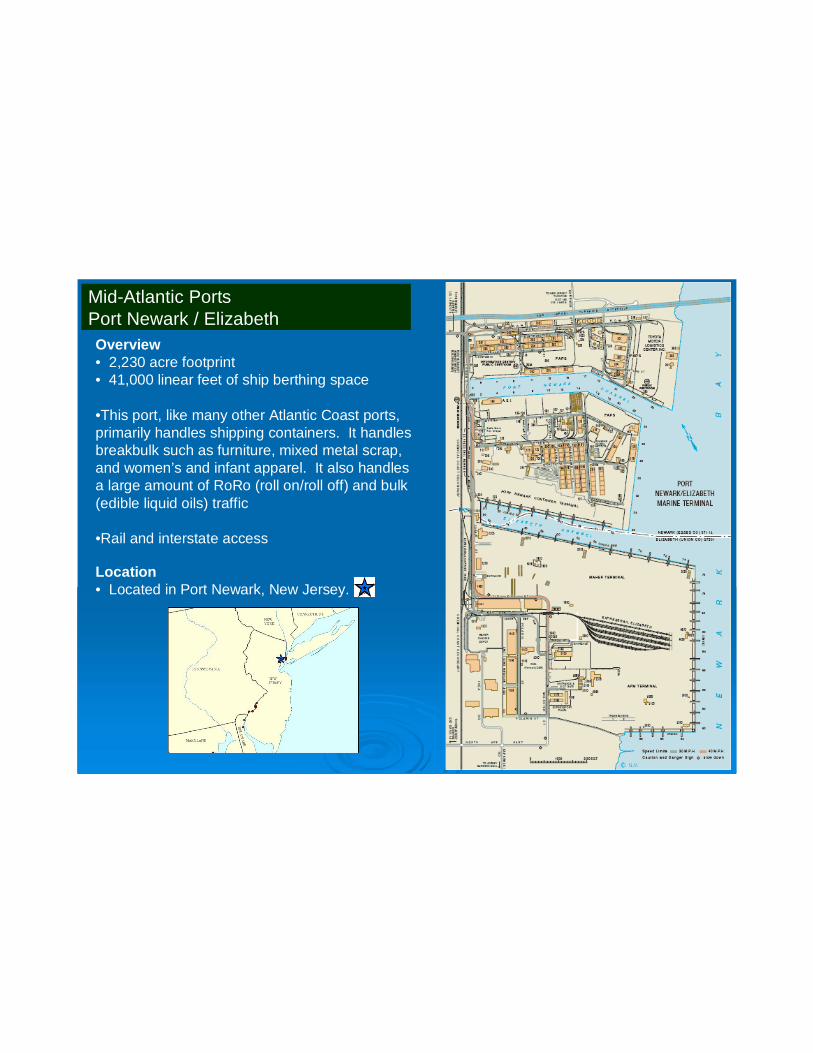
Overview• 2,230 acre footprint• 41,000 linear feet of ship berthing space
•This port, like many other Atlantic Coast ports, primarily handles shipping containers. It handles breakbulk such as furniture, mixed metal scrap, and women’s and infant apparel. It also handles a large amount of RoRo (roll on/roll off) and bulk (edible liquid oils) traffic
•Rail and interstate access
Location• Located in Port Newark, New Jersey.
Mid-Atlantic PortsPort Newark / Elizabeth
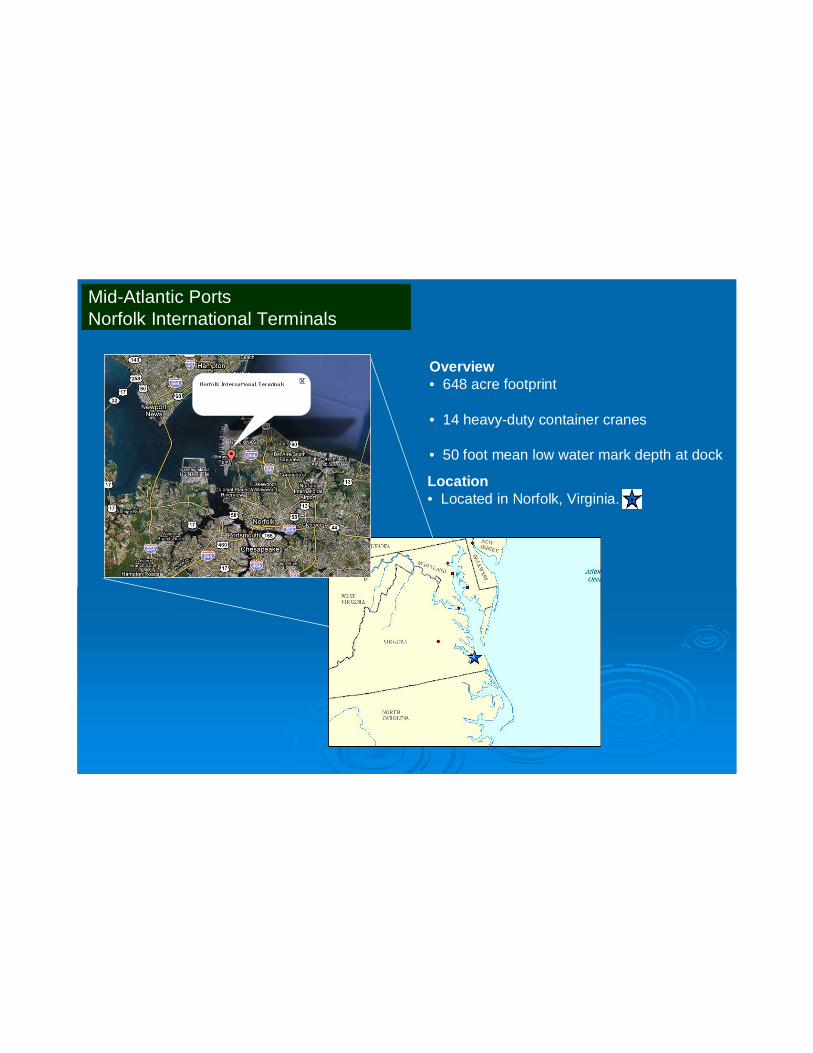
Overview• 648 acre footprint
• 14 heavy-duty container cranes
• 50 foot mean low water mark depth at dock
Location• Located in Norfolk, Virginia.
Mid-Atlantic PortsNorfolk International Terminals
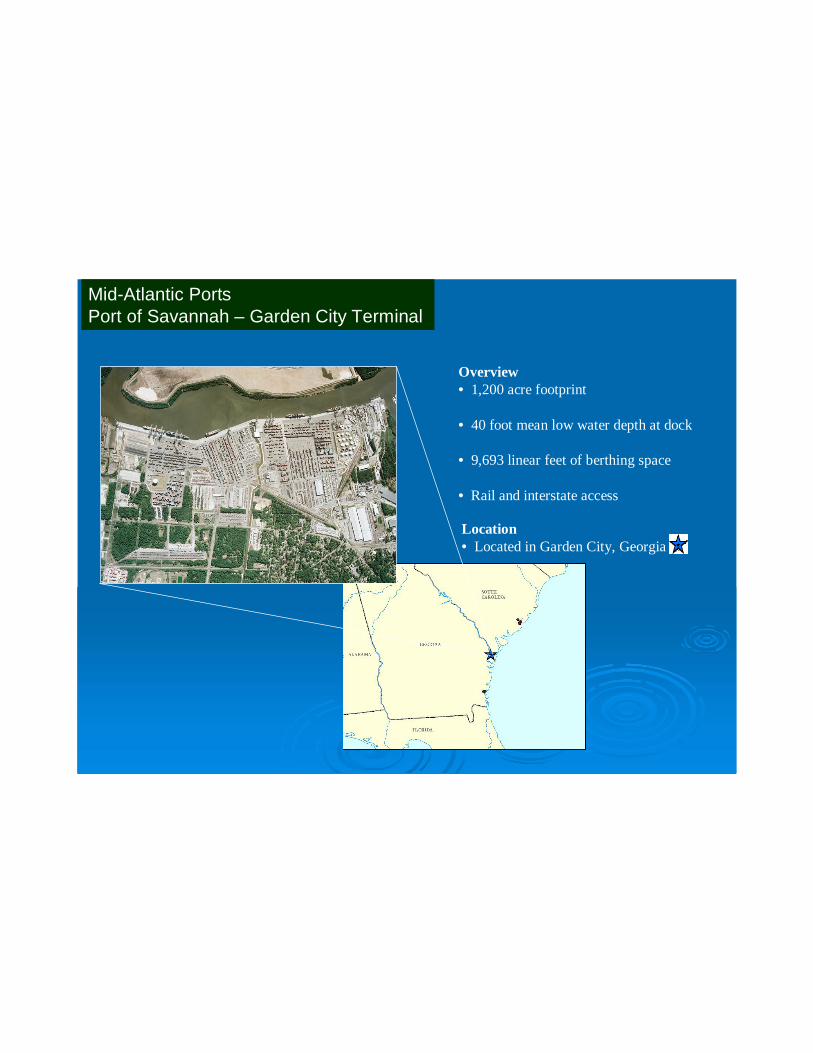
Overview• 1,200 acre footprint
• 40 foot mean low water depth at dock
• 9,693 linear feet of berthing space
• Rail and interstate access
Location• Located in Garden City, Georgia
Mid-Atlantic PortsPort of Savannah – Garden City Terminal
Ports and Service BasesEmployment – Annual Operations
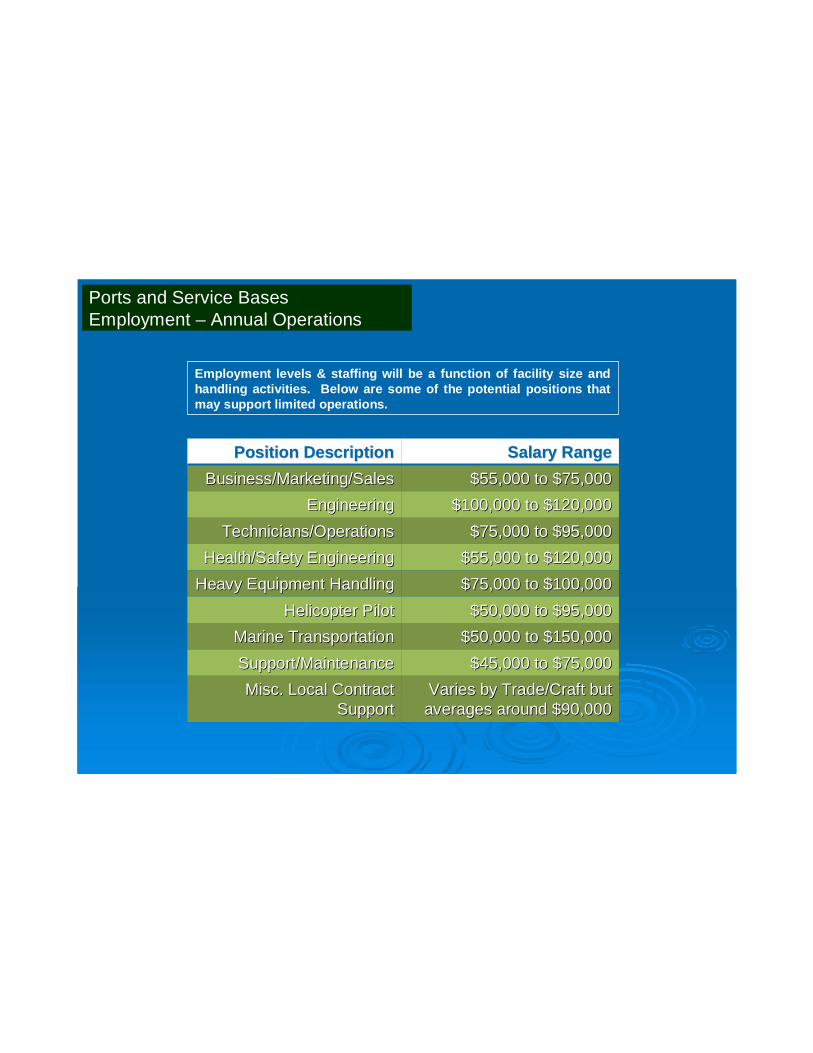
Position DescriptionPosition Description Salary RangeSalary RangeBusiness/Marketing/SalesBusiness/Marketing/Sales $55,000 to $75,000$55,000 to $75,000
EngineeringEngineering $100,000 to $120,000$100,000 to $120,000Technicians/OperationsTechnicians/Operations $75,000 to $95,000$75,000 to $95,000
Health/Safety EngineeringHealth/Safety Engineering $55,000 to $120,000$55,000 to $120,000Heavy Equipment HandlingHeavy Equipment Handling $75,000 to $100,000$75,000 to $100,000
Helicopter PilotHelicopter Pilot $50,000 to $95,000$50,000 to $95,000Marine TransportationMarine Transportation $50,000 to $150,000$50,000 to $150,000Support/MaintenanceSupport/Maintenance $45,000 to $75,000$45,000 to $75,000Misc. Local Contract Misc. Local Contract
SupportSupportVaries by Trade/Craft but Varies by Trade/Craft but averages around $90,000averages around $90,000
Employment levels & staffing will be a function of facility size and handling activities. Below are some of the potential positions that may support limited operations.
Waste Disposal

WasteOverview
• A variety of different types of wastes are generated by offshore oil and gas E&P activities
• Some wastes are common to any manufacturing / industrial operation; others are unique to oil and gas
• Different types of wastes generated from offshore E&P activity include:
– Solids (e.g. drill cuttings, pipe scale, produced sand)– Drilling muds (oil-based, synthetic, or water-based)– Fluids (e.g. produced waters, waters separated from drilling muds, clear brine completion fluids, wash
waters)– (NORM) Naturally Occurring Radioactive Materials (e.g. tank bottoms, pipe scale, & other sediments
that contain naturally high levels of radioactive materials) – Industrial hazardous wastes (e.g. solvents & compounds with chemical characteristics that
render them hazardous)– Non-hazardous industrial oily waste streams; generated by machinery O&M (e.g. used compressor
oils, diesel fuel, lubricating oils, & pipeline testing and pigging fluids)– Municipal solid waste (MSW) generated by personnel (rigs, platforms, tankers, & workboats)
57
WasteOnshore Network
The onshore infrastructure network needed to manage the spectrum of waste generated by offshore E&P activities can be divided into three categories:
1. Transfer facilities at ports, where waste is transferred from supply boats to another transportation mode (barge or truck) toward a final point of disposition;
2. Special-purpose waste management facilities dedicated to handling particular types of waste; and,
3. Generic waste management facilities that receive waste from a broad spectrum of American industry, of which oil field waste is only a small part.
58

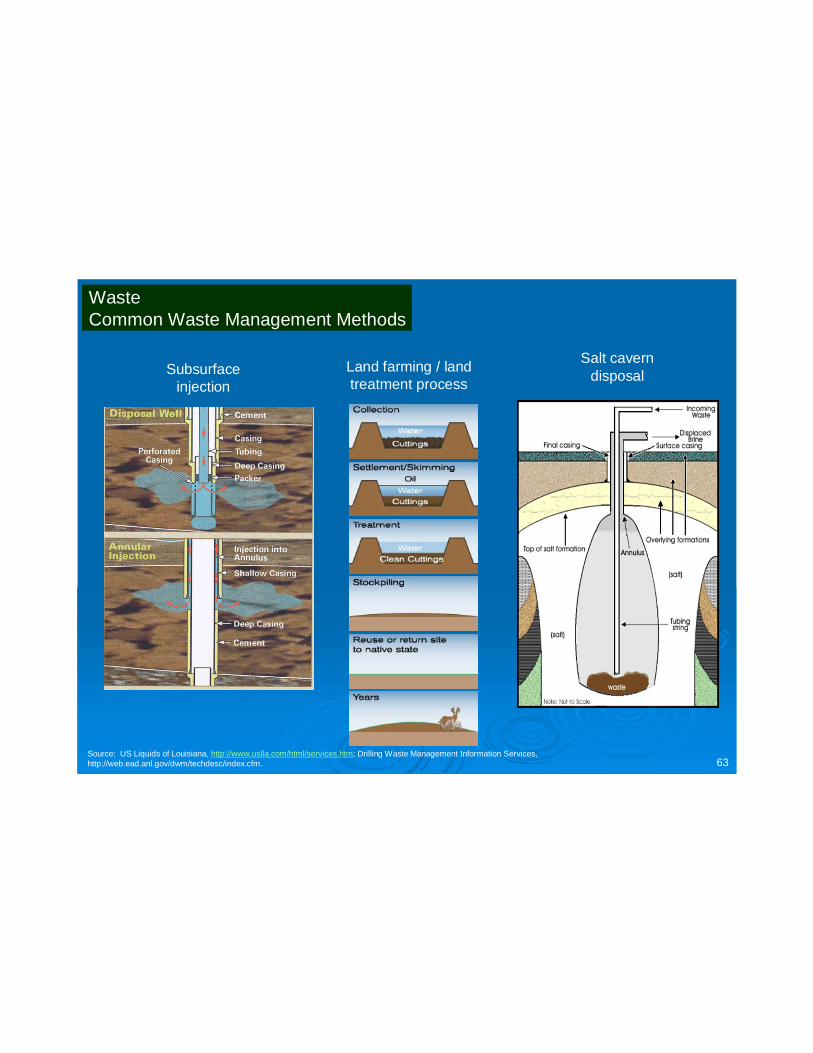
WasteCommon Waste Management Methods
Offshore Marine Discharge – In the GOM, water-based muds & cuttings may be discharged in Federal waters; some synthetic-based muds that are retained on cuttings may be discharged in Federal waters, with a number of limitations/restrictions.
Subsurface Injection – Oldest & most established method for disposing produced fluids when discharge is not allowed offshore
Salt Cavern Disposal – Solution-mined caverns used for the disposal of drilling wastes such as muds and cuttings
Land Application / Land Farming – Drilling muds, produced sand & other small solids can be spread onto the land & mixed with the earth to be incorporated into the soil
Land Filling – Most MSW is disposed in landfills; some cuttings, muds or watery waste streams may be treated and disposed in landfills
Recycling – Oil based muds & some synthetic-based muds can be recycled; cuttings from drilling operations can be used to stabilize surfaces (e.g. roads or drilling pads)
59
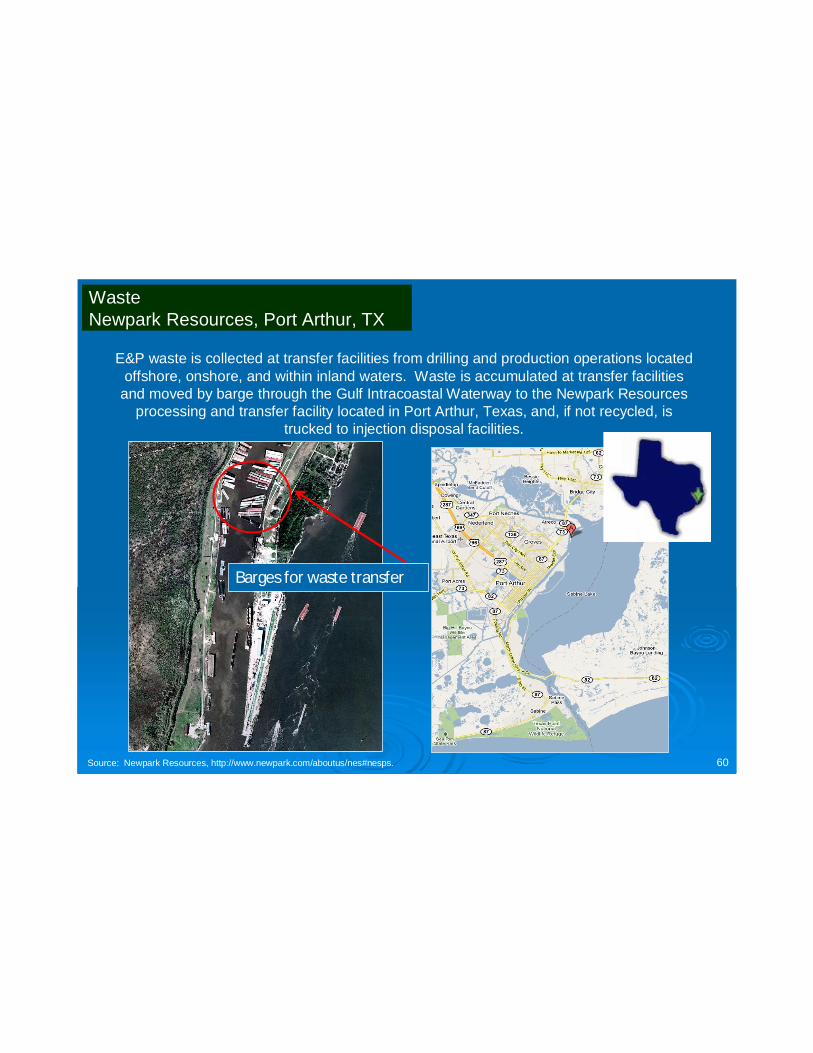
E&P waste is collected at transfer facilities from drilling and production operations located offshore, onshore, and within inland waters. Waste is accumulated at transfer facilities
and moved by barge through the Gulf Intracoastal Waterway to the Newpark Resources processing and transfer facility located in Port Arthur, Texas, and, if not recycled, is
trucked to injection disposal facilities.
WasteNewpark Resources, Port Arthur, TX
Source: Newpark Resources, http://www.newpark.com/aboutus/nes#nesps. 60
Barges for waste transfer

Source: Newpark Resources, http://www.newpark.com/aboutus/nes#nesps.
WasteNewpark Resources, Fannett, TX
This 400-acre site near Fannett, Texas is Newpark’s primary facility for disposing of E&P waste.
61
Treatment Areas
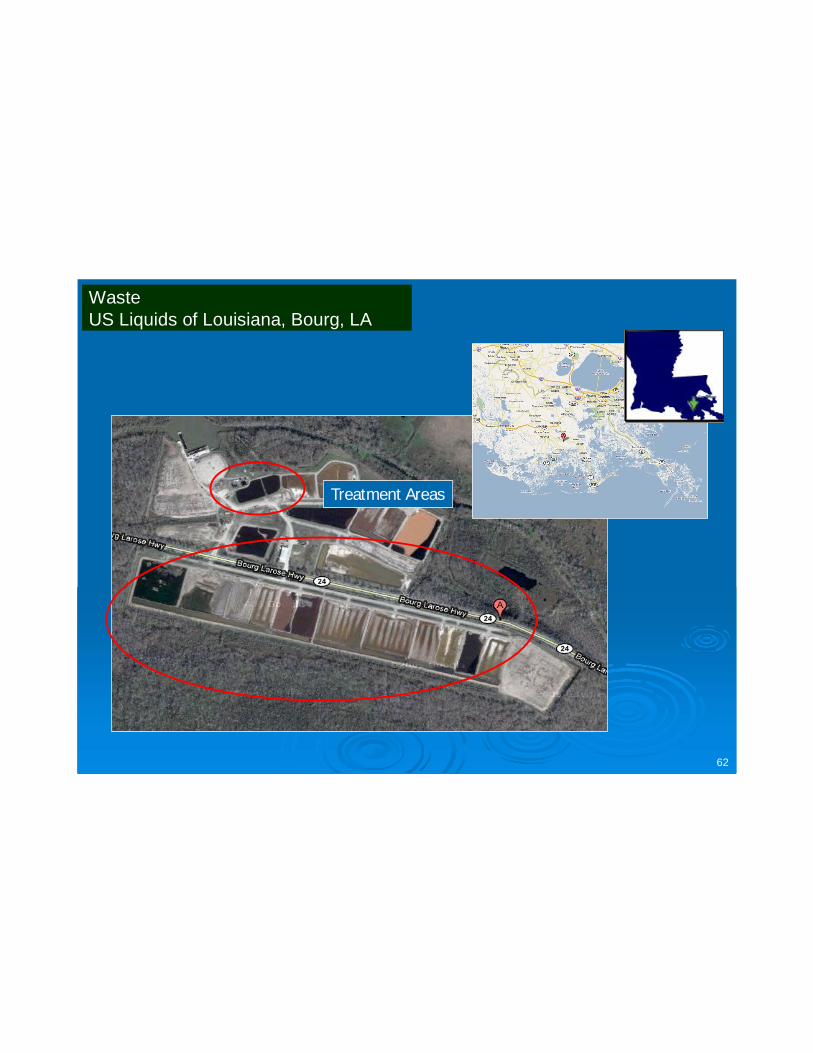
WasteUS Liquids of Louisiana, Bourg, LA
62
Treatment Areas
Source: US Liquids of Louisiana, http://www.uslla.com/html/services.htm; Drilling Waste Management Information Services, http://web.ead.anl.gov/dwm/techdesc/index.cfm.
Land farming / land treatment process
WasteCommon Waste Management Methods
Salt cavern disposalSubsurface
injection
63
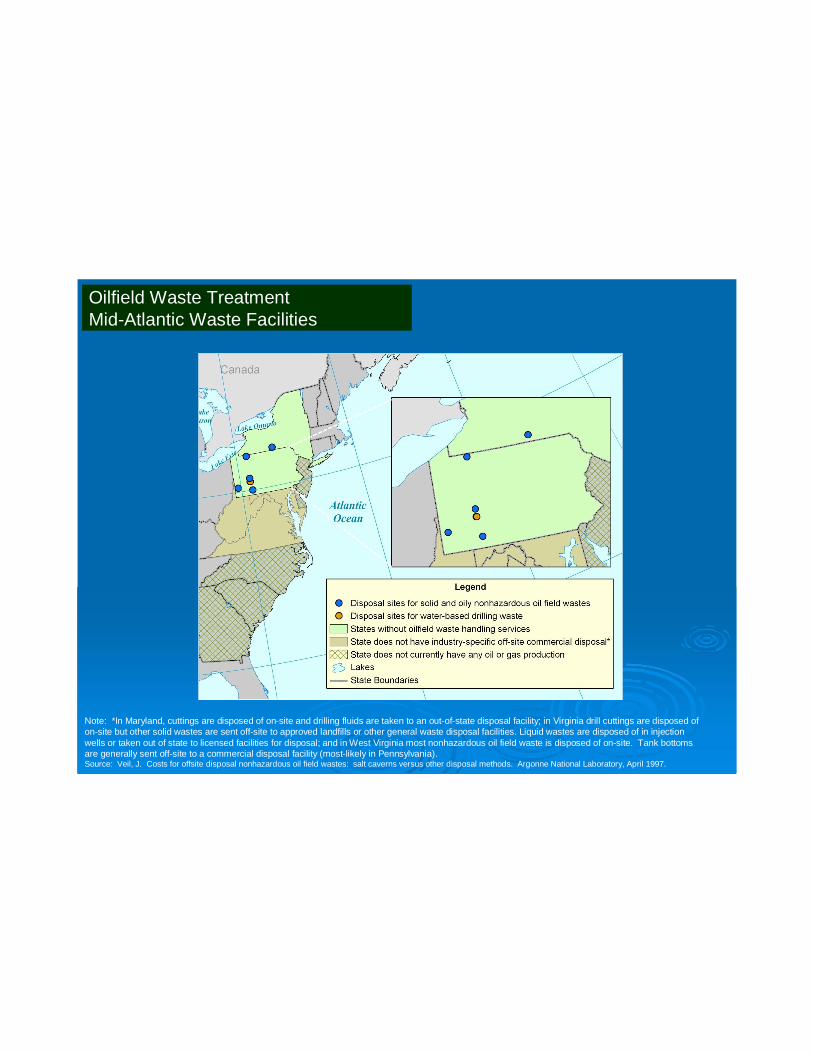
Oilfield Waste TreatmentMid-Atlantic Waste Facilities
Note: *In Maryland, cuttings are disposed of on-site and drilling fluids are taken to an out-of-state disposal facility; in Virginia drill cuttings are disposed of on-site but other solid wastes are sent off-site to approved landfills or other general waste disposal facilities. Liquid wastes are disposed of in injection wells or taken out of state to licensed facilities for disposal; and in West Virginia most nonhazardous oil field waste is disposed of on-site. Tank bottoms are generally sent off-site to a commercial disposal facility (most-likely in Pennsylvania).Source: Veil, J. Costs for offsite disposal nonhazardous oil field wastes: salt caverns versus other disposal methods. Argonne National Laboratory, April 1997.
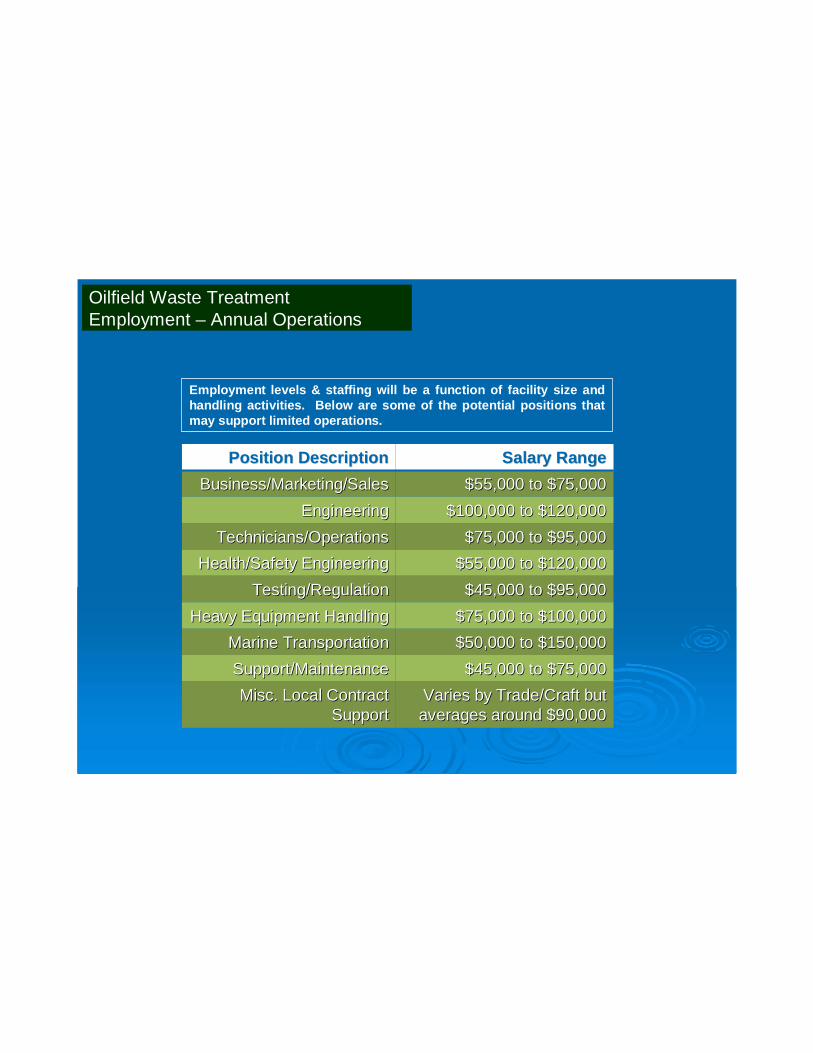
Oilfield Waste TreatmentEmployment – Annual Operations
Position DescriptionPosition Description Salary RangeSalary RangeBusiness/Marketing/SalesBusiness/Marketing/Sales $55,000 to $75,000$55,000 to $75,000
EngineeringEngineering $100,000 to $120,000$100,000 to $120,000Technicians/OperationsTechnicians/Operations $75,000 to $95,000$75,000 to $95,000
Health/Safety EngineeringHealth/Safety Engineering $55,000 to $120,000$55,000 to $120,000Testing/RegulationTesting/Regulation $45,000 to $95,000$45,000 to $95,000
Heavy Equipment HandlingHeavy Equipment Handling $75,000 to $100,000$75,000 to $100,000Marine TransportationMarine Transportation $50,000 to $150,000$50,000 to $150,000Support/MaintenanceSupport/Maintenance $45,000 to $75,000$45,000 to $75,000Misc. Local Contract Misc. Local Contract
SupportSupportVaries by Trade/Craft but Varies by Trade/Craft but averages around $90,000averages around $90,000
Employment levels & staffing will be a function of facility size and handling activities. Below are some of the potential positions that may support limited operations.

66
Summary & Conclusion
• MMS will continue to examine the potential onshore support network that would support offshore oil & gas development in the Atlantic.
• The final report of the current MMS Study “Oil & Gas Infrastructure in the Mid-Atlantic (GM-09-08)” is expected in June 2011.
• Many pictures of that facilities/assets shown today support the extensive O&G development in the GOM. Thus, the scope & size of many of these assets are significant & may not approximate the scale & scope of onshore assets that may be developed to support a single Atlantic lease sale, or limited Atlantic development.
• MMS has no permitting authority for any onshore infrastructure. Individual states will make their own permitting and siting decisions.

Thank You