Analysis of Ambient Pollutant Concentrations and Meteorological ... · OCS Study MMS 96-0062...
141
n U OCS Study MMS 96-0062 Coastal Marine Institute Analysis of Ambient Pollutant Concentrations and Meteorological Conditions Affecting EPA Class I and II Areas in Southeastern Louisiana Volume I : Technical Report U.S . Department of the Interior Minerals Management Service Gulf of Mexico OCS Region
Transcript of Analysis of Ambient Pollutant Concentrations and Meteorological ... · OCS Study MMS 96-0062...

n U
OCS Study MMS 96-0062
Coastal Marine Institute
Analysis of Ambient Pollutant Concentrations and Meteorological Conditions Affecting EPA Class I and II Areas in Southeastern Louisiana
Volume I : Technical Report
U.S. Department of the Interior Minerals Management Service Gulf of Mexico OCS Region
OCS Study MMS 96-0062
Coastal Marine Institute
Analysis of Ambient Pollutant Concentrations and Meteorological Conditions Affecting EPA Class I and II Areas if Southeastern Louisiana
Volume I : Technical Report
Authors
S. A. Hsu
Prepared under MMS Contract 14-35-0001-30660-19925 by Coastal Studies Institute Louisiana State University Baton Rouge, Louisiana 70803
Published by
U .S. Department of the Interior New Orleans Minerals Management Service December 1996 Gulf of Mexico OCS Region

DISCLAIMER
This report was prepared under contract between the Minerals Management Service (MMS) and the Coastal Studies Institute, Louisiana State University . This report has been technically reviewed by the MMS and approved for publication. Approval does not signify that the contents necessarily reflect the views and policies of the Service, nor does mention of trade names or commercial products constitute endorsement or recommendation for use. It is, however, exempt from review and compliance with MMS editorial standards .
REPORT AVAILABILITY
Extra copies of the report may be obtained from the Public Information Office (Mail Stop 5034) at the following address :
U.S . Department of the Interior Minerals Management Service Gulf of Mexico OC S Region Attention : Public Information Office (MS 5034) 1201 Elmwood Park Boulevard New Orleans, Louisiana 70123-2394
Telephone Number: 1-800-200-GULF or 504-736-2519
CITATION
Suggested citation :
Hsu, S. A. 1996. Analysis of ambient pollutant concentrations and meteorological conditions affecting EPA Class I and II areas in southeastern Louisiana, Volume 1 : Technical Report . OCS Study MMS 96-0062. U.S . Dept. of the Interior, Minerals Management Service, Gulf of Mexico OCS Region, New Orleans, LA. 156 pp .
FRONT COVER
Coastal Studies Institute technician Bill Gibson inspecting the Gusier Island, Louisiana, SOZ and meteorological monitoring station, August, 1994.
iii
ABSTRACT
Seasonal weather patterns over the northeast Gulf of Mexico can produce prolonged periods of onshore flow . Since areas of the coastlines and barrier islands of Louisiana, Mississippi, and Alabama have been designated as Class I and II by the EPA, there is concern that pollutants from Outer Continental Shelf (OCS) activities, such as petroleum drilling and production, may be acting to degrade these pristine environments . Three air quality and meteorological monitoring stations were deployed during the period of July through mid-September 1994 to measure ambient levels of SOZ and NOX as well as meteorological conditions . Two stations were in the Class I Breton National Wildlife Area while the third was in the Class II Delta National Wildlife Refuge of southeastern Louisiana . It was found that the majority of all measurements of S02 and NOX acquired during the period were less than 5 - 10 ppb. Concentrations in the Breton Refuge were generally higher than those measured in the Delta Refuge, with highest concentrations being from the north and northeast . In addition, distinct short-lived episodes of higher than average (for the data record) NO, concentrations were evident in the Breton data set. Radiosondes released throughout the study period reveal the average mixing height to be 600 - 700 m, well below the climatic average believed to prevail over our area during the summer. A method of estimating the offshore mixing height from surface temperature values is presented . Long-term monitoring is recommended to gain a better understanding of offshore pollutant transport, to delineate between OCS and onshore pollutant contributions, and to compare with the PSD increments for our area .
v
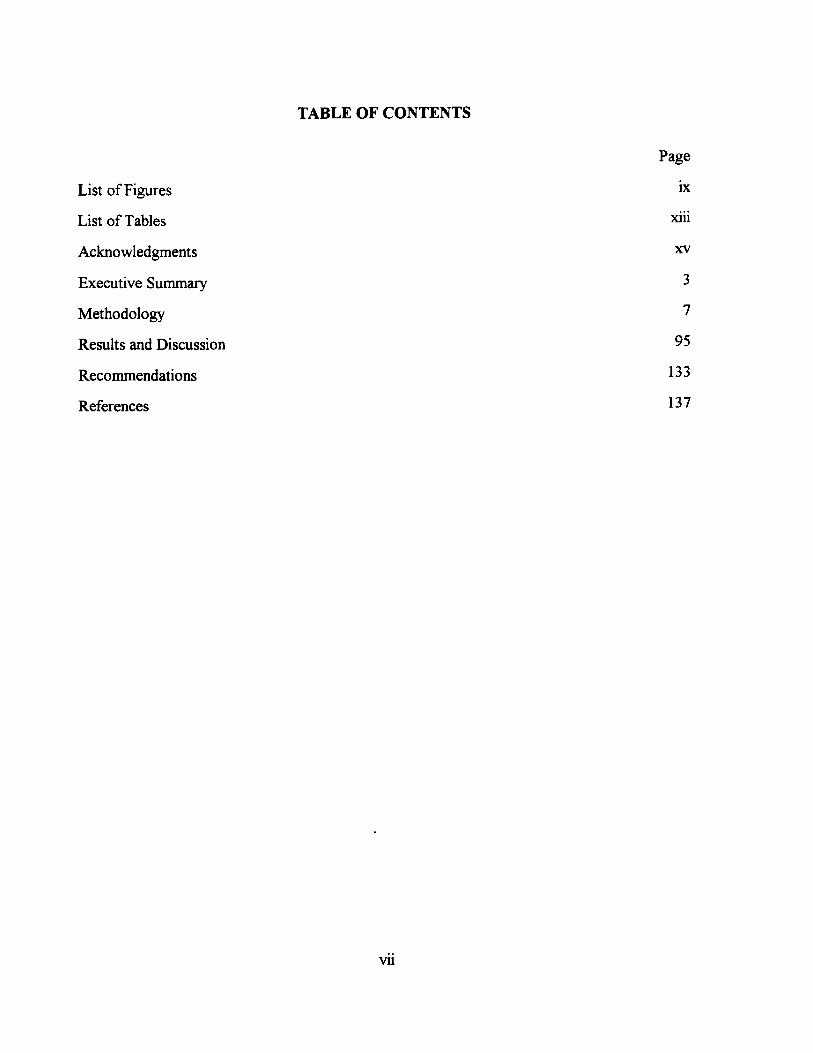
TABLE OF CONTENTS
List of Figures
List of Tables
Acknowledgments
Executive Summary
Methodology
Results and Discussion
Recommendations
References
Page
ix
xiii
3
7
95
133
137
vii

LIST OF FIGURES
Figure Page
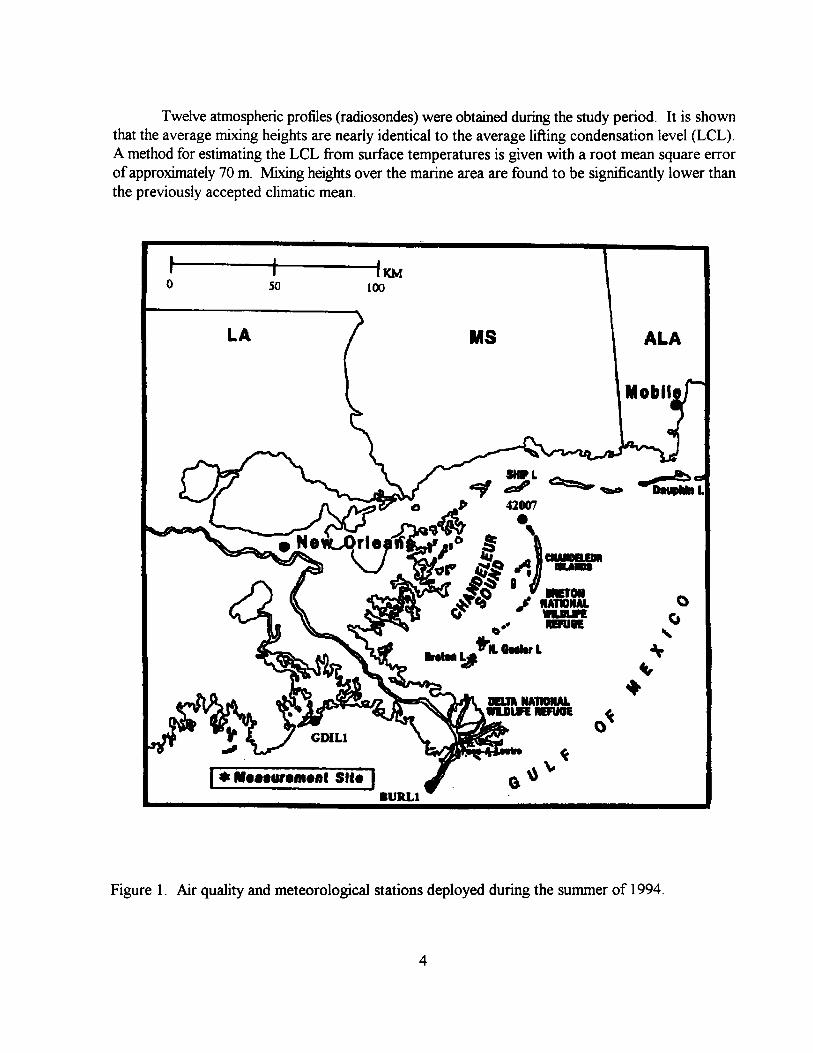
1 Air quality and meteorological station deployed during the summer of 4 1994 .
2 Calibration curves from Pass-A-Loutre air quality analyzers . 13
3a July 1994 hourly SOZ concentrations at Gosier Island . 31
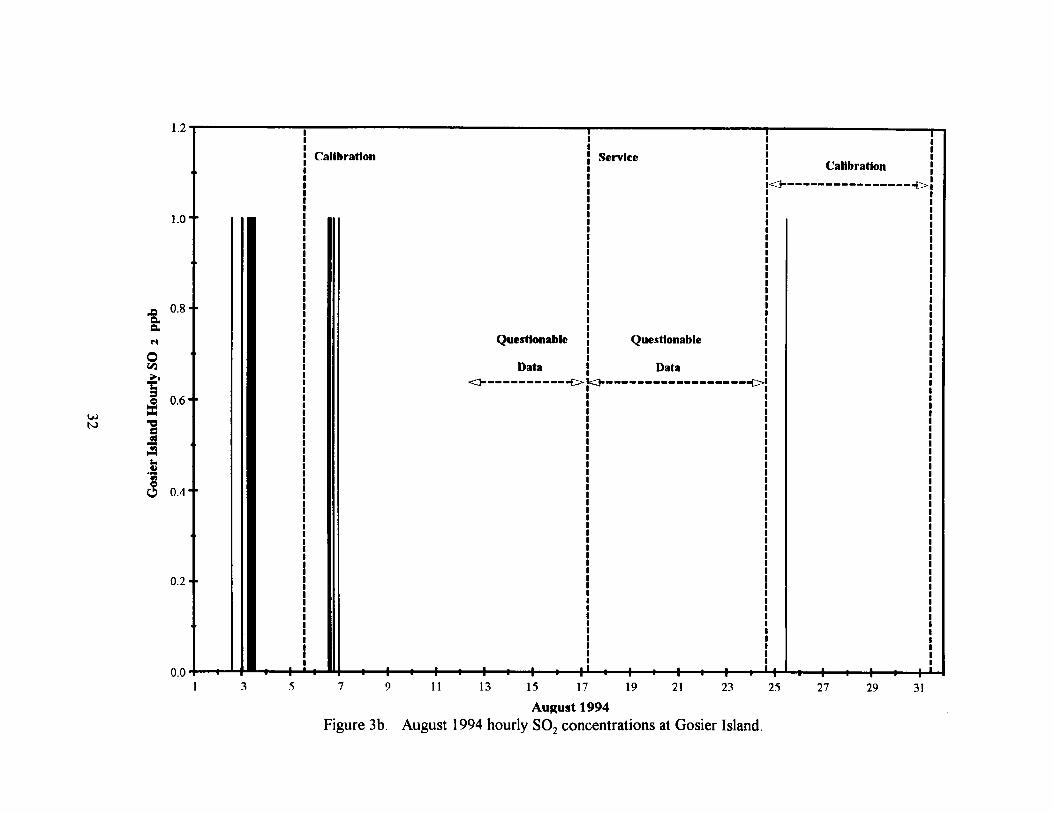
3b August 1994 hourly SOZ concentrations at Gosier Island . 32
3c September 1994 hourly SOZ concentrations at Gosier Island . 33
3d July 1994 hourly wind speeds at Gosier Island and NUAA buoy 42007 . 34
3e August 1994 hourly wind speeds at Gosier Island and NOAH buoy 35 42007.
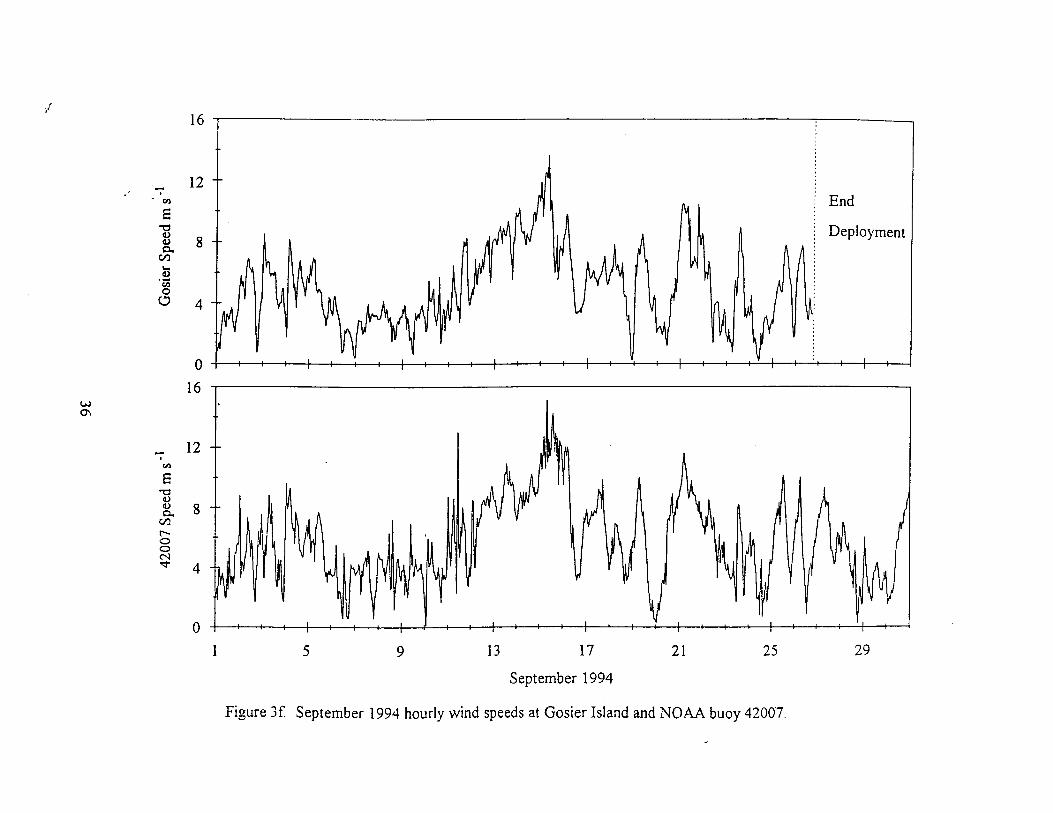
3f September 1994 hourly wind speeds at Gosier Island and NOAH buoy 36 42007.
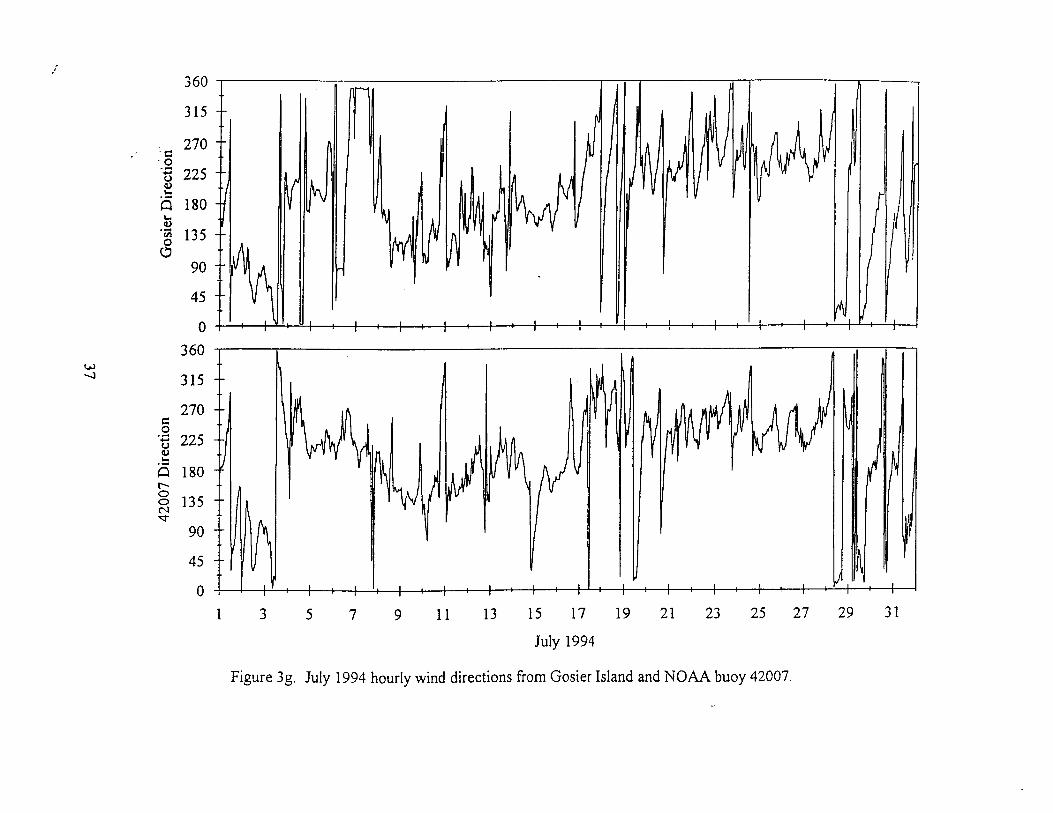
3g July 1994 hourly wind directions from Gosier Island and NOAA buoy 37 42007.
3h August 1994 hourly wind directions from Gosier Island and NOAH 38 buoy 42007.
3i September 1994 hourly wind directions from Gosier Island and NOAA 39 buoy 42007 .
3j July 1994 hourly air temperatures at Gosier Island and NOAA buoy 40 42007.
3k August 1994 hourly air temperatures at Gosier Island and NOAA buoy 41 42007.
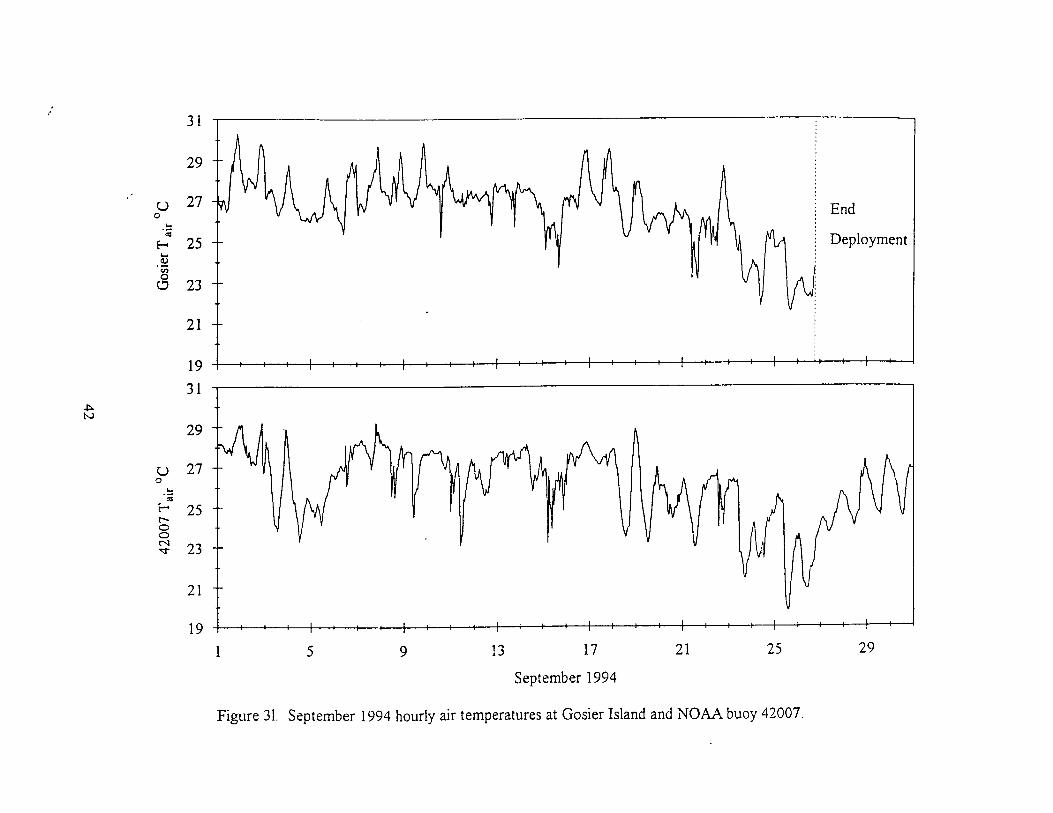
31 September 1994 hourly air temperatures at Gosier Island and NOAA 42 buoy 42007 .
3m July 1994 hourly pond data at Gosier Island (see text for explanation) . 43
4a July 1994 hourly SOz concentrations at Breton Island . 44
4b August 1994 hourly SOZ concentrations at Breton Island . 45
4c September 1994 hourly S02 concentrations at Breton Island . 46
4d July 1994 hourly NO concentrations at Breton Island . 47
ix

Figure Page
4e August 1994 hourly NO concentrations at Breton Island . 48
4f September 1994 hourly NO concentrations at Breton Island . 49
4g July 1994 hourly NOZ concentrations at Breton Island . 50
4h August 1994 hourly NOZ concentrations at Breton Island . 51
4i September 1994 hourly NOZ concentrations at Breton Island . 52
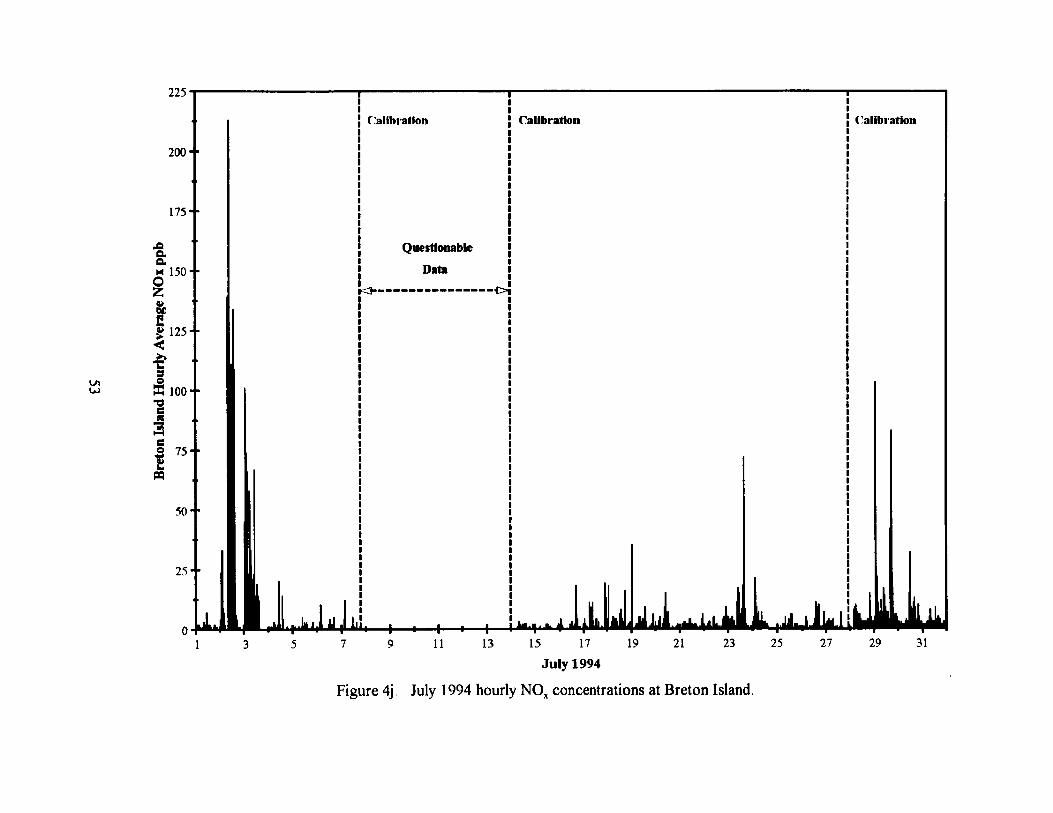
4j July 1994 hourly NO. concentrations at Breton Island . 53
4k August 1994 hourly NO,, concentrations at Breton Island . 54
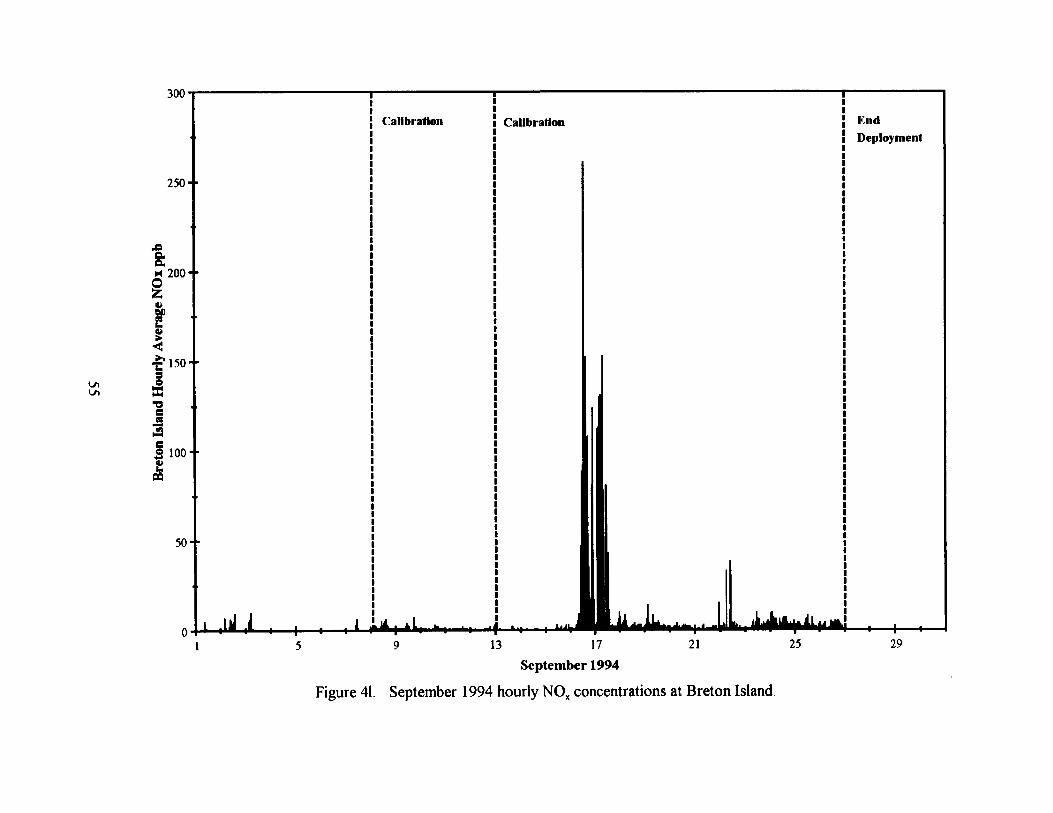
41 September 1994 hourly NO, concentrations at Breton Island . 55
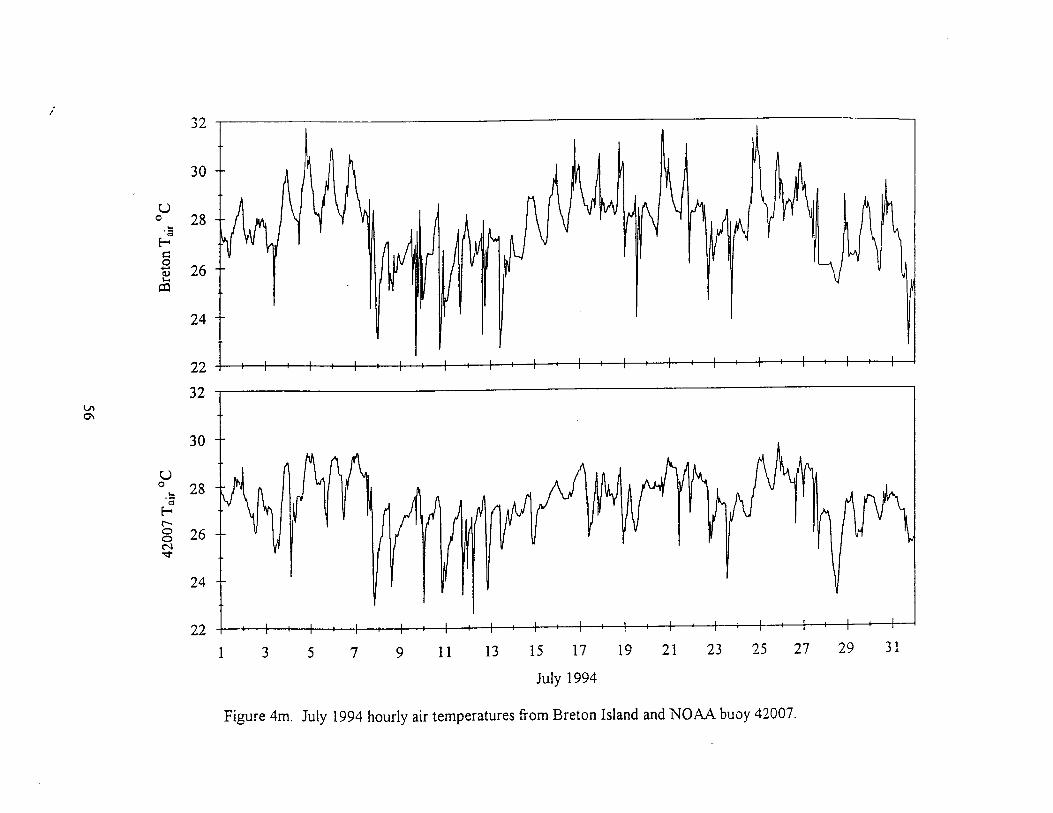
4m July 1994 hourly air temperatures from Breton Island and NOAH buoy 56 42007.
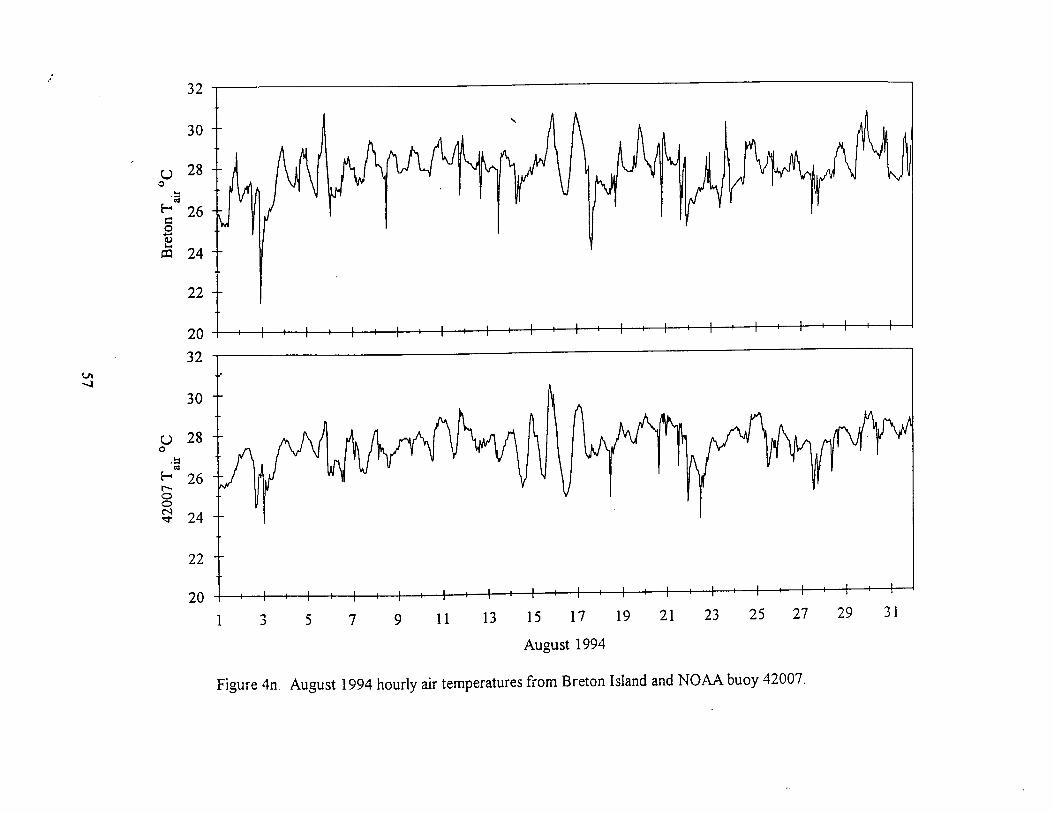
4n August 1994 hourly air temperatures from Breton Island and NOAH 57 buoy 42007.
4o September 1994 hourly air temperatures from Breton Island and NOAH 58 buoy 42007.
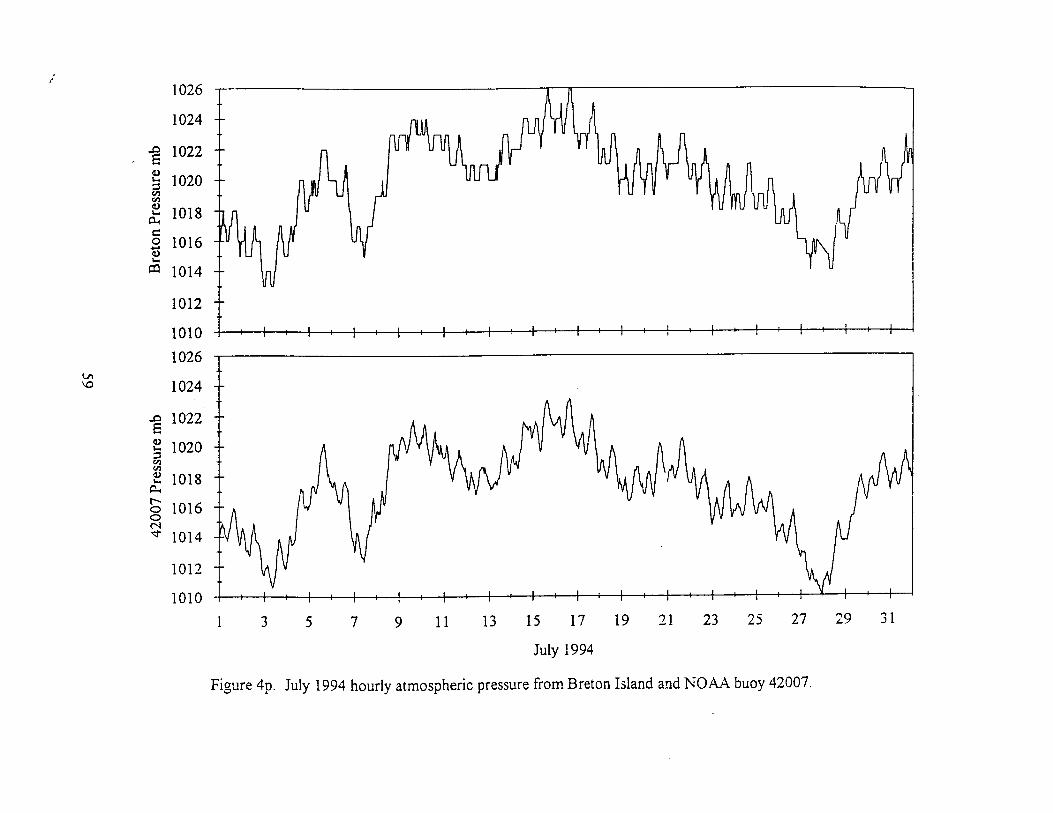
4p July 1994 hourly atmospheric pressure from Breton Island and NOAA 59 buoy 42007.
4q August 1994 hourly atmospheric pressure from Breton Island and 60 NOAH buoy 42007 .
4r September 1994 hourly atmospheric pressure from Breton Island and 61 NOAA buoy 42007.
4s July 1994 hourly relative humidity from Breton Island . 62
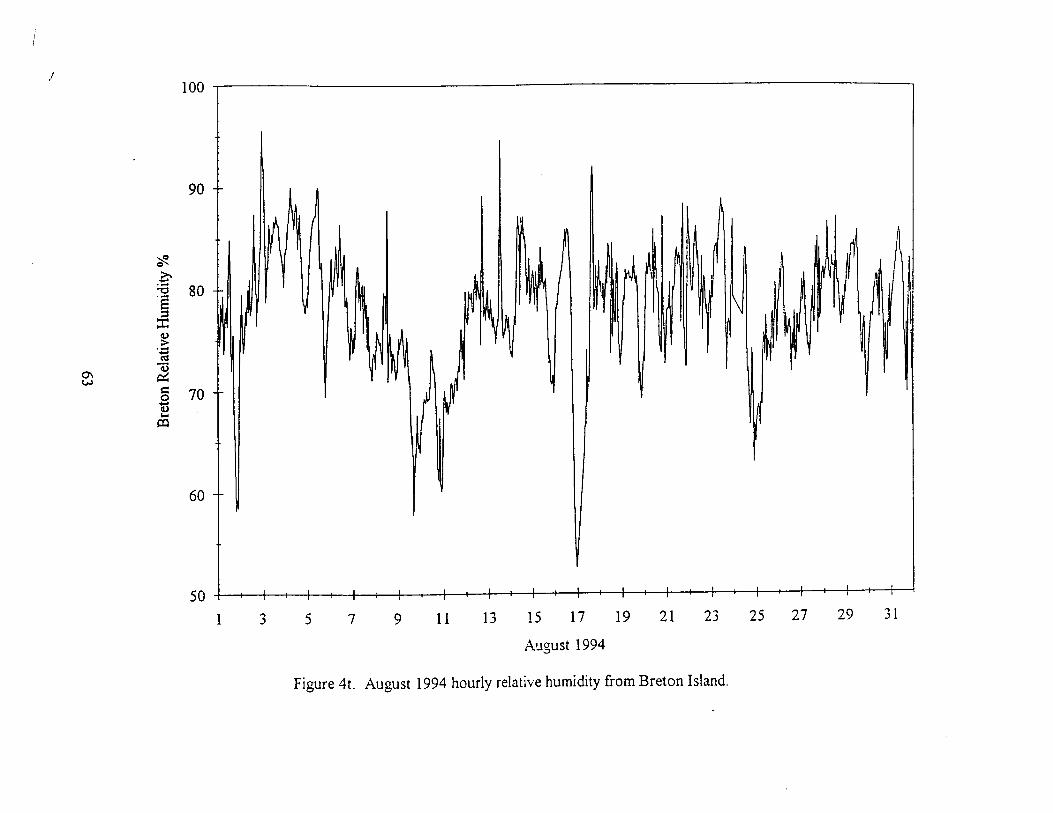
4t August 1994 hourly relative humidity from Breton Island . 63
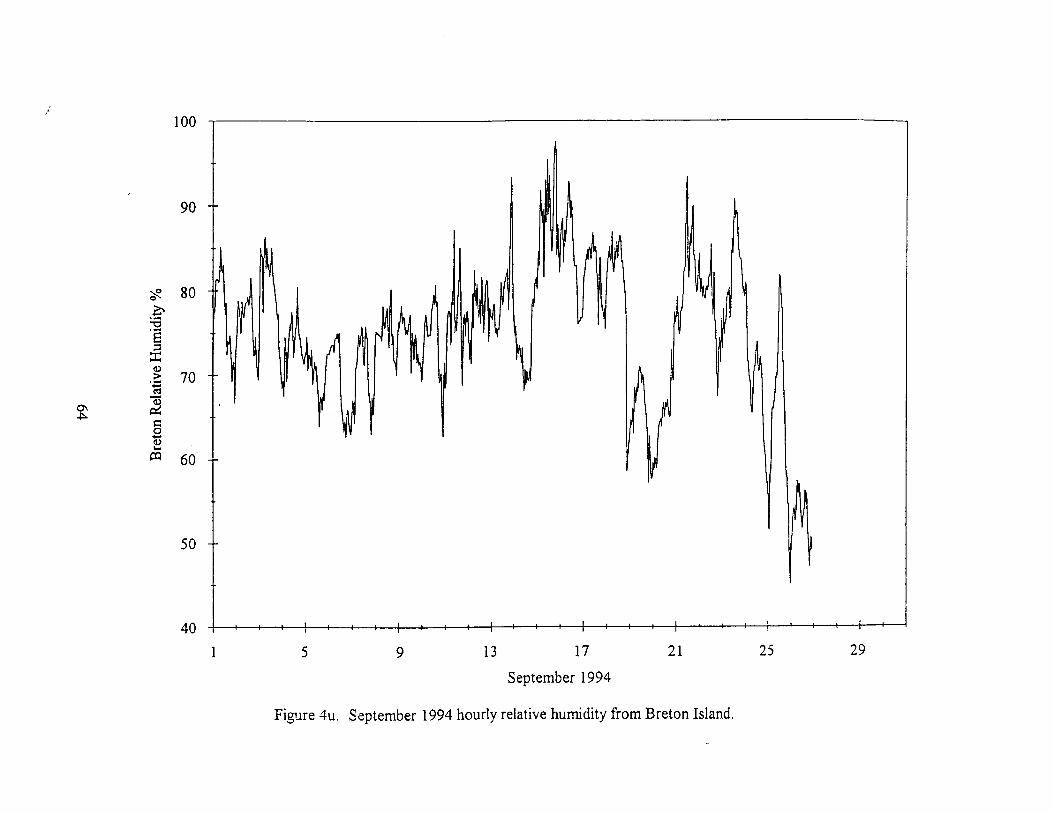
4u September 1994 hourly relative humidity from Breton Island . 64
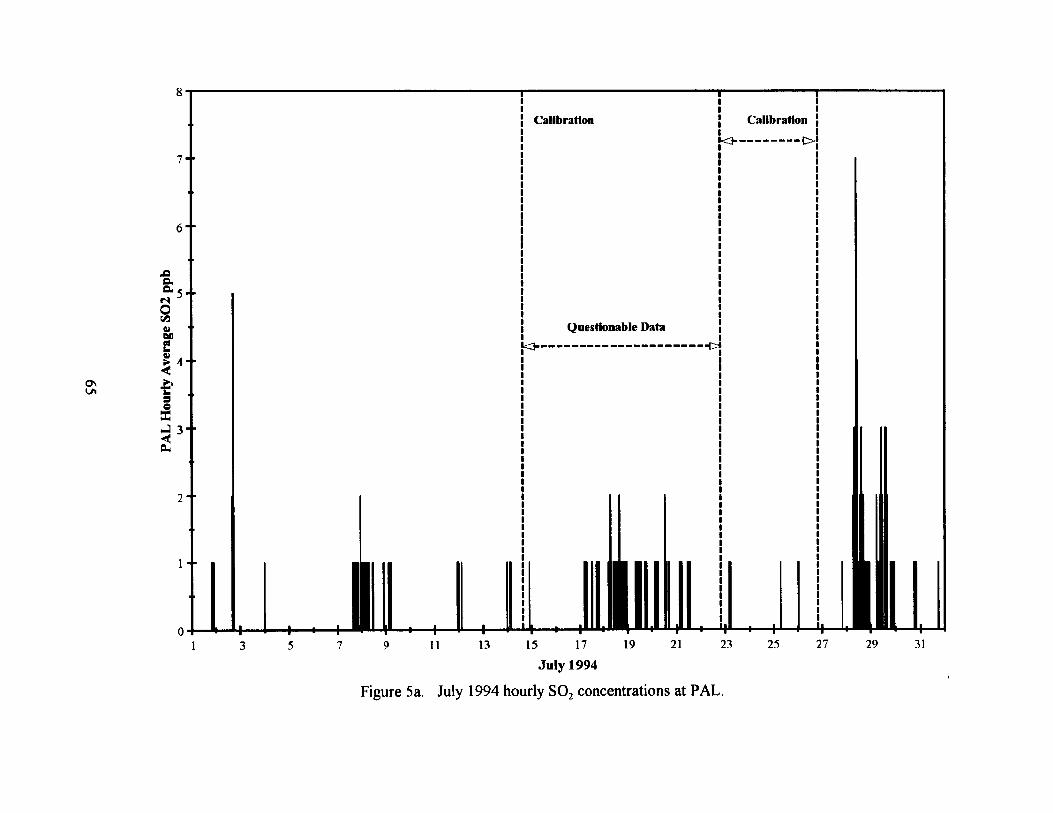
Sa July 1994 hourly SOZ concentrations at PAL. 65
Sb August 1994 hourly SOZ concentrations at PAL. 66
Sc September 1994 hourly SOZ concentrations at PAL. 67
Sd July 1994 hourly NO concentrations at PAL. 68
Se August 1994 hourly NO concentrations at PAL. 69
x

Figure Page
Sf September 1994 hourly NO concentrations at PAL. 70
Sg July 1994 hourly N02 concentrations at PAL. 71
Sh August 1994 hourly N02 concentrations at PAL . 72
Si September 1994 hourly N02 concentrations at PAL. 73
Sj July 1994 hourly NO,, concentrations at PAL. 74
Sk August 1994 hourly NO,, concentrations at PAL. 75
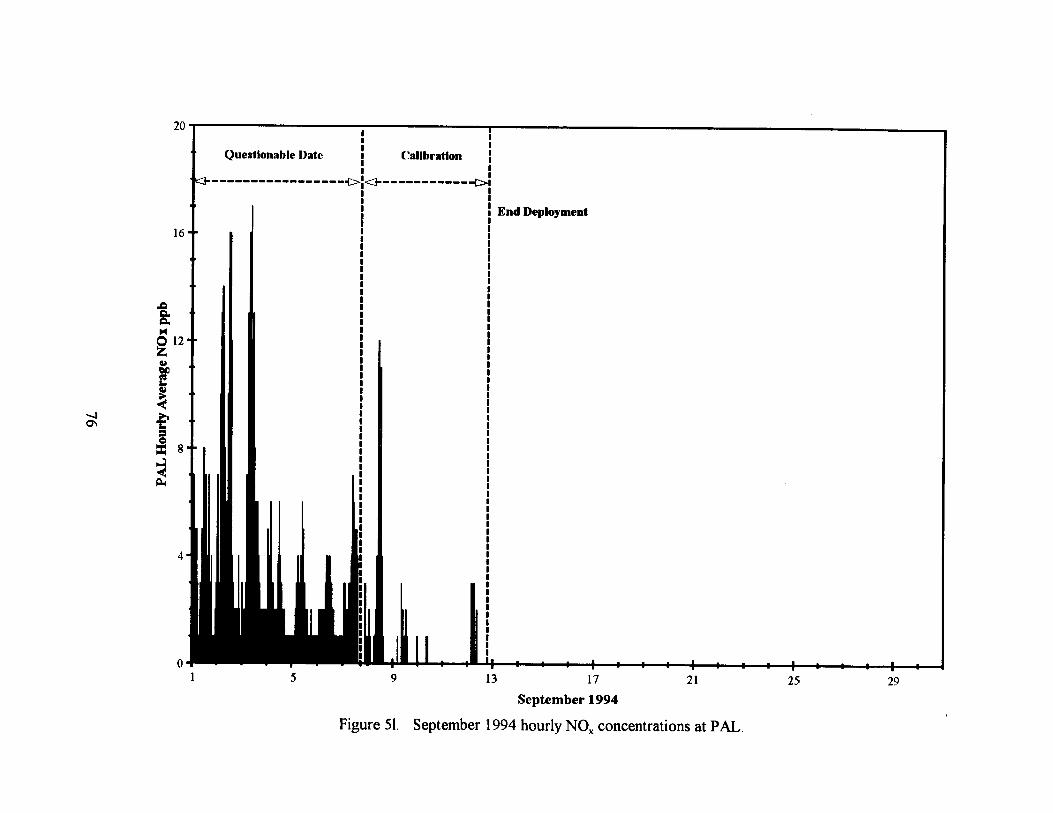
51 September 1994 hourly NO. concentrations at PAL . 76
Sm July 1994 hourly wind speeds at PAL and NOAH stations GDIL1 and 77 BURI,1 .
Sn August 1994 hourly wind speeds at PAL and NOAA stations GDII,1 78 and BURL 1 .
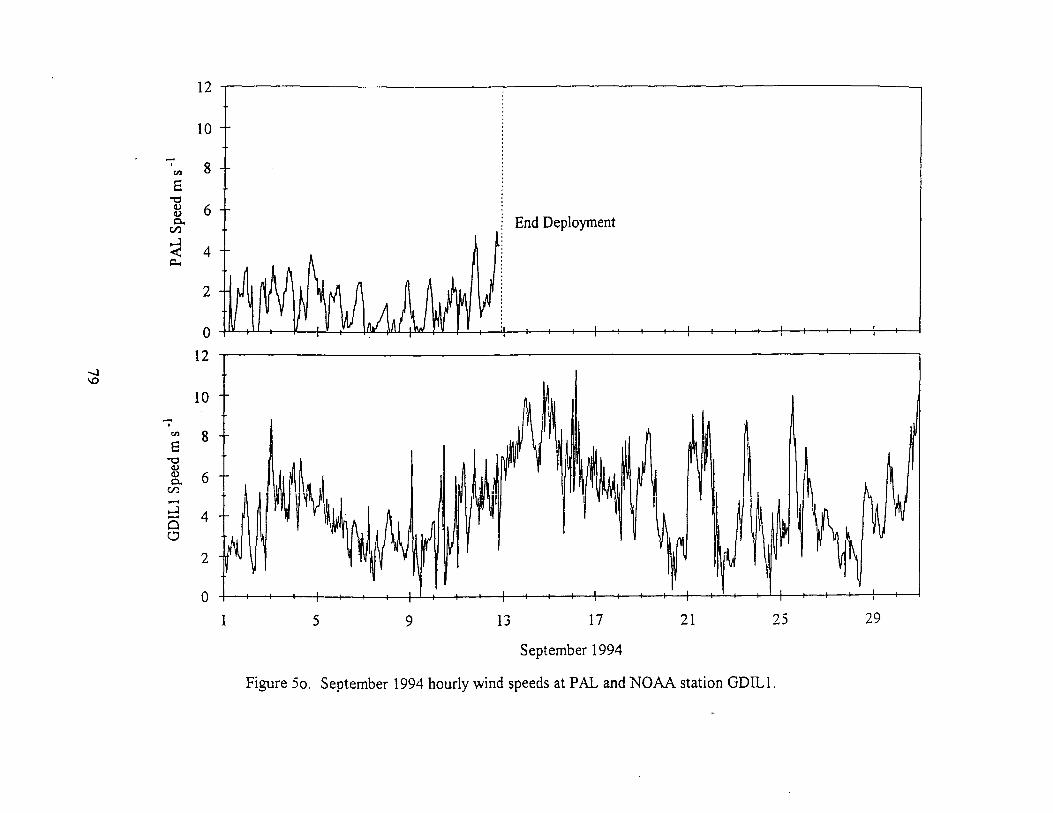
So September 1994 hourly wind speeds at PAL and NOAH station GDII,I . 79
Sp July 1994 hourly wind directions at PAL and NOAA stations GDII,I SO and BURL 1 .
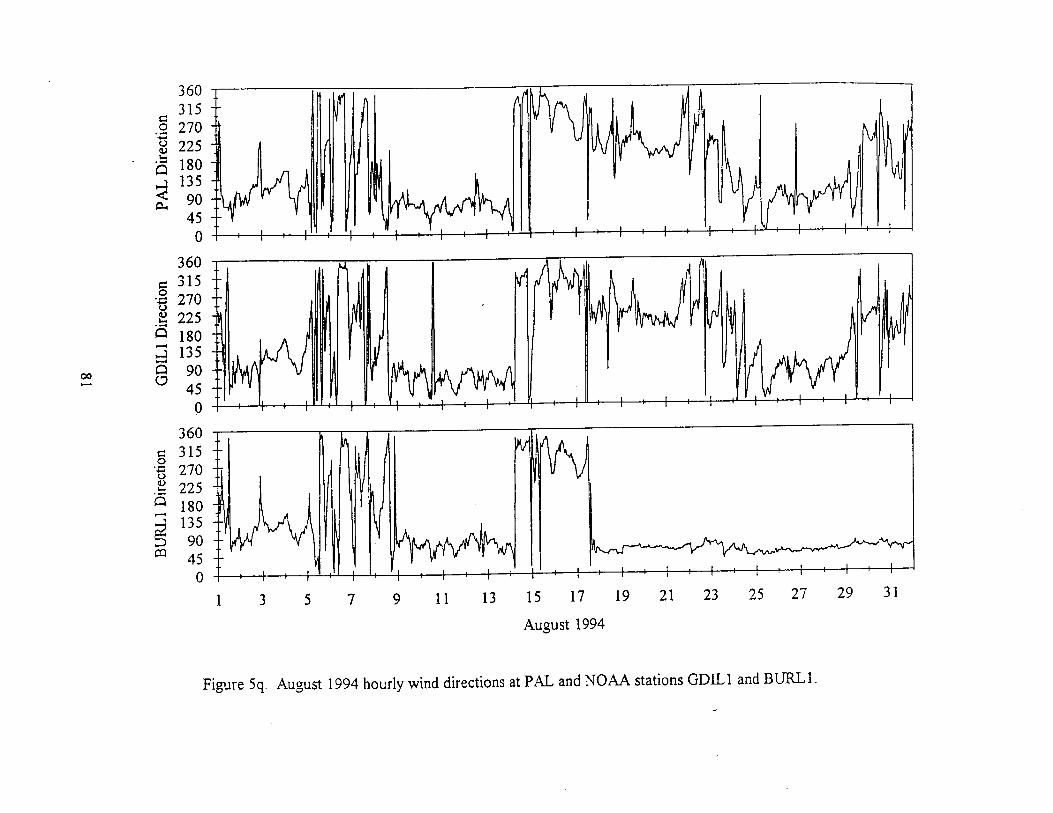
Sq August 1994 hourly wind directions at PAL and NOAA stations GDII.1 81 and BURL 1 .
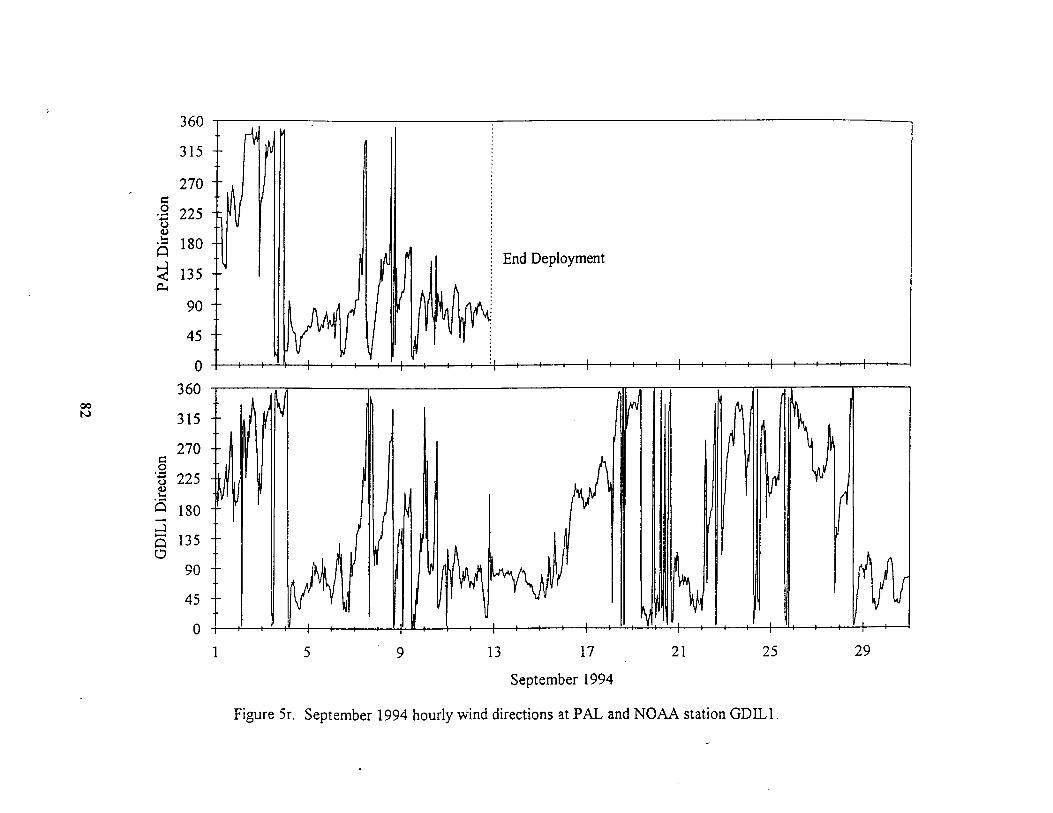
Sr September 1994 hourly wind directions at PAL and NOAH station 82 GDIL 1 .
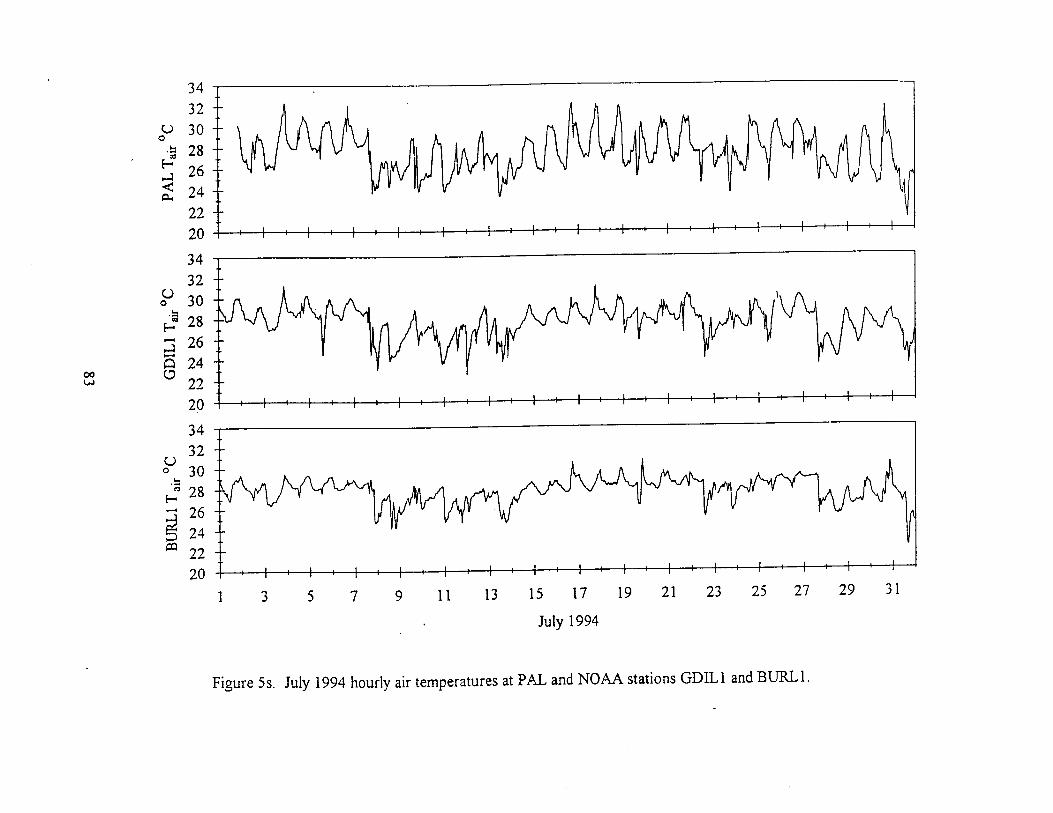
Ss July 1994 hourly air temperatures at PAL and NOAH stations GDII.1 83 and BURL 1 .
St August 1994 hourly air temperatures at PAL and NOAA stations 84 GDEL I and BURL 1 .
Su September 1994 hourly air temperatures at PAL and NOAH station 85 GDII.1 .
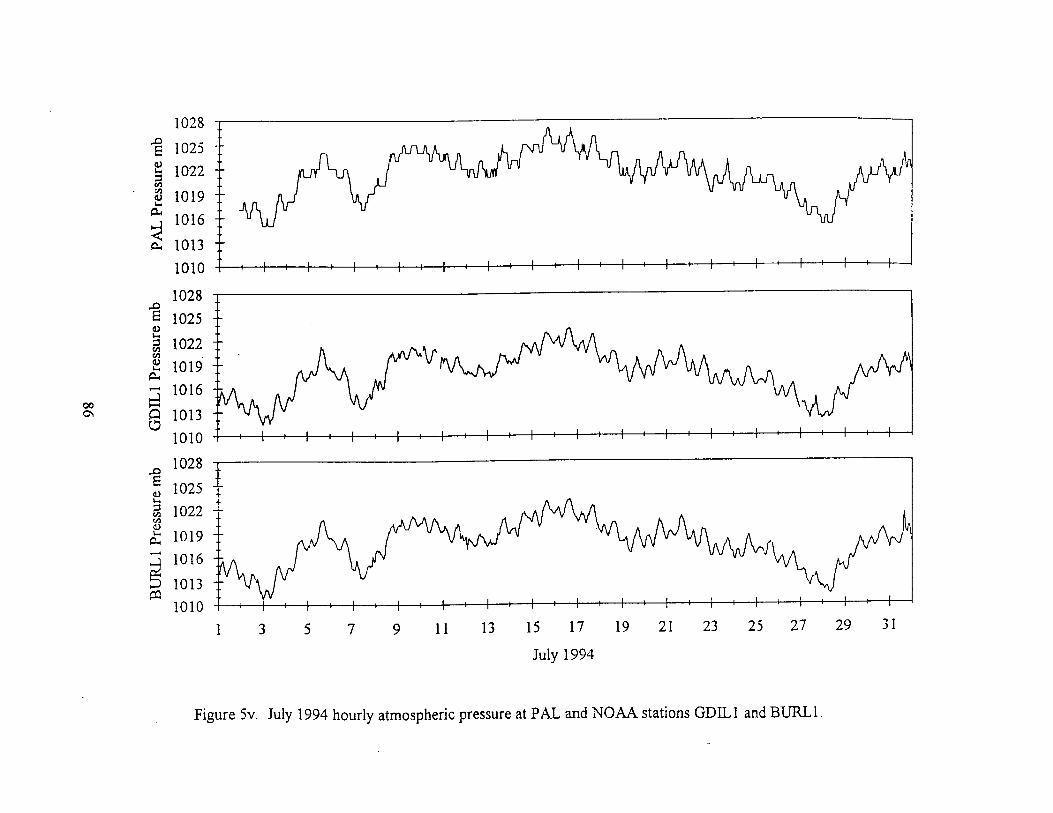
Sv July 1994 hourly atmospheric pressure at PAL and NOAA stations 86 GDEL 1 and BURL 1 .
Sw August 1994 atmospheric pressure at PAL and NOAH stations GDII.1 87 and BURL 1 .
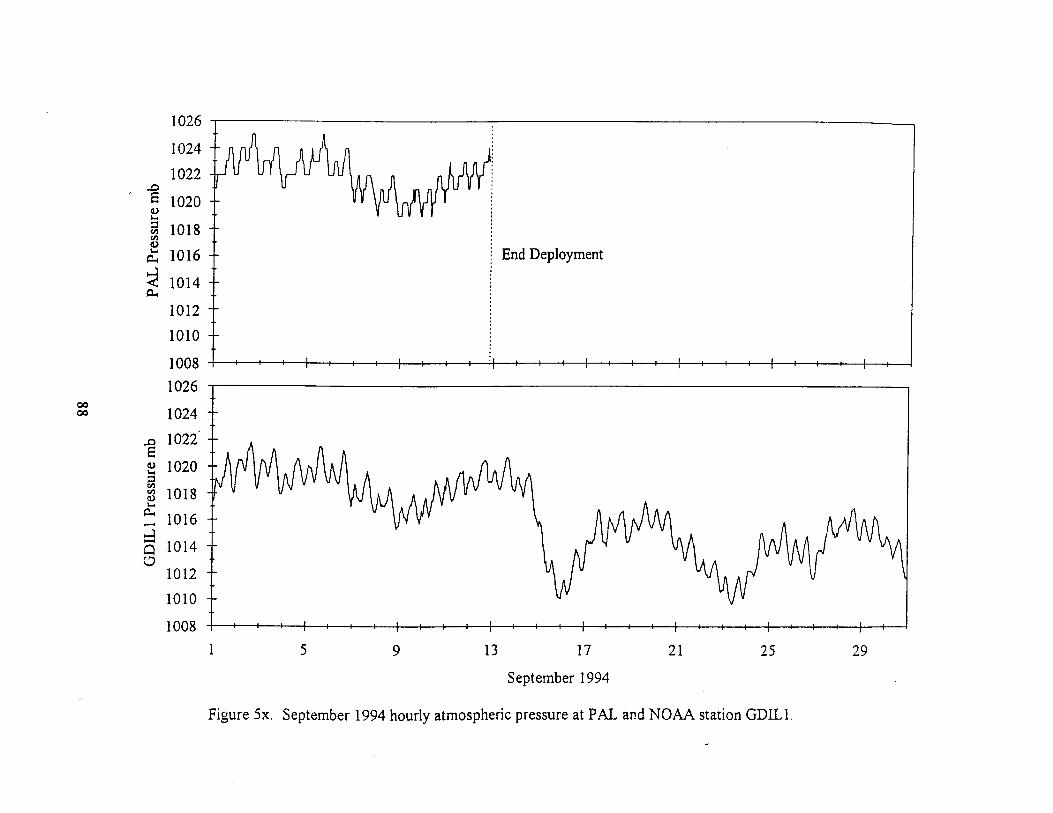
Sx September 1994 hourly atmospheric pressure at PAL and NOAH station 88 GDII.1 .
xi

Figure Page
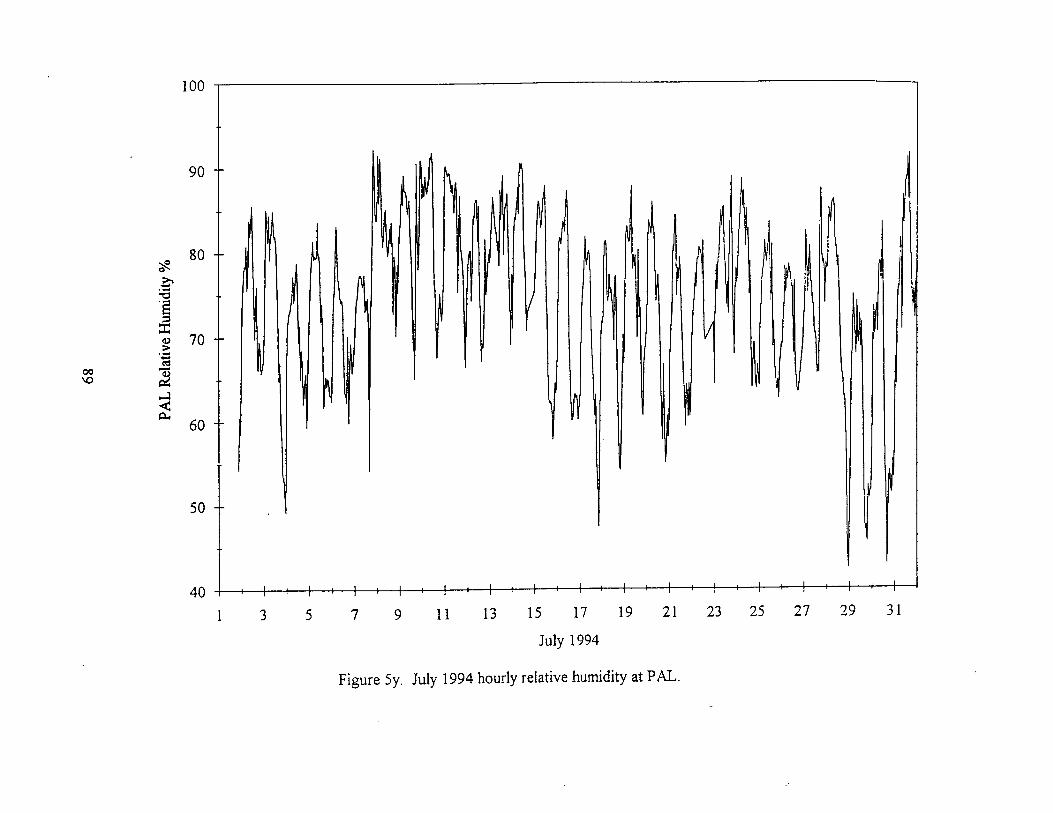
Sy July 1994 hourly relative humidity at PAL. 89
Sz August 1994 hourly relative humidity at PAL. 90
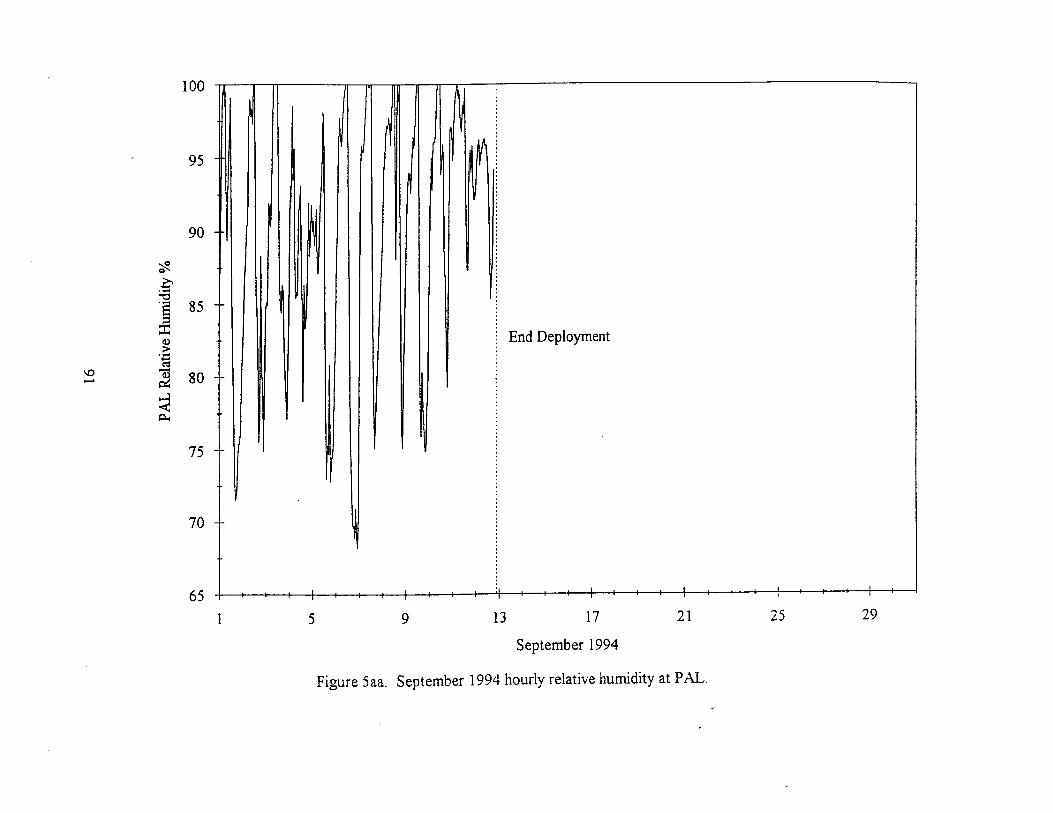
Saa September 1994 hourly relative humidity at PAL. 91
6 NAAQS standards and maximum SOZ concentrations at PAL and Breton 99 Island .
7 July 1994 wind rose from Gosier Island . 105
8 August 1994 wind rose from Gosier Island . 106
9 September 1994 wind rose from Gosier Island . 107
10 August 1994 wind rose at Gosier Island . 108
11 Frequency distribution of NOZ (in ppb) at Breton Island during the 109 period of 1 July to 26 September 1994 based on Gosier Island winds (1819 samples, 86.2% of possible record).
12 Frequency distribution of SOZ (in ppb) at Breton Island for the months 110 of July and August 1994 based on Gosier Island winds (887 samples, 59.6% of possible record).
13 July 1994 wind rose from PAL. 119
14 August 1994 wind rose from PAL . 120
15 July 1994 wind rose from PAL. 121
16 August 1994 wind rose from PAL. 122
17 Frequency distribution of NOZ concentration (in ppb) at PAL during the 123 period of 1 July to 12 September 1994 (1574 samples, 89 .9% of possible record) .
18 Frequency distribution of SOZ concentration (in ppb) at PAL during the 124 period of 1 July to 12 September 1994 (1715 samples, 97 .9% of possible record) .
19 Atmospheric profiles of potential temperature (8, X-line) and mixing 126 ratio (q, o-line) versus height in m over our study area .
xii

LIST OF TABLES
Table Page 1 A Gosier Island SO, Precision Data 15 1B Gosier Island SOZ Accuracy Data 16 2A Breton Island SOz Precision Data 17 2B Breton Island SOz Accuracy Data 17 3A Breton Island NO. Precision Data 18 3B Breton Island NOX Accuracy Data 20 4A Pass-A-Loutre SOZ Precison Data 22 4B Pass-A-Loutre SOZ Accuracy Data 23 SA Pass-A-Loutre NO. Precision Data 24 SB Pass-A-Loutre NOX Accuracy Data 26 6 Percentage Data Return 29 7 Radiosonde Launch Information 30
8 U.S . Federal Primary and Secondary Ambient Air Quality Standards 96 9 U.S . Federal PSD Concentration Increments 97 10 Gosier Island Ogawa (SOZ) Passive Data 100 11 Gosier Island Palmes (NOz) Passive Data 101 12 Breton Island Daily SOz Maximums and Averages (ppb) 102 13 Breton Island Daily NOZ Maximums and Averages (ppb) 103 14 Breton Island 1994 Pollutant Maximums 104
15 Events of Breton Island NOZ Concentrations > 18 .2 ppb 111 16 Breton Island Ogawa (SOZ) Passive Data 114 17 Breton Island Palmes (NOz) Passive Data 115 18 Pass-A-Loutre Daily SOZ Maximums and Averages (ppb) 116 19 Pass-A-Loutre Daily NOz Maximums and Averages (ppb) 117 20 Pass-A-Loutre 1994 Pollutant Maximums 118 21 Events of Pass-A-Loutre NOZ Concentrations > 8 .8 ppb 125 22 Lifting Condensation Levels and Mixing Heights 129
xiii
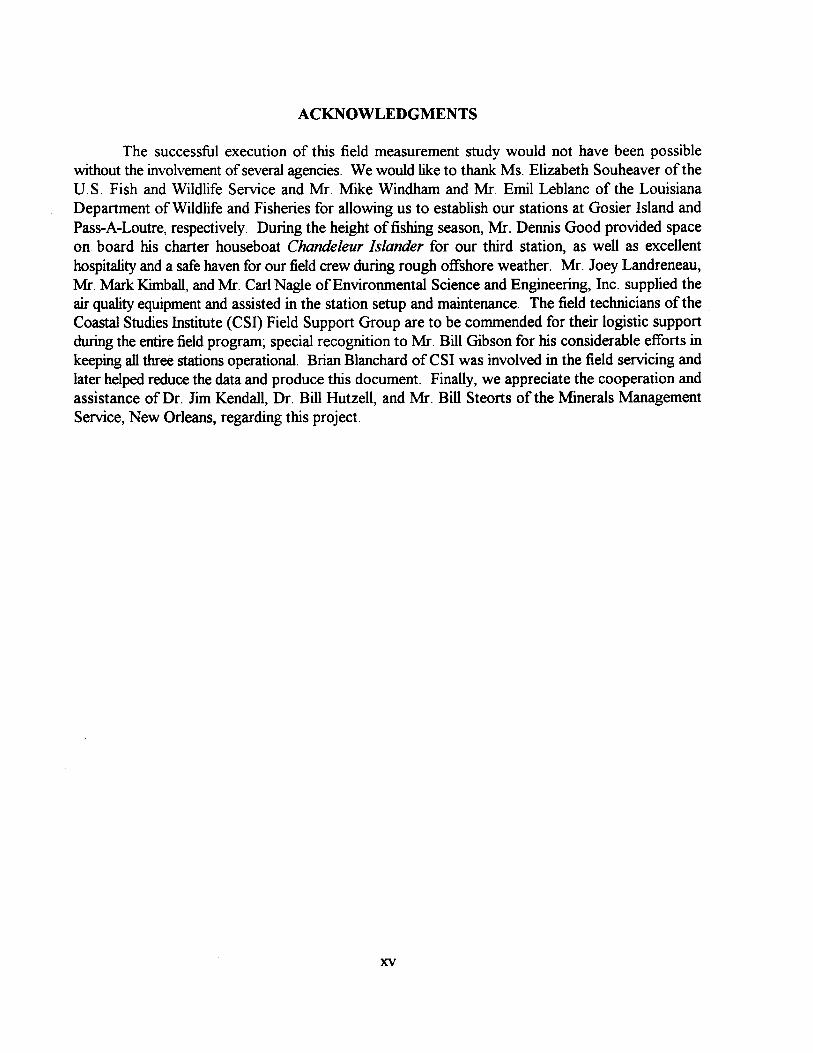
ACKNOWLEDGMENTS
The successful execution of this field measurement study would not have been possible without the involvement of several agencies . We would like to thank Ms. Elizabeth Souheaver of the U.S . Fish and Wildlife Service and Mr. Mike Windham and Mr Emil Leblanc of the Louisiana Department of Wildlife and Fisheries for allowing us to establish our stations at Gosier Island and Pass-A-Loutre, respectively . During the height of fishing season, Mr. Dennis Good provided space on board his charter houseboat Chandeleur Islander for our third station, as well as excellent hospitality and a safe haven for our field crew during rough offshore weather. Mr. Joey Landreneau, Mr. Mark Kimball, and Mr. Carl Nagle of Environmental Science and Engineering, Inc. supplied the air quality equipment and assisted in the station setup and maintenance. The field technicians of the Coastal Studies Institute (CSI) Field Support Group are to be commended for their logistic support during the entire field program; special recognition to Mr. Bill Cribson for his considerable efforts in keeping all three stations operational. Brian Blanchard of CSI was involved in the field servicing and later helped reduce the data and produce this document . Finally, we appreciate the cooperation and assistance of Dr. Jim Kendall, Dr. Bill Hutzell, and Mr. Bill Steorts of the Minerals Management Service, New Orleans, regarding this project .

EXECUTIVE SUMMARY

EXECUTIVE SUMMARY
The U. S. Environmental Protection Agency (EPA) has designated sections of southern Mississippi and Alabama as Class I and II areas due to their status as National Seashores . Part of the Breton National Wildlife Area in the Chandeleur Islands of Louisiana provides protected haven for the abundant wildlife inhabiting these environments, and is also Class I. The Delta National Wildlife Refuge in the Mississippi River Delta is Class II . Having attained this ranking, these areas fall under the restrictions of the Prevention of Significant Deterioration (PSD) regulations of the Clean Air Act . Although the air quality is presumably quite clean at present, it is mandatory that pollutants transported into the areas do not lower the air quality beyond a specified significant increment .
Offshore oil and gas production to the east and south of the Mississippi River Delta is currently very active and will likely increase in the future . Atmospheric releases of sulphur and nitrogen compounds are a natural by-product of the production processes . Since the National Seashores and Wildlife Refuges are coastally located, they are in a unique position in which they can be affected by land-based as well as offshore (Outer Continental Shelf) pollutant sources.
To gain a better understanding of the current ambient levels of both SOZ and NO2, three air quality and meteorological monitoring stations were deployed during the period of July through mid-September 1994 . High pressure normally dominates over the area during this time, which can lead to air stagnation and in turn, higher pollutant levels . Two stations were established in the Breton National Wildlife Area and one at the headquarters of the Louisiana Wildlife and Fisheries at Pass-A-Loutre, Louisiana (see Fig. 1) . Measured parameters included SOZ, NO Z , air temperature, atmospheric pressure, relative humidity, and wind speed and direction .
Analysis of the available data records shows that measured pollutant levels at all three stations were well below the National Ambient Air Quality Standard maximums . Allowable limits on pollutant concentrations applying to PSD Class I and II areas are increments with respect to a baseline concentration. Due to the unavailability of these baseline measurements combined with the relatively short and non-continuous record obtained in this program, direct comparisions with PSD increments were not valid. On the other hand, average and maximum concentrations of both SOZ and NOz were considerably higher at Breton Island than at Pass-A-Loutre. Furthermore, several distinct episodes of higher than average NO,, concentrations were evident in the Breton Island record . The data indicates that these short-lived (on the order of hours) events may be due to local sources rather than long distance transports . Highest concentrations of NOZ and SOZ at Breton Island during the study period were from the north and northeast, while at Pass-A-Loutre highest NOZ concentrations were observed from the northwest and southwest and highest SOZ from the north. For S02, the highest 3-hourly and daily concentration was 13 .3 ppb (f 6.4) and 2 .8 ppb (t 0.8) at Breton Island and 5.7 ppb (f 1 .5) and 1 .4 ppb (t 1 .6) at Pass-A-Loutre, respectively . The highest 3-hourly and daily NOZ concentrations were 31 ppb (f 5.6) and 12 ppb (f 12 .8) for Breton Island and 13 ppb (f 1 .7) and 5 .1 ppb (f 3 .8) for Pass-A-Loutre, respectively . The majority of all hourly samples were less than 5 ppb.
3
Twelve atmospheric profiles (radiosondes) were obtained during the study period . It is shown that the average mixing heights are nearly identical to the average lifting condensation level (LCL). A method for estimating the LCL from surface temperatures is given with a root mean square error of approximately 70 m. Mixing heights over the marine area are found to be significantly lower than the previously accepted climatic mean .
o so ioo
MS ALA
Mobil
SW L -lb
4f 4:00 dh=:%W Wor .
o b 42007 0
N e t! AS
~ ~u auwo~ di° ly 4 ~ wiot
~ ~s o ~~ ,~tgp f ~ O
V ~
` WLMJFE REFUGE 4r V
OPIL Oar t grow
INLD ~M I~ REFUGE ~
GDILl F
L * Ilfsa:~r~m~n! S!!i1 a v
BURLI
Figure 1 . Air quality and meteorological stations deployed during the summer of 1994 .
4

METHODOLOGY

METHODOLOGY
1 . Introduction
During the 1994 summer months of July through mid-September, air quality and meteorological data was collected from three field stations located within the Mississippi River Delta and off the Louisiana coast in the Chandeleur Islands . In essence, this deployment was a repeat of our pilot study conducted during the summer of 1993 (see Hsu, 1995) but with a much more comprehensive measurement program. Details of the setup, equipment, calibration techniques and results, and data collected for each station is provided in the following sections .
2. Equipment
All three stations were originally designed to be equipped with the same suite of meteorological sensors and air quality analyzers; however frequent operational problems and malfunctions during the deployment resulted in the use of several different brands of instrumentation. In general, the minimum detectable threshold for all air quality analyzers used was 1 ppb. All data was stored on site via Campbell CR10 dataloggers . These dataloggers utilize a 10-second scan rate and were programmed for 5-minute averages (30 samples) . Depended on the parameter, average values were recorded every 5 minutes or hourly .
Gosier Island
Gosier Island is situated in the southern part of the Chandelew Island chain, north of the Mississippi River Delta. These islands are within the Breton National Wildlife Area, which has been designated as an EPA Class I area. The measurement station was established on the beach at approximately 29°33.69'N 890 03 .39'W. Major equipment deployed included a Thermo-Environmental (TECO) Model 43A SO2 Analyzer, Weathertronics Micro-Response Anemometer and Wind Vane (later changed to a single Weathertronics Stratavane Windbird), and a Campbell Scientific CR10 datalogger. The SOZ Analyzer and CR10 housing were placed inside of a ventilated shelter on a scaffold about 2 m above ground level. An air temperature sensor and the wind instruments were tower mounted next to the scaffold with observation heights of 3 m and 6 m, respectively . In addition, a pond located adjacent to the beach site was instrumented with an Model PHTX-20 pH transmitter and Model CDTX-20 conductivity transmitter, both manufactured by Omega Engineering, Inc., and a water temperature sensor . Due to the lack of any commercial power source, all equipment was run off of a bank of 12V car batteries. This fact, combined with the remote locale and harsh environmental conditions, produced a non-continuous data record and made servicing the station difficult and, on occasion, hazardous to equipment and personnel .
Meteorological parameters (wind speed and direction and air temperature) were recorded every five minutes while limnological values (pH, conductivity, temperature) were obtained hourly, whereas ambient SOZ concentrations were measured on a 45-60 minute basis. This was accomplished
7

by programming the CR10 to activate the SOZ Analyzer, allow it five minutes to stabilize (at which point a measurement was taken), and then de-activate . The measurement interval was calculated to provide the most observations possible given the expected power drain on the batteries between servicings .
Power restraints also ruled out the use of an automated gas calibrator for the S02 Analyzer . Therefore, a calibration system consisting of flowmeters, a gas proportioner, and cylinders of zero air and span gas was assembled . Flows necessary to produce a five-point calibration of the Analyzer were derived.
Ogawa Passive SOZ and Palmes Passive NO,, sensors were exposed throughout the field deployment at Gosier Island . Although correctly handled in the field, the long exposure times and improper storage of the sample tubes casts doubts on the validity of this data .
Given the rugged conditions and the non-conventional method of operation, it is surprising that the only missing data in the air quality (S02) record occurred during 7 - 13 July . When the station was serviced on 7 July, it was found that the UV lamp in the Analyzer had failed, and the unit was subsequently taken o$line . The lamp and socket were replaced on the next trip out (13 July) and the Analyzer returned to service .
On the other hand, wildlife inhabiting the island caused several problems . Pelicans and other marine waterfowl destroyed the Micro-Response Anemometer, resulting in a data gap in the wind speed record from 5 through 13 July . The wind vane was also damaged but apparently could still rotate for wind direction . The most serious damage was done to the cables connecting the pond instruments to the datalogger system, which were run on the surface over the dunes. Over time, animals apparently chewed into the cables, causing system shorts and the eventual failure of reliable data from the pond instruments on 21 July . These intermittent shorts were not detected in the field until 24 August, at which point the cables were disconnected from the datalogger . Large negative values in the S02 record from 13 to 24 August are probably due to these shorts .
The station deployment and servicing schedule is listed below as taken from field log excerpts :
29 June - all equipment deployed
1 July - start of monitoring
7 July - download, damage to wind instruments, S02 Analyzer taken offline due to lamp failure
13 July - download, Stratavane Windbird installed, S02 Analyzer online
21 July - download, S02 Analyzer calibration, failure of pond instruments
5 August - download, S02 Analyzer calibration
8

17 August - download
24 August - download, S02 Analyzer calibration, pond instruments disconnected
31 August - download, S02 Analyzer calibration
8 September - download, S02 Analyzer calibration
26 September - station had exhausted power supply previous to this date . All equipment removed. Post calibration of S02 Analyzer performed at CSI lab .
Breton Island (Chandeleur Islander)
Breton Island is also in the EPA Class I area of the Chandeleur Islands, less than 10 miles southwest of Gosier Island . The reason for having this second site in such close proximity to the Gosier station was that AC power was available here . Although this area is more developed and utilized than pristine Gorier Island (considerable boat traffic, moored houseboats and camps, and the Kerr-McGee facility), continuous air quality measurements could be made which would back up those acquired at nearby Gosier .
As in 1993, the houseboat Chandeleur Islander served as host to our station. The Islander was semi-permanently moored in Breton Sound at approximately 29°29.34N 89°10.45'W. Air quality equipment for this station consisted of a TECO Model 43A S02 Analyzer (rotated with a Model 43), a Monitor Labs, Inc. Model 8840 NO. Analyzer, and a TECO Model 146 Gas Calibrator (later changed to an Environics Series 100 Calibrator) with associated zero and span gas supplies . These units, along with the CR10 datalogger, were installed in a loft inside of the houseboat's loading bay. Unfortunately, this left them exposed to the marine environment and high temperatures (which may have contributed to problems later encountered with the units) . Passive air quality sensors (Ogawa and Palmes) were also deployed here as at Gorier . Meteorological parameters monitored were air temperature, relative humidity, atmospheric pressure, and wind speed and direction.
Ambient concentrations of SO2, NO, NOZ, and NO, were recorded every five minutes along with wind speed and direction; air temperature, humidity and pressure were recorded hourly . Since the Chandeleur Islander was moored at a single point, it would turn on this axis in response to the wind and wave conditions . This necessitated the addition of a compass heading in order to determine the true wind direction . After field measurements were completed, it was discovered that the compass had not been functional during the entire period . Therefore, the wind record for this station has not been included in this analysis .
This station experienced several other equipment problems which resulted in the loss of data . The TECO 146 Gas Calibrator failed on installation and was returned for repairs. On 13 July, the TECO 43A could not be calibrated and was taken offline. This created a gap in the S02 record until
9
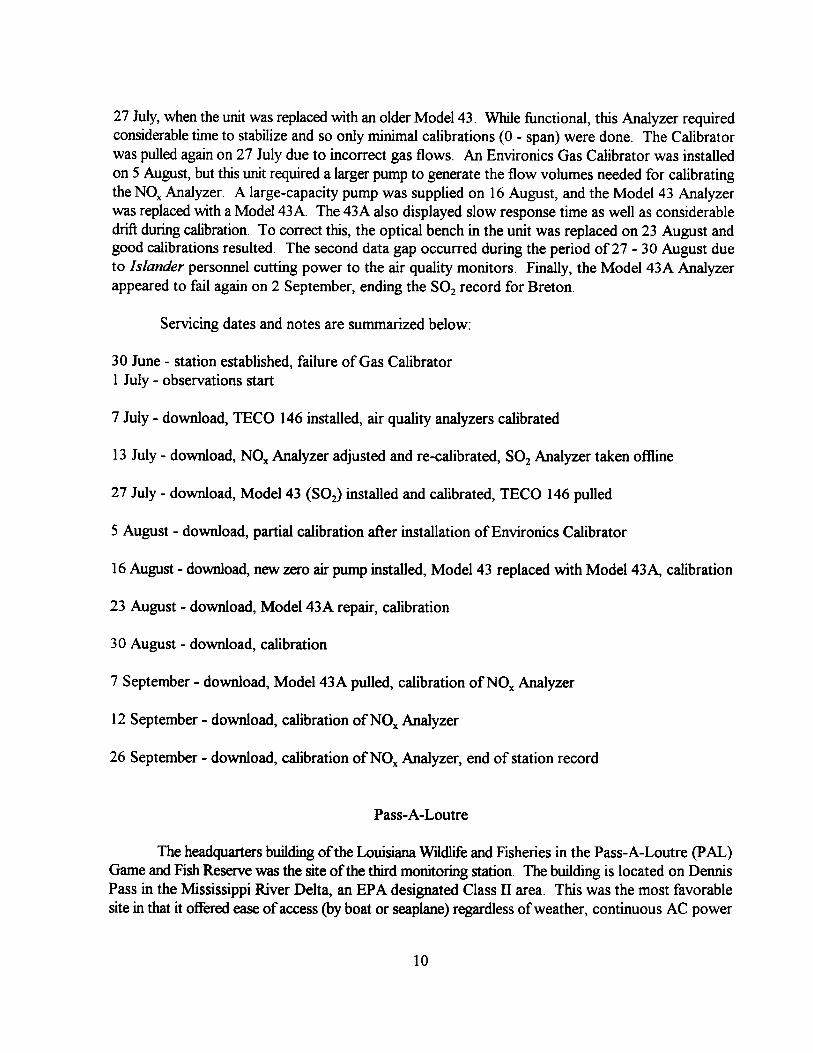
27 July, when the unit was replaced with an older Model 43 . While functional, this Analyzer required considerable time to stabilize and so only minimal calibrations (0 - span) were done . The Calibrator was pulled again on 27 July due to incorrect gas flows. An Environics Gas Calibrator was installed on 5 August, but this unit required a larger pump to generate the flow volumes needed for calibrating the NO,, Analyzer . A large-capacity pump was supplied on 16 August, and the Model 43 Analyzer was replaced with a Model 43A. The 43A also displayed slow response time as well as considerable drift during calibration . To correct this, the optical bench in the unit was replaced on 23 August and good calibrations resulted . The second data gap occurred during the period of 27 - 30 August due to Islander personnel cutting power to the air quality monitors . Finally, the Model 43A Analyzer appeared to fail again on 2 September, ending the SOZ record for Breton .
Servicing dates and notes are summarized below :
30 June - station established, failure of Gas Calibrator 1 July - observations start
7 July - download, TECO 146 installed, air quality analyzers calibrated
13 July - download, NOX Analyzer adjusted and re-calibrated, S02 Analyzer taken offline
27 July - download, Model 43 (SOZ) installed and calibrated, TECO 146 pulled
5 August - download, partial calibration after installation of Environics Calibrator
16 August - download, new zero air pump installed, Model 43 replaced with Model 43A, calibration
23 August - download, Model 43A repair, calibration
30 August - download, calibration
7 September - download, Model 43A pulled, calibration of NO,, Analyzer
12 September - download, calibration of NO. Analyzer
26 September - download, calibration of NO. Analyzer, end of station record
Pass-A-Loutre
The headquarters building of the Louisiana Wildlife and Fisheries in the Pass-A-Loutre (PAL) Game and Fish Reserve was the site of the third monitoring station. The building is located on Dennis Pass in the Mississippi River Delta, an EPA designated Class II area . This was the most favorable site in that it offered ease of access (by boat or seaplane) regardless of weather, continuous AC power
10

for the Analyzers, and a climate-controlled room for the equipment. The effect of these factors is evident in the higher percentage of data obtained here .
Station setup was similar to that at Breton Island . TECO Models 43A (S02), 42 (NOX), and 146 (Calibrator) were installed for air quality monitoring . A 10 m tower was erected for wind speed and direction (via Weathertronics Micro-Response Anemometer and Vane). Other recorded parameters were air temperature, relative humidity, and atmospheric pressure . Sample interval for the air quality parameters as well as wind speed and direction was five minute ; remaining meteorological parameters were recorded hourly . No passive sensors were deployed .
The only significant data loss resulted from the failure of the NO. Analyzer as the station was being established . The NO. Analyzer was repaired and installed on 7 July . The unit remained in service throughout the rest of the deployment, although problems with the keyboard and display prompted the replacement of the processor board on 16 August. On 7 September, the NO. Analyzer could not be calibrated . The field technician dis-assembled the unit on site and cleaned the lens and then partially removed the pump . A foreign substance was found inside the pump which was obstructing the flapper valves . Once removed, the unit operated normally and good calibrations followed . Following are field servicing notes for the PAL station-
I July - station established and measurements begin, NO,, Analyzer failure
7 July - NOR Analyzer installed
14 July - download, air quality Analyzers adjusted and calibrated but suspect error in Calibrator
22 July - download, Calibrator checked with Gilibrator bubble meter and adjusted, good calibrations of Analyzers
26 July - download, calibration
4 August - download, anemometer changed, calibration
11 August - download, calibration
16 August - download, processor board in NO. Analyzer changed, calibration
23 August - download, calibration
30 August - download, calibration
7 September - download, repair of pump in NO. Analyzer, calibration
12 September - download, calibration, end of station record
11

3. Calibrations
As indicated in the servicing records for each station, considerable effort was devoted to keeping the air quality monitors calibrated and in good operating condition . Typically when the stations were serviced, the monitors were either within acceptable error or not working at all .
Calibrations were performed by exposing the analyzers to known concentrations of the desired pollutants (SO2, NO) at several points from 0 ppb to nearly 500 ppb (full scale) . Test concentrations were obtained from compressed gas cylinders (traceable EPA Protocol gases) containing a mix of approximately 50 ppm SOZ and 50 ppm NO with a nitrogen balance. This gas was then diluted through a zero-air system with scrubbers to produce concentrations at several points . As described in the Code of Federal Regulations (40 CFR 58, App. B, 1994), one precision point and two or more additional points evenly spaced up to the full scale were checked to establish the relationship between the analyzer response and the pollutant concentration. If properly calibrated and operating nominally, the analyzers used in this study should exhibit a linear response as shown in Fig. 2; therefore accuracy of measurements should be consistent from low to high concentrations . At Gosier Island, calibration of the SOZ analyzer was performed manually by mixing test gas with that from a cylinder of zero air through a gas proportioner (all flowmeters were certified at the Louisiana Department of Environmental Quality) . Automated gas calibrators were required at Breton Island and Pass-A-Loutre to produce the gas phase titration needed for calibration of the NO,, analyzers . In this technique, ozone (03) is added to the calibrated NO channel in the reaction
N0 + 03 , N02+02
The decrease in the NO concentration from this reaction is equivalent to the N02 produced . Thus N02 concentration is derived from the difference between calibrated NO. and NO channels .
Gosier Island
Table lA lists the precision data for the TECO Model 43A SO2 Analyzer deployed at Gosier Island . The data are reported as a 95 percent confidence interval bounded by two percentile values as described in 49 CFR 58, App. B (1994) . The interpretation is that for any randomly selected value within the database represented, there is only 5 percent probability that its accuracy is outside of the boundaries defined as the upper and lower 95-percent confidence limits . All air quality measurements are in ppb.
Table 1B presents accuracy data at other selected calibration points . It should be noted that the Tables reflect values obtained immediately before the Analyzer was adjusted (greatest error) . Also, a final calibration of the Analyzer on-site was not possible due to the lack of power. The unit was shipped back to the Coastal Studies Institute and calibrated under laboratory conditions .
12

U
N
U
Pass-A-Loutre
1 July 1994 y=1 .Ox-1 .05
Corr = 0.99
to
O
)
0 100 200 300 400 S02 Expected ppb
500
500
400
300
U Q
C) 200 z
100
0
Pass-A-Loutre 1 July 1994
""""""y = 1 .Olx - 2.46 (for NO and NOx) Corr = 0.99 - y = 0.99x = 0.39 (for NO 2)
Corr = 0.99
NO
NOx
N02
0 100 200 300 400 NOD Expected ppb
Figure 2 . Calibration curves from Pass-A-Loutre air quality analyzers .
500
13

Whenever an analyzer is physically moved to a new location, has undergone repairs, has been inoperative for an emended period, or has obviously malfunctioned, a new multi-point calibration must be conducted (EPA, 1979). Obviously, this calibration may not be representative of the response of the analyzer in its former state. In this case, if this post-calibration is excluded, the mean precision error would be -0.13 with a standard deviation of 13.12 . Accuracy values would likewise improve. Since deleting the final calibration would also invalidate all air quality data collected between that point and the last acceptable calibration, it has been included in the tables .
Breton Island
Calibration values at this station were made more complicated due to the previously described problems with the calibration system and exchange of the SOZ Analyzer on two occasions . Precision and accuracy data for the SOZ Analyzer are listed in Tables 2A and 2B while values for the NO,, Analyzer are in Tables 3A and 3B. The wide range of expected values for N02 in Tables 3A and 3B are the result of different flow rates (and thereby concentrations) associated with the gas calibration systems and zero air supplies used at this station.
Pass-A-Loutre
Precision and accuracy data for the SOZ Analyzer at the PAL station are listed in Tables 4A and 4B and for the NO,, Analyzer in Tables SA and SB, respectively . The calibration performed at this station on 14 July is not included due to incorrect flows in the TECO 146 Gas Calibrator ; however, values obtained after the Calibrator was corrected on 22 July (before the Analyzers were adjusted) are incorporated. If only values measured after the re-calibration are considered, the mean precision error for SOZ reduces to 2.4 with a standard deviation of 2.6 . On 7 September, a partial calibration was performed on the defective NO,, Analyzer before the unit was taken online and repaired . These values are listed in Tables SA and SB but could have been deleted as described under Gosier Island above. Again, if excluded the average precision error and accuracy for the NO,, Analyzer would improve significantly .
4. Data Return
Due in part to the relatively short duration of the field measurement period, virtually all available data from each station is employed for this report . It has been shown that each air quality monitor was subjected to frequent multi-point calibrations with resulting mean precision errors of less than 10%. The minimum requirements for PSD monitoring are determined by many factors including field conditions, the objectives of monitoring, level of quality data needed, expertise of personnel, cost of control procedures, and pollutant concentration levels (40 CFR 58, App. B, 1994). The goal is to provide data of adequate quality to meet the monitoring objectives, and to minimize the loss of air quality data due to malfunctions and out-of-control conditions . Taking into account the operating environments and logistic difficulties, it was not intended that these stations would conform to EPA recommendations for Class I and II PSD Air Monitoring (i .e ., regulatory purposes); rather, they were
14
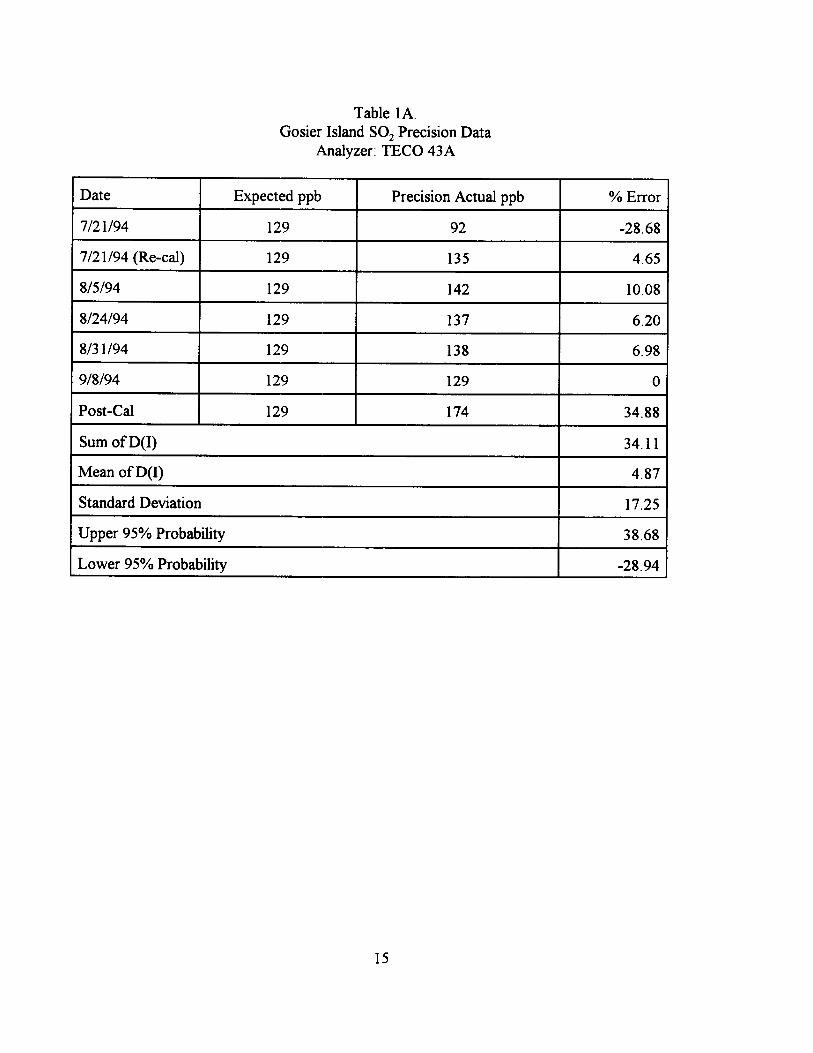
Table IA. Gosier Island SOz Precision Data
Analyzer : TECO 43A
Date Expected ppb Precision Actual ppb % Error
7/21/94 129 92 -28 .68
7/21/94 (Re-cal) 129 135 4 .65
8/5/94 129 142 10.08
8/24/94 129 137 6.20
8/31/94 129 138 6.98
9/8/94 129 129 0
Post-Cal 129 174 34.88
Sum of D(I) 34.11
Mean of D(I) 4.87
Standard Deviation 17 .25
Upper 95% Probability 38 .68
Lower 95% Probability -28.94
15
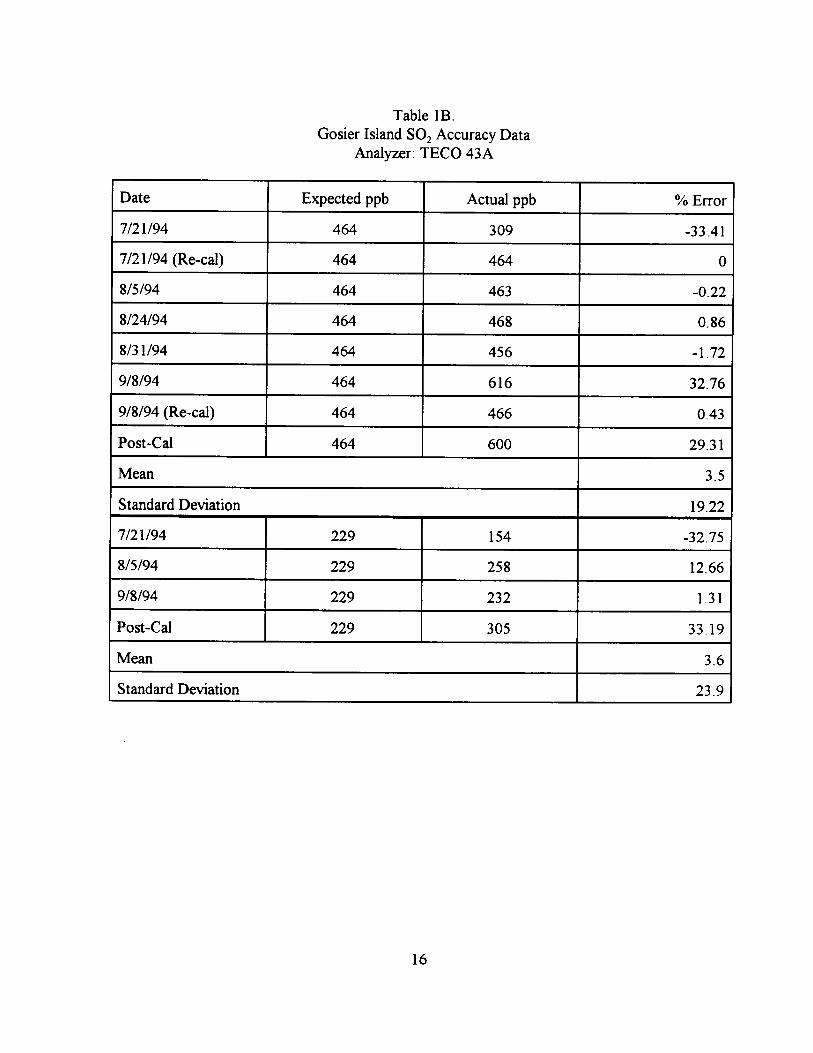
Table 1B . Gosier Island SOZ Accuracy Data
Analyzer : TECO 43A
Date Expected ppb Actual ppb % Error
7/21/94 464 309 -33 .41
7/21/94 (Re-cal) 464 464 0
8/5/94 464 463 -0.22
8/24/94 464 468 0.86
8/31/94 464 456 -1 .72
9/8/94 464 616 32.76
9/8/94 (Re-cal) 464 466 0.43
Post-Cal 464 600 29.31
Mean 3 .5
Standard Deviation 19.22
7/21/94 229 154 -32.75
8/5/94 229 258 12.66
9/8/94 229 232 1 .31
Post-Cal 229 305 33 .19
Mean 3 .6
Standard Deviation 23 .9
16

Table 2A. Breton Island SOZ Precision Data
Analyzer : TECO 43 and 43A
Date Expected ppb Precision Actual ppb % Error
7/7/94 92 92 0
8/6/94 90 88 -2.22
8/23/94 90 110 22.22
8/30/94 90 105 16.67
Sum of D(I) 36.67
Mean of D(I) 9.17
Standard Deviation 10 .49
Upper 95% Probability 29 .73
Lower 95% Probability -11 .39
Table 2B . Breton Island SOz Accuracy Data
Analyzer : TECO 43 and 43A
Date Expected ppb Actual ppb % Error
7/7/94 449 461 2.67
7/27/94' 449 443 -1 .34
8/5/94` 449 360 -19 .82
8/5/94 (Re-cal)" 449 447 -0 .45
8/16/94 450 428 -4.89
8/23/94 450 448 -0.44
8/30/94 450 451 0.22
Mean -3 .44
Standard Deviation 7.01 'Model 43
17
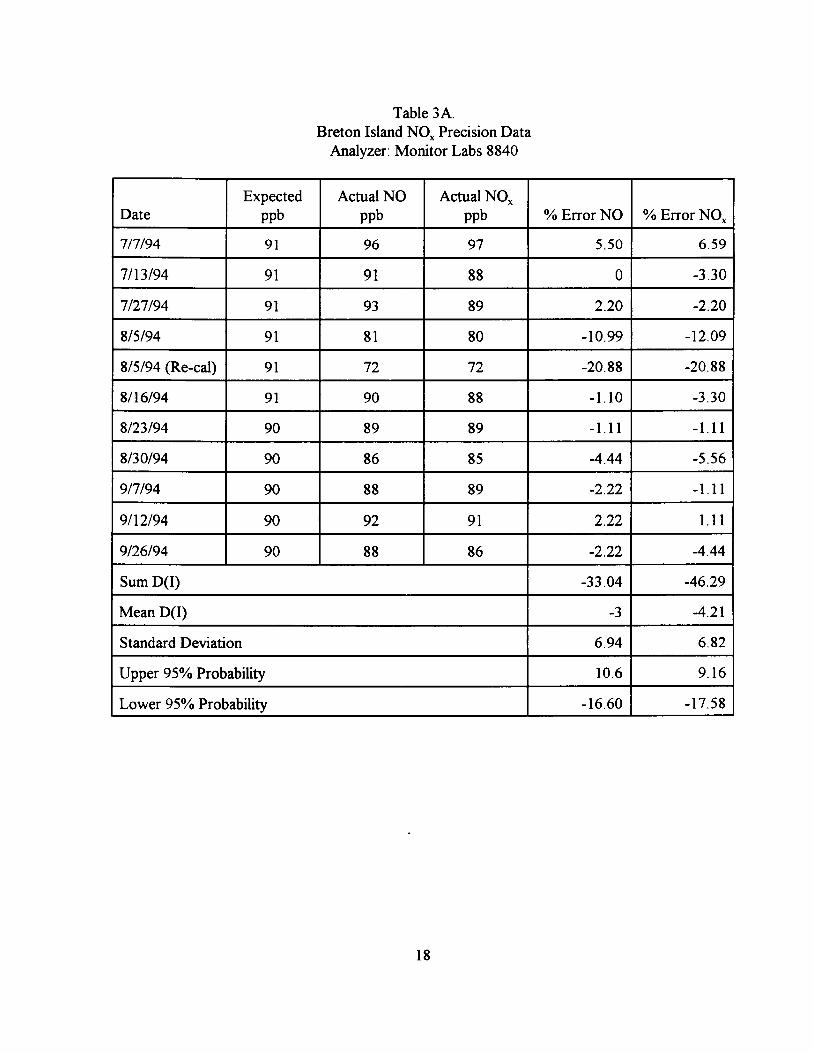
Table 3A. Breton Island NO., Precision Data Analyzer : Monitor Labs 8840
Date Expected
ppb Actual NO
ppb Actual NOX
ppb % Error NO % Error NO,
7/7/94 91 96 97 5 .50 6.59
7/13/94 91 91 88 0 -3 .30
7/27/94 91 93 89 2.20 -2.20
8/5/94 91 81 80 -10.99 -12 .09
8/5/94 (Re-cal) 91 72 72 -20.88 -20 .88
8/16/94 91 90 88 -1 .10 -3 .30
8/23/94 90 89 89 -1 .11 -1 .11
8/30/94 90 86 85 -4.44 -5 .56
9/7/94 90 88 89 -2.22 -1 .11
9/12/94 90 92 91 2 .22 1 .11
9/26/94 90 88 86 -2 .22 -4.44
Sum D(I) -33 .04 -46.29
Mean D(I) -3 -4 .21
Standard Deviation 6.94 6 .82
Upper 95% Probability 10.6 9 .16
Lower 95% Probability -16.60 -17 .58
18

Table 3A Continued
Date Expected ppb Actual NOZ ppb % Error
7/7/94 79 80 1 .27
7/13/94 82 83 1 .22
7/27/94 64 65 1 .56
8/16/94 119 127 6.72
8/23/94 103 128 24.27
8/30/94 119 139 16.81
9/7/94 126 139 10.32
9/12/94 126 126 0
9/26/94 113 137 21 .24
Sum D(I) 83 .41
Mean D(I) 9.27
Standard Deviation 8.86
Upper 95% Probability 26.64
Lower 95% Probability -8.10
19
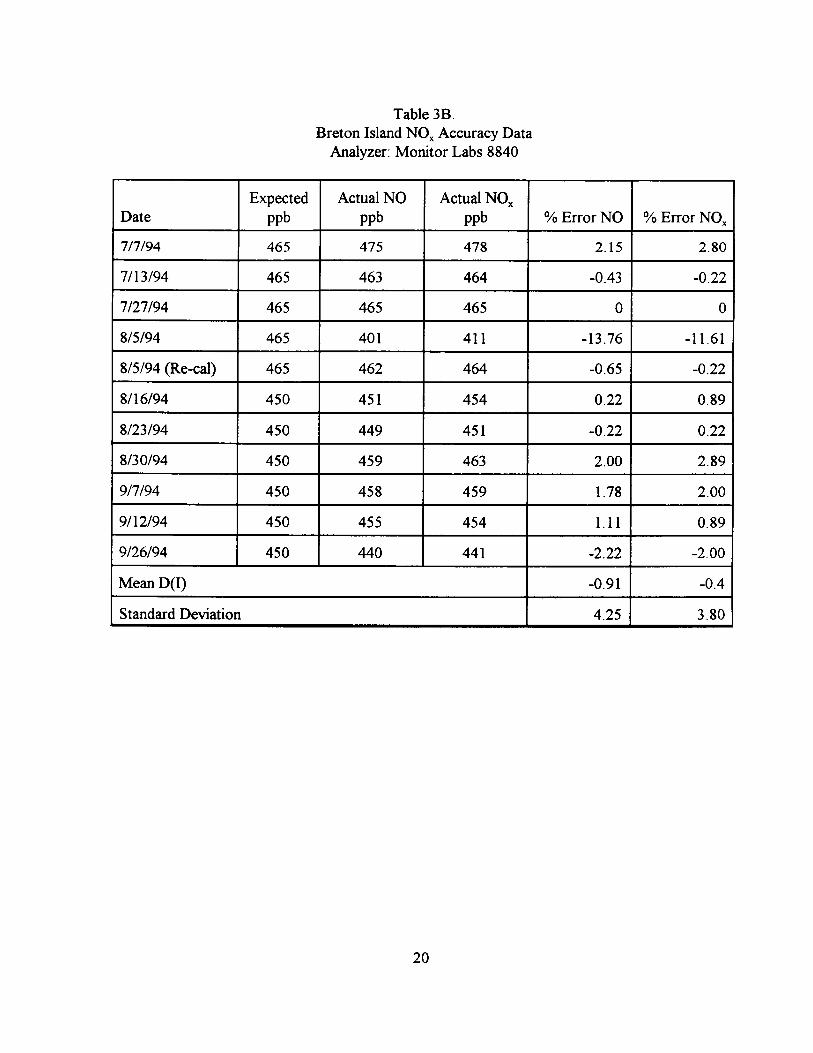
Table 3B. Breton Island NO. Accuracy Data
Analyzer : Monitor Labs 8840
Date Expected
ppb Actual NO
ppb Actual NOX
ppb % Error NO % Error NO,,
7/7/94 465 475 478 2.15 2.80
7/13/94 465 463 464 -0.43 -0.22
7/27/94 465 465 465 0 0
8/5/94 465 401 411 -13 .76 -11 .61
8/5/94 (Re-cal) 465 462 464 -0.65 -0.22
8/16/94 450 451 454 0.22 0.89
8/23/94 450 449 451 -0 .22 0.22
8/30/94 450 459 463 2.00 2 .89
9/7/94 450 458 459 1 .78 2 .00
9/12/94 450 455 454 1 .11 0.89
9/26/94 450 440 441 -2.22 -2.00
Mean D(I) -0.91 -0.4
Standard Deviation 4.25 3 .80
20

Table 3B Continued
Date Expected ppb Actual NOZ ppb % Error N02
7/7/94 265 268 1 .13
7/13/94 387 385 -0.52
7/13/94 (Re-cal) 350 353 0.86
8/16/94 328 350 6.71
8/23/94 340 363 6.77
8/30/94 340 362 6.47
9/7/94 357 374 4.76
9/12/94 372 378 1 .61
9/26/94 346 364 5.20
Mean D(I) 3 .67
Standard Deviation 2.72
21

Table 4A. Pass-A-Loutre SOZ Precision Data
Analyzer : TECO 43A
Date Expected ppb Precision Actual ppb % Error
7/l/94 91 91 0
7/22/94 85 47 -44.71
7/22/94 (Re-cal) 85 86 1 .18
7/26/94 85 83 -2 .35
8/4/94 85 84 -1 .18
8/11/94 85 87 2.35
8/16/94 85 87 2.35
8/23/94 85 88 3 .53
8/30/94 85 89 4.71
9/7/94 85 89 4.71
9/12/94 85 90 5 .88
Sum D(I) -23 .53
Mean D(I) -2.14
Standard Deviation 13 .68
Upper 95% Probability 24.67
Lower 95% Probability -28 .95
22

Table 4B. Pass-A-Loutre SOZ Accuracy Data.
Analyzer : TECO 43A
Date Expected ppb Actual ppb % Error
7/1/94 452 455 0.66
7/22/94 427 244 -42 .86
7/22/94 (Re-cal) 427 428 0.23
7/26/94 427 422 -1 .17
8/4/94 427 426 -0.23
8/11/94 427 435 1 .87
8/16/94 427 435 1 .87
8/23/94 427 434 1 .64
8/30/94 427 439 2.81
9/7/94 427 440 3 .04
9/12/94 427 450 5.39
Mean D(I) -2.43
Standard Deviation ~ 12.90
23

Table SA. Pass-A-Loutre NOX Precison Data
Analyzer : TECO 42
Date Expected
ppb Actual NO
ppb Actual NO,,
ppb % Error NO % Error NO,,
7/22/94 85 70 69 -17.65 -18.82
7/22/94 (Re-cal) 94 96 97 2.13 3 .19
7/26/94 85 87 87 2.35 2.35
8/4/94 94 90 90 -4.26 -4.26
8/11/94 94 80 79 -14.89 -15 .96
8/11/94 (Re-cal) 94 90 91 -4.26 -3 .19
8/16/94 94 95 95 1 .06 1 .06
8/23/94 94 84 84 -10.64 -10.64
8/23/94 (Re-cal) 94 95 95 1 .06 1 .06
8/30/94 94 92 92 -2.13 -2.13
9/7/94 94 46 46 -51 .06 -51 .06
9/7/94 (Re-cal) 94 97 97 3 .19 3 .19
9/12/94 94 89 89 -5 .32 -5 .32
Sum D(I) -100.42 -100.53
Mean D(I) -7.73 -7.73
Standard Deviation 14.06 14.25
Upper 95% Probability 19.83 20.20
Lower 95% Probability -35 .29 -35 .66
24

Table SA Continued
Date Expected ppb Actual NOZ ppb % Error N02
7/22/94 73 63 -13 .70
7/22/94 (Re-cal) 89 94 5.62
7/26/94 90 87 -3 .33
8/4/94 97 92 -5 .16
8/11/94 99 98 -1 .01
8/16/94 97 96 -1 .03
8/23/94 98 98 0
8/30/94 92 92 0
9/12/94 92 93 1 .09
Sum D(I) -17.52
Mean D(I) -1 .95
Standard Deviation 5 .01
Upper 95% Probability 7.87
Lower 95% Probability ~ -11 .77
25

Table SB . Pass-A-Loutre NO,, Accuracy Data
Analyzer : TECO 42
Date Expected
ppb Actual NO
ppb Actual NOX
ppb % Error NO % Error NOX
7/22/94 454 336 329 -25 .99 -27 .53
7/22/94 (Re-cal) 454 452 451 -0.44 -0 .66
7/26/94 454 420 421 -7.49 -7.27
8/4/94 454 433 431 -4.63 -5 .07
8/11/94 454 407 404 -10.35 -11 .01
8/11/94 (Re-cal) 454 446 448 -1 .76 -1 .32
8/16/94 454 451 452 -0 .66 -0.44
8/23/94 454 398 398 -12 .34 -12.34
8/23/94 (Re-cal) 454 453 455 -0.22 0.22
8/30/94 454 427 429 -5.95 -5 .51
9/7/94 454 293 293 -35 .46 -35 .46
9/7/94 (Re-cal) 454 453 453 -0.22 -0 .22
9/12/94 454 i 422 T 424 -7.05 -6.61
Mean D(I) -8 .66 -8 .71
Standard Deviation 10 .32 10 .59
26
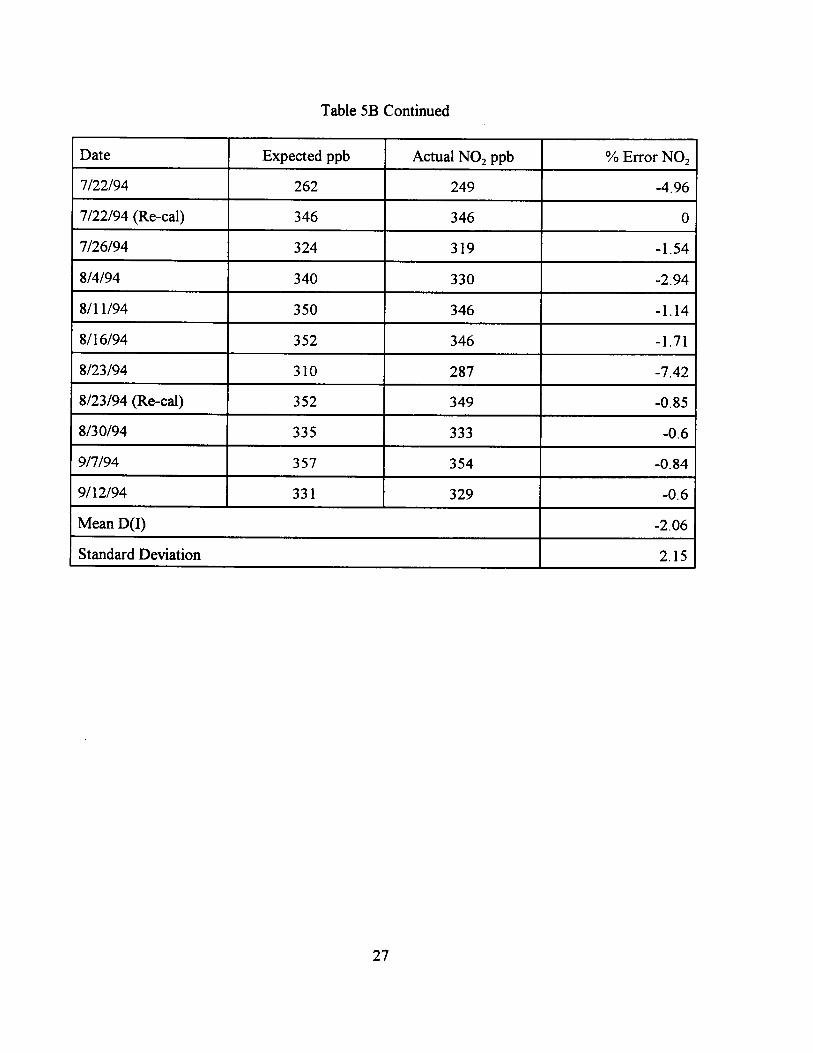
Table SB Continued
Date Expected ppb Actual NO, ppb % Error NO,
7/22/94 262 249 -4.96
7/22/94 (Re-cal) 346 346 0
7/26/94 324 319 -1 .54
8/4/94 340 330 -2 .94
8/11/94 350 346 -1 .14
8/16/94 352 346 -1 .71
8/23/94 310 287 -7.42
8/23/94 (Re-cal) 352 349 -0.85
8/30/94 335 333 -0.6
9/7/94 357 354 -0.84
9/12/94 331 329 -0.6
Mean D(I) -2.06
Standard Deviation 2 .15
27

designed for scientific purposes (to obtain a quantitative first-look at the pollutant levels existing over these areas and the meteorological conditions which could affect those levels) . With this in mind, and considering that the monitors were generally well calibrated, the air quality data is presented as recorded with the only adjustment being the removal of zero offsets.
Hourly values of wind speed and direction were derived through a vector average for all hours reporting six or more 5-minute measurements . Other meteorological parameters not reported hourly and all air quality data were reduced by arithmetic average. Average concentrations less than zero were considered non-detect and reported as zero assuming the analyzer was operating nominally . In other words, if negative values were recorded during a period between two acceptable calibrations, those measurements were considered valid and retained as 0 ppb. Over time, cumulative zero drifts of 20 to 30 ppb and span drifts of 20 - 25% of full scale may be observed before the analyzer should be adjusted and re-calibrated (EPA, 1979).
Table 6 lists the percentage of hourly data return for measured parameters at each station (note that NOZ implies NO and NO,,). Values represent percentage of possible record, not month. Computed hourly values are presented graphically for Gosier Island in Figs . 3a - 3m, for Breton Island in Figs . 4a - 4u, and for Pass-A-Loutre in Figs . Sa - Saa. Numerical values are listed in Appendices A - C. Interpretation of the data is provided in the Results and Discussion Section.
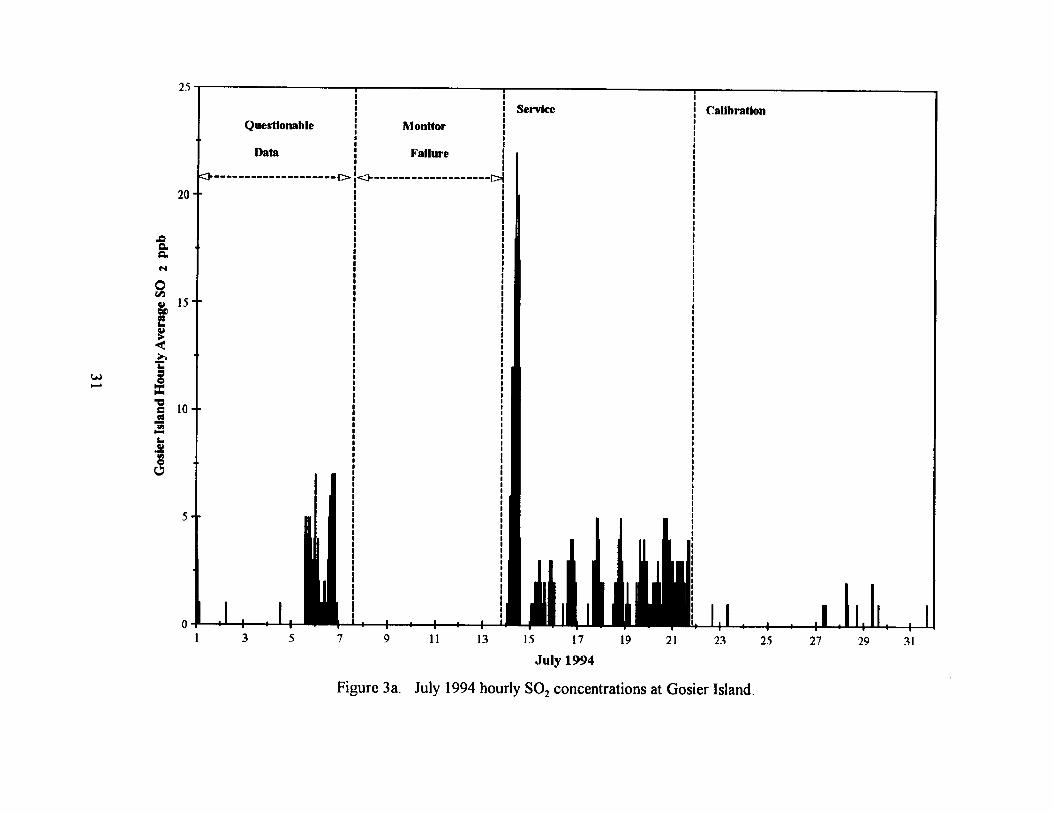
It can be seen in the figures that parts of the air quality records have been designated as "Questionable", due primarily to lack of successful monitor calibration or related equipment failures as described previously . In the Gosier SOZ record, July 1 - 7 is suspect since no span calibration was performed on installation and the Analyzer subsequently failed (Fig . 3a). Large negative values were recorded during 12 - 24 August (Fig . 3b), however good calibrations were obtained on 5 and 24 August . It should be noted that, at an undetermined point before the end of the Gosier SOZ record, battery power levels had become insufficient to run to air quality monitor (Fig . 3c).
Both SOz and NO. data have been removed from the Breton Island air quality record during the period of 7 - 14 July due to an unexplained lack of response from the monitors (Figs. 4a, d, g, and j) . In Figure 4c, failure of the SOZ Analyzer caused hourly measurements to go negative after 2 September.
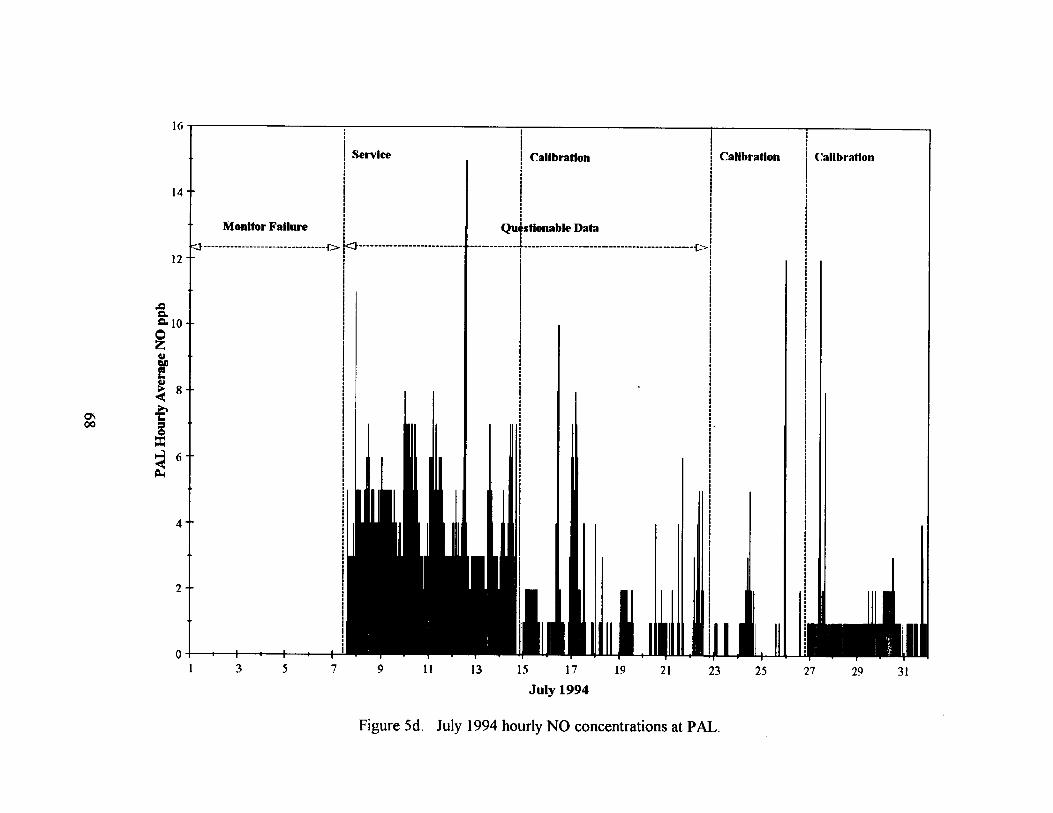
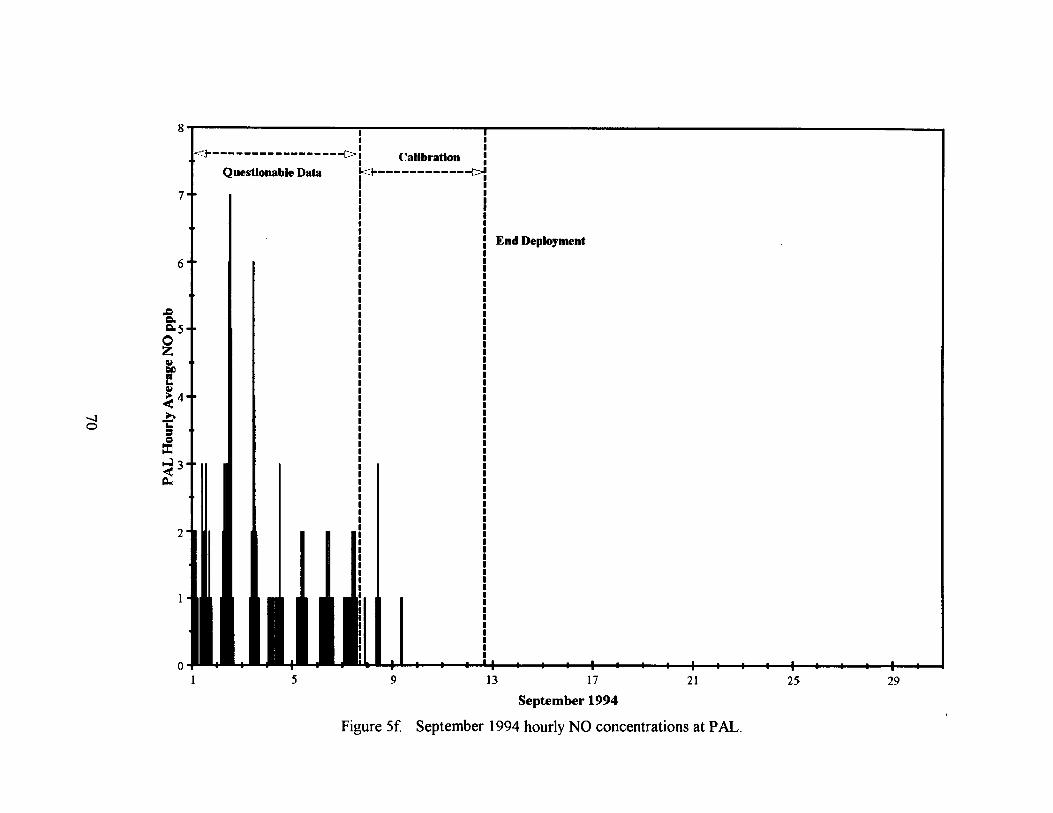
Calibration of the air quality monitors at Pass-A-Loutre was performed on 14 July even though it was suspected that the Gas Calibrator was out of specifications. This was confirmed on 22 July, at which point the Calibrator was corrected and the air quality monitors brought back into line (see Calibrations) . In addition, no span calibration was conducted on the NO,, Analyzer when installed on 7 July . Figures Sa, d, g, and j illustrate these events . As shown in Figs . Sf, i, and 1, the pump in the NO. Analyzer began failing before being repaired on 7 September; however NO. data appears consistent throughout the period of 30 August to 7 September.
28

Table 6. Percentage Data Return
Month Air
Temp . Press . Relative Humidity
Wind Speed
Wind Direct . SOZ NOZ
Gosier Island
July 99.9 NM NM 73 .8 99.6 79.4 NM
Aug 99.3 NM NM 99.3 99 .3 98.4 NM
Sept 100 NM NM 100 100 99.7 NM
Breton Island
July 97.3 97.3 97 .3 NM NM 34.3 77 .6
Aug 96.4 96 .4 96.4 NM NM 85 .6 85.6
Sept 99 99 99 NM NM 6 .6 98.7
Pass-A-Loutre
July 97.5 97.5 97.5 97.9 97 .9 97.9 78 .7
Aug 97.6 97.6 97.6 98 .3 98 .3 98 98
Sept 97.5 97.5 97.5 97 .9 97.9 97.9 97 .9 NM - Not Measured
29

5. Radiosondes
The final component of the field measurement program consisted of atmospheric profiles obtained at each station throughout the deployment period . Table 7 denotes the date, time, and location of each launch . The majority of launches were scheduled to coincide with 00 and 12 GMT (standard National Weather Service launch times) . Those remaining were launched in the local afternoon hours to investigate the variation of the mixing heights.
Sensor packages used were A.I.R., Inc. Model AS-3A-403 Airsondes carved aloft on 200 gm balloons . The Airsonde measures air temperature via bead thermistor, relative humidity by carbon hygristor, and barometric pressure with an electronic aneroid capacitance pressure sensor mounted internally on the circuit board. Data is sampled and transmitted every 5 - 6 seconds. An A.I .R ., Inc. Atmospheric Data Acquisition System (ADAS) was employed to receive and interpret the transmitted signal .
Prior to launch, surface temperatures (dry- and wet-bulb) were measured with an electric psychrometer, and station pressure with both an aneroid and digital barometer. Other conditions (wind speed and direction, cloud cover, etc.) were estimated by the observer .
Table 7. Radiosonde Launch Information
Profile Location Date/Time Local Date/Time GMT
STA1RS01 Gosier Island 8/24/94 1216CDT 8/24/94 1716GMT
STA2RS01 Breton Island 8/5/94 1558CDT 8/5/94 2058GMT
STA2RS02 Breton Island 8/16/94 1900CDT 8/17/94 OOOOGMT
STA2RS03 Breton Island 8/17/94 0631CDT 8/17/94 1131GMT
STA2RS04 Breton Island 8/23/94 1902CDT 8/24/94 0002GMT
STA2RS05 Breton Island 8/24/94 0706CDT 8/24/94 1206GMT
STA2RS06 Breton Island 8/30/94 1905CDT 8/31/94 OOOSGMT
STA2RS07 Breton Island 8/31/94 0703CDT 8/31/94 1203GMT
STA2RS08 Breton Island 9/7/94 1930CDT 9/8/94 0030GMT
STA2RS09 Breton Island 9/8/94 0701 CDT 9/8/94 1201 GMT
STA3RS01 PAL 8/4/94 1900CDT 8/5/94 OOOOGMT
STA3RS02 PAL 9/7/941304CDT 9/7/941804GMT
30
w
2
20
a a N
15
Z 0 x C 10
C7
5
0
Questionable ~ Monitor
Data ; Failure
----------------~r --------------------
1 1 1
1 1
Service Calibration
I I I
1
1 3 5 7 9 11 13 15 17 19 21 23 25 27 29 31
July 1994
Figure 3a . July 1994 hourly SOZ concentrations at Gosier Island .
1.2
1 .0
.0 0.8 a a N
Z ~0 0.6
w N
L 91
0.4
0.2
0.0
Calibration ~ Service Calibration
i -------------------
1 1 1 1
1 1
1 1
1 1
1 1
1 1
1 1
1 I 1
1 1 1 1 1 1
1 1
1 1
1 1
Questionable ~ Questionable i
1 1 I
Data ~ Data ~ i 4-----------E~ - ------------------- ~ 1
1 1
1 1
1 1 1
1 1
1 1
1 1 1
i
i
13 15 17 19 21 23 25 27 29 31
August 1994 Figure 3b . August 1994 hourly SOZ concentrations at Gosier Island .

1 .2
1 .0
,0 0.8 4 a N
L
0 6 .
C
0 4 .
0.2
0.0
~ Calibration ; End i Deployment
i
i i
i 1
1 1 1 1 1 1 1
i 1 1 1 1 1 I 1 1
i i
i
i i
5 9 13 17 21 25 29
September 1994 Figure 3c . September 1994 hourly SOZ concentrations at Gosier Island .

20
15
b
¢, 10
.y
5 Anemometer Damaged v . . . . . . . . . . . . . . . . . . . . . . . . . . . . . . . . . . . . v
0 20
w
1$
a 10
0 0 N -r 5
0
1 3 5 7 9 11 13 15 17 19 21 23 25 27 29 31
July 1994
Figure 3d . July 1994 hourly wind speeds at Gosier Island and NOAA buoy 42007 .

16
w
12
E
g c~.
.N
4
0 16
a.
0 0 N `r 4
12
0 F i T~TS
i FTtl r F~ 1 SI1 -i-1 -F1 1 i'~ i 1 F-1 I +- 1F-T-1
1 3 5 7 9 11 13 15 17 19 21 23 25 27 29 31
August 1994
Figure 3e . August 1994 hourly wind speeds at Gosier Island and NOAH buoy 42007.
16
12
a.
. N
0 t7 4
0 16
w
12 V1
G
N
a.
0 0 N ,,1' 4
End
Deployment
0 ' 1 5 9 13 17 21 25
September 1994
Figure 3f. September 1994 hourly wind speeds at Gosier Island and NOAA buoy 4200'7 .
29
W J
360
315
270 c -o
225
A 180
' 135 a
90
45
0
360
315
270 c 0 '~ 225
A 180
135
90
45
0
Figure 3g. July 1994 hourly wind directions from Gosier Island and NOAH buoy 42007 .
1 3 5 7 9 11 13 15 17 19 21 23 25 27 29 31
July 1994

w 00
360
315
270 0
225
180
0 135 C7
90
45
0 360
315
270 0
225 a ~1 180
c135
90
45
0 1 3 5 7 9 11 13 15 17 19 21 23 25 27 29 31
August 1994
Figure 3h. Aujust 1994 hourly wind directions from Gosier Island and NOAA buoy 42007.

360
315
270 o
225 a
180 L..
0 135
90
45
0
360 w 110 315
270 c 0
225 a (.~ 180
a 135 v
90
45
0
End
Deployment
1 5 9 13 17 21 25 29
September 1994
Figure 3i . September 1994 hourly wind direction at Gosier Island and NOAH buoy 42007 .

32
30
U O ,� 28
E-' a~ 'a 26 c7
24
22 32
.A 0 30
U ° 28 ,, H
° 0 26 N
24
22 1 3 5 7 9 11 13 15 17 19 21 23 25 27 29 31
July 1994
Figure 3j . July 1994 hourly air temperatures at Gosier Island and NOAH buoy 42007 :

32
30
a 28 w
E- " ~. ~ 26 0 C7
24
22 32
30
U ° . Zs E-' o
`6 N
24
1 3 5 7 9 11 13 15 17 19 21 23 25 27 29 31
August 1994
Figure 3k . August 199 hourly air temperatures at Gosier Island and NOAH buoy 42007.
31
29
U 27 0 V
H 25 V
.N
0 23
21
19 31
.A N
29
U 27 0
V
F" 25 0 0 v 23
21
19
End
Deployment
1 5 9 13 17 21 25
September 1994
Figure 31 . September 1994 hourly air temperatures at Gosie: Island and NOAA buoy 42007.
29

w
38 v 36 ° 34 c. E 32 F' 30 -o 0 28 a' 26
24 9.0
8.5 x a.
8.0
7.5
14 12 10
~ 8 6 ~
`n 4
0
End Data Record
End Data Record
End Data Record
Invalid Data 4 . . . . . . . . . . . . . . . . . . . . . . . . . . . . . . . . . . . . . . . . . . . . . . . .~
1 3 5 7 9 11 13 15 17 19 21 23 25 27 29
July 1994
31
Figure 3m. July 1994 hourly pond data Gosier Island (see text for explanation) .

13
12
11
10
a 9 N 0
as g
d' 7 a.
6
C R 5
C O
4
i i Calibration i
i
i
i i i i
i i i 1
Questionable
i Data -----'
i i i i i i
i 1
-----Dj
Calibration
1 i
Monitor Failure 11 C-------------------------------------{~i
1
1 1
1 1
Calibration
11 13 15 17 19 21 23
July 1994 25 27 29 31
Figure 4a . July 1994 hourly SOZ concentrations at Breton Island .

55
SO
45
J2 40
a
~ 35
ao
30
~+°,~ 25
C R
~ 20
15
10
5
i Calibration ~ Calibration ~ Calibration ------------------- ==' i i i
1 I 1 1
I 1 j j
Powcr Lost
i i
i
1 3 5 7 9 11 13 15 17 19 21 23 25 27 29 31
August 1994
Figure 4b . August 1994 hourly SOz concentrations at Breton Island . 1
0
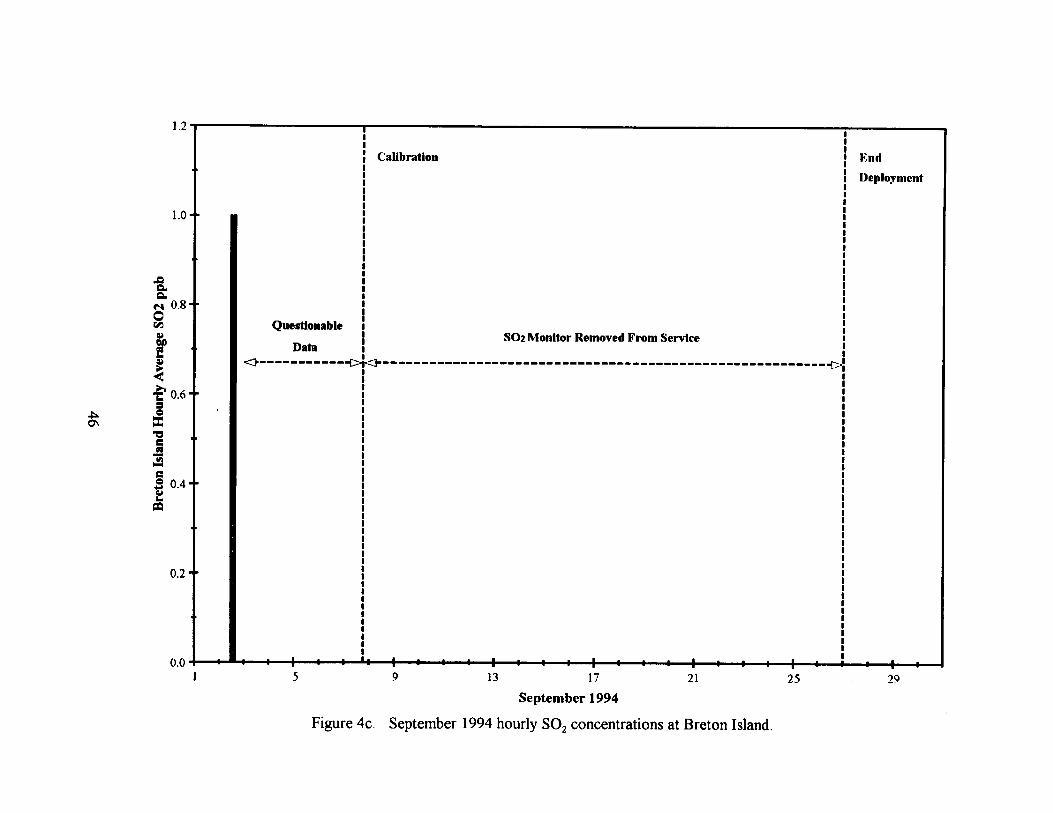
1 .2
1 .0
a a e~ 0.8 O
el~
Q 0.6
0
w
c 0.4
0.2
0.0
i i
Calibration
i i i 1 1 1 1 1 1 1 1 1 1 1
i
Questionable i 302 Monitor Removed From Service
Data i ~------------di< ------------------------------------------
i i
I I 1
1 1
1 1 1 1
i i i i
i i
i
i i
i i i i
N;nd
Deployment
13 17 21
September 1994 25 29
Figure 4c . September 1994 hourly SOZ concentrations at Breton Island .
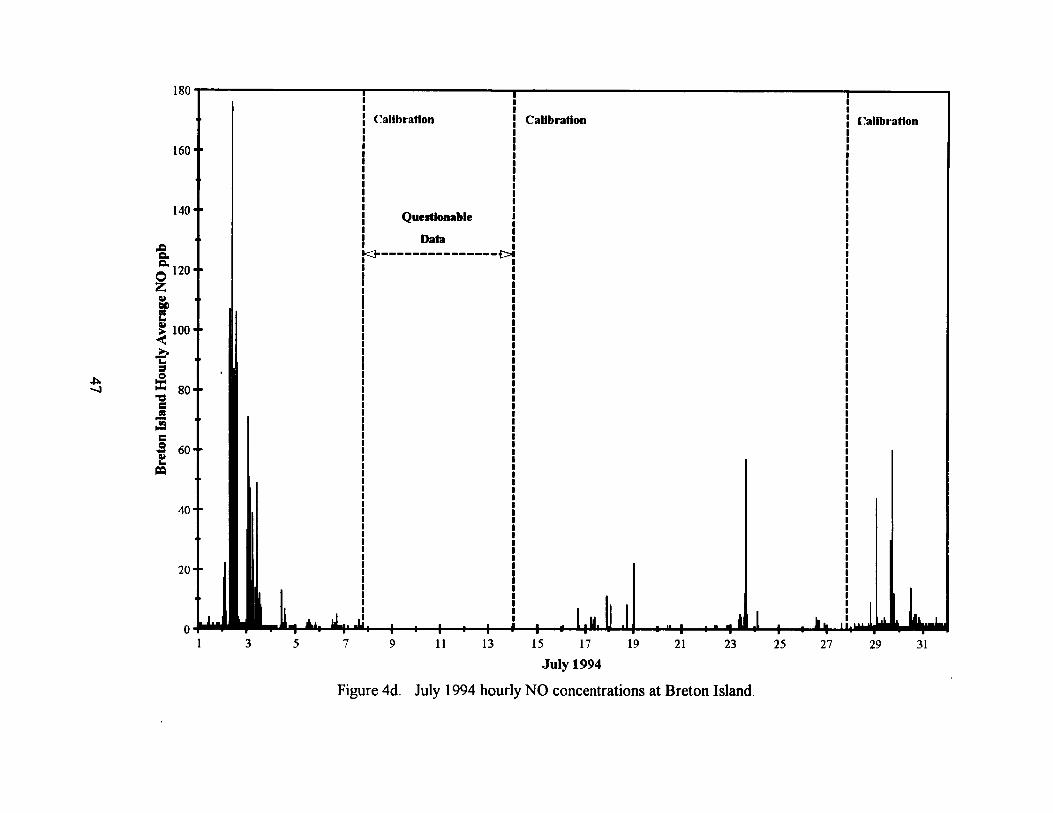
11
180 i
Calibration ~ Calibration i
i i i i
Questionable
Data
160
K~---------------f~
i
140
0. 120
z
a Loo
t A so C
C 60
PQ
Calibration
40
20
0~ 1 3 5 7 9 11 13 15 17 19 21 23 25 27 29 31
July 1994
Figure 4d. July 1994 hourly NO concentrations at Breton Island .
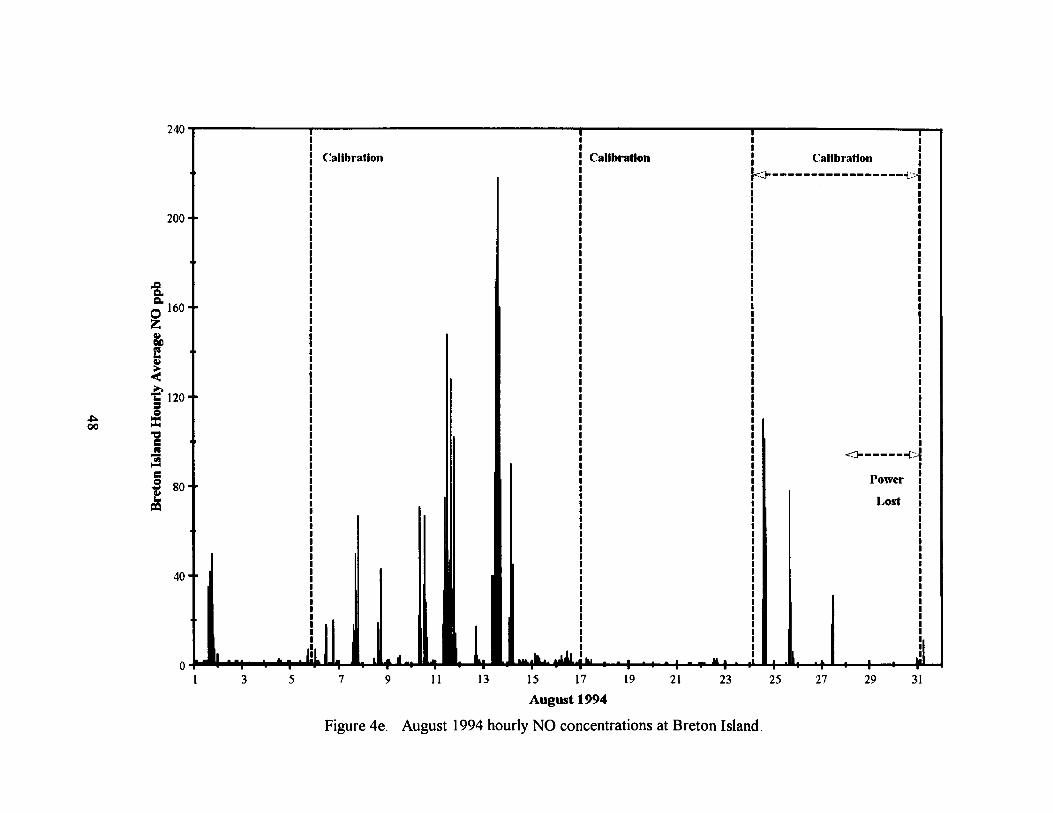
00
240
200
a 0 160 z
120 x C r
80
40
0
Calibration Calibration Calibration ------------------{=i
i i i
i
i i i i
1 1 ~----
Power
i Lost i
i
i
1 3 5 7 9 11 13 15 17 19 21 23
August 1994
25 27 29 31
Figure 4e . August 1994 hourly NO concentrations at Breton Island .

250
200
a a
°z ~ 150
0 0 x too
c 0 .+
PQ
50
i Calibration Calibration I End
i Deployment i i i i
i i
i
i
i
i i i i i i
i i
i i
5 9 13 17 21
September 1994 25 29
Figure 4f. September 1994 hourly NO concentrations at Breton Island .

0
60
50
a O40
N
-~, 30
x C r
0 20 L
10
Calibration i
---------------
i i i i
Questionable
i Data
K-----------------C, I I 1 1 1 1 1
i
i 1
1 1 I 1
1
1 3 5 7 9 11 13 15 17 19 21 23 25 27
July 1994
Figure 4g . July 1994 hourly NOZ concentrations at Breton Island .
i i
Calibration
"--------------------L~
i i i i
i i i I 1
1 I 1 1
29 31

50
40
to. a N 0 z ~ 30
d
Z
`" x zo
Q 0 L
10
Figure 4h . August 1994 hourly NOz concentrations at Breton Island .
1 3 5 7 9 11 13 15 17 19 21 23 25 27 29 31
August 1994
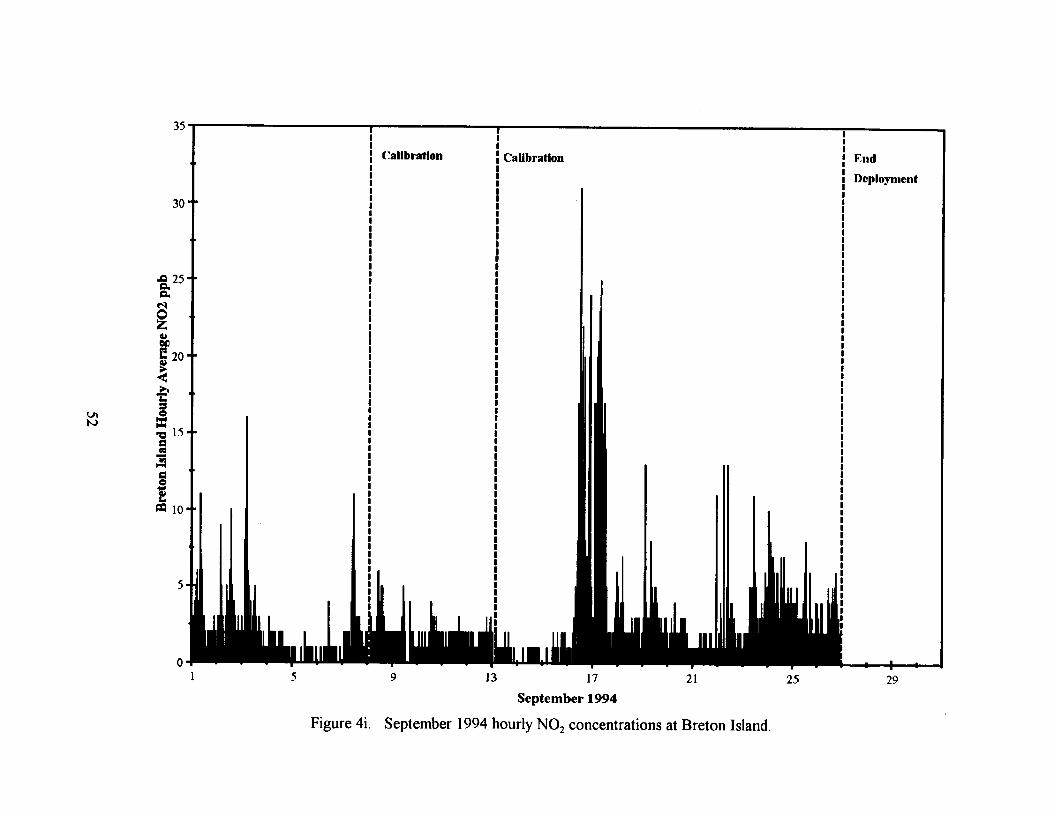
N
35
30
a 25 a N
d OA 20
D
W p I S C
O
10
Calibration ; CaUbration ~ End
i Deployment
i i i
i
i i i I I
t 1
1 1
1 1
1 1
1 1 1
1 1 1 I 1 1 1
1 1
1 1
1 1
1 1 1 1 1 1 1
1 1 I
1 1
I 1 1 1 1 1 1 1 1 1
1 1
1 1 1 1
1 1
1 1
1 1
1 1
1 1
1 1 1 t
13 17 21 25 29 September 1994
Figure 4i . September 1994 hourly NOZ concentrations at Breton Island .
W
225
200
175
.a a a O 150
z
its
4 100
.ry FH
75 V
50
25
0
i ~ Calibration
1 I i i
Questionable i
Data
---------------- 1--4
i
1 1
1 1 1 1
I 1
Calibration Calibration
1 3 5 7 9 11 13 15 17 19 21 23 25 27 29 31
July 1994
Figure 4j . July 1994 hourly NO,, concentrations at Breton Island .

.A
275
250
225
200 a a N
z ins ea
a 150
41
x izs 9 C R
100
75
50
zs
Calibration ~ Calibration ~ Calibration '
--=~---------------------------------i==~~
I I
I I
I i
j I
i s =
I
4.______-_____{?' i i
i i Power I
~ ! Lost ' i
i
i 's I 16u W :
1 3 5 7 9 11 13 15 17 19 21 23 25 27 29 31
August 1994
Figure 4k . August 1994 hourly NO,, concentrations at Breton Island .
0
300
250
a a a 200
z
150 0 x C R
C 100
L
50
0
i Calibration i Calibration ~ End
i i Deployment
i i i
i i
i
1 1 1 1
1
1
1 1 1 1
1 1 1 1
1 1 1
1 1 1 1
1 1
1 1
1 1
1 1
i
i
1 5 9 13 17 21 25
September 1994
Figure 41 . September 1994 hourly NO,, concentrations at Breton Island .
29
32
30
U 28
.5 m
E-' c
6 2
24
22
32
30
U ° ,. 28 E-
0 26 N
24
22 ' 1 3 5 7 9 11 13 15 17 19 21 23 25 27 29 31
July 1994
Figure 4m. July 1994 hourly air temperatures from Breton Island and NOAA buoy 42007 .
v
32
30
U 28 0
26 0 +. as 24
22
20 32
30
U 28 0
'" 26 c 0
24
1 3 5 7 9 11 13 15 17 19 21 23 25 27 29 31
August 1994
Figure 4n . August 1994 hourly air temperatures from Breton Island and NOAH buoy 42007.
22
20

32
30
- 28 U 0 ~ 26
E-'
24 A
22
18 32
20
00 3 0
28 U 0 ~ 26 H 0 24 N
22
ZO
18 1 5 9 13 17 21 25 29
September 1994
Figure 40 . September 1994 hourly air temperatures from Breton Island and NOAA buoy 42007.
1026
1024
1022
1020 y H
1018 c
1016
1014
1012
1010 1026
1024
1022
1020 V1 y
iols 0 1016 0 N
1014
1012
1010 1 3 5 7 9 11 13 15 17 19 21 23 25 27 29 31
July 1994
Figure 4p. July 1994 hourly atmospheric pressure from Breton Island and NOA~1 buoy 42007.

0
1024
1022
1020
1018 N H
1016 a 1014
1012
1010
1008 1024
1022
_0 1020
1018
. 1016 a 0 1014 0 C1a
1012
1010
1008
1 3 5 7 9 11 13 15 17 19 21 23 25 27 29 31
August 1994
Figure 4q . Aajust 1994 hourly atmospheric pressure from Breton Island and NOAH buoy 42007.

1024
1022
1020
1018 y
1016 a 0 1014
1012
1010
1008 1024
1022
1020
1018 lA
1016 a 0 1014 C1a
1012
1010
1008 1 5 9 13 17 21 25 29
September 1994
Figure 4r . September 1994 hourly atmospheric pressure from Breton Island and ?VTOAA buoy 42007.

100
90
80 E x .~,
N 70 O
Y
Lr M W
60
50 1 3 5 7 9 11 13 15 17 19 21 23 25 27 29 31
July 1994
Figure 4s . July 1994 hourly relative humidity from Breton Island .
100
90
0
80
x
W o 70 it M W
VO
SO 1
1 3 5 7 9 11 13 15 17 19 21 23 25 27 29 31
Au~ust 1994
Figure 4t . August 1994 hourly relative humidity from Breton Island .
100
90
a 80
x >_ 70
0 r.
60
50
40 9 13 17 21 25 29
September 1994
Figure 4u . September 1994 hourly relative humidity from Breton Island .
a 0.5 N
m
Q 4
.. L
O x a3 a
Calibration ~ Calibration
~C~--------C-~
i
i i
1 1 1 1 1 1
Questionable Data i i
-----------------------
a . . ~ i
11 13 15 17 19 21 23
July 1994 25 27 29 31
Figure Sa . July 1994 hourly SOZ concentrations at PAL.

R
7
6
a 5 N
~'4
0 x
2
1 ! 1
Calibration = ~ Calibration Calibration ~Ct---------- ---- --------------- ---p t ~ t ~ 4--------------------------------fi~~
I I
i
i
I
i
j e 's t
i ~ = s
i
i
1 3 5 7 9 11 13 15 17 19 21 23 25 27 29 31 August 1994
Figure Sb . August 1994 hourly SOZ concentrations at PAL.
0

Calibration -~--------------------fl
End Deployment
0. a . S N 0
00
4
J
x 3
a
13 17 21 25 29
September 1994
Figure Sc . September 1994 hourly SOZ concentrations at PAL.
ON 00
16
14
12
.o a 10
z
4 a.
0 x 6
a
a
Service . Calibration t Calibration Calibration I
i I ~ ! i
Monitor Failure ~ Qu4flonable Data j ~--------------------------------ice ~-------------------------- --------- -------------------- -------------------
i j
i
i
i
i i i
i i I
I I
1 1 3 5 7 9 11 13 15 17 19 21 23 25 27 29 31 July 1994
Figure Sd . July 1994 hourly NO concentrations at PAL.
0
9
8
7
.0 6 a a O
two 5
'C 4 0
a 9 3
2
1
Calibration ~ --------------~~
~ Calibration ~ Calibration ~-------------------t=i ~
i ~ 1 I
i i i
i i
i
i
1 3 5 7 9 11 13 15 17 19 21 23 25 27 29 31
August 1994
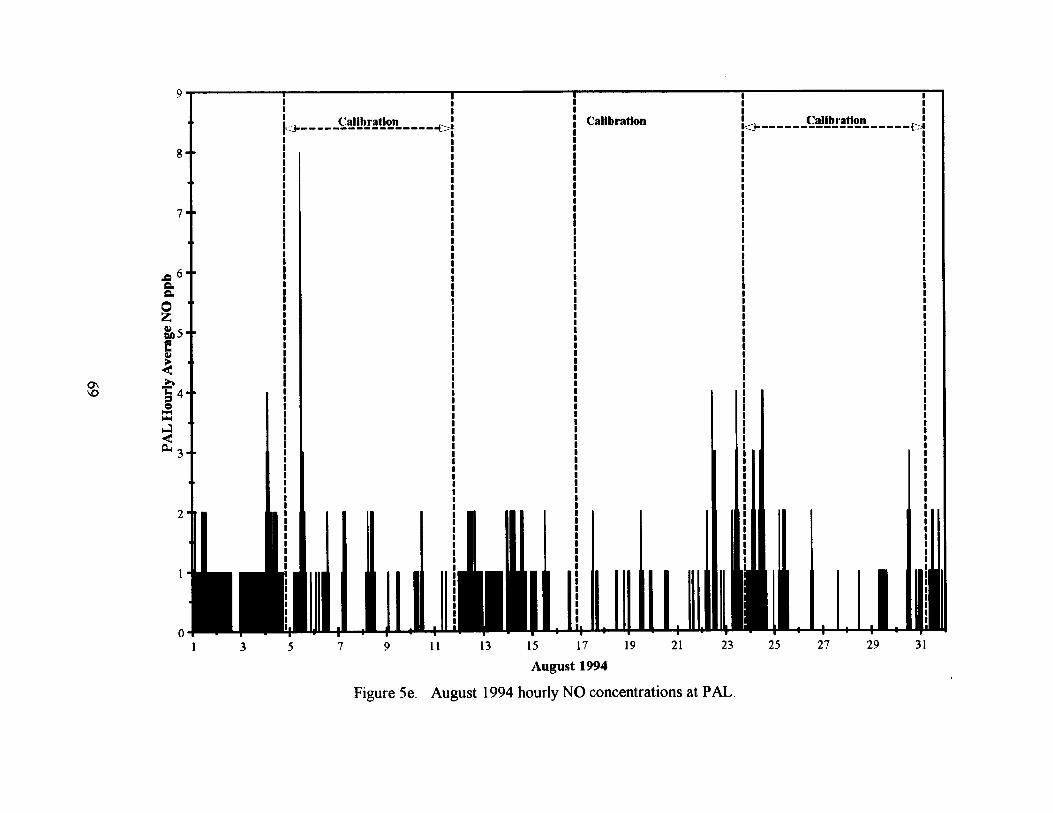
Figure Se . August 1994 hourly NO concentrations at PAL.
0
8 i
----------------C=-~ Calibration Questionable Data -- -------------d
J O
7
6
.a a as
°z
~ 4
7 O x 3 Q
z
0
i
i
i
End Deployment
5 9 13 17 21
September 1994 25 29
Figure Sf. September 1994 hourly NO concentrations at PAL.

v r+
25
20
.a
a
0 15
e°'n
40
Q 0-0 r
10
a
s
of 1
Monitor Failure
--------------------------
i
i i i
Service ~ Calibration ~ Calibration ii
Calibration
i
3 5 7 9 11 13 15 17 19 21 23 25 27 29 31
July 1994
Figure Sg . July 1994 hourly NOZ concentrations at PAL. I
Questionable Data
< ---------------------I-----------------------1 1 1 1 1 I i i

14- i i
12 " 1 1 I 1 1 1 1 1
10-
CL O z 8 ;
6
i
4
i i
2
i
0 1 3 5
Calibration Calibration -----
1 1 1 1 1 1
1 1 1 1 1 1
1 1 1 1 1 1 I 1 1 1
i
I 1
Calibration j-________________-
1 1 1 1 1 1
1 1 1 1 1 1 1 1 1
1 i i i
1
i
i
I I
7 9 11 13 15 17 19 21 23 25 27 29 31
August 1994
Figure Sh . August 1994 hourly NOZ concentrations at PAL.

w
a N
z
a i. .
x a a
15 i ------------------------------------f-4
I
Questionable ! Calibration !
Data = End Deployment
I
i i
t i
i
i
i
i
12
9
6
5 9 13 17 21
September 1994 25 29
Figure Si . September 1994 hourly N02 concentrations at PAL .
36
32
28
~ 24 a a M
20
16
x
a N 12
8
4
1
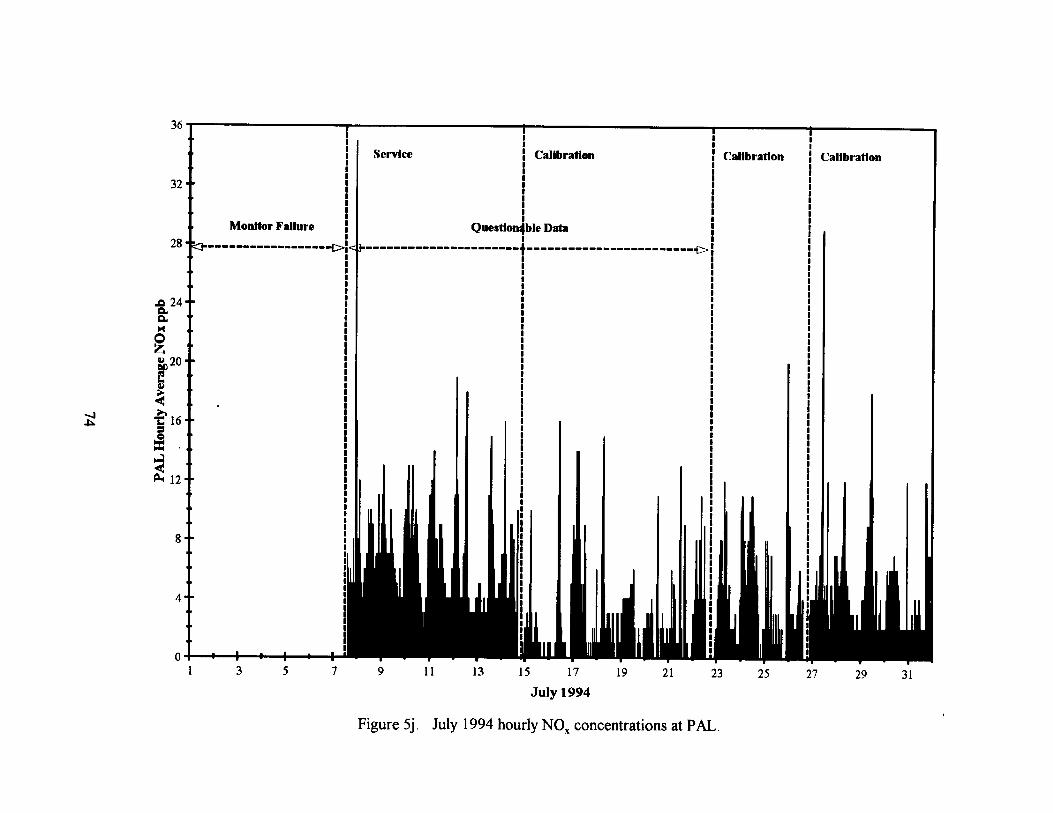
Figure Sj . July 1994 hourly NO. concentrations at PAL.
3 5 7 9 11 13 15 17 19 21 23 25 27 29 31 July 1994

16
12
a. a H O z
dg D O x a
4
0
Figure Sk . August 1994 hourly NO,, concentrations at PAL.
1 3 5 7 9 11 13 15 17 19 21 23 25 27 29 31
August 1994
J
20
Questionable Date
---------------
16 a 1
0. M
IZ z
6
W
a
0
i c ~ Calibration
---~~C------------- 1>i
End Deployment i i
i i
5 9 13 17 21
September 1994 25 29
Figure 51 . September 1994 hourly NO., concentrations at PAL.

16
12
o. 8
.a ¢ 4 a . .
0
16
12
a.
4 J
0
16
12 11- ~. s r..
4 a
0 1 3 5 7 9 11 13 15 17 19 21 23 25 27 29 31
July 1994
Figure gym. July 1994 hourly wind speeds at PAL and NOtL4 stations GDIL1 and BURI.l .

lb
~ 12 "O N G.
4 a
0
16
12 't7
O. H
'~ 4 00
16
12
N o O
L=+ Y
1 3 5 7 9 11 13 15 17 19 21 23 25 27 29 31
August 1994
Fijure Sn . August 1994 hourly wind speeds at PAL and NOAH stations GDIL1 and BURL1 .
-1 1.0
12
10
v 6 fl.
4 a
2
0 12
10
b N
6 n. cr:
4 0
2
0
End Deployment
1 5 9 13 17 21 25 29
September 1994
Figure 5o . September 1994 hourly wind speeds at PAL and NOAH station GDIL1 .

360 315
.0 270 225 180
,~ 135 a 90
45 0
360 315 270 225 180
a 135 o ~ 90
45 0
360 c 315 0
270 .°= 225
130 135 90 45 0
1 3 5 7 9 11 13 15 17 19 21 23 25 27 29 31
July 1994
Figure Sp . July 1994 hourly wind directions at PAL, and NOAA stations GDIL 1 and BURL 1 .
360 315
0 . 270 ~, 225 180 135
a, 90 45 0
360 315 270
U N 225
180 a 135
00 ~ `y
90 45 0
360 c 315 0
270 225 180 135 90 45 0
1 3 5 7 9 11 13 15 17 19 21 23 25 27 29 31
August 1994
Figure Sq . August 1994 hourly wind directions at PAL and NOAH stations GDILland BURL I .
360
315
270
225 U N
180
'¢ 135 a
90
45
0 360
00 315
270 a 0
225 a V
180
Q 135 C7
SO
45
0
End Deployment
1 5 9 13 17 21 25 29
September 1994
Figure Sr . September 1994 hourly wind directions at PAL and NOAA station GDII,1 .
34 32
c~ 3 0 a 28 ~
~ 26 a 24
22 20
34 32
0 30 28 26 a
A 24 00 w 22
20
34 32 30
-~ 28 E Zs Za 22 20
1 3 5 7 9 11 13 15 17 19 21 23 25 27 29 31
July 1994
Fi?ure 5 s. July 1994 hourly air temperatures at PAL and NOA.A stations GDIL 1 and BURL 1 .

34 32
0 30 ~ 28 ~ 26 Q 24 a
22 20
34 32
0 30 28 26
A 24 00 ~ 22
20
34 32
U 30
12 28 -' 26
24 22 20
1 3 5 '7 9 11 13 15 17 19 21 23 25 27 29 31
August 1994
Figure St . August 1994 hourly air temperatures at PAL, and NOAA stations GDIL1 and BIJRLI .

32
30
28 U 0 V
Ha 26
°" 24
22
20 32
00
30
u 28 0
' ~ 26
24
?2
20
End Deployment
1 5 9 13 17 21 25 29
September 1994
Figure 5u . September 1994 hourly air temperatures at PAL and NOAA station GDIL1 .
1028
102 1022
1019 1016
a 1013
00
1010
1028 1025
y 1022 1019 1016
1013 1010
1028 1025 1022
1019 1016 1013
rIn 1010
w
1 3 5 7 9 11 13 15 17 19 21 23 25 27 29 31
July 1994
Figure Sv . July 1994 hourly atmospheric pressure at PAL and NOAH stations GDIL1 and BUItI.I .

1026
1022 y
1018 a
1014 a
1010 1026
1022
a 1013
v 1014
1010
1026
1022 i a, 1018
1014 cA
1010 1 3 5 7 9 11 13 15 17 19 21 23 25 27 29 31
Auaust 1994
Figure Sw. August 199 hourly atmospheric pressure at PAL and NOAA stations GDIL 1 and BURL 1 .
1026
1024
1022
1020 4
1018 H
1016
d 1014 a 1012
1010
1008 1026
00 00 1024
1022
1020
1018
1016
q 1014
1012 1010
1008
End Deployment
1 5 9 13 17 21 25 29
September 1994
Figure 5x . September 1994 hourly atmospheric pressure at PAL anal NOAA station GDILl .
100
90
80 0
x 70 00
60
50
40 4 1 3 5 7 9 11 13 15 17 19 21 23 25 27 29 31
July 1994
Figure Sy . July 1994 hourly relative humidity at PAL .

100
90
a 80
.'.,
x
o 70
a
60
50 1 3 5 7 9 11 13 15 17 19 21 23 25 27 29 31
August 1994
Fijure Sz . August 1994 hourly relative humidity at PAL.
100
95
90
a
T1
'~ 85 x
80
a
75
70
65
End Deployment
1 5 9 13 17 21 25 29
September 1994
Figure Saa. September 1994 hourly relative humidity at PAL.

RESULTS AND DISCUSSION
RESULTS AND DISCUSSION
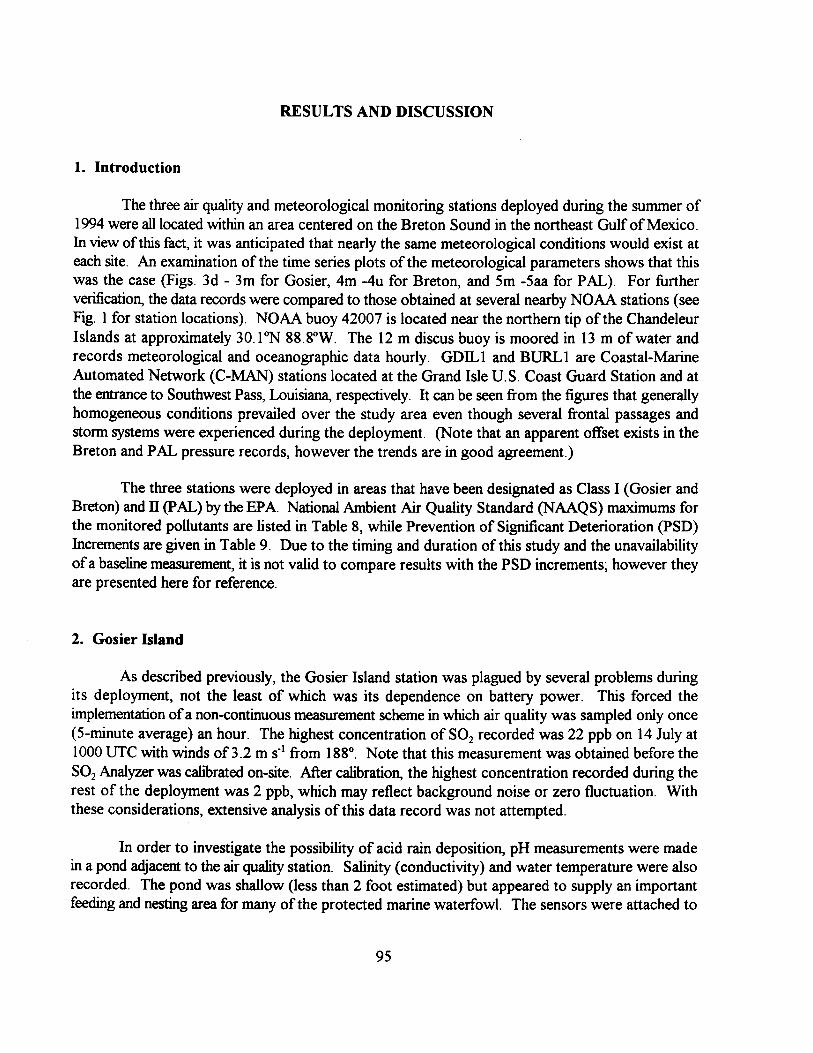
1. Introduction
The three air quality and meteorological monitoring stations deployed during the summer of 1994 were all located within an area centered on the Breton Sound in the northeast Gulf of Mexico. In view of this fact, it was anticipated that nearly the same meteorological conditions would exist at each site . An examination of the time series plots of the meteorological parameters shows that this was the case (Figs . 3d - 3m for Gosier, 4m -4u for Breton, and Sm -Saa for PAL). For further verification, the data records were compared to those obtained at several nearby NOAA stations (see Fig. 1 for station locations) . NOAH buoy 42007 is located near the northern tip of the Chandeleur Islands at approximately 30.1°N 88.8°W . The 12 m discus buoy is moored in 13 m of water and records meteorological and oceanographic data hourly . GDII,1 and BURL1 are Coastal-Marine Automated Network (C-MAN) stations located at the Grand Isle U.S . Coast Guard Station and at the entrance to Southwest Pass, Louisiana, respectively. It can be seen from the figures that generally homogeneous conditions prevailed over the study area even though several frontal passages and storm systems were experienced during the deployment . (Note that an apparent offset exists in the Breton and PAL pressure records, however the trends are in good agreement.)
The three stations were deployed in areas that have been designated as Class I (Gosier and Breton) and II (PAL) by the EPA. National Ambient Air Quality Standard (NAAQS) maximums for the monitored pollutants are listed in Table 8, while Prevention of Significant Deterioration (PSD) Increments are given in Table 9. Due to the timing and duration of this study and the unavailability of a baseline measurement, it is not valid to compare results with the PSD increments ; however they are presented here for reference .
2. Gosier Island
As described previously, the Gosier Island station was plagued by several problems during its deployment, not the least of which was its dependence on battery power. This forced the implementation of a non-continuous measurement scheme in which air quality was sampled only once (5-minute average) an hour . The highest concentration of SOZ recorded was 22 ppb on 14 July at 1000 iTTC with winds of 3 .2 m s'' from 188°. Note that this measurement was obtained before the SOZ Analyzer was calibrated on-site. After calibration, the highest concentration recorded during the rest of the deployment was 2 ppb, which may reflect background noise or zero fluctuation. With these considerations, extensive analysis of this data record was not attempted .
In order to investigate the possibility of acid rain deposition, pH measurements were made in a pond adjacent to the air quality station. Salinity (conductivity) and water temperature were also recorded . The pond was shallow (less than 2 foot estimated) but appeared to supply an important feeding and nesting area for many of the protected marine waterfowl . The sensors were attached to
95
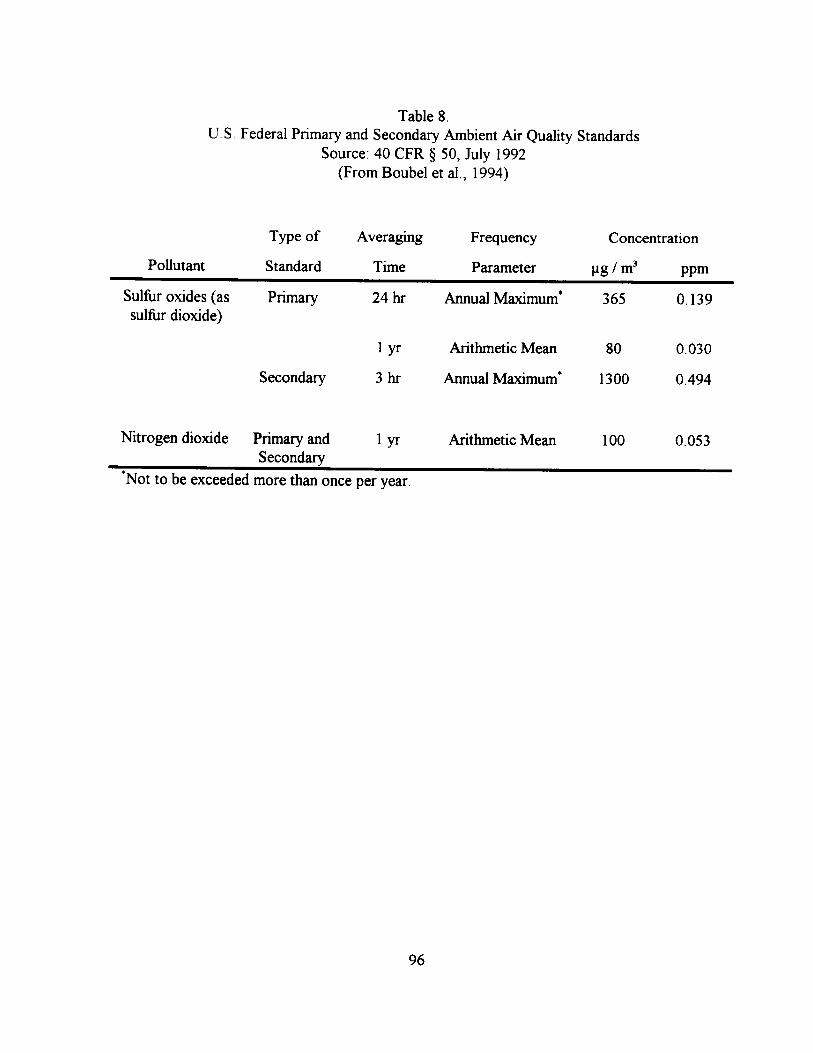
Table 8 . U.S . Federal Primary and Secondary Ambient Air Quality Standards
Source : 40 CFR § 50, July 1992 (From Boubel et al ., 1994)
Pollutant
Type of
Standard
Averaging
Time
Frequency
Parameter
Concentration
Pg / m3 ppm
Sulfur oxides (as Primary 24 hr Annual Maximum' 365 0.139 sulfur dioxide)
1 yr Arithmetic Mean 80 0.030
Secondary 3 hr Annual Maximum' 1300 0.494
Nitrogen dioxide Primary and 1 yr Arithmetic Mean 100 0 .053 Secondary
"`Not to be exceeded more than once per year
96

Table 9 . U.S . Federal PSD Concentration Increments
Source : 40 CFR § 51 .166, July 1992 (From Boubel et al ., 1994)
Increment
Pollutant gg / m3 ppm
Class I
SOZ
Annual Arithmetic Mean
24-hr Maximum
3-hr Maximum
NOZ
Annual Arithmetic Mean
2 0.001
5 0.002
25 0.010
2.5 0.001
Class II
SOZ
Annual Arithmetic Mean
24-hr Maximum
3-hr Maximum
NOZ
Annual Arithmetic Mean
20 0.008
91 0.035
512 0.195
25 0.013
97
a pipe and submerged in approximately 6 - S inches of water (the water level was noted to have dropped considerably by the end of July) . Measurements obtained show that the water was brackish ; however pH values were generally greater than 8 (more alkaline). Diurnal variations are evident in the time series plot (Fig . 3m), particularly after 12 July . Positive correlation of pH and temperature is seen, while salinity appears inversely related due to evaporation and cooling effects.
Passive air quality sensors (Ogawa and Palmes tubes) were exposed throughout the deployment . Analysis was later performed by the Harvard School of Public Health through a sub-contractor, Environmental Science and Engineering, Inc . Their results are given in Tables 10 and 11 . Long exposure times and improper storage of the tubes in all likelihood invalidates this data .
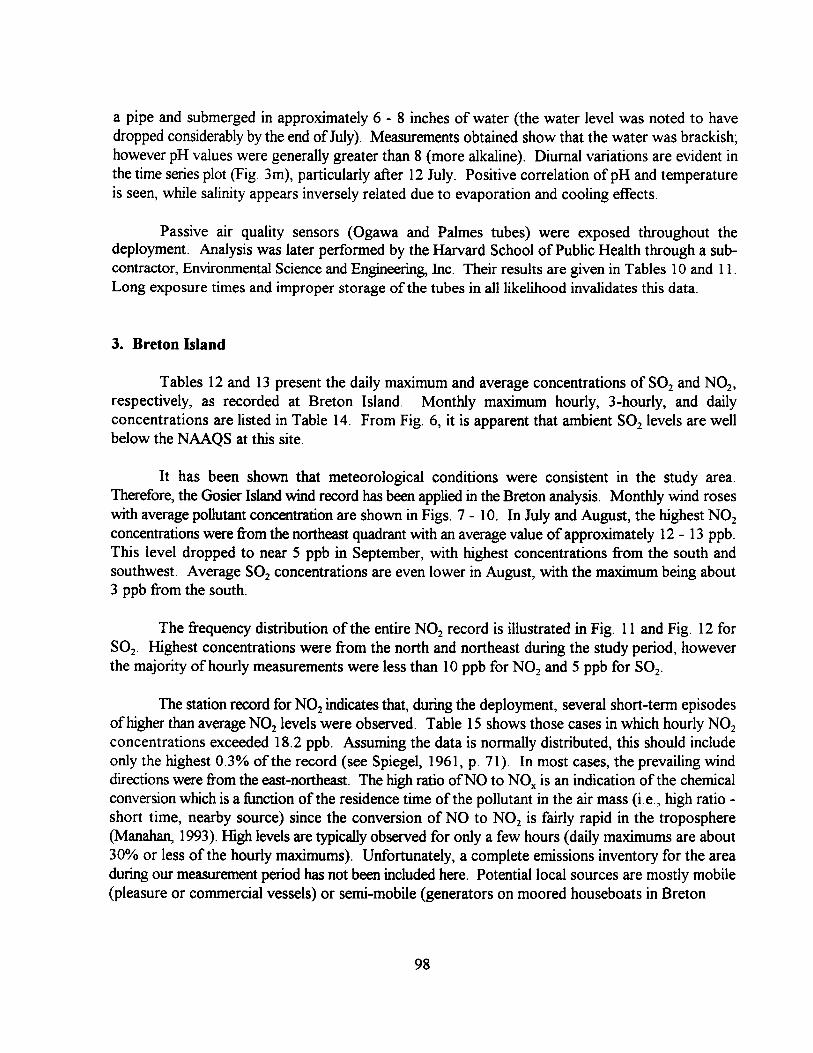
3. Breton Island
Tables 12 and 13 present the daily maximum and average concentrations of S02 and NO2, respectively, as recorded at Breton Island . Monthly maximum hourly, 3-hourly, and daily concentrations are listed in Table 14 . From Fig. 6, it is apparent that ambient S02 levels are well below the NAAQS at this site .
It has been shown that meteorological conditions were consistent in the study area. Therefore, the Gosier Island wind record has been applied in the Breton analysis . Monthly wind roses with average pollutant concentration are shown in Figs . 7 - 10 . In July and August, the highest NOZ concentrations were from the northeast quadrant with an average value of approximately 12 - 13 ppb. This level dropped to near 5 ppb in September, with highest concentrations from the south and southwest . Average SOZ concentrations are even lower in August, with the maximum being about 3 ppb from the south.
The frequency distribution of the entire NOZ record is illustrated in Fig. 11 and Fig. 12 for SOz. Highest concentrations were from the north and northeast during the study period, however the majority of hourly measurements were less than 10 ppb for N02 and 5 ppb for S02.
The station record for N02 indicates that, during the deployment, several short-term episodes of higher than average NOZ levels were observed . Table 15 shows those cases in which hourly NOZ concentrations exceeded 18.2 ppb . Assuming the data is normally distributed, this should include only the highest 0.3% of the record (see Spiegel, 1961, p. 71) . In most cases, the prevailing wind directions were from the east-northeast . The high ratio of NO to NOX is an indication of the chemical conversion which is a function of the residence time of the pollutant in the air mass (i.e., high ratio -short time, nearby source) since the conversion of NO to NOZ is fairly rapid in the troposphere (Manahan, 1993). High levels are typically observed for only a few hours (daily maximums are about 30% or less of the hourly maximums). Unfortunately, a complete emissions inventory for the area during our measurement period has not been included here. Potential local sources are mostly mobile (pleasure or commercial vessels) or semi-mobile (generators on moored houseboats in Breton
98

1VVUVU
U C O U N
O
1000
100
loo
10
Highest SOZ Concentrations
Breton
PAL
0 Note : For SO 2 ; 1 ppb = 2.6 gg/m'
°
o,.so
1 Hour
3 Hour
24 Hour
0.01 0.1 1 10 100
Averaging Time, Hours
I
igure 6 . NAAQS st concentrations at PAL and Breton Island . F I indards and maximurnS02
99

Table 10 . Gosier Island Ogawa (SO)Passive Data
0 0
CSI Design. Harvard Design . Time On Time Ofd Total Hours Net P1113 S02
G001 ESC 1 6/29 Missing -- 1631
G003 ESC 3 7/7 7/13 150.8 3 .4 1140 1825
G005 ESC 5 7/13 7/28 350 2.9 1827 0830
G007 ESC 7 7/28 8/5 196.3 3 .3 0830 1244
G009 CSC 9 8/5 8/17 285.2 9.5 1246 0955
G013 ESC 13 8/17 8/24 170.4 2.0 0955 1240
G015 ESC 15 8/24 (8/23)' 8/31 166.2 (190) 2.1 1241 1058
G017 ESC 17 8/31 9/8 193.2 0.8 1058 1208
G019 ESC 19 9/8 9/26 438 6.2 1208 1840
Dates and times in parentheses are incorrect, but were used in Harvard's chemical analysis . NOTE: Ogawa tube #'s 11, 12, and 21 were not exposed.

Table 11 . Gosier Island Palmes (N02) Passive Data
0
CSI Design. Harvard Design . Time On Time Off Total Hours Mean Conc . N02 PPI3
G001 6/29 7!7 187.2 1630 1140
6003 ESC-003 7/7 7/13 150.8 449.4 1140 1825'
G005 ESC-005 7/13 7/28 350 5 .58 1827 0830
G007 ESC-007 7/28 8/5 196 .2 5 .74 0835 1244
G009 ESC-009 8/5 8/17 285 .2 5.08 1246 0955
GU 11 ESC-011 8/17 8/24 170.8 5.82 0955 1240
G015 ESC-015 8/24 (8/23)+ 8/31 166.3 (190.3) 5 .10 12'11 1058
G017 CSC-017 8/31 9/8 193 .2 13 .05 1058 1208
6019 ESC-019 9/8 9/26 438.5 3 .75 1208 1840
Tube found on beach near tower. i Dates and times in parentheses are incorrect but were used in Harvard's chemical analysis . NOTE: Palmes tubes # 13, 14, and 21 were not exposed.

Table 12 . Breton Island Daily SOZ Maximums and Averages (ppb)
Julv 1994 Au st 1994 September 1994
Dav Maximum Average Maximum Average Maximum Average
1 1 0 1 0.9 0 0
2 6 1 .8 0 0 1 0.3 3 12 1.8 1 0.1
4 3 0.3 0 0
5 0 0 0 0
6 0 0 0 0
7 0 0 2 0.1
0 0
0 0
10 1 0
11 1 0.1
12 0 0
13 17 2
14 10 0.7
15 11 0.9
16 7 0.4
17 3 0.4
18 1 0.5
19 2 1
20 2 1 .1
21 1 0.6
22 9 1 .5
23 25 2.4
24 9 2.1
25 5 0.4
26 0 0
27 1 0.1
28 11 4.2
29 S 2.8
30 2 1 .1
31 1 0.9 51 3.6
Number Hours 255 637 41
Maximum 12 51 1
-Afith-Mean 1 _ 1.2 0.7 1 0.1
Total Samples = 933 % Of Possible Observations = 44.2
102
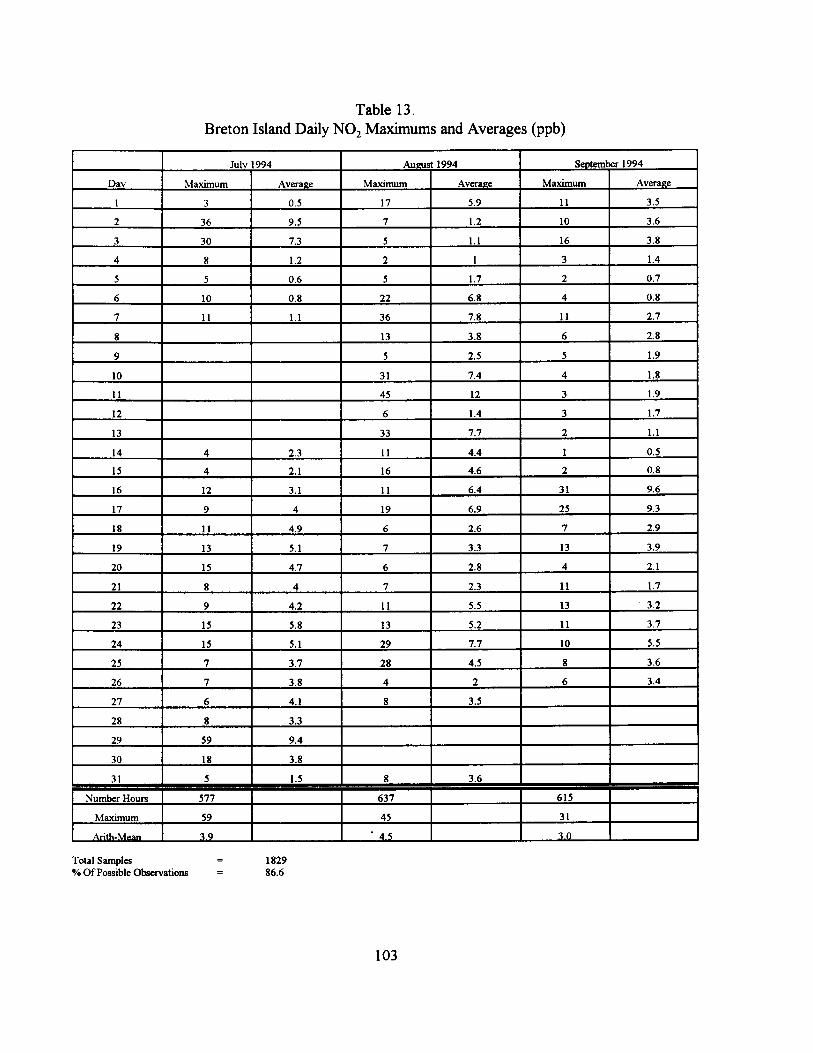
Table 13 . Breton Island Daily NOZ Maximums and Averages (ppb)
Jul 1994 Au 1994 S ember 1994
Day Maximum Average Maximum Average Maximum Average
1 3 0.5 17 5.9 11 3.5
2 36 9.5 7 1.2 10 3.6
3 30 7.3 5 1.1 16 3.8
4 8 1 .2 2 1 3 1 .4
5 5 0.6 5 1.7 2 0.7
6 10 0.8 22 6.8 4 0.8
7 11 1.1 36 7.8 11 2.7
8 13 3 .8 6 2 .8
9 S 2 .5 S 1 .9
10 31 7.4 4 1 .8
11 45 12 3 1 .9
12 6 1.4 3 1 .7
13 33 7.7 2 1 .1
14 4 2.3 11 4.4 1 0.5
15 4 2.1 16 4.6 2 0.8
16 12 3.1 11 6.4 31 9.6
17 9 4 19 6.9 25 9.3
18 11 4.9 6 2.6 7 2.9
19 13 5.1 7 33 13 3.9
20 15 4.7 6 2.8 4 2.1
21 8 4 7 2.3 11 1.7
22 9 4.2 11 5.5 13 3.2
23 15 5.8 13 5.2 11 3.7
24 15 5.1 29 7.7 10 5.5
25 7 3.7 28 4.5 8 3.6
26 7 3.8 4 2 6 3.4
27 6 4.1 8 3.5
28 8 3.3
29 59 9.4
30 18 3.8
31
1
S 1.5 8 3.6
Number Hours 577 637 615
Maximum 59 45 31
Arith_Mean 39 4.5 3 .0
Total Samples = 1829 Of Possible Observations = 86 .6
103

Table 14 . Breton Island 1994 Pollutant Maximums
Month Pollutant % Averaging Period
Maximum ppb
Average Wind Speed / Direction
Date / Tune UTC
1 hr 12 3.2/9 7/3/94 @ 1300
S02 34.3 3 hr 8.3
6.3 5.2/311 8.3/19
7/28/94 @ 0600- 7/28/94 @ 1100
July r 24 hr 4.2
2.8 5.3/340 2.7/358
7/28/94' 7/29/94
1 hr 59 3 .4/317 7/29/94 @ 0200
NO Z 77.6 3 hr 31 3.4/51 7/2/94 @ 1000
24 hr 9.5 4.5/73 7/2/94
1 hr 51 25
2.4/195 1 .7/143
8/31/94 @ 0600- 8/23/94 @ 1500
S02 85.6 3 hr 21 .3 13.3
2.6/192 6.2/52
8/31/94 @ 0800- 8/13/94 @ 1600
August 24 hr 2.4 2.2/206 8/23/94
1 hr 45 6.4/53 8/11/94 @ 1600
NO, 85.6 3 hr 28.3 5.6/50 6.3/54
8/11/94 @ 1200 and 1600
24 hr 12 5.3/76 8/11/94
1 hr 1 6.2/312 9/2/94 @ 1100
S02 6.6 3 hr 1 5 .1/352 9/2/94 @ 1600
S b 24 hr 0.3 4.8/296 9/2/94
eptem er 1 hr 31 3.3/200 9/16/94 @ 1300
NO, 98.7 3 hr 24 3.4/197 9/16/94 @ 1500
24 hr 9.6 5.7/175 9/16/94 Average concentration values may reflect residual measurements from instrument calibration nuts . NOTE: Wind speed in m sec-' and direction in degrees.
104

Figure 7 . July 1994 wind rose from Gosier Island . Solid bar denotes percentage of speeds greater than 5 m sec' . Solid line is average NOZ concentration in ppb at Breton Island (57G samples, 77.4% of month).
105

ZS"/n
'r In -_ 1 5^/0
i " .
------- 01101
5 ppb j. j
15 PpU
-------------
Figure 8. August 1994 wind rose from Gosier Island . Solid bar denotes percentage of wind speeds greater than 5 m sec-' . Solid line is average N02 concentration in ppb at Breton Island (632 samples, 84 .9% of month) .
106

',10"/n
%20"/0
~III \_ `10"/.
\ -
i
to`pav _ -
20 nob j~
-------------
Figure 9 . September 1994 wind rose from Gosier Island. Solid bar denotes percentage of wind speeds greater than 5 m sec-1 . Solid line is average NOZ concentration in ppb at Breton Island (611 samples, 98 .6% of possible record).
107
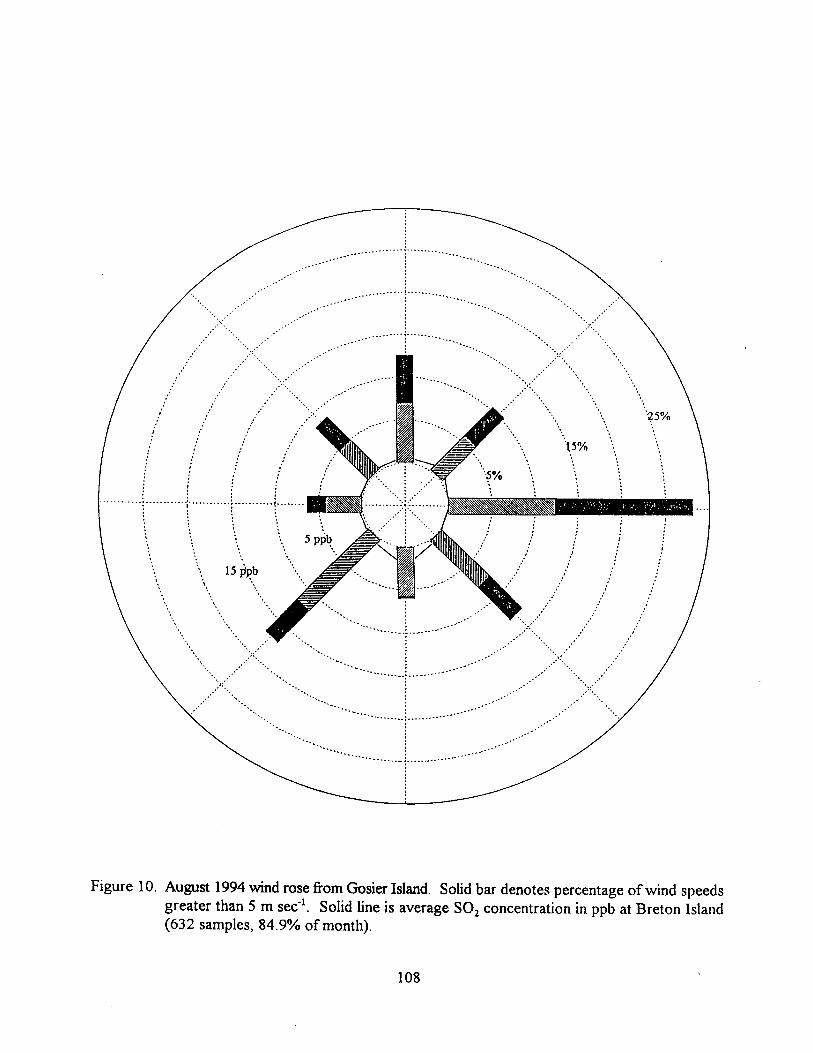
.~25%
j - 15"/0
`'S"/o
~~. : .. . . .
.~~
15 ppb
Figure 10 . August 1994 wind rose from Gosier Island . Solid bar denotes percentage of wind speeds greater than 5 m sec' . Solid line is average SOZ concentration in ppb at Breton Island (632 samples, 84.9% of month) .
108

Figure 11 . Frequency distribution of N02 (in ppb) at Breton Island during the period of 1 July to 26 September 1994 based on Gosier Island winds (1819 samples, 86 .2% of possible record). Bar is divided into 0-10 ppb (clear), 10-20 ppb (hatched), and >20 ppb (solid) .
109

Figure 12 . Frequency distribution of SOZ (in ppb) at Breton Island for the months of July and August 1994 based on Gorier Island winds (887 samples, 59.6% of possible record) . Bar is divided into 0-5 ppb (clear), 5-10 ppb (hatched), and >10 ppb (solid) .
110
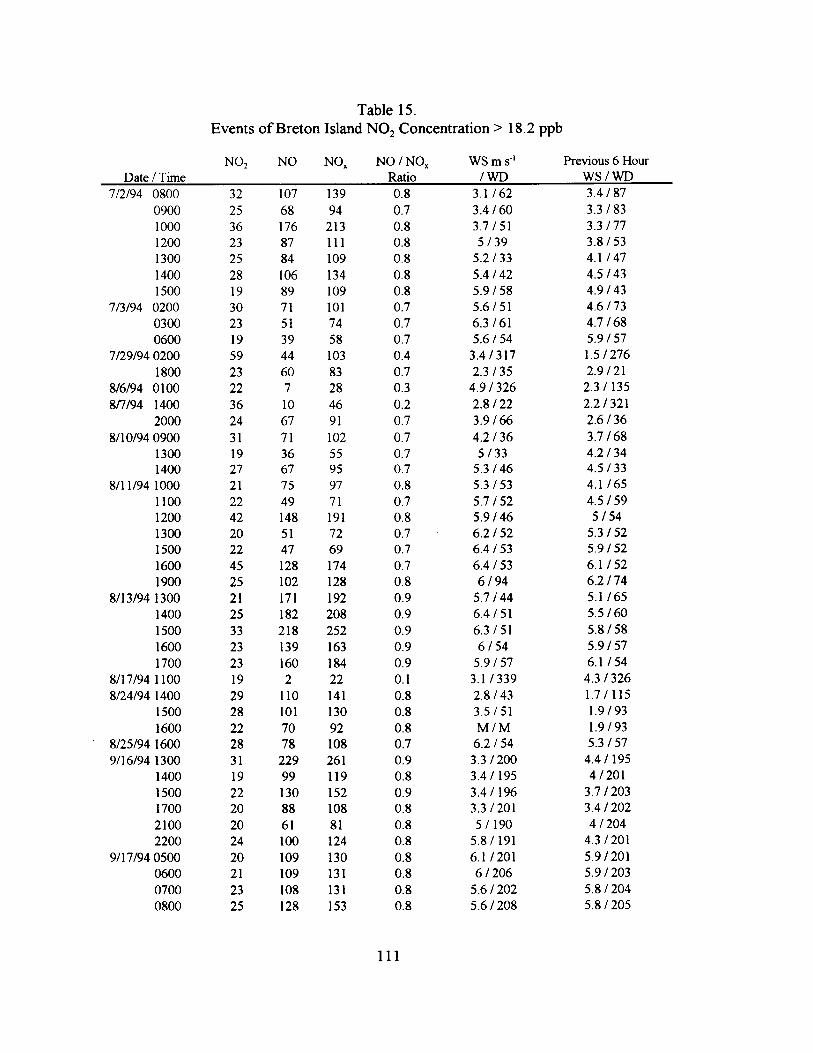
Table 15 . Events of Breton Island NO2 Concentration > 18 .2 ppb
NOZ NO NOx NO / NO,, WS m s' Previous 6 Hour Date / Time Ratio / WD WS / WD
7/2/94 0800 32 107 139 0.8 3 .1/62 3 .4/87 0900 25 68 94 0.7 3 .4/60 3 .3/83 1000 36 176 213 0.8 3 .7/51 3 .3/77 1200 23 87 111 0.8 5 /39 3 .8/53 1300 25 84 109 0.8 5.2/33 4.1/47 1400 28 106 134 0.8 5.4/42 4.5/43 1500 19 89 109 0.8 5.9/58 4.9/43
7/3/94 0200 30 71 101 0.7 5.6/51 4.6/73 0300 23 51 74 0.7 6.3161 4.7/68 0600 19 39 58 0.7 5.6/54 5.9/57
7/29/94 0200 59 44 103 0.4 3.4/317 1 .5/276 1800 23 60 83 0.7 2.3/35 2.9/21
8/6/94 0100 22 7 28 0.3 4.9/326 2.3/135 8!7/94 1400 36 10 46 0.2 2.8/22 2.2/321
2000 24 67 91 0.7 3.9/66 2.6/36 8/10/94 0900 31 71 102 0.7 4.2/36 3 .7/68
1300 19 36 55 0.7 5 /33 4.2/34 1400 27 67 95 0.7 5.3/46 4.5/33
8/11/94 1000 21 75 97 0.8 5.3/53 4.1/65 1100 22 49 71 0.7 5.7/52 4.5/59 1200 42 148 191 0.8 5.9 /46 5/54 1300 20 51 72 0.7 62 /52 5.3/52 1500 22 47 69 0.7 6.4 /53 5.9/52 1600 45 128 174 0.7 6.4 /'53 6.1/52 1900 25 102 128 0.8 6/94 6.2/74
8/13/94 1300 21 171 192 0.9 5.7 /'44 5.1/65 1400 25 182 208 0.9 6.4 /'51 5.5/60 1500 33 218 252 0.9 6.3 /51 5.8/58 1600 23 139 163 0.9 6/54 5.9/57 1700 23 160 184 0.9 5.9 /57 6.1/54
8/17/94 1100 19 2 22 0.1 3 .1 /339 4.3/326 8/24/94 1400 29 110 141 0.8 2 .8 /43 1 .7/115
1500 28 101 130 0.8 3 .5 15l 1 .9/93 1600 22 70 92 0.8 M / M 1 .9/93
8/25/94 1600 28 78 108 0.7 6.2 /54 5 .3/57 9/16/94 1300 31 229 261 0.9 3.3/200 4.4/195
1400 19 99 119 0.8 3.4/195 4/201 1500 22 130 152 0.9 3.4/196 3 .7/203 1700 20 88 108 0.8 3.3/201 3 .4/202 2100 20 61 81 0.8 5/190 4/204 2200 24 100 124 0.8 5.8/191 4.3/201
9/17/94 0500 20 109 130 0.8 6.1/201 5.9/201 0600 21 109 131 0.8 6/206 5.9/203 0700 23 108 131 0.8 5.6/202 5.8/204 0800 25 128 153 0.8 5.6/208 5.8/205
111
Sound), but frequency or amount of traffic is not know. Another possible local source is the generator at the Kerr-McGee facility on Breton Island which is in continuous operation .
Passive sampler data for Breton Island as provided by the Harvard School of Public Health is given in Tables 16 and 17 with the same considerations as at Gosier .
4. Pass-A-Loutre
Observed ambient levels of both SOZ and N02 at the PAL station were lower than those at Breton during the study period . Daily maximums and averages for SOZ and N02 are in Table 18 and 19, respectively . Monthly hourly, 3-hourly, and daily maximums are in Table 20.
Wind roses with average pollutant levels are shown in Figs . 13 - 16 . Highest levels of NOZ occurred from the southwest and northwest quadrants in July, and again from the northwest in August. Average N02 values were less than 5 ppb. SOZ appeared to be more evenly distributed; however average concentrations were near to zero .
Figures 17 and 18 display the frequency distributions for the entire record of NO2 and SO2, respectively . Highest concentrations of N02 were from northwest and southwest, while highest S02 concentrations came from the north. The majority of all measurements were 5 ppb or less .
Table 21 is constructed similar to Table 15, but for PAL. The NO/NO,, ratios here are much lower, suggesting a more aged air mass (distant source); however it should be noted that the wind speeds were generally very light. The highest ratios appear to be associated with westerly transport . A possible cause may be ship traffic in the heavily utilized South and Southwest Passes of the Mississippi River delta.
5. Radiosondes
Atmospheric profiles obtained by radiosondes were analyzed to determine the mixing heights prevailing over the study area . Profiles of the lower 1000 - 2000 m of potential temperature (8) and mixing ratio (q) for each sounding are shown in Figs . 19a - c. In a well-mixed boundary layer, 8 and q remain nearly constant with height until reaching the top of the layer, at which point there is usually rapid increase of 8 and decrease of q. Each profile was examined to identify the height where this change (in slope) occurred .
Assuming the presence of cumulus cloud (which often prevail over the marine layer), Garratt (1992) has shown that the mixing height h = LCL, the lifting condensation level. The LCL may be estimated (see McIlveen, 1986) by
HeQ = 125 (T,, Td,wl
112

where H.a is the mixing height over the water surface, and T ,j, and T , are the air and dewpoint temperatures (°C) . If the clouds are stratiform, then the mixing height extends to the cloud top rather than base .
Table 22 lists all heights as determined by the methods described . LCLP is obtained from the plot of the profile on a Skew-T Log-p thermodynamic diagram, while LCLc was calculated from Eq. (1) and h is from 8 and q. If one accepts a root mean square error of approximately 71 m, then Eq. (1) may be used to estimate the LCL over our study area . The lifting condensation levels and mixing height estimates for each profile are generally within 100 - 200 m, however excellant agreement is found between the mean LCLp (507 m) and the mean mixing height (505 m). Since heights h and LCLp are measured directly by radiosonde which LCL, is derived from theoretical considerations, it should be possible to refine Eq. (1) to more accurately represent our study area given further investigation and measurements . At this point, considering the upper-air measurement void which exist over the Gulf of Mexico, Eq . (1) is offered here as a first approximation . Regardless, all of the heights found through this analysis are well below the climatic mean for summer as given by Holzworth (1972) .
113
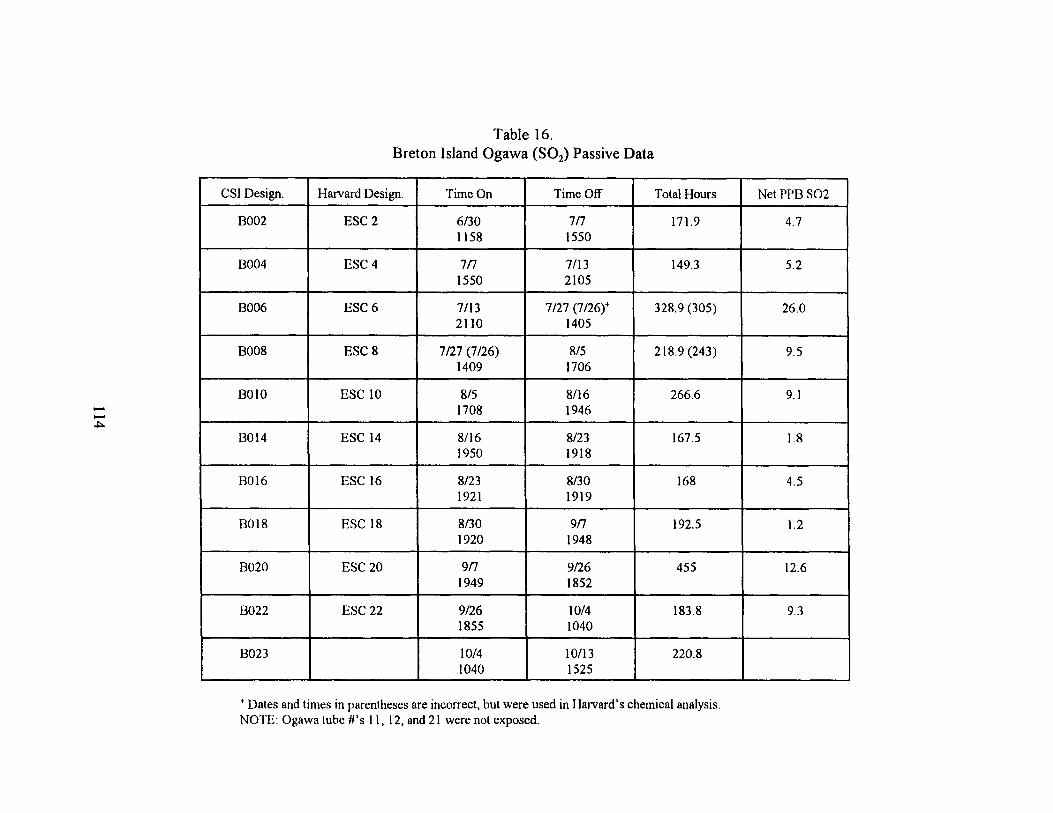
Table 16 . Breton Island Ogawa (SOZ) Passive Data
CSI Design . Harvard Design . Time On Time Off Total Hours Net PPB S02
B002 ESC 2 6/30 7/7 171 .9 4.7 1158 1550
B004 ESC 4 7/7 7/13 149.3 5.2 1550 2105
B006 ESC 6 7/13 7/27 (7/26)+ 328.9 (305) 26.0 2110 1405
B008 ESC 8 7/27(7/26) 8/5 218.9 (243) 9.5 1409 1706
13010 ESC 10 8/5 8/16 266.6 9.1 1708 1946
B014 ESC 14 8/16 8/23 167 .5 1 .8 1950 1918
8016 ESC 16 8/23 8/30 168 4.5 1921 1919
B018 ESC 18 8/30 9/7 192.5 1 .2 1920 1948
B020 ESC 20 9/7 9/26 455 12.6 1949 1852
B022 ESC 22 9/26 10/4 183 .8 9.3 1855 1040
B023 10/4 10/13 220.8 1040 1525
Dates and times in parentheses are incorrect, but were used in Harvard's chemical analysis . NOTE: Ogawa tube #'s 11, 12, and 21 were not exposed.

Table 17 . Breton Island Palmes (N02) Passive Data
...
CSI Design . Harvard Design . Time On Time Off Total Hours Mean Cone. N02 I'I'13
B002 CSC-002 6/30 7/7 171 .9 9.38 1157 1550
B004 ESC-004 7!7 7/13 149.3 15.56 1550 2104
B006 ESC-006 7/13 7/27 (7/26)' 329 (304) 8.66 2108 1405
B008 ESC-008 7/27 (7/26) 8/5 219 (243) 6.62 1409 1706
13010 ESC-010 8/5 8/16 266.6 11 .91 1708 1946
B012 ESC-012 8/16 8/23 167.5 13.64 1950 1918
B016 ESC-016 8/23 8/30 168 7.92 1921 1919
13018 ESC-018 8/30 9/7 192.5 7.28 1920 1948
B020 ESC-020 9/7 9/26 455 5 .52 1949 1852
B022 ESC-022 9/26 10/4 183.8 4.86 1855 1040
8023 10/4 10/13 220.8 1040 1525
'Dates and times in parentheses are incorrect, but were used in Harvard's chemical analysis . NOTE: Palmas tubes #'s 13, 14, and 21 were not exposed.

Table 18 . Pass-A-Loutre Daily SOZ Maximums and Averages (ppb)
Julv 1994 Au 1994 September 1994
Dav Maximum Average Maximum Average Maximum Average
1 1 0.8 2 0.1 0 0
2 5 0 .3 0 0 4 0 .8
3 0 0 0 0 7 1
4 1 0 0 0 1 0.1
5 0 0 0 0 0 0
6 0 0 3 0.7 0 0
7 2 0.4 0 0 2 0.3
8 1 0.5 0 0 0 0
9 1 0.1 2 0.3 0 0
10 0 0 1 0.1 0 0
11 1 0 0 0 0 0
12 1 0.1 0 0 0 0
13 0 0 3 0.2
14 1 0.2 7 1.4
15 0 0 6 1 .3
16 0 0 4 1
17 1 0.4 4 1
18 2 0.8 2 0.1
19 1 0.4 1 0
20 2 03 0 0
21 1 0 .3 1 0.1
22 0 0 3 0.3
23 1 0.1 1 0.1
24 0 0 1 0.2
25 1 0 1 0
26 1 0 0 0
27 1 0 0 0
28 7 1 .4 0
-
0
29 3 1 0 0
30 1 0.1 1 0.1
31 1 0 2 0.3
Number Hours 709 729 277
Maximum 7 7 7
4f;th_Mean n ? a2 0.2
Total Samples = 1715 Of Possible Observations = 97 .9
116

Table 19 . Pass-A-Loutre Daily N02 Maximums and Averages (ppb)
Julv 1994 Au 1994 S tember 1994
Dav Maximum Average Maximum Average Maximum Average
1 4 1 .7 5 1.8
2 3 0.9 11 4
3 3 0.5 14 4.2
4 3 0.5 4 1.2
5 5 1 .7 2 0.6
6 10 3.2 1 0.5
7 23 3.8 4 2 3 1.2
8 9 1 .5 3 1 .2 9 2.4
9 7 1.3 6 1.4 2 1.4
10 5 1.3 4 1.5 2 1.2
11 5 1.5 8 13 2 0.6
12 14 1.9 4 2.2 5 1.8
13 6 1.3 3 1.3
14 10 1.4 10 3
15 7 0 .4 9 3 .2
16 4 0.3 12 5
17 6 1.4 13 5.1
18 11 1.8 5 1.6
19 3 1 9 2.4
20 6 1.2 1 0.3
21 7 1.3 3 0.7
22 4 23 9 3.5
23 12 4.1 6 2.6
24 11 4.8 3 1.8
25 9 3 .3 S 1 .5
26 9 2.9 3 0.8
27 15 3 4 0.9
28 10 2.9 3 0.8
29 15 3.3 2 0.6
30 3 1.8 5 2.2
31 9 2 10 1 .8
Number Hours 570 729 277
Maximum 23 13 14
Arith-Mean 2 1 .R 1 .7
Total Samples = 1576 Of Possible Observations = 97.8
117

Table 20 . Pass-A-Loutre 1994 Pollutant Maximums
Month Pollutant % Averaging Period
Maximum ppb
Average Wind Speed / Direction
Date / Tune UTC
1 hr 7 3.5/8 7/28/94 @ 1000
SO2 97.9 3 hr 4 3 .5/12 7/28/94 @ 1200
24 hr 1 .4 2.6/334 7/28/94 July
I hr 23 0.5/324 7x7/94 @ 2300
NO, 78.7 3 hr 11 0.5/356 7/8/94 @ 0 100
24 hr 4.8 1 .1/260 7/24/94
1 hr 7 3 .6/355 8/14/94 @ 2 100
SO2 98 3 hr 5 .7 4/349 8/14/94 @ 2 100
24 hr 1 .4 2.3/354 8/14/94
August 1 hr 13 0.5/325 8/17/94 @ 1000
NO2 98 3 hr 11 .7 3 .8/316
0.8/322 8/16/94 @ 0400 and 8/17/94 @ 1100
24 hr 5.1 2.3/262 8/17/94
1 hr 7 2.1/330 9/3/94 @ 0500
SO2 98.2 3 hr 4.7 1 .9/322 9/3/94 @ 0700
24 hr 1 2,2/336 9/3/94 September
1 hr 14 1.4, 1 .3 /312,319 9/3/94 @ 0800, 0900
N02 98.2 3 hr 13 1 .5/314 9/3/94 @ 0900
24 hr 4.2 ~ 2.2/336 ~ 9/3/94
NOTE : Wind speed in m sec' and direction in degrees.
118

i ,-\ .
MOMM
5 ppU
10 ppb -
. . . . . . . . . ,~ \ . . . . . ,f_ . . . . . . . . . . .
i i
~ .. . / . ...-----.. . . .~
Figure 13 . July 1994 wind rose from PAL. Solid bar denotes percentage of wind speeds greater than 5 m sec' . Solid line is average N02 concentration in ppb (569 samples, 78 .6% of month).
119

- ~~25"/n --- ~ -
\ - ~5/0
. . . . . . . . . . . .. . . . . . . . . . . . . . . . . . . . . . . . . . . . . . . . . . --------- ------- \\ \\
I S ppb / '.
Figure 14 . August 1994 wind rose from PAL. Solid bar denotes percentage of wind speeds greater than 5 m sec' . Solid line is average N02 concentration in ppb (729 samples, 98% of month) .
120
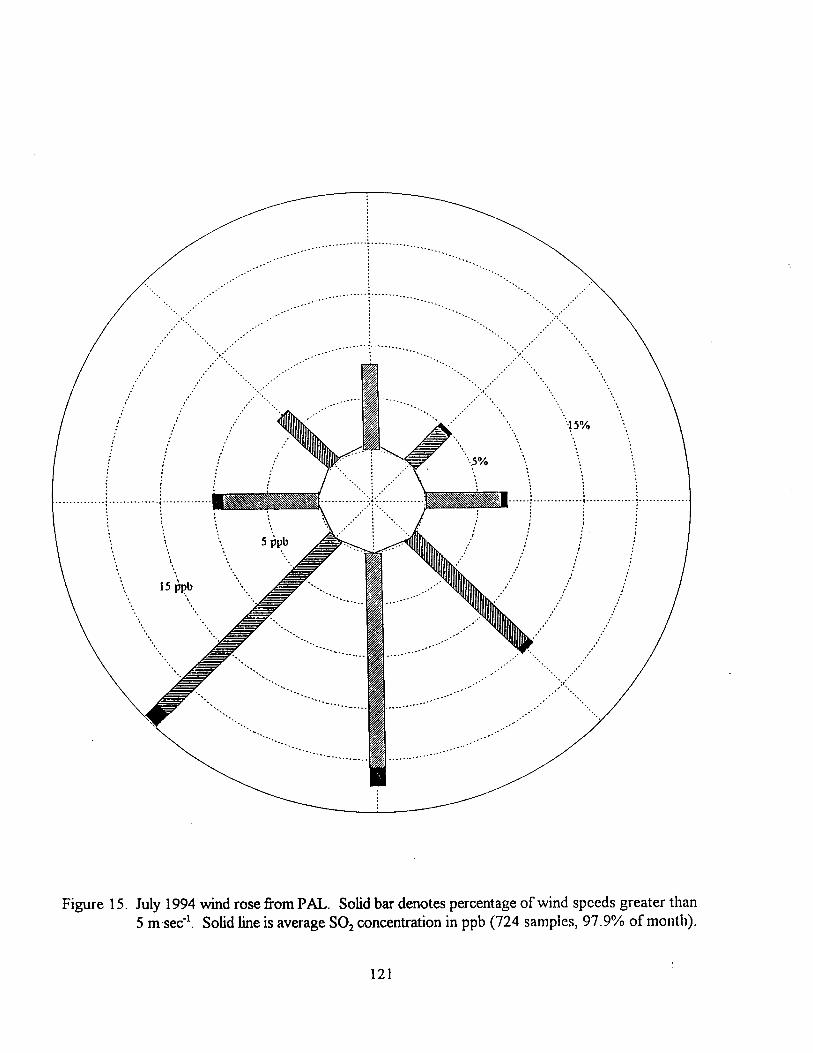
Figure 15 . July 1994 wind rose from PAL. Solid bar denotes percentage of wind speeds greater than 5 m~sec' . Solid line is average S02 concentration in ppb (724 samples, 97 .9% of month).
121
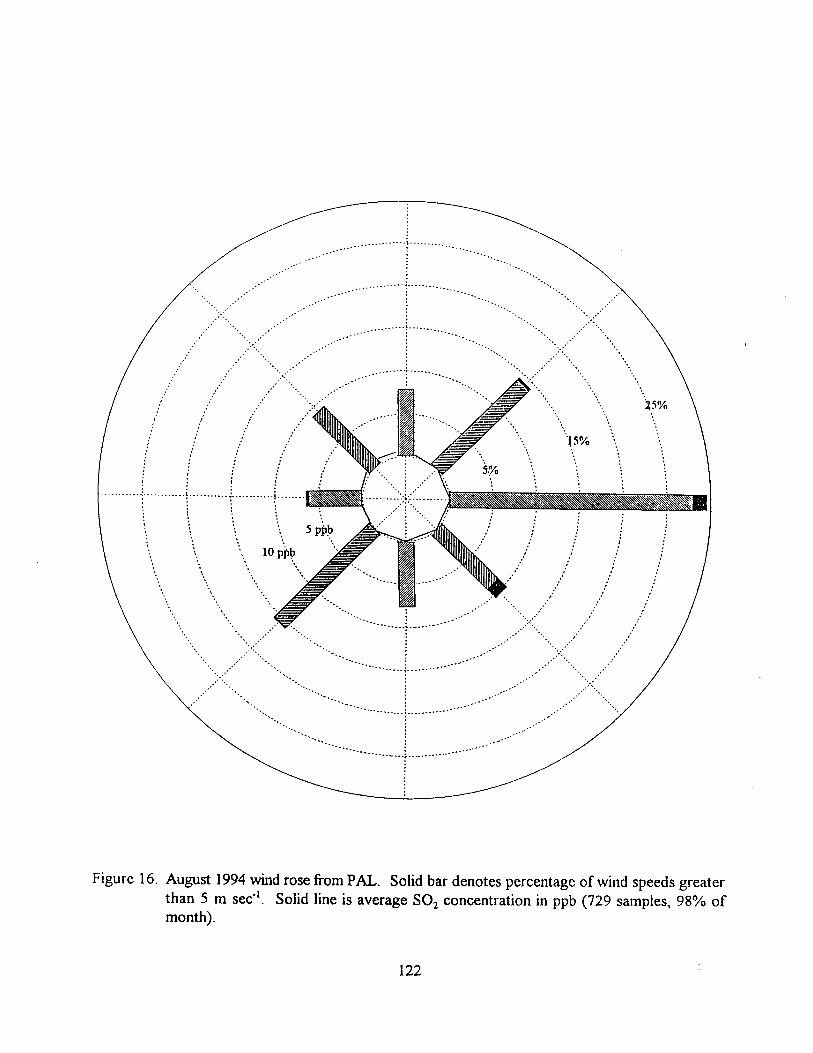
. ._ . . . . . . . . . . ..F .. . . . . . . . . . . . . . .
j , - ~~~_5"/0
j
i . . . . . . . . . .. . t . . . . . ... .. . .. . .. . . . . . . . .~-
- ---- -- . . . . . . . . . . . . . . . . . \ ~ ~~ ~\~\
i 5 ppb
10 ppU
i
Figure 16 . August 1994 wind rose from PAL. Solid bar denotes percentage of wind speeds greater than 5 m sec-' . Solid line is average S02 concentration in ppb (729 samples, 98% of month).
122

Figure 17 . Frequency distribution of NOZ concentration (in ppb) at PAL during the period of 1 July to 12 September 1994 (1574 samples, 89.9% of possible record) . Bar is divided into 0-5 ppb~(clear), 5-10 ppb (hatched), and >10 ppb (solid) .
123

Figure 18 . Frequency distribution of S02 concentration (in ppb) at PAL during the period of 1 July to 12 September 1994 (1715 samples, 97.9% of possible record). Bar is divided into 0-5 ppb,(clear) and >5 ppb (hatched) .
124

Table 21 . Events of Pass-A-Loutre N02 Concentrations > 8.8 ppb
NO, NO NO,, NO / NOx Previous 6 Hour Date / Time Ratio WS m sec-'/ WD WS / WD 7/7/94 2300 23 11 35 0.3 o.5/324 2.1/189 7/8/94 0000 9 5 16 0.3 0.6/6 1 .9/235 7/12/94 0300 14 3 19 0.2 1 .7/301 2.9/200 7/14/94 0400 10 5 16 0.3 2/132 3.2/166 7/18/94 0600 9 1 11 0.1 1/245 0.2/178
0700 11 3 15 0.2 1/244 0.3/191 7/23/94 0800 12 0 12 0 1 .4/227 0.9/214
0900 9 0 9 0 0.6/227 1/223 1000 1O 0 10 0 0.8/252 1/229
7/24/94 0100 11 0 10 0 0.6/236 2.8/212 0200 11 1 11 0.1 0/230 2.7/219
7/25/94 0300 9 0 8 0 :2 .5 / 223 2.8/232 2300 9 12 20 0.6 .3.8/236 4/247
7/26/94 0100 9 0 9 0 3.5/226 3 .9/237 7/27/94 1100 15 12 29 0.4 6.8/232 5.6/228 7/28/94 0700 9 1 11 0.1 3 .5 / 323 2.6/300
0800 10 1 12 0.1 3 .9/336 2.9/312 7/29/94 1000 9 1 12 0.1 0.2/340 0/354
1100 15 1 18 0.1 1 .2/347 0.3/351 7/31/94 2300 9 1 12 0.1 1 .2/228 1 .7/243 8/6/94 1000 10 1 13 0.1 0.4/299 0.3/323
1400 9 2 12 0.2 1 .4/341 0.9/321 8/14/94 1300 10 2 13 0.2 3 .8 / 318 3/327 8/15/94 1100 9 1 11 0.1 1 .8/336 1 .4/311 8/16/94 0200 1l 0 12 0 4.2/311 3.9/274
0300 12 0 14 0 .3 .9/313 4,1/281 0400 12 0 13 0 3 .2 / 323 4/294
8/17/94 0100 10 0 11 0 3 .6 / 224 3 .2/242 0200 10 0 11 0 .3 .2/225 3 .2/240 0900 11 0 12 0 1 .5/334 2.3/267 1000 13 0 15 0 0.5/325 1 .9/283 1100 11 0 13 0 0.3/308 1 .4/296 1200 9 1 12 0.1 0.2/341 1 .1/311 1300 10 2 13 02 0.2/31 0.8/335
8/19/94 0900 9 0 11 0 0.5/234 0.7/226 8/22/94 0800 9 1 11 0.1 0.5/289 0.5/214 8/31/94 0000 10 1 12 0.1 0.5/223 1 .9/210 9/2/94 0500 11 1 13 0.1 0.5/340 1 .4/280
0600 10 2 14 0.1 0/340 1 .1/296 1200 9 6 16 0.4 0.8/349 0.1/342
9/3/94 0600 12 0 13 0 1 .8/323 2.6/310 0700 11 0 13 0 1 .8/312 2.4/307 0800 14 1 16 0.1 1 .4/312 2.1/315 0900 14 2 17 0.1 1 .3/319 1.9/318
9/8/94 1100 9 3 12 0.3 0/150 0.2/155 1300 9 1 11 0.1 0.4/7 0.1/97
125

4sm / k6
10 11 12 13 14 15 16 17
- ------- - ---- f
_ _ '
-- ----- - ------- - ----- ---_----I
SIR] 1216 LT
26 27 28 29
e, °c
q, sm/rs
- -- -- - - -- ,y]
---- -------- ----------------- ------------------ ---------------
S2R2 1900 LT
0
27 28 29 30
e, °c
4Em/ rB 10 13 16
r--_-----_ -~--St'------~
S2R3 0631 LT
-~-
41''
0 28 29 30 31 32 33 34 76 27 28 29
e, °c e, ~c
Figure 19 . Atmospheric profiles of potential temperature (A, X-line) and mixing ratio (q, o-line) versus height in m over our study area . Light solid line denotes mixing height h, light dotted line is LCLp, and heavy dashed line is LCL~ (see text for details) .
126
48mI k8
19 to 1R is on _ . . ._ ., .
lip
--- -------- ------------------- ---------------
52R1 1558 LT
--1 a

9.&n / rB
10 12 14 16 Is
----
-------- --------------- -------
SZR4 1902 LT
.----y
25 27 29 31 33
e, °c
q.pn/k6
13 14 IS 16 17 18 19 20
q.sm~ra ,~ 8 10 12 14 1e 1 a 20
`b
--
-- ----------- ----
---- ------------------------------------- --------
S2R5 0706 LT
O
?A 26 28 30
8, °C
a. sm / to 14 15 16 17 18 19 20
s
"Q'
O
W
Figure 19 continued .
______ Y
11
I S2R7 0703 LT
n
25 ?b 27 28
e. °c
127
25 26 27 23 29
e. °c

a, gm i kg 12 13 14 15 16 17 1
p
I o ---- --- -------------------- ------------ ---------------------
S2R8 1930 LT
O 26 27 28 29
e. °c
9" Bm / kg
13 14 15 16 17 18 19 20
Figure 19 continued .
q. gm ~kg 11 12 13 14 15 16 17 18 19 ,~
-~-r--
S2R9 0701 LT
O 25 26 27 28
e, °c
9.Bn / LB
14 15 16 17 18 19 20 ~p `Q'
S3R2 1304 LT
------- - -------------
O 27 29 19 30 31
e, °c
128
26 27 28 29
e; °c

Table 22 . Lifting Condensation Levels and Mixing Heights
Profile Tune Cloud Cover LCLP m Mixing Height (h) m LCL~ m
STA1RS01 1216 LT CLR, HAZE 761 675 875
STA2RS01 158 LT BKN CU, CB 515 550 562
STA2RS02 1900 LT SCT CI 1073 880 1125
STA2RS03 0631 LT BKN ST, CU 570 370 625
STA2RS04 1902 LT BKN SC 448 400 525
STA2RS05 0706 LT STC AC 152 400 238
STA2RS06 1905 LT BKN AC, CS 379 430 438
STA2R507 0703 LT BKN CU, CB 237 300 300
STA2RS08 1930 LT SCT CI, CC 477 380 538
STA2RS09 0701 LT SCT CU, BKN CI 428 420 488
STA3RS01 1906 LT SCT CU, CI 370 600 438
STA3RS02 1304 LT 1 BKN CU ~ 670 650 ~ 750 LCLp is obtained from profile while LCL, was calculated and h is from 8q plot.
Where: CLR - clear SCT - scattered BKN - broken CU - cumulus CB - cumulonimbus CI - cirrus ST - stratus SC - stratocumulus AC - altocumulus CS - cirrostratus CC - cirrocumulus
129

RECOMMENDATIONS

RECOMMENDATIONS
Ambient levels of S02 and N02 recorded from three remote stations near the Mississippi River Delta during the summer of 1994 have been shown to be much lower than the NAAQS. Short-lived episodes of higher than average NO,, appear intermittently in the Breton Island record . Since this area is subject to EPA Class I PSD regulations, it is recommended that long-term (at least one year) continuous monitoring be conducted so that comparisons to PSD increments can be made . The long term record will also allow investigation into the frequency and intensity of the high NO,, events . It is fiuther suggested that the monitoring network be expanded so that pollutant sources (both on land and OCS) may be identified and overwater transport processes better understood . To this end, offshore meteorological monitoring (including atmospheric profiles) should be continued. A more rigorous program for OCS air quality monitoring and station maintenance should be developed (including the acquisition of additional analyzers to minimize downtime). Finally, an additional station in the northeast Gulf of Mexico should be established to improve the spatial resolution as described above.
133

REFERENCES
REFERENCES
Boubel, R. W., D. L. Fox, D. B. Turner, and A. C . Stern. 1994 . Fundamentals of air pollution . San Diego: Academic Press, 574 pp.
Code of Federal Regulations. 1994 . Title 40, Protection of Environment, Part 58, Appendix B, Quality assurance requirements for prevention of significant deterioration (PSD) air monitoring .
Environment Protection Agency. 1979 . Quality assurance handbook for air pollution measurement systems . Volume II - Ambient air specific methods. EPA-600/4-77-027a. May 1979 . Available from U.S . Environmental Protection Agency, Environmental Monitoring Systems Laboratory (MD-77), Research Triangle Park, NC .
Garratt, J. R. 1992. The atmospheric boundary layer. Cambridge University Press. 316 pp .
Holzworth, G. C. 1972. Mixing heights, wind speeds, and potential for urban air pollution throughout the contiguous United States . AP-101, Technical Publications Branch, Environmental Protection Agency, Research Triangle Park., NC. 118 pp.
Hsu, S . A. 1995 . Measurements of SOZ concentration and atmospheric structure in Delta and Breton Wildlife Refuges. OCS Study MMS 95-0019 . U.S . Dept. of the Interior, Minerals Management Service, Gulf of Mexico OCS Region, New Orleans, LA. 74 pp.
Manahan, S . E . 1993 . Environmental chemistry . Lewis Publishers . 844 pp.
McIlveen, 7. F . R. 1986 . Basic meteorology. Van Nostrand Reinhold (U.K.) Co ., Ltd. 457 pp .
Spiegel, M. R. 1961 . Schaum's outline of theory and problems of statistics. New York: Schaum Publishing Co . 359 pp .
137

N F
p
The Department of the Interior Mission
As the Nation's principal conservation agency, the Department of the Interior has responsibility for most of our nationally owned public lands and natural resources . This includes fostering sound use of our land and water resources ; protecting our fish, wildlife, and biological diversity; preserving the environmental and cultural values of our national parks and historical places ; and providing for the enjoyment of life through outdoor recreation . The Department assesses our energy and mineral resources and works to ensure that their development is in the best interests of all our people by encouraging stewardship and citizen participation in their care . The Department also has a major responsibility for American Indian reservation communities and for people who live in island territories under U.S. administration .
The Minerals Management Service Mission
As a bureau of the Department of the Interior, the Minerals Management Service's (MMS) primary responsibilities are to manage the mineral resources located on the Nation's Outer Continental Shelf (OCS), collect revenue from the Federal OCS and onshore Federal and Indian lands, and distribute those revenues .
Moreover, in working to meet its responsibilities, the Offshore Minerals Management Program administers the OCS competitive leasing program and oversees the safe and environmentally sound exploration and production of our Nation's offshore natural gas, oil and other mineral resources . The MMS Royalty Management Program meets its responsibilities by ensuring the efficient, timely and accurate collection and disbursement of revenue from mineral leasing and production due to Indian tribes and allottees, States and the U.S . Treasury .
The MMS strives to fulfill its responsibilities through the general guiding principles of: (1) being responsive to the public's concerns and interests by maintaining a dialogue with all potentially affected parties and (2) carrying out its programs with an emphasis on working to enhance the quality of life for all Americans by lending MMS assistance and expertise to economic development and environmental protection.


![Assessment of benzo[a]pyrene concentrations in the United ...4.1.2 Point source modelling 11 4.1.3 Meteorological data 11 5 Prediction of BAP concentrations in 2003 and 2010, 2015](https://static.fdocuments.in/doc/165x107/61192bd4788b5e3eb47c51a2/assessment-of-benzoapyrene-concentrations-in-the-united-412-point-source.jpg)