Objective Assessment of Ornamentation in Indian Classical ...daplab/... · Objective Assessment of...
25
Objective Assessment of Ornamentation in Indian Classical Singing Chitralekha Gupta and Preeti Rao Department of Electrical Engineering, IIT Bombay, Mumbai 400076, India [email protected], [email protected] Abstract. Important aspects of singing ability include musical accuracy and voice quality. In the context of Indian classical music, not only is the correct sequence of notes important to musical accuracy but also the nature of pitch transitions between notes. These transitions are essentially related to gamakas (ornaments) that are important to the aesthetics of the genre. Thus a higher level of singing skill involves achieving the necessary expressiveness via correct rendering of ornamentation, and this ability can serve to distinguish a well- trained singer from an amateur. We explore objective methods to assess the quality of ornamentation rendered by a singer with reference to a model rendition of the same song. Methods are proposed for the perceptually relevant comparison of complex pitch movements based on cognitively salient features of the pitch contour shape. The objective measurements are validated via their observed correlation with subjective ratings by human experts. Such an objective assessment system can serve as a useful feedback tool in the training of amateur singers. Keywords: singing scoring, ornamentation, Indian music, polynomial curve fitting 1 Introduction Evaluation of singing ability involves judging the accuracy of notes and rendering of expression. While learning to sing, the first lessons from the guru (teacher) involve training to be in sur or rendering the notes of the melodic phrase correctly. In the context of Indian Classical music, not only is the sequence of notes critical but also the nature of the transitions between notes. The latter, related to gamaka (ornamentation), is important to the aesthetics of the genre. Hence the next level of singing training involves specific note intonation and the formation of raga- dependent phrases linking notes all of which make the singing more expressive and pleasing to hear. The degree of virtuosity in rendering such expressions provides important cues that distinguish a well-trained singer from an amateur. So incorporating expression scores in the singing evaluation systems for Indian music in general is expected to increase its performance in terms of its accuracy with respect to perceptual judgment. Such a system will be useful in singing competition platforms that involve screening out better singers from large masses. Also such an evaluation system could be used as a feedback tool for training amateur singers. CMMR/FRSM 2011, Springer LNCS 7172, pp. 1-25, 2012
Transcript of Objective Assessment of Ornamentation in Indian Classical ...daplab/... · Objective Assessment of...

Objective Assessment of Ornamentation in Indian
Classical Singing
Chitralekha Gupta and Preeti Rao
Department of Electrical Engineering, IIT Bombay, Mumbai 400076, India
[email protected], [email protected]
Abstract. Important aspects of singing ability include musical accuracy and
voice quality. In the context of Indian classical music, not only is the correct
sequence of notes important to musical accuracy but also the nature of pitch
transitions between notes. These transitions are essentially related to gamakas
(ornaments) that are important to the aesthetics of the genre. Thus a higher level
of singing skill involves achieving the necessary expressiveness via correct
rendering of ornamentation, and this ability can serve to distinguish a well-
trained singer from an amateur. We explore objective methods to assess the
quality of ornamentation rendered by a singer with reference to a model
rendition of the same song. Methods are proposed for the perceptually relevant
comparison of complex pitch movements based on cognitively salient features
of the pitch contour shape. The objective measurements are validated via their
observed correlation with subjective ratings by human experts. Such an
objective assessment system can serve as a useful feedback tool in the training
of amateur singers.
Keywords: singing scoring, ornamentation, Indian music, polynomial curve
fitting
1 Introduction
Evaluation of singing ability involves judging the accuracy of notes and rendering of
expression. While learning to sing, the first lessons from the guru (teacher) involve
training to be in sur or rendering the notes of the melodic phrase correctly. In the
context of Indian Classical music, not only is the sequence of notes critical but also
the nature of the transitions between notes. The latter, related to gamaka
(ornamentation), is important to the aesthetics of the genre. Hence the next level of
singing training involves specific note intonation and the formation of raga-
dependent phrases linking notes all of which make the singing more expressive and
pleasing to hear. The degree of virtuosity in rendering such expressions provides
important cues that distinguish a well-trained singer from an amateur. So
incorporating expression scores in the singing evaluation systems for Indian music in
general is expected to increase its performance in terms of its accuracy with respect to
perceptual judgment. Such a system will be useful in singing competition platforms
that involve screening out better singers from large masses. Also such an evaluation
system could be used as a feedback tool for training amateur singers.
CMMR/FRSM 2011, Springer LNCS 7172, pp. 1-25, 2012

The aim of this work is to formulate a method for objective evaluation of singing
quality based on perceived closeness of various types of expression rendition of a
singer to that of the reference or model singer. The equally important problem of
evaluating singing quality in isolation is not considered in the present work. The
present work is directed towards computationally modeling of the perceived
difference between the test and reference pitch contour shapes. This is based on the
hypothesis that the perceived quality of an ornament rendered in singing is mainly
determined by the pitch contour shape although it is not unlikely that voice quality
and loudness play some role as well. This hypothesis is tested by subjective listening
experiments presented here. Next, several methods to evaluate a specific ornament
type based on the pitch contour extracted from sung phrases have been explored. The
objective measures obtained have been experimentally validated by correlation with
subjective judgments on a set of singers and ornament instances.
2 Related Work
Past computational studies of Indian classical music have been restricted to scales and
note sequences within melodies. There has been some analysis of ornamentation,
specifically of the ornament meend which can be described as a glide connecting two
notes. Its proper rendition involves the accuracy of starting and ending notes, speed,
and accent on intermediate notes [3 - 4]. Perceptual tests to differentiate between
synthesized singing of vowel /a/ with a pitch movement of falling and rising
intonation (concave, convex & linear) between two steady pitch states, 150 and 170
Hz, using a second degree polynomial function, revealed that the different types of
transitory movements are cognitively separable [5]. A methodology for automatic
extraction of meend from the performances in Hindustani vocal music described in
[6] also uses the second degree equation as a criterion for extracting the meend. Also
automatic classification of meend attempted in [7] gives some important observations
like descending meends are the most common, followed by the rise-fall meends
(meend with kanswar). The meends with intermediate touch notes are relatively less
frequent. The duration of meend is generally between 300 - 500 ms. The transition
between notes can also be oscillatory with the pitch contour assuming the shape of
oscillations riding on a glide. Subramanian [8] reports that such ornaments are
common in Indian classical music and he uses Carnatic music to demonstrate, through
cognitive experiments that pitch curves of similar shapes convey similar musical
expression even if the measured note intervals differ.
In Indian classical singing education, the assessment of progress of music learners
has been a recent topic of research interest [2]. In the present work, two ornaments
have been considered viz., glide and oscillations-on-glide. The assessment is with
respect to the “model” or ideal rendition of the same song. Considering the relatively
easy availability of singers for popular Indian film music, we use Hindustani classical
music based movie songs for testing our methods. The previous work reported on
glide has been to model it computationally. In this work, computational modeling has
been used to assess the degree of perceived closeness between a given rendition and a
reference rendition taken to be that of the original playback singer of the song.

3 Methodology
Since we plan to evaluate a rendered ornament with respect to an available reference
audio recording of the same ornament, we need to prepare a database accordingly.
Due to the relatively easy availability of singers for popular music, we choose songs
from old classical music based Hindi film songs that are rich in ornamentation. Next,
both reference and test audio files are subjected to pitch detection followed by
computation of objective measures that seek to quantify the perceptually relevant
differences between the two corresponding pitch contour shapes.
3.1 Reference and Test Datasets
The dataset consisting of polyphonic audio clips from popular Hindi film songs rich
in ornament, were obtained as the reference dataset. The ornament clips (300 ms – 1
sec.) were isolated from the songs for use in the objective analysis. Short phrases (1 –
4 sec. duration) that include these ornament clips along with the neighboring context
were used for subjective assessment. The ornament clips along with some immediate
context makes it perceptually more understandable. The reference songs were sung and recorded by 5 to 7 test singers. The test
singers were either trained or amateur singers who were expected to differ mainly in
their expression abilities. The method of „sing along‟ with the reference (played at a
low volume on one of the headphones) at the time of recording was used to maintain
the time alignment between the reference and test songs.
The polyphonic reference audio files as well as the monophonic test audio files
are processed by a semi-automatic polyphonic pitch detector [9] to obtain a high time-
resolution voice pitch contour (representing the continuous variation of pitch in time
across all vocal segments of the audio signal). It computes pitch every 10 ms interval
throughout the audio segment.
3.2 Subjective Assessment
The original recording by the playback singer is treated as the model, with reference
to which singers of various skill levels are to be rated. The subjective assessment of
the test singers was performed by a set of 3 - 4 judges who were asked either to rank
or to categorize (into good, medium or bad classes) the individual ornament clips of
the test singers based on their closeness to the reference ornament clip.
Kendall’s Coefficient. Kendall's W (also known as Kendall's coefficient of
concordance) is a non-parametric statistic that is used for assessing agreement among
judges [10]. Kendall's W ranges from 0 (no agreement) to 1 (complete agreement).

3.3 Procedure for Computational Modeling and Validation
From the reference polyphonic and test monophonic audio files, first the pitch is
detected throughout the sung segments using the PolyPDA tool [9]. The pitch
values are converted to a semitone (cents) scale to obtain the pitch contour. The ornament is identified in the reference contour and marked manually using
the software PRAAT, and the corresponding ornament segment pitch is isolated
from both the reference and the test singer files for objective analysis. Also
slightly larger segment around the ornament is clipped from the audiofile for the
subjective tests so as to have the context. Model parameters are computed from the reference ornament pitch. Subjective ranks/ratings of the ornaments for each test token compared with the
corresponding reference token are obtained from the judges. Those ornament
tokens that obtain a high inter-judge agreement (Kendall‟s W>0.5) are retained
for use in the validation of objective measures.
The ranks/ratings are computed on the retained tokens using the objective
measures for the test ornament instance in comparison to the reference or model
singer ornament model parameters.
The subjective and objective judgments are then compared by computing a
correlation measure between them.
Glide and oscillations-on-glide ornament pitch segments obtained from the
datasets are separately objectively evaluated.
3.4 Subjective Relevance of Pitch Contour
Since all the objective evaluation methods are based on the pitch contour, a
comparison of the subjective evaluation ranks for two versions of the same ornament
clips - the original full audio and the pitch re-synthesized with a neutral tone, can
reveal how perceptual judgment is influenced by factors other than the pitch variation.
Table 1 shows inter – judge rank correlation (Kendall Coefficient W) for a glide
segment. Correlation between the two versions‟ ranks for each of the judges ranged
from 0.67 to 0.85 with an average of 0.76 for the glide clip. This high correlation
between the ratings of the original voice and resynthesized pitch indicate that the
pitch variation is indeed the major component in subjective assessment of ornaments.
We thus choose to restrict our objective measurement to capturing differences in pitch
contours in various ways.
Table 1. Agreement of subjective ranks for the two versions of ornament test clips (original and pitch re-synthesized)
Ornament Instance
No. of Test
Singers
No. of Judges
Inter-judges’ rank
agreement (W) for Avg. correlation between original and pitch re-syn.
judges’ ranks (W) Original Pitch re-
synthesized Glide 5 4 0.86 0.76 0.76

4 Glide Assessment
A glide is a pitch transition ornament that resembles the ornament meend. Its proper
rendition involves the following: accuracy of starting and ending notes, speed, and
accent on intermediate notes [3]. Some types of glide are shown in Fig.1.
0 0.1 0.2 0.3 0.4 0.5-600
-400
-200
0
200
400
600
Time (sec)
Pitch
Fre
q (
ce
nts
)
0 0.1 0.2 0.3 0.4-400
-350
-300
-250
-200
-150
-100
-50
0
50
Time (sec)
Pitch
Fre
q (
ce
nts
)
0.4 0.45 0.5 0.55 0.6
100
200
300
400
500
600
Time (sec)
Pitch
Fre
q (
ce
nts
)
(a) (b) (c)
Fig.1. Types of Meend (a) simple descending (b) pause on one intermediate note (c) pause on more than one intermediate notes
4.1 Database
This section consists of the reference data, test singing data and the subjective rating description.
Reference and Test Dataset. Two datasets, A and B, consisting of polyphonic audio
clips from popular Hindi film songs rich in ornaments, were obtained as presented in
Table 2. The pitch tracks of the ornament clips were isolated from the songs for use in
the objective analysis. The ornament clips (1 - 4 sec) from Dataset A and the
complete audio clips (1 min. approx.) from Dataset B were used for subjective
assessment as described later in this section. The reference songs of the two datasets
were sung and recorded by 5 to 9 test singers (Table 2).
Subjective Assessment. The original recording by the playback singer is treated as
ideal, with reference to which singers of various skill levels are to be rated.
Dataset A. The subjective assessment of the test singers for Dataset A was performed
by 3 judges who were asked to rank the individual ornament clips of the test singers
based on their closeness to the reference ornament clip. The audio clips for the
ornament glide comprised of the start and end steady notes with the glide in between
them. The judges were asked to rank order the test singers‟ clips based on perceived
similarity with the corresponding reference clip.
Dataset B. The subjective evaluation of the test singers for Dataset B was performed
by 4 judges who were asked to categorize the test singers into one of three categories
(good, medium and bad) based on an overall judgment of their ornamentation skills as
compared to the reference by listening to the complete audio clip. The inter-judge
agreement was 1.0 for both the songs‟ test singer sets.

Table 2. Glide database description
Song Name Singer
No. of
ornament
clips
No. of
Test
singers
Total
no. of
test
tokens
Characteristics of the
ornaments
A1. Kaisi Paheli
(Parineeta)
Sunidhi
Chauhan 3 5 15
All the glides are simple
descending (avg. duration is 1 sec
approx.)
A2.
Nadiya
Kinare
(Abhimaan)
Lata
Mangeshkar 4 5 20
All are descending glides with
pause on one intermediate note
(avg. duration is 0.5 sec approx.)
A3.
Naino Mein
Badra
(MeraSaaya)
Lata
Mangeshkar 3 6 18
All are simple descending glides
(avg. duration is 0.5 sec approx.)
A4.
Raina Beeti
Jaye (Amar
Prem)
Lata
Mangeshkar 4 7 28
First and fourth instances are
simple descending glides, second
and third instances are complex
ornaments (resembling other
ornaments like murki)
B1. Ao Huzoor
(Kismat)
Asha
Bhonsle 4 9 36 All are simple descending glides
B2.
Do Lafzon
(The Great
Gambler)
Asha
Bhonsle 4 8 32 All are simple descending glides
4.2 Objective Measures
For evaluation of glides, two methods to compare the test singing pitch contour with the corresponding reference glide contour are explored: (i) point to point error calculation using Euclidean distance and (ii) polynomial curve fit based matching.
Euclidean distance between aligned contours.Point to point error calculation using
Euclidean distance is the simplest approach. Euclidean distance (ED) between pitch
contours p and q(each of duration n samples) is obtained as below wherepiand qiare
the corresponding pair of time-aligned pitch instances
2
1
,n
i i
i
d p q p q
(1)
But the major drawback of this method is that it might penalize a singer for perceptually unimportant factors because a singer may not have sung „exactly‟ the
same shape as the reference and yet could be perceived to be very similar by the listeners.

Polynomial Curve Fitting. Whereas the Euclidean distance serve to match pitch
contours shapes in fine detail, the motivation for this method is to retain only what
may be the perceptually relevant characteristics of the pitch contour. The extent of fit
of a 2nd degree polynomial equation to a pitch contour segment has been proposed as
a criterion for extracting/detecting meends [6]. This idea has been extended here to
evaluate test singer glides. It was observed in our dataset that 3rd degree polynomial
gives a better fit because of the frequent presence of an „inflection point‟ in the pitch
contours of glides as shown in Fig. 2. An inflection point is a location on the curve
where it switches from a positive radius to negative. The maximum number of
inflection points possible in a polynomial curve is n-2, where n is the degree of the
polynomial equation. A 3rd degree polynomial is fitted to the corresponding reference
glide, and the normalized approximation error of the test glide with respect to this
polynomial is computed. The 3rd
degree polynomial curve fit to the reference glide
pitch contour will be henceforth referred to as „model curve‟.
An R-Square value measures the closeness of any two datasets. A data set has
values yi each of which has an associated modeled value fi, then, the total sum of
squares is given by,
2 tot i
i
SS y y (2)
where, 1
n
i
i
y yn
(3)
The sum of squares of residuals is given by,
2
err i i
i
SS y f (4)
and, 2 1 err
tot
SSR
SS (5)
which is close to 1 if approximation error is close to 0.
0.1 0.2 0.3 0.4 0.5 0.6 0.7
-700
-600
-500
-400
-300
-200
-100
0
Time (sec)
Pitch F
req (
cents
)
Singer pitch
Polynomial Curve fit
0.1 0.2 0.3 0.4 0.5 0.6 0.7
-700
-600
-500
-400
-300
-200
-100
0
Time (sec)
Pitch F
req (
cents
)
Singer pitch
Polynomial Curve fit
(a) (b)
Fig.2. Reference glide polynomial fit of (a) degree 2; P1(x) = ax2+bx+c; R-square = 0.937 (b)
degree 3; P2(x) = ax3+bx2+cx+d; R-square = 0.989
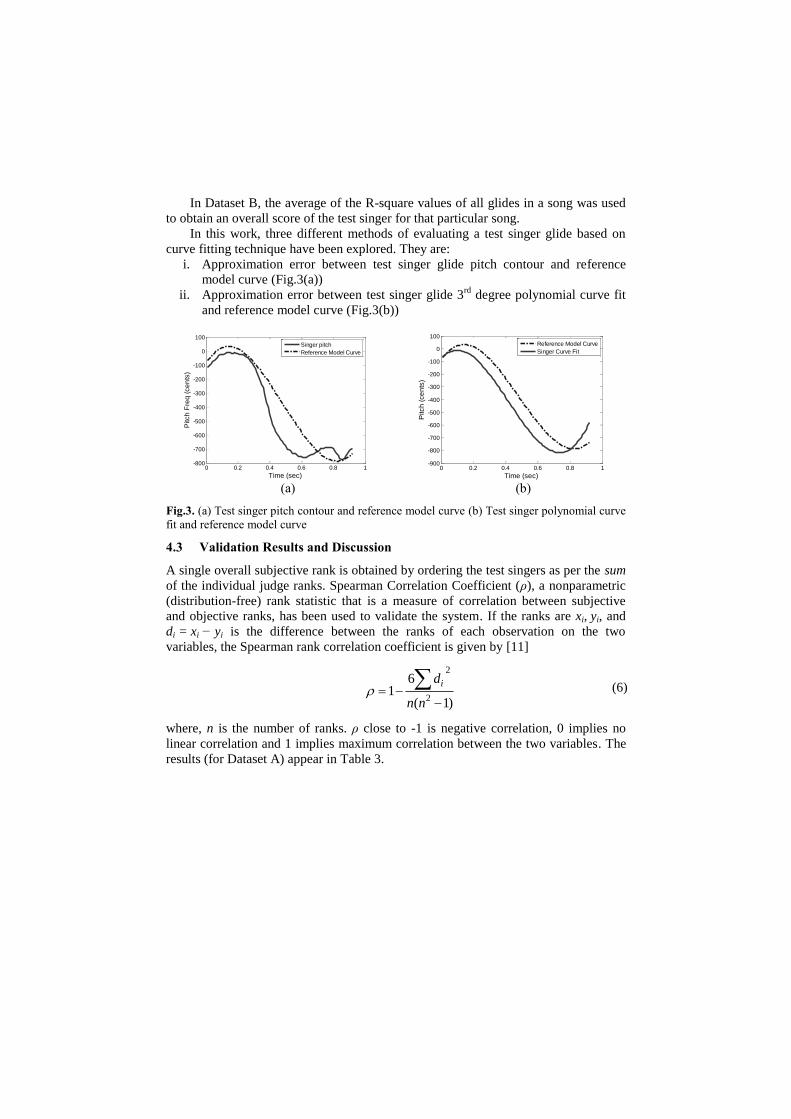
In Dataset B, the average of the R-square values of all glides in a song was used to obtain an overall score of the test singer for that particular song.
In this work, three different methods of evaluating a test singer glide based on curve fitting technique have been explored. They are:
i. Approximation error between test singer glide pitch contour and reference model curve (Fig.3(a))
ii. Approximation error between test singer glide 3rd degree polynomial curve fit and reference model curve (Fig.3(b))
0 0.2 0.4 0.6 0.8 1-800
-700
-600
-500
-400
-300
-200
-100
0
100
Time (sec)
Pitc
h F
req
(ce
nts
)
Singer pitchReference Model Curve
0 0.2 0.4 0.6 0.8 1
-900
-800
-700
-600
-500
-400
-300
-200
-100
0
100
Time (sec)
Pitc
h (
cen
ts)
Reference Model CurveSinger Curve Fit
(a) (b)
Fig.3. (a) Test singer pitch contour and reference model curve (b) Test singer polynomial curve
fit and reference model curve
4.3 Validation Results and Discussion
A single overall subjective rank is obtained by ordering the test singers as per the sum of the individual judge ranks. Spearman Correlation Coefficient (ρ), a nonparametric (distribution-free) rank statistic that is a measure of correlation between subjective and objective ranks, has been used to validate the system. If the ranks are xi, yi, and di = xi − yi is the difference between the ranks of each observation on the two variables, the Spearman rank correlation coefficient is given by [11]
2
2
61
( 1)
id
n n
(6)
where, n is the number of ranks. ρ close to -1 is negative correlation, 0 implies no linear correlation and 1 implies maximum correlation between the two variables. The results (for Dataset A) appear in Table 3.

Table 3. Inter-Judges‟ rank agreement (W) and correlation (ρ) between judges‟ avg. rank and
objective measure rank for the ornament instances for Dataset A. Objective Measure 1: ED,
Measure 2: 3rd degree Polynomial fit with best shift for glide: (i) Test glide pitch contour and
model curve (ii) Test glide 3rd deg. polynomial curve fit and model curve (iii) ED between
polynomial coefficients of the test glide curve fit and the model curve
Type of
Ornament
Instance
no.
Inter-
judges’ rank
agreement
(W)
Correlation between Judges’ avg. rank &
Obj.
measure 1
rank (ρ)
Obj. measure 2 rank (ρ)
(i) (ii)
Simple Descending
Glide
1 0.99 0.75 0.65 0.65
2 0.98 0.35 0.15 0.05
3 0.82 0.77 0.66 0.66
4 0.87 0.48 0.5 0.5
5 0.88 0.94 0.94 0.94
6 0.84 0.93 0.61 0.54
7 0.65 0.67 0.63 0.59
Complex Descending
Glide
1 1 0.5 0.6 0.6
2 0.95 0.48 0 0.2
3 0.96 0.65 0.65 0.55
4 0.73 0.58 0.52 0.87
5 0.70 0.87 0.94 0.94
Dataset A. We observe that out of 12 instances with good inter-judges‟ agreement
(W>0.5), both ED and 3rd
degree Polynomial Curve fit measures give comparable
number of instances with a high rank correlation with the judges‟ rank (ρ >= 0.5)
(Table 4). Methods i. and ii. for Measure 2 (Polynomial Curve Fit) show similar
performance, but method i. is computationally less complex. In the case of simple
glides, Measure 1 (ED) performs as well as Measure 2 (Polynomial Curve Fit)
(methods i. and ii.). ED is expected to behave similar to polynomial modeling
methods because there is not much difference between the real pitch and the modeled
pitch. For simple glides, ED and modeling methods differ in performance only when
there occurs pitch errors like slight jaggedness or a few outlier points in the pitch
contour. Such aberrations get averaged out by modeling, while ED gets affected
because of point-to-point distance calculation.
In case of complex glides however, point-to-point comparisons may not give
reliable results as the undulations and pauses on intermediate notes may not be
exactly time aligned to the reference (although the misalignment is perceptually
unimportant) but ED will penalize it. Also, the complex glides will have a poor curve
fit by a low degree polynomial. A lower degree polynomial is able to capture only the
overall trend of the complex glide, while the undulations and pauses on intermediate
notes that carry significant information about the singing accuracy (as observed from
the subjective ratings) are not appropriately modeled as can be seen in Fig.4.

Table 4.Summary of performance of different measures for the ornament glide in Dataset A
Measures
No. of instances that have ρ>= 0.5
Simple Glides (out of 7
with judges’ rank
agreement)
Complex Glides (out of 5 with
judges’ rank agreement)
1 - Euclidean Distance 5 4
3 - 3rd degree
Polynomial curve fit
(i) 6 4
(ii) 6 4
0 0.05 0.1 0.15 0.2 0.25 0.3 0.35 0.4 0.45-400
-350
-300
-250
-200
-150
-100
-50
0
50
Time (sec)
Pitch
Fre
q (
ce
nts
)
Singer pitch
Polynomial Curve fit
Fig.4. Complex glide (reference) modeled by a 3rd degree polynomial
Dataset B. The overall ornament quality evaluation of the singer as evaluated on
Dataset B has good inter-judge agreement for almost all singers for both the songs in
this dataset. The most frequent rating given by the judges (three out of the four
judges) for a singer was taken as the subjective ground truth category for that singer.
The cases of contention between the judges (two of the four judges for one class and
the other two for another class) have not been considered for objective analysis.
The R-square value of the curve fit measure i. (error between reference model curve and test glide pitch contour) is used for evaluating each of the glide instances for the songs in Dataset B. A threshold of 0.9 was fixed on this measure to state the detection of a particular glide instance. For a test singer, if all the glide instances are detected, the singer‟s overall objective rating is “good”; if the number of detections is
between 75 – 100% of the total number of glide instances in the song, the singer‟s
overall objective rating is “medium”; and if the number of detections is less than 75%,
the singer‟s overall objective rating is “bad”. The above settings are empirical. Table 5 shows the singer classification confusion matrix. Though no drastic misclassifications between good and bad singer classification is seen but the overall correct classification is very poor 31.25% due to large confusion with the “medium”
class. One major reason for this inconsistency was that the full audio clips also contained complex glides and other ornaments that influenced the overall subjective ratings while the objective analysis was based solely on the selected instances of simple glides. This motivates the need of objective analysis of complex ornaments so as to come up with an overall expression rating of a singer.

Table 5. Singer classification confusion matrix for Dataset B
Objectively→
Subjectively↓ G M B
G 0 3 0
M 2 0 4
B 0 2 5
5 Assessment of Oscillations-on-glide
The ornament „oscillations-on-glide‟ refers to an undulating glide. Nearly periodic
oscillations ride on a glide-like transition from one note to another. The
oscillations may or may not be of uniform amplitude. Some examples of this
ornament appear in Fig. 5. While the melodic fragment represented by the pitch contour could be transcribed into a sequence of notes or scale intervals, it has been observed that similar shaped contours are perceived to sound alike even if the note intervals are not identical [8]. From Fig. 5, we see that prominent measurable attributes of the pitch contour shape of the undulating glide are the overall (monotonic) trajectory of the underlying transition, and the amplitude and rate of the oscillations. The cognitive salience of these attributes can be assessed by perceptual experiments where listeners are asked to attend to a specific perceptual correlate while rating the quality. Previous work has shown the cognitive salience of the rate of the transition of synthesized meend signals [5].
0 0.05 0.1 0.15 0.2 0.25 0.3 0.35 0.4 0.45-300
-200
-100
0
100
200
300
400
500
Time (sec)
Pitc
h F
req
(ce
nts
)
0 0.05 0.1 0.15 0.2 0.25 0.3 0.35 0.4
-400
-300
-200
-100
0
100
200
300
Time (sec)
Pitch
Fre
q (
ce
nts
)
Fig.5. Fragments of pitch contour extracted from a reference song: (a) ascending glide with
oscillations (b) descending glide with oscillations

5.1 Database
Reference and Test Dataset. The reference dataset, consisting of polyphonic audio
clips from popular Hindi film songs rich in ornaments, were obtained as presented in
Table 6. The pitch tracks of the ornament clips were isolated from the songs for use in
the objective analysis. Short phrases containing the ornament clips (1 - 4 sec) were
used for subjective assessment as described later in this section. The reference songs
were sung and recorded by 6 to 11 test singers (Table 6).
Table 6. „Oscillations-on-glide‟ database description
Song
No. Song Name Singer
No. of
ornament
clips
No. of
Test
singers
Total
no. of
test
tokens
Characteristics of the ornaments
1. Ao Huzoor
(Kismat)
Asha
Bhonsle 3 6 18
All three instances are descending
oscillations-on-glide. Duration:
400 ms (approx.)
2.
Nadiya
Kinare
(Abhimaan)
Lata
Mangeshkar 3 8 24
All three instances are ascending oscillations-on-glide. Duration:
380 - 450 ms (approx.)
3.
Naino Mein
Badra (Mera
Saaya)
Lata
Mangeshkar 13 11 143
All thirteen instances are ascending oscillations-on-glide.
Duration: 300 - 500 ms (approx.)
Observations on Pitch Contour of Oscillations-on-Glide. This ornament can be
described by the rate of transition, rate of oscillation and oscillation amplitude which
itself may not be uniform across the segment but show modulation (A.M.). Rate of
oscillations is defined as the number of cycles per second. The range of the oscillation
rate is seen to be varying from 5 to 11 Hz approximately as observed from the 19
instances of the reference ornament. Some observations for these 19 reference
instances are tabulated in Table7. 11 out of the 19 instances are within the vibrato
range of frequency, but 8 are beyond the range. Also 7 of the instances show
amplitude modulation. The rate of transition varied from 890 to 2000 cents per
second.
Table 7.Observations on the pitch contour of oscillations-on-glide
Rate range (Hz) # of instances without A.M. # of instances with A.M. 5 – 8 5 6
8 – 10 6 0 10 – 12 1 1
Subjective Assessment
Holistic ground-truth. Three human experts were asked to give a categorical rating
(Good (G), Medium (M) and Bad (B)) to each ornament instance of the test singers.

The most frequent rating given by the judges (two out of the three judges) for an
instance was taken as the subjective ground truth category for that ornament instance.
Out of the total of 185 test singers‟ ornament tokens (as can be seen from
6), 105 tokens were subjectively annotated and henceforth used in the validation
experiments. An equal number of tokens were present in each of these classes (35
each). Henceforth whenever an ornament instance of a singer is referred to as
good/medium/bad, it implies the subjective rating of that ornament instance.
Parameter-wise ground-truth. Based on the kind of feedback expected from a music
teacher about the ornament quality, a subset of the test ornament tokens (75 test
tokens out of 105) were subjectively assessed by one of the judges separately for each
of the three attributes: accuracy of the glide (start and end notes, and trend),
amplitude of oscillation, and rate (number of oscillations) of oscillation. For each of
these parameters, the test singers were categorized into good/medium/bad for each
ornament instance. These ratings are used to investigate the relationship between the
subjective rating and individual attributes.
5.2 Modeling Parameters
From observations, it was found that modelling of this ornament can be divided into 2
components with 3 parameters in all:
i. Glide
ii. Oscillation
a. Amplitude
b. Rate Glide represents the overall monotonic trend of the ornament while transiting
between two correct notes. Oscillation is the pure vibration around the monotonic
glide. Large amplitude and high rate of oscillations are typically considered to be
good and requiring skill. On the other hand, low amplitude of oscillation makes the
rate of oscillation irrelevant, indicating that rate should be evaluated only after the
amplitude of oscillation crosses a certain threshold of significance.
5.3 Implementation of Objective Measures
Glide. Glide modeling, as presented in Section 0, involves a 3rd
degree polynomial
approximation of the reference ornament pitch contour that acts as a model to
evaluate the test ornament. A similar approach has been taken to evaluate the glide
parameter of the ornament oscillations-on-glide. The 3rd
degree polynomial curve fit
is used to capture the underlying glide transition of the ornament. Since the glide
parameter of this ornament characterizes the trend in isolation, the following
procedure is used to assess the quality of the underlying glide.
Fit a “trend model” (3rd
degree polynomial curve fit) in the reference
ornament (Fig.6(a))
Similarly fit a 3rd
degree curve into the test singer ornament (Fig.6(b))
A measure of distance of the test singer curve fit from the reference trend
model evaluates the overall trend of the test singer‟s ornament

As in Section 5, the R-square value is the distance measure used here; R-sq close to
1 implies closer to the trend model (reference model) (Fig. 6(c)). This measure is
henceforth referred to as glide measure.
0 0.05 0.1 0.15 0.2 0.25 0.3 0.35 0.4-400
-300
-200
-100
0
100
200
300
Time (sec)
Pitch
Fre
q (
ce
nts
)
Singer pitch
Polynomial Curve fit
0 0.05 0.1 0.15 0.2 0.25 0.3 0.35 0.4
-400
-300
-200
-100
0
100
200
Time (sec)P
itch
Fre
q (
ce
nts
)
Singer pitch
Polynomial Curve fit
(a) (b)
0 0.05 0.1 0.15 0.2 0.25 0.3 0.35 0.4-350
-300
-250
-200
-150
-100
-50
0
50
100
150
Time (sec)
Pitch
(ce
nts
)
Model Curve (Ref. Curve Fit)
Singer Curve Fit
(c)
Fig.6. (a) „Trend Model‟; 3rd degree curve fit into reference ornament pitch (b) 3rd degree curve
fit into test singer ornament pitch (c) Trend Model and Test curve fit shown together; R-square
= 0.92
Oscillations. To analyze the oscillations component of the ornament, we need to first
subtract the trend from it. This is done by subtracting the vertical distance of the
lowest point of the curve from every point on the pitch contour, and removing DC
offset, as shown in Fig.7.
The trend-subtracted oscillations, although similar in appearance to vibrato, differ
in following important ways:
i. Vibrato has approximately constant amplitude across time, while this ornament may have varying amplitude, much like amplitude modulation, and thus frequency domain representation may show double peaks or side humps
ii. The rate of vibrato is typically between 5 - 8 Hz [12]while the rate of this oscillation may be as high as 10 Hz
These oscillations are, by and large, characterized by their amplitude and rate, both
of which are studied in the frequency and time domain in order to obtain the best
parameterization.

0 0.05 0.1 0.15 0.2 0.25 0.3 0.35 0.4-400
-300
-200
-100
0
100
200
Time (sec)
Pitch
(ce
nts
)
Singer pitch
Polynomial Curve fit
0 0.05 0.1 0.15 0.2 0.25 0.3 0.35 0.4-100
-50
0
50
100
150
Time (sec)
pitch
(ce
nts
)
Fig.7. Trend Subtraction
Frequency domain attributes.
Amplitude. Ratio of the peak amplitude in the magnitude spectrum of test
singer ornament pitch contour to that of the reference. This measure is
henceforth referred to as frequency domain oscillation amplitude feature
(FDOscAmp).
max max
test
ref
Z kFDOscAmp
Z k (7)
where Ztest(k) and Zref(k) are the DFT of the mean-subtracted pitch trajectory
z(n) of the test singer and reference ornaments respectively.
Rate. Ratio of the frequency of the peak in the magnitude spectrum of the test
singer ornament pitch contour to that of the reference. This measure is
henceforth referred to as frequency domain oscillation rate feature
(FDOscRate). The ratio of energy around test peak frequency to energy in 1 to 20 Hz may show
spurious results if the test peak gets spread due to amplitude modulation (Fig.8). Also
it was observed that amplitude modulation does not affect the subjective assessment.
Thus the scoring system should be designed to be insensitive to the amplitude
modulation. This is taken care of in frequency domain analysis by computing the sum
of the significant peak amplitudes (3 point local maxima with a threshold of 0.5 of the
maximum on the magnitude) and average of the corresponding peak frequencies and
computing the ratio of these features of the test ornament to that of the reference
ornament.

0 0.05 0.1 0.15 0.2 0.25 0.3 0.35 0.4 0.45-300
-200
-100
0
100
200
300
400
Time (sec)
Pitch
(ce
nts
)
Reference Pitch
Singer Pitch
(a)
0 0.05 0.1 0.15 0.2 0.25 0.3 0.35 0.4 0.45-200
-100
0
100
time (sec)
pitch (
cents
)
0 5 10 15 20 25 30 35 40 45 500
500
1000
1500
freq (Hz)FF
T a
mplit
ude o
f pitch c
onto
ur
0 0.05 0.1 0.15 0.2 0.25 0.3 0.35 0.4 0.45-100
-50
0
50
100
time (sec)
pitch (
cents
)
0 5 10 15 20 25 30 35 40 45 500
200
400
600
800
freq (Hz)FF
T a
mplit
ude o
f pitch c
onto
ur
(b) (c)
Fig.8. (a) Reference and Test ornament pitch contours for a “good” test instance, (b) Trend
subtracted reference ornament pitch contour and frequency spectrum, (c) Trend subtracted test
singer ornament pitch contour and frequency spectrum
Time domain attributes. Due to the sensitivity of frequency domain measurements to
the amplitude modulation that may be present in the trend-subtracted oscillations, the
option of time-domain characterization is explored. The pitch contour in time domain
may sometimes have jaggedness that might affect a time domain feature that uses
absolute values of the contour. Hence a 3-point moving average filter has been used to
smoothen the pitch contour (Fig. 9)
Amplitude. Assuming that there exists only one maxima or minima between
any two zero crossings of the trend subtracted smoothened pitch contour of the
ornament, the amplitude feature computed is the ratio of the average of the
highest two amplitudes of the reference ornament to that of the test singer
ornament. The average of only the highest two amplitudes as opposed to
averaging all the amplitudes has been used here to make the system robust to
amplitude modulation (Fig. 9). This measure is henceforth referred to as time
domain oscillation amplitude feature (TDOscAmp).
Rate. The rate feature in time domain is simply the ratio of the number of zero
crossings of ornament pitch contour of the test singer to that of the reference
(Fig. 9). This measure is henceforth referred to as time domain oscillation rate

feature (TDOscRate).
0 .05 .1 .15 .2 .25 .3 .35 .4 .45-40
-20
0
20
40
60
Time (sec)
Pitch
(ce
nts
)
0 .05 .1 .15 .2 .25 .3 .35 .4 .45-40
-20
0
20
40
60
Time (sec)
Pitch
(ce
nts
)
Smoothened pitch contour
Zero Crossings
Maximas and Minimas
Pitch contour
Fig. 9. Trend subtracted pitch contour and smoothened pitch contour with zero crossings and
maxima and minima marked
5.4 Results and Discussion
This section first describes the performance of the different measures of each of the
modelling parameters using the parameter-wise ground truths for validation. Then
the different methods of combining the best attributes of the individual model
parameters to get a holistic objective rating of the ornament instance have been
discussed.
Glide Measure. In the scatter plot (Fig.10), the objective score is the glide measure
for each instance of ornament singing that are shape coded by the respective
subjective rating of glide (parameter-wise ground-truth). We observe that the “bad”
ratings are consistently linked to low values of the objective measure. The “medium”
rated tokens show a wide scatter in the objective measure. The medium and the good
ratings were perceptually overlapping in a lot of cases (across judges) and thus the
overlap shows up in the scatter plot as well. A threshold of 0.4 on the objective
measure would clearly demarcate the bad singing from the medium and good singing.
It has been observed that even when the oscillations are rendered very nicely, there is
a possibility that the glide is bad (Fig.11). It will be interesting to see the weights that
each of these parameters get in the holistic rating.

0
0.2
0.4
0.6
0.8
1
1.2
Singers
Ob
jective
Sco
re
Good
Medium
Bad
Fig.10. Scatter Plot for Glide Measure
0 0.05 0.1 0.15 0.2 0.25 0.3 0.35 0.4-400
-200
0
200
400
Time (sec)
Pitch
Fre
q (
ce
nts
)
0 0.05 0.1 0.15 0.2 0.25 0.3 0.35 0.4-400
-300
-200
-100
0
100
200
Time (sec)
Pitch
Fre
q (
ce
nts
)
Reference curve fit
Singer curve fit
Reference pitch contour
Singer pitch contour
Fig.11. Reference and singer ornament pitch contour and glide curve fits
160 cents

Oscillation Amplitude Measures. In the scatter plot (Fig.12), the objective score is
the oscillation amplitude measure for each instance of ornament singing that are shape
coded by the respective subjective rating of oscillation amplitude (parameter-wise
ground-truth). As seen in the scatter plot, both frequency and time domain features by
and large separate the good and the bad instances well. But there are a number of
medium to bad misclassification by the frequency domain feature assuming a
threshold at objective score equal to 0.4. A number of bad instances are close to the
threshold, this happens because of occurrence of multiple local maxima in the
spectrum of the bad ornament that add up to have a magnitude comparable to that of
the reference magnitude, and hence a high magnitude ratio (Fig.13). Also a few of the
good instances are very close to this threshold in frequency domain analysis. This
happens because of the occurrence of amplitude modulation that reduces the
magnitude of the peak in the magnitude spectrum (Fig.14).
The number of misclassifications by the time domain amplitude feature is
significantly less. The mediums and the goods are clearly demarcated from the bads
with a threshold of 0.5 only with a few borderline cases of mediums.
0
0.2
0.4
0.6
0.8
1
Singers
Ob
jective
Sco
re
Good
Medium
Bad
0
0.2
0.4
0.6
0.8
1
Singers
Ob
jective
Sco
re
Good
Medium
Bad
(a) (b)
Fig.12. Scatter plot for Oscillation Amplitude measure in (a) Frequency domain (b) Time
domain
0 0.05 0.1 0.15 0.2 0.25 0.3 0.350
50
100
150
200
250
300
350
400
450
Time (sec)
Pitc
h (
ce
nts
)
Reference Pitch
Singer Pitch
0 0.05 0.1 0.15 0.2 0.25 0.3 0.35-50
0
50
Time (sec)
Pitch
(ce
nts
)
0 5 10 15 20 25 30 35 40 45 500
100
200
300
Freq (Hz)FF
T a
mp
litu
de
of p
itch
co
nto
ur
FFT (512 point)
(a) (b)
Fig.13. (a) Bad ornament pitch along with reference ornament pitch (b) Trend subtracted bad
ornament pitch from (a) and its magnitude spectrum
0 0.05 0.1 0.15 0.2 0.25 0.3 0.35 0.4-200
-100
0
100
time (sec)
pitch
(ce
nts
)
0 5 10 15 20 25 30 35 40 45 500
500
1000
1500
freq (Hz)
FF
T a
mp
litu
de
of p
itch
co
nto
ur
0 0.05 0.1 0.15 0.2 0.25 0.3 0.35 0.4-100
-50
0
50
100
time (sec)
pitch
(ce
nts
)
0 5 10 15 20 25 30 35 40 45 500
200
400
600
800
freq (Hz)
FF
T a
mp
litu
de
of p
itch
co
nto
ur
(a) (b)
Fig.14. Trend subtracted ornament pitch and magnitude spectrum of (a) Reference (b) Good
ornament instance
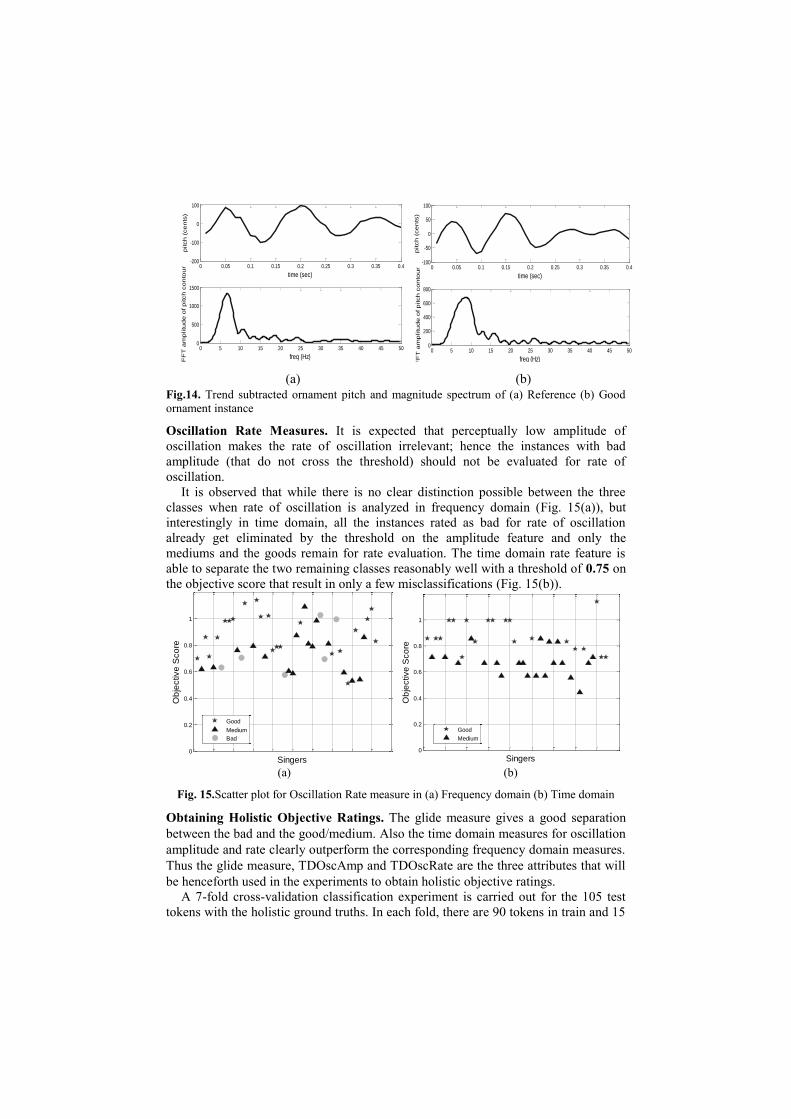
Oscillation Rate Measures. It is expected that perceptually low amplitude of
oscillation makes the rate of oscillation irrelevant; hence the instances with bad
amplitude (that do not cross the threshold) should not be evaluated for rate of
oscillation.
It is observed that while there is no clear distinction possible between the three
classes when rate of oscillation is analyzed in frequency domain (Fig. 15(a)), but
interestingly in time domain, all the instances rated as bad for rate of oscillation
already get eliminated by the threshold on the amplitude feature and only the
mediums and the goods remain for rate evaluation. The time domain rate feature is
able to separate the two remaining classes reasonably well with a threshold of 0.75 on
the objective score that result in only a few misclassifications (Fig. 15(b)).
0
0.2
0.4
0.6
0.8
1
Singers
Ob
jective
Sco
re
Good
Medium
Bad
0
0.2
0.4
0.6
0.8
1
Singers
Ob
jective
Sco
re
Good
Medium
(a) (b)
Fig. 15.Scatter plot for Oscillation Rate measure in (a) Frequency domain (b) Time domain
Obtaining Holistic Objective Ratings. The glide measure gives a good separation
between the bad and the good/medium. Also the time domain measures for oscillation
amplitude and rate clearly outperform the corresponding frequency domain measures.
Thus the glide measure, TDOscAmp and TDOscRate are the three attributes that will
be henceforth used in the experiments to obtain holistic objective ratings.
A 7-fold cross-validation classification experiment is carried out for the 105 test
tokens with the holistic ground truths. In each fold, there are 90 tokens in train and 15

in test. Equal distribution of tokens exists across all the three classes in both train and
test sets. Two methods of obtaining the holistic scores have been explored, a purely
machine learning method and a knowledge-based approach.
While a machine learning framework like Classification and Regression Trees
(CART) [13] (as provided by The MATLAB Statistics Toolbox) can provide a system
for classifying ornament quality from the measured attributes of glide, TDOscAmp
and TDOscRate, it is observed that a very complex tree results from the direct
mapping of the actual real number values of these parameters to ground-truth
category. With the limited training data, this tree has limited generalizability and
performs poorly on test data. So, we adopt instead simplified parameters obtained by
the thresholds suggested by the scatter plots of Figs. 10, 12 and 15 which is consistent
with the notion that human judgments are not finely resolved but rather tend to be
categorical with underlying parameter changes.
From the thresholds derived from the observations of the scatter plots and
combining the two time domain features for oscillation using the parameter-wise
ground-truths, as explained earlier, we finally have two attributes – the glide measure
and the combined oscillation measure. Glide measure gives a binary decision (0, 1)
while the combined oscillation measure (TDOsc) gives a three level decision (0, 0.5,
1). Using the thresholds obtained, we have a decision tree representation for each of
these features as shown in Fig. 16. Each branch in the tree is labeled with its decision
rule, and each terminal node is labeled with the predicted value for that node. For
each branch node, the left child node corresponds to the points that satisfy the
condition, and the right child node corresponds to the points that do not satisfy the
condition. With these decision boundaries, the performance of the individual
attributes is shown in Table 8.
Glide < 0.4
0 1
TDOscAmp< 0.5
0
1 0.5
(a) (b)
TDOscRate< 0.75
Fig. 16. Empirical threshold based quantization of the features of (a) Glide (b) Oscillation
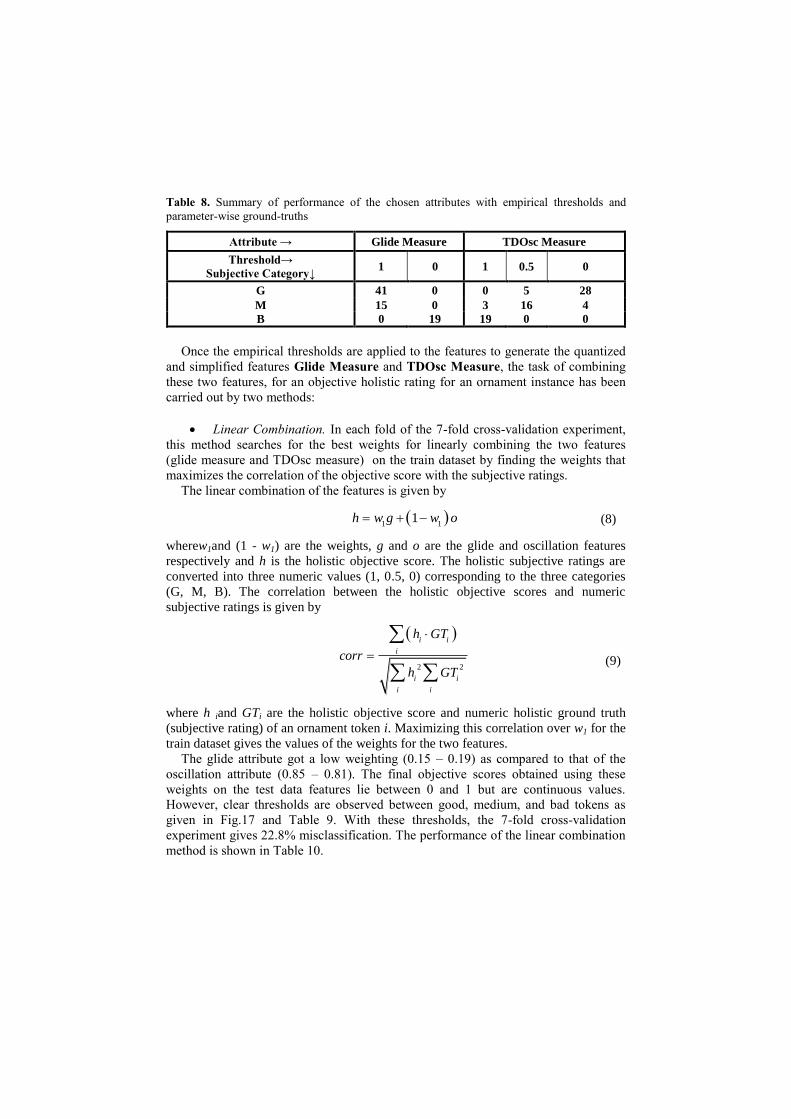
Table 8. Summary of performance of the chosen attributes with empirical thresholds and
parameter-wise ground-truths
Attribute → Glide Measure TDOsc Measure
Threshold→ Subjective Category↓
1 0 1 0.5 0
G 41 0 0 5 28 M 15 0 3 16 4 B 0 19 19 0 0
Once the empirical thresholds are applied to the features to generate the quantized
and simplified features Glide Measure and TDOsc Measure, the task of combining
these two features, for an objective holistic rating for an ornament instance has been
carried out by two methods:
Linear Combination. In each fold of the 7-fold cross-validation experiment,
this method searches for the best weights for linearly combining the two features
(glide measure and TDOsc measure) on the train dataset by finding the weights that
maximizes the correlation of the objective score with the subjective ratings.
The linear combination of the features is given by
1 11h w g w o (8)
wherew1and (1 - w1) are the weights, g and o are the glide and oscillation features respectively and h is the holistic objective score. The holistic subjective ratings are converted into three numeric values (1, 0.5, 0) corresponding to the three categories (G, M, B). The correlation between the holistic objective scores and numeric subjective ratings is given by
2 2
i i
i
i i
i i
h GT
corrh GT
(9)
where h iand GTi are the holistic objective score and numeric holistic ground truth (subjective rating) of an ornament token i. Maximizing this correlation over w1 for the train dataset gives the values of the weights for the two features.
The glide attribute got a low weighting (0.15 – 0.19) as compared to that of the
oscillation attribute (0.85 – 0.81). The final objective scores obtained using these
weights on the test data features lie between 0 and 1 but are continuous values.
However, clear thresholds are observed between good, medium, and bad tokens as
given in Fig.17 and Table 9. With these thresholds, the 7-fold cross-validation
experiment gives 22.8% misclassification. The performance of the linear combination
method is shown in Table 10.

0 20 40 60 80 100 1200
0.2
0.4
0.6
0.8
1
Singers
Ho
listic O
bje
ctive
Sco
re
Good
Medium
Bad
Fig.17. Scatter plot of the holistic objective score obtained from Linear Combination method
Table 9. Thresholds for objective classification on holistic objective score obtained from
Linear Combination method
Holistic Objective Score Objective classification
>= 0.8 G
0.35 – 0.8 M
<0.35 B
Table 10.Token classification results of 7-fold cross-validation with Linear Combination
method
Objectively→ Subjectively↓
G M B
G 32 3 0 M 11 17 7 B 0 3 32
Decision boundaries using CART. Another method of obtaining a holistic
objective rating of an ornament instance is to obtain decision boundaries from a
classification tree trained on the two quantized features Glide measure and TDOsc
measure. A 7-fold cross-validation experiment has been carried out and testing in
each of the folds has been done once with the full tree and next with the pruned tree.
Both full and pruned tree cross-validation experiments gave 22.8% misclassifications.
A full tree for the entire dataset (105 tokens) is shown in Fig. 18. Because of the
simplified nature of the features, the full tree itself is a short tree with a few nodes and
branches and hence mostly the best level of pruning comes out to be zero implying
that the tree remains un-pruned and thus no difference in performance. Also it was
observed that misclassification rate in this case is same as that in linear combination.
The token classification confusion matrix is also same for both the cases (Table 10).
This suggests that the simple weighted linear combination of attributes provides an
adequate discrimination of quality.

Fig.18. Full tree by machine learning using thresholded features
6 Conclusion
Pitch contour shapes are shown to be sufficient in the characterization of the
perceived similarity between a reference and test rendering of an ornament in vocal
music. Modelling the pitch contour shape by polynomial curve fitting for has given
encouraging results in objective assessment. Out of 7 simple glides (that closely
resemble the Indian classical music ornament meend), the objective ratings obtained
from 3rd
degree polynomial curve approximation method for 6 of these show high
correlation with the subjective ratings. The complex ornament termed „oscillations-
on-glide‟ (similar to the Indian classical music ornament Gamak) has been modelled
in terms of individual cognitively salient attributes. Various frequency and time domain features were explored for the oscillation modelling. The time domain features for oscillation perform better than the corresponding frequency domain features. With 23% misclassification in the 3-category quality rating, there were no
confusions observed between the two extreme categories. Since this ornament is a
critical differentiator between a good and a bad singer, a fair automatic assessment of
this ornament will be very useful in singing scoring systems.
Further an attempt was made to get an overall judgment of a singer‟s
ornamentation skills from the complete audio clip (not just the individual instances)
based on objectively evaluated vibratos and glides of the audio clip. This too gave
Glide < 0.5
M G
TDOsc< 0.25
B
M
TDOsc< 0.75

encouraging results clearly indicating the feasibility of objective assessment of
singers based on their ornamentation skills.
Future work will target a framework more suited to Indian classical vocal music
performance where the test singer‟s rendition may not be time aligned with that of the
ideal singer. An ornament assessment system in such a scenario demands reliable
automatic detection of ornaments. In the context of purely improvised Indian classical
music, the task of evaluation becomes even more challenging as it demands
evaluation without a copycat reference and hence the need for more universal
computational models.
References
1. Sundberg, J.: The science of the singing voice. Northern Illinois Univ. Press, Illinois, USA
(1987)
2. Datta, A., Sengupta, R., Dey, N.: On the possibility of objective assessment of students of
Hindustani Music. Ninaad Journal of ITC Sangeet Research Academy 23, 44-57 (2009)
3. Bor, J., Rao, S., Meer, W., Harvey, J.: The Raga Guide, A survey of 74 Hindustani Ragas.
Wyastone Estate Limited (2002)
4. In: ITC Sangeet Research Academy: A trust promoted by ITC Limited. Available at:
http://www.itcsra.org/alankar/alankar.html
5. Datta, A., Sengupta, R., Dey, N., Nag, D., Mukherjee, A.: Perceptual evaluation of
synthesized „meends‟ in Hindustani music. In : Frontiers of Research on Speech and Music
(2007)
6. Datta, A., Sengupta, R., Dey, N., Nag, D.: A methodology for automatic extraction of
'meend' from the performances in Hindustani vocal music. Ninaad Journal of ITC Sangeet
Research Academy 21, 24-31 (2007)
7. Datta, A., Sengupta, R., Dey, N., Nag, D.: Automatic classification of 'meend' extracted
from the performances in Hindustani vocal music. In : Frontiers of Research on Speech and
Music, Kolkata (2008)
8. Subramanian, M.: Carnatic RagamThodi – Pitch Analysis of Notes and Gamakams. Journal
of the Sangeet Natak Akademi, XLI(1), 3-28 (2007)
9. Pant, S., Rao, V., Rao, P.: A melody detection user interface for polyphonic music. In : NCC
2010, IIT Madras (2010)
10. Kendall, M. G.: Rank Correlation Methods 2nd edn. Hafner Publishing Co., New York
(1955)
11.Spearman, C.: The proof and measurement of association between two things. Amer. J.
Psychol. 15, 72-101 (1904)
12.Nakano, T., Goto, M., Hiraga, Y.: An automatic singing skill evaluation method for
unknown melodies using pitch interval accuracy and vibrato features. In : Interspeech 2006,
Pittsburgh (2006)
13.Steinberg, D., Colla, P.: CART: Tree-Structured Nonparametric Data Analysis. In: Salford
Systems, San Diego, CA (1995)