NVTC Agenda 12-2-10 · result from eliminating the RAB does not compare to the large benefit of...
391
NVTC COMMISSION MEETING THURSDAY, DECEMBER 2, 2010 8:00 PM NVTC CONFERENCE ROOM NOTE: A buffet supper will be provided for attendees. AGENDA 1. Minutes of the NVTC Meeting of November 4, 2010. Recommended Action : Approval. 2. NVTC Audit Results for FY 2010. Representatives from PBGH LLP will be present to describe the results of their annual examination of NVTC’s financial statements. Recommended Action : Authorize NVTC staff to distribute the audited financial statements to regulatory agencies, local and state jurisdictions, bond holders and other interested parties and to post the results on NVTC’s website. 3. VRE Items. A. Report from the VRE Operations Board and VRE Chief Executive Officer-- Information Item . B. FY 2010 Audited VRE Financial Statements -- Action Item/Resolution #2159 . C. Sale of 10 VRE Locomotives -- Action Item/Resolution #2160 . 4. NVTC’s and VRE’s Legislative Agendas for 2011. NVTC’s Legislative Committee will meet in November and provide recommendations to the commission. VRE’s Operations Board has forwarded the proposed VRE Legislative Agenda for consideration. Copies of VTA’s and NVTA’s approved legislative agendas are attached together with NVTC’s letter to Congress opposing the sunset of increased transit commuter benefits. Recommended Action : Approve the proposed agendas and authorize staff to distribute and work to accomplish them.
Transcript of NVTC Agenda 12-2-10 · result from eliminating the RAB does not compare to the large benefit of...

NVTC COMMISSION MEETING
THURSDAY, DECEMBER 2, 2010 8:00 PM
NVTC CONFERENCE ROOM
NOTE: A buffet supper will be provided for attendees.
AGENDA
1. Minutes of the NVTC Meeting of November 4, 2010. Recommended Action: Approval.
2. NVTC Audit Results for FY 2010.
Representatives from PBGH LLP will be present to describe the results of their annual examination of NVTC’s financial statements. Recommended Action: Authorize NVTC staff to distribute the audited financial statements to regulatory agencies, local and state jurisdictions, bond holders and other interested parties and to post the results on NVTC’s website.
3. VRE Items. A. Report from the VRE Operations Board and VRE Chief Executive Officer--
Information Item.
B. FY 2010 Audited VRE Financial Statements -- Action Item/Resolution #2159. C. Sale of 10 VRE Locomotives -- Action Item/Resolution #2160.
4. NVTC’s and VRE’s Legislative Agendas for 2011. NVTC’s Legislative Committee will meet in November and provide recommendations to the commission. VRE’s Operations Board has forwarded the proposed VRE Legislative Agenda for consideration. Copies of VTA’s and NVTA’s approved legislative agendas are attached together with NVTC’s letter to Congress opposing the sunset of increased transit commuter benefits. Recommended Action: Approve the proposed agendas and authorize staff to distribute and work to accomplish them.

2
5. Draft NVTC Work Program for 2011. Staff has prepared a draft for review. Additional suggestions from commissioners are requested. Recommended Action: Authorize staff to release the draft for public comment and to schedule a public hearing for January 6, 2011.
6. Comments on Proposed Revisions to National Transit Database Reporting. Proposed changes by FTA in the Federal Register could seriously reduce federal formula funds flowing to the region. Other changes could benefit the region’s new vanpool program. Recommended Action: Authorize Chairman Hudgins to send a letter containing comments to FTA by the December 6th deadline for comments.
7. WMATA Items. Among the items presented are WMATA’s General Manager’s report for November. Progress is described on discussions with the Commonwealth of Virginia about WMATA funding, safety and governance. A copy of the BOT/MWCOG report on WMATA’s governance is provided. Discussion Item.
8. Progress on the Upcoming NVTC Move to a New Office. A report is provided on progress. The move to 2300 Wilson Boulevard (Suite 620) in Arlington must be completed by the end of December, 2010. Information Item.
9. Regional Transportation Items. A. Pentagon Transit Security. B. CEO’s for Cities Critique of Texas Transportation Congestion Measures.
Information Item.

3
10. NVTC Nominating Committee for 2011 Officers.
Chairman Hudgins will announce her appointments. Information Item.
11. NVTC Financial Items for October, 2010.
Information Item.
12. Personnel Item. Closed Session: Virginia Code Section 2.2-3711.A.1.

AGENDA ITEM #1
MINUTES
NVTC COMMISSION MEETING – NOVEMBER 4, 2010 NVTC CONFERENCE ROOM – ARLINGTON, VIRGINIA
The meeting of the Northern Virginia Transportation Commission was called to order by Chairman Hudgins at 8:10 P.M. Members Present Sharon Bulova Barbara Comstock John Cook Thelma Drake Adam Ebbin William D. Euille Jay Fisette John Foust Jeffrey Greenfield Mark R. Herring Catherine Hudgins Mary Hynes Joe May Jeffrey McKay Paul Smedberg David F. Snyder Christopher Zimmerman Members Absent Kelly Burk Thomas Rust Mary Margaret Whipple Staff Present Rhonda Gilchrest Scott Kalkwarf Greg McFarland Adam McGavock Stephen MacIsaac (VRE) Kala Quintana Jennifer Straub (VRE) Rick Taube Dale Zehner (VRE)

2
Approval of the Agenda
Chairman Hudgins stated that Richard Sarles, WMATA’s interim general manager, will give a presentation during the WMATA agenda item. There were no objections to adding this to the agenda. Minutes of the NVTC Meeting of October 7, 2010
On a motion by Mr. Zimmerman and a second by Mrs. Hynes, the commission unanimously approved the minutes. The vote in favor was cast by commissioners Bulova, Cook, Drake, Ebbin, Euille, Fisette, Foust, Greenfield, Herring, Hudgins, Hynes, May, Smedberg, Snyder and Zimmerman. Mr. McKay abstained since he did not attend last month’s meeting. VRE Items Report from the VRE Operations Board and VRE Chief Executive Officer. Mr. Zehner reported that VRE’s average daily ridership was over 17,000 for the month of October. VRE’s highest ridership day was October 13th with 19,322 daily passenger trips. Systemwide on-time performance was at 89 percent for the month of October. The majority of the delays were due to weather issues, including flood restrictions. Prince William County has developed plans to add approximately 180 parking spaces to the Broad Run VRE station. Construction is expected to be completed this winter. Mr. Zehner also announced that on November 13th VRE will conduct a full scale emergency drill. Fairfax County has asked for 150 volunteers from the local community to participate and VRE will ask for rider participation as well. It is a multi-agency effort with Fairfax and Prince William counties’ Fire and Rescue and Police, TSA, FBI, and FRA all participating. Mr. Zehner explained that this is a larger scale drill compared to past drills. The simulated wounded will even be evacuated to a local hospital for this drill. Sale of Railcars and Locomotives to the U.S. Army. Mrs. Bulova reported that the VRE Operations Board recommends approval of Resolution #2158, which would authorize VRE’s CEO to sell three GP-40 locomotives and 10 gallery railcars to the U.S. Army for $250,000. The Army will use this equipment to transport troops to and from field training at Fort A.P. Hill in Caroline County. Mrs. Bulova moved, with a second by Mr. Smedberg, to approve Resolution #2158.
Mr. Euille asked if a market analysis of value had been done on the railcars. Mr. Zehner explained that VRE purchased the railcars from Chicago for $1 apiece. The selling price is higher since VRE invested in the rehabilitation of these cars.
Delegate Comstock arrived at 8:15 P.M.

3
The commission then voted on the motion and it passed. The vote in favor was cast by commissioners Bulova, Cook, Comstock, Drake, Ebbin, Euille, Fisette, Foust, Greenfield, Herring, Hudgins, Hynes, May, McKay, Smedberg, Snyder and Zimmerman. Elimination of Rail Advisory Board. Mrs. Bulova explained that Governor McDonnell’s Government Reform Commission has recommended in its interim report that the Rail Advisory Board (RAB) should be eliminated. To do so would save $10,000 annually. The Board advises the Commonwealth Transportation Board on allocating Rail Enhancement funds for rail projects and serves as a forum for interactions between freight and rail passenger interests. RAB has been especially valuable for improving relations with VRE’s freight rail partners and the VRE Operations Board has written to the Reform Commission’s chairman citing the benefits to VRE and asking for the Reform Commission to withdraw its recommendation. The VRE Operations Board also asked NVTC and PRTC to take a position on this proposal and to send a letter.
Mrs. Bulova moved, with a second by Mr. Smedberg, to authorize NVTC’s chairman to send a letter to the Government Reform Commission. In response to a question from Mr. Fisette, Mr. Zehner explained that CSX and Norfolk Southern senior executives are members of the Rail Advisory Board. The Board has provided a forum for VRE and the freight railroads to build a partnership, which has been invaluable to VRE. Mrs. Bulova noted that the small amount of savings that would result from eliminating the RAB does not compare to the large benefit of what the Board provides. The vote in favor was cast by commissioners Bulova, Cook, Ebbin, Euille, Fisette, Foust, Greenfield, Herring, Hudgins, Hynes, McKay, Smedberg, Snyder and Zimmerman. Commissioners Comstock, Drake and May abstained. NVTC Copier Lease
Mr. Taube reported that NVTC received three proposals in response to its RFP. The existing office copier lease expires at the end of December, 2010. NVTC staff tested the proposed copiers and carefully reviewed the proposed lease costs, including the maintenance agreements. The top-ranked firm is Capital Office Solutions (NVTC’s current service provider). Its proposal would provide a Xerox 7765 copier at an initial annual lease cost of $5,500, fixed for the first two years with a maximum of 7% escalation for each of the remaining three years. This copier and service agreement was the least expensive of the top-ranked machines in the three proposals as well as being ranked first in overall value to NVTC. An industry-standard lease agreement would be executed. It is being reviewed by legal counsel. Mr. Fisette moved, with a second by Mr. McKay, to authorize NVTC’s Executive Director to execute the lease with Capital Office Solutions after legal counsel review. The vote in favor was cast by commissioners Bulova, Cook, Comstock, Drake, Ebbin, Euille, Fisette, Foust, Greenfield, Herring, Hudgins, Hynes, May, McKay, Smedberg, Snyder and Zimmerman.

4
WMATA Items Presentation on “Rebuilding Metro: Preliminary FY 2012-2017 Capital Improvement Program.” Mr. Sarles explained that safety is WMATA’s number one priority. He reviewed some of the procedures put in place to address safety issues, including implementing the NTSB recommendations. For the Capital Improvement Program, WMATA will be focusing on the Metro system being in a state of good repair and safety, with no expansion of the system and services. The proposed CIP ($5.1 billion) includes NTSB-related projects which total $330 million. Debt issuance would be shifted from FY 2015 to FY 2023 to accommodate these recommendations. This would assume a four percent growth in federal and jurisdictional funding. $148 million will be designated for escalator repair or replacement over a six year period. Mr. Zimmerman stated that it is important to understand that previously the plan was to grow service by 50 percent. Based on inadequate funding, all service expansion has been halted over the next six years. Therefore, capacity has been scaled back even though ridership continues to increase. He stated that it will be important to be able to explain this to the public. Mr. Snyder, who is a daily Metrorail rider, observed that it is hard for Orange Line riders to understand that although they have to pay increased fares, the service will not get any better and may even deteriorate. In his opinion, the Orange Line all too often is dangerously overcrowded. Mr. Snyder also asked if some of the problems with the escalators are due to being exposed to the elements. Mr. Sarles stated that this is a contributing issue but it is not the only issue. The age of the equipment is a factor. Escalators haven’t been maintained as well as they should have been. There are plans that include installing canopies at some of the stations to protect the escalators. Mr. Snyder stated that on a positive note Metro operators are doing a better job of communicating with riders when there are problems and delays. Mr. Snyder stated that during his travels in Europe, he observed that some transit agencies have agreements with hotels to provide transit passes to patrons. He suggested WMATA look at this.
Chairman Hudgins thanked Mr. Sarles for coming and giving his presentation. She observed that there have been many positive things happening at WMATA under his leadership.
WMATA Governance. Chairman Hudgins explained that following last month’s
meeting, staff was asked to propose a process for discussing Metro governance, safety and funding. Staff proposes that a group of up to ten individuals be selected to discuss these three topics. Proposed members are Bill Euille, Thelma Drake, Corey Hill, Catherine Hudgins, Joe May, Steve Pittard, Mary Margaret Whipple and Chris Zimmerman. She also suggested that Mr. McKay be added to the list since he is on the WMATA Board and Mrs. Drake has agreed. It is suggested that the committee meet a maximum of three times and the topics for discussion at each meeting have been outlined. NVTC should discuss the committee’s progress and act upon any recommendations at its January 6, 2011 meeting.

5
Mr. Smedberg moved, with a second by Mrs. Bulova, to approve the process, schedule and membership, including the addition of Mr. McKay to the group.
In response to a question from Mr. Smedberg, Chairman Hudgins explained that
at the first meeting participants will come to consensus as to the items to be discussed and can decide how wide to disseminate information.
The commission then voted on the motion and it passed. The vote in favor was
cast by commissioners Bulova, Cook, Comstock, Drake, Ebbin, Euille, Fisette, Foust, Greenfield, Herring, Hudgins, Hynes, May, McKay, Smedberg, Snyder and Zimmerman.
Vital Signs Report. Chairman Hudgins reported that this written report is a new tool for WMATA to measure its performance. Mrs. Hynes observed that WMATA’s number one goal is to create a safer organization and its third goal is to use every resource wisely. She observed that both of these goals overlap with what DRPT has been talking about relative to WMATA governance. She hopes that some of this information in this report could be helpful to the governance discussions. Chairman Hudgins agreed. Legislative Items
Chairman Hudgins announced that NVTC’s Legislative Committee will meet in November to develop the commission’s proposed Legislative Agenda for 2011. The committee will present its recommendations for action at the commission’s December meeting. NVTC’s Legislative Committee is chaired by Bill Euille. Chairman Hudgins explained that she has appointed Delegate Rust to serve on the committee, filling the vacancy when Delegate Albo left the commission. Legislative Committee members are commissioners Euille, Burk, Greenfield, Hudgins, Hynes, Rust, Snyder and Whipple.
Mr. McKay observed that the transit benefit for federal employees will expire
soon and asked if NVTC has taken a position on this. If the benefit is not extended, transit ridership, including Metro and VRE, could be reduced dramatically. Mr. Taube stated that this issue was included in NVTC’s 2010 Legislative Agenda and could be included in this year’s agenda. Mr. McKay stated that it should be included and also suggested that NVTC send a letter to Virginia’s congressional delegation on this issue.
Mr. McKay moved, with a second by Mr. Smedberg, to authorize staff to send a
letter to Virginia’s congressional delegation urging that the transit benefit of $230 be extended. The vote in favor was cast by commissioners Bulova, Cook, Comstock, Drake, Ebbin, Euille, Fisette, Foust, Greenfield, Herring, Hudgins, Hynes, May, McKay, Smedberg, Snyder and Zimmerman.
Mr. Foust suggested also sending the letter to other members of Congress.
Chairman Hudgins agreed that it would be good to broadly expand the list of recipients.

6
Regional Transportation Items Miller Center Report on National Transportation Funding. Mr. Taube reported that in September 2009, 80 transportation experts (including NVTC’s executive director) convened at the Miller Center at the University of Virginia to create a blueprint for rescuing the deteriorating U.S. transportation system. The recommendations included that Congress must address the immediate crisis in transportation funding. Also, future funding mechanisms should not depend primarily on fossil-fuel consumption. U.S. DOT TIGER II Grants. Mr. Taube reported that no grant requests from this region were funded.
Agenda for Virginia Governor’s Transportation Conference. Mr. Taube reported that the conference will be held December 8-10, 2010 at the Hotel Roanoke. The conference is titled, “Reforming and Revitalizing Transportation in Virginia.”
NVTC Financial Items for September, 2010 Commissioners were provided with the financial items and there were no questions. Mr. Smedberg asked how the preparations are coming for NVTC’s office move. Mr. Taube explained that a furniture vendor and moving services are in the process of being selected for NVTC’s upcoming move at the end of December. Closed Session
Mrs. Bulova moved, with a second by Mr. Zimmerman, the following motion: Pursuant to the Virginia Freedom of Information Act (Sections 2.2-3711A (1) of the Code of Virginia), the Northern Virginia Transportation Commission authorizes discussion in Closed Session concerning a personnel item, pertaining to the annual performance review of NVTC’s executive director. The vote in favor was cast by commissioners Bulova, Cook, Comstock, Drake,
Ebbin, Euille, Fisette, Foust, Greenfield, Herring, Hudgins, Hynes, May, McKay, Smedberg, Snyder and Zimmerman.
The commission entered into Closed Session at 8:55 P.M. and returned to Open
Session at 9:35 P.M.
Mrs. Bulova moved, with a second by Mr. Zimmerman, the following certification:

7
The Northern Virginia Transportation Commission certifies that, to the best of each member’s knowledge and with no individual member dissenting, at the just concluded Closed Session: 1. Only public business matters lawfully exempted from open
meeting requirements under the Freedom of Information Act discussed; and
2. Only such public business matters as were identified in the motion by which the Closed Session was convened were heard, discussed or considered.
The vote in favor was cast by commissioners Bulova, Cook, Comstock, Drake,
Ebbin, Euille, Fisette, Foust, Greenfield, Herring, Hudgins, Hynes, May, McKay, Smedberg, Snyder and Zimmerman. Chairman Hudgins noted that no action is needed at this time. Adjournment
Without objection, Chairman Hudgins adjourned the meeting at 9:36 P.M. Approved this 2nd day of December, 2010. ________________________ Catherine Hudgins Chairman ____________________________ Mary Hynes Secretary-Treasurer

AGENDA ITEM #2 TO: Chairman Hudgins and NVTC Commissioners FROM: Rick Taube and Scott Kalkwarf DATE: November 24, 2010 SUBJECT: NVTC Audit Results for FY 2010 Representatives from NVTC’s audit firm, PBGH LLP will be present to describe the results of their annual audit for FY 2010. They again issued an unqualified (clean) opinion that NVTC’s financial statements, in all material respects, fairly and accurately present the financial position of the organization. No management letter was provided. After discussion, the commission is asked to accept the audit report and to authorize staff to provide copies of the audited financial statements to the mailing list of interested agencies and firms, and release the information to the public.

NORTHERN VIRGINIA TRANSPORTATION COMMISSION Table of Contents
Page
Independent Auditors’ Report 1 - 2 Required Supplementary Information:
Management’s Discussion and Analysis 3 - 9 Basic Financial Statements:
Statement of Net Assets 10
Statement of Activities 11 Balance Sheet - Governmental Funds 12
Statement of Revenues, Expenditures and Changes in Fund Balances - Governmental Funds 13 Statement of Fiduciary Net Assets - Fiduciary Fund 14
Statement of Changes in Fiduciary Net Assets - Fiduciary Fund 15
Notes to the Basic Financial Statements 16 - 32
Supplementary Information:
Schedule of Changes in Fiduciary Net Assets by Jurisdiction - Jurisdiction Trust Fund 33
Schedule of General, Administrative and Project Expenditures - General Fund 34
Schedules of Project Revenues and Expenditures - General Fund 35 - 36
Schedule of Expenditures of Commonwealth of Virginia Awards 37 - 41
Schedule of Expenditures of Federal Awards - Cumulative 42

Page Compliance Section:
Schedule of expenditures of federal awards 43 Note to schedule of expenditures of federal awards 44
Independent Auditors’ Report on Internal Control Over Financial Reporting and on Compliance and Other Matters Based on an Audit of Financial Statements Performed in Accordance With Government Auditing Standards 45 - 46 Independent Auditors’ Report on Compliance with Requirements Applicable to Each Major Program and Internal Control Over Compliance in Accordance with OMB Circular A-133 47 - 48 Schedule of findings and questioned costs 49 - 50 Summary schedule of prior audit findings 51

1
INDEPENDENT AUDITORS’ REPORT To the Honorable Commission Board Members Northern Virginia Transportation Commission Arlington, Virginia We have audited the accompanying financial statements of the governmental activities, each major fund, and the remaining fund information of Northern Virginia Transportation Commission (Commission) as of and for the year ended June 30, 2010, which collectively comprise the Commission’s basic financial statements as listed in the table of contents. These financial statements are the responsibility of the Commission’s management. Our responsibility is to express opinions on these financial statements based on our audit. We conducted our audit in accordance with auditing standards generally accepted in the United States of America; the standards applicable to financial audits contained in Government Auditing Standards, issued by the Comptroller General of the United States; and Specifications for Audits of Authorities, Boards, and Commissions, issued by the Auditor of Public Accounts of the Commonwealth of Virginia. Those standards and specifications require that we plan and perform the audit to obtain reasonable assurance about whether the financial statements are free of material misstatement. An audit includes consideration of internal control over financial reporting as a basis for designing audit procedures that are appropriate in the circumstances, but not for the purpose of expressing an opinion on the effectiveness of the Commission’s internal control over financial reporting. Accordingly, we express no such opinion. An audit includes examining, on a test basis, evidence supporting the amounts and disclosures in the financial statements. An audit also includes assessing the accounting principles used and significant estimates made by management, as well as evaluating the overall financial statement presentation. We believe that our audit provides a reasonable basis for our opinions. In our opinion, the financial statements referred to above present fairly, in all material respects, the respective financial position of the governmental activities, each major fund, and the remaining fund information of the Commission as of June 30, 2010, and the respective changes in financial position, for the year then ended in conformity with accounting principles generally accepted in the United States of America. In accordance with Government Auditing Standards, we have also issued our report dated November 22, 2010 on our consideration of the Commission’s internal control over financial reporting and our tests of its compliance with certain provisions of laws, regulations, contracts and grant agreements, and other matters. The purpose of that report is to describe the scope of our testing of internal control over financial reporting and compliance and the results of that testing, and not to provide an opinion on the internal control over financial reporting or on compliance. That report is an integral part of an audit performed in accordance with Government Auditing Standards and should be considered in assessing the results of our audit.

2
The management’s discussion and analysis (pages 3 to 9) is not a required part of the basic financial statements but is supplementary information required by accounting principles generally accepted in the United States of America. We have applied certain limited procedures, which consisted principally of inquiries of management regarding the methods of measurement and presentation of the required supplementary information. However, we did not audit the information and express no opinion on it. Our audit was conducted for the purpose of forming opinions on the financial statements that collectively comprise the Commission’s basic financial statements. The schedules listed in the table of contents as supplementary information are presented for purposes of additional analysis and are not a required part of the financial statements. The accompanying Schedule of Expenditures of Federal Awards is presented for purposes of additional analysis as required by the U. S. Office of Management and Budget Circular A-133, Audits of States, Local Governments and Non-Profit Organizations, and is not a required part of the financial statements. Such information has been subjected to the auditing procedures applied in the audit of the financial statements and, in our opinion, is fairly stated, in all material respects, in relation to the financial statements taken as a whole.
Harrisonburg, Virginia November 22, 2010

NORTHERN VIRGINIA TRANSPORTATION COMMISSION
REQUIRED SUPPLEMENTARY INFORMATION
YEAR ENDED JUNE 30, 2010

3
NORTHERN VIRGINIA TRANSPORTATION COMMISSION MANAGEMENT’S DISCUSSION AND ANALYSIS This discussion and analysis of Northern Virginia Transportation Commission’s (NVTC) financial performance provides an overview of NVTC’s financial activities for the fiscal year that ended on June 30, 2010. Please read it in conjunction with the accompanying financial statements which follow this section. OVERVIEW OF THE FINANCIAL STATEMENTS The financial statements presented include all of the activities of NVTC which are part of the NVTC reporting entity using the integrated approach as prescribed by the Governmental Accounting Standards Board (GASB). The government-wide financial statements present the financial picture of NVTC from the economic resources measurement focus using the accrual basis of accounting. Excluded from these statements are the activities of the jurisdiction trust funds, which are considered fiduciary funds and, therefore, not part of the primary government. The fund financial statements include a set of statements for each of the two categories of funds – governmental and fiduciary. The governmental funds are prepared using the current financial resources measurement focus and modified accrual basis of accounting. The fiduciary fund is prepared using the economic resources measurement focus and the accrual basis of accounting, similar to the government-wide financial statements. Reconciliation of the fund financial statements to the government-wide financial statements is provided to explain the differences created by the integrated approach. Government-Wide Financial Statements The government-wide financial statements consist of the Statement of Net Assets and the Statement of Activities. The Statement of Net Assets presents the assets and liabilities, with the difference between the two reported as net assets. The Statement of Activities shows in broad terms how the net assets changed during the fiscal year. Over time, increases or decreases in net assets may serve as a useful indicator of whether the financial position of NVTC is improving or declining. Net assets can be reported in three categories; net assets invested in capital assets, net assets that are restricted in use, and net assets that are unrestricted. NVTC does not have any restricted net assets. The revenue supporting the activities and programs are classified under two broad categories: operating grants and contributions and capital grants and contributions. While NVTC receives grant revenue used ultimately for capital purposes, the revenue is classified as operating since it is for the joint venture, the Virginia Railway Express. Accordingly, NVTC does not report revenues under the capital grants and contributions category.

4
Fund Financial Statements A fund is a grouping of related accounts that is used to maintain control over resources that have been segregated for specific activities or objectives. The funds of the NVTC reporting entity are divided into two categories: governmental funds and fiduciary funds. Governmental Funds. Governmental funds are used to account for essentially the same functions reported as governmental activities in the government-wide financial statements. Unlike the government-wide financial statements, governmental fund financial statements focus on near-term inflows and outflows of spendable resources as well as on balances of spendable resources available at the end of the fiscal year. NVTC maintains two governmental funds: the General Fund and the Special Revenue Fund. Information is presented separately in the governmental fund Balance Sheet and in the governmental fund Statement of Revenues, Expenditures and Changes in Fund Balances for each of these funds. The General Fund includes the administrative, planning and project activities of NVTC. The Special Revenue Fund reports the intergovernmental revenue received by NVTC and allocated to the member jurisdictions by a formula maintained by NVTC. Once the allocation is determined, the funds are remitted to the fiduciary fund. Fiduciary Fund. The Fiduciary Fund is used to account for resources held by NVTC for the benefit and restricted use of the programs of other governments. Additions to the fiduciary fund consist of revenue remitted from the Special Revenue Fund and investment income. Deductions from the fiduciary fund are disbursements directed by the individual member jurisdictions for restricted purposes. The accounting methods used for the fiduciary fund are much like that used for proprietary funds. The two statements included for the fiduciary fund are the Statement of Fiduciary Net Assets and the Statement of Changes in Fiduciary Net Assets. Notes to the Basic Financial Statements The notes to the financial statements provide additional information that is essential to a full understanding of the data provided in the government-wide and fund financial statements. Supplementary Information Additional information is presented as a supplement to the basic financial statements. Although not required to be presented and not part of the basic financial statements, the schedules are included to provide additional information of interest to certain financial statement users. GOVERNMENT-WIDE FINANCIAL ANALYSIS This management discussion and analysis is required to present information on a government-wide basis. Due to the nature of NVTC’s activities, the discussion included in the fund analysis section provides information that may be more meaningful.

5
Current assets consist primarily of grant revenue and motor fuel sales tax due from the Commonwealth of Virginia. As of June 30, 2010, the Statement of Net Assets shows $11,235,395 due from the Commonwealth of Virginia, of which $6,772,054 is for motor fuel sales tax, and $4,463,341 for grant revenue. This is a decrease from the previous fiscal year which included receivables of $5,725,583 in motor fuel sales tax and $20,575,542 in grant revenue, totaling $26,301,125. The approximate $15.1 million decrease in the receivable for grant revenue is due primarily to a large number of jurisdiction capital grants invoiced near the end of the previous fiscal year, offset by including approximately $3.0 million in receivables for commuter rail service in the current fiscal year. The $1.1 million increase in receivable for motor fuel sales tax is primarily the result of increasing fuel prices between periods. As of June 30, 2010, $2,959,930 of the amount due from the Commonwealth was for the commuter rail service, $39,355 was for general and administrative and projects, and $8,236,110 was for the jurisdiction transit function of NVTC, which is offset by a payable to the fiduciary fund. As noted earlier, net assets may serve as a useful indicator of a government’s financial position. As shown below, total assets exceeded liabilities by $171,921. Net assets invested in capital assets of $5,559 and unrestricted net assets of $166,362 make up the balance of net assets. Please refer to the funds analysis for a discussion of the components and changes in the governmental activities.
Condensed Statements of Net Assets June 30, 2010 and 2009
Increase 2010 2009 (Decrease) Current and other assets $ 11,542,805 $ 26,582,056 $ (15,039,251) Capital assets 5,559 11,904 (6,345) Total assets 11,548,364 26,593,960 (15,045,596) Current and other liabilities 11,298,282 26,338,619 (15,040,337) Long-term liabilities 78,161 75,555 2,606 Total liabilities 11,376,443 26,414,174 (15,037,731) Net assets: Invested in capital assets 5,559 11,904 (6,345) Unrestricted 166,362 167,882 (1,520) Total net assets $ 171,921 $ 179,786 $ (7,865)

6
The following table shows the revenues and expenses and the change in net assets of the governmental activities. For the fiscal year ended June 30, 2010, approximately $178.7 million in revenues were reported, which is a decrease of approximately $50.3 million from the previous year, with a similar decrease in expenses from the prior year. Net assets decreased by $7,865 from the previous year. A discussion of the key components of these changes is included in the funds analysis.
Changes in Net Assets
Years Ended June 30, 2010 and 2009 Increase 2010 2009 (Decrease) Revenue: Program revenues: Operating grants and contributions $ 178,659,838 $ 228,984,078 $( 50,324,240) General revenues: Interest income 1,376 8,194 (6,818) Total revenue 178,661,214 228,992,272 (50,331,058) Expenses: General and administration 989,115 980,377 8,738 Project costs 665,434 710,873 (45,439) State grants – commuter rail service 28,415,641 25,674,708 2,740,933 Payments to fiduciary fund 148,598,889 201,663,016 (53,064,127) Total expenses 178,669,079 229,028,974 (50,359,895) Change in net assets (7,865) (36,702) (28,837) Net assets, beginning of year 179,786 216,488 (36,702) Net assets, end of year $ 171,921 $ 179,786 $ (7,865)

7
FINANCIAL ANALYSIS OF THE REPORTING ENTITY’S FUNDS Governmental Funds General Fund. The General Fund reports the project, planning and administrative activities of NVTC. The unreserved fund balance represents the net resources available for spending at the end of the fiscal year.
NVTC adopts an annual operating budget for the planning and administrative activities of the General Fund for the purpose of determining the annual contributions from the member jurisdictions required to fund these activities. In addition, the various projects included in the General Fund have individual budgets. While certain administrative expenditures such as payroll and payroll related expenses are part of the annual operating budget, they may be included in project costs if they were incurred directly for a project. Since non-administrative project expenditures are generally fully funded from sources other than those for the planning and administrative activities, the unreserved fund balance is mainly the result of the planning and administrative activities of the General Fund. As of June 30, 2010 the General Fund had a total fund balance of $274,517, an increase of $3,172 from the prior year, of which $24,230 was reserved and $250,287 was unreserved. The increase is the result of a favorable budget variance, offset by a budgeted drawdown of surplus funds. During fiscal year 2010, NVTC’s regional projects incurred a total of $650,930 in direct costs. Three of these projects are presently grant funded, with state and federal funding sources totaling $485,379. The $180,055 in other funding sources includes local contributions from NVTC and other miscellaneous sources. NVTC’s contributions consist primarily of payroll and payroll related costs. A portion of NVTC’s general and administrative contributions, the Marketing program, and the Bus Data NTD collection project, which are all part of the General Fund, receive funding from the state assistance for operations and the Motor Vehicle Fuel Sales tax. For the fiscal year, this equaled $1,008,001 in state assistance and sales tax, which is in addition to the revenue reported in the Special Revenue Fund.

8
Special Revenue Fund. The special revenue fund reports intergovernmental revenue for the jurisdictions’ transit programs, including local bus systems and the operating and capital subsidies of the Washington Metropolitan Area Transit Authority (“WMATA”). The intergovernmental revenue includes state operating assistance, state capital assistance, the motor vehicle fuel sales tax, and for the current fiscal year, federal assistance. As the revenue is recognized by the Special Revenue Fund, it is allocated using the Subsidy Allocation Model formula (“SAM”). This formula, which is defined and established by NVTC board resolution and the Code of Virginia, is maintained and updated annually by NVTC. After the revenue has been allocated by the SAM and each jurisdiction’s share has been identified, the funds are remitted to the Jurisdiction Trust Fund for the restricted use by the member jurisdictions individually to support the programs of their respective locality. Intergovernmental revenues decreased approximately $53 million (26%) compared to fiscal year 2009. A comparison of the revenue by type between fiscal years follows:
State assistance for operations is revenue from the state FTM/Admin formula assistance program. The approximate $8.4 million decrease in assistance from fiscal year 2009 to fiscal year 2010 recognized by the special revenue fund just about mirrors the decrease in assistance available from the state’s Mass Transit Trust Fund combined with other appropriated funding. The FTM/Admin assistance program is funded at the statutory fixed rate of 73.5% of projected Mass Transit Trust Fund revenue. In fiscal year 2009 and 2010, the FTM/Admin program received a portion of the state recordation tax to help fund the program. State assistance for capital expenditures recognized by the special revenue fund during fiscal year 2010 includes revenue from the Mass Transit Trust Fund, the Mass Transit Capital program, and special appropriations for capital. The state-wide capital program is funded at the statutory fixed rate of 25% of projected Mass Transit Trust Fund revenues. An additional $32.6 million was available statewide through the Mass Transit Capital program, funded by revenue bonds. The substantial decrease in capital revenue recognized by the Special Revenue fund is due to the fact that the fiscal year 2009 revenue was much higher than other years due to a high effective capital matching ratio, combined with a large amount of local capital costs invoiced to grants during the fiscal year.
$60.9 $69.3
$50.3
$96.7 $36.1
$35.6
$1.3
$‐
$50.0
$100.0
$150.0
$200.0
$250.0
2010 2009
(in m
illions) Federal Assistance
for CapitalMotor Vehicle Fuels Sales TaxState Assistance for CapitalState Assistance for Operations

9
Effective January 1, 2010, the Motor Vehicle Fuel Sales tax is levied on distributors of gasoline and diesel fuel for deliveries within NVTC’s jurisdictions at the rate of 2.1%. Prior to this, the tax was levied on the retail sales at the rate of 2%. The Department of Taxation, the state agency responsible for administering the tax, has not determined the impact on revenue collections with the change in the tax. However, NVTC’s analysis indicates it is most likely not significant. Motor Vehicle Fuel Sales tax revenue decreased by $6.7 million, or over 15%, from the previous fiscal year. This decrease is consistent with the national average price decrease for all grades over the same period, as calculated from U.S. DOE weekly price data. Overall demand, the price elasticity impacting demand and grade mix are some of the other factors that affect revenue collections. Fiduciary Fund The fiduciary fund is a private purpose trust fund, which is titled the Jurisdiction Trust Fund. Jurisdiction Trust Fund. The Jurisdiction Trust Fund holds the assets that were remitted from the special revenue fund and are accounted for on an individual jurisdiction basis. These funds are invested primarily in the Virginia Local Government Investment Pool, and are available for disbursement for restricted purposes by instructions of the member jurisdictions. The change in the fund balance from year to year is dependent upon the remittances from the special revenue fund, investment income and the amount each member jurisdiction instructs NVTC to disburse from the Fund. CAPITAL ASSETS AND DEBT ADMINISTRATION NVTC’s capital assets consist of office furniture, equipment, computer hardware and software. No significant changes have occurred in capital assets from the prior fiscal year. NVTC has issued debt to finance, in part, the construction and purchase of the capital assets of the Virginia Railway Express (VRE). The debt and related capital assets are not recognized on the financial statements of NVTC, but rather on those of VRE. Complete financial statements for VRE can be obtained from the Director of Finance and Administration of NVTC at 4350 N. Fairfax Drive, Suite 720, Arlington, VA 22203, or by email to [email protected]. REQUESTS FOR INFORMATION This financial report is designed to provide a general overview of NVTC’s finances for all those interested. If you have any questions about this report or need additional financial information, contact the Director of Finance and Administration, Northern Virginia Transportation Commission, 2300 Wilson Boulevard, Suite 620, Arlington, Virginia 22201, or by email to [email protected].

NORTHERN VIRGINIA TRANSPORTATION COMMISSION
Financial and Compliance Reports Year Ended June 30, 2010

NORTHERN VIRGINIA TRANSPORTATION COMMISSION
BASIC FINANCIAL STATEMENTS
YEAR ENDED JUNE 30, 2010

10
NORTHERN VIRGINIA TRANSPORTATION COMMISSIONSTATEMENT OF NET ASSETS
June 30, 2010
Governmental ASSETS Activities
Cash and cash equivalents 264,511$ Due from the Commonwealth of Virginia 11,235,395 Due from Virginia Railway Express 12,913 Advances, deposits and prepaid items 29,986 Capital assets:
Office equipment, furniture and software 131,448 Less accumulated depreciation and amortization (125,889) Total assets 11,548,364
LIABILITIES
Accounts payable 52,648 Accrued salaries 19,600 Due to fiduciary fund 8,236,110 State grants - commuter rail service 2,959,930 Compensated absences:
Due within one year 29,994 Due in more than one year 78,161 Total liabilities 11,376,443
NET ASSETS
Invested in capital assets 5,559 Unrestricted 166,362
Total net assets 171,921$
The accompanying notes are an integral part of the financial statements.

11
NORTHERN VIRGINIA TRANSPORTATION COMMISSIONSTATEMENT OF ACTIVITIES
Year Ended June 30, 2010
Governmental Activities Functions / Programs
Project and JurisdictionTotals Administrative Transit
Expenses:General and administration 989,115$ 989,115$ -$ Project costs 665,434 665,434 - State grants - commuter rail service 28,415,641 28,415,641 - Payments to fiduciary fund 148,598,889 - 148,598,889
Total expenses 178,669,079 30,070,190 148,598,889
Program revenues:Operating grants and contributions 178,659,838 30,060,949 148,598,889
Net program expense (9,241) (9,241)$ -$
General revenues:Interest income 1,376
Change in net assets (7,865)
Net assets, beginning of year 179,786 Net assets, end of year 171,921$
The accompanying notes are an integral part of the financial statements.

12
NORTHERN VIRGINIA TRANSPORTATION COMMISSIONBALANCE SHEET
GOVERNMENTAL FUNDSJune 30, 2010
Major Funds Special Total
General Revenue GovernmentalFund Fund Funds
ASSETS
Cash and cash equivalents 264,511$ -$ 264,511$ Due from the Commonwealth of Virginia 2,999,285 8,236,110 11,235,395 Due from Virginia Railway Express 12,913 - 12,913 Advances, deposits and prepaid items 29,986 - 29,986
Total assets 3,306,695$ 8,236,110$ 11,542,805$
LIABILITIES
Accounts payable 52,648$ -$ 52,648$ Accrued salaries 19,600 - 19,600 State grants - commuter rail service 2,959,930 - 2,959,930 Due to fiduciary fund - 8,236,110 8,236,110
Total liabilities 3,032,178 8,236,110 11,268,288
FUND BALANCES
Reserved for prepaids 24,230 - 24,230 Unreserved 250,287 - 250,287
Total fund balance 274,517 - 274,517
Total liabilities and fund balance 3,306,695$ 8,236,110$ 11,542,805$
Reconciliation of fund balance on the Balance Sheet for the governmental funds to the net assets of thegovernmental activities on the Statement of Net Assets:
Fund balances - governmental funds 274,517$
Amounts reported for governmental activities in the Statement of Net Assets aredifferent because:
Capital assets used in governmental activities are not financial resourcestherefore are not reported in the funds. The cost of the assets is$131,448 and the accumulated depreciation and amortization is $125,889. 5,559
Compensated absences are liabilities not due and payable in the current period and, therefore, are not reported in the governmental funds. (108,155)
Net assets - governmental activities 171,921$
The accompanying notes are an integral part of the financial statements.

13
NORTHERN VIRGINIA TRANSPORTATION COMMISSIONSTATEMENT OF REVENUES, EXPENDITURES AND CHANGES IN FUND BALANCES
GOVERNMENTAL FUNDSYear Ended June 30, 2010
Major Funds Special Total
General Revenue GovernmentalFund Fund Funds
Revenues:Intergovernmental revenues:
Contributions:Commonwealth of Virginia 749,380$ -$ 749,380$ Local jurisdictions 309,999 - 309,999
Grants:Federal 125,568 1,318,400 1,443,968 Commonwealth of Virginia 28,786,594 111,145,290 139,931,884
Motor vehicle fuel sales tax 797 36,135,199 36,135,996 Project chargebacks, Virginia Railway Express 70,000 - 70,000 Local project contributions 18,500 - 18,500
Interest income 1,376 - 1,376 Other income 111 - 111
Total revenues 30,062,325 148,598,889 178,661,214
Expenditures:Current:
General and administration 978,078 - 978,078 Project costs 665,434 - 665,434 State grants - commuter rail service 28,415,641 - 28,415,641 Payments to fiduciary fund - 148,598,889 148,598,889 Total expenditures 30,059,153 148,598,889 178,658,042
Change in fund balances 3,172 - 3,172 Fund balances, beginning of year 271,345 - 271,345 Fund balances, end of year 274,517$ -$ 274,517$
Change in fund balances - total governmental funds 3,172$
Amounts reported for governmental activities in the Statement of Activities aredifferent because:
Governmental funds report capital outlays as expenditures. However, inthe Statement of Activities, the cost of those assets is allocated overtheir estimated useful lives and reported as depreciation and amortization expense.
Deduct - depreciation and amortization expense (6,345)
The change in compensated absences included in the expenses reportedin the Statement of Activities do not require the use of current financial resourcesand, therefore, are not reported as expenditures in the governmental funds. (4,692)
Change in net assets of governmental activities (7,865)$
The accompanying notes are an integral part of the financial statements.

14
NORTHERN VIRGINIA TRANSPORTATION COMMISSIONSTATEMENT OF FIDUCIARY NET ASSETS
FIDUCIARY FUNDJune 30, 2010
JurisdictionTrust Fund
ASSETS
Cash and cash equivalents 145,325,831$ Due from special revenue fund - Commonwealth of Virginia grants 1,464,207 Due from special revenue fund - Motor fuel sales tax 6,771,903
Total assets 153,561,941
LIABILITIES
Deferred revenue 5,000,000
NET ASSETS
Net assets held in trust for member jurisdictions 148,561,941$
The accompanying notes are an integral part of the financial statements.

15
NORTHERN VIRGINIA TRANSPORTATION COMMISSIONSTATEMENT OF CHANGES IN FIDUCIARY NET ASSETS
FIDUCIARY FUNDYear Ended June 30, 2010
JurisdictionTrust Fund
Additions:Contributions from government 148,598,889$ Investment income 387,074
Total Additions 148,985,963
Deductions:Funds disbursed to WMATA:
Metro Matters capital 8,659,572 Beyond Metro Matters capital 692,000 Metrorail operating 41,652,984 Metrobus operating 46,496,861 Metroaccess operating 9,874,830 Metro debt service 7,412,500
Other funds disbursed:Other capital disbursements 6,329,281 Other operating disbursements 23,350,690 Total Deductions 144,468,718
Change in net assets 4,517,245
Net assets held in trust for member jurisdictionsBeginning of year 144,044,696 End of year 148,561,941$
The accompanying notes are an integral part of the financial statements.

NORTHERN VIRGINIA TRANSPORTATION COMMISSION
NOTES TO THE BASIC FINANCIAL STATEMENTS
YEAR ENDED JUNE 30, 2010

16
NORTHERN VIRGINIA TRANSPORTATION COMMISSION NOTES TO THE BASIC FINANCIAL STATEMENTS ____________________________________________________________________________ Note 1. SUMMARY OF SIGNIFICANT ACCOUNTING POLICIES The financial statements of the Northern Virginia Transportation Commission (“NVTC”) have been prepared in accordance with accounting principles generally accepted in the United States of America (“GAAP”). The Governmental Accounting Standards Board (“GASB”) is responsible for establishing GAAP for state and local governments through its pronouncements (Statements and Interpretations). Governments are also required to follow the pronouncements of the Financial Accounting Standards Board (“FASB”) issued through November 30, 1989 (when applicable) that do not conflict with or contradict GASB pronouncements. A. Reporting Entity
The Northern Virginia Transportation District (the "District") was created by the 1964 Acts of Assembly of the Commonwealth of Virginia, Chapter 630, to assume the powers and purposes of transportation districts under the Act. The transportation district comprises the cities of Alexandria, Fairfax, and Falls Church, and the counties of Arlington, Fairfax and Loudoun, and has all the powers granted transportation districts in the Act. The Act was created for the purpose of developing transportation systems necessary to the orderly growth and development of urban areas of the Commonwealth of Virginia for the safety, comfort, and convenience of its citizens and for the economical utilization of public funds. The District has no taxing power, although a tax imposed by the Virginia General Assembly is collected within the District's boundaries for its benefit. The Northern Virginia Transportation Commission is the governing body of the District, and was created pursuant to the Authorizing Legislation to manage and control the functions, affairs, and property of the District. B. Government-wide and Fund Financial Statements The government-wide financial statements (the Statement of Net Assets and the Statement of Activities) report only information of the governmental activities supported by intergovernmental revenues, and excludes the fiduciary activities of NVTC. The government-wide Statement of Activities is designed to report the degree to which the direct expenses of a given function are offset by program revenues. Program revenues include grants and contributions that are restricted to meeting the operational or capital requirements of a particular function. The Motor Vehicle Fuel Sales tax is reported as program revenue because the Commonwealth of Virginia, not the NVTC, has the authority to collect this tax. The government-wide Statement of Net Assets reports net assets as restricted when externally imposed constraints on those net assets are in effect. Internally imposed designations of resources are not presented as restricted net assets.
Separate fund financial statements are provided for governmental funds and fiduciary funds. The governmental funds are reported on a Balance Sheet and a Statement of Revenues, Expenditures and Changes in Fund Balances (fund equity). The fiduciary fund is reported on a Statement of Fiduciary Net Assets and a Statement of Changes in Fiduciary Net Assets. The fiduciary fund is not included in the government-wide statements.
17
NORTHERN VIRGINIA TRANSPORTATION COMMISSION NOTES TO THE BASIC FINANCIAL STATEMENTS ____________________________________________________________________________ Note 1. SUMMARY OF SIGNIFICANT ACCOUNTING POLICIES (Continued) C. Measurement Focus, Basis of Accounting and Financial Statement Presentation Government-wide Financial Statements – The government-wide financial statements are reported using the economic resources measurement focus and the accrual basis of accounting. Revenues are recorded when earned and expenses are recorded when a liability is incurred, regardless of the timing of related cash flows. Intergovernmental revenues, consisting primarily of Federal and Commonwealth of Virginia grants, designated for payment of specific expenditures, are recognized at the time the expenditures are incurred. Any excess of revenues or expenditures at year-end are recorded as deferred revenue or accounts receivable, respectively. Derived tax revenues are recognized when the underlying transactions have occurred.
Governmental Fund Financial Statements – The Governmental fund financial statements are reported using the current financial resources measurement focus and the modified accrual basis of accounting. Revenues are recognized as soon as they are both measurable and available. Revenues are considered to be available when they are collectible within the current period, or soon enough thereafter, to pay liabilities of the current period. For this purpose, NVTC considers revenues to be available if they are collected within 90 days of the end of the current fiscal year end. Revenues from grants that are expenditure based are recognized if the expenditure has been made and invoiced to the grant. Expenditures are recorded when a liability is incurred under the full accrual method of accounting. Fiduciary Fund – The financial statements of the fiduciary fund are reported using the economic resources measurement focus and the accrual basis of accounting, similar to the government-wide statements described above. D. Fund Accounting The financial activities are recorded in individual funds, each of which is deemed to be a separate accounting entity with a self-balancing set of accounts. Financial activities have been classified into the following major governmental and fiduciary fund: 1. Governmental Funds
General Fund – This fund accounts for all financial activities of NVTC not accounted for in other funds and includes project, planning and administrative activities. Special Revenue Fund – This fund accounts for revenue from state capital grants, state operating grants, and motor vehicle fuel sales tax received from the Commonwealth of Virginia for NVTC member jurisdiction transit purposes. NVTC is required by state statute to receive this revenue and allocate to the jurisdictions located within the transportation district based upon a formula developed and maintained by NVTC. Upon allocation, the revenue is transferred to a fiduciary fund where it is available for the jurisdictions’ restricted use.

18
NORTHERN VIRGINIA TRANSPORTATION COMMISSION NOTES TO THE BASIC FINANCIAL STATEMENTS ____________________________________________________________________________ Note 1. SUMMARY OF SIGNIFICANT ACCOUNTING POLICIES (Continued)
D. Fund Accounting (Continued)
2. Fiduciary Fund
The Fiduciary fund is used to report assets held in a trustee capacity for the member jurisdictions. This fund is available to support the programs of the member jurisdictions, not the programs of the NVTC reporting entity. Jurisdiction Trust Fund – The resources received from the Special Revenue Fund are invested and held in a fiduciary capacity for each member jurisdiction until such time as they are disbursed upon the instructions of the individual jurisdictions.
E. Budgeting Although not statutorily required, NVTC adopts an annual operating budget for the planning and administrative activities of the General Fund. The budgeting process enables NVTC to determine the annual contributions required from the member jurisdictions and the Commonwealth of Virginia to fund its planning and administrative activities. Accumulated fund balances in excess of anticipated minimum operating cash requirements are used as a revenue source in subsequent budgets. F. Capital Assets NVTC’s capital assets are accounted for at cost in accordance with the capitalization policy and are depreciated or amortized using the straight-line method over the following estimated useful lives:
Computer hardware and software 3 years Office equipment 5 - 10 years Office furniture 7 - 10 years G. Project Funds Advanced
Grant and project revenue that has been received, but not yet earned, is recorded as unearned revenue in the governmental and fiduciary funds.
H. Indirect Expenditure Allocation Employee benefits are allocated to projects based on direct labor charges. Overhead and other indirect costs are not charged to NVTC projects.
I. Estimates
The preparation of financial statements in conformity with accounting principles generally accepted in the United States of America requires management to make estimates and assumptions that affect the reported amounts of assets and liabilities and disclosure of contingent assets and liabilities at the date of the financial statements and the reported amounts of revenue and expenses during the reporting period. Actual results could differ from those estimates.

19
NORTHERN VIRGINIA TRANSPORTATION COMMISSION NOTES TO THE BASIC FINANCIAL STATEMENTS ____________________________________________________________________________ Note 1. SUMMARY OF SIGNIFICANT ACCOUNTING POLICIES (Continued)
J. Restricted Cash and Cash Equivalents
Restricted cash and cash equivalents are funds held by the Trust Fund and are restricted for use by the member jurisdictions for certain transit purposes.
K. Compensated Absences Vacation leave is granted to all employees and is earned based upon the length of employment. Employees with zero through 9 years of service may carryover a maximum of 240 hours of accumulated leave while employees with 10 to 15 complete years of service may carryover a maximum of 320 hours of leave. For greater than 15 years, the maximum carryover is 360 hours of leave. The allowed accumulated leave earned, yet not paid has been recorded as a liability since the leave vests and an obligation to make payment exists if an employee terminates. Sick leave may also be accumulated by employees. After five years of service, NVTC employees are eligible to receive 25% of their accumulated sick leave at the then current wage rate for hours in excess of 450, without limit. Employees hired prior to January 3, 2008 have the option of receiving a payment for 25% of accrued hours of sick leave with a maximum of $5,000. The calculation producing the largest amount for each eligible employee has been recorded as a liability. In prior years, the General Fund was responsible for paying the liability for compensated absences for general government employees. Note 2. DEPOSITS AND INVESTMENTS At June 30, 2010, cash and cash equivalents consisted of the following, at cost which approximates fair value: Governmental Fiduciary Activities Fund Total Cash $ 157,805 $ - $ 157,805Local Government Investment Pool 106,706 - 106,706 264,511 - 264,511 Restricted: Local Government Investment Pool - 145,325,831 145,325,831 Total $ 264,511 $ 145,325,831 $ 145,590,342

20
NORTHERN VIRGINIA TRANSPORTATION COMMISSION NOTES TO THE BASIC FINANCIAL STATEMENTS ____________________________________________________________________________ Note 2. DEPOSITS AND INVESTMENTS (Continued)
Deposits: All cash of NVTC is maintained in accounts collateralized in accordance with the Virginia Security for Public Deposits Act, Section 2.2-4400 et. seq. of the Code of Virginia or covered by federal depository insurance. Investments: State statues authorize local governments and other public bodies to invest in obligations of the United States or its agencies thereof, obligations of the Commonwealth of Virginia or political subdivisions thereof, obligations of the International Bank for Reconstruction and Development (World Bank), the Asian Development Bank, the African Development Bank, “prime quality” commercial paper and certain corporate notes; bankers’ acceptances, repurchase agreements and the State Treasurer’s Local Government Investment Pool (LGIP).
NVTC has investments in the LGIP. The LGIP is a professionally managed money market fund which invests in qualifying obligations and securities as permitted by Virginia statutes. Pursuant to Section 2.2-4605 Code of Virginia, the Treasury Board of the Commonwealth sponsors the LGIP and has delegated certain functions to the State Treasurer. The LGIP reports to the Treasury Board at their regularly scheduled monthly meetings. The fair value of the position of the LGIP is the same as the value of the pool shares, i.e., the LGIP maintains a stable net asset value of $1 per share. The LGIP has been assigned an “AAAm” rating by Standard & Poor’s and all of the investments made by NVTC are held here. The maturity of the LGIP is less than one year.
NVTC’s investment policy establishes the maximum percentages of the portfolio permitted in each of the following instruments:
LGIP 100%US Treasury Obligations 100%Certificates of Deposit 75%Bankers’ Acceptances 50%Repurchase Agreements 35%Commercial Paper 25%
Note 3. DUE FROM OTHER GOVERNMENTS At June 30, 2010, due from other governments consisted of the following:
Project and Jurisdiction Administrative Transit Total
Due from Commonwealth of Virginia: Motor fuel sales tax $ 151 $ 6,771,903 $ 6,772,054 Grants 2,999,134 1,464,207 4,463,341 $ 2,999,285 $ 8,236,110 $ 11,235,395 Amounts due from the Commonwealth for the Project and Administrative activities include $2,959,930 for commuter rail, and $39,204 for other projects.

21
NORTHERN VIRGINIA TRANSPORTATION COMMISSION NOTES TO THE BASIC FINANCIAL STATEMENTS Note 4. CAPITAL ASSETS
Capital asset activity for the year ended June 30, 2010 was as follows:
Beginning Ending Balance Increases Decreases Balance
Governmental activities: Capital assets, being depreciated and amortized: Office equipment, furniture and software $ 131,448 $ - $ - $ 131,448 Less accumulated depreciation and amortization for: Office equipment, furniture and software (119,544) (6,345) - (125,889) Governmental activities capital assets, net $ 11,904 $ (6,345) $ - $ 5,559 Depreciation and amortization expense was charged to the governmental activities, general and administrative $ 6,345 Note 5. JOINT VENTURE - VIRGINIA RAILWAY EXPRESS Pursuant to a Master Agreement signed in 1989, NVTC and the Potomac and Rappahannock Transportation Commission ("PRTC") jointly (as the "Commissions") own and operate the Virginia Railway Express ("VRE"). VRE provides commuter rail service on two railroad lines originating in Fredericksburg and Manassas, Virginia and terminating at Union Station, Washington, D.C. The service uses existing track of the CSX Transportation Corporation ("CSX"), and the Norfolk Southern Railway Company, under respective operating access agreements. The provisions of the 1998 agreement with Amtrak for maintenance of equipment, access to Union Station, and train operations terminated on June 25, June 28 and July 9, 2010, respectively. A new agreement between Amtrak and the Commission became effective on June 28, 2010, at an annual fee of $8.8 million, to be adjusted in future years based on changes to various published cost indices. The contract includes $5.2 million for access to and storage of equipment or the annual operation of less than 7,600 or more than 8,000 trains; and $3.6 million for mid-day maintenance, electrical power and other services. During fiscal year 2010, the Commissions entered into a contract with Keolis Rail Services Virginia, LLC for train operations and equipment and facilities maintenance for a five year period beginning June 25, 2010, at an annual fee of $16.8 million with adjustments for service additions or deletions and annual changes to the Consumer Price Index. The amount paid to Keolis during fiscal year 2010 for mobilization to establish the new service and the first several days of operations amounted to approximately $2,080,000.

22
NORTHERN VIRGINIA TRANSPORTATION COMMISSION NOTES TO THE BASIC FINANCIAL STATEMENTS Note 5. JOINT VENTURE - VIRGINIA RAILWAY EXPRESS (Continued) VRE is managed by the Commissions. Certain functions have been delegated to the VRE Operations Board, consisting of three commissioners appointed from each of NVTC and PRTC and one representative of the Commonwealth of Virginia's Department of Rail and Public Transportation. The system is not currently configured for fare revenues alone to produce positive net income. In addition to fares, the project is financed with proceeds from the Commuter Rail Revenue Bond issues, lease financing, Federal (with PRTC as grantee) and Commonwealth of Virginia grants, and local jurisdictional contributions based on a population/ridership formula that is supplemented by voluntary donations from contributing jurisdictions. Grants and contributions fund both operations and capital projects. Participating jurisdictions include the counties of Fairfax, Prince William, Spotsylvania, and Stafford; and the cities of Manassas, Manassas Park, and Fredericksburg, Virginia. Contributing jurisdictions include Arlington County and the City of Alexandria, Virginia. In February 2010 the VRE Master Agreement was amended to include Spotsylvania County as a participating jurisdiction. Spotsylvania County’s share of the VRE annual subsidy from February 2010 through the middle of fiscal year 2012 has been deferred until 60 days after the beginning of fiscal year 2013.
In July 2007, the Commissions adopted amendments to the VRE Master Agreement that expanded the Operations Board to include all member jurisdictions and provided for board representation proportionate to system ridership, and weighted voting proportionate to jurisdictional subsidy. In addition, the amendments apportioned jurisdictional subsidies on system ridership only, rather than the then current 90% system ridership and 10% population formula. The amendment to the subsidy formula is being phased in over four years, beginning in fiscal year 2008. The amendments also allowed for greater autonomy for the Operations Board, with progressively more decisions made by the Board without referral to PRTC and NVTC. Commuter Rail Revenue Bonds have been issued in the name of NVTC for the VRE project. This debt and the capital assets acquired with the debt are not recognized on the financial statements of NVTC, but rather on those of VRE. Following is a schedule of the bonds outstanding as of June 30, 2010 as reported by VRE:
$37,625,000 Commuter Rail Revenue Refunding Bonds, series 1993; maturity of 5,065,000 in July 2010, plus interest at 5.25%
$
5,065,000 $31,700,000 Commuter Rail Revenue Refunding Bonds, series 1998; due in annual maturities of $130,000 to $6,555,000 through July 1, 2014, plus semi-annual interest at 4.8% to 5.375%
24,425,000 29,490,000 (Less) Plus unamortized: Deferred loss (706,986) Premiums 159,326 Total bonded debt, net $ 28,942,340

23
NORTHERN VIRGINIA TRANSPORTATION COMMISSION NOTES TO THE BASIC FINANCIAL STATEMENTS Note 5. JOINT VENTURE - VIRGINIA RAILWAY EXPRESS (Continued) The 1993 and 1998 Series Bonds are payable from a pledge of revenues attributable to VRE, including government grants, local jurisdictional contributions and passenger revenue. A debt service insurance policy guarantees payment of each bond series. Mandatory debt service requirements consist of the following:
Years Ending
June 30,
Principal
Interest Total
Required
2011 $ 5,195,000 $ 1,434,545 $ 6,629,545 2012 5,610,000 1,147,700 6,757,700 2013 5,910,000 841,794 6,751,794 2014 6,220,000 519,494 6,739,494 2015 6,555,000 176,166 6,731,166
$ 29,490,000 $ 4,119,699 $ 33,609,699 Deferred bond, lease and note costs, consisting of issuance costs and insurance premiums are shown net of accumulated amortization. These costs are amortized on a straight-line basis over the life of the debt. Amortization of deferred costs, approximating $101,500, is included in interest expense in 2010. Federal arbitrage regulations apply to VRE’s revenue bonds and the Gallery IV capitalized lease. The Indentures of Trust for the 1997 Commuter Rail Revenue Bonds required VRE to maintain a debt service reserve. During fiscal year 2000, VRE purchased a surety in substitution of the debt service reserve fund, releasing the proceeds from the reserve. The Indentures of Trust for the bonds also require the maintenance of an operating reserve equivalent to one-third (33.3%) of annual budgeted operating expenses. As of June 30, 2010, VRE designated $35,395,025 of its cash, inventory and receivables as this operating reserve. The reserves represented 66.19% of budgeted operating expenses. Funds are invested by the Trustee pursuant to the Indentures of Trust and are classified as restricted. Funds held by the Trustee as of June 30, 2010 are as follows:
Bond Interest Fund $ 785,313 Bond Principal Fund 5,195,000 Total Held by Trustee $ 5,980,313

24
NORTHERN VIRGINIA TRANSPORTATION COMMISSION NOTES TO THE BASIC FINANCIAL STATEMENTS Note 5. JOINT VENTURE - VIRGINIA RAILWAY EXPRESS (Continued) VRE has entered into the following capitalized lease financing to acquire rail cars.
Capitalized lease – Gallery IV (11 cars) $25,100,000 capitalized lease obligation $965,679 due semi-annually, interest at 4.59%, maturing in 2025, collateralized with Gallery IV railcars with a carrying value of $23,721,785
$ 20,775,627
Future minimum lease payments as of June 30, 2010 are as follows:
Years Ended June 30, Amount
2011 $ 1,931,357 2012 1,931,357 2013 1,931,357 2014 1,931,357 2015 1,931,357
2016-2020 9,656,785 2021-2025 9,656,785
Total minimum lease payments 28,970,355 Lease amount representing interest 8,194,728 Present value of lease payments $ 20,775,627

25
NORTHERN VIRGINIA TRANSPORTATION COMMISSION NOTES TO THE BASIC FINANCIAL STATEMENTS Note 5. JOINT VENTURE - VIRGINIA RAILWAY EXPRESS (Continued) Notes Payable – Gallery IV (60 cars) In fiscal year 2008, VRE entered into an agreement with the Federal Railroad Administration for a loan of up to $72.5 million to purchase 50 Gallery railcars; in fiscal year 2009 the terms were amended to include ten additional Gallery railcars. The first 14 of a series of promissory notes were authorized by the end of fiscal year 2010; when all funds have been borrowed, the individual notes will be combined into a single note. The notes are secured by the revenues of VRE and the railcars.
$8,553,421 Promissory Note #1; due in quarterly maturities of $48,739 to $146,358 through March 2033, plus quarterly interest at 4.74%
$
8,176,933
$3,069,526 Promissory Note #2; due in quarterly maturities of $17,491 to $52,523 through March 2033; plus quarterly interest at 4.74%
2,934,417
$7,673,804 Promissory Note #3; due in quarterly maturities of $43,727 to $131,304 through March 2033; plus quarterly interest at 4.74%
7,336,033
$7,673,804 Promissory Note #4; due in quarterly maturities of $43,956 to $131,993 through March 2033, plus quarterly interest at 4.74%
7,374,417
$5,400,287 Promissory Note #5; due in quarterly maturities of $30,933 to $92,885 through March 2033, plus quarterly interest at 4.74%
5,189,599
$7,673,834 Promissory Note #6; due in quarterly maturities of $43,956 to $131,992 through March 2033, plus quarterly interest at 4.74%
7,374,446 $7,673,814 Promissory Note #7; due in quarterly maturities of $43,956 to $131,991 through March 2033, plus quarterly interest at 4.74%
7,374,427 $3,073,814 Promissory Note #8; due in quarterly maturities of $17,703 to $53,160 through March 2033, plus quarterly interest at 4.74%
2,970,001 $2,350,000 Promissory Note #9; due in quarterly maturities of $13,686 to $41,096 through March 2033, plus quarterly interest at 4.74%
2,295,977 $3,896,059 Promissory Note #10; due in quarterly maturities of $22,816 to $68,513 through March 2033, plus quarterly interest at 4.74%
3,827,734 $1,989,000 Promissory Note #11; due in quarterly maturities of $11,715 to $35,178 through March 3033, plus quarterly interest at 4.74%
1,965,472

26
NORTHERN VIRGINIA TRANSPORTATION COMMISSION NOTES TO THE BASIC FINANCIAL STATEMENTS Note 5. JOINT VENTURE - VIRGINIA RAILWAY EXPRESS (Continued) Notes Payable – Gallery IV (60 cars)
$2,640,000 Promissory Note #12; due in quarterly maturities of $15,644 to $46,977 through March 2033, plus quarterly interest at 4.74%
$ 2,624,541
$2,780,343 Promissory Note #13; due in quarterly maturities of $16,475 to $49,473 through March 2033, plus quarterly interest at 4.74%
2,764,062 $1,541,791 Promissory Note #14; due in quarterly maturities of $9,190 to $27,595 through March 2033, plus quarterly interest at 4.74%
1,541,792 $ 63,749,851
Mandatory debt service requirements for the first 14 promissory notes consist of the following:
Years Ended June 30,
Principal
Interest
Total Required
2011 $ 1,572,381 $ 2,994,144 $ 4,566,525 2012 1,644,178 2,922,347 4,566,525 2013 1,731,612 2,834,913 4,566,525 2014 1,811,127 2,755,398 4,566,525 2015 1,898,512 2,668,013 4,566,525
2016-2020 10,954,955 11,877,668 22,832,623 2021-2025 13,872,020 8,960,603 22,832,623 2026-2030 17,553,938 5,278,685 22,832,623 2031-2033 12,711,128 988,446 13,699,574
$ 63,749,851 $ 41,280,217 $ 105,030,068 In June 2002, VRE entered into a borrowing with SunTrust Bank in the amount of $900,000 to refinance a previous borrowing used to purchase the VRE offices. This note carried a repayment schedule of 15 years, with the terms of the note subject to revision June 2007. In November 2007 a new note was signed in the amount of $600,000 at 4.31% interest with a 10 year amortization and a balloon payment after five years. The current note is secured by the office condominium. Principal of $5,000 plus interest is payable monthly. The note had a balance of $440,000 at June 30, 2010. VRE uses a revolving line of credit to finance certain grant-funded capital projects prior to the receipt of reimbursements from the granting agencies. The revolving line of credit was not used during the years ended June 30, 2010. The line of credit is in NVTC’s name and they are obligated for any outstanding balance. Under an agreement entered into between NVTC and VRE for the current fiscal year, project charge backs to VRE for staff support equals $70,000 for the fiscal year, and amounts due from VRE equaled $12,913 as of June 30, 2010.

27
NORTHERN VIRGINIA TRANSPORTATION COMMISSION NOTES TO THE BASIC FINANCIAL STATEMENTS Note 5. JOINT VENTURE - VIRGINIA RAILWAY EXPRESS (Continued) Capital asset activity for the year ended June 30, 2010 was as follows:
Beginning (Deletions) Ending Balance Increases Reclassifications Balance Capital assets not being depreciated or amortized:
Construction in progress $ 33,842,651 $ 33,882,630 $ (24,907,703) $ 42,817,578Capital assets being depreciated and amortized:
Rolling stock 153,611,395 636,844 21,603,937 175,852,176Vehicles 45,550 28,612 - 74,162Facilities 76,785,604 589,083 724,468 78,099,155Track and signal improvements 52,151,000 - - 52,151,000Equipment 7,850,081 38,738 887,502 8,776,321Equity in local properties 5,244,798 - - 5,244,798Furniture, equipment and software 3,314,942 33,868 375,854 3,724,664
Total capital assets being depreciated and amortized 299,003,370 1,327,145 23,591,761 323,922,276
Less accumulated depreciation and amortization for:
Rolling stock 37,389,117 6,061,113 (181,748) 43,268,482Vehicles 43,283 3,698 - 46,981Facilities 16,580,997 2,145,809 (216,628) 18,510,178Track and signal improvements 10,718,487 1,738,300 - 12,456,787Equipment 6,151,721 648,323 - 6,800,044Equity in local properties 2,347,648 149,851 - 2,497,499Furniture, equipment and software 1,644,755 590,312 - 2,235,067
Total accumulated depreciation and amortization 74,876,008 11,337,406 (398,376) 85,815,038Total capital assets being depreciated and amortized, net 224,127,362 (10,010,261) 23,990,137 238,107,238
Totals $ 257,970,013 $ 23,872,369 $ (917,566) $ 280,924,816

28
NORTHERN VIRGINIA TRANSPORTATION COMMISSION NOTES TO THE BASIC FINANCIAL STATEMENTS Note 5. JOINT VENTURE - VIRGINIA RAILWAY EXPRESS (Continued) Financial information from VRE’s fiscal year 2010 audited financial statements is shown below. Complete financial statements for VRE can be obtained from the Director of Finance and Administration of NVTC at 2300 Wilson Blvd., Suite 620, Arlington, VA 22201.
VIRGINIA RAILWAY EXPRESS STATEMENT OF NET ASSETS
June 30, 2010
ASSETS Current Assets Cash and cash equivalents $ 10,042,748 Accounts receivable: Due from PRTC – funded by FTA 13,843,349 Federal grants – other 190,368 Commonwealth of Virginia grants 2,959,930 Trade and other, net of allowance 4,140,978 Inventory 3,445,580 Prepaid expenses and other 772,322 Restricted cash, cash equivalent, and investments 15,579,409 Total current assets 50,974,684 Noncurrent Assets Deferred bond and lease costs, net 1,473,627 Capital assets (net of $85,815,038 accumulated depreciation and amortization) 280,924,816 Total noncurrent assets 282,398,443 Total assets $ 333,373,127
LIABILITIES AND NET ASSETS Current Liabilities Accounts payable and accrued liabilities $ 14,538,022 Unearned revenue 1,056,857 Contract retainage 1,976,566 Current portion of: Capital lease obligations 988,975 Long-term debt 5,195,000 Notes payable 1,632,381 Total current liabilities 25,387,801 Noncurrent Liabilities Capital lease obligations 19,786,652 Notes payable 62,557,470 Bonds payable, net 23,747,340 Compensated absences 283,534 Total noncurrent liabilities 106,374,996 Total liabilities 131,762,797

29
NORTHERN VIRGINIA TRANSPORTATION COMMISSION NOTES TO THE BASIC FINANCIAL STATEMENTS Note 5. JOINT VENTURE - VIRGINIA RAILWAY EXPRESS (Continued)
VIRGINIA RAILWAY EXPRESS STATEMENT OF NET ASSETS (Continued)
June 30, 2010 Net Assets Invested in capital assets, net of related debt $ 164,700,445 Restricted for liability insurance plan 9,511,797 Restricted for debt service and capital lease 5,980,313 Restricted grants or contributions 34,619 Unrestricted assets 21,383,156 Total net assets 201,610,330 Total liabilities and net assets $ 333,373,127
VIRGINIA RAILWAY EXPRESS STATEMENT OF REVENUES, EXPENSES AND
CHANGES IN NET ASSETS Year Ended June 30, 2010
Operating revenues $ 30,267,105 Operating expenses 52,594,511 Operating loss before depreciation and amortization (22,327,406) Depreciation and amortization (11,337,406) Operating loss (33,664,812) Nonoperating revenues (expenses): Subsidies: Commonwealth of Virginia grants 13,153,781 Federal grants – with PRTC as grantee 14,525,795 Jurisdictional contributions 16,376,968 Capital grants and assistance: Commonwealth of Virginia grants 10,939,490 Federal grants – with PRTC as grantee 15,437,312 Federal grants - other 402,355 Other local contributions 680,631 Interest income: Operating funds 23,893 Insurance trust 65,164 Other restricted funds 586 Interest, amortization and other nonoperating expenses, net (5,682,935) Total nonoperating revenues, net 65,923,040
Loss on disposal of assets (393,419) Change in net assets 31,864,809 Net assets, beginning 169,745,521 Net assets, ending $ 201,610,330

30
NORTHERN VIRGINIA TRANSPORTATION COMMISSION NOTES TO THE BASIC FINANCIAL STATEMENTS Note 6. PENSION PLAN
NVTC contributes to the Northern Virginia Transportation Commission Pension Trust (the “Plan”), a single employer public employees’ retirement system, contributory target benefit pension plan covering substantially all employees. Under the terms of the Plan, the normal retirement date is the July 1st closest to the participant’s 65th birthday. Early retirement may be elected if the participant has attained age 55 with ten years of continuous service. Employees vest in the employer’s contributions at the rate of 20% for each year of service until fully vested.
The plan is funded in amounts determined by an actuarial consultant. Employer contributions for the year ended June 30, 2010 totaled $62,882 (10.6% of covered payroll). Required employee contributions for the year ended June 30, 2010 totaled $11,803 (2.0% of covered payroll). Since 1994, participants have been required to contribute 2.0% of covered salary, not to exceed 50% of the aggregate gross annual contribution for benefits. NVTC contributes the balance of the cost of the Plan. NVTC’s payroll for employees covered by the plan for the year ended June 30, 2010 was approximately $592,000.
Note 7. OPERATING LEASES
NVTC leases office space under a 10-year agreement which expires December 31, 2010. Office rent under this lease totaled $178,423 for the year ended June 30, 2010. The lease provides for an adjustment to the base rental for increases in basic costs. Escalation is limited to five percent per year in basic costs of building operation, maintenance and management and the actual increases in real estate taxes and electricity.
NVTC leases office equipment under a five-year agreement which expires December 31, 2010. Minimum monthly payments equal $389 per month. Payments under this lease totaled $4,668 for the year ended June 30, 2010.
Future minimum lease payments required as of June 30, 2010 for the operating leases are as follows:
Year Ending June 30, 2011 $ 86,300
Note 8. COMPENSATED ABSENCES Due Beginning Ending Within Balance Increases Decreases Balance One Year Accrued annual leave $ 103,463 $ 81,011 $ 76,319 $ 108,155 $ 29,994

31
NORTHERN VIRGINIA TRANSPORTATION COMMISSION NOTES TO THE BASIC FINANCIAL STATEMENTS Note 9. SIGNIFICANT COMMITMENTS AND CONTINGENCIES A combination of Federal and Commonwealth of Virginia Grants and local funds are available to finance substantially all of the NVTC contracted services for the projects. Significant NVTC contracts include a sufficiency of funding clause in the event funding becomes unavailable.
All project expenditures are expensed as incurred, including expenditures for tangible assets, as the equipment becomes the property of the transit systems upon completion of the contract.
The Commissions have outstanding commitments on behalf of the VRE for construction of facilities and equipment. A combination of Federal and Commonwealth of Virginia grants will be used to finance these capital projects. The following is a summary of the more significant contractual commitments relating to VRE as of June 30, 2010:
Stations and parking lots $ 1,557,251 Maintenance and layover yards 523,793 Track and signal improvements 5,094 Other administrative 577,730 Railcars 35,253,954 $ 37,917,822
NVTC has received proceeds from several federal and state grant programs. In the event of an audit of these grants certain costs may be questioned as not being appropriate expenditures under the grant agreements. Such findings may result in the refund of grant monies to the grantor agencies. Based on NVTC’s policies and past experience, management believes that no refunds would be due in the case of an audit and accordingly no provision has been made in the accompanying financial statements for the refund of grant monies.
Note 10. RISK MANAGEMENT NVTC is exposed to various risks of loss related to torts; theft of, damage to, and destruction of assets; errors and omissions; injuries to employees; and natural disasters. Commercial insurance is purchased to address these risks, including workers’ compensation and employee health and accidental insurance. VRE’s insurance plan consists of a combination of self-insurance reserves and purchased insurance in amounts actuarially determined to meet the indemnification requirements of the Operating Access Agreements and the Purchase Service Agreements and for liability and property damage. The Commissions indemnify each of the railroads in an amount up to $250,000,000 for any claims against persons or property associated with commuter rail operations. Settled claims have not exceeded coverage during any of the past three fiscal years.

32
NORTHERN VIRGINIA TRANSPORTATION COMMISSION NOTES TO THE BASIC FINANCIAL STATEMENTS Note 11. PENDING GASB STATEMENTS At June 30, 2010, the Governmental Accounting Standards Board (GASB) had issued statements not yet implemented by VRE. The statements which might impact VRE is as follows: GASB Statement No. 54, Fund Balance Reporting and Governmental Fund Type Definitions, establishes standards to enhance the usefulness of fund balance information by providing clearer fund balance classifications that comprise hierarchy based primarily on the extent to which a government is bound to observe constraints imposed upon the use of the resources reported in governmental funds. Statement No. 54 will be effective for periods beginning after June 15, 2010. GASB Statement No. 57, OPEB Measurements by Agent Employers and Agent-Multiple Employer Plans, establishes standards for the measurement and financial reporting of actuarially determined information by agent employers with individual-employer OPEB plans that have fewer than 100 total plan members and by the agent multiple-employer OPEB plans in which they participate. In addition, it clarifies requirements of Statements 43 and 45 related to the coordination of the timing and frequency of OPEB measurements by agent employers and the agent multiple-employer OPEB plans in which they participate. Statement No. 57 will be effective for periods beginning after June 15, 2011. GASB Statement No. 59, Financial Instruments Omnibus, updates and improves existing standards regarding financial reporting and disclosure requirements of certain financial instruments and external investment pools. Statement No. 59 will be effective for periods beginning after June 15, 2010. Management has not yet determined the effect these statements will have on its financial statements.
Note 12. SUBSEQUENT EVENTS In October 2010, the NVTC entered into a 125 month lease for its administrative facilities, effective January 1, 2011. Minimum lease payments are as follows:
Years ending June 30, 2011 $ 14,0332012 170,9352013 176,0712014 181,3512015 186,798
2016 - 2020 1,021,5372021 204,191Total $ $1,954,916

NORTHERN VIRGINIA TRANSPORTATION COMMISSION
SUPPLEMENTARY INFORMATION
YEAR ENDED JUNE 30, 2010

NORTHERN VIRGINIA TRANSPORTATION COMMISSIONSUPPLEMENTARY INFORMATION
SCHEDULE OF CHANGES IN FIDUCIARY NET ASSETS BY JURISDICTIONJURISDICTION TRUST FUND
Year Ended June 30, 2010
City of Arlington City of Fairfax City of LoudounAlexandria County Fairfax County Falls Church County Totals
Additions:Contributions from primary government:
Commonwealth of Virginia 15,200,853$ 28,316,815$ 1,525,947$ 65,200,551$ 901,124$ -$ 111,145,290$ Motor Vehicle Fuel Sales Tax 2,368,961 3,307,031 1,117,772 20,448,933 1,017,942 7,874,560 36,135,199 Federal grant revenue - - - 1,318,400 - - 1,318,400
Interest income 16,274 70,683 7,148 226,581 2,314 64,074 387,074
Total additions 17,586,088 31,694,529 2,650,867 87,194,465 1,921,380 7,938,634 148,985,963
Deductions:Funds disbursed to WMATA:
Metro Matters capital - 5,185,000 315,026 2,648,000 511,546 - 8,659,572 Beyond Metro Matters capital - 261,000 6,000 417,000 8,000 - 692,000 Metrorail operating 7,025,440 13,602,142 500,835 20,132,933 391,634 - 41,652,984 Metrobus operating 9,185,711 - 465,023 35,813,199 1,032,928 - 46,496,861 Metroaccess operating 699,329 755,568 169,293 8,155,387 95,253 - 9,874,830 Metro debt service 1,418,200 2,740,200 46,700 3,168,900 38,500 - 7,412,500
Other funds disbursed:Other capital disbursements - - 3,302,332 1,223,000 - 1,803,949 6,329,281 Other operating disbursements 1,590 1,110,057 954,237 15,936,798 193,793 5,154,215 23,350,690
Total deductions 18,330,270 23,653,967 5,759,446 87,495,217 2,271,654 6,958,164 144,468,718
Change in net assets (744,182) 8,040,562 (3,108,579) (300,752) (350,274) 980,470 4,517,245
Net assets held in trust for member jurisdictionsBeginning of year 8,390,056 25,034,516 5,473,560 81,909,382 1,100,891 22,136,291 144,044,696
End of year 7,645,874$ 33,075,078$ 2,364,981$ 81,608,630$ 750,617$ 23,116,761$ 148,561,941$
33

34
NORTHERN VIRGINIA TRANSPORTATION COMMISSIONSUPPLEMENTARY INFORMATION
SCHEDULE OF GENERAL, ADMINISTRATIVE AND PROJECT EXPENDITURESGENERAL FUND
Year Ended June 30, 2010
General andTotal Administrative Projects
Expenditures:Commissioners' per diem 16,200$ 16,200$ -$ Computer 4,039 2,491 1,548 Conference registration and training 944 944 - Copier duplicating 12,130 12,130 - Disability insurance 3,247 2,644 603 Employee group insurance 65,704 53,493 12,211 Employee retirement 64,112 52,196 11,916 Employer payroll taxes 47,818 38,931 8,887 Leave - annual, holiday, and sick 108,063 87,978 20,085 Legal and auditing 21,650 21,650 - Memberships and subscriptions 1,763 1,763 - Miscellaneous 3,087 3,087 - Office supplies 2,637 2,637 - Office rent 178,972 178,972 - Insurance and liability bonds 5,595 5,595 - Parking and Metrochek 9,316 8,906 410 Postage and shipping 2,699 2,699 - Project consultants and other project costs 490,433 - 490,433 Public information 13,166 500 12,666 Salaries and wages 582,423 475,903 106,520 Telephone 5,428 5,273 155 Travel and meetings 4,086 4,086 -
Total expenditures 1,643,512$ 978,078$ 665,434$

NORTHERN VIRGINIA TRANSPORTATION COMMISSIONSUPPLEMENTARY INFORMATION
SCHEDULE OF PROJECT REVENUES AND EXPENDITURESGENERAL FUND
Year Ended June 30, 2010
JurisdictionGrants & GPS / Bus Data TransActionProjects AVL Marketing Collection SmarTrip 2040 Update Totals
Revenues:Federal 125,568$ -$ -$ -$ -$ -$ 125,568$ Commonwealth of Virginia 101,190 - 12,749 245,872 - - 359,811 Local 5,000 - 13,500 - - - 18,500 NVTC match 22,747 2,626 123,980 324 2,626 9,252 161,555
Total revenue 254,505$ 2,626$ 150,229$ 246,196$ 2,626$ 9,252$ 665,434$
Expenditures:Salaries and wages 15,067$ 1,746$ 81,665$ 215$ 1,746$ 6,081$ 106,520$ Fringe benefits 7,596 880 41,172 109 880 3,065 53,702 Computer - - 1,548 - - - 1,548 Consultants 231,759 - - 245,872 - - 477,631 Telephone 83 - 72 - - - 155 Parking and metrochek - - 304 - - 106 410 Public information - - 12,666 - - - 12,666 Events - - 12,802 - - - 12,802
Total expenditures 254,505$ 2,626$ 150,229$ 246,196$ 2,626$ 9,252$ 665,434$
35

NORTHERN VIRGINIA TRANSPORTATION COMMISSIONSUPPLEMENTARY INFORMATION
SCHEDULE OF PROJECT REVENUES AND EXPENDITURESGENERAL FUND
Project Costs to Date - Active Projects
JurisdictionGrants & GPS / Bus Data TransActionProjects AVL Marketing Collection SmarTrip 2040 Update Totals
Revenues:Federal 315,448$ -$ -$ 113,067$ 1,200,000$ -$ 1,628,515$ Commonwealth of Virginia 152,799 199,500 276,700 1,294,093 4,185,957 - 6,109,049 Local 5,000 - 13,500 50,000 1,426,522 - 1,495,022 Other revenue - - - - 67,915 - 67,915 NVTC match 71,102 37,969 802,902 46,542 226,270 9,252 1,194,037
Total revenue 544,349$ 237,469$ 1,093,102$ 1,503,702$ 7,106,664$ 9,252$ 10,494,538$
Expenditures:Capital outlays -$ -$ 17,556$ -$ -$ -$ 17,556$ Salaries and wages 47,718 24,994 608,343 41,589 152,697 6,081 881,422 Fringe benefits 22,963 11,627 283,466 17,843 70,046 3,065 409,010 Advertising 306 448 354 852 377 - 2,337 Computer - 404 13,460 - - - 13,864 Consultants 442,735 199,482 - 1,442,113 319,033 - 2,403,363 Dues and memberships - - 770 - - - 770 Postage - - - 874 43 - 917 Telephone 108 - 859 21 125 - 1,113 Office supplies - - 187 - - - 187 Travel - - 3,310 350 1,298 - 4,958 Parking and metrochek 8 56 577 60 1,137 106 1,944 Public information - - 151,418 - - - 151,418 Events - - 12,802 - - - 12,802 Costs incurred 30,511 458 - - 6,561,908 - 6,592,877
Total expenditures 544,349$ 237,469$ 1,093,102$ 1,503,702$ 7,106,664$ 9,252$ 10,494,538$
36
Period Ended June 30, 2010

NORTHERN VIRGINIA TRANSPORTATION COMMISSIONSUPPLEMENTARY INFORMATION
SCHEDULE OF EXPENDITURES OF COMMONWEALTH OF VIRGINIA AWARDSYear Ended June 30, 2010
Accrued Accrued(Deferred) (Deferred)
Contract Grant Grant Revenue Cash Revenue Revenue CumulativeGrant Date Number Award 6/30/2009 Received Recognized Expenditures 6/30/2010 Expenditures
Northern Virginia Transportation Commission
Virginia Department of Rail and Public Transportation (DRPT)
Capital:Fiscal Year 2010 7/2/2009 73010-25 3,384,000$ -$ -$ -$ -$ -$ -$ Fiscal Year 2010 7/2/2009 73010-26 792,000 - - 113,164 113,164 113,164 113,164 Fiscal Year 2010 7/2/2009 73010-27 320,000 - - - - - - Fiscal Year 2010 7/2/2009 73010-28 1,200,000 - 809,724 809,724 809,724 - 809,724 Fiscal Year 2010 7/2/2009 73010-29 3,600,000 - - - - - - Fiscal Year 2010 7/2/2009 73010-30 40,000 - - - - - - Fiscal Year 2010 7/2/2009 73010-31 80,000 - - - - - - Fiscal Year 2010 7/2/2009 73010-32 996,000 - - - - - - Fiscal Year 2010 7/2/2009 73010-33 812,000 - - - - - - Fiscal Year 2010 7/2/2009 73010-34 54,400 - - - - - - Fiscal Year 2010 7/2/2009 73010-35 171,200 - - - - - - Fiscal Year 2010 7/2/2009 73010-36 800,000 - - - - - - Fiscal Year 2010 7/2/2009 73010-37 800,000 - - - - - - Fiscal Year 2010 7/2/2009 73010-40 13,946,240 - 6,374,446 6,374,446 6,374,446 - 6,374,446 Fiscal Year 2010 7/2/2009 73010-41 7,725,600 - 6,407,200 6,407,200 6,407,200 - 6,407,200 Fiscal Year 2010 7/2/2009 73010-42 635,250 - 577,501 577,501 577,501 - 577,501 Fiscal Year 2010 7/2/2009 73010-43 5,707,240 - 5,188,399 5,188,399 5,188,399 - 5,188,399 Fiscal Year 2010 7/2/2009 73110-10 2,387,837 - 514,531 514,531 514,531 - 514,531 Fiscal Year 2010 7/2/2009 72509-21 156,270 - - - - - - Fiscal Year 2010 7/2/2009 72509-22 190,190 - - - - - - Fiscal Year 2009 7/1/2008 73009-37 160,000 - - - - - - Fiscal Year 2009 7/1/2008 73009-38 160,000 - 64,123 64,123 64,123 - 64,123 Fiscal Year 2009 7/1/2008 73009-40 400,000 - 89,106 89,106 89,106 - 89,106 Fiscal Year 2009 7/1/2008 73009-41 96,200 - 96,200 96,200 96,200 - 96,200 Fiscal Year 2009 7/1/2008 73009-42 6,084,800 - - - - - - Fiscal Year 2009 7/1/2008 73009-43 500,000 - - - - - - Fiscal Year 2009 7/1/2008 73009-44 4,626,150 - - - - - - Fiscal Year 2009 7/1/2008 73009-45 160,000 - - - - - - Fiscal Year 2009 7/1/2008 73009-46 863,168 - - - - - - Fiscal Year 2009 7/1/2008 73009-47 100,000 - - - - - - Fiscal Year 2009 7/1/2008 73009-48 5,038,800 369,450 5,038,800 4,669,350 4,669,350 - 5,038,800 Fiscal Year 2009 7/1/2008 73009-49 6,804,000 - 6,167,058 6,167,058 6,167,058 - 6,167,058 Fiscal Year 2009 7/1/2008 73009-50 630,400 630,400 630,400 - - - 630,400 Fiscal Year 2009 7/1/2008 73009-51 1,500,800 1,500,800 1,500,800 - - - 1,500,800 Fiscal Year 2009 7/1/2008 73009-52 84,000 - 84,000 84,000 84,000 - 84,000 Fiscal Year 2009 7/1/2008 73009-53 201,040 73,630 95,219 21,589 21,589 - 95,219 Fiscal Year 2009 7/1/2008 73009-54 203,201 - 121,648 121,648 121,648 - 121,648 Fiscal Year 2009 7/1/2008 73009-55 58,800 - - - - - - Fiscal Year 2009 7/1/2008 73009-56 67,200 - 32,061 32,061 32,061 - 32,061 Fiscal Year 2009 7/1/2008 R 73009-57 416,325 - - 13,478 13,478 13,478 13,478
37

Accrued Accrued(Deferred) (Deferred)
Contract Grant Grant Revenue Cash Revenue Revenue CumulativeGrant Date Number Award 6/30/2009 Received Recognized Expenditures 6/30/2010 Expenditures
Northern Virginia Transportation Commission (continued)
Virginia Department of Rail and Public Transportation (DRPT) (continued)
Capital (continued):Fiscal Year 2009 7/1/2008 73009-58 120,000$ -$ -$ -$ -$ -$ -$ Fiscal Year 2009 7/1/2008 R 73109-21 7,555,411 272,955 272,955 - - - 7,555,411 Fiscal Year 2009 7/2/2009 72508-08 150,480 - - - - - - Fiscal Year 2009 7/2/2009 72508-09 175,560 - - - - - - Fiscal Year 2009 7/2/2009 72508-10 100,320 - - - - - - Fiscal Year 2008 8/12/2008 72508-12 125,400 - - - - - - Fiscal Year 2008 10/1/2008 72508-14 59,500 - - - - - - Fiscal Year 2008 8/12/2008 72508-16 59,500 - - - - - - Fiscal Year 2008 9/19/2008 72508-19 100,320 - - - - - - Fiscal Year 2008 7/2/2009 72508-45 712,460 - - - - - - Fiscal Year 2008 7/2/2009 72508-47 99,000 - - - - - - Fiscal Year 2008 1/4/2008 73006-30 40,000,000 - - - - - 38,770,400 Fiscal Year 2008 7/1/2007 73008-03 23,561,720 - - - - - 23,561,720 Fiscal Year 2008 7/1/2007 73008-05 473,070 - - - - - 429,000 Fiscal Year 2008 7/1/2007 73008-06 28,880 - - - - - 28,880 Fiscal Year 2008 1/4/2008 73008-16 20,000,000 - 15,000,000 15,000,000 15,000,000 - 20,000,000 Fiscal Year 2008 1/4/2008 73008-15 4,497,364 4,497,364 4,497,364 - - - 4,497,364 Fiscal Year 2008 10/16/2007 73008-17 2,139,112 - 902,070 902,070 902,070 - 1,965,471 Fiscal Year 2008 10/16/2007 73008-18 65,000 - - - - - - Fiscal Year 2008 10/16/2007 73008-19 88,000 - - - - - - Fiscal Year 2008 10/16/2007 73008-20 2,113,800 1,857,012 2,012,130 158,600 158,600 3,482 2,015,612 Fiscal Year 2008 10/16/2007 73008-21 5,982,926 2,563,618 2,584,629 73,847 73,847 52,836 5,975,449 Fiscal Year 2008 10/16/2007 73008-23 2,400,000 - 2,400,000 2,400,000 2,400,000 - 2,400,000 Fiscal Year 2007 7/2/2009 72507-06 142,768 - - - - - - Fiscal Year 2007 9/19/2008 72507-08 95,178 - - - - - - Fiscal Year 2007 8/12/2008 72507-31 118,973 - - - - - - Fiscal Year 2007 8/12/2008 72507-35 56,678 - - - - - - Fiscal Year 2007 7/1/2008 72507-32 56,678 - - 6,190 6,190 6,190 27,288 Fiscal Year 2007 10/1/2008 72507-33 56,678 - - - - - - Fiscal Year 2007 7/1/2006 73007-19 2,390,740 - - - - - 2,903 Fiscal Year 2007 7/1/2006 73007-20 348,480 - - - - - 254,315 Fiscal Year 2007 7/1/2006 73007-21 6,600 - - - - - 5,240 Fiscal Year 2007 7/1/2006 73007-22 9,952,611 5,386,627 5,446,219 59,592 59,592 - 9,370,408 Fiscal Year 2007 7/2/2009 72507-29 166,563 - - - - - - Fiscal Year 2007 7/2/2009 72507-30 95,178 - - - - - - Fiscal Year 2006 3/3/2010 72506-13 329,600 - 329,600 329,600 329,600 - 329,600 Fiscal Year 2006 7/1/2005 73006-17 31,500 - 7,628 7,628 7,628 - 26,528 Fiscal Year 2006 7/1/2005 73006-25 7,076,790 2,957,882 2,957,882 - - - 7,076,790 Fiscal Year 2006 7/1/2005 73006-26 256,000 256,000 256,000 - - - 256,000
38
NORTHERN VIRGINIA TRANSPORTATION COMMISSIONSUPPLEMENTARY INFORMATION
SCHEDULE OF EXPENDITURES OF COMMONWEALTH OF VIRGINIA AWARDS (Continued)Year Ended June 30, 2010

Accrued Accrued(Deferred) (Deferred)
Contract Grant Grant Revenue Cash Revenue Revenue CumulativeGrant Date Number Award 6/30/2009 Received Recognized Expenditures 6/30/2010 Expenditures
Northern Virginia Transportation Commission (continued)
Virginia Department of Rail and Public Transportation (DRPT) (continued)
FTM/Admin (Operating): . . .Fiscal Year 2010 7/2/2009 72010-25 1,135,037$ -$ 1,094,552$ 1,135,037$ 1,135,037$ 40,485$ 1,135,037$ Fiscal Year 2010 7/2/2009 72010-26 2,129,710 - 2,053,748 2,129,710 2,129,710 75,962 2,129,710 Fiscal Year 2010 7/2/2009 72010-27 468,380 - 451,676 468,380 468,380 16,704 468,380 Fiscal Year 2010 7/2/2009 72010-28 7,876,960 - 7,596,004 7,876,960 7,876,960 280,956 7,876,960 Fiscal Year 2010 7/2/2009 72010-30 50,188,024 - 49,294,157 50,188,024 50,188,024 893,867 50,188,024 Fiscal Year 2010 7/2/2009 72010-31 79,470 - 76,636 79,470 79,470 2,834 79,470 Fiscal Year 2009 7/1/2008 R 72009-29 57,645,223 - - - - - 57,645,223 Fiscal Year 2009 7/1/2008 R 72009-30 1,408,307 23,703 23,703 - - - 1,408,307 Fiscal Year 2009 7/1/2008 R 72009-31 2,196,326 36,962 36,962 - - - 2,196,326 Fiscal Year 2009 7/1/2008 R 72009-32 561,781 9,457 9,457 - - - 561,781 Fiscal Year 2009 7/1/2008 R 72009-33 88,310 1,486 1,486 - - - 88,310 Fiscal Year 2009 7/1/2008 R 72009-34 8,038,680 135,280 135,280 - - - 8,038,680
Demonstration \ Experimental:Fiscal Year 2007
Hydrogen Fuel Injection 7/1/2006 71107-08 86,600 - - - - - 48,458 Fiscal Year 2006
Alexandria RT Bus Info 7/1/2005 71106-06 95,000 - 95,000 95,000 95,000 - 95,000 Fiscal Year 2004
SmarTrip POS Devices 7/1/2003 71004-40 48,545 - - - - - - Fiscal Year 2001 or interim
Intern:Fiscal Year 2006 7/1/2005 71206-07 24,700 2,916 11,402 11,940 11,940 3,454 22,565
Total State Assistance - NVTC 335,813,002$ 20,575,542$ 131,337,756$ 112,265,626$ 112,265,626$ 1,503,412$ 290,448,468$
39
NORTHERN VIRGINIA TRANSPORTATION COMMISSIONSUPPLEMENTARY INFORMATION
SCHEDULE OF EXPENDITURES OF COMMONWEALTH OF VIRGINIA AWARDS (Continued)Year Ended June 30, 2010

NORTHERN VIRGINIA TRANSPORTATION COMMISSIONSUPPLEMENTARY INFORMATION
SCHEDULE OF EXPENDITURES OF COMMONWEALTH OF VIRGINIA AWARDS (Continued)Year Ended June 30, 2010
Accrued Accrued(Deferred) (Deferred)
Grant Grant Revenue Cash Revenue Revenue CumulativeGrant Number Award 06/30/09 Received Recognized Expenditures 6/30/2010 Expenditures
Virginia Railway Express
Virginia Department of Rail and Public Transportation (DRPT)
Capital:Fiscal Year 2010 3/18/2010 72510-19 141,075$ -$ -$ -$ -$ -$ -$ Fiscal Year 2010 7/1/2009 73010-56 945,000 - - - - - - Fiscal Year 2010 7/1/2009 73010-58 4,734,800 - 1,285,635 1,680,264 1,680,264 394,629 1,680,264 Fiscal Year 2010 3/18/2010 73010-70 1,774,000 - - - - - - Fiscal Year 2009 7/20/2009 41009-53 20,000 - - - - - - Fiscal Year 2009 1/30/2009 72509-33 135,850 - - - - - - Fiscal Year 2009 9/1/2009 72509-74 270,000 - 105,006 109,269 109,269 4,263 109,269 Fiscal Year 2009 7/1/2008 73009-59 3,694,477 514,962 2,854,570 2,339,608 2,339,608 - 3,694,477 Fiscal Year 2009 7/1/2008 73009-60 749,000 - - - - - - Fiscal Year 2009 8/25/2010 73109-16 61,832 - - - - - 61,832 Fiscal Year 2009 8/25/2010 73109-38 75,680 - - - - - - Fiscal Year 2008 1/30/2009 72508-21 125,400 - - - - - - Fiscal Year 2008 1/30/2009 76508-36 200,000 41,241 187,277 146,036 146,036 - 200,000 Fiscal Year 2008 1/30/2009 72508-48 191,680 - 38,488 38,488 38,488 - 93,273 Fiscal Year 2008 7/20/2009 72508-58 537,902 - - - - - - Fiscal Year 2008 7/1/2007 73008-01 1,776,710 - 3,106 10,233 10,233 7,127 1,776,710 Fiscal Year 2008 7/1/2007 73008-02 3,459,968 - - - - - 3,459,968 Fiscal Year 2008 1/4/2008 73008-22 15,000,000 2,509,162 10,345,868 7,836,706 7,836,706 - 15,000,000 Fiscal Year 2008 3/16/2009 73008-28 62,192 5,943 5,943 - - - 62,192 Fiscal Year 2008 3/16/2009 73008-29 193,024 193,024 193,024 - - - 193,024 Fiscal Year 2008 6/16/2009 73008-55 58,247 57,595 58,247 652 652 - 58,247 Fiscal Year 2008 3/16/2009 73008-56 11,582 3,604 7,366 4,157 4,157 395 7,097 Fiscal Year 2008 3/16/2009 73008-58 20,800 - - - - - - Fiscal Year 2008 3/16/2009 73008-59 374,061 - 42,222 175,863 175,863 133,641 133,641 Fiscal Year 2008 3/16/2009 73008-61 145,600 115,648 115,648 - - - 145,600 Fiscal Year 2008 3/16/2009 73008-62 20,800 4,408 19,936 15,528 15,528 - 20,800 Fiscal Year 2008 3/16/2009 73008-64 14,560 4,047 4,047 - - - 14,560 Fiscal Year 2008 3/16/2009 73008-65 198,848 - 50,763 50,763 50,763 - 169,882 Fiscal Year 2008 3/16/2009 73008-66 200,824 - 111,411 111,411 111,411 - 200,824 Fiscal Year 2008 3/16/2009 73008-69 10,400 - 5,431 9,588 9,588 4,157 9,588 Fiscal Year 2008 3/16/2009 73008-70 20,800 - - - - - - Fiscal Year 2008 3/16/2009 73008-71 73,632 - - - - - - Fiscal Year 2008 3/16/2009 73008-72 10,400 - - 5,931 5,931 5,931 5,931 Fiscal Year 2008 3/16/2009 73008-73 8,718 - - - - - - Fiscal Year 2007 2/1/2008 72507-11 118,973 4,708 18,912 14,204 14,204 - 37,356 Fiscal Year 2007 2/1/2008 73007-24 282,779 45,945 56,317 12,358 12,358 1,986 155,368 Fiscal Year 2007 2/1/2008 73007-25 355,392 19,135 19,135 79,516 79,516 79,516 233,821
40

NORTHERN VIRGINIA TRANSPORTATION COMMISSIONSUPPLEMENTARY INFORMATION
SCHEDULE OF EXPENDITURES OF COMMONWEALTH OF VIRGINIA AWARDS (Continued)Year Ended June 30, 2010
Accrued Accrued(Deferred) (Deferred)
Grant Grant Revenue Cash Revenue Revenue CumulativeGrant Number Award 6/30/2009 Received Recognized Expenditures 6/30/2010 Expenditures
Virginia Railway Express (continued)
Virginia Department of Rail and Public Transportation (DRPT) (continued)
Capital (continued):Fiscal Year 2007 4/15/2008 73507-07 750,000$ -$ -$ 96,120$ 96,120$ 96,120$ 96,120$ Fiscal Year 2006 8/2/2007 72506-08 500,000 - - 94,157 94,157 94,157 94,157 Fiscal Year 2006 8/2/2007 73006-28 1,771,812 748,015 695,465 118,388 118,388 170,938 1,468,641 Fiscal Year 2005 6/23/2008 73005-26 534,228 142,771 177,704 42,848 42,848 7,915 341,603 Fiscal Year 2004 7/1/2003 73004-20 4,825,414 21,603 197,004 250,989 250,989 75,588 4,727,304
Capital - State Transit Partnership:FTM/Admin (Operating):
Fiscal Year 2010 7/1/2009 73010-32 8,077,470 - 7,789,360 8,077,470 8,077,470 288,110 8,077,470 Fiscal Year 2009 7/1/2008 73009-35 9,254,240 155,740 155,740 - - - 9,254,240
Other Special Projects:Rail Enhancement Fund:
Cherry Hill Station 4/15/2008 76507-07 750,000 - 25,769 25,769 25,769 - 25,769 Gainsville/Haymarket Study 3/18/2008 76506-07 700,000 98,547 98,547 - - - 700,000 Cherry Hill Station 4/15/2008 76506-08 1,750,000 245,207 787,770 542,563 542,563 - 1,750,000
VTA 2000:Fiscal Year 2003
Quantico Creek Bridge 7/1/2002 80001-02 6,137,000 - - - - - 4,243,497 Intern:
Fiscal Year 2007 7/1/2006 71207-04 38,000 - - - - - - Fiscal Year 2006 7/1/2005 71206-08 38,000 - - - - - 31,757
Technical Assistance:Fiscal Year 2009
Gainsville/Haymarket 7/20/2009 41009-53 20,000 - - - - - - Fiscal Year 2006
Turn-back & Express Study 7/1/2006 41006-54 20,000 - - - - - - Station Access Study 7/1/2005 71306-02 100,000 - - - - - 82,551
Transit Capital Fund:Quantico Creek Bridge 8/2/2007 73000-29 257,000 - - - - - -
Eligible expenditures accrued, not yet assigned to specific grants N/A N/A 119,895 - 1,475,562 1,475,562 1,595,457 1,523,328
Total State Assistance - VRE 71,598,170 5,051,200 25,455,711 23,364,441 23,364,441 2,959,930 59,940,161
Total State Assistance - NVTC and VRE 407,411,172$ 25,626,742$ 156,793,467$ 135,630,067$ 135,630,067$ 4,463,342$ 350,388,629$
41

NORTHERN VIRGINIA TRANSPORTATION COMMISSIONSUPPLEMENTARY INFORMATION
SCHEDULE OF EXPENDITURES OF FEDERAL AWARDSYear Ended June 30, 2010
Accrued AccruedFederal (Deferred) (Deferred)CFDA Grant Grant Revenue Cash Revenue Revenue Cumulative
Number Number Award 6/30/09 Received Recognized Expenditures 6/30/10 Expenditures
Northern Virginia Transportation Commission
Federal Transit Administration
City of Alexandria ITS Project 20.500 VA 04-0013 226,710$ -$ 24,758$ 24,758$ 24,758$ -$ 109,149$ Fairfax County 20.507 VA 95-0060 1,318,400 - 1,318,400 1,318,400 1,318,400 - 1,318,400 City of Alexandria ITS Project 20.514 VA 26-0017 353,249 - 100,810 100,810 100,810 - 206,299
1,898,359$ -$ 1,443,968$ 1,443,968$ 1,443,968$ -$ 1,633,848$
42

NORTHERN VIRGINIA TRANSPORTATION COMMISSION
COMPLIANCE SECTION
YEAR ENDED JUNE 30, 2010

43
NORTHERN VIRGINIA TRANSPORTATION COMMISSIONSCHEDULE OF EXPENDITURES OF FEDERAL AWARDSYear Ended June 30, 2010
FederalFederal Granting Agency/ CFDAGrant Program/Grant Number Number Expenditures
Department of Transportation:
Direct Payments:
Federal Transit Administration:Federal Transit Cluster:
VA 04-0013 20.500 24,758$ VA 95-0060 20.507 1,318,400
Total federal transit cluster 1,343,158 VA 26-0017 20.514 100,810
1,443,968$
The accompanying note is an integral part of this financial statement.
Total federal awards expended

NORTHERN VIRGINIA TRANSPORTATION COMMISSION NOTE TO SCHEDULE OF EXPENDITURES OF FEDERAL AWARDS
44
Note 1. Summary of Significant Accounting Policies A. Basis of Presentation and Accounting
The accompanying Schedule of Expenditures of Federal Awards includes the federal grant activity of NVTC and is presented on the accrual basis of accounting. The information in this schedule is presented in accordance with the requirements of OMB Circular A-133, Audits of States, Local Governments, and Non-Profit Organizations. Therefore, some amounts presented in this schedule may differ from amounts presented in, or used in the preparation of, the financial statements. Federal Financial Assistance – The Single Audit Act Amendments of 1996 (Public Law 104-156) and OMB Circular A-133 define federal financial assistance as grants, loans, loan guarantees, property (including donated surplus property), cooperative agreements, interest subsidies, insurance, food commodities, direct appropriations or other assistance. Direct Payments – Assistance received directly from the Federal government is classified as direct payments on the “Schedule of Expenditures of Federal Awards.” Major Programs – The Single Audit Act Amendments of 1996 and OMB Circular A-133 establish the criteria to be used in defining major programs. Major programs for PRTC were determined using a risk-based approach in accordance with OMB Circular A-133. Catalog of Federal Domestic Assistance – The Catalog of Federal Domestic Assistance (CFDA) is a government-wide compendium of individual federal programs. Each program included in the catalog is assigned a five-digit program identification number (CFDA Number), which is reflected in the accompanying schedule.
Cluster of Programs – Closely related programs that share common compliance requirements are grouped into clusters of programs. A cluster of programs is considered as one federal program for determining major programs. The following are the clusters administered by NVTC: Federal Transit – Capital Investment Grants and Federal Transit – Formula Grants.

45
INDEPENDENT AUDITORS' REPORT ON INTERNAL CONTROL OVER FINANCIAL REPORTING
AND ON COMPLIANCE AND OTHER MATTERS BASED ON AN AUDIT OF FINANCIAL STATEMENTS
PERFORMED IN ACCORDANCE WITH GOVERNMENT AUDITING STANDARDS
To the Honorable Commission Board Members Northern Virginia Transportation Commission Arlington, Virginia We have audited the financial statements of the Northern Virginia Transportation Commission (NVTC), as of and for the year ended June 30, 2010, and have issued our report thereon dated November 22, 2010. We conducted our audit in accordance with auditing standards generally accepted in the United States of America; the standards applicable to financial audits contained in Government Auditing Standards, issued by the Comptroller General of the United States; and the Specifications for Audits of Authorities, Boards, and Commissions, issued by the Auditor of Public Accounts of the Commonwealth of Virginia. Internal Control Over Financial Reporting In planning and performing our audit, we considered NVTC’s internal control over financial reporting as a basis for designing our auditing procedures for the purpose of expressing our opinion on the financial statements, but not for the purpose of expressing an opinion on the effectiveness of NVTC’s internal control over financial reporting. Accordingly, we do not express an opinion on the effectiveness of NVTC’s internal control over financial reporting. A deficiency in internal control exists when the design or operation of a control does not allow management or employees, in the normal course of performing their assigned functions, to prevent, or detect and correct misstatements on a timely basis. A material weakness is a deficiency, or combination of deficiencies, in internal controls, such that there is a reasonable possibility that a material misstatement of NVTC’s financial statements will not be prevented, or detected and corrected on a timely basis. Our consideration of internal control over financial reporting was for the limited purpose described in the first paragraph of this section and was not designed to identify all deficiencies in internal control over financial reporting that might be deficiencies, significant deficiencies, or material weaknesses. We did not identify any deficiencies in internal control over financial reporting that we consider to be material weaknesses, as defined above.

46
Compliance and Other Matters As part of obtaining reasonable assurance about whether NVTC’s financial statements are free of material misstatement, we performed tests of its compliance with certain provisions of laws, regulations, contracts and grant agreements, noncompliance with which could have a direct and material effect on the determination of financial statement amounts. However, providing an opinion on compliance with those provisions and specifications was not an objective of our audit and, accordingly, we do not express such an opinion. The results of our tests disclosed no instances of noncompliance or other matters that are required to be reported under Government Auditing Standards. This report is intended solely for the information and use of the Commissioners, management, the Auditor of Public Accounts, and other Federal and state agencies and is not intended to be and should not be used by anyone other than these specified parties.
Harrisonburg, Virginia November 22, 2010

47
INDEPENDENT AUDITORS' REPORT ON COMPLIANCE WITH REQUIREMENTS APPLICABLE TO EACH MAJOR
PROGRAM AND INTERNAL CONTROL OVER COMPLIANCE IN ACCORDANCE WITH OMB CIRCULAR A-133
To the Honorable Commission Board Members Northern Virginia Transportation Commission Arlington, Virginia Compliance We have audited the compliance of the Northern Virginia Transportation Commission (NVTC), with the types of compliance requirements described in the U. S. Office of Management and Budget (OMB) Circular A-133, Compliance Supplement, that are applicable to each of its major Federal programs for the year ended June 30, 2010. NVTC’s major Federal programs are identified in the Summary of Independent Auditors’ Results section of the accompanying Schedule of Findings and Questioned Costs. Compliance with the requirements of laws, regulations, contracts and grants applicable to each of its major Federal programs is the responsibility of NVTC’s management. Our responsibility is to express an opinion on NVTC’s compliance based on our audit. We conducted our audit of compliance in accordance with auditing standards generally accepted in the United States of America; the standards applicable to financial audits contained in Government Auditing Standards, issued by the Comptroller General of the United States; and OMB Circular A-133, Audits of States, Local Governments, and Non-Profit Organizations. Those standards and OMB Circular A-133 require that we plan and perform the audit to obtain reasonable assurance about whether noncompliance with the types of compliance requirements referred to above that could have a direct and material effect on a major Federal program occurred. An audit includes examining, on a test basis, evidence about NVTC’s compliance with those requirements, and performing such other procedures as we considered necessary in the circumstances. We believe that our audit provides a reasonable basis for our opinion. Our audit does not provide a legal determination on NVTC’s compliance with those requirements. In our opinion, NVTC complied, in all material respects, with the requirements referred to above that are applicable to each of its major Federal programs for the year ended June 30, 2010.

48
Internal Control Over Compliance The management of NVTC is responsible for establishing and maintaining effective internal control over compliance with requirements of laws, regulations, contracts and grants applicable to Federal programs. In planning and performing our audit, we considered NVTC’s internal control over compliance with requirements that could have a direct and material effect on a major Federal program in order to determine our auditing procedures for the purpose of expressing our opinion on compliance and to test and report on internal control over compliance in accordance with OMB Circular A-133, but not for the purpose of expressing an opinion on the effectiveness of internal control over compliance. Accordingly, we do not express an opinion on the effectiveness of NVTC’s internal control over compliance. A deficiency in internal control over compliance exists when the design or operation of a control over compliance does not allow management or employees, in the normal course of performing their assigned functions, to prevent, or detect and correct, noncompliance with a type of compliance requirement of a federal program on a timely basis. A material weakness in internal control over compliance is a deficiency, or combination of deficiencies, in internal control over compliance, such that there is a reasonable possibility that material noncompliance with a type of compliance requirement of a federal program will not be prevented, or detected and corrected, on a timely basis. Our consideration of internal control over compliance was for the limited purpose described in the first paragraph of this section and was not designed to identify all deficiencies in internal control over compliance that might be deficiencies, significant deficiencies, or material weaknesses. We did not identify any deficiencies in internal control over compliance that we consider to be material weaknesses, as defined above. This report is intended solely for the information and use of the Commissioners, management, the Auditor of Public Accounts, and other Federal and state agencies and is not intended to be and should not be used by anyone other than these specified parties. Harrisonburg, Virginia November 22, 2010

NORTHERN VIRGINIA TRANSPORTATION COMMISSION Page 1
SCHEDULE OF FINDINGS AND QUESTIONED COSTS Year Ended June 30, 2010
49
I. SUMMARY OF INDEPENDENT AUDITORS’ RESULTS Financial Statements Type of auditors’ report issued: Unqualified Internal control over financial reporting: Material weaknesses identified Yes √ No Significant deficiency identified that is not considered to be material weaknesses Yes √ None Reported Noncompliance material to financial statements noted Yes √ No Federal awards Internal control over major programs: Material weaknesses identified Yes √ No Significant deficiency identified that is not considered to be material weaknesses Yes √ None Reported Type of auditors’ report issued on compliance for major programs: Unqualified Any audit findings disclosed that are required
to be reported in accordance with section 510(a) of Circular A-133? Yes √ No
Identification of major programs:
CFDA Number Name of Federal Program or Cluster Federal Transit Cluster: 20.500 Federal Transit - Capital Investment Grants 20.507 Federal Transit - Formula Grants Dollar threshold used to distinguish between type A and type B
programs: $300,000
Auditee qualified as low-risk auditee? Yes √ No

NORTHERN VIRGINIA TRANSPORTATION COMMISSION Page 2
SCHEDULE OF FINDINGS AND QUESTIONED COSTS Year Ended June 30, 2010
50
II. FINDINGS RELATING TO THE FINANCIAL STATEMENT AUDIT AS REQUIRED TO
BE REPORTED IN ACCORDANCE WITH GENERALLY ACCEPTED GOVERNMENT AUDITING STANDARDS
A. Significant Deficiency in Internal Control None Reported B. Compliance Findings None III. FINDINGS AND QUESTIONED COSTS FOR FEDERAL AWARDS None

NORTHERN VIRGINIA TRANSPORTATION COMMISSION
SUMMARY SCHEDULE OF PRIOR AUDIT FINDINGS Year Ended June 30, 2010
51
There was no single audit performed in the prior year, therefore, there are no prior audit findings to report.

AGENDA ITEM #3 TO: Chairman Hudgins and NVTC Commissioners FROM: Rick Taube DATE: November 24, 2010 SUBJECT: VRE Items
A. Report from the VRE Operations Board and VRE Chief Executive Officer--Information Item.
B. FY 2010 Audited VRE Financial Statements--Action Item/Resolution #2159. C. Sale of 10 VRE Locomotives--Action Item/Resolution #2160.

Item #3A
Report from the VRE Operations Board and VRE Chief Executive Officer Minutes will be provided from the VRE Operations Board’s meeting of November 19, 2010. Also attached are ridership, financial and on-time performance reports. A preview of the FY 2012 budget is included.

1
Virginia Railway Express
CHIEF EXECUTIVE OFFICER’S REPORT
MONTHLY DELAY SUMMARY July August September October System wide Total delays 229 112 86 65 Average length of delay (mins.) 18 26 30 19 Number over 30 minutes 30 24 20 10 Days with Heat Restrictions/Total days 4/21 3/22 0/21 0/20 On-Time Performance 63.0% 82.7% 86.4% 88.9% Fredericksburg Line Total delays 125 65 51 35 Average length of delay (mins.) 19 23 19 18 Number over 30 minutes 16 8 6 4 On-Time Performance 55.8% 77.9% 82.7% 87.5% Manassas Line Total delays 104 47 35 30 Average length of delay (mins.) 18 32 49 20 Number over 30 minutes 14 16 14 6 On-Time Performance 69.1% 86.7% 89.6% 90.1%
SYSTEM RIDERSHIP
Average daily ridership for the month of October was 17,647, which marks the tenth
consecutive month where average daily ridership was above 17,000. On October 13, another all
time ridership record was set when we reached 19,322 trips - until that record was broken on
November 9 with 19,526 riders. All top 10 ridership days have been in 2010, with the previous
record of 19,075 on February 17, 2010. Monthly ridership for October 2009 compared to October
2010 indicates an increase of 4.3%; while year-to-date ridership is 6.1% higher than last year.
ON-TIME PERFORMANCE
System-wide on-time performance for the month of October was 88.9%. October on-time
performance for the Fredericksburg line was 87.5% and the Manassas line was 90.1%. All trains
on the Manassas line had to be cancelled on Friday, October 1st due to low hanging electrical
wires over the tracks in Alexandria, which were the result of a major storm. CSX continued its
flash flood restrictions for the entirety of the same morning, so the Fredericksburg line was also
affected. There was also a two hour signal system outage on the Norfolk Southern line on
October 22nd disrupting morning service significantly.
NEW LOCOMOTIVE
November 2010

2
We look forward to receiving our second new locomotive during the third week of December
2010, with additional locomotives arriving every two weeks after that. We anticipate all twenty
locomotives will be on the property by July 2011.
VRE was notified this month that we received an AdWheel Award for Marketing and
Communications Excellence for the new locomotive poster which was produced this summer
announcing the arrival of our new locomotive. The poster was well received by our riders and
the artwork was also used on the invitations to the ribbon-cutting ceremony which was held in
Alexandria on July 30, 2010.
The VRE CEO signed the Addendum to the Rail Enhancement Fund (REF) agreement for the
Gainesville-Haymarket Extension project on September 14, 2010 and returned it to DRPT for
signature by NS and DRPT. The award of the consultant contract for environmental review and
preliminary engineering is pending the execution of this Addendum.
VRE is continuing to work with Stafford County on the plan review process and obtaining the
necessary permits for the Brooke and Leeland parking expansion projects. The final bid set will
be ready for procurement in spring 2011. This project will add an additional 200 parking spaces
to each lot and sequencing will depend on available funding.
STV/RWA continues its design efforts for the train wash facility at the Broad Run yard and a
new warehouse at the Crossroads yard. The 30% design submittal is anticipated by the end of
the month.
VRE had a schedule change effective November 8. The minor VRE changes included moving
train 300’s (express train) departure time from Woodbridge up by four minutes and changing
train 310 to operate 5 minutes later, which is the same schedule the train operated on before the
addition of the express train. Some Amtrak trains available to VRE riders also underwent some
minor time changes. The new schedule is available on VRE’s web site and in the new
schedules.
NEW LOCOMOTIVE
VRE WINS ADWHEEL AWARD
GAINESVILLE-HAYMARKET
BROOKE AND LEELAND PARKING UPDATE
BROAD RUN TRAIN WASH/CROSSROADS WAREHOUSE
SCHEDULE CHANGE NOVEMBER 8

3
VRE will conduct its annual full scale emergency exercise on Saturday, November 13th in
Springfield on the CSX right of way. This full scale exercise is designed to test internal and
multi-agency coordination following a VRE train incident. To mimic VRE service, a VRE train
consist, complete with train crew and volunteer passengers, was utilized. This year’s drill used
an improvised explosive device (IED) to test emergency response actions of VRE personnel,
railroad personnel and first responders.
The following agencies participated: VRE, Keolis, CSX, approximately 60 volunteer victims,
Fairfax County Fire Dept, Arlington Fire Dept, Alexandria Fire Dept, Ft Myer Fire Dept,
Metropolitan Washington Airport Authority Fire Dept, Montgomery County Fire Dept, City of
Fairfax Fire Dept, Fairfax County Police Department, Town of Quantico Police Dept., Federal
Air Marshals, Virginia State Police, FBI - Joint Terrorism Task Force, Fairfax County Office of
Emergency Management, and Fairfax Connector Bus.
ANNUAL EMERGENCY DRILL – NOVEMBER 13

4
MONTHLY PERFORMANCE MEASURES – OCTOBER 2010
MONTHLY ON-TIME PERFORMANCE ON-TIME
PERCENTAGE
October Fredericksburg OTP Average 87.5%
October Manassas OTP Average 90.1%
OCTOBER OVERALL OTP AVERAGE 88.9%
RIDERSHIP YEAR TO DATE RIDERSHIP
VRE FY 2010 Passenger Totals 1,436,511
VRE FY 2009 Passenger Totals 1,354,198
PERCENTAGE CHANGE 6.1%
RIDERSHIP MONTH TO MONTH COMPARISON
DESCRIPTION MONTHLY RIDERSHIP
OCTOBER 2010 343,734
OCTBER 2009 345,883
PERCENTAGE CHANGE 4.3% NORMALIZED
SERVICE DAYS (CURRENT/PRIOR) 20/21


Item #3B
FY 2010 Audited VRE Financial Statements The VRE Operations Board recommends approval of Resolution #2159. This resolution accepts the completed audit report and authorizes staff to provide copies to the mailing list of interested agencies and firms and to release the audited financial statements to the public. The opinion from VRE’s auditors, PBGH LLP is unqualified (clean).

RESOLUTION #2159 SUBJECT: FY 2010 Audited VRE Financial Statements. WHEREAS: An audit of VRE’s financial statements for FY 2010 has been completed
by PBGH, LLC; and WHEREAS: The auditors have issued an unqualified opinion that VRE’s statements,
in all material respects, fairly and accurately present the financial position of the organization.
NOW, THEREFORE BE IT RESOLVED that the Northern Virginia Transportation
Commission accepts the audit report and authorizes the VRE Chief Executive Officer and NVTC Executive Director to provide copies of the audited financial statements to interested agencies and firms and to release the information to the public.
Approved this 2nd day of December, 2010.
Catherine M. Hudgins Chairman
Mary Hynes Secretary-Treasurer


Certificate of Achievement for Excellence
in Financial Reporting
Presented to
Virginia Railway Express
For its Comprehensive Annual
Financial Report
for the Fiscal Year Ended
June 30, 2009
A Certificate of Achievement for Excellence in Financial Reporting is presented by the Government Finance Officers
Association of the United States and Canada to government units and public employee retirement systems whose comprehensive annual financia l
reports (CAFRs) achieve the highest standards in government accounting
and flJ1ancial reporting.
President
Executive Director

VIRGINIA RAILWAY EXPRESS
Comprehensive Annual Financial Report
YEARS ENDED JUNE 30, 2010 AND 2009

Prepared by:
Department of Finance

THIS PAGE NOT USED

TABLE OF CONTENTS
Page
Introductory Section Letter of Transmittal…………………………………………………... 1 – 3 Directory of Principal Officials and Key Personnel…………………... 4 Organizational Chart …………………………………………………..
5
Financial Section Independent Auditors’ Report……...……………………….………… 6 – 7 Management’s Discussion and Analysis……………………………… Basic Financial Statements
8 – 16
Statements of Net Assets ………...……………………….…….….. 17 and 18
Statements of Revenues, Expenses and Changes in Net Assets……. 19 Statements of Cash Flows ……………………………………….…. 20 Notes to Financial Statements ……………………………………… 21 – 36
Required Supplementary Information Schedule of Funding Progress – Virginia Retirement System……… 37
Statistical Section Introduction to Statistical Section .............................................................. 38Schedule of Change in Net Assets ............................................................. 39Schedule of Outstanding Debt ................................................................... 40Schedule of Jurisdictional Contributions ................................................... 41Schedule of Miscellaneous Statistics ......................................................... 42VRE System Map ....................................................................................... 43Principal Employers of Participating Jurisdictions .................................... 44Demographics and Economic Statistics of Participating Jurisdictions ...... 45 and 46
Compliance Section
Independent Auditors’ Report on Internal Control Over Financial Reporting and on Compliance and Other Matters Based on an Audit of Financial Statements Performed in Accordance With Government Auditing Standards .......... 47 and 48

THIS PAGE NOT USED

Introductory Section

1
November 8, 2010 To the Honorable Operations Board Members and Commissioners The Virginia Railway Express The Northern Virginia Transportation Commission The Potomac and Rappahannock Transportation Commission We are pleased to present the comprehensive annual financial report for fiscal year ended June 30, 2010 for the Virginia Railway Express (VRE), a commuter rail service jointly owned and operated by the Northern Virginia Transportation Commission (NVTC) and the Potomac and Rappahannock Transportation Commission (PRTC). NVTC and PRTC are political subdivisions of the Commonwealth of Virginia. VRE is not a legal entity and is considered a joint venture of the two Commissions for accounting purposes. As used in this report, VRE refers to those activities that are carried out jointly or individually by NVTC and PRTC to operate the commuter rail activities described below. This report conforms to accounting principles generally accepted in the United States of America (GAAP) and provides full disclosure of VRE’s financial position and operations for fiscal year 2010. The information provided in this report assists the VRE Operations Board, Commissions and other officials in making management decisions and provides all interested parties with comprehensive financial data in a format that will enable them to gain a true understanding of VRE’s financial affairs. The report consists of management’s representations concerning the finances of VRE. Consequently, management assumes responsibility for the completeness and reliability of all of the information presented in this report. To provide a reasonable basis for making these representations, VRE’s management has established a comprehensive internal control framework that is designed to protect VRE’s assets from loss, theft, or misuse and to gather sufficient reliable information for the preparation of VRE’s financial statements in conformity with accounting principles generally accepted in the United States of America. The internal control structure is designed to provide reasonable, but not absolute, assurance that these objectives are met. The concept of reasonable assurance recognizes that the cost of a control should not exceed the benefits likely to be derived. The evaluation of costs and benefits requires estimates and judgments by management. VRE’s financial statements have been audited by PBGH, LLP, a firm of licensed certified public accountants, and have earned an unqualified opinion. The independent auditors’ report is located at the front of the financial section of this report. Management’s Discussion and Analysis (MD&A) is found immediately following the independent auditors’ report. This letter of transmittal is designed to complement the MD&A and should be read in conjunction with it.
Profile of Virginia Railway Express
VRE provides commuter rail service on two railroad lines originating in Fredericksburg and Manassas, Virginia, and terminating at Union Station, Washington, DC. VRE began operations in 1992 with 16 trains and 1,800 average daily riders. During fiscal year 2010, VRE operated 30 trains and served an average daily ridership of 16,673.
Virginia Railway Express A Transportation Partnership

2
VRE is managed by the Commissions. Certain functions have been delegated to the VRE Operations Board, consisting of representatives of all contributing and participating jurisdictions and one representative of the Commonwealth of Virginia’s Department of Rail and Public Transportation. PRTC is the recipient of federal grants for the rail service and NVTC is the recipient of state grants for the rail service, with certain minor exceptions. All non-contract staff are employees of PRTC. In accordance with the Master Agreement that created VRE, the Operations Board must prepare and submit a preliminary annual budget to the Commissions and the contributing and participating jurisdictions by September 30 of the preceding fiscal year for review and comment. A final recommended budget is prepared by December 1 for consideration by the Operations Board and the Commissions by February 1, followed by transmittal to the jurisdictions for appropriation.
Economic Conditions
Major Initiatives During fiscal year 2010, VRE focused on improving systems that would ensure the future health of the rail line. Ten new bi-level Gallery railcars were delivered during the fiscal year and placed in service, the completion of the purchase of 60 railcars approved in fiscal years 2008 and 2009. These railcars have allowed VRE to replace aging and leased equipment as well as increase capacity. During fiscal year 2009, VRE placed orders for the construction of nine locomotives. An additional six locomotives were ordered during fiscal year 2010 and five more were approved for purchase by the Commissions in the early months of fiscal year 2011. The first new locomotive was delivered to VRE in June 2010 and seventeen will be received by the end of fiscal year 2011. The new locomotives are more fuel efficient and less costly to maintain and will improve service reliability. A platform extension at the Burke station was completed during the fiscal year and construction of a second platform and overhead pedestrian bridge at the Woodbridge station was substantially completed by year-end. Full use of the new Woodbridge second platform began in August 2010. For Fredericksburg line passengers, design work continues for the expansion of parking at both the Brooke and Leeland stations. Improvements at the Broad Run storage yard, including the construction of a service and inspection building and the extension of tracks for rolling stock storage were completed in the first quarter of fiscal year 2011. In addition, a radio communications system that provides for the monitoring of train communications and can establish direct communication with trains during emergencies was completed. Work continued on an upgrade to the current fare collection system to assure compliance with the Payment Card Industry (PCI) standards for data security. During the second half of FY 2010, VRE prepared for the transition to a new contract operator for train operations and maintenance services. The contract with Keolis Rail Services Virginia, LLC began June 25, 2010, although Amtrak continued to operate revenue trains for the VRE service through July 9, 2010. Long-Term Financial Planning In order to help prioritize future needs and address potential future growth, a Long-Range Strategic Plan was completed in 2004. The plan identifies the projected ridership demand through 2025, and the capital and operating expenses necessary to meet the demand. It also examines potential network extensions, their impact on ridership, and the costs of such expansions. The Strategic Plan provides the technical underpinning for policy and planning decisions in the upcoming years. An update to the cost and timing of the major capital projects included in the plan was begun during fiscal year 2010 and will be completed in fiscal 2011. In addition, the annual budget includes both a multi-year capital program and a six-year forecast of revenue, expenses and funding sources.

Financial Environment
The current financial environment has resulted in a conundrum for VRE, as it has for many transit agencies. As the price of fuel soared, environmental concerns increased, and highways became even more crowded, commuters were drawn to transit alternatives. For VRE, much of this increased ridership was maintained even when fuel costs fell, and further strengthened by investments in new equipment and an increase in the transit subsidy available to many area residents. As a result, VRE experienced its highest cumulative average daily ridership to date during fiscal year 20 10. At the same time, the precipitous decrease in real estate values in Northern Virginia and throughout the Commonwealth and the general economic downturn have caused severe financial difficulty for the local and state governments that provide important subsidy funds for the VRE system. As a result, future VRE budgets will continue to reflect a balance between meeting service needs, controlling subsidy levels and setting fares at a reasonable price.
The focus of the VRE Operations Board and VRE management continues to be the provision of safe, reliable commuter rail service to the citizens of Northern Virginia. With the Washington, DC metropolitan area designated as an ozone non-attainment area, public transit will play an increasingly vital role in addressing the area's need to improve air quality and reduce congestion. It is estimated that VRE takes the equivalent of one full lane of traffic off of both Interstate 95 and Interstate 66 during morning and evening rush hour.
Awards and Acknowledgement
The Government Finance Officers Association of the United States and Canada (GFOA) awarded a Certificate of Achievement for Excellence in Financial Reporting to the Virginia Railway Express for its comprehensive annual financial report for the fiscal year ended June 30, 2009. In order to be awarded a Certificate of Achievement, a government must publish an easily readable and efficiently organized comprehensive annual financial report. This report must satisfY both accounting principles generally accepted in the United States of America and applicable legal requirements.
A Certificate of Achievement is valid for a period of one year only. We believe that our current comprehensive annual financial report continues to meet the Certificate of Achievement Program's requirements and we are submitting it to the GFOA to determine its eligibility for another certificate.
This report could not have been prepared without the dedicated cooperation of the entire Finance staff. We would also like to thank the VRE Operations Board and the Commissions for their continued support in planning and conducting the financial operations of VRE in a responsible, progressive fashion.
Chief Executiv Donna Boxer, CPA Chief Financial Officer
3

4
DIRECTORY OF PRINCIPAL OFFICIALS AND KEY PERSONNEL
Operations Board
Officers
Chairman Hon. Paul Milde, Stafford County
Vice-Chairman Hon. Sharon Bulova, Fairfax County
Treasurer Hon. Paul Smedberg, City of Alexandria
Secretary Hon. Wally Covington, Prince William County
Members
Hon. Maureen Caddigan, Prince William County Hon. John Cook, Fairfax County
Thelma Drake, VDRPT Hon. Frederic Howe, City of Fredericksburg Hon. John Jenkins, Prince William County
Hon. Suhas Naddoni, City of Manassas Park Hon. Gary Skinner, Spotsylvania County Hon. Susan Stimpson, Stafford County Hon. Jonathan Way, City of Manassas
Hon. Christopher Zimmerman, Arlington County
Alternates
Hon. Marc Aveni, City of Manassas Hon. Harry Crisp, Stafford County
Hon. Mark Dudenhefer, Stafford County Hon. Brad Ellis, City of Fredericksburg
Hon. Jay Fisette, Arlington County Hon. Frank Jones, City of Manassas Park Hon. Robert Krupicka, City of Alexandria
Hon. Jerry Logan, Spotsylvania County Hon. Michael May, Prince William County
Hon. Jeff McKay, Fairfax County Hon. Martin Nohe, Prince William County
Kevin Page, VDRPT Hon. John Stirrup, Prince William County
Management
Chief Executive Officer Dale ZehnerDeputy Chief Executive Officer Jennifer MouchantafChief Financial Officer Donna Boxer, CPADirector, Rail Equipment and Services Richard DaltonDirector, Rail Operations April MaguigadDirector, Construction and Facilities Sirel Mouchantaf, P.E.

Virginia Railway Express Organizational Chart
June 2010
5
Manager of Planning
Purchasing AdministratorCapital and Grants Accountant Fare Operations Manager
Web Content & E-Networking Specialist
Passenger Operations SpecialistAccounting Administrator
Manager of InformationPassenger Support & Admin Procurement Administrator
Project Manager
Senior Accountant
Manager of Personnel and Passenger Support Services
Manager of Contract Administration
Manager of Market Development
Facilities Superintendent
Maintenance Quality Assurance Manager Project Manager
Accounting Manager
Equipment Specialist
Project ManagerRevenue Accountant
Operations Service Manager
Written Communications Coordinator
Manager of Transportation Services, Safety and Security
Director of Construction and Facilities
Manager of Public Affairs & Government Relations
Chief Executive Officer
Deputy Chief Executive Officer
Chief Financial Officer Director of Rail Operations
Director of Rail Equipment and Services
Footnote: Manager of Transportation Services, Safety and Security reports to the CEO in matters related to safety and security.
Passenger Support Specialist
Network Administrator Passenger Support Specialist
Passenger Support Specialist
Manager of Information Technology
g ppServices Manager Procurement Administrator
Senior Passenger Support Specialist

Financial Section

6
INDEPENDENT AUDITORS’ REPORT
To the Honorable Commission Board Members The Northern Virginia Transportation Commission The Potomac and Rappahannock Transportation Commission We have audited the accompanying financial statements of the Virginia Railway Express, a joint venture of the Northern Virginia Transportation Commission and the Potomac and Rappahannock Transportation Commission, as of and for the years ended June 30, 2010 and 2009, as listed in the table of contents. These financial statements are the responsibility of the Virginia Railway Express’ management. Our responsibility is to express an opinion on these financial statements based on our audits. We conducted our audits in accordance with auditing standards generally accepted in the United States of America; the standards applicable to financial audits contained in Government Auditing Standards, issued by the Comptroller General of the United States; and Specifications for Audits of Authorities, Boards, and Commissions, issued by the Auditor of Public Accounts of the Commonwealth of Virginia. Those standards and specifications require that we plan and perform the audit to obtain reasonable assurance about whether the financial statements are free of material misstatement. An audit includes consideration of internal control over financial reporting as a basis for designing audit procedures that are appropriate in the circumstances, but not for the purpose of expressing an opinion on the effectiveness of the Virginia Railway Express’ internal control over financial reporting. Accordingly, we express no such opinion. An audit includes examining, on a test basis, evidence supporting the amounts and disclosures in the financial statements. An audit also includes assessing the accounting principles used and significant estimates made by management, as well as evaluating the overall financial statement presentation. We believe that our audits provide a reasonable basis for our opinion. In our opinion, the financial statements referred to above present fairly, in all material respects, the respective financial position of the Virginia Railway Express as of June 30, 2010 and 2009, and the respective changes in financial position and cash flows for the years then ended in conformity with accounting principles generally accepted in the United States of America. In accordance with Government Auditing Standards, we have also issued our report dated November 10, 2010 on our consideration of the Virginia Railway Express’ internal control over financial reporting and our tests of its compliance with certain provisions of laws, regulations, contracts and grant agreements, and other matters. The purpose of that report is to describe the scope of our testing of internal control over financial reporting and compliance and the results of that testing, and not to provide an opinion on the internal control over financial reporting or on compliance. That report is an integral part of an audit performed in accordance with Government Auditing Standards and should be considered in assessing the results of our audits.

7
The management’s discussion and analysis on pages 8 through 16 and Schedule of Funding Progress on page 37 are not a required part of the basic financial statements but are supplementary information required by the accounting principles generally accepted in the United States of America. We have applied certain limited procedures, which consisted principally of inquiries of management regarding the methods of measurement and presentation of the required supplementary information. However, we did not audit the information and express no opinion on it. Our audit was conducted for the purpose of forming an opinion on the financial statements that collectively comprise VRE’s basic financial statements. The accompanying introductory and statistical sections, as listed in the table of contents, are presented for purposes of additional analysis and are not a required part of the basic financial statements. This information has not been subjected to the auditing procedures applied in the audit of the basic financial statements and, accordingly, we express no opinion on it.
Harrisonburg, Virginia November 10, 2010

8
The following Management’s Discussion and Analysis (MD&A) of the Virginia Railway Express’ activities and performance provides the reader with an introduction and overview of the financial statements of the Virginia Railway Express (VRE) for the fiscal year ended June 30, 2010. We encourage readers to consider the information presented here in conjunction with additional information that we have furnished in our letter of transmittal, which can be found on pages 1-3 of this report and the financial statements which begin on page 17.
Financial Operations and Highlights
Operating revenues increased by 16.3 percent compared to the prior year, from $26,034,720 to $30,267,105. Ridership increased by 4.6 percent from 3,857,646 annual trips to 4,033,230.
Operating expenses increased by 3.5 percent from $50,792,704 to $52,594,511. Non-operating revenue and capital grants increased by 4.8 percent from $68,326,404 to
$71,605,975. This increase reflects large federal grants drawn in fiscal year 2010 for the purchase of locomotives (with PRTC as grantee).
The operating loss before depreciation was $22,327,406, a decrease from the previous year of 9.8 percent. Local, federal and state support is accounted for as non-operating income and is used to offset these losses.
VRE’s total net assets increased by $31,864,809 from $169,745,521 to $201,610,330. At the end of the fiscal year, unrestricted net assets were $21,383,156.
During the fiscal year, capital assets, net of accumulated depreciation and amortization, increased by 8.9 percent, primarily as the result of the completion of 10 new Gallery railcars and progress on the construction of 15 new locomotives.
Overview of the Basic Financial Statements
This discussion and analysis are intended to serve as an introduction to the basic financial statements of the Virginia Railway Express. VRE’s basic financial statements also include notes that provide in more detail some of the information in the basic statements. Basic Financial Statements. VRE’s statements are prepared in conformity with accounting principles generally accepting in the United States of America (GAAP) as applied to an enterprise using the accrual basis of accounting. Under this basis, revenues are recognized in the period in which they are earned, and expenses are recognized in the period in which they are incurred. VRE’s basic financial statements are the Statements of Net Assets; the Statements of Revenues, Expenses and Changes in Net Assets; and the Statements of Cash Flows. Comparative data for the prior fiscal year is provided for all three statements.
MANAGEMENT’S DISCUSSION AND ANALYSIS

9
The Statements of Net Assets report VRE’s net assets, the difference between assets and liabilities. Net assets are one way to measure financial position, but the reader should also consider other indicators, such as the rate of growth of operating subsidies, passenger fare levels, ridership, general economic conditions and the age and condition of capital assets. The Statements of Revenues, Expenses and Changes in Net Assets report all of the revenues earned and expenses incurred during the reporting periods. The Statements of Cash Flows provide information on cash receipts and cash payments during the reporting periods. The basic financial statements can be found on pages 17-20 of this report. Notes to the Basic Financial Statements. The notes provide additional information that is essential to a full understanding of the data provided in the basic financial statements. The notes to the basic financial statements can be found on pages 21-36 of this report.
Financial Analysis
Statements of Net Assets
As noted earlier, net assets may serve over time as an indicator of financial position, although other indicators should be considered as well. A condensed summary of VRE’s net assets at June 30, 2010, 2009, and 2008 is shown below:
Condensed Statements of Net Assets
2010 2009 2008 ASSETS: Current and other assets $ 52,448,311 $ 43,704,514 $ 39,350,039 Capital assets, net 280,924,816 257,970,013 226,293,095 Total assets 333,373,127 301,674,527 265,643,134 LIABILITIES: Current portion of long-term debt 7,816,356 7,209,050 7,721,012 Other current liabilities 17,571,445 19,665,846 23,576,220 Non-current liabilities 106,374,996 105,054,110 95,928,158 Total liabilities 131,762,797 131,929,006 127,225,390
NET ASSETS: Invested in capital assets, net of related debt` 164,700,445 143,591,053 113,435,714 Restricted 15,526,729 14,273,387 16,027,225 Unrestricted 21,383,156 11,881,081 8,954,805 Total net assets $ 201,610,330 $ 169,745,521 $ 138,417,744

10
Current Year Net assets increased by approximately $31.9 million, or 18.8 percent during the current fiscal year, due mainly to capital contributions that were used to fund rolling stock and facilities improvements. The largest portion of VRE’s net assets, $164.7 million or 82 percent, represents its investment in capital assets (e.g., land, buildings, improvements, rolling stock, equipment and software), less the related indebtedness outstanding used to acquire those capital assets. VRE uses these assets to provide services to its riders; consequently, these assets are not available for future spending. VRE’s investment in its capital assets is reported net of accumulated depreciation and amortization and net of related debt. The resources required to repay this debt must be provided annually from operations and federal (with PRTC as grantee), state and other local support since it is unlikely that the capital assets themselves will be liquidated to pay liabilities. A portion of VRE’s net assets, $15.5 million or 7.7 percent represents resources that are restricted for the liability insurance plan, debt service, and restricted grant funds less related liabilities. Capital assets, net of accumulated depreciation and amortization, increased approximately $23 million or 8.9 percent as the result of rolling stock and facilities additions. Current liabilities decreased approximately $1.5 million or 5.5 percent as the result of a decrease to accounts payable. Noncurrent liabilities increased approximately $1.3 million or 1.3 percent because of new debt incurred for the purchase of ten additional Gallery railcars, less scheduled bond and note repayments during the year. Restricted net assets increased approximately $1.3 million or 8.8 percent. Prior Year Net assets increased by approximately $31.3 million, or 22.6 percent during the current fiscal year, due mainly to capital contributions that were used to fund rolling stock and facilities improvements. The largest portion of VRE’s net assets, $143.6 million or 84.6 percent, represented its investment in capital assets (e.g., land, buildings, improvements, rolling stock, equipment and software), less the related indebtedness outstanding used to acquire those capital assets. A portion of VRE’s net assets, $14.3 million or 8.4 percent represented resources that are restricted for the liability insurance plan, debt service, and restricted grant funds less related liabilities. Capital assets, net of accumulated depreciation, increased approximately $31.7 million or 14 percent as the result of rolling stock and facilities additions. Current liabilities decreased approximately $4.4 million or 14.1 percent. Accrued expenses in the prior year reflected five Gallery railcars placed in service at year end which were funded with a note payable in the current year. Noncurrent liabilities increased approximately $9.1 million or 9.5 percent because of new debt incurred for the purchase of the remaining 15 of a 50 Gallery railcar purchase and the initiation of construction for ten additional Gallery railcars, less scheduled bond repayments during the year and the defeasance of the Series 1993 bonds. Restricted net assets decreased approximately $1.8 million or 10.9 percent.

11
Statements of Revenues, Expenses and Changes in Net Assets
The following financial information was derived from the Statements of Revenues, Expenses and Changes in Net Assets and reflects how VRE’s net assets changed during the current and two prior fiscal years.
2010 2009 2008 Operating revenues: Passenger revenue $ 30,019,730 $ 25,909,794 $ 21,688,092 Equipment rentals and other 247,375 124,926 133,242 Total operating revenues 30,267,105 26,034,720 21,821,334 Non-operating revenues and capital grants: Subsidies and grants: Commonwealth of Virginia 24,093,271 25,711,262 25,755,293 Federal – with PRTC as grantee 29,963,107 27,432,583 30,782,327 Federal – other 402,355 53,738 959,088 Jurisdictional contributions 16,376,968 17,275,500 13,379,155 In-kind and local contributions 680,631 1,903,284 925,338 Insurance proceeds - - 262,676 Interest income 89,643 406,855 1,334,850 Total non-operating revenues and capital grants
71,605,975
68,326,404
73,398,727
Total revenues 101,873,080 94,361,124 95,220,061
Operating expenses: Contract operations and maintenance 20,291,361 18,694,757 17,433,267 Other operations and maintenance 12,055,009 12,575,004 11,562,892 Property leases and access fees 9,482,367 8,686,385 8,279,505 Insurance 3,864,366 3,866,438 4,099,475 Marketing and sales 1,259,048 1,477,554 1,537,243 General and administrative 5,642,360 5,492,566 5,151,117 Total operating expenses 52,594,511 50,792,704 48,063,499 Other expenses: Depreciation and amortization 11,337,406 10,445,041 10,640,098 Interest, financing costs and other 5,682,935 6,014,243 4,525,279 Total other expenses 17,020,341 16,459,284 15,165,377 Total expenses 69,614,852 67,251,988 63,228,876 Revenues over expenses before special items 32,258,228 27,109,136 31,991,185 Special item – gain (loss) on disposal of assets (393,419) 4,218,641 (3,176,932) Change in net assets 31,864,809 31,327,777 28,814,253
Net assets - beginning of year 169,745,521 138,417,744 109,603,491 Net assets - end of year $ 201,610,330 $ 169,745,521 $ 138,417,744

12
Revenues Current Year Total revenues for the current fiscal year increased approximately $7.5 million or 8 percent. Operating revenues totaled $30.3 million, an increase of 16.3 percent from the prior year. Passenger revenue increased approximately $4.1 million or 15.9 percent, the combined result of a 7 percent midyear fare increase in 2009 and an increase in ridership.
June 30,
2010 2009 2008 Ridership 4,033,230 3,857,646 3,628,563 % Increase (Decrease) 4.6% 6.3% 5.1%
Subsidies and capital grants increased approximately $5.7 million or 11.7 percent; this increase reflects the grants for the purchase of locomotives. Jurisdictional subsidies decreased approximately $.9 million or 5.2 percent. In addition, VRE received $.7 million of in-kind and local contributions. The following chart shows the major sources of revenues for the year ended June 30, 2010:
Passenger revenue29.5%
Equipment rentals and
other0.2%
Commonwealth of Virginia
27.3%
Federal (PRTCand other)
29.8%
Jurisdictions16.7%
Interest income0.1%

13
Prior Year Total revenues for the prior fiscal year decreased approximately $.86 million or .9 percent. Operating revenues totaled $26 million, an increase of 19.3 percent from fiscal year 2008. Passenger revenue increased approximately $4.2 million or 19.5 percent, the combined result of a 10 percent fare increase and a 6.3 percent increase in ridership. Fares were increased 3 percent at the beginning of the year and an additional 7 percent midyear. Subsidies and capital grants decreased approximately $8.8 million or 15.2 percent; this decrease reflects the large federal grant drawn primarily in fiscal year 2009 for the purchase of railcars. Jurisdictional subsidies increased approximately $3.9 million or 29 percent. In addition, VRE received $1.9 million of in-kind and local contributions. Expenses Current Year Total operating and other expenses, including depreciation and amortization, increased approximately $2.4 million or 3.5 percent. Operating expenses increased by $1.8 million or 3.6 percent. Total operating expenses were approximately $52.6 million compared to approximately $50.8 million for the prior fiscal year. Contracted operation and maintenance costs increased by approximately $1.6 million or 8.5 percent because of the one-time costs of transitioning to a new operation and equipment maintenance contractor during the fiscal year. Diesel fuel costs were less than the amount for the prior year by approximately $1.9 million or 33.4 percent, primarily as the result of a substantial decrease to the price of diesel fuel. Property leases and access fees increased by approximately $.77 million or 9 percent as the result of contractual increases and marketing costs decreased by approximately $.31 million or 63.8 percent, a reflection of the decision not to conduct any marketing campaigns during the fiscal year. Depreciation and amortization increased by approximately $.89 million or 8.5 percent and net interest and financing costs decreased by $.33 million or 5.5 percent. The following chart shows the major expense categories for the year ended June 30, 2010:
Contract
operations & maint.29.1%
Other operations & maint.17.3%Leases & access
fees13.6%
Insurance5.8%
Marketing & commissions
1.8%
General and admin.8.1%
Depreciationand amortization
16.3%
Financing & other non operating
8.2%

14
Prior Year Total operating and other expenses, including depreciation and amortization, increased approximately $4 million or 6.4 percent. Operating expenses increased by $2.7 million or 5.7 percent. Total operating expenses were approximately $50.8 million compared to approximately $48.1 million for fiscal year 2008. Diesel fuel costs exceeded the amount for the prior year by approximately $1 million or 21.8 percent. Train crew labor costs increased approximately $1.2 million or 27.8 percent as the result of an Amtrak wage settlement and the transfer of certain costs from insurance to employee benefits. Liability insurance costs were lower than the previous year by approximately $1 million, primarily as the result of a one-time credit and insurance claims costs were higher by approximately $.66 million. Track access and mid-day storage fees increased approximately $.66 million or 8.4 percent as the result of contractual commitments. The gain on sale of assets of approximately $4.2 million was the result of the sale of 13 Kawasaki railcars.
Capital Assets and Debt Administration Capital Assets VRE’s investment in capital assets as of June 30, 2010 amounts to $281 million (net of accumulated depreciation and amortization). This investment in capital assets includes rolling stock, stations and platforms, track and signal improvements, office facilities, equipment and software, and equity in local property. Acquisitions are funded using a variety of financing techniques, including loans and grants from varying government agencies and other local sources.
2010 2009 2008
Rolling stock $ 175,852,176 $ 153,611,395 $ 148,011,293 Vehicles 74,162 45,550 45,550 Facilities 78,099,155 76,785,604 59,713,775 Track and signal improvements 52,151,000 52,151,000 52,269,212 Equipment 8,776,321 7,850,081 7,796,280 Construction in progress 42,817,578 33,842,651 19,461,401 Equity in local properties 5,244,798 5,244,798 5,244,798 Furniture, equipment and software 3,724,664 3,314,942 3,256,370
366,739,854 332,846,021 295,798,679 Less accumulated depreciation and
amortization (85,815,038) (74,876,008) (69,505,584)
Total capital assets, net $ 280,924,816 $ 257,970,013 $ 226,293,095 Current Year During fiscal year 2010, net investment in capital assets increased approximately $23 million or 8.9 percent. Completed projects totaling approximately $24.9 million were closed from construction in progress to their respective capital accounts and an additional $1.3 million was charged directly to the capital accounts.

15
The major completed projects were: manufacture and purchase of 10 Gallery railcars ($22.8 million); Burke platform extension ($1.2 million); the cab signal project ($.5 million); and the two-way radio project ($.4 million). Two older locomotives were sold during the year, a warehouse at the Amtrak Ivy City yard was converted to Amtrak ownership, and equipment was transferred to the purchaser of older Gallery cars and to the new contract operator for a combined net loss on sale in the amount of $.4 million. The major additions to construction in progress during the fiscal year were for the acquisition of new locomotives, improvements to the stations and yards, expansion of parking facilities, and an upgrade to the fare collection system. Additional information on VRE’s capital assets and contractual commitments can be found in Note 3 to the financial statements.
Prior Year During fiscal year 2009, net investment in capital assets increased approximately $31.7 million or 14 percent. Completed projects totaling approximately $43.1 million were closed from construction in progress to their respective capital accounts and an additional $2.24 million was charged directly to the capital accounts. The major completed projects were: manufacture and purchase of 15 Gallery railcars ($27.3 million); overhaul of locomotives ($873,000); Crossroads Yard Expansion ($7.1 million); and construction of the Manassas Parking Garage ($10 million). In addition, 13 Kawasaki railcars and associated equipment with a net book value of approximately $17.7 million were sold during the year, resulting in a gain on sale in the amount of $4.2 million. The major additions to construction in progress during the fiscal year were for acquisition of additional railcars and locomotives, and improvements to the stations and yards. Debt Administration At June 30, 2010, VRE had total debt outstanding of $114,455,478. The revenue bond debt is issued under the name of the Northern Virginia Transportation Commission (NVTC). The bonds are secured by a pledge of VRE revenue. A debt service insurance policy guarantees payment of each bond series. The Northern Virginia Transportation Commission (NVTC) and the Potomac and Rappahannock Transportation Commission (PRTC) are co-lessees of the capital lease for rolling stock, which is secured by the related equipment. The note payable for VRE’s office condominium was issued by NVTC and is secured by the real estate. The promissory notes with the Federal Railroad Administration for the purchase of 60 Gallery railcars are issued by NVTC, and PRTC consented to their issuance and to the pledge of VRE revenues. The notes are secured by the revenues of VRE and the rolling stock.
2010 2009 2008 Revenue bonds $ 29,490,000 $ 34,425,000 $ 53,755,000Capital leases 20,775,627 21,720,726 23,044,557Notes payable 64,189,851 56,622,937 27,530,555 Total $ 114,455,478 $ 112,768,663 $ 104,330,112
VRE has access to a line of credit of up to $1 million with SunTrust Bank; the line was not utilized during 2010. For further information, please refer to Note 7 in the financial statements.

16
Economic Factors and Next Year’s Budget Population growth in Northern Virginia, especially in the outer suburbs, continues to remain robust. In combination with the congestion on major highways and on-going highway construction projects, this growth will continue to increase demand for VRE’s service. The constraining factors to VRE growth are station parking, availability of seats, storage capacity, and the availability of subsidy funds. After three fare increases in the prior two years, no general fare increase was budgeted for fiscal year 2011. The local subsidy for fiscal year 2011 was reduced by $306,659 to a total of $16,070,309, a reflection of the decline in local jurisdiction revenue. The level of state funding for transportation continues to be extremely volatile. The FY 2011 budget reflects costs associated with a new five-year agreement with Amtrak for access to Washington Union Terminal and a new contract with Keolis Rail Services Virginia for operations and maintenance of the commuter rail service. The Keolis contract is for five years with an option to renew for two additional five year periods.
Request for Information This financial report is designed to provide a general overview of VRE’s finances for all those interested. Questions concerning any of the information provided in this report or requests for additional information should be addressed to the Chief Financial Officer, Virginia Railway Express, 1500 King Street, Alexandria, Virginia 22314-2730 or by e-mail to [email protected].

See Notes to Financial Statements. 17
VIRGINIA RAILWAY EXPRESS STATEMENTS OF NET ASSETS June 30, 2010 and 2009 ASSETS 2010 2009 Current Assets: Cash and cash equivalents $ 10,042,748 $ 5,901,750 Accounts receivable: Due from PRTC – funded by FTA 13,843,349 8,790,894 Federal grants – other 190,368 - Commonwealth of Virginia grants 2,959,930 5,051,200 Trade receivables, net of allowance for doubtful accounts 4,036,020 4,126,931 Other receivables 104,958 49,020 Inventory 3,445,580 3,464,574 Prepaid expenses and other 772,322 548,371 Restricted cash, cash equivalents and investments 15,579,409 14,326,630 Total current assets 50,974,684 42,259,370 Noncurrent Assets: Deferred bond and lease costs, net 1,473,627 1,445,144 Capital assets: Rolling stock 175,852,176 153,611,395 Vehicles 74,162 45,550 Facilities 78,099,155 76,785,604 Track and signal improvements 52,151,000 52,151,000 Equipment 8,776,321 7,850,081 Construction in progress 42,817,578 33,842,651 Equity in local properties 5,244,798 5,244,798 Furniture, equipment and software 3,724,664 3,314,942 366,739,854 332,846,021 Less accumulated depreciation and amortization (85,815,038) (74,876,008) Total capital assets, net 280,924,816 257,970,013 Total noncurrent assets 282,398,443 259,415,157 Total assets $ 333,373,127 $ 301,674,527

18
LIABILITIES AND NET ASSETS 2010 2009 Current Liabilities: Accounts payable $ 3,386,946 $ 6,459,391 Accounts payable – rolling stock 1,609,565 1,397,863 Payable to Commissions 496,560 1,131,576 Compensated absences 1,462 3,930 Accrued expenses 7,978,407 7,152,734 Accrued interest 1,065,082 1,192,344 Unearned revenue 1,056,857 938,095 Contract retainage 1,976,566 1,389,913 Notes payable 1,632,381 1,328,952 Current portion of capital lease obligations 988,975 945,098 Current portion of revenue bonds 5,195,000 4,935,000 Total current liabilities 25,387,801 26,874,896 Noncurrent Liabilities: Capital lease obligations 19,786,652 20,775,628 Notes payable 62,557,470 55,293,985 Revenue bonds payable, net 23,747,340 28,726,958 Compensated absences 283,534 257,539 Total noncurrent liabilities 106,374,996 105,054,110 Total liabilities 131,762,797 131,929,006 Net Assets: Invested in capital assets, net of related debt 164,700,445 143,591,053 Restricted for liability insurance plan 9,511,797 8,229,082 Restricted for debt service and capital lease 5,980,313 5,850,112 Restricted grants or contributions 34,619 194,193 Unrestricted assets 21,383,156 11,881,081 Total net assets 201,610,330 169,745,521 Total liabilities and net assets $ 333,373,127 $ 301,674,527

See Notes to Financial Statements. 19
VIRGINIA RAILWAY EXPRESS STATEMENTS OF REVENUES, EXPENSES AND CHANGES IN NET ASSETS Years Ended June 30, 2010 and 2009 2010 2009
Operating Revenues: Passenger revenue $ 30,019,730 $ 25,909,794 Equipment rentals and other 247,375 124,926 Total operating revenues 30,267,105 26,034,720
Operating Expenses: Contract operations and maintenance 20,291,361 18,694,757 Other operations and maintenance 12,055,009 12,575,004 Property leases and access fees 9,482,367 8,686,385 Insurance 3,864,366 3,866,438 Marketing and sales 1,259,048 1,477,554 General and administrative 5,642,360 5,492,566
Total operating expenses 52,594,511 50,792,704
Operating loss before depreciation and amortization (22,327,406) (24,757,984)
Depreciation and amortization (11,337,406) (10,445,041)
Operating loss (33,664,812) (35,203,025) Nonoperating Revenues (Expenses): Subsidies: Commonwealth of Virginia grants 13,153,781 13,482,816 Federal grants – with PRTC as grantee 14,525,795 12,784,123 Jurisdictional contributions 16,376,968 17,275,500 Interest income: Operating funds 23,893 129,620 Insurance trust 65,164 241,003 Other restricted funds 586 36,232 Interest, amortization and other nonoperating expenses, net (5,682,935) (6,014,243)
Total nonoperating revenues, net 38,463,252 37,935,051
Capital grants and assistance: Commonwealth of Virginia grants 10,939,490 12,228,446 Federal grants – with PRTC as grantee 15,437,312 14,648,460 Federal grants – other 402,355 53,738 Less: Pass-through to Fairfax County - (4,456,818) Other local contributions 680,631 1,903,284
Total capital grants and assistance, net 27,459,788 24,377,110 Gain/(Loss) on disposal of assets (393,419) 4,218,641
Change in net assets 31,864,809 31,327,777
Net Assets, beginning 169,745,521 138,417,744
Net Assets, ending $ 201,610,330 $ 169,745,521

See Notes to Financial Statements. 20
VIRGINIA RAILWAY EXPRESS
STATEMENTS OF CASH FLOWS Years Ended June 30, 2010 and 2009
2010 2009 Cash Flows From Operating Activities: Receipts from customers $ 30,393,082 $ 24,447,258 Payments to suppliers (48,894,869) (46,040,729) Payments to employees (4,660,169) (3,842,570) Net cash used in operating activities (23,161,956) (25,436,041) Cash Flows From Noncapital Financing Activities: Governmental subsidies 44,513,699 42,947,801 Cash Flows From Capital and Related Financing Activities: Acquisition and construction of capital assets (26,997,485) (33,571,366) Capital grants and assistance 23,537,414 23,818,720 Pass through to Fairfax County - (4,456,818) Proceeds from sale of capital assets 300,000 22,027,504 Principal paid on capital lease obligations (945,099) (1,323,831) Principal paid on notes (1,384,221) (975,427) Principal paid on bonds (4,935,000) (19,330,000) Interest paid on capital lease obligation (986,259) (1,040,338) Interest paid on bonds and notes (4,637,040) (4,754,084) Net cash used in capital and related financing activities (16,047,690) (19,605,640) Cash Flows From Investing Activities: Interest received on investments 89,724 406,755
Increase (decrease) in cash and cash equivalents 5,393,777 (1,687,125) Cash and Cash Equivalents, beginning 20,228,380 21,915,505 Cash and Cash Equivalents, ending $ 25,622,157 $ 20,228,380 Reconciliation of Operating Loss to Net Cash Used In Operating Activities: Operating loss $ (33,664,812) $ (35,203,025) Adjustments to reconcile operating loss to net cash used in operating activities: Depreciation and amortization 11,337,406 10,445,041 Loss on disposal of inventory - 296,811 Loss on disposal of assets 44,780 - (Increase) decrease in: Accounts receivable 90,911 (1,855,998) Other receivables (83,696) - Inventory (77,041) (93,353) Prepaid expenses and other (223,951) (97,212) Increase (decrease) in: Accounts payable and accrued expenses (704,315) 803,159 Unearned revenue 118,762 268,536 Net cash used in operating activities $ (23,161,956) $ (25,436,041) Schedule of Noncash Capital Activities Capital assets acquired through accounts payable $ 2,441,232 $ 5,534,131 Capital assets acquired through notes payable 8,951,135 30,067,809 Capital assets acquired through accrued liabilities 2,909,466 1,758,811 Capital assets acquired through in-kind contributions 341,344 517,664 $ 14,643,177 $ 37,878,415

VIRGINIA RAILWAY EXPRESS NOTES TO FINANCIAL STATEMENTS
21
Note 1. Summary of Significant Accounting Policies Reporting Entity The Virginia Railway Express (VRE) is accounted for as a joint venture of the Northern Virginia Transportation Commission (NVTC) and the Potomac and Rappahannock Transportation Commission (PRTC). Pursuant to a Master Agreement signed in 1989, NVTC and PRTC (the Commissions) jointly own and operate VRE. VRE provides commuter rail service on two railroad lines originating in Fredericksburg and Manassas, Virginia and terminating at Union Station, Washington, D.C. The service uses existing tracks of the CSX Transportation Corporation (CSX), and the Norfolk Southern Railway Company, under respective operating access agreements. Trains are operated and maintained pursuant to a Purchase of Services Agreement between Amtrak and the Commissions. Assets for VRE operations have been purchased in the name of the Commissions and funded primarily by grants, loans or other financing arrangements for which one or both Commissions have served as grantee, issuer, borrower, or in other related capacities. In order to present a full and accurate picture of VRE operations, all financial transactions related to the commuter rail program are combined in this report.
VRE is managed by the Commissions. Certain functions have been delegated to the VRE Operations Board, which consists of representatives of all contributing and participating jurisdictions and one representative of the Commonwealth of Virginia’s Department of Rail and Public Transportation. The system is not currently configured for fare revenues alone to produce positive operating income. In addition to fares, the project is financed with proceeds from the Commuter Rail Revenue Bonds, a federal loan, a lease financing, Federal (with PRTC as grantee) and Commonwealth of Virginia grants, and jurisdictional contributions based on a population/ridership formula that are supplemented by voluntary donations from contributing jurisdictions. Grants and contributions fund both operations and capital projects. Participating jurisdictions include the counties of Fairfax, Prince William, Spotsylvania and Stafford; and the cities of Manassas, Manassas Park and Fredericksburg, Virginia. Contributing jurisdictions include Arlington County and the City of Alexandria, Virginia. In February 2010 the VRE Master Agreement was amended to include Spotsylvania County as a participating jurisdiction. Spotsylvania County’s share of the VRE annual subsidy from February 2010 through the middle of fiscal year 2012 has been deferred until 60 days after the beginning of fiscal year 2013. In July 2007, the Commissions adopted amendments to the VRE Master Agreement that expanded the Operations Board to include all member jurisdictions and provided for board representation proportionate to system ridership, and weighted voting proportionate to jurisdictional subsidy. In addition, the amendments apportioned jurisdictional subsidies on system ridership only, rather than the former 90 percent system ridership and 10 percent population formula. The amendment to the subsidy formula is being phased in over four years, beginning in fiscal year 2008. The amendments also allowed for greater autonomy for the Operations Board, with progressively more decisions made by the Board without referral to PRTC and NVTC.

VIRGINIA RAILWAY EXPRESS NOTES TO FINANCIAL STATEMENTS
22
Note 1. Summary of Significant Accounting Policies (Continued) Measurement Focus, Basis of Accounting VRE prepares its financial statements using the accrual basis of accounting. The activities of VRE are similar to those of proprietary funds of local jurisdictions. The Governmental Accounting Standards Board (“GASB”) is the accepted standard-setting body for establishing governmental accounting and financial reporting principles. Pursuant to GASB Statement No. 20, Accounting and Financial Reporting for Proprietary Funds and Other Governmental Entities that use Proprietary Fund Accounting, VRE has elected to apply all applicable GASB pronouncements as well as Financial Accounting Standards Board (“FASB”) pronouncements and Accounting Principles Board (“APB”) opinions issued on or before November 30, 1989 that do not conflict with or contradict GASB pronouncements.
Revenues and expenses: VRE distinguishes operating revenues and expenses from nonoperating items. Operating revenues and expenses are those that result from providing services in connection with VRE’s principal ongoing operation. The principal operating revenues of VRE are charges to customers which result in passenger revenues. Passenger revenues are recorded as revenue at the time services are performed. Cash received for services in advance is deferred until earned. Operating revenues and expenses also include all revenues and expenses not associated with capital and related financing, noncapital financing, subsidies, or investing activities. Revenue recognition: Intergovernmental revenues, consisting primarily of Federal (with PRTC as grantee) and Commonwealth of Virginia grants, designated for payment of specific expenses, are recognized at the time that the expenses are incurred. Capital grants and assistance are recognized as additions are made to capital assets and other contributions are included in the Statements of Revenues, Expenses and Changes in Net Assets when expended. VRE records monetary and in-kind contributions as it assesses matching obligations to the jurisdictions or other construction partners. Any excess of grant revenues or expenses at year end are recorded as unearned revenue or accounts receivable, respectively. Cash and investments: VRE considers all highly liquid investments with maturities of three months or less to be cash equivalents. Investments in U.S. government securities and commercial paper are carried at fair value based on quoted market prices. The investment in the Local Government Investment Pool (LGIP or Pool), a 2a7-like pool, is reported at the Pool’s share price. Restricted cash and cash equivalents: Restricted cash, cash equivalents and investments of $15,579,409 and $14,326,630 at June 30, 2010 and 2009, respectively, are comprised of funds related to bond compliance requirements, the balance in the Liability Insurance Plan, remaining proceeds from the sale of the Kawasaki rail cars and a small liability claims account.
Allowance for uncollectible accounts: VRE calculates its allowance for uncollectible accounts using historical collection data and specific account analysis. The allowance was $301,000 at June 30, 2010 and approximately $257,000 at June 30, 2009. Inventory: VRE has purchased an inventory of spare parts for rolling stock that is maintained and managed by Amtrak pursuant to its maintenance responsibilities under the Purchase of Services Agreement with the Commissions. In addition, VRE has established an inventory of parts for rolling stock at its own warehouse located at Broad Run. As the result of the transfer of maintenance operations to Keolis Rail Virginia, all inventory was shifted to VRE’s warehouse at Broad Run in June and July 2010. Inventory is stated at cost, which approximates market, and is valued using the first-in-first-out method.

VIRGINIA RAILWAY EXPRESS NOTES TO FINANCIAL STATEMENTS
23
Note 1. Summary of Significant Accounting Policies (Continued) Measurement Focus, Basis of Accounting (Continued)
Capital assets: For constructed assets, all costs necessary to bring assets to the condition and location necessary for the intended use are capitalized. Asset costs include allocation of certain common construction costs based on the relationship of associated direct costs. Assets constructed directly by jurisdictions in satisfaction of system financial responsibilities have been capitalized at the estimated fair market value as of the date of donation. When assets are substantially complete and ready for use, these costs are transferred from construction in progress to property and equipment and depreciated or amortized. Major improvements and replacements of property are capitalized. Maintenance, repairs and minor improvements and replacements are expensed. Costs of improvements to track and signal facilities owned by the railroads have been capitalized in recognition of the increased efficiency afforded VRE operations over their useful lives. The Commissions retain a residual interest in these assets such that net salvage value will be reimbursed by the railroads upon cessation of commuter rail service. Similarly, shared investments in jurisdictional facilities (“equity in local properties”) recognize the right of access for commuter rail patrons granted to the Commissions. VRE capitalizes assets that have an initial cost of $5,000 or more per unit and a useable life of two or more years, with the exception of software purchases, which are only capitalized if the initial cost is $15,000 or more. The GASB Statement No. 51 accounting and financial reporting requirements for intangible assets were implemented during fiscal year 2010. Depreciation and amortization of all exhaustible equipment, buildings, and intangibles is charged as an expense against operations using the straight-line method over the following estimated useful lives:
Rolling stock 8-40 yearsVehicles 5 yearsFacilities 30-40 yearsTrack and signal improvements 30 yearsEquipment 5 yearsEquity in local properties 35 yearsFurniture, equipment and software 3-10 years
When, in the opinion of management, certain assets are impaired, any estimated decline in value is accounted for as a non-operating expense. There were no impaired assets as of June 30, 2010.
Compensated absences: VRE employees are granted vacation leave based on length of employment. Employees with less than ten years of service may carry over a total of 225 hours of leave from year to year, while those with more than ten years may carry over 300 hours. Excess leave may convert to sick leave or may be paid out with the approval of the Chief Executive Officer. Employees may accumulate sick leave without limitation. Employees who separate in good standing after five or more years of service will be paid for 25 percent of their sick leave credit in excess of 450 hours. Certain employees may accumulate compensatory leave for overtime worked. Compensated absences are accrued when incurred. Long-term obligations: Bond premiums, discounts, and deferred losses, as well as issuance costs, are deferred and amortized over the life of the bonds using the straight line method.

VIRGINIA RAILWAY EXPRESS NOTES TO FINANCIAL STATEMENTS
24
Note 1. Summary of Significant Accounting Policies (Continued) Measurement Focus, Basis of Accounting (Continued) Estimates and assumptions: The preparation of financial statements in conformity with accounting principles generally accepted in the United States of America requires management to make estimates and assumptions that affect the reported amounts of assets and liabilities and disclosure of contingent assets and liabilities at the date of the financial statements and the reported amounts of revenues and expenses during the reporting period. Actual results could differ from those estimates. Note 2. Cash, Cash Equivalents and Investments The VRE Operations Board has adopted a formal investment policy. The goal of the policy is to minimize risk and to ensure the availability of cash to meet VRE’s expenditures, while generating revenue from the use of funds which might otherwise remain idle. The primary objectives of VRE’s investment activities, in priority order, are: safety, liquidity and yield. The policy specifies eligible and ineligible investments; diversification requirements; maximum length of time for various types of investments; and the process for purchasing securities. Interest rate risk: In accordance with its investment policy, VRE manages its exposure to declines in fair values by limiting the maturity of various investment vehicles, as indicated in the chart below. Credit risk: The investment policy specifies credit quality for certain types of investments, as described below, in accordance with the Code of Virginia, and the policy specifies the qualifications for institutions providing depository and investment services. In addition, the Chief Financial Officer must conduct a quarterly review of the condition of each authorized financial institution and broker/dealer.
Investment Credit Quality Savings account or CD’s of any bank or savings and loan association within the Commonwealth of Virginia
Bank or savings and loan association must be a “qualified public depository”
Bankers’ acceptances Institution must be “prime quality” as determined by
one or more recognized rating services
Commercial paper Must be “prime quality” as rated by two of the following: Moody’s (prime 1): S&P (A-1); Fitch (F-1); Duff and Phelps (D-1)
Corporate notes Must be “high quality” as defined by ratings of at least AA by S&P and Aa by Moody’s
Negotiable certificates of deposit and negotiable bank deposit notes
Must have ratings of at least A-1 by S&P and P-1 by Moody’s for short term instruments and AA by S&P and Aa by Moody’s for long term instruments.

VIRGINIA RAILWAY EXPRESS NOTES TO FINANCIAL STATEMENTS
25
Note 2. Cash, Cash Equivalents and Investments (Continued) Custodial credit risk: For deposits, custodial credit risk is the risk that in the event of a failure of a depository financial institution, VRE may not recover its deposits. All cash of VRE is maintained in accounts collateralized in accordance with the Virginia Security for Public Deposits Act, Section 2.2-4400 et. seq. of the Code of Virginia or covered by federal depository insurance. Under the Act, banks holding public deposits in excess of the amounts insured by FDIC must pledge collateral in the amount of 50 percent of excess deposits to a collateral pool in the name of the State Treasury Board. If any member bank fails, the entire collateral pool becomes available to satisfy the claims of governmental entities. With the ability to make additional assessments, the multiple bank collateral pool functions similarly to depository insurance. The Commonwealth of Virginia Treasury Board is responsible for monitoring compliance with the collateralization and reporting requirements of the Act. At June 30, 2010, the book balance of VRE’s deposits with banks was $1,437,467; these funds are swept into a U.S. Government Securities money market fund at the end of each business day. Concentration of credit risk: VRE’s investment policy provides limitations on the percentage of the portfolio that can be invested in each type of security, as indicated in the following chart. The limitations provided in the investment policy for maximum maturity and percentage of the portfolio for each category of investment are as follows:
Investment Length of Maturity Percent Allowed Bonds, notes, and other evidence of indebtedness of the United States 60 months or less 100%
Bonds, notes, and other evidence of indebtedness of the Commonwealth of Virginia 60 months or less 100%
Bonds, notes, and other evidence of indebtedness of any county, city, town, district, authority or other public body of the Commonwealth of Virginia 36 months or less 100%
Bonds and notes of FNMA and FHLB 36 months or less 75%
Savings accounts or CD’s of any bank or savings and loan association within the Commonwealth of Virginia 12 months or less 20%
Money market mutual funds 13 months or less 60%
Repurchase agreements 24 months or less 20%
Bankers’ acceptances 24 months or less 10%
Prime Quality Commercial Paper (no more than 5% from one issuer) 270 days or less 35%
High Quality Corporate Notes 24 months or less 50%
Certificates representing ownership in treasury bond principal 24 months or less 50%
LGIP N/A 100%
Negotiable CD’s and negotiable bank deposit notes 24 months or less 25%

VIRGINIA RAILWAY EXPRESS NOTES TO FINANCIAL STATEMENTS
26
Note 2. Cash, Cash Equivalents and Investments (Continued)
At June 30, 2010, VRE had investments of $8,692,280 in the LGIP. The LGIP is a professionally managed money market fund that invests in qualifying obligations and securities as permitted by Virginia statutes. Pursuant to Section 2.2-4605 of the Code of Virginia, the Treasury Board of the Commonwealth sponsors the LGIP and has delegated certain functions to the State Treasurer. The LGIP reports to the Treasury Board at the Treasury Board’s regularly scheduled monthly meetings. The fair value of the position of the LGIP is the same as the value of the pool shares, i.e., the LGIP maintains a stable net asset value of $1 per share. The LGIP has been assigned an “AAAm” rating by Standard & Poor’s. The Commonwealth of Virginia Department of Treasury manages the VRE Insurance Trust. State statutes govern the portion of assets invested in the Commonwealth’s pooled accounts, while the remainder is invested by an external portfolio manager. At June 30, 2010, VRE had $9,511,797 invested in the Insurance Trust.
Accumulated bond interest and principal payments in the amount of $5,980,313 at June 30, 2010 were held by the bond trustee, U.S. Bank, in U.S. Treasury money market accounts. Investments in U. S. Treasury money market accounts at SunTrust Bank and U.S. Bank have been assigned a “AAAm” rating by Standard & Poor’s. As of June 30, 2010, the carrying values and maturity of VRE’s investments were as follows:
Investment Type
Fair Value
Maturities Less than 1
Year LGIP $ 8,692,280 $ 8,692,280Insurance trust fund – pooled funds 9,511,797 9,511,797Money market funds – U. S. Treasuries 5,980,313 5,980,313Total investments $ 24,184,390 $ 24,184,390

VIRGINIA RAILWAY EXPRESS NOTES TO FINANCIAL STATEMENTS
27
Note 3. Capital Assets Capital asset activity for the year ended June 30, 2010 was as follows:
Beginning (Deletions) Ending Balance Increases Reclassifications Balance Capital assets not being depreciated or amortized:
Construction in progress $ 33,842,651 $ 33,882,630 $ (24,907,703) $ 42,817,578 Capital assets being depreciated and amortized:
Rolling stock 153,611,395 636,844 21,603,937 175,852,176 Vehicles 45,550 28,612 - 74,162 Facilities 76,785,604 589,083 724,468 78,099,155 Track and signal improvements 52,151,000 - - 52,151,000 Equipment 7,850,081 38,738 887,502 8,776,321 Equity in local properties 5,244,798 - - 5,244,798 Furniture, equipment and software 3,314,942 33,868 375,854 3,724,664
Total capital assets being depreciated and amortized 299,003,370 1,327,145 23,591,761 323,922,276
Less accumulated depreciation and amortization for:
Rolling stock 37,389,117 6,061,113 (181,748) 43,268,482 Vehicles 43,283 3,698 - 46,981 Facilities 16,580,997 2,145,809 (216,628) 18,510,178 Track and signal improvements 10,718,487 1,738,300 - 12,456,787 Equipment 6,151,721 648,323 - 6,800,044 Equity in local properties 2,347,648 149,851 - 2,497,499 Furniture, equipment and software 1,644,755 590,312 - 2,235,067
Total accumulated depreciation and amortization
74,876,008
11,337,406
(398,376)
85,815,038
Total capital assets being depreciated and amortized , net 224,127,362 (10,010,261) 23,990,137 238,107,238 Totals $ 257,970,013 $ 23,872,369 $ (917,566) $ 280,924,816

VIRGINIA RAILWAY EXPRESS NOTES TO FINANCIAL STATEMENTS
28
Note 3. Capital Assets (Continued) Capital asset activity for the year ended June 30, 2009 was as follows:
Beginning (Deletions) Ending Balance Increases Reclassifications Balance Capital assets not being depreciated or amortized:
Construction in progress $ 19,461,401 $ 57,521,120 $ (43,139,870) $ 33,842,651 Capital assets being depreciated or amortized:
Rolling stock 148,011,293 1,306,705 4,293,397 153,611,395 Vehicles 45,550 - - 45,550 Facilities 59,713,775 880,000 16,191,829 76,785,604 Track and signal improvements 52,269,212 - (118,212) 52,151,000 Equipment 7,796,280 53,801 - 7,850,081 Equity in local properties 5,244,798 - - 5,244,798 Furniture, equipment and software 3,256,370 - 58,572 3,314,942
Total capital assets being depreciated or amortized 276,337,278 2,240,506 20,425,586 299,003,370
Less accumulated depreciation and amortization for:
Rolling stock 36,705,363 5,758,371 (5,074,617) 37,389,117 Vehicles 36,461 6,822 - 43,283 Facilities 14,676,743 1,904,254 - 16,580,997 Track and signal improvements 8,984,195 1,734,292 - 10,718,487 Equipment 5,532,039 619,682 - 6,151,721 Equity in local properties 2,197,796 149,852 - 2,347,648 Furniture, equipment and software 1,372,987 271,768 - 1,644,755
Total accumulated depreciation and amortization
69,505,584
10,445,041
(5,074,617)
74,876,008
Total capital assets being depreciated and amortized , net 206,831,694 (8,204,535) 25,500,203 224,127,362 Totals $ 226,293,095 $ 49,316,585 $ (17,639,667) $ 257,970,013
Note 4. Related Party Transactions VRE reimburses the Commissions for expenditures made on behalf of VRE. During 2010 and 2009, these payments included $4,055,250 and $3,988,627 of salary-related costs and $6,138 and $4,801 of administrative costs, respectively, which are functionally classified with similar payments made directly to vendors and contractors. In addition, VRE pays the Commissions for direct labor and associated indirect costs incurred for services rendered under budgeted activities for VRE. These staff support payments totaled $70,000 to NVTC during both 2010 and 2009 and $92,345 and $127,178 to PRTC during 2010 and 2009, respectively. VRE also contracts with PRTC for connecting bus service to selected stations on an as needed basis. PRTC bus service costs amounted to $5,226 and $1,273 in 2010 and 2009, respectively. Amounts payable to NVTC and PRTC were $12,914 and $483,646 at June 30, 2010 and $12,344 and $1,119,232 at June 30, 2009, respectively.

VIRGINIA RAILWAY EXPRESS NOTES TO FINANCIAL STATEMENTS
29
Note 5. Defined Benefit Pension Plan A. Plan Description Name of Plan: Virginia Retirement System (VRS) Identification of Plan: Agent and Cost-Sharing Multiple-Employer Defined Benefit Pension Plan Administering Entity: Virginia Retirement System (System) All full-time, salaried permanent employees of VRE participate in the VRS through PRTC. Benefits vest after five years of service. Employees are eligible for an unreduced retirement benefit at age 65 with five years of service or at age 50 with at least 30 years of service, if elected by the employer, payable monthly for life in an amount equal to 1.70 percent of their average final compensation (AFC) for each year of credited service. Benefits are actuarially reduced for retirees who retire prior to becoming eligible for full retirement benefits. In addition, retirees qualify for annual cost-of-living adjustment (COLA) beginning in their second year of retirement. The COLA is limited to 5.00 percent per year. AFC is defined as the highest consecutive 36 months of reported compensation. The VRS also provides death and disability benefits. Title 51.1 of the Code of Virginia (1950), as amended, assigns the authority to establish and amend benefit provisions to the General Assembly of Virginia. The System issues a publicly available comprehensive annual financial report that included financial statements and required supplementary information for VRS. A copy of that report may be downloaded from their website at http://www.varetire.org/Pdf/Publications/2009-Annual-Report.pdf or obtained by writing to the system’s Chief Financial Officer at P.O. Box 2500, Richmond, VA, 23218-2500. B. Funding Policy Plan members are required by title 51.1 of the Code of Virginia (1950), as amended, to contribute 5 percent of their annual reported salary to the VRS. VRE has assumed this 5 percent member contribution. In addition, VRE is required to contribute the remaining amounts necessary to fund its participation in the VRS using the actuarial basis specified by the Code of Virginia and approved by the VRS Board of Trustees. VRE’s contribution rate for retirement for fiscal year 2010 was 11.49 percent of annual covered payroll, inclusive of the 5 percent member contribution, and 0.79 percent for group life insurance. The contribution rate for retirement for fiscal year 2009 was 11.49 percent and 1 percent for group life insurance for July 2009 through March 2010 and 0 percent for April 2010 through June 2010. C. Annual Pension Cost For fiscal year 2010, VRE’s annual pension cost of $365,253 was equal to VRE’s required and actual contributions. The required contribution was determined as part of the June 30, 2007 actuarial valuation using the entry age normal actuarial cost method. The actuarial assumptions at June 30, 2007 included (a) an investment rate of return (net of administrative expenses) of 7.50 percent (b) projected salary increases ranging from 3.75 percent to 5.60 percent per year, and (c) a cost-of-living adjustment of 2.50 percent per year. Both the investment rate of return and the projected salary increases include an inflation component of 2.50 percent. The actuarial value of the PRTC’s assets is equal to the modified market value of the assets (VRE’s assets are not separated from PRTC’s). This method uses techniques that smooth the effects of short term volatility in the market value of assets over a five year period. The unfunded actuarial accrued liability is being amortized as a level percentage of payroll on an open basis. The remaining amortization period at June 30, 2007 was 20 years. VRE’s annual pension cost of $341,017 for fiscal year 2009 and $291,953 for fiscal year 2008 was equal to VRE’s actual and required contributions.

VIRGINIA RAILWAY EXPRESS NOTES TO FINANCIAL STATEMENTS
30
Note 5. Defined Benefit Pension Plan (Continued) C. Annual Pension Cost (Continued) To obtain more information pertaining to three-year trend information and a Schedule of Funding Progress for PRTC and VRE, a request should be sent to PRTC, 14700 Potomac Mills Road, Woodbridge, VA, 22192. VRE’s payroll for the employees covered by the VRS for the years ended June 30, 2010, 2009 and 2008 was $3,023,072, $2,967,956 and $2,769,945 respectively. D. Funded Status and Funding Progress As of June 30, 2009, the most recent actuarial valuation date, the plan was 97.33 percent funded. The actuarial accrued liability for benefits was $6,996,387 and the actuarial value of assets was $6,809,891, resulting in an unfunded actuarial accrued liability (UAAL) of $186,496. The covered payroll (annual payroll of active employees of the plan) was $5,743,627 and the ratio of the UAAL to the covered payroll was 3.25 percent. The only other postemployment benefits offered by VRE are COBRA payments, which have been determined to be immaterial to the financial statements. The Schedule of Funding Progress, presented as required supplementary information following the notes to the financial statements, presents multi-year trend information about whether the actuarial value of plan assets is increasing or decreasing over time relative to the actuarial accrued liability for benefits. Note 6. Operating Leases and Agreements
Operating Access Agreements with the CSX and Norfolk Southern railroads provide the Commissions the right to use tracks owned by the railroads in the provision of commuter rail passenger service. These agreements require the Commissions to pay the railroads a monthly base fee and to reimburse the railroads for any incremental cost incurred by the railroads as a result of providing tracks for commuter rail service. For the years ended June 30, 2010 and 2009, annual track usage fees totaled approximately $6,139,000 and $5,744,000, respectively, and facility and other identified costs totaled approximately $419,000 and $463,000, respectively. Under the Purchase of Services Agreement dated March 1, 1998 Amtrak operated and maintained the VRE service and rolling stock, and permitted the Commissions to use its terminal, station, and equipment maintenance facilities at Union Station, Washington, D.C. Actual costs of these services, which are based on annual budgets prepared in advance by Amtrak, amounted to approximately $21,241,000 in 2010 and $21,206,000 in 2009. The provisions of the 1998 agreement for maintenance of equipment, access to Union Station, and train operations terminated on June 25, June 28 and July 9, 2010, respectively. A new agreement between Amtrak and the Commissions became effective on June 28, 2010, at an annual fee of $8.8 million, to be adjusted in future years based on changes to various published cost indices. The contract includes $5.2 million for access to and storage of equipment or the annual operation of less than 7,600 or more than 8,000 trains; and $3.6 million for mid-day maintenance, electrical power and other services.

VIRGINIA RAILWAY EXPRESS NOTES TO FINANCIAL STATEMENTS
31
Note 6. Operating Leases and Agreements (Continued) During fiscal year 2010, the Commissions entered into a contract with Keolis Rail Services Virginia, LLC for train operations and equipment and facilities maintenance for a five year period beginning June 25, 2010, at an annual fee of $16.8 million with adjustments for service additions or deletions and annual changes to the Consumer Price Index. The amount paid to Keolis during fiscal year 2010 for mobilization to establish the new service and the first several days of operations amounted to approximately $2,080,000. VRE has entered into a series of operating leases with Titan Transit for locomotives. At June 30, 2010, three locomotives were under lease at an annual cost of approximately $203,000. The leases are scheduled to terminate during fiscal year 2012.
Note 7. Long-Term Debt Obligations The following is a summary of long-term liability activity for the year ended June 30, 2010:
Beginning Balance
Increases
Decreases
Ending Balance
Due Within One Year
Revenue Bonds $ 34,425,000 $ - $ (4,935,000) $ 29,490,000 $ 5,195,000 Capital Leases 21,720,726 - (945,099) 20,775,627 988,975 Notes Payable 56,622,937 8,951,135 (1,384,221) 64,189,851 1,632,381 112,768,663 8,951,135 (7,264,320) 114,455,478 7,816,356 Accrued Annual Leave
261,469 240,801 (217,274) 284,996 1,462
$ 113,030,132 $ 9,191,936 $ (7,481,594) $ 114,740,474 $ 7,817,818
Revenue Bonds:
$37,625,000 Commuter Rail Revenue Refunding Bonds, series 1993; due in annual maturity of $5,065,000 on July 1, 2010, plus interest at 5.25%
$
5,065,000
$31,700,000 Commuter Rail Revenue Refunding Bonds, series 1998; due in annual maturities of $130,000 to $6,555,000 through July 1, 2014, plus semi-annual interest at 4.8% to 5.375%
24,425,000 29,490,000 Plus (less) unamortized: Deferred loss (706,986) Premiums 159,326 Total bonded debt, net $ 28,942,340
The 1993 and 1998 Series Bonds are payable from a pledge of revenues attributable to VRE, including government grants, local jurisdictional contributions and passenger revenue. A debt service insurance policy guarantees payment of each bond series. Mandatory debt service requirements consist of the following:
Years Ended June 30,
Principal
Interest
Total Required
2011 $ 5,195,000 $ 1,434,545 $ 6,629,545 2012 5,610,000 1,147,700 6,757,700 2013 5,910,000 841,794 6,751,794 2014 6,220,000 519,494 6,739,494 2015 6,555,000 176,166 6,731,166
$ 29,490,000 $ 4,119,699 $ 33,609,699

VIRGINIA RAILWAY EXPRESS NOTES TO FINANCIAL STATEMENTS
32
Note 7. Long-Term Debt Obligations (Continued) Deferred bonds, lease, and notes cost, consisting of issuance costs and insurance premiums are shown net of accumulated amortization. These costs are amortized on a straight-line basis over the life of the debt. Amortization of deferred costs, approximating $101,500 and $95,000, is included in interest expense in 2010 and 2009, respectively. Federal arbitrage regulations apply to VRE’s revenue bonds and the Gallery IV capitalized lease. The Indentures of Trust for the 1997 Commuter Rail Revenue Bonds required VRE to maintain a debt service reserve. During fiscal year 2000, VRE purchased a surety in substitution of the debt service reserve fund, releasing the proceeds from the reserve. The Indentures of Trust for the bonds also require the maintenance of an operating reserve equivalent to one-third (33.3 percent) of annual budgeted operating expenses. As of June 30, 2010 and 2009, VRE designated $35,395,025 and $27,932,489 respectively, of its cash, inventory and receivables as this operating reserve. The reserves represented 66.19 percent and 56.18 percent of budgeted operating expenses for June 30, 2010 and 2009, respectively. Funds are invested by the Trustee pursuant to the Indentures of Trust and are classified as restricted. Funds held by the Trustee as of June 30, 2010 and 2009, are as follows:
2010 2009 Bond Interest Fund $ 785,313 $ 914,568Bond Principal Fund 5,195,000 4,935,544 Total held by Trustee $ 5,980,313 $ 5,850,112
Capitalized Lease - Gallery IV (11 cars)
$25,100,000 capitalized lease obligation; $965,679 due semi-annually, interest at 4.59%, maturing in 2025, collateralized with Gallery IV railcars with a carrying value of $23,721,785.
$
20,775,627 Future minimum lease payments as of June 30, 2010 are as follows:
Years Ended June 30, Amount
2011 $ 1,931,357 2012 1,931,357 2013 1,931,357 2014 1,931,357 2015 1,931,357
2016-2020 9,656,785 2021-2025 9,656,785
Total minimum lease payments 28,970,355 Lease amount representing interest 8,194,728 Present value of lease payments $ 20,775,627

VIRGINIA RAILWAY EXPRESS NOTES TO FINANCIAL STATEMENTS
33
Note 7. Long-Term Debt Obligations (Continued) Notes Payable – Gallery IV (60 cars) In fiscal year 2009, VRE entered into an agreement with the Federal Railroad Administration for a loan of up to $72.5 million to purchase 50 Gallery railcars; in fiscal year 2010 the terms were amended to include ten additional Gallery railcars. The first 14 of a series of promissory notes were authorized by the end of fiscal year 2010; when all funds have been borrowed, the individual notes will be combined into a single note. The notes are secured by the revenues of VRE and the railcars.
$8,553,421 Promissory Note #1; due in quarterly maturities of $48,739 to $146,358 through March 2033, plus quarterly interest at 4.74%
$
8,176,933
$3,069,526 Promissory Note #2; due in quarterly maturities of $17,491 to $52,523 through March 2033; plus quarterly interest at 4.74%
2,934,417
$7,673,804 Promissory Note #3; due in quarterly maturities of $43,727 to $131,304 through March 2033; plus quarterly interest at 4.74%
7,336,033
$7,673,804 Promissory Note #4; due in quarterly maturities of $43,956 to $131,993 through March 2033, plus quarterly interest at 4.74%
7,374,417
$5,400,287 Promissory Note #5; due in quarterly maturities of $30,933 to $92,885 through March 2033, plus quarterly interest at 4.74%
5,189,599
$7,673,834 Promissory Note #6; due in quarterly maturities of $43,956 to $131,992 through March 2033, plus quarterly interest at 4.74%
7,374,446
$7,673,814 Promissory Note #7; due in quarterly maturities of $43,956 to $131,991 through March 2033, plus quarterly interest at 4.74%
7,374,427
$3,073,814 Promissory Note #8; due in quarterly maturities of $17,703 to $53,160 through March 2033, plus quarterly interest at 4.74%
2,970,001
$2,350,000 Promissory Note #9; due in quarterly maturities of $13,686 to $41,096 through March 2033, plus quarterly interest at 4.74%
2,295,977
$3,896,059 Promissory Note #10; due in quarterly maturities of $22,816 to $68,513 through March 2033; plus quarterly interest at 4.74%
3,827,734
$1,989,000 Promissory Note #11; due in quarterly maturities of $11,715 to $35,178 through March 2033; plus quarterly interest at 4.74%
1,965,472
$2,640,000 Promissory Note #12; due in quarterly maturities of $15,644 to $46,977 through March 2033, plus quarterly interest at 4.74%
2,624,541
$2,780,343 Promissory Note #13; due in quarterly maturities of $16,475 to $49,473 through March 2033, plus quarterly interest at 4.74%
2,764,062

VIRGINIA RAILWAY EXPRESS NOTES TO FINANCIAL STATEMENTS
34
Note 7. Long-Term Debt Obligations (Continued) Notes Payable – Gallery IV (60 cars) (Continued) $1,541,791 Promissory Note #14; due in quarterly maturities of $9,190 to $27,595 through March 2033, plus quarterly interest at 4.74%
$ 1,541,792
$ 63,749,851 Mandatory debt service requirements for the first 14 promissory notes consist of the following:
Years Ended June 30,
Principal
Interest
Total Required
2011 $ 1,572,381 $ 2,994,144 $ 4,566,525 2012 1,644,178 2,922,347 4,566,525 2013 1,731,612 2,834,913 4,566,525 2014 1,811,127 2,755,398 4,566,525 2015 1,898,512 2,668,013 4,566,525
2016-2020 10,954,955 11,877,668 22,832,623 2021-2025 13,872,020 8,960,603 22,832,623 2026-2030 17,553,938 5,278,685 22,832,623 2031-2033 12,711,128 988,446 13,699,574
$ 63,749,851 $ 41,280,217 $ 105,030,068 Note Payable – VRE Offices: In June 2002, VRE entered into a borrowing with SunTrust Bank in the amount of $900,000 to refinance a previous borrowing used to purchase the VRE offices. This note carried a repayment schedule of 15 years, with the terms of the note subject to revision June 2007. In November 2007 a new note was signed in the amount of $600,000 at 4.31 percent interest with a 10 year amortization and a balloon payment after five years. Principal of $5,000 plus interest is payable monthly. The note is secured by the office condominium. The balance outstanding was $440,000 and $500,000 for the years ended June 30, 2010 and 2009, respectively. Note 8. Short-Term Debt VRE uses a revolving line of credit to finance certain grant-funded capital projects prior to the receipt of reimbursements from the granting agencies. The revolving line of credit was not used during the years ended June 30, 2010 and 2009. The line of credit is in NVTC’s name and they are obligated for any outstanding balance.

VIRGINIA RAILWAY EXPRESS NOTES TO FINANCIAL STATEMENTS
35
Note 9. Liability Insurance Plan VRE is exposed to various risks of loss related to torts; theft of, damage to and destruction of assets; and natural disasters. The Virginia Department of Treasury, Division of Risk Management has established the terms of VRE’s Commuter Rail Operations Liability Plan (the Insurance Plan). The Insurance Plan consists of a combination of self-insurance reserves and purchased insurance in amounts actuarially determined to meet the indemnification requirements of the Operating Access Agreements and the Purchase of Services Agreement and for liability and property damage. The Commissions indemnify each of the railroads in an amount up to $250,000,000 for any claims against persons or property associated with commuter rail operations. Settled claims have not exceeded commercial coverage during any of the past three fiscal years. The liability for incurred but not reported claims was approximately $283,000 at June 30, 2010 and $254,000 at June 30, 2009. The Division of Risk Management manages the Insurance Trust Fund pursuant to provisions of the Insurance Plan. Since November 2009, all plan assets have been invested in the Department of Treasury common pool. Prior to that time, approximately one-half of plan assets were invested in the common pool, and the remainder was invested in a portfolio managed by external financial consultants. Activity in the Insurance Trust Fund for the years ended June 30, 2010 and 2009 was as follows:
2010 2009
Beginning balance, July 1 $ 8,229,082 $ 7,470,123 Contribution to reserves 5,005,000 4,345,000 Insurance premiums paid (3,639,323) (3,017,157)Claims mitigation costs and losses incurred (68,329) (718,544)Investment income 65,164 241,003 Actuarial and administrative charges (79,797) (70,343)Transfer to VRE for small liability claims - (21,000)Ending balance, June 30 $ 9,511,797 $ 8,229,082
An actuarial study is performed annually to determine the adequacy of the Insurance Trust Fund for the risk retained and to determine the required contribution to reserves.

VIRGINIA RAILWAY EXPRESS NOTES TO FINANCIAL STATEMENTS
36
Note 10. Contingencies and Contractual Commitments At June 30, 2010, there were disputes between VRE and certain vendors. The amounts of any settlements, should they occur, are not determinable at this time. However, such amounts are not expected to be material in relation to the recorded amounts. The Commissions have outstanding commitments for construction of facilities and equipment. A combination of Federal (with PRTC as grantee) and Commonwealth of Virginia grants and local funds will be used to finance these capital projects. The following is a summary of the more significant contractual commitments, net of expenditures incurred as of June 30, 2010:
Stations and parking lots $ 1,557,251Railcars 35,253,954Maintenance and layover yards 523,793Track and signal improvements 5,094Other administrative 577,730
Total $ 37,917,822
VRE has received proceeds from several federal (with PRTC as grantee) and state grant programs. In the event of an audit of these grants, certain costs may be questioned as not being appropriate expenses under the grant agreements. Such findings may result in the refund of grant monies to the grantor agencies. Based on VRE’s policies and past experience, management believes that no refunds would be due in the case of an audit and, accordingly, no provision has been made in the accompanying financial statements for the refund of grant monies. Note 11. Pending GASB Statement
At June 30, 2010, the Governmental Accounting Standards Board (GASB) had issued a statement not yet implemented by VRE. The statement which might impact VRE is as follows: GASB Statement No. 59, Financial Instruments Omnibus, updates and improves existing standards regarding financial reporting and disclosure requirements of certain financial instruments and external investment pools. Statement No. 59 will be effective for periods beginning after June 15, 2010. The effects of adopting this statement on future financial statements have not been determined by management. Note 12. Subsequent Events
VRE entered into contracts at various times from April 2010 to August 2010 to purchase fuel at set prices for delivery in July 2010 through June 2011. The fuel will be used in the normal course of operations and is not being purchased for resale. The total commitment is for 1,008,000 gallons of fuel at a cost of approximately $2.4 million. In July 2010, the Commissions authorized the purchase of four additional locomotives from MotivePower, Inc. for $14.4 million. A fifth locomotive was authorized in October 2010 after funding was identified. These modifications are estimated to increase the contract with MotivePower to 20 locomotives at a total value of $77.5 million. The first locomotive was delivered in June 2010 and the remaining 19 are scheduled to be delivered at the rate of two locomotives per month from December 2010 to September 2011.
Required Supplementary Information

37
VIRGINIA RAILWAY EXPRESS SCHEDULE OF FUNDING PROGRESS
Virginia Retirement System The information below is derived from the actuarial valuation report for the Potomac & Rappahannock Transportation Commission, which consolidates information for both PRTC and VRE employees. No separate data on funding progress is available solely for VRE.
Actuarial Valuation
Date June 30,
Actuarial Value of Assets
Actuarial Accrued Liability (AAL)
Unfunded AAL
(UAAL)
Funded Ratio Assets as % of
AAL
Covered Payroll
UAAL as a % of Covered
Payroll
2009 $ 6,809,891 $ 6,996,387 $ 186,496 97.33% $ 5,743,627 3.25%
2007 5,875,612 6,065,059 189,447 96.88% 5,369,543 3.53%
2006 4,861,087 4,962,766 101,679 97.95% 5,189,808 1.96%

THIS PAGE NOT USED

Statistical Section

38
STATISTICAL SECTION This portion of Virginia Railway Express’ Comprehensive Annual Financial Report presents detailed information as a context for understanding what the information in the financial statements, note disclosures, and required supplemental information says about VRE’s overall financial health. Unless otherwise noted, the information in these schedules is derived from the Comprehensive Annual Financial Reports for the relevant year. VRE implemented GASB Statement 34 in 2002; schedules presenting government-wide information include information beginning in that year. Contents Page Financial Trends These schedules contain trend information to help the reader understand how VRE’s financial performance has changed over time. 39 - 41 Other Statistical Information This schedule and service area map provides other information useful to certain readers of VRE’s financial statements. 42 - 43 Demographic and Economic Information These schedules offer demographic and economic indicators to assist the reader understand the environment within which VRE’s financial activities take place. 44 - 46

VIRGINIA RAILWAY EXPRESS
SCHEDULE OF CHANGE IN NET ASSETSLast Nine Fiscal Years(Unaudited)
2010 2009 2008 2007 2006 2005 2004 2003 2002Operating Revenues:
Passenger revenue 30,019,730$ 25,909,794$ 21,688,092$ 19,685,561$ 19,453,436$ 19,452,162$ 16,929,629$ 15,048,262$ 12,753,214$ Equipment rentals and other 247,375 124,926 133,242 206,558 442,517 121,373 188,256 292,086 206,796
Total operating revenues 30,267,105 26,034,720 21,821,334 19,892,119 19,895,953 19,573,535 17,117,885 15,340,348 12,960,010
Nonoperating Revenues: Commonwealth of Virginia grants 13,153,781 13,482,816 10,795,443 12,269,884 13,137,477 7,613,022 7,453,276 5,002,085 5,366,332 Federal grants - provided by PRTC 14,525,795 12,784,123 12,522,868 12,741,069 10,721,335 8,124,763 6,226,445 7,168,236 5,143,950 Jurisdictional contribution 16,376,968 17,275,500 13,379,155 8,802,762 6,878,061 6,352,999 6,352,890 5,752,890 5,752,890
Capital Grants and Assistance: Commonwealth of Virginia grants 10,939,490 12,228,446 14,959,850 9,455,655 1,769,727 3,778,146 4,238,109 6,150,235 7,915,624 Federal grants - provided by PRTC 15,437,312 14,648,460 18,259,459 399,283 550,890 - - - - Federal grants - other 402,355 53,738 959,088 10,363,653 12,245,939 9,824,036 6,689,765 8,597,822 11,080,201
Pass-through to Fairfax County - (4,456,818) - - - - - - - In-kind and other local contributions 680,631 1,903,284 925,338 - - 266,148 3,143,319 457,149 699,375 Interest income: Operating funds 23,893 129,620 399,553 850,490 367,292 214,888 44,390 87,809 236,488 39 Insurance trust 65,164 241,003 400,204 329,252 721,919 688,816 837,583 1,171,667 1,180,707 Other restrictive funds 586 36,232 535,093 41,038 840,383 49,860 - - - Insurance proceeds - - 262,676 - - - - - -
Total nonoperating revenues 71,605,975 68,326,404 73,398,727 55,253,086 47,233,023 36,912,678 34,985,777 34,387,893 37,375,567 Total revenues 101,873,080 94,361,124 95,220,061 75,145,205 67,128,976 56,486,213 52,103,662 49,728,241 50,335,577
Operating Expenses:Contract operations and maintenance 20,291,361 18,694,757 17,433,267 16,982,189 14,619,521 14,144,414 14,212,476 13,095,504 12,612,253 Other operations and maintenance 12,055,009 12,575,004 11,562,892 10,130,233 9,304,325 7,928,107 5,466,313 4,741,041 4,308,986 Property leases and access fees 9,482,367 8,686,385 8,279,505 8,636,947 8,986,974 8,769,866 8,163,632 7,307,905 6,308,712 Insurance 3,864,366 3,866,438 4,099,475 5,169,441 3,521,858 3,533,503 3,275,081 2,429,993 2,413,642 Marketing and sales 1,259,048 1,477,554 1,537,243 1,161,206 1,005,348 1,302,527 1,279,549 1,482,131 1,549,752 General and administrative 5,642,360 5,492,566 5,151,117 5,164,332 5,219,514 5,282,641 5,041,238 5,462,768 4,476,015 Depreciation and amortization 11,337,406 10,445,041 10,640,098 9,875,593 8,217,233 6,699,409 6,595,698 5,837,560 5,261,679
Total operating expenses 63,931,917 61,237,745 58,703,597 57,119,941 50,874,773 47,660,467 44,033,987 40,356,902 36,931,039
Nonoperating Expenses:Interest and amortization 5,682,935 6,014,243 4,525,279 2,748,084 4,953,443 4,257,178 4,323,776 3,960,846 6,250,481 (Gain) loss on sale of assets 393,419 (4,218,641) 3,176,932 291,306 1,366,531 3,640,928 - - -
Total nonoperating expenses, net 6,076,354 1,795,602 7,702,211 3,039,390 6,319,974 7,898,106 4,323,776 3,960,846 6,250,481 Total expenses 70,008,271 63,033,347 66,405,808 60,159,331 57,194,747 55,558,573 48,357,763 44,317,748 43,181,520
Change in net assets 31,864,809$ 31,327,777$ 28,814,253$ 14,985,874$ 9,934,229$ 927,640$ 3,745,899$ 5,410,493$ 7,154,057$
Source: VRE's Audited Financial Statements.NOTE: Due to reporting format and definition changes prescribed by GASB Statement 34, only fiscal years 2002-2010 are available.

VIRGINIA RAILWAY EXPRESS
SCHEDULE OF OUTSTANDING DEBTLast Nine Fiscal Years(Unaudited)
2010 2009 2008 2007 2006 2005 2004 2003 2002
Revenue Bonds: $37,625,000 Commuter Rail Revenue Bond, Series 1993 5,065,000$ 9,875,000$ 14,450,000$ 18,800,000$ 22,945,000$ 26,895,000$ 30,660,000$ 34,250,000$ 35,005,000$ $23,000,000 Commuter Rail Revenue Bond, Series 1997 - - 14,635,000 15,690,000 16,690,000 17,645,000 18,555,000 19,430,000 21,070,000 $31,700,000 Commuter Rail Revenue Bond, Series 1998 24,425,000 24,550,000 24,670,000 24,785,000 24,895,000 25,000,000 25,100,000 25,195,000 31,305,000
Capital Leases: $271,804 Capitalized Lease Obligation - - - 164,600 - - - - - $2,717,409 Capitalized Lease Obligation - - 420,665 855,119 1,265,433 1,652,951 2,018,938 2,364,591 2,691,039 $25,100,000 Capitalized Lease Obligation 20,775,627 21,720,726 22,623,892 23,486,988 24,311,791 25,100,000 - - - $2,400,000 Capitalized Lease Obligation - - - - - - - 262,222 534,198 $297,691 Capitalized Lease Obligation - - - - - - - 55,882 108,624 $746,282 Capitalized Lease Obligation - - - - - - - 94,961 247,109
Notes Payable: $900,000 SunTrust Bank 440,000 500,000 560,000 605,000 660,000 720,000 780,000 840,000 900,000 $65,989,497 FRA Notes(#1-#14) 63,749,851 56,122,937 26,970,555 - - - - - -
Outstanding on June 30 114,455,478$ 112,768,663$ 104,330,112$ 84,386,707$ 90,767,224$ 97,012,951$ 77,113,938$ 82,492,656$ 91,860,970$
40
Debt per Capita:Outstanding on June 30 114,455,478$ 112,768,663$ 104,330,112$ 84,386,707$ 90,767,224$ 97,012,951$ 77,113,938$ 82,492,656$ 91,860,970$ Total Participating Jurisdictional Population N/A N/A 1,953,544 1,931,114 1,912,177 1,887,634 1,859,557 1,828,344 1,797,039
Debt per Capita N/A N/A 53.41 43.70 47.47 51.39 41.47 45.12 51.12
Outstanding Debt as a Percentage of Personal Income:Outstanding on June 30 N/A N/A 104,330,112$ 84,386,708$ 90,767,224$ 97,012,951$ 77,113,938$ 82,492,656$ 91,860,970$ Total Personal Income N/A N/A 123,047,146,000 116,245,177,000 140,070,173,000 103,027,869,000 95,710,712,000 90,296,704,000 86,708,640,000 Total Outstanding Debt as a Percentage of Personal Income N/A N/A 0.08% 0.07% 0.06% 0.09% 0.08% 0.09% 0.11%
Source: VRE's Audited Financial Statements.NOTE: Due to reporting format and definition changes prescribed by GASB Statement 34, only fiscal years 2002-2010 are available.

VIRGINIA RAILWAY EXPRESS
SCHEDULE OF JURISDICTIONAL CONTRIBUTIONSLast Nine Fiscal Years(Unaudited)
2010 2009 2008 2007 2006 2005 2004 2003 2002
Fairfax County 4,995,535$ 5,507,805$ 4,700,508$ 3,935,736$ 3,159,643$ 2,963,820$ 2,972,946$ 2,607,621$ 2,510,184$ City of Fredericksburg 508,503 482,764 330,713 111,115 73,827 57,544 68,276 79,191 109,519 City of Manassas 883,443 938,897 655,077 428,436 276,306 270,924 270,494 286,196 329,215 City of Manassas Park 537,496 567,082 359,574 183,686 179,422 149,758 129,178 127,728 135,725 Prince William County 6,173,028 6,511,839 4,624,876 2,961,241 2,236,676 2,061,006 1,956,546 1,878,919 1,846,733 Stafford County 2,971,727 2,974,507 2,429,735 917,147 699,424 609,222 726,297 554,900 613,575 City of Alexandria 124,737 118,797 113,140 107,752 102,621 97,734 93,080 88,648 84,427 Arlington County 182,499 173,809 165,532 157,649 150,142 142,992 136,183 129,687 123,512
Total contributions 16,376,968$ 17,275,500$ 13,379,155$ 8,802,762$ 6,878,061$ 6,353,000$ 6,353,000$ 5,752,890$ 5,752,890$
41
Source: VRE's Audited Financial Statements.NOTE: Due to reporting format and definition changes prescribed by GASB Statement 34, only fiscal years 2002-2010 are available.

VIRGINIA RAILWAY EXPRESS
SCHEDULE OF MISCELLANEOUS STATISTICSLast Nine Fiscal Years(Unaudited)
2010 2009 2008 2007 2006 2005 2004 2003 2002
Rolling Stock (Owned or Leased) Locomotives 20 21 18 19 20 20 19 19 19 Railcars 95 91 89 90 90 90 90 86 86
Total rolling stock 115 112 107 109 110 110 109 105 105
Stations 18 18 18 18 18 18 18 18 18
Parking Spaces 8,508 8,504 7,284 7,273 7,273 7,009 6,354 5,980 5,980
Employees 37 37 37 36 36 34 32 28 28 42
Ridership and Fare Revenue Data:
Total Ridership 4,033,230 3,857,646 3,628,563 3,453,561 3,637,043 3,763,740 3,562,299 3,296,272 2,798,016
Average Daily Ridership 16,673 15,754 14,662 13,982 14,667 15,238 14,720 13,291 11,467
Average Fare per Trip 7.44$ 6.66$ 5.98$ 5.70$ 5.40$ 5.17$ 4.76$ 4.64$ 4.54$

43

VIRGINIA RAILWAY EXPRESS
PRINCIPAL EMPLOYERS OF PARTICIPATING JURISDICTIONSCurrent Year and Nine Years Ago(Unaudited)
Percentage of Percentage ofTotal Jurisdictional Total Jurisdictional
Employers Rank Employees Employment Rank Employees Employment
Fairfax County Public Schools (1) 1 23,014 N/A 1 19,463 N/AFederal Government (1) 2 15,393 N/A 2 11,802 N/AFairfax County Government (1) 3 11,393 N/A 3 10,243 N/AUS Patent Trademark Office (2) 4 9,000 N/AUS Department of Defense (2) 5 7,500 N/A 5 7,545 N/AInova Health System (1) 6 7,000-10,000 N/A 10 4,000-5,000 N/ABooz Allen Hamilton (1) 6 7,000-10,000 N/A N/ANorthrop Grumman (1) 6 7,000-10,000 N/A 10 4,000-5,000 N/ACity of Alexandria (2) 9 2,500 N/A N/A44 Virginia Hospital Center (3) 10 2,354 N/AKaiser Permanente (1) 4 10,000-11,000 N/AMobil Corporation (1) 6 6,000-7,000 N/AComputer Science Corporation (1) 6 6,000-7,000 N/AScience Applications International Corporation (1) 8 5,000-6,000 N/ATRW Inc 8 5,000-6,000 N/A
Sources:
(1), (2), and (3) extracted and combined from the following sources:
(1) Fairfax County fiscal year 2009 Comprehensive Annual Financial Report, Statistical Section, Table 4.2, page 248 (2) City of Alexandria fiscal year 2009 Comprehensive Annual Financial Report, Statistical Section, Table XIX, page 133 (3) Arlington County fiscal year 2009 Comprehensive Annual Financial Report, Statistical Section, Table L, page 177
2009 2000

VIRGINIA RAILWAY EXPRESS
DEMOGRAPHICS AND ECONOMIC STATISTICS OF PARTICIPATING JURISDICTIONSFiscal Years 2000 to 2010(Unaudited)
Prince City ofFairfax William City of Manassas Stafford City of City of ArlingtonCounty County Manassas Park County Fredericksburg Alexandria County
(1) (2) (3) (4) (5) (6) (7) (8)2010 (all categories) N/A N/A N/A N/A N/A N/A N/A N/A2009 Population N/A 364,734 35,883 14,050 122,800 22,818 144,100 209,300 Personal Income (in thousands) N/A N/A $1,063,859 $419,153 $4,759,728 $846,457 $10,178,071 $14,841,044 Per Capita Personal Income N/A N/A $29,648 $29,833 $38,760 $37,096 N/A $70,908 Unemployment Rate N/A 5.9% 6.4% 6.5% 5.4% 9.7% 2.8% 4.7%2008 Population 1,050,315 359,588 36,666 13,950 121,736 22,410 140,879 208,000 Personal Income (in thousands) $74,060,459 $17,843,462 $1,059,061 $424,663 $4,625,968 $789,527 $10,204,006 $14,040,000 Per Capita Personal Income $70,822 $41,945 $28,884 $30,442 $38,000 $35,231 N/A $67,500 Unemployment Rate 3.4% 3.3% 4.8% 3.2% 3.4% 6.4% 2.9% 2.6%2007 Population 1,041,507 352,559 38,066 13,910 123,200 21,273 139,000 204,800 Personal income (in thousands) $70,500,650 $16,715,928 $1,081,912 $419,253 $4,497,535 $710,837 $9,507,531 $13,004,800 Per capita personal income $67,691 $40,004 $28,422 $30,140 $35,571 $33,415 $68,400 $63,500 Unemployment rate 2.2% 2.6% 2.7% 2.4% 2.7% 4.4% 2.2% 2.3%200645 Population 1,037,311 345,349 38,066 13,100 118,384 20,732 138,000 200,226 Personal income (in thousands) $67,111,947 $15,494,963 $1,066,343 $380,385 $4,207,840 $662,387 $8,835,057 $12,132,694 Per capita personal income $64,698 $38,728 $28,013 $29,037 $35,544 $31,950 $64,022 $60,595 Unemployment rate 2.2% 2.3% 2.9% 2.3% 2.4% 4.2% N/A 2.3%2005 Population 1,033,646 333,335 37,000 12,900 116,545 20,458 135,000 198,267 Personal income (in thousands) $63,917,568 $14,589,990 N/A $361,406 $3,967,308 $623,826 $7,776,966 $11,699,736 Per capita personal income $61,837 $37,045 N/A $28,016 $34,041 $30,493 $61,147 $59,010 Unemployment rate 2.5% 2.6% 2.8% 2.1% 2.4% 5.0% N/A 2.5%2004 Population 1,022,298 321,083 36,500 12,700 113,173 20,189 134,000 198,739 Personal income (in thousands) $58,830,183 $13,355,974 N/A $343,776 $3,644,396 $607,669 $7,435,257 $11,497,250 Per capita personal income $57,547 $34,989 N/A $27,069 $32,202 $30,099 $58,365 $57,851 Unemployment rate 2.7% 2.6% 3.1% 2.0% 2.5% 6.0% N/A 2.6%2003 Population 1,012,090 309,647 36,300 12,300 108,994 20,076 135,000 196,925 Personal income (in thousands) $54,771,275 $12,176,485 $843,820 $321,694 $3,310,801 $602,180 $7,165,859 $11,106,570 Per capita personal income $54,117 $33,023 $23,246 $26,154 $30,376 $29,995 $53,711 $56,400 Unemployment rate 3.1% 3.6% 3.5% 1.8% 2.9% 5.8% N/A 2.3%2002 Population 1,004,435 297,207 35,900 11,900 103,606 19,800 129,938 193,754 Personal income (in thousands) $52,744,891 $11,492,607 $805,706 $305,128 $3,105,569 $561,508 $7,009,871 $10,685,146 Per capita personal income $52,512 $32,071 $22,443 $25,641 $29,975 $28,359 $52,344 $55,148 Unemployment rate 3.4% 3.3% 4.3% 2.7% 2.9% 4.0% N/A 2.7%

Prince City ofFairfax William City of Manassas Stafford City of City of ArlingtonCounty County Manassas Park County Fredericksburg Alexandria County
(1) (2) (3) (4) (5) (6) (7) (8)
2001 Population 984,366 283,814 35,500 11,200 98,060 19,279 130,403 189,983 Personal income (in thousands) $51,126,001 $10,983,002 $793,056 $321,966 $2,935,524 $538,752 $6,931,579 $10,226,785 Per capita personal income $51,938 $31,954 $22,340 $28,747 $29,936 $27,945 $52,125 $53,830 Unemployment rate 2.5% 2.4% 3.1% 1.0% 2.2% 3.7% N/A 2.1%2000 Population 969,749 270,841 35,135 10,290 92,446 21,686 129,147 189,453 Personal income (in thousands) $48,522,361 $10,228,409 $757,201 $285,640 $2,658,655 $575,872 $6,122,938 $9,384,744 Per capita personal income $50,036 $31,036 $21,551 $27,759 $28,759 $26,555 $48,106 $49,536 Unemployment rate 1.6% 1.5% 1.7% 1.1% 1.7% 2.3% N/A 1.1%
Sources:
(1) Fairfax County 2009 Comprehensive Annual Financial Report, Statistical Section, Table 4.1, page 247(2) Prince William County fiscal year 2009 Comprehensive Annual Financial Report, Statistical Section, Table 16, page 167(3) City of Manassas fiscal year 2009 Comprehensive Annual Financial Report, Statistical Section, Table XII, page 116(4) City of Manassas Park fiscal year 2009 Comprehensive Annual Financial Report, Statistical Section, Table 14, page 125(5) Stafford County fiscal year 2009 Comprehensive Annual Financial Report, Statistical Section, Table S-1446 (6) City of Fredericksburg fiscal year 2009 Comprehensive Annual Financial Report, Statistical Section, Table 14, page 130(7) City of Alexandria fiscal year 2009 Comprehensive Annual Financial Report, Statistical Section, Tables XI, XIV & XXI, pages 126, 128 & 136(8) Arlington County fiscal year 2009 Comprehensive Annual Financial Report, Statistical Section, Table K, page 176
N/A = Not Available

Compliance Section

47
INDEPENDENT AUDITORS’ REPORT ON INTERNAL CONTROL OVER FINANCIAL REPORTING AND ON
COMPLIANCE AND OTHER MATTERS BASED ON AN AUDIT OF FINANCIAL STATEMENTS
PERFORMED IN ACCORDANCE WITH GOVERNMENT AUDITING STANDARDS
To the Honorable Commission Board Members The Northern Virginia Transportation Commission The Potomac and Rappahannock Transportation Commission We have audited the financial statements of Virginia Railway Express (VRE) as of and for the year ended June 30, 2010, and have issued our report thereon dated November 10, 2010. We conducted our audit in accordance with auditing standards generally accepted in the United States of America; the standards applicable to financial audits contained in Government Auditing Standards, issued by the Comptroller General of the United States; and the Specifications for Audits of Authorities, Boards, and Commissions, issued by the Auditor of Public Accounts of the Commonwealth of Virginia. Internal Control Over Financial Reporting In planning and performing our audit, we considered VRE’s internal control over financial reporting as a basis for designing our auditing procedures for the purpose of expressing our opinion on the financial statements, but not for the purpose of expressing an opinion on the effectiveness of VRE’s internal control over financial reporting. Accordingly, we do not express an opinion on the effectiveness of VRE’s internal control over financial reporting. A deficiency in internal control exists when the design or operation of a control does not allow management or employees, in the normal course of performing their assigned functions, to prevent, or detect and correct misstatements on a timely basis. A material weakness is a deficiency, or combination of deficiencies, in internal control such that there is a reasonable possibility that a material misstatement of VRE’s financial statements will not be prevented, or detected and corrected on a timely basis. Our consideration of internal control over financial reporting was for the limited purpose described in the first paragraph of this section and was not designed to identify all deficiencies in internal control over financial reporting that might be deficiencies, significant deficiencies, or material weaknesses. We did not identify any deficiencies in internal control over financial reporting that we consider to be material weaknesses, as defined above.

48
Compliance and Other Matters As part of obtaining reasonable assurance about whether VRE’s financial statements are free of material misstatement, we performed tests of its compliance with certain provisions of laws, regulations, contracts, and grant agreements, noncompliance with which could have a direct and material effect on the determination of financial statement amounts. However, providing an opinion on compliance with those provisions was not an objective of our audit, and accordingly, we do not express such an opinion. The results of our tests disclosed no instances of noncompliance or other matters that are required to be reported under Government Auditing Standards. This report is intended solely for the information and use of the Commissioners, the Auditor of Public Accounts, and other Federal and state agencies and is not intended to be and should not be used by anyone other than these specified parties.
Harrisonburg, Virginia November 10, 2010

Item #3C
Sale of 10 VRE Locomotives The VRE Operations Board recommends approval of Resolution #2160. This resolution authorizes VRE’s Chief Executive Officer to execute an agreement with Motive Power Inc. to sell 10 GP 39 locomotives owned by VRE. The locomotives are not needed by VRE because new locomotives have been purchased. The proposed sales price will be provided at the meeting.

RESOLUTION #2160 SUBJECT: Sale of 10 VRE Locomotives. WHEREAS: In June of 2007, the VRE Operations Board authorized the VRE Chief
Executive Officer to pursue the sale of VRE locomotives as they were replaced with new equipment;
WHEREAS: Motive Power, Inc. has made a proposal to purchase 10 VRE GP39
locomotives; and WHEREAS: VRE has received no other expressions of interest for these locomotives. NOW, THEREFORE BE IT RESOLVED that the Northern Virginia Transportation
Commission authorizes the VRE Chief Executive Officer to execute a sales agreement for 10 GP39 locomotives with Motive Power, Inc.
Approved this 2nd day of December, 2010.
Catherine M. Hudgins Chairman
Mary Hynes Secretary-Treasurer

AGENDA ITEM 10-C ACTION ITEM
TO: CHAIRMAN MILDE AND THE VRE OPERATIONS BOARD FROM: DALE ZEHNER DATE: NOVEMBER 19, 2010 RE: AUTHORIZATION TO SELL TEN LOCOMOTIVES RECOMMENDATION: The VRE Operations Board is being asked to recommend that the Commissions authorize the Chief Executive Officer to execute a sales agreement for ten GP39 locomotives with MotivePower, Inc., or the next highest proposer, for the amount stated in the confidential envelope provided to Board Members. BACKGROUND: In June of 2007, the VRE Operations Board authorized the Chief Executive Officer to pursue the sale of VRE locomotives as they were replaced with new equipment. VRE posted the sale of this equipment on the website and notified several potential purchasers of the sale. Since that time, of the 18 available units, VRE has sold three F40 and three GP40 units. VRE subsequently received a proposal from MotivePower, Inc. to purchase 10 GP39 locomotives. Negotiations have been completed and a sales agreement, mirroring those already approved by the Operations Board for equipment, is being readied. Work is underway to develop a mutually agreed upon schedule to deliver the locomotives to MotivePower as VRE receives new locomotives.

2
FISCAL IMPACT: All sale proceeds will be reinvested in the railcar acquisition project to be used as match to upcoming federal and/or state grants.

AGENDA ITEM #4 TO: Chairman Hudgins and NVTC Commissioners FROM: Rick Taube and Kala Quintana DATE: November 24, 2010 SUBJECT: Legislative Items NVTC’s Legislative Committee met on November 19th and recommends the attached draft Legislative Agenda for approval. Also attached for approval is the VRE Legislative Agenda recommended by the VRE Operations Board. Attached for your information are the approved NVTA and VTA Legislative Agendas and the draft PRTC Legislative Agenda. While these separate documents are not identical, there appear to be no inconsistencies. Also attached for your information is a copy of a letter sent by NVTC’s Chairman, Cathy Hudgins, to members of Congress urging them to renew the tax-free transit commuter benefit of $230 monthly, which is otherwise due to drop back to $120 monthly in January, 2011. Finally, the Governor’s Reform Commission met again on November 18th and is due to submit its next report on December 1st. A copy is attached of NVTC’s letter to the Reform Commission’s Chairman, Fred Malek, asking that the recommendation to abolish the Rail Advisory Board be reversed.

NVTC’s 2011 STATE AND FEDERAL LEGISLATIVE AGENDA
DRAFT: November 24, 2010

STATE LEGISLATIVE ACTION ITEMS Transit Funding Crisis
Here are the essential facts:
• Transit is very well used in Northern Virginia: 143 million transit passenger trips were taken in FY 2010 (75% of Virginia’s total transit ridership);
• Currently about $700 million annually is spent on Northern Virginia’s transit for capital and operations by customers and federal, state and local governments;
• Well over $900 million annually is needed (source: NVTA’s TransAction 2030 Plan);
• This leaves a gap of over $200 million annually in Northern Virginia extending into the future;
• The Commonwealth of Virginia has a statutory target of covering 95% of eligible transit costs throughout the entire state, but falls $166 million short (as of FY 2011).
• State transit assistance is declining while funding needs are growing: Statewide transit operating costs grew to $573 million in FY 2011 from $505 million in FY 2009 while state aid fell to $102 million from $115 million.
Accordingly, there is a transit funding crisis that is getting worse. The Commonwealth must enact major new revenue sources for public transit during the 2011 General Assembly session, with these sources being stable, reliable, proven and permanent.
1. New revenue sources for public transit should be enacted that keep pace with inflation and do not decline as automobiles are driven less and become more fuel efficient. Examples include: sales taxes (one percent yields $1 billion statewide), indexed motor fuels taxes (10-cents generates almost $500 million); vehicle miles traveled fees, state/regional income taxes and tolls and congestion pricing. One-time revenue sources are welcome but they are not sufficient to resolve the ongoing transit funding crisis; immediate, continuous and sustainable funding is essential.

2
2. Any new revenue measures for transportation, energy conservation, air
quality or climate protection should dedicate an appropriate portion to public transit because transit is an effective means to achieve the goals of such legislation. Transit currently receives only 14.7% of Transportation Trust Fund revenues while 34% of the Commonwealth’s most recent bond issue was devoted to transit.
3. Existing state transit funding sources should be protected from encroachment, either through diversion of revenues from the Transportation Trust Fund to non-transportation uses or from new intercity passenger rail initiatives.
4. The commonwealth has a statutory responsibility to fund transportation.
Therefore, any new regional fees for public transit, including restoring previously authorized funds (HB 3202 of 2007) for the Northern Virginia Transportation Authority, should be imposed primarily by the state.
5. NVTC’s 2.1% motor fuels tax on distributors should be increased to at least 4.2%. The expected annual yield would increase from $35 million in FY 2010 to more than $70 million. This tax is dedicated to WMATA in five of NVTC’s jurisdictions. WMATA faces a continuing financial crisis.
6. With the increased federal emphasis on intercity passenger and high-speed rail, Virginia should establish a new funding source to fully match federal grants, to integrate service with existing local and regional transit providers, and to ensure that existing transit funds are not diminished (including the federal funds devoted each year by the CTB to VRE’s track leases). Virginia’s existing Rail Enhancement Program should be made available to fund the operating expenses of eligible regional and intercity passenger rail services that have benefits commensurate with costs. Where freight railroads are the beneficiaries of these public investments, they should be required to agree to cooperate with publicly provided passenger rail services on equitable terms.
7. Provide immediate funding to facilitate needed transit and other
transportation improvements to relieve congestion at BRAC-mandated facilities.
Safety and Improvements
8. Safety in accessing transit should be enhanced by enacting legislation to
require motorists to stop for pedestrians in marked crosswalks at unsignalized intersections where posted speeds are 35 mph or less and at unsignalized crosswalks in front of schools.

3
Other Legislative Actions
9. Amend the Virginia Code to further cap liability for commuter rail operations by including third party claims and terrorism.
10. Allow VRE, at its discretion, to utilize an independent third party or the Division of Risk Management to manage VRE’s liability insurance plan and trust fund.
11. Enact legislation to authorize NVTC to choose to provide equal per diem payments to its board members who are elected officials, including the option to provide no per diem payments. Currently, NVTC is required by state law to pay General Assembly members $200 per meeting and other elected officials $50 per meeting.
FEDERAL LEGISLATIVE ACTION ITEMS Immediate and Ongoing Funding
1. As part of the process to restructure federal transportation programs and
authorize multi-year funding, provide immediate and ongoing funding for important Northern Virginia transit projects.
2. Continue to appropriate new funding for WMATA of at least $150 million annually as previously authorized by Congress. Such appropriations are needed to justify the new federal WMATA Board members.
3. Make available funding for Metro Access from other relevant federal programs (e.g. HUD, HHS).
4. Include significant funding for transit as a critical strategy in any new
spending measures that seek to conserve energy, enhance clean air, mitigate climate change, provide access to jobs, stimulate the economy and respond to emergencies and disasters.
5. Provide immediate funding to facilitate needed transit and other transportation improvements to relieve congestion at BRAC-mandated facilities.

4
Authorization of Improved Transportation Policies and Programs
6. The current multi-year authorization of federal surface transportation programs (SAFETEA-LU) has expired at the end of FY 2009. Many organizations have offered detailed recommendations for a major restructuring rather than fine-tuning existing programs, including the National Surface Transportation Policy and Revenue Commission in its Transportation for Tomorrow report and the Miller Center’s Well Within Reach: America’s New Transportation Agenda, among many other pertinent reports and recommendations. Among the primary reasons for this view are shortfalls in gasoline tax revenues flowing to the Highway Trust Fund, proliferation of separate programs with complex eligibility criteria and rampant earmarking, all without a unifying policy focus. NVTC supports the policy principles adopted by the National Capital Region Transportation Planning Board and those of the American Public Transportation Association and the Northern Virginia Transportation Authority among others. Among the revisions with greatest benefit to NVTC’s members are:
• The level of federal investment in U.S. transportation infrastructure, including maintenance of the existing system and expansion, must increase significantly.
• Recognizing that federal fixed per gallon taxes on motor fuels are no longer reliable sources of funding, new methods must be identified that will grow along with the need to maintain existing facilities and support improvements and system expansions. Temporary transfers of General Funds or raiding the Transit Trust Fund are not worthwhile strategies to resolve this long-term structural imbalance.
• Fees for highway use that vary with numbers of auto occupants, types of vehicle miles driven and times and places driven should be used to reduce congestion as well as providing revenues. New technologies make such variable pricing feasible.
• Leverage available federal funds with national infrastructure banks
and bonding programs.
• Simplified, consolidated and streamlined federal transportation programs should be created with uniform, rigorous and comprehensive benefit/cost analyses across all modes, consideration of energy efficiency and environmental protection, inclusion of safety and security, and reduced federal review time.

5
• Urban mobility (and hence support for public transit) should be
recognized as a vital federal responsibility, in cooperation with states, local governments and regional agencies through intergovernmental partnerships, with greater decision-making authority for metropolitan areas and local governments.
Equitable Tax Incentives for Transit Users
7. In order to maintain increased tax-free monthly transit benefits of at least
$230 (to match the benefits currently available for parking), remove the sunset provision that requires a reduction at the end of 2010 to $120. Index the transit benefits to inflation.
Rail Related Actions
8. Additional federal funding should be provided to commuter rail systems to
meet new federal Positive Train Control unfunded mandates contained in the U.S. Rail Safety Act of 2008.
9. Amend the current liability cap of $200 million to include third party claims. VRE’s freight rail partners are demanding coverage of $500 million.
Promote Green Commuting
10. Allow governments to leverage private capital to create and expand vanpools by making vanpool passenger fare revenue an eligible source for local match of federal grants.
11. In addition to the above actions, provide further federal funding and other incentives to encourage alternative methods of commuting, including telework, bicycles, walking, vanpools as well as public transit.

AGENDA ITEM 10-D
ACTION ITEM
TO: CHAIRMAN MILDE AND THE VRE OPERATIONS BOARD FROM: DALE ZEHNER DATE: NOVEMBER 19, 2010 RE: AUTHORIZATION TO APPROVE THE 2011 LEGISLATIVE
AGENDA RECOMMENDATION
:
The VRE Operations Board is being asked to recommend that the Commissions approve the 2011 VRE Legislative Agenda and authorize the Chief Executive Officer to actively pursue the elements set forth in the document. BACKGROUND
:
The VRE legislative agenda is formulated to advocate VRE priorities in coordination with the Commissions and local jurisdictional staff. Additional advocacy positions related to specific federal and state legislature are also presented.
FEDERAL
1.
Request for Capital Appropriations and Authorization of Transportation Legislation
Congressional staffers have already begun working on the next Reauthorization legislation following SAFETEA-LU. However, all indications are that Congress will not take up the issue until January 2011. Congress has continued to pass continuing resolutions to fund transportation. However, both the Administration

2
and Congress have acknowledged that a new authorization bill must be passed in order to determine the magnitude of future funding and the revenue source for those funds. Given the success that VRE has enjoyed over the past decade, work will continue to secure appropriations in this fiscal year’s budget. This year, efforts will focus on the acquisition of 50 new bi-level railcars to replace and expand upon the aging railcars in VRE’s fleet. VRE will continue to pursue funding requests as follows, listed in priority order:
Priority List of VRE Projects for Inclusion in the Reauthorization Bill
1. Mid-day Storage of Rail Equipment* $20 Million 2. 50 new high capacity railcars $120 Million 3. Parking Expansion $41 Million 4. Platform Extensions/Additions $41 Million 5. Expansion of commuter rail service
to Gainesville/Haymarket $136 Million 6. Acquisition of new fare collection system $5 Million
TOTAL REQUEST: $363 MILLION *Highest priority project with immediate need
VRE, as it has done for the past four years, will also support APTA in their advocacy efforts to bring awareness to the need for additional, as well as dedicated, funding for public transportation. 2. Federal Liability Cap
One of the recurring themes on the federal agenda has been to raise awareness for the need for modified language in the federal code regarding liability insurance coverage. VRE will continue to advocate for capping liability insurance for commuter rail operations. This issue remains a challenge as not all commuter rail agencies face the same dilemma when it comes to carrying liability insurance (some are self-insured, some are protected by state law, and yet others carry lower premiums than VRE). CSX and Norfolk Southern continue to request liability insurance of $500 million per incident as an element of the access agreements. VRE will promote amending the current federal liability cap of $200 million to include third party claims.

3
3. Corridor Improvements
VRE will also continue to partner and support the efforts of the Commonwealth and our host railroads to secure funding to improve railroad capacity. This includes, but is not limited to, additional high speed rail funding for the Powell’s Creek to Arkendale project.
In addition, VRE continues to work with Congressman Moran and Senators Webb and Warner on potential public-private partnerships that could bring improvements to the rail and public transportation networks at L’Enfant and Washington Union Terminal. Under both proposals, VRE has been asked to comment on conceptual ideas but additional involvement could develop into support for efforts to fund the Maryland Avenue redevelopment and Union Station redevelopment efforts. 4.
Commuter Benefits
The American Reinvestment and Recovery Act (ARRA) contained a provision that created temporary parity between parking and transit commuter benefits. This provision raised transit benefits up to the $230 per month threshold allowable for parking. This provision is set to expire on December 31, 2010. Without an extension or permanent inclusion in the Internal Revenue Code, transit benefits will be reduced back to $120 per month. VRE will continue to advocate that transit benefits remain the same as the parking benefits. 5.
Miscellaneous Items
Under the language of the US Rail Safety Improvement Act of 2008, Congress mandated that the Federal Railroad Administration fully implement Positive Train Control (PTC) by 2015. VRE continues to work with federal agencies and the host railroads to ensure compliance by the deadline. VRE’s initial implementation plan has been approved by FRA and efforts are underway to find funding to help defray implementation costs.
STATE
1.
State Funding
VRE will partner with VTA and the local jurisdictions to advocate for an increase in the state’s transportation investment, including continued growth of state funding for transit and for the Commonwealth to meet the statutory goal of funding 95 percent of eligible transit capital and operating costs from the Mass Transit Fund.

4
As directed by the Operations Board, VRE will also continue to advocate for its current share of state allocated funding as well as secure appropriations in the upcoming budget cycle, all while being mindful of other public transportation partners. Projects would mirror those listed above in the federal program. VRE will also continue to advocate for capacity improvements such as construction of a third main line track from Washington to Fredericksburg and, more specifically, for a third mainline track from Hamilton to Crossroads in Spotsylvania County. The project has an estimated cost of $18M and is part of the contractual agreement between VRE and Spotsylvania County for the provision of revenue service to Spotsylvania County. 2.
Legislative Policy
There are several legislative initiatives or requests that VRE has identified as important for consideration during the upcoming legislative session of the General Assembly:
• Amend the Virginia Code to cap liability for commuter rail operations. The
existing cap enacted in a prior session excludes third party claims. VRE will also seek exemption for freight railroads and VRE from liability for terrorism.
• Seek both short term (offering a budget amendment allowing VRE such
latitude) and long term remedy (amending the Virginia Code) to allow VRE to, at its discretion, utilize an independent third party or the Virginia Division of Risk Management (DRM) to manage the liability insurance plan and oversee the VRE Insurance Trust Fund.
• Re-examine the merits of offering legislation to amend the Virginia Code to
prohibit pedestrians from crossing public thoroughfares when trains are present. VRE has been working with CSX and Norfolk Southern to get legislation in the Code to match the nearly 20 other states who have similar laws.
• Amend Chapter 774 of the Virginia Code that would increase the aggregate awardable liability claim a rail passenger could make per incident (as requested by the Virginia Trial Lawyers Association in 2006). The provision is set to begin in January 2011. Under the Code, the current threshold ($100,000) would be amended upward each year based on the percentage change in the medical care component of the Consumer Price Index (as published by the Bureau of Labor Statistics). Were this provision to remain, it could increase the existing $250 million dollar liability

5
insurance threshold imposed by the Class 1 freight railroads. VRE would advocate for the elimination of this amendment such that there is no annual index increase.
FISCAL IMPACT
:
There is no direct funding impact associated with adopting this agenda. As in the past, based on the success of federal and/or state appropriations, some local match may be required to fulfill grants or program money.

escalators, November 5, 2010 Fred Malek Senior Advisor Thayer-Hidden Creek 1455 Pennsylvania Avenue, N.W. Suite 350 Washington, D.C. 20004 Re: Government Reform Commission Dear Mr. Malek: At its meeting of November 4, 2010, the Northern Virginia Transportation Commission voted to authorize me to contact you regarding Governor McDonnell’s Government Reform Commission’s recommendation in its interim report that called for eliminating the Rail Advisory Board (RAB). As you may know, the RAB performs a valuable public service as a forum for discussions among freight and passenger rail interests. It advises the Commonwealth Transportation Board (CTB) on allocating funds from the Rail Enhancement Fund. A member of the CTB serves on the RAB as a direct liaison. NVTC is a co-owner (together with the Potomac Rappahannock Transportation Commission) of the Virginia Railway Express (VRE) commuter rail system. VRE has benefited greatly from the RAB as VRE’s partnership with its freight rail partners has been significantly strengthened as a result of the trusting relationships built at the RAB. We understand that the Reform Commission expects to save no more than $10,000 annually if its recommendation to abolish the RAB is carried out. While there would be no reason to oppose such a change if the RAB were ineffective or counterproductive, in our personal experience with VRE, that is decidedly not true in this case.
Chairman Hon. Catherine Hudgins Vice Chairman Hon. William D. Euille Secretary/Treasurer Hon. Mary Hynes Commissioners: City of Alexandria Hon. William D. Euille Hon. Paul Smedberg Arlington County Hon. Mary Hynes Hon. Jay Fisette Hon. Christopher Zimmerman Fairfax County Hon. Sharon Bulova Hon. John Cook Hon. John Foust Hon. Catherine M. Hudgins Hon. Jeffrey McKay City of Fairfax Hon. Jeffrey C. Greenfield City of Falls Church Hon. Daniel Maller Loudoun County Hon. Kelly Burk Virginia Department of Rail and Public Transportation Hon. Thelma Drake Virginia General Assembly Sen. Mark Herring Sen. Mary Margaret Whipple Del. Barbara Comstock Del. Adam P. Ebbin Del. Joe T. May Del. Thomas D. Rust Executive Director Richard K. Taube

We urge you to work with the Reform Commission to reconsider this recommendation. Abolishing the RAB would very likely contribute to less efficient government.
Please feel free to contact me with any questions.
Sincerely, Catherine Hudgins Chairman
cc: The Honorable Robert McDonnell The Honorable William Howell The Honorable Benjamin Lambert, III The Honorable Glen Oder The Honorable Paul Fraim The Honorable Ron Tillett The Honorable Joseph May The Honorable Tim Hugo The Honorable Ward Armstrong The Honorable Morgan Griffith The Honorable Lacey Putney The Honorable Harry Purkey The Honorable Charles Colgan The Honorable Richard Saslaw The Honorable Y.B. Miller The Honorable Thomas Norment Ms. Heather Cox Michael C. May

22001111 VVTTAA LLEEGGIISSLLAATTIIVVEE PPRRIIOORRIITTIIEESS
AAPPPPRROOVVEEDD:: NNOOVVEEMMBBEERR 11,, 22001100
AN AGENDA FOR JOB CREATION AND ACCESS
Virginia’s 59 public transit systems and Transportation Demand Management (TDM) agencies would be able to perform a stronger role in providing access to jobs and boosting economic activity that creates jobs and generates state tax revenues if funding from the Commonwealth were increased. Those systems currently provide almost 200 million annual passenger trips. Demand is growing and a major new light rail system is set to open next spring in Hampton Roads. At the same time, state transit assistance has been reduced and many transit systems have been forced to cut service.
The Commonwealth’s past investments in Metrorail are yielding almost 20 percent annually in increased state taxes through induced development. Half to two‐thirds of transit riders on each of Virginia’s transit systems are commuting to work.
According to research sponsored by the American Public Transportation Association:
• Every $10 million in capital investment in public transit yields $30 million in increased business sales.
• Every $10 million spent on operating public transit yields $32 million in increased business sales.
• Households that use transit to commute save up to $9,500 annually, freeing funds for other purposes such as housing, consumables or education.
Transit moves people efficiently at a fraction of the cost of investments in highways. The Commonwealth’s existing transportation resources should be directed to transit projects that typically can be completed quickly and yield immediate benefits.

2
At a crucial time when transit could be making a more significant contribution to Virginia’s economic recovery, the Commonwealth’s transit operating assistance is actually shrinking significantly:

3
While the economy also could be stimulated by efforts to improve the efficiency of government, streamline the delivery of services, create new opportunities for the private sector, extend the use of tolling and user fees, promote high‐speed and intercity rail, rejuvenate VDOT and restore the viability of the Transportation Trust Fund, these measures should not be undertaken without boosting the Commonwealth’s limited support for public transit.
For more information about public transit benefits see www.vatransit.com.
VTA’S LEGISLATIVE PROPOSALS
1. Protect Transit/TDM Services—Transit/ Transportation Demand Management is seriously underfunded by the Commonwealth. Transit/TDM should be a top budget priority for existing funds available to the Commonwealth. Existing state transit/TDM funding sources should be protected from encroachment (e.g. diversion of revenues from the Transportation Trust Fund to non‐transportation uses or new intercity and high speed passenger rail initiatives).
2. Add New Revenue Sources—New transit and transportation revenue sources must be enacted that sustainably keep pace with inflation and do not decline as automobiles become more fuel efficient. Examples include: sales taxes (one percent yields $1 billion), indexed motor fuel taxes (a tax of 10‐cents per gallon generates $500 million), vehicle miles traveled fees, state/regional income taxes and tolls. One‐time revenue sources are welcome but they are not sufficient to resolve this ongoing funding crisis; immediate, continuous and sustainable funding is essential.
3. Increase Transit’s Share of Existing and New Revenue Sources—The current share of Transportation Trust Fund revenues dedicated to transit is 14.7 percent. The transit share of recent state bonds authorized for transportation is a minimum of 20 percent. Any new measures should boost those shares to adequately meet rising demand for transit services.
4. Achieve State Transit Funding Share as Outlined in Code—Whatever the source of state funding, it should at a minimum make significant progress toward the 95 percent statutory target for the state’s share of transit operating/capital expenses. For FY 2011, the Commonwealth can only cover about 36% of eligible operating expenses and about 54.6% of capital, leaving local governments scrambling to raise passenger fares, spend precious property tax revenues or cut transit service. A significant share of any new revenue measures for transportation, energy conservation or climate protection should be dedicated for transit/TDM because transit investments are one of the most effective means to achieve the goals of such legislation. Further, public transit systems need additional state funding to

4
maintain effective service and to leverage the significant past and current investments by local governments.
LEGISLATIVE PROPOSALS THAT MAY BE INTRODUCED BY OTHERS
During the past several months, many creative ideas were submitted to the Virginia Department of Rail and Public Transportation, the Governor’s Reform Commission and other agencies by VTA members and others, some of which were (or may be) recommended for legislative action.
VTA favors in principle each of the following potential initiatives:
• In producing state transportation plans, the Commonwealth should seriously address how to provide sufficient funding for operating, maintenance and capital needs of the identified projects. Also, moving people and goods, not vehicles, should be emphasized.
• Provide tax credits for employers incurring expenses to encourage teleworking by their employees.
• Provide tax credits to railroads for preserving rights‐of‐way for future passenger use, assuming that the railroads are required to be open to negotiating access to their rights‐of‐way for public agencies seeking to provide local transit and/or commuter rail service.
• Continue allowing provisional waivers, based on DRPT’s recommendations, of the 30 percent match for Rail Enhancement Funds and allow those funds to be used to match federal funds and leverage bonds when there is a compelling public policy reason. Budget language for FY 2011 provided for such waivers.
• Provide long term, sustainable operating funding for expanding intercity rail service using new state sources such as a rental car tax increase. Funds should not be diverted from existing underfunded state transit programs or from the federal funds allocated to VRE’s track leases by the CTB each year.
• Require motorists to stop for pedestrians at marked crosswalks without traffic signals where posted speed limits are 35 mph or less, in order to promote safety in accessing transit.

VVTTAA WWAATTCCHH LLIISSTT OOFF LLEEGGIISSLLAATTIIVVEE PPRROOPPOOSSAALLSS
AAPPPPRROOVVEEDD:: NNOOVVEEMMBBEERR 11,, 22001100
Several proposals that could affect the interests of public transit systems in Virginia have been publicly discussed.
1. VTA does not favor the Commonwealth owning and operating VRE and all other commuter rail services which span different regions. VTA opposes this because local taxpayers and fare‐paying customers have provided most of the funds needed to build VRE into a successful $300 million enterprise with close to 18,000 average daily passenger trips. VRE is managed like a successful small business devoted to customer service. Local control ensures continuation of those customer‐friendly policies.
2. VTA does not favor consolidating Northern Virginia transit organizations (NVTA, NVTC, PRTC, VRE) into one agency stretching from Washington, D.C. to the southern boundary of Spotsylvania County. VTA opposes this because it would hamper the performance of WMATA, VRE and the eight other public bus systems operating in that expansive territory by requiring governmental entities that do not help fund certain of the transit systems to provide oversight. For example, NVTC specializes in WMATA issues and jurisdictions south of the Occoquan River have no financial stake in WMATA.
3. VTA does not favor eliminating the 95 percent target for state transit assistance covering eligible net transit expenses and substituting a new target of at least 20 percent of operating costs. VTA opposes this because the 95 percent target, although it has not been achieved, does provide parity with highways. Further, most operating costs are not even eligible for state aid (e.g. operators’ wages are excluded) and therefore this measure of costs provides an inappropriate target.
4. VTA does not support consolidating DRPT into VDOT. VTA opposes this because currently DRPT performs well as a funding and advocacy agency focusing on public transit/TDM.
5. Decisions on governance of transit systems should be determined by discussions among the parties, not by legislation. Further, governance should be discussed together with the need for sustainable funding.
6. VTA does not support eliminating the Rail Advisory Board. VTA opposes this because the Board provides a valuable forum for discussions and agreement among freight railroads and passenger rail interests, including VRE. A member of CTB serves on the board as a liaison to ensure that the Board’s recommendations for programming projects in the Rail Efficiency Fund are effectively communicated. Elimination would save the Commonwealth only $10,000 annually.

5.B.Jurisdiction and Agency Coordinating Committee
Northern Virginia Transportation Authority MEMORANDUM TO: Martin E. Nohe, Chairman Northern Virginia Transportation Authority Members Northern Virginia Transportation Authority FROM: Tom Biesiadny, Chairman Jurisdiction and Agency Coordinating Committee Northern Virginia Transportation Authority SUBJECT: Approval of 2011 Legislative Program (Item 5.B.) DATE: November 12, 2010 Recommendation: The Jurisdiction and Agency Coordinating Committee recommends that NVTA approve the proposed 2011 legislative program and direct staff to transmit it to the Northern Virginia delegation of the General Assembly and Congress. Background: In 2007, the General Assembly approved legislation (HB 3202) that resulted in increased transportation funding both in Northern Virginia and statewide. Unfortunately, the Virginia Supreme Court ruled that the General Assembly’s delegation of taxing authority NVTA was unconstitutional. Despite an extended Special Session during Summer 2008 and additional efforts during the 2009 and 2010 Sessions, the General Assembly has not enacted legislation to replace the regional transportation revenue included in HB 3202. Also, due to declining transportation revenues, the Commonwealth Transportation Board was been forced to cut $4.6 billion from the Six Year Program. Attached is a draft 2011 Legislative Program. Although the proposed program is similar to the 2010 Program, there have been several changes. These include:
• The transportation funding position has been update to reflect the most recent information regarding Virginia’s transportation funding situation.
Chairman Nohe

Member, Northern Virginia Transportation Authority November 12, 2010 Page Two
• The position on capital funding for the Virginia Railway Express has been revised. (Please note that VRE, NVTC and PRTC have not yet approved their legislative programs. The NVTA position on VRE capital items may need to be adjusted after these agencies approve their programs).
• A new position recommending the restoration of VDOT’s revenue sharing program to its pre-2006 approach has been added.
• A new position supporting changes to the Urban Development Areas has been added. • A new position recommending clarification regarding the uses for the local vehicle
registration fee is being consider. Language is still being discussed and will be presented at the NVTA meeting, if a consensus can be reached.
• A new position recommending that major corridor studies located within one VDOT construction district be managed by staff from that construction district.
In Item 5D, the Jurisdiction and Agency Coordinating Committee recommends a list of priority projects for funding identified by the VDOT audit. These projects are high priorities that can be implemented quickly. A separate project list was not developed for the 2011 Legislative Program. Jurisdiction and Agency Coordinating Committee members and I will be available at the November 18, 2010, NVTA meeting to answer questions. Cc: Members, NVTA Jurisdiction and Agency Coordinating Committee

Northern Virginia Transportation Authority 2010 Legislative Program
DRAFT: November 12, 2010 STATE TRANSPORTATION FUNDING What was once a crisis in Northern Virginia and Hampton Roads has become a catastrophe for nearly the entire Commonwealth. There is no viable transportation solution that does not include long-term, dedicated, sustainable, new multimodal revenues. Over the past three years, the Commonwealth Transportation Board has cut $4.6 billion from the Six Year Program. Secondary and urban system construction funds have essentially been eliminated, despite the fact that the secondary roads are a Commonwealth responsibility. Six-year secondary road allocations to counties in Northern Virginia are now less than $2,000 each and localities are being allocated no urban construction funds. In addition, the growth in maintenance spending has been reduced from four percent to three percent, even though maintenance costs are increasing overall. The Commonwealth is risking serious disinvestment in its existing transportation infrastructure that will be more difficult and more expensive to correct in the future. Today, approximately $1 billion is needed to address existing deficient pavement conditions, and approximately $3.7 billion is needed to fix the Commonwealth’s deficient bridges. Very shortly the Commonwealth will be unable to ensure that the required matches are available for the federal transportation funds the Commonwealth receives. Should this happen, Virginia would have to return these federal funds, further compounding the crisis. NVTA continues to support additional state and regional transportation funding for highway, transit, bicycle and pedestrian improvements, and have taken actions to increase funding locally. In 2006, the region’s TransAction 2030 Long-Range Transportation Plan estimated that Northern Virginia alone needs $700 million per year in new transportation funding to address the region’s transportation problems. This figure has increased since then, because most of the major HB 3202 revenue sources have been eliminated. NVTA seeks reinstatement of exclusive Northern Virginia revenues in the range of at least $300 million annually, as well as 100 percent of Northern Virginia’s contribution of additional statewide revenues, to address transportation needs not originally covered by the HB 3202 funding approved for Northern Virginia. Both the regional and statewide revenues should be provided from stable, reliable, proven and permanent source(s). The General Assembly must adopt new statewide transportation revenue sources to bolster existing highway and transit revenue sources that are not generating sufficient funding to meet the Commonwealth’s critical highway needs or meet the Commonwealth’s statutory 95 percent share of eligible transit operating and capital costs (net of fares and federal assistance). This additional transit funding alone would require approximately $166 million annually in new funds for the limited transit projects and eligible operating costs included in the Six Year Program. Additional funds to dramatically increase Secondary Road

investments are also needed. Any funding solution must ensure that dedicated funding for Washington Metropolitan Area Transit Authority capital improvements and for Virginia Railway Express capital and operating expenses are addressed. Existing state General Fund revenue streams (almost half of which now go to localities) are required and used for core services of the Commonwealth, such as education and public safety. These historically underfunded, locally provided, core services have already experienced significant cuts, due to reduced General Fund revenues, and shifting the state’s transportation funding responsibility to localities by using the General Fund increases local budget pressures without providing a true transportation solution. (Revises and updates previous transportation funding position.) BASE REALIGNMENT AND CLOSURE (BRAC) RECOMMENDATIONS NVTA supports the inclusion of sufficient funding in the 2010-2011 budget to ensure significant fiscal resources to address the enormous planning and transportation issues associated with the Base Realignment and Closure Commission recommendations. This is particularly critical, because the BRAC relocations will occur in 2011, and there is significant lead time required to implement needed transportation improvements. (Updates previous position). PEDESTRIAN SAFETY NVTA support revisions to Virginia’s existing pedestrian legislation to clarify the responsibilities of drivers and pedestrians in order to reduce the number of pedestrian injuries and fatalities that occur each year. In particular, support legislation that would require motorists to stop for pedestrians in crosswalks at unsignalized intersections on roads where the speed is 35 mph or less and at unsignalized crosswalks in front of schools. This issue is of special importance for pedestrians with physical or sensory disabilities, who are at particular risk of injury when crossing streets. (Reaffirms previous position.) CHAPTER 527 TRAFFIC IMPACT ANALYSES NVTA supports modifications to Chapter 527 Transportation and Land Use legislation and regulations to adjust timeframes for traffic impact analyses to be more consistent with local government review times and scheduled public hearings. In addition, the Comprehensive Plan amendment/updates section of the regulations should be further developed and improved to meet the needs of the process (especially dealing with multiple amendments at same time), and Low-volume rule traffic impact analysis requirements should be revised to address situations when existing roadway capacity is obviously sufficient to meet demands of a new development even though the development might otherwise cross the threshold for a traffic impact analysis. (Reaffirms previous position). SECONDARY ROAD DEVOLUTION

NVTA opposes any legislative or regulatory moratorium on the transfer of newly constructed secondary roads to VDOT for the purposes of ongoing maintenance. NVTA also opposes any legislation that would require the transfer of secondary road construction and maintenance responsibilities to counties. (Reaffirms previous position). REVENUE SHARING NVTA supports legislation to remove the project tiers and restore the program to the way it existed before 2006, but continue to allow cities and towns to participate. The revenue sharing program is a way to leverage scarce state transportation funds. (New position). URBAN DEVELOPMENT AREAS NVTA recommends changes to several aspects of the Code related to Urban Development Areas. These changes are summarized below: Density – recommend changes to the density requirements to allow Northern Virginia Jurisdictions to comply with more appropriate density requirements, since current density requirements for jurisdictions with a population over 130,000 will not attract new development in several of the affected communities. Size of UDAs / Regional Coordination – recommend changes to allow population estimates developed by the local Metropolitan Planning Organization, rather than restricting only the Weldon Cooper Center, the Virginia Employment Commission or the U.S. Census Bureau.
Date of Compliance – Change the date of compliance from July 1, 2012, to July 1, 2013, to give jurisdictions adequate time to consider appropriate amendments to its plans and regulations. (New position).
LOCAL VEHICLE REGISTRATION FEE
Position still being discussed. A position will be provided at the NVTA meeting on November 18, 2010, if consensus has been reached. Otherwise this item will be deleted.
TRANSPORTATION CORRIDOR STUDIES NVTA recommends that the Code of Virginia be amended to specify that major transportation corridor studies related to faculties wholly within one VDOT construction district, should be managed by that construction district rather than the VDOT Central Office. Regional VDOT staff is better equipped to address the concern of the affected citizens and local governments. (New position).

FEDERAL SURFACE TRANSPORTATION PROGRAM REAUTHORIZATION The current Federal Surface Transportation Program was authorized in July 2005 by the Safe, Accountable, Flexible, and Efficient Transportation Equity Act – A Legacy for Users (SAFETEA-LU). This legislation authorizes both highway and transit funding over a six-year period (FY 2004 to FY 2009) and establishes the policies and grant programs for distributing these funds. This authorization expired on September 30, 2009. Congress has extended SAFETEA-LU until December 31, 2010. Efforts are underway to develop a new surface transportation program for the period from Federal FY 2010 to FY 2015. In preparation for discussions of the new authorization bill, various transportation groups, including the Transportation Planning Board, the American Association of State Highway and Transportation Officials and the American Public Transportation Associations are adopting principles and/or position statements. In addition, the National Surface Transportation Policy and Revenue Study Commission, one of two established by SAFETEA-LU, has released their report on the future structure of the surface transportation program. The other commission, called the National Surface Transportation Infrastructure Financing Commission has completed its report on potential future revenue sources. The U.S. Department of Transportation also released a position paper on the new authorization. Throughout these various documents there are some common themes that are relevant to Northern Virginia. In general, there seems to agreement that the current surface transportation program should not be “reauthorized.” Instead, a number of significant changes should be considered. These changes include:
• The level of Federal investment in the nation’s transportation infrastructure, including both maintenance of the existing system and expansion, must increase significantly;
• The distribution of funding within the Federal Surface Transportation Program must be simplified and the number of funding programs streamlined and consolidated. Successful programs such as the Regional Surface Transportation Program (RSTP) and the Congestion Mitigation and Air Quality (CMAQ) program should be retained in some form;
• The time required to complete the federal review process of significant new transportation projects must be reduced, and the approval process must be consistent across all modal administrations. In addition, federal implementation regulations should be streamlined;
• To recognize the uniqueness of metropolitan areas, greater decision-making authority for determining how transportation funding is spent should be given to local governments and regional agencies, such as the Northern Virginia Transportation Authority;
• Energy efficiency and environmental protection must be addressed in the development of transportation projects; however environmental reviews should be conducted within specified timeframes, so that a project’s environmental

impacts can be identified and adequately addressed; and • Safety and security must continue to be an important focus of transportation
projects. (Reaffirms previous position) DEDICATED FUNDING FOR WMATA Now that Congress has authorized $1.5 billion for the Washington Metropolitan Area Transit Authority’s capital needs and the WMATA Compact has been amended as required by the Federal authorizing legislation, NVTA calls upon Congress to appropriate these funds annually. (Reaffirms previous position). FUNDING FOR THE VIRGINIA RAILWAY EXPRESS NVTA calls upon Congress to authorize Virginia Railway Express to secure federal appropriations under the new proposed Transportation Reauthorization legislation for the following items:
• Top priority is to satisfy core system-wide requirements including the acquisition of railcars, parking expansion, platform extensions and mid-day storage of rail equipment.
• Secondary priority is for the expansion of commuter rail service on the Manassas line (NS) to Gainesville-Haymarket.
(Updates previous position.) LIMITS ON COMMUTER RAIL RELATED LIABILITY NVTA calls upon Congress to approve legislation to broaden the applicability of existing statutory language in 49 USC, 28301 related to commuter rail related liability. The language should be amended to reflect the existing liability standard of a $250M annual aggregate limit while broadening the cap beyond passenger rail related claims for property damage, bodily injury or death so that they apply to all claims brought by third parties. FUNDING FOR TRANSPORTATION EMERGENCY PREPAREDNESS NVTA calls upon Congress to provide increased security funding to local and regional transportation agencies in the metropolitan Washington area. (Reaffirms previous position.) FUNDING FOR THE METROPOLITAN AREA TRANSPORTATION OPERATIONS COORDINATION (MATOC) PROGRAM NVTA calls upon Congress to provide increased funding to transportation agencies in the metropolitan Washington area to continue funding for MATOC’s operations. (Updates previous position)

COMMUTER BENEFITS NVTA supports legislation that would permanently increase the level of tax-free transit benefits employers can provide to employees to $230 per month, as a way to make transit service more attractive to commuters who currently drive alone. The benefit is scheduled to revert to $120 per month on December 31, 2010. In addition, NVTA supports legislation to permanently extend the current transit benefit to all branches of the federal government. (Reaffirms previous position.) REST AREA CONCESSIONS In July 2009, the Commonwealth Transportation Board significantly reduced funding for interstate rest areas as a way to address reduced transportation revenues. This resulted in the closure of numerous rest areas statewide, including four in Northern Virginia. Current federal law prevents the Virginia Department of Transportation for procuring private concessionaires to operate commercial establishments at its rest areas, even though such arrangements were permitted in other states in the past. NVTA requests that Congress approve flexibility for Virginia to procure private concessionaires to operate commercial establishments at the rest areas which have been closed as a way to provide an important a safety feature and comfort amenity to those who travel Virginia’s interstate highways. (Reaffirms previous position). FUNDING FOR CONSTRUCTION OF AN I-66 TRUCK INSPECTION AND WEIGH STATION
NVTA advocates that funding be included in the Homeland Security budget for these I-66 inspection and weigh stations. (Reaffirms previous position.)


1
The Case to Maintain the Commuter Benefit Cap
Congressional Action Required to Continue “Win-Win” Initiative Supporting Workers, Business, Mass
Transit, the Environment and Energy Independence
September 2010

2
Overview and Summary
Imagine an idea that could effectively slash taxes for millions of American workers, reduce payroll taxes for thousands of U.S. businesses, cut congestion on the nation’s major commuter arteries and eliminate almost 8,000 pounds of CO2 emissions per person, per year without onerous government regulation – all in one swoop.
Here is the good news: The program offering those benefits has been a reality for over 20 years. The bad news? This initiative, boasting rare “what’s-not-to-like” economic, environmental and quality-of-life benefits now faces the prospect of dramatic weakening – unless Congress renews the full benefit as it finalizes the fiscal 2011 budget in October of 2010. The Issue Over 20 years ago, a simple yet ingenious idea took root: Allowing workers to defray mass transit costs through their employers’ benefits packages. As a result, in 1987 TransitCenter introduced TransitChek®, the nation’s first commuter benefits program, giving employers the ability to allow employees to pay for their transit commuting costs as a fringe benefit. Several years later (1998), the Internal Revenue Service codified commuter benefits under Section 132(f), which allowed employees to take advantage of the benefit using pretax dollars. Today, tax-free commuter benefits are enjoyed by approximately 850,000 commuters nationwide and have joined health, retirement and disability at the top of the list of benefits offered by companies. In 2009, the American Recovery and Reinvestment Act -- recognizing the program’s efficacy, nearly doubled to $230 the monthly pretax cap commuters could spend on the benefit (compared to $120). This new higher benefit also created parity between mass transit and commuter parking benefits, promoting the use of eco-friendly modes of transportation while saving money for users of our nation’s mass transit system. Now, as the economic stimulus winds down and Congress turns to the new fiscal year budget, the monthly cap threatens to revert back to $120 on December 31st unless action is taken.
In this paper we will argue, citing objective evidence from noted third-parties, why the elimination of the $230 monthly cap will squander important economic and environmental benefits, and run counter to our nation’s recognized and urgent priorities to stimulate the economy, reduce dependence on Middle East oil, restrict greenhouse gas emissions and develop a sound transportation strategy.
The Consequences: Is a $110 monthly reduction all that important? Experts think so. A just completed independent analysis by the New York-based management consulting firm Bennett Midland shows that for a worker currently spending $230 per month on mass transit, the cap reduction would increase commuting cost by 18 percent. What is more, as a consequence of

3
the monthly cap reverting to previous levels, mass transit ridership nationally could plunge by an estimated 5% to 9% among users of commuter benefits, according to Bennett Midland. The economy is already forcing transit agencies nationwide, from New Jersey to Northern Virginia to Southern California, to increase their fares in light of tighter operating budgets. As a result, “Reducing the benefit cap would be like commuter savings and mass transit operators hitting the third rail,” says Dan Neuburger, President and CEO of TransitCenter, a pioneer in establishing tax-free commuter benefits. The Origins of a “Win-Win” Policy Commuter tax benefits were first established, on a modest level, in the mid-1980s, largely as an effort to redress IRS policy that treated free employee parking as a tax-free fringe benefit – a policy that encouraged employees to drive to work even when mass transit alternatives existed. Shortly thereafter, a consortium of New York City transportation, business and civic groups launched TransitCenter, which quickly demonstrated the broad success and appeal of the commuter benefits concept. Armed with this evidence, a national coalition rapidly formed behind the idea. Congress, in 1998, codified the concept into a single IRS statutory provision, Internal Revenue Code Section 132(f), which allows a person to pay for the costs of mass transit commutes using pretax earnings, the amount limited by a statutory cap. And in 2008, San Francisco passed a law requiring employers with 20 or more employees to provide commuter benefits to those employees who work in San Francisco. Today, an estimated 28% of all employers nationwide offer the pretax commuter benefit, covering 44% of employees.
Tax-free commuter benefits can only be provided through employee-funded pretax payroll deductions or employer-funded or partially funded benefits. They can be delivered as a transit provider-specific pass, universally accepted voucher or terminal-restricted debit card, or cash reimbursements under strict IRS rules (where vouchers are not readily available). The benefit covers commuter rail, subway and bus transportation, eligible vanpools and commuter-related parking.
Building on Success: The Economic Stimulus and the New Monthly Cap Congress, recognizing the popularity and power of the idea, has steadily raised the amount of pretax dollars permitted to be earmarked for mass transit costs. Specifically, in 2009 via the American Recovery and Reinvestment Act (the Economic Stimulus Plan), it raised the cap to $230 per month from $120. Several considerations underlay this decision: Investing in Success: Tax-free commuter benefits are a proven example of a successful
government incentive that brings a rare combination of both economic and environmental

4
benefits without direct government intervention. In short, this is the kind of program that has appeal across the political spectrum.
Addressing Costs: Impacted by state and municipal budget crises, commuter costs have escalated nationwide. Experts estimate that 30% of workers who use the benefit now pay more than $120 per month in commuting costs. The new monthly cap has brought the benefit more into line with these realities.
Achieving Parity: the private parking tax benefit referenced earlier now stands at $230 per month; in order to keep tax policy from encouraging the use of single occupancy vehicles rather than the use of mass transit, as it once did, legislators brought the commuter benefit into line.
Officials on the front lines of promoting mass transit ridership applauded the decision to raise the monthly cap.
“The support of public transit [via the cap increase] again demonstrates that win-win solutions can be found to answer both our economic and environmental needs,” said Dorothy Dugger, of San Francisco’s Bay Area Rapid Transit (BART) system.
“Given the economic pressures our riders are under,” said Steve Schlikman of the Regional Transportation Authority of Chicago, “the $230 cap couldn’t have come at a better time.”
What’s At Stake: The Bennett Midland Analysis What precisely is at stake if Congress reduces the monthly benefit cap from $230 to $120? In August, an independent management consultant commissioned by TransitCenter addressed that question. Bennett Midland concluded that lowering the monthly cap would result in three related, negative impacts:
Increased Costs for American Workers: Commuters using the benefit and spending $230 per month on mass transit will see their effective commuting costs increase by 18%.(1) All commuters with a commuting cost of more than $120 a month would see those costs increase.
(1) Assumption of tax rate at the national average of 31.6%
Declines in Mass Transit Usage: An increase in the cost of commuting is expected to reduce
mass transit ridership by as much as 9% among commuter benefit users. Lower Revenue for Operators: The decline in ridership would mean decreased revenue for
mass transit operators, leading to further pressure for fare increases.
Bennett Midland data confirmed that the old $120 monthly cap has been surpassed by fare hikes across the country. In the New York metropolitan area, for example, the minimum monthly pass

5
for each of the region’s three commuter rail systems exceeds $120. On Metra, Chicago’s commuter rail, nearly 35% of all monthly passes are in excess of $120.
Finally, Bennett Midland confirmed that the 2009 monthly cap increase attenuated declines in mass transit usage during the economic slowdown, and has had an immediate and positive impact on benefit enrollment growth. What’s At Stake: The Current Cap Benefits Energy Independence and the Environment Eliminating the $230 monthly cap represents a blow to the powerful environmental and energy benefits associated with mass transit, which the American Public Transportation Association calls, “one of the most effective strategies to reduce energy consumption and improve the environment without imposing government mandates or regulations.” Public transportation is twice as fuel efficient as private automobiles. Annually, mass transit saves an amount of energy comparable to one month of oil imports from Saudi Arabia. At current usage levels, public transportation reduces carbon emissions by nearly 750,000 tons per year, comparable to nearly three-quarters of carbon emissions by all U.S. chemical manufacturers.
The Metropolitan Transit Authority (New York) estimates that mass transit currently removes three million drivers from the New York City area roads each day, avoiding more carbon emissions than 648,000 acres of forest absorb.
TransitCenter data shows that 41% of employees who use its benefit increase their use of mass transit during the week and 46% do so on weekends. What’s at Stake: The Current Cap Drives Enrollment One of the keys to expanded use of the tax-free benefit is getting employers to offer it. A recent survey of companies with at least one office in the metropolitan areas of New York, Chicago or San Francisco – the three largest transit markets in the U.S. -- shows that the $230 monthly cap has been a strong spur to participation, both on the part of employers offering the benefit and employees participating in it.
TransitCenter reports that 17% more firms offered the pretax commuter benefit in 2010 (the first full year following the cap increase) compared with 2009.
Employee enrollment increased considerably during this period, especially at medium and large companies.
Forty-two percent of employers report that employees participating in the benefit increased their pretax deduction as a result of the cap increase.
The TransitCenter survey also suggests that a monthly cap reduction could even have more sweeping business consequences. Forty two percent of employers in the survey said that a

6
reduction in the present cap could encourage some employees to look for work closer to home. It would also reduce payroll tax savings currently enjoyed by participating employers.
Conclusion The risk facing the country and Congress in the months ahead is that of the path not taken. Failing, for whatever reason, to reaffirm the $230 monthly cap represents a step back from a successful and time-tested idea that brings our country clear and multiple benefits as we grapple with the challenges of economic weakness, energy dependence and global warming. To reiterate to whom and how the $230 monthly cap brings benefits:
American Workers: the $230 monthly cap aids approximately 850,000 employees at a time
when working families are struggling. Reducing the $230 monthly cap to its pre-stimulus level ($120) would effectively increase commuter costs to enrolled employees by up to 18%.
American Businesses: eliminating the present monthly cap represents an effective increase in payroll taxes for participating businesses.
The Environment: The increase in commuter costs noted above will spur a decline in mass transit usage – up to 9% among commuter benefit participants nationally according to a noted consultant. This will abet a host of harmful environmental impacts, including increased greenhouse gas emission, highway congestion and energy consumption.
Mass Transit Operators: Already reeling from state and municipal budget shortfalls, operators will suffer a further revenue blow from the ridership declines the cap reduction portends.
The new cap is spurring enrollment: Studies and trends show that the new monthly cap, just 18 months old, has been an important stimulus to enrollment in the benefit on the part of employees and employers.
The old monthly cap is inadequate: Up to one-third of American commuters spend more
than $120 per month (the level of the old cap) on mass transit, according to the TransitCenter 2010 Commuter Impact Survey.
The old cap is unfair tax policy: Eliminating the $230 monthly cap means that Congress will have betrayed the founding principle of the commuter benefit: keeping the private parking benefit at parity with the mass transit benefit.
Finally, the new monthly cap secures all these benefits without the heavy-hand of direct government intervention in the form of business or environmental regulation.

4350 N. Fairfax Drive Suite 720 Arlington, Virginia 22203 Tel (703) 524-3322 Fax (703) 524-1756 TDD (800) 828-1120
Email [email protected] Website www.thinkoutsidethecar.org
November 22, 2010
Dear:
I am writing to urge you to continue the current commuter benefit that permits employers to provide up to $230 per month as a tax-free public transit incentive. Unless Congress acts, this transit benefit, which matches the benefit to employees who drive and receive subsidized parking, will drop precipitously to $120 at the end of this year. The parking benefit will remain at $230. The Northern Virginia Transportation Commission coordinates public transit services providing 143 million passenger trips in Northern Virginia in FY 2010. NVTC co-owns one of the eight systems providing that service; the Virginia Railway Express commuter rail system itself carries almost four million passenger trips annually.
One of the most important factors contributing to these significant ridership levels is the availability of the $230 monthly commuter benefit. For example, 64% of VRE customers currently receive these benefits from employers. VRE fares from Fredericksburg to Union Station in the District of Columbia are $285.50 for a monthly pass ($20.60 per day using more expensive single-ride tickets). If the transit benefit amount is allowed to return to the previous $120 level, fewer employees will ride and more will drive. This will further clog our congested highways. Others without access to automobiles will no longer be able to afford to get to work. WMATA reports that 285,000 employees currently receive the monthly transit benefits in this region; an estimated 40% now receive more than the $120 level and many would be disadvantaged if the maximum were permitted to drop from the $230 level.
Chairman Hon. Catherine Hudgins Vice Chairman Hon. William D. Euille Secretary/Treasurer Hon. Mary Hynes Commissioners: City of Alexandria Hon. William D. Euille Hon. Paul Smedberg Arlington County Hon. Mary Hynes Hon. Jay Fisette Hon. Christopher Zimmerman Fairfax County Hon. Sharon Bulova Hon. John Cook Hon. John Foust Hon. Catherine M. Hudgins Hon. Jeffrey McKay City of Fairfax Hon. Jeffrey C. Greenfield City of Falls Church Hon. Daniel Maller Loudoun County Hon. Kelly Burk Virginia Department of Rail and Public Transportation Hon. Thelma Drake Virginia General Assembly Sen. Mark Herring Sen. Mary Margaret Whipple Del. Barbara Comstock Del. Adam P. Ebbin Del. Joe T. May Del. Thomas D. Rust Executive Director Richard K. Taube

2
As our economy struggles to return to prosperity, access to jobs should not be jeopardized. Please work with your colleagues to ensure that the $230 monthly public transit benefit is extended. Ideally it would be made permanent and be indexed to inflation.
The $230 monthly benefit was enacted in the American Recovery and Reinvestment Act of 2009, Section 1151. Pending bills would extend the benefit, including S 322 which is currently in the Senate Finance Committee and HR 891 which is in the House Ways and Means and Oversight and Government Reform committees.
Please feel free to contact me with any questions.
Sincerely, Catherine Hudgins Chairman
cc: The Honorable Robert McDonnell The Honorable Sean Connaughton Virginia Congressional Delegation

AGENDA ITEM #5 TO: Chairman Hudgins and NVTC Commissioners FROM: Rick Taube DATE: November 24, 2010 SUBJECT: Draft NVTC Work Program for 2011 Each year at this time NVTC staff prepares a draft work program for the coming year. It is reviewed by local staff and then presented to the NVTC board for additional suggestions. Following discussion, the commission is asked to authorize staff to release the attached draft 2011 NVTC work program to the public for comment. Also, authorization is requested to schedule a public hearing on the work program for NVTC’s January 6, 2011 meeting, prior to action that evening to approve the final work program. Examples of proposed new activities for 2011 include development of a “virtual machine” for buses to consolidate several separate onboard computer systems and thereby save money and improve performance. Also, local transit systems would be helped to report real-time information to the Regionally Integrated Transportation Information System (RITIS) in order to facilitate development of “apps” by the private sector to serve this region’s technologically savvy transit customers. No additional grant funds will be required for these two new technology projects. Also, NVTC would manage additional federal grant funding for its jurisdictions amounting to $1.3 million in the first half of 2011.

NVTC’S 2011 GOALS, OBJECTIVES AND WORK PROGRAM
--DRAFT: November 9, 2010--

2011 NVTC Meeting Schedule [Meetings start at 8:00 P.M.]
MONTH DATE AGENDA
January 6 Elect officers. Select WMATA and VRE Board members, VTA representatives and NVTC Legislative Committee members. Conduct a public hearing and approve 2011 goals, schedule and work program. Approve FY 2012 VRE budget. Approve NVTC FY 2012 budget.
February 3* Review progress on state and federal legislative agenda. Approve NVTC and VRE state grant applications.
March 3 Review progress on state and federal legislative agenda.
April 7 Review progress on WMATA budget for FY 2012. Review completed 2011 General Assembly session.
May 5 Approve comments on WMATA FY 2012 budget.
June 2 Focus on regional transit performance.
July 7 Review mid-year progress on NVTC work program. Approve DRPT contracts for NVTC and VRE FY 2012 grants.
August No Meeting.
September 1 Forward preliminary NVTC FY 2013 budget to local jurisdictions.
October 6 Review quarterly progress on NVTC’s work program. Approve CTB pre-allocation testimony.
November 3 Approve FY 2011 NVTC and VRE audits.
December 1 Select NVTC Nominating Committee for 2012 officers. Approve legislative agenda for 2012. Review progress on 2011 work program and release draft 2012 work program for public review and comment.
*February meeting with NVTA in the General Assembly building in Richmond starting at 5:30 p.m.

2
NVTC EXECUTIVE COMMITTEE 2011 MEETING SCHEDULE
[All meetings 7:30 - 8:00 P.M. prior to NVTC meetings in the small conference room.] MONTH DATE SUBJECT January 6 Legislative items. February 3 No meeting. March 3 Review General Assembly session. April 7 Review quarterly progress on work program. May 5 Review NVTC policies on topical transit issues. June 2 Examine VRE performance. July 7 Mid-year review of progress on workplan. Meet with auditors
to preview FY 2011 audit. August No meeting. September 1 Preliminary NVTC FY 2013 budget. Executive director
performance review. October 6 Review quarterly progress on work program. November 3 FY 2011 NVTC and VRE audits. December 1 Select NVTC Nominating Committee for 2012 officers.
Consider 2012 legislative agenda. Review progress on 2011 work program and preview 2012 work program.

3
NVTC MANAGEMENT ADVISORY COMMITTEE 2011 MEETING SCHEDULE
[All meetings begin at NVTC at 1:30 P.M. on the third Tuesday of each month. At each meeting the agenda and suggested material for the upcoming NVTC board meeting are reviewed.] MONTH DATE SUBJECT January 18 FY 2012 state grant application; NVTC administrative budget
for FY 2012; NVTC legislative agenda. February 15 Progress on legislative agenda.
March 15 Review of legislative accomplishments; WMATA FY 2012
budget issues. April 19 To be determined. May 17 To be determined. June 14 Mid-year progress review on NVTC work program; authorize
funding of scope of work for NTD data collection; authorize funding of scope of work for e-schedules maintenance and promotion.
July No meeting. August 16 NVTC preliminary administrative budget for FY 2013. September 20 Review draft CTB pre-allocation testimony.
October 18 NVTC audit for FY 2011. November 15 Draft NVTC legislative agenda for 2012; first draft 2012 NVTC
work program. December 20 Proposed 2012 work program; VRE and NVTC budgets for FY
2013.

4
NVTC MISSION STATEMENT To serve the public by providing a forum for elected officials to achieve an effective regional transportation network. Focusing primarily on transit, NVTC will develop strategies, identify funding sources, advocate for additional funding, prioritize allocations, oversee transit systems such as VRE and WMATA, measure and report transit performance and pursue new transit programs. NVTC will work to improve mobility, reduce traffic congestion, protect the environment and stimulate the regional economy by increasing transit and ridesharing use.

5
GOALS AND ACTIONS FOR 2010 1. DEVELOP POLICY AND ADVOCATE FAVORABLE LEGISLATION Goal: Devise and implement legislative strategies based on sound policy
analysis to increase transit ridership, obtain adequate funding, and coordinate priorities with members and other agencies.
Actions: 1. With the support of local staff, identify transit issues that require policy decisions
and assemble data and perform policy analyses to facilitate those decisions (e.g. fare integration, development of new technology, service expansion, customer safety and system security). Work with local legislative liaisons to develop strategies for improved transit funding and to educate General Assembly members about Northern Virginia’s transit needs.
2. Adopt a state and federal legislative agenda and work with local jurisdictions,
Virginia Transit Association (VTA) and other groups, as appropriate, to implement the agenda and the supporting NVTC policies. Work with delegations in Richmond and in Washington D.C. as needed to promote NVTC’s approved agendas. Emphasize a greater role for transit in authorizing the next six years of federal funding programs. Conduct NVTC’s February meeting on Local Government Day at the General Assembly in Richmond, jointly with the Northern Virginia Transportation Authority. Obtain reduced rate for on-line legislative monitoring service and share access with member jurisdictions. Provide legislative alerts to commissioners and local staff during the session. Focus on transit funding.
3. Participate on the American Public Transportation Association’s (APTA)
legislative and commuter rail committees to define and implement a federal legislative strategy as part of a broad, nationwide pro-transit coalition. Provide special assistance to areas contemplating new commuter rail service.
4. Participate on VTA's executive, legislative and ad hoc committees to help define
and implement an effective state legislative strategy for the transit industry and strengthen VTA as an organization and keep it responsive to Northern Virginia’s concerns. Co-chair VTA events, chair VTA’s Legislative Committee, encourage NVTC board members to serve as VTA officers and assist transit systems in special legislative promotions with NVTC’s public outreach and web-design expertise.
5. Prepare written testimony and appear at the CTB's annual pre-allocation
hearings on public transit funding priorities and at the Transportation Planning Board (TPB) and other hearings as appropriate. Advocate NVTC’s policies including balanced transportation and stable and reliable funding.

6
2. SEEK AND ADVOCATE FUNDING Goal: Identify and implement cooperative strategies with member governments
to gain additional transit revenues and work to obtain adequate, dedicated, stable and reliable financial support from the federal government and the commonwealth and the private sector.
Actions: 1. Identify and seek to implement stable, reliable, permanent and dedicated funding
sources for operating and capital expenses for WMATA, VRE and local transit systems. Help coordinate regional efforts and prepare analysis tools, brochures and editorials to promote such funding. Safeguard the current sources of transit funding available to NVTC’s local governments.
2. Produce financial projections and analyze alternative funding mechanisms to bridge the growing gap between transit operating and capital needs versus available financial resources. Actively participate in regional and statewide efforts to define public transit needs and identify funding sources, such as corridor studies, TPB's vision plan and constrained financial plan update, VTrans 2035 and Northern Virginia's TransAction 2040 transportation plan update. Analyze funding proposals produced by those studies and identify policy issues for consideration by the commission. Maintain up to date PowerPoint presentations on “The Case for Increased Funding of Public Transportation in Northern Virginia,” “How Public Transportation is Organized in Northern Virginia,” and the “VRE Chronology” to help educate elected officials, the media and the public.
3. Organize improved information sharing between local governments and the
Virginia Department of Taxation and more effective auditing to facilitate efficient collection of NVTC’s 2.1 percent motor fuels tax and increased knowledge of taxpayer responsibility on the part of motor fuels distributors. Employ database and spreadsheet models to identify unanticipated discrepancies for particular tax payers and jurisdictions. Monitor the required reconciliation of motor fuels tax collections by jurisdiction. Brief NVTC’s MAC group regularly on processes, issues, and solutions.
4. Serve as the central point of contact for Northern Virginia transit system financial
information. Identify and obtain funding for new transit projects that are recommended by NVTC’s jurisdictions.

7
3. COORDINATE TRANSIT SERVICE Goal: Work with all public and private transit providers to coordinate all transit
service within Northern Virginia, with emphasis on understandable fares, convenient schedules, proper information, good customer service, efficient performance and access by disabled persons. Help to clarify roles of respective agencies and governments to avoid overlaps or gaps in jurisdiction. Work to improve the safe and orderly movement of people and goods, primarily by encouraging greater use of integrated public transit and ridesharing systems. Involve the public in identifying problems and solutions. Use NVTC's Management Advisory Committee as a forum to work out cooperative solutions and keep local governments fully informed. Emphasize better bicycle and pedestrian access to transit facilities and services.
Actions: 1. Work with local governments to coordinate collection and dissemination of
performance data for FTA's National Transit Database reports. Collect performance data and maintain a shared database that uses NTD and other sources. Encourage transit systems to use the data to improve efficiency. Publish the data on NVTC’s website. Help Northern Virginia’s transit systems comply with DRPT’s performance data requirements. Ensure that the data are consistent, timely and accurate.
2. Manage consultants to continue NTD data collection for all of Northern Virginia’s transit systems and oversee collective funding of this work that brings at least $6 million annually of federal revenues to this region.
3. Assist WMATA and Northern Virginia’s transit systems in utilizing SmarTrip
fareboxes and implementing efficient regional fare collection databases and parts inventories. Work with NVTC’s transit systems to continue to debug Nextfare 5 software and implement SmarTrip passes and Autoload. Serve on WMATA selection committees to identify potential bank card-based fare collection systems.
4. Continue an ongoing project to provide free electronic transit schedules to
persons using personal digital assistants and pocket computers. Ensure that transit schedules are kept current, work to expand to the entire metropolitan region and report regularly on performance. Develop an annual operational and promotional budget for funding by the local jurisdictions and manage the agreed upon marketing campaign, including interior bus and bus shelter display ads and website promotions.

8
5. Support regional pedestrian safety initiatives and encourage bicycle and
pedestrian use. Publicize and seek to expand "bike on rail and bus" opportunities. Encourage all agencies to incorporate bike and pedestrian access at major transit centers and transfer locations. Assist VDOT in ensuring that the recommendations from its Northern Virginia Regional Bikeway and Trail Network study that focus on connections to transit are implemented. Support initiatives of such groups as the National Center for Bicycling and Walking and its Walkable Communities Workshops.
6. Serve on regional task forces examining options for improved transit, such as
WMATA’s Regional Mobility Panel and the Pike Transit initiative.
7. Help transit systems implement coordinated transit services to reduce the traffic impacts of the new BRAC installations due to open in 2011.

9
4. MANAGE GRANTS, CONTRACTS AND TRUST FUNDS Goal: Facilitate the fair and equitable allocation of costs among governments,
persons using transportation services and facilities and others who benefit. Manage grants fairly and effectively, according to state and federal laws and NVTC's policies. Invest trust fund assets prudently to maximize returns consistent with safety.
Actions: 1. Use NVTC's subsidy allocation model to incorporate the most recent WMATA and
local budget information on transit costs, revenues and subsidies. Using NVTC's adopted allocation formula, determine each local government's share of NVTC assistance. Use their percentages to apportion shares of local contributions to NVTC's administrative budget. Maintain detailed spreadsheets to calculate NVTC's formula. Provide early estimates each year to assist local governments in budget planning.
2. Prepare and submit NVTC and VRE state grant applications (approximately $250
million) due on February 1, 2011, using DRPT’s automated OLGA system. 3. Manage state grants to prepare proper billings and obtain timely
reimbursements. Participate with VRE and NVTC jurisdictions in quarterly project status review meetings. Work with grantor agencies and grantees to achieve the maximum feasible flexibility in using the funds in order to meet expiration deadlines with no loss of funds.
4. Manage jurisdiction trust funds (average over $100 million). Prepare timely and
accurate quarterly cash flow forecasts of transit assistance sources and uses for NVTC’s local jurisdictions (average about $150 million annually). Assist local jurisdictions in spending promptly the proceeds of state bond issues.
5. Prepare financial reports for NVTC's annual audit. Manage a multi-year audit
services contract. Accomplish an unqualified auditors' opinion and provide to the appropriate regulatory agencies. Anticipate concerns of outside auditors and work to alleviate in advance any such concerns. Develop and implement appropriate responses to any concerns of auditors contained in management letters.
6. Respond to DRPT’s new audit initiatives and grant policies and work with
NVTC’s jurisdictions to fine-tune the new procedures, if necessary, so they work to the advantage of all parties. Encourage DRPT to provide timely opportunities to comment on Master Agreement amendments and other policy changes.

10
8. Maintain up-to-date compilations of state and federal grant regulations. Ensure staff is adequately trained in grant and project management and alerted to any changes in regulations. Maintain current procurement documents to facilitate prompt release of authorized requests for proposals and invitations for bids. Obtain agreements with sub-recipients to ensure compliance. Submit annual certifications and maintain access to TEAM to ensure continued eligibility for FTA grants.
9. Manage federal funds on behalf of Alexandria for demonstrations of new bus
technologies. Procure consulting assistance and manage projects for the city, including a real-time bus arrival information system. Work to integrate this system with WMATA’s regional database and/or the Regionally Integrated Transportation Information System (RITIS). Currently NVTC is managing $737,000 of projects for the city.
10. As requested, work with Alexandria and Arlington to apply for federal funds for
BRT service improvements in the Crystal City/Potomac Yard corridor, for subsequent citywide transit improvements in Alexandria, and for access improvements in Rosslyn. Work with Fairfax County to obtain federal grant funding for Metrobuses. Work with Falls Church to obtain federal grants for an intermodal transit center and if asked, a transit study of Route 7. Currently NVTC has obtained and is billing federal grants for about $11 million of jurisdictional projects and expects to execute another $1.3 million in the first half of 2011. *
11. Manage NVTA’s grants for the regional transportation plan update
(TransAction 2040) with an anticipated contract value of $500,000. 12. If asked by participating jurisdictions, serve as project manager for regional
streetcar/light rail projects and assist jurisdictions in considering new and expanded projects (e.g. Route 7 transit alternatives with federal earmarks, Pike Transit Initiative).
13. Provide accounting services to NVTA without charge and manage any required NVTA audits. Also maintain financial records, obtain any needed insurance and notify regulatory agencies.
_______________ *Items in bold are new for 2011.

11
5. PROVIDE OVERSIGHT FOR WMATA AND VRE Goal: Exercise leadership on issues pertaining to oversight of the WMATA and
VRE systems, particularly budget and finance, to reduce costs and control the growth of local subsidies and fares while improving service quality. Effectively manage ongoing transit services for which NVTC is responsible and develop efficient management structures that facilitate regional cooperation and support.
Actions: 1. In January, appoint Virginia's two principal and two alternate members of the
WMATA Board of Directors. Provide staff support to WMATA Board members. As needed, facilitate caucuses of Virginia's Board members and their staffs to develop consensus positions prior to committee and board meetings. Keep NVTC commissioners informed of pending WMATA Board decisions of regional significance. Invite WMATA’S General Manager periodically to brief the entire NVTC Board on important issues.
2. Monitor the development of WMATA’s budget. Provide recommendations to
local jurisdictions and the WMATA Board, as appropriate. Co-sponsor public forums with WMATA.
3. Participate actively on WMATA’s Jurisdictional Coordinating Committee. 4. Facilitate discussion with DRPT on WMATA governance, funding and
safety.
5. Assist Loudoun County as it transitions to full participation in WMATA upon completion of the Dulles Rail project.
6. As co-owner of VRE (with assets of $333.3 million, outstanding debt issued by
NVTC of $29.5 million and annual operating/capital budgets of over $60 million) appoint NVTC's principal and alternate members of the VRE Operations Board, maintain close communications with PRTC and VRE staff, coordinate presentation of action items to the VRE Board and commissions, and monitor ongoing operations for consistency with the Master Agreement and approved budgets, customer service quality and NVTC jurisdictions' interests.
7. Support the VRE team as it negotiates with DRPT, CSXT, Norfolk Southern,
Amtrak and Keolis to agree on multi-year access and operations contracts and to clarify and accomplish rail service priorities in the Richmond-Washington, DC corridor.
8. Support annual VRE customer service surveys each spring and ridership surveys
each October, by providing zip code verification and on-board volunteers.

12
6. COORDINATE REGIONAL EFFORTS Goal: Support coordinated regional efforts to improve air quality, conserve
energy, boost the economy, respond to emergencies and integrate land use and transportation. Pursue new transit opportunities and actively support telework.
Actions: 1. Help direct a cooperative regional consulting study to design a new Vanpool
Incentive Program to increase vanpooling and qualify the region for significantly increased federal transit formula assistance. Work to obtain funding to implement the program when the design is approved.
2. Work to establish NVTC as the chief advocate of Intelligent Transportation
Systems (ITS) investments for transit, by conducting low-cost demonstrations, evaluating the results, and more actively encouraging all of NVTC’s transit providers to adopt similar (interoperable) technologies. Examples include: web-based automated bus stop information signs; on-board bus stop enunciators; passenger counters; automated maintenance devices; variable pricing of roads and parking; parking capacity electronic message signs; and alternative fuel technologies. Promote joint procurements for uniformity and cost saving and develop effective contract language to encourage non-proprietary technology. Help educate board members and the public. Work with VTA and ITSVA to provide forums for transit technology professionals, serve on the board of directors of ITSVA, and work to broaden RITIS to include real-time transit performance data from all of NVTC’s transit systems. Develop a “virtual machine” for buses to consolidate several separate on-board computer systems and save money.
3. Develop information from research on Metropolitan Washington and other
regions to help NVTA, WMATA and other transit organizations define lower-cost strategies for meeting congestion challenges in the short term using such mechanisms as exclusive transit lanes, bus rapid transit, priority lanes, queue jumping, jitneys, route-deviation transit, vanpools and real-time information devices. Publicize the results and work to achieve public acceptance. Work with the local jurisdictions to initiate appropriate demonstrations of these mechanisms.
4. Participate on technical committees assisting in planning, preliminary engineering and environmental analysis for transit in the Dulles Corridor and other locations such as the Capital Beltway and I-95/395 as requested by WMATA, VDOT, DRPT and/or local jurisdictions.

13
5. From various published forecasts, plans and corridor studies, assemble mode split and other data to provide a convenient source of comprehensive transit market performance data. Use the data to encourage efficient transit management, expanded transit ridership and greater public awareness. Use statistically significant traffic counts by MWCOG/TPB of persons traveling in Northern Virginia’s major corridors. Make this information available in user-friendly formats on NVTC’s website.
6. Actively promote telework initiatives and encourage the commonwealth to take
the lead with its own employees and the private sector. 7. Examine public-private HOT lane proposals for the Beltway, I-95 and elsewhere
and work to ensure adequate transit access and the use of toll revenues to help support transit operations. Actively participate on DRPT Transit Advisory Committees to articulate transit concerns and resolve any issues. Take the lead in assertively presenting a coordinated transit plan that protects the interests of transit systems and their customers.
8. Assist Transportation Management Associations and Transportation Demand Management agencies (ridesharing, telework). Serve on boards of directors and competitive selection panels as requested.
9. Coordinate security measures impacting Northern Virginia’s transit providers, including monitoring the Pentagon’s progress in implementing its security plans.
10. Assist WMATA in negotiating a new Memorandum of Understanding for transit access with the Pentagon, by identifying important issues for all the transit systems using that facility and helping to explain concerns to Pentagon staff.
11. Examine opportunities to cooperate with Governor McDonnell’s “Going Green with Virginia Transportation” initiative, including recognition of NVTC’s new offices in the LEED certified Navy League Building.

14
7. DELIVER PUBLIC INFORMATION, MARKETING AND CUSTOMER SERVICE Goal: Reach out to transit customers and the general public, listen to customer
concerns and implement improvements to boost regional transit ridership. Actions:
1. Serve as the central point of contact for the news media, interest groups and the general public for transit issues in Northern Virginia, making referrals to other transit agencies and local governments when appropriate. Initiate contacts with media representatives via calls and visits. Provide NVTC’s reports, analyses and policies with easy to understand explanations of their content and significance. Help transit systems and elected officials prepare to respond effectively to media and other public inquiries during emergencies and at other times by sponsoring seminars on best practices. Establish media opportunities for NVTC board members to promote NVTC’s mission.
2. Assist NVTA’s public outreach mission, actively maintain NVTA’s “virtual office”
and website, and lead public outreach for NVTA’s regional transportation plan update (TransAction 2040).
3. Provide the following resources to the public, primarily on NVTC’s website,
utilizing enhanced graphics:
a. Maintain and improve NVTC’s website, to focus on informing the public about opportunities to be involved in regional transit and ridesharing planning;
b. Distribute NVTC's brochure, reports and agendas to encourage more public
involvement, again emphasizing easy-to-use web-based applications; c. Publish electronically an annual NVTC Handbook to provide a detailed
description of the commission's history, mission and accomplishments, including the commission's workprogram, policies and by-laws;
d. Link to other regional transit databases to provide information about regional
transit services to better inform the public; e. Maintain a transit system performance database; f. Monitor NVTC and NVTA website performance with monthly and quarterly
compilations of user statistics. 4. Survey WMATA, VRE and local jurisdictions to compile innovative marketing
activities, host coordination meetings, facilitate transit topics for the Marketing and Outreach Specialists Consortium and the Northern Virginia Public Information Officers and report at least annually to the commission and jurisdictions. Assist APTA in local marketing and public information activities. Help plan VTA conferences.

15
5. Continue technical support for transit stores and Transportation Management
Associations (e.g., serve on Boards of Directors and consultant selection committees). Assist with logo design, marketing, consultant selection, performance evaluation, fare collection, web design and customer service issues. Compile and post on NVTC’s website a list of transit stores and TMA’s in the region.
6. Look for opportunities to partner in order to stage events and promotions that will
emphasize the effectiveness of transit and ridesharing and the need for additional transit funding (e.g. Greater Washington Board of Trade, Google.) Reach out to “electronic hitchhiking” firms (e.g. NuRide) and car-sharing organizations (e.g. Zip Car) for joint promotion opportunities.
7. Implement NVTC’s federal Title VI program with active outreach to immigrants,
simplified messages and NVTC/NVTA website accommodations.
8. Coordinate meetings with visiting delegations of transit system board members and other elected officials to describe this region’s success with transit coordination, transit-oriented development and innovative transit finance.

NVTC 2011 WORK PROGRAM
List of Products/Projects
Goal # Products/Projects
1. Policy and Advocacy -Annual state and federal legislative agenda. -Annual Virginia Transit Association legislative agenda. -Provide subscription legislative tracking service to NVTC/PRTC jurisdictions/agencies. -CTB pre-allocation testimony.
2. Funding -Maintain PowerPoint presentations on the “Case for Increased Funding of Public Transit in Northern Virginia,” “How Transit is Organized in Northern Virginia,” and the “VRE Chronology.” -Reports to MAC and NVTC on reconciliation of Department of Taxation’s motor fuel tax collections ($35 million annually.)
3. Coordination -Manage consultants and auditors for collection and filing of National Transit Database reports (yields at least $6 million for WMATA annually). -Manage and promote regional e-schedule project.
4. Grants/Contracts/Trust Funds -Maintain and update NVTC’s subsidy allocation model (up to $150 million distributed annually). -Apply on behalf of NVTC jurisdictions, WMATA and VRE for state grants (eligibility of up to $250 million). -Manage jurisdiction trust fund accounts (average over $100 million). -Prepare financial statements for fiscal year independent audits of NVTC and NVTA.

2
-Manage NVTA’s transportation plan update grants (TransAction 2040 Update @ $500,000). -Maintain proper federal certifications and sub-recipient agreements. -Manage Alexandria’s federal grant-funded city wide bus technology project and grant funds ($737,000). -Manage federal grant funds for NVTC’s jurisdictions totaling $11 million. -Execute another $1.3 million in federal grants in the first half of 2011.
5. WMATA and VRE -Appoint WMATA and VRE Board members. -Co-own (with PRTC) VRE assets of $333.3 million. -Co-sponsor public forums to examine WMATA’s budgets.
6. Coordinate Regional Efforts -Maintain transit performance on-line database. -Help direct a cooperative regional consulting study to design a Vanpool Incentive Program to promote more vanpools and significantly increase earnings from federal formula assistance.
7. Public Outreach -Maintain, improve and promote NVTC’s website as the primary source of transit performance data for the region. -Direct public outreach for NVTA’s regional transportation plan update (TransAction 2040).

1
NVTC’S 2010 ACCOMPLISHMENTS AND 2011 GOALS, OBJECTIVES, WORK
PROGRAM AND MEETING SCHEDULE
1
NVTC MISSION
To serve the public by providing a forum for elected p y p gofficials to achieve an effective regional transportation network. Focusing primarily on transit, NVTC will develop strategies, identify funding sources, advocate for additional funding, prioritize allocations, oversee transit systems such as VRE and WMATA, measure and report transit performance and pursue new transit programs. p p p gNVTC will work to improve mobility, reduce traffic congestion, protect the environment and stimulate the regional economy by increasing transit and ridesharing use.
2

2
1. Develop policy and advocate favorable legislation: Increase transit ridership, obtain adequate funding and coordinate priorities.
GOALS AND OBJECTIVES
2. Seek and advocate funding: Stable and reliable transit funding from federal, state and private sources.
3. Coordinate transit service: Understandable fares, convenient schedules, good customer service, efficient performance.
4. Manage grants, contracts and trust funds: Allocate costs equitably, ensure compliance and invert safely and effectively.
5. Provide oversight for WMATA and VRE: Reduce costs and control local subsidy growth, improve service quality, facilitate regional cooperation.
6. Support coordinated regional efforts: Improve air quality, conserve energy, integrate land use and transportation, promote telework.
7. Deliver public information, marketing and customer service: Inform transit customers, taxpayers, elected officials and the media, identify NVTC as the primary “data agency” for transit in Northern Virginia.
3
2010 MAJOR ACCOMPLISHMENTS
Legislative Advocacy:g y
Prepared VTA and NVTC legislative agendas. Explained NVTC’s positions to legislators, legislative committees and staffs.
New Funding:
New federal grants obtained for NVTC’s jurisdictions totaling about $3.5 million.
Reconciled gas tax collections totaling $35 million.
4

3
2010 MAJOR ACCOMPLISHMENTS
Coordinate Transit Service:
Conducted an extensive transit tour for 18 General Assembly members and ysenior executive branch staff.
Increased annual NTD federal formula assistance from FTA by $1 million due to facilitating NVTC local transit systems’ filings of performance data.
Manage Grants/Contracts/Trust Funds:
Achieved flawless audit for NVTC and NVTA.
Responded to DRPT compliance review.
Managed trust fund assets of $65 million per financial management employee at an administrative cost of less than $0.003 per $1 of assets.
Oversight of WMATA and VRE:
Developed a process and schedule for discussions with DRPT on WMATA governance, funding and safety.
5
2010 MAJOR ACCOMPLISHMENTS
Regional Coordination:Completed screenline mode share study outside the Beltway in the Dulles
id d bli i d ltcorridor and publicized results.
Initiated a multi-regional effort to develop a Vanpool Incentive Program, organized a technical committee, drafted scope of work for design and identified funds for the design study.
Coordinated security measures impacting Northern Virginia’s transit providers at the Pentagon Transit Center and established improved lines of communication.
Public Information:Public Information:Continued to serve as Public Information office for NVTA and maintain NVTA website and its “virtual office.”
Received 3.7 million requests for e-schedules in 2010, up 23% since 2007.
Prepared media releases and alerts, set up over 25 TV and radio interviews, and worked with reporters on over 100 articles on transit issues.
6

4
2011 MEETING SCHEDULE
• First Thursday of each month (except February and August).
• No meeting in August.
• February 3rd meeting in Richmond on Local Government Day at 5:30 p.m. in General Assembly Building jointly with NVTA.
7
2011 WORK PROGRAM
Proposed FY 2012 Administrative Budget:
$1.2 million (reduced from FY 2011)
Includes $291,315 local contributions (down 6% since FY 2002)
Eight employees (six full-time)
Work program activities:
50 specific actions for 2011 organized by goal.
8

5
MAJOR ACTIVITIES FOR 2011
Legislative Advocacy:
Annual state and federal NVTC legislative agenda.
Annual VTA legislative agenda.
CTB pre-allocation testimony.
Funding:
M i t i d ti l P P i t t ti “H T it i
9
Maintain educational PowerPoint presentations on “How Transit is Organized in Northern Virginia” and “The Case for Increased Funding of Public Transportation in Northern Virginia.”
MAJOR ACTIVITIES FOR 2011
Coordinate Transit Service:
Manage consultants and auditors for collection of data and submission of NTD reports yielding $6 million annually for WMATA over and above NVTC’s costs.
Grants/Contracts/Trust Funds:
Maintain NVTC subsidy allocation model (up to $150 million distributed annually.)
10
Apply for up to $250 million of state assistance annually.
Manage jurisdiction trust fund accounts with balances averaging over $100 million.
Manage almost $12 million of federal grants for local jurisdictional projects. Execute $1.3 million in new federal grants.

6
MAJOR ACTIVITIES FOR 2011
WMATA and VRE:
Appoint board membersAppoint board members.
Co-own VRE assets of $333.3 million.
Protect NVTC’s jurisdictions’ interests as new members of VRE and service expansion are considered.
Facilitate discussion with DRPT on WMATA governance, funding and safety to result in an consensus recommendation.
11
Coordinated Regional Efforts:
Maintain NVTC’s transit performance database on-line and work continuously with DRPT and transit providers to verify accuracy and publicize results.
Coordinate transit studies in major corridors and publicize results.
MAJOR ACTIVITIES FOR 2011
Public Outreach:
Maintain, improve and promote NVTC’s website as the primary source of transit information in the region.
Maintain e-schedules for transit customers using NVTC’s consultants.
12

AGENDA ITEM #6 TO: Chairman Hudgins and NVTC Commissioners FROM: Rick Taube DATE: November 24, 2010 SUBJECT: Comments on Proposed Revisions to National Transit Database Reporting The Federal Transit Administration has requested comments by December 6, 2010 on proposed revisions to its National Transit Database reporting. NTD reports are used to allocate federal formula assistance. In FY 2010, WMATA, VRE, PRTC and FRED (Fredericksburg Transit) combined are receiving almost $260 million from these federal formula funds. NVTC and jurisdiction staff are particularly concerned about one of the proposed changes. As explained in the attached draft letter, diverting to rural areas the miles traveled by public transit vehicles in areas outside Urbanized Areas (UZA’s) will result in significant loss of funds to our region (the exact amount of the potential loss is unknown). The impact on VRE is likely to be particularly significant. The commission is asked to authorize Chairman Hudgins to send the attached letter containing NVTC’s comments.

4350 N. Fairfax Drive Suite 720 Arlington, Virginia 22203 Tel (703) 524-3322 Fax (703) 524-1756 TDD (800) 828-1120
Email [email protected] Website www.thinkoutsidethecar.org
DRAFT: Dec. 2, 2010
Docket Management Facility U.S. Dept. of Transportation 1200 New Jersey Ave., SE West Building, Ground Floor, Room W12-140 Washington, DC 20590-0001
Re: Docket Number FTA-2010-0027 Dear Docket Manager: At its board meeting of December 2, 2010, the Northern Virginia Transportation Commission authorized me to submit the following comments in response to the public notice published in the Federal Register Volume 75, Number 192, page 61553ff. Proposed Changes in the 2011 National Transit Database (NTD) Annual Manual Section 1: Eligibility of Vanpools for the NTD, page 61533 The Northern Virginia Transportation Commission (NVTC) strongly agrees with the proposal to permit qualifying private vanpools to report statistics to the National Transit Database (NTD). Privately operated vanpools that provide public transportation services are common in the Washington, DC metropolitan region. NVTC requests that FTA clarify whether reporting of vanpool operating costs is optional or mandatory. In the vanpool section of the NPRM describing vanpool eligibility requirements, FTA’s fourth requirement describes the need for a record-keeping system to collect and report fully allocated operating costs. However, in the next paragraph, FTA has proposed the following: “Reporting fully allocated operating costs means that vanpools can (emphasis added) report on the total cost of the service….” The word “can” introduces uncertainty. Whether or not FTA intends such reporting of vanpool costs to be mandatory, the instructions should be clear, consistent and apply equally to all.
Chairman Hon. Catherine Hudgins Vice Chairman Hon. William D. Euille Secretary/Treasurer Hon. Mary Hynes Commissioners: City of Alexandria Hon. William D. Euille Hon. Paul Smedberg Arlington County Hon. Mary Hynes Hon. Jay Fisette Hon. Christopher Zimmerman Fairfax County Hon. Sharon Bulova Hon. John Cook Hon. John Foust Hon. Catherine M. Hudgins Hon. Jeffrey McKay City of Fairfax Hon. Jeffrey C. Greenfield City of Falls Church Hon. Daniel Maller Loudoun County Hon. Kelly Burk Virginia Department of Rail and Public Transportation Hon. Thelma Drake Virginia General Assembly Sen. Mark Herring Sen. Mary Margaret Whipple Del. Barbara Comstock Del. Adam P. Ebbin Del. Joe T. May Del. Thomas D. Rust Executive Director Richard K. Taube

2
Section 6: Revision of Rules for Urbanized Area Allocations, page 61555 FTA proposes changes to the FFA-10 (Federal Funding Allocation Form): “[Transit] service that connects a small UZA or a rural area to a large UZA cannot be allocated entirely to the large UZA. An area is considered served by transit service if passengers can board or alight the transit service there.” FTA lists three reasons for this rule change: 1) FTA wishes to provide a more accurate representation of the distribution of transit service among various UZAs and rural areas to its data users; 2) the current policy does not properly allocate transit service data to small UZAs for use in calculating the apportionment of funds under the Small Transit Intensive Cities (STIC) Program; 3) transit researchers and policymakers have expressed concern to FTA that the current policy understates the level of transit service in rural areas. NVTC requests that FTA not change the NTD reporting rules for urbanized area allocations on the FFA-10 Federal Funding Allocation Form. FTA’s proposed rule change will arbitrarily decrease federal apportionments to UZAs for transit service provided outside the UZA boundaries. The UZA boundaries themselves are artificial, unrelated to the provision of transit services, and do not reflect the true extent of transit service within the region. Patterns of trip-making, based on a preponderance of usage, should govern the distribution of formula revenues, not the origins of trips or rigid geographic boundaries. In our region, distant public transit trips are destined for the core of the region. That core should be credited with the miles (as is currently the case) and with the resulting formula revenues. Just because suburban transit service traverses rural areas and permits boardings and alightings in those rural areas does not mean that any transit customers actually do so. With the proposed change, designated recipients of FTA 5307 urbanized federal formula funds will not be able to report revenue miles and passenger miles statistics on the FFA-10 Federal Funding Allocation Form for transit service provided in non-UZA areas and small UZA areas when passengers can board or alight there. This change will affect the federal funding allocations attributable to commuter bus services, commuter rail services and vanpools that typically operate between non-urbanized areas and large UZAs. Because NTD transit service data are not used to apportion federal formula funds in rural areas, any transit service data that are reported as serving a rural area will be “lost” to any current recipient of federal formula funds. NVTC appreciates FTA’s desire to provide a more accurate representation of transit service data in small UZAs and in rural areas. However, the Federal Funding Allocation Form FFA-10 is not the proper form to collect this information, as the FFA-10 form is primarily used to apportion federal funds. The Service Module Form S-10 should be altered to capture actual transit service data allocated between each UZA and in rural areas in aggregate, and changes to this form would not alter the federal

3
formula funding apportionments to UZAs. Data from an improved Form S-10 could also be used to more accurately allocate transit service data for use in apportioning federal funds from the Small Transit Intensive Cities (STIC) Program. Thank you for the opportunity to submit these comments. Sincerely, Catherine M. Hudgins Chairman, Northern Virginia Transportation Commission

4

AGENDA ITEM #7 TO: Chairman Hudgins and NVTC Commissioners FROM: Rick Taube DATE: November 24, 2010 SUBJECT: WMATA Items A report from WMATA’s General Manager is provided for your information, together with a vital signs report on Metrobus performance and a safety report.
At its last meeting, the commission adopted a process and schedule for discussions with the Commonwealth on WMATA governance, funding and safety. The first meeting occurred on November 23rd. Participants will describe the meeting and next steps.
On November 17th the Board of Trade and MWCOG released its report on
WMATA governance: Moving Metro Forward. A copy is attached for discussion. Also attached is a copy of the draft report of WMATA’s Riders’ Advisory Council:
Report on Governance of the Washington Metropolitan Area Transit Authority.


Moving Metro Forward: Report of the Joint WMATA Governance Review Task Force
1

THIS PAGE INTENTIONALLY LEFT BLANK

Moving Metro Forward: Report of the Joint WMATA Governance Review Task Force
i
JOINT WMATA GOVERNANCE REVIEW TASK FORCE
Hon. James Dyke Partner McGuireWoods LLP Chairman, Board of Trade
Hon. Kwame R. Brown Councilmember District of Columbia Chairman, COG Board of Directors
Ron Carlee Director, Domestic Strategic Initiatives International City/County Management Association Former County Manager, Arlington County
Michael Daniels Former Chairman and CEO, Network Solutions
Hon. Penelope A. Gross Vice Chair, Board of Supervisors Fairfax County Former Chairman, COG Board of Directors
Hon. Andrea C. Harrison Council Vice Chair Prince George’s County Vice Chairman, COG Board of Directors
JayEtta Hecker Director of Transportation Advocacy Bipartisan Policy Center Former Director of Physical Infrastructure, U.S. Government Accountability Office
Hon. Betty Ann Kane Former Councilmember, District of Columbia
Hon. John Mason Former Mayor, City of Fairfax
Patricia A. McGuire President Trinity Washington University
Peter T. Metzger Vice Chairman CTPartners
Hon. Connie Morella Ambassador in Residence American University School of Public Affairs Former U.S. Representative, MD-08
Anthony T. Pierce Partner in Charge – Washington Office Akin Gump Strauss Hauler & Feld LLLP
Bruce Romer Vice President, Administration Westat, Inc. Former Chief Administrative Officer, Montgomery County
Emanuel Rouvelas Partner K&L Gates
Hon. Peter Shapiro Executive Director Chesapeake Center for Public Leadership Former Councilmember, Prince George’s County
Stuart L. Solomon Managing Director Metro Washington Office Accenture
Hon. Anthony Williams Executive Director Corporate Executive Board Former Mayor, District of Columbia
Joint WMATA Governance Review Executives
James C. Dinegar, President and CEO, Greater Washington Board of Trade David J. Robertson, Executive Director, Metropolitan Washington Council of Governments

Moving Metro Forward: Report of the Joint WMATA Governance Review Task Force ii
TABLE OF CONTENTS Joint WMATA Governance Review Task Force ........................................................................ i
Executive Summary ...................................................................................................................... 1
Section 1: Introduction ................................................................................................................ 5
1a. Issue Statement .................................................................................................. 5
1b. Mission of the Task Force ................................................................................. 6
1c. Input from Regional Leaders, Stakeholders, and Other Individuals ................. 7
Section 2: The Current State of WMATA Governance ........................................................... 8
2a. WMATA’s Creation .......................................................................................... 8
2b. WMATA’s Governance Structure ..................................................................... 9
2c. WMATA’s Governance Challenges ................................................................ 13
Section 3: Relevant Experience from other Governance Models .......................................... 15
3a. Delineation of Responsibilities ........................................................................ 15
3b. Composition of the Board................................................................................ 17
3c. Role of the Chair.............................................................................................. 19
3d. Decision-Making ............................................................................................. 20
Section 4: Findings and Recommendations ............................................................................. 21
4a. Delineation of Responsibilities ........................................................................ 21
4b. Composition of the Board................................................................................ 23
4c. Role of the Chair.............................................................................................. 26
4d. Decision-Making ............................................................................................. 28
Section 5: Conclusion ................................................................................................................. 30
Acronyms and Abbreviations .................................................................................................... 31
Appendix: Task Force Resources ............................................................................................. 32
Acknowledgements
Staff/Research Leader: Ronald F. Kirby, Transportation Planning Director, Metropolitan Washington Council of Governments
Researchers/Writers: Gareth James, Metropolitan Washington Council of Governments Steven Kania, Metropolitan Washington Council of Governments Staff Support: Steve Brockelman, Accenture
William Englehaupt, Accenture Robert Grow, Greater Washington Board of Trade Kyle White, Greater Washington Board of Trade

Moving Metro Forward: Report of the Joint WMATA Governance Review Task Force 1
Executive Summary growing number of area leaders and industry experts believe that significant shortcomings in the Washington Metropolitan Area Transit Authority’s (WMATA) governance structure have contributed to a serious decline in Metro’s performance, as evidenced by fatal accidents, escalator and elevator outages, and unsatisfactory
service reliability. Declining public confidence in the ability of the Metro system to meet the region’s needs has become a major concern for regional leaders in both the public and private sectors.
In June 2010, the Greater Washington Board of Trade (BOT) and the Metropolitan Washington Council of Governments (COG) created a task force of 18 current and former elected officials, government managers, and business leaders to review the effectiveness of current governance arrangements for WMATA. The Joint WMATA Governance Review Task Force met 16 times between June and October and received input from 47 officials, stakeholders, and experts, including current and former WMATA Board members and General Managers. It also received public comment, reviewed scholarly articles and studies, and examined governance arrangements for WMATA and other transit and multi-state public sector organizations.
The current WMATA governance structure is based on the Interstate Compact signed in 1966 by the Governors of Maryland and Virginia and the Commissioners of the District of Columbia, which led to the formation of WMATA in 1967. The Compact has been amended seven times, most recently in 2009 when federal members were added to the WMATA Board to comply with a new federal-regional dedicated funding agreement.
A full examination of WMATA’s governance must consider the following key entities.
Signatories – There are three Signatories to the Compact: the State of Maryland, the Commonwealth of Virginia, and the District of Columbia. They may amend the Compact with the consent of Congress.
Appointing Authorities – There are four Appointing Authorities defined in the Compact: for Maryland, the Washington Suburban Transit Commission (WSTC); for Virginia, the Northern Virginia Transportation Commission (NVTC); for the District of Columbia, the Council of the District of Columbia; and for the federal government, the General Services Administration (GSA). Each authority independently appoints two primary members and two alternate members to the WMATA Board.
A

Moving Metro Forward: Report of the Joint WMATA Governance Review Task Force 2
Board of Directors – The Compact states that the Board is responsible for adopting a capital budget and a current expense budget, defining the service performed and the rates and fares charged, and appointing the General Manager and other officers of WMATA.
General Manager – The Compact states that the General Manager shall be the chief administrative officer of WMATA and, subject to policy direction by the Board, shall be responsible for all activities of WMATA.
Tri-State Oversight Committee (TOC) – The TOC was created by the Signatories in 1997 to provide safety oversight of rail systems not already regulated by the Federal Railroad Administration. The Signatories each appoint two representatives to the TOC.
The Task Force finds that what may have been an appropriate governance structure for WMATA to build a new transit system in the 1960s is not appropriate to operate today’s mature system. Responsibilities are not clearly delineated among WMATA’s governing entities. Board members are not selected in a coordinated process to ensure they collectively possess the right balance of attributes. The role of the Chair is not structured to provide strong leadership to the Board. The threat of using the veto and an unstable committee structure do not encourage effective decision-making. The current governance structure does not promote accountability or regional cohesion and, in a number of critical areas of governance, WMATA is out of step with the best practices employed by other leading transit authorities. Fundamental changes must be made for Metro to meet the region’s needs.
To help restore Metro’s high-performing, world-class reputation, the Task Force urges the enactment of the following recommendations. The central, overarching recommendation is that the Signatories and Appointing Authorities defined in the WMATA Compact should come together to form a WMATA Governance Commission to make necessary improvements to the authority’s governance structure and hold the Board of Directors accountable for its performance. The Commission should include seven members:
Maryland Governor Virginia Governor District of Columbia Mayor Washington Suburban Transit Commission Chair Northern Virginia Transportation Commission Chair District of Columbia Council Chair General Services Administration Administrator

Moving Metro Forward: Report of the Joint WMATA Governance Review Task Force 3
The Task Force recommends that the WMATA Governance Commission take the following actions in the immediate future, working within the terms of the Compact:
Clearly define the Board’s responsibilities and set a uniform role description for Board members
Clearly define the Chair’s responsibilities and role description Agree to and implement a coordinated process for appointing a WMATA Board with the
right balance of attributes to serve Metro and the region Introduce staggered, 4-year terms, including a maximum of one renewal, for all Board
members Develop a uniform compensation policy for all Board members to address inconsistencies in
the current arrangements
The Task Force recommends that the WMATA Board take the following actions in the immediate future to improve the functionality of the Board and its relationship with the General Manager and WMATA staff:
Define the General Manager as WMATA’s Chief Executive Officer and give him or her clear authority and autonomy to oversee day-to-day management of WMATA
Restore the role of alternate members to that stated in the Compact, which provides for their participation only when primary members are absent
End the custom of annual rotation of the Chairmanship and select a regionally-focused Chair from among its membership
Increase the term of the Chair from one to two years Adopt a policy to limit use of the veto to matters relating to the budget or to system
expansion Adopt a policy that all changes in committees and procedures require a majority vote of the
Board and establish a formal committee structure with committees on governance, safety, and customer relations at a minimum
Develop an orientation process and other leadership activities for Board members

Moving Metro Forward: Report of the Joint WMATA Governance Review Task Force 4
The Task Force recommends that the Signatories to the WMATA Compact initiate action to make the following changes to the Compact:
Give the Appointing Authorities greater flexibility to select the most qualified Board members, whether they be elected or non-elected
Eliminate the role of alternates and increase the number of primary members from two to three for each Appointing Authority, resulting in a 12-member Board, with one member appointed by the Chief Executive of each Signatory
Enable the WMATA Governance Commission to appoint a Chair from outside the Board’s membership, agree on the compensation for the Chair, and increase the length of the Chair’s term to four years
Determine the appropriate role for the veto in WMATA’s decision-making process, and give serious consideration to eliminating it entirely
The multi-state agreement that created WMATA and helped build a world-class transit system endures as a visionary example of regional leadership. In that spirit, the Task Force calls on today’s leaders to demonstrate the same level of regional cooperation and commitment to improve WMATA’s governance and ensure Metro’s success in the coming decades.

Moving Metro Forward: Report of the Joint WMATA Governance Review Task Force 5
Section 1: Introduction
1a. Issue Statement
nce considered a high-performing, world-class transit system, Metro has deteriorated in recent years, experiencing fatal accidents, management instability, overcrowded trains and buses, broken escalators, and unsatisfactory service reliability. A growing number of area leaders and industry experts believe the Washington Metropolitan
Area Transit Authority’s (WMATA) governance structure has significantly contributed to its current problems. There is concern that Metro’s troubling decline in performance will continue unless fundamental changes are made to improve governance, leadership, and accountability at WMATA.
Concern over WMATA’s governance is not new. In 1982, a study commissioned by the Greater Washington Research Center concluded that while the composition of the Board may have been appropriate to plan and construct Metrorail, “it is entirely unsuitable for overseeing the management of an operating transit system.”
Some assert a lack of dedicated funding is the sole source of WMATA’s problems. While dedicated funding for WMATA should be vigorously pursued, and regional leaders need to spearhead this effort, funding remains a serious challenge for most transit agencies, including those with dedicated funding. Given the economic downturn, transit agencies with dedicated funding tied to tax revenues are in difficult financial straits, yet they are not experiencing the same problems as WMATA.
In 2005, a panel sponsored by the Greater Washington Board of Trade (BOT), Metropolitan Washington Council of Governments (COG), and Federal City Council raised concerns about management effectiveness and accountability at WMATA. The panel, which helped secure a federal funding agreement for Metro, stressed that “progress in this regard will be critical in achieving public acceptance for new revenues.”
In a March 2010 report requested by WMATA, former General Manager (GM) David Gunn noted a “staggering loss” of talented staff members and poor morale, illustrated by an absentee rate of more than 7.5 percent compared with an industry average of about 4 percent. Currently, WMATA is searching for a new GM to lead the $2.2 billion-a-year agency of almost 11,000 employees. WMATA has had two GMs and two interim GMs in the past five years.
O

Moving Metro Forward: Report of the Joint WMATA Governance Review Task Force 6
In an April 2010 report, the Congressional Research Service (CRS) highlighted concerns that “the Board lacks the subject expertise and political independence” necessary to make the best decisions for WMATA. At a time when WMATA needs leadership, news accounts have revealed poor attendance by Board members. In addition, more than a year after a Compact change added four federal members to the Board, two seats remain vacant.
In a June 2010 report on the fatal Fort Totten accident, the National Transportation Safety Board (NTSB) noted “inadequate” and “ineffective” safety oversight by the WMATA Board and the Tri-State Oversight Committee. The accident was not an aberration. NTSB Chairman Deborah Hersman highlighted an “anemic safety culture" and "layers of safety deficiencies" and said “Metro was on a collision course long before this accident.” Derailments of in-service trains have increased in the last decade, and eight Metrorail employees have died in the past five years.
Even as the system’s performance has declined, the region’s stake in Metro has grown considerably. Metro provides 1.2 million daily transit trips, reduces traffic congestion, improves air quality, attracts businesses and concentrated development around its stations, strengthens government tax bases, serves large numbers of visitors to the nation’s capital, and fulfills a key role in homeland security evacuation plans.
In response to the growing concerns about WMATA’s governance and because the region’s future success is so closely tied to Metro’s performance, the Board of Trade and Council of Governments created a Joint WMATA Governance Review Task Force.
1b. Mission of the Task Force
In June 2010, the Task Force commenced its work with a mission to recommend improvements in the transit agency’s governance to ensure the highest performing and sustainable transportation system for the Washington metropolitan area. The Task Force is composed of 18 current and former elected officials, government managers, and business leaders. It met 16 times between June and October and received input from 47 officials, stakeholders, and experts, including current and former WMATA Board members and General Managers. The Task Force also received public comment in an initial meeting and on COG’s website, reviewed scholarly articles and studies, and examined governance arrangements for WMATA and other transit and multi-state public sector organizations.

Moving Metro Forward: Report of the Joint WMATA Governance Review Task Force 7
1c. Input from Regional Leaders, Stakeholders, and Other Individuals
The Task Force received input on WMATA and transit system governance from dozens of regional leaders, stakeholders, and other individuals. U.S. Congress Benjamin Cardin (MD) Christopher Dodd (CT) Barbara Mikulski (MD) Mark Warner (VA) Gerald Connolly (VA) Donna Edwards (MD) Dutch Ruppersberger (MD) Frank Wolf (VA) Tom Davis (VA)
WMATA Board Members Peter Benjamin Catherine Hudgins Neil Albert Mortimer Downey Elizabeth Hewlett Christopher Zimmerman Jim Graham Marcel Acosta William Euille Joe Alexander Katherine Hanley Emeka Moneme
State Transportation Secretaries/Directors Sean Connaughton (VA) Gabe Klein (DC) Beverly Swaim-Staley (MD) Pierce Homer (VA) John Porcari (MD, current USDOT deputy
director) David Winstead (MD)
WMATA General Managers Richard Sarles (Interim) John Catoe David Gunn Richard White
Industry Experts Gus Bauman, Of Counsel, Beveridge &
Diamond, PC Steve Bland, CEO, Port Authority of Allegheny
County Anthony Coscia, Chairman of the Board of
Commissioners, Port Authority of New York and New Jersey
Lynn Hampton, President and CEO, Metropolitan Washington Airports Authority
Deborah Hersman, Chairman, National Transportation Safety Board
Les Sterman, Former Executive Director, East-West Gateway Council of Governments (St. Louis)
Jim Wilding, Former President and CEO, Metropolitan Washington Airports Authority
Michael Wilson, Senior Executive, Public Transportation, North America, Accenture
Stakeholders Michael Brownell, Member, WMATA
Accessibility Advisory Committee Robert Chase, President, Northern Virginia
Transportation Alliance Francis DeBernardo, Chairman, WMATA
Riders Advisory Council Ben Ross, President, Action Committee for
Transit Stewart Schwartz, Executive Director,
Coalition for Smarter Growth Lateefah Williams, Policy and Legislative
Director, ATU‐Local 689
Academics Chris Higgins, Master of Public Policy and
Administration, McMaster University Richard Soberman, Former Chair of Civil
Engineering, University of Toronto
Italicized names indicate former position

Moving Metro Forward: Report of the Joint WMATA Governance Review Task Force 8
Section 2: The Current State of WMATA Governance
2a. WMATA’s Creation
n November 1966, President Lyndon B. Johnson signed a bill to create WMATA. Later that month, the Governors of Maryland and Virginia and Commissioners of the District of Columbia1 signed the WMATA Compact, an interstate agreement to plan, develop, finance, and cause to be operated a comprehensive mass transit system for the
Washington Metropolitan area. In 1967, WMATA was officially born.
Metrobus service began in 1973 when WMATA assumed the responsibility for operating four area bus systems. Metrorail started its first phase of operation in 1976; its original construction plan was completed in 2001. WMATA began its third transit service, MetroAccess, which provides paratransit service for people with disabilities, in 1994. Today, Metrorail is 106 miles and 86 stations, and a Dulles Rail extension will add 23 miles and 11 stations. Unlike its first five lines, WMATA is not constructing the Dulles Rail line—the Metropolitan Washington Airports Authority is serving that role—but WMATA will operate the line upon its completion.
The WMATA Compact has been amended seven times, but only one amendment caused a significant change to its governance structure. In 2009, federal members were added to the WMATA Board to comply with a new federal-regional dedicated funding agreement. Amendments may be adopted by legislative action of any of the Signatories that is concurred with by all of the other Signatories and consented to by Congress.
1 Before home rule, the Board of Commissioners administered the District of Columbia. Today, the Mayor is the Chief Executive of the District of Columbia.
I

Moving Metro Forward: Report of the Joint WMATA Governance Review Task Force 9
2b. WMATA’s Governance Structure
The Compact sets out the organizational mission of WMATA as follows:
Plan, develop, finance, and cause to be operated improved transit facilities in coordination with transportation and general development planning for the Zone2 as part of a balanced regional system of transportation, using to their best advantage the various modes of transportation
Coordinate the operation of the public and privately owned or controlled transit facilities, to the fullest extent practicable, into a unified regional transit system without unnecessarily duplicating service
Serve such other regional purposes and perform such other regional functions as the signatories may authorize by appropriate legislation
A full examination of WMATA’s governance must consider all the key players involved in governing the transit agency. To make changes to WMATA’s governance structure, the following entities must be engaged:
WMATA’s Governance Structure
2 The Zone currently comprises Montgomery County and Prince George’s County in Maryland; Alexandria, Arlington County, Fairfax, Fairfax County, Falls Church, and Loudoun County in Virginia; and the District of Columbia.

Moving Metro Forward: Report of the Joint WMATA Governance Review Task Force 10
Signatories – There are three Signatories to the Compact: the State of Maryland, the Commonwealth of Virginia, and the District of Columbia. They may amend the Compact with the consent of Congress.
Appointing Authorities – There are four Appointing Authorities in the Compact: for Maryland, the Washington Suburban Transit Commission (WSTC); for Virginia, the Northern Virginia Transportation Commission (NVTC); for the District of Columbia, the Council of the District of Columbia; and for the federal government, the General Services Administration. Each authority independently appoints two primary members and two alternate members to the WMATA Board. These entities have different criteria for appointing members to the WMATA Board.
The WSTC appoints its primary and alternate WMATA Board members from among its membership. Traditionally, WSTC members appointed by the Governor are appointed as the two primary WMATA Board members. WSTC members appointed by Montgomery County and Prince George’s County are appointed as the WMATA alternates. WSTC’s membership is composed of seven members—two are chosen by Montgomery County, two are chosen by Prince George's County, and three are chosen by the Governor with advice and consent from the State Senate.
The NVTC appoints its primary and alternate WMATA Board members from among its membership. Traditionally, NVTC members from Arlington County and Fairfax County serve as the primary WMATA Board members, while NVTC members from Alexandria and Fairfax County serve as the WMATA alternates. NVTC’s membership is mandated by state statute to comprise 20 state and local elected officials plus one member appointed by the State Secretary of Transportation.
The D.C. Council traditionally appoints one elected official from among its membership and one appointed official from the Mayor’s administration to serve as its primary WMATA Board members. The same arrangement is used for its alternate members.
The federal General Services Administration appoints primary members and alternates to serve on the WMATA Board for the federal government. One of the primary members must be a regular passenger and customer of WMATA’s bus or rail service. Two of these positions are currently unfilled.

Moving Metro Forward: Report of the Joint WMATA Governance Review Task Force 11
Board of Directors (Board) – The Compact states that the Board is responsible for providing for its own organization and procedures, and annually adopting a capital budget and a current expense budget. Service performed and the rates and fares to be charged for such service are subject to the sole and exclusive jurisdiction of the Board. All WMATA officers are appointed and may be removed by the Board.
The Compact includes a number of provisions regarding the Board’s structure:
There shall be 16 members, with the four Appointing Authorities each selecting two directors and two alternate members
Alternates shall act only in the absence of “their member” Members representing the State of Maryland and the Commonwealth of Virginia shall be
appointed from among members of the appointing entity (the Washington Suburban Transit Commission and the Northern Virginia Transportation Commission respectively) for a coincident term to their membership of the appointing entity
The Chairman and Vice Chairman shall be elected annually by members of the Board Decisions at Board meetings shall be made according to a majority vote, but at least one
member or eligible alternate member from each signatory must vote affirmatively (commonly referred to as the jurisdictional veto)
The Board shall set its own organization and procedures Members of the Board and alternates shall serve without compensation, but may be
reimbursed for necessary expenses
There are several practices that have been adopted by the WMATA Board that are not specified in the Compact, but which are relevant to a discussion regarding WMATA’s governance:
The Board annually elects a Chair, Vice Chair, and Second Vice Chair and rotates these offices among the three signatory jurisdictions
Full Board meetings are held once or twice each month; an Executive Session (closed to the public) is held prior to each meeting
Committees, their Chairs, and their voting members (which include alternates) are determined annually by the Board Chair

Moving Metro Forward: Report of the Joint WMATA Governance Review Task Force 12
Six committees are defined in the 2010 Board Procedures: Finance and Administration; Policy, Program Development and Intergovernmental Relations; Joint Development and Real Estate; Jurisdictional Coordinating; Customer Service and Operations; and Safety and Security3
Committees meet at least once each month
It should be noted that no term limits for Board members are stipulated by the Compact, and none have been introduced as part of the Board’s processes and procedures. However, the first federal members of the Board were appointed for terms of four years.
General Manager – The Compact states that the General Manager shall be the chief administrative officer of WMATA and, subject to policy direction by the Board, shall be responsible for all activities of WMATA.
Tri-State Oversight Committee (TOC) – The Tri-State Oversight Committee (TOC) was created in 1997 in response to a federal regulation, which required specially designated state agencies to provide safety oversight of rail systems that were not already regulated by the Federal Railroad Administration. In locations where a rail system operates in more than one state, each of the affected states may designate its own oversight agency, or the states may collectively designate a single agency. Opting for the latter, the three WMATA Signatories signed a memorandum of understanding to establish the TOC. Each of the Signatories has two representatives. No special qualifications are required to serve on the committee.
Before the Fort Totten accident, the TOC met once per quarter, but it has since met more frequently. The TOC has no physical office location, and only one of its six members is assigned to work for the committee full-time. A majority vote is required for the TOC to take any official action, but its role is largely restricted to one of reviewing safety practices and procedures. The TOC cannot establish or enforce standards of performance for WMATA, nor can it force WMATA to comply with its own standards and procedures. In performing its oversight responsibilities, the TOC’s primary activities include approving WMATA’s system safety program plan and reviewing the findings of WMATA’s safety reviews. The TOC also conducts on-site safety reviews every three years to determine whether WMATA’s safety practices and procedures comply with the system safety program plan. Any areas identified as requiring remedial action are incorporated into a corrective action plan.
3 The Board created a Safety and Security Committee in September 2010 following National Transportation Safety Board recommendations that the Board exercise greater oversight over safety. Previously, the Board had combined safety with customer service and operations into one committee.

Moving Metro Forward: Report of the Joint WMATA Governance Review Task Force 13
2c. WMATA’s Governance Challenges
As described in the previous section, WMATA’s complex governance structure involves nine distinct entities, as well as the Tri-State Oversight Committee. Each of the governing entities has a major part to play in ensuring that WMATA performs to the highest possible standards. However, the month-to-month governance of WMATA is primarily conducted in the Boardroom; thus, the Task Force deemed the effectiveness of WMATA’s Board to be the logical starting point for its research. To this end, the Task Force considered relevant experience of other transit and public sector agencies, as well as scholarly articles on public sector governance models. The following diagram summarizes the characteristics that research by the Transportation Research Board of the National Academies (TRB) has shown to be important to the effective performance of a transit Board.
Staff rendering based on Transportation Research Board (TRB) research

Moving Metro Forward: Report of the Joint WMATA Governance Review Task Force 14
Preliminary research conducted by the Task Force demonstrated that the entities involved in WMATA’s governance face several challenges that must be addressed as a matter of some urgency. These challenges may be brought into focus by the following questions, which were addressed by the Task Force during its five-month review.
Delineation of Responsibilities
Is there a clear delineation of responsibilities of the governing entities? What is the Board’s focus? Should it be operational, policy-making or strategic? Does the Board micro-manage, and how may such a tendency be limited? Does the General Manager have sufficient authority to run the organization? How can the relationship between the Board and General Manager be enhanced? Do appointing officials provide sufficient oversight? Are they accountable?
Composition of the Board
Does the selection process for Board members yield the ideal composition? Should there be more uniformity to how members are selected? Does the Board possess the appropriate mix of skills? Is there a sufficient incentive to seek long-term solutions to challenges? Is there sufficient motivation to serve the interests of the system as a whole? What should be the role of the alternate members? Are the compensation arrangements for Board members desirable and/or appropriate? Should formal term lengths and/or limits be introduced?
Role of the Chair
Does the practice of annual rotation undermine WMATA’s performance? Does the Chair have appropriate authority over members from other jurisdictions? How should the Board Chair be selected to ensure a regional perspective? What is the appropriate term length for the Chair?
Decision-Making
Does the veto help or hinder consensus-building on the Board? Do Board members sometimes prioritize jurisdictional interests over those of the region? Is
this desirable, and if not, how may it be prevented? Are the frequent changes to Board procedures detrimental to the organization? Do Board members participate in formal orientation/ongoing training programs?

Moving Metro Forward: Report of the Joint WMATA Governance Review Task Force 15
Section 3: Relevant Experience from other Governance Models
3a. Delineation of Responsibilities
ultiple players are involved in the governance of public transit systems. Chief Executives/General Managers oversee their day-to-day management. According to the American Public Transportation Association (APTA), approximately 90 percent of transit systems have a Board of Directors, which are primarily
responsible for policymaking. State Safety Oversight agencies oversee rail systems that are not federally regulated. And the authorities that appoint the transit Boards are responsible for their Board members’ performance. The literature and interviews conducted by the Task Force emphasized that a transit system’s success requires all the entities involved in governing the system to have clearly delineated responsibilities and a commitment to adhere to them.
An Independent Public Inquiry in Sydney stressed the importance of establishing boundaries to cultivate trust and stability and deter micro-management. It determined that successful public transport governance authorities “have all thought through how to put some boundaries around the authority of the Minister of Transport and other elected officials, such that the government is fully in control of setting policies that reflect its values but is not micro-managing the work of the agency.” The Task Force reviewed transit authorities that recently made major governance changes and placed an emphasis on clearly delineating governance and management responsibilities. For example, in Pittsburgh, the Port Authority of Allegheny County (PAAC) recently changed its governance structure to better define responsibilities for its Board, and introduced a “Limits of Authority Policy” to affirm that “it is not the role of the Board nor of individual Board members to become involved in the day-to-day administration of the Authority’s activities.”
In the case of WMATA, its Signatories and Appointing Authorities have never undertaken a governance review, nor have they clearly defined the Board’s role and responsibilities. Currently, the Board defines its role as follows:
The Metro Board of Directors determines agency policy and provides oversight for the funding, operation,
and expansion of safe, reliable, and effective transit service within the Transit Zone. The authority of the
Board of Directors is vested in the collective body and not in its individual Members. Accordingly, the
Board, in establishing or providing any policies, orders, guidance, or instructions to the General Manager
or WMATA staff, shall act as a body. No Member individually shall direct or supervise the General
Manager or any WMATA employee or contractor.4 (WMATA Board Procedures)
Despite this statement, a majority of the current and former WMATA Board members, GMs, and stakeholders interviewed by the Task Force expressed concern that the roles and responsibilities among the governing entities of WMATA remained unclear. Many said this confusion has led to questions over who is accountable for issues like day-to-day management, operations, and communications.
4 In September 2010, at the recommendation of NTSB, the WMATA Board changed its role to include the words ”safe, reliable, and effective” before transit service.
M

Moving Metro Forward: Report of the Joint WMATA Governance Review Task Force 16
The Task Force interviews and recent studies most often pointed to the topic of safety as the best illustration of the lack of clarity on roles and responsibilities at WMATA. The NTSB found the Board, TOC, and WMATA management did not work together to address the transit system’s safety needs. It said that the TOC was “ineffective in providing proper safety oversight of the transit system and that the WMATA Board did not seek adequate information about, nor did it demonstrate adequate oversight to address, the number of open corrective action plans (CAPs).” In February 2010, the NTSB noted that a total of 48 CAPs from previous triennial audits were still unresolved. This included 9 CAPs from events in 2004, 6 from 2005, 6 from 2006, 11 from 2007, and 13 from 2008.
The Task Force’s research and interviews also stressed the importance of positive and supportive working relationships between transit Boards and the General Manager and senior support staff. According to the Congressional Research Service (CRS), WMATA’s current structure results in the general manager being heavily constrained by the Board in his or her ability to make crucial decisions on what would otherwise be viewed as normal business activities in a private sector transportation firm. CRS also noted that WMATA’s GM position has lacked continuity and been a “flashpoint” for controversy. In the past five years, WMATA has had two GMs and two interim GMs, and it is currently searching for a permanent candidate.

Moving Metro Forward: Report of the Joint WMATA Governance Review Task Force 17
3b. Composition of the Board
Research conducted by the Task Force revealed that the process for selecting transit Board members differs significantly from one organization to the next. There are several types of transit Boards, the most notable of which are the following:
Boards composed of elected officials Boards whose members are appointed by elected officials Publicly elected Boards Mixed (or hybrid) Boards
The composition of transit Boards is a much-debated subject. Most of the literature favors a Board of appointed members, asserting that elected officials have difficulty in focusing on the long-term needs of a regional system because the short-term needs of their constituents are more critical. It is also argued that this potential conflict of interest can encourage Board members to engage in matters that are the proper domain of management and that a Board composed entirely of elected officials may lack the necessary expertise to function effectively.
While many stakeholders the Task Force heard from were sympathetic to the views expressed in the literature, a significant number expressed strong reservations, arguing that a Board of appointed members would lack the transparency and accountability that befits an organization like WMATA. This division is best illustrated by the fact that certain stakeholders held up the appointed Board of the Metropolitan Washington Airports Authority (MWAA) as a model for WMATA to aspire to, while others were dismayed by such a prospect. The lack of consensus among local stakeholders on this matter is consistent with the experiences of other cities, such as Toronto, that have struggled to decide on the best type of transit Board over the years. There was, however, broad agreement that a publicly elected WMATA Board would not be well-suited to the particular needs of the region.
The TRB does not strongly advocate a particular Board type, but it suggests that a transit Board must be balanced to perform effectively. This means that it should include members from a variety of backgrounds such as politics, business, finance, marketing, and law. Furthermore, membership should be based on potential members’ interest in public transit and on their commitment to the system’s mission, values, and vision.
Interviews conducted by the Task Force brought to light the potential problem of political patronage on Boards of appointed members. The experience of other cities has demonstrated that the appointment process for Boards of appointed members must be carefully designed to ensure selections are based on merit. Several organizations have dealt with this issue by putting in place some kind of nomination process, whereby one authority identifies suitable persons and another authority makes the appointments. Three such examples are TransLink in Vancouver, the Bi-State Development Agency in St. Louis, and DC Water in Washington, DC.

Moving Metro Forward: Report of the Joint WMATA Governance Review Task Force 18
The Task Force found there to be a lack of literature that deals with the matter of alternate members on a transit Board. This is no doubt because of the rarity of such an arrangement. Of the many other transit authorities across the U.S. that were considered by the Task Force, none have alternate members.
Board size has largely remained constant for most transit authorities in recent decades, typically ranging between seven and 10 members, although the evidence from authorities that have enacted recent governance changes indicates a trend toward larger Boards.
The Task Force found that terms for transit Board members vary in length and that some authorities permit multiple terms to be served while others do not. Term lengths for Board members usually range from one to five years, but a three- or four-year term is typical, and some authorities stagger terms to ensure continuity. According to the TRB, term limits for Board members are an effective way to ensure Board vitality and new ideas. As the WMATA Board does not currently stipulate term lengths other than for the federal appointees, two members and one alternate member have served for more than a decade. Among transit authorities surveyed by this Task Force, Los Angeles MTA and Transport for London were the only authorities other than WMATA to permit their Board members to serve indefinitely.
Regarding the matter of Board member compensation, there is a lack of uniformity among WMATA’s Appointing Authorities. The TRB found that fewer than 15 percent of transit Boards compensate members for their time or expenses. Their research indicates that compensation has a very weak influence on the effectiveness of transit Boards.

Moving Metro Forward: Report of the Joint WMATA Governance Review Task Force 19
3c. Role of the Chair
Based on the literature and the testimony of many of those interviewed, it is clear to the Task Force that a strong Chair is essential for a transit Board to operate effectively. According to APTA, the Chair should keep the Board focused on its mission and the needs of the region, lead the Board’s communications with the GM, and share with the GM the responsibility for orienting the authority to the future. APTA also recommends that he or she should educate other Board members and cultivate among them a strong sense of accountability.
While term lengths for Chairs vary considerably among authorities, they are typically longer than is the case at WMATA and are commonly between two and five years. The Task Force’s research indicates that Los Angeles MTA is the only other major U.S. transit authority to appoint a different Chair every year. Like WMATA, the short term length of the Chair at Los Angeles MTA is combined with a policy of rotating the Chairmanship among jurisdictions. In St. Louis, where the Chairmanship typically alternates between Missouri and Illinois, the term length is two years.
A variety of methods may be employed to appoint a Chair, but in the majority of cases, transit Boards elect the Chair from among their members. Other noteworthy methods include those of Metrolinx in Toronto, where the Provincial government appoints the Chair, and the New York MTA, where a gubernatorial appointee combines the roles of Chair and Chief Executive Officer.

Moving Metro Forward: Report of the Joint WMATA Governance Review Task Force 20
3d. Decision-Making
The Task Force’s research and interviews emphasized that cohesion is one of the most integral characteristics of an effective transit Board. The TRB recommends that individual agendas should be eliminated or decreased for the good of the transit system and that Board members should be team players who are willing to support the majority decision.
Unlike most authorities reviewed by the Task Force, Board decisions are not based solely on the vote of the majority at WMATA because of the provision of a jurisdictional veto. Some experts have questioned this decision-making arrangement. The Greater Washington Research Center found that “because of the structure of the WMATA board as a forum for inter-jurisdictional political negotiation, almost every aspect of Metro planning and operations becomes a subject for political consideration.” The Congressional Research Service said jurisdictions have occasionally “threatened to withhold, eliminate, or unilaterally reduce their annual contributions on the ground of perceived inequities.” While many stakeholders expressed such views to the Task Force, several argued that the veto is beneficial to regional decision-making due to WMATA’s unique, multi-state arrangement.
Committees play a role in the decision-making process of most transit Boards. The transit and public sector Boards studied by the Task Force range from having one to nine committees. WMATA presently has six committees. These committees, their members, and the Board Procedures, are subject to change annually with each new Board Chair. Following the 2009 fatal train collision, the NTSB called on the Board to elevate its safety oversight role. It noted its safety concerns with WMATA dated back to 1996 during an investigation of a Metrorail collision at the Shady Grove station, which determined that “WMATA employees reported a perceived lack of communication and a sense of information isolation within the organization.” During this time span, WMATA’s internal safety operations have been restructured several times. In September 2010, the Board created a committee dedicated to safety and security. The Board had previously combined safety, customer service, and operations in one committee.
Many of those interviewed by the Task Force have suggested that the Board should include an orientation process and leadership activities to build cohesion among its members. Research by APTA recommends these programs so Board members understand their role and responsibilities and the system’s operations, budget, funding, and strategic planning. In the past, WMATA held an annual retreat, which brought together Board members and management as well as regional elected officials and stakeholders, but that program has been discontinued.

Moving Metro Forward: Report of the Joint WMATA Governance Review Task Force 21
Section 4: Findings and Recommendations
4a. Delineation of Responsibilities
he Task Force finds the entities involved in WMATA governance—the Board, General Manager, Tri-State Oversight Committee, Appointing Authorities, and Compact Signatories—lack clear delineation of their responsibilities. The research and interviews conducted by the Task Force revealed that the Signatories and
Appointing Authorities do not meet to review WMATA on a regular basis and have never set uniform expectations or role descriptions for their Board members.
Based on evidence gathered by the Task Force, the lack of delineation of responsibilities has created an environment where there is no clear understanding of who is accountable for issues such as day-to-day management, communication, operations, and safety. The Task Force is concerned that this lack of clarity has constrained the GM and contributed to the historically high rate of turnover of the position.
Because of WMATA’s complex structure, it is vital that the entities involved in its governance meet on a regular basis. In April 2010, Maryland Governor Martin O'Malley, Virginia Governor Robert McDonnell, and District of Columbia Mayor Adrian Fenty met to agree on a plan of action to cooperatively address WMATA’s safety problems, focusing on improvements to the TOC.
The Task Force welcomes the spirit of cooperation that the Signatories demonstrated through its April 2010 meeting and urges them to work together with the Appointing Authorities to improve governance, leadership, and accountability at WMATA.
T
“There is no clear understanding of who is accountable for issues
such as day-to-day management, communication,
operations, and safety.”

Moving Metro Forward: Report of the Joint WMATA Governance Review Task Force 22
Finding Recommendations
WMATA’s Signatories and Appointing Authorities do not meet, and they have never agreed to uniform expectations or role descriptions for their Board members. This has resulted in a lack of clear delineation of responsibilities among WMATA’s governing entities.
Immediate
The Signatories and the Appointing Authorities should come together to form a WMATA Governance Commission, to make improvements to the authority’s governance structure and hold the Board accountable for its performance. The Signatories and Appointing Authorities should devote resources to staffing the Commission and commit to meeting on a regular basis, at least twice a year. The Commission should be composed of seven members: Maryland Governor Virginia Governor District of Columbia Mayor Washington Suburban Transit
Commission Chair Northern Virginia Transportation
Commission Chair District of Columbia Council Chair General Services Administration
Administrator
Immediate
The WMATA Governance Commission should clearly define the Board’s responsibilities and set a uniform job description. This should be done before the current Board selects a new Chair.
The lack of clear delineation of responsibilities between the Board and WMATA management has constrained the GM and contributed to the historically high rate of turnover at the position.
Immediate
The Board should define the GM as WMATA’s Chief Executive Officer and give him/her clear authority and autonomy to oversee day-to-day management of WMATA. Ideally, this should be done before the Board selects a new GM.

Moving Metro Forward: Report of the Joint WMATA Governance Review Task Force 23
4b. Composition of the Board
The Task Force finds that significant improvements to the Board’s effectiveness can be achieved by identifying instances where its structure lags behind best practices in the transit sector or where it does not encourage Board members to act in the best interests of the system and the region.
The selection process for Board members is not well-suited to ensuring the Board has the right blend of attributes to perform effectively. There are two main reasons why this is the case. First, there is not an agreed role profile for either the Board as a whole or for individual Board members. Second, the Appointing Authorities do not consult with one another when it comes to selecting Board members; this is inherently likely to result in an unbalanced Board.
The Task Force has some reservations regarding the current composition of the Board; specifically, it is not convinced that elected officials are able to adopt a long-term, regional perspective. For example, they may elect to postpone vital investment to avoid service cuts or fare increases that are unpopular with their local constituents. However, the Task Force recognizes the concerns that some stakeholders have expressed about the potential for a Board of appointed members to operate with less transparency than is presently the case.
The Task Force researched the flexibility available to each appointing authority within the existing appointment process. The Appointing Authorities for Maryland, the District of Columbia, and the federal government appear to be free to appoint elected or non-elected officials. Any change to their existing selection processes would simply require a change of policy. Virginia does not have the same flexibility. The NVTC could appoint one non-elected official by selecting the one member who is appointed by the State Secretary of Transportation, but the second appointment from Virginia currently has to be an elected official, as state statute mandates that the remaining 20 members of the NVTC Board all be elected officials.
Through its research, the Task Force heard a wide variety of views concerning the appropriate role of alternates, which ranged from giving them more power to eliminating them altogether. The Task Force has serious concerns regarding the role of alternate members on the Board, which includes voting on Board committees. Not only is it unusual to have alternate members on a transit Board, but the Compact explicitly states that alternates should act only in the absence of their jurisdictions’ members.
“The selection process for Board members is not well-suited to
ensuring the Board has the right blend of attributes to perform
effectively.”

Moving Metro Forward: Report of the Joint WMATA Governance Review Task Force 24
The Task Force is not of the opinion that the size of the WMATA Board represents a problem. However, if the role of the alternate members were to be eliminated, a small increase in the number of primary members would be appropriate. Additionally, the situation may need to be reassessed in the event that future expansion of the system results in other jurisdictions having a significant stake in WMATA’s performance.
Based on evidence gathered through its research, the Task Force does not believe that the Appointing Authorities should permit their representatives to serve on the WMATA Board indefinitely. The Task Force recognizes the value of experience on transit Boards. But the current situation at WMATA is contrary to best practice, it is inconsistent among Appointing Authorities, and it compromises Board vitality.
The Task Force finds that the current compensation arrangements for WMATA Board Members require revision. The Compact requires that Board members and alternates shall serve without compensation. It is for the Signatories and Appointing Authorities to decide whether there is a compelling case for compensating Board members, but the current lack of consistency is illogical and runs contrary to the spirit of regional cooperation.
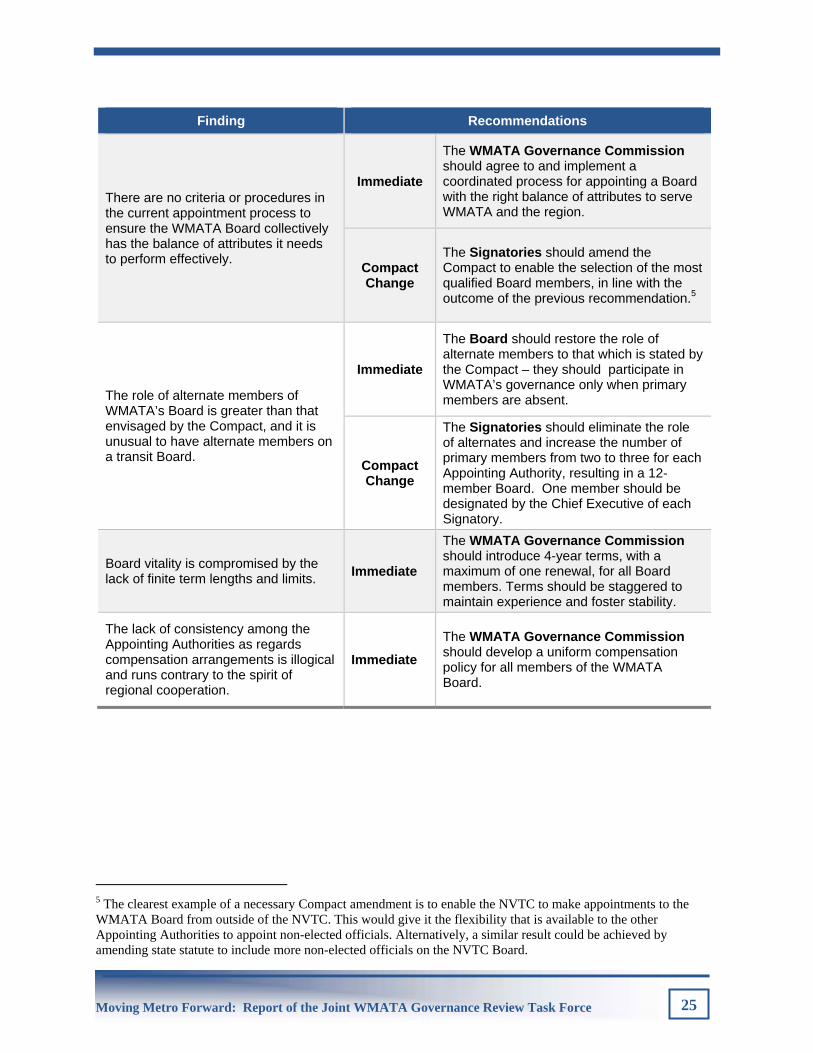
Moving Metro Forward: Report of the Joint WMATA Governance Review Task Force 25
Finding Recommendations
There are no criteria or procedures in the current appointment process to ensure the WMATA Board collectively has the balance of attributes it needs to perform effectively.
Immediate
The WMATA Governance Commission should agree to and implement a coordinated process for appointing a Board with the right balance of attributes to serve WMATA and the region.
Compact Change
The Signatories should amend the Compact to enable the selection of the most qualified Board members, in line with the outcome of the previous recommendation.5
The role of alternate members of WMATA’s Board is greater than that envisaged by the Compact, and it is unusual to have alternate members on a transit Board.
Immediate
The Board should restore the role of alternate members to that which is stated by the Compact – they should participate in WMATA’s governance only when primary members are absent.
Compact Change
The Signatories should eliminate the role of alternates and increase the number of primary members from two to three for each Appointing Authority, resulting in a 12-member Board. One member should be designated by the Chief Executive of each Signatory.
Board vitality is compromised by the lack of finite term lengths and limits. Immediate
The WMATA Governance Commission should introduce 4-year terms, with a maximum of one renewal, for all Board members. Terms should be staggered to maintain experience and foster stability.
The lack of consistency among the Appointing Authorities as regards compensation arrangements is illogical and runs contrary to the spirit of regional cooperation.
Immediate
The WMATA Governance Commission should develop a uniform compensation policy for all members of the WMATA Board.
5 The clearest example of a necessary Compact amendment is to enable the NVTC to make appointments to the WMATA Board from outside of the NVTC. This would give it the flexibility that is available to the other Appointing Authorities to appoint non-elected officials. Alternatively, a similar result could be achieved by amending state statute to include more non-elected officials on the NVTC Board.

Moving Metro Forward: Report of the Joint WMATA Governance Review Task Force 26
4c. Role of the Chair
The Task Force finds that the role of the Chair is not structured to provide strong leadership to the WMATA Board.
The rotation of the Chairmanship among jurisdictions diminishes the possibility of the Chair guiding all Board members to act in the best interests of the system and the region.
The Chair’s role and responsibilities are not well defined. The Chair has no authority over members from other jurisdictions. For example, he or she is not empowered to prevent micro-management or encouraged to report non-attendance of members at Board and Committee meetings to the Appointing Authorities. He or she is also unable to prevent Board members from communicating mixed messages to the public and media.
A term length of one year is too short for the Chair to assume true leadership, and frequent changes in leadership can have a destabilizing effect on the Board’s performance.
“The role of the Chair is not structured to provide strong leadership to the WMATA
Board.”

Moving Metro Forward: Report of the Joint WMATA Governance Review Task Force 27
Finding Recommendations
The rotation of the Chairmanship among jurisdictions diminishes the possibility of the Chair guiding all Board members to act in the best interests of the system and the region.
Immediate
The Board should end the custom of rotating the Chairmanship. Instead, it should select a regionally-focused Chair from among its membership.
Compact Change
The Signatories should amend the Compact to enable the WMATA Governance Commission to appoint a regionally-focused Chair from outside the Board’s membership. They should also agree on appropriate compensation for the Chair, which can be made greater than for other Board members through a Compact amendment.
A term length of one year is too short for the Chair to assume true leadership.
Immediate The Board should increase the term length of the Chair from 1 to 2 years.
Compact Change
If the Signatories enact the recommended Compact change to enable the WMATA Governance Commission to appoint a Chair from outside the Board’s membership, they should enact a further change to increase the Chair’s term length to 4 years.
The Chair’s responsibilities are not clearly defined, and the Chair has no authority over other Board members.
Immediate
The WMATA Governance Commission should develop a role description that clearly defines the Chair's responsibilities and helps to ensure the Chair has sufficient authority to assume a true leadership role.

Moving Metro Forward: Report of the Joint WMATA Governance Review Task Force 28
4d. Decision-Making
The Task Force finds that the current state of WMATA’s governance structure does not encourage the Board to act as a cohesive, regional body. This is due to a number of factors including the inconsistent process by which the Appointing Authorities select Board members and lack of clearly delineated responsibilities. The Task Force finds that the threat of using the veto has sometimes acted as an impediment to making the best regional decisions. Thus, options for using the veto should be limited, and serious consideration should be given to eliminating it altogether.
The Task Force finds that WMATA’s committees and Board Procedures should not be subject to change by each new Board Chair on an annual basis. Regardless of the term length of the Board Chair, changes to the standing committee structure and formal Board procedures should require a majority vote by the Board. The Board should establish a committee structure that is better-suited to WMATA’s distinct characteristics and challenges, including stand-alone committees for governance, safety, and customer relations.
The Task Force finds that there is no orientation process or other leadership activities in place for Board members to prepare them for their role and responsibilities and develop a better understanding of the system’s operations, budget, funding, and strategic planning. An orientation process would have the added benefit of building cohesion among Board members.
“The threat of using the veto has sometimes acted as an
impediment to making the best regional decisions.”

Moving Metro Forward: Report of the Joint WMATA Governance Review Task Force 29
Finding Recommendations
The Task Force finds that the threat of using the veto has sometimes acted as an impediment to making the best regional decisions.
Immediate The Board should adopt a policy to limit use of the veto to matters relating to the budget or to system expansion.
Compact Change
The Signatories should determine the appropriate role of the veto in WMATA’s decision-making process, and give serious consideration to eliminating it entirely.
The Task Force finds that WMATA’s committees and Board Procedures should not be subject to change by each new Board Chair, and that its standing committee structure could be improved.
Immediate
The Board should adopt a policy that all changes to committees and procedures require a majority vote, and it should establish a committee structure that is better-suited to WMATA’s distinct characteristics and challenges, including stand-alone committees for governance, safety, and customer relations.
Board members lack an orientation process and other leadership activities to prepare them for their role and responsibilities, develop a better understanding of the system, and build cohesion.
Immediate The Board should develop an orientation process and other leadership activities for Board members.

Moving Metro Forward: Report of the Joint WMATA Governance Review Task Force 30
Section 5: Conclusion
he Task Force finds that what may have been an appropriate governance structure for WMATA to build a new transit system in the 1960s is not appropriate to operate today’s mature system. The current structure does not promote accountability or regional cohesion and, in a number of critical areas of governance, WMATA is out
of step with the best practices employed by other leading transit authorities. Fundamental changes must be made for Metro to meet the region’s needs.
The Task Force recommends that the Signatories and Appointing Authorities come together to form a WMATA Governance Commission to improve the authority’s governance structure. The Task Force also recommends that the Board take a number of immediate actions to improve its effectiveness.
The multi-state agreement that created WMATA and helped build a world-class transit system endures as a visionary example of regional leadership. In that spirit, the Task Force calls on today’s leaders to demonstrate the same level of regional cooperation and commitment to improve WMATA’s governance and ensure Metro’s success in the coming decades.
T

Moving Metro Forward: Report of the Joint WMATA Governance Review Task Force 31
Acronyms and Abbreviations
APTA American Public Transportation Association
BOT Greater Washington Board of Trade
CAP Corrective Action Plan
CEO Chief Executive Officer
COG Metropolitan Washington Council of Governments
CRS Congressional Research Service
GM General Manager
GSA General Services Administration
MTA Metropolitan Transportation Authority
NTSB National Transportation Safety Board
NVTC Northern Virginia Transportation Commission
TOC Tri-State Oversight Committee
TRB Transportation Research Board of the National Academies
WMATA Washington Metropolitan Area Transit Authority
WSTC Washington Suburban Transit Commission

Moving Metro Forward: Report of the Joint WMATA Governance Review Task Force 32
Appendix: Task Force Resources
A complete list of resources, including public comments received by the Task Force, can be found at: http://www.mwcog.org/governancetaskforce
Selected Bibliography
Transit Sector and Governance (General)
American Public Transportation Association Transit Board Member Handbook 2006
Independent Public Inquiry Long-Term Public Transport Plan for Sydney 2010
Transportation Research Board TCRP Report 85: Public Transit Board Governance Guidebook 2002
U.S. Government Accountability Office Survey of Governance Practices and the Inspector General Role 2009
Transit Sector (Cities/Regions)
The District of Columbia, State of Maryland, and the Commonwealth of Virginia Optimizing State Safety Oversight of the WMATA Metro Rail System 2010
Fischer, John and Mallett, William; (Congressional Research Service) Washington Metropolitan Area Transit Authority: Issues and Options for Congress 2010
Gunn, David Analysis on the current status of Metro (commissioned by WMATA) 2010
Kirby, Ronald; Bhatt, Kiran and Kemp, Michael; (Greater Washington Research Center) Washington’s Metro: Issues and Options 1982

Moving Metro Forward: Report of the Joint WMATA Governance Review Task Force 33
Metro Funding Panel Analysis of and Potential for Alternate Dedicated Revenue Sources for WMATA 2005
National Transportation Safety Board Collision of Two Washington Metropolitan Area Transit Authority Metrorail Trains Near Fort Totten Station, Washington, D.C. June 22, 2009 2010
Strategic Development Program Steering Committee for the Port Authority of Allegheny County Action Report following up on the November 16-17, Strategic Work Session 2007
Higgins, Chris; (Master of Public Policy and Administration, McMaster University) Transportation Dilemmas - Fixing Transit In The City of Toronto 2010
Independent Study Funded by the Residential and Civil Construction Alliance of Ontario Transportation Challenges in the Greater Toronto Area 2006
Soberman, Richard M. (University of Toronto) The Track Ahead: Organization of the TTC under the new amalgamated City of Toronto 1997
Toronto Board of Trade Time is of the Essence: Ensuring Economic Prosperity through Improved Transit and Transportation in the GTHA: Comments and Recommendations on Metrolinx’s Draft Regional Transportation Plan and Investment Strategy 2008
Office of the Comptroller General, British Columbia Report on Review of Transportation Governance Models 2009
TransLink Governance Review Panel TransLink Governance Review: An Independent Review of the Greater Vancouver Transportation Authority 2007
Non-Transit Sector
District of Columbia Water and Sewer Authority Regionalization Study 2001
Advisory Commission on the Reorganization of the Metropolitan Washington Airports Report to the Secretary 1984

Moving Metro Forward: Report of the Joint WMATA Governance Review Task Force 34
Regions/Governance Structures Studied
Atlanta Metropolitan Atlanta Rapid Transit Authority
Boston Massachusetts Bay Transportation Authority
Brisbane TransLink
Chicago Chicago Transit Authority
Dallas Dallas Area Rapid Transit
Denver Denver Regional Transportation District
Hong Kong Mass Transit Railway
Houston Metropolitan Transit Authority of Harris County
London Transport for London
Los Angeles Los Angeles County Metropolitan Transportation Authority
Minneapolis Metro Transit Minneapolis
New York/ New Jersey
New York Metropolitan Transportation Authority New Jersey Transit Authority Port Authority Trans-Hudson Corporation
Perth Transperth
Philadelphia Southeastern Pennsylvania Transportation Authority
Pittsburgh Port Authority of Allegheny County, PA
Portland Tri-County Metropolitan Transportation District of Oregon
San Diego San Diego Metropolitan Transit System
San Francisco/ San Jose
San Francisco Municipal Railway San Francisco Bay Area Rapid Transit District Santa Clara Valley Transportation Authority

Moving Metro Forward: Report of the Joint WMATA Governance Review Task Force 35
Singapore Land Transport Authority
St. Louis Bi-State Development Agency
Sydney State Transit Authority of New South Wales
Toronto Metrolinx, Greater Toronto and Hamilton Toronto Transit Commission
Vancouver Translink
Washington Metropolitan Washington Airports Authority DC Water (formerly DC Water and Sewer Authority)
Zurich Zurich Transport Network (ZVV)

Washington Metropolitan Area Transit Authority
Vital Signs ReportB P fBus Performance
Customer Service and Operations Committee
November 4, 2010
Page 8 of 52
Purpose
The Performance Office will periodically present an inThe Performance Office will periodically present an indepth review of performance in a key aspect of Metro’s operation
• Collaboration of Chief Performance Officer and Assistant General Manager of Bus (CPO & AGM)
• Focus of this review – Metrobus Operations
– What’s working well?g
– What’s not working, why?
– What actions improve performance?What actions improve performance?
Page 9 of 52

Metrobus Overview
Metrobus operations
• Sixth largest bus fleet in the United States
• Average weekday ridership: 405,971
• Active buses (FY10): 1,512
• Average fleet age: 7.2 Years
• Repair facilities: 9
• Vehicle miles (FY09, 000s): 50,682
• Diesel fuel dependence has dropped 35% since 2001
Page 10 of 52
Performance: What Is Working Well
Bus Transportation Dashboard Goal 1: Create A Safer OrganizationBus Transportation Dashboard – Goal 1: Create A Safer OrganizationGoal 2: Deliver Quality Service Goal 3: Use Every Resource Wisely
• A management tool that communicates performancecommunicates performance
• Execution Plan is the foundation of the dashboard
• Provides real-time information to supervisors, to speed up response and corrective actionsp
• Coming Soon: Bus Maintenance real-time performance reportingperformance reporting
Page 11 of 52

Performance: What Is Working Well
Bus Safety Conversations – Goal 1: Create A Safer Organizationy g
100%
Bus Safety Conversation Time Compliance
80%
100%
40%
60%
Compliance
0%
20%
Sept Oct Nov Dec Jan Feb Mar Apr May June July Aug Sept
BMNT BTRA Target
Page 12 of 52
Performance: What Is Working Well
Select Advantage Goal 4: Retain Attract and Reward the Best and the BrightestSelect Advantage – Goal 4: Retain, Attract and Reward the Best and the Brightest
• A behavioral assessmentselection tool implemented on December 29, 2009 used to select Bus Operator candidates
• Purpose: Identify candidates that possess key elements of asuccessful bus operatorp
• Benefit:1. Decreased turn-over rate of students 2. Improved on the job performance
Page 13 of 52

Performance: What Is Working Well
Bus Fleet Reliability – Goal 2: Deliver Quality Service y Q y
8,000ilure
s
Bus Fleet Reliability FY 2010 FY 2011 Target
• Replaced 148, 15 year old buses, with new hybrid electric
5,5006,0006,5007,0007,5008,000
ce b
etw
een
Fai
(Mile
s)
new hybrid electricbuses
• Enhancedi t t ff
4,0004,5005,000
July Aug Sep Oct Nov Dec Jan Feb Mar Apr May JunM
ean
Dis
tan
cmaintenance stafftraining procedures
* FYTD 6,950 MDBF
Page 14 of 52
Performance: What Is Not Working WellWell
Bus On-Time Performance (OTP) – Goal 2: Deliver Quality Service
• Controllable- Workforce shortage- Not adhering to on-
time pullout85.0%
Bus On-Time PerformanceFY 2010 FY 2011 Target
time pullout- Bus bunching- Realistic run times
70.0%
75.0%
80.0%
• Uncontrollable- Road construction- Traffic congestion- Major events
60.0%
65.0%
July Aug Sep Oct Nov Dec Jan Feb Mar Apr May Jun
Major eventscreating detours
Definition: Window of no more than 2 minutes early or 7 minutes late
Page 15 of 52

Industry Practices: On-Time Performance DefinitionsDefinitions
• Agencies often differ in methodology of
AGENCY EARLY LATE
2 i iin methodology ofidentifying at which point does tracking OTP begin
Metro *Schedule Adherence
2 minutes 7 minutes
Ride On* Schedule Adherence
2 minutes 5 minutes
• National peer agencies were chosen using INTDAS* likeness scores
DC Circulator*Headway Adherence (<15 mins. is late)
7 minutes 11 minutes
The Bus * Schedule Adherence
2 minutes 7 minutes
• OTP is often calculated for completed trips, but it is sometimes unclear as to whether
CUE *Schedule Adherence 2 minutes 5 minutes
SEPTA *Schedule Adherence
0 minutes 4 minutes
MDT * h d l dh 59 seconds 4 minutes + 59to whethermissed/dropped trips and extra trips are included in the measurement
MDT * Schedule Adherence 59 seconds 4 minutes + 59seconds
MARTA*Schedule Adherence
0 minutes + 30 seconds
5 minutes + 30 secondsthe measurement
MTA New York City *Schedule Adherence
1 minute 5 minutes
*Source: Integrated National Transit Database Analysis System (INTDAS)Page 16 of 52
Performance: Action To Improve S f t
DriveCam System - Goal 1: Create A Safer Organization
Safety
• Coming Soon, Installation is 85% completed
www.drivecam.com
Page 17 of 52

Performance: Actions To Improve OTP
The Bus Verifier - Goal 2: Deliver Quality Service
• A pilot application designed to allow users to readily pinpoint incidents within a geographic area
ith t d d twith route and date
• Tool will assist in performing root cause analysis and addressing
t l i tcustomer complaints
• Information will explain the cause for delays, early arrivals, and no h i l hi t i l tishows in real or historical time
• Success Factor: Service Operation Managers must phone in detention t d di t d BOCCto a dedicated BOCC resource
Page 18 of 52
Performance: Actions To Improve OTP
G30 Strategic Action Team - Goal 2: Deliver Quality Service
100%
% OTP by Time Period
Sunday SaturdayWeekdays All Days
The G30 OTP team is a cross functional group tasked with:
350
Customer Complaints Related toBus OTP in FY2010
85%
90%
95%
sOnTime
Weekdays All DaysGoal
tasked with:
• AssessingMetrobus service reliability
250
300
70%
75%
80%
%Timep
ointsreliability
• Identifying internal and external factors 100
150
200Early
Late
No Show
60%
65%external factorsaffecting service
• Suggesting recommendations 0
50
100
J l A S O t N D J F bM A M J
• A.M. OTP consistently meets 80% goal; P.M. peak and evening have the lowest OTP
recommendations Jul Aug Sep Oct NovDec Jan FebMarAprMayJun
• OTP accounts for 35%of total bus complaints
Page 19 of 52

Performance: Actions To Improve OTP
G30 Sample Strategies For Improving Reliability - Goal 2: Deliver Quality Service
• Implement dedicated bus lanes and intersection treatments to alleviate the impact of traffic congestion
• Re-deploy Service Operation Managers (SOM) and dedicate SOMs to specific lines or corridors
• Consolidate bus stops
• Review time point locations
• Adjust schedules to match actual operations (budget constraints)
• Ride the bus routes and interview operators more frequently
Page 20 of 52
Action To Improve Service: Planning F S i IFor Service Improvements
P i it C id N t k B d dPriority Corridor Network - Goal 2: Deliver Quality Service
• Priority Corridor Network: Board approved program to improve service, capacity, and performance on 24 corridors serving over half of all Metrobus riders
Corridor Study Projects: (3 4 per year) intended to
STUDIES EVALUATIONS
U Street-Garfield Line: Routes 90, 92,93
70s Line (2007): Routes 70,71,79
• Corridor Study Projects: (3-4 per year) intended toevaluate, recommend and prepare corridor service restructuring and capital improvement plans
• Service Evaluation Projects: (6 8 per year) intended
K6 Line: Route K6
Routes B2, D12,D13,D14
Benning Rd. – H St.: Routes
Routes 23A,23C,25A,25C,• Service Evaluation Projects: (6-8 per year) intended
to evaluate existing service, recommend operating adjustments, and identify future strategic needs
• Comprehensive Implementation Plans: addresses
X1,X2,X3, , ,
25D
28-LeesburgPike Line: Route 28A
F8,P12,2A,2C,2G,D1234568• Comprehensive Implementation Plans: addresses
requirements and practices for service design; customer facilities; buses and assignments; customer information systems; transit/traffic operations and plans; fare collection; and safety and
Q Line: Route Q2
16th St. Line:operations and plans; fare collection; and safety andsecurity management
16 St. Line:Routes S1, S2,S4
30s Line: Route 32,34,36
Page 21 of 52

Vital SignsNext StepsNext Steps
SummarySummaryMetro is becoming a performance based agency
• Performance Office staff will continue to collaborate• Performance Office staff will continue to collaboratewith front line operating groups seeking ways to highlight good performanceand improve poor performance
• Develop Execution Plans
• Performance Reporting
• Share Best Practices• Share Best Practices
Page 22 of 52

TITLE:
Safety Report
PURPOSE:
To present to the Board of Directors a report on the state of safety within Metro. Including safety statistics, current actions, action plans on recomendations to audits, policies and other safety related information so the Board may be kept up to date and informed.
DESCRIPTION:
To ensure that safety is the priority within Metro and the necessary actions and policies are implemented to enhance the safety of our emloyees and customers.
FUNDING IMPACT:
None
RECOMMENDATION:
To present the monthly Safety Report to the Board of Directors.
Washington Metropolitan Area Transit Authority
Board Action/Information Summary
Action Information MEAD Number: Resolution: Yes No
Page 1 of 1
11/3/2010http://mead/prod/reports/bais.cfm?RequestTimeout=300
47 of 86

Washington Metropolitan Area Transit Authority
Safety Report
Safety & Security CommitteeNovember 18, 2010
48 of 86

NTSB Update
M i k d h bl l• Metro continues to works towards the acceptable closure of NTSB recommendations
A f th k f N b 1 2010 t h id d• As of the week of November 1, 2010, metro has provided an update proposal regarding these 15 recommendations (R-10-08 through R-10-22)( g )
49 of 86

Corrective Action Plans
Closed Openp
227 29256 TOTAL
227 29
0 50 100 150 200 250 3000 50 100 150 200 250 300
50 of 86

Corrective Action Plans
2009
2010
25
2
4
1
2007
2008
55
15
12
8
Closed
2005
2006
27
49Open
0 10 20 30 40 50 60 70
2004 52 3
0 10 20 30 40 50 60 70
51 of 86

Days Worked – No Lost Time Injuries
Division Number of days
Glenmont Rail Inspection 1,287
R l St t B M i t 568Royal Street Bus Maintenance 568
Track Maintenance Red 447
Heavy Equipment Shop CMNT 371
Shops and Material Control SMNT 351Shops and Material Control SMNT 351
Heavy Overhaul Shop Bus, CTF 346
Current as of November 4, 2010
52 of 86

Metrorail Safety Performance Indicators
Total Rail Incidents, YTD Through September
15
17
19
R il I id t18
11
13
15 Rail Incidents
15Rail Incidents are
collisions (vehicle to vehicle, vehicle to
7
9
vehicle, vehicle to obstruction, vehicle to person or object placed
on the track), derailments, and
3
5track), derailments, and
suicides.
1
2009 2010
53 of 86

Metrorail Safety Performance Indicators
Rail Passenger Injury Rate, YTD Through September( illi i )
4.00
4.50
(per million passenger trips)
2.50
3.00
3.50
2010
2009
1.00
1.50
2.002009
2009 Average .47
Jan Feb Mar Apr May Jun Jul Aug Sep0.00
0.50
1.00
Average
2010 0.06 0.15 0.10 0.19 0.22 0.20 0.10 0.11 0.172009 0.27 0.12 0.26 0.05 0.05 4.04 0.10 0.22 0.17
g
0.140.59
54 of 86

Metrorail Safety Performance Indicators
Suicides, Year to Date
3
4
2
32010
2009
2008
1
2008
Jan Feb Mar Apr May Jun Jul Aug Sep Oct Nov Dec
2010 0 1 0 1 0 2 1 0 0
0Total
52009 0 0 2 0 0 3 1 1 2 0 2 02008 0 0 0 0 1 1 0 0 0 2 0 1
5115
55 of 86

Metrorail Safety Performance Indicators
Fire Incidents, YTD Through September
05
1015
2010
2009
Jan Feb Mar Apr May Jun Jul Aug Sep
2010 6 9 10 11 8 10 4 4 82009 3 5 1 5 13 7 10 4 4
0Total
70522009 3 5 1 5 13 7 10 4 4 52
40
Smoke Incidents, YTD Through September
Jan Feb Mar Apr May Jun Jul Aug Sep0
10203040
2010
2009
Total
2010 4 5 10 8 7 7 12 4 122009 2 2 6 12 5 8 16 34 25
69110
56 of 86

Metrobus Safety Performance Indicators
Total Bus Collision Rate, YTD Through September( illi il )
0 020.040.060.0
(per million miles)
2010
2009
Jan Feb Mar Apr May Jun Jul Aug Sep
2010 43.9 51.7 38.1 41.4 27.9 46.1 51.1 51.52009 41 6 41 5 46 4 42 1 47 4 40 6 43 8 34 2
0.0Average
44.042.22009 41.6 41.5 46.4 42.1 47.4 40.6 43.8 34.2 42.2
Preventable Bus Collision Rate, YTD Through September(per million miles)
Jan Feb Mar Apr May Jun Jul Aug Sep0.0
10.020.030.0 2010
2009Average
2010 14.3 16.9 12.4 12.8 9.0 20.4 24.2 14.82009 18.0 13.2 14.8 16.8 21.3 18.5 14.5 15.6
g
15.616.6
57 of 86

Metrobus Safety Performance Indicators
Bus Passenger Injury Rate, YTD Through September( illi i )
0 002.004.006.00
(per million passenger trips)
2010
2009Jan Feb Mar Apr May Jun Jul Aug Sep
2010 0.42 1.41 1.46 1.11 1.26 1.43 1.44 0.96 5.272009 0 79 0 49 0 71 0 80 1 47 0 89 0 93 1 16 1 23
0.00 2009Average
1.640.94
60
Bus Passenger Injuries, YTD Through September
2009 0.79 0.49 0.71 0.80 1.47 0.89 0.93 1.16 1.23 0.94
Jan Feb Mar Apr May Jun Jul Aug Sep0
204060
2010
2009
Total
2010 4 10 16 12 13 15 15 10 562009 8 5 8 9 16 10 11 13 14
15194
58 of 86

Metrobus Safety Performance Indicators
Pedestrian Injuries, YTD Through September
3
4
2
3
2010
2009
1
Jan Feb Mar Apr May Jun Jul Aug Sep0
Total
2010 0 2 1 3 2 0 0 0 02009 0 3 0 3 1 1 3 1 3
815
59 of 86

MetroAccess Safety Performance Indicators
MetroAccess Total Accident Rate, YTD Through September( illi il )
0 020.040.060.0
(per million miles)
2010
2009
Jan Feb Mar Apr May Jun Jul Aug Sep
2010 35.7 40.3 39.0 37.8 45.3 47.2 39.8 33.7 26.32009 33 7 21 5 32 6 27 3 37 9 45 8 35 5 35 7 36 6
0.0Average
38.334.12009 33.7 21.5 32.6 27.3 37.9 45.8 35.5 35.7 36.6 34.1
MetroAccess Preventable Acc. Rate, YTD Through September (per million miles)
Jan Feb Mar Apr May Jun Jul Aug Sep0
2040 2010
2009Average
2010 23 13 18 15 28 19 19 15 152009 15 25 21 17 20 31 18 17 20
g
1820
60 of 86

MetroAccess Safety Performance Indicators
MetroAccess Passenger Injury Rate, YTD Through September( illi il )
0 020.040.060.0
(per million miles)
2010
2009
Jan Feb Mar Apr May Jun Jul Aug Sep
2010 31.4 36.8 21.6 27.0 52.9 46.5 24.6 38.8 9.82009 6 3 17 5 10 5 20 3 5 3 46 6 30 3 25 7 20 1
0.0Average
32.220.32009 6.3 17.5 10.5 20.3 5.3 46.6 30.3 25.7 20.1 20.3
MetroAccess Passenger Injuries, YTD Through September(per million miles)
Jan Feb Mar Apr May Jun Jul Aug Sep05
1015 2010
2009Total
2010 6 5 5 6 11 10 5 8 22009 1 3 2 4 1 9 6 5 4
5835
61 of 86

Metro Safety Performance Indicators
Employee Injury Rate, YTD Through September( 200 000 h )
8 009.00
10.00
(per 200,000 hours)
5 006.007.008.00
2010
2009
2 003.004.005.00 2009
Jan Feb Mar Apr May Jun Jul Aug Sep0.001.002.00
Average
2010 5.38 8.70 5.29 5.88 6.53 7.21 4.68 5.59 8.142009 4.73 6.61 5.09 5.57 6.20 8.65 8.92 6.98 8.55
g
6.386.81
62 of 86

S t S f t P PlSystem Safety Program Plan
63 of 86

Purpose
• Provide information to the Committee regarding the revision of the WMATA System Safety Program Plan (SSPP)Plan (SSPP)
• Required by the FTA State Safety Oversight Regulation for all RailOversight Regulation for all Rail Fixed Guideway Systems
• Must include the requirements of• Must include the requirements of the Tri-State Oversight Committee (TOC) program Standard and P d M lProcedures Manual
64 of 86

Background
Metro’s first SSPP was developed in 1976 with the openingMetro s first SSPP was developed in 1976 with the opening of the first segments of Metrorail.
– Voluntary and based on guidelines established by the American y g yPublic Transportation Association (APTA)
– 1996, FTA State Safety Oversight (SSO) regulation made the SSPP d tSSPP mandatory.
• APTA guidelines were adopted by the FTA as the basis for developing the SSPP
– 2005, revised FTA SSO regulation established new guidelines for the preparation of the SSPP based on 21 Elements
65 of 86

2010 SSPP Revision2010 SSPP Revision
Includes recommendations from:Includes recommendations from:
• December 2009 FTA Audit
i l i S f d ( S )• National Transportation Safety Board (NTSB) Fort Totten Investigation report
• 2010 TOC Triennial Safety Review report
• 2010 revision of the TOC Program Standard gand Procedures Manual
• Transit Industry “Best Practices”Transit Industry Best Practices
66 of 86

Major Modifications
• Clarification of responsibilities of the• Clarification of responsibilities of the Chief Safety Officer
• Safety communication among GeneralSafety communication among General Manager, Chief Safety Officer and the Executive Leadership Team
• Comprehensive revision of the Accident Investigation, Hazard Management Internal Safety AuditManagement, Internal Safety Audit programs and the corrective action development and implementation process
67 of 86

Recommendation
• 2010 Amendment to the Board2010 Amendment to the Board of Directors System Safety Policy Statement.
– Board Safety Policy established in 1983
– Last amended in 2006
• Bring Revised Policy to C itt i D b fCommittee in December for Action
68 of 86

1
DRAFT FOR PUBLIC COMMENT
Report on Governance of the
Washington Metropolitan Area
Transit Authority
Riders’ Advisory Council
November 3, 2010

2
Table of Contents
Executive Summary ....................................................................................................................................... 3
Research into WMATA governance .............................................................................................................. 4
Existing discussions of governance ........................................................................................................... 4
Process of the RAC committee on WMATA governance .......................................................................... 4
Recommendations ........................................................................................................................................ 7
1. The Board is analogous to a legislature and should include public officials ......................................... 9
2. The Board should set clear, high standards for members .................................................................. 11
3. The Board should focus on high-level policy and objectives .............................................................. 13
4. The Board should act as a regional body rather than as individuals .................................................. 14
5. WMATA’s top official should be a CEO rather than a General Manager ............................................ 16
6. Board decision-making should include a clear and accessible public input process .......................... 18
Appendix A: Summary of testimony from RAC hearings ............................................................................ 21
How should the Board relate to jurisdictions? ....................................................................................... 21
How should the Board relate to riders?.................................................................................................. 24
How should the Board relate to the General Manager? ........................................................................ 27
Who should serve on the Board? ........................................................................................................... 30
Appendix B: Current WMATA governance ................................................................................................. 36
Board composition .................................................................................................................................. 36
Board structure ....................................................................................................................................... 37
Board meetings and procedures ............................................................................................................. 38
Advisory committees .............................................................................................................................. 38
Staff ......................................................................................................................................................... 39
Funding ................................................................................................................................................... 39

3
Executive Summary
The Riders’ Advisory Council (RAC) of the Washington Metropolitan Area Transit Authority (WMATA)
conducted a study of the governance structure of the WMATA Board of Directors during the summer
and fall of 2010.
There is a widespread perception among riders and the local media that change is needed at WMATA,
and that WMATA’s problems, along with the necessary change, includes the top: the Board.
This led to a number of outside studies of WMATA’s governance structure. However, the RAC felt that
these studies do not address the issue from the riders’ perspective. The RAC therefore formed a special
WMATA Governance Committee to examine the issues in detail and issue its own report.
The RAC is a 21-member body composed of riders from the District of Columbia, Virginia, and Maryland
including three at-large members. RAC meetings and committee meetings are all open to the public. All
RAC members can participate in all committees, including the Governance Committee.
The Governance Committee held 7 public meetings including four roundtables with current and former
Board members and representatives of advocacy organizations. Based on the dialogue at the
roundtables, the RAC believes that there is room for improvement of the current governance structure
of the Board.
The RAC approved releasing this draft report for public comment at its meeting on November 3, 2010. It
will hold a public hearing to solicit public input on November 17, 2010 at 7:00 pm in the committee
room at WMATA headquarters, 600 5th Street, NW, Washington DC. Comments can also be emailed to
[email protected]. The RAC will review the public input and consider a final draft of this report
at its December 1, 2010 meeting.
The draft recommendations include 6 broad, general recommendations with 23 specific
recommendations. The general recommendations are:
1. The Board is analogous to a legislature and should include public officials.
2. The Board should set clear, high standards for its members.
3. The Board should focus on high-level policy and objectives.
4. The Board should act as a regional body rather than as individuals.
5. WMATA’s top staff member should be a CEO rather than a General Manager.
6. Board decision-making should include a clear and accessible public input process.
The RAC believes that implementation of its recommendations will lead to a WMATA Board that focuses
on policy issues, delegates day-to-day decisions to a chief executive, and is more accountable to
WMATA riders and the public.

4
Research into WMATA governance
Existing discussions of governance
There have been a number of editorials in local newspapers, blogs and other media recommending
possible reforms to WMATA’s governance. Much of this interest stemmed from the June 2009 crash on
the Red Line, which triggered substantial scrutiny of Metro.
For instance, the Washington Post published an op-ed by former Virginia Secretary of Transportation
Pierce Homer recommending certain reforms.1 Fairfax City Councilmember Dan Drummond made some
suggestions on his blog, “The Corner Of…”2 In its report, the National Transportation Safety Board
(NTSB) recommended some governance reforms internal to the Board to enhance oversight over
safety.3
In response to this debate, the Greater Washington Board of Trade (BOT) established a task force to
study governance, which was cosponsored by the Metropolitan Washington Council of Governments
(COG). That task force has held a number of meetings, mostly closed to the public.4 They held one public
meeting where individuals were allowed to speak for 3 minutes each,5 and another to hear in more
depth from representatives of the Riders’ Advisory Council, the Accessibility Advisory Committee, ATU
Local 689, the National Transportation Safety Board (NTSB), the Coalition for Smarter Growth, the
Action Committee for Transit, and the Northern Virginia Transportation Alliance.6
In addition, the U.S. Government Accountability Office (GAO) was assigned in July 2009 to conduct a
separate analysis of WMATA governance. That analysis is just getting underway. A representative from
GAO attended three roundtables of the RAC’s Governance Committee.
Process of the RAC committee on WMATA governance
The RAC established a committee to examine the issue of WMATA governance in July 2010. The
committee reviewed the existing written suggestions listed above, TCRP Report 85 (the “Public Transit
Board Governance Guidebook”),7 the report of the Board’s 2006 WMATA Governance Task Force,8 and
the COG/BOT task force’s posted list of resources.9
1 http://www.washingtonpost.com/wp-dyn/content/article/2010/01/16/AR2010011602570.html
2 http://councilmandan.blogspot.com/2010/08/metros-board-needs-shake-up-three-quick.html
3 http://ntsb.gov/Publictn/2010/RAR1002.pdf
4 http://www.mwcog.org/about/governancetaskforce/governancetaskforce.asp
5 http://www.mwcog.org/about/governancetaskforce/Task%20Force%20Docs/070110_summary.pdf
6 http://www.mwcog.org/about/governancetaskforce/Task%20Force%20Docs/17%20sep%202010.pdf
7 http://onlinepubs.trb.org/onlinepubs/tcrp/tcrp_rpt_85.pdf
8 http://www.wmata.com/about_metro/board_of_directors/board_docs/101206_GTFcompiled.pdf
9 http://www.mwcog.org/about/governancetaskforce/resources.asp

5
The committee held meetings on July 28 and August 25, September 15, 20, 22 and 29, and October 20.
All meetings were open to the public and four included a discussion with current and former Board
members and members of advocacy organizations.
The following individuals participated in one or more roundtables:
Current Board members:
Peter Benjamin, Chairman of the WMATA Board and principal director from Maryland
Catherine Hudgins, First Vice-Chairman of the WMATA Board, principal director from Fairfax
County and member of the Fairfax County Board of Supervisors
Mortimer Downey, principal director from the federal government and former U.S. Deputy
Secretary of Transportation
William Euille, alternate director from Virginia and Mayor of the City of Alexandria
Christopher Zimmerman, principal director from Virginia and Vice-Chair of the Arlington County
Board
Former Board members:
Kate Hanley, former alternate member from Virginia (1988-1995 and 1998-2004) and former
Chairman of the Fairfax County Board of Supervisors
Gladys Mack, former principal member from the District of Columbia (1979-1991 and 1995-
2007)
Matthew Watson, former alternate member from the District of Columbia (1988-1992) and
former DC City Auditor
Representatives of advocacy groups and other participants providing input:
Richard Bradley, Executive Director of the Downtown DC Business Improvement District
James Dinegar, President of the Greater Washington Board of Trade
James Dyke, Chairman of the Greater Washington Board of Trade
Dennis Jaffe, Sierra Club Metro DC and first chair of the RAC (2006)
Jackie Jeter, President of ATU Local 689
David Robertson, Executive Director of the Metropolitan Washington Council of Governments
Richard Rybeck, former aide to former Board member Hilda Mason from DC and former District
Department of Transportation official
Stewart Schwartz, Executive Director of the Coalition for Smarter Growth
Tina Slater, Vice President, Action Committee for Transit, reading a statement by Ben Ross,
President of the Action Committee for Transit
Lateefah Williams, political and legislative director for ATU Local 689

6
The following members of the Riders’ Advisory Council and others participated in one or more of the
sessions:
David Alpert, chair of the Governance Committee and DC Vice-Chair of the RAC
Frank DeBernardo, member from Prince George’s County and Chair of the RAC
Victoria Wilder, member from Montgomery County and Maryland Vice-Chair of the RAC
Penelope Everline, member from Arlington County
Christopher Farrell, member from Montgomery County
Robert Petrine, member from Fairfax County
Carol Carter Walker, member from the District of Columbia
Lillian White, member from the City of Alexandria
Kim Kaplan, an Alexandria member of the Transportation Planning Board’s Citizens’ Advisory
Committee, also participated in some meetings following an invitation from the RAC to the CAC
to have one or more CAC representatives participate in the process.
The Governance Committee posed the following questions to participants to frame the issue:
1. What does the WMATA Board do well? What could it do better?
2. What types of decisions are appropriate for the Board to make? What types of decisions are
more appropriately delegated to the General Manager and his/her staff?
3. What advantages/disadvantages do you see in including public officials, appointed individuals
and/or directly elected representatives on the Board?
4. How does the composition of the Board affect WMATA’s ability to secure funding?
After some initial comments by each participant, RAC members asked questions and participants
engaged in an open discussion of the issues.
A summary of the issues discussed at the roundtables is attached as Appendix A.

7
Recommendations
Based on the conversations at the roundtables, the Riders’ Advisory Council feels that it is important for
the Board to consider ways to improve governance. There are many ideas which could improve the
Board’s functioning and relationship to riders, and WMATA stands at a moment in its history when it
needs to take action to restore confidence and address the systemic issues which have been building for
a long time. Funding is one of the largest, but it is not the only one, and improvements to the
functioning of WMATA and its Board can help build public support for new means of funding.
The following are our recommendations:
1. The Board is analogous to a legislature and should include public officials.
1.1. To the extent practical, each rider in the Compact area should have one or more
representatives on the Board who represents that rider in an elected capacity.
2. The Board should set clear, high standards for its members.
2.1. The Board should define, as a written policy, the responsibilities of Board members.
2.2. The Board should set a high standard for attendance at Board and committee meetings,
and incorporate that standard into the Procedures that it adopts at the beginning of each
year.
2.3. Board members should ride rail and bus regularly, and take occasional trips on
MetroAccess to experience that service as well.
2.4. Jurisdictions should commit to appointing members who can commit to meet the
attendance and ridership standards, and removing members who do not.
2.5. Jurisdictions should select public officials for their involvement with budget processes
that could affect transit funding, and their role in land use policy in the vicinity of transit,
especially Metrorail stations.
3. The Board should focus on high-level policy and objectives.
3.1. The Board should spend more time discussing and developing policies on issues such as
land use, fares, budget, and service.
3.2. The Board should set clear, high-level goals for WMATA on issues such as safety,
operations, and customer service, and monitor progress against those goals.

8
4. The Board should act as a regional body rather than as individuals.
4.1. The Boad and General Counsel should clarify that guidance from individual Board
members either at or outside meetings do not have force and the staff should not modify
policy on that basis.
4.2. The Board chair should no longer automatically rotate. Instead, Board members should
elect the best chair each year. Reelection of capable chairs is encouraged for continuity.
4.3. The jurisdictional veto should remain.
4.4. The Board should remain the same size as called for in the Compact today.
5. WMATA’s top staff member should be a CEO rather than a General Manager.
5.1. The top staff position should bear the title of CEO.
5.2. The CEO should bring specific recommendations to the Board.
5.3. The Board should let the CEO make most operational decisions based on Board policies
and direction.
5.4. The CEO should feel free to present any information or recommendations to the Board or
the public he or she feels appropriate.
5.5. The CEO should serve as the primary public face of WMATA.
6. Board decision-making should include a clear and accessible public input process.
6.1. The Board should create a standardized process for soliciting public input and
involvement on decisions before any vote is taken on that decision.
6.2. The Board should develop a clearer policy around staff releasing information.
6.3. The Board should create a clear mechanism for riders to contact individual members.
6.4. Board members should follow up directly on communications from riders and be
adequately staffed to do so.
6.5. All Board meetings including committee meetings and special Board meetings should
include a public comment period at the beginning,
6.6. The Board should repeal the current rule limiting public comment to once every three
months.

9
1. The Board is analogous to a legislature and should include public officials
The WMATA Board is more analogous to a legislative body than to a corporate Board of Directors or the
board of a public utility. However, there are valuable elements of non-legislative organizations’
governance that the Board can incorporate.
Some criticisms of the WMATA Board say that it is too fraught with political conflict. When this
interferes with the Board’s ability to make good decisions, this is a problem. However, it often leads to
better decisions, rather than worse ones.
WMATA must balance the needs of multiple jurisdictions with different interests. It must operate
services that touch riders on a daily basis, where riders expect responsiveness. A legislature is the
political structure best able to meet these needs.
Some proposals for reform of the WMATA Board cite MWAA, public utilities like DC Water, or corporate
boards as examples of governance. One seemingly appealing element of these structures is that they
appear to be much more efficient.
However, this is a false comparison and assumes the wrong objective.
Unlike MWAA, WMATA’s operations are not narrowly circumscribed in a small geographic area which
can be under exclusive control. Unlike public utility authorities, decisions have to be made about how
much transit service to provide, and to whom. Unlike corporations, riders do not have the choice to take
their business elsewhere. Most importantly, unlike all of these, WMATA is not in a position to raise its
own revenue and become self-sufficient.
Proposals to restructure the Board to be more akin to MWAA or a corporation would simply move the
politics under the surface. Instead of the press reporting on the fight over an issue, the press would not
be present. That might reduce the number of tweets about a silly comment by a Board member, but it
would not result in better outcomes.
WMATA does not need to make decisions with less public debate; it needs to make the right decisions.
The needs of diverse jurisdictions must necessarily be a factor. It must also balance the interests of most
efficiently moving trains and buses against broader policy goals, such as access by riders of different
incomes, different geographies, different times of day and different modes of reaching transit.
Simply being a legislature does not mean giving up on making governance more effective. There are
elements of the governance of other, non-legislative bodies that can provide ideas for improving
WMATA’s governance, and in particular the executive.
Recommendation 1.1: To the extent practical, each rider in the Compact area should have one or
more representatives on the Board who represents that rider in an elected capacity.
Ideally, each rider should have at least one elected official representing them on the Board whom they
have the power to vote for or against in an election (presuming they are eligible and registered to vote).

10
Fundamentally, elected officials are most responsive to those who directly elected them. Riders who
have such an official on the Board enjoy the ability to weigh in with a member on policy issues and feel
they will receive a response.
However, given the structure of the region’s governments, it is not possible or practical for all riders to
actually have a representative on the Board, since doing so would require a very large Board (and we
don’t think it should get larger; see Recommendation 4.4), or the service of officials who would not have
the time or interest in serving directly.
For example, in Virginia, no four local officials collectively represent all riders. Only the chairman of the
Fairfax County Board of Supervisors is elected at-large in that county, and she has too many other
responsibilities to serve on the Board. The Cities of Falls Church and Fairfax cannot gain representation
without the Board becoming larger.
However, the current composition in Virginia gives a large number of riders direct representation, by
including two members representing rider-heavy districts from the jurisdiction with the most riders and
at-large members from the next two, and giving all jurisdictions a role through NVTC.
In the District, all riders are represented if at least one at-large DC councilmember serves on the Board.
Montgomery County could have an at-large county councilmember as one of its members. Prince
George’s County has no at-large councilmembers, but could appoint a councilmember, state senator or
delegate whose district contains a large number of Metro stations, bus lines, and riders.
Some worry that there may be an inherent conflict of interest with elected officials seeking benefits for
their constituents versus benefits for the entire region. The RAC heard from several current and former
Board members who explained how they do consider the entire region, largely because their riders
travel throughout the region.
Even if members do focus at times on their own jurisdictional interests, the negotiations between
jurisdictions usually generates a compromise that relatively fairly balances the wishes and needs of
each. Budget negotiations give each jurisdiction some but not all of the elements they want. It may
appear messy, but it is ultimately fair.
Should some Board members be directly elected?
Several participants at the roundtables suggested the direct election of a number of Board members by
voters. This would ensure that members are responsive to rider concerns. Four transit systems have
directly elected boards: Denver’s, the San Francisco Bay Area’s BART, Alameda County, California’s AC
Transit, and Salem, Oregon’s.
However, the committee was persuaded by other feedback raising cautions against this approach. Such
a system would run a great chance of bringing in members without the ability to advocate for funding
with local jurisdictions or influence land use. Candidates might even oppose transit altogether, and
many interest groups would likely try to influence elections. We believe that more specialized functions

11
like the WMATA Board are better suited to elected officials who run on a broader platform or
appointees of elected officials.
2. The Board should set clear, high standards for members
The Board and its members play a number of roles beyond simply directing WMATA. Unlike in many
other organizations, the Board’s role does not begin and end with casting votes on decisions WMATA
must make. Board members also are significant points of contact with riders, and are advocates for
transit in their own jurisdictions, both fiscally and in land use planning. These diverse roles are not a
distraction but an integral part of the Board’s functioning.
Recommendation 2.1: The Board should define, as a written policy, the responsibilities of Board
members.
One theme which became clear through the roundtables is that Board members do not all share the
same view of what the role of the Board is or what it should be, or the responsibilities and qualifications
of Board members.
We recommend that the Board engage in a discussion amongst its members, with staff and with the
riding public, about what we expect from the Board and individual members.
We consider the following to be essential responsibilities:
Participate in discussion and debate at committee and full Board meetings
Cast votes
Listen to rider input
Advocate both publicly and behind the scenes for WMATA’s needs
Educate riders
Experience all three modes of transit service
The ideal Board member should possess many of the following qualities, which jurisdictions should bear
in mind when they select members:
Demonstrated interest in transit
Broad transit knowledge
Interest in interacting with the public
Jurisdictional budget influence
Role and influence over land use policy
High public standing
Ability and commitment to think regionally as well as locally
Time and desire to fully participate in deliberations in committee and full Board meetings
Experience through regular ridership of the system
Current residence in the Compact area

12
Recommendation 2.2: The Board should set a high standard for attendance at Board and committee
meetings, and incorporate that standard into the Procedures that it adopts at the beginning of each
year.
We are indeed “chagrined,” as one roundtable participant put it, by the poor attendance of many
members. With a small Board and many issues to work out which matter so much to so many, it is not
acceptable for members to view attendance as optional.
Some members who rarely attend claim they are working in Metro’s interest behind the scenes. This
rationale is not persuasive. As Ms. Hanley explained, Board membership is far more than casting a vote.
It is an ongoing, active involvement in setting important policy. Members need to be present for most
discussions to understand the past context for present decisions.
The former members said that they had close working relationships with their counterparts in other
jurisdictions. Members today must strive for the same standard. One weakness we heard in our
roundtables was that members often do not talk to each other as much as legislators do in a city or
county board or council.
Membership on the Board should not be considered a political plum to be given to a supporter or an
elected official who wants an extra title. Nor should it go to the highest ranking official in a government
simply by virtue of their position. It should go to those who have the time and interest in making a deep
commitment to addressing WMATA’s needs and working for the needs of riders, and who exemplify the
qualities and can exercise the responsibilities listed in Recommendation 1.1.
Recommendation 2.3: Board members should ride rail and bus regularly, and take occasional trips on
MetroAccess to experience that service as well.
It is true that some members are strong advocates for transit while not riding the system on a regular
basis. After all, some elected officials note, they themselves hear from riders. However, we believe there
is no substitute for regular, direct experience with the system.
We realize that not all members can ride often or on a set schedule, but we think that members should
ride often enough to be familiar with the system and its operations.
Recommendation 2.4: Jurisdictions should commit to appointing members who can commit to meet
the attendance and ridership standards, and removing members who do not.
The August 2, 2010 Examiner article “Metro board members play hooky”10 noted the disadvantages DC
faced in recent budget negotiations as a result of having only one of its two voting members able to
participate in negotiations. Having a member who does not participate and ride transit hurts that
jurisdiction in important ways.
10
http://www.washingtonexaminer.com/local/Metro-board-members-play-hooky-1005888-99658089.html

13
Riders should bear in mind the appointment decisions made by their top leaders, whether county
executives, Governors, the Mayor or Council Chairman in DC, and hold those leaders accountable for
those choices. If a member does not attend meetings or ride transit, it reflects poorly not only on that
individual, but on the person who chose that individual for the Board or allowed him or her to remain.
The federal government should also make a similar commitment when selecting its remaining
representatives. Part of choosing regular riders and those with the time to attend meetings must
necessarily mean choosing individuals who live in the Washington metropolitan area, since a resident of
another city cannot ride the system regularly and Board meetings, budget hearings, and other events
are frequent enough that only those who live nearby can practically participate fully.
Recommendation 2.5: Jurisdictions should select public officials for their involvement with budget
processes that could affect transit funding, and their role in land use policy in the vicinity of transit,
especially Metrorail stations.
The role of a WMATA Board member goes beyond simply operating the Authority. Board members often
act as advocates for transit within their jurisdictions as well as advocates for their jurisdictions within
the Board.
Members advocate for transit in their local jurisdictions in two ways: by setting the budget and by
determining land use.
The most important is representing transit needs in the budget process. When Board members are able
to influence their jurisdictions’ budget processes, a better relationship develops to ensure that WMATA
is responsive to the budget pressures of the jurisdictions and the jurisdiction is also responsive to the
budget pressures of WMATA.
Land use decisions also strongly affect WMATA. The more development happens around Metro stations,
the more riders use the system, increasing transit revenue. It is better when those deciding land use are
also appropriating money for transit, because they have an incentive to maximize the investment.
Where this relationship does not exist, local jurisdictions may lack the same direct incentive to guide
land use around transit. But if, at the very least, an official who is involved with land use policy also
serves on the Board, it ensures that transit is highly considered.
3. The Board should focus on high-level policy and objectives
Current and former Board members uniformly defined the WMATA Board as a “policy board,” but there
was a great deal of variation as to what a “policy board” means. One element, we believe, is spending a
fair amount of time developing actual policies, rather than simply making policy-related decisions on a
case by case basis.
Recommendation 3.1: The Board should spend more time discussing and developing policies on issues
such as land use, fares, budget, and service.

14
The Board currently spends very little time defining high-level policy. Understandably, they are all busy
people and often have to focus on the most urgent matters. However, this creates the perception of
“micromanagement.” The Board needs to devote the necessary time to define broad policies with
which to shape later decisions.
Recommendation 3.2: The Board should set clear, high-level goals for WMATA on issues such as
safety, operations, and customer service, and monitor progress against those goals.
As several members noted, the Board is criticized both for micromanaging and for not being aware of
operating problems. The first can be addressed by developing policies. The second is a consequence of
the Board’s agenda, which almost exclusively covers issues requiring immediate attention.
The new “Vital Signs Report” is a laudable innovation, but it also reveals how on many metrics, little has
changed. Staff told the RAC that the target level for metrics were based on past experience or set
somewhat arbitrarily.
The Board should decide which of these “vital signs” it wants staff to improve, and direct the General
Manager to identify what would be necessary to make progress in those areas. Together, the Board and
General Manager should then establish achievable yet meaningful targets, and judge the General
Manager in his or her annual performance evaluation based on progress against those goals. Further,
we recommend that the Board discuss progress against these goals at least quarterly.
This would address many of the criticisms around safety in particular. Safety does not lend itself to
decision-making based on urgency, because safety is never urgent until there is a problem with safety. If
the Board works with the General Manager to set objectives and tracks progress, then the Board can
ensure tangible improvements so that safety is never an afterthought.
4. The Board should act as a regional body rather than as individuals
Recommendation 4.1: The Board and General Counsel should clarify that guidance from individual
Board members either at or outside meetings do not have force and the staff should not modify policy
on that basis.
The Board should adopt the policy that Ms. Hanley described from the Fairfax School Board: the
members have power when they act as a group, but not individually.
In the budget negotiations, staff often modified their recommendations based on statements of
individual Board members. They were trying to identify a budget compromise that they thought would
garner sufficient support, but this made the whole budget a moving target for other members.
On an issue like the budget, the CEO should present a recommendation based around what he or she
thinks is best, not based on what he or she thinks will win votes. There can be a variety of other
alternatives presented as well. If the Board wants to make changes from the recommendation, they can,
but they should do so on their own, potentially negotiating to trade off different proposals instead of
having the staff simply take one off the table preemptively.

15
Board members are free to meet privately with staff and try to influence them to modify a proposal, and
staff are free to make changes, but they should treat this in the same way as they would a meeting with
any other advocate. If they are persuaded by new information on its merits, they should make a change.
If they are not, and still believe the original recommendation is right, they should continue presenting
the original to the Board until such time as it votes as a whole to disapprove that plan and/or adopt a
different alternative.
Recommendation 4.2: The Board chair should no longer automatically rotate. Instead, Board members
should elect the best chair each year. Reelection of capable chairs is encouraged for continuity.
The Compact only compels the Board to hold elections for a chair, but prescribes no rotation.
Nevertheless, the chair has rotated among the six seats annually by convention.
It is important to give the Board some stability from year to year. The Board should elect a member that
has the support of all jurisdictions.
Having a new chair each year means that the Board’s procedures have changed frequently. Committees
have changed in number and size. Some chairs have set goals for the year, others have not. Some have
controlled agenda items and information disseminated to fellow members or the public, while others
have not.
A real election instead of a strict rotation will push members to choose a chair who has a good
relationship with all and who holds a regional perspective. If there is a true contest for chair and one
jurisdiction’s member must win, it creates a need for members to act in a more regional way to win
support from their colleagues.
Ideally, such a member would maintain the support and trust of colleagues so that the chair would
change less frequently than once per year. Another suggestion was to create a longer, fixed term of
office for the chair.
Recommendation 4.3: The jurisdictional veto should remain.
The veto may rankle and appear to create the opportunity for “gridlock,” but WMATA is above all else a
cooperative endeavor between three signatories with their own interests. It must ensure that no one is
put at a disadvantage to ensure ongoing support from leaders and residents of all three. Messy as it is,
the veto is necessary and should stay.
Recommendation 4.4: The Board should remain the same size as called for in the Compact today.
It is a truism of group dynamics that smaller groups are more effective at making decisions than larger
ones. At 12 members, the Board was adequately sized to make decisions. Now, at 14, it is still able to.
Hopefully the future increase to 16 will not impair this.
However, giving additional voice to the many Virginia jurisdictions that could demand representation
would further grow the Board. DC and Maryland would need comparable increases.

16
We believe that an increase beyond 16 members would be detrimental to the effectiveness of the
Board. If any Compact changes come under consideration, they should not involve enlarging the Board.
5. WMATA’s top official should be a CEO rather than a General Manager
If the Board plays a legislative role (see Recommendation 1), then the head of the staff must play an
executive role. That executive function should be strong, making the CEO the primary leader of the
organization.
Recommendation 5.1: The top staff position should bear the title of CEO.
We agree with Mr. Downey that “General Manager” connotes a “hired hand” who simply obeys orders
from the Board and makes the trains run on time. Renaming the position is the smallest but first step in
changing the perception of this office.
The CEO can certainly hire an official who assumes more of an operational role, ensuring that the
specific functions of WMATA are carried out day to day. Such a person could hold the title of Chief
Operating Officer, General Manager, or something else.
Recommendation 5.2: The CEO should bring specific recommendations to the Board.
The CEO should act as the visionary and leader for WMATA. He or she should recommend a course of
action on long-term and short-term issues and bring them to the Board for approval, rather than waiting
for the Board to point the way.
While the Board should set policy, the CEO should also formulate potential policies and bring those to
the Board as recommendations. The Board can then modify the policies, but should have a clear
recommendation from the CEO.
On issues such as budgets and contracts, the CEO should make a recommendation and then stand by it
until and unless the Board makes modifications.
Recommendation 5.3: The Board should let the CEO make most specific decisions based on Board
policies and direction.
The Board should hire a CEO it believes will make the right decision most of the time. When the CEO
comes to the Board with a recommendation, the Board should expect that in most cases it will approve
the recommendation. If that confidence wanes, the Board should replace the CEO rather than second-
guessing more of his or her decisions.
Several Board members told the Governance Committee that this is current practice, but at least
following the Red Line crash, it has not appeared that way. The Board should go on public record that it
intends to govern in this manner.
Recommendation 5.4: The CEO should feel free to present any information or recommendations to
the Board or the public he or she feels appropriate.

17
Leading up to the 2011 budget process, the Board provided budget guidance in the form of a resolution
that mandated the General Manager present a budget containing no jurisdictional contribution
increases and no fare increases beyond the 2-year cost of living increase.
As a result, the General Manager initially released only a single budget with enormous service cuts,
which later evolved into a budget with all of the elements the Board guidance had prohibited but no
service cuts.
Leaving aside the question of whether or not the Board should have provided this guidance or whether
the General Manager interpreted it to be constraining him more than he should, this is not the proper
relationship between the CEO and the Board. The CEO needs to be able to present realities, pleasant or
unpleasant, to the Board, and a number of options, whether politically comfortable or not. That means
the Board should not try to discourage the CEO from bringing forth any recommendations and the CEO
should not feel constrained from presenting potentially unpleasant facts or difficult choices.
The Board Chairman and other members should not be making these types of requests. Their role is to
listen to what the CEO is saying and give feedback, and ultimately approve or reject the proposal. They
should not be preventing the CEO from asking or from sharing anything with the other members. To
ensure this is clear, the Board should add a formal policy on the subject to their operating procedures
which are reviewed and updated annually.
Recommendation 5.5: The CEO should serve as the primary public face of WMATA.
In a corporate setting, the CEO is the person who most often represents the company on TV, in the
press, at Congressional hearings and in other public venues. In a city, the mayor often fills this role,
though the council head often does as well, in that case often because both have political standing and
ambitions.
In recent years, the General Manager has often been a less visible public figure than the Board chair.
John Catoe had few direct contacts with the press. Richard Sarles is currently serving in an interim
capacity, and perhaps partly as a consequence is not doing much to raise his public profile.
The Board should clearly define the role of the Board chair relative to the CEO. The CEO should be the
one to go on television or the radio, and should give interviews. He or she should play the role of the
most visible WMATA official.
Should the CEO be a member of the Board?
Some individuals and organizations who support elevating the GM/CEO role have suggested making the
CEO a member of the Board, possibly even as its chair, as is the case in some other transit systems like
the New York MTA.
Without such a change, there will be an inherent and perhaps inevitable tension between the value of
having the CEO tell the Board what they don’t want to hear, and the desire of the CEO to please those
who have the power to fire him or her. It will require some restraint and clear agreement by the Board

18
to avoid the temptation to take over the spotlight, or start deciding more minor details, or to clash with
an independent-minded CEO. Riders, advocates, and local jurisdictions will need to maintain the strong
expectation with Board members that they treat the CEO like a CEO.
6. Board decision-making should include a clear and accessible public input
process
The more the Board is focused on policy, the more each individual decision impacts riders in long-term
ways. Policy decisions should not be made lightly or based on initial impressions at a meeting where
Board members have not had any opportunity to hear from the public.
In addition, in Recommendation 5 we encouraged the Board to delegate more decisions to the CEO and
in Recommendation 3 to concentrate more on policy. The question remains how to ensure the Board
resists the temptation to tinker with the mechanics of individual issues and lose focus on policy.
In a legislative system, one check on a legislature’s propensity to micromanage issues is its process for
making decisions. Most legislatures require public notices and hearings before making decisions. Should
the Board institute similar requirements?
At first blush, it would seem that any mechanism that slows down Board decision-making might reduce
WMATA’s efficiency. However, if Board decisions require a period of time and a public process, it could
push the Board to actually decide fewer yet more significant items, and to delegate the operational and
more immediate issues to the CEO.
Therefore, in keeping with the legislative theme of Recommendation 1, we suggest that the Board adopt
a more legislative process. Some types of decisions can be done quickly, but most other issues should
require public comment. If that necessitates more steps in the decision-making process, that can be an
advantage.
Recommendation 6.1: The Board should create a standardized process for soliciting public input and
involvement on decisions before any vote is taken on that decision.
Currently, agenda items appear on the Board website six days before a meeting, in most cases. Riders
can, if they are paying close attention, see this information. If they know how to contact their Board
members, they can weigh in. Often, members make their decisions at that meeting.
The Board should modify this process to require public input before taking a vote. This could happen in
one of two ways. First, staff could release the information publicly with a longer lead time, announce it
publicly, and develop a formal way for people to weigh in. Alternately, staff could present it to a
committee but the committee would not vote. After that, the Board could solicit input and then take a
vote at a subsequent meeting.
The input itself could take a variety of forms. It could involve public hearings, or posting items online and
in public places and allowing feedback via a Web site or phone number. Another option would be for the
Riders’ Advisory Council to play an increased role.

19
Recommendation 6.2: The Board should develop a clearer policy around staff releasing information.
Participants in the roundtables explained that staff sometimes feel a tension between the chance of
getting reprimanded for not soliciting rider input before presenting something, and the chance of
getting reprimanded for talking about something to members of the public before the Board members
have had a chance to review it.
Board members shouldn’t reprimand staff for either of these actions. The Board should do more to
define what it expects from staff and from riders. Sometimes one member of the Board expects one
thing and another member expects something else. The Board should work to reach consensus on when
information should be released and how to elicit public feedback.
Recommendation 6.3: The Board should create a clear mechanism for riders to contact individual
members.
Riders who live in jurisdictions with elected officials on the Board can send comments on policy to their
members via the publicly accessible contact information every elected official maintains. Riders whose
representatives are appointed have no similar clear venue.
Today, riders can contact [email protected], but there is no assurance that riders will
receive a reply, which members will get the message, or who will reply. Some emails on policy issues
end up going to the customer support staff and yield a staff response rather than going to a Board
member.
The Board should create a process for any rider to send a message to any particular member. One easy
way would be to create a Web form on which riders can select a member or their jurisdiction from a
drop-down and then enter a comment to go to the member.
As several participants in the roundtables pointed out, in a legislative system (see Recommendation 1)
representatives actually play two roles. One is to set policy. The other is to help constituents with issues
when the standard administrative procedure has not functioned. For example, Congressmen help
people whose Social Security checks have not arrived due to bureaucratic snafus.
This is not a distraction but rather a valuable way to increase public confidence in an institution. The
better the standard customer service system becomes, the less members of the public need to reach out
to their representatives, but inevitably there are some cases where the standard system breaks down
and it becomes necessary.
In its process of defining its role and that of members in recommendation 2.1, the Board should include
the “Congressman role” among those expected of Board members.

20
Recommendation 6.4: Board members should follow up directly on communications from riders and
be adequately staffed to do so.
Riders who contact their representatives expect to receive a reply from that individual, even if that reply
is actually composed by a staff member. Even so, those replies generally bear the name of the
representative, telling the rider at the very least that the representative is generally aware of the issue
and has authorized the response.
WMATA Board members should do the same. Naturally, this expectation would create some work for
members. If necessary, therefore, they should have adequate staff to handle these inquiries.
Some members may feel they are adequately staffed today, while others may not. For those who are,
the existing staff can handle the communications.
For those who are not, we suggest adding some staff inside the WMATA headquarters. This could
include employees dedicated to an individual Board member or a member and alternate pair, or shared
staff in the Office of the Board Secretary, or other arrangements.
Recommendation 6.5: All Board meetings including committee meetings and special Board meetings
should include a public comment period at the beginning,
The public comment period at the beginning of each Board meeting was added in 1995 as a
consequence of the same Sierra Club advocacy that resulted in the Riders’ Advisory Council. However,
the public comment period only exists at the start of each full, regularly-scheduled Board meeting.
In reality, many Board members make up their minds and give guidance to staff at committee meetings.
However, committee meetings have no public comment period. Likewise, “special Board meetings” have
no public comment period either.
The Board should provide the opportunity for members of the public to speak with them before each
meeting, regardless of its size or whether it is “special.”
Recommendation 6.6: The Board should repeal the current rule limiting public comment to once every
three months.
A little-known provision of current Board procedures restricts any individual from speaking during the
public comment period more than once every three months. The Board should drop this provision.
This inherently assumes that the testimony from the individuals at public comment is burdensome
rather than useful. After all, if someone has useful input to the Board, wouldn’t it be useful during two
adjacent meetings as well as when spread out more widely?
In fact, public comment input has often informed Board debates and even led to new policies. Even if
some individuals’ comments are not as informative, listening to the public is part of the responsibility of
legislators. After all, the agency runs on public money and members of the public pay the fares.

21
Appendix A: Summary of feedback from RAC hearings
The Board relates to three other groups: jurisdictions, riders, and the General Manager and other staff.
The feedback at the roundtables can generally therefore be grouped into these three categories, plus a
fourth: Who should serve on the Board, to best accomplish the needs from the three relationships?
The below statements are not verbatim quotations from the participants, but paraphrases based on
notes. These are grouped into topics to make it easier to understand the discussions, but for any
particular topic, the various comments often occurred at separate meetings, each of which had different
participants testifying. Except when a word like “replied” is used, the statements do not necessarily
relate to each other as those making them may not have heard the others.
How should the Board relate to jurisdictions?
Historical perspective
A number of participants talked about how WMATA’s reputation has shifted over time.
Mr. Benjamin talked about how Metro’s original purpose was to build a rail system rather than to
operate it or run the bus system, but he feels the Board has risen to the subsequent challenges and had
been viewed positively until the June 2009 Red Line crash.
Following the crash, the public perception changed, Mr. Benjamin said. He explained how he could
attend a party before the crash and people would say positive things, while now people talk about
Metro’s problems. He said he doesn’t believe the Board’s actions changed over that time period.
Ms. Jeter replied that she felt there had been “cracks” in the system all along, but people weren’t paying
as close attention. Also, the system is aging, which exposes problems to a greater extent.
Ms. Hudgins also spoke to this topic, noting that some of WMATA’s biggest challenges involve
communication, which wasn’t as necessary when the system was newer and everything worked better.
The declining maintenance condition has forced more interaction with the public.
Need for funding
Several participants said they felt that the primary issue facing WMATA is one of funding, and some
argued that an examination of governance is missing the key issue.
Mr. Zimmerman said he feels that discussing governance simply gets away from talking about the
fundamental problems of funding. The system needs “vast amounts of money,” is not getting it, and
little is being done currently to set up a revenue source.
Therefore, advocates are discussing governance, which is academically interesting but, Mr. Zimmerman
argued, is not likely to result in any actual changes nor fix the deeper issues.

22
Ms. Hudgins noted that any private sector company would have invested in its infrastructure to a
greater extent over time.
Mr. Euille said that with more money, WMATA could “run like Microsoft,” but in the absence of money
it faces many challenges with an aging system.
Ability to advocate for funding
Many participants directly linked the current funding structure to the representation of local
jurisdictions on the Board.
Mr. Benjamin explained the history of Maryland’s representation. At first, Montgomery and Prince
George’s Counties paid some of the cost of Metro, and the county executives appointed the principal
directors. In 1992, the state took over that funding responsibility, and the Governor began appointing
the principal directors while the county executives appoint the alternates.
Ms. Hanley said that Virginia localities have to be represented on the Board because they are the ones
that appropriate money out of the general fund, and other money for Metro comes from dedicated
Northern Virginia-only taxes like the add-on gas tax. As long as localities and residents of the local
jurisdictions are primarily paying for transit, they will expect representation on the Board.
Mr. Zimmerman said there is an advantage to having elected officials on the Board, since they are more
directly connected to the budget process and can work to get more money allocated, as happened
during the FY2011 budget where Northern Virginia jurisdictions were the first to increase support for
Metro.
Ability to tie land use to transit
Another way Board members often interact with local jurisdictions is in the discussions over
development at and around Metrorail stations. Local jurisdictions hold the zoning powers to decide land
use, which affects Metro’s budget since greater development around stations leads to more ridership
which increases fare revenue.
Mr. Schwartz noted that elected officials who serve on the Board are in the position of both having an
involvement with Metro and also an involvement in local land use decisions. He said that gives them a
greater understanding of transit-oriented development and the ridership benefits that come with that
development, which benefits Metro.
Jurisdictional veto
There was a significant amount of discussion of the jurisdictional veto. Almost all participants supported
retaining the veto.
Mr. Zimmerman analogized the veto to a provision in the U.S. Constitution like the bicameral legislature.
He said it was a necessary element to get the three signatories (DC, Maryland, and Virginia) to agree to
the WMATA Compact. Any of the three wouldn’t participate if they feared the other two would outvote
them on important issues.

23
Mr. Benjamin said that without the veto, any two signatories could agree to change the funding formula,
which allocates costs among the various jurisdictions, to the detriment of the third.
Ms. Hudgins said that new Board members often assume the veto will be burdensome, but that instead
of being “overpowering,” it often functions as “collaborating” by making sure the jurisdictions work
together to find a solution instead of simply deciding on a divisive majority vote.
Mr. Benjamin also said that the veto is rarely used, and that a bias exists against using it.
Ms. Mack pointed out that the veto can only be used to “pause” progress instead of make progress. She
said it sounds worse than it works in practice.
Ms. Mack also noted that DC is often the jurisdiction that feels most vulnerable, because it and Arlington
are more central and urban than the outer jurisdictions and its riders therefore have different needs
than those from Maryland and outer jurisdictions in Virginia.
Mr. Watson relayed an example when most of the system had been constructed but not the Green Line
between U Street and Fort Totten. There was a desire for trains from Greenbelt to switch to the Red
Line and run to Farragut North, a service pattern that was ultimately adopted for a period of time.
However, DC was fearful that this would result in the inner Green Line being cut for cost reasons, and
thus used the veto to prevent this service pattern until contracts were issued for the construction of the
line.
Reactions: Mr. DeBernardo pointed out that even if the veto is officially used only rarely, it is often
threatened, similar to the way the filibuster is threatened but not formally used in the U.S. Senate.
Mr. Alpert noted that while it is only a tool to slow things down, sometimes that leads to a certain
brinksmanship where one or more jurisdictions holds up an important decision, like the budget, in order
to exact concessions as the danger of delay becomes great.
Hazards of the veto
Some participants pointed out potential dangers in the veto.
Ms. Hanley suggested that the veto should only be used in important situations. If a jurisdiction
threatens to veto over other matters, it can cause gridlock.
Mr. Ross’s statement (as read by Ms. Slater) also talked about a potential for gridlock, and noted the
paralysis of the Washington Suburban Sanitary Commission as an example. He also worried that
members could use the veto power to assert control over hiring or procurement decisions.
Mr. Ross’s statement further noted that the original Compact provided for members to be chosen
independently, such as by the two separate county executives in Maryland, but that has changed as the
Governor of Maryland now appoints both members. Consequently, members from other jurisdictions
now vote more often in concert, making it more likely the veto will be used.

24
Mr. Ross’s statement pointed out that the Maryland secretary of transportation effectively holds the
veto power on his or her own since he or she controls the Maryland Board members. While they have
been dedicated public servants and not tried to improperly use the veto power, he said “governmental
structures should not be designed for angels.”
Reactions: Committee members appreciated these dangers but felt that there is little alternative to the
veto. They did not feel that separately chosen members would make a significant impact on the veto
and that there is no way to limit it to the truly important issues as there is no clear definition of an
important issue. For example, the case Mr. Watson cited about the Green and Red Line service could
seem to be a less important issue, as it only pertained to the running of some trains in a way that purely
added rider value. However, DC considered it very important since it could have impacted the
construction or cancellation of a line segment entirely inside its borders.
How should the Board relate to riders?
Need to educate riders
Several participants cited education of riders as being a role of the Board that should not be neglected.
Ms. Jeter said that education of the public on transit is a missing element today.
Mr. Benjamin and Ms. Mack said that riders need to have more education on how the system works and
why it costs what it costs to run it. Mr. Benjamin relayed an example of one person at a budget hearing
who accused the Board of cutting costs and service or raising fares so that it could pay more money to
shareholders. (There are no shareholders and WMATA does not generate profit.)
Ms. Hanley said that just as a more educated electorate often makes better decisions when voting, a
better educated riding public can better give input to the Board.
Role like a Congressman
Mr. Zimmerman said that large bureaucracies face an “inherent limitation,” in that they need
hierarchical structure to be efficient, but which also can cut down on responsiveness to those on the
outside. He said that people within the organization may want to help an individual but also have to
respect the structure and the roles of others who are in charge of that area, and that sometimes the
decisions are policy ones which they cannot make on their own.
Therefore, Mr. Zimmerman suggested that one important function of a Board member is analogous to a
Congressman, who is formally responsible for voting on legislation but also spends considerable time
helping constituents with problems that the regular bureaucracy doesn’t solve. He called this an “escape
valve,” and said it’s necessary for there to be public support for the bureaucracy.
As an example, Mr. Zimmerman said that Board members sometimes deal with issues where a bus often
doesn’t show up, but the supervisor is rationally focused on other performance metrics. He argued that

25
no system can function without some people in the role of a legislative representative who can get
involved when necessary.
Releasing information to riders
One question posed at some roundtables related to the way WMATA discloses information about
performance. Staff often seem reluctant to release information, sometimes believing they are not
allowed to share it until it has been presented to the Board.
Ms. Hudgins agreed, saying that the agency often acts with undue caution about when to release
information, who to release it to, and how much to share. She expressed a desire for WMATA to be
freer with information that is not confidential, proprietary, or subject to policy debate.
Ms. Hudgins also said she would like to ensure that information also goes to the Board so that they are
not surprised to see it in the press. She suggested the Board and General Manager reach some
understanding about this process, to avoid the public thinking of the agency as “impenetrable.”
Mr. Zimmerman said he thinks WMATA can do a better job of “communicating and being communicated
to.”
Ms. Hanley argued the Board needs to do more in this area, saying, “Sunshine needs to be first, not
last.”
Need for public input
A number of participants noted how the Board often makes policy decisions on issues without having
much or any opportunity to hear from the public.
Mr. Watson said that the public should not be surprised by any policy decisions the Board is making on
any particular day.
Ms. Hanley said that the Board often only starts focusing on an issue the day they’re going to hold a
vote, either in committee or at the full Board. She suggested the Board take time to listen to people and
get feedback earlier in the decision-making process.
Mr. Downey pointed out that agenda items are typically posted online the Friday before a Board
meeting.
Mr. Zimmerman said that he often asks staff what the RAC thinks of an issue, even knowing that staff
has not asked.
On the other hand, Mr. Zimmerman noted that staff face a dilemma between the need to share
information and the possibility of it getting them in trouble with Board members for not showing the
information to the Board before releasing it publicly. Therefore, staff often wait until an issue is fully
analyzed, which sometimes means they do not tell Board members either.

26
Reactions: The Governance Committee discussed this issue significantly at its followup meeting. Some
noted that other agencies use longer timelines for discussing issues, compared to WMATA where an
issue goes to the full Board just two weeks after a committee meeting, and given the posting of agendas
the Friday before, that can be just eight days after. Some agencies use a six-week process.
Ms. Everline said she thought that two weeks was too quick. She said when she was on a hiatus from
working, she could keep up with issues before the Board posted 6 days before a committee or full Board
meeting, but that she thinks most people who work full time would not be able to even become aware
of most issues in that time frame, let alone review materials and provide comment.
Ms. Walker suggested looking to federal rulemaking processes which have longer periods for public
comment.
The Governance Committee also discussed the DC Council’s process, which requires hearings but allows
for “emergency” legislation that circumvents that process. However, “emergency” legislation requires a
supermajority to declare an “emergency” and must expire after a fairly short period of time unless it is
extended through the permanent process.
Opportunities to communicate with the Board
Mr. Jaffe pointed out that Board members who are elected officials have more evident ways to be
reached. They are often more well known and get stopped in public places like supermarkets. Also, they
have email addresses posted on their public Web pages.
Meanwhile, Mr. Jaffe noted that there is no way to directly reach an appointed member. There is an
email address, [email protected], which goes to the Office of the Board Secretary.
Reactions: Mr. Pasek informed the Governance Committee that the emails to
[email protected] are all presented to Board members in a spreadsheet each week.
Ms. Everline said that she has sometimes emailed that address and not received any reply.
Staff for Board members
Some participants talked about whether Board members need additional staff to assist them in their
role in interacting with and advocating for riders.
Mr. Jaffe suggested that Board members receive additional staff. He pointed out that elected officials
use their elected office’s staff to communicate with constituents on Metro issues, but that appointed
members have no such resource.
Ms. Hudgins said that she has a dedicated transportation staff person who works for Fairfax County, but
that person is focused on Fairfax’s interests, and that it could be beneficial to have greater staffing at
Metro.
Reactions: Ms. Walker suggested there could be an intermediate process between submitting a
customer service form, which most riders feel disappears into a black hole, and actually getting a Board

27
member involved. Perhaps there could be some staff members who are more visible to riders for
complaints.
Need for public standing
Mr. Jaffe also pointed out that either the Board or General Manager should be in a position to rally the
public behind an agenda. He said this requires members who have “high public standing and
accessibility.”
How should the Board relate to the General Manager?
Policy Board
Many current and former Board members expressed a clear sense that the Board is a “policy board.”
Mr. Benjamin said that in testimony to Congress and the NTSB, he was repeatedly asked why the Board
wasn’t aware of various specific details, and that he replied that they are a “policy board.”
Micromanaging vs. effective oversight
Mr. Benjamin said the Board is often accused of micromanaging, but that he isn’t sure he or anybody
else knows what micromanaging is. He doesn’t think people would be happy if the Board only met
quarterly and only discussed “great and ethereal policy issues.” On the flip side, he doesn’t think people
want them to decide “who should be hired, who should be fired, and how the bus operators should sit
in their seats.”
Mr. Zimmerman said he hears two major criticisms of the Board. One is that they micromanage too
much, and the other that they are not paying close enough attention. He said the NTSB, for example,
wants the Board to have known about technical details around safety, but also criticized it for
micromanagement. He argued that these are “completely contradictory.”
Ms. Jeter said that many of the issues the Board focuses on should be in a day to day category better
handled by staff, but that the Board should be spending more energy on safety, on ensuring compliance
with OSHA rules, NTSB recommendations, and workmen’s comp rules.
Mr. Dyke relayed a statement by NTSB Chair Debbie Hersman that she didn’t expect Board members to
become track inspectors. However, he said the Board could metaphorically pound on the table and
make it clear that they are serious about safety and the lack of a safety culture, and ask staff what they
can do to ensure both.
Need to set goals
Some participants suggested the Board do more to set high-level goals and objectives and monitor
progress against those, in addition to simply being reactive to items that come before them.
Mr. Downey said the Board needs to take on a higher level role, setting parameters and giving reactions
to items instead of “trying to … hit at pitches as they come in.”

28
Ms. Mack encouraged the Board to create a process for setting objectives and monitoring progress
against them. The objectives could appear on the General Manager’s evaluation each year.
Mr. Bradley recommended that the Board give staff performance measures and ask them to meet
those. He said that his board at the Downtown BID just approves a general direction and budget, and
judges his performance as Executive Director, but isn’t more involved day to day. He thinks the WMATA
Board should follow a similar model.
Need to set policy
Related to this, many participants discussed how much the Board should be defining more general
policies outside of individual cases, but that would guide actions on individual cases.
Ms. Hanley said Board member should spend more time talking about issues when they are not facing
an immediate vote.
Mr. Downey suggested the Board do more to set general policies. On fares, for example, he
recommended the Board decide if they want fares to reward regular riders, giving bigger discounts to
those who ride every day, or support tourists, or something in between.
What the Board shouldn’t do
Participants gave several examples of issues they believe the Board should not get involved in.
Mr. Watson listed the colors of seats and carpeting in railcars as items the Board should delegate to
staff. He said the Board used to worry about such issues.
Mr. Benjamin said that over the last 5-6 years the Board has backed away from deciding several specific
types of issues which they believe should be delegated to staff. He said they now stay away from
decisions about hiring of top managers below the General Manager and in procurement decisions.
Mr. Downey criticized the Board’s discussion in August of fare policy concerning letting SmarTrip cards
go negative. He said such issues cannot be discussed well in the Board context, and is too detailed and
complex for them to try to resolve.
Power of individual members
Ms. Hanley explained how the attorney for the Fairfax County school board spoke to new members
when she joined in 1984, and made it clear to them that they have no individual authority, only as
members. They cannot promise to change anything or direct staff to take any actions. They can only act
as a body.
Ms. Hanley suggested the WMATA Board also have a clear framework that they have no individual
authority, and that if a member asks staff to take action on a policy issue, the staff should insist that the
guidance come from the full Board instead.

29
General Manager versus CEO
Participants at one of the roundtables spent significant time discussing the role of the General Manager.
Ms. Hanley said the Board should hire a General Manager they can trust, whom they respect, and then
let that person do the hiring and make most decisions. She argued the Board should recognize that if the
General Manager is recommending something they probably have good reasons, and should avoid
undermining the GM.
Mr. Downey suggested the General Manager be considered a CEO. Changing the name is only a part of
that distinction. He said “General Manager” is a 50-year-old term which implies a “hired hand” to simply
make the trains run, and that WMATA needs more than that.
Mr. Downey added that many Board members have suggested bringing in a CEO type person, but that
would also mean giving the CEO wider latitude and to have the CEO represent the organization to the
public and outside groups.
A question was asked about the FY2011 budget process, where the Board passed a resolution on budget
guidance that limited the General Manager to producing a budget that contained no jurisdictional
subsidy increases and no fare increases beyond a two-year cost of living increase.
Mr. Downey said that if the Board wants a CEO, they will have to be willing to listen to what the CEO
says, and hear things the way they are. The CEO has to have the freedom to lay out options for the
Board to choose among.
Role of the Chair
Participants discussed who the Chairman should be and whether the position of chair should rotate as it
does today.
Mr. Downey added that he would prefer to see a structure similar to New York’s where the CEO is also
the Chairman of the Board.
In his editorial, Mr. Homer had suggested the chairman serve for a fixed term longer than one year
instead of maintaining the annual rotation among jurisdictions. He suggested a chairman selected
through some other process, such as by agreement between the governors and mayor of the three
Compact signatories.
Mr. Jaffe noted that in the Port Authority of New York and New Jersey, the Governor of New York
appoints the executive director, while the Governor of New Jersey appoints the chairman.
Reactions: Mr. DeBernardo suggested that not having the chair rotate among jurisdictions, but allowing
members to select and re-elect any member as chair, could promote a more regionalist perspective.
Board members would have to select someone who they felt would not be parochial, but who would
consider a wider perspective.

30
Who should serve on the Board?
Much of the discussion surrounding governance has involved what people and what type of people
should comprise the Board.
Value of elected officials
Most of the participants praised the value of having local elected officials serve on the Board.
Mr. Watson, who was not an elected official himself, said that Metro is a political organization and
always will be. He also thinks it should be, because there are many policy questions which require
political judgment. He thinks that local elected officials should remain on the Board.
Mr. Zimmerman said that riders are best served when people on the Board are answerable to the public.
Mr. Jaffe said with few exceptions, elected officials are accessible to riders while appointed members
are not accessible.
Mr. Schwartz said his organization likes having elected officials on the Board because they are more
responsive, more accountable, and more transparent. He also added that the Virginia members, who
are all local elected officials, were the leaders in increasing jurisdictional contributions on the budget.
Meanwhile, Maryland’s members had little authority. Advocates had to go to the Governor, and to
reach the Governor they had to reach the Secretary of Transportation.
Appointed members
Some participants also praised having some appointed members, especially alternates.
Mr. Watson said that he would like to see a professional class of “technocrat” members. He said that
Bob Ostrum from Prince George’s County, who was a former county attorney, and himself, a former DC
city auditor, were appointed as individuals who had government expertise but were not incumbent
politicians. He felt that this helped the jurisdictions to have professionals with the time to analyze policy
and also to have people not interested in “the sound bite.”
Value of a mix
A number of participants praised having some combination of elected officials and appointed members.
Ms. Mack said there is no one type of representative who functions better than another. She said it’s
important to keep elected officials on the Board, who bring one constituency to the Board, and
appointed officials who bring a “public perception” to the Board.
Mr. Watson said having public officials “increases the prestige” of the Board, and gives allies and
spokespeople inside the local governments, but that he would make the alternates appointed members
to lend more professionalism to the Board.

31
Mr. Schwartz suggested that Montgomery and Prince George’s Counties consider appointing elected
officials as their alternate members because the principal members in Maryland are already appointed.
This would provide for a mix.
Should members be paid?
There had been negative press recently around the fact that a few Board members were being paid
while most are not. WMATA does not pay Board members. Marcel Solomon, the alternate from Prince
George’s County, was making $39,656.90 from the county for his service.
Mr. Zimmerman noted that Virginia members get $50 for each meeting, which is a nominal amount.
They also must attend the meeting to collect this stipend.
Mr. Watson said he had been paid by DC, as had Bob Ostrum from Prince George’s. He said this helped
them devote most of their time to their role on the Board. He suggested appointed alternates should be
paid.
In his blog post, Mr. Drummond advocated for banning the practice of paying members. He called Board
membership a “public service where people should be honored to serve through appointment.” He said
a small stipend is fine but “the salary of a first-year teacher” is unacceptable.
Directly elected members?
Some participants suggested the option of directly electing members of the Board, but all current or
former Board members who spoke on the subject gave negative reactions to the concept.
Mr. Jaffe said he saw value in having members be elected directly by riders.
Mr. Ross, in his written comments, suggested analyzing this option.
Mr. Zimmerman said that three boards in the nation have directly elected members, Denver’s, the San
Francisco Bay Area’s BART, and AC Transit, the bus system for Alameda County, California. (Alameda
County contains Oakland and Berkeley and is also part of the BART service area. In addition to these,
Salem, Oregon also has an elected board.)
Mr. Zimmerman warned against having directly elected members if they lack the ability to fund the
system. Otherwise, he said, people will run on the idea of improving service but be unable to bring in
the necessary money. In that case, he said the role would be more like running for student government.
Mr. Watson said it would be a horrible mistake to have directly elected officials. He said much “common
wisdom” is plain wrong, and worries people would campaign on ideas that sound reasonable but which
are entirely incorrect. As an example, he pointed to a case where Congress insisted freight trains travel
only 5 mph near transit tracks after a spate of freight trains derailing. However, freight trains are
actually less stable at low speeds.
As another example, Mr. Watson said that, while the last bus or train of the day often draws light
ridership, many people are willing to stay out late and take a bus or train a bit earlier just having the

32
comfort that the last run is available afterward if need be. However, many people don’t recognize that
and he expressed concern elected members would campaign on a platform such as removing the final
run not realizing its impact on ridership at other times.
Mr. Downey said most elected boards are terrible, with a couple being mediocre. He noted that some
cities have had anti-transit activists seek election, and in one city, they took over the board entirely.
Other people run solely with the ambition to reach higher office.
Representation by the State of Virginia
There was considerable discussion of the recent request from the State of Virginia to NVTC to let the
Governor appoint two of Virginia’s members. Secretary of Transportation Sean Connaugton argued in a
letter that the state is paying over half of the total cost of Metro and therefore is entitled to half the
seats.
Mr. Schwartz argued that these numbers are incorrect, and only 20-30% is coming from the state.
Ms. Hanley noted that Mr. Connaughton is counting the add-on gas tax, which is only charged in
Northern Virginia counties and collected by the state but sent directly to WMATA. She argued that is not
really a state expenditure.
Ms. Hanley worried that state appointees would not be responsive to riders. She said she doesn’t like a
situation where Board members are appointed by any group that isn’t responsive to the region’s needs.
Mr. Schwartz added that “Richmond is distant in more than geographic distance.”
Mr. Jaffe called Mr. Connaughton’s request “alarming” because of “the remoteness and automatic built-
in lack of accountability.”
Mr. Watson said that the change in Maryland to members appointed by the governor was the worst
thing that could happen from the riders’ perspective in terms of Board membership. Montgomery and
Prince George’s gave up their representation for only 12.5% of the Metro funding each. He said that
state appointees will not be as responsive to riders.
Other expansion of the Board
In addition, Ms. Jeter suggested adding a representative of the workers to the Board.
Mr. Drummond advocated in his blog post for adding representation to the other jurisdictions, like the
City of Fairfax or Loudoun County, which are not represented on the Board today except through NVTC.
Ms. Mack said that while it would be possible to add representation from different groups, there is no
one set of individuals that would be best. Instead, the Board should focus on objectives.
Mr. Zimmerman noted that the WMATA Board is one of the smallest boards among U.S. transit
agencies. He said that the system as originally devised in the 1960s ensures a voice by specific entities of
government that needed representation, but was not so big as to be unwieldy.

33
Mr. Zimmerman added that the addition of 4 federal members makes the Board a bit less nimble, and
that if the governance process results in opening up the Compact to changes, the result will likely be an
even larger Board, since for example the State of Virginia wants representation but local jurisdictions
need to be a part of it as well if they are funding the system.
Mr. Bradley said that while he was at the Connecticut Department of Transportation, the state was able
to have its needs met regarding the New Haven branch of the Metro-North Commuter Railroad even
though Connecticut did not have any seats on the MTA board. Instead, they worked with the staff of
MTA and worked through the governors.
Mr. Bradley argued that the current Board structure is too large, noting that when he was in Connecticut
the MTA Board had only 5 members. [It now has 17.11] He said this structure consumes a huge amount
of time and takes away from staff carrying out their duties.
Federal appointments
The federal government currently has two vacant spots on the Board. Some participants noted dangers
if the government ends up appointing members from outside the region.
Ms. Watson expressed concern about the federal representation, noting that while he has no problem
with Mr. Downey, at times NCPC (the National Capital Planning Commission) has had a chair from
outside the region. He cited an attitude that Washington and the region somehow owe something to
the nation and that it’s appropriate for people from outside to come in and run local institutions.
Note: Mr. Downey lives in Vienna, Virginia, and Marcel Acosta, the federal alternate member, lives in
the District.
Importance of attendance
Many participants expressed a concern about the poor attendance of some members of the Board.
Mr. Dinegar said he hoped the RAC was as “chagrined” as the Board of Trade by the revelations in the
Washington Examiner:
11
http://www.mta.info/mta/leadership/board.htm

34
http://www.washingtonexaminer.com/local/Metro-board-members-play-hooky-1005888-99658089.html
Ms. Hanley said individual jurisdictions should make clear that Board membership is a time-consuming
obligation, not an honor. It’s a responsibility to run an operating agency, the same as the boards and
councils in the jurisdictions.
Mr. Dyke called for accountability from Board members, including when members don’t show up and
don’t participate.
Ms. Hanley added that if members aren’t willing to show up for every meeting with some exceptions,
the public should know and they should step down. She noted that being effective on the Board requires
remembering decisions made at previous committee meetings or in previous years, and the reasons for
those decisions. She said that Board members can’t simply show up to cast votes and still be effective.
Responsibility to ride the system
On February 22, 2009, the Washington Post wrote that “Half of Metro's 12 board members … do not
regularly ride the train or bus system they oversee. And even as members say they need to trim
expenses and boost revenue, several haven't paid their parking fees at Metro headquarters for at least 2
1/2 years.”

35
Mr. Drummond suggested requiring Board members to ride the system at least 3 times per week during
the morning and evening rush hours, and requiring members to pay instead of getting free transit as
they currently do.
Some committee members suggested that Board members should not be entitled to parking spaces at
WMATA headquarters. Currently, they can park in the building, though there is a charge.
Is MWAA a model?
Some who testified at the COG/Board of Trade task force, such as Bob Chase of the Northern Virginia
Transportation Alliance, suggested looking to the Metropolitan Washington Airports Authority (MWAA)
as a model.12 Governance Committee members asked some participants what they thought of this idea.
Ms. Hanley said that she respects MWAA, and supported giving it the responsibility of building the
Dulles line, but pointed out that MWAA has a dedicated revenue source in the airport and ticket fees,
which means it doesn’t have to rely on appropriations from any governmental entity. Therefore, she
argued it is not a good model for Metro.
Mr. Schwartz said the comparison to MWAA seriously concerns him. He noted that MWAA has very little
transparency, and the press does not report on its meetings. In fact, he said he checked their Web site
and could find no information about the time or place of meetings. MWAA is receiving public revenue
but is not accountable.
Regionalism?
Mr. Dinegar asked the group if Board members representing individual jurisdictions could act with a
“regional mindset.” He wondered how members could go into a meeting and take off their “local hat”
and put on the “regional hat.”
Ms. Hanley noted that most riders don’t work in the same jurisdiction in which they live. Therefore,
strong regional cooperation is in the interests of all jurisdictions.
Ms. Hudgins said that many of her constituents might ride a bus and a train and then end up on a bus in
DC. She wants them all to have a good experience, and therefore makes her decisions for all riders,
wherever they start or end their trips.
Mr. Watson suggested more Board members attend hearings in other jurisdictions to get more of a
sense of the opinions and concerns of riders elsewhere.
Reactions: Mr. DeBernardo noted that any members will be political if they are appointed by political
people.
Ms. Walker suggested that the only difference is between people who are overtly political and those
whose political interests are more “subterranean.”
12
http://www.mwcog.org/about/governancetaskforce/task%20force%20docs/nvta.pdf

36
Appendix B: Current WMATA governance
Board composition
The Washington Metropolitan Area Transit Authority (WMATA) is governed by a 16-member Board of
Directors. Four members represent the District of Columbia (DC), four the State of Maryland, four the
Commonwealth of Virginia, and four the federal government. The federal members are new additions in
2010 and only two have been appointed thus far.
Of each four, two are Principal Directors and two are Alternate Directors. Each alternate is designated as
the alternate to a specific principal. At full Board meetings, only principal members may cast votes. If a
principal is absent, his or her alternate may cast the vote. In DC, the other alternate may also cast the
vote if the designated alternate is not present.
This is the current composition of the Board:
Name Juris. P/A Government position Appointed by
Jim Graham DC Principal Councilmember, Ward 1 DC Council
Michael Brown DC Alternate Councilmember, at-large DC Council
Neil Albert DC Principal City Administrator Mayor
Anthony Giancola DC Alternate Mayor
Peter Benjamin MD Principal WSTC/Governor
Gordon Linton MD Alternate WSTC/Mont. Executive
Elizabeth Hewlett MD Principal WSTC/Governor
Marcel Solomon MD Alternate WSTC/P.G. Executive Christopher Zimmerman
VA Principal Member, Arlington County Bd. NVTC
William Euille VA Alternate Mayor, City of Alexandria NVTC
Catherine Hudgins VA Principal Member, Fairfax Bd. of Sups. NVTC
Jeffrey McKay VA Alternate Member, Fairfax Bd. of Sups. NVTC
Mortimer Downey Federal Principal President/GSA
Marcel Acosta Federal Alternate Executive Director, National Capital Planning Commission
President/GSA
Each jurisdiction has a different mechanism for appointing the members. In DC, the Council appoints the
members, but by convention one principal and one alternate are chosen by the Mayor.
In Maryland, the members are formally appointed by the Washington Suburban Transit Commission, but
in practice as a result of the state paying for the Maryland share of WMATA operating costs, the
Governor selects both principal members, and the County Executive of each of Montgomery and Prince
George’s Counties appoint one alternate each.
In Virginia, members are appointed by the Northern Virginia Transportation Commission, a body with
voting members from the various local jurisdictions in the WMATA Compact area (Arlington, Fairfax and
Loudoun Counties, the Cities of Alexandria, Fairfax and Falls Church), members of the state legislature,

37
and a representative of the Governor. NVTC has always appointed principal members from Fairfax and
Arlington Counties and alternate members from Fairfax County and the City of Alexandria.13
Federal members are appointed by the President of the United States through the General Services
Administration.
Board structure
The Board is headed by a Chairman. The current Chairman is Peter Benjamin. The First Vice-Chairman is
Catherine Hudgins and the Second Vice-Chairman is Neil Albert.
The chair rotates by convention among the six voting slots, so each jurisdiction has a member serving as
chair once every three years, and each individual member is chair once every six years. The First Vice-
Chairman has always [?] been elected Chairman and the Second Vice-Chairman elected First Vice-
Chairman. At times, the chair has even been a member who just joined the Board, as in 2007 when
Elizabeth Hewlett replaced incoming Chairman Charles Deegan and immediately became chair.
However, the Compact does not require this process. The Board simply elects a chair each year, and can
choose based on any criteria they wish.
Much of the work of the Board takes place through committees. Alternates who are designated
members of committees have the same voting privileges in that committee as principal members. Some
committees are “committees of the whole,” where all 14 (currently) Board members are members of
the committee, while others only comprise a subset of the Board members.
Current committees are:
Name of Committee Chair # members Public meetings?
Safety and Security Mortimer Downey 14 (whole) Yes
Joint Development & Real Estate Jim Graham 14 (whole) Yes
Customer Service & Operations Christopher Zimmerman 4 + chair Yes
Finance & Administration Catherine Hudgins 5 + chair Yes
Policy, Program Development, & Intergovernmental Relations
Neil Albert 4 + chair Yes
Technology Review Subcommittee Anthony Giancola 2 + chair No
Audits & Investigations Subcommittee Anthony Giancola 3 + chair No
The Board chairman is an ex officio member of all committees and subcommittees.
This committee structure changes from year to year and sometimes within years. For example, in 2009,
all committees (at least those that met publicly) were all Committees of the Whole. In September 2010,
the Board voted to establish a new Safety & Security Committee and rename the Customer Service,
13
http://www.thinkoutsidethecar.org/pdfs/WMATA%20Governance%20Issues%20%5BCompatibility%20Mode
%5D.pdf

38
Operations & Safety Committee to the Customer Service & Operations Committee at the suggestion of
the National Transportation Safety Board (NTSB).
Board meetings and procedures
The Board meets monthly on a Thursday, usually the fourth Thursday of the month. Monthly meetings
of the Board are open to the public. Audio is broadcast over the Web and archived audio posted
afterward. The agenda for the Board meeting is typically posted the Friday before the meeting, though
sometimes agenda items are not posted and instead a note is posted saying that materials will be made
available at the meeting itself.
There is a public comment period at the beginning of each meeting, where members of the public are
permitted to speak for up to two minutes each. The Board reserves the right to limit this period if many
people sign up. Members of the public are only permitted to speak once in any three-month period.
Committee meetings have no public comment period. Some committee meetings are public like full
Board meetings in that their dates are listed on the publicly accessible calendar and members of the
public may attend. Audio is broadcast and archived like full Board meetings. Other committees never
have their meetings announced publicly and do not post agendas or audio.
Advisory committees
The Board is formally advised by three outside groups. The Riders’ Advisory Council (RAC) is made up of
21 riders (currently 20 with one vacancy), 6 each from DC, Maryland, and Virginia, two at-large, and the
chair of the Accessibility Advisory Committee.
RAC members are appointed by the Board, technically as a whole but in practice by individual members
based on their jurisdiction. Members serve staggered three-year terms and may serve for up to four full
terms. The RAC elects a Chair from among its membership and one Vice-Chair from each of DC,
Maryland, and Virginia.
All RAC meetings are open to the public and, beginning in September 2010, audio is posted online
following the meeting. Agendas are posted online in advance. The RAC meets once a month on the first
Wednesday of each month. In addition, the RAC has a number of ad-hoc and standing committees that
hold additional meetings, also open to the public.
The RAC chair or a designee makes a monthly presentation to the Board at its full meeting. The RAC
often also approves letters or resolutions which are sent to the Board.
The Accessibility Advisory Committee (AAC) also combines members from DC, Maryland, Virginia, and
at-large members, and advises staff and the Board on issues affecting riders with disabilities.
The Jurisdictional Coordinating Committee (JCC) is made of representatives from the local and state
governments, usually their departments of transportation. The JCC’s members also typically serve as
staff to the jurisdictions’ Board members advising them on matters of policy. Therefore, JCC meetings

39
often explore policy issues that cross jurisdictional lines or provide staff with early input on how Metro
projects would interact with jurisdictional efforts and priorities.
There is some question about whether JCC meetings are technically public, but in practice they are not
as their agendas and meeting dates are not posted. Agendas and minutes are provided to Board
members but not to the public.
Staff
The Board of Directors hires a General Manager who manages all WMATA employees with only a few
exceptions: the Office of the Board Secretary, the Inspector General and staff, and the General Counsel.
WMATA has no permanent General Manager at the moment. The Interim General Manager is Richard
Sarles. A search is underway for a permanent General Manager.
Funding
WMATA receives its funding from fares and from jurisdictional subsidies.
WMATA has no dedicated revenue source, such as a local tax or tolls, under its control. All funding other
than fares must come from federal, state or local governments.
The District of Columbia, functionally a state, pays its contributions from the District general budget. The
State of Maryland pays the costs of WMATA subsidies from state transportation funds.
In Virginia, local governments pay most of the costs of subsidies. According to NVTC, the state
government currently pays 28% of Virginia’s WMATA funding.14 Some additional funding come from
dedicated taxes, such as an add-on gas tax, which is charged in Northern Virginia jurisdictions and
collected by the state but dedicated to transit in Northern Virginia. Finally, the remainder of the subsidy
is paid out of general revenues by the individual jurisdictions (currently the Counties of Arlington and
Fairfax and the Cities of Alexandria, Fairfax and Falls Church).
The federal government pays no ongoing operating costs. It contributes capital funding under a recent
agreement, $150 million per year matched by DC, Maryland, and Virginia for $50 million each. Congress
must appropriate the money each year, and has done so once so far. Future years’ funding will depend
on Congress’s leadership, the interests of appropriators, and budget pressures.
14
http://www.thinkoutsidethecar.org/pdfs/WMATA%20Governance%20Issues%20%5BCompatibility%20Mode
%5D.pdf

AGENDA ITEM #8 TO: Chairman Hudgins and NVTC Commissioners FROM: Rick Taube and Scott Kalkwarf DATE: November 24, 2010 SUBJECT: Progress on the Upcoming NVTC Move to a New Office Attached is a description of ongoing activities that are part of NVTC’s preparations to move to a new office at 2300 Wilson Boulevard in Suite 620 of the Navy League Building in Arlington. NVTC will be able to begin to move into the new space in the last two weeks of December and must vacate its current office no later than December 31st. NVTC’s January 6th meeting will take place in the first floor conference room at the new building. Directions are attached.
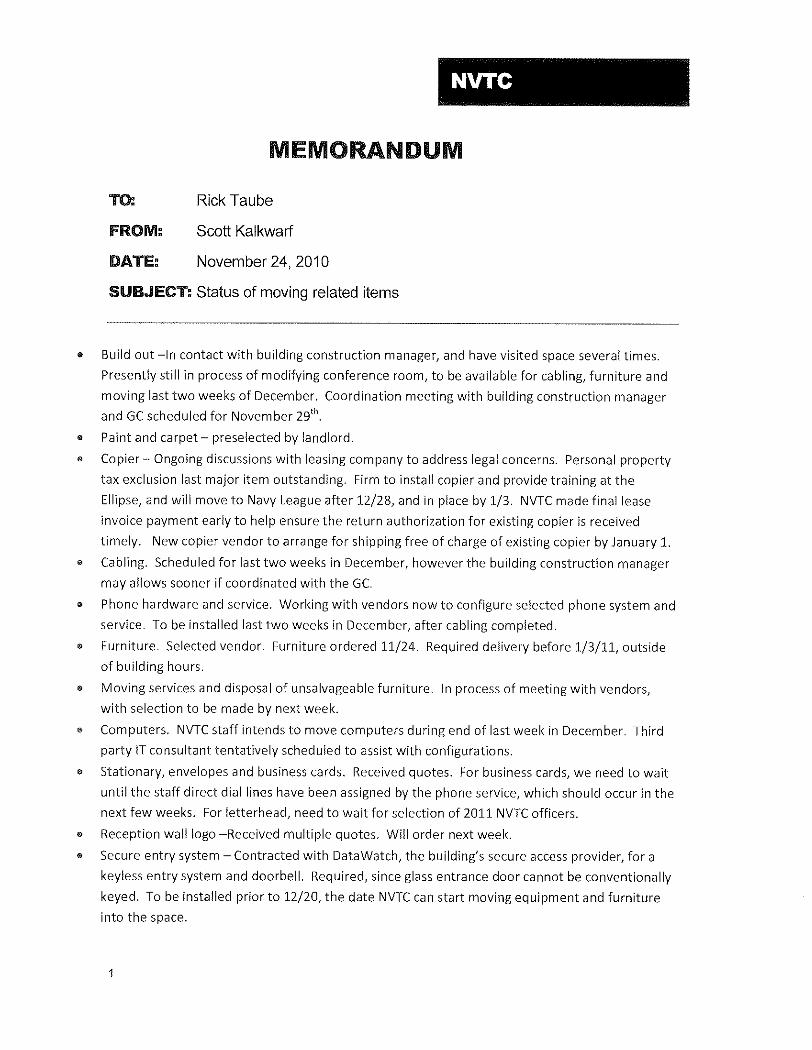


AGENDA ITEM #9
TO: Chairman Hudgins and NVTC Commissioners FROM: Rick Taube DATE: November 24, 2010 SUBJECT: Regional Transportation Items
A. Pentagon Transit Security. A copy of a letter is attached from the Acting Director of the Defense Facilities
Directorate at the Pentagon updating the status of security improvements as they affect transit customers. A central point of contact has been designated for formal communications with NVTC and the transit community.
B. CEO’s for Cities Critique of Texas Transportation Institute’s Congestion Measures.
As explained in the attached excerpts from the executive summary, this group estimates
that TTI’s annual report over estimated the costs of urban traffic congestion by almost $50 billion. This is because the “green dividend” of wise land use decisions and investments in transit are not recognized by TTI. According to the author, in urban areas in which commuting trip lengths are shorter, TTI’s methodology over estimates congestion costs. For example, Portland, Oregon has reduced its average trip lengths by 20% in the past 20 years. If other cities applied these lessons, their drivers could save 40 billion annually miles traveled, two billion gallons of gasoline and $31 billion in fuel costs.
The TTI index shows congestion travel time delay divided by free flow travel time. Clearly, the longer the distance traveled, the smaller effect any given level of delay will show in that index. Adjusting for varying trip distances alters the rankings significantly.
While TTI ranked the Washington Metropolitan area second worst in the country, adjusting for travel distances drops this region to 14th. Los Angeles drops from first to 16th. Nashville is worst in the new methodology (up from 31st) and Oklahoma City is next (up from 38th). Richmond ranks 4th (up from 44th) and shows the greatest shift of any city in the country.
To view the entire report, go to http://www.ceosforcities.org/work/driven-apart.


D R I V E NA P A R THOW SPRAWL IS LENGTHENING OUR COMMUTES AND WHY MISLEADING MOBILITY MEASURES ARE MAKING THINGS WORSE.
EXECUTIVE SUMMARY
Joe Cortright, Senior Policy Advisor for CEOs for Cities
Funded by the Rockefeller FoundationSeptember 2010

While peak hour travel is a perennial headache for many Americans –
peak hour travel times average 200 hours a year in large metropolitan
areas – some cities have managed to achieve shorter travel times
and actually reduce the peak hour travel times. The key is that some
metropolitan areas have land use patterns and transportation systems
that enable their residents to take shorter trips and minimize the
burden of peak hour travel.
That’s not the conclusion promoted by years of highway-oriented
transportation research. The Urban Mobility Report (UMR) produced
annually by the Texas Transportation Institute and widely used to
gauge metropolitan traffic problems has completely overlooked
the role that variations in travel distances play in driving urban
transportation problems.
The secret to reducing the amount of time Americans spend in peak hour traffic has more to do with how we build our cities than how we build our roads.

This report offers a new view of urban transportation performance.
It explores the key role that land use and variations in travel distances
play in determining how long Americans spend in peak hour travel.
It shows how the key tool contained in the Urban Mobility Report –
the Travel Time Index – actually penalizes cities that have shorter
travel distances and conceals the additional burden caused by
longer trips in sprawling metropolitan areas. Finally, it critically
examines the reliability and usefulness of the methodology used in
the Urban Mobility Report, finding it does not accurately estimate
travel speeds, it exaggerates travel delays, and it overestimates the
fuel consumption associated with urban travel. How we measure
transportation systems matters, and the nation needs a better set of
measures than it has today.

> Travelers in some cities – those with more compact development patterns – tend to spend less
time in peak hour traffic because they don't have to travel as far.
> IF EVERY ONE OF THE TOP 50 METRO AREAS
ACHIEVED THE SAME LEVEL OF PEAK
HOUR TRAVEL DISTANCES AS THE BEST
PERFORMING CITIES, THEIR RESIDENTS
WOULD DRIVE ABOUT 40 BILLION FEWER
MILES PER YEAR AND USE TWO BILLION
FEWER GALLONS OF FUEL, AT A SAVINGS OF
$31 BILLION ANNUALLY.
> In the best performing cities the typical traveler spends 40 fewer hours per year in peak hour
travel than the average American because of the shorter distances they have to travel.
In the best performing cities – those that have achieved the shortest peak hour travel distances – such
as Chicago, Portland and Sacramento, the typical traveler spends 40 fewer hours per year in peak
hour travel than the average American. In contrast, in the most sprawling metropolitan areas, such as
Nashville, Indianapolis and Raleigh, the average resident spends as much as 240 hours per year in peak
period travel because travel distances are so much greater. These data suggest that reducing average
trip lengths is a key to reducing the burden of peak period travel. Over the past two decades, for example,
Portland, Oregon, which has smart land use planning and has invested in alternative transportation, has
seen its average trip lengths decline by 20 percent.
5
HOW LAND USE PATTERNS AND TRAVEL DISTANCE AFFECT PEAK TRAFFIC

The following chart shows the nation’s 51 largest metropolitan areas, all with a population of one million
or more, and the average amount of peak period travel per traveler in hours per year. The dark-shaded
portion of each bar illustrates the number of additional hours of travel that are associated with longer
travel distances, compared to the most compact metropolitan areas.
The additional travel time associated with longer average trip distances is the chief determinant of
which metropolitan areas have the longest travel times. Longer trip distances add 80 hours a year or more
to peak travel times in Nashville, Oklahoma City, Richmond, and Birmingham. Areas with the shortest
average travel distances, including Chicago, New Orleans, Sacramento and New York, have among the
lowest total hours of peak period travel.
These results are a stark contrast to the picture of urban transportation painted by the UMR, which
has long been used to measure traffic problems and compare cities. A close examination shows that the
UMR has a number of key flaws that misstate and exaggerate the effects of congestion, and it ignores
the critical role that sprawl and travel distances play in aggravating peak period travel.
RANKING METROPOLITAN AREAS ON PEAK PERIOD TRAVEL TIMES
TRAVEL TIMEINDEX
CONGESTION TRAVEL TIME
FREE FLOW TRAVEL TIME
THE TRAVEL TIME INDEX MAKES NO ALLOWANCE FOR THE EFFECTS OF LONGER TRAVEL DISTANCES ONTRAVEL TIMES.

Number of additional hours of travel associated with longer travel distances
Hours per year of peak period travel per traveler
PEAK PERIOD TRAVEL TIMES
50 100HOURS PER YEAR 150 200 2500
Nashville-Davidson-Murfreesboro-Franklin TN
Oklahoma City OK
Birmingham-Hoover AL
Richmond VA
Raleigh-Cary NC
Memphis TN-MS-AR
Detroit-Warren-Livonia MI
Orlando-Kissimmee FL
Kansas City MO-KS
Louisville/Jefferson County KY-IN
St. Louis MO-IL
Houston-Sugar Land-Baytown TX
Indianapolis-Carmel IN
Washington-Arlington-Alexandria DC-VA-MD-WV
Atlanta-Sandy Springs-Marietta GA
Dallas-Fort Worth-Arlington TX
Los Angeles-Long Beach-Santa Ana CA
Jacksonville FL
Boston-Cambridge-Quincy MA-NH
San Antonio TX
Minneapolis-St. Paul-Bloomington MN-WI
San Jose-Sunnyvale-Santa Clara CA
Charlotte-Gastonia-Concord NC-SC
Providence-New Bedford-Fall River RI-MA
Tampa-St. Petersburg-Clearwater FL
Columbus OH
San Diego-Carlsbad-San Marcos CA
New Haven-Milford CT
Seattle-Tacoma-Bellevue WA
Las Vegas-Paradise NV
Phoenix-Mesa-Scottsdale AZ
Denver-Aurora CO
Virginia Beach-Norfolk-Newport News VA-NC
San Francisco-Oakland-Fremont CA
Baltimore-Towson MD
Pittsburgh PA
Rochester NY
Miami-Fort Lauderdale-Pompano Beach FL
Philadelphia-Camden-Wilmington PA-NJ-DE-MD
Austin-Round Rock TX
Salt Lake City UT
Buffalo-Niagara Falls NY
Riverside-San Bernardino-Ontario CA
Portland-Vancouver-Beaverton OR-WA
Cincinnati-Middletown OH-KY-IN
New York-Northern New Jersey-Long Island NY-NJ-PA
Cleveland-Elyria-Mentor OH
Sacramento-Arden-Arcade-Roseville CA
Milwaukee-Waukesha-West Allis WI
New Orleans-Metairie-Kenner LA
Chicago-Naperville-Joliet IL-IN-WI
7

Using total hours of peak travel to measure urban transportation performance produces an entirely
different ranking of metropolitan areas with the worst performing transportation systems. Five of the ar-
eas with the longest total travel times - Nashville, Oklahoma City, Birmingham, Richmond and Memphis
- were rated by the UMR to have among the least severe congestion problems. Conversely, several of the
cities that UMR ranked high for congestion - including Chicago, New York, and Sacramento - have among
the lowest peak period travel times. This table compares the rankings of metropolitan areas in the severity
of traffic problems based on the analysis presented here and in the Urban Mobility Report.
This table shows how each of the 51 largest metropolitan areas ranks in terms of the severity of
traffic problems based on this analysis and from the data contained in the 2009 Urban Mobility Report. The
metropolitan areas are ranked according to the average peak period travel times, expressed in hours per
year, with the areas having the longest travel times ranked highest. The second column of the table shows
the ranking of congestion-related delays, according to the Urban Mobility Report, again with the metropol-
itan areas with the highest levels of delays ranked highest. The third column shows the difference in ranks
between the two measures. Positive numbers show metropolitan areas whose performance improved,
compared to their UMR ranking, negative numbers show those metropolitan areas whose performance
declined compared to their UMR ranking. The bar chart to the right of the table illustrates the difference
in ranks between the two measures.
COMPARISONS IN CITY RANKINGS

9
Nashville-Davidson-Murfreesboro-Franklin TN
Oklahoma City OK
Birmingham-Hoover AL
Richmond VA
Raleigh-Cary NC
Memphis TN-MS-AR
Detroit-Warren-Livonia MI
Orlando-Kissimmee FL
Kansas City MO-KS
Louisville/Jefferson County KY-IN
St. Louis MO-IL
Houston-Sugar Land-Baytown TX
Indianapolis-Carmel IN
Washington-Arlington-Alexandria DC-VA-MD-WV
Atlanta-Sandy Springs-Marietta GA
Dallas-Fort Worth-Arlington TX
Los Angeles-Long Beach-Santa Ana CA
Jacksonville FL
Boston-Cambridge-Quincy MA-NH
San Antonio TX
Minneapolis-St. Paul-Bloomington MN-WI
San Jose-Sunnyvale-Santa Clara CA
Charlotte-Gastonia-Concord NC-SC
Providence-New Bedford-Fall River RI-MA
Tampa-St. Petersburg-Clearwater FL
Columbus OH
San Diego-Carlsbad-San Marcos CA
New Haven-Milford CT
Seattle-Tacoma-Bellevue WA
Las Vegas-Paradise NV
Phoenix-Mesa-Scottsdale AZ
Denver-Aurora CO
Virginia Beach-Norfolk-Newport News VA-NC
San Francisco-Oakland-Fremont CA
Baltimore-Towson MD
Pittsburgh PA
Rochester NY
Miami-Fort Lauderdale-Pompano Beach FL
Philadelphia-Camden-Wilmington PA-NJ-DE-MD
Austin-Round Rock TX
Salt Lake City UT
Buffalo-Niagara Falls NY
Riverside-San Bernardino-Ontario CA
Portland-Vancouver-Beaverton OR-WA
Cincinnati-Middletown OH-KY-IN
New York-Northern New Jersey-Long Island NY-NJ-PA
Cleveland-Elyria-Mentor OH
Sacramento-Arden-Arcade-Roseville CA
Milwaukee-Waukesha-West Allis WI
New Orleans-Metairie-Kenner LA
Chicago-Naperville-Joliet IL-IN-WI
1
2
3
4
5
6
7
8
9
10
11
12
13
14
15
16
17
18
19
20
21
22
23
24
25
26
27
28
29
30
30
32
33
34
35
36
37
38
39
40
41
42
43
44
45
46
47
48
49
50
51
DRIVEN APART: RANK BY TOTAL PEAK TRAVEL
TIME
31
38
34
44
33
41
9
6
47
28
40
4
23
2
3
6
1
23
19
28
23
6
22
36
11
35
43
9
19
14
14
13
36
5
14
47
51
11
28
23
38
50
14
31
41
14
49
23
46
44
21
UMR: RANK BY ESTIMATED
HOURS OF CONGESTION
-20 -10-30-40 300 10 20
UMR OVERSTATES HOURS OF TRAVEL (POSITIVE VALUES)
UMR UNDERSTATES HOURS OF TRAVEL (NEGATIVE VALUES)
-30
-36
-31
-40
-28
-35
-2
2
-38
-18
-29
8
-10
12
12
10
16
-5
0
-8
-2
16
1
-12
14
-9
-16
19
10
16
16
19
-3
29
21
-11
-14
27
11
17
3
-8
29
13
4
32
-2
25
3
6
30
DIFFERENCE IN RANKSDRIVEN APART VS. UMR

THE TRAVEL TIME INDEX:A FLAWED TOOL FOR DIAGNOSING TRANSPORTATION PROBLEMS
The central analytical tool in the Urban Mobility Report is the Travel Time Index (TTI), which is the ratio
of average peak hour travel times to average free flow travel times. For large metropolitan areas, the
average Travel Time Index was 1.25 in 2007 according to the UMR. This means, for example, that a trip
that takes 20 minutes in free flow conditions is estimated to require, on average, 25 minutes during
peak travel times (25/20 = 1.25).
On its face, the Travel Time Index seems like a reasonable way to compare city transportation
systems. And if all cities had similar land use patterns and densities and had the same average trip
lengths, then the TTI would be a fair measure. But city land use patterns vary substantially, and as
a result the Travel Time Index conceals major differences in urban transportation between different
cities. To illustrate this, we examine the UMR data for Charlotte and Chicago. Chicago has a TTI of 1.43
(the second highest overall, behind only Los Angeles), while Charlotte has a TTI of 1.25 (just about
equal to the average for all large metropolitan areas). This would appear to indicate that urban travel
conditions are far worse in Chicago. But the traffic delays in the two regions are almost identical (40
and 41 hours per year, or about 10 minutes per day). Chicago has average travel distances (for peak
hour trips) of 13.5 miles, while Charlotte has average travel distances of 19 miles. Because they travel
nearly 50 percent farther then their counterparts in Chicago, Charlotte travelers end up spending a lot
more time in traffic, about 48 minutes per day, rather than 33 minutes per day.
According to the UMR, the worst traffic was in Los Angeles, Washington and Atlanta. But a re-
analysis of the data shows that residents in at least ten other metropolitan areas, including Richmond,
Raleigh-Durham, Detroit and Kansas City, spent the most time traveling in peak hours. Again, the key
reason for the difference is the much longer-than-average peak period travel distances in those cities.

A COMPARISON OF CHARLOTTE AND CHICAGO
AVERAGE TRIP
CHICAGO 13.5mi
CHARLOTTE 19.0mi
CHARLOTTE
1.25 1.43CHICAGO
TRAVEL TIME
TRAVEL TIME INDEX
CHARLOTTE
48.0minTotal Travel Time
38.4minUN-CONGESTED
TRAVEL TIME
9.6minDELAY
CHICAGO
32.6minTotal Travel Time
22.8minUN-CONGESTED
TRAVEL TIME
9.8minDELAY
11
ACCORDING TO THE UMR, THINGS ARE MUCH WORSE IN CHICAGO THAN IN CHARLOTTE.

LIMITATIONS OF THE URBAN MOBILITY REPORT’S METHODOLOGY
Our detailed analysis of the methodology of the Urban Mobility Report suggests that it is an unreliable guide to understanding the nature and extent of transportation problems in the nation’s metropolitan areas.
The Urban Mobility Report’s key measure – the Travel Time Index – is a poor guide to policy, and its speed and fuel economy estimates are flawed. In the aggregate, the analysis appears to overstate the costs of traffic congestion three-fold and ignores the larger transportation costs associated with sprawl. Specifically:
> The Travel Time Index used in the UMR is based on a questionable model of how traffic volumes
affect traffic speeds, and it uses an unrealistic and unattainable baseline of zero delay computing
congestion costs. The structure of the Travel Time Index inherently conceals the effect of sprawl
and travel distance on travel time.
> The key statistic underpinning the UMR’s findings is based on the difference in travel times be-
tween peak and non-peak periods, but the study’s travel time estimates are based on volume
data, not on actually observed travel speeds.
> The model used to convert volume data to estimated speeds was calibrated by “visual inspec-
tion” of the data, and the line chosen to reflect the data isn’t based on statistical analysis; a line
fit with a simple quadratic equation would produce much higher estimates of peak hour speeds
and consequently lower levels of peak hour delay.

> The UMR speed/volume model relies on daily, rather than hourly (or minute–by–minute) traffic
volumes, meaning that the authors must make strong assumptions about the distribution of traf-
fic between peak and non-peak hours.
> The claims the UMR makes about trends in travel times over time and across cities do not corre-
late with other independent measures of travel times. Survey data on observed speeds from Inrix,
a private aggregator of travel time data gathered from commercial vehicles, and self-reported
travel times from the Census and National Travel Survey are not consistent with the conclusions
of the Urban Mobility Report. Neither the total change in travel time, measured nationally, nor the
pattern of changes in travel time across metropolitan areas is consistent with the estimates of
increased delay presented in the Urban Mobility Report.
° Data from speed measurements monitored by Inrix suggest that the UMR methodology
overstates the Travel Time Index by about 70 percent.
° This chart shows the Travel Time Index as estimated by the Urban Mobility Report with
that computed by Inrix. For almost all metropolitan areas, the Travel Time Index estimated
by the UMR is higher than that computed by Inrix.
INRIX (OBSERVED)
UR
BA
N M
OB
ILIT
Y R
EPO
RT
(MO
DEL
ED)
1.501.451.401.351.15 1.251.05 1.301.10 1.201.001.00
1.10
1.20
1.30
1.40
1.50
NAS
NH
PIT
HAR
CINRAL
CLERIC
BIR
VBN
MINCHA
PHIDET
BOS
PDX
RIV NYC
LA
SFO
WAS
CHI
SDOSJO
MIA
ATL
HOU
SEA
AUS
SAT
IND
SLC
JFL
DFW
LVBAL
SACTPA
ORL
ROC
MEM
OK
BUF
DENPHX
PRONO
STLMIL
KC
LOU
COL
UMR ESTIMATES GREATER THAN INRIX VALUES
UMR ESTIMATES LESS THAN INRIX VALUES
13

° Data from the National Household Travel Survey show that nearly all of the increase in
peak commuting times was due to longer trips rather that slower travel speeds.
° The pattern of changes in reported commuting times between 1990 and 2000 Census
shows that there is no correlation between changes in travel delays estimated in the
UMR and changes in commute times reported in the Census.
> The UMR claim that travel times have increased is a product not of direct observations but is an
artifact of the structure of the UMR’s speed/volume equations, for which there is no independent
confirmation. As long as volume increases more than capacity, the UMR model mechanically pre-
dicts slower speeds and travel times.
> There are strong reasons to doubt the UMR claim that slower speeds associated with congestion
wastes billions of gallons of fuel.
° The UMR estimates of fuel consumption are based on a 29 year-old study of low-speed
driving using 1970s era General Motors cars, which is of questionable applicability to
today’s vehicles and to highway speeds.
° The UMR extrapolates these data outside of the speeds for which they were intended
and changes the functional form estimated from the original study in a way that
exaggerates fuel consumption associated with speed changes.
° The UMR fuel consumption results are not consistent with other, more recent estimates
of fuel economy patterns and ignore the savings in fuel consumption associated with
modest reductions in travel speeds.
° The UMR ignores the fuel consumption associated with longer trips in sprawling
metropolitan areas.
LIMITATIONS OF THE URBAN MOBILITY REPORT’S METHODOLOGY (CONT.)
INDEPENDENT MEASURES OF COMMUTING TRENDS DON’T CORROBORATE THE UMR CLAIMS ABOUT CONGESTION-RELATED DELAYS.

Adjusting the UMR estimates to account for each of these issues produces a significantly lower estimate of the cost of congestion. Adopting a more reasonable baseline for congestion-related delays, using the Inrix Travel Time Index, adopting a lower value of travel time, and adjusting fuel consumption estimates would imply that the cost of congestion in monetary terms is perhaps less than 70 percent lower than the figure claimed in the UMR. For the 51 metropolitan areas analyzed here, this means that the
UMR OVERSTATES THE COST OF CONGESTION BY ABOUT $49 BILLION.
A re-analysis of the data in the UMR paints a very different picture of transportation problems. Trip
distances grew rapidly in the 1980s and 1990s, but have stopped growing since then. Between 1982 and
2001, average commute trips nationally got three miles longer. Our calculations, based on data from the
UMR, suggest that average travel distances increased in three-quarters of the 50 largest metropolitan
areas over this time period. Since 2001, however, peak period travel distances have been shrinking in most
metropolitan areas, and the average travel distance has declined about 1.0 percent.
Many metropolitan areas have seen reductions in average peak hour travel times because residents
are now traveling shorter distances, reflecting land use patterns and personal choices about where to live
and work. Consider the example of Portland, Oregon. Between 1982 and 2007 average peak period travel
distances in Portland have fallen one-sixth, from 19.6 miles in 1982, to 16.0 miles in 2007. As a result,
average peak period travel times have actually gone down, from 54 minutes per day to 43 minutes per
day. So rather than getting three times worse (the UMR says Portland’s Travel Time Index went from 1.07
in 1982 to 1.29 in 2007), the average peak period traveler in Portland actually experienced shorter travel
times in 2007 than she did 25 years earlier.
15

POLICIES THAT ENABLE SHORTER TRIPS REDUCE PEAK PERIOD TRAVEL TIMES. MANY METROPOLITAN AREAS HAVE SEEN REDUCTIONS IN AVERAGE PEAK TRAVEL TIMES BECAUSE RESIDENTS ARE NOW TRAVELING SHORTER DISTANCES.
Focusing on trip distances and total travel times - two statistics not reported in the UMR - points to a broader and more powerful set of public policy options for dealing with urban transportation problems. Land use patterns, particularly mixed-use development, walkable and bike-able neighborhoods, higher densities, and good transit, can reduce vehicle miles traveled. Cities that pursue these strategies can reduce the total amount of time, money and fuel their citizens spend on transportation, in effect, earning a “green dividend” by being able to travel shorter distances.
THE NATION NEEDS BETTER MEASURES OF URBAN TRANSPORTATION PERFORMANCE

The key role of sprawling development patterns in driving peak period travel and the limitations of the
Urban Mobility Report presented here underscore the need for a much improved system for measur-
ing and comparing the performance of urban transportation systems. A new system for measuring
urban transportation performance should embrace five important elements.
1 EMPHASIZE ACCESSIBILITY - THE PROXIMITY AND CONVENIENCE OF DESTINATIONS - NOT JUST MOBILITY.
2 INCLUDE COMPREHENSIVE MEASURES OF LAND USES, TRIP LENGTHS AND MODE CHOICES AS WELL AS TRAVEL SPEEDS.
3 INCORPORATE NEW AND BETTER DATA ON TRAVEL SPEEDS AND COMMUTING PATTERNS.
4 THE U.S. DEPARTMENT OF TRANSPORTATION SHOULD ADOPT AN OPEN, MULTI-DISCIPLINARY PROCESS TO SELECT, VALIDATE AND CONTINUOUSLY IMPROVE MEASURES.
5 PROVIDE MEASURES THAT CAN BE USED TO GUIDE POLICY AND EVALUATE INVESTMENTS RATHER THAN SIMPLY RAISE ALARM ABOUT TRAFFIC DELAYS.
The essential economic and social purpose of cities is bringing people together, taking advantage of
opportunities for interaction and agglomeration economies. Cities perform this function in two prin-
cipal ways, by providing accessibility (putting people close to one another and to common destina-
tions), and through mobility, the ability to move easily from one point to another. National discussions
of how to make cities work better have tended to focus on making it easier for people to move, which
has had the paradoxical effect of leading cities to be less dense. And the measures we use to describe
how well city transportation systems work have reflected this bias toward mobility. In that sense, the
emphasis on mobility measures has driven us apart. Putting more emphasis on accessibility can bring
us closer together.
17

This report was prepared by Joseph Cortright, an economist with Impresa, Inc., in Portland and senior
policy advisor for CEOs for Cities. It was commissioned by CEOs for Cities, a national organization of
urban leaders, and supported by the Rockefeller Foundation.
This publication summarizes the findings of a longer technical report: "Measuring Urban Transportation
Performance." The technical report describes the methodology for the calculations presented in this
publication as well as a more detailed examination of the Urban Mobility Report. Copies of the technical
report are available at: www.ceosforcities.org

AGENDA ITEM #10 TO: Chairman Hudgins and NVTC Commissioners FROM: Rick Taube DATE: November 24, 2010 SUBJECT: NVTC Nominating Committee for 2011 Officers
Consistent with past practice at NVTC, Chairman Hudgins has appointed the NVTC Executive Committee to prepare the nominations for NVTC officers for 2011. The commission will be asked to elect its officers and representatives to various boards at its January 6, 2011 meeting.
Commissioners with suggestions for nominations should contact an Executive Committee member:
• Cathy Hudgins, Chairman • Bill Euille, Vice Chairman • Mary Hynes, Secretary-Treasurer • Chris Zimmerman, WMATA Board • Mary Margaret Whipple, Virginia General Assembly

AGENDA ITEM #11 TO: Chairman Hudgins and NVTC Commissioners FROM: Scott Kalkwarf and Colethia Quarles DATE: November 24, 2010 SUBJECT: NVTC Financial Items for October, 2010
The financial reports for October, 2010 are attached for your information.

Northern Virginia Transportation Commission
Financial Reports
October, 2010October, 2010

P t f FY 2011 NVTC Ad i i t ti B d t U dPercentage of FY 2011 NVTC Administrative Budget UsedOctober, 2010
(Target 33.33% or less)
Personnel Costs
Administrative and Allocated Costs
Contract Services
TOTAL EXPENSES
0% 8% 17% 25% 33% 42% 50% 58% 67% 75% 83% 92% 100%
Note: Refer to pages 2 and 3 for details
1
p g

NORTHERN VIRGINIA TRANSPORTATION COMMISSIONG&A BUDGET VARIANCE REPORT
October 2010
Current Year Annual Balance BalanceMonth To Date Budget Available %
Personnel CostsSalaries 51,367.04$ 208,261.82$ 737,900.00$ 529,638.18$ 71.8%Temporary Employee Services - - - - Total Personnel Costs 51,367.04 208,261.82 737,900.00 529,638.18 71.8%
BenefitsEmployer's Contributions:FICA 2,860.28 14,821.51 52,400.00 37,578.49 71.7%Group Health Insurance 5,933.57 23,076.32 80,200.00 57,123.68 71.2%Retirement 5,240.00 21,960.00 73,700.00 51,740.00 70.2%Workmans & Unemployment Compensation 93.75 375.00 2,950.00 2,575.00 87.3%Life Insurance 296.68 1,186.72 4,300.00 3,113.28 72.4%Long Term Disability Insurance 252.81 1,264.05 3,950.00 2,685.95 68.0% Total Benefit Costs 14,677.09 62,683.60 217,500.00 154,816.40 71.2%
Administrative Costs Commissioners Per Diem 1,550.00 3,650.00 16,850.00 13,200.00 78.3%
Rents: 16,036.60 64,790.60 182,180.00 117,389.40 64.4% Office Rent 15,436.60 61,790.60 170,980.00 109,189.40 63.9% Parking 600.00 3,000.00 11,200.00 8,200.00 73.2%
Insurance: 575.00 575.00 4,100.00 3,525.00 86.0% Public Official Bonds - - 2,300.00 2,300.00 100.0% Liability and Property 575.00 575.00 1,800.00 1,225.00 68.1%
Travel: 555.88 991.70 6,300.00 5,308.30 84.3% Conference Registration - - - - 0.0% Conference Travel - 92.74 2,000.00 1,907.26 95.4% Local Meetings & Related Expenses 555.88 898.96 4,000.00 3,101.04 77.5% Training & Professional Development - - 300.00 300.00 100.0%
Communication: 1,041.51 3,101.99 10,200.00 7,098.01 69.6% Postage 590.07 1,375.28 4,000.00 2,624.72 65.6% Telephone - LD 117.41 379.28 1,300.00 920.72 70.8% Telephone - Local 334.03 1,347.43 4,900.00 3,552.57 72.5%
Publications & Supplies 879.53 3,648.62 13,500.00 9,851.38 73.0% Office Supplies 105.18 345.45 3,000.00 2,654.55 88.5% Duplication 774.35 3,303.17 10,000.00 6,696.83 67.0% Public Information - - 500.00 500.00 100.0%
2

NORTHERN VIRGINIA TRANSPORTATION COMMISSIONG&A BUDGET VARIANCE REPORT
October 2010
Current Year Annual Balance BalanceMonth To Date Budget Available %
Operations: 466.95 1,093.80 8,000.00 6,906.20 86.3% Furniture and Equipment - - - - 0.0% Repairs and Maintenance - - 1,000.00 1,000.00 100.0% Computers 466.95 1,093.80 7,000.00 5,906.20 84.4%
Other General and Administrative 516.22 1,351.82 5,350.00 3,998.18 74.7% Subscriptions - - - - 0.0% Memberships - 205.00 1,300.00 1,095.00 84.2% Fees and Miscellaneous 251.86 882.46 2,950.00 2,067.54 70.1% Advertising (Personnel/Procurement) 264.36 264.36 1,100.00 835.64 76.0% Total Administrative Costs 21,621.69 79,203.53 246,480.00 167,276.47 67.9%
Contracting ServicesAuditing - 8,000.00 20,000.00 12,000.00 60.0%Consultants - Technical - - - - 0.0%Legal - - - - 0.0% Total Contract Services - 8,000.00 20,000.00 12,000.00 60.0%
Total Gross G&A Expenses 87,665.82$ 358,148.95$ 1,221,880.00$ 863,731.05$ 70.7%
3

NVTCRECEIPTS and DISBURSEMENTSOctober, 2010
Payer/ Wachovia Wachovia VA LGIPDate Payee Purpose (Checking) (Savings) G&A / Project Trusts
RECEIPTS1 City of Alexandria G&A contribution 8,776.25$ 4 DRPT Capital grant receipt - VRE 288,110.00 5 DRPT Capital grant receipt - VRE 805,988.00 7 DRPT Operating grant receipt 16,704.00 7 DRPT Capital grant receipt - VRE 189,966.00 8 DRPT Operating grant receipt 1,294,104.00
15 Dept. of Taxation Motor Vehicle Fuels Sales tax receipt 3,193,402.36 15 DRPT Capital grant receipt - VRE 126,383.00 18 DRPT Capital grant receipt - VRE 602,808.00 18 DRPT Capital grant receipt 29,479.00 19 DRPT Operating grant receipt - VRE 1,683,043.00 19 DRPT Operating grant receipt 6,670,217.00 20 Loudoun County G&A contribution 4,509.50 25 Arlington County G&A contribution 15,538.00 25 VRE Reimbursement for staff support 6,181.42 26 DRPT Capital grant receipt - VRE 1,819,481.00 28 DRPT Capital grant receipt - VRE 71,409.00 31 Banks Interest earnings 8.97 126.40 23,300.26
- 30,504.64 5,591,823.90 11,227,206.62
DISBURSEMENTS1-31 Various G&A expenses (107,399.77)
2 WMATA Bus operating (15,207,177.00) 2 WMATA Paratransit operating (3,339,506.00) 2 WMATA Rail operating (5,605,879.00) 2 WMATA Capital program funding agreement (1,599,022.00) 2 WMATA Project development (173,000.00) 2 WMATA Debt service (1,853,125.00) 2 WMATA Debt service - Metro Matters (13,764.00) 4 VRE Capital grant - VRE (288,110.00) 5 VRE Capital grant - VRE (805,988.00) 7 VRE Capital grant - VRE (189,966.00)
15 VRE Capital grant - VRE (126,383.00) 18 VRE Capital grant - VRE (602,808.00) 19 VRE Operating grant - VRE (1,683,043.00) 20 Loudoun County Other operating (4,509.50) 26 VRE Capital grant - VRE (1,819,481.00) 27 WMATA Other capital (136,586.00) 28 VRE Capital grant - VRE (71,409.00) 31 Wachovia Bank Service fees (19.99)
(107,419.76) - (5,587,188.00) (27,932,568.50)
TRANSFERS7 Transfer From LGIP to checking 150,000.00 (150,000.00)
150,000.00 - (150,000.00) -
NET INCREASE (DECREASE) FOR MONTH 42,580.24$ 30,504.64$ (145,364.10)$ (16,705,361.88)$
4

NVTCINVESTMENT REPORT
October, 2010
Balance Increase Balance NVTC Jurisdictions LoudounType Rate 9/30/2010 (Decrease) 10/31/2010 G&A/Project Trust Fund Trust Fund
Cash Deposits
Wachovia: NVTC Checking N/A 45,646.24$ 42,580.24$ 88,226.48$ 88,226.48$ -$ -$
Wachovia: NVTC Savings 0.500% 213,644.75 30,504.64 244,149.39 244,149.39 - -
Investments - State Pool
Nations Bank - LGIP 0.236% 138,931,554.13 (16,850,725.98) 122,080,828.15 603,353.19 100,345,666.93 21,131,808.03
139,190,845.12$ (16,923,005.20)$ 122,413,204.02$ 935,729.06$ 100,345,666.93$ 21,131,808.03$
5

NVTC MONTHLY GAS TAX REVENUEALL JURISDICTIONS
FISCAL YEARS 2008-2011
$5,500,000
$4,000,000
$4,500,000
$5,000,000
$2,500,000
$3,000,000
$3,500,000
$1,000,000
$1,500,000
$2,000,000
$-
$500,000
Oct-07
Jan
Apr
July
Oct-08
Jan
Apr
July
Oct-09
Jan
Apr
July
Oct-10
Note: Taxes shown as received by NVTC in a particular
6
Monthly Revenue 12 Month Average
y pmonth are generated from sales two months earlier.

NVTC MONTHLY GAS TAX REVENUEFAIRFAX COUNTY
FISCAL YEARS 2008-2011
$2,600,000$2,800,000 $3,000,000 $3,200,000 $3,400,000
$1,600,000 $1,800,000 $2,000,000 $2,200,000 $2,400,000 $2,600,000
$400 000$600,000 $800,000
$1,000,000 $1,200,000 $1,400,000
$-$200,000 $400,000
Oct-07
Jan
Apr
July
Oct-08
Jan
Apr
July
Oct-09
Jan
Apr
July
Oct-10
Note: Taxes shown as received by NVTC in a particular month are generated from sales two months
7
Monthly Revenue 12-Month Averageparticular month are generated from sales two months earlier.

NVTC MONTHLY GAS TAX REVENUECITY OF ALEXANDRIA
FISCAL YEARS 2008-2011
$260,000$280,000 $300,000 $320,000 $340,000
$160,000 $180,000 $200,000 $220,000 $240,000 $260,000
$40 000$60,000 $80,000
$100,000 $120,000 $140,000
$-$20,000 $40,000
Oct-07
Jan
Apr
July
Oct-08
Jan
Apr
July
Oct-09
Jan
Apr
July
Oct-10
Note: Taxes shown as received by NVTC in a particular month are generated from sales two months earlier
8
Monthly Revenue 12-Month Averagemonth are generated from sales two months earlier.

NVTC MONTHLY GAS TAX REVENUEARLINGTON COUNTY
FISCAL YEARS 2008-2011
$400 000
$450,000
$500,000
$550,000
$250,000
$300,000
$350,000
$400,000
$100,000
$150,000
$200,000
$ ,
$-
$50,000
Oct-07
Jan
Apr
July
Oct-08
Jan
Apr
July
Oct-09
Jan
Apr
July
Oct-10
N T h i d b NVTC i i l
9
Monthly Revenue 12-Month Average
Note: Taxes shown as received by NVTC in a particular month are generated from sales two months earlier.

NVTC MONTHLY GAS TAX REVENUECITY OF FAIRFAX
FISCAL YEARS 2008-2011
$165,000
$190,000
$215,000
$240,000
$90,000
$115,000
$140,000
$165,000
$(10,000)
$15,000
$40,000
$65,000
$(35,000)
$( , )
Oct-07
Jan
Apr
July
Oct-08
Jan
Apr
July
Oct-09
Jan
Apr
July
Oct-10
Monthly Revenue 12 Month Average
Note: Taxes shown as received by NVTC in a particular month are generated from sales two months earlier.
10
Monthly Revenue 12-Month Average

NVTC MONTHLY GAS TAX REVENUECITY OF FALLS CHURCHFISCAL YEARS 2008-2011
$80,000
$90,000
$100,000
$50,000
$60,000
$70,000
$10 000
$20,000
$30,000
$40,000
$-
$10,000
Oct-07
Jan
Apr
July
Oct-08
Jan
Apr
July
Oct-09
Jan
Apr
July
Oct-10
Note: Taxes shown as received by NVTC in a particular month are generated from sales two months earlier
11
Monthly Revenue 12-Month Averagemonth are generated from sales two months earlier .

NVTC MONTHLY GAS TAX REVENUELOUDOUN COUNTY
FISCAL YEARS 2008-2011
$2 000 000
$2,250,000
$2,500,000
$1 250 000
$1,500,000
$1,750,000
$2,000,000
$500 000
$750,000
$1,000,000
$1,250,000
$-
$250,000
$500,000
Oct-0
Jan
Apr
July
Oct- 0
Jan
Apr
July
Oct-0
Jan
Apr
July
Oct-1
12
07 08 09 10
Monthly Revenue 12-Month AverageNote: Taxes shown as received by NVTC in a particular month are generated from sales two months earlier.

AGENDA ITEM #12 TO: Chairman Hudgins and NVTC Commissioners FROM: Rick Taube DATE: November 24, 2010 SUBJECT: Personnel Item
A closed session is required to consider the annual performance review of NVTC’s executive director. NVTC’s Executive Committee is expected to provide a recommendation.
To enter closed session:
Pursuant to the Virginia Freedom of Information Act (Sections 2.2.-3711A (1) of the Code of Virginia), the Northern Virginia Transportation Commission authorizes discussion in Closed Session concerning a personnel item, pertaining to the annual performance review of NVTC’s executive director.
Following the closed session:
The Northern Virginia Transportation Commission certifies that, to the best of each member’s knowledge and with no individual member dissenting, at the just concluded Closed Session:
1. Only public business matters lawfully exempted from open meeting requirements under the Freedom of Information Act were discussed ; and
2. Only such public business matters as were identified in the motion by which the Closed Session was convened were heard, discussed or considered.

VIRGINIA RAILWAY
EXPRESS
BOARD MEMBERS
PAUL MILDE CHAIRMAN
SHARON BULOVA VICE-CHAIRMAN
PAUL SMEDBERG
TREASURER
WALLY COVINGTON SECRETARY
MAUREEN CADDIGAN
JOHN COOK THELMA DRAKE FREDERIC HOWE JOHN JENKINS
SUHAS NADDONI GARY SKINNER
SUSAN STIMPSON JONATHAN WAY
CHRIS ZIMMERMAN
ALTERNATES
MARC AVENI HARRY CRISP
MARK DUDENHEFER BRAD ELLIS JAY FISETTE
FRANK JONES ROB KRUPICKA JERRY LOGAN MICHAEL MAY JEFF McKAY
MARTIN NOHE KEVIN PAGE
JOHN STIRRUP
DALE ZEHNER CHIEF EXECUTIVE
OFFICER
1500 King Street, Suite 202 Alexandria, VA 22314-2730
MM II NN UU TT EE SS
VRE OPERATIONS BOARD MEETING PRTC HEADQUARTERS – PRINCE WILLIAM COUNTY, VIRGINIA
NOVEMBER 19, 2010
MEMBERS PRESENT JURISDICTION Sharon Bulova (NVTC) Fairfax County Maureen Caddigan (PRTC) Prince William County John Cook (NVTC) Fairfax County Wally Covington (PRTC) Prince William County Frederic Howe (PRTC) City of Fredericksburg John D. Jenkins (PRTC) Prince William County Paul Milde (PRTC) Stafford County Gary Skinner (PRTC) Spotsylvania County Jonathan Way (PRTC) City of Manassas Christopher Zimmerman (NVTC) Arlington County
MEMBERS ABSENT JURISDICTION Thelma Drake DRPT Suhas Naddoni (PRTC) City of Manassas Park Paul Smedberg (NVTC) City of Alexandria Susan Stimpson (PRTC) Stafford County
ALTERNATES PRESENT JURISDICTION Kevin Page DRPT
ALTERNATES ABSENT JURISDICTION Marc Aveni (PRTC) City of Manassas Harry Crisp (PRTC) Stafford County Mark Dudenhefer (PRTC) Stafford County Brad Ellis (PRTC) City of Fredericksburg Jay Fisette (NVTC) Arlington County Frank C. Jones (PRTC) City of Manassas Park Rob Krupicka (NVTC) City of Alexandria Jerry Logan (PRTC) Spotsylvania County Michael C. May (PRTC) Prince William County Jeff McKay (NVTC) Fairfax County Martin E. Nohe (PRTC) Prince William County John Stirrup (PRTC) Prince William County
STAFF AND GENERAL PUBLIC Donna Boxer – VRE Jennifer Buske – Washington Post John Duque – VRE Mike Garber – PBGH Al Harf – PRTC staff Christine Hoeffner – VRE Harry Kelso – BCP, LLC Ann King – VRE Mike Lake – Fairfax DOT Lezlie Lamb – VRE Bob Leibbrandt – Prince William County
Steve MacIsaac – VRE counsel April Maguigad – VRE Jennifer Mouchantaf – VRE Sirel Mouchantaf – VRE Dick Peacock – citizen Mark Roeber – VRE Mike Schaller – citizen Brett Shorter – VRE Rick Taube – NVTC staff Dale Zehner – VRE
** Delineates arrival following the commencement of the Board meeting. Notation of exact arrival time is included in the body of the minutes.

2
Chairman Milde called the meeting to order at 9:34 A.M. Following the Pledge of Allegiance, roll call was taken. Approval of the Agenda – 3 Mr. Zehner stated that Agenda Item #11A “FY 2012 Budget Review” should be added to the agenda as an information item. Ms. Bulova moved, with a second by Mr. Skinner, to accept the agenda, with the inclusion of Agenda Item #11A. The vote in favor was cast by Board Members Bulova, Caddigan, Cook, Covington, Howe, Jenkins, Milde, Page, Skinner, Way and Zimmerman. Chairman’s Comments – 5 Chairman Milde reported that VRE’s on-time performance (OTP) improved during the month of October, with systemwide OTP at 89 percent (88 percent for the Fredericksburg line and 90 percent on the Manassas Line). OTP improved even with several major service disruptions. Thirty percent of the delays were track related (signal problems, speed restrictions and/or weather issues); twenty-five percent of the delays were rail congestion; and the remaining 45 percent were VRE related. Chairman Milde reported that ridership continues to break records. November 9th had an all-time high of 19,526 passenger trips and over the past year VRE has sustained a daily average of over 17,000 passenger trips. Chairman Milde stated that since he was in Boise, Idaho for other business, he was able to tour the MotivePower plant and saw VRE’s locomotives being built. It was an impressive operation. He also stated that he hopes the changes resulting from the recent election will not adversely impact VRE as it seeks federal funding. Chief Executive Officer’s Report – 6 Mr. Zehner reported that VRE’s annual Santa Trains will run on December 11th at the Burke Centre, Manassas, Woodbridge and Fredericksburg stations. Tickets go on sale on Monday, November 29th and are usually sold out by the end of the day. Santa and Mrs. Claus will greet riders throughout the trains and hand out Operation Lifesaver coloring books to children. VRE staff is trying to arrange local high school vocal groups to sing holiday songs on the trains. Mr. Cook announced that there will be a Toys for Tots campaign at the Burke Centre station. Mr. Zehner stated that toys and monetary donations will also be accepted on all Santa trains. Passengers are encouraged to bring toys, but it is not required. Many families are making it a tradition every year to purchase toys and then ride the Santa train. VRE will also hold a Toys for Tots drive on December 8th for daily passengers to participate. In response to a question from Mr. Jenkins, Mr. Zehner stated that daily passengers will receive information about this event by seat notice.

3
Mr. Zehner reported that VRE conducted its annual emergency drill on Saturday, November 13th in Springfield on the CSX right of way. This full scale exercise was designed to test internal and multi-agency coordination following a VRE train incident. To mimic VRE service, a VRE train consist, complete with train crew and volunteer passengers, was utilized. This year’s drill used an improvised explosive device (IED) to test emergency response actions of VRE personnel, railroad personnel and first responders. Mr. Zehner listed the many agencies who participated, including VRE, Keolis, CSX, approximately 60 volunteer victims, Fairfax County Fire Department, Arlington County Fire Department, Alexandria Fire Department, Ft. Myers Fire Department, Prince Georges Fire Department, Stafford County Fire Department, Metropolitan Washington Airports Authority Fire Department, Montgomery County Fire Department, City of Fairfax Fire Department, Fairfax County Police (including the EOD unit), Town of Quantico Police Department, Federal Air Marshalls, Virginia State Police, FBI-Joint Terrorism Task Force, Federal Transit Administration, Fairfax County Office of Emergency Management, Fairfax Connector Bus, Northern Virginia Hospital Alliance and the Northern Virginia Community College. Mr. Zehner stated that the exercise was very realistic. In the future, VRE staff would like to run similar exercises in the Alexandria area and let Arlington County and Alexandria be the lead agencies, as well as one in the Fredericksburg area with Fredericksburg and Stafford County serving as the lead agencies. Mr. Zehner stated that January 26, 2011 has been the date selected for the VRE legislative reception at the Main Street Station in Richmond. A VRE train will park at the station during the reception for legislators to board the train and see the new equipment, which will be a good way to stress the need for funding for additional equipment. VRE did a similar event back in 2005. Mr. Zehner asked for Board Members’ comments. Mr. Cook observed that NVTC will be holding its Board meeting in Richmond in conjunction with Local Government Day the following week and asked if there has been any discussion on coordinating these events. Mr. Taube stated that it is difficult for legislators to break away and come to the VRE event because of the volume of people attending Local Government Day and the associated events. Mr. Zehner explained that Mr. Roeber worked to coordinate the January 26th date with House and Senate staff so it would not conflict with another large event. Mr. Covington suggested that VRE provide nametags for Board Members for the VRE legislative reception in Richmond. It would also be helpful to have them for Board Members participating on the Santa Trains to be able to interact better with passengers. Mr. Page suggested that VRE hand out VRE pins to senators and delegates at the reception. Mr. Zehner stated that VRE will send invitations to each General Assembly member. Chairman Milde suggested that jurisdictions may wish to include a personal note with the invitation to reach out to their state representatives. Ms. Bulova stated that it is important for legislators to see how VRE has used state funds. She also suggested VRE produce a fact sheet about the investments the state has contributed to VRE and how they have benefited Virginia’s constituents, including increased on-time performance and capacity. The fact sheet could also include VRE’s funding needs. Chairman Milde observed that VRE’s customer service survey results might have some

4
interesting data to include. Mr. Cook suggested expanding it to a one-page glossy brochure, which could also be distributed at multiple events and made available to distribute at Board Member’s jurisdictional offices. Ms. Bulova noted that it does not have to be expensive and it could be as simple as a palm card. Mr. Page asked if VRE would have a new fleet of equipment or a combination of old and new equipment on display at the Richmond reception. Mr. Zehner stated that his personal inclination is to have all new equipment since no one wanted to look at the old railcars at the last reception. Ms. Bulova stated that this is the point to show the difference between the two types of equipment and why passengers like the new railcars better. Mr. Zimmerman pointed out that ridership continues to increase. It is important to give legislators an opportunity to see the changes VRE made with state funding. Mr. Zehner stated that if old and new equipment is displayed, VRE’s message could be that the Commonwealth helped VRE to get these new railcars but VRE needs additional funding to replace the old equipment. Mr. Way suggested that the bottom of the handout/brochure include four bullet points about VRE’s top legislative agenda items. Mr. Page also stated that maps and pictures of VRE’s stations would be helpful to have displayed at the reception. It is also important to emphasize the partnership VRE has with the Commonwealth to make these projects happen. Mr. Covington stated that it is also important to show that jurisdictions have invested heavily in the VRE system. Chairman Milde observed that VRE needs the Commonwealth’s help because demand keeps growing and VRE will not be able to meet the demand without the Commonwealth’s financial help. Mr. Skinner suggested that the fact sheet be put into a tri-fold pamphlet, which people would more likely keep for later reference. It could then include more information, such as station maps and photos. Mr. Zehner stated that staff will put together some prototypes of a fact sheet/brochure/pamphlet for the Board to peruse at the next meeting. Chairman Milde also suggested staff put together talking points for Board Members to use at the reception. Approval of the Minutes of the October 15, 2010 VRE Operations Board Meeting – 4 Ms. Bulova moved, with a second by Mr. Zimmerman, to approve the minutes. The vote in favor was cast by Board Members Bulova, Cook, Covington, Howe, Jenkins, Milde, Page, Skinner, Way and Zimmerman. Ms. Caddigan abstained. Operations Board Member’s Time – 7 Mr. Skinner stated that he and Mr. Howe participated in a VRE orientation which included a VRE train ride and a visit to the VRE operations center. Mr. Howe found this very useful and educational. He urged Board Members to do the orientation if they have not already. Mr. Howe stated that it was impressive and he was able to go back to his council and give a detailed report on VRE operations.

5
VRE Riders’ and Public Comment – 8 Mr. Peacock asked if VRE staff can estimate the number of riders standing on the trains. This would be useful information to present to Virginia legislators to prove that VRE needs more capacity. He also noted that many war veterans are returning from duty and are riding VRE, which should also be mentioned. He stated that VRE needs to emphasize that more mid-day storage space is needed in its Legislative Agenda. He asked if there is some way to recognize the good work done by the dispatchers. Consent Agenda – 9 Ms. Bulova moved, with a second by Mr. Covington, to approve the following consent agenda items:
Agenda Item #9A: Authorization to Issue an IFB for the Construction of a Platform Extension at the Broad Run Station.
Agenda Item #9B: Authorization to Issue a RFP for Mechanical Engineering
Consulting Services. Agenda Item #9C: Authorization to Issue an RFQ for the Purchase and
Installation of Multi-radio Wireless Routers.
The vote in favor was cast by Board Members Bulova, Caddigan, Cook, Covington, Howe, Jenkins, Milde, Page, Skinner, Way and Zimmerman. Authorization to Forward the FY 2010 Audited Financial Statements and Management Letter to the Commissions – 10A Mr. Zehner reported that the VRE Operations Board is being asked to authorize him to forward to the Commissions for consideration VRE’s financial statements for FY 2012 as audited. Resolution #10A-11-2010 would accomplish this. Mr. Zehner explained that the audit was conducted by the firm PBGH, LLC, which has served as the auditors for VRE, NVTC and PRTC for the last few years and a new three-year contract for the audit of VRE and NVTC financial statements was approved in April 2008. Mr. Zehner introduced Mike Garber of PBGH, LLC. Mr. Garber stated that the audit of VRE’s FY 2012 financial statements has been completed and PBGH has issued an unqualified opinion. The audit report finds that VRE’s statements in all material respects, fairly and accurately present the financial position of the organization. Mr. Garber stated that he met with VRE’s Audit and Finance Committee prior to this meeting and reviewed the audit findings in more detail. He stated that there were no issues or problems during the audit.

6
Ms. Bulova moved, with a second by Mr. Jenkins, to approve the resolution. The vote in favor was cast by Board Members Bulova, Caddigan, Cook, Covington, Howe, Jenkins, Milde, Page, Skinner, Way and Zimmerman. Authorization to Award a Lease for Vendor Space at the Woodbridge Station – 10B Mr. Zehner stated that the VRE Operations Board is being asked to authorize him to award two lease agreements to the Coffee Club Café Company, Inc. for the operation of concessions and ticket sales in the North and South rooms of the Woodbridge VRE station. After VRE issued a solicitation for proposals, only one proposal was received from the Coffee Club Café Company, which is the current vendor. An evaluation team reviewed the proposal and requested additional financial information. All financial requirements have been met and accepted by VRE. Rent is $300 per month and the term of each lease will be for one year, with four one-year renewable options to be exercised at the CEO’s discretion. Ms. Caddigan moved, with a second by Mr. Howe, to approve the minutes. The vote in favor was cast by Board Members Bulova, Caddigan, Cook, Covington, Howe, Jenkins, Milde, Page, Skinner, Way and Zimmerman. Authorization to Sell 10 Locomotives – 10C Mr. Zehner reported that the VRE Operations Board is being asked to recommend that the Commissions authorize him to execute a sales agreement for 10 GP39 locomotives with MotivePower, Inc., or the next highest proposer, for the amount stated in a confidential envelope provided to Board Members. Resolution #10C-11-2010 would accomplish this. Mr. Zehner reminded Board Members that back in June 2007, the Operations Board authorized him to pursue the sale of VRE locomotives as they were replaced with new equipment. Since that time, VRE has sold six of the 18 available units. VRE subsequently received a proposal from MotivePower, Inc. to purchase 10 GP39 locomotives. Negotiations have been completed and a sales agreement, mirroring those already approved by the Operations Board for equipment, is being readied. Work is underway to develop a mutually agreed upon schedule to deliver the locomotives to MotivePower as VRE receives new locomotives. Mr. Zehner asked that Board Members keep the price confidential because there is a potential second proposer. Chairman Milde stated that VRE will have to add additional trains at some point to address capacity issues and asked if VRE will have a sufficient number of locomotives. Mr. Zehner explained that currently VRE uses 12 locomotives to run service but there are another eight in the fleet. After this sale, VRE will still have two F40 locomotives left. Therefore, VRE can add service with its fleet. In comparison to the old locomotives

7
being sold, VRE’s new locomotives have a computerized system that monitors over 400 areas on the locomotive. In addition, the technician does not have to spend hours trying to determine a problem because the locomotive has a diagnostic system that can identify the problem. Therefore, the turn-around time for repairs is greatly reduced. In response to a question from Mr. Skinner, Mr. Zehner responded that all software updates are included in the two-year warranty period, after which VRE would have to pay for them. VRE’s locomotives are customized and VRE is the first to have the upgraded system, which is unique to VRE equipment. Ms. Bulova moved, with a second by Mr. Howe, to approve the minutes. The vote in favor was cast by Board Members Bulova, Caddigan, Cook, Covington, Howe, Jenkins, Milde, Page, Skinner, Way and Zimmerman. Authorization to Approve the 2011 Legislative Agenda – 10D Mr. Zehner stated that the VRE Operations Board is being asked to recommend that the Commissions approve the 2011 VRE Legislative Agenda and authorize him to actively pursue the elements set forth in the document. Resolution #10D-11-2010 would accomplish this. Mr. Zehner reviewed the federal and state legislative initiatives, which many are similar to past years. Congressional staffers have already begun working on the next Reauthorization legislation following SAFETEA-LU; however, all indications are that Congress will not take up the issue until next year. Both the Obama Administration and Congress have acknowledged that a new authorization bill must be passed in order to determine the magnitude of future funding and the revenue source for those funds. VRE has identified a priority list of projects for inclusion in the Reauthorization Bill totaling $363 million for the six-year appropriation. The projects are:
1) Mid-day storage of rail equipment $20 million 2) Fifty new high capacity railcars $120 million 3) Parking expansion $41 million 4) Platform extensions/additions $41 million 5) Expansion of commuter rail service
To Gainesville/Haymarket $136 million 6) Acquisition of new fare collection system $5 million
Mr. Zehner explained that state funding continues to be a concern. He reviewed the state legislative initiatives; including a possible initiative to codify language that would dedicate funds apportioned under federal law from the Equity Bonus program for VRE to pay track lease fees to CSXT, Norfolk Southern and Amtrak. Mr. Zehner asked for Board Member comment on this initiative. Ms. Bulova shared her concern that this initiative could put state funding in jeopardy. The General Assembly has been very supportive of VRE and she would not like to see this backfire. Therefore, she suggested that it be removed from the Legislative Agenda. Chairman Milde and Ms. Caddigan agreed.

8
Mr. Harf observed that under the state funding it references “secure appropriations” which is a euphemism for “seek earmarks.” This is a wise course of action, but he cautioned that it should not be at the expense of the rest of the transit community. He encouraged VRE to seek earmarks beyond the traditional transit pot of money. Ms. Bulova agreed. Mr. Page stated that he will abstain from the vote as a Commonwealth employee but wished to make a few comments. The Operations Board needs to be aware that Hampton Roads Tide and the Metro Dulles extension will be projects added to the pot. VRE may need to start looking at the “fish bowl” of mass transit trust funding that all funding agencies dip into. VRE should also review the methodology and logic of the 95 percent eligibility that was put into place. Chairman Milde suggested incorporating these comments in the motion. Mr. Way observed that some of the projects that make up the $363 million are needed now, such as mid-day storage, while other projects are more long-term. He suggested listing the projects in three columns to distinguish whether they need to be funded immediately or later in the six-year time period. This would convey that VRE is not asking for $363 million all at once. Chairman Milde stated that the $20 million for mid-day storage should be highlighted, which is VRE’s most immediate need since it has been projected that by 2013 VRE will not have the capacity to meet additional ridership. Mr. Covington stated that it is good to highlight the immediate need of storage, but he would keep the rest of the projects grouped together. He stated that he wants to see VRE be aggressive about going after funding. If VRE does not go after it, some other agency will. Mr. Howe asked if it would be appropriate to list all the projects, such as the Fredericksburg VRE station improvements. Mr. Zehner replied that the list is general in nature and the Fredericksburg station project will fit into the platform extension/additions category. Mr. Way asked why $41 million is listed for parking expansion if it is a financial responsibility of the individual jurisdiction. Mr. Zehner explained that VRE tries to help find funding sources for these large projects. In response to a question from Mr. Way, Chairman Milde stated that this is not a change in VRE policy since funding is not coming out of VRE’s general fund. The jurisdictions would provide funding after other funding sources are sought. Mr. Zehner gave the example of how VRE helped find funding for the Burke Centre Parking facility, although VRE did not fund any of it. Ms. Bulova moved to approve Resolution #10D-11-2010, as amended during discussion (remove codifying language, clarify earmark competition issues, and highlight VRE’s immediate need for mid-day storage). Chairman Milde also stated that it should be amended as it pertains to immediate demand; otherwise VRE will not be able to expand service. The vote in favor was cast by Board Members Bulova, Caddigan, Cook, Covington, Howe, Jenkins, Milde, Skinner, Way and Zimmerman. Mr. Page abstained.

9
FY 2012 Budget Review – 11 Mr. Zehner gave a presentation on the status of the FY 2012 budget, which will be reviewed in full at the December meeting. There are several issues that are impacting the budget. He reported that VRE staff recently met with DRPT staff to review the budget status. VRE's state operating assistance is estimated at $5.3 million for FY 2012. This is down over $2 million for FY 2011, which reflects planned formula changes by DRPT. VRE’s capital match is estimated at 50 percent, with the exception of 80 percent for rolling stock. The biggest change is that the Commonwealth will only approve projects if expenses begin during the fiscal year. Currently, VRE saves federal funds over several years and the Commonwealth provides the state match each year. With this change, state funds would need to be spent that current year; otherwise they could be deobligated back to the Commonwealth. This provides some challenges for VRE to find a way to work under these new requirements. Two possible solutions may be to ask for a larger match all at once or find funding such as loans to cover costs over an extended period. Mr. Zehner also reviewed another change regarding reprogramming of match funds between projects from previous years, which now requires prior state approval. This could result in a loss of state match and need for additional local funds. Advanced use of funds before CTB approval is now no longer allowed. Mr. Zehner stated that another unknown is the potential change in the federal transit benefit. If the benefit is reduced back to the $120 level, VRE’s growth in ridership could be impacted. It could also hurt VRE’s revenue because many of the riders purchasing monthly passes now with their transit benefit will begin to purchase 10-ride tickets. Mr. Zehner stated that staff is looking at several options on how to address capacity issues. One possibility would be to return a morning Manassas line train back to the Broad Run Yard in lieu of storage in Ivy City, which would open up three storage slots. However, there would be a cost associated with adding this service and the railroads would need to approve it. Staff also continues to look at using the L’Enfant storage track. When this was originally proposed it was determined that 25 percent of passengers would have been adversely impacted by having the train end at L’Enfant station. However, there may be a solution by doing some switch work that would allow trains to discharge passengers at Union Station and return back to L’Enfant for storage. Finally, building the Crescent track near Union Station is also being investigated. All of these options have some costs that would have to be included in the budget. Mr. Zehner reported that staff is also looking at examining the change to the self-insurance requirement from Keolis, which could result in an estimated savings of $900,000 in insurance costs in FY 2012. Currently, the operating contract requires Keolis to insure VRE for the first $5 million of losses caused by operator error. However, the total premium cost was much higher than anticipated so staff is looking at ways to reduce these costs. Mr. Zehner also reviewed some of the changes that need to be made with the Keolis contract, which will not affect the budget process because the funds are already budgeted. He also reviewed the three major funded capital projects (Spotsylvania third

10
track, mid-day storage and new railcars). Crucial unfunded projects include a heavy maintenance repair facility; positive train control, which is a federal requirement; 10-year locomotive truck overhaul; and Legacy Gallery rehabilitation if no new railcars are procured. Mr. Zehner stated that currently VRE’s Master Agreement requires an automatic five percent increase in Arlington and Alexandria’s subsidies each year, regardless if other jurisdiction’s subsidies increase or decrease. Staff has proposed a plan to recommend a subsidy calculation method such that the increase/decrease is based on overall jurisdictional subsidy change. This has been discussed without objection during the jurisdictional budget process. It would require an amendment to the Master Agreement, which would have to be approved by each jurisdiction and both Commissions. Mr. Zimmerman noted that currently if subsidies are held constant for other jurisdictions, Arlington and Alexandria’s subsidies still go up five percent. Both jurisdictions are happy to support VRE, but there are only a handful of riders that originate from these two jurisdictions. Mr. Page explained the DRPT programming versus cash flow philosophy. DRTP is not stepping away from long term projects. DRPT found that there was a lot of funding just sitting around not being used. It will take more effort on the front end for VRE to adjust to these changes, but it keeps the funds flowing and being spent. Adjournment Without objection, Chairman Milde adjourned the meeting at 11:13 A.M. Approved this 17th day of December, 2010. _____________________________ Paul Milde Chairman _____________________________ Wally Covington Secretary CERTIFICATION This certification hereby acknowledges that the minutes for the November 19, 2010 Virginia Railway Express Operations Board Meeting have been recorded to the best of my ability.
Rhonda Gilchrest